Frontenac, MO Map & Demographics
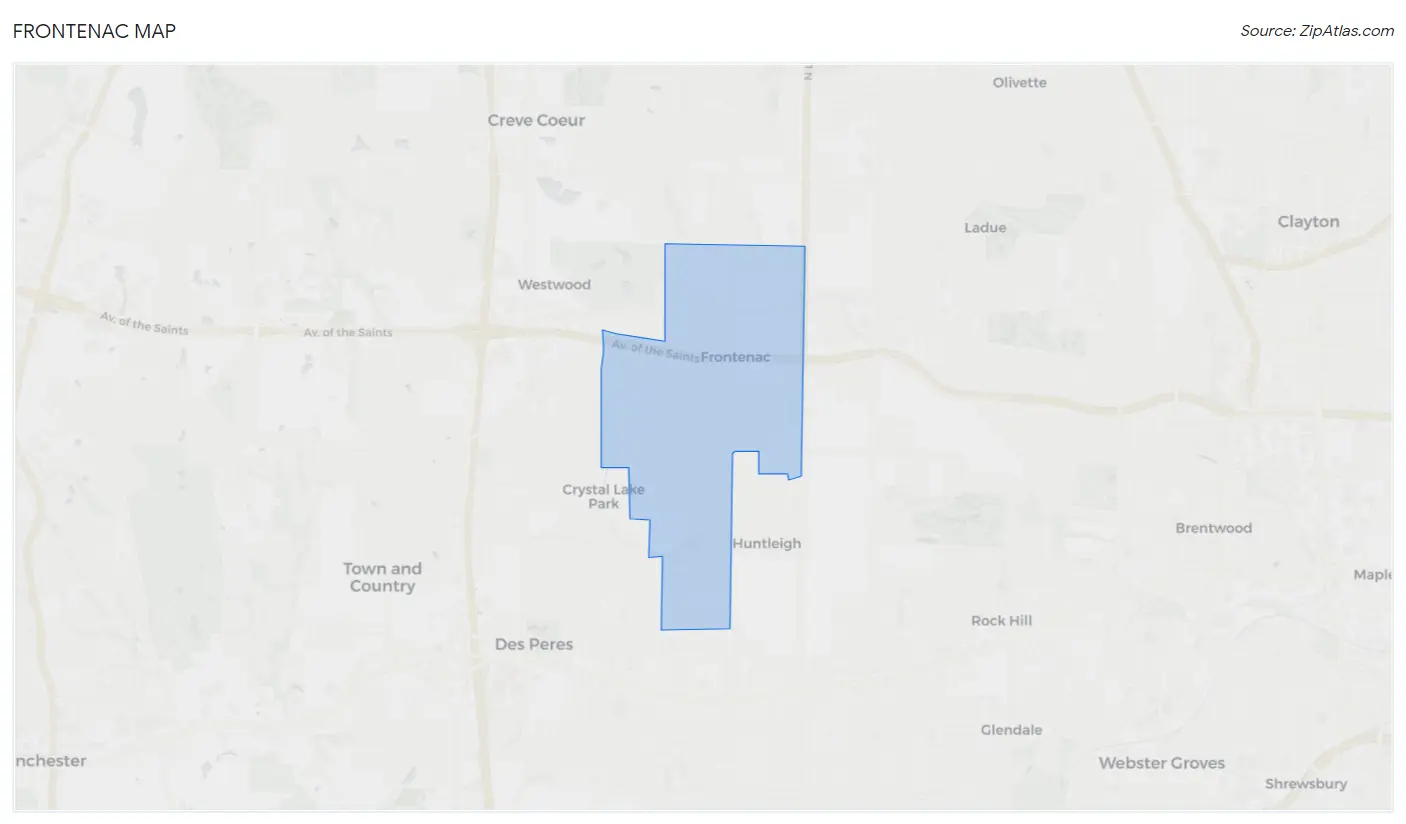
Frontenac Map
Frontenac Overview
$121,798
PER CAPITA INCOME
$250,001
AVG FAMILY INCOME
$250,001
AVG HOUSEHOLD INCOME
27.8%
WAGE / INCOME GAP [ % ]
72.2¢/ $1
WAGE / INCOME GAP [ $ ]
$16,485
FAMILY INCOME DEFICIT
0.52
INEQUALITY / GINI INDEX
3,639
TOTAL POPULATION
1,850
MALE POPULATION
1,789
FEMALE POPULATION
103.41
MALES / 100 FEMALES
96.70
FEMALES / 100 MALES
47.3
MEDIAN AGE
3.5
AVG FAMILY SIZE
3.1
AVG HOUSEHOLD SIZE
1,749
LABOR FORCE [ PEOPLE ]
60.7%
PERCENT IN LABOR FORCE
4.1%
UNEMPLOYMENT RATE
Frontenac Area Codes
Income in Frontenac
Income Overview in Frontenac
Per Capita Income in Frontenac is $121,798, while median incomes of families and households are $250,001 and $250,001 respectively.
| Characteristic | Number | Measure |
| Per Capita Income | 3,639 | $121,798 |
| Median Family Income | 969 | $250,001 |
| Mean Family Income | 969 | $437,646 |
| Median Household Income | 1,160 | $250,001 |
| Mean Household Income | 1,160 | $384,521 |
| Income Deficit | 969 | $16,485 |
| Wage / Income Gap (%) | 3,639 | 27.79% |
| Wage / Income Gap ($) | 3,639 | 72.21¢ per $1 |
| Gini / Inequality Index | 3,639 | 0.52 |
Earnings by Sex in Frontenac
Average Earnings in Frontenac are $107,781, $114,821 for men and $82,917 for women, a difference of 27.8%.
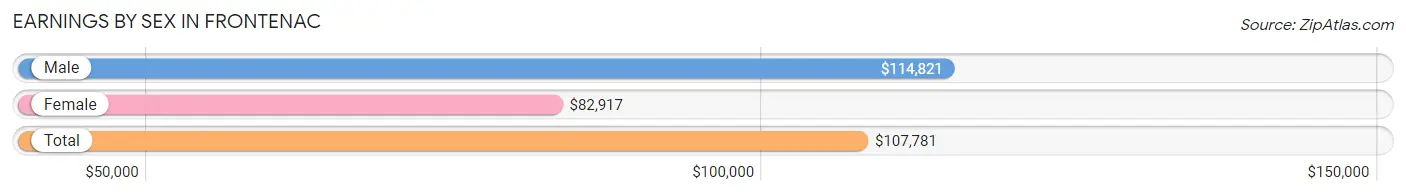
| Sex | Number | Average Earnings |
| Male | 1,165 (61.1%) | $114,821 |
| Female | 742 (38.9%) | $82,917 |
| Total | 1,907 (100.0%) | $107,781 |
Earnings by Sex by Income Bracket in Frontenac
The most common earnings brackets in Frontenac are $100,000+ for men (643 | 55.2%) and $100,000+ for women (322 | 43.4%).
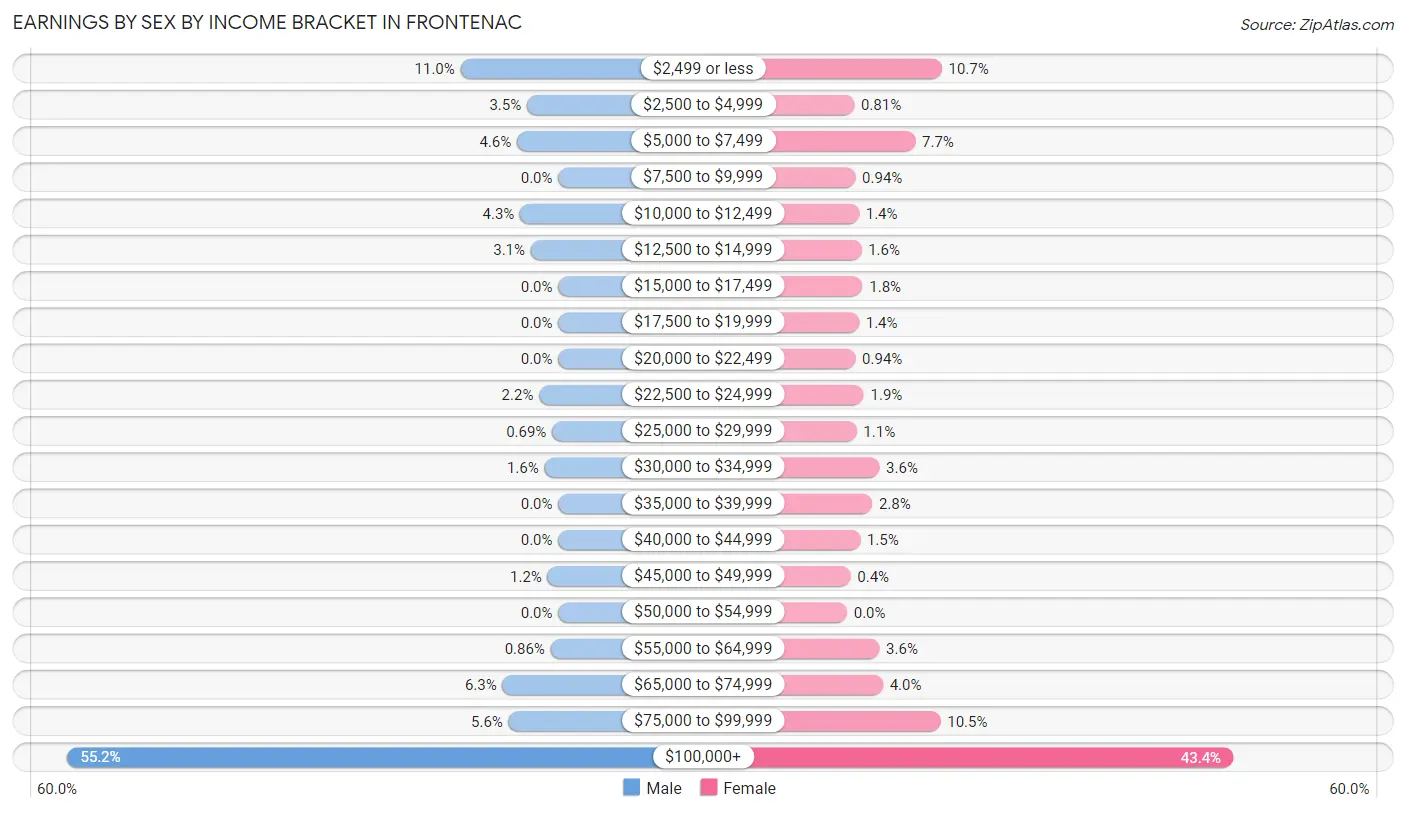
| Income | Male | Female |
| $2,499 or less | 128 (11.0%) | 79 (10.6%) |
| $2,500 to $4,999 | 41 (3.5%) | 6 (0.8%) |
| $5,000 to $7,499 | 54 (4.6%) | 57 (7.7%) |
| $7,500 to $9,999 | 0 (0.0%) | 7 (0.9%) |
| $10,000 to $12,499 | 50 (4.3%) | 10 (1.3%) |
| $12,500 to $14,999 | 36 (3.1%) | 12 (1.6%) |
| $15,000 to $17,499 | 0 (0.0%) | 13 (1.8%) |
| $17,500 to $19,999 | 0 (0.0%) | 10 (1.3%) |
| $20,000 to $22,499 | 0 (0.0%) | 7 (0.9%) |
| $22,500 to $24,999 | 25 (2.1%) | 14 (1.9%) |
| $25,000 to $29,999 | 8 (0.7%) | 8 (1.1%) |
| $30,000 to $34,999 | 18 (1.5%) | 27 (3.6%) |
| $35,000 to $39,999 | 0 (0.0%) | 21 (2.8%) |
| $40,000 to $44,999 | 0 (0.0%) | 11 (1.5%) |
| $45,000 to $49,999 | 14 (1.2%) | 3 (0.4%) |
| $50,000 to $54,999 | 0 (0.0%) | 0 (0.0%) |
| $55,000 to $64,999 | 10 (0.9%) | 27 (3.6%) |
| $65,000 to $74,999 | 73 (6.3%) | 30 (4.0%) |
| $75,000 to $99,999 | 65 (5.6%) | 78 (10.5%) |
| $100,000+ | 643 (55.2%) | 322 (43.4%) |
| Total | 1,165 (100.0%) | 742 (100.0%) |
Earnings by Sex by Educational Attainment in Frontenac
Average earnings in Frontenac are $158,783 for men and $88,929 for women, a difference of 44.0%. Men with an educational attainment of bachelor's degree enjoy the highest average annual earnings of $177,917, while those with college or associate's degree education earn the least with $143,229. Women with an educational attainment of graduate degree earn the most with the average annual earnings of $115,833, while those with bachelor's degree education have the smallest earnings of $60,536.

| Educational Attainment | Male Income | Female Income |
| Less than High School | - | - |
| High School Diploma | - | - |
| College or Associate's Degree | $143,229 | $0 |
| Bachelor's Degree | $177,917 | $60,536 |
| Graduate Degree | $159,243 | $115,833 |
| Total | $158,783 | $88,929 |
Family Income in Frontenac
Family Income Brackets in Frontenac
According to the Frontenac family income data, there are 615 families falling into the $200,000+ income range, which is the most common income bracket and makes up 63.5% of all families.
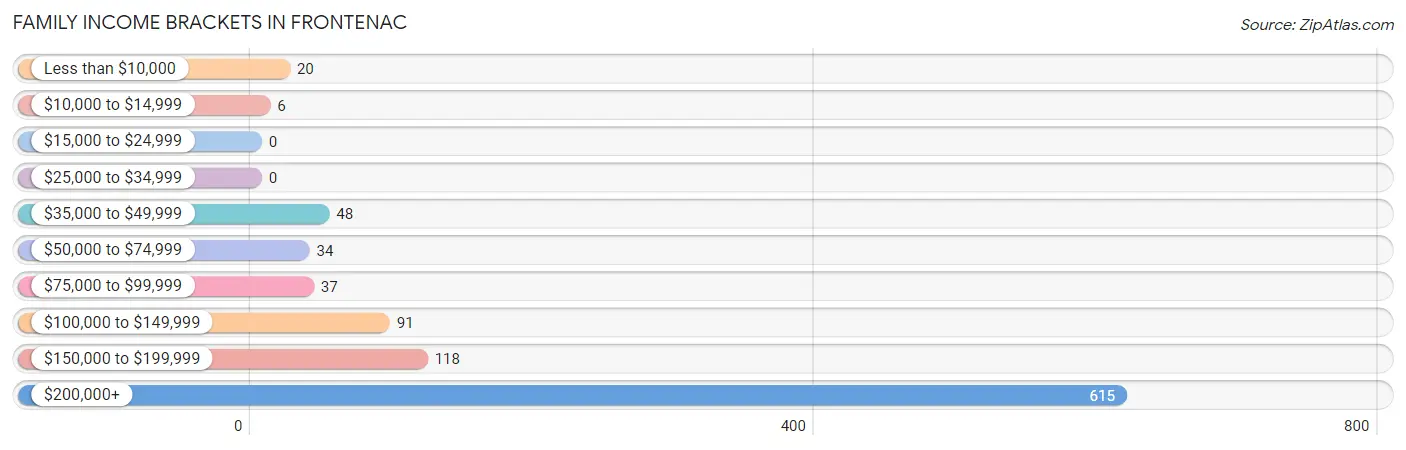
| Income Bracket | # Families | % Families |
| Less than $10,000 | 20 | 2.1% |
| $10,000 to $14,999 | 6 | 0.6% |
| $15,000 to $24,999 | 0 | 0.0% |
| $25,000 to $34,999 | 0 | 0.0% |
| $35,000 to $49,999 | 48 | 5.0% |
| $50,000 to $74,999 | 34 | 3.5% |
| $75,000 to $99,999 | 37 | 3.8% |
| $100,000 to $149,999 | 91 | 9.4% |
| $150,000 to $199,999 | 118 | 12.2% |
| $200,000+ | 615 | 63.5% |
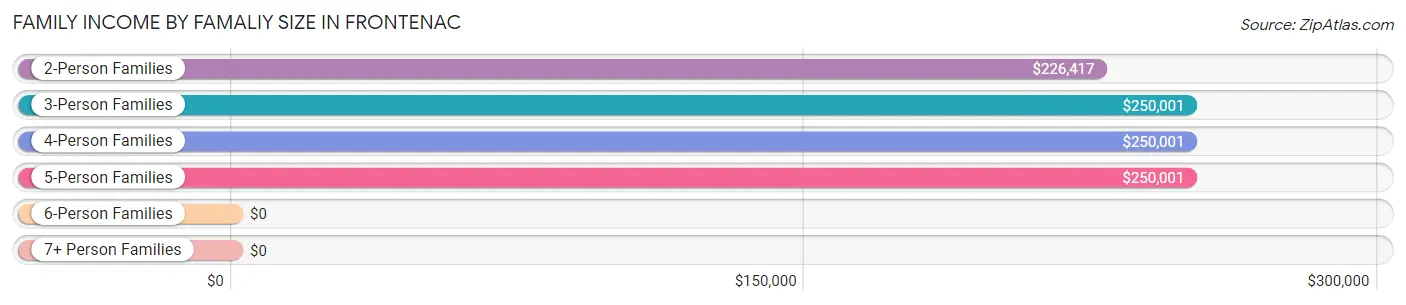
Family Income by Famaliy Size in Frontenac
3-person families (151 | 15.6%) account for the highest median family income in Frontenac with $250,001 per family, while 2-person families (387 | 39.9%) have the highest median income of $113,208 per family member.
| Income Bracket | # Families | Median Income |
| 2-Person Families | 387 (39.9%) | $226,417 |
| 3-Person Families | 151 (15.6%) | $250,001 |
| 4-Person Families | 182 (18.8%) | $250,001 |
| 5-Person Families | 193 (19.9%) | $250,001 |
| 6-Person Families | 29 (3.0%) | $0 |
| 7+ Person Families | 27 (2.8%) | $0 |
| Total | 969 (100.0%) | $250,001 |
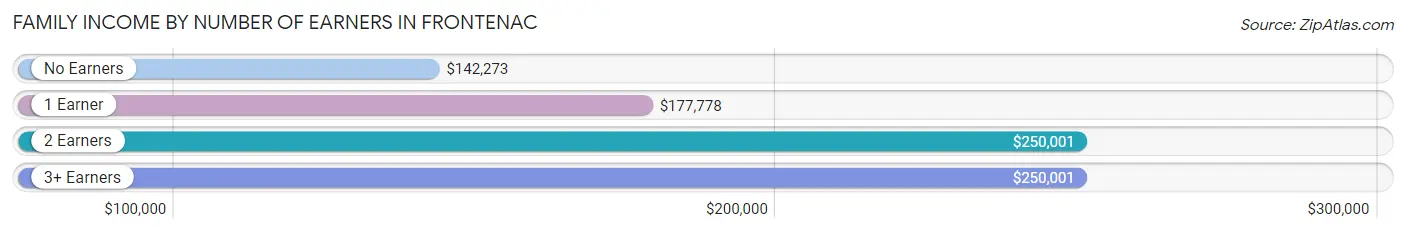
Family Income by Number of Earners in Frontenac
The median family income in Frontenac is $250,001, with families comprising 2 earners (309) having the highest median family income of $250,001, while families with no earners (84) have the lowest median family income of $142,273, accounting for 31.9% and 8.7% of families, respectively.
| Number of Earners | # Families | Median Income |
| No Earners | 84 (8.7%) | $142,273 |
| 1 Earner | 314 (32.4%) | $177,778 |
| 2 Earners | 309 (31.9%) | $250,001 |
| 3+ Earners | 262 (27.0%) | $250,001 |
| Total | 969 (100.0%) | $250,001 |
Household Income in Frontenac
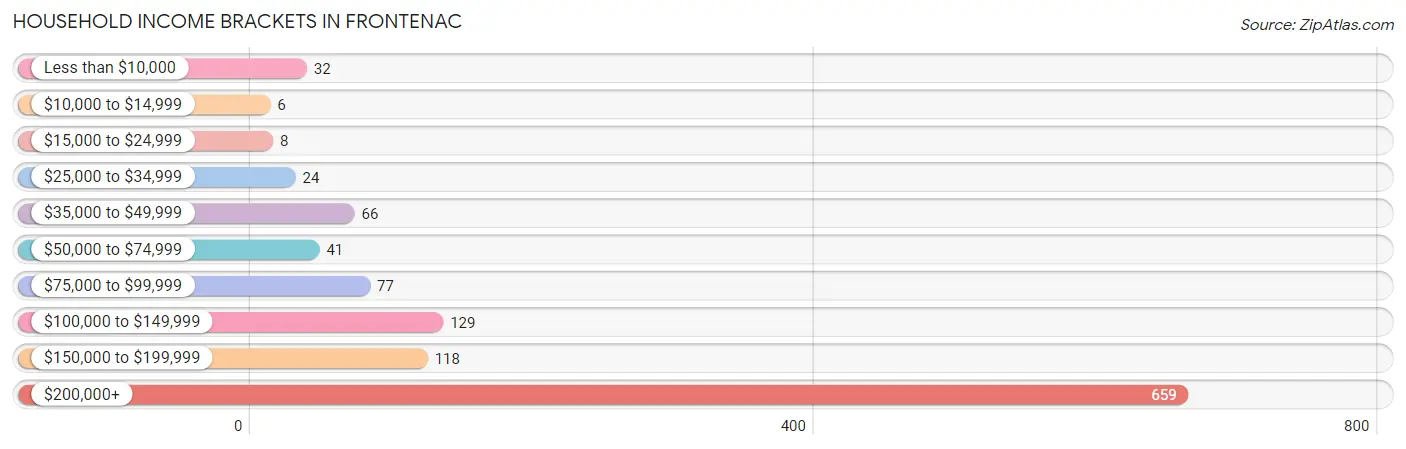
Household Income Brackets in Frontenac
With 659 households falling in the category, the $200,000+ income range is the most frequent in Frontenac, accounting for 56.8% of all households. In contrast, only 6 households (0.5%) fall into the $10,000 to $14,999 income bracket, making it the least populous group.
| Income Bracket | # Households | % Households |
| Less than $10,000 | 32 | 2.8% |
| $10,000 to $14,999 | 6 | 0.5% |
| $15,000 to $24,999 | 8 | 0.7% |
| $25,000 to $34,999 | 24 | 2.1% |
| $35,000 to $49,999 | 66 | 5.7% |
| $50,000 to $74,999 | 41 | 3.5% |
| $75,000 to $99,999 | 77 | 6.6% |
| $100,000 to $149,999 | 129 | 11.1% |
| $150,000 to $199,999 | 118 | 10.2% |
| $200,000+ | 659 | 56.8% |
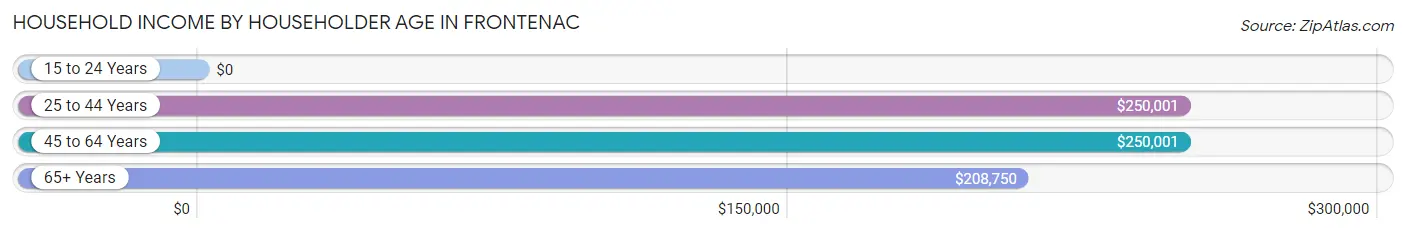
Household Income by Householder Age in Frontenac
The median household income in Frontenac is $250,001, with the highest median household income of $250,001 found in the 25 to 44 years age bracket for the primary householder. A total of 93 households (8.0%) fall into this category.
| Income Bracket | # Households | Median Income |
| 15 to 24 Years | 0 (0.0%) | $0 |
| 25 to 44 Years | 93 (8.0%) | $250,001 |
| 45 to 64 Years | 751 (64.7%) | $250,001 |
| 65+ Years | 316 (27.2%) | $208,750 |
| Total | 1,160 (100.0%) | $250,001 |
Poverty in Frontenac
Income Below Poverty by Sex and Age in Frontenac
With 1.7% poverty level for males and 3.2% for females among the residents of Frontenac, 75 year old and over males and 18 to 24 year old females are the most vulnerable to poverty, with 6 males (6.7%) and 10 females (27.0%) in their respective age groups living below the poverty level.
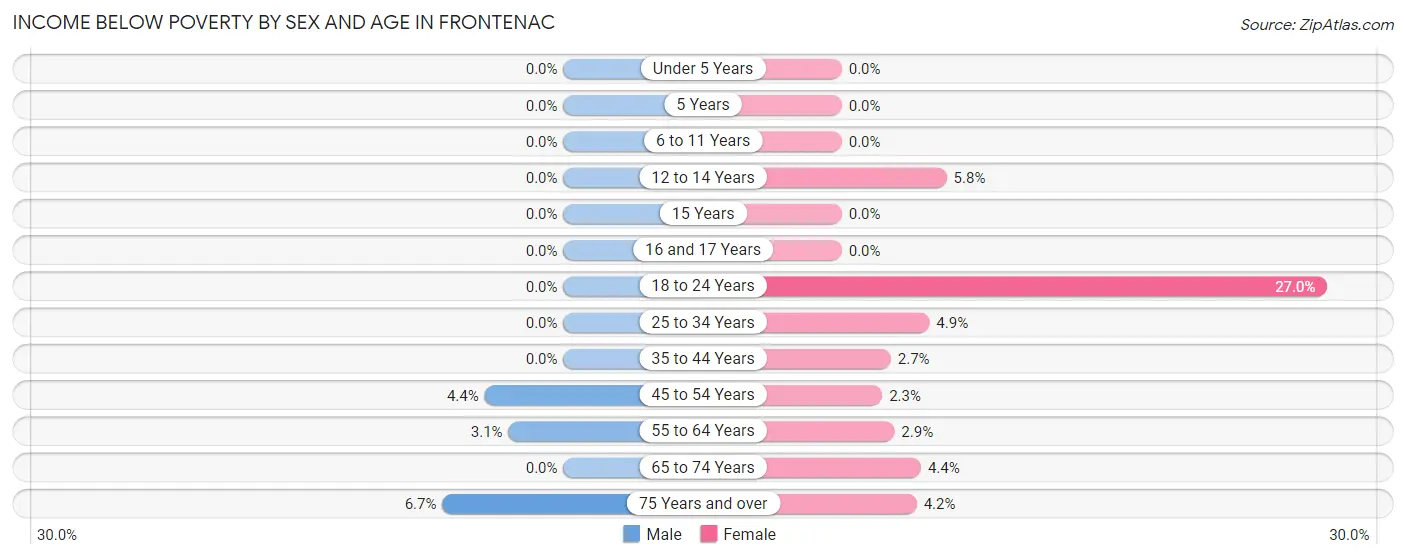
| Age Bracket | Male | Female |
| Under 5 Years | 0 (0.0%) | 0 (0.0%) |
| 5 Years | 0 (0.0%) | 0 (0.0%) |
| 6 to 11 Years | 0 (0.0%) | 0 (0.0%) |
| 12 to 14 Years | 0 (0.0%) | 8 (5.8%) |
| 15 Years | 0 (0.0%) | 0 (0.0%) |
| 16 and 17 Years | 0 (0.0%) | 0 (0.0%) |
| 18 to 24 Years | 0 (0.0%) | 10 (27.0%) |
| 25 to 34 Years | 0 (0.0%) | 4 (4.9%) |
| 35 to 44 Years | 0 (0.0%) | 3 (2.7%) |
| 45 to 54 Years | 15 (4.4%) | 8 (2.2%) |
| 55 to 64 Years | 11 (3.1%) | 10 (2.9%) |
| 65 to 74 Years | 0 (0.0%) | 6 (4.4%) |
| 75 Years and over | 6 (6.7%) | 7 (4.2%) |
| Total | 32 (1.7%) | 56 (3.2%) |
Income Above Poverty by Sex and Age in Frontenac
According to the poverty statistics in Frontenac, males aged under 5 years and females aged under 5 years are the age groups that are most secure financially, with 100.0% of males and 100.0% of females in these age groups living above the poverty line.
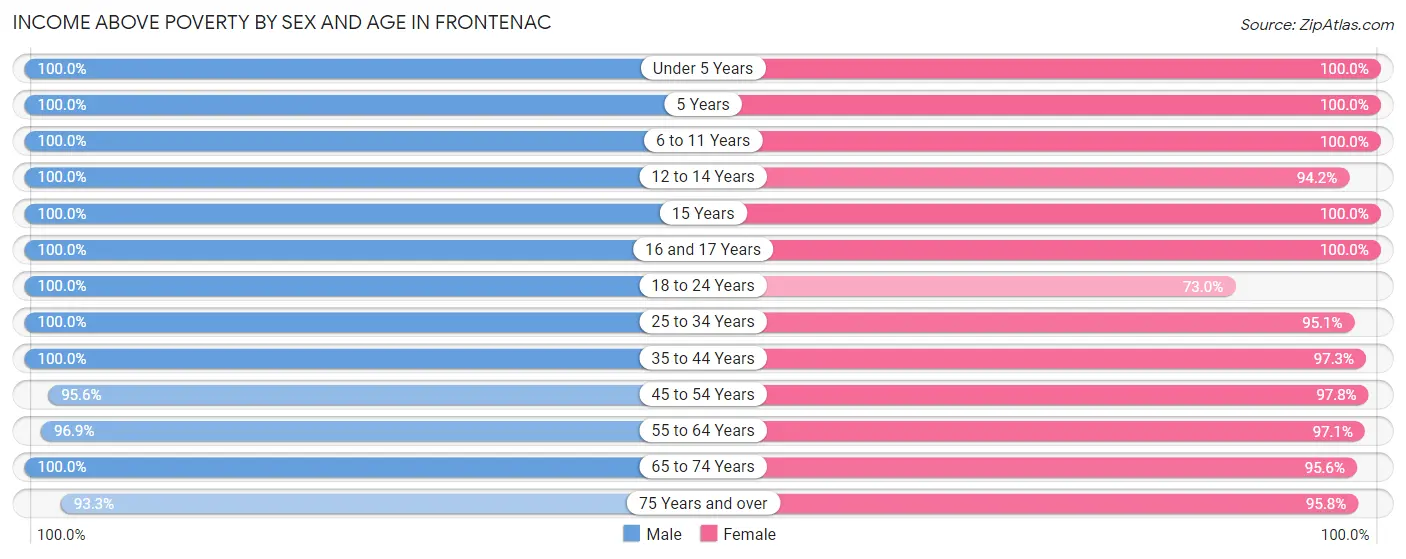
| Age Bracket | Male | Female |
| Under 5 Years | 21 (100.0%) | 21 (100.0%) |
| 5 Years | 6 (100.0%) | 16 (100.0%) |
| 6 to 11 Years | 91 (100.0%) | 137 (100.0%) |
| 12 to 14 Years | 128 (100.0%) | 129 (94.2%) |
| 15 Years | 47 (100.0%) | 154 (100.0%) |
| 16 and 17 Years | 174 (100.0%) | 63 (100.0%) |
| 18 to 24 Years | 307 (100.0%) | 27 (73.0%) |
| 25 to 34 Years | 84 (100.0%) | 78 (95.1%) |
| 35 to 44 Years | 74 (100.0%) | 107 (97.3%) |
| 45 to 54 Years | 327 (95.6%) | 347 (97.8%) |
| 55 to 64 Years | 348 (96.9%) | 331 (97.1%) |
| 65 to 74 Years | 128 (100.0%) | 130 (95.6%) |
| 75 Years and over | 83 (93.3%) | 161 (95.8%) |
| Total | 1,818 (98.3%) | 1,701 (96.8%) |
Income Below Poverty Among Married-Couple Families in Frontenac
The poverty statistics for married-couple families in Frontenac show that 3.0% or 26 of the total 878 families live below the poverty line. Families with 1 or 2 children have the highest poverty rate of 3.6%, comprising of 9 families. On the other hand, families with 3 or 4 children have the lowest poverty rate of 0.0%, which includes 0 families.
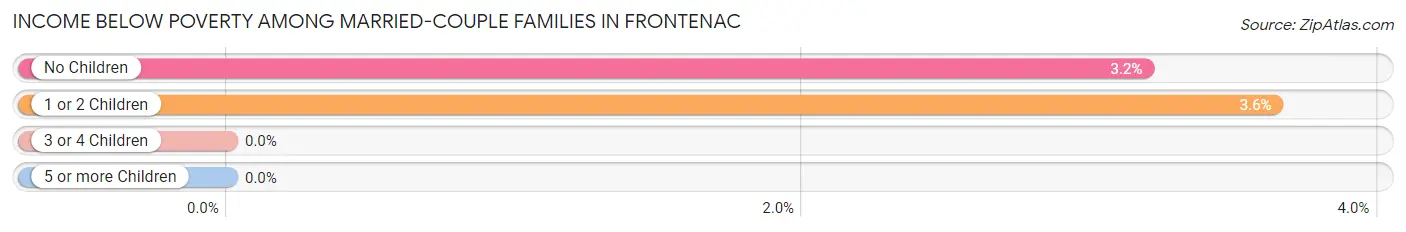
| Children | Above Poverty | Below Poverty |
| No Children | 516 (96.8%) | 17 (3.2%) |
| 1 or 2 Children | 238 (96.4%) | 9 (3.6%) |
| 3 or 4 Children | 98 (100.0%) | 0 (0.0%) |
| 5 or more Children | 0 (0.0%) | 0 (0.0%) |
| Total | 852 (97.0%) | 26 (3.0%) |
Income Below Poverty Among Single-Parent Households in Frontenac
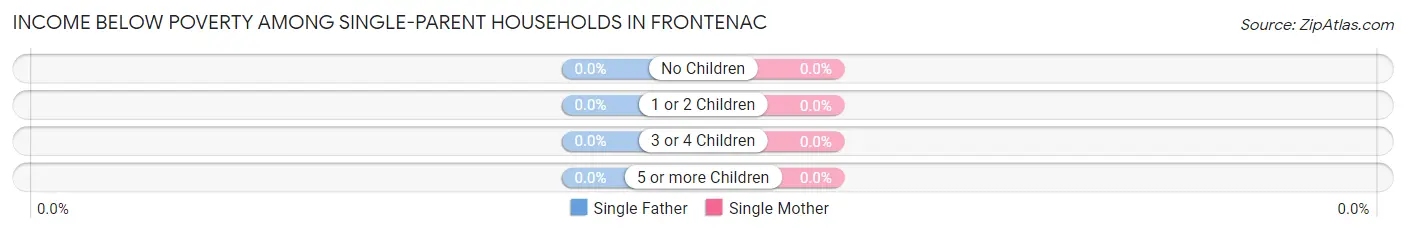
| Children | Single Father | Single Mother |
| No Children | 0 (0.0%) | 0 (0.0%) |
| 1 or 2 Children | 0 (0.0%) | 0 (0.0%) |
| 3 or 4 Children | 0 (0.0%) | 0 (0.0%) |
| 5 or more Children | 0 (0.0%) | 0 (0.0%) |
| Total | 0 (0.0%) | 0 (0.0%) |
Income Below Poverty Among Married-Couple vs Single-Parent Households in Frontenac
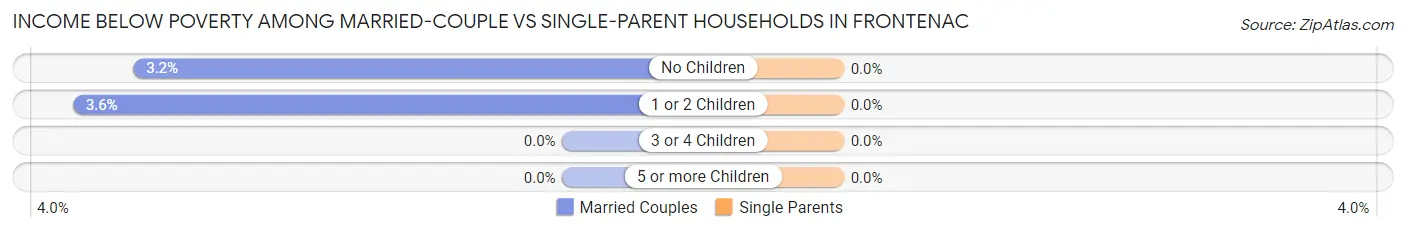
| Children | Married-Couple Families | Single-Parent Households |
| No Children | 17 (3.2%) | 0 (0.0%) |
| 1 or 2 Children | 9 (3.6%) | 0 (0.0%) |
| 3 or 4 Children | 0 (0.0%) | 0 (0.0%) |
| 5 or more Children | 0 (0.0%) | 0 (0.0%) |
| Total | 26 (3.0%) | 0 (0.0%) |
Race in Frontenac
The most populous races in Frontenac are White / Caucasian (2,894 | 79.5%), Asian (393 | 10.8%), and Two or more Races (256 | 7.0%).
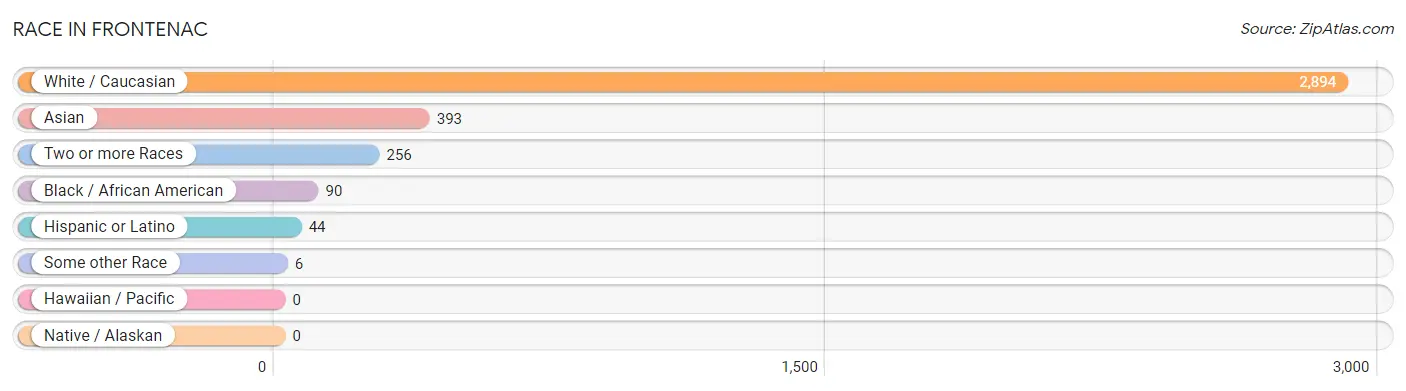
| Race | # Population | % Population |
| Asian | 393 | 10.8% |
| Black / African American | 90 | 2.5% |
| Hawaiian / Pacific | 0 | 0.0% |
| Hispanic or Latino | 44 | 1.2% |
| Native / Alaskan | 0 | 0.0% |
| White / Caucasian | 2,894 | 79.5% |
| Two or more Races | 256 | 7.0% |
| Some other Race | 6 | 0.2% |
| Total | 3,639 | 100.0% |
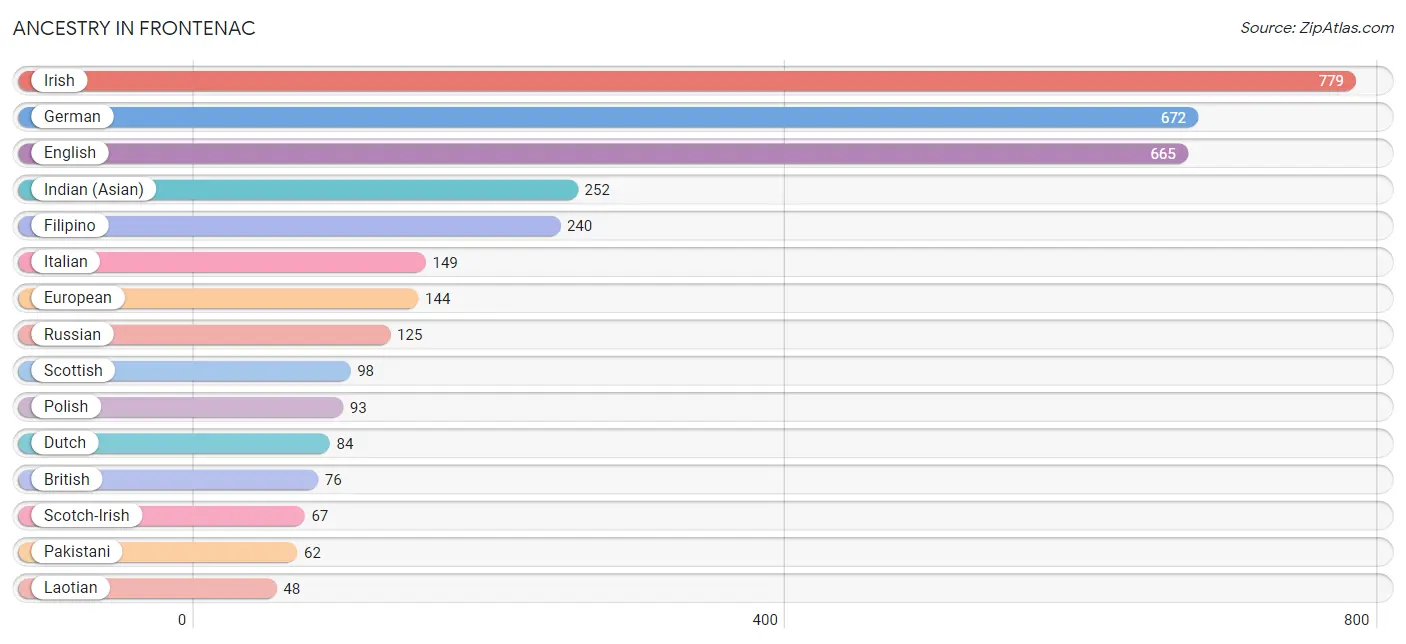
Ancestry in Frontenac
The most populous ancestries reported in Frontenac are Irish (779 | 21.4%), German (672 | 18.5%), English (665 | 18.3%), Indian (Asian) (252 | 6.9%), and Filipino (240 | 6.6%), together accounting for 71.7% of all Frontenac residents.
| Ancestry | # Population | % Population |
| African | 4 | 0.1% |
| American | 12 | 0.3% |
| Austrian | 8 | 0.2% |
| Belgian | 3 | 0.1% |
| Brazilian | 23 | 0.6% |
| British | 76 | 2.1% |
| Cuban | 28 | 0.8% |
| Czechoslovakian | 10 | 0.3% |
| Dutch | 84 | 2.3% |
| Eastern European | 46 | 1.3% |
| English | 665 | 18.3% |
| European | 144 | 4.0% |
| Filipino | 240 | 6.6% |
| French | 41 | 1.1% |
| German | 672 | 18.5% |
| Indian (Asian) | 252 | 6.9% |
| Iranian | 17 | 0.5% |
| Irish | 779 | 21.4% |
| Italian | 149 | 4.1% |
| Laotian | 48 | 1.3% |
| Lithuanian | 16 | 0.4% |
| Macedonian | 38 | 1.0% |
| Mexican | 10 | 0.3% |
| Nigerian | 12 | 0.3% |
| Pakistani | 62 | 1.7% |
| Pennsylvania German | 10 | 0.3% |
| Polish | 93 | 2.6% |
| Puerto Rican | 6 | 0.2% |
| Russian | 125 | 3.4% |
| Scandinavian | 3 | 0.1% |
| Scotch-Irish | 67 | 1.8% |
| Scottish | 98 | 2.7% |
| Subsaharan African | 16 | 0.4% |
| Swedish | 11 | 0.3% |
| Thai | 40 | 1.1% |
| Ukrainian | 9 | 0.3% |
| Welsh | 11 | 0.3% | View All 37 Rows |
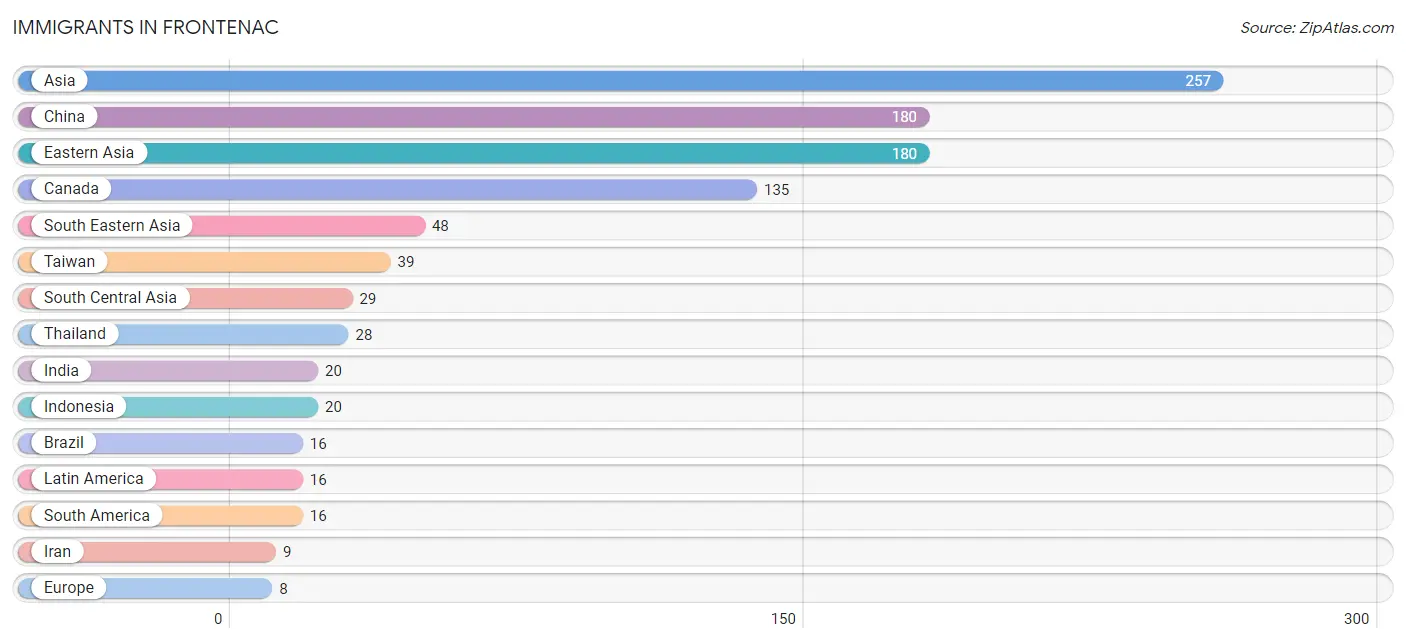
Immigrants in Frontenac
The most numerous immigrant groups reported in Frontenac came from Asia (257 | 7.1%), China (180 | 5.0%), Eastern Asia (180 | 5.0%), Canada (135 | 3.7%), and South Eastern Asia (48 | 1.3%), together accounting for 22.0% of all Frontenac residents.
| Immigration Origin | # Population | % Population |
| Asia | 257 | 7.1% |
| Brazil | 16 | 0.4% |
| Canada | 135 | 3.7% |
| China | 180 | 5.0% |
| Eastern Asia | 180 | 5.0% |
| Europe | 8 | 0.2% |
| Germany | 8 | 0.2% |
| India | 20 | 0.5% |
| Indonesia | 20 | 0.5% |
| Iran | 9 | 0.3% |
| Latin America | 16 | 0.4% |
| South America | 16 | 0.4% |
| South Central Asia | 29 | 0.8% |
| South Eastern Asia | 48 | 1.3% |
| Taiwan | 39 | 1.1% |
| Thailand | 28 | 0.8% |
| Western Europe | 8 | 0.2% | View All 17 Rows |
Sex and Age in Frontenac
Sex and Age in Frontenac
The most populous age groups in Frontenac are 15 to 19 Years (282 | 15.2%) for men and 45 to 49 Years (267 | 14.9%) for women.
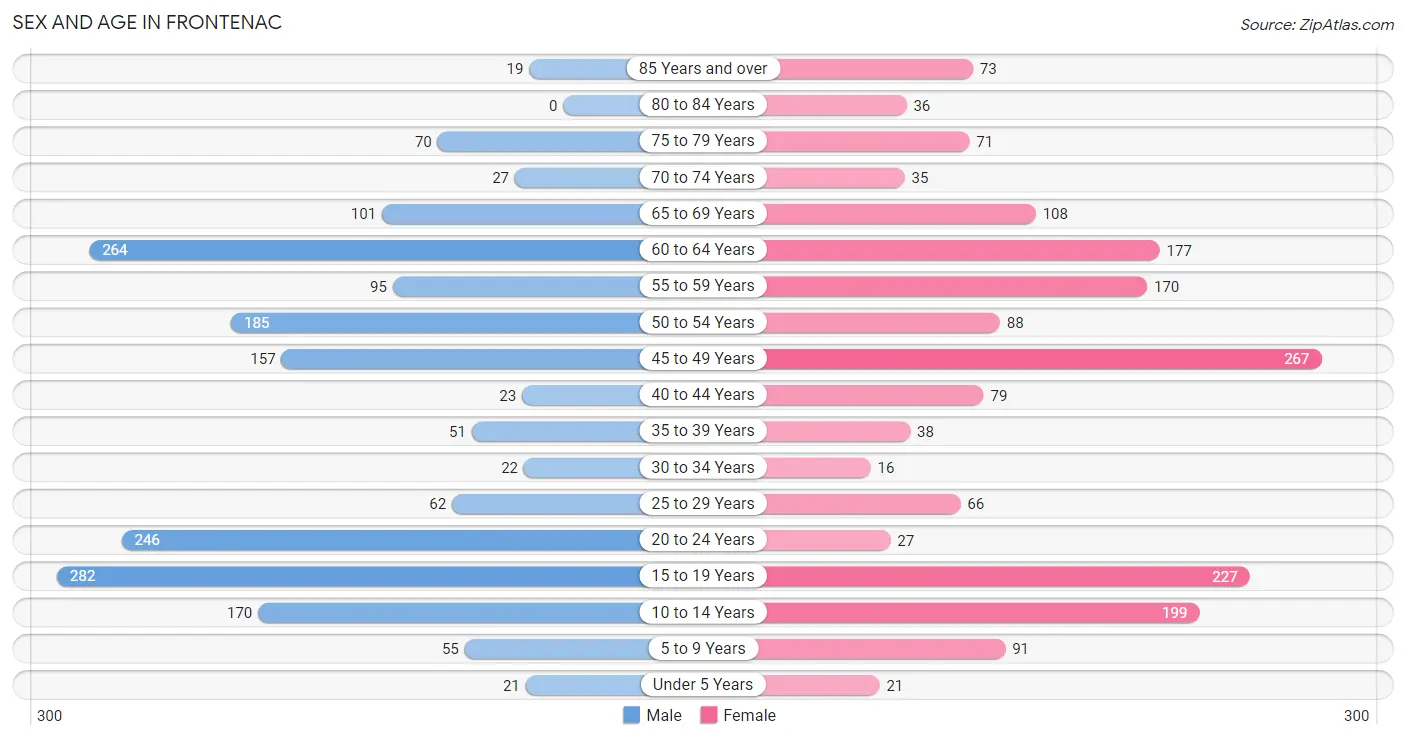
| Age Bracket | Male | Female |
| Under 5 Years | 21 (1.1%) | 21 (1.2%) |
| 5 to 9 Years | 55 (3.0%) | 91 (5.1%) |
| 10 to 14 Years | 170 (9.2%) | 199 (11.1%) |
| 15 to 19 Years | 282 (15.2%) | 227 (12.7%) |
| 20 to 24 Years | 246 (13.3%) | 27 (1.5%) |
| 25 to 29 Years | 62 (3.4%) | 66 (3.7%) |
| 30 to 34 Years | 22 (1.2%) | 16 (0.9%) |
| 35 to 39 Years | 51 (2.8%) | 38 (2.1%) |
| 40 to 44 Years | 23 (1.2%) | 79 (4.4%) |
| 45 to 49 Years | 157 (8.5%) | 267 (14.9%) |
| 50 to 54 Years | 185 (10.0%) | 88 (4.9%) |
| 55 to 59 Years | 95 (5.1%) | 170 (9.5%) |
| 60 to 64 Years | 264 (14.3%) | 177 (9.9%) |
| 65 to 69 Years | 101 (5.5%) | 108 (6.0%) |
| 70 to 74 Years | 27 (1.5%) | 35 (2.0%) |
| 75 to 79 Years | 70 (3.8%) | 71 (4.0%) |
| 80 to 84 Years | 0 (0.0%) | 36 (2.0%) |
| 85 Years and over | 19 (1.0%) | 73 (4.1%) |
| Total | 1,850 (100.0%) | 1,789 (100.0%) |
Families and Households in Frontenac
Median Family Size in Frontenac
The median family size in Frontenac is 3.48 persons per family, with single male/father families (43 | 4.4%) accounting for the largest median family size of 6.81 persons per family. On the other hand, single female/mother families (48 | 5.0%) represent the smallest median family size with 3.23 persons per family.
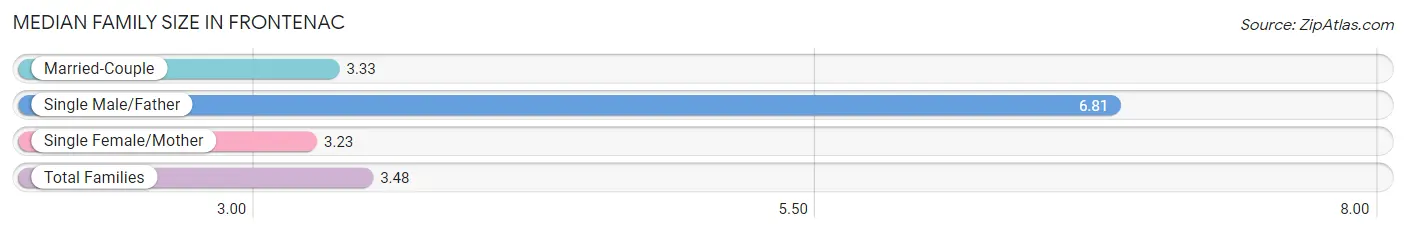
| Family Type | # Families | Family Size |
| Married-Couple | 878 (90.6%) | 3.33 |
| Single Male/Father | 43 (4.4%) | 6.81 |
| Single Female/Mother | 48 (5.0%) | 3.23 |
| Total Families | 969 (100.0%) | 3.48 |
Median Household Size in Frontenac
The median household size in Frontenac is 3.10 persons per household, with single male/father households (43 | 3.7%) accounting for the largest median household size of 6.81 persons per household. non-family households (191 | 16.5%) represent the smallest median household size with 1.14 persons per household.
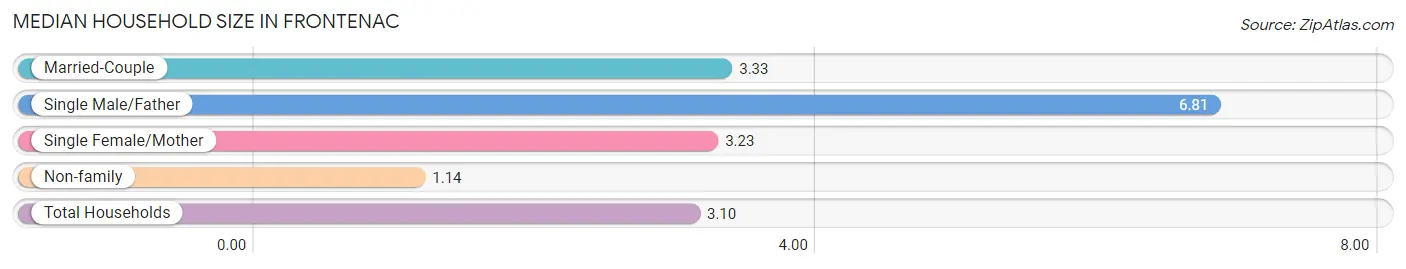
| Household Type | # Households | Household Size |
| Married-Couple | 878 (75.7%) | 3.33 |
| Single Male/Father | 43 (3.7%) | 6.81 |
| Single Female/Mother | 48 (4.1%) | 3.23 |
| Non-family | 191 (16.5%) | 1.14 |
| Total Households | 1,160 (100.0%) | 3.10 |
Household Size by Marriage Status in Frontenac
Out of a total of 1,160 households in Frontenac, 969 (83.5%) are family households, while 191 (16.5%) are nonfamily households. The most numerous type of family households are 2-person households, comprising 387, and the most common type of nonfamily households are 1-person households, comprising 172.
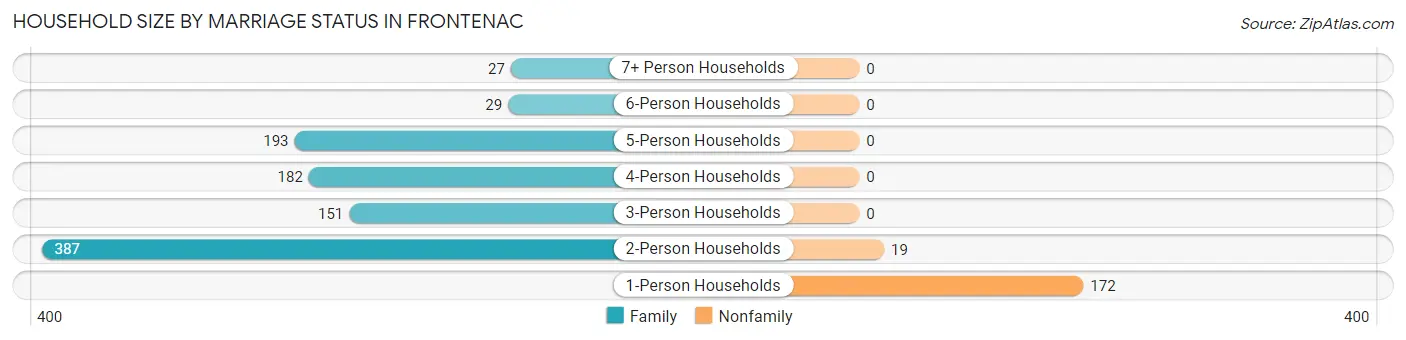
| Household Size | Family Households | Nonfamily Households |
| 1-Person Households | - | 172 (14.8%) |
| 2-Person Households | 387 (33.4%) | 19 (1.6%) |
| 3-Person Households | 151 (13.0%) | 0 (0.0%) |
| 4-Person Households | 182 (15.7%) | 0 (0.0%) |
| 5-Person Households | 193 (16.6%) | 0 (0.0%) |
| 6-Person Households | 29 (2.5%) | 0 (0.0%) |
| 7+ Person Households | 27 (2.3%) | 0 (0.0%) |
| Total | 969 (83.5%) | 191 (16.5%) |
Female Fertility in Frontenac
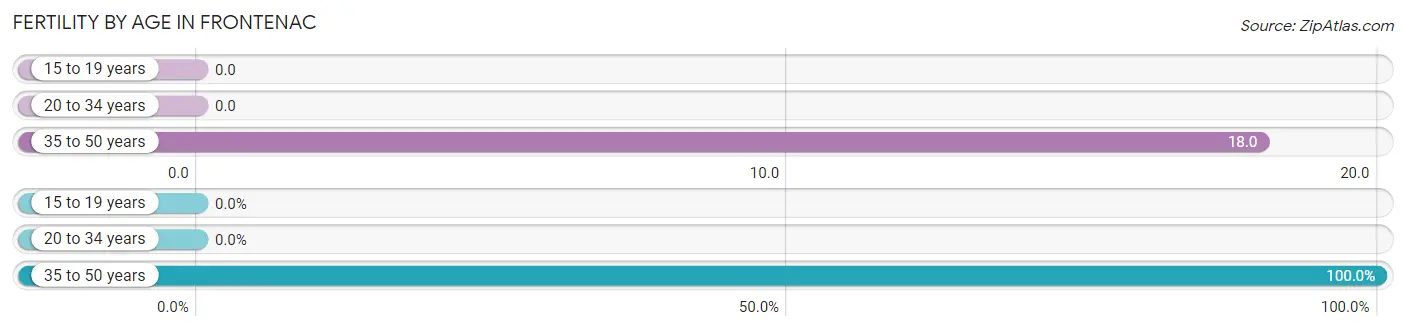
Fertility by Age in Frontenac
Average fertility rate in Frontenac is 10.0 births per 1,000 women. Women in the age bracket of 35 to 50 years have the highest fertility rate with 18.0 births per 1,000 women. Women in the age bracket of 35 to 50 years acount for 100.0% of all women with births.
| Age Bracket | Women with Births | Births / 1,000 Women |
| 15 to 19 years | 0 (0.0%) | 0.0 |
| 20 to 34 years | 0 (0.0%) | 0.0 |
| 35 to 50 years | 7 (100.0%) | 18.0 |
| Total | 7 (100.0%) | 10.0 |
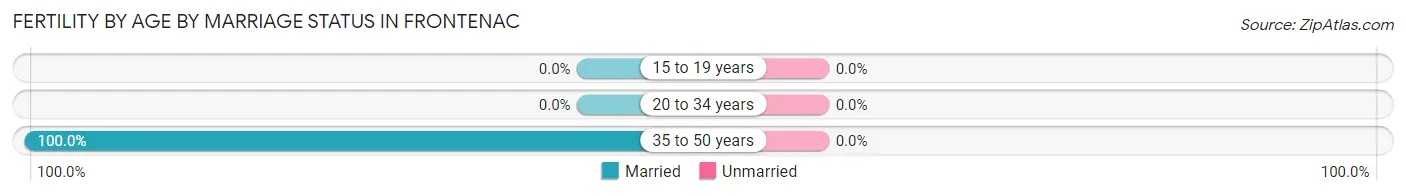
Fertility by Age by Marriage Status in Frontenac
| Age Bracket | Married | Unmarried |
| 15 to 19 years | 0 (0.0%) | 0 (0.0%) |
| 20 to 34 years | 0 (0.0%) | 0 (0.0%) |
| 35 to 50 years | 7 (100.0%) | 0 (0.0%) |
| Total | 7 (100.0%) | 0 (0.0%) |
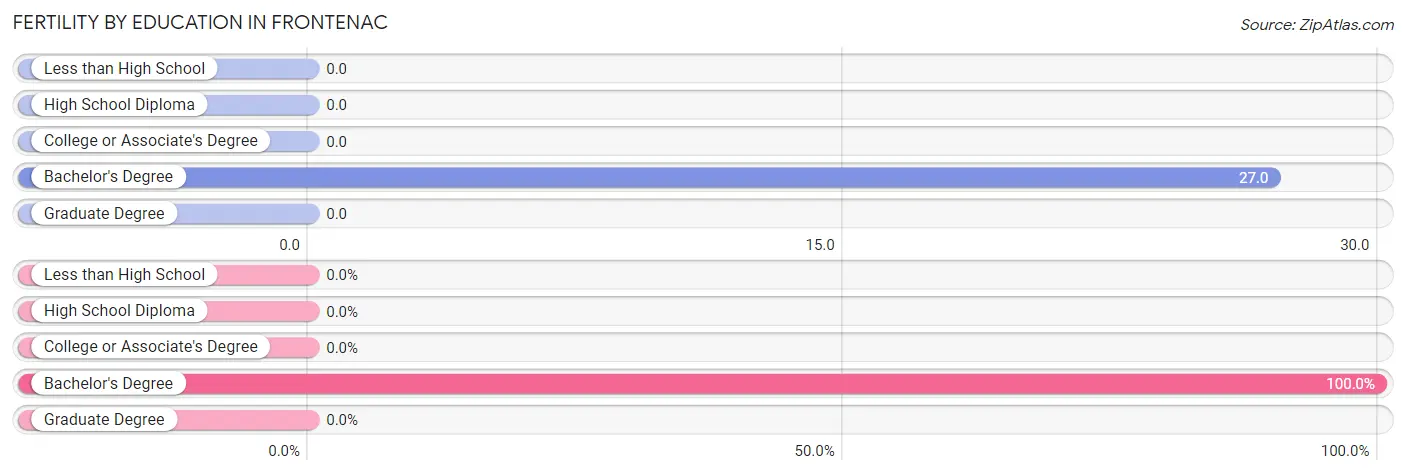
Fertility by Education in Frontenac
| Educational Attainment | Women with Births | Births / 1,000 Women |
| Less than High School | 0 (0.0%) | 0.0 |
| High School Diploma | 0 (0.0%) | 0.0 |
| College or Associate's Degree | 0 (0.0%) | 0.0 |
| Bachelor's Degree | 7 (100.0%) | 27.0 |
| Graduate Degree | 0 (0.0%) | 0.0 |
| Total | 7 (100.0%) | 10.0 |
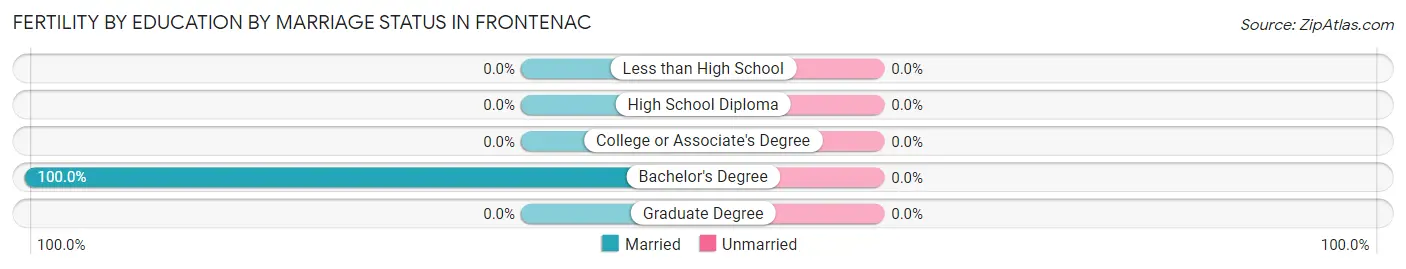
Fertility by Education by Marriage Status in Frontenac
| Educational Attainment | Married | Unmarried |
| Less than High School | 0 (0.0%) | 0 (0.0%) |
| High School Diploma | 0 (0.0%) | 0 (0.0%) |
| College or Associate's Degree | 0 (0.0%) | 0 (0.0%) |
| Bachelor's Degree | 7 (100.0%) | 0 (0.0%) |
| Graduate Degree | 0 (0.0%) | 0 (0.0%) |
| Total | 7 (100.0%) | 0 (0.0%) |
Employment Characteristics in Frontenac
Employment by Class of Employer in Frontenac
Among the 1,661 employed individuals in Frontenac, private company employees (1,042 | 62.7%), not-for-profit organizations (290 | 17.5%), and self-employed (incorporated) (164 | 9.9%) make up the most common classes of employment.
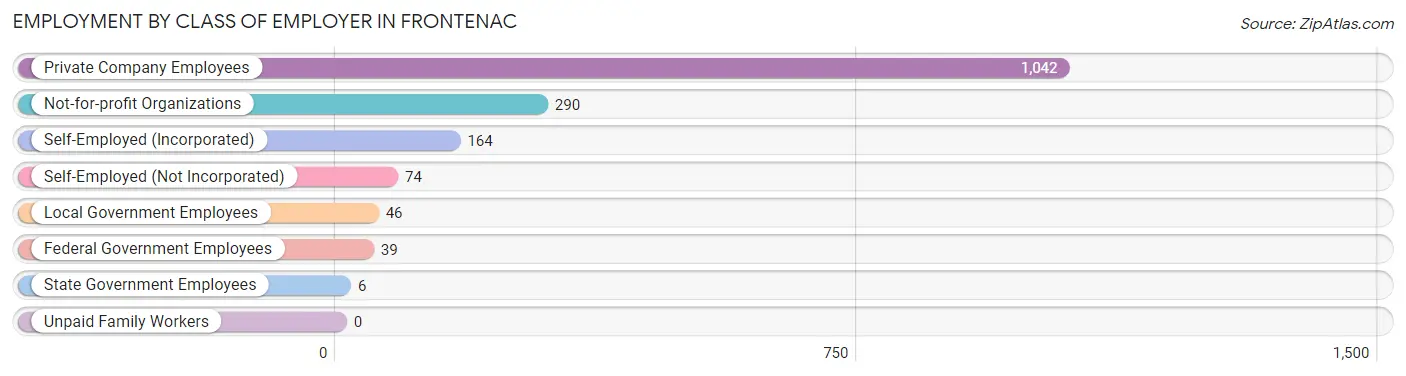
| Employer Class | # Employees | % Employees |
| Private Company Employees | 1,042 | 62.7% |
| Self-Employed (Incorporated) | 164 | 9.9% |
| Self-Employed (Not Incorporated) | 74 | 4.5% |
| Not-for-profit Organizations | 290 | 17.5% |
| Local Government Employees | 46 | 2.8% |
| State Government Employees | 6 | 0.4% |
| Federal Government Employees | 39 | 2.4% |
| Unpaid Family Workers | 0 | 0.0% |
| Total | 1,661 | 100.0% |
Employment Status by Age in Frontenac
According to the labor force statistics for Frontenac, out of the total population over 16 years of age (2,881), 60.7% or 1,749 individuals are in the labor force, with 4.1% or 72 of them unemployed. The age group with the highest labor force participation rate is 45 to 54 years, with 83.9% or 585 individuals in the labor force. Within the labor force, the 16 to 19 years age range has the highest percentage of unemployed individuals, with 24.3% or 26 of them being unemployed.
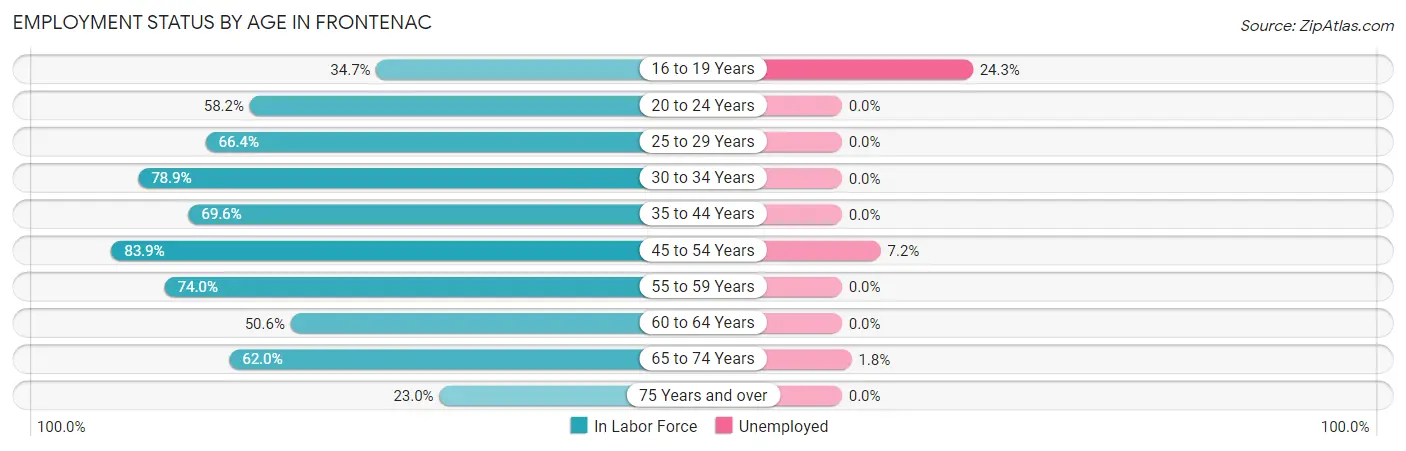
| Age Bracket | In Labor Force | Unemployed |
| 16 to 19 Years | 107 (34.7%) | 26 (24.3%) |
| 20 to 24 Years | 159 (58.2%) | 0 (0.0%) |
| 25 to 29 Years | 85 (66.4%) | 0 (0.0%) |
| 30 to 34 Years | 30 (78.9%) | 0 (0.0%) |
| 35 to 44 Years | 133 (69.6%) | 0 (0.0%) |
| 45 to 54 Years | 585 (83.9%) | 42 (7.2%) |
| 55 to 59 Years | 196 (74.0%) | 0 (0.0%) |
| 60 to 64 Years | 223 (50.6%) | 0 (0.0%) |
| 65 to 74 Years | 168 (62.0%) | 3 (1.8%) |
| 75 Years and over | 62 (23.0%) | 0 (0.0%) |
| Total | 1,749 (60.7%) | 72 (4.1%) |
Employment Status by Educational Attainment in Frontenac
According to labor force statistics for Frontenac, 71.1% of individuals (1,251) out of the total population between 25 and 64 years of age (1,760) are in the labor force, with 3.4% or 43 of them being unemployed. The group with the highest labor force participation rate are those with the educational attainment of bachelor's degree or higher, with 72.6% or 1,162 individuals in the labor force. Within the labor force, individuals with bachelor's degree or higher education have the highest percentage of unemployment, with 3.6% or 42 of them being unemployed.
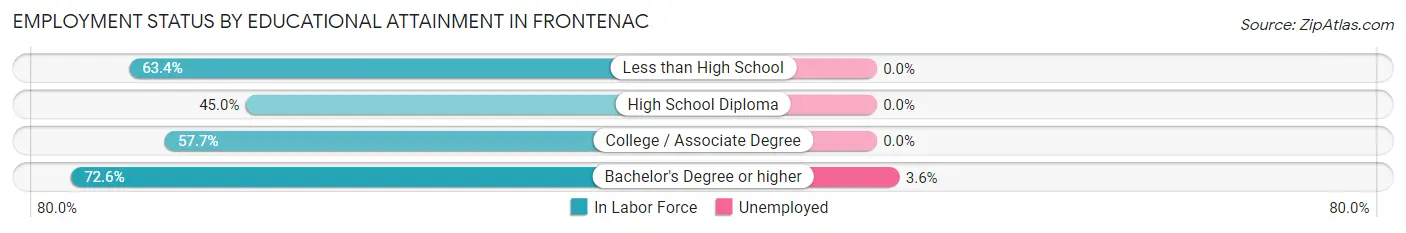
| Educational Attainment | In Labor Force | Unemployed |
| Less than High School | 26 (63.4%) | 0 (0.0%) |
| High School Diploma | 18 (45.0%) | 0 (0.0%) |
| College / Associate Degree | 45 (57.7%) | 0 (0.0%) |
| Bachelor's Degree or higher | 1,162 (72.6%) | 58 (3.6%) |
| Total | 1,251 (71.1%) | 60 (3.4%) |
Employment Occupations by Sex in Frontenac
Management, Business, Science and Arts Occupations
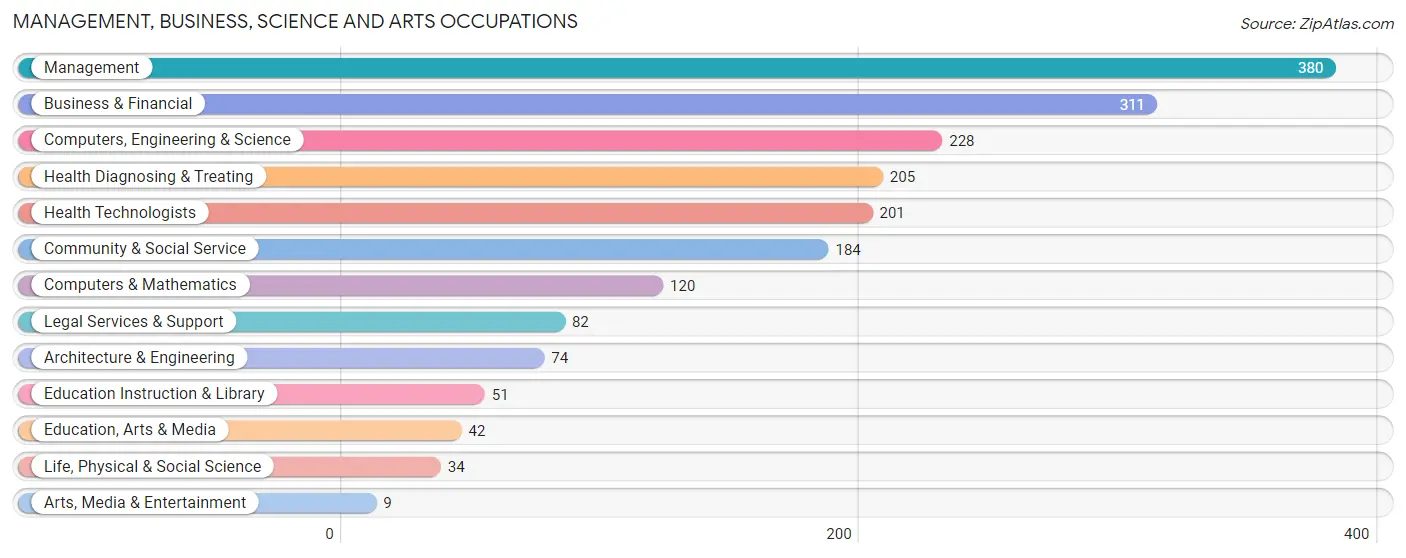
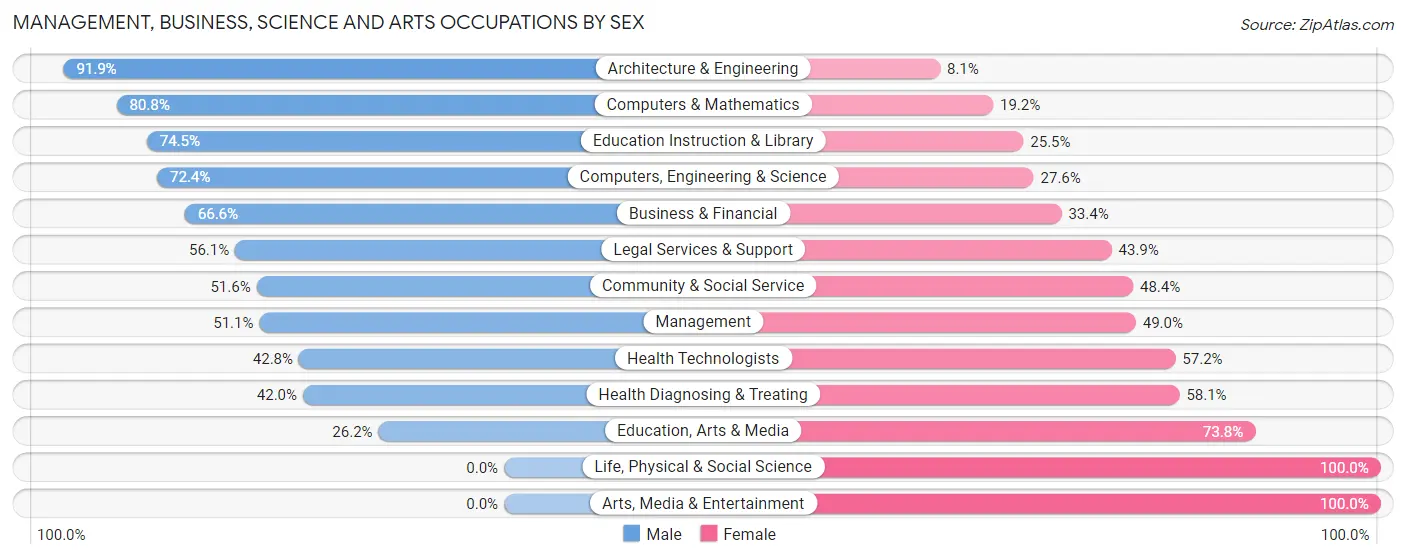
The most common Management, Business, Science and Arts occupations in Frontenac are Management (380 | 22.7%), Business & Financial (311 | 18.5%), Computers, Engineering & Science (228 | 13.6%), Health Diagnosing & Treating (205 | 12.2%), and Health Technologists (201 | 12.0%).
Management, Business, Science and Arts Occupations by Sex
Within the Management, Business, Science and Arts occupations in Frontenac, the most male-oriented occupations are Architecture & Engineering (91.9%), Computers & Mathematics (80.8%), and Education Instruction & Library (74.5%), while the most female-oriented occupations are Life, Physical & Social Science (100.0%), Arts, Media & Entertainment (100.0%), and Education, Arts & Media (73.8%).
| Occupation | Male | Female |
| Management | 194 (51.0%) | 186 (48.9%) |
| Business & Financial | 207 (66.6%) | 104 (33.4%) |
| Computers, Engineering & Science | 165 (72.4%) | 63 (27.6%) |
| Computers & Mathematics | 97 (80.8%) | 23 (19.2%) |
| Architecture & Engineering | 68 (91.9%) | 6 (8.1%) |
| Life, Physical & Social Science | 0 (0.0%) | 34 (100.0%) |
| Community & Social Service | 95 (51.6%) | 89 (48.4%) |
| Education, Arts & Media | 11 (26.2%) | 31 (73.8%) |
| Legal Services & Support | 46 (56.1%) | 36 (43.9%) |
| Education Instruction & Library | 38 (74.5%) | 13 (25.5%) |
| Arts, Media & Entertainment | 0 (0.0%) | 9 (100.0%) |
| Health Diagnosing & Treating | 86 (41.9%) | 119 (58.1%) |
| Health Technologists | 86 (42.8%) | 115 (57.2%) |
| Total (Category) | 747 (57.1%) | 561 (42.9%) |
| Total (Overall) | 1,016 (60.6%) | 661 (39.4%) |
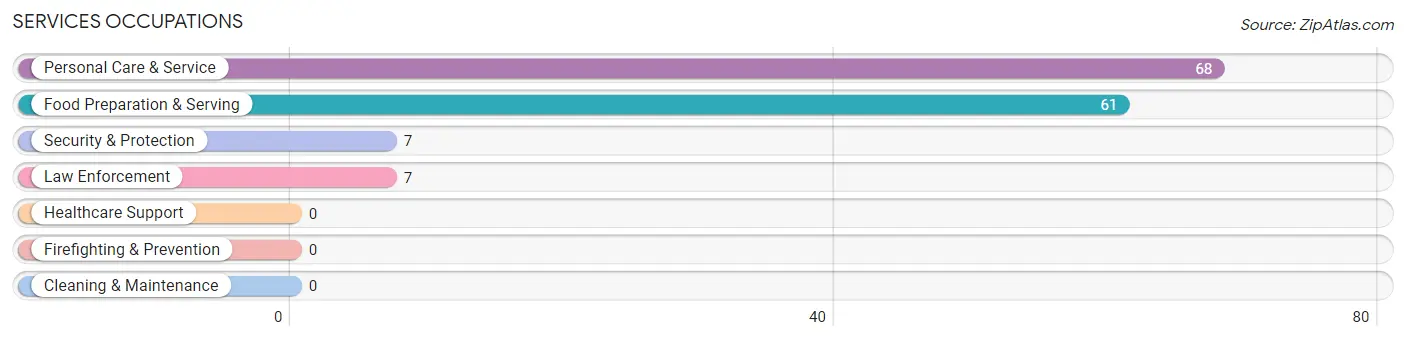
Services Occupations
The most common Services occupations in Frontenac are Personal Care & Service (68 | 4.1%), Food Preparation & Serving (61 | 3.6%), Security & Protection (7 | 0.4%), and Law Enforcement (7 | 0.4%).
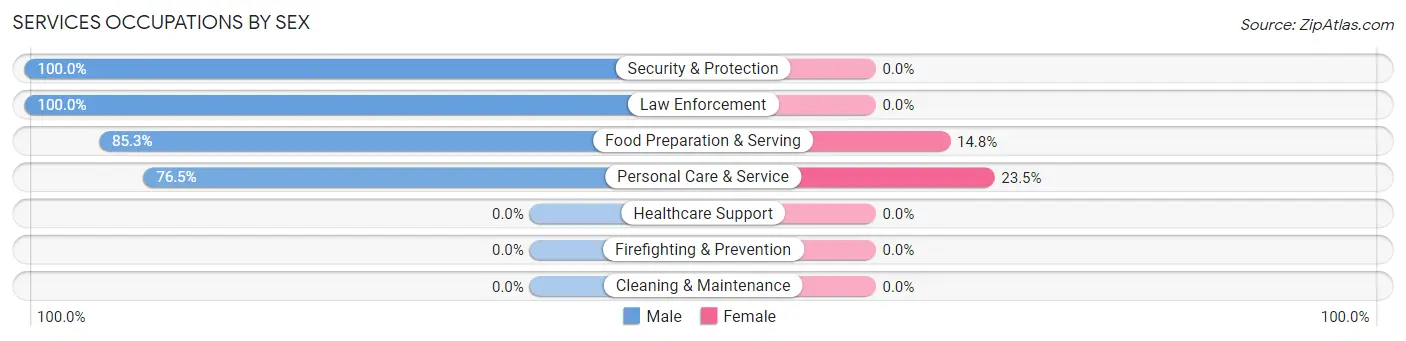
Services Occupations by Sex
Within the Services occupations in Frontenac, the most male-oriented occupations are Security & Protection (100.0%), Law Enforcement (100.0%), and Food Preparation & Serving (85.3%), while the most female-oriented occupations are Personal Care & Service (23.5%), and Food Preparation & Serving (14.7%).
| Occupation | Male | Female |
| Healthcare Support | 0 (0.0%) | 0 (0.0%) |
| Security & Protection | 7 (100.0%) | 0 (0.0%) |
| Firefighting & Prevention | 0 (0.0%) | 0 (0.0%) |
| Law Enforcement | 7 (100.0%) | 0 (0.0%) |
| Food Preparation & Serving | 52 (85.3%) | 9 (14.7%) |
| Cleaning & Maintenance | 0 (0.0%) | 0 (0.0%) |
| Personal Care & Service | 52 (76.5%) | 16 (23.5%) |
| Total (Category) | 111 (81.6%) | 25 (18.4%) |
| Total (Overall) | 1,016 (60.6%) | 661 (39.4%) |
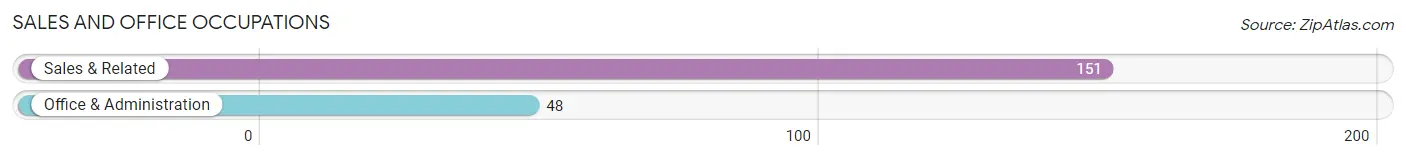
Sales and Office Occupations
The most common Sales and Office occupations in Frontenac are Sales & Related (151 | 9.0%), and Office & Administration (48 | 2.9%).
Sales and Office Occupations by Sex
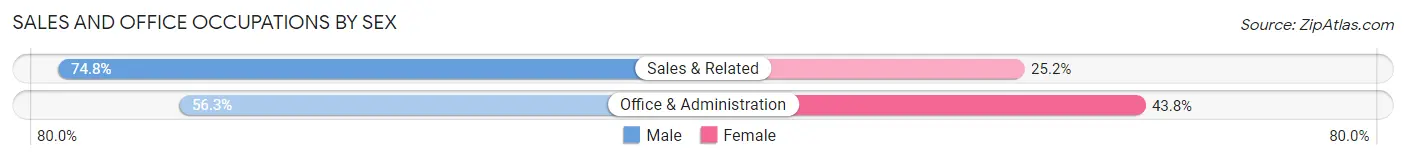
| Occupation | Male | Female |
| Sales & Related | 113 (74.8%) | 38 (25.2%) |
| Office & Administration | 27 (56.2%) | 21 (43.8%) |
| Total (Category) | 140 (70.4%) | 59 (29.6%) |
| Total (Overall) | 1,016 (60.6%) | 661 (39.4%) |
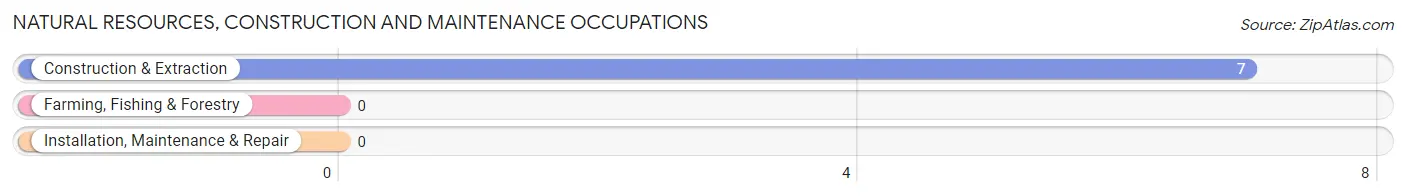
Natural Resources, Construction and Maintenance Occupations
The most common Natural Resources, Construction and Maintenance occupations in Frontenac are , and Construction & Extraction (7 | 0.4%).
Natural Resources, Construction and Maintenance Occupations by Sex
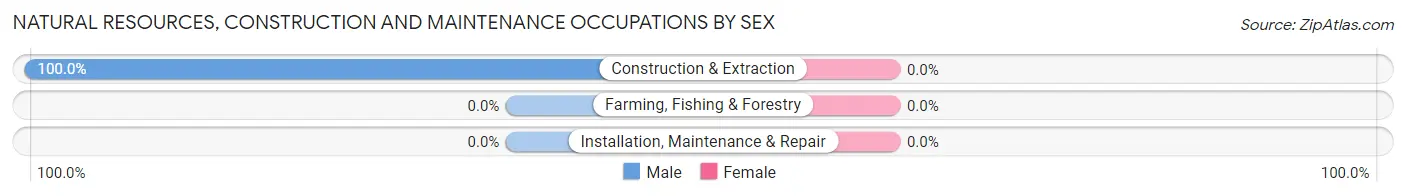
| Occupation | Male | Female |
| Farming, Fishing & Forestry | 0 (0.0%) | 0 (0.0%) |
| Construction & Extraction | 7 (100.0%) | 0 (0.0%) |
| Installation, Maintenance & Repair | 0 (0.0%) | 0 (0.0%) |
| Total (Category) | 7 (100.0%) | 0 (0.0%) |
| Total (Overall) | 1,016 (60.6%) | 661 (39.4%) |
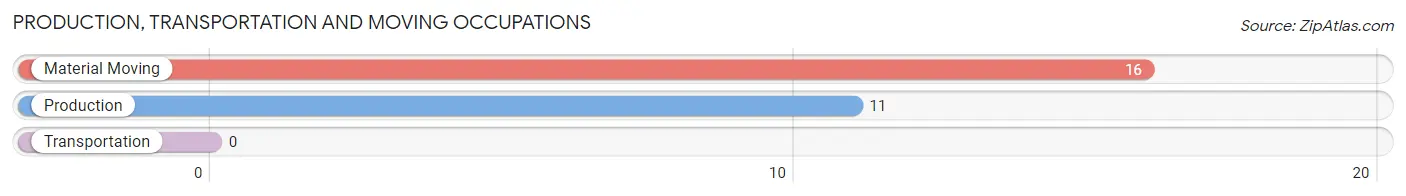
Production, Transportation and Moving Occupations
The most common Production, Transportation and Moving occupations in Frontenac are Material Moving (16 | 0.9%), and Production (11 | 0.7%).
Production, Transportation and Moving Occupations by Sex
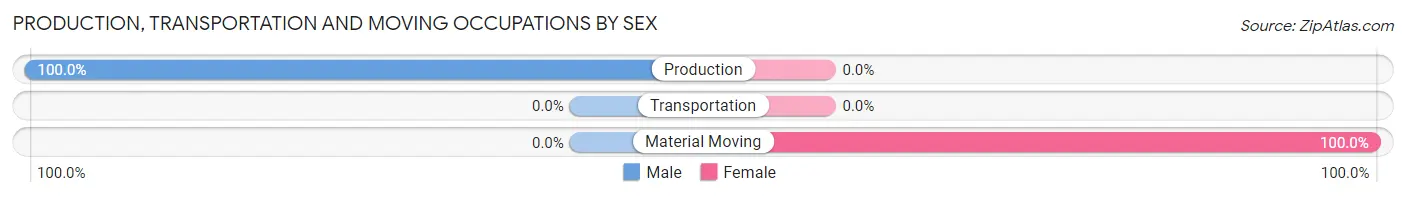
| Occupation | Male | Female |
| Production | 11 (100.0%) | 0 (0.0%) |
| Transportation | 0 (0.0%) | 0 (0.0%) |
| Material Moving | 0 (0.0%) | 16 (100.0%) |
| Total (Category) | 11 (40.7%) | 16 (59.3%) |
| Total (Overall) | 1,016 (60.6%) | 661 (39.4%) |
Employment Industries by Sex in Frontenac
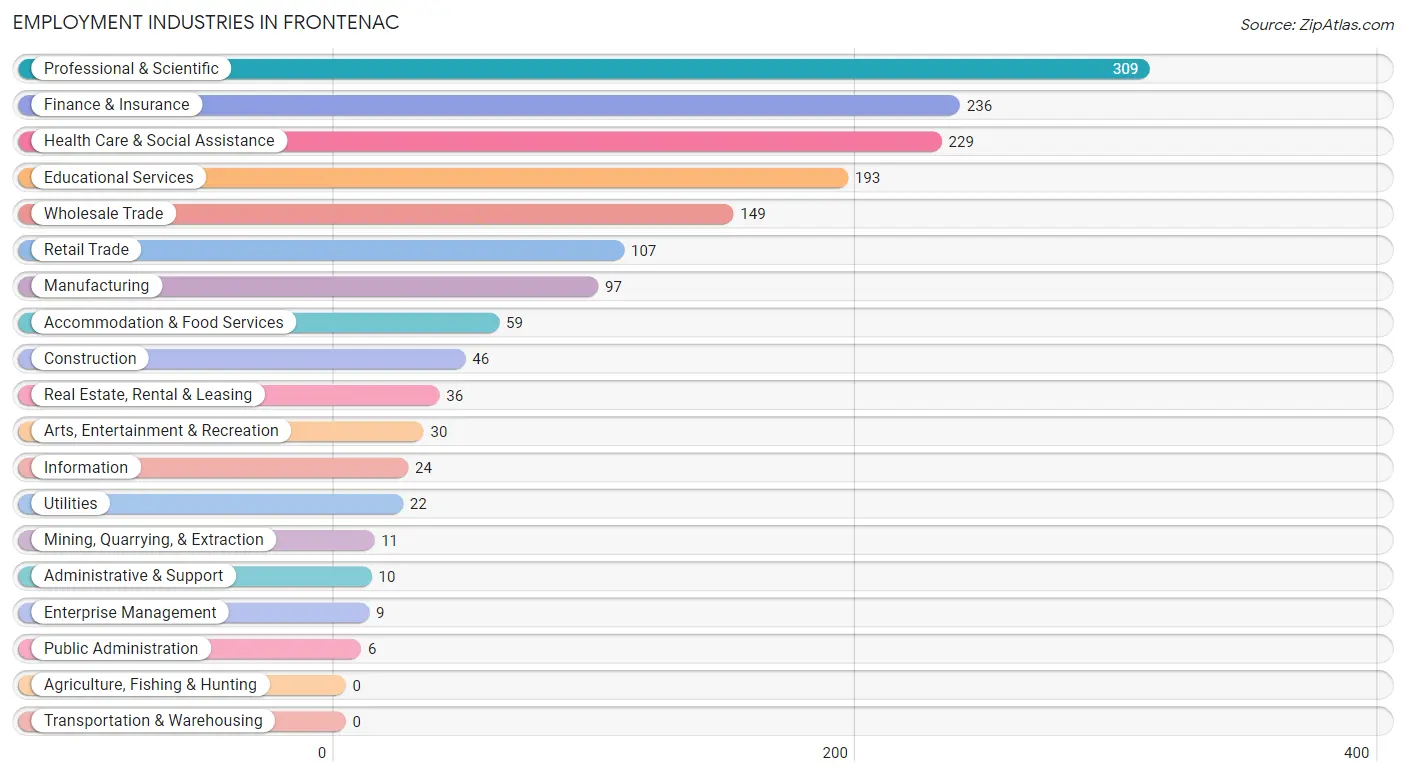
Employment Industries in Frontenac
The major employment industries in Frontenac include Professional & Scientific (309 | 18.4%), Finance & Insurance (236 | 14.1%), Health Care & Social Assistance (229 | 13.7%), Educational Services (193 | 11.5%), and Wholesale Trade (149 | 8.9%).
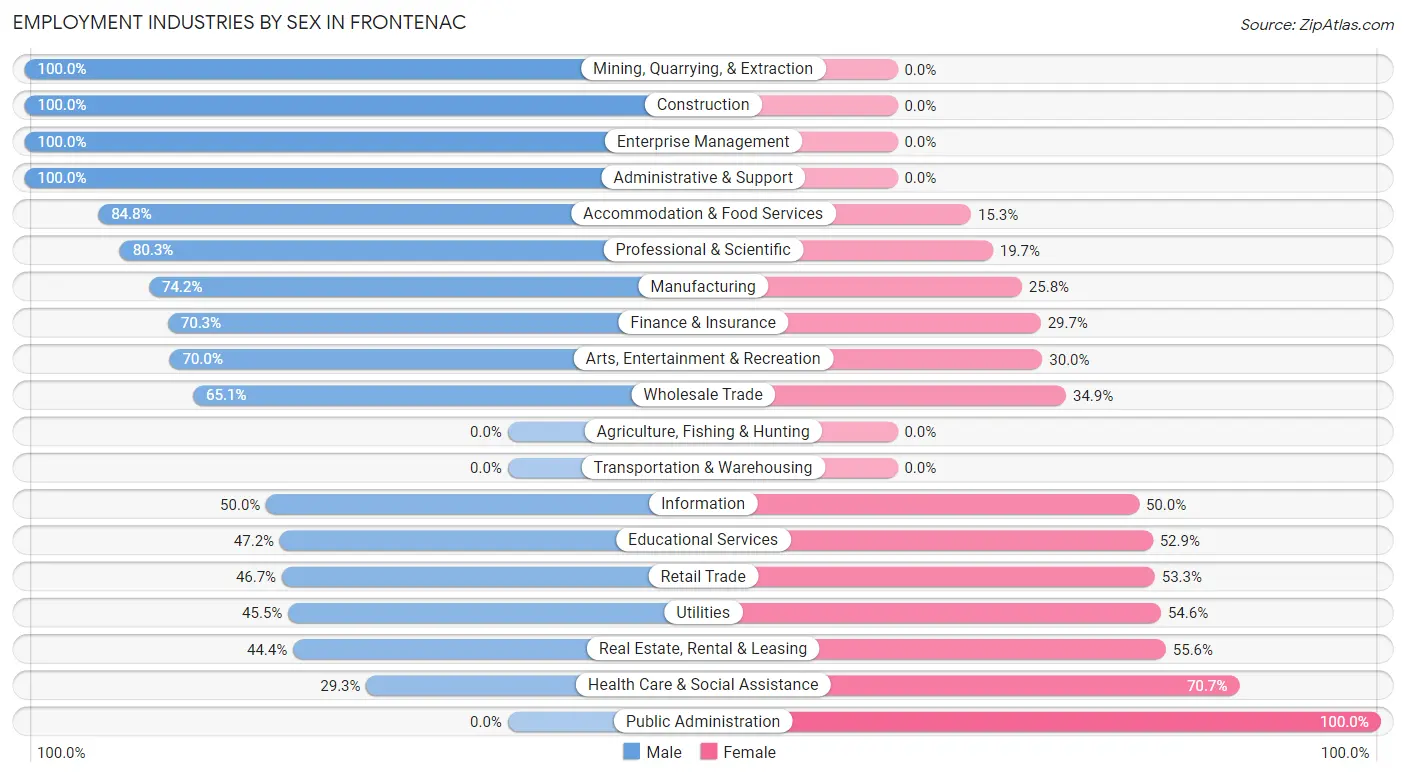
Employment Industries by Sex in Frontenac
The Frontenac industries that see more men than women are Mining, Quarrying, & Extraction (100.0%), Construction (100.0%), and Enterprise Management (100.0%), whereas the industries that tend to have a higher number of women are Public Administration (100.0%), Health Care & Social Assistance (70.7%), and Real Estate, Rental & Leasing (55.6%).
| Industry | Male | Female |
| Agriculture, Fishing & Hunting | 0 (0.0%) | 0 (0.0%) |
| Mining, Quarrying, & Extraction | 11 (100.0%) | 0 (0.0%) |
| Construction | 46 (100.0%) | 0 (0.0%) |
| Manufacturing | 72 (74.2%) | 25 (25.8%) |
| Wholesale Trade | 97 (65.1%) | 52 (34.9%) |
| Retail Trade | 50 (46.7%) | 57 (53.3%) |
| Transportation & Warehousing | 0 (0.0%) | 0 (0.0%) |
| Utilities | 10 (45.5%) | 12 (54.5%) |
| Information | 12 (50.0%) | 12 (50.0%) |
| Finance & Insurance | 166 (70.3%) | 70 (29.7%) |
| Real Estate, Rental & Leasing | 16 (44.4%) | 20 (55.6%) |
| Professional & Scientific | 248 (80.3%) | 61 (19.7%) |
| Enterprise Management | 9 (100.0%) | 0 (0.0%) |
| Administrative & Support | 10 (100.0%) | 0 (0.0%) |
| Educational Services | 91 (47.1%) | 102 (52.8%) |
| Health Care & Social Assistance | 67 (29.3%) | 162 (70.7%) |
| Arts, Entertainment & Recreation | 21 (70.0%) | 9 (30.0%) |
| Accommodation & Food Services | 50 (84.8%) | 9 (15.2%) |
| Public Administration | 0 (0.0%) | 6 (100.0%) |
| Total | 1,016 (60.6%) | 661 (39.4%) |
Education in Frontenac
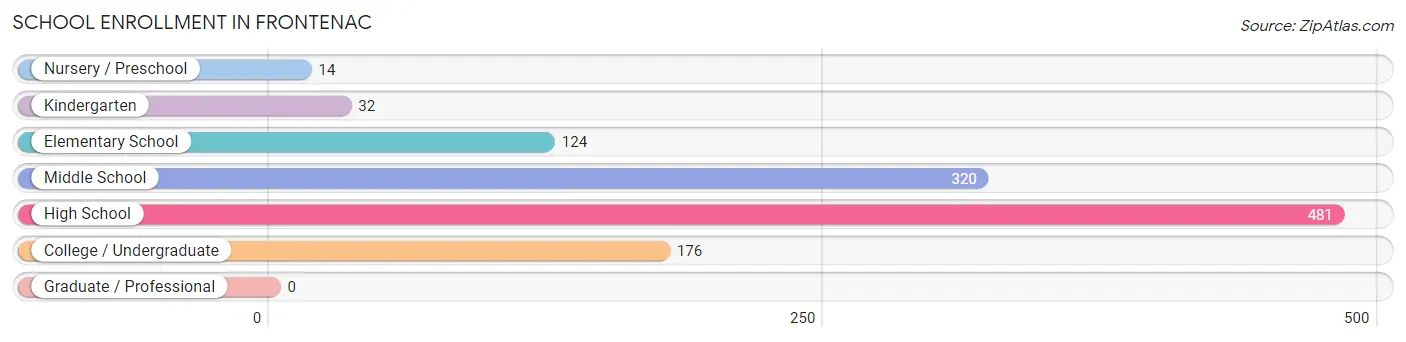
School Enrollment in Frontenac
The most common levels of schooling among the 1,147 students in Frontenac are high school (481 | 41.9%), middle school (320 | 27.9%), and college / undergraduate (176 | 15.3%).
| School Level | # Students | % Students |
| Nursery / Preschool | 14 | 1.2% |
| Kindergarten | 32 | 2.8% |
| Elementary School | 124 | 10.8% |
| Middle School | 320 | 27.9% |
| High School | 481 | 41.9% |
| College / Undergraduate | 176 | 15.3% |
| Graduate / Professional | 0 | 0.0% |
| Total | 1,147 | 100.0% |
School Enrollment by Age by Funding Source in Frontenac
Out of a total of 1,147 students who are enrolled in schools in Frontenac, 635 (55.4%) attend a private institution, while the remaining 512 (44.6%) are enrolled in public schools. The age group of 3 to 4 year olds has the highest likelihood of being enrolled in private schools, with 8 (100.0% in the age bracket) enrolled. Conversely, the age group of 5 to 9 year old has the lowest likelihood of being enrolled in a private school, with 90 (61.6% in the age bracket) attending a public institution.
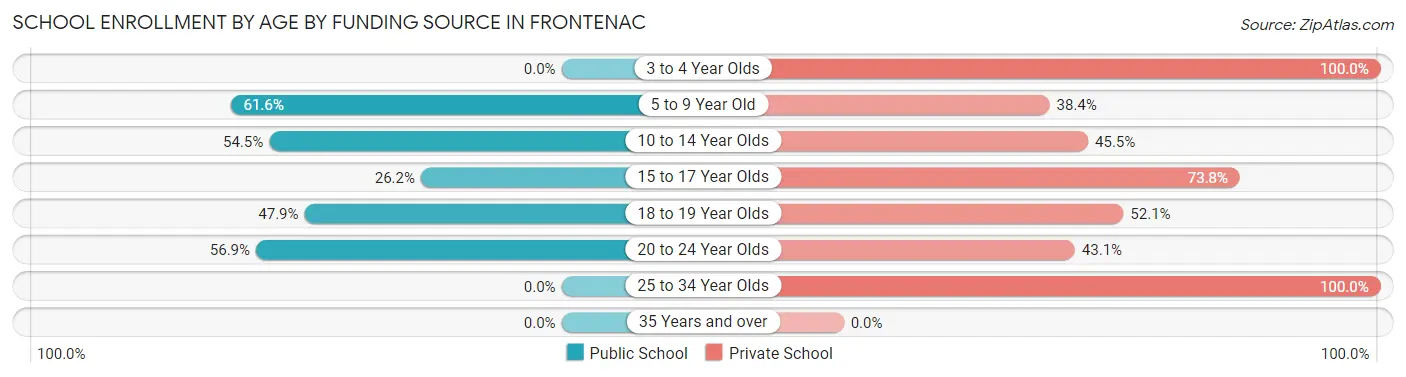
| Age Bracket | Public School | Private School |
| 3 to 4 Year Olds | 0 (0.0%) | 8 (100.0%) |
| 5 to 9 Year Old | 90 (61.6%) | 56 (38.4%) |
| 10 to 14 Year Olds | 201 (54.5%) | 168 (45.5%) |
| 15 to 17 Year Olds | 108 (26.2%) | 304 (73.8%) |
| 18 to 19 Year Olds | 34 (47.9%) | 37 (52.1%) |
| 20 to 24 Year Olds | 78 (56.9%) | 59 (43.1%) |
| 25 to 34 Year Olds | 0 (0.0%) | 4 (100.0%) |
| 35 Years and over | 0 (0.0%) | 0 (0.0%) |
| Total | 512 (44.6%) | 635 (55.4%) |
Educational Attainment by Field of Study in Frontenac
Business (588 | 26.6%), physical & health sciences (215 | 9.7%), science & technology (203 | 9.2%), bio, nature & agricultural (152 | 6.9%), and social sciences (151 | 6.8%) are the most common fields of study among 2,213 individuals in Frontenac who have obtained a bachelor's degree or higher.
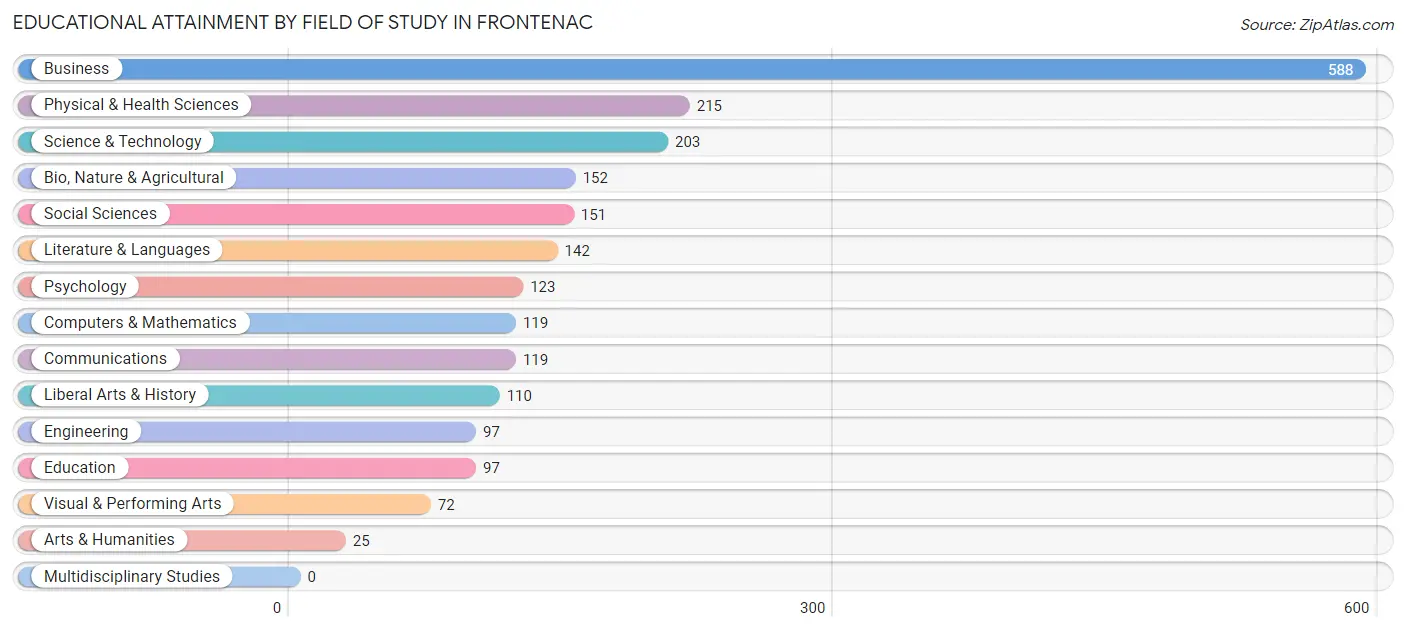
| Field of Study | # Graduates | % Graduates |
| Computers & Mathematics | 119 | 5.4% |
| Bio, Nature & Agricultural | 152 | 6.9% |
| Physical & Health Sciences | 215 | 9.7% |
| Psychology | 123 | 5.6% |
| Social Sciences | 151 | 6.8% |
| Engineering | 97 | 4.4% |
| Multidisciplinary Studies | 0 | 0.0% |
| Science & Technology | 203 | 9.2% |
| Business | 588 | 26.6% |
| Education | 97 | 4.4% |
| Literature & Languages | 142 | 6.4% |
| Liberal Arts & History | 110 | 5.0% |
| Visual & Performing Arts | 72 | 3.3% |
| Communications | 119 | 5.4% |
| Arts & Humanities | 25 | 1.1% |
| Total | 2,213 | 100.0% |
Transportation & Commute in Frontenac
Vehicle Availability by Sex in Frontenac
The most prevalent vehicle ownership categories in Frontenac are males with 3 vehicles (445, accounting for 43.8%) and females with 3 vehicles (225, making up 69.4%).
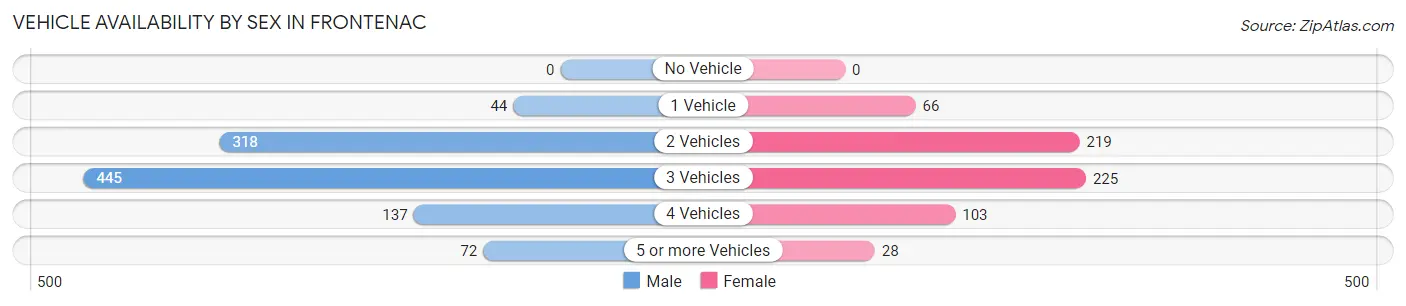
| Vehicles Available | Male | Female |
| No Vehicle | 0 (0.0%) | 0 (0.0%) |
| 1 Vehicle | 44 (4.3%) | 66 (10.3%) |
| 2 Vehicles | 318 (31.3%) | 219 (34.2%) |
| 3 Vehicles | 445 (43.8%) | 225 (35.1%) |
| 4 Vehicles | 137 (13.5%) | 103 (16.1%) |
| 5 or more Vehicles | 72 (7.1%) | 28 (4.4%) |
| Total | 1,016 (100.0%) | 641 (100.0%) |
Commute Time in Frontenac
The most frequently occuring commute durations in Frontenac are 15 to 19 minutes (328 commuters, 23.0%), 20 to 24 minutes (272 commuters, 19.1%), and 30 to 34 minutes (257 commuters, 18.0%).
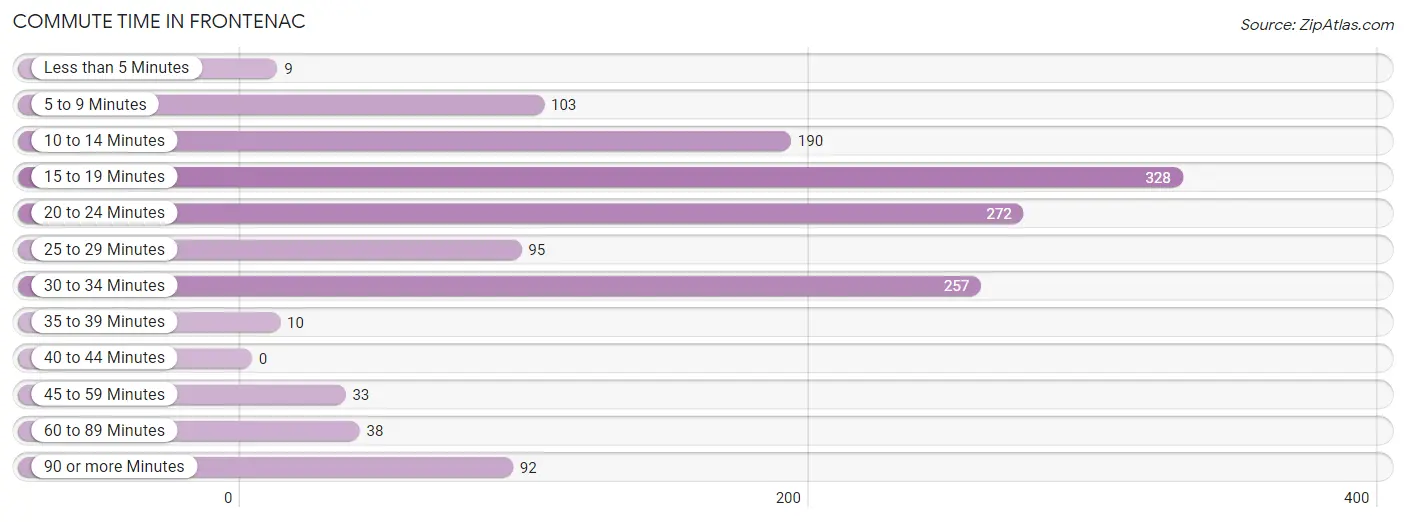
| Commute Time | # Commuters | % Commuters |
| Less than 5 Minutes | 9 | 0.6% |
| 5 to 9 Minutes | 103 | 7.2% |
| 10 to 14 Minutes | 190 | 13.3% |
| 15 to 19 Minutes | 328 | 23.0% |
| 20 to 24 Minutes | 272 | 19.1% |
| 25 to 29 Minutes | 95 | 6.7% |
| 30 to 34 Minutes | 257 | 18.0% |
| 35 to 39 Minutes | 10 | 0.7% |
| 40 to 44 Minutes | 0 | 0.0% |
| 45 to 59 Minutes | 33 | 2.3% |
| 60 to 89 Minutes | 38 | 2.7% |
| 90 or more Minutes | 92 | 6.5% |
Commute Time by Sex in Frontenac
The most common commute times in Frontenac are 20 to 24 minutes (227 commuters, 26.0%) for males and 30 to 34 minutes (168 commuters, 30.4%) for females.
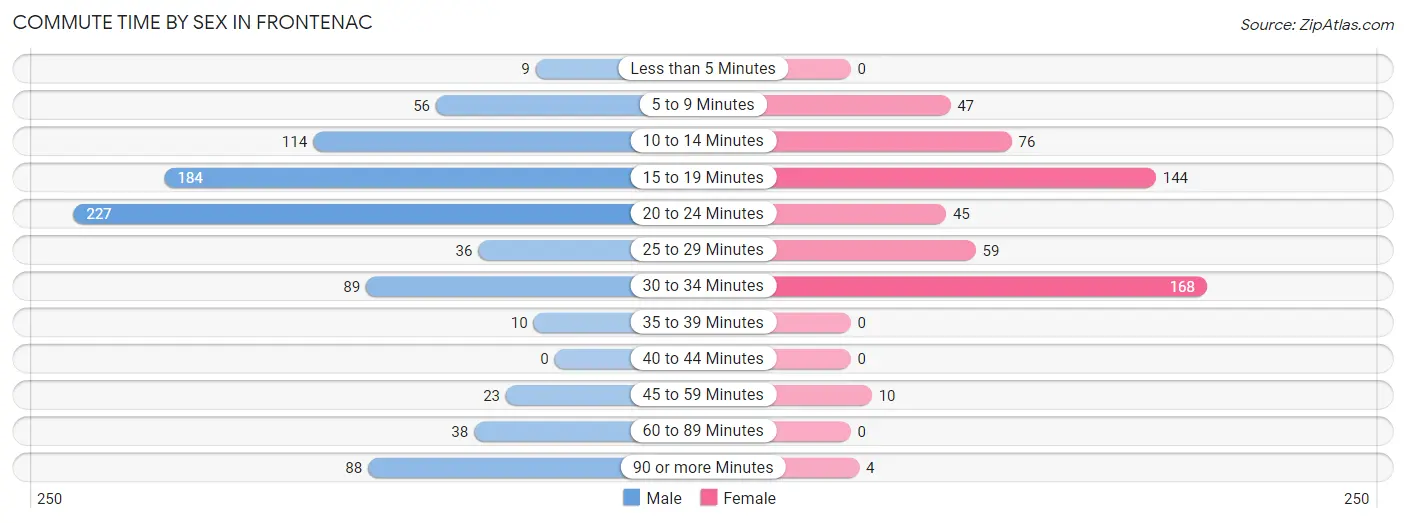
| Commute Time | Male | Female |
| Less than 5 Minutes | 9 (1.0%) | 0 (0.0%) |
| 5 to 9 Minutes | 56 (6.4%) | 47 (8.5%) |
| 10 to 14 Minutes | 114 (13.0%) | 76 (13.7%) |
| 15 to 19 Minutes | 184 (21.0%) | 144 (26.0%) |
| 20 to 24 Minutes | 227 (26.0%) | 45 (8.1%) |
| 25 to 29 Minutes | 36 (4.1%) | 59 (10.7%) |
| 30 to 34 Minutes | 89 (10.2%) | 168 (30.4%) |
| 35 to 39 Minutes | 10 (1.1%) | 0 (0.0%) |
| 40 to 44 Minutes | 0 (0.0%) | 0 (0.0%) |
| 45 to 59 Minutes | 23 (2.6%) | 10 (1.8%) |
| 60 to 89 Minutes | 38 (4.3%) | 0 (0.0%) |
| 90 or more Minutes | 88 (10.1%) | 4 (0.7%) |
Time of Departure to Work by Sex in Frontenac
The most frequent times of departure to work in Frontenac are 7:30 AM to 7:59 AM (143, 16.4%) for males and 7:30 AM to 7:59 AM (125, 22.6%) for females.
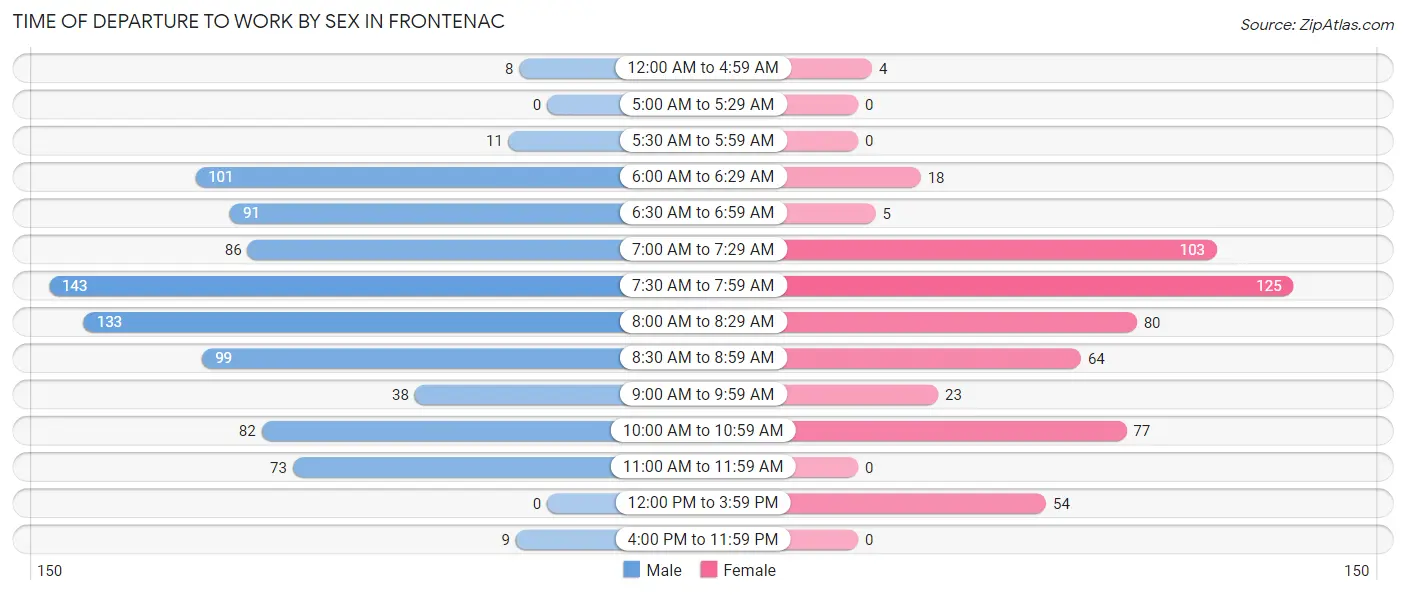
| Time of Departure | Male | Female |
| 12:00 AM to 4:59 AM | 8 (0.9%) | 4 (0.7%) |
| 5:00 AM to 5:29 AM | 0 (0.0%) | 0 (0.0%) |
| 5:30 AM to 5:59 AM | 11 (1.3%) | 0 (0.0%) |
| 6:00 AM to 6:29 AM | 101 (11.6%) | 18 (3.3%) |
| 6:30 AM to 6:59 AM | 91 (10.4%) | 5 (0.9%) |
| 7:00 AM to 7:29 AM | 86 (9.8%) | 103 (18.6%) |
| 7:30 AM to 7:59 AM | 143 (16.4%) | 125 (22.6%) |
| 8:00 AM to 8:29 AM | 133 (15.2%) | 80 (14.5%) |
| 8:30 AM to 8:59 AM | 99 (11.3%) | 64 (11.6%) |
| 9:00 AM to 9:59 AM | 38 (4.3%) | 23 (4.2%) |
| 10:00 AM to 10:59 AM | 82 (9.4%) | 77 (13.9%) |
| 11:00 AM to 11:59 AM | 73 (8.4%) | 0 (0.0%) |
| 12:00 PM to 3:59 PM | 0 (0.0%) | 54 (9.8%) |
| 4:00 PM to 11:59 PM | 9 (1.0%) | 0 (0.0%) |
| Total | 874 (100.0%) | 553 (100.0%) |
Housing Occupancy in Frontenac
Occupancy by Ownership in Frontenac
Of the total 1,160 dwellings in Frontenac, owner-occupied units account for 1,133 (97.7%), while renter-occupied units make up 27 (2.3%).
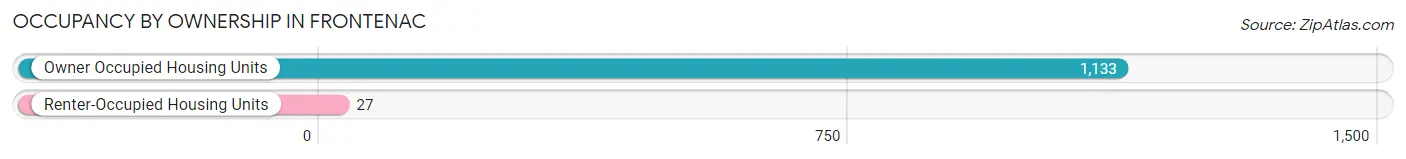
| Occupancy | # Housing Units | % Housing Units |
| Owner Occupied Housing Units | 1,133 | 97.7% |
| Renter-Occupied Housing Units | 27 | 2.3% |
| Total Occupied Housing Units | 1,160 | 100.0% |
Occupancy by Household Size in Frontenac
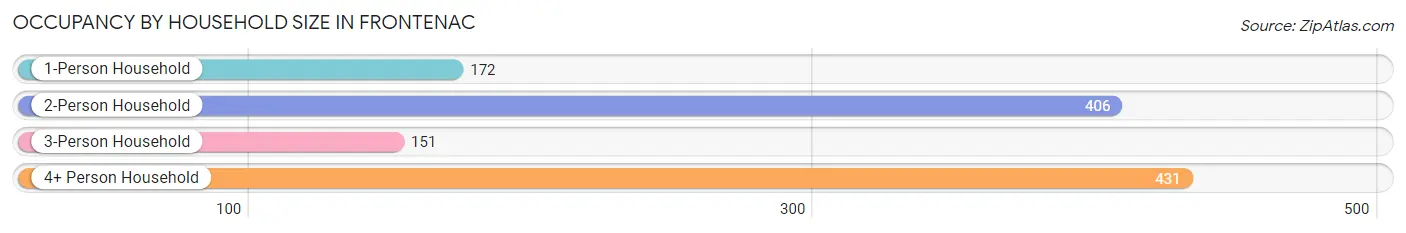
| Household Size | # Housing Units | % Housing Units |
| 1-Person Household | 172 | 14.8% |
| 2-Person Household | 406 | 35.0% |
| 3-Person Household | 151 | 13.0% |
| 4+ Person Household | 431 | 37.2% |
| Total Housing Units | 1,160 | 100.0% |
Occupancy by Ownership by Household Size in Frontenac
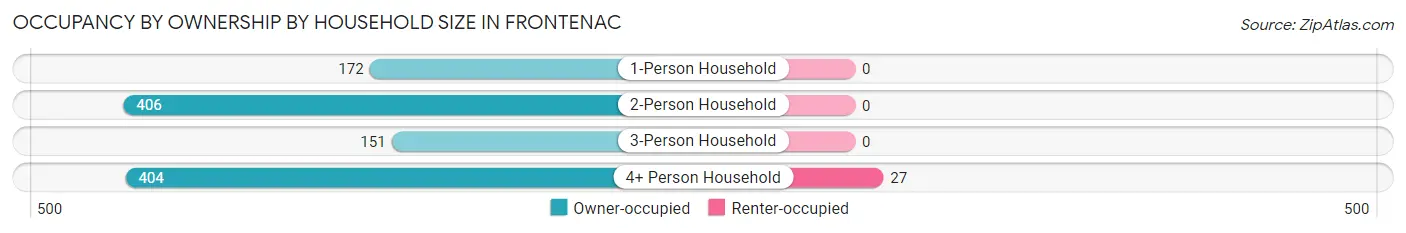
| Household Size | Owner-occupied | Renter-occupied |
| 1-Person Household | 172 (100.0%) | 0 (0.0%) |
| 2-Person Household | 406 (100.0%) | 0 (0.0%) |
| 3-Person Household | 151 (100.0%) | 0 (0.0%) |
| 4+ Person Household | 404 (93.7%) | 27 (6.3%) |
| Total Housing Units | 1,133 (97.7%) | 27 (2.3%) |
Occupancy by Educational Attainment in Frontenac
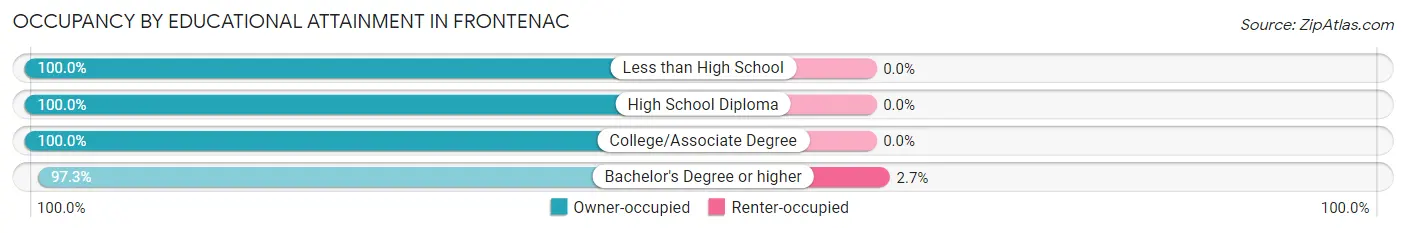
| Household Size | Owner-occupied | Renter-occupied |
| Less than High School | 13 (100.0%) | 0 (0.0%) |
| High School Diploma | 21 (100.0%) | 0 (0.0%) |
| College/Associate Degree | 110 (100.0%) | 0 (0.0%) |
| Bachelor's Degree or higher | 989 (97.3%) | 27 (2.7%) |
Occupancy by Age of Householder in Frontenac
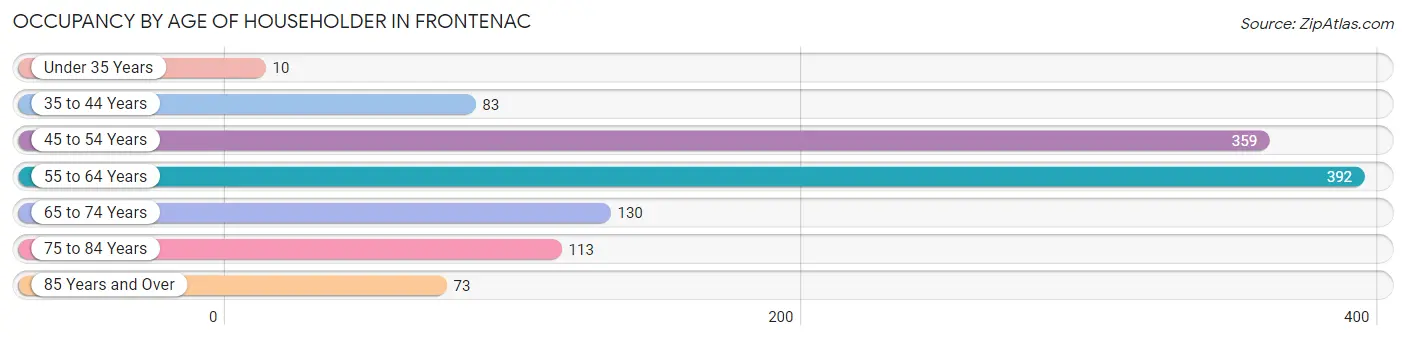
| Age Bracket | # Households | % Households |
| Under 35 Years | 10 | 0.9% |
| 35 to 44 Years | 83 | 7.2% |
| 45 to 54 Years | 359 | 30.9% |
| 55 to 64 Years | 392 | 33.8% |
| 65 to 74 Years | 130 | 11.2% |
| 75 to 84 Years | 113 | 9.7% |
| 85 Years and Over | 73 | 6.3% |
| Total | 1,160 | 100.0% |
Housing Finances in Frontenac
Median Income by Occupancy in Frontenac
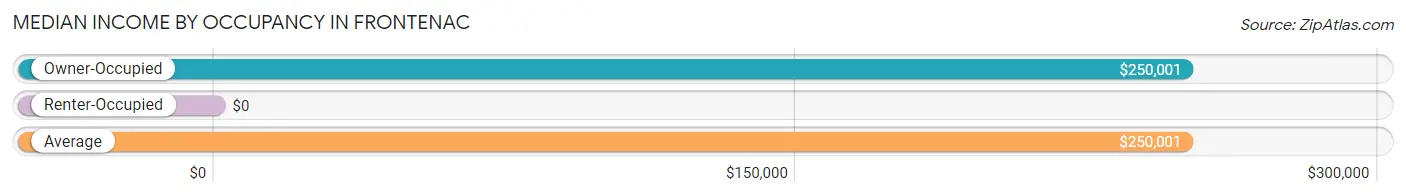
| Occupancy Type | # Households | Median Income |
| Owner-Occupied | 1,133 (97.7%) | $250,001 |
| Renter-Occupied | 27 (2.3%) | $0 |
| Average | 1,160 (100.0%) | $250,001 |
Occupancy by Householder Income Bracket in Frontenac
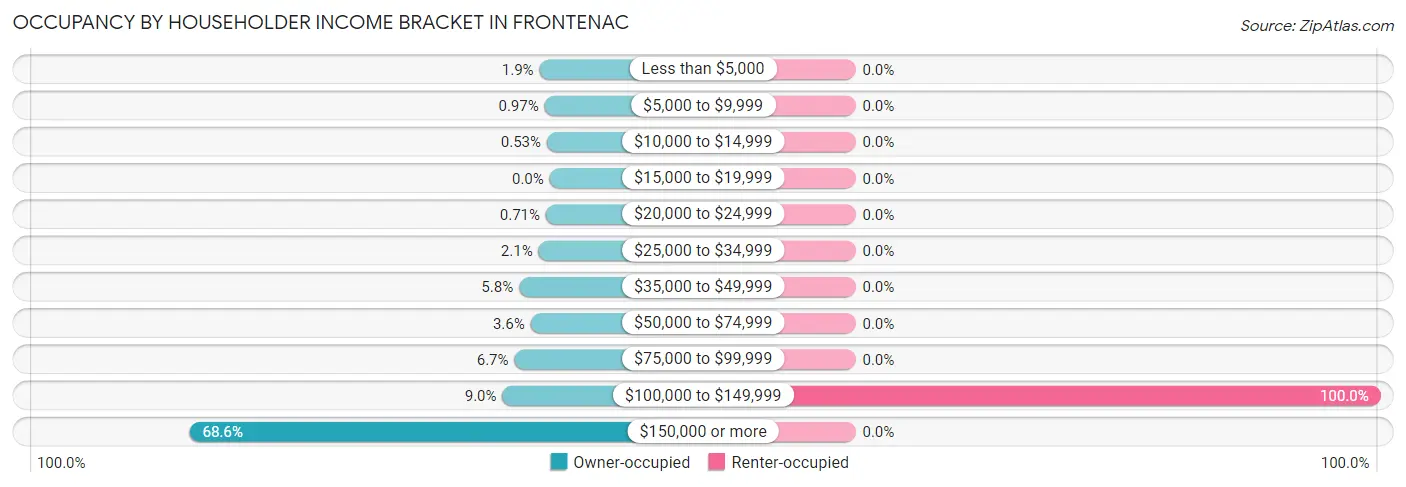
| Income Bracket | Owner-occupied | Renter-occupied |
| Less than $5,000 | 22 (1.9%) | 0 (0.0%) |
| $5,000 to $9,999 | 11 (1.0%) | 0 (0.0%) |
| $10,000 to $14,999 | 6 (0.5%) | 0 (0.0%) |
| $15,000 to $19,999 | 0 (0.0%) | 0 (0.0%) |
| $20,000 to $24,999 | 8 (0.7%) | 0 (0.0%) |
| $25,000 to $34,999 | 24 (2.1%) | 0 (0.0%) |
| $35,000 to $49,999 | 66 (5.8%) | 0 (0.0%) |
| $50,000 to $74,999 | 41 (3.6%) | 0 (0.0%) |
| $75,000 to $99,999 | 76 (6.7%) | 0 (0.0%) |
| $100,000 to $149,999 | 102 (9.0%) | 27 (100.0%) |
| $150,000 or more | 777 (68.6%) | 0 (0.0%) |
| Total | 1,133 (100.0%) | 27 (100.0%) |
Monthly Housing Cost Tiers in Frontenac
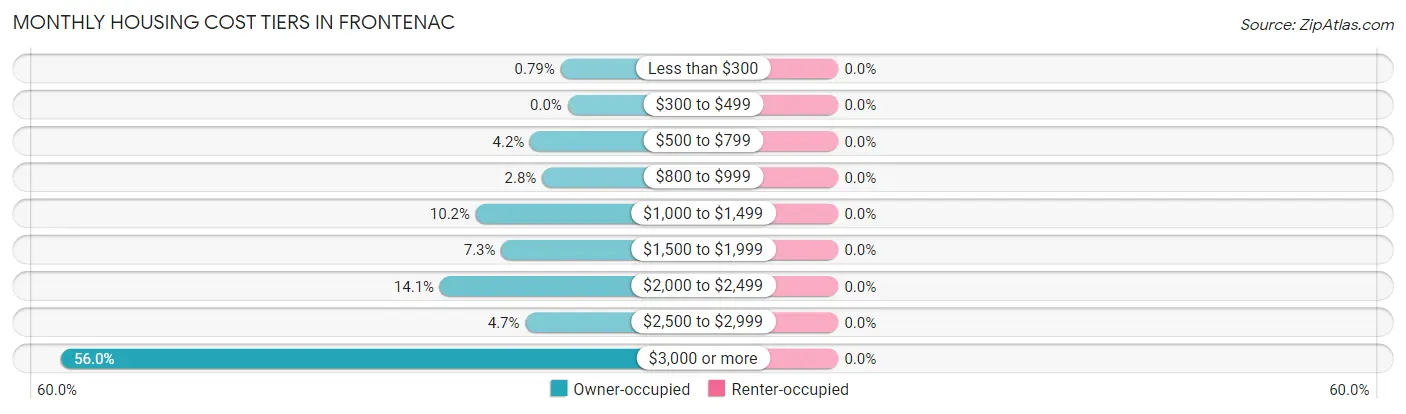
| Monthly Cost | Owner-occupied | Renter-occupied |
| Less than $300 | 9 (0.8%) | 0 (0.0%) |
| $300 to $499 | 0 (0.0%) | 0 (0.0%) |
| $500 to $799 | 47 (4.2%) | 0 (0.0%) |
| $800 to $999 | 32 (2.8%) | 0 (0.0%) |
| $1,000 to $1,499 | 115 (10.2%) | 0 (0.0%) |
| $1,500 to $1,999 | 83 (7.3%) | 0 (0.0%) |
| $2,000 to $2,499 | 160 (14.1%) | 0 (0.0%) |
| $2,500 to $2,999 | 53 (4.7%) | 0 (0.0%) |
| $3,000 or more | 634 (56.0%) | 0 (0.0%) |
| Total | 1,133 (100.0%) | 27 (100.0%) |
Physical Housing Characteristics in Frontenac
Housing Structures in Frontenac
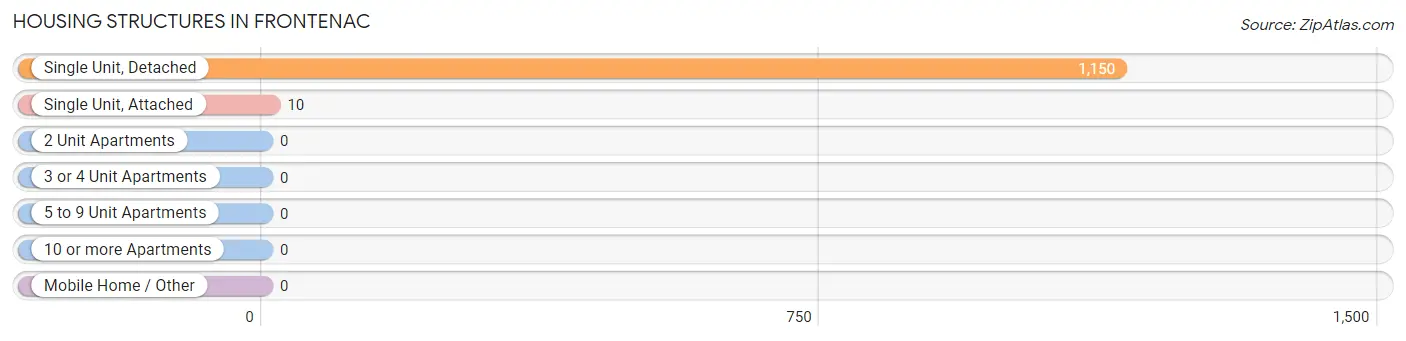
| Structure Type | # Housing Units | % Housing Units |
| Single Unit, Detached | 1,150 | 99.1% |
| Single Unit, Attached | 10 | 0.9% |
| 2 Unit Apartments | 0 | 0.0% |
| 3 or 4 Unit Apartments | 0 | 0.0% |
| 5 to 9 Unit Apartments | 0 | 0.0% |
| 10 or more Apartments | 0 | 0.0% |
| Mobile Home / Other | 0 | 0.0% |
| Total | 1,160 | 100.0% |
Housing Structures by Occupancy in Frontenac
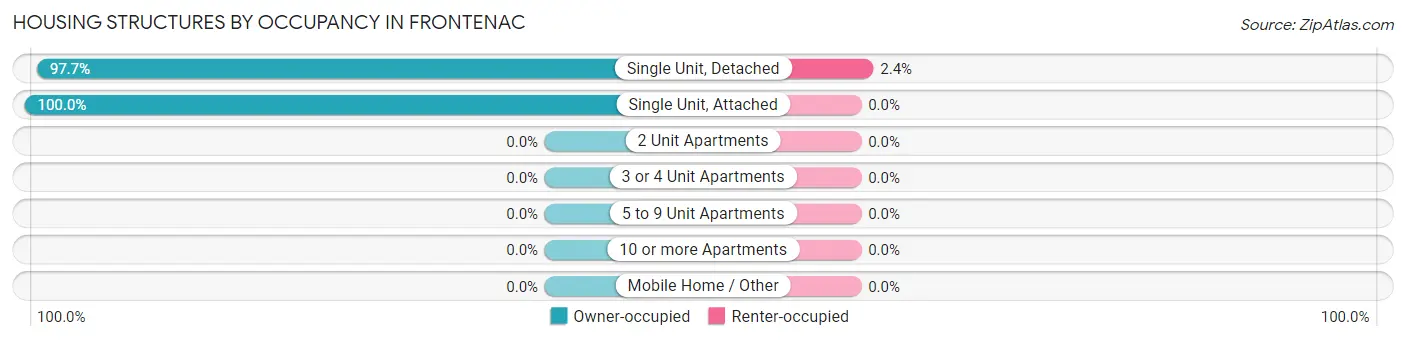
| Structure Type | Owner-occupied | Renter-occupied |
| Single Unit, Detached | 1,123 (97.7%) | 27 (2.4%) |
| Single Unit, Attached | 10 (100.0%) | 0 (0.0%) |
| 2 Unit Apartments | 0 (0.0%) | 0 (0.0%) |
| 3 or 4 Unit Apartments | 0 (0.0%) | 0 (0.0%) |
| 5 to 9 Unit Apartments | 0 (0.0%) | 0 (0.0%) |
| 10 or more Apartments | 0 (0.0%) | 0 (0.0%) |
| Mobile Home / Other | 0 (0.0%) | 0 (0.0%) |
| Total | 1,133 (97.7%) | 27 (2.3%) |
Housing Structures by Number of Rooms in Frontenac
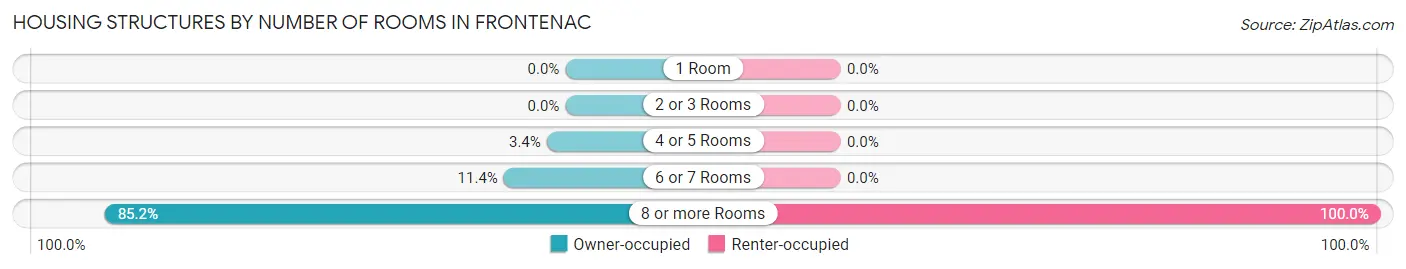
| Number of Rooms | Owner-occupied | Renter-occupied |
| 1 Room | 0 (0.0%) | 0 (0.0%) |
| 2 or 3 Rooms | 0 (0.0%) | 0 (0.0%) |
| 4 or 5 Rooms | 39 (3.4%) | 0 (0.0%) |
| 6 or 7 Rooms | 129 (11.4%) | 0 (0.0%) |
| 8 or more Rooms | 965 (85.2%) | 27 (100.0%) |
| Total | 1,133 (100.0%) | 27 (100.0%) |
Housing Structure by Heating Type in Frontenac
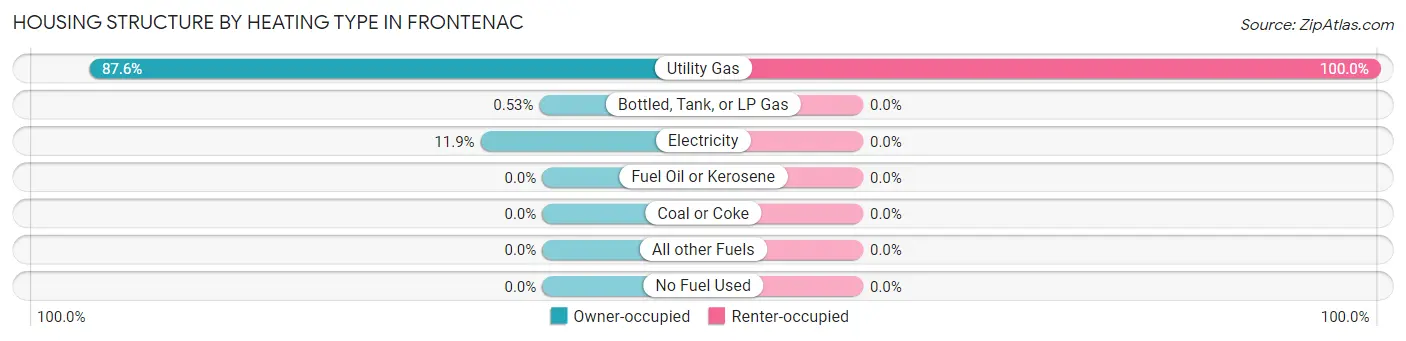
| Heating Type | Owner-occupied | Renter-occupied |
| Utility Gas | 992 (87.6%) | 27 (100.0%) |
| Bottled, Tank, or LP Gas | 6 (0.5%) | 0 (0.0%) |
| Electricity | 135 (11.9%) | 0 (0.0%) |
| Fuel Oil or Kerosene | 0 (0.0%) | 0 (0.0%) |
| Coal or Coke | 0 (0.0%) | 0 (0.0%) |
| All other Fuels | 0 (0.0%) | 0 (0.0%) |
| No Fuel Used | 0 (0.0%) | 0 (0.0%) |
| Total | 1,133 (100.0%) | 27 (100.0%) |
Household Vehicle Usage in Frontenac
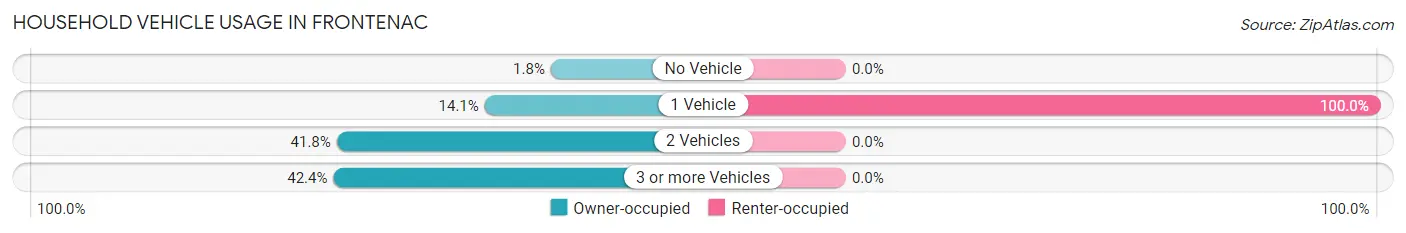
| Vehicles per Household | Owner-occupied | Renter-occupied |
| No Vehicle | 20 (1.8%) | 0 (0.0%) |
| 1 Vehicle | 160 (14.1%) | 27 (100.0%) |
| 2 Vehicles | 473 (41.7%) | 0 (0.0%) |
| 3 or more Vehicles | 480 (42.4%) | 0 (0.0%) |
| Total | 1,133 (100.0%) | 27 (100.0%) |
Real Estate & Mortgages in Frontenac
Real Estate and Mortgage Overview in Frontenac
| Characteristic | Without Mortgage | With Mortgage |
| Housing Units | 388 | 745 |
| Median Property Value | $945,700 | $952,700 |
| Median Household Income | $155,909 | $579 |
| Monthly Housing Costs | $1,501 | $597 |
| Real Estate Taxes | $10,001 | $12 |
Property Value by Mortgage Status in Frontenac
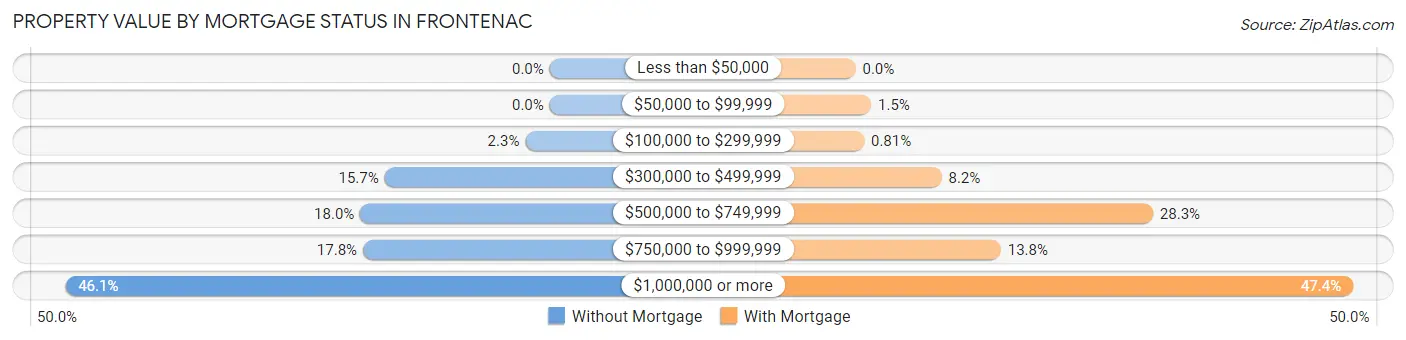
| Property Value | Without Mortgage | With Mortgage |
| Less than $50,000 | 0 (0.0%) | 0 (0.0%) |
| $50,000 to $99,999 | 0 (0.0%) | 11 (1.5%) |
| $100,000 to $299,999 | 9 (2.3%) | 6 (0.8%) |
| $300,000 to $499,999 | 61 (15.7%) | 61 (8.2%) |
| $500,000 to $749,999 | 70 (18.0%) | 211 (28.3%) |
| $750,000 to $999,999 | 69 (17.8%) | 103 (13.8%) |
| $1,000,000 or more | 179 (46.1%) | 353 (47.4%) |
| Total | 388 (100.0%) | 745 (100.0%) |
Household Income by Mortgage Status in Frontenac
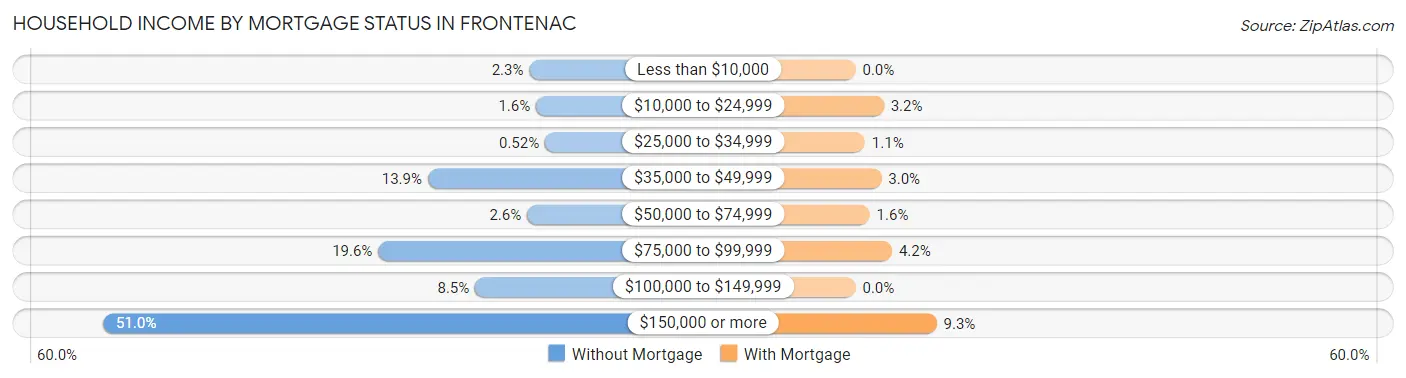
| Household Income | Without Mortgage | With Mortgage |
| Less than $10,000 | 9 (2.3%) | 0 (0.0%) |
| $10,000 to $24,999 | 6 (1.5%) | 24 (3.2%) |
| $25,000 to $34,999 | 2 (0.5%) | 8 (1.1%) |
| $35,000 to $49,999 | 54 (13.9%) | 22 (2.9%) |
| $50,000 to $74,999 | 10 (2.6%) | 12 (1.6%) |
| $75,000 to $99,999 | 76 (19.6%) | 31 (4.2%) |
| $100,000 to $149,999 | 33 (8.5%) | 0 (0.0%) |
| $150,000 or more | 198 (51.0%) | 69 (9.3%) |
| Total | 388 (100.0%) | 745 (100.0%) |
Property Value to Household Income Ratio in Frontenac
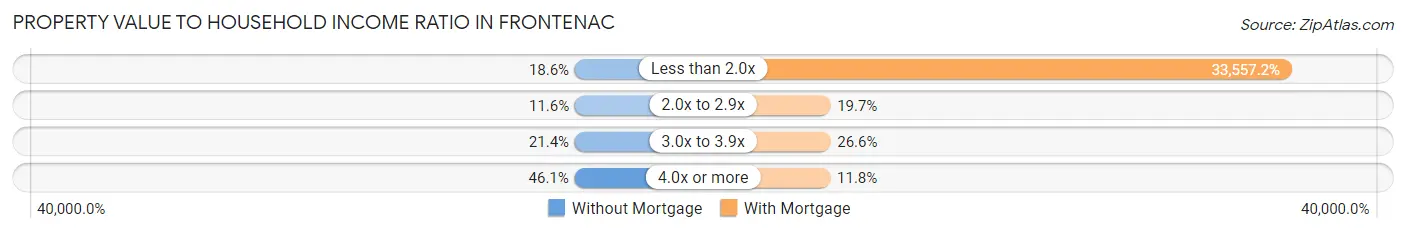
| Value-to-Income Ratio | Without Mortgage | With Mortgage |
| Less than 2.0x | 72 (18.6%) | 250,001 (33,557.2%) |
| 2.0x to 2.9x | 45 (11.6%) | 147 (19.7%) |
| 3.0x to 3.9x | 83 (21.4%) | 198 (26.6%) |
| 4.0x or more | 179 (46.1%) | 88 (11.8%) |
| Total | 388 (100.0%) | 745 (100.0%) |
Real Estate Taxes by Mortgage Status in Frontenac
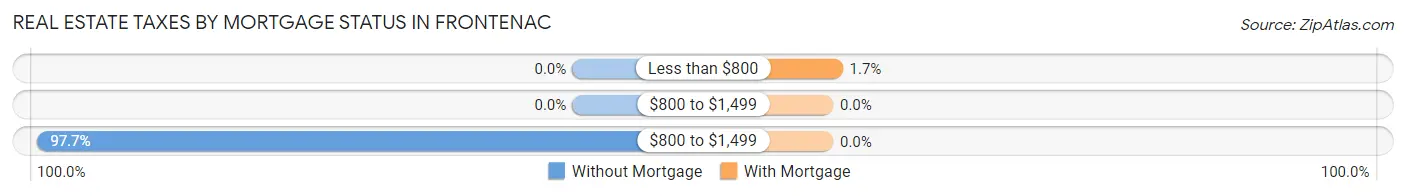
| Property Taxes | Without Mortgage | With Mortgage |
| Less than $800 | 0 (0.0%) | 13 (1.7%) |
| $800 to $1,499 | 0 (0.0%) | 0 (0.0%) |
| $800 to $1,499 | 379 (97.7%) | 0 (0.0%) |
| Total | 388 (100.0%) | 745 (100.0%) |
Health & Disability in Frontenac
Health Insurance Coverage by Age in Frontenac
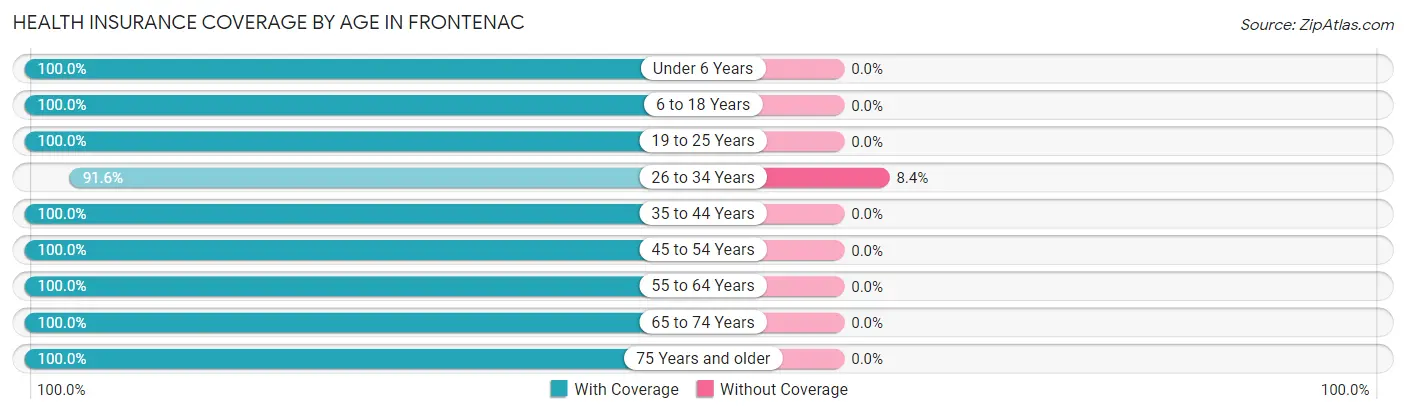
| Age Bracket | With Coverage | Without Coverage |
| Under 6 Years | 64 (100.0%) | 0 (0.0%) |
| 6 to 18 Years | 977 (100.0%) | 0 (0.0%) |
| 19 to 25 Years | 369 (100.0%) | 0 (0.0%) |
| 26 to 34 Years | 87 (91.6%) | 8 (8.4%) |
| 35 to 44 Years | 184 (100.0%) | 0 (0.0%) |
| 45 to 54 Years | 697 (100.0%) | 0 (0.0%) |
| 55 to 64 Years | 700 (100.0%) | 0 (0.0%) |
| 65 to 74 Years | 264 (100.0%) | 0 (0.0%) |
| 75 Years and older | 257 (100.0%) | 0 (0.0%) |
| Total | 3,599 (99.8%) | 8 (0.2%) |
Health Insurance Coverage by Citizenship Status in Frontenac
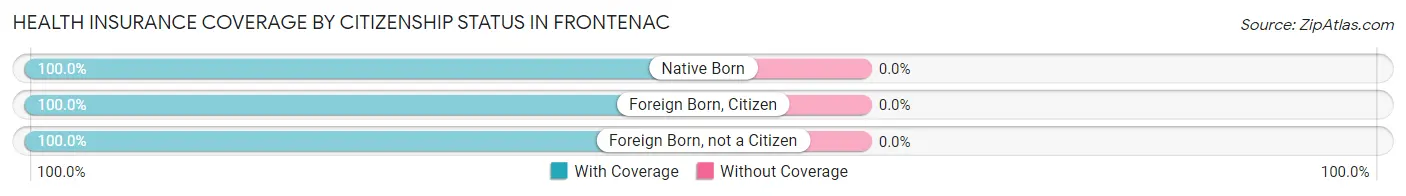
| Citizenship Status | With Coverage | Without Coverage |
| Native Born | 64 (100.0%) | 0 (0.0%) |
| Foreign Born, Citizen | 977 (100.0%) | 0 (0.0%) |
| Foreign Born, not a Citizen | 369 (100.0%) | 0 (0.0%) |
Health Insurance Coverage by Household Income in Frontenac
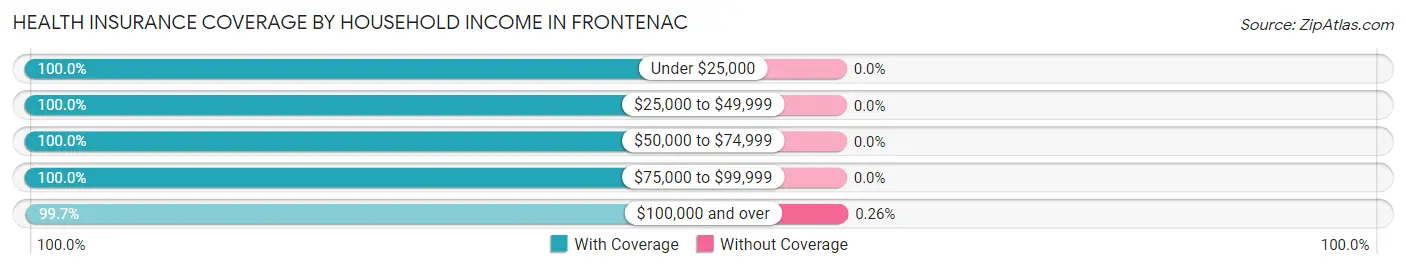
| Household Income | With Coverage | Without Coverage |
| Under $25,000 | 89 (100.0%) | 0 (0.0%) |
| $25,000 to $49,999 | 147 (100.0%) | 0 (0.0%) |
| $50,000 to $74,999 | 100 (100.0%) | 0 (0.0%) |
| $75,000 to $99,999 | 123 (100.0%) | 0 (0.0%) |
| $100,000 and over | 3,126 (99.7%) | 8 (0.3%) |
Public vs Private Health Insurance Coverage by Age in Frontenac
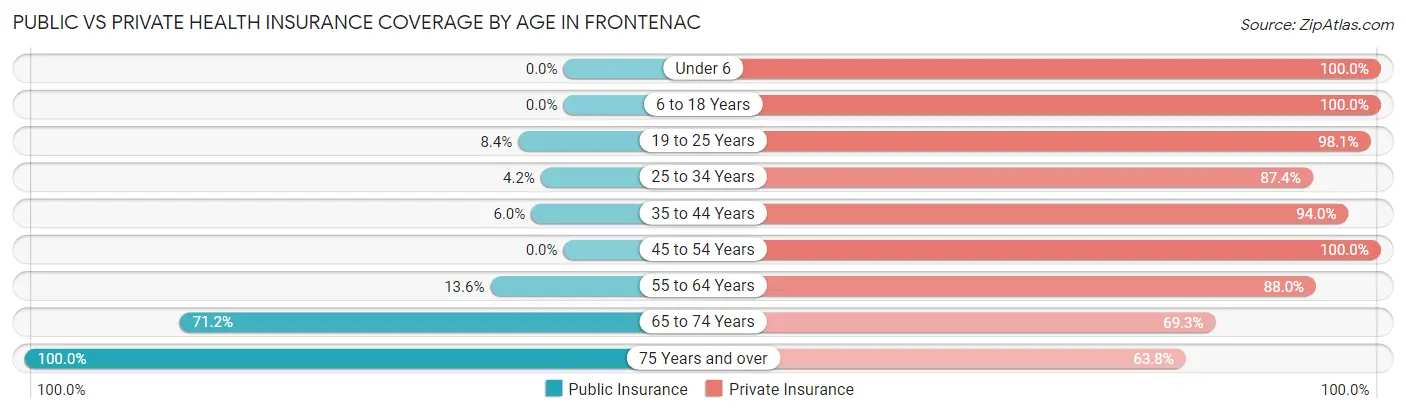
| Age Bracket | Public Insurance | Private Insurance |
| Under 6 | 0 (0.0%) | 64 (100.0%) |
| 6 to 18 Years | 0 (0.0%) | 977 (100.0%) |
| 19 to 25 Years | 31 (8.4%) | 362 (98.1%) |
| 25 to 34 Years | 4 (4.2%) | 83 (87.4%) |
| 35 to 44 Years | 11 (6.0%) | 173 (94.0%) |
| 45 to 54 Years | 0 (0.0%) | 697 (100.0%) |
| 55 to 64 Years | 95 (13.6%) | 616 (88.0%) |
| 65 to 74 Years | 188 (71.2%) | 183 (69.3%) |
| 75 Years and over | 257 (100.0%) | 164 (63.8%) |
| Total | 586 (16.3%) | 3,319 (92.0%) |
Disability Status by Sex by Age in Frontenac
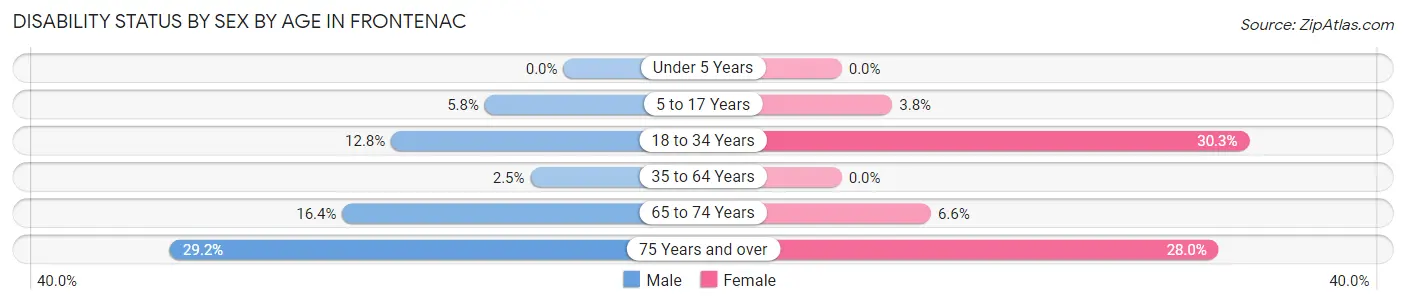
| Age Bracket | Male | Female |
| Under 5 Years | 0 (0.0%) | 0 (0.0%) |
| 5 to 17 Years | 26 (5.8%) | 19 (3.7%) |
| 18 to 34 Years | 50 (12.8%) | 36 (30.2%) |
| 35 to 64 Years | 19 (2.5%) | 0 (0.0%) |
| 65 to 74 Years | 21 (16.4%) | 9 (6.6%) |
| 75 Years and over | 26 (29.2%) | 47 (28.0%) |
Disability Class by Sex by Age in Frontenac
Disability Class: Hearing Difficulty
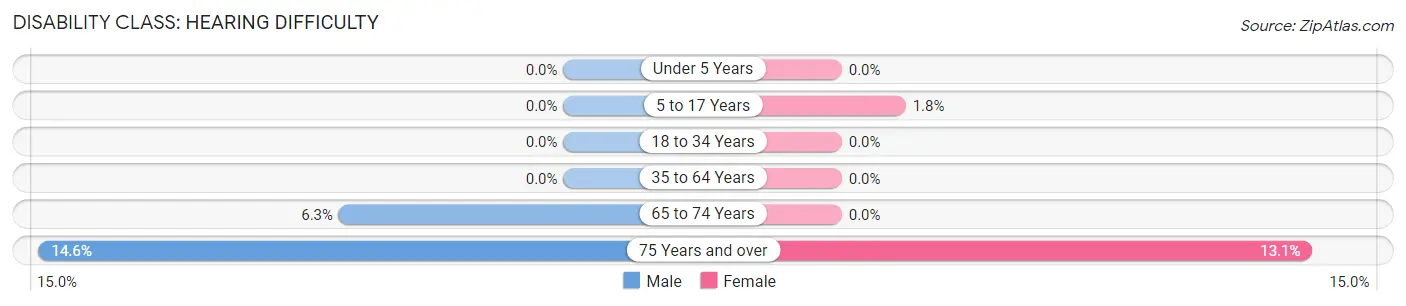
| Age Bracket | Male | Female |
| Under 5 Years | 0 (0.0%) | 0 (0.0%) |
| 5 to 17 Years | 0 (0.0%) | 9 (1.8%) |
| 18 to 34 Years | 0 (0.0%) | 0 (0.0%) |
| 35 to 64 Years | 0 (0.0%) | 0 (0.0%) |
| 65 to 74 Years | 8 (6.2%) | 0 (0.0%) |
| 75 Years and over | 13 (14.6%) | 22 (13.1%) |
Disability Class: Vision Difficulty
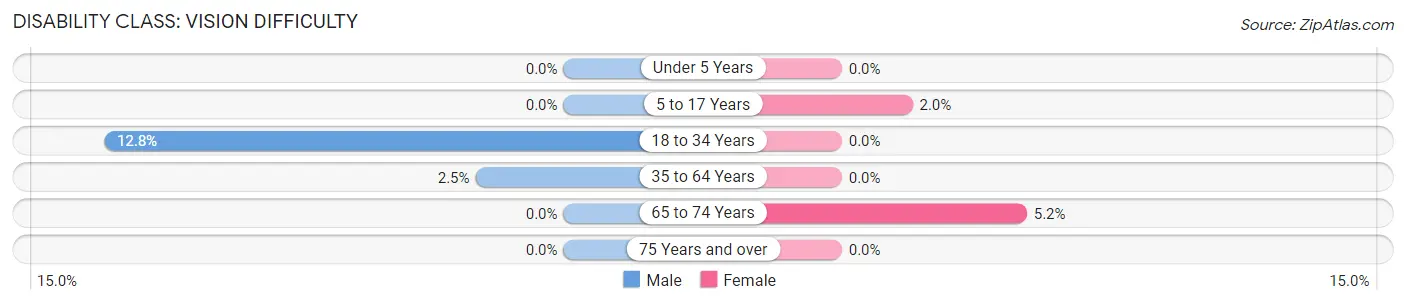
| Age Bracket | Male | Female |
| Under 5 Years | 0 (0.0%) | 0 (0.0%) |
| 5 to 17 Years | 0 (0.0%) | 10 (2.0%) |
| 18 to 34 Years | 50 (12.8%) | 0 (0.0%) |
| 35 to 64 Years | 19 (2.5%) | 0 (0.0%) |
| 65 to 74 Years | 0 (0.0%) | 7 (5.1%) |
| 75 Years and over | 0 (0.0%) | 0 (0.0%) |
Disability Class: Cognitive Difficulty
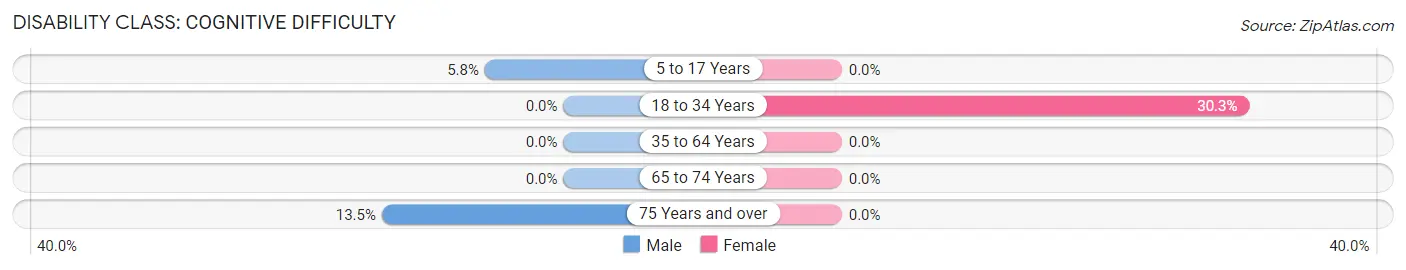
| Age Bracket | Male | Female |
| 5 to 17 Years | 26 (5.8%) | 0 (0.0%) |
| 18 to 34 Years | 0 (0.0%) | 36 (30.2%) |
| 35 to 64 Years | 0 (0.0%) | 0 (0.0%) |
| 65 to 74 Years | 0 (0.0%) | 0 (0.0%) |
| 75 Years and over | 12 (13.5%) | 0 (0.0%) |
Disability Class: Ambulatory Difficulty
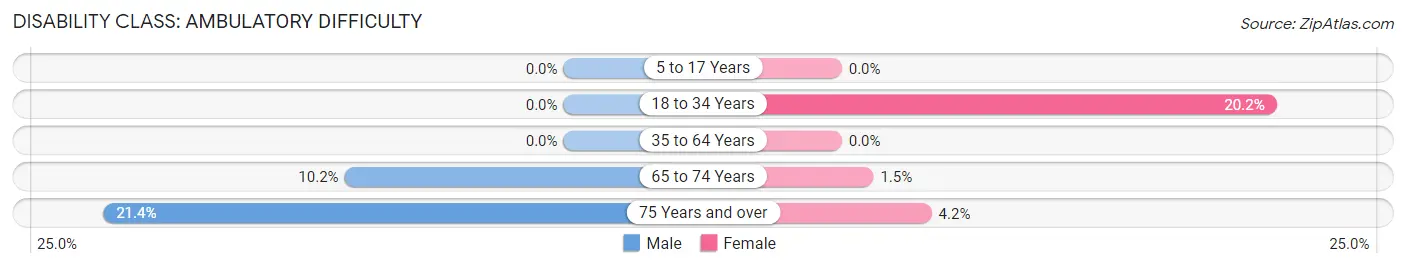
| Age Bracket | Male | Female |
| 5 to 17 Years | 0 (0.0%) | 0 (0.0%) |
| 18 to 34 Years | 0 (0.0%) | 24 (20.2%) |
| 35 to 64 Years | 0 (0.0%) | 0 (0.0%) |
| 65 to 74 Years | 13 (10.2%) | 2 (1.5%) |
| 75 Years and over | 19 (21.3%) | 7 (4.2%) |
Disability Class: Self-Care Difficulty
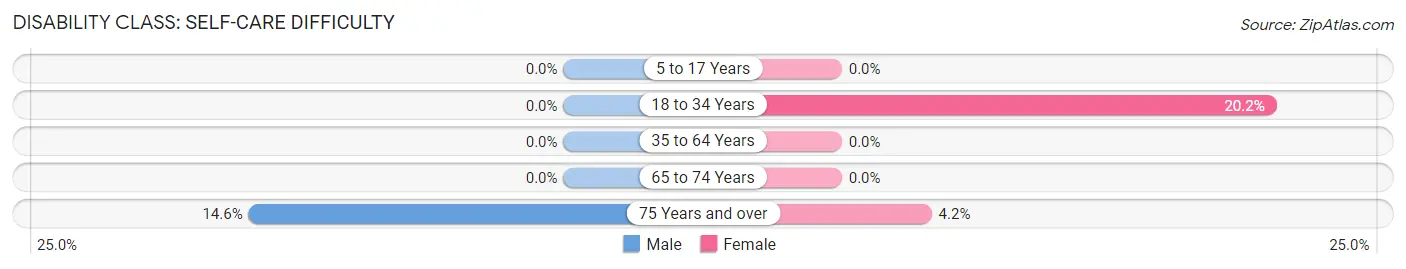
| Age Bracket | Male | Female |
| 5 to 17 Years | 0 (0.0%) | 0 (0.0%) |
| 18 to 34 Years | 0 (0.0%) | 24 (20.2%) |
| 35 to 64 Years | 0 (0.0%) | 0 (0.0%) |
| 65 to 74 Years | 0 (0.0%) | 0 (0.0%) |
| 75 Years and over | 13 (14.6%) | 7 (4.2%) |
Technology Access in Frontenac
Computing Device Access in Frontenac
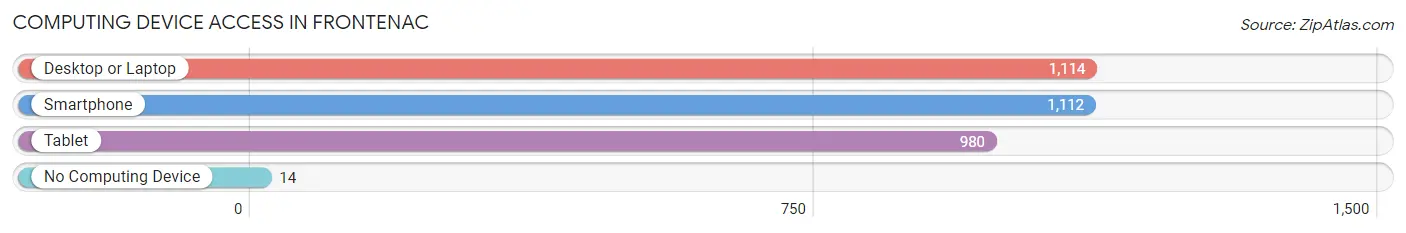
| Device Type | # Households | % Households |
| Desktop or Laptop | 1,114 | 96.0% |
| Smartphone | 1,112 | 95.9% |
| Tablet | 980 | 84.5% |
| No Computing Device | 14 | 1.2% |
| Total | 1,160 | 100.0% |
Internet Access in Frontenac
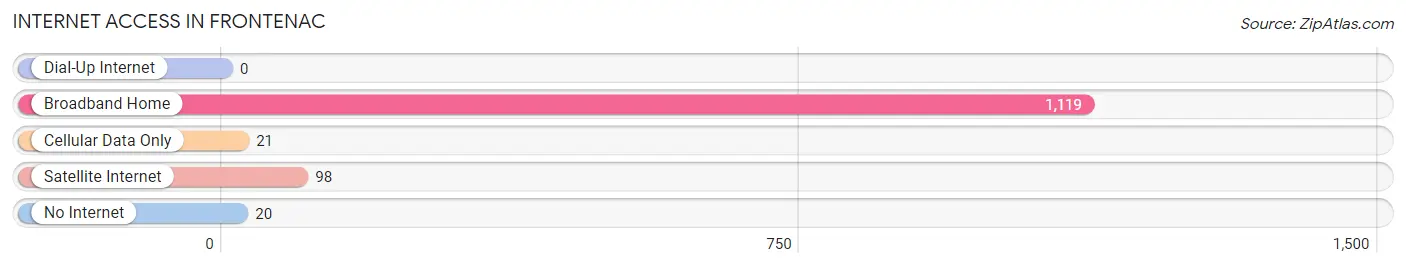
| Internet Type | # Households | % Households |
| Dial-Up Internet | 0 | 0.0% |
| Broadband Home | 1,119 | 96.5% |
| Cellular Data Only | 21 | 1.8% |
| Satellite Internet | 98 | 8.5% |
| No Internet | 20 | 1.7% |
| Total | 1,160 | 100.0% |
Frontenac Summary
Frontenac, Missouri is a small city located in St. Louis County, Missouri. It is situated on the banks of the Mississippi River, just south of St. Louis. The city has a population of approximately 4,000 people and is part of the Greater St. Louis metropolitan area.
History
Frontenac was founded in 1855 by a group of French settlers who had come to the area from Canada. The city was named after the French city of Frontenac, which is located in Quebec. The settlers were attracted to the area due to its proximity to the Mississippi River and its rich soil.
The city was incorporated in 1872 and quickly grew in population. By the early 1900s, Frontenac had become a popular destination for wealthy St. Louisans who wanted to escape the hustle and bustle of the city. The city was known for its luxurious homes and estates, and it was home to many prominent St. Louisans.
In the 1950s, Frontenac began to experience a decline in population as many of its wealthy residents moved away. The city was also affected by the construction of the nearby Lambert-St. Louis International Airport, which caused a decrease in property values.
Geography
Frontenac is located in St. Louis County, Missouri, on the banks of the Mississippi River. The city is situated just south of St. Louis and is part of the Greater St. Louis metropolitan area. The city covers an area of approximately 4.5 square miles and has a population of approximately 4,000 people.
The city is located in a hilly area and is surrounded by forests and rolling hills. The city is also home to several parks, including the Frontenac Park, which is a popular destination for outdoor activities.
Economy
Frontenac’s economy is largely based on the service industry. The city is home to several restaurants, retail stores, and other businesses. The city is also home to several corporate offices, including those of the St. Louis-based companies, Anheuser-Busch and Monsanto.
The city is also home to several educational institutions, including the University of Missouri-St. Louis and St. Louis Community College. These institutions provide employment opportunities for many of the city’s residents.
Demographics
As of the 2010 census, Frontenac had a population of 4,000 people. The racial makeup of the city was 87.3% White, 8.2% African American, 0.7% Asian, 0.3% Native American, and 3.5% from other races. The median household income was $50,000 and the median family income was $60,000.
Frontenac is a diverse city with a variety of cultures and backgrounds. The city is home to many different religions, including Christianity, Judaism, and Islam. The city is also home to a large number of immigrants, including those from Mexico, India, and China.
Conclusion
Frontenac, Missouri is a small city located in St. Louis County, Missouri. It is situated on the banks of the Mississippi River, just south of St. Louis. The city has a population of approximately 4,000 people and is part of the Greater St. Louis metropolitan area. The city was founded in 1855 by a group of French settlers and was known for its luxurious homes and estates. The city’s economy is largely based on the service industry and it is home to several educational institutions. Frontenac is a diverse city with a variety of cultures and backgrounds.
Common Questions
What is Per Capita Income in Frontenac?
Per Capita income in Frontenac is $121,798.
What is the Median Family Income in Frontenac?
Median Family Income in Frontenac is $250,001.
What is the Median Household income in Frontenac?
Median Household Income in Frontenac is $250,001.
What is Income or Wage Gap in Frontenac?
Income or Wage Gap in Frontenac is 27.8%.
Women in Frontenac earn 72.2 cents for every dollar earned by a man.
What is Family Income Deficit in Frontenac?
Family Income Deficit in Frontenac is $16,485.
Families that are below poverty line in Frontenac earn $16,485 less on average than the poverty threshold level.
What is Inequality or Gini Index in Frontenac?
Inequality or Gini Index in Frontenac is 0.52.
What is the Total Population of Frontenac?
Total Population of Frontenac is 3,639.
What is the Total Male Population of Frontenac?
Total Male Population of Frontenac is 1,850.
What is the Total Female Population of Frontenac?
Total Female Population of Frontenac is 1,789.
What is the Ratio of Males per 100 Females in Frontenac?
There are 103.41 Males per 100 Females in Frontenac.
What is the Ratio of Females per 100 Males in Frontenac?
There are 96.70 Females per 100 Males in Frontenac.
What is the Median Population Age in Frontenac?
Median Population Age in Frontenac is 47.3 Years.
What is the Average Family Size in Frontenac
Average Family Size in Frontenac is 3.5 People.
What is the Average Household Size in Frontenac
Average Household Size in Frontenac is 3.1 People.
How Large is the Labor Force in Frontenac?
There are 1,749 People in the Labor Forcein in Frontenac.
What is the Percentage of People in the Labor Force in Frontenac?
60.7% of People are in the Labor Force in Frontenac.
What is the Unemployment Rate in Frontenac?
Unemployment Rate in Frontenac is 4.1%.