Walnut Grove, GA Map & Demographics
Walnut Grove Map
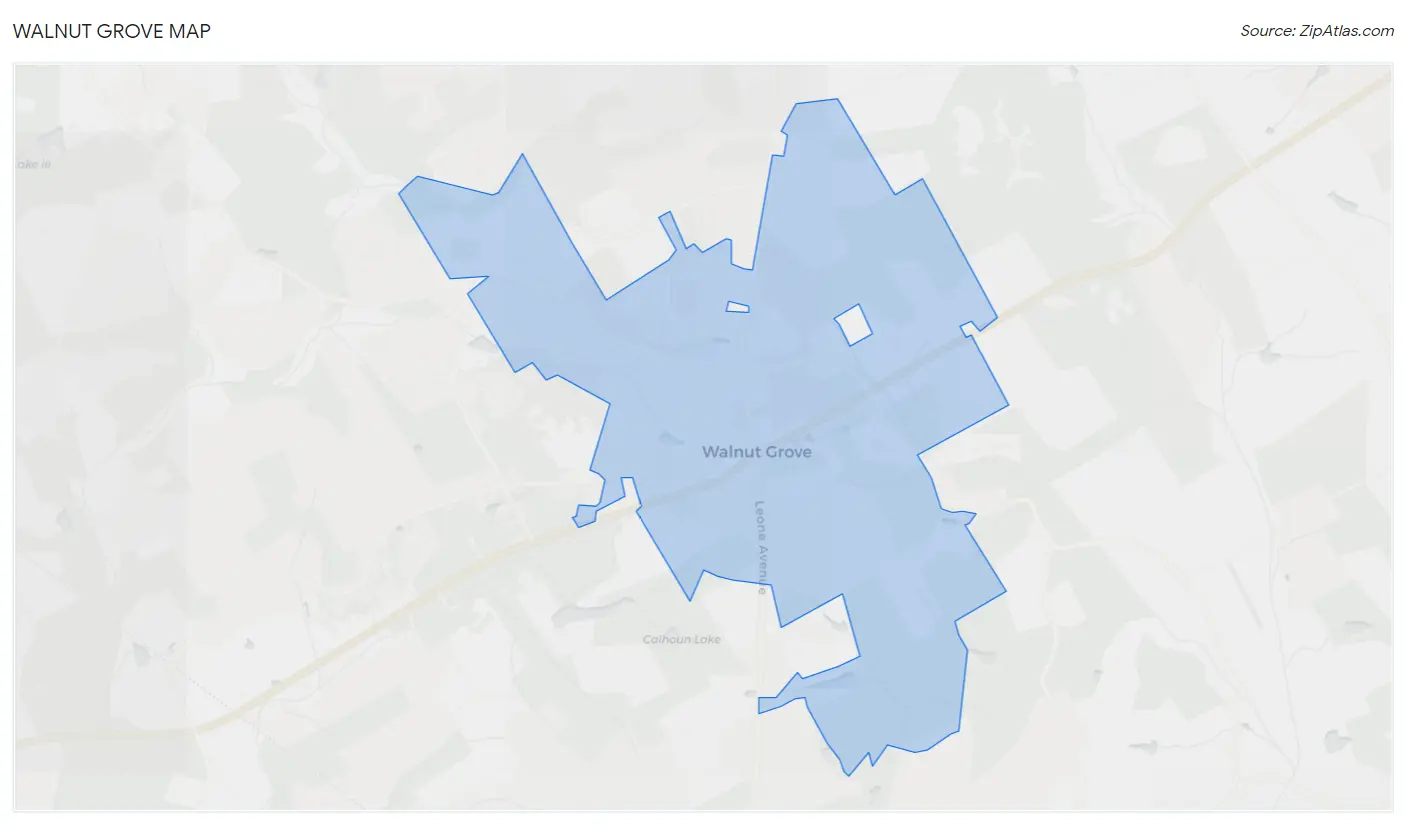
Walnut Grove Overview
$32,906
PER CAPITA INCOME
$95,938
AVG FAMILY INCOME
$78,750
AVG HOUSEHOLD INCOME
25.2%
WAGE / INCOME GAP [ % ]
74.8¢/ $1
WAGE / INCOME GAP [ $ ]
$11,364
FAMILY INCOME DEFICIT
0.35
INEQUALITY / GINI INDEX
1,620
TOTAL POPULATION
778
MALE POPULATION
842
FEMALE POPULATION
92.40
MALES / 100 FEMALES
108.23
FEMALES / 100 MALES
45.2
MEDIAN AGE
2.8
AVG FAMILY SIZE
2.4
AVG HOUSEHOLD SIZE
975
LABOR FORCE [ PEOPLE ]
69.0%
PERCENT IN LABOR FORCE
3.2%
UNEMPLOYMENT RATE
Income in Walnut Grove
Income Overview in Walnut Grove
Per Capita Income in Walnut Grove is $32,906, while median incomes of families and households are $95,938 and $78,750 respectively.
| Characteristic | Number | Measure |
| Per Capita Income | 1,620 | $32,906 |
| Median Family Income | 474 | $95,938 |
| Mean Family Income | 474 | $104,362 |
| Median Household Income | 689 | $78,750 |
| Mean Household Income | 689 | $89,607 |
| Income Deficit | 474 | $11,364 |
| Wage / Income Gap (%) | 1,620 | 25.23% |
| Wage / Income Gap ($) | 1,620 | 74.77¢ per $1 |
| Gini / Inequality Index | 1,620 | 0.35 |
Earnings by Sex in Walnut Grove
Average Earnings in Walnut Grove are $34,631, $45,083 for men and $33,708 for women, a difference of 25.2%.
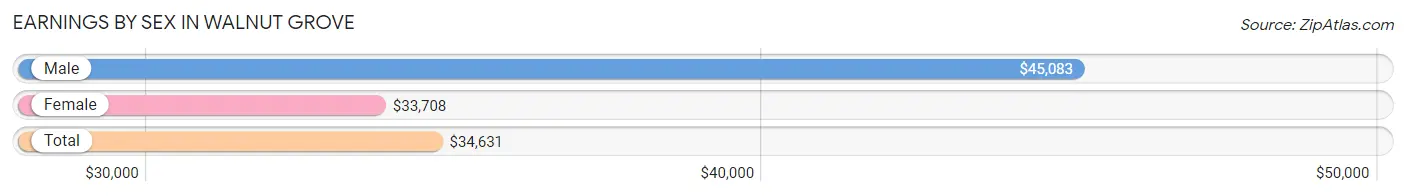
| Sex | Number | Average Earnings |
| Male | 507 (49.9%) | $45,083 |
| Female | 509 (50.1%) | $33,708 |
| Total | 1,016 (100.0%) | $34,631 |
Earnings by Sex by Income Bracket in Walnut Grove
The most common earnings brackets in Walnut Grove are $75,000 to $99,999 for men (79 | 15.6%) and $30,000 to $34,999 for women (153 | 30.1%).
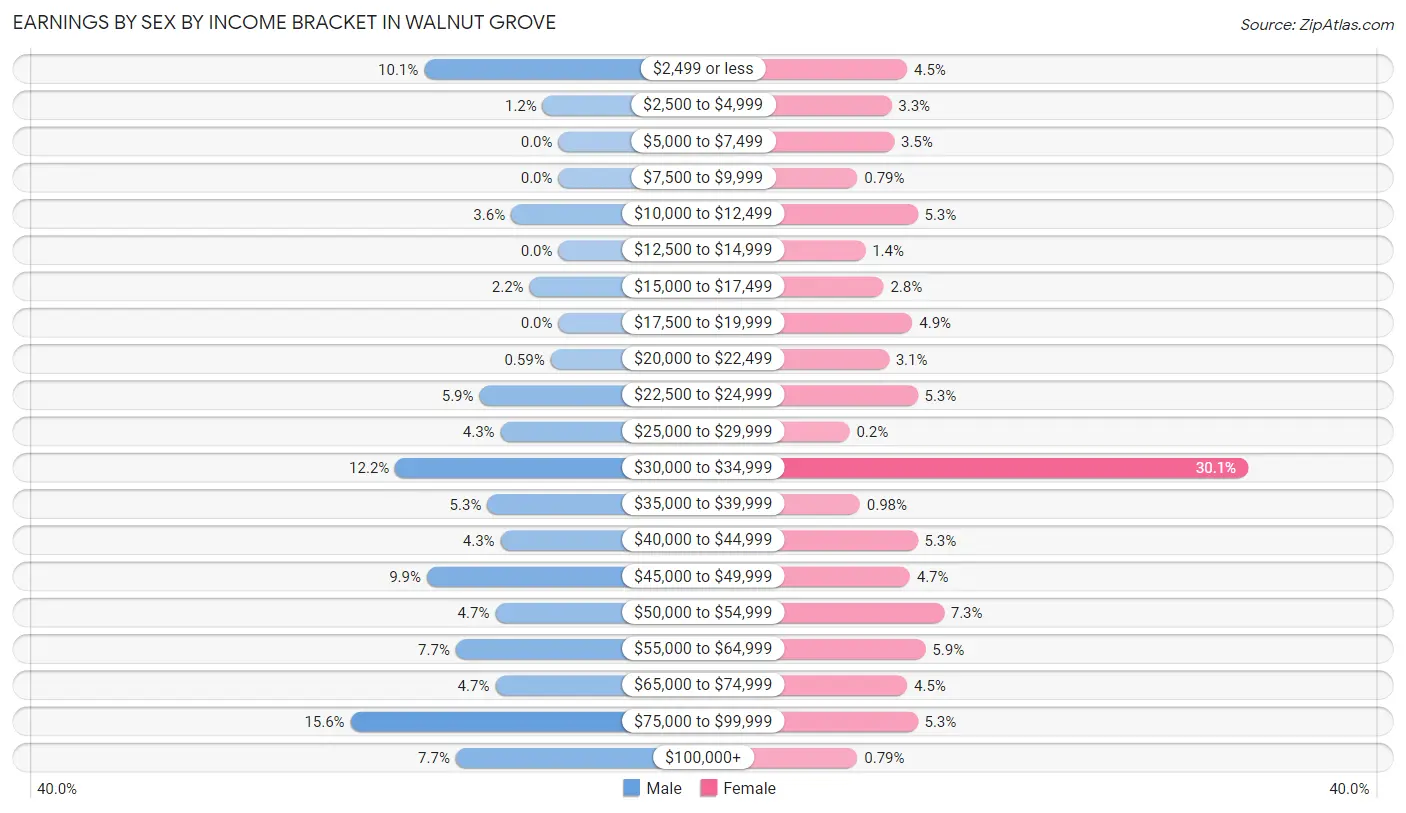
| Income | Male | Female |
| $2,499 or less | 51 (10.1%) | 23 (4.5%) |
| $2,500 to $4,999 | 6 (1.2%) | 17 (3.3%) |
| $5,000 to $7,499 | 0 (0.0%) | 18 (3.5%) |
| $7,500 to $9,999 | 0 (0.0%) | 4 (0.8%) |
| $10,000 to $12,499 | 18 (3.5%) | 27 (5.3%) |
| $12,500 to $14,999 | 0 (0.0%) | 7 (1.4%) |
| $15,000 to $17,499 | 11 (2.2%) | 14 (2.8%) |
| $17,500 to $19,999 | 0 (0.0%) | 25 (4.9%) |
| $20,000 to $22,499 | 3 (0.6%) | 16 (3.1%) |
| $22,500 to $24,999 | 30 (5.9%) | 27 (5.3%) |
| $25,000 to $29,999 | 22 (4.3%) | 1 (0.2%) |
| $30,000 to $34,999 | 62 (12.2%) | 153 (30.1%) |
| $35,000 to $39,999 | 27 (5.3%) | 5 (1.0%) |
| $40,000 to $44,999 | 22 (4.3%) | 27 (5.3%) |
| $45,000 to $49,999 | 50 (9.9%) | 24 (4.7%) |
| $50,000 to $54,999 | 24 (4.7%) | 37 (7.3%) |
| $55,000 to $64,999 | 39 (7.7%) | 30 (5.9%) |
| $65,000 to $74,999 | 24 (4.7%) | 23 (4.5%) |
| $75,000 to $99,999 | 79 (15.6%) | 27 (5.3%) |
| $100,000+ | 39 (7.7%) | 4 (0.8%) |
| Total | 507 (100.0%) | 509 (100.0%) |
Earnings by Sex by Educational Attainment in Walnut Grove
Average earnings in Walnut Grove are $46,417 for men and $34,025 for women, a difference of 26.7%. Men with an educational attainment of bachelor's degree enjoy the highest average annual earnings of $68,958, while those with college or associate's degree education earn the least with $34,773. Women with an educational attainment of bachelor's degree earn the most with the average annual earnings of $47,250, while those with less than high school education have the smallest earnings of $17,875.
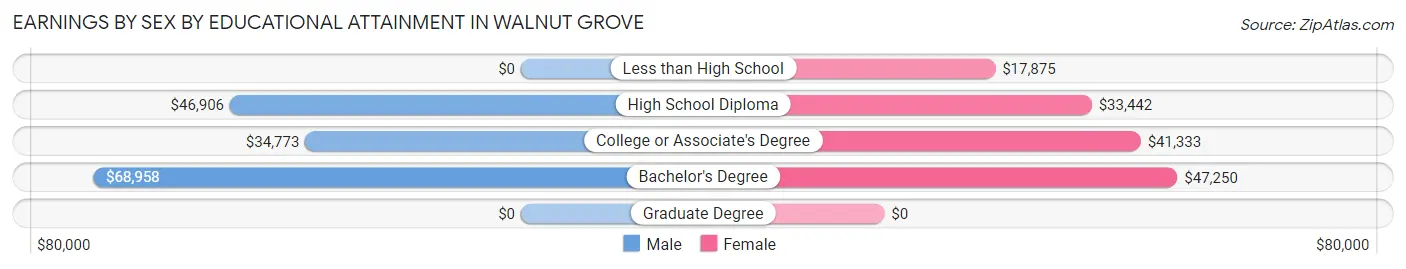
| Educational Attainment | Male Income | Female Income |
| Less than High School | - | - |
| High School Diploma | $46,906 | $33,442 |
| College or Associate's Degree | $34,773 | $41,333 |
| Bachelor's Degree | $68,958 | $47,250 |
| Graduate Degree | - | - |
| Total | $46,417 | $34,025 |
Family Income in Walnut Grove
Family Income Brackets in Walnut Grove
According to the Walnut Grove family income data, there are 200 families falling into the $100,000 to $149,999 income range, which is the most common income bracket and makes up 42.2% of all families. Conversely, the $150,000 to $199,999 income bracket is the least frequent group with only 6 families (1.3%) belonging to this category.
| Income Bracket | # Families | % Families |
| Less than $10,000 | 8 | 1.7% |
| $10,000 to $14,999 | 7 | 1.5% |
| $15,000 to $24,999 | 28 | 5.9% |
| $25,000 to $34,999 | 16 | 3.4% |
| $35,000 to $49,999 | 22 | 4.6% |
| $50,000 to $74,999 | 75 | 15.8% |
| $75,000 to $99,999 | 89 | 18.8% |
| $100,000 to $149,999 | 200 | 42.2% |
| $150,000 to $199,999 | 6 | 1.3% |
| $200,000+ | 23 | 4.9% |
Family Income by Famaliy Size in Walnut Grove
3-person families (210 | 44.3%) account for the highest median family income in Walnut Grove with $147,831 per family, while 3-person families (210 | 44.3%) have the highest median income of $49,277 per family member.
| Income Bracket | # Families | Median Income |
| 2-Person Families | 149 (31.4%) | $68,750 |
| 3-Person Families | 210 (44.3%) | $147,831 |
| 4-Person Families | 96 (20.3%) | $91,250 |
| 5-Person Families | 6 (1.3%) | $0 |
| 6-Person Families | 0 (0.0%) | $0 |
| 7+ Person Families | 13 (2.7%) | $75,694 |
| Total | 474 (100.0%) | $95,938 |
Family Income by Number of Earners in Walnut Grove
The median family income in Walnut Grove is $95,938, with families comprising 3+ earners (172) having the highest median family income of $148,347, while families with 1 earner (98) have the lowest median family income of $54,706, accounting for 36.3% and 20.7% of families, respectively.
| Number of Earners | # Families | Median Income |
| No Earners | 43 (9.1%) | $55,729 |
| 1 Earner | 98 (20.7%) | $54,706 |
| 2 Earners | 161 (34.0%) | $85,815 |
| 3+ Earners | 172 (36.3%) | $148,347 |
| Total | 474 (100.0%) | $95,938 |
Household Income in Walnut Grove
Household Income Brackets in Walnut Grove
With 217 households falling in the category, the $100,000 to $149,999 income range is the most frequent in Walnut Grove, accounting for 31.5% of all households. In contrast, only 9 households (1.3%) fall into the $150,000 to $199,999 income bracket, making it the least populous group.
| Income Bracket | # Households | % Households |
| Less than $10,000 | 22 | 3.2% |
| $10,000 to $14,999 | 16 | 2.3% |
| $15,000 to $24,999 | 47 | 6.8% |
| $25,000 to $34,999 | 56 | 8.1% |
| $35,000 to $49,999 | 43 | 6.2% |
| $50,000 to $74,999 | 93 | 13.5% |
| $75,000 to $99,999 | 163 | 23.7% |
| $100,000 to $149,999 | 217 | 31.5% |
| $150,000 to $199,999 | 9 | 1.3% |
| $200,000+ | 23 | 3.3% |
Household Income by Householder Age in Walnut Grove
The median household income in Walnut Grove is $78,750, with the highest median household income of $131,000 found in the 15 to 24 years age bracket for the primary householder. A total of 36 households (5.2%) fall into this category. Meanwhile, the 45 to 64 years age bracket for the primary householder has the lowest median household income of $0, with 374 households (54.3%) in this group.
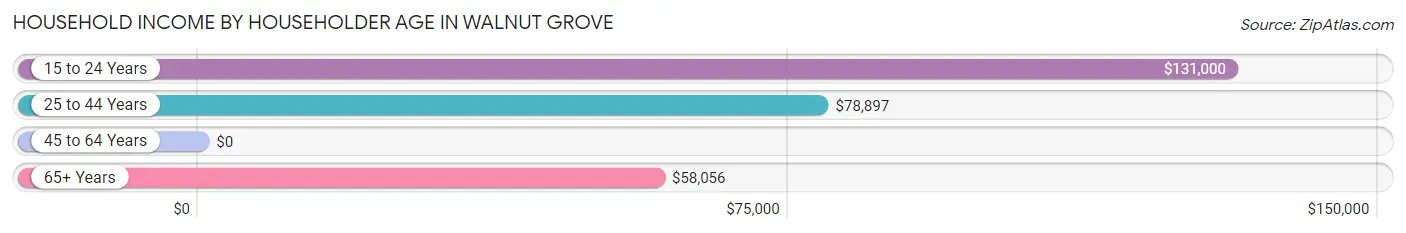
| Income Bracket | # Households | Median Income |
| 15 to 24 Years | 36 (5.2%) | $131,000 |
| 25 to 44 Years | 161 (23.4%) | $78,897 |
| 45 to 64 Years | 374 (54.3%) | $0 |
| 65+ Years | 118 (17.1%) | $58,056 |
| Total | 689 (100.0%) | $78,750 |
Poverty in Walnut Grove
Income Below Poverty by Sex and Age in Walnut Grove
With 5.4% poverty level for males and 14.2% for females among the residents of Walnut Grove, under 5 year old males and 35 to 44 year old females are the most vulnerable to poverty, with 9 males (23.7%) and 28 females (45.9%) in their respective age groups living below the poverty level.
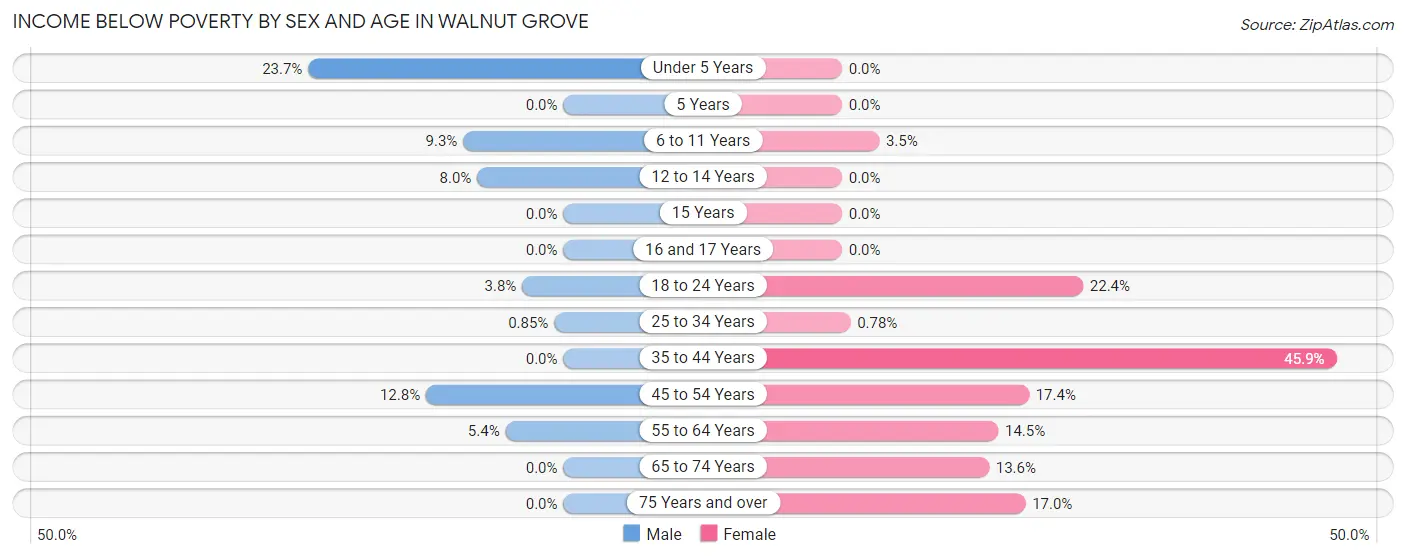
| Age Bracket | Male | Female |
| Under 5 Years | 9 (23.7%) | 0 (0.0%) |
| 5 Years | 0 (0.0%) | 0 (0.0%) |
| 6 to 11 Years | 4 (9.3%) | 1 (3.5%) |
| 12 to 14 Years | 2 (8.0%) | 0 (0.0%) |
| 15 Years | 0 (0.0%) | 0 (0.0%) |
| 16 and 17 Years | 0 (0.0%) | 0 (0.0%) |
| 18 to 24 Years | 5 (3.8%) | 17 (22.4%) |
| 25 to 34 Years | 1 (0.9%) | 1 (0.8%) |
| 35 to 44 Years | 0 (0.0%) | 28 (45.9%) |
| 45 to 54 Years | 13 (12.8%) | 17 (17.3%) |
| 55 to 64 Years | 8 (5.4%) | 39 (14.5%) |
| 65 to 74 Years | 0 (0.0%) | 9 (13.6%) |
| 75 Years and over | 0 (0.0%) | 8 (17.0%) |
| Total | 42 (5.4%) | 120 (14.2%) |
Income Above Poverty by Sex and Age in Walnut Grove
According to the poverty statistics in Walnut Grove, males aged 5 years and females aged under 5 years are the age groups that are most secure financially, with 100.0% of males and 100.0% of females in these age groups living above the poverty line.
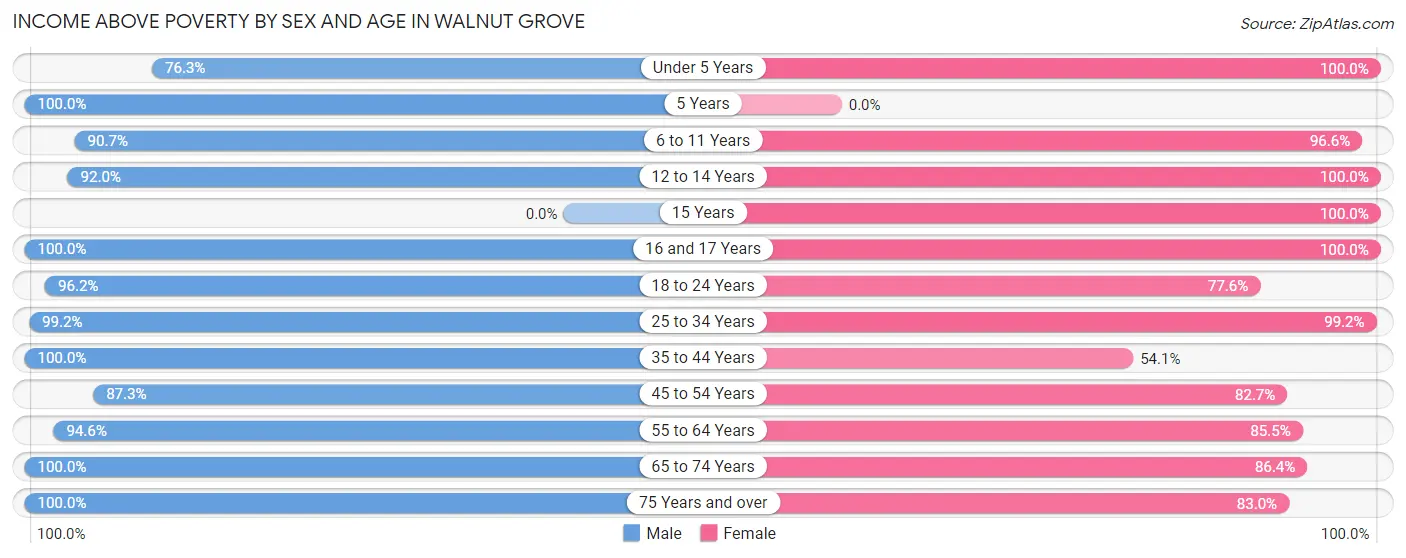
| Age Bracket | Male | Female |
| Under 5 Years | 29 (76.3%) | 29 (100.0%) |
| 5 Years | 14 (100.0%) | 0 (0.0%) |
| 6 to 11 Years | 39 (90.7%) | 28 (96.6%) |
| 12 to 14 Years | 23 (92.0%) | 23 (100.0%) |
| 15 Years | 0 (0.0%) | 6 (100.0%) |
| 16 and 17 Years | 16 (100.0%) | 9 (100.0%) |
| 18 to 24 Years | 126 (96.2%) | 59 (77.6%) |
| 25 to 34 Years | 116 (99.2%) | 128 (99.2%) |
| 35 to 44 Years | 59 (100.0%) | 33 (54.1%) |
| 45 to 54 Years | 89 (87.3%) | 81 (82.7%) |
| 55 to 64 Years | 141 (94.6%) | 230 (85.5%) |
| 65 to 74 Years | 44 (100.0%) | 57 (86.4%) |
| 75 Years and over | 40 (100.0%) | 39 (83.0%) |
| Total | 736 (94.6%) | 722 (85.8%) |
Income Below Poverty Among Married-Couple Families in Walnut Grove
The poverty statistics for married-couple families in Walnut Grove show that 2.2% or 8 of the total 369 families live below the poverty line. Families with 3 or 4 children have the highest poverty rate of 100.0%, comprising of 1 families. On the other hand, families with no children have the lowest poverty rate of 1.5%, which includes 4 families.
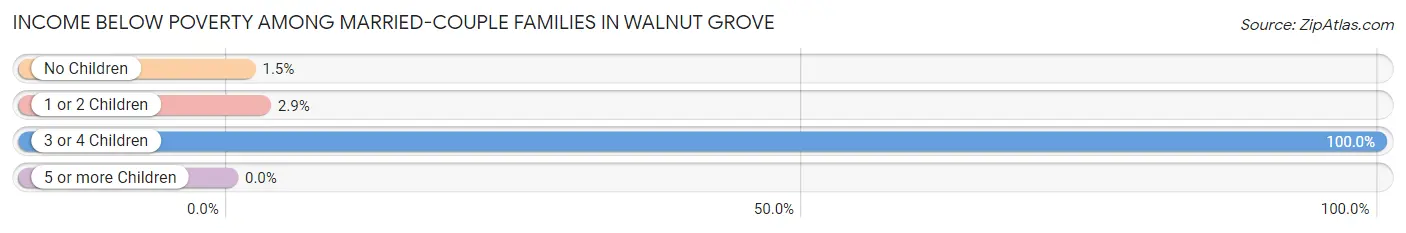
| Children | Above Poverty | Below Poverty |
| No Children | 259 (98.5%) | 4 (1.5%) |
| 1 or 2 Children | 102 (97.1%) | 3 (2.9%) |
| 3 or 4 Children | 0 (0.0%) | 1 (100.0%) |
| 5 or more Children | 0 (0.0%) | 0 (0.0%) |
| Total | 361 (97.8%) | 8 (2.2%) |
Income Below Poverty Among Single-Parent Households in Walnut Grove
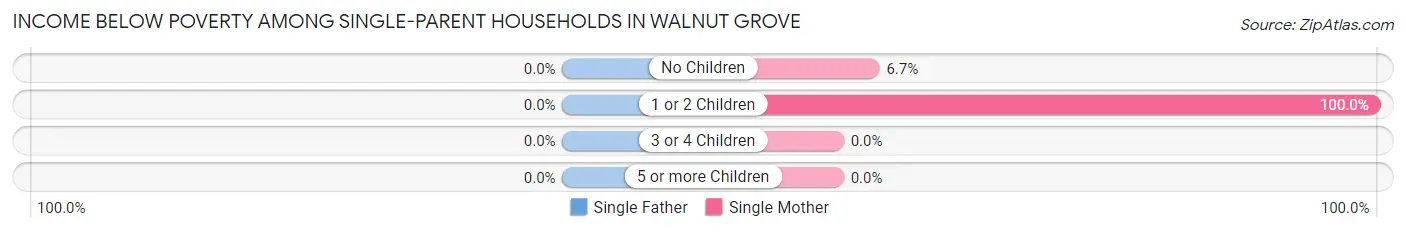
| Children | Single Father | Single Mother |
| No Children | 0 (0.0%) | 3 (6.7%) |
| 1 or 2 Children | 0 (0.0%) | 11 (100.0%) |
| 3 or 4 Children | 0 (0.0%) | 0 (0.0%) |
| 5 or more Children | 0 (0.0%) | 0 (0.0%) |
| Total | 0 (0.0%) | 14 (21.5%) |
Income Below Poverty Among Married-Couple vs Single-Parent Households in Walnut Grove
The poverty data for Walnut Grove shows that 8 of the married-couple family households (2.2%) and 14 of the single-parent households (13.3%) are living below the poverty level. Within the married-couple family households, those with 3 or 4 children have the highest poverty rate, with 1 households (100.0%) falling below the poverty line. Among the single-parent households, those with 1 or 2 children have the highest poverty rate, with 11 household (39.3%) living below poverty.
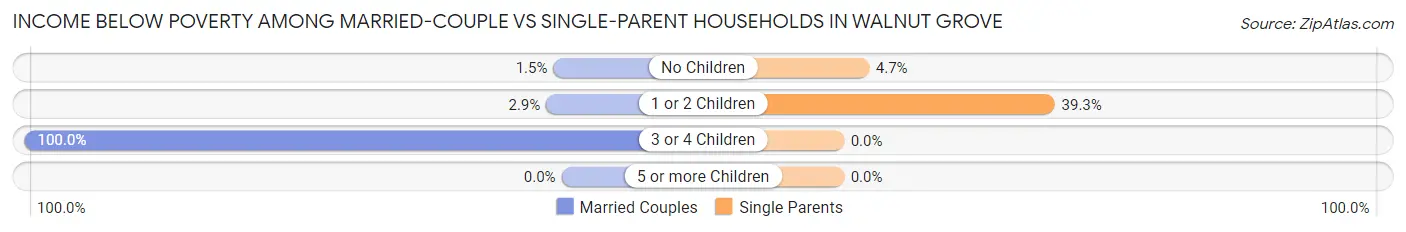
| Children | Married-Couple Families | Single-Parent Households |
| No Children | 4 (1.5%) | 3 (4.7%) |
| 1 or 2 Children | 3 (2.9%) | 11 (39.3%) |
| 3 or 4 Children | 1 (100.0%) | 0 (0.0%) |
| 5 or more Children | 0 (0.0%) | 0 (0.0%) |
| Total | 8 (2.2%) | 14 (13.3%) |
Race in Walnut Grove
The most populous races in Walnut Grove are White / Caucasian (1,340 | 82.7%), Two or more Races (131 | 8.1%), and Hispanic or Latino (64 | 4.0%).
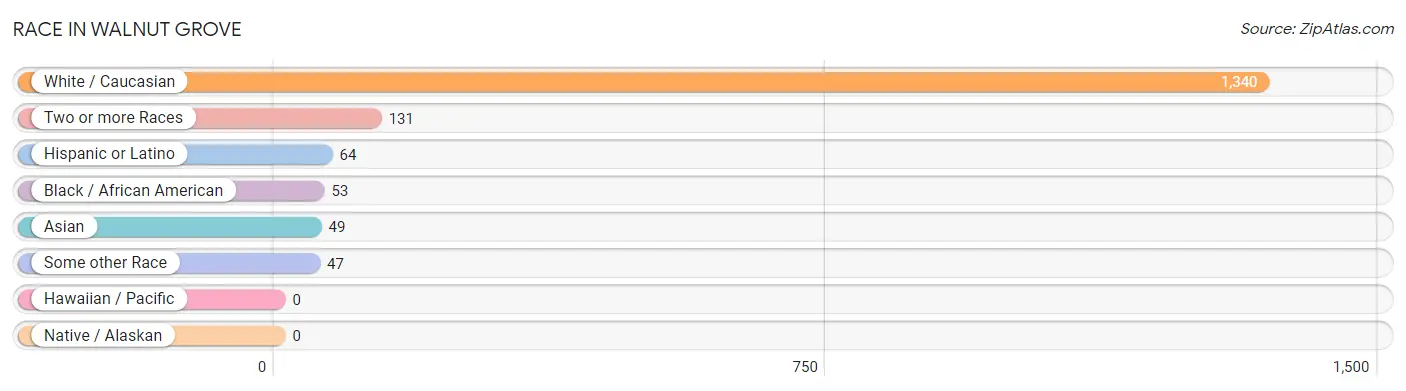
| Race | # Population | % Population |
| Asian | 49 | 3.0% |
| Black / African American | 53 | 3.3% |
| Hawaiian / Pacific | 0 | 0.0% |
| Hispanic or Latino | 64 | 4.0% |
| Native / Alaskan | 0 | 0.0% |
| White / Caucasian | 1,340 | 82.7% |
| Two or more Races | 131 | 8.1% |
| Some other Race | 47 | 2.9% |
| Total | 1,620 | 100.0% |
Ancestry in Walnut Grove
The most populous ancestries reported in Walnut Grove are Irish (289 | 17.8%), American (263 | 16.2%), German (161 | 9.9%), Welsh (150 | 9.3%), and Mexican (64 | 4.0%), together accounting for 57.2% of all Walnut Grove residents.
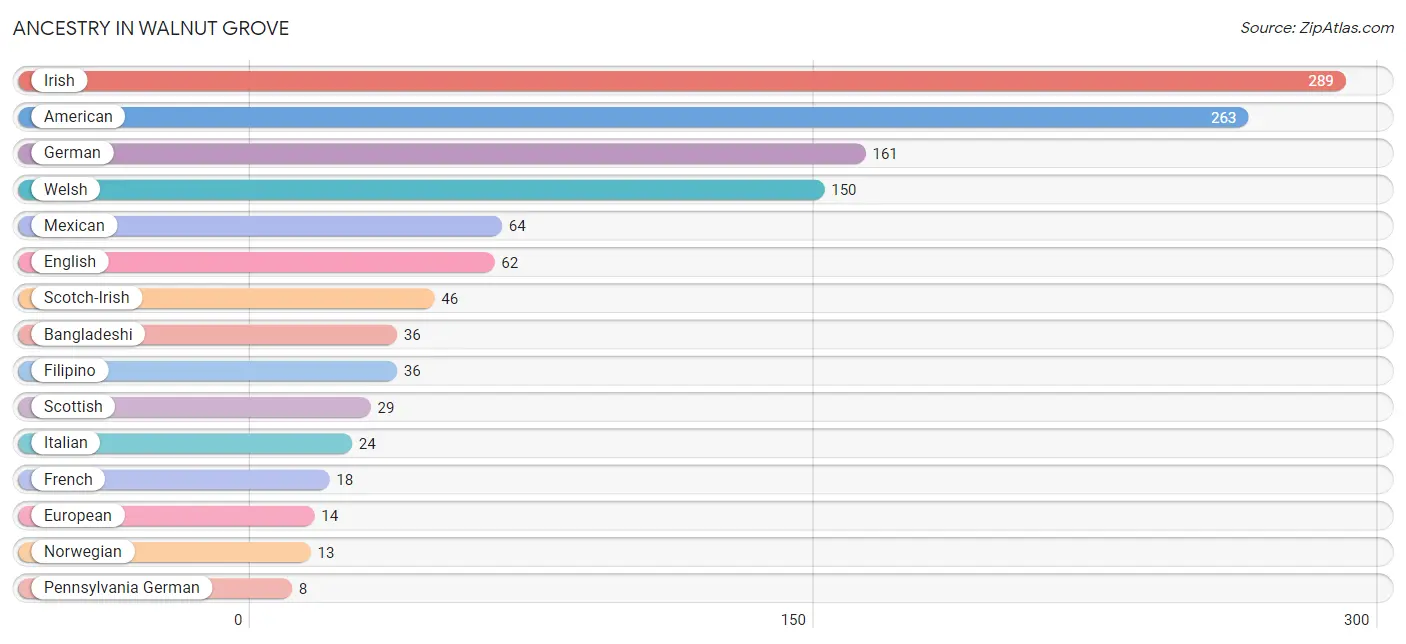
| Ancestry | # Population | % Population |
| American | 263 | 16.2% |
| Arab | 5 | 0.3% |
| Armenian | 4 | 0.3% |
| Bangladeshi | 36 | 2.2% |
| Burmese | 5 | 0.3% |
| Dutch | 2 | 0.1% |
| English | 62 | 3.8% |
| European | 14 | 0.9% |
| Filipino | 36 | 2.2% |
| Finnish | 5 | 0.3% |
| French | 18 | 1.1% |
| German | 161 | 9.9% |
| Greek | 4 | 0.3% |
| Irish | 289 | 17.8% |
| Italian | 24 | 1.5% |
| Lebanese | 5 | 0.3% |
| Mexican | 64 | 4.0% |
| New Zealander | 2 | 0.1% |
| Norwegian | 13 | 0.8% |
| Pennsylvania German | 8 | 0.5% |
| Scotch-Irish | 46 | 2.8% |
| Scottish | 29 | 1.8% |
| Swedish | 2 | 0.1% |
| Welsh | 150 | 9.3% | View All 24 Rows |
Immigrants in Walnut Grove
The most numerous immigrant groups reported in Walnut Grove came from Asia (13 | 0.8%), Eastern Asia (13 | 0.8%), Central America (10 | 0.6%), Latin America (10 | 0.6%), and Mexico (10 | 0.6%), together accounting for 3.5% of all Walnut Grove residents.
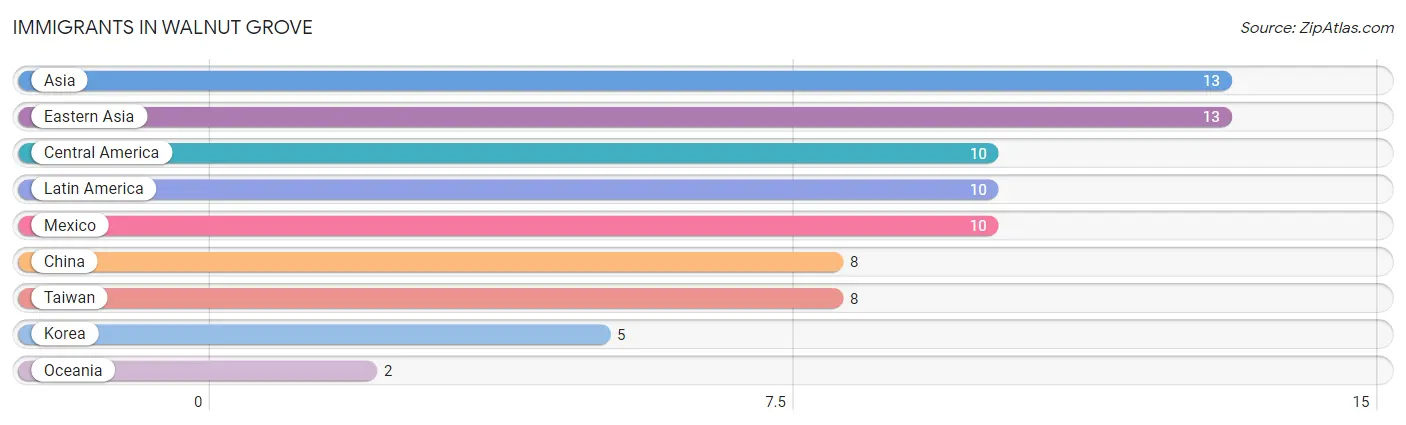
| Immigration Origin | # Population | % Population |
| Asia | 13 | 0.8% |
| Central America | 10 | 0.6% |
| China | 8 | 0.5% |
| Eastern Asia | 13 | 0.8% |
| Korea | 5 | 0.3% |
| Latin America | 10 | 0.6% |
| Mexico | 10 | 0.6% |
| Oceania | 2 | 0.1% |
| Taiwan | 8 | 0.5% | View All 9 Rows |
Sex and Age in Walnut Grove
Sex and Age in Walnut Grove
The most populous age groups in Walnut Grove are 20 to 24 Years (112 | 14.4%) for men and 60 to 64 Years (223 | 26.5%) for women.
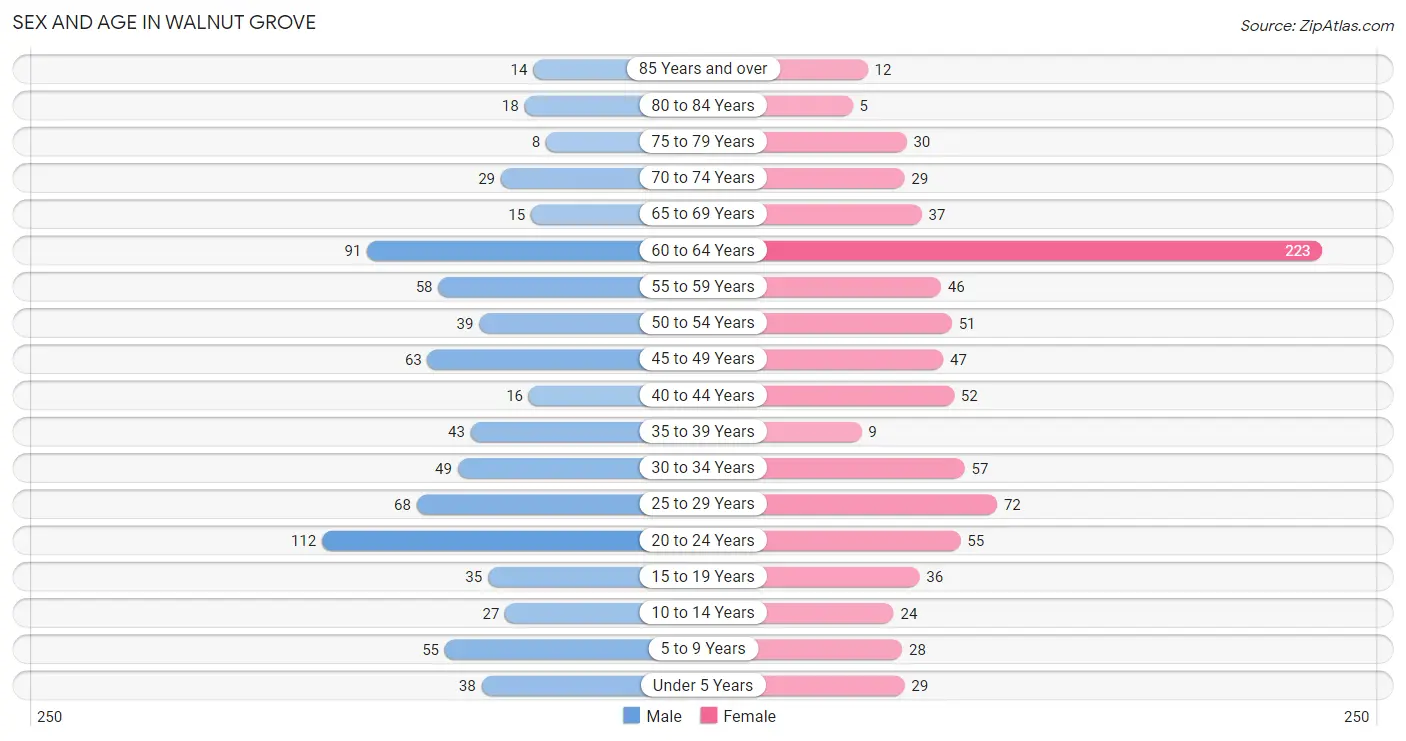
| Age Bracket | Male | Female |
| Under 5 Years | 38 (4.9%) | 29 (3.4%) |
| 5 to 9 Years | 55 (7.1%) | 28 (3.3%) |
| 10 to 14 Years | 27 (3.5%) | 24 (2.9%) |
| 15 to 19 Years | 35 (4.5%) | 36 (4.3%) |
| 20 to 24 Years | 112 (14.4%) | 55 (6.5%) |
| 25 to 29 Years | 68 (8.7%) | 72 (8.6%) |
| 30 to 34 Years | 49 (6.3%) | 57 (6.8%) |
| 35 to 39 Years | 43 (5.5%) | 9 (1.1%) |
| 40 to 44 Years | 16 (2.1%) | 52 (6.2%) |
| 45 to 49 Years | 63 (8.1%) | 47 (5.6%) |
| 50 to 54 Years | 39 (5.0%) | 51 (6.1%) |
| 55 to 59 Years | 58 (7.5%) | 46 (5.5%) |
| 60 to 64 Years | 91 (11.7%) | 223 (26.5%) |
| 65 to 69 Years | 15 (1.9%) | 37 (4.4%) |
| 70 to 74 Years | 29 (3.7%) | 29 (3.4%) |
| 75 to 79 Years | 8 (1.0%) | 30 (3.6%) |
| 80 to 84 Years | 18 (2.3%) | 5 (0.6%) |
| 85 Years and over | 14 (1.8%) | 12 (1.4%) |
| Total | 778 (100.0%) | 842 (100.0%) |
Families and Households in Walnut Grove
Median Family Size in Walnut Grove
The median family size in Walnut Grove is 2.77 persons per family, with single female/mother families (65 | 13.7%) accounting for the largest median family size of 3.37 persons per family. On the other hand, married-couple families (369 | 77.8%) represent the smallest median family size with 2.60 persons per family.
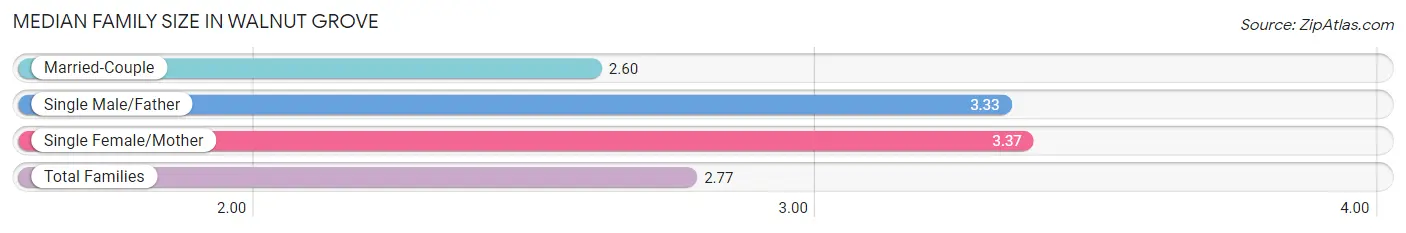
| Family Type | # Families | Family Size |
| Married-Couple | 369 (77.8%) | 2.60 |
| Single Male/Father | 40 (8.4%) | 3.33 |
| Single Female/Mother | 65 (13.7%) | 3.37 |
| Total Families | 474 (100.0%) | 2.77 |
Median Household Size in Walnut Grove
The median household size in Walnut Grove is 2.35 persons per household, with single male/father households (40 | 5.8%) accounting for the largest median household size of 3.88 persons per household. non-family households (215 | 31.2%) represent the smallest median household size with 1.31 persons per household.
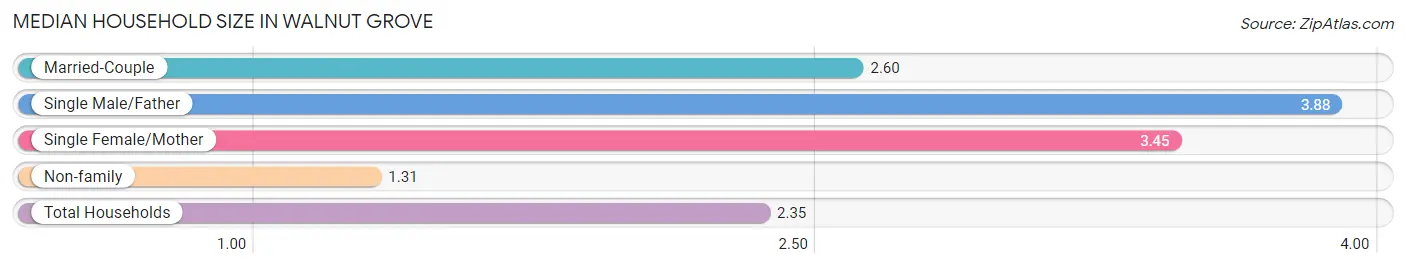
| Household Type | # Households | Household Size |
| Married-Couple | 369 (53.6%) | 2.60 |
| Single Male/Father | 40 (5.8%) | 3.88 |
| Single Female/Mother | 65 (9.4%) | 3.45 |
| Non-family | 215 (31.2%) | 1.31 |
| Total Households | 689 (100.0%) | 2.35 |
Household Size by Marriage Status in Walnut Grove
Out of a total of 689 households in Walnut Grove, 474 (68.8%) are family households, while 215 (31.2%) are nonfamily households. The most numerous type of family households are 3-person households, comprising 197, and the most common type of nonfamily households are 1-person households, comprising 147.
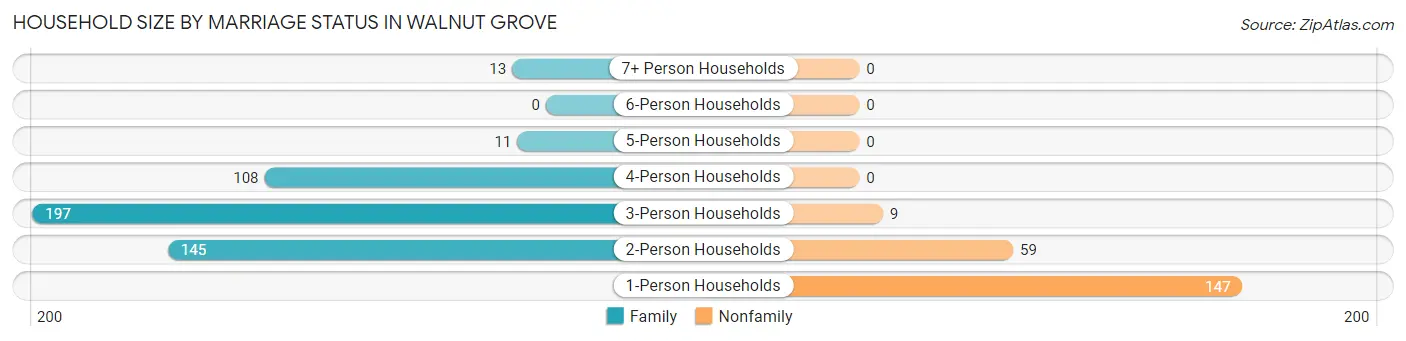
| Household Size | Family Households | Nonfamily Households |
| 1-Person Households | - | 147 (21.3%) |
| 2-Person Households | 145 (21.0%) | 59 (8.6%) |
| 3-Person Households | 197 (28.6%) | 9 (1.3%) |
| 4-Person Households | 108 (15.7%) | 0 (0.0%) |
| 5-Person Households | 11 (1.6%) | 0 (0.0%) |
| 6-Person Households | 0 (0.0%) | 0 (0.0%) |
| 7+ Person Households | 13 (1.9%) | 0 (0.0%) |
| Total | 474 (68.8%) | 215 (31.2%) |
Female Fertility in Walnut Grove
Fertility by Age in Walnut Grove
Average fertility rate in Walnut Grove is 89.0 births per 1,000 women. Women in the age bracket of 15 to 19 years have the highest fertility rate with 111.0 births per 1,000 women. Women in the age bracket of 20 to 34 years acount for 63.3% of all women with births.
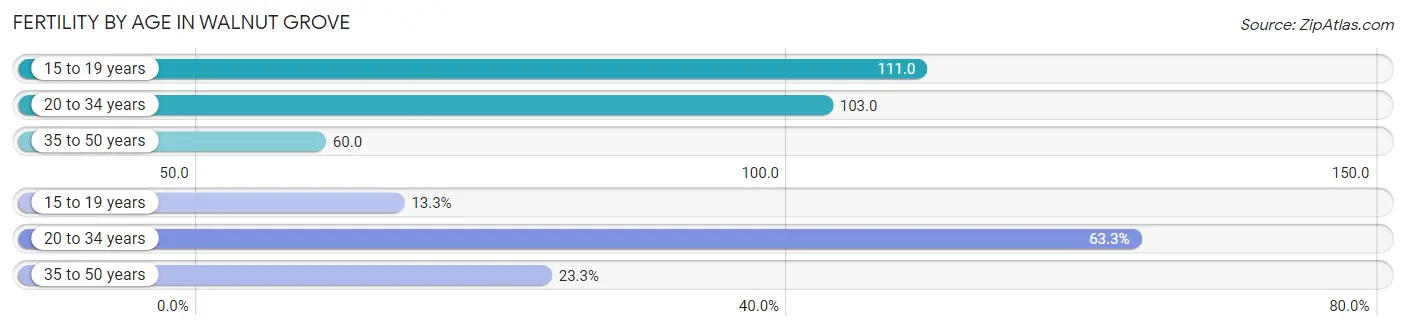
| Age Bracket | Women with Births | Births / 1,000 Women |
| 15 to 19 years | 4 (13.3%) | 111.0 |
| 20 to 34 years | 19 (63.3%) | 103.0 |
| 35 to 50 years | 7 (23.3%) | 60.0 |
| Total | 30 (100.0%) | 89.0 |
Fertility by Age by Marriage Status in Walnut Grove
63.3% of women with births (30) in Walnut Grove are married. The highest percentage of unmarried women with births falls into 15 to 19 years age bracket with 100.0% of them unmarried at the time of birth, while the lowest percentage of unmarried women with births belong to 20 to 34 years age bracket with 0.0% of them unmarried.
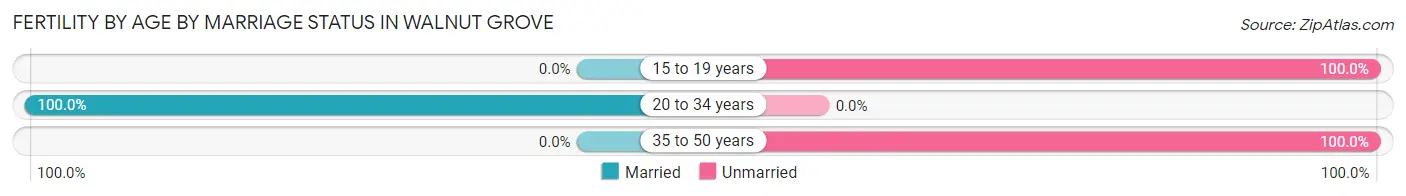
| Age Bracket | Married | Unmarried |
| 15 to 19 years | 0 (0.0%) | 4 (100.0%) |
| 20 to 34 years | 19 (100.0%) | 0 (0.0%) |
| 35 to 50 years | 0 (0.0%) | 7 (100.0%) |
| Total | 19 (63.3%) | 11 (36.7%) |
Fertility by Education in Walnut Grove
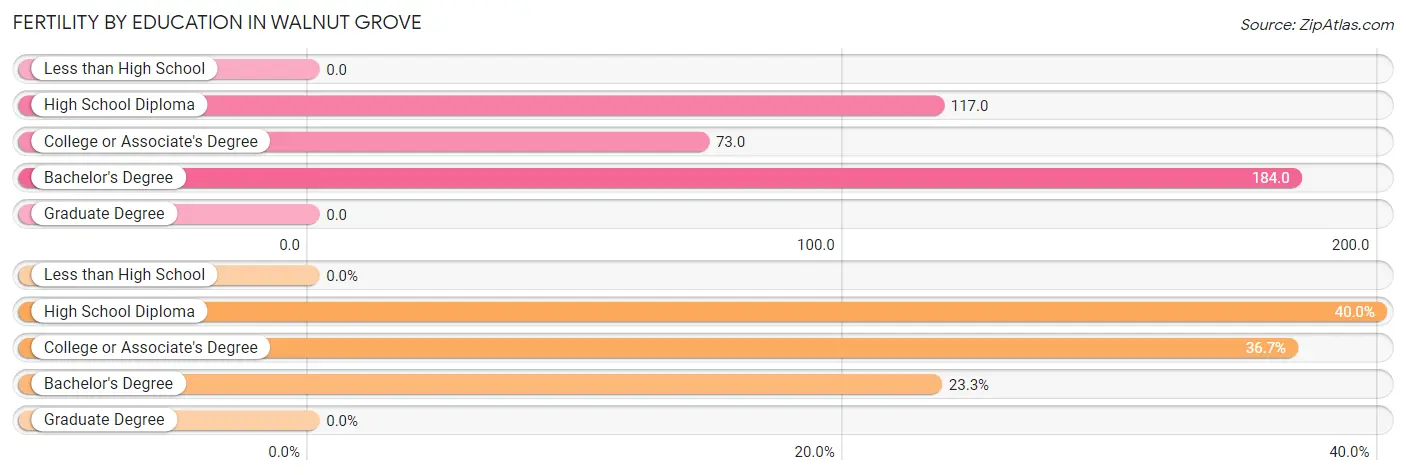
| Educational Attainment | Women with Births | Births / 1,000 Women |
| Less than High School | 0 (0.0%) | 0.0 |
| High School Diploma | 12 (40.0%) | 117.0 |
| College or Associate's Degree | 11 (36.7%) | 73.0 |
| Bachelor's Degree | 7 (23.3%) | 184.0 |
| Graduate Degree | 0 (0.0%) | 0.0 |
| Total | 30 (100.0%) | 89.0 |
Fertility by Education by Marriage Status in Walnut Grove
36.7% of women with births in Walnut Grove are unmarried. Women with the educational attainment of college or associate's degree are most likely to be married with 100.0% of them married at childbirth, while women with the educational attainment of bachelor's degree are least likely to be married with 100.0% of them unmarried at childbirth.
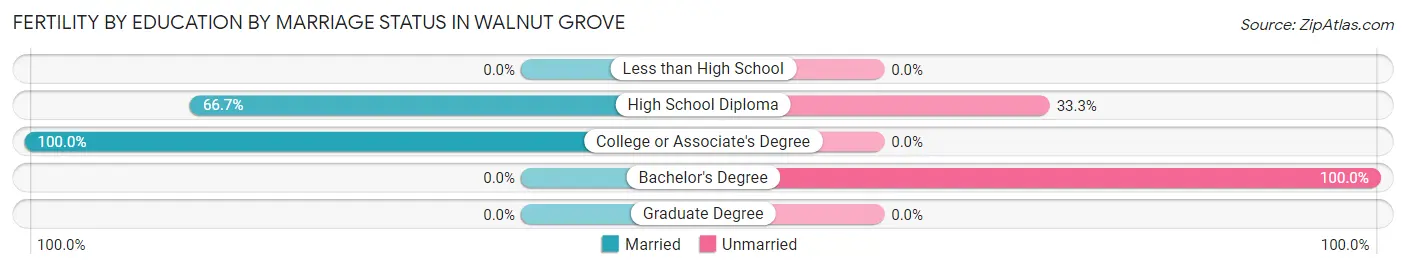
| Educational Attainment | Married | Unmarried |
| Less than High School | 0 (0.0%) | 0 (0.0%) |
| High School Diploma | 8 (66.7%) | 4 (33.3%) |
| College or Associate's Degree | 11 (100.0%) | 0 (0.0%) |
| Bachelor's Degree | 0 (0.0%) | 7 (100.0%) |
| Graduate Degree | 0 (0.0%) | 0 (0.0%) |
| Total | 19 (63.3%) | 11 (36.7%) |
Employment Characteristics in Walnut Grove
Employment by Class of Employer in Walnut Grove
Among the 944 employed individuals in Walnut Grove, private company employees (816 | 86.4%), local government employees (58 | 6.1%), and self-employed (not incorporated) (38 | 4.0%) make up the most common classes of employment.
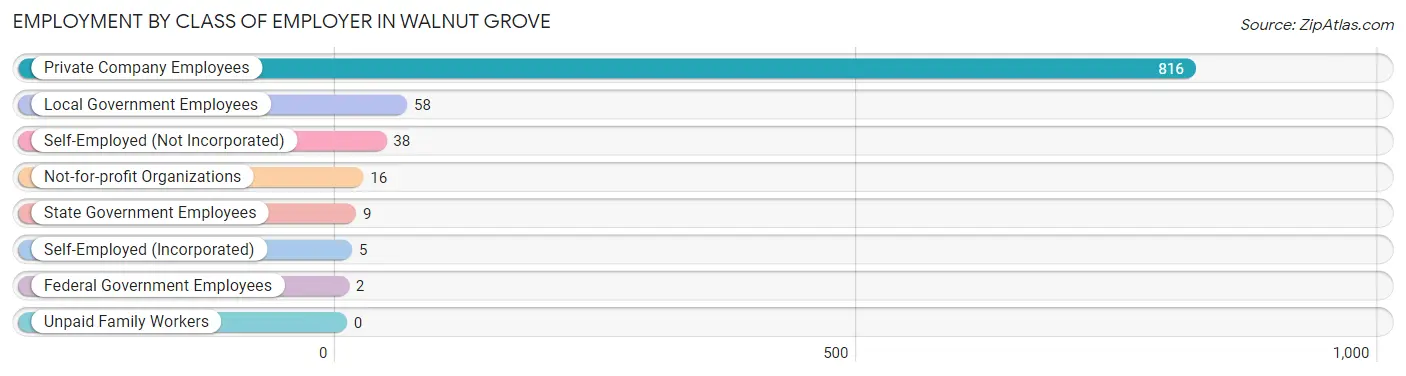
| Employer Class | # Employees | % Employees |
| Private Company Employees | 816 | 86.4% |
| Self-Employed (Incorporated) | 5 | 0.5% |
| Self-Employed (Not Incorporated) | 38 | 4.0% |
| Not-for-profit Organizations | 16 | 1.7% |
| Local Government Employees | 58 | 6.1% |
| State Government Employees | 9 | 0.9% |
| Federal Government Employees | 2 | 0.2% |
| Unpaid Family Workers | 0 | 0.0% |
| Total | 944 | 100.0% |
Employment Status by Age in Walnut Grove
According to the labor force statistics for Walnut Grove, out of the total population over 16 years of age (1,413), 69.0% or 975 individuals are in the labor force, with 3.2% or 31 of them unemployed. The age group with the highest labor force participation rate is 25 to 29 years, with 93.6% or 131 individuals in the labor force. Within the labor force, the 55 to 59 years age range has the highest percentage of unemployed individuals, with 7.8% or 6 of them being unemployed.
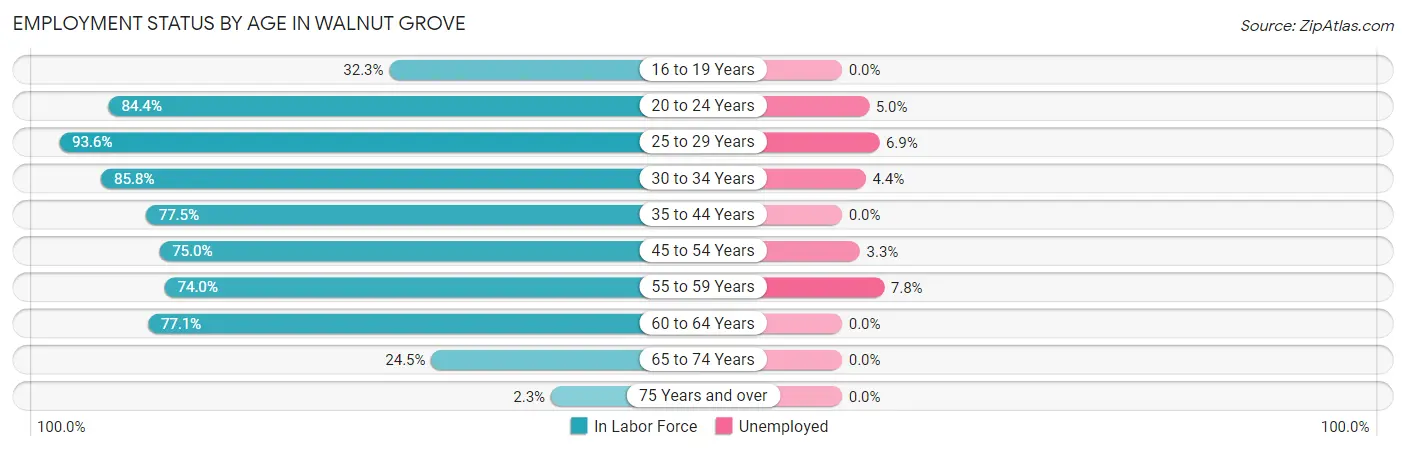
| Age Bracket | In Labor Force | Unemployed |
| 16 to 19 Years | 21 (32.3%) | 0 (0.0%) |
| 20 to 24 Years | 141 (84.4%) | 7 (5.0%) |
| 25 to 29 Years | 131 (93.6%) | 9 (6.9%) |
| 30 to 34 Years | 91 (85.8%) | 4 (4.4%) |
| 35 to 44 Years | 93 (77.5%) | 0 (0.0%) |
| 45 to 54 Years | 150 (75.0%) | 5 (3.3%) |
| 55 to 59 Years | 77 (74.0%) | 6 (7.8%) |
| 60 to 64 Years | 242 (77.1%) | 0 (0.0%) |
| 65 to 74 Years | 27 (24.5%) | 0 (0.0%) |
| 75 Years and over | 2 (2.3%) | 0 (0.0%) |
| Total | 975 (69.0%) | 31 (3.2%) |
Employment Status by Educational Attainment in Walnut Grove
According to labor force statistics for Walnut Grove, 79.7% of individuals (784) out of the total population between 25 and 64 years of age (984) are in the labor force, with 3.1% or 24 of them being unemployed. The group with the highest labor force participation rate are those with the educational attainment of bachelor's degree or higher, with 88.1% or 89 individuals in the labor force. Within the labor force, individuals with less than high school education have the highest percentage of unemployment, with 15.8% or 9 of them being unemployed.
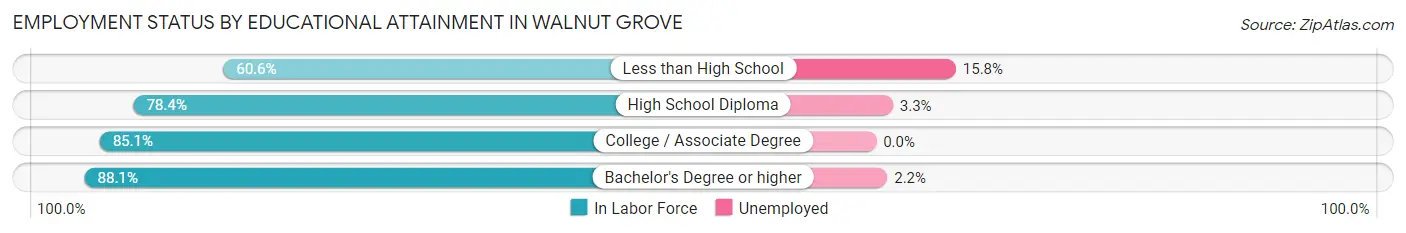
| Educational Attainment | In Labor Force | Unemployed |
| Less than High School | 57 (60.6%) | 15 (15.8%) |
| High School Diploma | 393 (78.4%) | 17 (3.3%) |
| College / Associate Degree | 245 (85.1%) | 0 (0.0%) |
| Bachelor's Degree or higher | 89 (88.1%) | 2 (2.2%) |
| Total | 784 (79.7%) | 31 (3.1%) |
Employment Occupations by Sex in Walnut Grove
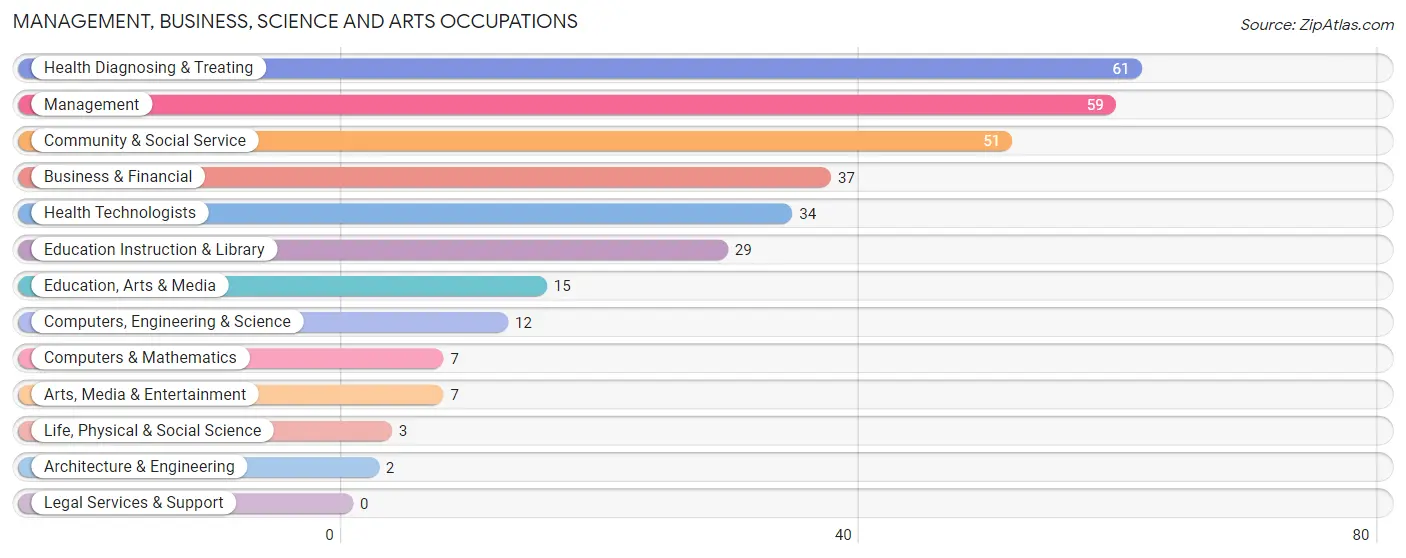
Management, Business, Science and Arts Occupations
The most common Management, Business, Science and Arts occupations in Walnut Grove are Health Diagnosing & Treating (61 | 6.5%), Management (59 | 6.2%), Community & Social Service (51 | 5.4%), Business & Financial (37 | 3.9%), and Health Technologists (34 | 3.6%).
Management, Business, Science and Arts Occupations by Sex
Within the Management, Business, Science and Arts occupations in Walnut Grove, the most male-oriented occupations are Architecture & Engineering (100.0%), Life, Physical & Social Science (100.0%), and Business & Financial (81.1%), while the most female-oriented occupations are Education Instruction & Library (100.0%), Arts, Media & Entertainment (100.0%), and Health Diagnosing & Treating (100.0%).
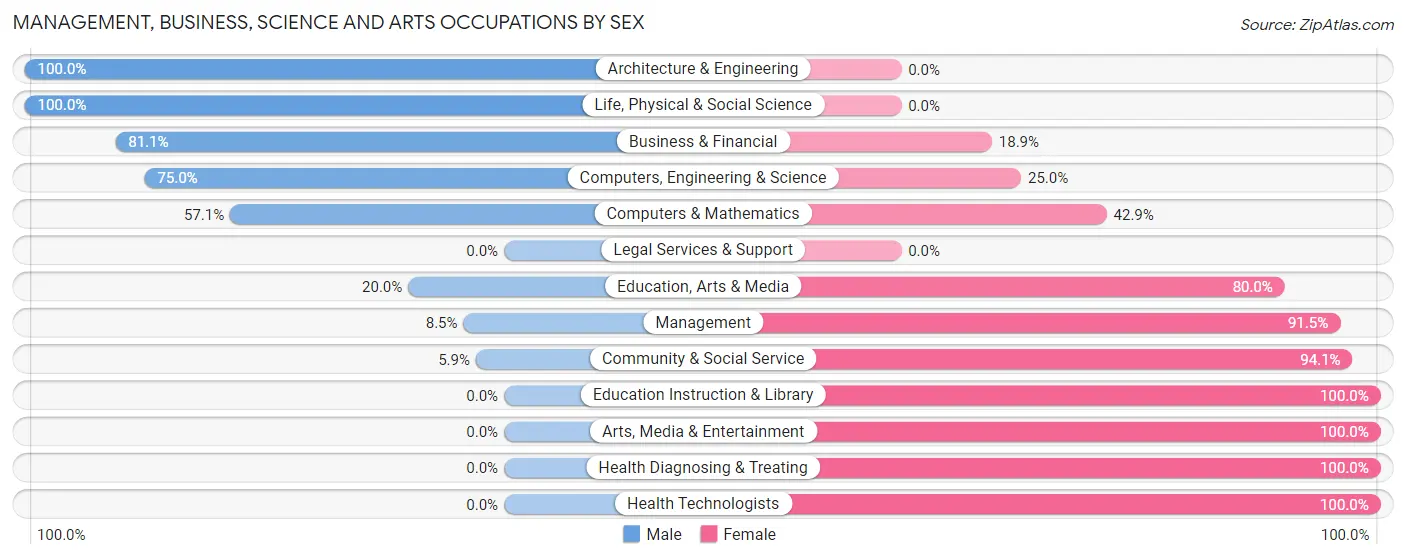
| Occupation | Male | Female |
| Management | 5 (8.5%) | 54 (91.5%) |
| Business & Financial | 30 (81.1%) | 7 (18.9%) |
| Computers, Engineering & Science | 9 (75.0%) | 3 (25.0%) |
| Computers & Mathematics | 4 (57.1%) | 3 (42.9%) |
| Architecture & Engineering | 2 (100.0%) | 0 (0.0%) |
| Life, Physical & Social Science | 3 (100.0%) | 0 (0.0%) |
| Community & Social Service | 3 (5.9%) | 48 (94.1%) |
| Education, Arts & Media | 3 (20.0%) | 12 (80.0%) |
| Legal Services & Support | 0 (0.0%) | 0 (0.0%) |
| Education Instruction & Library | 0 (0.0%) | 29 (100.0%) |
| Arts, Media & Entertainment | 0 (0.0%) | 7 (100.0%) |
| Health Diagnosing & Treating | 0 (0.0%) | 61 (100.0%) |
| Health Technologists | 0 (0.0%) | 34 (100.0%) |
| Total (Category) | 47 (21.4%) | 173 (78.6%) |
| Total (Overall) | 452 (47.9%) | 492 (52.1%) |
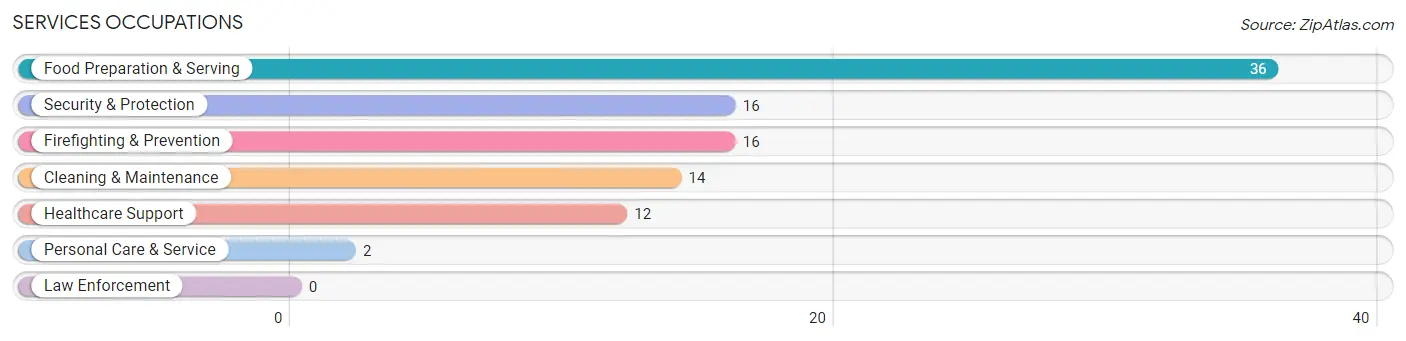
Services Occupations
The most common Services occupations in Walnut Grove are Food Preparation & Serving (36 | 3.8%), Security & Protection (16 | 1.7%), Firefighting & Prevention (16 | 1.7%), Cleaning & Maintenance (14 | 1.5%), and Healthcare Support (12 | 1.3%).
Services Occupations by Sex
Within the Services occupations in Walnut Grove, the most male-oriented occupations are Security & Protection (100.0%), Firefighting & Prevention (100.0%), and Personal Care & Service (100.0%), while the most female-oriented occupations are Healthcare Support (75.0%), Food Preparation & Serving (38.9%), and Cleaning & Maintenance (21.4%).
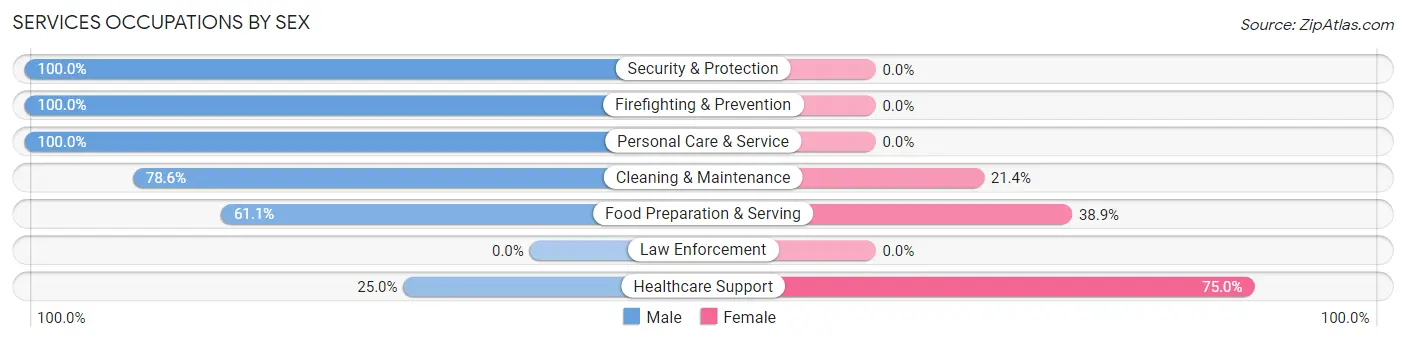
| Occupation | Male | Female |
| Healthcare Support | 3 (25.0%) | 9 (75.0%) |
| Security & Protection | 16 (100.0%) | 0 (0.0%) |
| Firefighting & Prevention | 16 (100.0%) | 0 (0.0%) |
| Law Enforcement | 0 (0.0%) | 0 (0.0%) |
| Food Preparation & Serving | 22 (61.1%) | 14 (38.9%) |
| Cleaning & Maintenance | 11 (78.6%) | 3 (21.4%) |
| Personal Care & Service | 2 (100.0%) | 0 (0.0%) |
| Total (Category) | 54 (67.5%) | 26 (32.5%) |
| Total (Overall) | 452 (47.9%) | 492 (52.1%) |
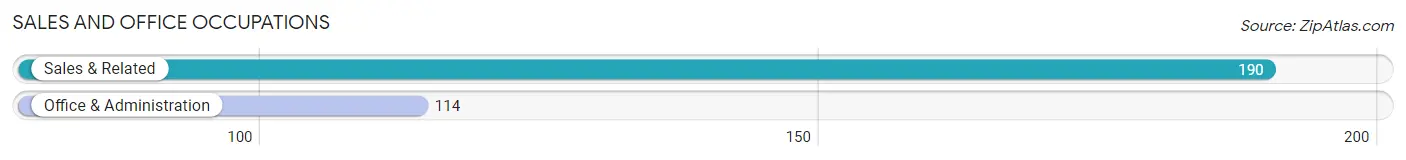
Sales and Office Occupations
The most common Sales and Office occupations in Walnut Grove are Sales & Related (190 | 20.1%), and Office & Administration (114 | 12.1%).
Sales and Office Occupations by Sex

| Occupation | Male | Female |
| Sales & Related | 34 (17.9%) | 156 (82.1%) |
| Office & Administration | 25 (21.9%) | 89 (78.1%) |
| Total (Category) | 59 (19.4%) | 245 (80.6%) |
| Total (Overall) | 452 (47.9%) | 492 (52.1%) |
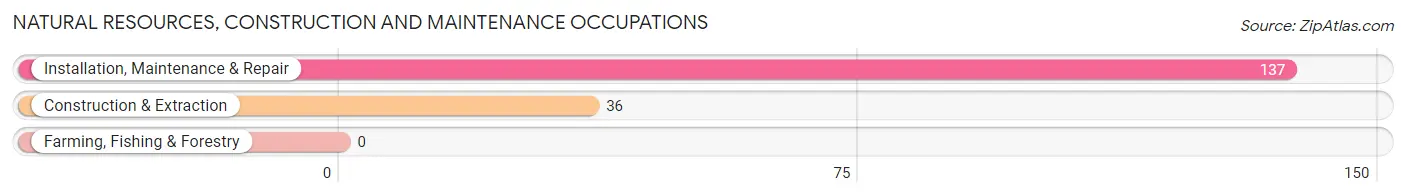
Natural Resources, Construction and Maintenance Occupations
The most common Natural Resources, Construction and Maintenance occupations in Walnut Grove are Installation, Maintenance & Repair (137 | 14.5%), and Construction & Extraction (36 | 3.8%).
Natural Resources, Construction and Maintenance Occupations by Sex

| Occupation | Male | Female |
| Farming, Fishing & Forestry | 0 (0.0%) | 0 (0.0%) |
| Construction & Extraction | 28 (77.8%) | 8 (22.2%) |
| Installation, Maintenance & Repair | 137 (100.0%) | 0 (0.0%) |
| Total (Category) | 165 (95.4%) | 8 (4.6%) |
| Total (Overall) | 452 (47.9%) | 492 (52.1%) |
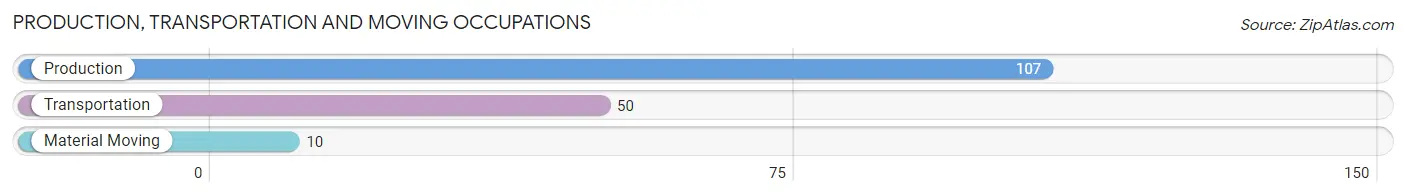
Production, Transportation and Moving Occupations
The most common Production, Transportation and Moving occupations in Walnut Grove are Production (107 | 11.3%), Transportation (50 | 5.3%), and Material Moving (10 | 1.1%).
Production, Transportation and Moving Occupations by Sex
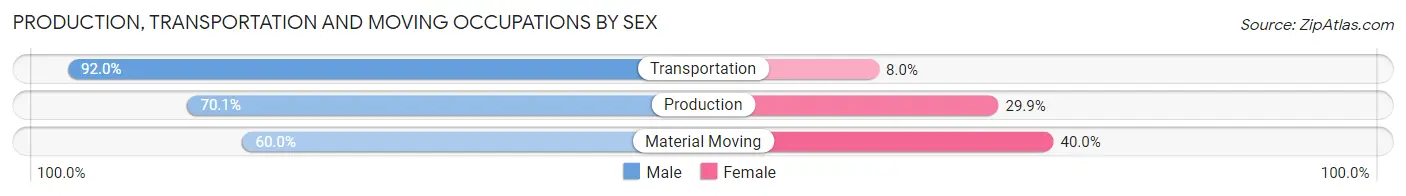
| Occupation | Male | Female |
| Production | 75 (70.1%) | 32 (29.9%) |
| Transportation | 46 (92.0%) | 4 (8.0%) |
| Material Moving | 6 (60.0%) | 4 (40.0%) |
| Total (Category) | 127 (76.0%) | 40 (23.9%) |
| Total (Overall) | 452 (47.9%) | 492 (52.1%) |
Employment Industries by Sex in Walnut Grove
Employment Industries in Walnut Grove
The major employment industries in Walnut Grove include Administrative & Support (146 | 15.5%), Manufacturing (136 | 14.4%), Retail Trade (123 | 13.0%), Health Care & Social Assistance (122 | 12.9%), and Construction (74 | 7.8%).
Employment Industries by Sex in Walnut Grove
The Walnut Grove industries that see more men than women are Information (100.0%), Construction (89.2%), and Manufacturing (85.3%), whereas the industries that tend to have a higher number of women are Professional & Scientific (92.7%), Administrative & Support (91.1%), and Educational Services (87.1%).
| Industry | Male | Female |
| Agriculture, Fishing & Hunting | 0 (0.0%) | 0 (0.0%) |
| Mining, Quarrying, & Extraction | 0 (0.0%) | 0 (0.0%) |
| Construction | 66 (89.2%) | 8 (10.8%) |
| Manufacturing | 116 (85.3%) | 20 (14.7%) |
| Wholesale Trade | 6 (60.0%) | 4 (40.0%) |
| Retail Trade | 72 (58.5%) | 51 (41.5%) |
| Transportation & Warehousing | 14 (45.2%) | 17 (54.8%) |
| Utilities | 3 (50.0%) | 3 (50.0%) |
| Information | 14 (100.0%) | 0 (0.0%) |
| Finance & Insurance | 16 (55.2%) | 13 (44.8%) |
| Real Estate, Rental & Leasing | 20 (66.7%) | 10 (33.3%) |
| Professional & Scientific | 4 (7.3%) | 51 (92.7%) |
| Enterprise Management | 0 (0.0%) | 0 (0.0%) |
| Administrative & Support | 13 (8.9%) | 133 (91.1%) |
| Educational Services | 4 (12.9%) | 27 (87.1%) |
| Health Care & Social Assistance | 21 (17.2%) | 101 (82.8%) |
| Arts, Entertainment & Recreation | 2 (40.0%) | 3 (60.0%) |
| Accommodation & Food Services | 22 (45.8%) | 26 (54.2%) |
| Public Administration | 19 (45.2%) | 23 (54.8%) |
| Total | 452 (47.9%) | 492 (52.1%) |
Education in Walnut Grove
School Enrollment in Walnut Grove
The most common levels of schooling among the 251 students in Walnut Grove are elementary school (69 | 27.5%), high school (62 | 24.7%), and college / undergraduate (47 | 18.7%).
| School Level | # Students | % Students |
| Nursery / Preschool | 18 | 7.2% |
| Kindergarten | 12 | 4.8% |
| Elementary School | 69 | 27.5% |
| Middle School | 33 | 13.2% |
| High School | 62 | 24.7% |
| College / Undergraduate | 47 | 18.7% |
| Graduate / Professional | 10 | 4.0% |
| Total | 251 | 100.0% |
School Enrollment by Age by Funding Source in Walnut Grove
Out of a total of 251 students who are enrolled in schools in Walnut Grove, 31 (12.4%) attend a private institution, while the remaining 220 (87.6%) are enrolled in public schools. The age group of 35 years and over has the highest likelihood of being enrolled in private schools, with 14 (100.0% in the age bracket) enrolled. Conversely, the age group of 10 to 14 year olds has the lowest likelihood of being enrolled in a private school, with 51 (100.0% in the age bracket) attending a public institution.
| Age Bracket | Public School | Private School |
| 3 to 4 Year Olds | 14 (77.8%) | 4 (22.2%) |
| 5 to 9 Year Old | 76 (93.8%) | 5 (6.2%) |
| 10 to 14 Year Olds | 51 (100.0%) | 0 (0.0%) |
| 15 to 17 Year Olds | 31 (100.0%) | 0 (0.0%) |
| 18 to 19 Year Olds | 21 (100.0%) | 0 (0.0%) |
| 20 to 24 Year Olds | 16 (84.2%) | 3 (15.8%) |
| 25 to 34 Year Olds | 11 (68.8%) | 5 (31.2%) |
| 35 Years and over | 0 (0.0%) | 14 (100.0%) |
| Total | 220 (87.6%) | 31 (12.4%) |
Educational Attainment by Field of Study in Walnut Grove
Education (42 | 34.4%), business (22 | 18.0%), science & technology (14 | 11.5%), computers & mathematics (11 | 9.0%), and arts & humanities (11 | 9.0%) are the most common fields of study among 122 individuals in Walnut Grove who have obtained a bachelor's degree or higher.
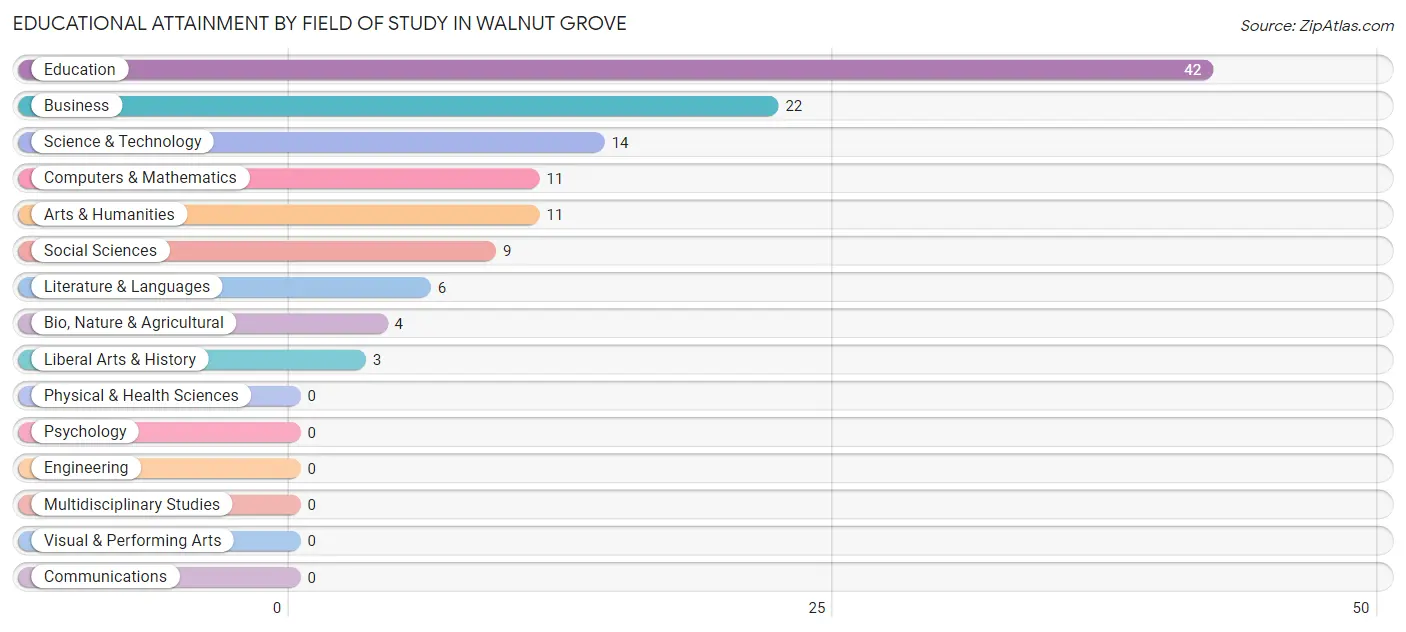
| Field of Study | # Graduates | % Graduates |
| Computers & Mathematics | 11 | 9.0% |
| Bio, Nature & Agricultural | 4 | 3.3% |
| Physical & Health Sciences | 0 | 0.0% |
| Psychology | 0 | 0.0% |
| Social Sciences | 9 | 7.4% |
| Engineering | 0 | 0.0% |
| Multidisciplinary Studies | 0 | 0.0% |
| Science & Technology | 14 | 11.5% |
| Business | 22 | 18.0% |
| Education | 42 | 34.4% |
| Literature & Languages | 6 | 4.9% |
| Liberal Arts & History | 3 | 2.5% |
| Visual & Performing Arts | 0 | 0.0% |
| Communications | 0 | 0.0% |
| Arts & Humanities | 11 | 9.0% |
| Total | 122 | 100.0% |
Transportation & Commute in Walnut Grove
Vehicle Availability by Sex in Walnut Grove
The most prevalent vehicle ownership categories in Walnut Grove are males with 2 vehicles (154, accounting for 34.1%) and females with 2 vehicles (123, making up 31.3%).
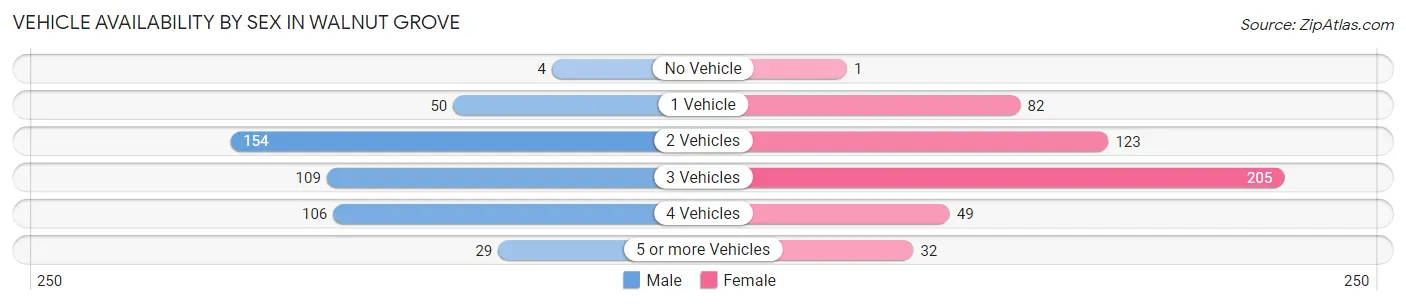
| Vehicles Available | Male | Female |
| No Vehicle | 4 (0.9%) | 1 (0.2%) |
| 1 Vehicle | 50 (11.1%) | 82 (16.7%) |
| 2 Vehicles | 154 (34.1%) | 123 (25.0%) |
| 3 Vehicles | 109 (24.1%) | 205 (41.7%) |
| 4 Vehicles | 106 (23.4%) | 49 (10.0%) |
| 5 or more Vehicles | 29 (6.4%) | 32 (6.5%) |
| Total | 452 (100.0%) | 492 (100.0%) |
Commute Time in Walnut Grove
The most frequently occuring commute durations in Walnut Grove are 30 to 34 minutes (123 commuters, 15.4%), 60 to 89 minutes (116 commuters, 14.5%), and 45 to 59 minutes (109 commuters, 13.6%).
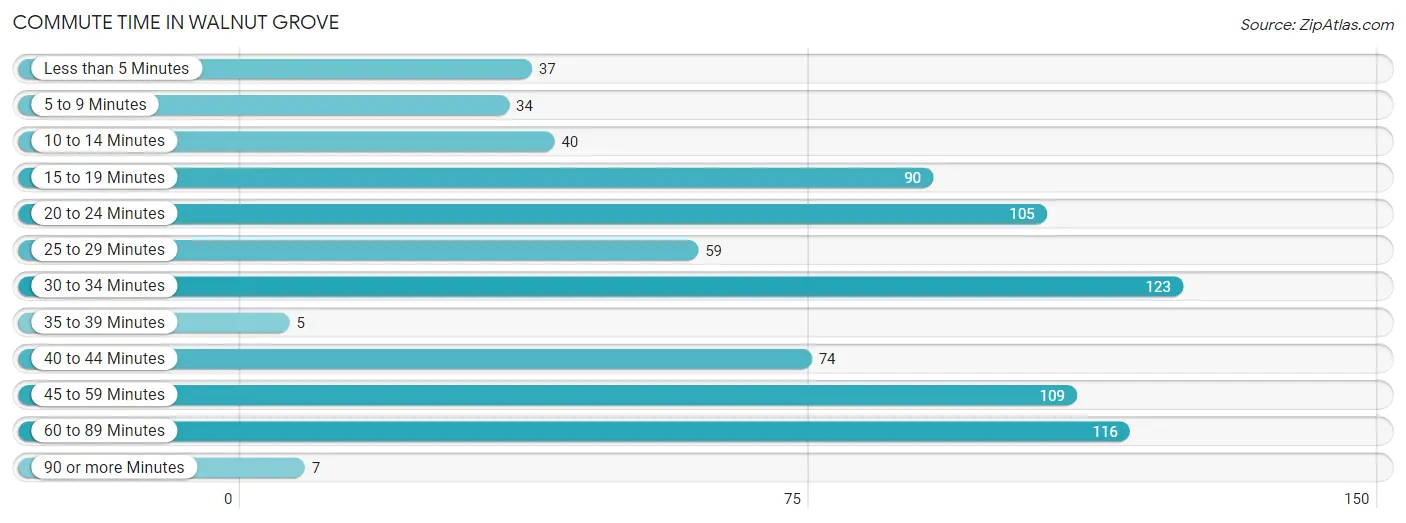
| Commute Time | # Commuters | % Commuters |
| Less than 5 Minutes | 37 | 4.6% |
| 5 to 9 Minutes | 34 | 4.3% |
| 10 to 14 Minutes | 40 | 5.0% |
| 15 to 19 Minutes | 90 | 11.3% |
| 20 to 24 Minutes | 105 | 13.1% |
| 25 to 29 Minutes | 59 | 7.4% |
| 30 to 34 Minutes | 123 | 15.4% |
| 35 to 39 Minutes | 5 | 0.6% |
| 40 to 44 Minutes | 74 | 9.3% |
| 45 to 59 Minutes | 109 | 13.6% |
| 60 to 89 Minutes | 116 | 14.5% |
| 90 or more Minutes | 7 | 0.9% |
Commute Time by Sex in Walnut Grove
The most common commute times in Walnut Grove are 30 to 34 minutes (75 commuters, 16.9%) for males and 45 to 59 minutes (66 commuters, 18.6%) for females.
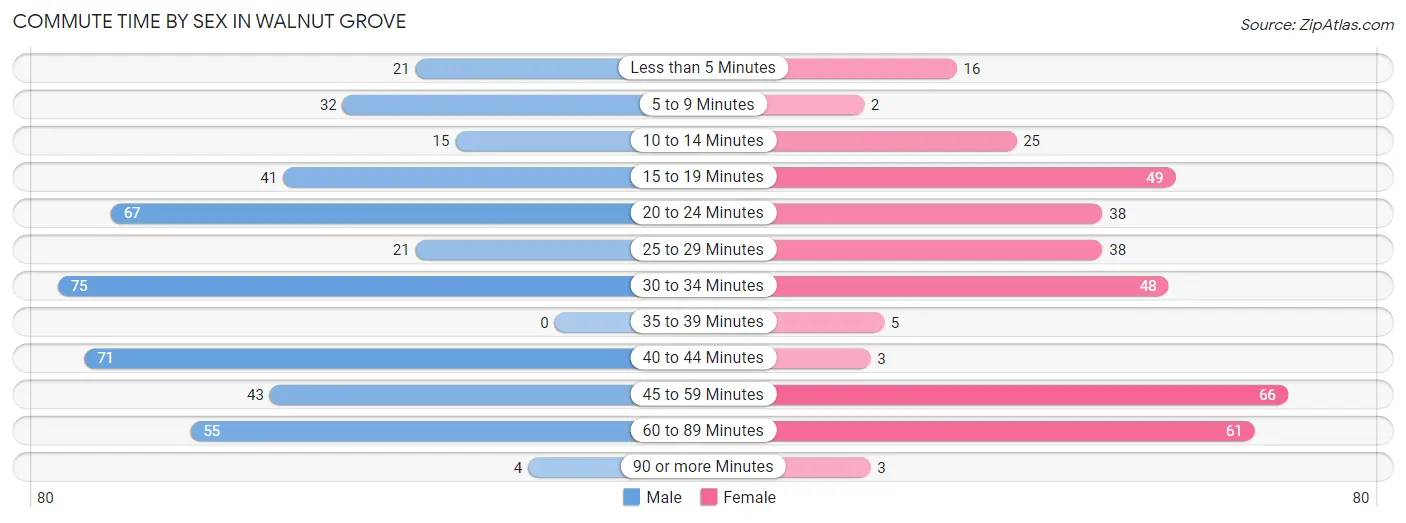
| Commute Time | Male | Female |
| Less than 5 Minutes | 21 (4.7%) | 16 (4.5%) |
| 5 to 9 Minutes | 32 (7.2%) | 2 (0.6%) |
| 10 to 14 Minutes | 15 (3.4%) | 25 (7.1%) |
| 15 to 19 Minutes | 41 (9.2%) | 49 (13.8%) |
| 20 to 24 Minutes | 67 (15.1%) | 38 (10.7%) |
| 25 to 29 Minutes | 21 (4.7%) | 38 (10.7%) |
| 30 to 34 Minutes | 75 (16.9%) | 48 (13.6%) |
| 35 to 39 Minutes | 0 (0.0%) | 5 (1.4%) |
| 40 to 44 Minutes | 71 (16.0%) | 3 (0.9%) |
| 45 to 59 Minutes | 43 (9.7%) | 66 (18.6%) |
| 60 to 89 Minutes | 55 (12.4%) | 61 (17.2%) |
| 90 or more Minutes | 4 (0.9%) | 3 (0.9%) |
Time of Departure to Work by Sex in Walnut Grove
The most frequent times of departure to work in Walnut Grove are 7:30 AM to 7:59 AM (101, 22.7%) for males and 7:00 AM to 7:29 AM (102, 28.8%) for females.
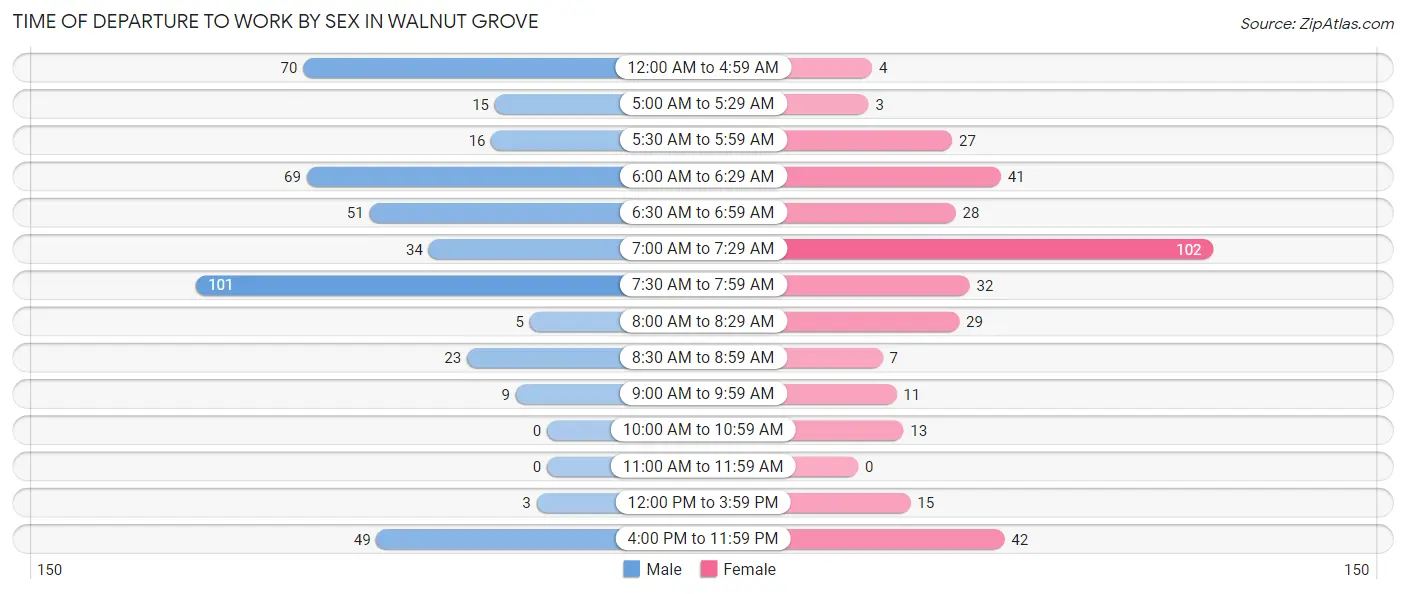
| Time of Departure | Male | Female |
| 12:00 AM to 4:59 AM | 70 (15.7%) | 4 (1.1%) |
| 5:00 AM to 5:29 AM | 15 (3.4%) | 3 (0.9%) |
| 5:30 AM to 5:59 AM | 16 (3.6%) | 27 (7.6%) |
| 6:00 AM to 6:29 AM | 69 (15.5%) | 41 (11.6%) |
| 6:30 AM to 6:59 AM | 51 (11.5%) | 28 (7.9%) |
| 7:00 AM to 7:29 AM | 34 (7.6%) | 102 (28.8%) |
| 7:30 AM to 7:59 AM | 101 (22.7%) | 32 (9.0%) |
| 8:00 AM to 8:29 AM | 5 (1.1%) | 29 (8.2%) |
| 8:30 AM to 8:59 AM | 23 (5.2%) | 7 (2.0%) |
| 9:00 AM to 9:59 AM | 9 (2.0%) | 11 (3.1%) |
| 10:00 AM to 10:59 AM | 0 (0.0%) | 13 (3.7%) |
| 11:00 AM to 11:59 AM | 0 (0.0%) | 0 (0.0%) |
| 12:00 PM to 3:59 PM | 3 (0.7%) | 15 (4.2%) |
| 4:00 PM to 11:59 PM | 49 (11.0%) | 42 (11.9%) |
| Total | 445 (100.0%) | 354 (100.0%) |
Housing Occupancy in Walnut Grove
Occupancy by Ownership in Walnut Grove
Of the total 689 dwellings in Walnut Grove, owner-occupied units account for 554 (80.4%), while renter-occupied units make up 135 (19.6%).
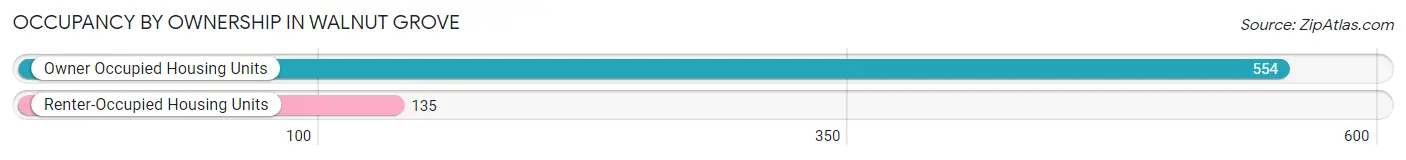
| Occupancy | # Housing Units | % Housing Units |
| Owner Occupied Housing Units | 554 | 80.4% |
| Renter-Occupied Housing Units | 135 | 19.6% |
| Total Occupied Housing Units | 689 | 100.0% |
Occupancy by Household Size in Walnut Grove
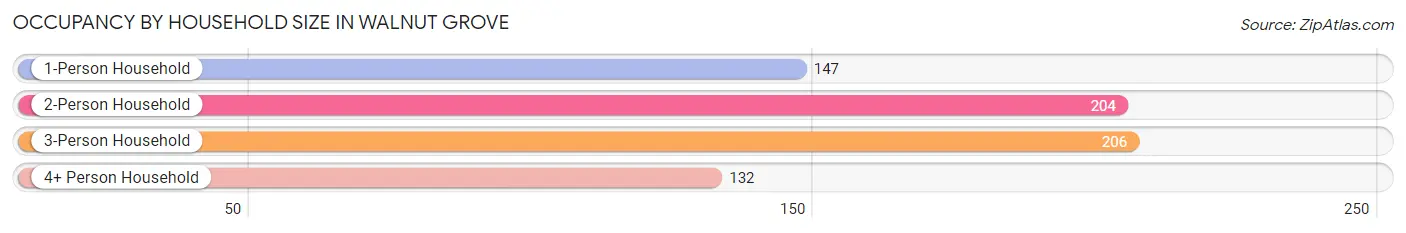
| Household Size | # Housing Units | % Housing Units |
| 1-Person Household | 147 | 21.3% |
| 2-Person Household | 204 | 29.6% |
| 3-Person Household | 206 | 29.9% |
| 4+ Person Household | 132 | 19.2% |
| Total Housing Units | 689 | 100.0% |
Occupancy by Ownership by Household Size in Walnut Grove
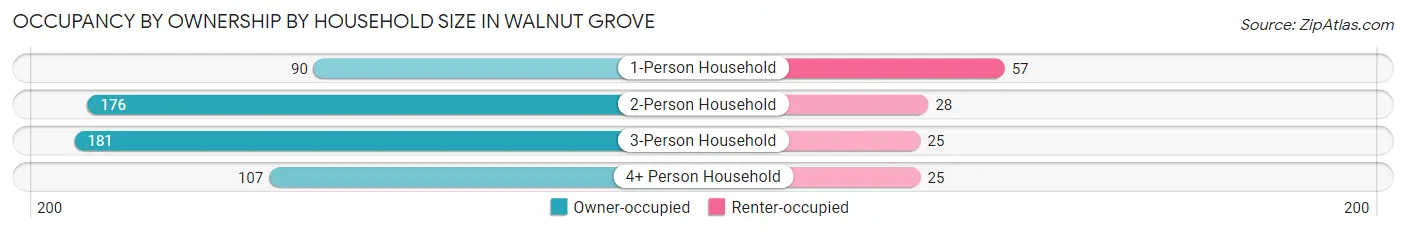
| Household Size | Owner-occupied | Renter-occupied |
| 1-Person Household | 90 (61.2%) | 57 (38.8%) |
| 2-Person Household | 176 (86.3%) | 28 (13.7%) |
| 3-Person Household | 181 (87.9%) | 25 (12.1%) |
| 4+ Person Household | 107 (81.1%) | 25 (18.9%) |
| Total Housing Units | 554 (80.4%) | 135 (19.6%) |
Occupancy by Educational Attainment in Walnut Grove
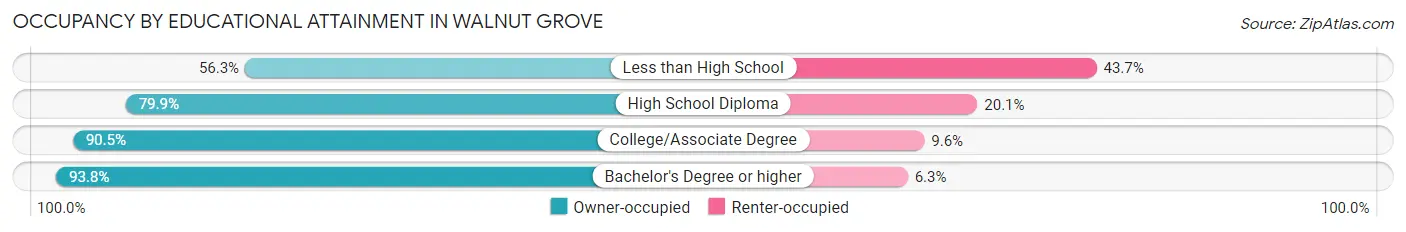
| Household Size | Owner-occupied | Renter-occupied |
| Less than High School | 58 (56.3%) | 45 (43.7%) |
| High School Diploma | 279 (79.9%) | 70 (20.1%) |
| College/Associate Degree | 142 (90.4%) | 15 (9.6%) |
| Bachelor's Degree or higher | 75 (93.8%) | 5 (6.2%) |
Occupancy by Age of Householder in Walnut Grove
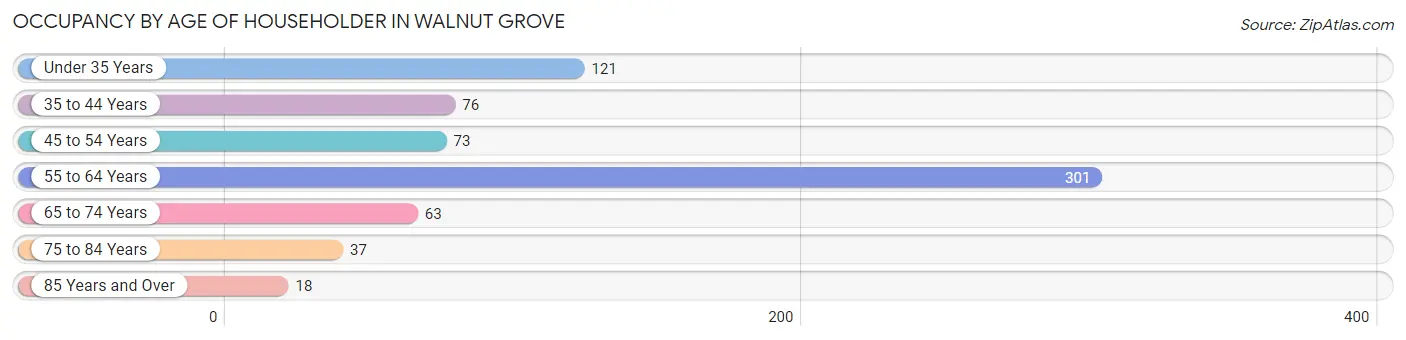
| Age Bracket | # Households | % Households |
| Under 35 Years | 121 | 17.6% |
| 35 to 44 Years | 76 | 11.0% |
| 45 to 54 Years | 73 | 10.6% |
| 55 to 64 Years | 301 | 43.7% |
| 65 to 74 Years | 63 | 9.1% |
| 75 to 84 Years | 37 | 5.4% |
| 85 Years and Over | 18 | 2.6% |
| Total | 689 | 100.0% |
Housing Finances in Walnut Grove
Median Income by Occupancy in Walnut Grove
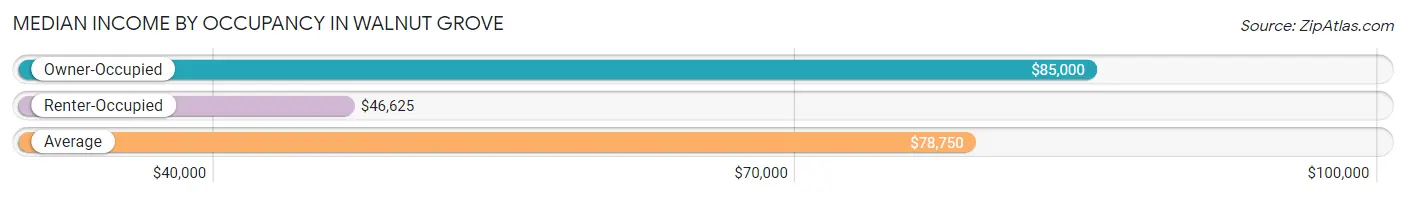
| Occupancy Type | # Households | Median Income |
| Owner-Occupied | 554 (80.4%) | $85,000 |
| Renter-Occupied | 135 (19.6%) | $46,625 |
| Average | 689 (100.0%) | $78,750 |
Occupancy by Householder Income Bracket in Walnut Grove
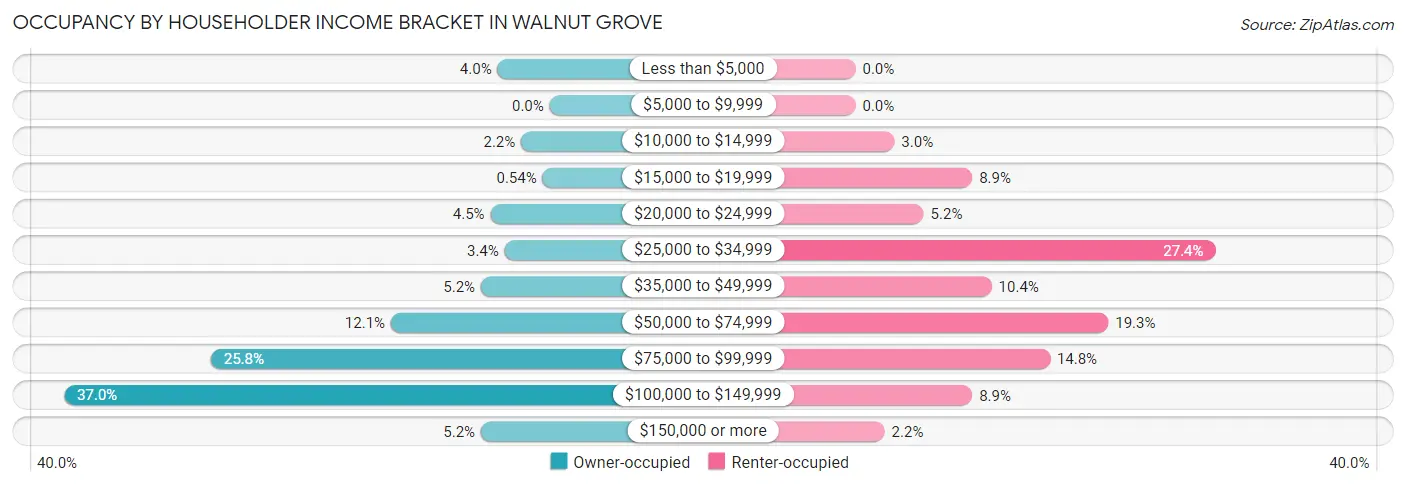
| Income Bracket | Owner-occupied | Renter-occupied |
| Less than $5,000 | 22 (4.0%) | 0 (0.0%) |
| $5,000 to $9,999 | 0 (0.0%) | 0 (0.0%) |
| $10,000 to $14,999 | 12 (2.2%) | 4 (3.0%) |
| $15,000 to $19,999 | 3 (0.5%) | 12 (8.9%) |
| $20,000 to $24,999 | 25 (4.5%) | 7 (5.2%) |
| $25,000 to $34,999 | 19 (3.4%) | 37 (27.4%) |
| $35,000 to $49,999 | 29 (5.2%) | 14 (10.4%) |
| $50,000 to $74,999 | 67 (12.1%) | 26 (19.3%) |
| $75,000 to $99,999 | 143 (25.8%) | 20 (14.8%) |
| $100,000 to $149,999 | 205 (37.0%) | 12 (8.9%) |
| $150,000 or more | 29 (5.2%) | 3 (2.2%) |
| Total | 554 (100.0%) | 135 (100.0%) |
Monthly Housing Cost Tiers in Walnut Grove
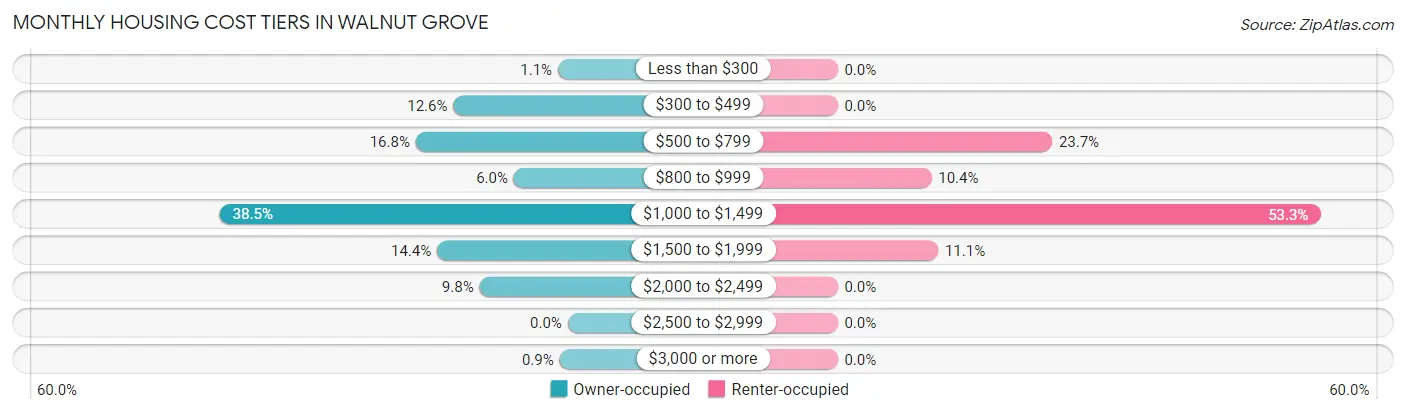
| Monthly Cost | Owner-occupied | Renter-occupied |
| Less than $300 | 6 (1.1%) | 0 (0.0%) |
| $300 to $499 | 70 (12.6%) | 0 (0.0%) |
| $500 to $799 | 93 (16.8%) | 32 (23.7%) |
| $800 to $999 | 33 (6.0%) | 14 (10.4%) |
| $1,000 to $1,499 | 213 (38.5%) | 72 (53.3%) |
| $1,500 to $1,999 | 80 (14.4%) | 15 (11.1%) |
| $2,000 to $2,499 | 54 (9.8%) | 0 (0.0%) |
| $2,500 to $2,999 | 0 (0.0%) | 0 (0.0%) |
| $3,000 or more | 5 (0.9%) | 0 (0.0%) |
| Total | 554 (100.0%) | 135 (100.0%) |
Physical Housing Characteristics in Walnut Grove
Housing Structures in Walnut Grove
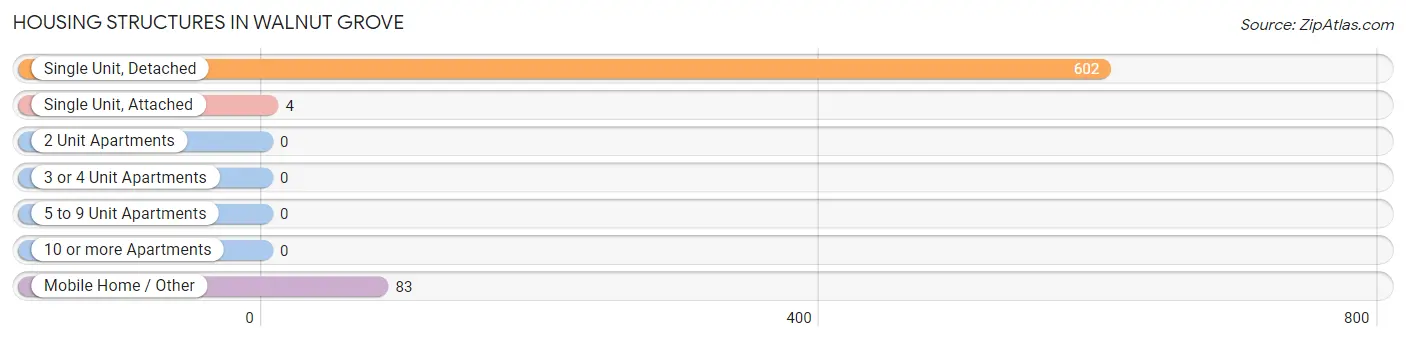
| Structure Type | # Housing Units | % Housing Units |
| Single Unit, Detached | 602 | 87.4% |
| Single Unit, Attached | 4 | 0.6% |
| 2 Unit Apartments | 0 | 0.0% |
| 3 or 4 Unit Apartments | 0 | 0.0% |
| 5 to 9 Unit Apartments | 0 | 0.0% |
| 10 or more Apartments | 0 | 0.0% |
| Mobile Home / Other | 83 | 12.0% |
| Total | 689 | 100.0% |
Housing Structures by Occupancy in Walnut Grove
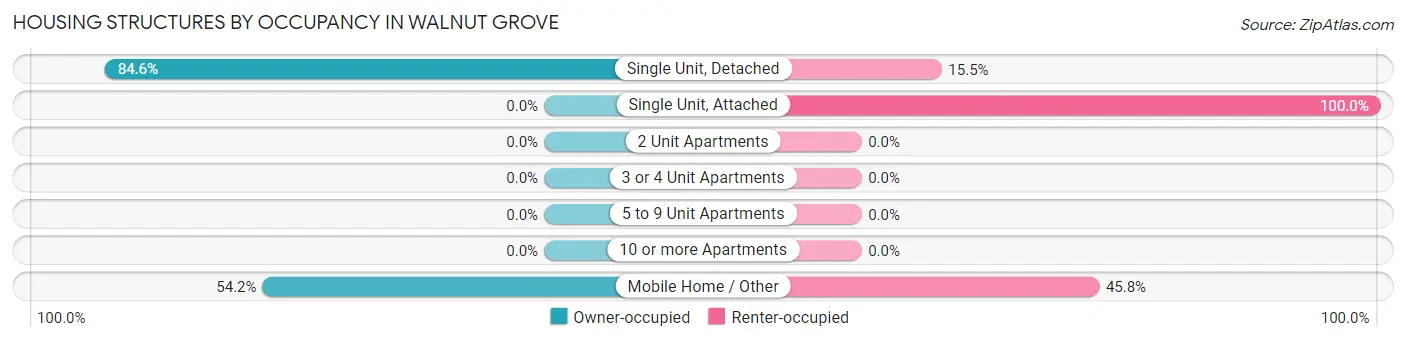
| Structure Type | Owner-occupied | Renter-occupied |
| Single Unit, Detached | 509 (84.6%) | 93 (15.4%) |
| Single Unit, Attached | 0 (0.0%) | 4 (100.0%) |
| 2 Unit Apartments | 0 (0.0%) | 0 (0.0%) |
| 3 or 4 Unit Apartments | 0 (0.0%) | 0 (0.0%) |
| 5 to 9 Unit Apartments | 0 (0.0%) | 0 (0.0%) |
| 10 or more Apartments | 0 (0.0%) | 0 (0.0%) |
| Mobile Home / Other | 45 (54.2%) | 38 (45.8%) |
| Total | 554 (80.4%) | 135 (19.6%) |
Housing Structures by Number of Rooms in Walnut Grove
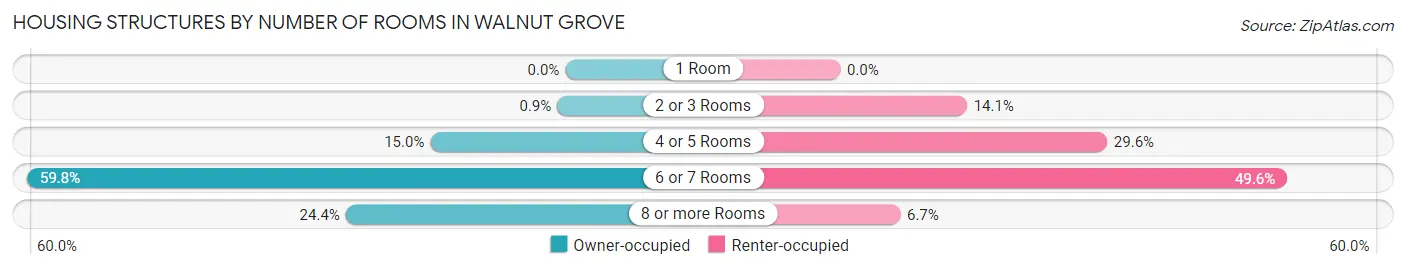
| Number of Rooms | Owner-occupied | Renter-occupied |
| 1 Room | 0 (0.0%) | 0 (0.0%) |
| 2 or 3 Rooms | 5 (0.9%) | 19 (14.1%) |
| 4 or 5 Rooms | 83 (15.0%) | 40 (29.6%) |
| 6 or 7 Rooms | 331 (59.8%) | 67 (49.6%) |
| 8 or more Rooms | 135 (24.4%) | 9 (6.7%) |
| Total | 554 (100.0%) | 135 (100.0%) |
Housing Structure by Heating Type in Walnut Grove
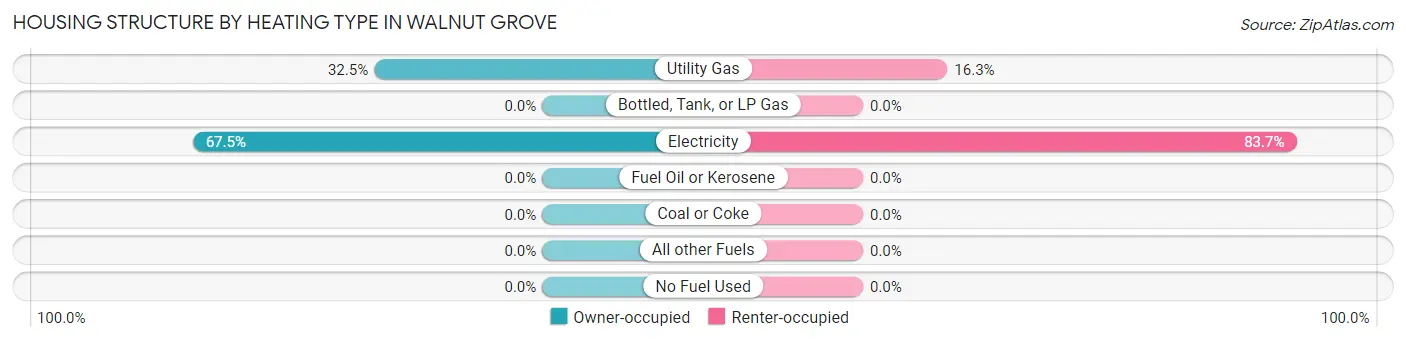
| Heating Type | Owner-occupied | Renter-occupied |
| Utility Gas | 180 (32.5%) | 22 (16.3%) |
| Bottled, Tank, or LP Gas | 0 (0.0%) | 0 (0.0%) |
| Electricity | 374 (67.5%) | 113 (83.7%) |
| Fuel Oil or Kerosene | 0 (0.0%) | 0 (0.0%) |
| Coal or Coke | 0 (0.0%) | 0 (0.0%) |
| All other Fuels | 0 (0.0%) | 0 (0.0%) |
| No Fuel Used | 0 (0.0%) | 0 (0.0%) |
| Total | 554 (100.0%) | 135 (100.0%) |
Household Vehicle Usage in Walnut Grove
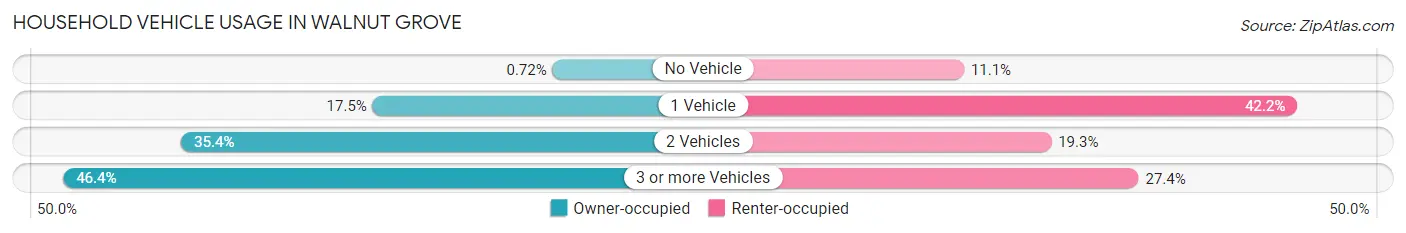
| Vehicles per Household | Owner-occupied | Renter-occupied |
| No Vehicle | 4 (0.7%) | 15 (11.1%) |
| 1 Vehicle | 97 (17.5%) | 57 (42.2%) |
| 2 Vehicles | 196 (35.4%) | 26 (19.3%) |
| 3 or more Vehicles | 257 (46.4%) | 37 (27.4%) |
| Total | 554 (100.0%) | 135 (100.0%) |
Real Estate & Mortgages in Walnut Grove
Real Estate and Mortgage Overview in Walnut Grove
| Characteristic | Without Mortgage | With Mortgage |
| Housing Units | 151 | 403 |
| Median Property Value | $216,300 | $206,600 |
| Median Household Income | $70,417 | $22 |
| Monthly Housing Costs | $498 | $5 |
| Real Estate Taxes | $1,441 | $0 |
Property Value by Mortgage Status in Walnut Grove
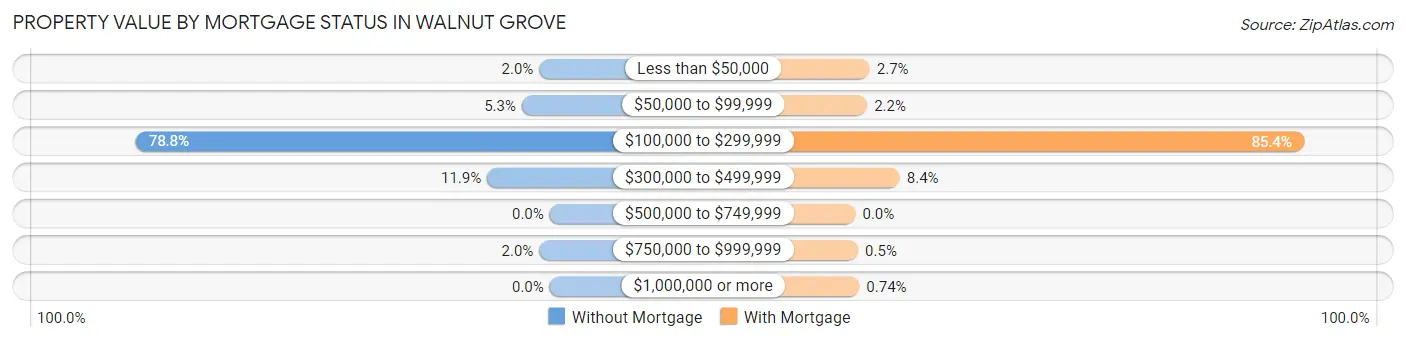
| Property Value | Without Mortgage | With Mortgage |
| Less than $50,000 | 3 (2.0%) | 11 (2.7%) |
| $50,000 to $99,999 | 8 (5.3%) | 9 (2.2%) |
| $100,000 to $299,999 | 119 (78.8%) | 344 (85.4%) |
| $300,000 to $499,999 | 18 (11.9%) | 34 (8.4%) |
| $500,000 to $749,999 | 0 (0.0%) | 0 (0.0%) |
| $750,000 to $999,999 | 3 (2.0%) | 2 (0.5%) |
| $1,000,000 or more | 0 (0.0%) | 3 (0.7%) |
| Total | 151 (100.0%) | 403 (100.0%) |
Household Income by Mortgage Status in Walnut Grove
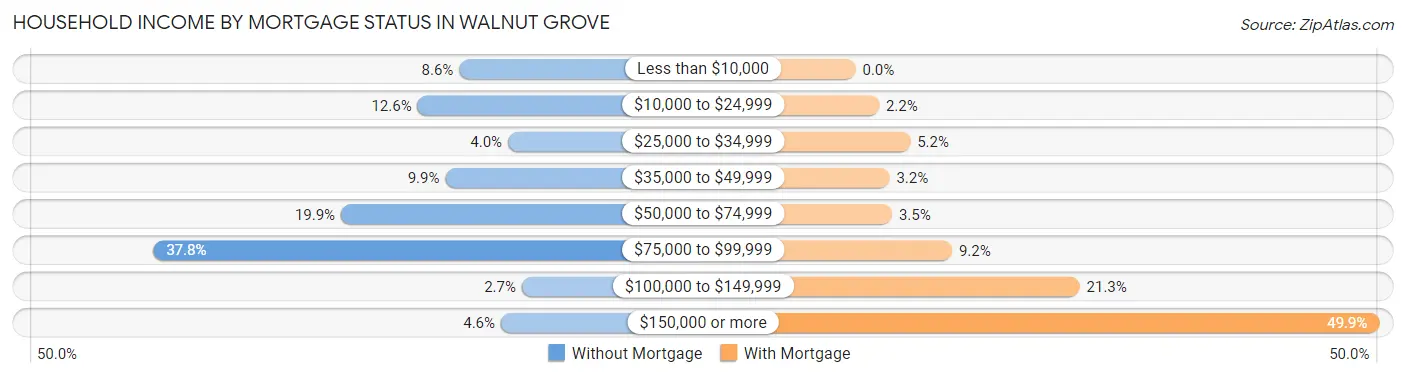
| Household Income | Without Mortgage | With Mortgage |
| Less than $10,000 | 13 (8.6%) | 0 (0.0%) |
| $10,000 to $24,999 | 19 (12.6%) | 9 (2.2%) |
| $25,000 to $34,999 | 6 (4.0%) | 21 (5.2%) |
| $35,000 to $49,999 | 15 (9.9%) | 13 (3.2%) |
| $50,000 to $74,999 | 30 (19.9%) | 14 (3.5%) |
| $75,000 to $99,999 | 57 (37.8%) | 37 (9.2%) |
| $100,000 to $149,999 | 4 (2.6%) | 86 (21.3%) |
| $150,000 or more | 7 (4.6%) | 201 (49.9%) |
| Total | 151 (100.0%) | 403 (100.0%) |
Property Value to Household Income Ratio in Walnut Grove
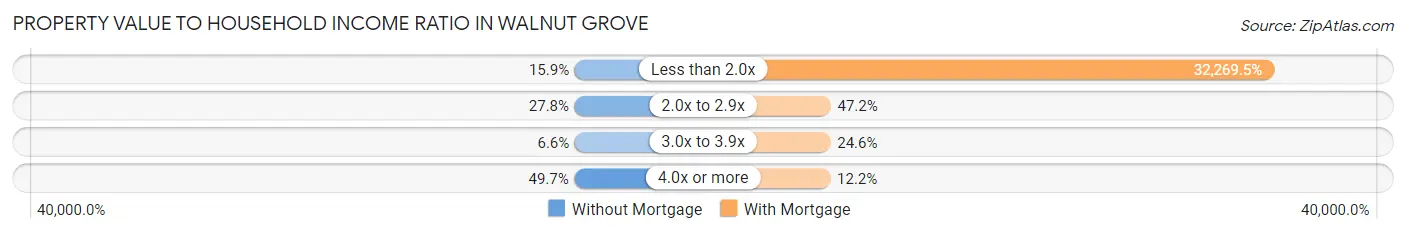
| Value-to-Income Ratio | Without Mortgage | With Mortgage |
| Less than 2.0x | 24 (15.9%) | 130,046 (32,269.5%) |
| 2.0x to 2.9x | 42 (27.8%) | 190 (47.1%) |
| 3.0x to 3.9x | 10 (6.6%) | 99 (24.6%) |
| 4.0x or more | 75 (49.7%) | 49 (12.2%) |
| Total | 151 (100.0%) | 403 (100.0%) |
Real Estate Taxes by Mortgage Status in Walnut Grove
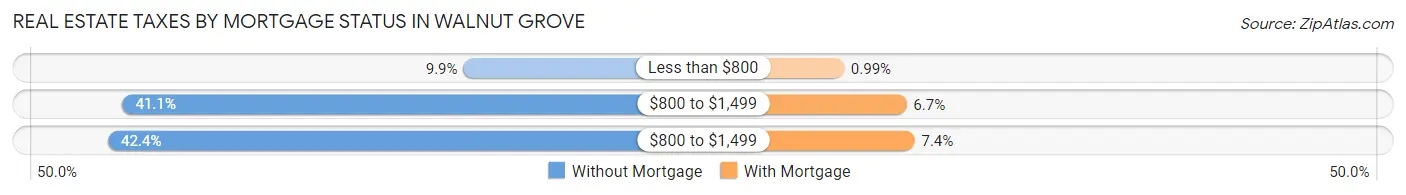
| Property Taxes | Without Mortgage | With Mortgage |
| Less than $800 | 15 (9.9%) | 4 (1.0%) |
| $800 to $1,499 | 62 (41.1%) | 27 (6.7%) |
| $800 to $1,499 | 64 (42.4%) | 30 (7.4%) |
| Total | 151 (100.0%) | 403 (100.0%) |
Health & Disability in Walnut Grove
Health Insurance Coverage by Age in Walnut Grove
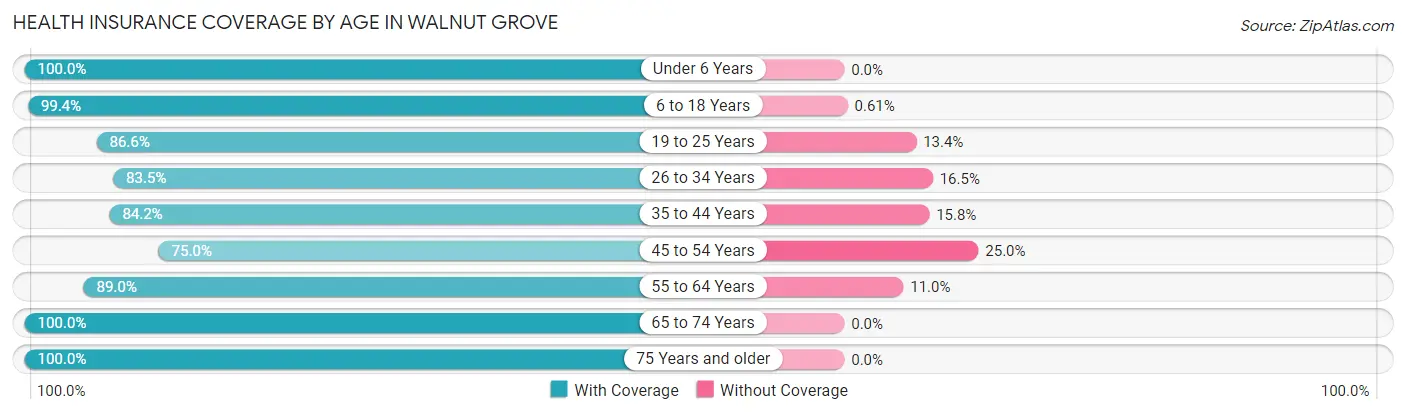
| Age Bracket | With Coverage | Without Coverage |
| Under 6 Years | 81 (100.0%) | 0 (0.0%) |
| 6 to 18 Years | 163 (99.4%) | 1 (0.6%) |
| 19 to 25 Years | 213 (86.6%) | 33 (13.4%) |
| 26 to 34 Years | 162 (83.5%) | 32 (16.5%) |
| 35 to 44 Years | 101 (84.2%) | 19 (15.8%) |
| 45 to 54 Years | 150 (75.0%) | 50 (25.0%) |
| 55 to 64 Years | 372 (89.0%) | 46 (11.0%) |
| 65 to 74 Years | 110 (100.0%) | 0 (0.0%) |
| 75 Years and older | 87 (100.0%) | 0 (0.0%) |
| Total | 1,439 (88.8%) | 181 (11.2%) |
Health Insurance Coverage by Citizenship Status in Walnut Grove
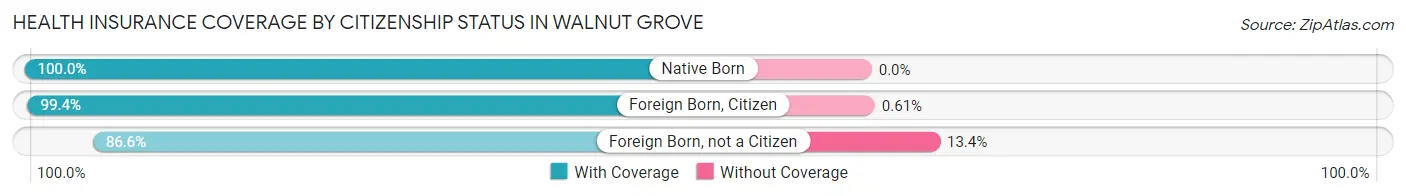
| Citizenship Status | With Coverage | Without Coverage |
| Native Born | 81 (100.0%) | 0 (0.0%) |
| Foreign Born, Citizen | 163 (99.4%) | 1 (0.6%) |
| Foreign Born, not a Citizen | 213 (86.6%) | 33 (13.4%) |
Health Insurance Coverage by Household Income in Walnut Grove
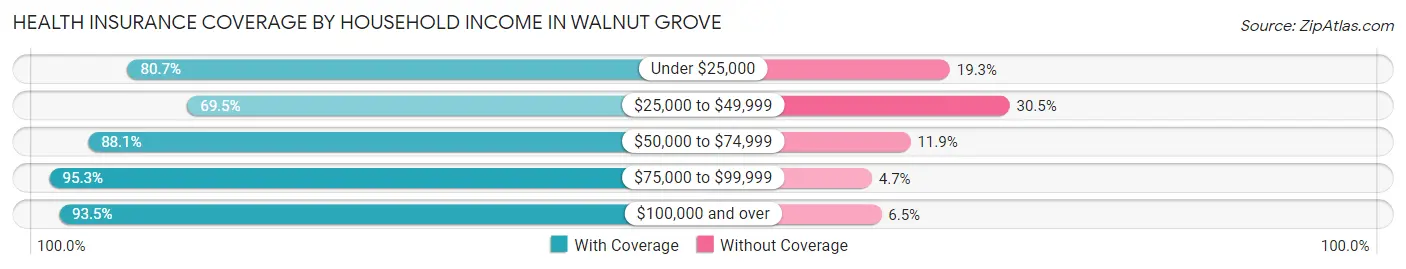
| Household Income | With Coverage | Without Coverage |
| Under $25,000 | 117 (80.7%) | 28 (19.3%) |
| $25,000 to $49,999 | 155 (69.5%) | 68 (30.5%) |
| $50,000 to $74,999 | 192 (88.1%) | 26 (11.9%) |
| $75,000 to $99,999 | 426 (95.3%) | 21 (4.7%) |
| $100,000 and over | 549 (93.5%) | 38 (6.5%) |
Public vs Private Health Insurance Coverage by Age in Walnut Grove
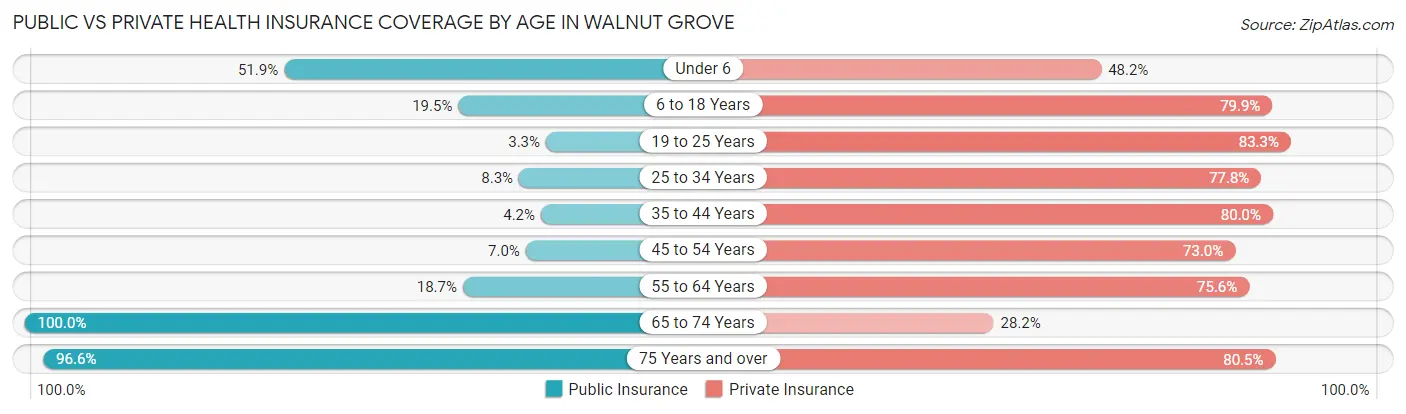
| Age Bracket | Public Insurance | Private Insurance |
| Under 6 | 42 (51.8%) | 39 (48.1%) |
| 6 to 18 Years | 32 (19.5%) | 131 (79.9%) |
| 19 to 25 Years | 8 (3.3%) | 205 (83.3%) |
| 25 to 34 Years | 16 (8.3%) | 151 (77.8%) |
| 35 to 44 Years | 5 (4.2%) | 96 (80.0%) |
| 45 to 54 Years | 14 (7.0%) | 146 (73.0%) |
| 55 to 64 Years | 78 (18.7%) | 316 (75.6%) |
| 65 to 74 Years | 110 (100.0%) | 31 (28.2%) |
| 75 Years and over | 84 (96.6%) | 70 (80.5%) |
| Total | 389 (24.0%) | 1,185 (73.2%) |
Disability Status by Sex by Age in Walnut Grove
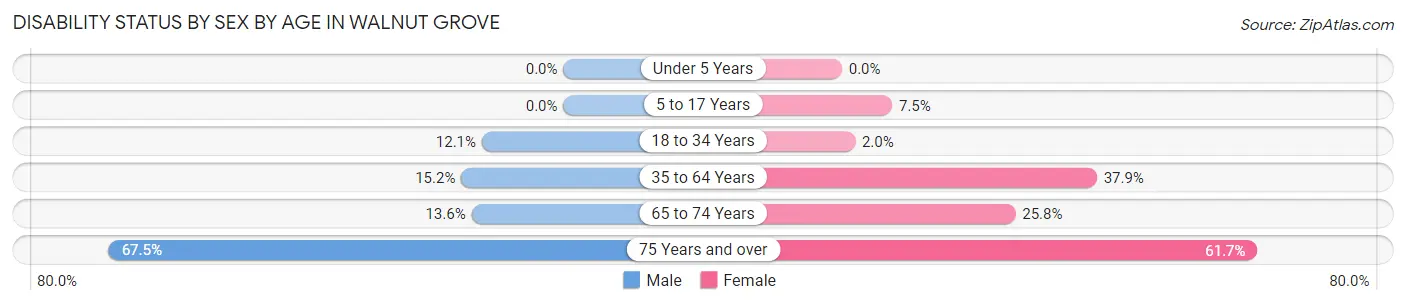
| Age Bracket | Male | Female |
| Under 5 Years | 0 (0.0%) | 0 (0.0%) |
| 5 to 17 Years | 0 (0.0%) | 5 (7.5%) |
| 18 to 34 Years | 30 (12.1%) | 4 (1.9%) |
| 35 to 64 Years | 47 (15.2%) | 162 (37.9%) |
| 65 to 74 Years | 6 (13.6%) | 17 (25.8%) |
| 75 Years and over | 27 (67.5%) | 29 (61.7%) |
Disability Class by Sex by Age in Walnut Grove
Disability Class: Hearing Difficulty
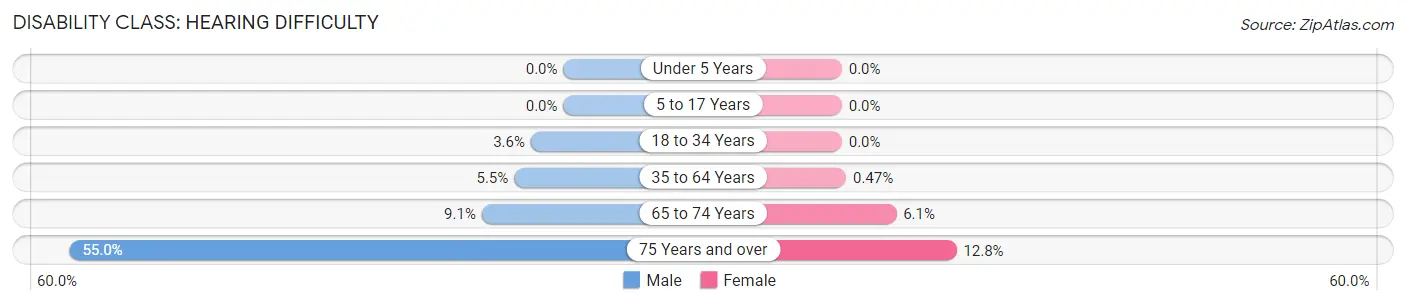
| Age Bracket | Male | Female |
| Under 5 Years | 0 (0.0%) | 0 (0.0%) |
| 5 to 17 Years | 0 (0.0%) | 0 (0.0%) |
| 18 to 34 Years | 9 (3.6%) | 0 (0.0%) |
| 35 to 64 Years | 17 (5.5%) | 2 (0.5%) |
| 65 to 74 Years | 4 (9.1%) | 4 (6.1%) |
| 75 Years and over | 22 (55.0%) | 6 (12.8%) |
Disability Class: Vision Difficulty
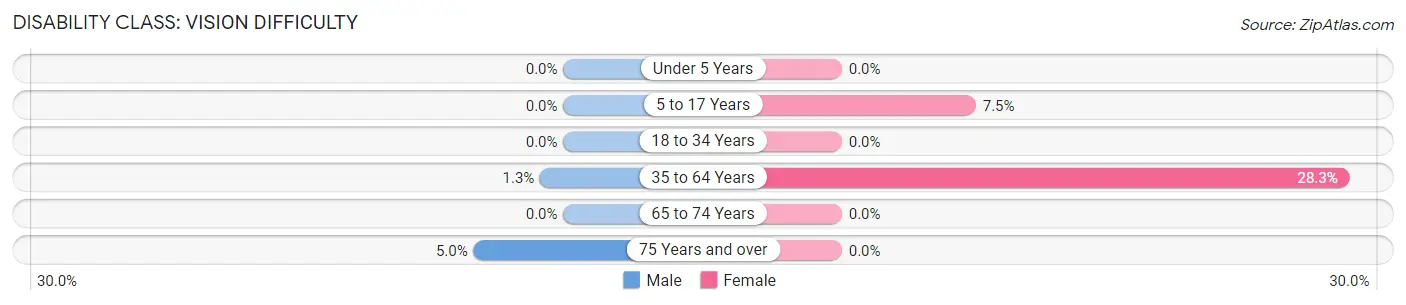
| Age Bracket | Male | Female |
| Under 5 Years | 0 (0.0%) | 0 (0.0%) |
| 5 to 17 Years | 0 (0.0%) | 5 (7.5%) |
| 18 to 34 Years | 0 (0.0%) | 0 (0.0%) |
| 35 to 64 Years | 4 (1.3%) | 121 (28.3%) |
| 65 to 74 Years | 0 (0.0%) | 0 (0.0%) |
| 75 Years and over | 2 (5.0%) | 0 (0.0%) |
Disability Class: Cognitive Difficulty
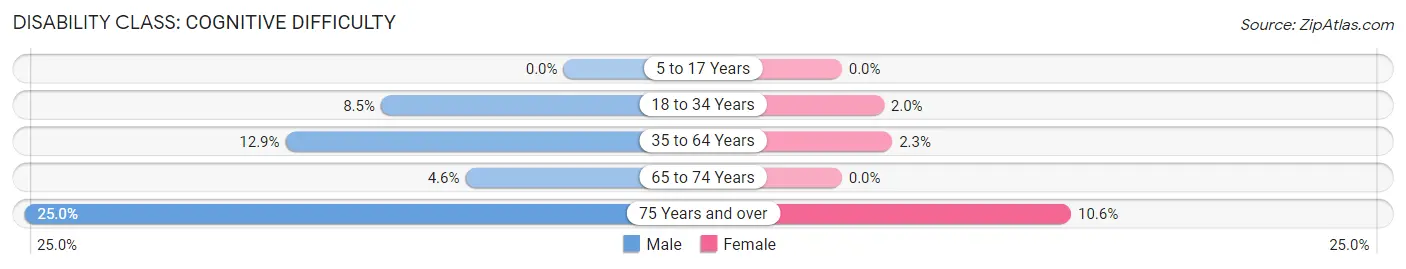
| Age Bracket | Male | Female |
| 5 to 17 Years | 0 (0.0%) | 0 (0.0%) |
| 18 to 34 Years | 21 (8.5%) | 4 (1.9%) |
| 35 to 64 Years | 40 (12.9%) | 10 (2.3%) |
| 65 to 74 Years | 2 (4.5%) | 0 (0.0%) |
| 75 Years and over | 10 (25.0%) | 5 (10.6%) |
Disability Class: Ambulatory Difficulty
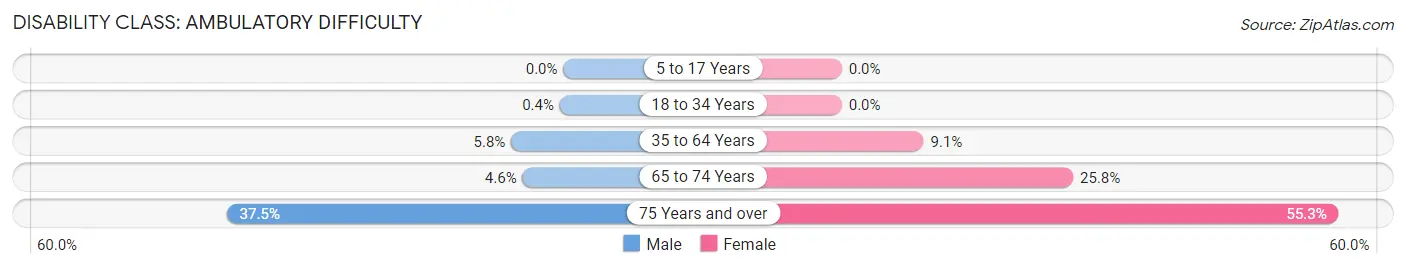
| Age Bracket | Male | Female |
| 5 to 17 Years | 0 (0.0%) | 0 (0.0%) |
| 18 to 34 Years | 1 (0.4%) | 0 (0.0%) |
| 35 to 64 Years | 18 (5.8%) | 39 (9.1%) |
| 65 to 74 Years | 2 (4.5%) | 17 (25.8%) |
| 75 Years and over | 15 (37.5%) | 26 (55.3%) |
Disability Class: Self-Care Difficulty
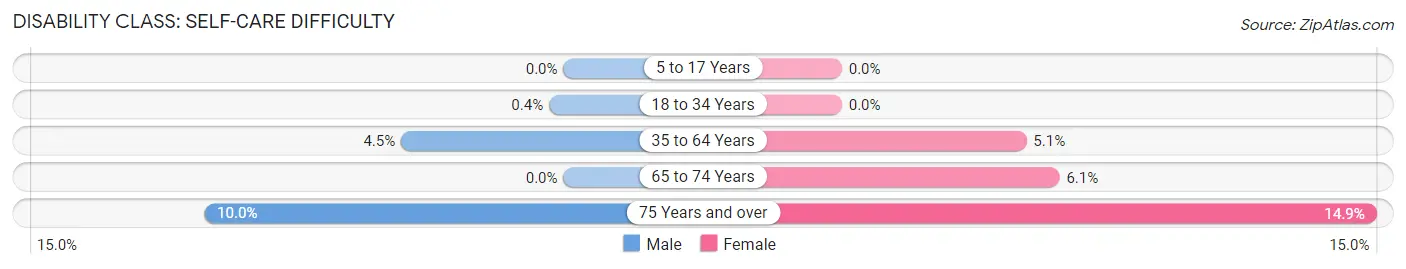
| Age Bracket | Male | Female |
| 5 to 17 Years | 0 (0.0%) | 0 (0.0%) |
| 18 to 34 Years | 1 (0.4%) | 0 (0.0%) |
| 35 to 64 Years | 14 (4.5%) | 22 (5.1%) |
| 65 to 74 Years | 0 (0.0%) | 4 (6.1%) |
| 75 Years and over | 4 (10.0%) | 7 (14.9%) |
Technology Access in Walnut Grove
Computing Device Access in Walnut Grove
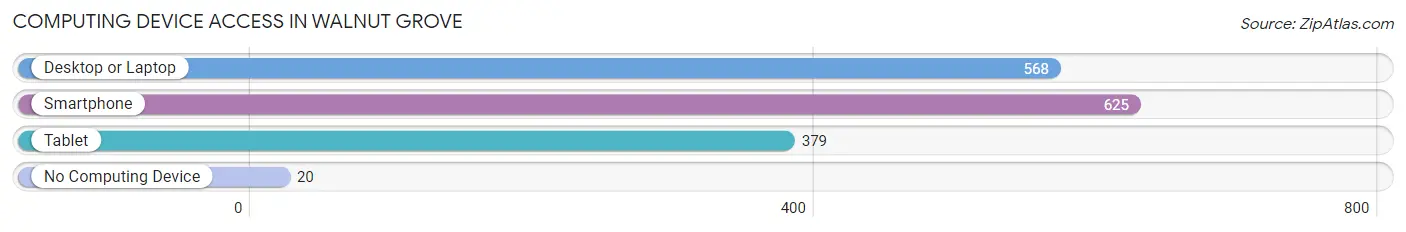
| Device Type | # Households | % Households |
| Desktop or Laptop | 568 | 82.4% |
| Smartphone | 625 | 90.7% |
| Tablet | 379 | 55.0% |
| No Computing Device | 20 | 2.9% |
| Total | 689 | 100.0% |
Internet Access in Walnut Grove
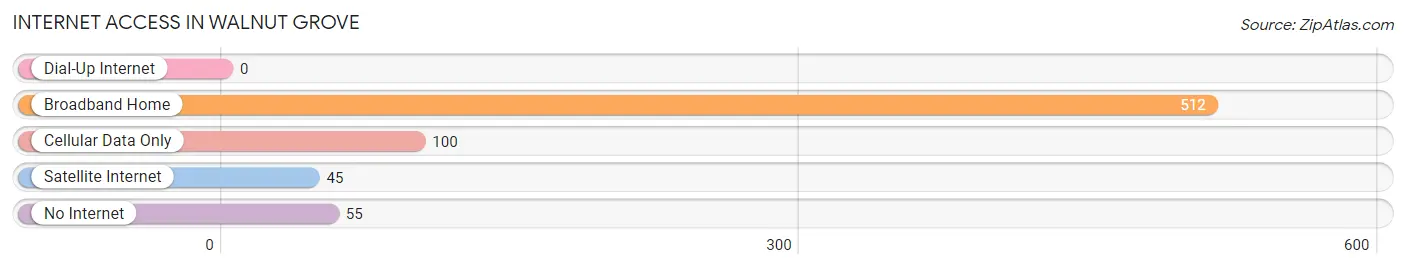
| Internet Type | # Households | % Households |
| Dial-Up Internet | 0 | 0.0% |
| Broadband Home | 512 | 74.3% |
| Cellular Data Only | 100 | 14.5% |
| Satellite Internet | 45 | 6.5% |
| No Internet | 55 | 8.0% |
| Total | 689 | 100.0% |
Walnut Grove Summary
Walnut Grove is a small town located in Walton County, Georgia, United States. It is situated about 40 miles east of Atlanta and is part of the Atlanta metropolitan area. The population of Walnut Grove was 1,845 at the 2010 census.
History
Walnut Grove was founded in 1820 by a group of settlers from North Carolina. The town was named after the abundance of walnut trees in the area. The town was incorporated in 1883 and was the county seat of Walton County until the county seat was moved to Monroe in 1891.
Walnut Grove was a small agricultural community until the 1950s when the town began to experience rapid growth due to the expansion of the Atlanta metropolitan area. The town has since become a bedroom community for Atlanta and the surrounding area.
Geography
Walnut Grove is located at 33°51'25" North, 83°45'17" West (33.857, -83.755). The town is situated in the foothills of the Blue Ridge Mountains and is part of the Piedmont region of Georgia. The town is located about 40 miles east of Atlanta and is part of the Atlanta metropolitan area.
The town has a total area of 2.2 square miles, all of which is land. The town is located along the Apalachee River and is surrounded by rolling hills and forests.
Economy
The economy of Walnut Grove is largely based on agriculture and tourism. The town is home to several farms that produce a variety of crops, including corn, soybeans, and cotton. The town is also home to several wineries and vineyards that produce a variety of wines.
The town is also home to several small businesses, including restaurants, shops, and other services. The town is also home to several manufacturing companies that produce a variety of products, including furniture, clothing, and electronics.
Demographics
As of the 2010 census, the population of Walnut Grove was 1,845. The racial makeup of the town was 79.2% White, 16.2% African American, 0.7% Native American, 0.7% Asian, 0.1% Pacific Islander, 1.2% from other races, and 2.0% from two or more races. Hispanic or Latino of any race were 3.2% of the population.
The median income for a household in the town was $41,250, and the median income for a family was $50,000. The per capita income for the town was $20,845. About 11.2% of families and 14.2% of the population were below the poverty line, including 18.2% of those under age 18 and 8.3% of those age 65 or over.
Common Questions
What is Per Capita Income in Walnut Grove?
Per Capita income in Walnut Grove is $32,906.
What is the Median Family Income in Walnut Grove?
Median Family Income in Walnut Grove is $95,938.
What is the Median Household income in Walnut Grove?
Median Household Income in Walnut Grove is $78,750.
What is Income or Wage Gap in Walnut Grove?
Income or Wage Gap in Walnut Grove is 25.2%.
Women in Walnut Grove earn 74.8 cents for every dollar earned by a man.
What is Family Income Deficit in Walnut Grove?
Family Income Deficit in Walnut Grove is $11,364.
Families that are below poverty line in Walnut Grove earn $11,364 less on average than the poverty threshold level.
What is Inequality or Gini Index in Walnut Grove?
Inequality or Gini Index in Walnut Grove is 0.35.
What is the Total Population of Walnut Grove?
Total Population of Walnut Grove is 1,620.
What is the Total Male Population of Walnut Grove?
Total Male Population of Walnut Grove is 778.
What is the Total Female Population of Walnut Grove?
Total Female Population of Walnut Grove is 842.
What is the Ratio of Males per 100 Females in Walnut Grove?
There are 92.40 Males per 100 Females in Walnut Grove.
What is the Ratio of Females per 100 Males in Walnut Grove?
There are 108.23 Females per 100 Males in Walnut Grove.
What is the Median Population Age in Walnut Grove?
Median Population Age in Walnut Grove is 45.2 Years.
What is the Average Family Size in Walnut Grove
Average Family Size in Walnut Grove is 2.8 People.
What is the Average Household Size in Walnut Grove
Average Household Size in Walnut Grove is 2.4 People.
How Large is the Labor Force in Walnut Grove?
There are 975 People in the Labor Forcein in Walnut Grove.
What is the Percentage of People in the Labor Force in Walnut Grove?
69.0% of People are in the Labor Force in Walnut Grove.
What is the Unemployment Rate in Walnut Grove?
Unemployment Rate in Walnut Grove is 3.2%.