Greenville, KY Map & Demographics
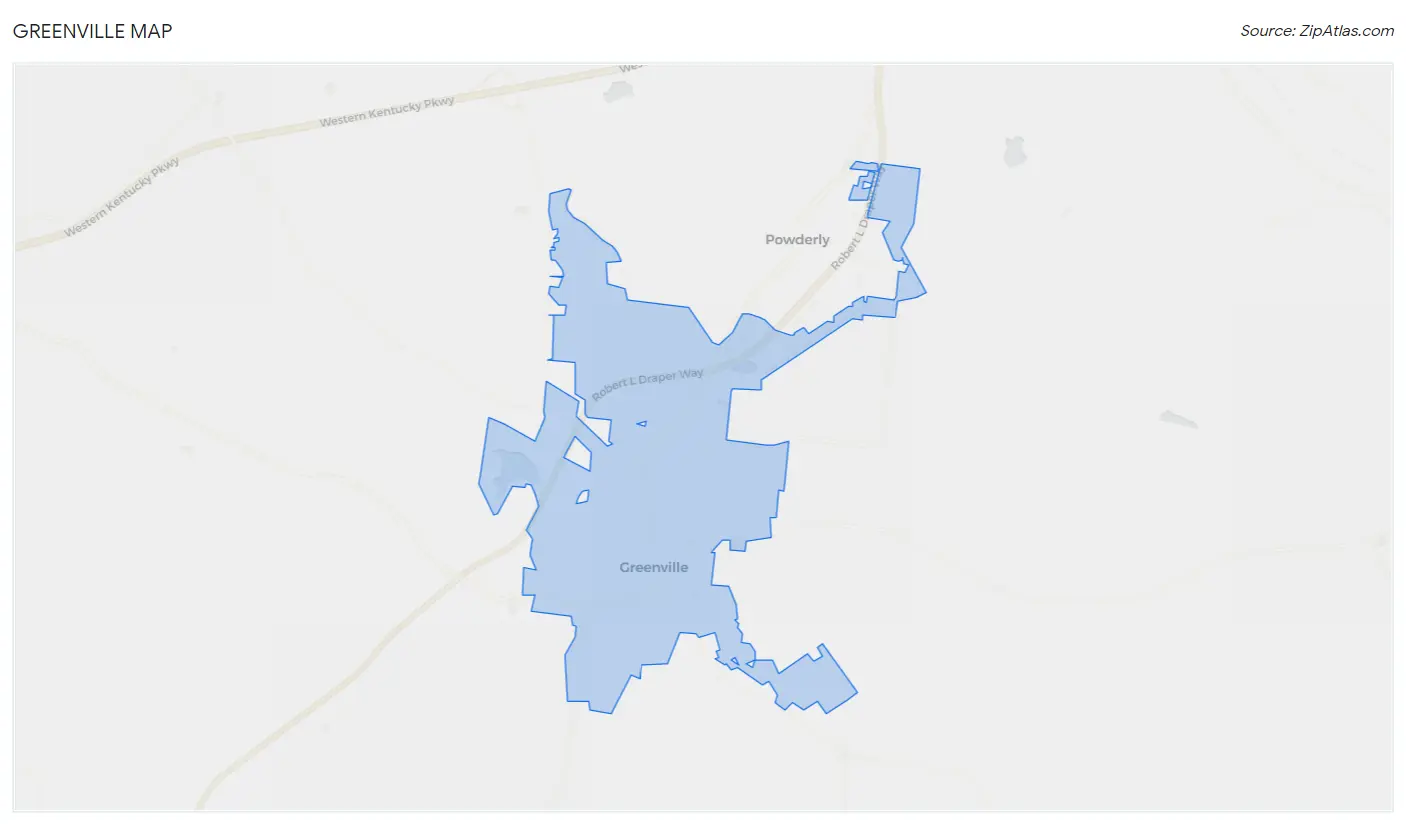
Greenville Map
Greenville Overview
$41,424
PER CAPITA INCOME
$100,536
AVG FAMILY INCOME
$68,984
AVG HOUSEHOLD INCOME
43.1%
WAGE / INCOME GAP [ % ]
56.9¢/ $1
WAGE / INCOME GAP [ $ ]
0.50
INEQUALITY / GINI INDEX
4,463
TOTAL POPULATION
2,294
MALE POPULATION
2,169
FEMALE POPULATION
105.76
MALES / 100 FEMALES
94.55
FEMALES / 100 MALES
45.4
MEDIAN AGE
2.6
AVG FAMILY SIZE
2.1
AVG HOUSEHOLD SIZE
2,100
LABOR FORCE [ PEOPLE ]
54.6%
PERCENT IN LABOR FORCE
4.6%
UNEMPLOYMENT RATE
Greenville Zip Codes
Greenville Area Codes
Income in Greenville
Income Overview in Greenville
Per Capita Income in Greenville is $41,424, while median incomes of families and households are $100,536 and $68,984 respectively.
| Characteristic | Number | Measure |
| Per Capita Income | 4,463 | $41,424 |
| Median Family Income | 1,221 | $100,536 |
| Mean Family Income | 1,221 | $134,161 |
| Median Household Income | 1,923 | $68,984 |
| Mean Household Income | 1,923 | $98,343 |
| Income Deficit | 1,221 | $0 |
| Wage / Income Gap (%) | 4,463 | 43.07% |
| Wage / Income Gap ($) | 4,463 | 56.93¢ per $1 |
| Gini / Inequality Index | 4,463 | 0.50 |
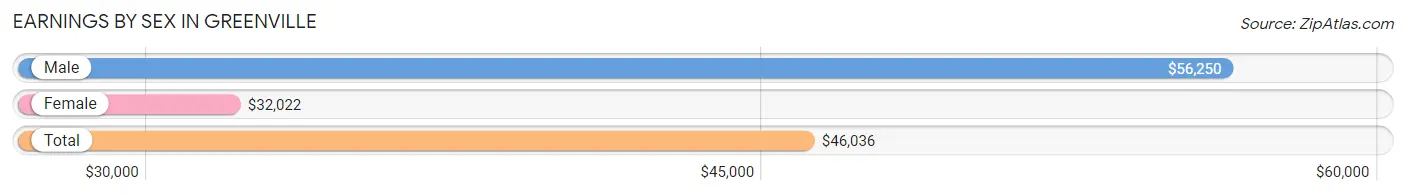
Earnings by Sex in Greenville
Average Earnings in Greenville are $46,036, $56,250 for men and $32,022 for women, a difference of 43.1%.
| Sex | Number | Average Earnings |
| Male | 1,304 (57.7%) | $56,250 |
| Female | 955 (42.3%) | $32,022 |
| Total | 2,259 (100.0%) | $46,036 |
Earnings by Sex by Income Bracket in Greenville
The most common earnings brackets in Greenville are $100,000+ for men (346 | 26.5%) and $50,000 to $54,999 for women (125 | 13.1%).
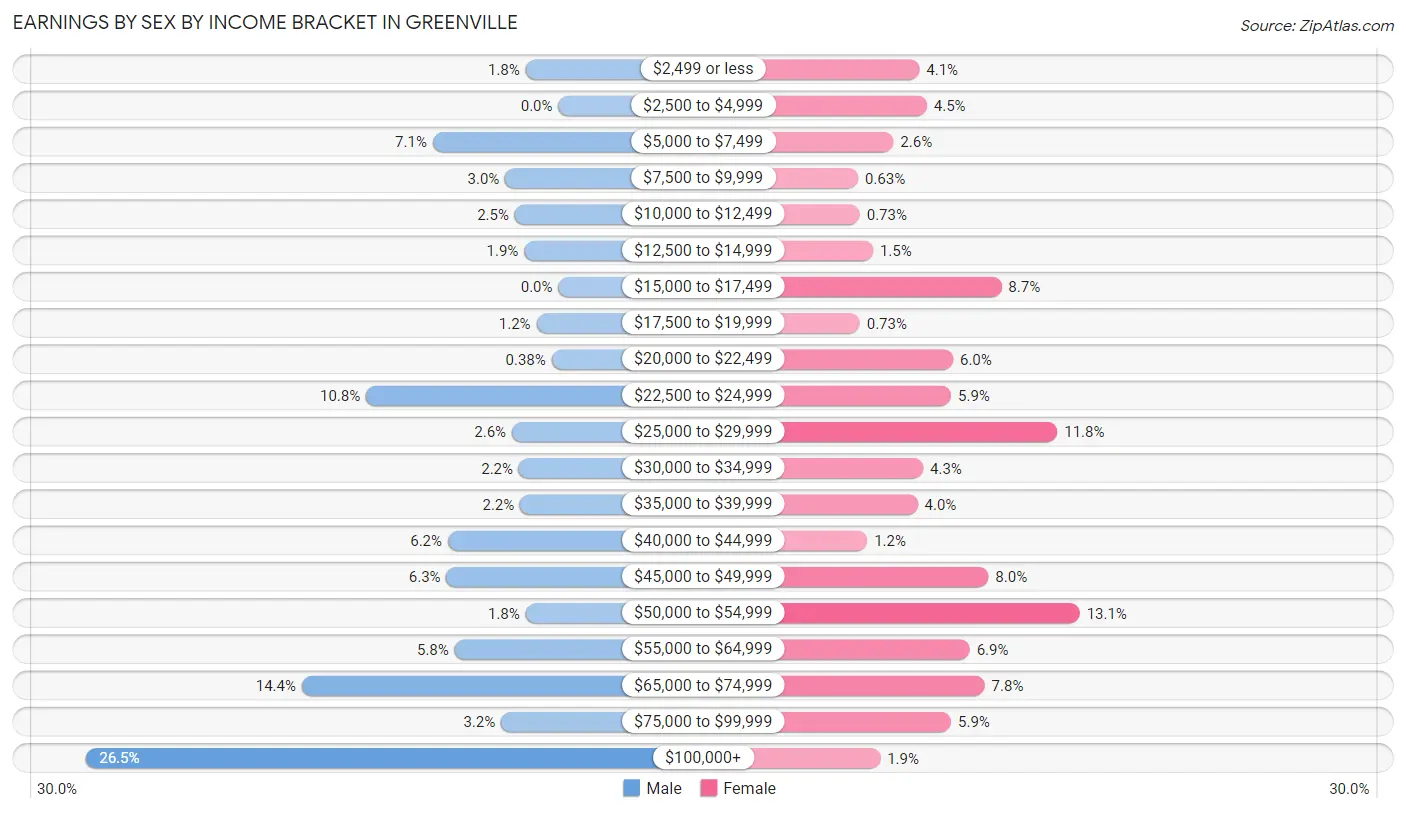
| Income | Male | Female |
| $2,499 or less | 24 (1.8%) | 39 (4.1%) |
| $2,500 to $4,999 | 0 (0.0%) | 43 (4.5%) |
| $5,000 to $7,499 | 92 (7.1%) | 25 (2.6%) |
| $7,500 to $9,999 | 39 (3.0%) | 6 (0.6%) |
| $10,000 to $12,499 | 32 (2.5%) | 7 (0.7%) |
| $12,500 to $14,999 | 25 (1.9%) | 14 (1.5%) |
| $15,000 to $17,499 | 0 (0.0%) | 83 (8.7%) |
| $17,500 to $19,999 | 16 (1.2%) | 7 (0.7%) |
| $20,000 to $22,499 | 5 (0.4%) | 57 (6.0%) |
| $22,500 to $24,999 | 141 (10.8%) | 56 (5.9%) |
| $25,000 to $29,999 | 34 (2.6%) | 113 (11.8%) |
| $30,000 to $34,999 | 29 (2.2%) | 41 (4.3%) |
| $35,000 to $39,999 | 28 (2.1%) | 38 (4.0%) |
| $40,000 to $44,999 | 81 (6.2%) | 11 (1.1%) |
| $45,000 to $49,999 | 82 (6.3%) | 76 (8.0%) |
| $50,000 to $54,999 | 24 (1.8%) | 125 (13.1%) |
| $55,000 to $64,999 | 76 (5.8%) | 66 (6.9%) |
| $65,000 to $74,999 | 188 (14.4%) | 74 (7.7%) |
| $75,000 to $99,999 | 42 (3.2%) | 56 (5.9%) |
| $100,000+ | 346 (26.5%) | 18 (1.9%) |
| Total | 1,304 (100.0%) | 955 (100.0%) |
Earnings by Sex by Educational Attainment in Greenville
Average earnings in Greenville are $63,770 for men and $38,684 for women, a difference of 39.3%. Men with an educational attainment of bachelor's degree enjoy the highest average annual earnings of $145,913, while those with less than high school education earn the least with $13,365. Women with an educational attainment of graduate degree earn the most with the average annual earnings of $54,315, while those with high school diploma education have the smallest earnings of $21,419.
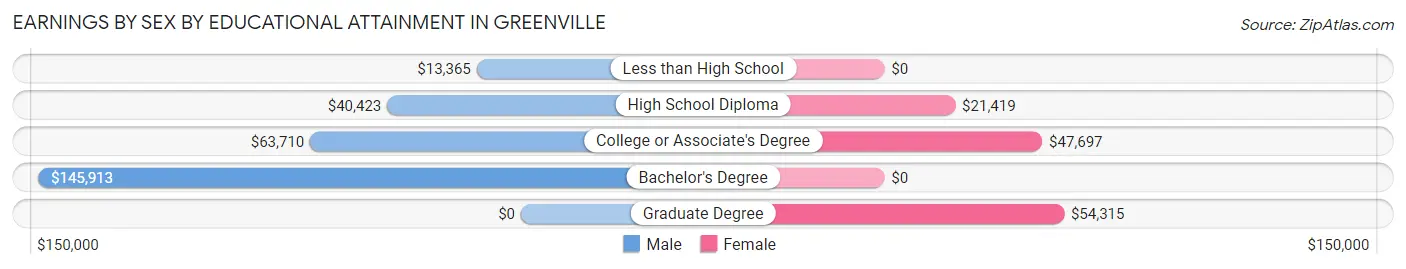
| Educational Attainment | Male Income | Female Income |
| Less than High School | $13,365 | $0 |
| High School Diploma | $40,423 | $21,419 |
| College or Associate's Degree | $63,710 | $47,697 |
| Bachelor's Degree | $145,913 | $0 |
| Graduate Degree | - | - |
| Total | $63,770 | $38,684 |
Family Income in Greenville
Family Income Brackets in Greenville
According to the Greenville family income data, there are 339 families falling into the $200,000+ income range, which is the most common income bracket and makes up 27.8% of all families. Conversely, the $15,000 to $24,999 income bracket is the least frequent group with only 22 families (1.8%) belonging to this category.
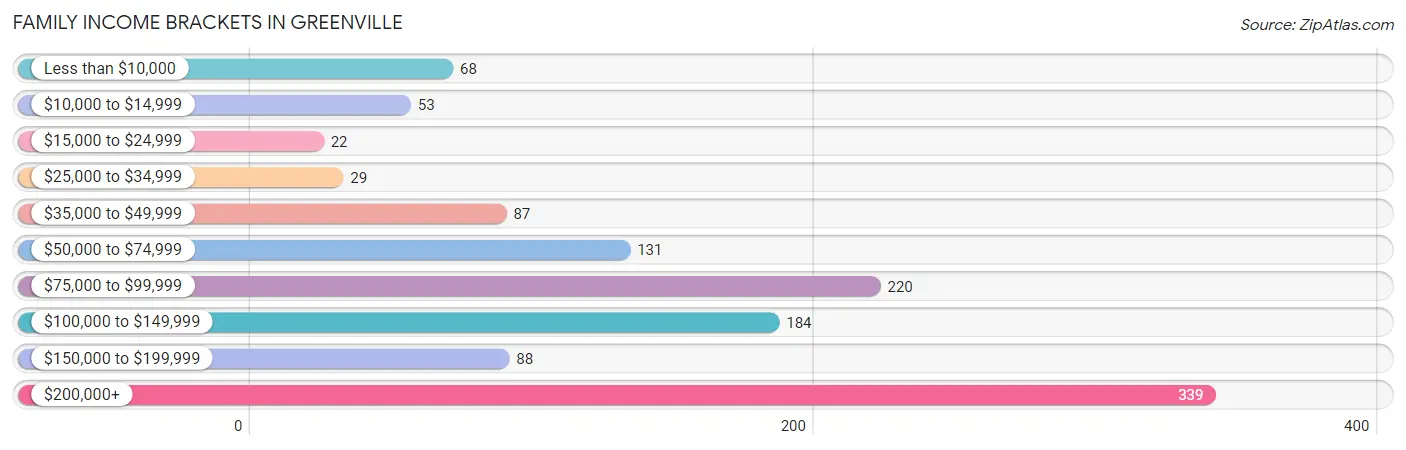
| Income Bracket | # Families | % Families |
| Less than $10,000 | 68 | 5.6% |
| $10,000 to $14,999 | 53 | 4.3% |
| $15,000 to $24,999 | 22 | 1.8% |
| $25,000 to $34,999 | 29 | 2.4% |
| $35,000 to $49,999 | 87 | 7.1% |
| $50,000 to $74,999 | 131 | 10.7% |
| $75,000 to $99,999 | 220 | 18.0% |
| $100,000 to $149,999 | 184 | 15.1% |
| $150,000 to $199,999 | 88 | 7.2% |
| $200,000+ | 339 | 27.8% |
Family Income by Famaliy Size in Greenville
5-person families (56 | 4.6%) account for the highest median family income in Greenville with $158,869 per family, while 2-person families (795 | 65.1%) have the highest median income of $53,986 per family member.
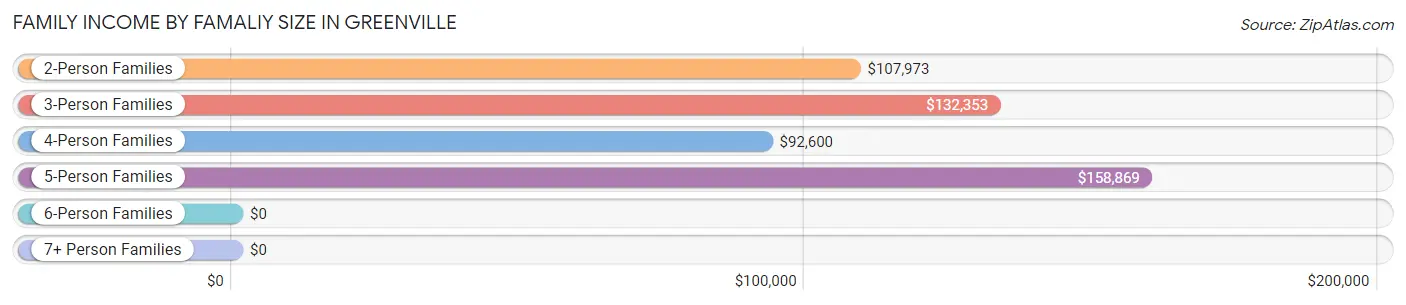
| Income Bracket | # Families | Median Income |
| 2-Person Families | 795 (65.1%) | $107,973 |
| 3-Person Families | 190 (15.6%) | $132,353 |
| 4-Person Families | 158 (12.9%) | $92,600 |
| 5-Person Families | 56 (4.6%) | $158,869 |
| 6-Person Families | 6 (0.5%) | $0 |
| 7+ Person Families | 16 (1.3%) | $0 |
| Total | 1,221 (100.0%) | $100,536 |
Family Income by Number of Earners in Greenville
The median family income in Greenville is $100,536, with families comprising 3+ earners (32) having the highest median family income of $166,528, while families with no earners (180) have the lowest median family income of $38,100, accounting for 2.6% and 14.7% of families, respectively.
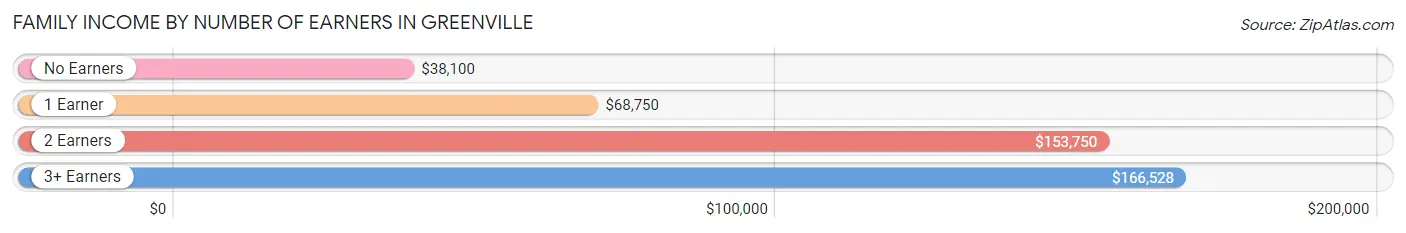
| Number of Earners | # Families | Median Income |
| No Earners | 180 (14.7%) | $38,100 |
| 1 Earner | 271 (22.2%) | $68,750 |
| 2 Earners | 738 (60.4%) | $153,750 |
| 3+ Earners | 32 (2.6%) | $166,528 |
| Total | 1,221 (100.0%) | $100,536 |
Household Income in Greenville
Household Income Brackets in Greenville
With 340 households falling in the category, the $200,000+ income range is the most frequent in Greenville, accounting for 17.7% of all households. In contrast, only 92 households (4.8%) fall into the $15,000 to $24,999 income bracket, making it the least populous group.
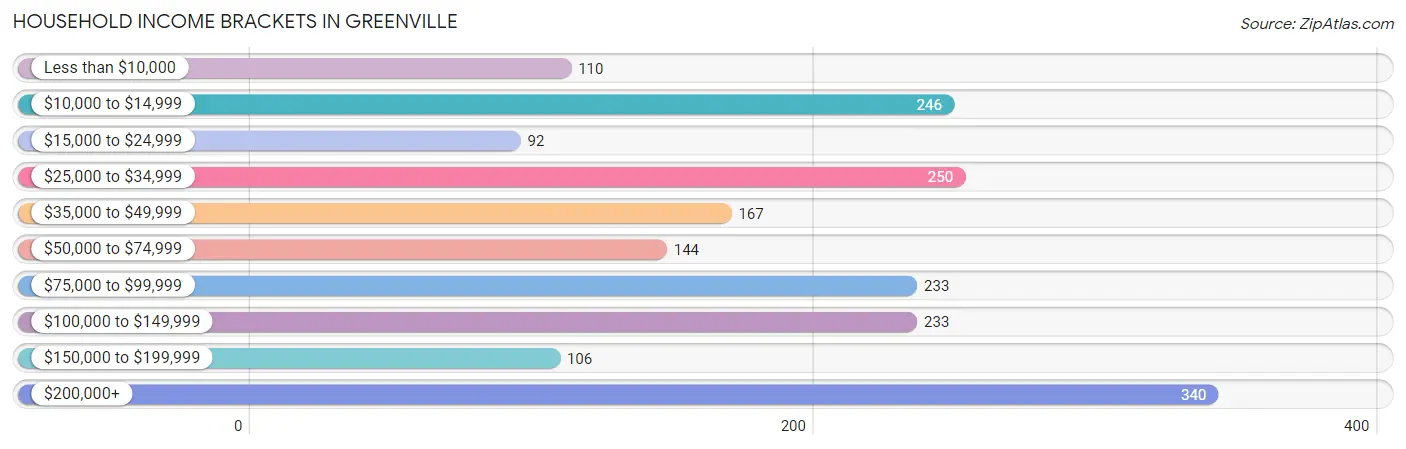
| Income Bracket | # Households | % Households |
| Less than $10,000 | 110 | 5.7% |
| $10,000 to $14,999 | 246 | 12.8% |
| $15,000 to $24,999 | 92 | 4.8% |
| $25,000 to $34,999 | 250 | 13.0% |
| $35,000 to $49,999 | 167 | 8.7% |
| $50,000 to $74,999 | 144 | 7.5% |
| $75,000 to $99,999 | 233 | 12.1% |
| $100,000 to $149,999 | 233 | 12.1% |
| $150,000 to $199,999 | 106 | 5.5% |
| $200,000+ | 340 | 17.7% |
Household Income by Householder Age in Greenville
The median household income in Greenville is $68,984, with the highest median household income of $108,968 found in the 45 to 64 years age bracket for the primary householder. A total of 848 households (44.1%) fall into this category. Meanwhile, the 15 to 24 years age bracket for the primary householder has the lowest median household income of $0, with 31 households (1.6%) in this group.
| Income Bracket | # Households | Median Income |
| 15 to 24 Years | 31 (1.6%) | $0 |
| 25 to 44 Years | 486 (25.3%) | $70,313 |
| 45 to 64 Years | 848 (44.1%) | $108,968 |
| 65+ Years | 558 (29.0%) | $31,867 |
| Total | 1,923 (100.0%) | $68,984 |
Poverty in Greenville
Income Below Poverty by Sex and Age in Greenville
With 17.2% poverty level for males and 20.1% for females among the residents of Greenville, 16 and 17 year old males and 18 to 24 year old females are the most vulnerable to poverty, with 94 males (74.0%) and 43 females (58.1%) in their respective age groups living below the poverty level.
| Age Bracket | Male | Female |
| Under 5 Years | 0 (0.0%) | 0 (0.0%) |
| 5 Years | 0 (0.0%) | 9 (33.3%) |
| 6 to 11 Years | 49 (27.1%) | 8 (4.1%) |
| 12 to 14 Years | 0 (0.0%) | 0 (0.0%) |
| 15 Years | 0 (0.0%) | 0 (0.0%) |
| 16 and 17 Years | 94 (74.0%) | 0 (0.0%) |
| 18 to 24 Years | 24 (21.2%) | 43 (58.1%) |
| 25 to 34 Years | 83 (24.7%) | 10 (2.6%) |
| 35 to 44 Years | 32 (22.5%) | 63 (33.3%) |
| 45 to 54 Years | 8 (1.8%) | 74 (32.5%) |
| 55 to 64 Years | 19 (7.4%) | 84 (25.4%) |
| 65 to 74 Years | 35 (18.7%) | 48 (23.6%) |
| 75 Years and over | 1 (1.3%) | 64 (22.9%) |
| Total | 345 (17.2%) | 403 (20.1%) |
Income Above Poverty by Sex and Age in Greenville
According to the poverty statistics in Greenville, males aged under 5 years and females aged under 5 years are the age groups that are most secure financially, with 100.0% of males and 100.0% of females in these age groups living above the poverty line.
| Age Bracket | Male | Female |
| Under 5 Years | 73 (100.0%) | 66 (100.0%) |
| 5 Years | 0 (0.0%) | 18 (66.7%) |
| 6 to 11 Years | 132 (72.9%) | 188 (95.9%) |
| 12 to 14 Years | 70 (100.0%) | 0 (0.0%) |
| 15 Years | 0 (0.0%) | 3 (100.0%) |
| 16 and 17 Years | 33 (26.0%) | 25 (100.0%) |
| 18 to 24 Years | 89 (78.8%) | 31 (41.9%) |
| 25 to 34 Years | 253 (75.3%) | 372 (97.4%) |
| 35 to 44 Years | 110 (77.5%) | 126 (66.7%) |
| 45 to 54 Years | 434 (98.2%) | 154 (67.5%) |
| 55 to 64 Years | 239 (92.6%) | 247 (74.6%) |
| 65 to 74 Years | 152 (81.3%) | 155 (76.3%) |
| 75 Years and over | 73 (98.7%) | 216 (77.1%) |
| Total | 1,658 (82.8%) | 1,601 (79.9%) |
Income Below Poverty Among Married-Couple Families in Greenville
The poverty statistics for married-couple families in Greenville show that 7.2% or 75 of the total 1,044 families live below the poverty line. Families with 1 or 2 children have the highest poverty rate of 16.9%, comprising of 56 families. On the other hand, families with 3 or 4 children have the lowest poverty rate of 0.0%, which includes 0 families.
| Children | Above Poverty | Below Poverty |
| No Children | 672 (97.3%) | 19 (2.8%) |
| 1 or 2 Children | 275 (83.1%) | 56 (16.9%) |
| 3 or 4 Children | 6 (100.0%) | 0 (0.0%) |
| 5 or more Children | 16 (100.0%) | 0 (0.0%) |
| Total | 969 (92.8%) | 75 (7.2%) |
Income Below Poverty Among Single-Parent Households in Greenville
According to the poverty data in Greenville, 46.2% or 6 single-father households and 37.2% or 61 single-mother households are living below the poverty line. Among single-father households, those with 1 or 2 children have the highest poverty rate, with 6 households (100.0%) experiencing poverty. Likewise, among single-mother households, those with 1 or 2 children have the highest poverty rate, with 46 households (62.2%) falling below the poverty line.
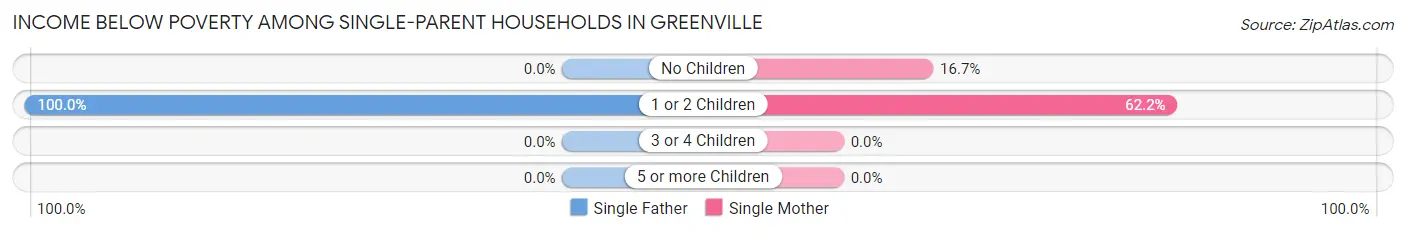
| Children | Single Father | Single Mother |
| No Children | 0 (0.0%) | 15 (16.7%) |
| 1 or 2 Children | 6 (100.0%) | 46 (62.2%) |
| 3 or 4 Children | 0 (0.0%) | 0 (0.0%) |
| 5 or more Children | 0 (0.0%) | 0 (0.0%) |
| Total | 6 (46.2%) | 61 (37.2%) |
Income Below Poverty Among Married-Couple vs Single-Parent Households in Greenville
The poverty data for Greenville shows that 75 of the married-couple family households (7.2%) and 67 of the single-parent households (37.9%) are living below the poverty level. Within the married-couple family households, those with 1 or 2 children have the highest poverty rate, with 56 households (16.9%) falling below the poverty line. Among the single-parent households, those with 1 or 2 children have the highest poverty rate, with 52 household (65.0%) living below poverty.
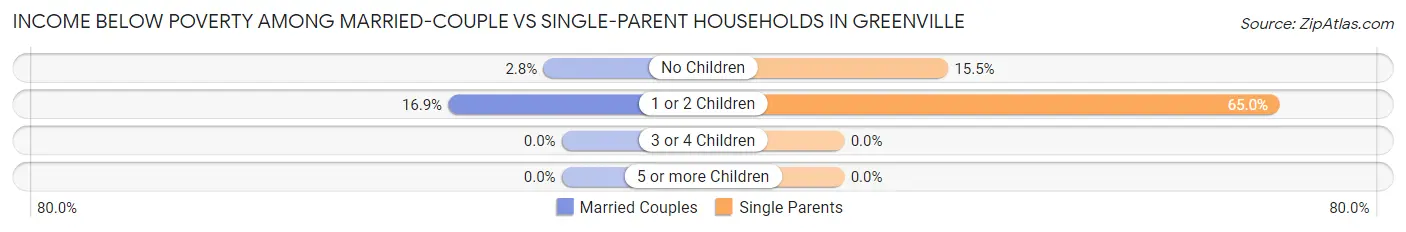
| Children | Married-Couple Families | Single-Parent Households |
| No Children | 19 (2.8%) | 15 (15.5%) |
| 1 or 2 Children | 56 (16.9%) | 52 (65.0%) |
| 3 or 4 Children | 0 (0.0%) | 0 (0.0%) |
| 5 or more Children | 0 (0.0%) | 0 (0.0%) |
| Total | 75 (7.2%) | 67 (37.9%) |
Race in Greenville
The most populous races in Greenville are White / Caucasian (3,552 | 79.6%), Two or more Races (326 | 7.3%), and Asian (304 | 6.8%).
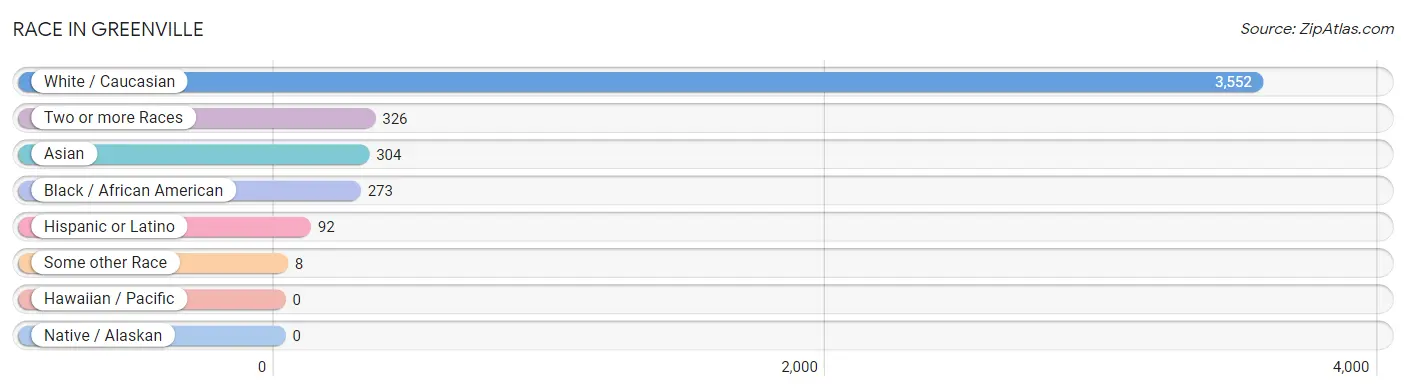
| Race | # Population | % Population |
| Asian | 304 | 6.8% |
| Black / African American | 273 | 6.1% |
| Hawaiian / Pacific | 0 | 0.0% |
| Hispanic or Latino | 92 | 2.1% |
| Native / Alaskan | 0 | 0.0% |
| White / Caucasian | 3,552 | 79.6% |
| Two or more Races | 326 | 7.3% |
| Some other Race | 8 | 0.2% |
| Total | 4,463 | 100.0% |
Ancestry in Greenville
The most populous ancestries reported in Greenville are Irish (535 | 12.0%), American (496 | 11.1%), English (402 | 9.0%), German (393 | 8.8%), and Filipino (293 | 6.6%), together accounting for 47.5% of all Greenville residents.
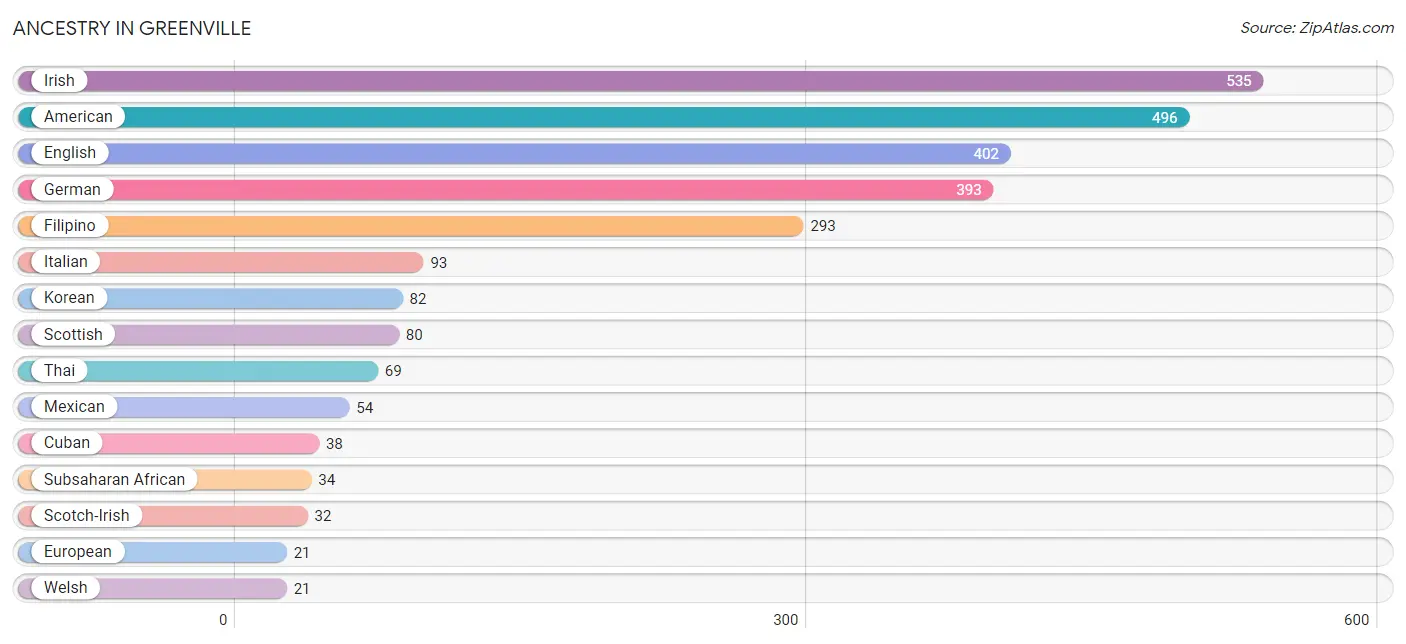
| Ancestry | # Population | % Population |
| African | 8 | 0.2% |
| American | 496 | 11.1% |
| British | 15 | 0.3% |
| Croatian | 6 | 0.1% |
| Cuban | 38 | 0.9% |
| Czech | 3 | 0.1% |
| Dutch | 3 | 0.1% |
| English | 402 | 9.0% |
| European | 21 | 0.5% |
| Filipino | 293 | 6.6% |
| French | 17 | 0.4% |
| German | 393 | 8.8% |
| Irish | 535 | 12.0% |
| Italian | 93 | 2.1% |
| Korean | 82 | 1.8% |
| Mexican | 54 | 1.2% |
| Nigerian | 2 | 0.0% |
| Northern European | 18 | 0.4% |
| Scotch-Irish | 32 | 0.7% |
| Scottish | 80 | 1.8% |
| Subsaharan African | 34 | 0.8% |
| Thai | 69 | 1.5% |
| Welsh | 21 | 0.5% | View All 23 Rows |
Immigrants in Greenville
The most numerous immigrant groups reported in Greenville came from Asia (336 | 7.5%), China (293 | 6.6%), Eastern Asia (293 | 6.6%), Taiwan (293 | 6.6%), and South Central Asia (43 | 1.0%), together accounting for 28.2% of all Greenville residents.
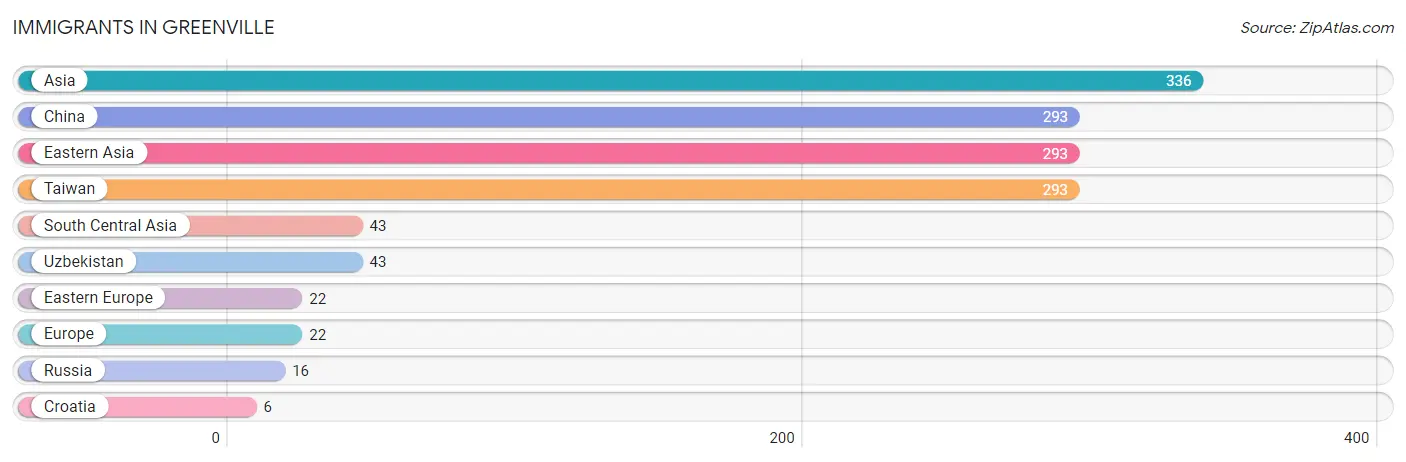
| Immigration Origin | # Population | % Population |
| Asia | 336 | 7.5% |
| China | 293 | 6.6% |
| Croatia | 6 | 0.1% |
| Eastern Asia | 293 | 6.6% |
| Eastern Europe | 22 | 0.5% |
| Europe | 22 | 0.5% |
| Russia | 16 | 0.4% |
| South Central Asia | 43 | 1.0% |
| Taiwan | 293 | 6.6% |
| Uzbekistan | 43 | 1.0% | View All 10 Rows |
Sex and Age in Greenville
Sex and Age in Greenville
The most populous age groups in Greenville are 50 to 54 Years (395 | 17.2%) for men and 55 to 59 Years (267 | 12.3%) for women.
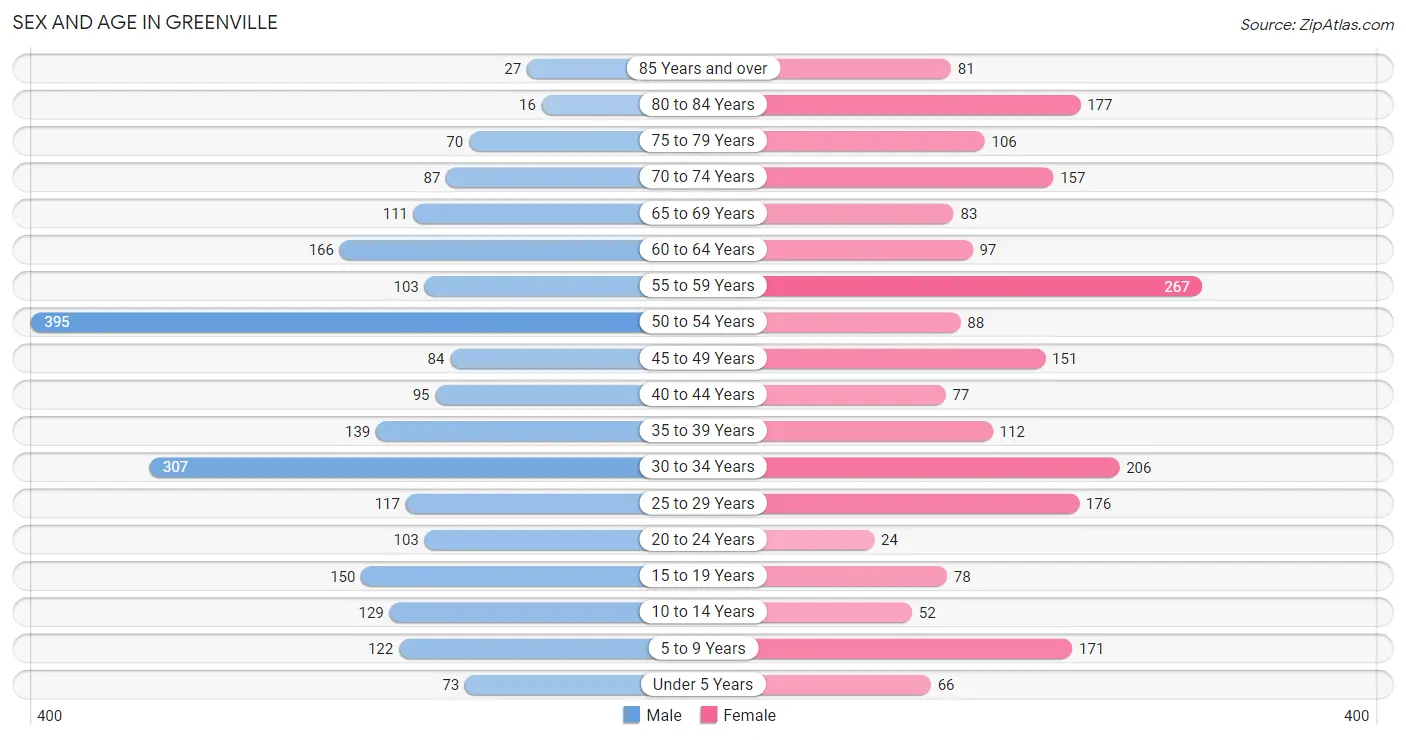
| Age Bracket | Male | Female |
| Under 5 Years | 73 (3.2%) | 66 (3.0%) |
| 5 to 9 Years | 122 (5.3%) | 171 (7.9%) |
| 10 to 14 Years | 129 (5.6%) | 52 (2.4%) |
| 15 to 19 Years | 150 (6.5%) | 78 (3.6%) |
| 20 to 24 Years | 103 (4.5%) | 24 (1.1%) |
| 25 to 29 Years | 117 (5.1%) | 176 (8.1%) |
| 30 to 34 Years | 307 (13.4%) | 206 (9.5%) |
| 35 to 39 Years | 139 (6.1%) | 112 (5.2%) |
| 40 to 44 Years | 95 (4.1%) | 77 (3.5%) |
| 45 to 49 Years | 84 (3.7%) | 151 (7.0%) |
| 50 to 54 Years | 395 (17.2%) | 88 (4.1%) |
| 55 to 59 Years | 103 (4.5%) | 267 (12.3%) |
| 60 to 64 Years | 166 (7.2%) | 97 (4.5%) |
| 65 to 69 Years | 111 (4.8%) | 83 (3.8%) |
| 70 to 74 Years | 87 (3.8%) | 157 (7.2%) |
| 75 to 79 Years | 70 (3.0%) | 106 (4.9%) |
| 80 to 84 Years | 16 (0.7%) | 177 (8.2%) |
| 85 Years and over | 27 (1.2%) | 81 (3.7%) |
| Total | 2,294 (100.0%) | 2,169 (100.0%) |
Families and Households in Greenville
Median Family Size in Greenville
The median family size in Greenville is 2.59 persons per family, with single male/father families (13 | 1.1%) accounting for the largest median family size of 3.31 persons per family. On the other hand, single female/mother families (164 | 13.4%) represent the smallest median family size with 2.30 persons per family.
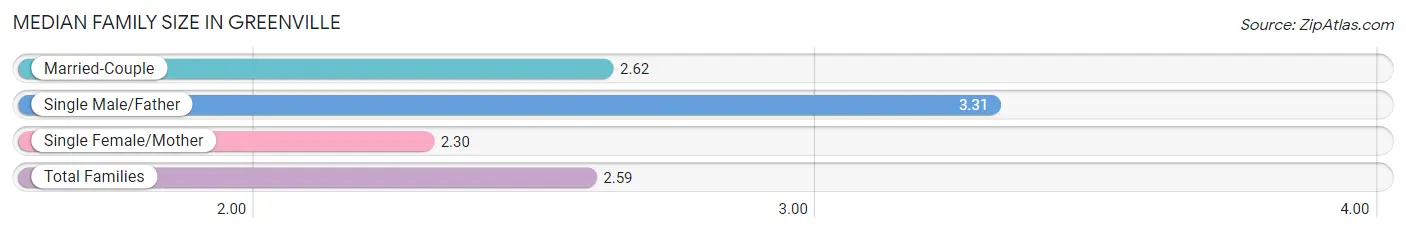
| Family Type | # Families | Family Size |
| Married-Couple | 1,044 (85.5%) | 2.62 |
| Single Male/Father | 13 (1.1%) | 3.31 |
| Single Female/Mother | 164 (13.4%) | 2.30 |
| Total Families | 1,221 (100.0%) | 2.59 |
Median Household Size in Greenville
The median household size in Greenville is 2.07 persons per household, with single male/father households (13 | 0.7%) accounting for the largest median household size of 4.08 persons per household. non-family households (702 | 36.5%) represent the smallest median household size with 1.14 persons per household.
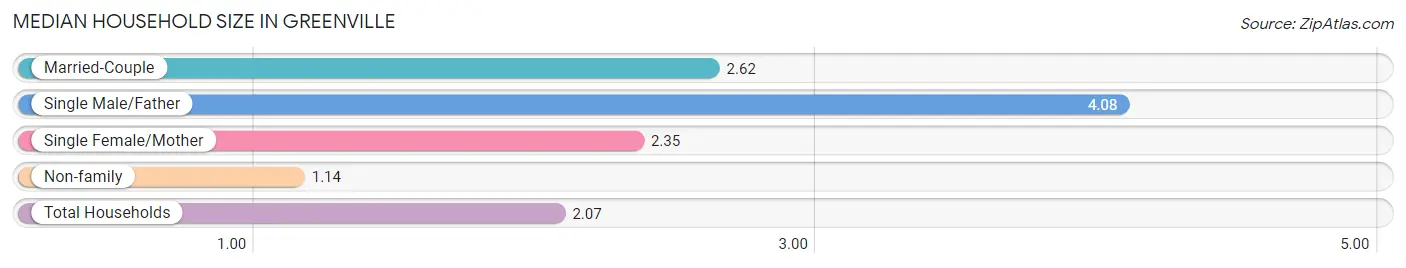
| Household Type | # Households | Household Size |
| Married-Couple | 1,044 (54.3%) | 2.62 |
| Single Male/Father | 13 (0.7%) | 4.08 |
| Single Female/Mother | 164 (8.5%) | 2.35 |
| Non-family | 702 (36.5%) | 1.14 |
| Total Households | 1,923 (100.0%) | 2.07 |
Household Size by Marriage Status in Greenville
Out of a total of 1,923 households in Greenville, 1,221 (63.5%) are family households, while 702 (36.5%) are nonfamily households. The most numerous type of family households are 2-person households, comprising 782, and the most common type of nonfamily households are 1-person households, comprising 597.
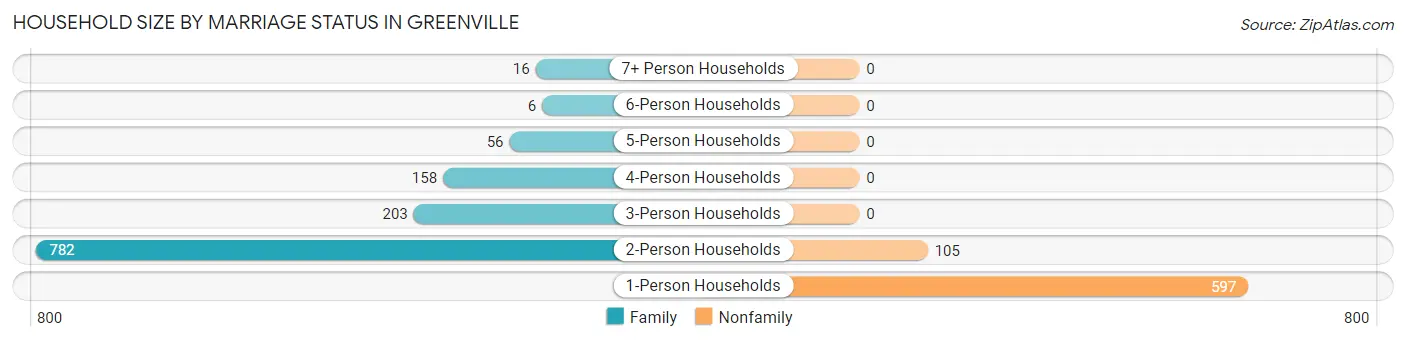
| Household Size | Family Households | Nonfamily Households |
| 1-Person Households | - | 597 (31.0%) |
| 2-Person Households | 782 (40.7%) | 105 (5.5%) |
| 3-Person Households | 203 (10.6%) | 0 (0.0%) |
| 4-Person Households | 158 (8.2%) | 0 (0.0%) |
| 5-Person Households | 56 (2.9%) | 0 (0.0%) |
| 6-Person Households | 6 (0.3%) | 0 (0.0%) |
| 7+ Person Households | 16 (0.8%) | 0 (0.0%) |
| Total | 1,221 (63.5%) | 702 (36.5%) |
Female Fertility in Greenville
Fertility by Age in Greenville
Average fertility rate in Greenville is 102.0 births per 1,000 women. Women in the age bracket of 20 to 34 years have the highest fertility rate with 167.0 births per 1,000 women. Women in the age bracket of 20 to 34 years acount for 80.9% of all women with births.
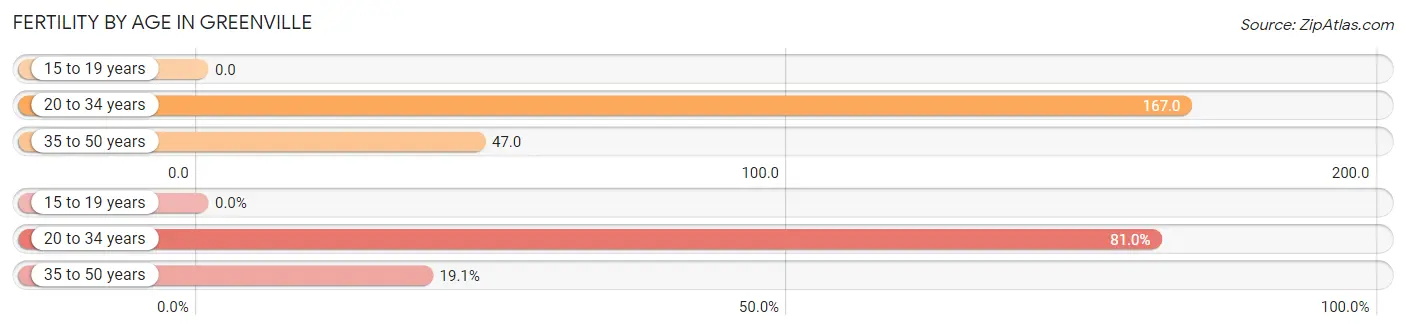
| Age Bracket | Women with Births | Births / 1,000 Women |
| 15 to 19 years | 0 (0.0%) | 0.0 |
| 20 to 34 years | 68 (80.9%) | 167.0 |
| 35 to 50 years | 16 (19.1%) | 47.0 |
| Total | 84 (100.0%) | 102.0 |
Fertility by Age by Marriage Status in Greenville
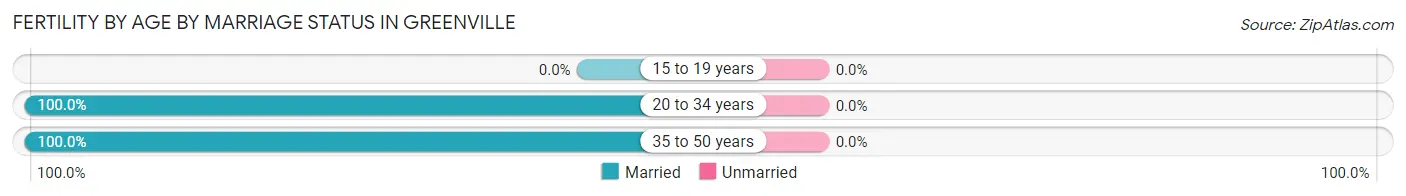
| Age Bracket | Married | Unmarried |
| 15 to 19 years | 0 (0.0%) | 0 (0.0%) |
| 20 to 34 years | 68 (100.0%) | 0 (0.0%) |
| 35 to 50 years | 16 (100.0%) | 0 (0.0%) |
| Total | 84 (100.0%) | 0 (0.0%) |
Fertility by Education in Greenville
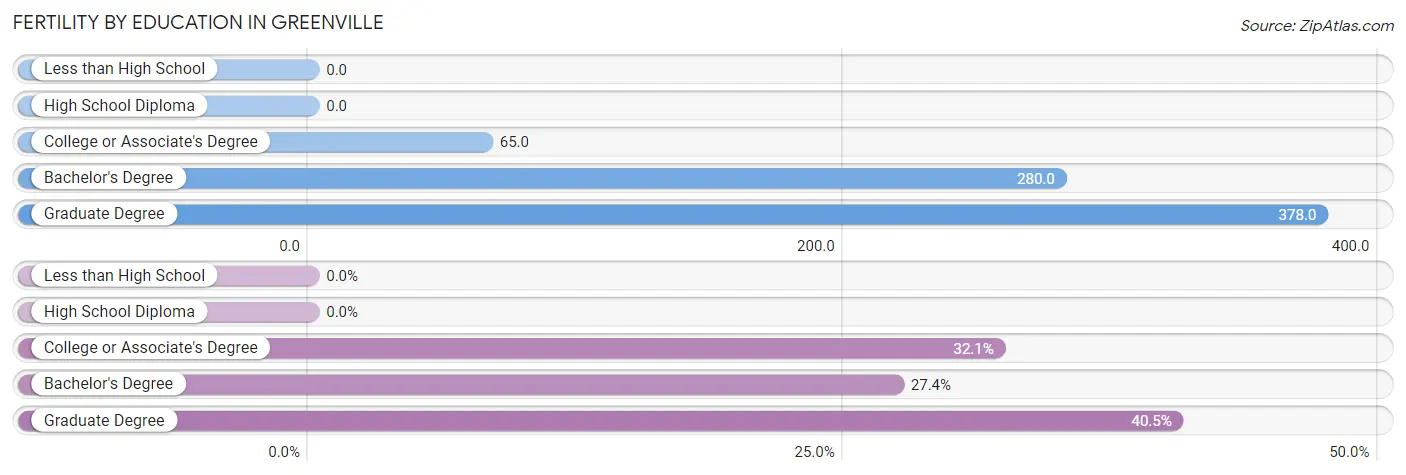
| Educational Attainment | Women with Births | Births / 1,000 Women |
| Less than High School | 0 (0.0%) | 0.0 |
| High School Diploma | 0 (0.0%) | 0.0 |
| College or Associate's Degree | 27 (32.1%) | 65.0 |
| Bachelor's Degree | 23 (27.4%) | 280.0 |
| Graduate Degree | 34 (40.5%) | 378.0 |
| Total | 84 (100.0%) | 102.0 |
Fertility by Education by Marriage Status in Greenville
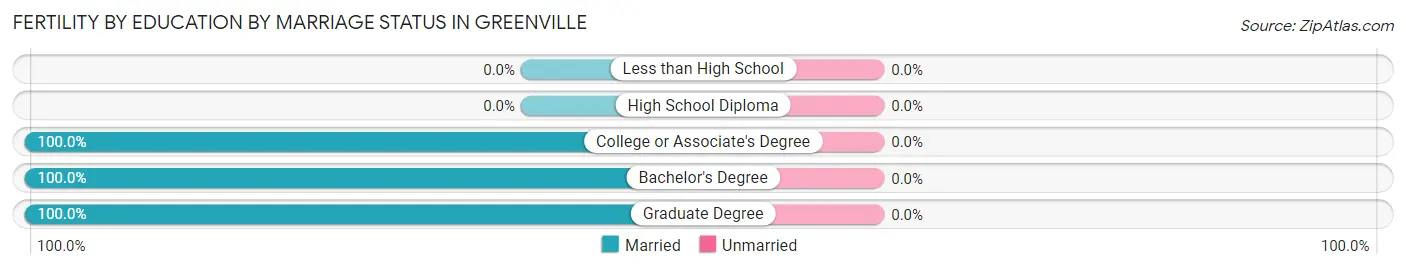
| Educational Attainment | Married | Unmarried |
| Less than High School | 0 (0.0%) | 0 (0.0%) |
| High School Diploma | 0 (0.0%) | 0 (0.0%) |
| College or Associate's Degree | 27 (100.0%) | 0 (0.0%) |
| Bachelor's Degree | 23 (100.0%) | 0 (0.0%) |
| Graduate Degree | 34 (100.0%) | 0 (0.0%) |
| Total | 84 (100.0%) | 0 (0.0%) |
Employment Characteristics in Greenville
Employment by Class of Employer in Greenville
Among the 1,890 employed individuals in Greenville, private company employees (1,416 | 74.9%), not-for-profit organizations (229 | 12.1%), and state government employees (120 | 6.4%) make up the most common classes of employment.
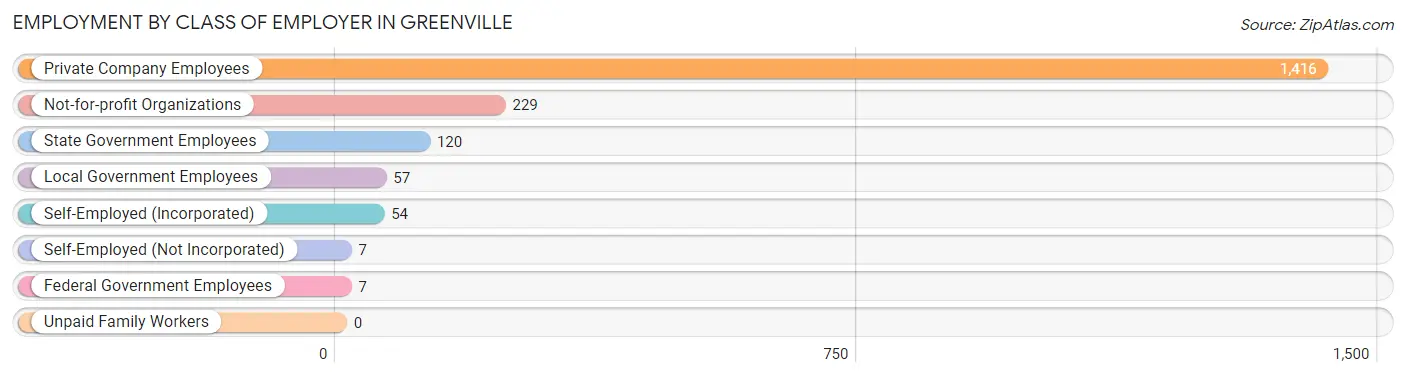
| Employer Class | # Employees | % Employees |
| Private Company Employees | 1,416 | 74.9% |
| Self-Employed (Incorporated) | 54 | 2.9% |
| Self-Employed (Not Incorporated) | 7 | 0.4% |
| Not-for-profit Organizations | 229 | 12.1% |
| Local Government Employees | 57 | 3.0% |
| State Government Employees | 120 | 6.4% |
| Federal Government Employees | 7 | 0.4% |
| Unpaid Family Workers | 0 | 0.0% |
| Total | 1,890 | 100.0% |
Employment Status by Age in Greenville
According to the labor force statistics for Greenville, out of the total population over 16 years of age (3,847), 54.6% or 2,100 individuals are in the labor force, with 4.6% or 97 of them unemployed. The age group with the highest labor force participation rate is 25 to 29 years, with 88.7% or 260 individuals in the labor force. Within the labor force, the 30 to 34 years age range has the highest percentage of unemployed individuals, with 18.6% or 69 of them being unemployed.
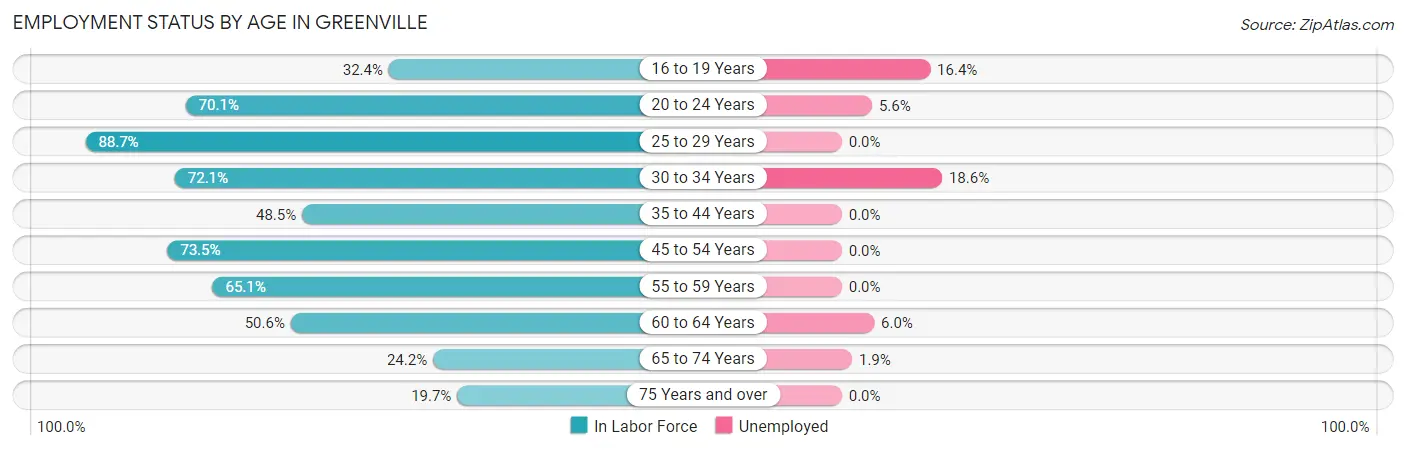
| Age Bracket | In Labor Force | Unemployed |
| 16 to 19 Years | 73 (32.4%) | 12 (16.4%) |
| 20 to 24 Years | 89 (70.1%) | 5 (5.6%) |
| 25 to 29 Years | 260 (88.7%) | 0 (0.0%) |
| 30 to 34 Years | 370 (72.1%) | 69 (18.6%) |
| 35 to 44 Years | 205 (48.5%) | 0 (0.0%) |
| 45 to 54 Years | 528 (73.5%) | 0 (0.0%) |
| 55 to 59 Years | 241 (65.1%) | 0 (0.0%) |
| 60 to 64 Years | 133 (50.6%) | 8 (6.0%) |
| 65 to 74 Years | 106 (24.2%) | 2 (1.9%) |
| 75 Years and over | 94 (19.7%) | 0 (0.0%) |
| Total | 2,100 (54.6%) | 97 (4.6%) |
Employment Status by Educational Attainment in Greenville
According to labor force statistics for Greenville, 67.3% of individuals (1,736) out of the total population between 25 and 64 years of age (2,580) are in the labor force, with 4.4% or 76 of them being unemployed. The group with the highest labor force participation rate are those with the educational attainment of bachelor's degree or higher, with 91.9% or 628 individuals in the labor force. Within the labor force, individuals with high school diploma education have the highest percentage of unemployment, with 13.5% or 69 of them being unemployed.
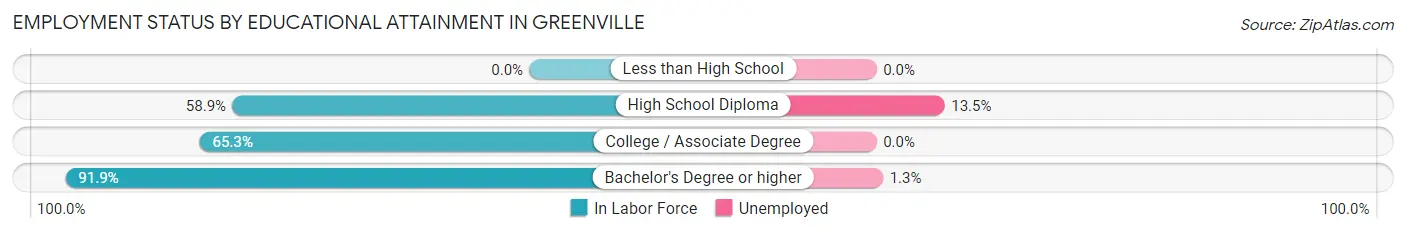
| Educational Attainment | In Labor Force | Unemployed |
| Less than High School | 0 (0.0%) | 0 (0.0%) |
| High School Diploma | 512 (58.9%) | 117 (13.5%) |
| College / Associate Degree | 597 (65.3%) | 0 (0.0%) |
| Bachelor's Degree or higher | 628 (91.9%) | 9 (1.3%) |
| Total | 1,736 (67.3%) | 114 (4.4%) |
Employment Occupations by Sex in Greenville
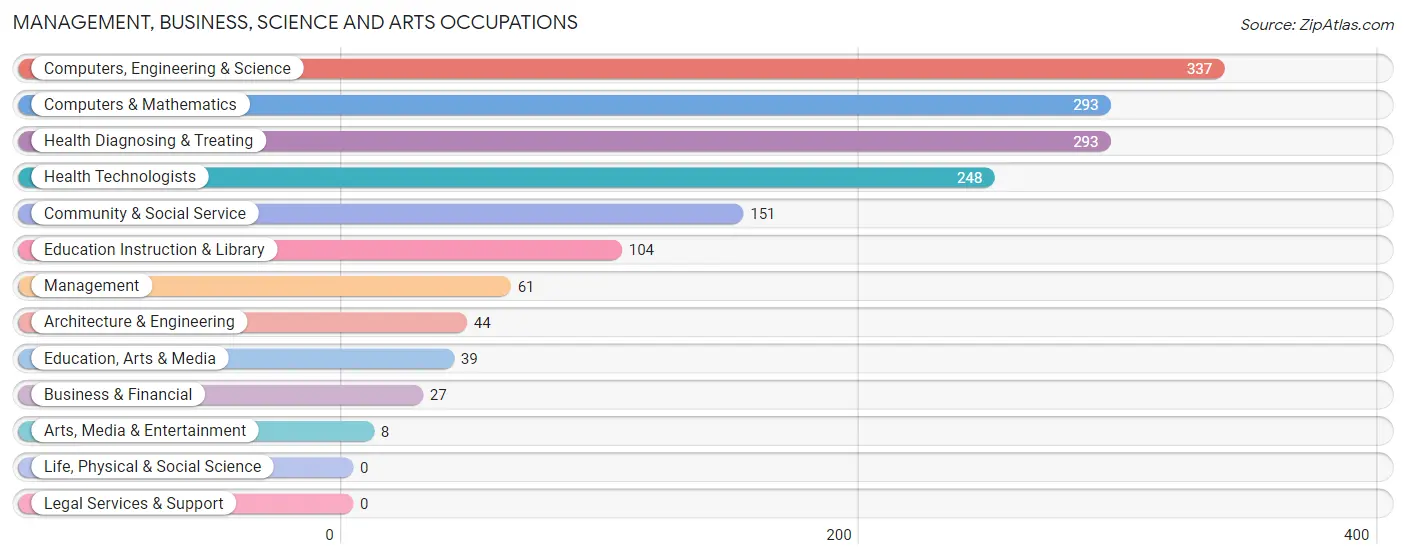
Management, Business, Science and Arts Occupations
The most common Management, Business, Science and Arts occupations in Greenville are Computers, Engineering & Science (337 | 16.8%), Computers & Mathematics (293 | 14.6%), Health Diagnosing & Treating (293 | 14.6%), Health Technologists (248 | 12.4%), and Community & Social Service (151 | 7.5%).
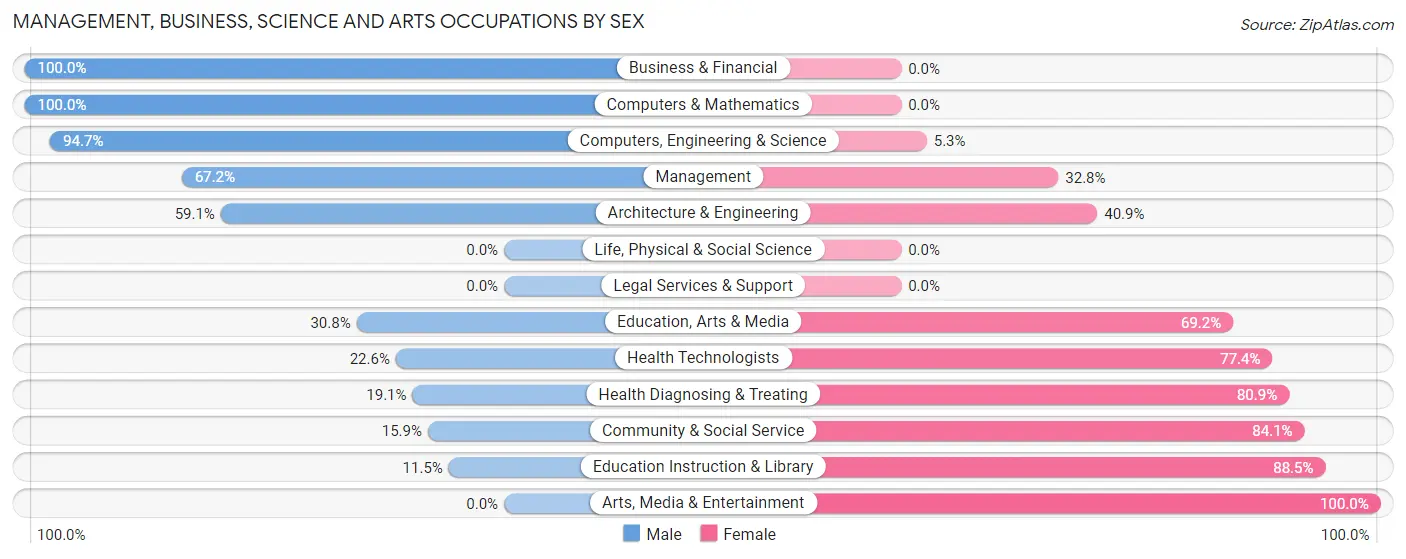
Management, Business, Science and Arts Occupations by Sex
Within the Management, Business, Science and Arts occupations in Greenville, the most male-oriented occupations are Business & Financial (100.0%), Computers & Mathematics (100.0%), and Computers, Engineering & Science (94.7%), while the most female-oriented occupations are Arts, Media & Entertainment (100.0%), Education Instruction & Library (88.5%), and Community & Social Service (84.1%).
| Occupation | Male | Female |
| Management | 41 (67.2%) | 20 (32.8%) |
| Business & Financial | 27 (100.0%) | 0 (0.0%) |
| Computers, Engineering & Science | 319 (94.7%) | 18 (5.3%) |
| Computers & Mathematics | 293 (100.0%) | 0 (0.0%) |
| Architecture & Engineering | 26 (59.1%) | 18 (40.9%) |
| Life, Physical & Social Science | 0 (0.0%) | 0 (0.0%) |
| Community & Social Service | 24 (15.9%) | 127 (84.1%) |
| Education, Arts & Media | 12 (30.8%) | 27 (69.2%) |
| Legal Services & Support | 0 (0.0%) | 0 (0.0%) |
| Education Instruction & Library | 12 (11.5%) | 92 (88.5%) |
| Arts, Media & Entertainment | 0 (0.0%) | 8 (100.0%) |
| Health Diagnosing & Treating | 56 (19.1%) | 237 (80.9%) |
| Health Technologists | 56 (22.6%) | 192 (77.4%) |
| Total (Category) | 467 (53.7%) | 402 (46.3%) |
| Total (Overall) | 1,094 (54.6%) | 909 (45.4%) |
Services Occupations
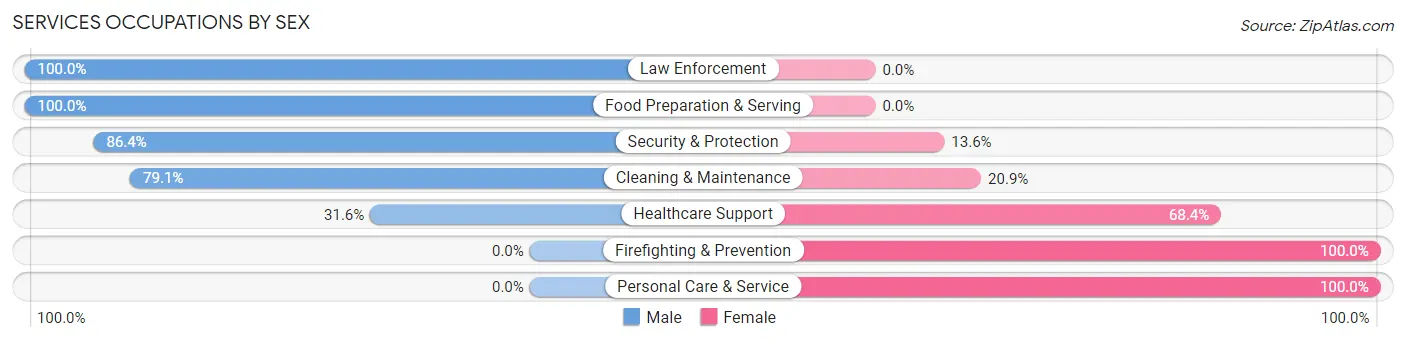
The most common Services occupations in Greenville are Cleaning & Maintenance (110 | 5.5%), Healthcare Support (95 | 4.7%), Security & Protection (22 | 1.1%), Law Enforcement (19 | 0.9%), and Personal Care & Service (17 | 0.9%).

Services Occupations by Sex
Within the Services occupations in Greenville, the most male-oriented occupations are Law Enforcement (100.0%), Food Preparation & Serving (100.0%), and Security & Protection (86.4%), while the most female-oriented occupations are Firefighting & Prevention (100.0%), Personal Care & Service (100.0%), and Healthcare Support (68.4%).
| Occupation | Male | Female |
| Healthcare Support | 30 (31.6%) | 65 (68.4%) |
| Security & Protection | 19 (86.4%) | 3 (13.6%) |
| Firefighting & Prevention | 0 (0.0%) | 3 (100.0%) |
| Law Enforcement | 19 (100.0%) | 0 (0.0%) |
| Food Preparation & Serving | 5 (100.0%) | 0 (0.0%) |
| Cleaning & Maintenance | 87 (79.1%) | 23 (20.9%) |
| Personal Care & Service | 0 (0.0%) | 17 (100.0%) |
| Total (Category) | 141 (56.6%) | 108 (43.4%) |
| Total (Overall) | 1,094 (54.6%) | 909 (45.4%) |
Sales and Office Occupations
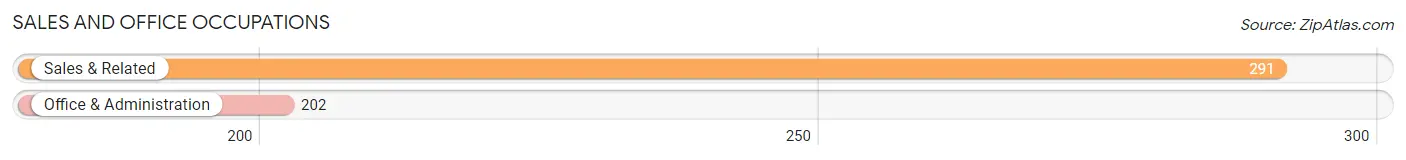
The most common Sales and Office occupations in Greenville are Sales & Related (291 | 14.5%), and Office & Administration (202 | 10.1%).
Sales and Office Occupations by Sex
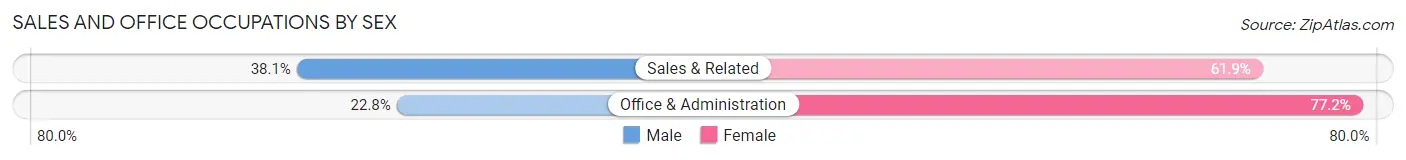
| Occupation | Male | Female |
| Sales & Related | 111 (38.1%) | 180 (61.9%) |
| Office & Administration | 46 (22.8%) | 156 (77.2%) |
| Total (Category) | 157 (31.9%) | 336 (68.1%) |
| Total (Overall) | 1,094 (54.6%) | 909 (45.4%) |
Natural Resources, Construction and Maintenance Occupations
The most common Natural Resources, Construction and Maintenance occupations in Greenville are Construction & Extraction (116 | 5.8%), and Installation, Maintenance & Repair (13 | 0.6%).

Natural Resources, Construction and Maintenance Occupations by Sex
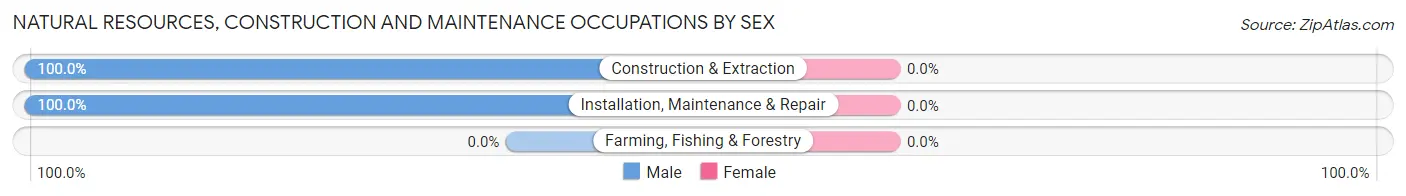
| Occupation | Male | Female |
| Farming, Fishing & Forestry | 0 (0.0%) | 0 (0.0%) |
| Construction & Extraction | 116 (100.0%) | 0 (0.0%) |
| Installation, Maintenance & Repair | 13 (100.0%) | 0 (0.0%) |
| Total (Category) | 129 (100.0%) | 0 (0.0%) |
| Total (Overall) | 1,094 (54.6%) | 909 (45.4%) |
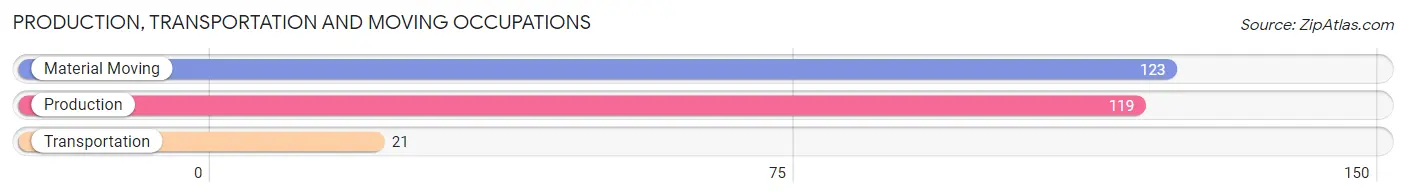
Production, Transportation and Moving Occupations
The most common Production, Transportation and Moving occupations in Greenville are Material Moving (123 | 6.1%), Production (119 | 5.9%), and Transportation (21 | 1.1%).
Production, Transportation and Moving Occupations by Sex
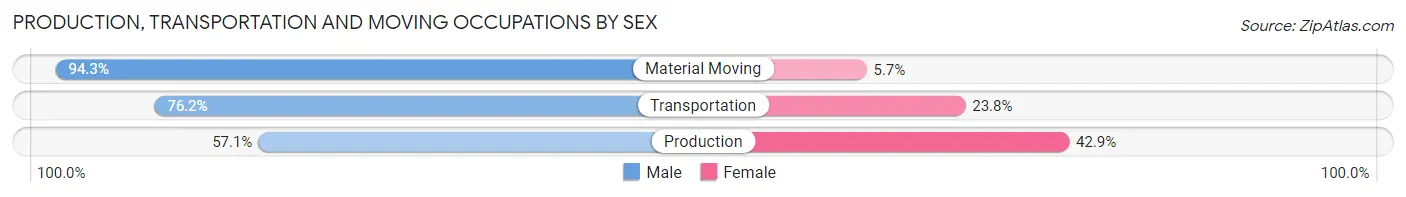
| Occupation | Male | Female |
| Production | 68 (57.1%) | 51 (42.9%) |
| Transportation | 16 (76.2%) | 5 (23.8%) |
| Material Moving | 116 (94.3%) | 7 (5.7%) |
| Total (Category) | 200 (76.0%) | 63 (23.9%) |
| Total (Overall) | 1,094 (54.6%) | 909 (45.4%) |
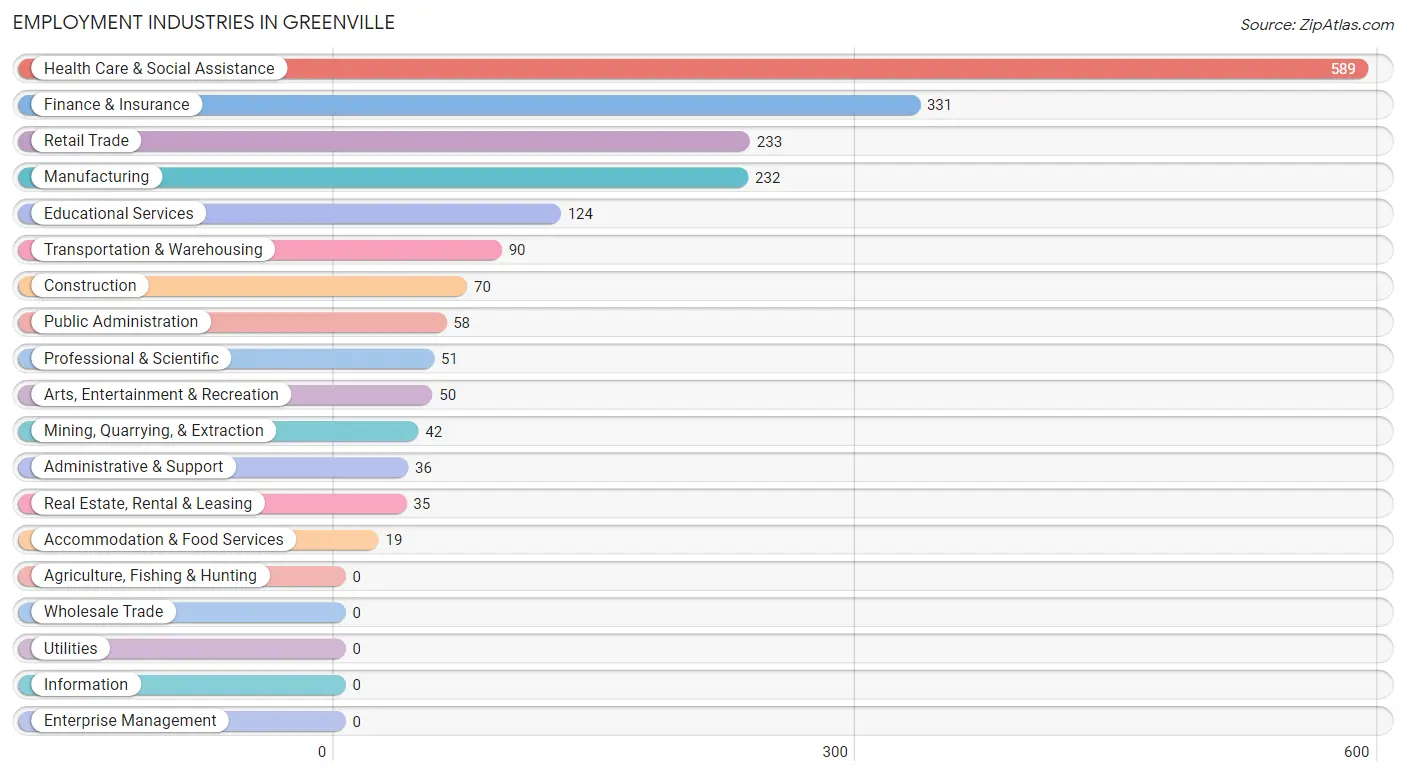
Employment Industries by Sex in Greenville
Employment Industries in Greenville
The major employment industries in Greenville include Health Care & Social Assistance (589 | 29.4%), Finance & Insurance (331 | 16.5%), Retail Trade (233 | 11.6%), Manufacturing (232 | 11.6%), and Educational Services (124 | 6.2%).
Employment Industries by Sex in Greenville
The Greenville industries that see more men than women are Mining, Quarrying, & Extraction (100.0%), Professional & Scientific (100.0%), and Finance & Insurance (97.6%), whereas the industries that tend to have a higher number of women are Arts, Entertainment & Recreation (100.0%), Educational Services (76.6%), and Retail Trade (73.0%).
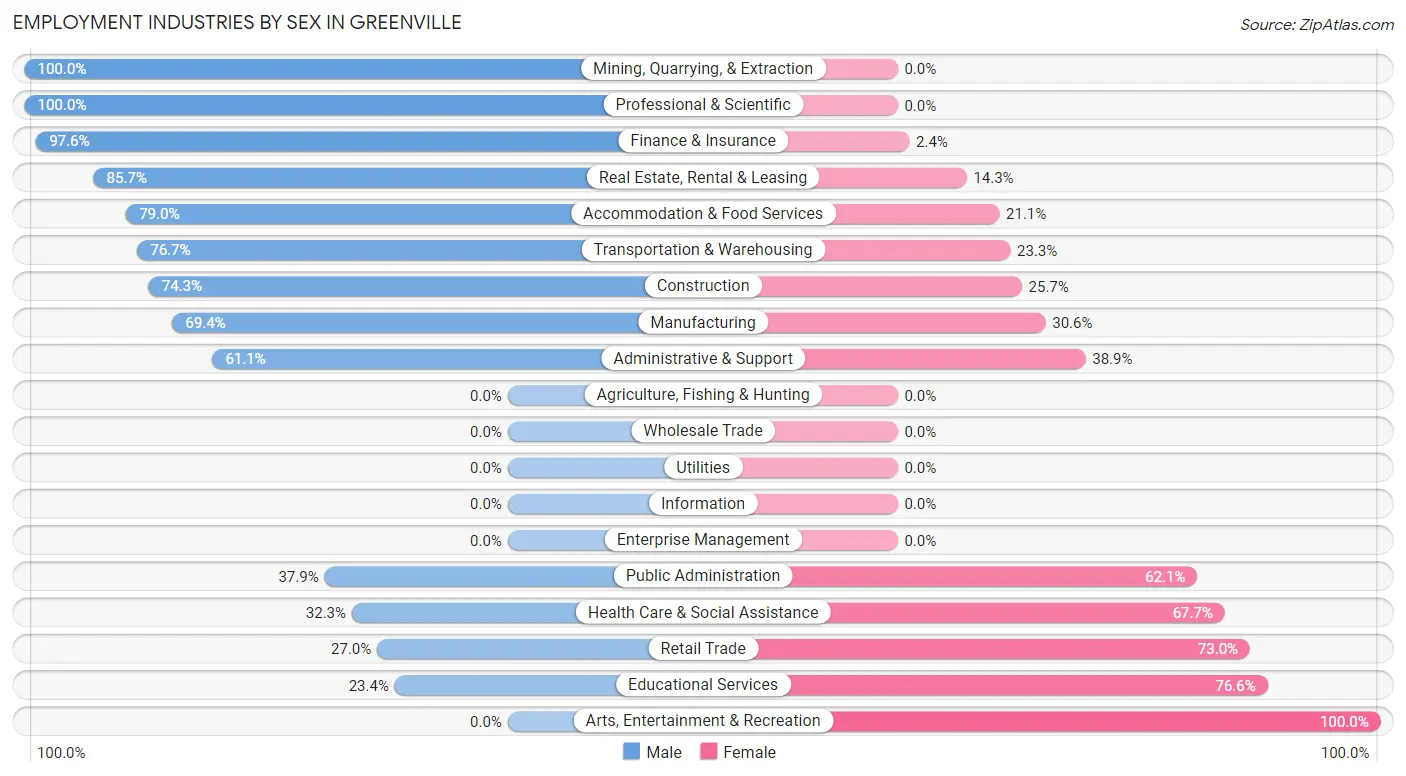
| Industry | Male | Female |
| Agriculture, Fishing & Hunting | 0 (0.0%) | 0 (0.0%) |
| Mining, Quarrying, & Extraction | 42 (100.0%) | 0 (0.0%) |
| Construction | 52 (74.3%) | 18 (25.7%) |
| Manufacturing | 161 (69.4%) | 71 (30.6%) |
| Wholesale Trade | 0 (0.0%) | 0 (0.0%) |
| Retail Trade | 63 (27.0%) | 170 (73.0%) |
| Transportation & Warehousing | 69 (76.7%) | 21 (23.3%) |
| Utilities | 0 (0.0%) | 0 (0.0%) |
| Information | 0 (0.0%) | 0 (0.0%) |
| Finance & Insurance | 323 (97.6%) | 8 (2.4%) |
| Real Estate, Rental & Leasing | 30 (85.7%) | 5 (14.3%) |
| Professional & Scientific | 51 (100.0%) | 0 (0.0%) |
| Enterprise Management | 0 (0.0%) | 0 (0.0%) |
| Administrative & Support | 22 (61.1%) | 14 (38.9%) |
| Educational Services | 29 (23.4%) | 95 (76.6%) |
| Health Care & Social Assistance | 190 (32.3%) | 399 (67.7%) |
| Arts, Entertainment & Recreation | 0 (0.0%) | 50 (100.0%) |
| Accommodation & Food Services | 15 (78.9%) | 4 (21.0%) |
| Public Administration | 22 (37.9%) | 36 (62.1%) |
| Total | 1,094 (54.6%) | 909 (45.4%) |
Education in Greenville
School Enrollment in Greenville
The most common levels of schooling among the 786 students in Greenville are elementary school (271 | 34.5%), middle school (161 | 20.5%), and high school (116 | 14.8%).
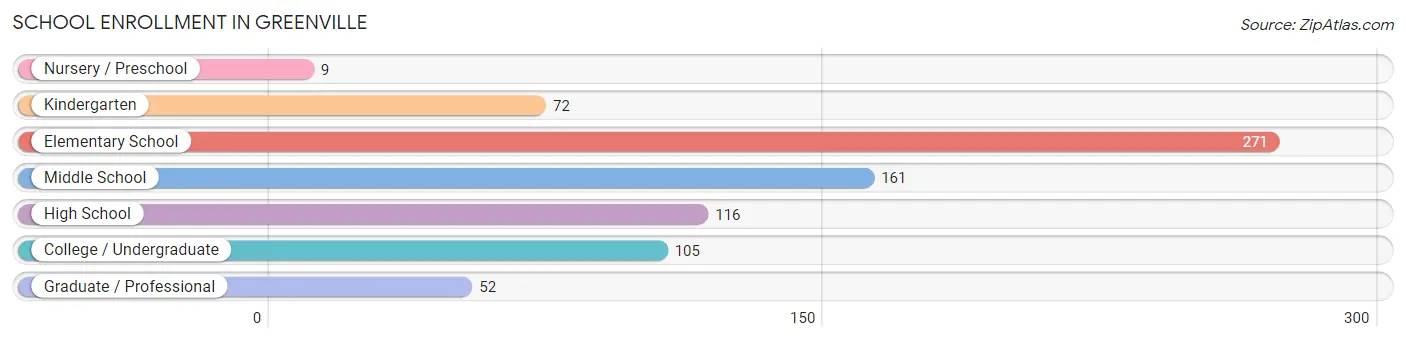
| School Level | # Students | % Students |
| Nursery / Preschool | 9 | 1.1% |
| Kindergarten | 72 | 9.2% |
| Elementary School | 271 | 34.5% |
| Middle School | 161 | 20.5% |
| High School | 116 | 14.8% |
| College / Undergraduate | 105 | 13.4% |
| Graduate / Professional | 52 | 6.6% |
| Total | 786 | 100.0% |
School Enrollment by Age by Funding Source in Greenville
Out of a total of 786 students who are enrolled in schools in Greenville, 72 (9.2%) attend a private institution, while the remaining 714 (90.8%) are enrolled in public schools. The age group of 15 to 17 year olds has the highest likelihood of being enrolled in private schools, with 42 (27.1% in the age bracket) enrolled. Conversely, the age group of 10 to 14 year olds has the lowest likelihood of being enrolled in a private school, with 181 (100.0% in the age bracket) attending a public institution.
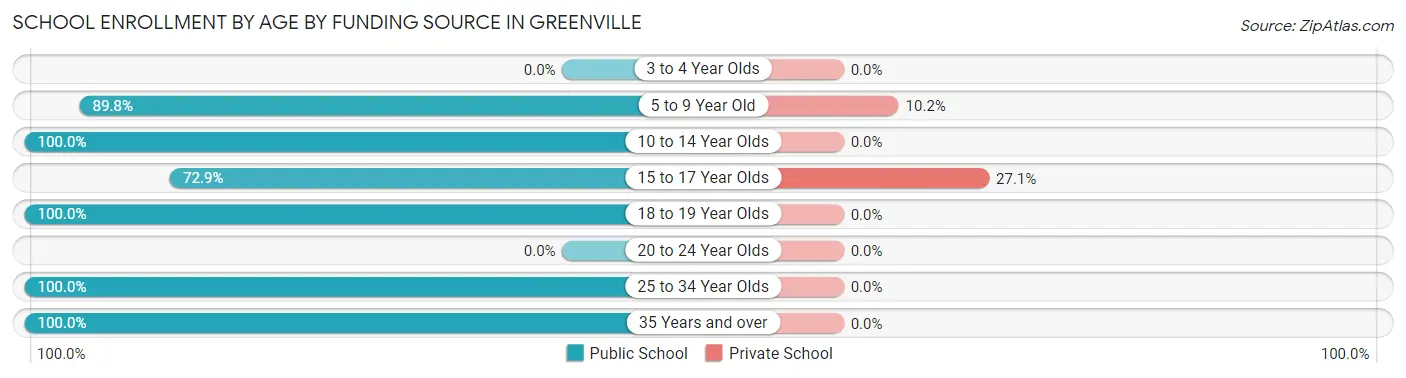
| Age Bracket | Public School | Private School |
| 3 to 4 Year Olds | 0 (0.0%) | 0 (0.0%) |
| 5 to 9 Year Old | 263 (89.8%) | 30 (10.2%) |
| 10 to 14 Year Olds | 181 (100.0%) | 0 (0.0%) |
| 15 to 17 Year Olds | 113 (72.9%) | 42 (27.1%) |
| 18 to 19 Year Olds | 10 (100.0%) | 0 (0.0%) |
| 20 to 24 Year Olds | 0 (0.0%) | 0 (0.0%) |
| 25 to 34 Year Olds | 103 (100.0%) | 0 (0.0%) |
| 35 Years and over | 44 (100.0%) | 0 (0.0%) |
| Total | 714 (90.8%) | 72 (9.2%) |
Educational Attainment by Field of Study in Greenville
Physical & health sciences (323 | 23.0%), arts & humanities (319 | 22.7%), computers & mathematics (300 | 21.3%), education (135 | 9.6%), and science & technology (132 | 9.4%) are the most common fields of study among 1,407 individuals in Greenville who have obtained a bachelor's degree or higher.
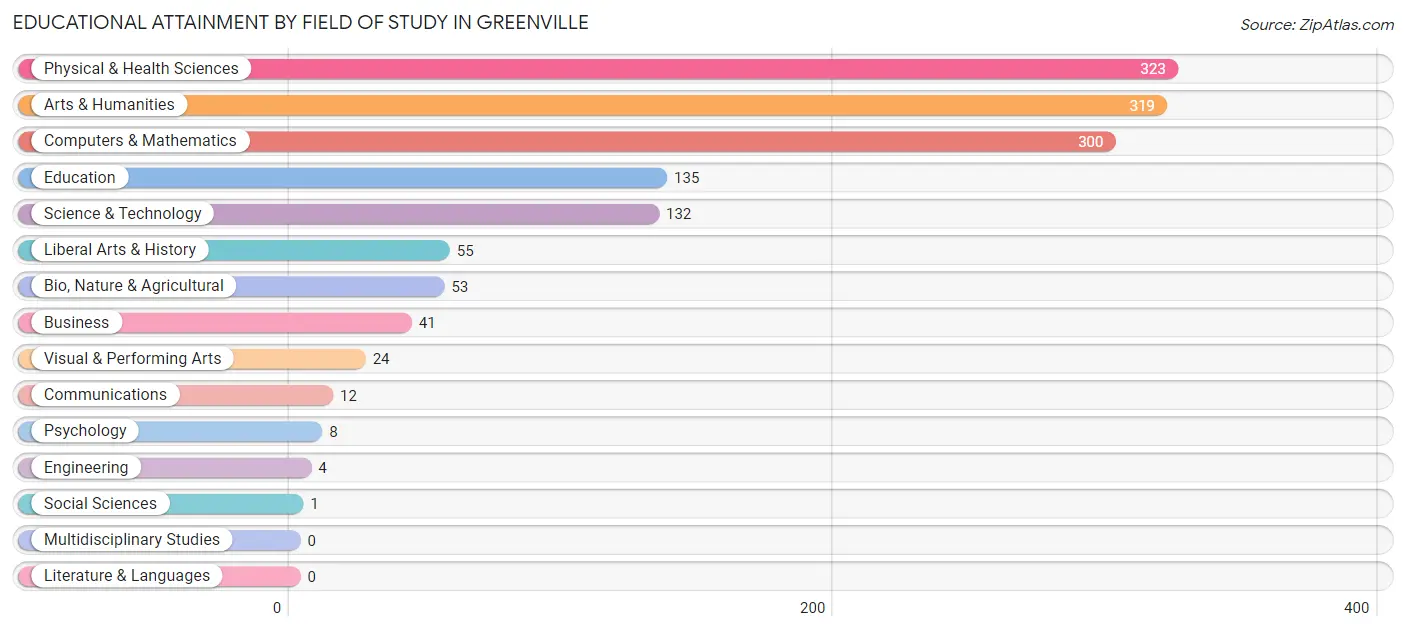
| Field of Study | # Graduates | % Graduates |
| Computers & Mathematics | 300 | 21.3% |
| Bio, Nature & Agricultural | 53 | 3.8% |
| Physical & Health Sciences | 323 | 23.0% |
| Psychology | 8 | 0.6% |
| Social Sciences | 1 | 0.1% |
| Engineering | 4 | 0.3% |
| Multidisciplinary Studies | 0 | 0.0% |
| Science & Technology | 132 | 9.4% |
| Business | 41 | 2.9% |
| Education | 135 | 9.6% |
| Literature & Languages | 0 | 0.0% |
| Liberal Arts & History | 55 | 3.9% |
| Visual & Performing Arts | 24 | 1.7% |
| Communications | 12 | 0.9% |
| Arts & Humanities | 319 | 22.7% |
| Total | 1,407 | 100.0% |
Transportation & Commute in Greenville
Vehicle Availability by Sex in Greenville
The most prevalent vehicle ownership categories in Greenville are males with 3 vehicles (503, accounting for 46.8%) and females with 3 vehicles (178, making up 62.6%).
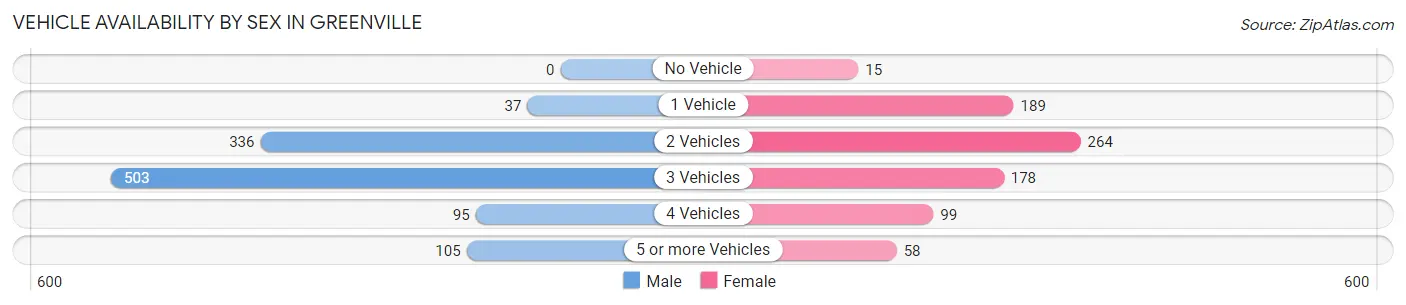
| Vehicles Available | Male | Female |
| No Vehicle | 0 (0.0%) | 15 (1.9%) |
| 1 Vehicle | 37 (3.4%) | 189 (23.5%) |
| 2 Vehicles | 336 (31.2%) | 264 (32.9%) |
| 3 Vehicles | 503 (46.8%) | 178 (22.2%) |
| 4 Vehicles | 95 (8.8%) | 99 (12.3%) |
| 5 or more Vehicles | 105 (9.8%) | 58 (7.2%) |
| Total | 1,076 (100.0%) | 803 (100.0%) |
Commute Time in Greenville
The most frequently occuring commute durations in Greenville are 40 to 44 minutes (306 commuters, 16.2%), 5 to 9 minutes (269 commuters, 14.2%), and less than 5 minutes (247 commuters, 13.1%).
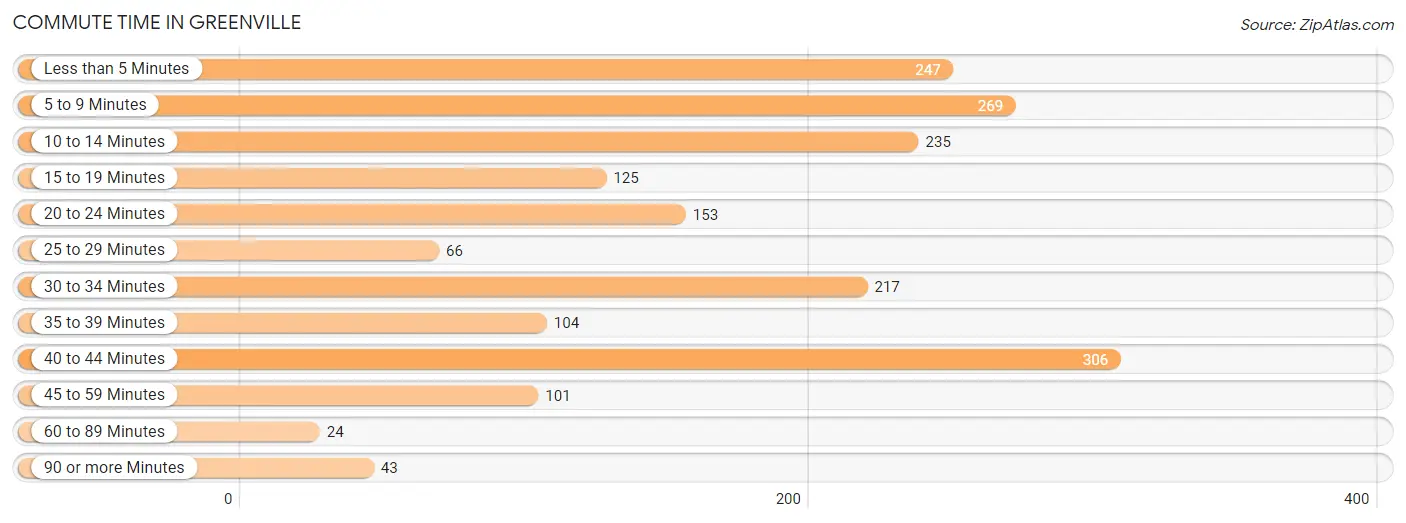
| Commute Time | # Commuters | % Commuters |
| Less than 5 Minutes | 247 | 13.1% |
| 5 to 9 Minutes | 269 | 14.2% |
| 10 to 14 Minutes | 235 | 12.4% |
| 15 to 19 Minutes | 125 | 6.6% |
| 20 to 24 Minutes | 153 | 8.1% |
| 25 to 29 Minutes | 66 | 3.5% |
| 30 to 34 Minutes | 217 | 11.5% |
| 35 to 39 Minutes | 104 | 5.5% |
| 40 to 44 Minutes | 306 | 16.2% |
| 45 to 59 Minutes | 101 | 5.3% |
| 60 to 89 Minutes | 24 | 1.3% |
| 90 or more Minutes | 43 | 2.3% |
Commute Time by Sex in Greenville
The most common commute times in Greenville are 40 to 44 minutes (301 commuters, 27.7%) for males and 30 to 34 minutes (191 commuters, 23.8%) for females.
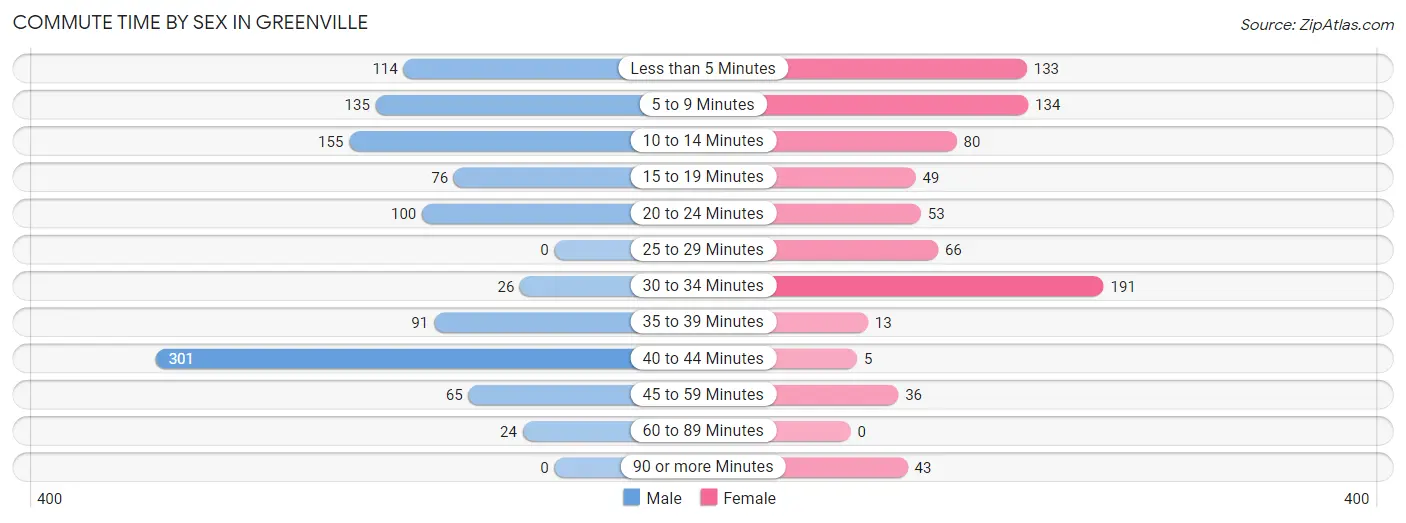
| Commute Time | Male | Female |
| Less than 5 Minutes | 114 (10.5%) | 133 (16.6%) |
| 5 to 9 Minutes | 135 (12.4%) | 134 (16.7%) |
| 10 to 14 Minutes | 155 (14.3%) | 80 (10.0%) |
| 15 to 19 Minutes | 76 (7.0%) | 49 (6.1%) |
| 20 to 24 Minutes | 100 (9.2%) | 53 (6.6%) |
| 25 to 29 Minutes | 0 (0.0%) | 66 (8.2%) |
| 30 to 34 Minutes | 26 (2.4%) | 191 (23.8%) |
| 35 to 39 Minutes | 91 (8.4%) | 13 (1.6%) |
| 40 to 44 Minutes | 301 (27.7%) | 5 (0.6%) |
| 45 to 59 Minutes | 65 (6.0%) | 36 (4.5%) |
| 60 to 89 Minutes | 24 (2.2%) | 0 (0.0%) |
| 90 or more Minutes | 0 (0.0%) | 43 (5.3%) |
Time of Departure to Work by Sex in Greenville
The most frequent times of departure to work in Greenville are 5:30 AM to 5:59 AM (409, 37.6%) for males and 6:30 AM to 6:59 AM (217, 27.0%) for females.
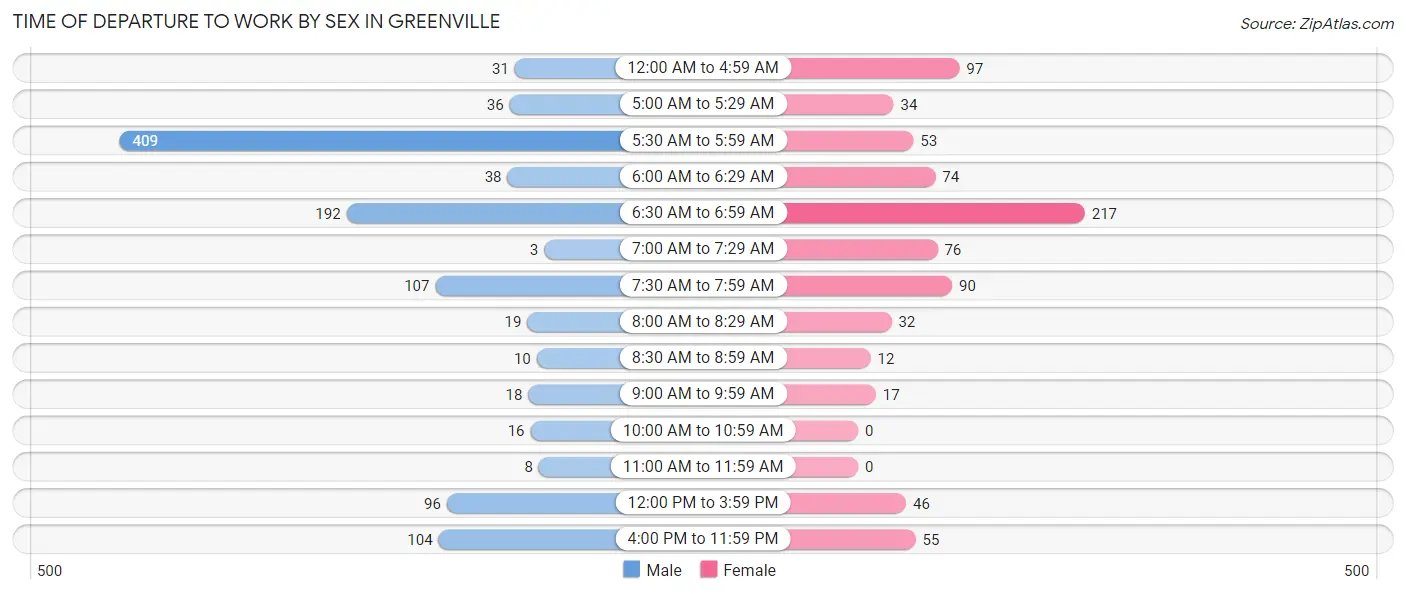
| Time of Departure | Male | Female |
| 12:00 AM to 4:59 AM | 31 (2.9%) | 97 (12.1%) |
| 5:00 AM to 5:29 AM | 36 (3.3%) | 34 (4.2%) |
| 5:30 AM to 5:59 AM | 409 (37.6%) | 53 (6.6%) |
| 6:00 AM to 6:29 AM | 38 (3.5%) | 74 (9.2%) |
| 6:30 AM to 6:59 AM | 192 (17.7%) | 217 (27.0%) |
| 7:00 AM to 7:29 AM | 3 (0.3%) | 76 (9.5%) |
| 7:30 AM to 7:59 AM | 107 (9.8%) | 90 (11.2%) |
| 8:00 AM to 8:29 AM | 19 (1.8%) | 32 (4.0%) |
| 8:30 AM to 8:59 AM | 10 (0.9%) | 12 (1.5%) |
| 9:00 AM to 9:59 AM | 18 (1.7%) | 17 (2.1%) |
| 10:00 AM to 10:59 AM | 16 (1.5%) | 0 (0.0%) |
| 11:00 AM to 11:59 AM | 8 (0.7%) | 0 (0.0%) |
| 12:00 PM to 3:59 PM | 96 (8.8%) | 46 (5.7%) |
| 4:00 PM to 11:59 PM | 104 (9.6%) | 55 (6.9%) |
| Total | 1,087 (100.0%) | 803 (100.0%) |
Housing Occupancy in Greenville
Occupancy by Ownership in Greenville
Of the total 1,923 dwellings in Greenville, owner-occupied units account for 1,356 (70.5%), while renter-occupied units make up 567 (29.5%).
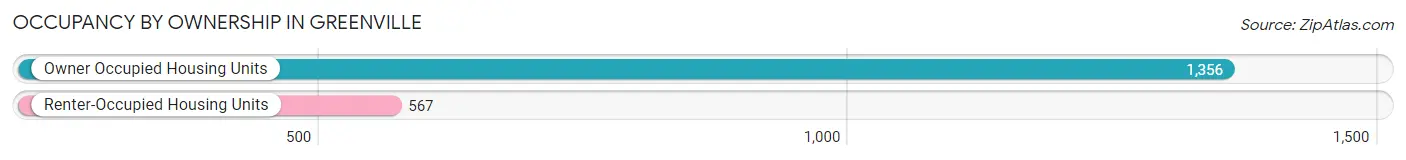
| Occupancy | # Housing Units | % Housing Units |
| Owner Occupied Housing Units | 1,356 | 70.5% |
| Renter-Occupied Housing Units | 567 | 29.5% |
| Total Occupied Housing Units | 1,923 | 100.0% |
Occupancy by Household Size in Greenville
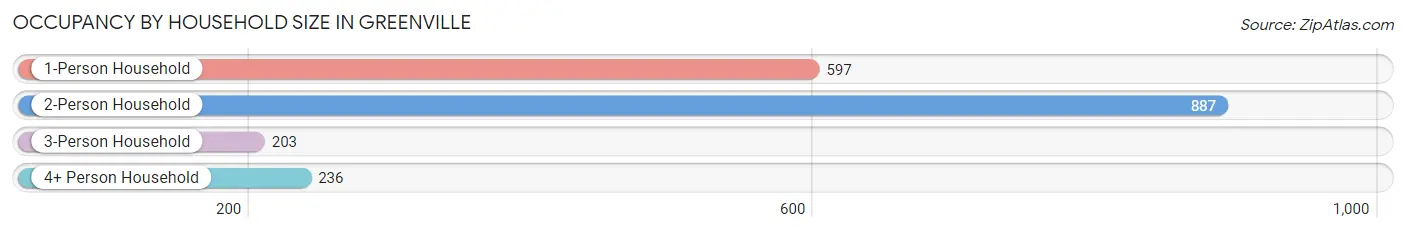
| Household Size | # Housing Units | % Housing Units |
| 1-Person Household | 597 | 31.0% |
| 2-Person Household | 887 | 46.1% |
| 3-Person Household | 203 | 10.6% |
| 4+ Person Household | 236 | 12.3% |
| Total Housing Units | 1,923 | 100.0% |
Occupancy by Ownership by Household Size in Greenville
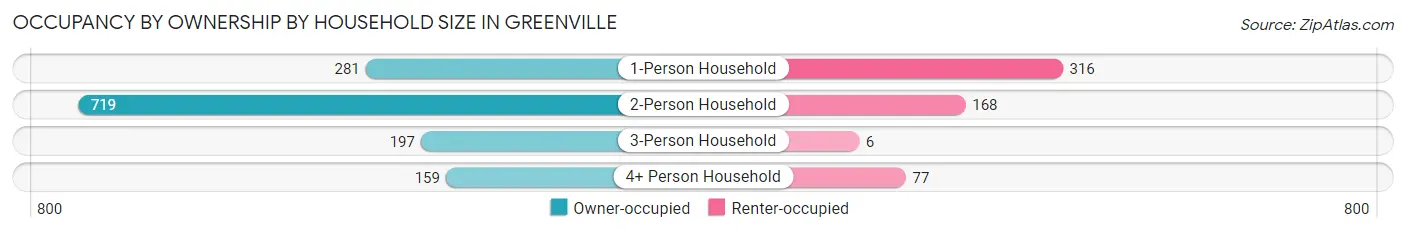
| Household Size | Owner-occupied | Renter-occupied |
| 1-Person Household | 281 (47.1%) | 316 (52.9%) |
| 2-Person Household | 719 (81.1%) | 168 (18.9%) |
| 3-Person Household | 197 (97.0%) | 6 (3.0%) |
| 4+ Person Household | 159 (67.4%) | 77 (32.6%) |
| Total Housing Units | 1,356 (70.5%) | 567 (29.5%) |
Occupancy by Educational Attainment in Greenville
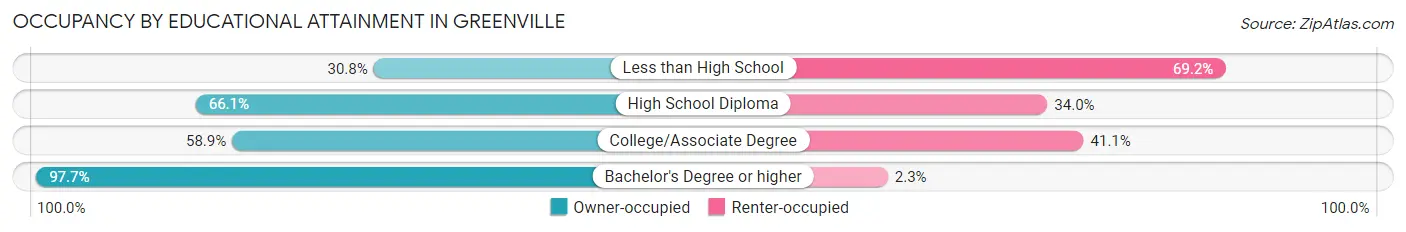
| Household Size | Owner-occupied | Renter-occupied |
| Less than High School | 45 (30.8%) | 101 (69.2%) |
| High School Diploma | 430 (66.0%) | 221 (34.0%) |
| College/Associate Degree | 332 (58.9%) | 232 (41.1%) |
| Bachelor's Degree or higher | 549 (97.7%) | 13 (2.3%) |
Occupancy by Age of Householder in Greenville
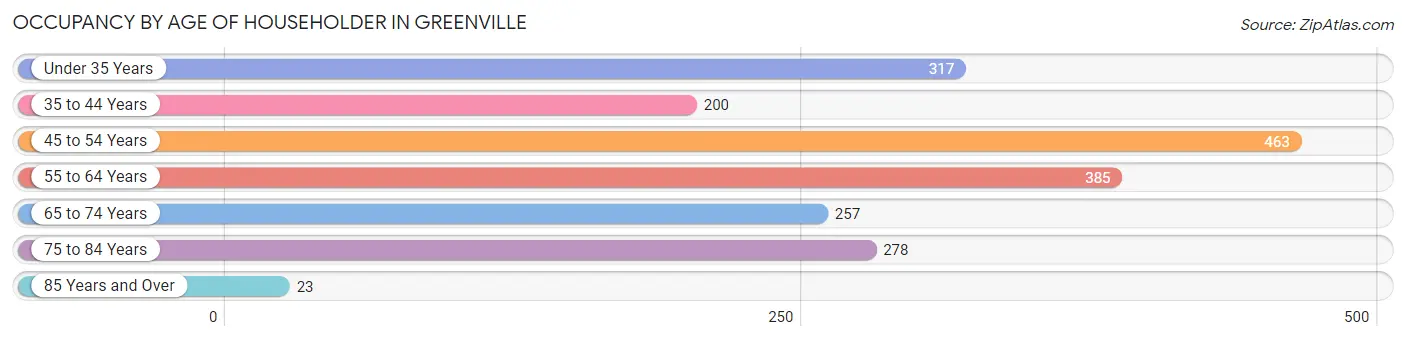
| Age Bracket | # Households | % Households |
| Under 35 Years | 317 | 16.5% |
| 35 to 44 Years | 200 | 10.4% |
| 45 to 54 Years | 463 | 24.1% |
| 55 to 64 Years | 385 | 20.0% |
| 65 to 74 Years | 257 | 13.4% |
| 75 to 84 Years | 278 | 14.5% |
| 85 Years and Over | 23 | 1.2% |
| Total | 1,923 | 100.0% |
Housing Finances in Greenville
Median Income by Occupancy in Greenville
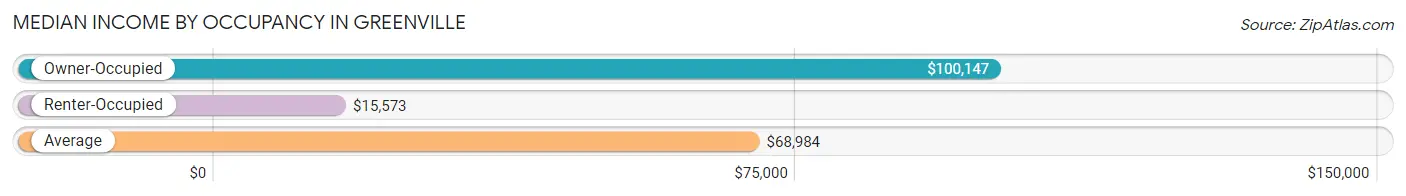
| Occupancy Type | # Households | Median Income |
| Owner-Occupied | 1,356 (70.5%) | $100,147 |
| Renter-Occupied | 567 (29.5%) | $15,573 |
| Average | 1,923 (100.0%) | $68,984 |
Occupancy by Householder Income Bracket in Greenville
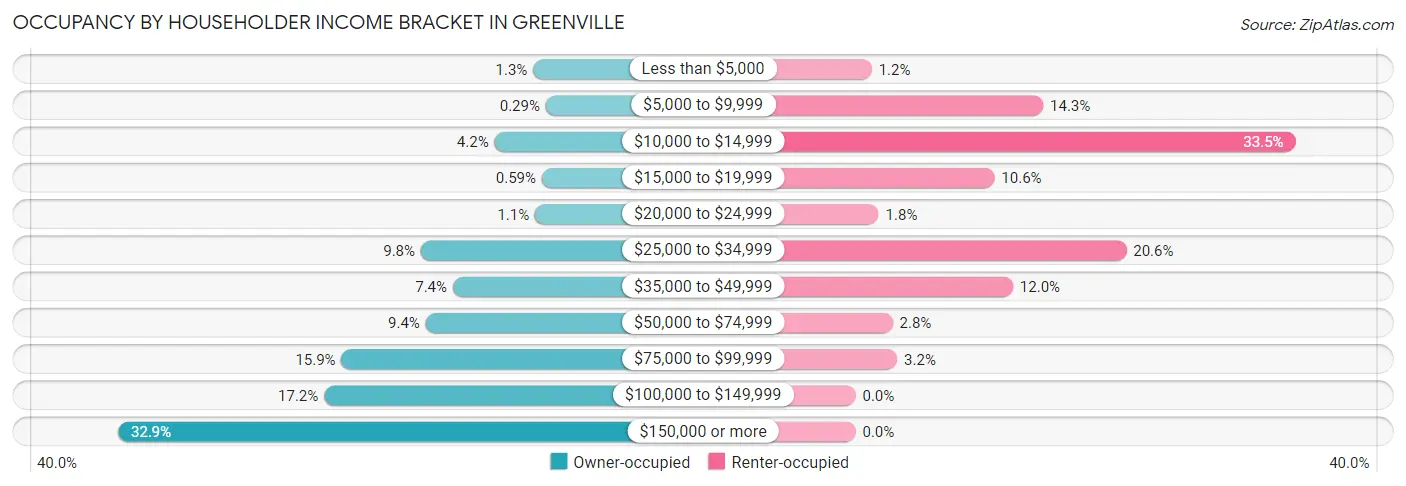
| Income Bracket | Owner-occupied | Renter-occupied |
| Less than $5,000 | 17 (1.3%) | 7 (1.2%) |
| $5,000 to $9,999 | 4 (0.3%) | 81 (14.3%) |
| $10,000 to $14,999 | 57 (4.2%) | 190 (33.5%) |
| $15,000 to $19,999 | 8 (0.6%) | 60 (10.6%) |
| $20,000 to $24,999 | 15 (1.1%) | 10 (1.8%) |
| $25,000 to $34,999 | 133 (9.8%) | 117 (20.6%) |
| $35,000 to $49,999 | 100 (7.4%) | 68 (12.0%) |
| $50,000 to $74,999 | 128 (9.4%) | 16 (2.8%) |
| $75,000 to $99,999 | 215 (15.9%) | 18 (3.2%) |
| $100,000 to $149,999 | 233 (17.2%) | 0 (0.0%) |
| $150,000 or more | 446 (32.9%) | 0 (0.0%) |
| Total | 1,356 (100.0%) | 567 (100.0%) |
Monthly Housing Cost Tiers in Greenville
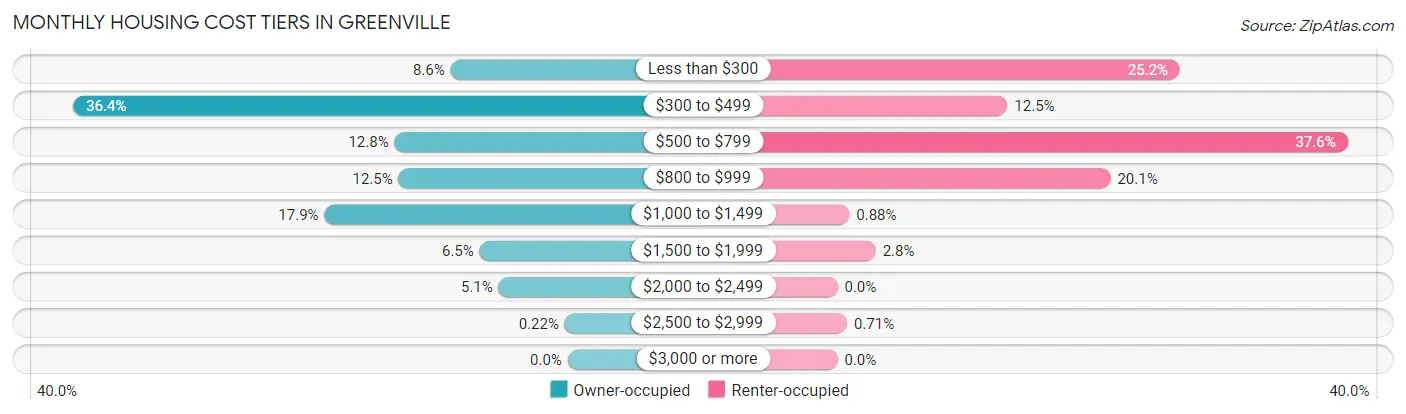
| Monthly Cost | Owner-occupied | Renter-occupied |
| Less than $300 | 117 (8.6%) | 143 (25.2%) |
| $300 to $499 | 494 (36.4%) | 71 (12.5%) |
| $500 to $799 | 173 (12.8%) | 213 (37.6%) |
| $800 to $999 | 169 (12.5%) | 114 (20.1%) |
| $1,000 to $1,499 | 243 (17.9%) | 5 (0.9%) |
| $1,500 to $1,999 | 88 (6.5%) | 16 (2.8%) |
| $2,000 to $2,499 | 69 (5.1%) | 0 (0.0%) |
| $2,500 to $2,999 | 3 (0.2%) | 4 (0.7%) |
| $3,000 or more | 0 (0.0%) | 0 (0.0%) |
| Total | 1,356 (100.0%) | 567 (100.0%) |
Physical Housing Characteristics in Greenville
Housing Structures in Greenville
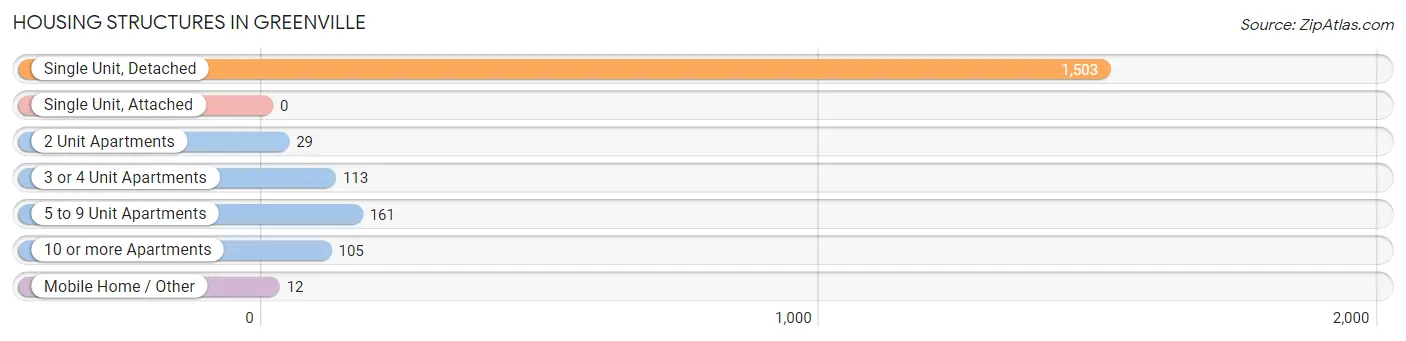
| Structure Type | # Housing Units | % Housing Units |
| Single Unit, Detached | 1,503 | 78.2% |
| Single Unit, Attached | 0 | 0.0% |
| 2 Unit Apartments | 29 | 1.5% |
| 3 or 4 Unit Apartments | 113 | 5.9% |
| 5 to 9 Unit Apartments | 161 | 8.4% |
| 10 or more Apartments | 105 | 5.5% |
| Mobile Home / Other | 12 | 0.6% |
| Total | 1,923 | 100.0% |
Housing Structures by Occupancy in Greenville
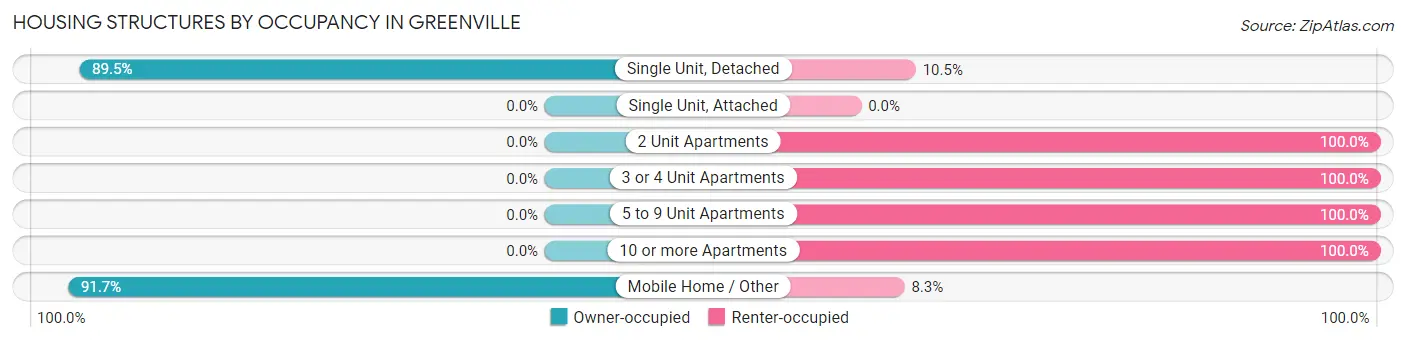
| Structure Type | Owner-occupied | Renter-occupied |
| Single Unit, Detached | 1,345 (89.5%) | 158 (10.5%) |
| Single Unit, Attached | 0 (0.0%) | 0 (0.0%) |
| 2 Unit Apartments | 0 (0.0%) | 29 (100.0%) |
| 3 or 4 Unit Apartments | 0 (0.0%) | 113 (100.0%) |
| 5 to 9 Unit Apartments | 0 (0.0%) | 161 (100.0%) |
| 10 or more Apartments | 0 (0.0%) | 105 (100.0%) |
| Mobile Home / Other | 11 (91.7%) | 1 (8.3%) |
| Total | 1,356 (70.5%) | 567 (29.5%) |
Housing Structures by Number of Rooms in Greenville
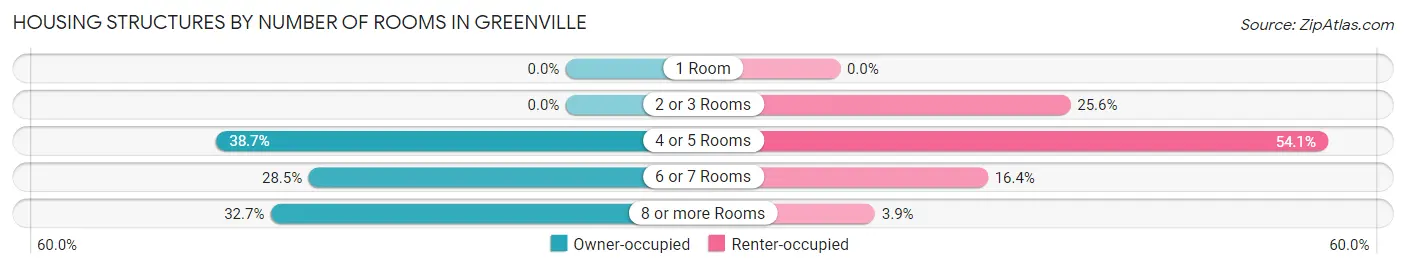
| Number of Rooms | Owner-occupied | Renter-occupied |
| 1 Room | 0 (0.0%) | 0 (0.0%) |
| 2 or 3 Rooms | 0 (0.0%) | 145 (25.6%) |
| 4 or 5 Rooms | 525 (38.7%) | 307 (54.1%) |
| 6 or 7 Rooms | 387 (28.5%) | 93 (16.4%) |
| 8 or more Rooms | 444 (32.7%) | 22 (3.9%) |
| Total | 1,356 (100.0%) | 567 (100.0%) |
Housing Structure by Heating Type in Greenville
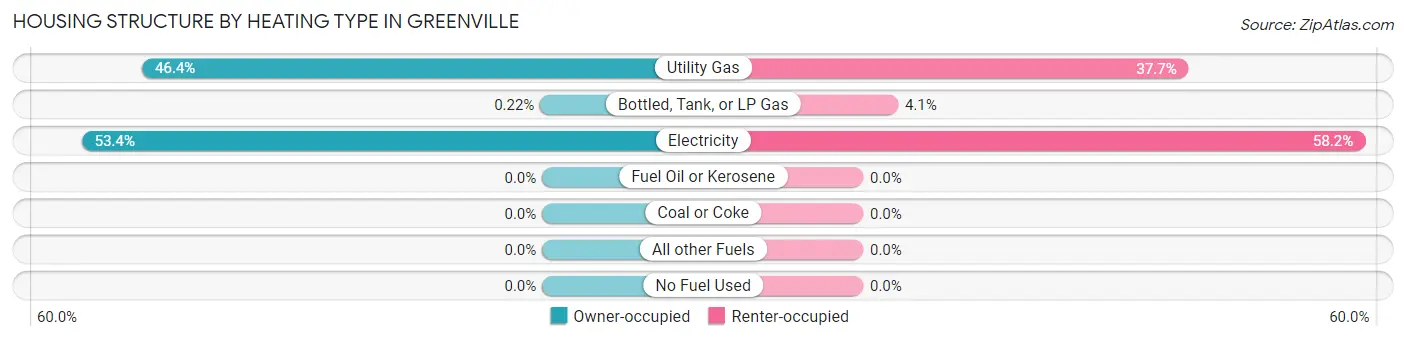
| Heating Type | Owner-occupied | Renter-occupied |
| Utility Gas | 629 (46.4%) | 214 (37.7%) |
| Bottled, Tank, or LP Gas | 3 (0.2%) | 23 (4.1%) |
| Electricity | 724 (53.4%) | 330 (58.2%) |
| Fuel Oil or Kerosene | 0 (0.0%) | 0 (0.0%) |
| Coal or Coke | 0 (0.0%) | 0 (0.0%) |
| All other Fuels | 0 (0.0%) | 0 (0.0%) |
| No Fuel Used | 0 (0.0%) | 0 (0.0%) |
| Total | 1,356 (100.0%) | 567 (100.0%) |
Household Vehicle Usage in Greenville
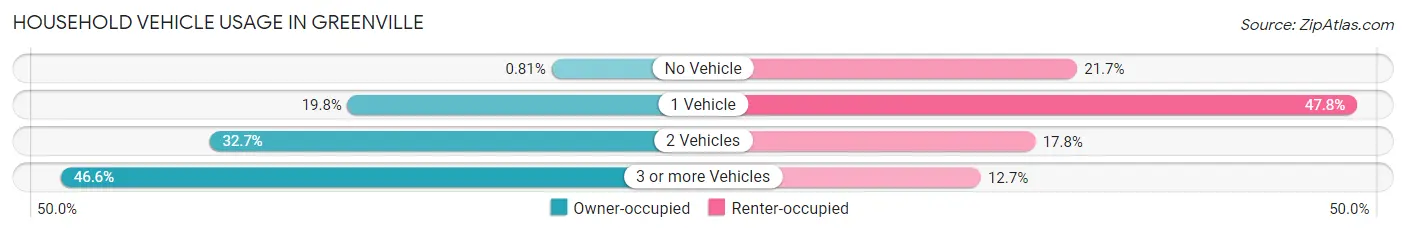
| Vehicles per Household | Owner-occupied | Renter-occupied |
| No Vehicle | 11 (0.8%) | 123 (21.7%) |
| 1 Vehicle | 269 (19.8%) | 271 (47.8%) |
| 2 Vehicles | 444 (32.7%) | 101 (17.8%) |
| 3 or more Vehicles | 632 (46.6%) | 72 (12.7%) |
| Total | 1,356 (100.0%) | 567 (100.0%) |
Real Estate & Mortgages in Greenville
Real Estate and Mortgage Overview in Greenville
| Characteristic | Without Mortgage | With Mortgage |
| Housing Units | 764 | 592 |
| Median Property Value | $99,200 | $142,400 |
| Median Household Income | $116,167 | $135 |
| Monthly Housing Costs | $377 | $0 |
| Real Estate Taxes | $1,202 | $28 |
Property Value by Mortgage Status in Greenville
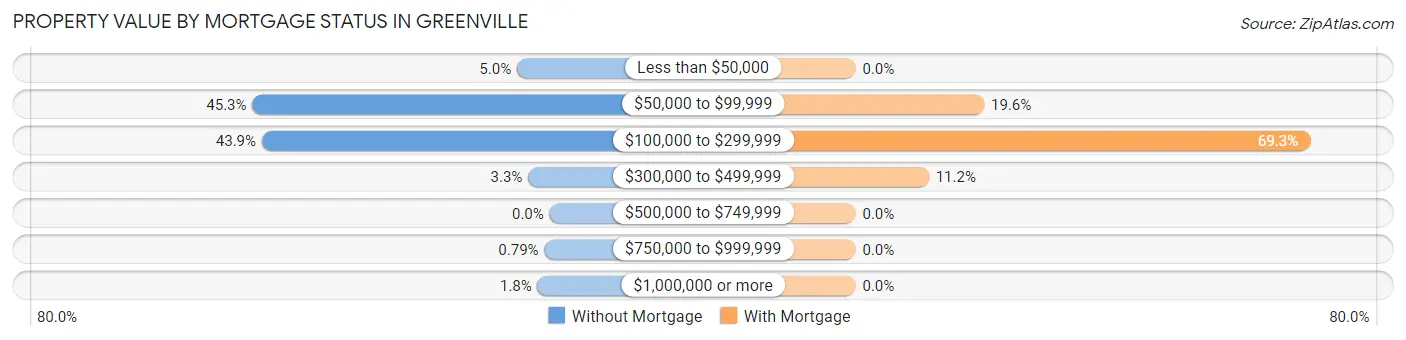
| Property Value | Without Mortgage | With Mortgage |
| Less than $50,000 | 38 (5.0%) | 0 (0.0%) |
| $50,000 to $99,999 | 346 (45.3%) | 116 (19.6%) |
| $100,000 to $299,999 | 335 (43.9%) | 410 (69.3%) |
| $300,000 to $499,999 | 25 (3.3%) | 66 (11.2%) |
| $500,000 to $749,999 | 0 (0.0%) | 0 (0.0%) |
| $750,000 to $999,999 | 6 (0.8%) | 0 (0.0%) |
| $1,000,000 or more | 14 (1.8%) | 0 (0.0%) |
| Total | 764 (100.0%) | 592 (100.0%) |
Household Income by Mortgage Status in Greenville
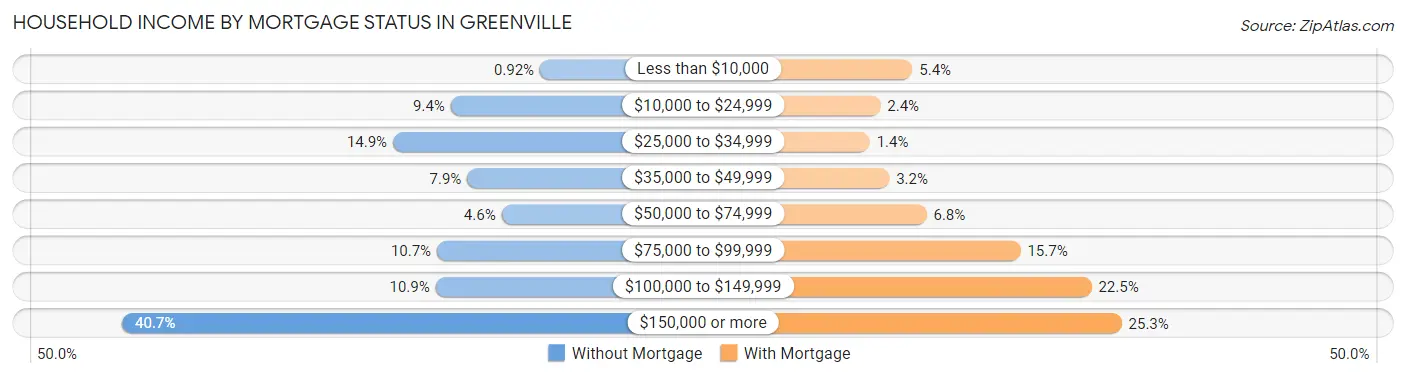
| Household Income | Without Mortgage | With Mortgage |
| Less than $10,000 | 7 (0.9%) | 32 (5.4%) |
| $10,000 to $24,999 | 72 (9.4%) | 14 (2.4%) |
| $25,000 to $34,999 | 114 (14.9%) | 8 (1.3%) |
| $35,000 to $49,999 | 60 (7.9%) | 19 (3.2%) |
| $50,000 to $74,999 | 35 (4.6%) | 40 (6.8%) |
| $75,000 to $99,999 | 82 (10.7%) | 93 (15.7%) |
| $100,000 to $149,999 | 83 (10.9%) | 133 (22.5%) |
| $150,000 or more | 311 (40.7%) | 150 (25.3%) |
| Total | 764 (100.0%) | 592 (100.0%) |
Property Value to Household Income Ratio in Greenville
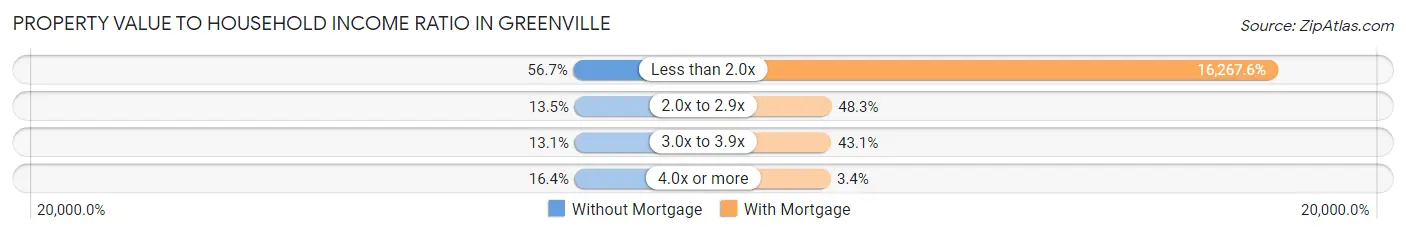
| Value-to-Income Ratio | Without Mortgage | With Mortgage |
| Less than 2.0x | 433 (56.7%) | 96,304 (16,267.6%) |
| 2.0x to 2.9x | 103 (13.5%) | 286 (48.3%) |
| 3.0x to 3.9x | 100 (13.1%) | 255 (43.1%) |
| 4.0x or more | 125 (16.4%) | 20 (3.4%) |
| Total | 764 (100.0%) | 592 (100.0%) |
Real Estate Taxes by Mortgage Status in Greenville
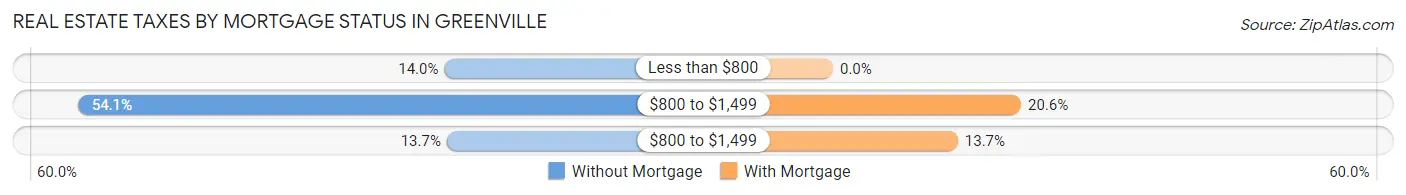
| Property Taxes | Without Mortgage | With Mortgage |
| Less than $800 | 107 (14.0%) | 0 (0.0%) |
| $800 to $1,499 | 413 (54.1%) | 122 (20.6%) |
| $800 to $1,499 | 105 (13.7%) | 81 (13.7%) |
| Total | 764 (100.0%) | 592 (100.0%) |
Health & Disability in Greenville
Health Insurance Coverage by Age in Greenville
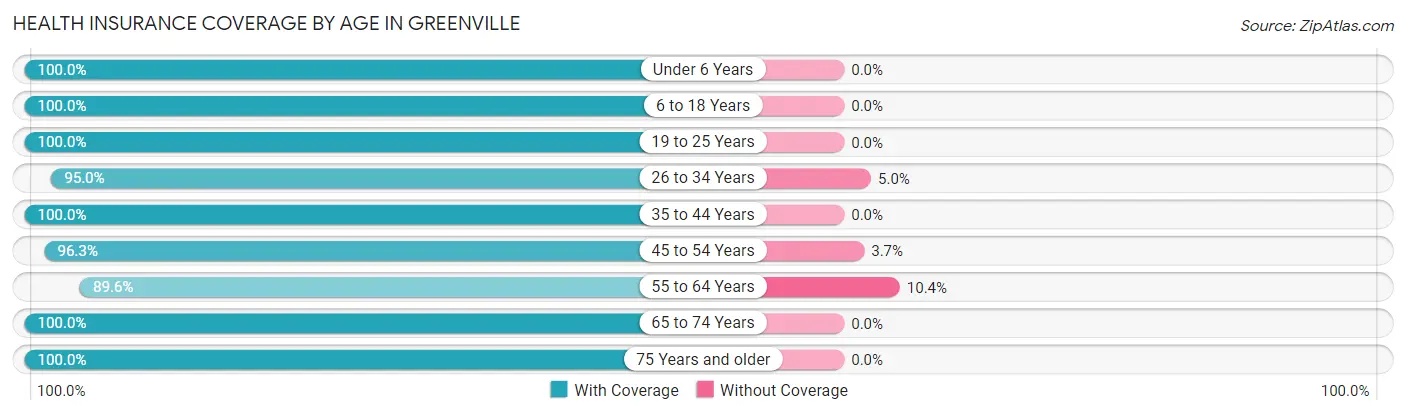
| Age Bracket | With Coverage | Without Coverage |
| Under 6 Years | 166 (100.0%) | 0 (0.0%) |
| 6 to 18 Years | 619 (100.0%) | 0 (0.0%) |
| 19 to 25 Years | 268 (100.0%) | 0 (0.0%) |
| 26 to 34 Years | 589 (95.0%) | 31 (5.0%) |
| 35 to 44 Years | 331 (100.0%) | 0 (0.0%) |
| 45 to 54 Years | 645 (96.3%) | 25 (3.7%) |
| 55 to 64 Years | 528 (89.6%) | 61 (10.4%) |
| 65 to 74 Years | 390 (100.0%) | 0 (0.0%) |
| 75 Years and older | 354 (100.0%) | 0 (0.0%) |
| Total | 3,890 (97.1%) | 117 (2.9%) |
Health Insurance Coverage by Citizenship Status in Greenville
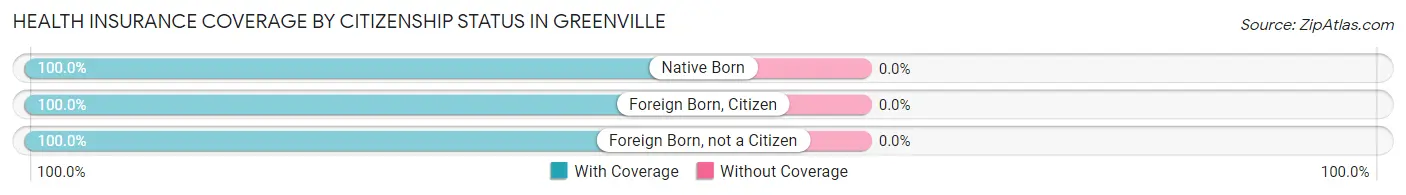
| Citizenship Status | With Coverage | Without Coverage |
| Native Born | 166 (100.0%) | 0 (0.0%) |
| Foreign Born, Citizen | 619 (100.0%) | 0 (0.0%) |
| Foreign Born, not a Citizen | 268 (100.0%) | 0 (0.0%) |
Health Insurance Coverage by Household Income in Greenville
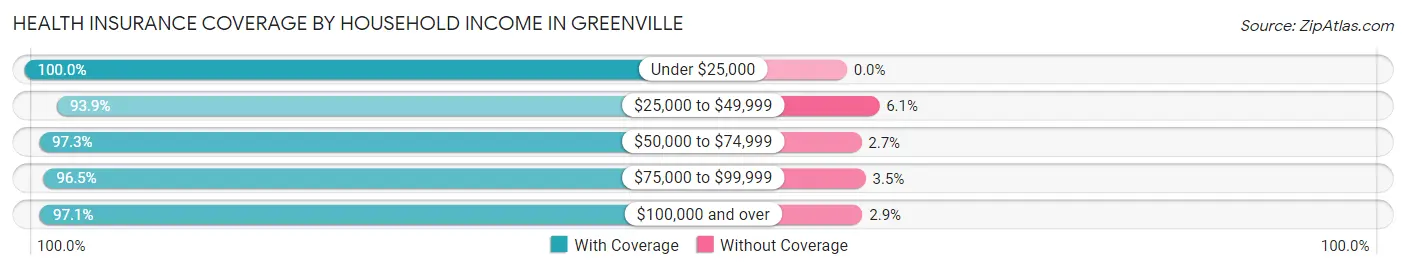
| Household Income | With Coverage | Without Coverage |
| Under $25,000 | 735 (100.0%) | 0 (0.0%) |
| $25,000 to $49,999 | 572 (93.9%) | 37 (6.1%) |
| $50,000 to $74,999 | 427 (97.3%) | 12 (2.7%) |
| $75,000 to $99,999 | 686 (96.5%) | 25 (3.5%) |
| $100,000 and over | 1,437 (97.1%) | 43 (2.9%) |
Public vs Private Health Insurance Coverage by Age in Greenville
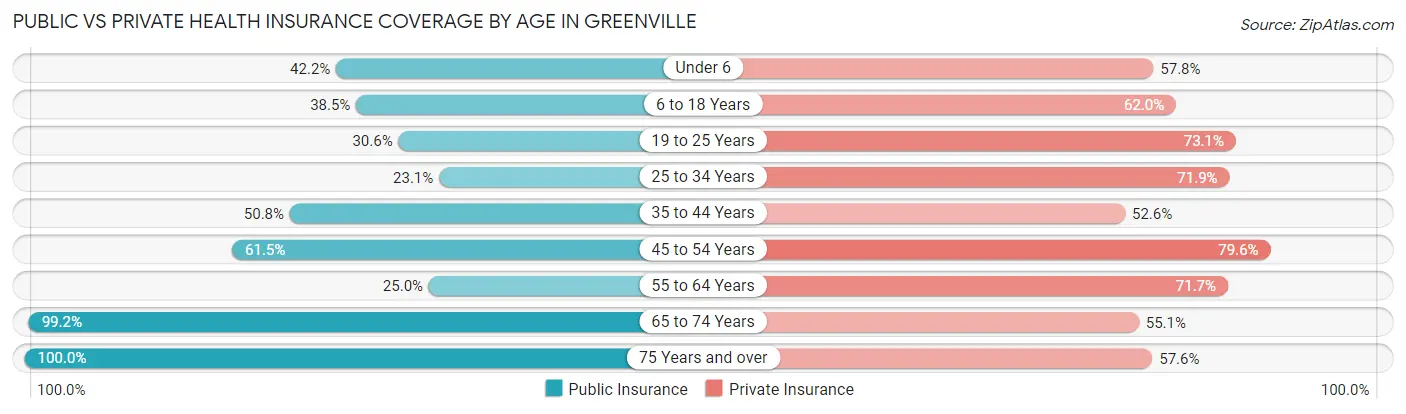
| Age Bracket | Public Insurance | Private Insurance |
| Under 6 | 70 (42.2%) | 96 (57.8%) |
| 6 to 18 Years | 238 (38.5%) | 384 (62.0%) |
| 19 to 25 Years | 82 (30.6%) | 196 (73.1%) |
| 25 to 34 Years | 143 (23.1%) | 446 (71.9%) |
| 35 to 44 Years | 168 (50.8%) | 174 (52.6%) |
| 45 to 54 Years | 412 (61.5%) | 533 (79.5%) |
| 55 to 64 Years | 147 (25.0%) | 422 (71.7%) |
| 65 to 74 Years | 387 (99.2%) | 215 (55.1%) |
| 75 Years and over | 354 (100.0%) | 204 (57.6%) |
| Total | 2,001 (49.9%) | 2,670 (66.6%) |
Disability Status by Sex by Age in Greenville
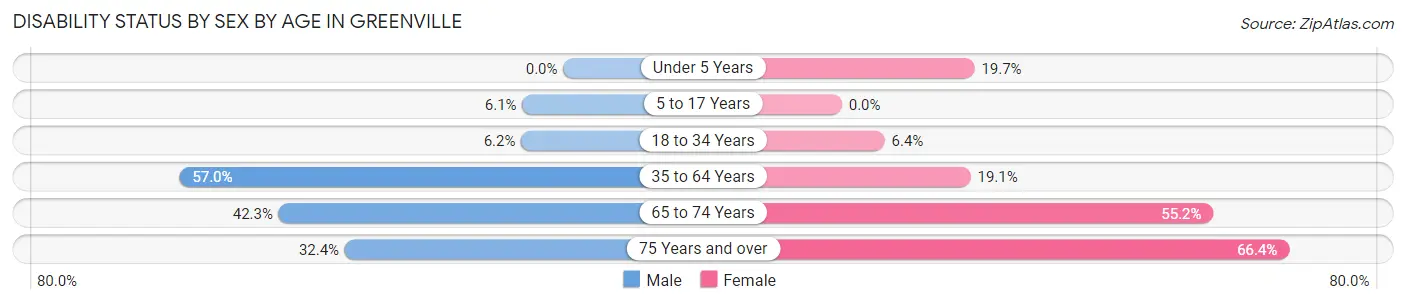
| Age Bracket | Male | Female |
| Under 5 Years | 0 (0.0%) | 13 (19.7%) |
| 5 to 17 Years | 23 (6.1%) | 0 (0.0%) |
| 18 to 34 Years | 28 (6.2%) | 29 (6.4%) |
| 35 to 64 Years | 480 (57.0%) | 143 (19.1%) |
| 65 to 74 Years | 79 (42.2%) | 112 (55.2%) |
| 75 Years and over | 24 (32.4%) | 186 (66.4%) |
Disability Class by Sex by Age in Greenville
Disability Class: Hearing Difficulty
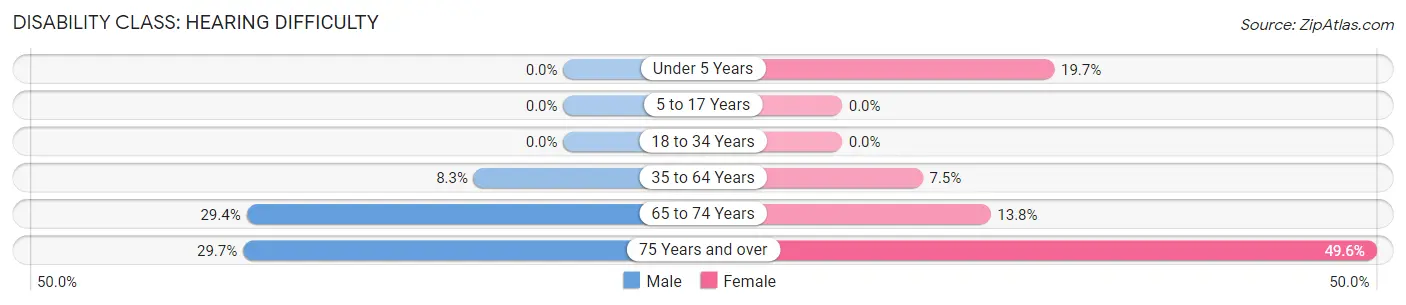
| Age Bracket | Male | Female |
| Under 5 Years | 0 (0.0%) | 13 (19.7%) |
| 5 to 17 Years | 0 (0.0%) | 0 (0.0%) |
| 18 to 34 Years | 0 (0.0%) | 0 (0.0%) |
| 35 to 64 Years | 70 (8.3%) | 56 (7.5%) |
| 65 to 74 Years | 55 (29.4%) | 28 (13.8%) |
| 75 Years and over | 22 (29.7%) | 139 (49.6%) |
Disability Class: Vision Difficulty
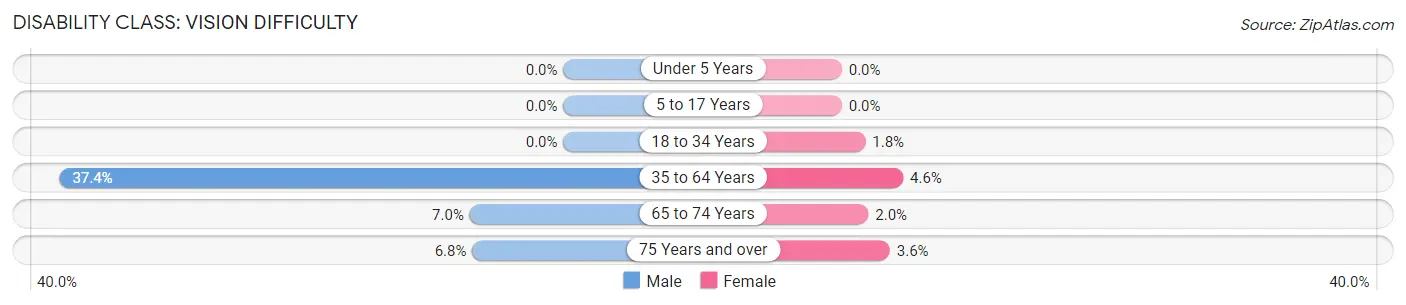
| Age Bracket | Male | Female |
| Under 5 Years | 0 (0.0%) | 0 (0.0%) |
| 5 to 17 Years | 0 (0.0%) | 0 (0.0%) |
| 18 to 34 Years | 0 (0.0%) | 8 (1.8%) |
| 35 to 64 Years | 315 (37.4%) | 34 (4.5%) |
| 65 to 74 Years | 13 (7.0%) | 4 (2.0%) |
| 75 Years and over | 5 (6.8%) | 10 (3.6%) |
Disability Class: Cognitive Difficulty
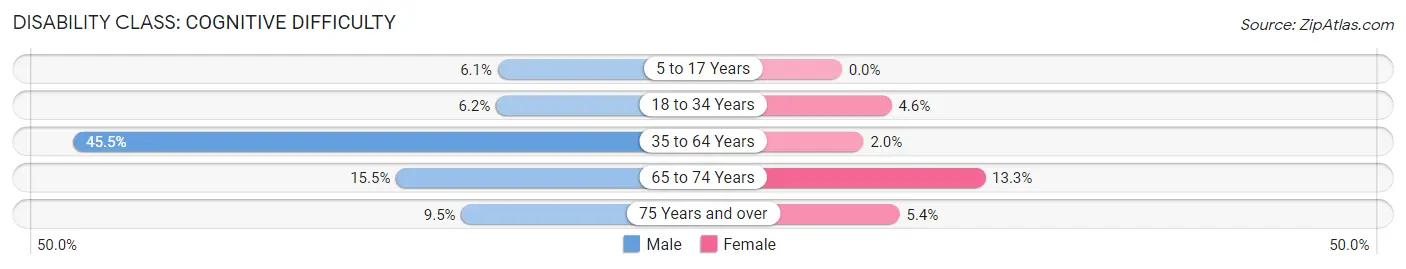
| Age Bracket | Male | Female |
| 5 to 17 Years | 23 (6.1%) | 0 (0.0%) |
| 18 to 34 Years | 28 (6.2%) | 21 (4.6%) |
| 35 to 64 Years | 383 (45.5%) | 15 (2.0%) |
| 65 to 74 Years | 29 (15.5%) | 27 (13.3%) |
| 75 Years and over | 7 (9.5%) | 15 (5.4%) |
Disability Class: Ambulatory Difficulty
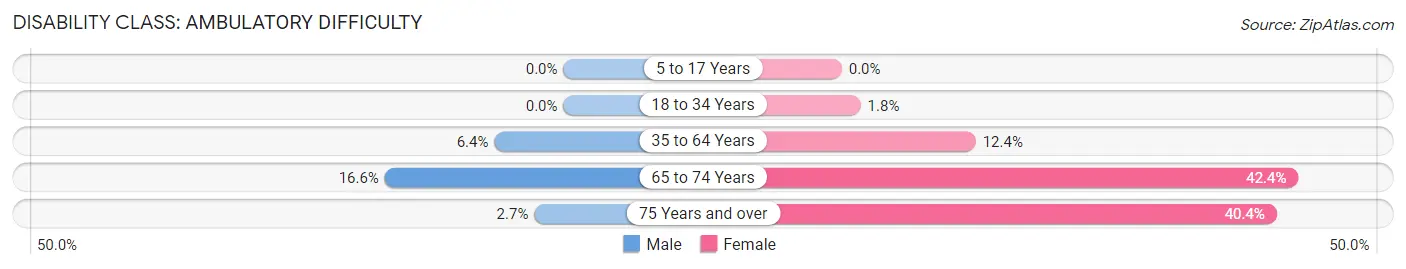
| Age Bracket | Male | Female |
| 5 to 17 Years | 0 (0.0%) | 0 (0.0%) |
| 18 to 34 Years | 0 (0.0%) | 8 (1.8%) |
| 35 to 64 Years | 54 (6.4%) | 93 (12.4%) |
| 65 to 74 Years | 31 (16.6%) | 86 (42.4%) |
| 75 Years and over | 2 (2.7%) | 113 (40.4%) |
Disability Class: Self-Care Difficulty
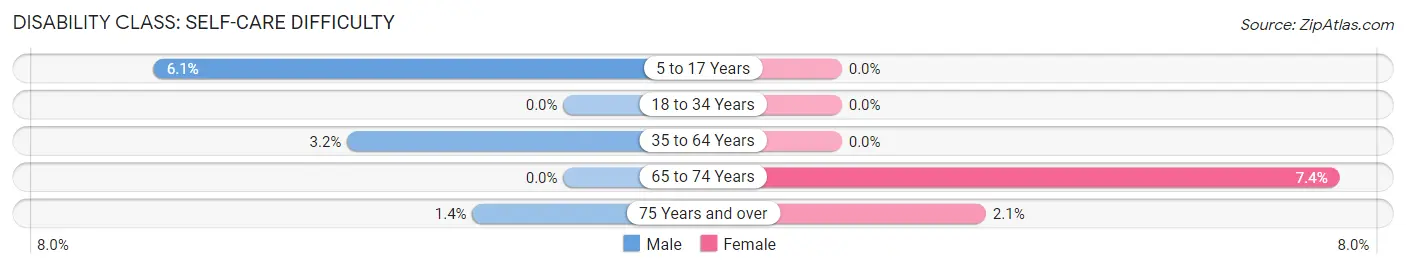
| Age Bracket | Male | Female |
| 5 to 17 Years | 23 (6.1%) | 0 (0.0%) |
| 18 to 34 Years | 0 (0.0%) | 0 (0.0%) |
| 35 to 64 Years | 27 (3.2%) | 0 (0.0%) |
| 65 to 74 Years | 0 (0.0%) | 15 (7.4%) |
| 75 Years and over | 1 (1.3%) | 6 (2.1%) |
Technology Access in Greenville
Computing Device Access in Greenville
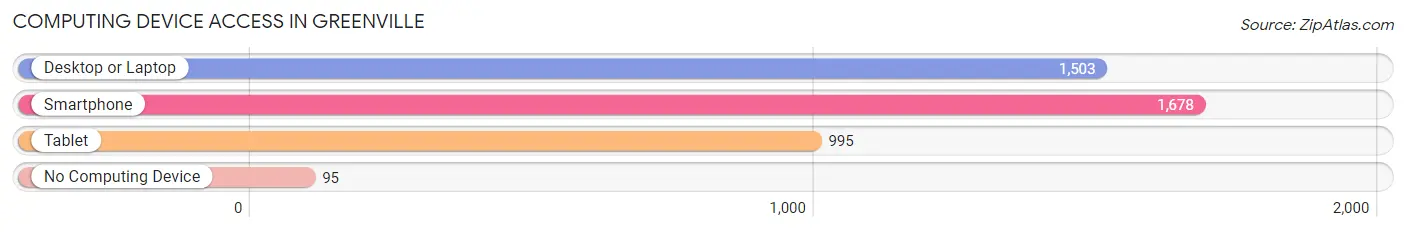
| Device Type | # Households | % Households |
| Desktop or Laptop | 1,503 | 78.2% |
| Smartphone | 1,678 | 87.3% |
| Tablet | 995 | 51.7% |
| No Computing Device | 95 | 4.9% |
| Total | 1,923 | 100.0% |
Internet Access in Greenville
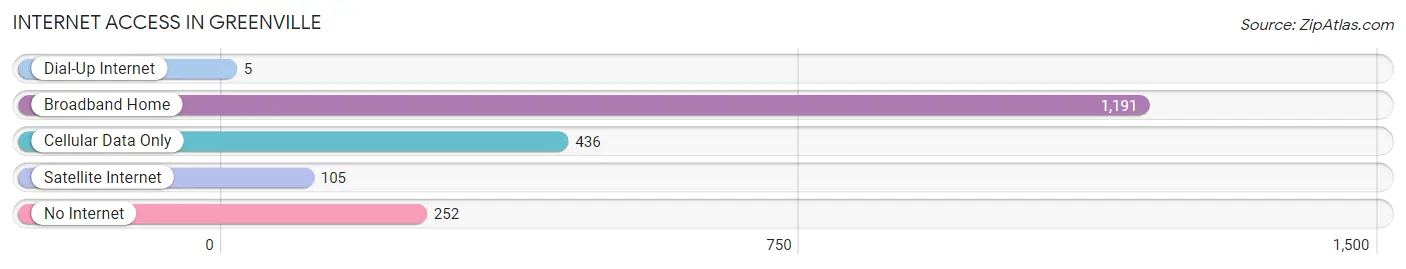
| Internet Type | # Households | % Households |
| Dial-Up Internet | 5 | 0.3% |
| Broadband Home | 1,191 | 61.9% |
| Cellular Data Only | 436 | 22.7% |
| Satellite Internet | 105 | 5.5% |
| No Internet | 252 | 13.1% |
| Total | 1,923 | 100.0% |
Greenville Summary
Greenville, Kentucky is a small city located in Muhlenberg County, Kentucky. It is situated on the banks of the Green River and is the county seat of Muhlenberg County. The city has a population of approximately 4,000 people and is part of the Owensboro metropolitan area.
History
Greenville was founded in 1810 by William Green, a Revolutionary War veteran. The city was originally known as Green’s Landing, but was later renamed Greenville in 1817. The city was incorporated in 1820 and was the first city in Muhlenberg County.
Greenville was an important stop on the Louisville and Nashville Railroad, which was completed in 1859. The railroad brought economic growth to the city and helped to make it a major shipping center for the region.
During the Civil War, Greenville was a major supply center for the Confederate Army. The city was also the site of a major battle in 1862, when Union forces attempted to capture the city. The Union forces were unsuccessful and the city remained in Confederate hands until the end of the war.
Geography
Greenville is located in western Kentucky, approximately 50 miles from the state capital of Frankfort. The city is situated on the banks of the Green River and is surrounded by rolling hills and farmland. The city has a total area of 4.2 square miles, all of which is land.
The climate in Greenville is humid subtropical, with hot, humid summers and mild winters. The average annual temperature is around 60 degrees Fahrenheit, with an average high of around 80 degrees in the summer and an average low of around 40 degrees in the winter.
Economy
Greenville’s economy is largely based on agriculture and manufacturing. The city is home to several large manufacturing plants, including a paper mill, a steel mill, and a chemical plant. The city is also home to several small businesses, including restaurants, retail stores, and service providers.
The city is also home to several educational institutions, including the University of Kentucky at Greenville and Muhlenberg County Community College.
Demographics
As of the 2010 census, Greenville had a population of 4,062 people. The racial makeup of the city was 94.3% White, 3.2% African American, 0.3% Native American, 0.3% Asian, 0.1% Pacific Islander, 0.7% from other races, and 1.2% from two or more races. Hispanic or Latino of any race were 1.7% of the population.
The median household income in Greenville was $31,250, and the median family income was $37,500. The per capita income for the city was $17,845. About 17.2% of the population was below the poverty line.
Greenville is a small city with a rich history and a diverse economy. The city is home to several educational institutions and is a major shipping center for the region. The city has a population of approximately 4,000 people and is part of the Owensboro metropolitan area.
Common Questions
What is Per Capita Income in Greenville?
Per Capita income in Greenville is $41,424.
What is the Median Family Income in Greenville?
Median Family Income in Greenville is $100,536.
What is the Median Household income in Greenville?
Median Household Income in Greenville is $68,984.
What is Income or Wage Gap in Greenville?
Income or Wage Gap in Greenville is 43.1%.
Women in Greenville earn 56.9 cents for every dollar earned by a man.
What is Inequality or Gini Index in Greenville?
Inequality or Gini Index in Greenville is 0.50.
What is the Total Population of Greenville?
Total Population of Greenville is 4,463.
What is the Total Male Population of Greenville?
Total Male Population of Greenville is 2,294.
What is the Total Female Population of Greenville?
Total Female Population of Greenville is 2,169.
What is the Ratio of Males per 100 Females in Greenville?
There are 105.76 Males per 100 Females in Greenville.
What is the Ratio of Females per 100 Males in Greenville?
There are 94.55 Females per 100 Males in Greenville.
What is the Median Population Age in Greenville?
Median Population Age in Greenville is 45.4 Years.
What is the Average Family Size in Greenville
Average Family Size in Greenville is 2.6 People.
What is the Average Household Size in Greenville
Average Household Size in Greenville is 2.1 People.
How Large is the Labor Force in Greenville?
There are 2,100 People in the Labor Forcein in Greenville.
What is the Percentage of People in the Labor Force in Greenville?
54.6% of People are in the Labor Force in Greenville.
What is the Unemployment Rate in Greenville?
Unemployment Rate in Greenville is 4.6%.