Inwood, WV Map & Demographics
Inwood Map
Inwood Overview
$36,341
PER CAPITA INCOME
$99,474
AVG FAMILY INCOME
$90,327
AVG HOUSEHOLD INCOME
31.8%
WAGE / INCOME GAP [ % ]
68.2¢/ $1
WAGE / INCOME GAP [ $ ]
0.29
INEQUALITY / GINI INDEX
2,831
TOTAL POPULATION
1,495
MALE POPULATION
1,336
FEMALE POPULATION
111.90
MALES / 100 FEMALES
89.36
FEMALES / 100 MALES
40.7
MEDIAN AGE
2.9
AVG FAMILY SIZE
2.6
AVG HOUSEHOLD SIZE
1,441
LABOR FORCE [ PEOPLE ]
63.0%
PERCENT IN LABOR FORCE
10.7%
UNEMPLOYMENT RATE
Inwood Zip Codes
Inwood Area Codes
Income in Inwood
Income Overview in Inwood
Per Capita Income in Inwood is $36,341, while median incomes of families and households are $99,474 and $90,327 respectively.
| Characteristic | Number | Measure |
| Per Capita Income | 2,831 | $36,341 |
| Median Family Income | 808 | $99,474 |
| Mean Family Income | 808 | $92,444 |
| Median Household Income | 1,103 | $90,327 |
| Mean Household Income | 1,103 | $90,858 |
| Income Deficit | 808 | $0 |
| Wage / Income Gap (%) | 2,831 | 31.77% |
| Wage / Income Gap ($) | 2,831 | 68.23¢ per $1 |
| Gini / Inequality Index | 2,831 | 0.29 |
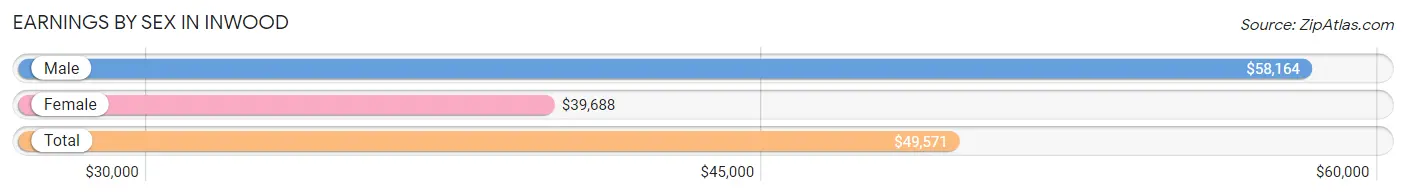
Earnings by Sex in Inwood
Average Earnings in Inwood are $49,571, $58,164 for men and $39,688 for women, a difference of 31.8%.
| Sex | Number | Average Earnings |
| Male | 869 (57.1%) | $58,164 |
| Female | 653 (42.9%) | $39,688 |
| Total | 1,522 (100.0%) | $49,571 |
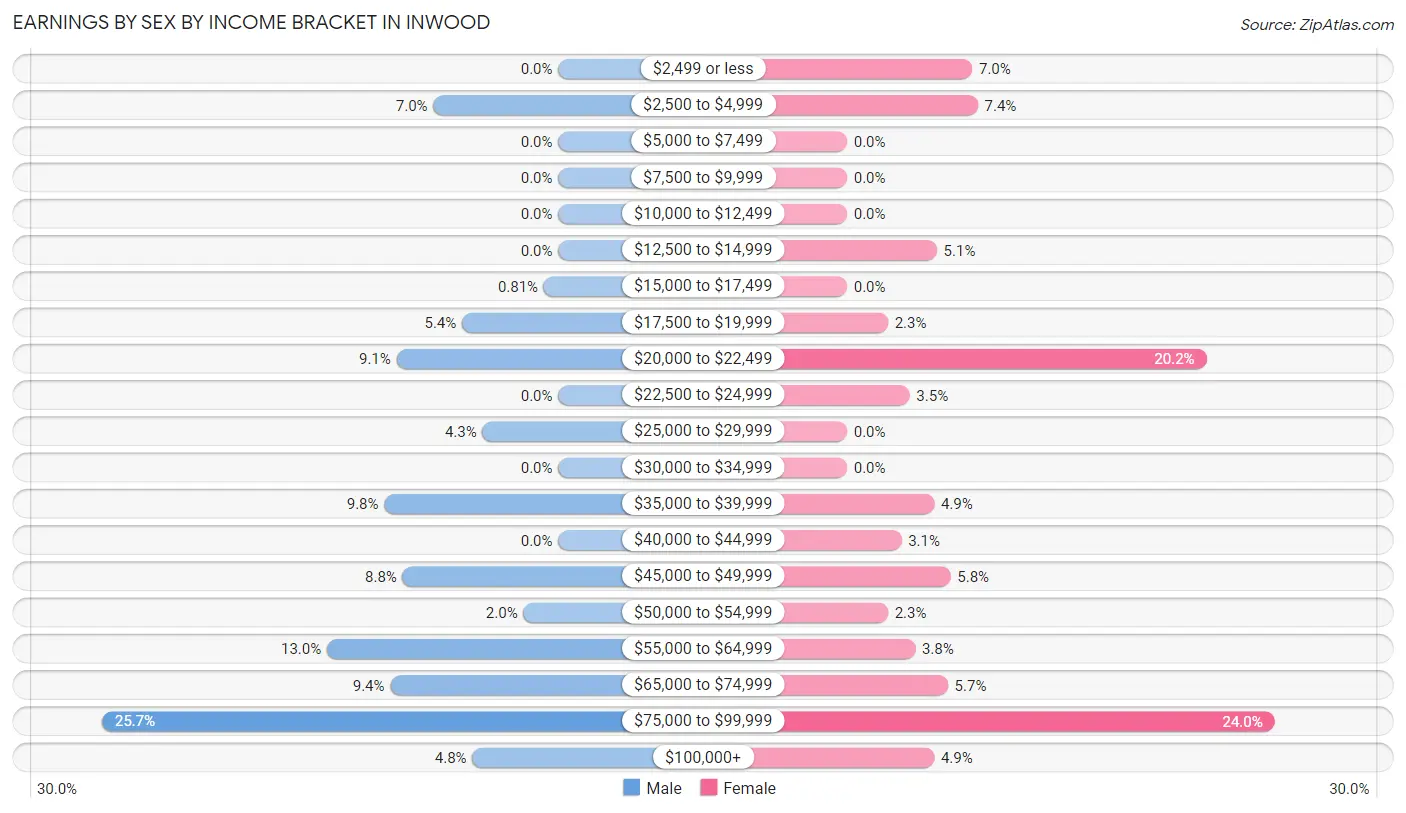
Earnings by Sex by Income Bracket in Inwood
The most common earnings brackets in Inwood are $75,000 to $99,999 for men (223 | 25.7%) and $75,000 to $99,999 for women (157 | 24.0%).
| Income | Male | Female |
| $2,499 or less | 0 (0.0%) | 46 (7.0%) |
| $2,500 to $4,999 | 61 (7.0%) | 48 (7.3%) |
| $5,000 to $7,499 | 0 (0.0%) | 0 (0.0%) |
| $7,500 to $9,999 | 0 (0.0%) | 0 (0.0%) |
| $10,000 to $12,499 | 0 (0.0%) | 0 (0.0%) |
| $12,500 to $14,999 | 0 (0.0%) | 33 (5.1%) |
| $15,000 to $17,499 | 7 (0.8%) | 0 (0.0%) |
| $17,500 to $19,999 | 47 (5.4%) | 15 (2.3%) |
| $20,000 to $22,499 | 79 (9.1%) | 132 (20.2%) |
| $22,500 to $24,999 | 0 (0.0%) | 23 (3.5%) |
| $25,000 to $29,999 | 37 (4.3%) | 0 (0.0%) |
| $30,000 to $34,999 | 0 (0.0%) | 0 (0.0%) |
| $35,000 to $39,999 | 85 (9.8%) | 32 (4.9%) |
| $40,000 to $44,999 | 0 (0.0%) | 20 (3.1%) |
| $45,000 to $49,999 | 76 (8.7%) | 38 (5.8%) |
| $50,000 to $54,999 | 17 (2.0%) | 15 (2.3%) |
| $55,000 to $64,999 | 113 (13.0%) | 25 (3.8%) |
| $65,000 to $74,999 | 82 (9.4%) | 37 (5.7%) |
| $75,000 to $99,999 | 223 (25.7%) | 157 (24.0%) |
| $100,000+ | 42 (4.8%) | 32 (4.9%) |
| Total | 869 (100.0%) | 653 (100.0%) |
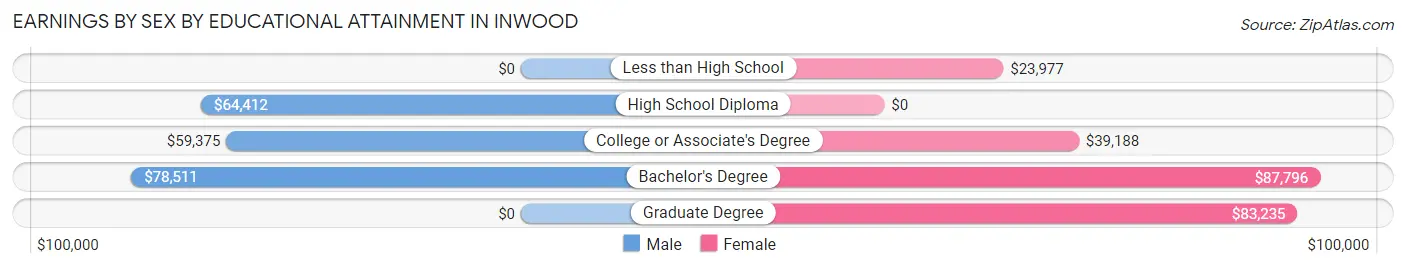
Earnings by Sex by Educational Attainment in Inwood
Average earnings in Inwood are $67,939 for men and $48,684 for women, a difference of 28.3%. Men with an educational attainment of bachelor's degree enjoy the highest average annual earnings of $78,511, while those with college or associate's degree education earn the least with $59,375. Women with an educational attainment of bachelor's degree earn the most with the average annual earnings of $87,796, while those with less than high school education have the smallest earnings of $23,977.
| Educational Attainment | Male Income | Female Income |
| Less than High School | - | - |
| High School Diploma | $64,412 | $0 |
| College or Associate's Degree | $59,375 | $39,188 |
| Bachelor's Degree | $78,511 | $87,796 |
| Graduate Degree | - | - |
| Total | $67,939 | $48,684 |
Family Income in Inwood
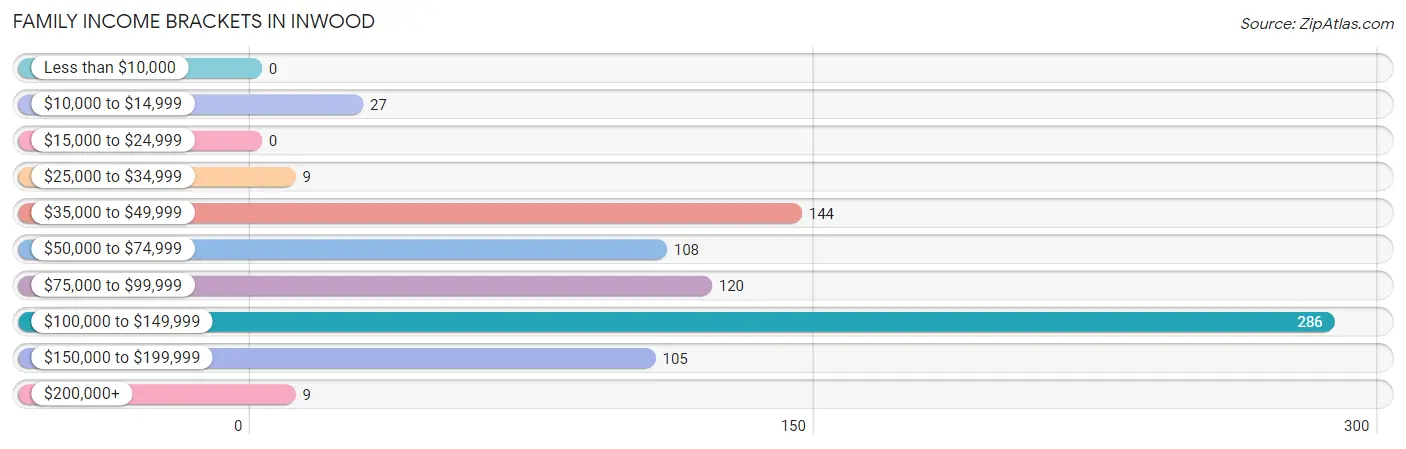
Family Income Brackets in Inwood
According to the Inwood family income data, there are 286 families falling into the $100,000 to $149,999 income range, which is the most common income bracket and makes up 35.4% of all families.
| Income Bracket | # Families | % Families |
| Less than $10,000 | 0 | 0.0% |
| $10,000 to $14,999 | 27 | 3.3% |
| $15,000 to $24,999 | 0 | 0.0% |
| $25,000 to $34,999 | 9 | 1.1% |
| $35,000 to $49,999 | 144 | 17.8% |
| $50,000 to $74,999 | 108 | 13.4% |
| $75,000 to $99,999 | 120 | 14.9% |
| $100,000 to $149,999 | 286 | 35.4% |
| $150,000 to $199,999 | 105 | 13.0% |
| $200,000+ | 9 | 1.1% |
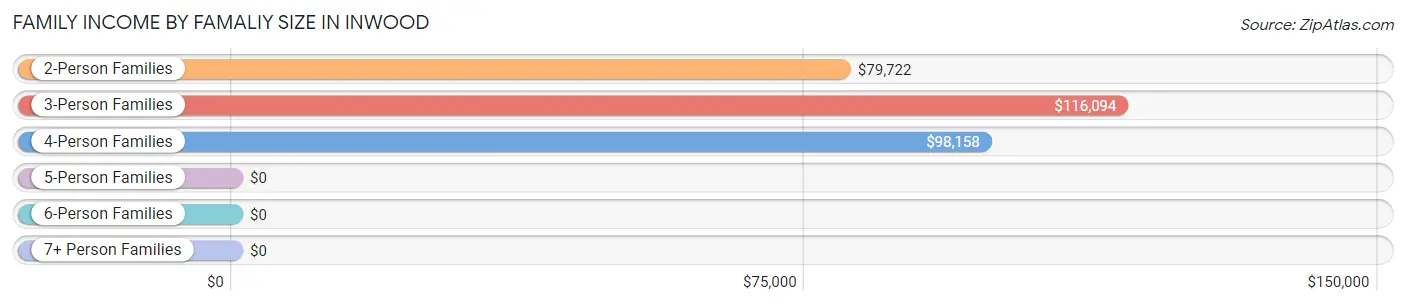
Family Income by Famaliy Size in Inwood
3-person families (57 | 7.0%) account for the highest median family income in Inwood with $116,094 per family, while 2-person families (522 | 64.6%) have the highest median income of $39,861 per family member.
| Income Bracket | # Families | Median Income |
| 2-Person Families | 522 (64.6%) | $79,722 |
| 3-Person Families | 57 (7.0%) | $116,094 |
| 4-Person Families | 156 (19.3%) | $98,158 |
| 5-Person Families | 66 (8.2%) | $0 |
| 6-Person Families | 7 (0.9%) | $0 |
| 7+ Person Families | 0 (0.0%) | $0 |
| Total | 808 (100.0%) | $99,474 |
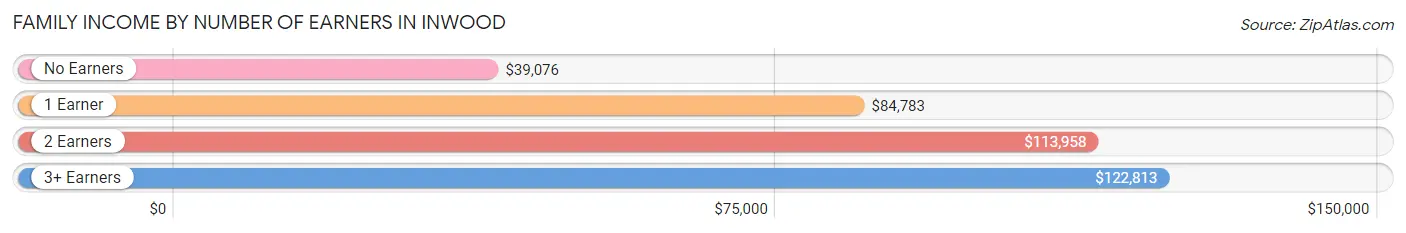
Family Income by Number of Earners in Inwood
The median family income in Inwood is $99,474, with families comprising 3+ earners (87) having the highest median family income of $122,813, while families with no earners (167) have the lowest median family income of $39,076, accounting for 10.8% and 20.7% of families, respectively.
| Number of Earners | # Families | Median Income |
| No Earners | 167 (20.7%) | $39,076 |
| 1 Earner | 310 (38.4%) | $84,783 |
| 2 Earners | 244 (30.2%) | $113,958 |
| 3+ Earners | 87 (10.8%) | $122,813 |
| Total | 808 (100.0%) | $99,474 |
Household Income in Inwood
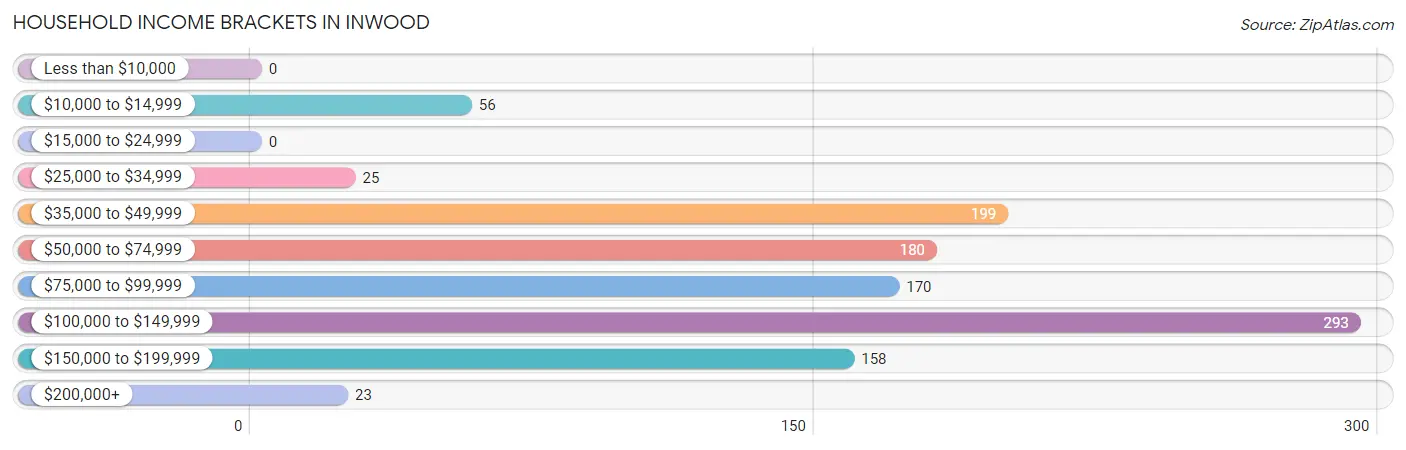
Household Income Brackets in Inwood
With 293 households falling in the category, the $100,000 to $149,999 income range is the most frequent in Inwood, accounting for 26.6% of all households.
| Income Bracket | # Households | % Households |
| Less than $10,000 | 0 | 0.0% |
| $10,000 to $14,999 | 56 | 5.1% |
| $15,000 to $24,999 | 0 | 0.0% |
| $25,000 to $34,999 | 25 | 2.3% |
| $35,000 to $49,999 | 199 | 18.0% |
| $50,000 to $74,999 | 180 | 16.3% |
| $75,000 to $99,999 | 170 | 15.4% |
| $100,000 to $149,999 | 293 | 26.6% |
| $150,000 to $199,999 | 158 | 14.3% |
| $200,000+ | 23 | 2.1% |
Household Income by Householder Age in Inwood
The median household income in Inwood is $90,327, with the highest median household income of $113,575 found in the 45 to 64 years age bracket for the primary householder. A total of 382 households (34.6%) fall into this category. Meanwhile, the 15 to 24 years age bracket for the primary householder has the lowest median household income of $0, with 54 households (4.9%) in this group.
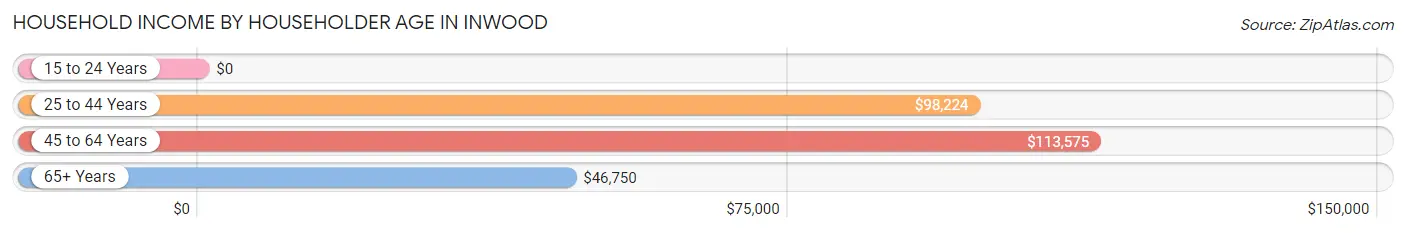
| Income Bracket | # Households | Median Income |
| 15 to 24 Years | 54 (4.9%) | $0 |
| 25 to 44 Years | 345 (31.3%) | $98,224 |
| 45 to 64 Years | 382 (34.6%) | $113,575 |
| 65+ Years | 322 (29.2%) | $46,750 |
| Total | 1,103 (100.0%) | $90,327 |
Poverty in Inwood
Income Below Poverty by Sex and Age in Inwood
With 1.8% poverty level for males and 7.2% for females among the residents of Inwood, 75 year old and over males and 18 to 24 year old females are the most vulnerable to poverty, with 18 males (18.8%) and 14 females (17.3%) in their respective age groups living below the poverty level.
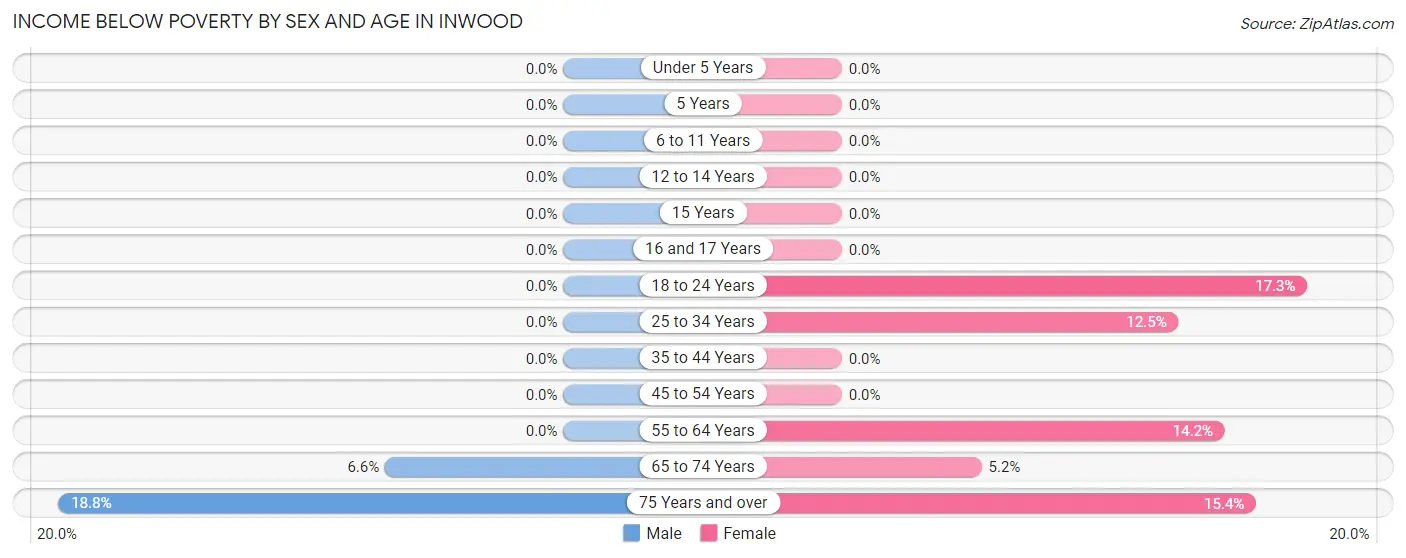
| Age Bracket | Male | Female |
| Under 5 Years | 0 (0.0%) | 0 (0.0%) |
| 5 Years | 0 (0.0%) | 0 (0.0%) |
| 6 to 11 Years | 0 (0.0%) | 0 (0.0%) |
| 12 to 14 Years | 0 (0.0%) | 0 (0.0%) |
| 15 Years | 0 (0.0%) | 0 (0.0%) |
| 16 and 17 Years | 0 (0.0%) | 0 (0.0%) |
| 18 to 24 Years | 0 (0.0%) | 14 (17.3%) |
| 25 to 34 Years | 0 (0.0%) | 24 (12.5%) |
| 35 to 44 Years | 0 (0.0%) | 0 (0.0%) |
| 45 to 54 Years | 0 (0.0%) | 0 (0.0%) |
| 55 to 64 Years | 0 (0.0%) | 29 (14.2%) |
| 65 to 74 Years | 9 (6.6%) | 8 (5.2%) |
| 75 Years and over | 18 (18.8%) | 18 (15.4%) |
| Total | 27 (1.8%) | 93 (7.2%) |
Income Above Poverty by Sex and Age in Inwood
According to the poverty statistics in Inwood, males aged under 5 years and females aged under 5 years are the age groups that are most secure financially, with 100.0% of males and 100.0% of females in these age groups living above the poverty line.
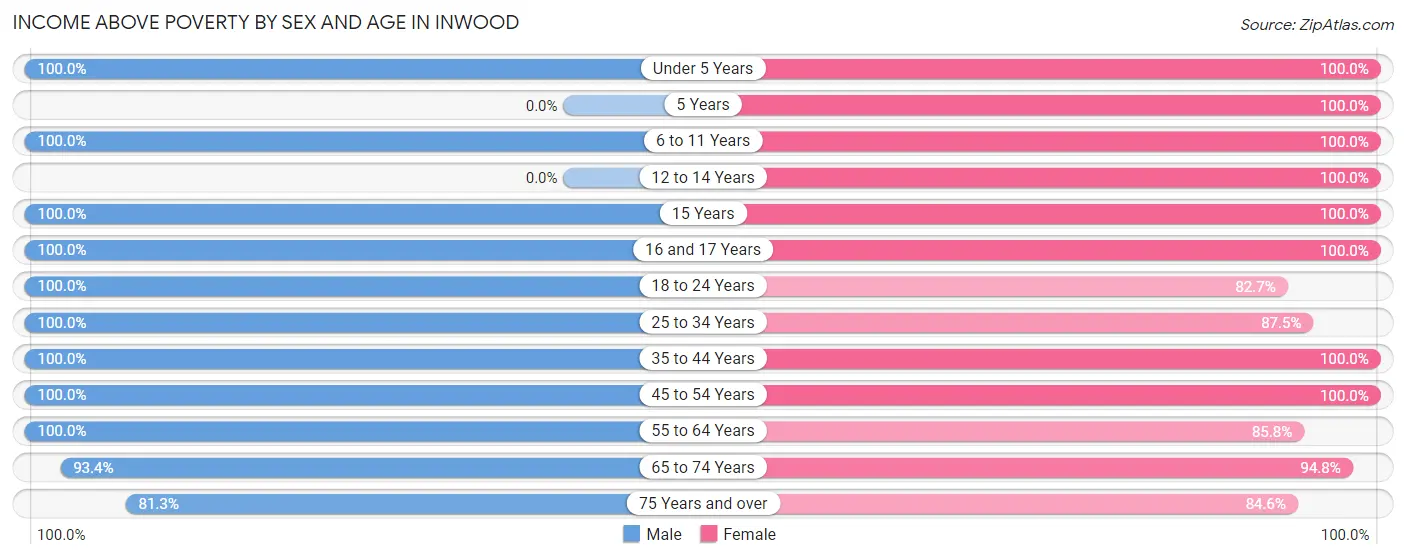
| Age Bracket | Male | Female |
| Under 5 Years | 78 (100.0%) | 112 (100.0%) |
| 5 Years | 0 (0.0%) | 7 (100.0%) |
| 6 to 11 Years | 178 (100.0%) | 90 (100.0%) |
| 12 to 14 Years | 0 (0.0%) | 7 (100.0%) |
| 15 Years | 15 (100.0%) | 7 (100.0%) |
| 16 and 17 Years | 36 (100.0%) | 60 (100.0%) |
| 18 to 24 Years | 195 (100.0%) | 67 (82.7%) |
| 25 to 34 Years | 211 (100.0%) | 168 (87.5%) |
| 35 to 44 Years | 195 (100.0%) | 160 (100.0%) |
| 45 to 54 Years | 225 (100.0%) | 96 (100.0%) |
| 55 to 64 Years | 130 (100.0%) | 175 (85.8%) |
| 65 to 74 Years | 127 (93.4%) | 146 (94.8%) |
| 75 Years and over | 78 (81.2%) | 99 (84.6%) |
| Total | 1,468 (98.2%) | 1,194 (92.8%) |
Income Below Poverty Among Married-Couple Families in Inwood
The poverty statistics for married-couple families in Inwood show that 4.1% or 27 of the total 652 families live below the poverty line. Families with no children have the highest poverty rate of 6.6%, comprising of 27 families. On the other hand, families with 1 or 2 children have the lowest poverty rate of 0.0%, which includes 0 families.
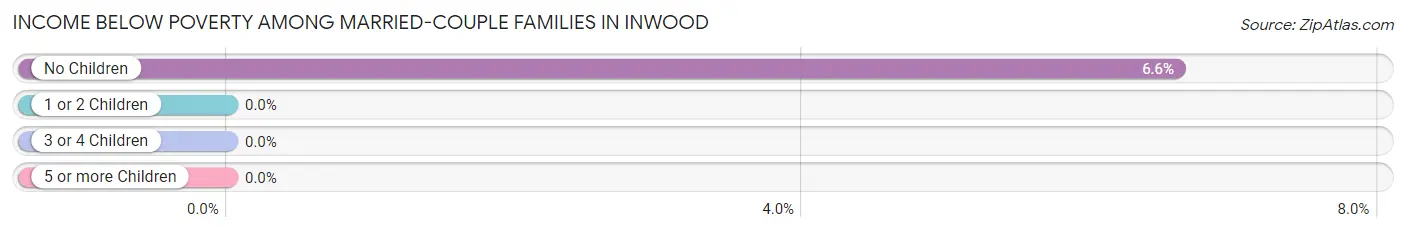
| Children | Above Poverty | Below Poverty |
| No Children | 382 (93.4%) | 27 (6.6%) |
| 1 or 2 Children | 201 (100.0%) | 0 (0.0%) |
| 3 or 4 Children | 42 (100.0%) | 0 (0.0%) |
| 5 or more Children | 0 (0.0%) | 0 (0.0%) |
| Total | 625 (95.9%) | 27 (4.1%) |
Income Below Poverty Among Single-Parent Households in Inwood
| Children | Single Father | Single Mother |
| No Children | 0 (0.0%) | 0 (0.0%) |
| 1 or 2 Children | 0 (0.0%) | 0 (0.0%) |
| 3 or 4 Children | 0 (0.0%) | 0 (0.0%) |
| 5 or more Children | 0 (0.0%) | 0 (0.0%) |
| Total | 0 (0.0%) | 0 (0.0%) |
Income Below Poverty Among Married-Couple vs Single-Parent Households in Inwood
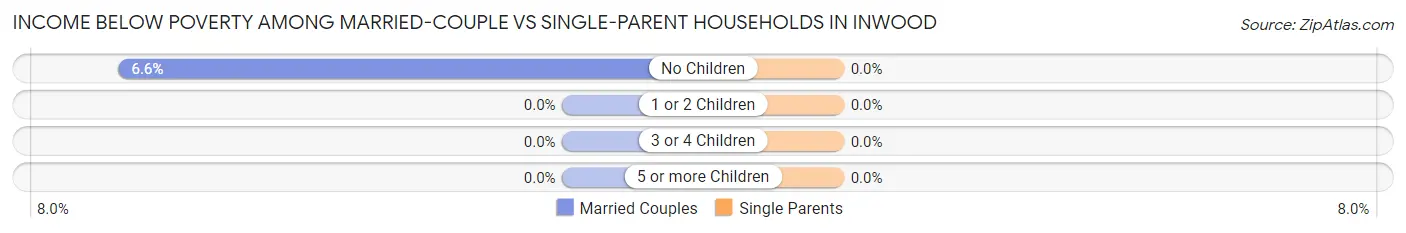
| Children | Married-Couple Families | Single-Parent Households |
| No Children | 27 (6.6%) | 0 (0.0%) |
| 1 or 2 Children | 0 (0.0%) | 0 (0.0%) |
| 3 or 4 Children | 0 (0.0%) | 0 (0.0%) |
| 5 or more Children | 0 (0.0%) | 0 (0.0%) |
| Total | 27 (4.1%) | 0 (0.0%) |
Race in Inwood
The most populous races in Inwood are White / Caucasian (2,398 | 84.7%), Two or more Races (172 | 6.1%), and Asian (150 | 5.3%).
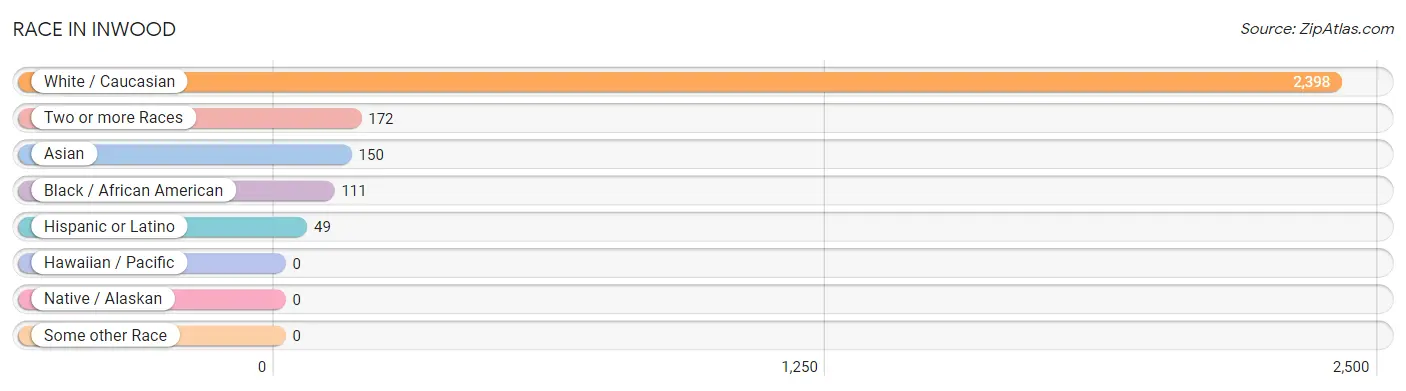
| Race | # Population | % Population |
| Asian | 150 | 5.3% |
| Black / African American | 111 | 3.9% |
| Hawaiian / Pacific | 0 | 0.0% |
| Hispanic or Latino | 49 | 1.7% |
| Native / Alaskan | 0 | 0.0% |
| White / Caucasian | 2,398 | 84.7% |
| Two or more Races | 172 | 6.1% |
| Some other Race | 0 | 0.0% |
| Total | 2,831 | 100.0% |
Ancestry in Inwood
The most populous ancestries reported in Inwood are English (527 | 18.6%), German (401 | 14.2%), Irish (318 | 11.2%), Italian (152 | 5.4%), and Scottish (126 | 4.4%), together accounting for 53.8% of all Inwood residents.
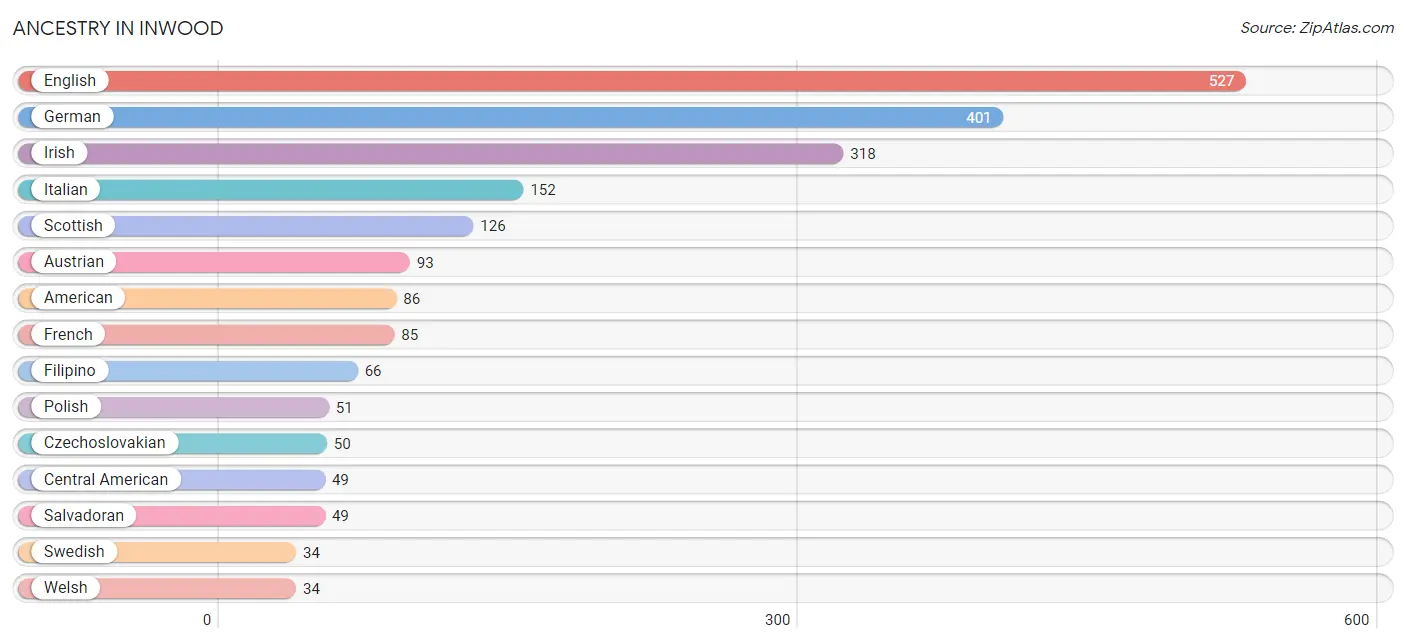
| Ancestry | # Population | % Population |
| American | 86 | 3.0% |
| Austrian | 93 | 3.3% |
| Bhutanese | 16 | 0.6% |
| British | 8 | 0.3% |
| Central American | 49 | 1.7% |
| Croatian | 17 | 0.6% |
| Czechoslovakian | 50 | 1.8% |
| Eastern European | 9 | 0.3% |
| English | 527 | 18.6% |
| European | 33 | 1.2% |
| Filipino | 66 | 2.3% |
| French | 85 | 3.0% |
| German | 401 | 14.2% |
| Hungarian | 30 | 1.1% |
| Indian (Asian) | 17 | 0.6% |
| Irish | 318 | 11.2% |
| Italian | 152 | 5.4% |
| Japanese | 2 | 0.1% |
| Polish | 51 | 1.8% |
| Salvadoran | 49 | 1.7% |
| Scotch-Irish | 28 | 1.0% |
| Scottish | 126 | 4.4% |
| Sri Lankan | 26 | 0.9% |
| Swedish | 34 | 1.2% |
| Welsh | 34 | 1.2% | View All 25 Rows |
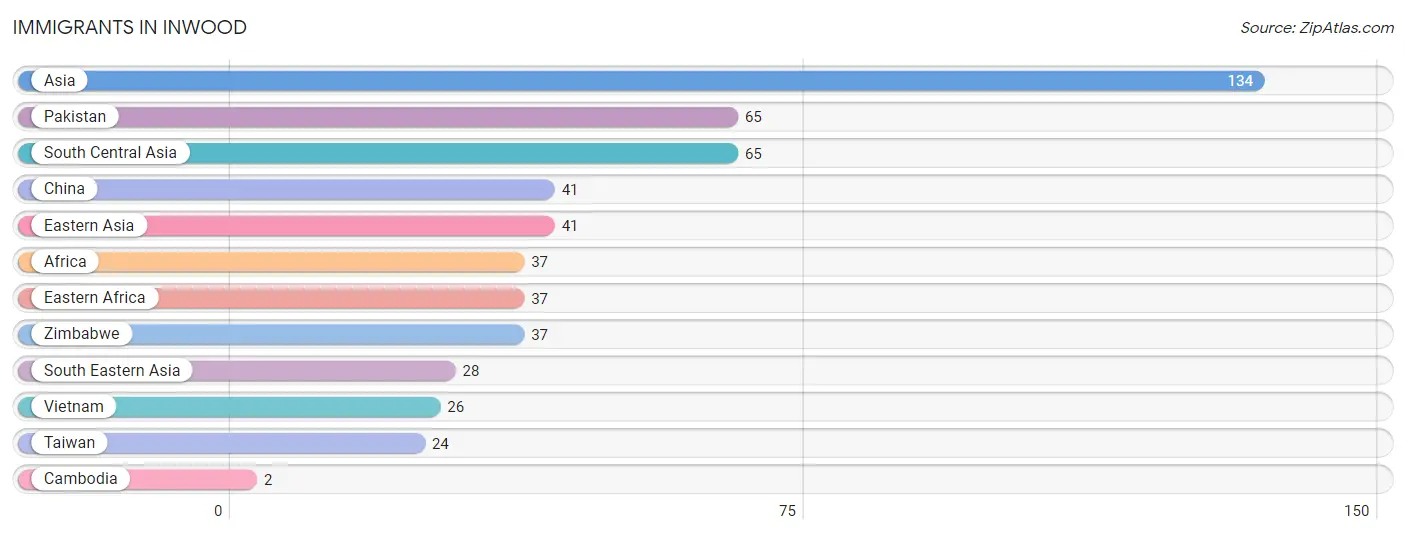
Immigrants in Inwood
The most numerous immigrant groups reported in Inwood came from Asia (134 | 4.7%), Pakistan (65 | 2.3%), South Central Asia (65 | 2.3%), China (41 | 1.5%), and Eastern Asia (41 | 1.5%), together accounting for 12.2% of all Inwood residents.
| Immigration Origin | # Population | % Population |
| Africa | 37 | 1.3% |
| Asia | 134 | 4.7% |
| Cambodia | 2 | 0.1% |
| China | 41 | 1.5% |
| Eastern Africa | 37 | 1.3% |
| Eastern Asia | 41 | 1.5% |
| Pakistan | 65 | 2.3% |
| South Central Asia | 65 | 2.3% |
| South Eastern Asia | 28 | 1.0% |
| Taiwan | 24 | 0.9% |
| Vietnam | 26 | 0.9% |
| Zimbabwe | 37 | 1.3% | View All 12 Rows |
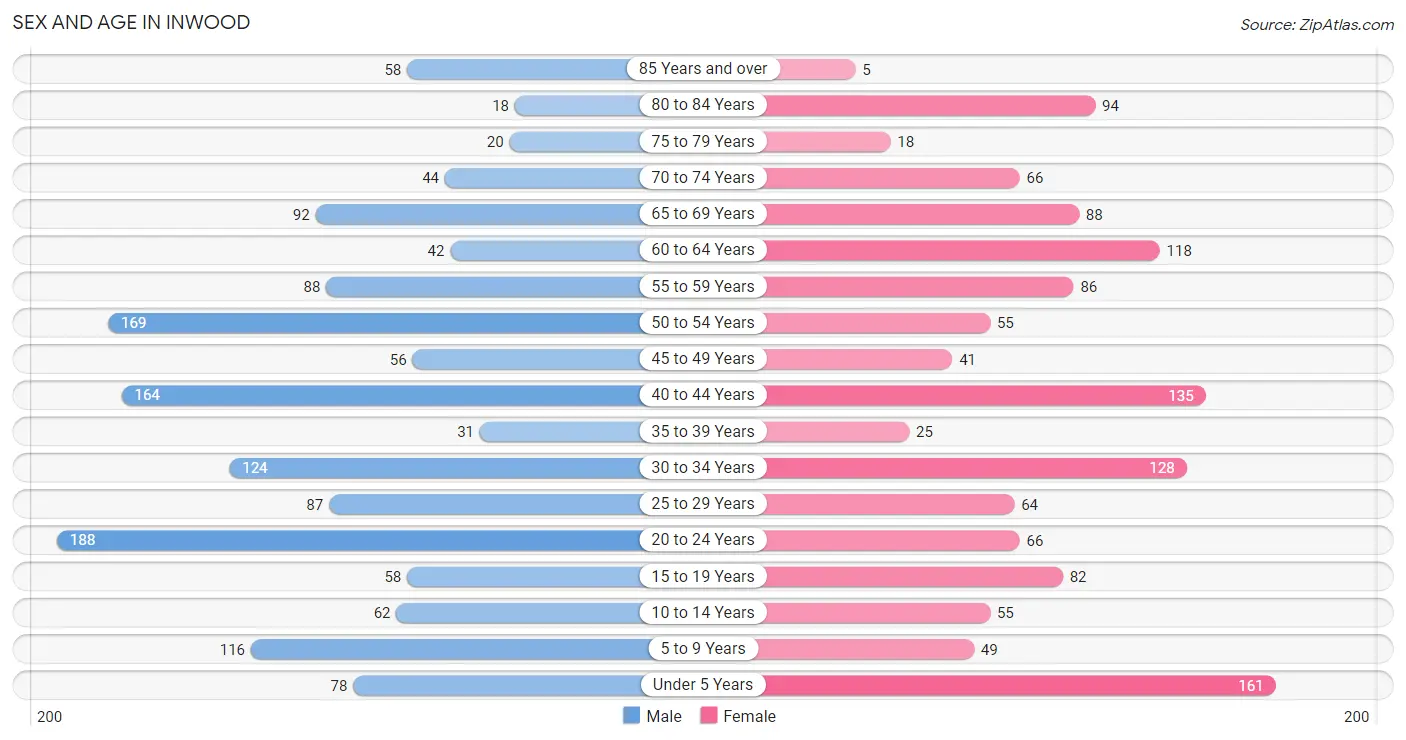
Sex and Age in Inwood
Sex and Age in Inwood
The most populous age groups in Inwood are 20 to 24 Years (188 | 12.6%) for men and Under 5 Years (161 | 12.0%) for women.
| Age Bracket | Male | Female |
| Under 5 Years | 78 (5.2%) | 161 (12.0%) |
| 5 to 9 Years | 116 (7.8%) | 49 (3.7%) |
| 10 to 14 Years | 62 (4.2%) | 55 (4.1%) |
| 15 to 19 Years | 58 (3.9%) | 82 (6.1%) |
| 20 to 24 Years | 188 (12.6%) | 66 (4.9%) |
| 25 to 29 Years | 87 (5.8%) | 64 (4.8%) |
| 30 to 34 Years | 124 (8.3%) | 128 (9.6%) |
| 35 to 39 Years | 31 (2.1%) | 25 (1.9%) |
| 40 to 44 Years | 164 (11.0%) | 135 (10.1%) |
| 45 to 49 Years | 56 (3.7%) | 41 (3.1%) |
| 50 to 54 Years | 169 (11.3%) | 55 (4.1%) |
| 55 to 59 Years | 88 (5.9%) | 86 (6.4%) |
| 60 to 64 Years | 42 (2.8%) | 118 (8.8%) |
| 65 to 69 Years | 92 (6.1%) | 88 (6.6%) |
| 70 to 74 Years | 44 (2.9%) | 66 (4.9%) |
| 75 to 79 Years | 20 (1.3%) | 18 (1.3%) |
| 80 to 84 Years | 18 (1.2%) | 94 (7.0%) |
| 85 Years and over | 58 (3.9%) | 5 (0.4%) |
| Total | 1,495 (100.0%) | 1,336 (100.0%) |
Families and Households in Inwood
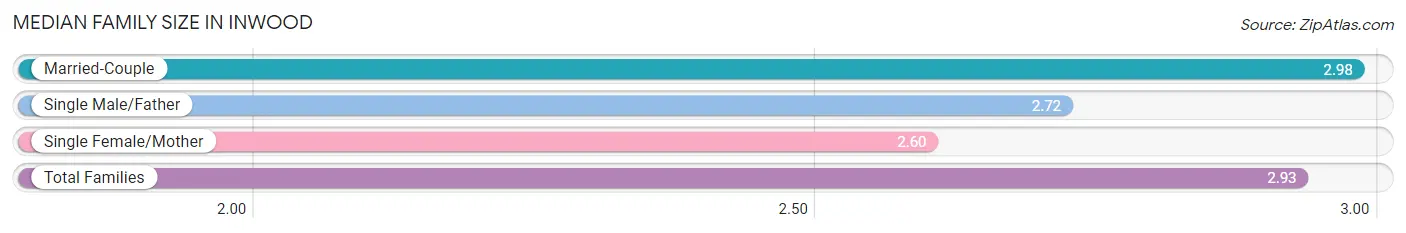
Median Family Size in Inwood
The median family size in Inwood is 2.93 persons per family, with married-couple families (652 | 80.7%) accounting for the largest median family size of 2.98 persons per family. On the other hand, single female/mother families (42 | 5.2%) represent the smallest median family size with 2.60 persons per family.
| Family Type | # Families | Family Size |
| Married-Couple | 652 (80.7%) | 2.98 |
| Single Male/Father | 114 (14.1%) | 2.72 |
| Single Female/Mother | 42 (5.2%) | 2.60 |
| Total Families | 808 (100.0%) | 2.93 |
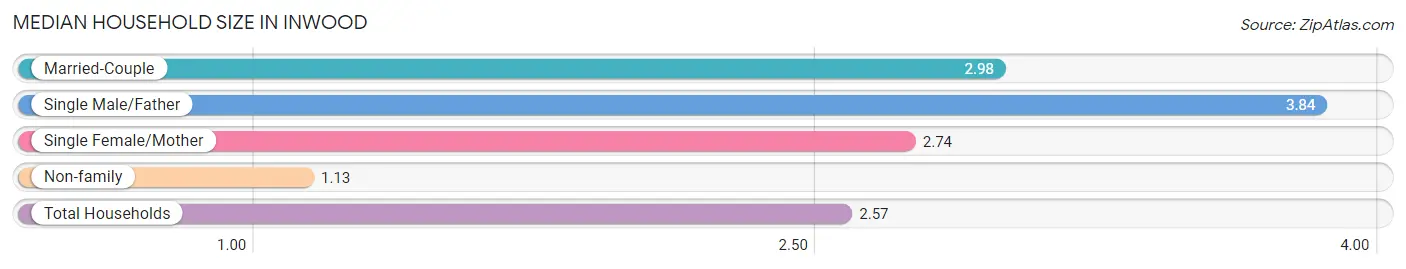
Median Household Size in Inwood
The median household size in Inwood is 2.57 persons per household, with single male/father households (114 | 10.3%) accounting for the largest median household size of 3.84 persons per household. non-family households (295 | 26.8%) represent the smallest median household size with 1.13 persons per household.
| Household Type | # Households | Household Size |
| Married-Couple | 652 (59.1%) | 2.98 |
| Single Male/Father | 114 (10.3%) | 3.84 |
| Single Female/Mother | 42 (3.8%) | 2.74 |
| Non-family | 295 (26.8%) | 1.13 |
| Total Households | 1,103 (100.0%) | 2.57 |
Household Size by Marriage Status in Inwood
Out of a total of 1,103 households in Inwood, 808 (73.3%) are family households, while 295 (26.8%) are nonfamily households. The most numerous type of family households are 2-person households, comprising 443, and the most common type of nonfamily households are 1-person households, comprising 257.
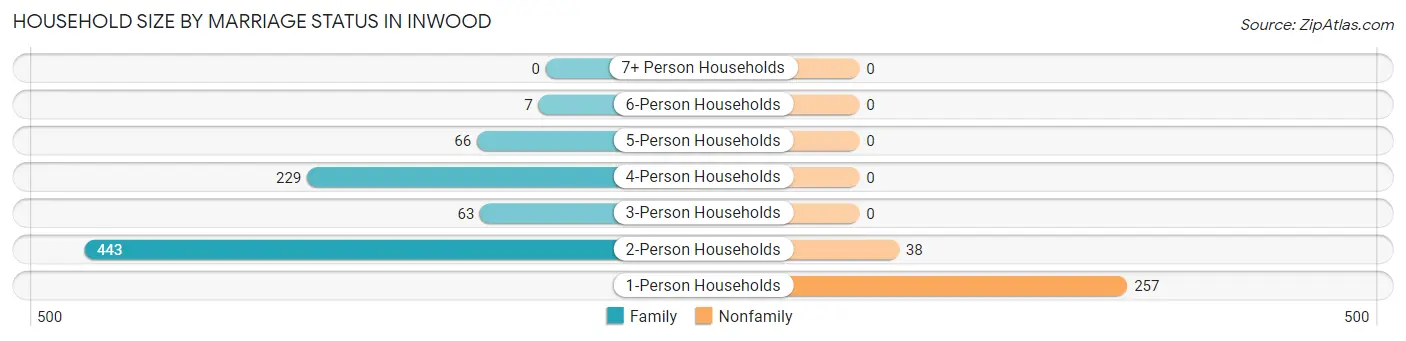
| Household Size | Family Households | Nonfamily Households |
| 1-Person Households | - | 257 (23.3%) |
| 2-Person Households | 443 (40.2%) | 38 (3.5%) |
| 3-Person Households | 63 (5.7%) | 0 (0.0%) |
| 4-Person Households | 229 (20.8%) | 0 (0.0%) |
| 5-Person Households | 66 (6.0%) | 0 (0.0%) |
| 6-Person Households | 7 (0.6%) | 0 (0.0%) |
| 7+ Person Households | 0 (0.0%) | 0 (0.0%) |
| Total | 808 (73.3%) | 295 (26.8%) |
Female Fertility in Inwood
Fertility by Age in Inwood
Average fertility rate in Inwood is 78.0 births per 1,000 women. Women in the age bracket of 20 to 34 years have the highest fertility rate with 167.0 births per 1,000 women. Women in the age bracket of 20 to 34 years acount for 100.0% of all women with births.
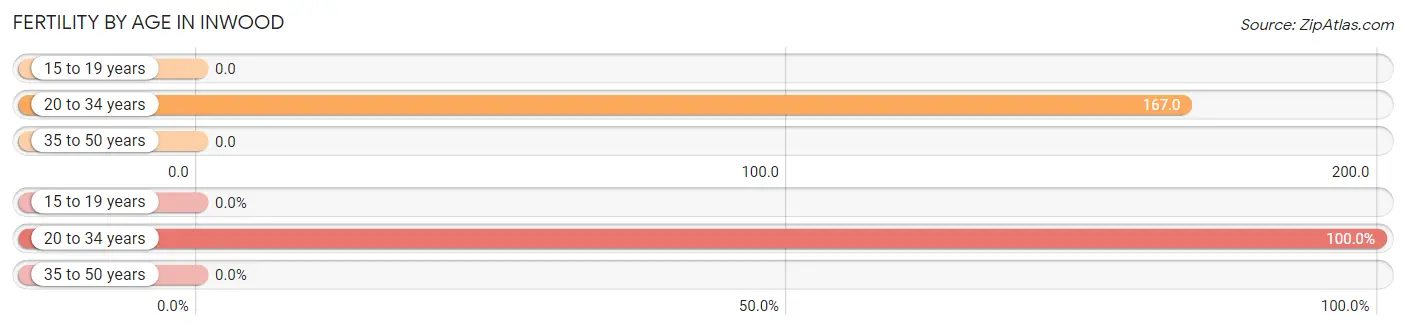
| Age Bracket | Women with Births | Births / 1,000 Women |
| 15 to 19 years | 0 (0.0%) | 0.0 |
| 20 to 34 years | 43 (100.0%) | 167.0 |
| 35 to 50 years | 0 (0.0%) | 0.0 |
| Total | 43 (100.0%) | 78.0 |
Fertility by Age by Marriage Status in Inwood
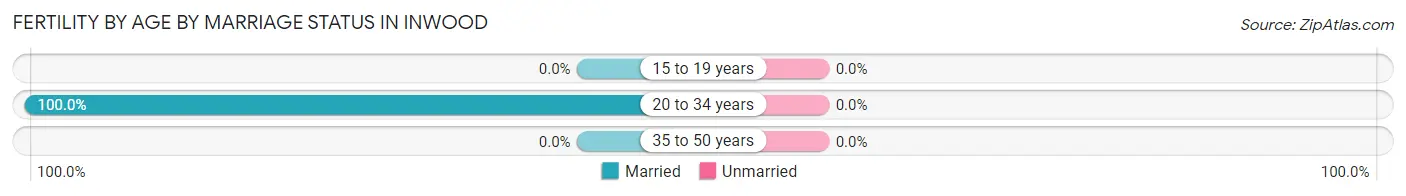
| Age Bracket | Married | Unmarried |
| 15 to 19 years | 0 (0.0%) | 0 (0.0%) |
| 20 to 34 years | 43 (100.0%) | 0 (0.0%) |
| 35 to 50 years | 0 (0.0%) | 0 (0.0%) |
| Total | 43 (100.0%) | 0 (0.0%) |
Fertility by Education in Inwood
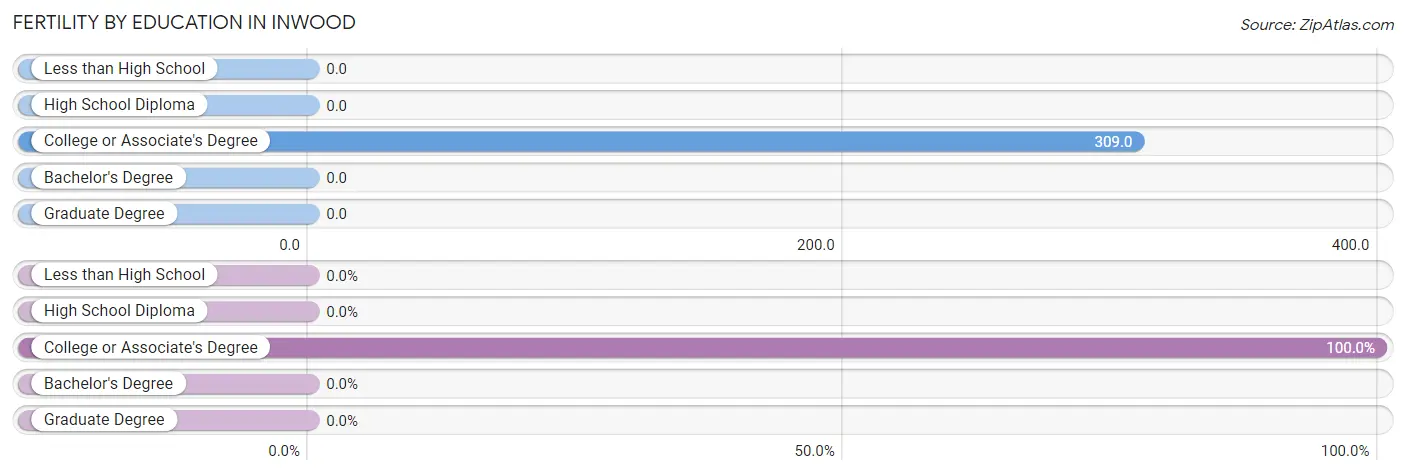
| Educational Attainment | Women with Births | Births / 1,000 Women |
| Less than High School | 0 (0.0%) | 0.0 |
| High School Diploma | 0 (0.0%) | 0.0 |
| College or Associate's Degree | 43 (100.0%) | 309.0 |
| Bachelor's Degree | 0 (0.0%) | 0.0 |
| Graduate Degree | 0 (0.0%) | 0.0 |
| Total | 43 (100.0%) | 78.0 |
Fertility by Education by Marriage Status in Inwood
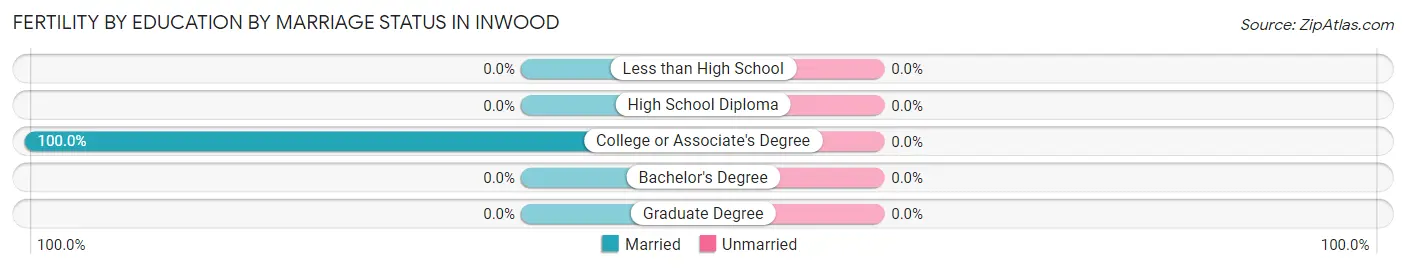
| Educational Attainment | Married | Unmarried |
| Less than High School | 0 (0.0%) | 0 (0.0%) |
| High School Diploma | 0 (0.0%) | 0 (0.0%) |
| College or Associate's Degree | 43 (100.0%) | 0 (0.0%) |
| Bachelor's Degree | 0 (0.0%) | 0 (0.0%) |
| Graduate Degree | 0 (0.0%) | 0 (0.0%) |
| Total | 43 (100.0%) | 0 (0.0%) |
Employment Characteristics in Inwood
Employment by Class of Employer in Inwood
Among the 1,247 employed individuals in Inwood, private company employees (840 | 67.4%), local government employees (114 | 9.1%), and not-for-profit organizations (106 | 8.5%) make up the most common classes of employment.
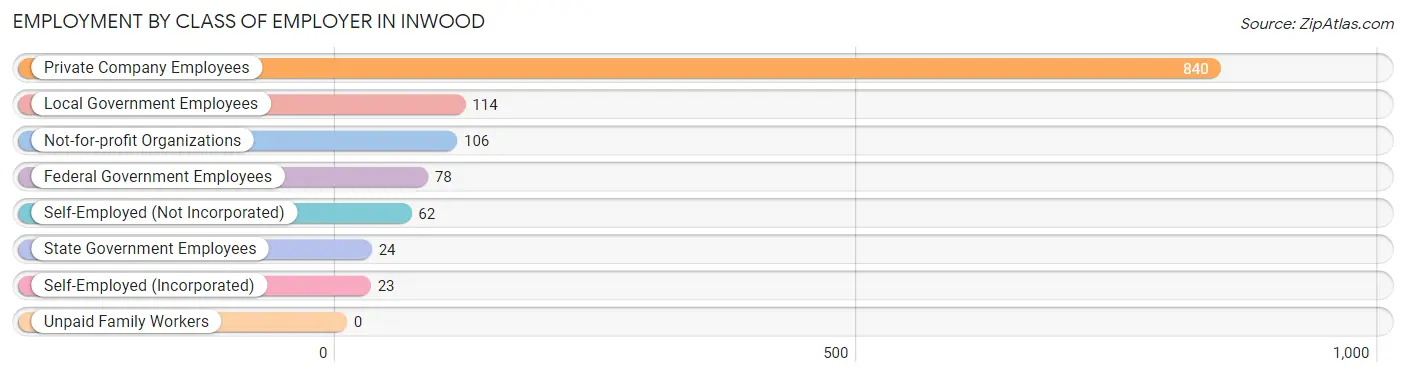
| Employer Class | # Employees | % Employees |
| Private Company Employees | 840 | 67.4% |
| Self-Employed (Incorporated) | 23 | 1.8% |
| Self-Employed (Not Incorporated) | 62 | 5.0% |
| Not-for-profit Organizations | 106 | 8.5% |
| Local Government Employees | 114 | 9.1% |
| State Government Employees | 24 | 1.9% |
| Federal Government Employees | 78 | 6.3% |
| Unpaid Family Workers | 0 | 0.0% |
| Total | 1,247 | 100.0% |
Employment Status by Age in Inwood
According to the labor force statistics for Inwood, out of the total population over 16 years of age (2,288), 63.0% or 1,441 individuals are in the labor force, with 10.7% or 154 of them unemployed. The age group with the highest labor force participation rate is 60 to 64 years, with 100.0% or 160 individuals in the labor force. Within the labor force, the 16 to 19 years age range has the highest percentage of unemployed individuals, with 73.2% or 60 of them being unemployed.
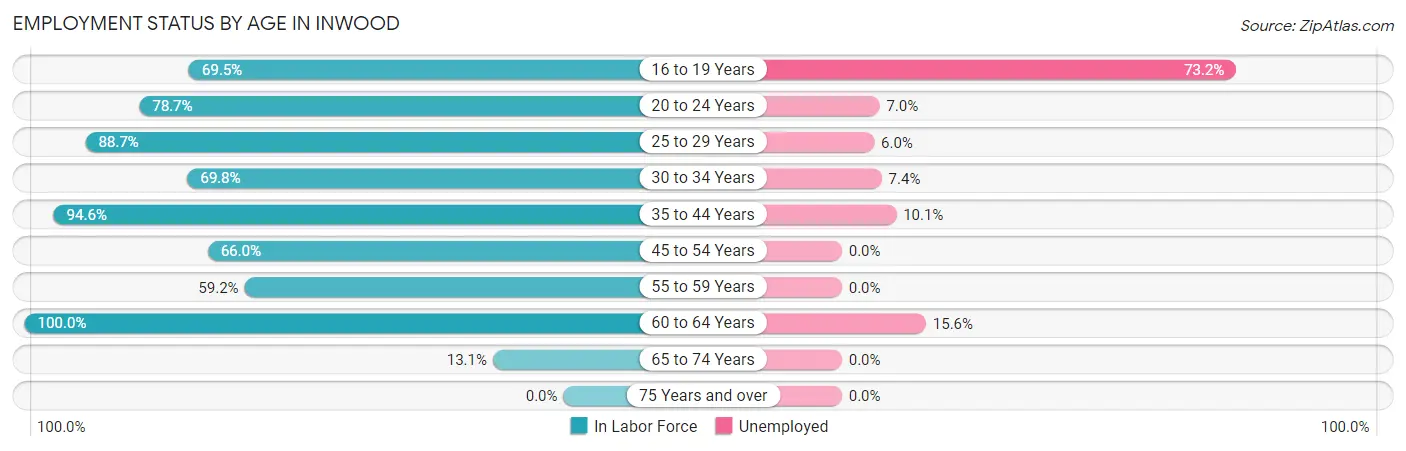
| Age Bracket | In Labor Force | Unemployed |
| 16 to 19 Years | 82 (69.5%) | 60 (73.2%) |
| 20 to 24 Years | 200 (78.7%) | 14 (7.0%) |
| 25 to 29 Years | 134 (88.7%) | 8 (6.0%) |
| 30 to 34 Years | 176 (69.8%) | 13 (7.4%) |
| 35 to 44 Years | 336 (94.6%) | 34 (10.1%) |
| 45 to 54 Years | 212 (66.0%) | 0 (0.0%) |
| 55 to 59 Years | 103 (59.2%) | 0 (0.0%) |
| 60 to 64 Years | 160 (100.0%) | 25 (15.6%) |
| 65 to 74 Years | 38 (13.1%) | 0 (0.0%) |
| 75 Years and over | 0 (0.0%) | 0 (0.0%) |
| Total | 1,441 (63.0%) | 154 (10.7%) |
Employment Status by Educational Attainment in Inwood
According to labor force statistics for Inwood, 79.3% of individuals (1,121) out of the total population between 25 and 64 years of age (1,413) are in the labor force, with 7.1% or 80 of them being unemployed. The group with the highest labor force participation rate are those with the educational attainment of bachelor's degree or higher, with 100.0% or 326 individuals in the labor force. Within the labor force, individuals with high school diploma education have the highest percentage of unemployment, with 16.4% or 55 of them being unemployed.
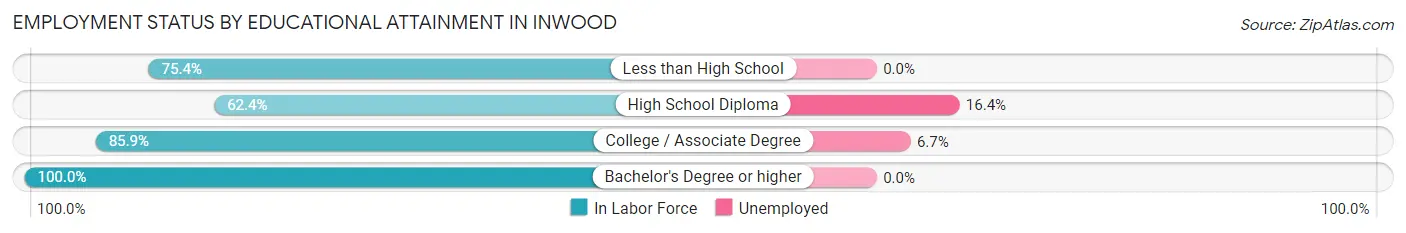
| Educational Attainment | In Labor Force | Unemployed |
| Less than High School | 89 (75.4%) | 0 (0.0%) |
| High School Diploma | 335 (62.4%) | 88 (16.4%) |
| College / Associate Degree | 371 (85.9%) | 29 (6.7%) |
| Bachelor's Degree or higher | 326 (100.0%) | 0 (0.0%) |
| Total | 1,121 (79.3%) | 100 (7.1%) |
Employment Occupations by Sex in Inwood
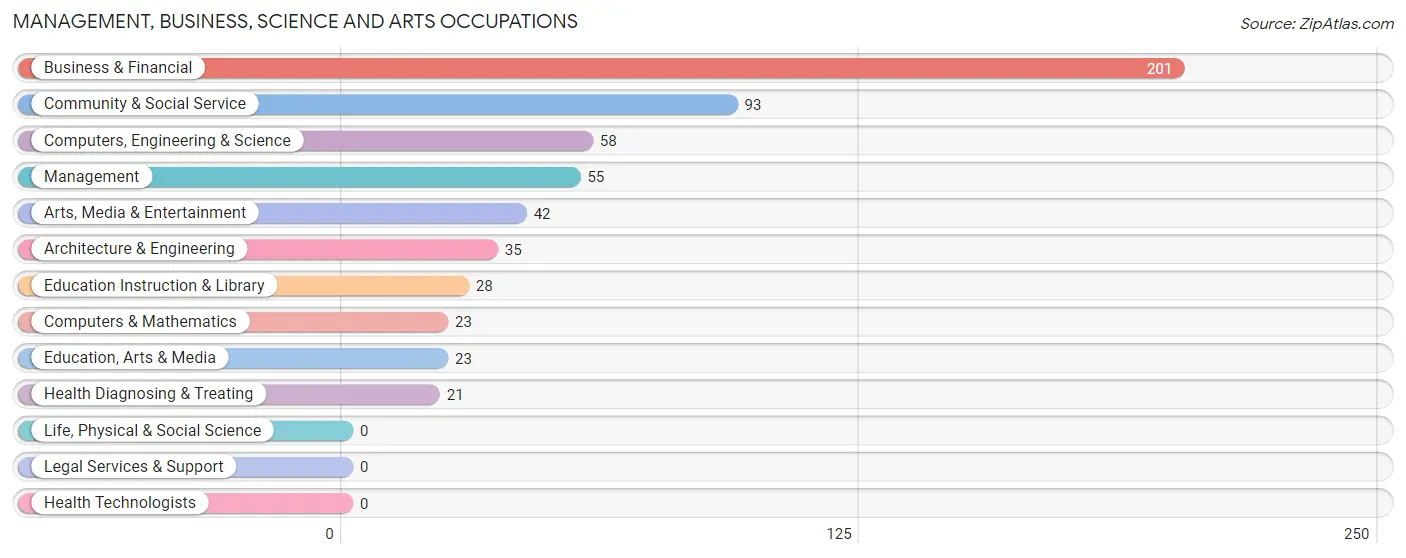
Management, Business, Science and Arts Occupations
The most common Management, Business, Science and Arts occupations in Inwood are Business & Financial (201 | 15.6%), Community & Social Service (93 | 7.2%), Computers, Engineering & Science (58 | 4.5%), Management (55 | 4.3%), and Arts, Media & Entertainment (42 | 3.3%).
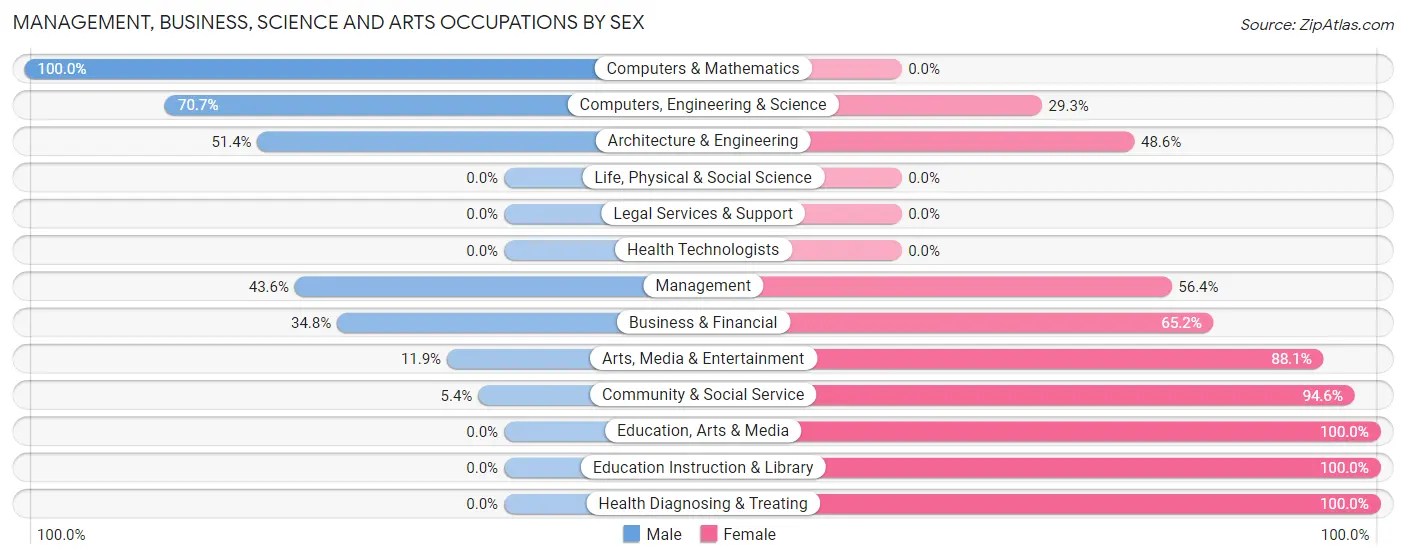
Management, Business, Science and Arts Occupations by Sex
Within the Management, Business, Science and Arts occupations in Inwood, the most male-oriented occupations are Computers & Mathematics (100.0%), Computers, Engineering & Science (70.7%), and Architecture & Engineering (51.4%), while the most female-oriented occupations are Education, Arts & Media (100.0%), Education Instruction & Library (100.0%), and Health Diagnosing & Treating (100.0%).
| Occupation | Male | Female |
| Management | 24 (43.6%) | 31 (56.4%) |
| Business & Financial | 70 (34.8%) | 131 (65.2%) |
| Computers, Engineering & Science | 41 (70.7%) | 17 (29.3%) |
| Computers & Mathematics | 23 (100.0%) | 0 (0.0%) |
| Architecture & Engineering | 18 (51.4%) | 17 (48.6%) |
| Life, Physical & Social Science | 0 (0.0%) | 0 (0.0%) |
| Community & Social Service | 5 (5.4%) | 88 (94.6%) |
| Education, Arts & Media | 0 (0.0%) | 23 (100.0%) |
| Legal Services & Support | 0 (0.0%) | 0 (0.0%) |
| Education Instruction & Library | 0 (0.0%) | 28 (100.0%) |
| Arts, Media & Entertainment | 5 (11.9%) | 37 (88.1%) |
| Health Diagnosing & Treating | 0 (0.0%) | 21 (100.0%) |
| Health Technologists | 0 (0.0%) | 0 (0.0%) |
| Total (Category) | 140 (32.7%) | 288 (67.3%) |
| Total (Overall) | 728 (56.6%) | 559 (43.4%) |
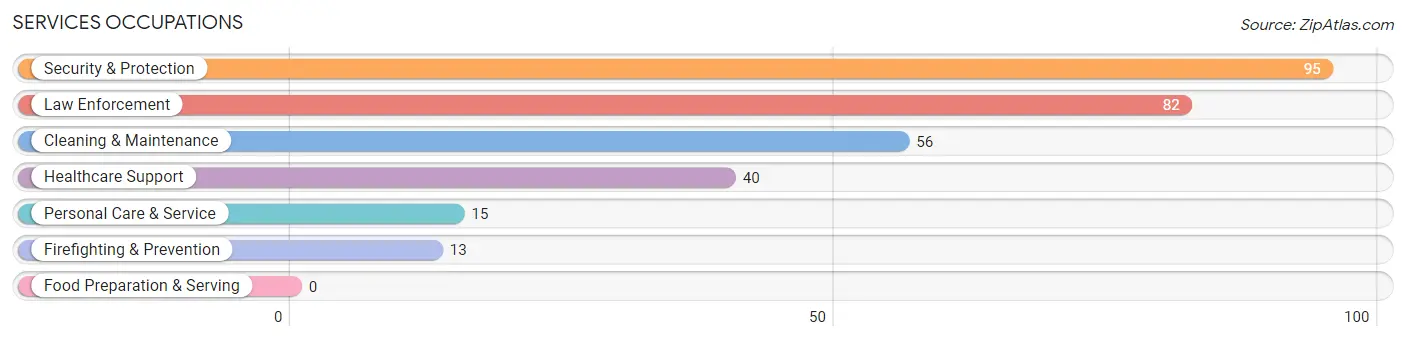
Services Occupations
The most common Services occupations in Inwood are Security & Protection (95 | 7.4%), Law Enforcement (82 | 6.4%), Cleaning & Maintenance (56 | 4.3%), Healthcare Support (40 | 3.1%), and Personal Care & Service (15 | 1.2%).
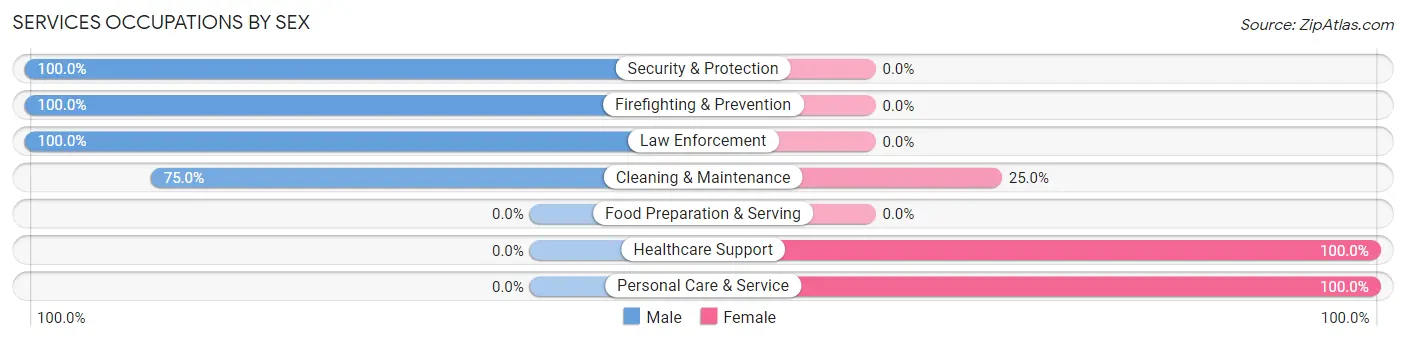
Services Occupations by Sex
Within the Services occupations in Inwood, the most male-oriented occupations are Security & Protection (100.0%), Firefighting & Prevention (100.0%), and Law Enforcement (100.0%), while the most female-oriented occupations are Healthcare Support (100.0%), Personal Care & Service (100.0%), and Cleaning & Maintenance (25.0%).
| Occupation | Male | Female |
| Healthcare Support | 0 (0.0%) | 40 (100.0%) |
| Security & Protection | 95 (100.0%) | 0 (0.0%) |
| Firefighting & Prevention | 13 (100.0%) | 0 (0.0%) |
| Law Enforcement | 82 (100.0%) | 0 (0.0%) |
| Food Preparation & Serving | 0 (0.0%) | 0 (0.0%) |
| Cleaning & Maintenance | 42 (75.0%) | 14 (25.0%) |
| Personal Care & Service | 0 (0.0%) | 15 (100.0%) |
| Total (Category) | 137 (66.5%) | 69 (33.5%) |
| Total (Overall) | 728 (56.6%) | 559 (43.4%) |
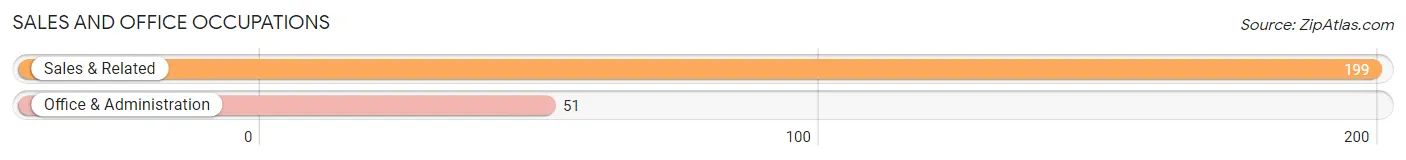
Sales and Office Occupations
The most common Sales and Office occupations in Inwood are Sales & Related (199 | 15.5%), and Office & Administration (51 | 4.0%).
Sales and Office Occupations by Sex
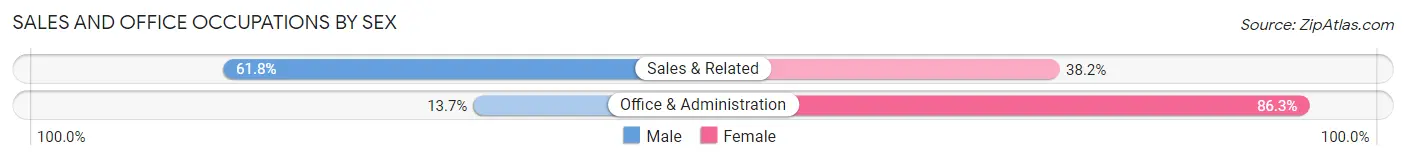
| Occupation | Male | Female |
| Sales & Related | 123 (61.8%) | 76 (38.2%) |
| Office & Administration | 7 (13.7%) | 44 (86.3%) |
| Total (Category) | 130 (52.0%) | 120 (48.0%) |
| Total (Overall) | 728 (56.6%) | 559 (43.4%) |
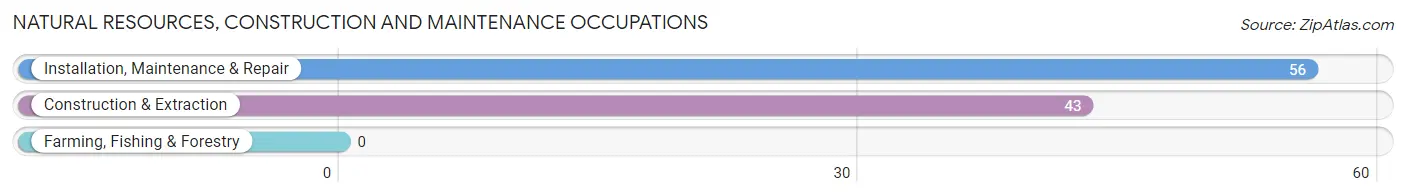
Natural Resources, Construction and Maintenance Occupations
The most common Natural Resources, Construction and Maintenance occupations in Inwood are Installation, Maintenance & Repair (56 | 4.3%), and Construction & Extraction (43 | 3.3%).
Natural Resources, Construction and Maintenance Occupations by Sex
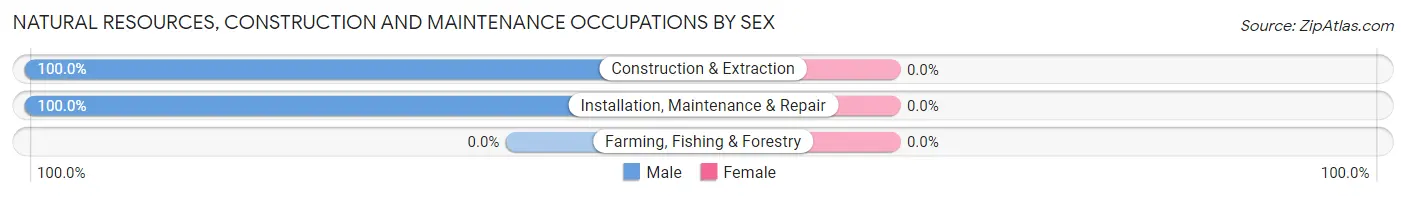
| Occupation | Male | Female |
| Farming, Fishing & Forestry | 0 (0.0%) | 0 (0.0%) |
| Construction & Extraction | 43 (100.0%) | 0 (0.0%) |
| Installation, Maintenance & Repair | 56 (100.0%) | 0 (0.0%) |
| Total (Category) | 99 (100.0%) | 0 (0.0%) |
| Total (Overall) | 728 (56.6%) | 559 (43.4%) |
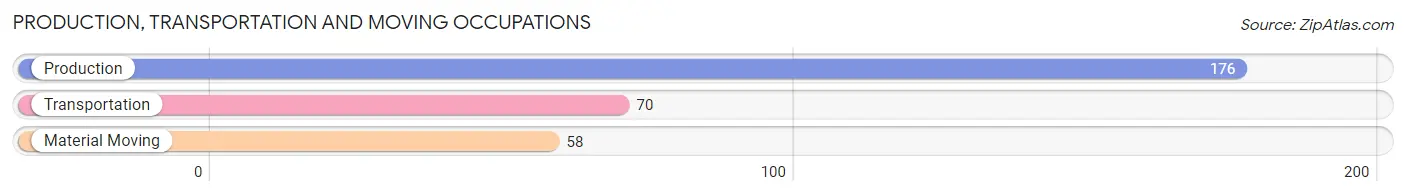
Production, Transportation and Moving Occupations
The most common Production, Transportation and Moving occupations in Inwood are Production (176 | 13.7%), Transportation (70 | 5.4%), and Material Moving (58 | 4.5%).
Production, Transportation and Moving Occupations by Sex
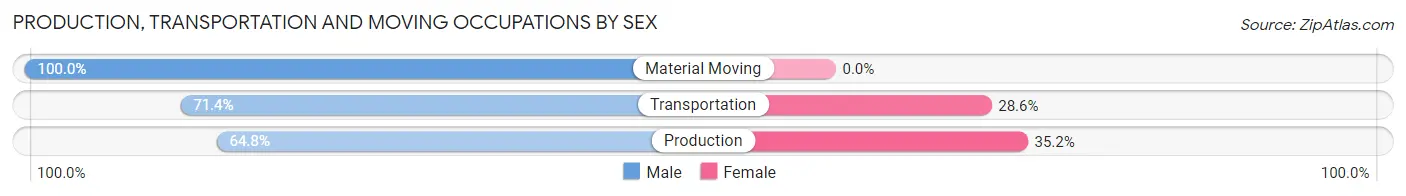
| Occupation | Male | Female |
| Production | 114 (64.8%) | 62 (35.2%) |
| Transportation | 50 (71.4%) | 20 (28.6%) |
| Material Moving | 58 (100.0%) | 0 (0.0%) |
| Total (Category) | 222 (73.0%) | 82 (27.0%) |
| Total (Overall) | 728 (56.6%) | 559 (43.4%) |
Employment Industries by Sex in Inwood
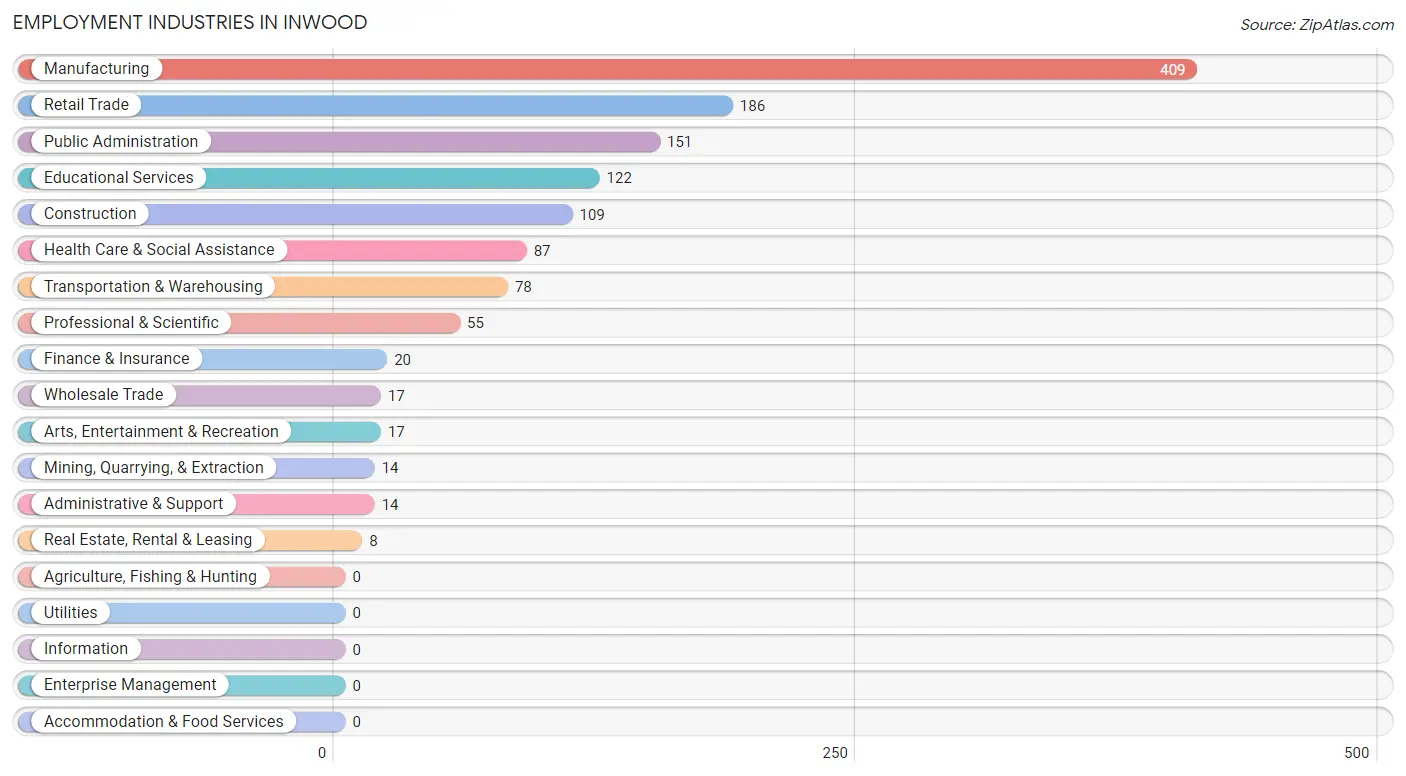
Employment Industries in Inwood
The major employment industries in Inwood include Manufacturing (409 | 31.8%), Retail Trade (186 | 14.4%), Public Administration (151 | 11.7%), Educational Services (122 | 9.5%), and Construction (109 | 8.5%).
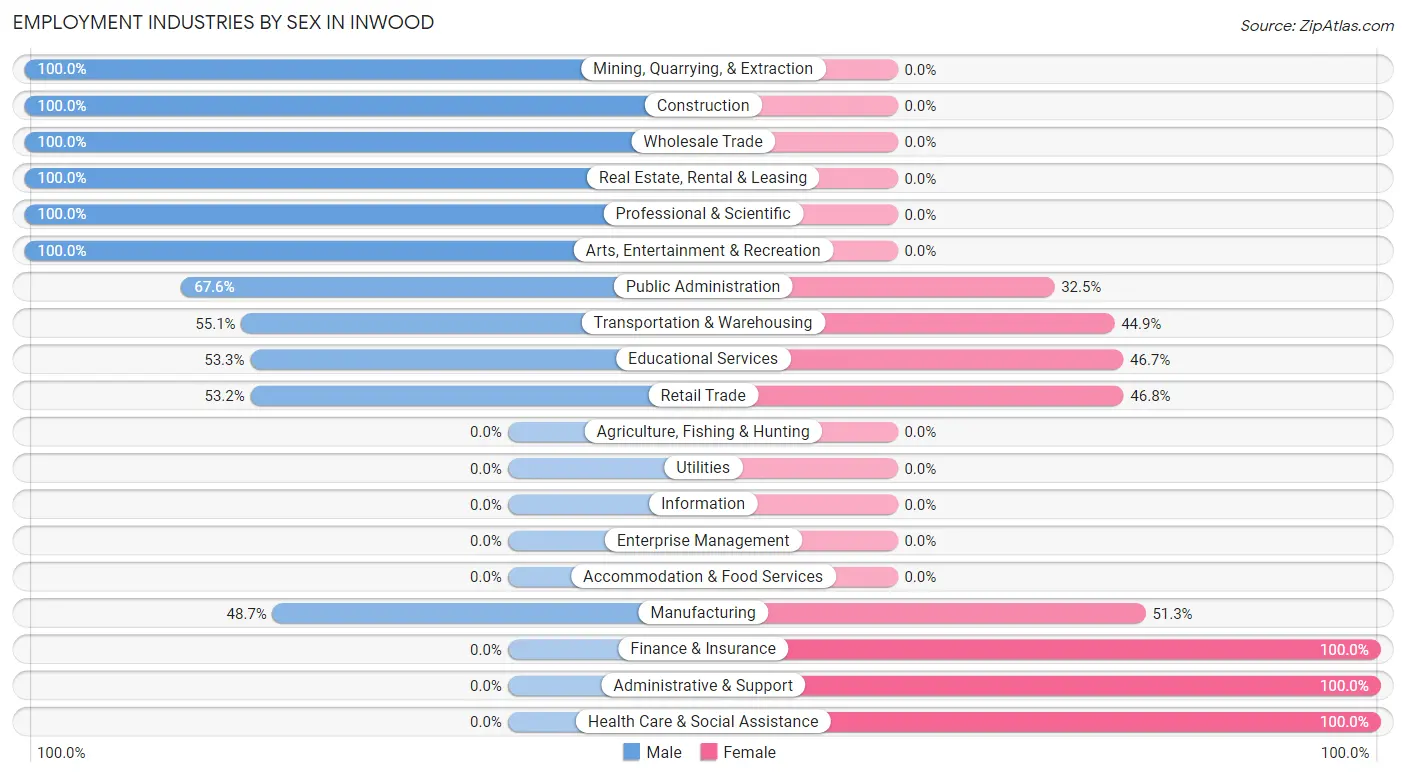
Employment Industries by Sex in Inwood
The Inwood industries that see more men than women are Mining, Quarrying, & Extraction (100.0%), Construction (100.0%), and Wholesale Trade (100.0%), whereas the industries that tend to have a higher number of women are Finance & Insurance (100.0%), Administrative & Support (100.0%), and Health Care & Social Assistance (100.0%).
| Industry | Male | Female |
| Agriculture, Fishing & Hunting | 0 (0.0%) | 0 (0.0%) |
| Mining, Quarrying, & Extraction | 14 (100.0%) | 0 (0.0%) |
| Construction | 109 (100.0%) | 0 (0.0%) |
| Manufacturing | 199 (48.7%) | 210 (51.3%) |
| Wholesale Trade | 17 (100.0%) | 0 (0.0%) |
| Retail Trade | 99 (53.2%) | 87 (46.8%) |
| Transportation & Warehousing | 43 (55.1%) | 35 (44.9%) |
| Utilities | 0 (0.0%) | 0 (0.0%) |
| Information | 0 (0.0%) | 0 (0.0%) |
| Finance & Insurance | 0 (0.0%) | 20 (100.0%) |
| Real Estate, Rental & Leasing | 8 (100.0%) | 0 (0.0%) |
| Professional & Scientific | 55 (100.0%) | 0 (0.0%) |
| Enterprise Management | 0 (0.0%) | 0 (0.0%) |
| Administrative & Support | 0 (0.0%) | 14 (100.0%) |
| Educational Services | 65 (53.3%) | 57 (46.7%) |
| Health Care & Social Assistance | 0 (0.0%) | 87 (100.0%) |
| Arts, Entertainment & Recreation | 17 (100.0%) | 0 (0.0%) |
| Accommodation & Food Services | 0 (0.0%) | 0 (0.0%) |
| Public Administration | 102 (67.5%) | 49 (32.5%) |
| Total | 728 (56.6%) | 559 (43.4%) |
Education in Inwood
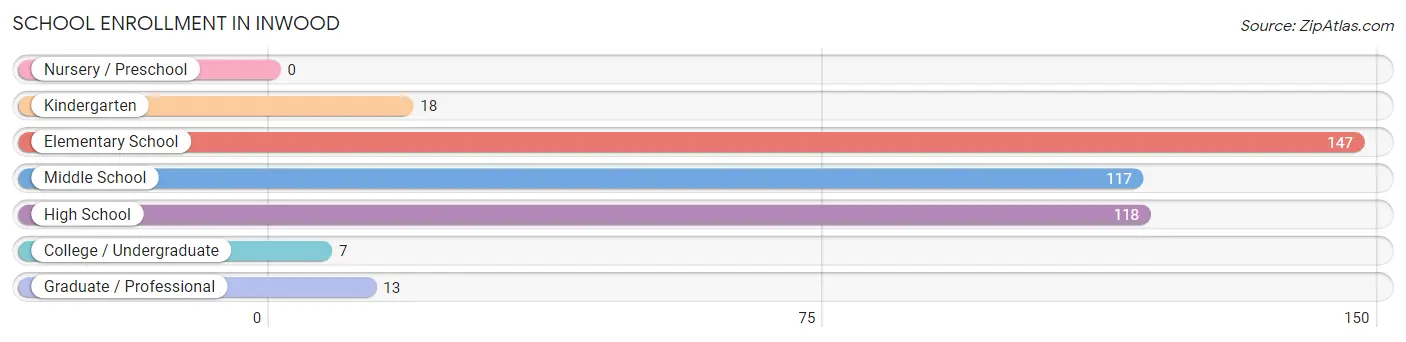
School Enrollment in Inwood
The most common levels of schooling among the 420 students in Inwood are elementary school (147 | 35.0%), high school (118 | 28.1%), and middle school (117 | 27.9%).
| School Level | # Students | % Students |
| Nursery / Preschool | 0 | 0.0% |
| Kindergarten | 18 | 4.3% |
| Elementary School | 147 | 35.0% |
| Middle School | 117 | 27.9% |
| High School | 118 | 28.1% |
| College / Undergraduate | 7 | 1.7% |
| Graduate / Professional | 13 | 3.1% |
| Total | 420 | 100.0% |
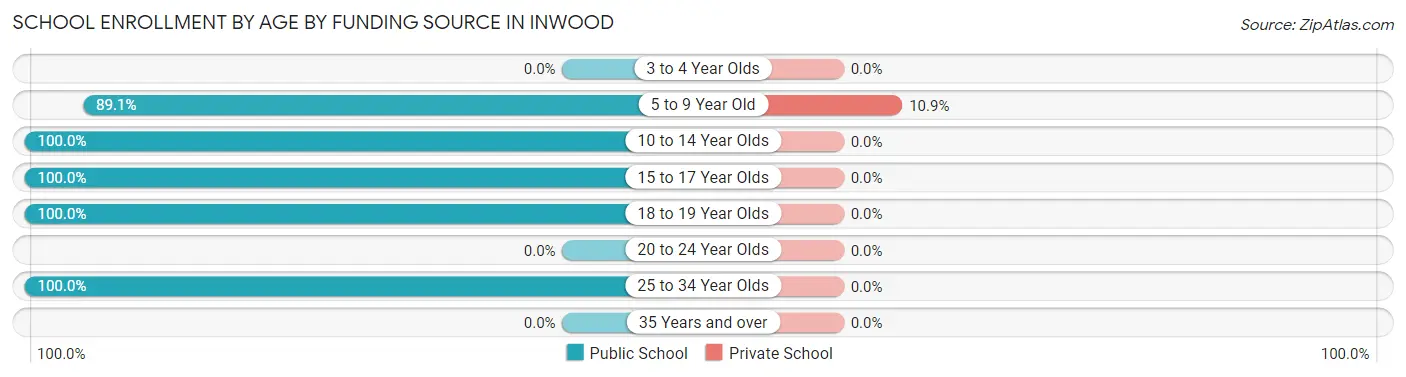
School Enrollment by Age by Funding Source in Inwood
Out of a total of 420 students who are enrolled in schools in Inwood, 18 (4.3%) attend a private institution, while the remaining 402 (95.7%) are enrolled in public schools. The age group of 5 to 9 year old has the highest likelihood of being enrolled in private schools, with 18 (10.9% in the age bracket) enrolled. Conversely, the age group of 10 to 14 year olds has the lowest likelihood of being enrolled in a private school, with 117 (100.0% in the age bracket) attending a public institution.
| Age Bracket | Public School | Private School |
| 3 to 4 Year Olds | 0 (0.0%) | 0 (0.0%) |
| 5 to 9 Year Old | 147 (89.1%) | 18 (10.9%) |
| 10 to 14 Year Olds | 117 (100.0%) | 0 (0.0%) |
| 15 to 17 Year Olds | 118 (100.0%) | 0 (0.0%) |
| 18 to 19 Year Olds | 7 (100.0%) | 0 (0.0%) |
| 20 to 24 Year Olds | 0 (0.0%) | 0 (0.0%) |
| 25 to 34 Year Olds | 13 (100.0%) | 0 (0.0%) |
| 35 Years and over | 0 (0.0%) | 0 (0.0%) |
| Total | 402 (95.7%) | 18 (4.3%) |
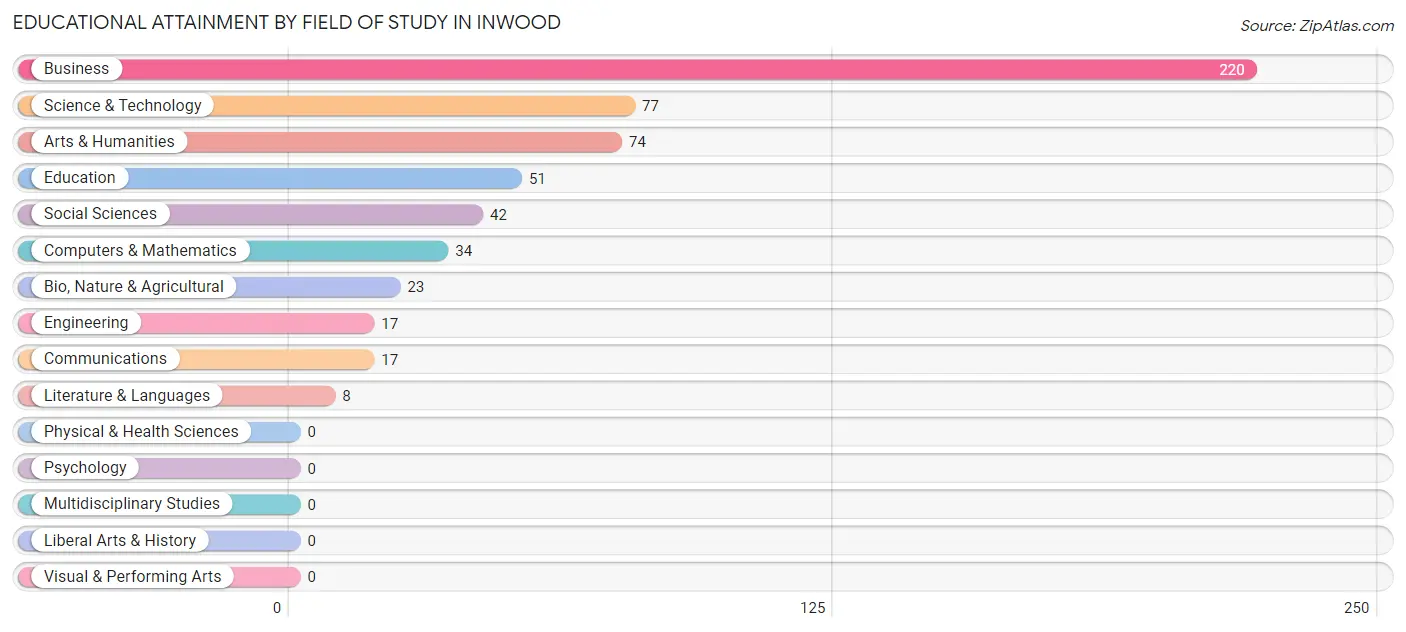
Educational Attainment by Field of Study in Inwood
Business (220 | 39.1%), science & technology (77 | 13.7%), arts & humanities (74 | 13.1%), education (51 | 9.1%), and social sciences (42 | 7.5%) are the most common fields of study among 563 individuals in Inwood who have obtained a bachelor's degree or higher.
| Field of Study | # Graduates | % Graduates |
| Computers & Mathematics | 34 | 6.0% |
| Bio, Nature & Agricultural | 23 | 4.1% |
| Physical & Health Sciences | 0 | 0.0% |
| Psychology | 0 | 0.0% |
| Social Sciences | 42 | 7.5% |
| Engineering | 17 | 3.0% |
| Multidisciplinary Studies | 0 | 0.0% |
| Science & Technology | 77 | 13.7% |
| Business | 220 | 39.1% |
| Education | 51 | 9.1% |
| Literature & Languages | 8 | 1.4% |
| Liberal Arts & History | 0 | 0.0% |
| Visual & Performing Arts | 0 | 0.0% |
| Communications | 17 | 3.0% |
| Arts & Humanities | 74 | 13.1% |
| Total | 563 | 100.0% |
Transportation & Commute in Inwood
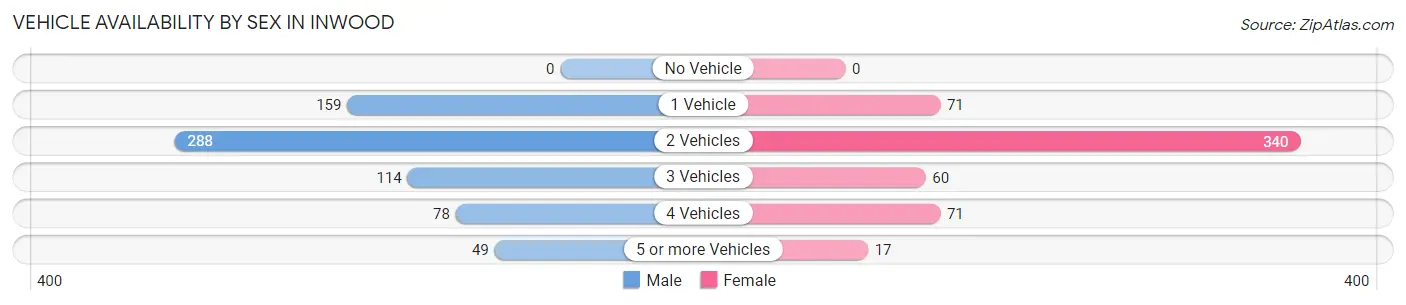
Vehicle Availability by Sex in Inwood
The most prevalent vehicle ownership categories in Inwood are males with 2 vehicles (288, accounting for 41.9%) and females with 2 vehicles (340, making up 51.5%).
| Vehicles Available | Male | Female |
| No Vehicle | 0 (0.0%) | 0 (0.0%) |
| 1 Vehicle | 159 (23.1%) | 71 (12.7%) |
| 2 Vehicles | 288 (41.9%) | 340 (60.8%) |
| 3 Vehicles | 114 (16.6%) | 60 (10.7%) |
| 4 Vehicles | 78 (11.3%) | 71 (12.7%) |
| 5 or more Vehicles | 49 (7.1%) | 17 (3.0%) |
| Total | 688 (100.0%) | 559 (100.0%) |
Commute Time in Inwood
The most frequently occuring commute durations in Inwood are 15 to 19 minutes (232 commuters, 19.7%), 20 to 24 minutes (174 commuters, 14.7%), and 10 to 14 minutes (173 commuters, 14.7%).
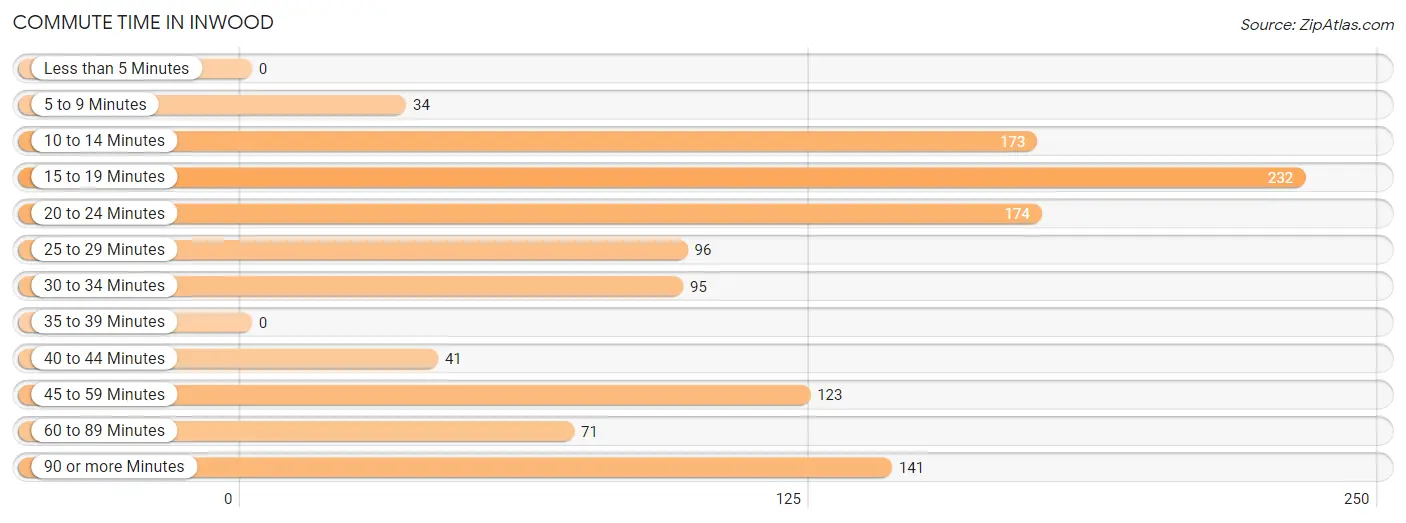
| Commute Time | # Commuters | % Commuters |
| Less than 5 Minutes | 0 | 0.0% |
| 5 to 9 Minutes | 34 | 2.9% |
| 10 to 14 Minutes | 173 | 14.7% |
| 15 to 19 Minutes | 232 | 19.7% |
| 20 to 24 Minutes | 174 | 14.7% |
| 25 to 29 Minutes | 96 | 8.1% |
| 30 to 34 Minutes | 95 | 8.1% |
| 35 to 39 Minutes | 0 | 0.0% |
| 40 to 44 Minutes | 41 | 3.5% |
| 45 to 59 Minutes | 123 | 10.4% |
| 60 to 89 Minutes | 71 | 6.0% |
| 90 or more Minutes | 141 | 11.9% |
Commute Time by Sex in Inwood
The most common commute times in Inwood are 15 to 19 minutes (150 commuters, 22.6%) for males and 20 to 24 minutes (104 commuters, 20.2%) for females.
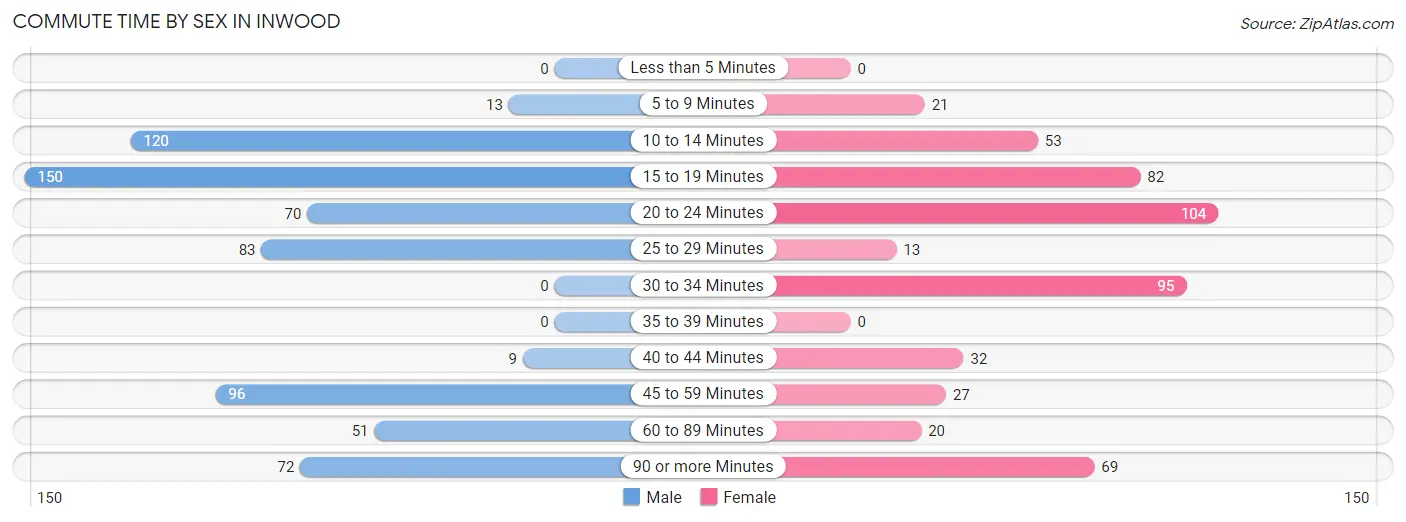
| Commute Time | Male | Female |
| Less than 5 Minutes | 0 (0.0%) | 0 (0.0%) |
| 5 to 9 Minutes | 13 (2.0%) | 21 (4.1%) |
| 10 to 14 Minutes | 120 (18.1%) | 53 (10.3%) |
| 15 to 19 Minutes | 150 (22.6%) | 82 (15.9%) |
| 20 to 24 Minutes | 70 (10.5%) | 104 (20.2%) |
| 25 to 29 Minutes | 83 (12.5%) | 13 (2.5%) |
| 30 to 34 Minutes | 0 (0.0%) | 95 (18.4%) |
| 35 to 39 Minutes | 0 (0.0%) | 0 (0.0%) |
| 40 to 44 Minutes | 9 (1.4%) | 32 (6.2%) |
| 45 to 59 Minutes | 96 (14.5%) | 27 (5.2%) |
| 60 to 89 Minutes | 51 (7.7%) | 20 (3.9%) |
| 90 or more Minutes | 72 (10.8%) | 69 (13.4%) |
Time of Departure to Work by Sex in Inwood
The most frequent times of departure to work in Inwood are 6:00 AM to 6:29 AM (195, 29.4%) for males and 7:30 AM to 7:59 AM (139, 26.9%) for females.
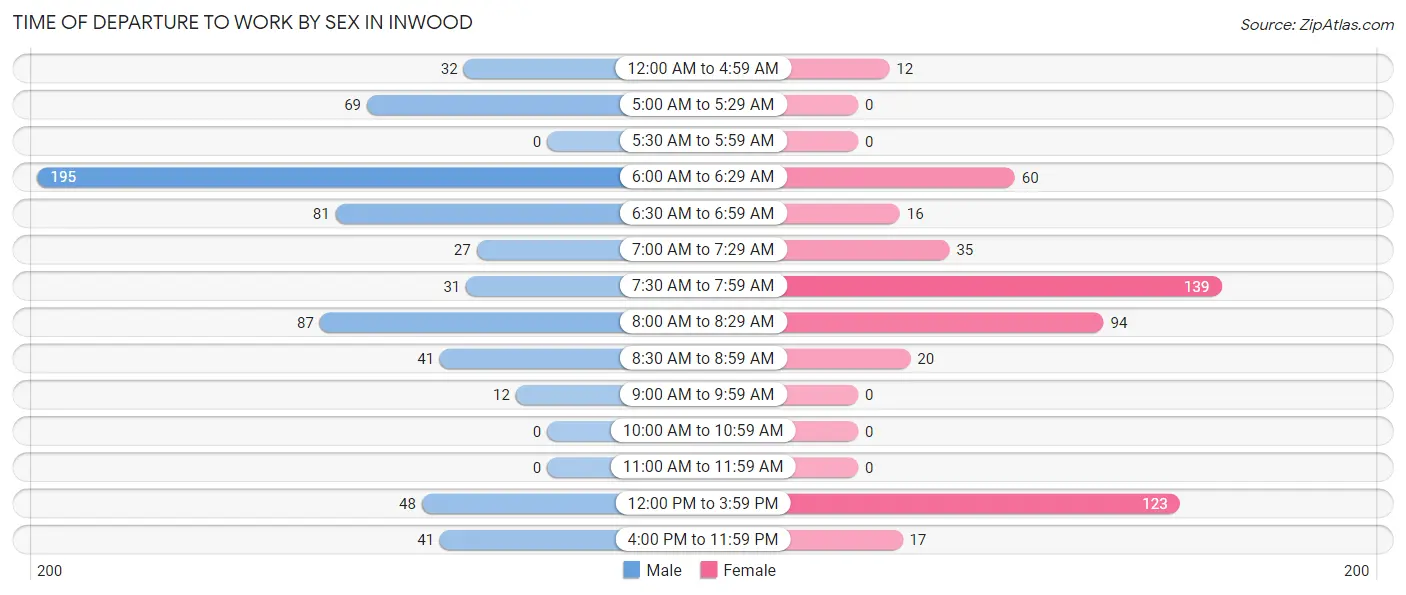
| Time of Departure | Male | Female |
| 12:00 AM to 4:59 AM | 32 (4.8%) | 12 (2.3%) |
| 5:00 AM to 5:29 AM | 69 (10.4%) | 0 (0.0%) |
| 5:30 AM to 5:59 AM | 0 (0.0%) | 0 (0.0%) |
| 6:00 AM to 6:29 AM | 195 (29.4%) | 60 (11.6%) |
| 6:30 AM to 6:59 AM | 81 (12.2%) | 16 (3.1%) |
| 7:00 AM to 7:29 AM | 27 (4.1%) | 35 (6.8%) |
| 7:30 AM to 7:59 AM | 31 (4.7%) | 139 (26.9%) |
| 8:00 AM to 8:29 AM | 87 (13.1%) | 94 (18.2%) |
| 8:30 AM to 8:59 AM | 41 (6.2%) | 20 (3.9%) |
| 9:00 AM to 9:59 AM | 12 (1.8%) | 0 (0.0%) |
| 10:00 AM to 10:59 AM | 0 (0.0%) | 0 (0.0%) |
| 11:00 AM to 11:59 AM | 0 (0.0%) | 0 (0.0%) |
| 12:00 PM to 3:59 PM | 48 (7.2%) | 123 (23.8%) |
| 4:00 PM to 11:59 PM | 41 (6.2%) | 17 (3.3%) |
| Total | 664 (100.0%) | 516 (100.0%) |
Housing Occupancy in Inwood
Occupancy by Ownership in Inwood
Of the total 1,103 dwellings in Inwood, owner-occupied units account for 877 (79.5%), while renter-occupied units make up 226 (20.5%).
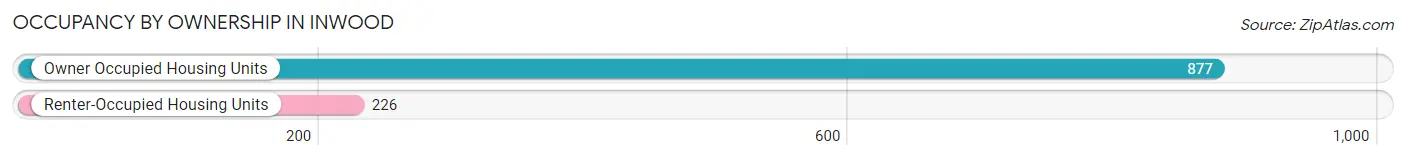
| Occupancy | # Housing Units | % Housing Units |
| Owner Occupied Housing Units | 877 | 79.5% |
| Renter-Occupied Housing Units | 226 | 20.5% |
| Total Occupied Housing Units | 1,103 | 100.0% |
Occupancy by Household Size in Inwood
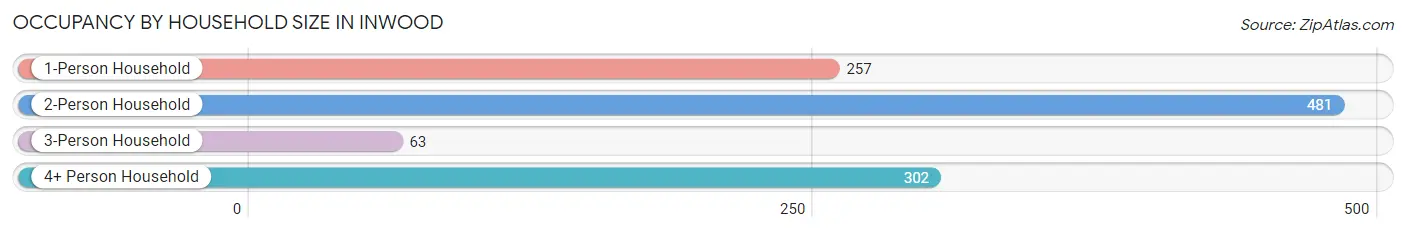
| Household Size | # Housing Units | % Housing Units |
| 1-Person Household | 257 | 23.3% |
| 2-Person Household | 481 | 43.6% |
| 3-Person Household | 63 | 5.7% |
| 4+ Person Household | 302 | 27.4% |
| Total Housing Units | 1,103 | 100.0% |
Occupancy by Ownership by Household Size in Inwood
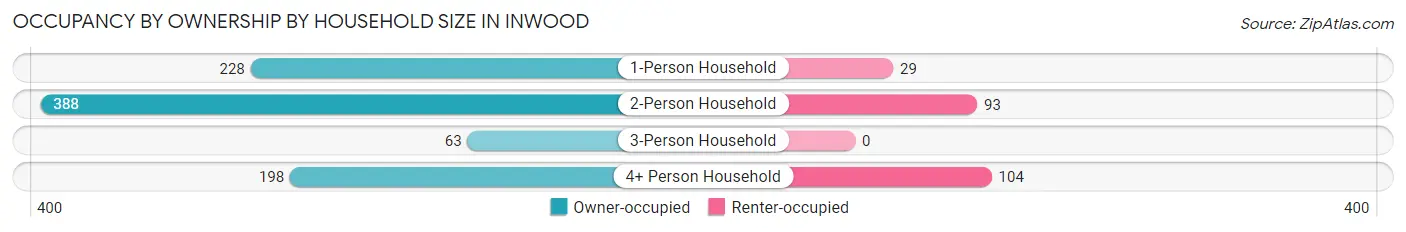
| Household Size | Owner-occupied | Renter-occupied |
| 1-Person Household | 228 (88.7%) | 29 (11.3%) |
| 2-Person Household | 388 (80.7%) | 93 (19.3%) |
| 3-Person Household | 63 (100.0%) | 0 (0.0%) |
| 4+ Person Household | 198 (65.6%) | 104 (34.4%) |
| Total Housing Units | 877 (79.5%) | 226 (20.5%) |
Occupancy by Educational Attainment in Inwood
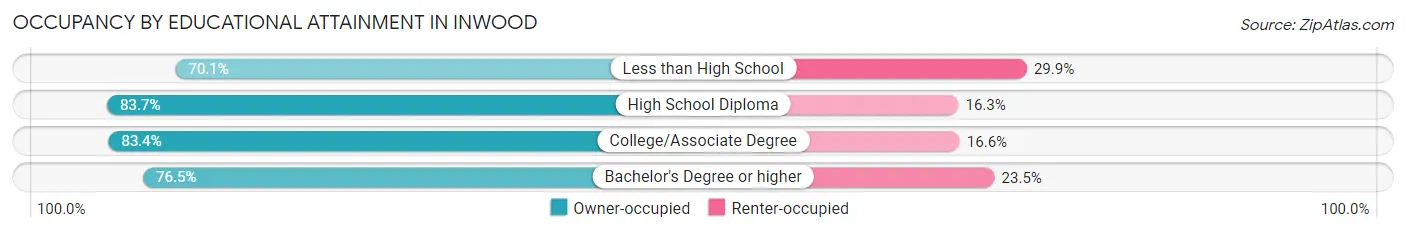
| Household Size | Owner-occupied | Renter-occupied |
| Less than High School | 68 (70.1%) | 29 (29.9%) |
| High School Diploma | 256 (83.7%) | 50 (16.3%) |
| College/Associate Degree | 211 (83.4%) | 42 (16.6%) |
| Bachelor's Degree or higher | 342 (76.5%) | 105 (23.5%) |
Occupancy by Age of Householder in Inwood
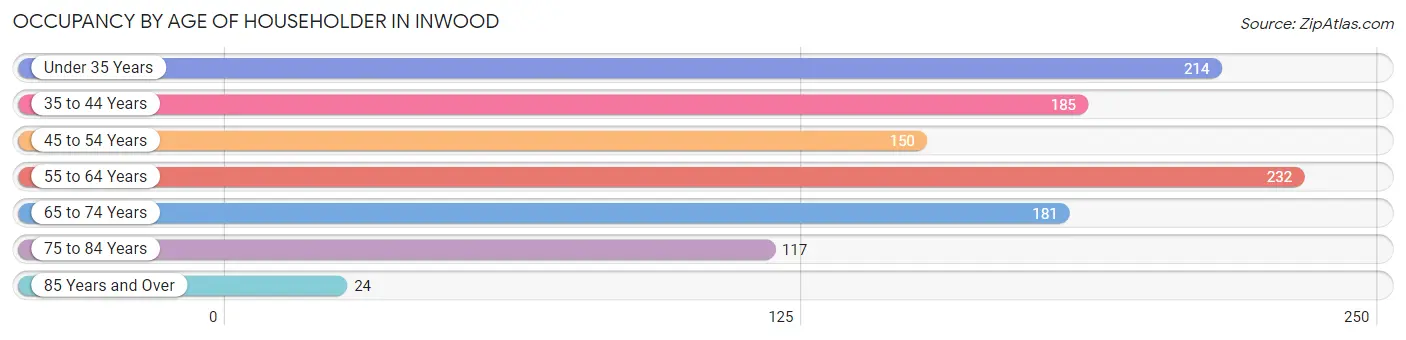
| Age Bracket | # Households | % Households |
| Under 35 Years | 214 | 19.4% |
| 35 to 44 Years | 185 | 16.8% |
| 45 to 54 Years | 150 | 13.6% |
| 55 to 64 Years | 232 | 21.0% |
| 65 to 74 Years | 181 | 16.4% |
| 75 to 84 Years | 117 | 10.6% |
| 85 Years and Over | 24 | 2.2% |
| Total | 1,103 | 100.0% |
Housing Finances in Inwood
Median Income by Occupancy in Inwood
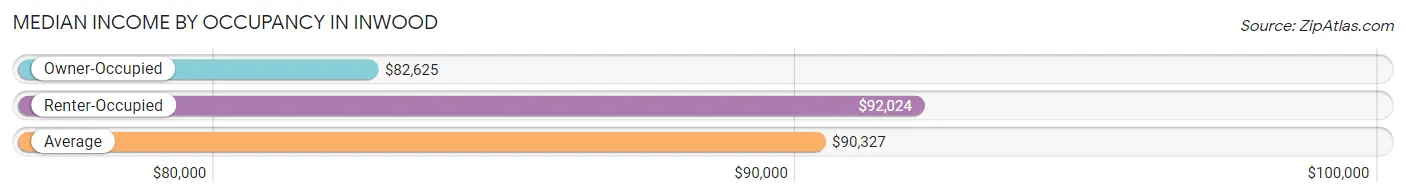
| Occupancy Type | # Households | Median Income |
| Owner-Occupied | 877 (79.5%) | $82,625 |
| Renter-Occupied | 226 (20.5%) | $92,024 |
| Average | 1,103 (100.0%) | $90,327 |
Occupancy by Householder Income Bracket in Inwood
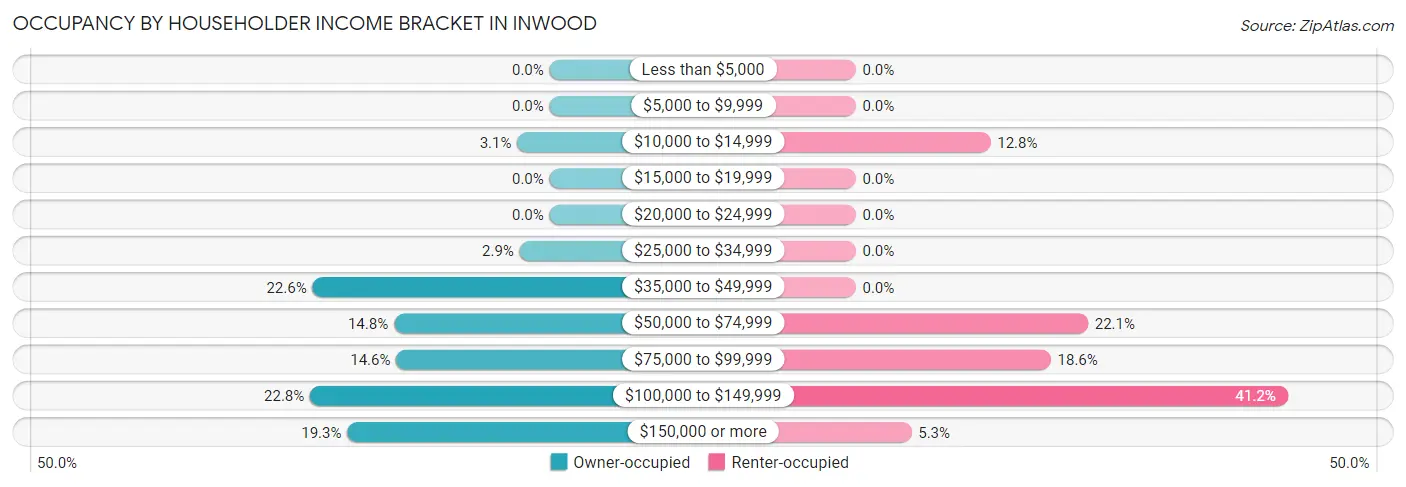
| Income Bracket | Owner-occupied | Renter-occupied |
| Less than $5,000 | 0 (0.0%) | 0 (0.0%) |
| $5,000 to $9,999 | 0 (0.0%) | 0 (0.0%) |
| $10,000 to $14,999 | 27 (3.1%) | 29 (12.8%) |
| $15,000 to $19,999 | 0 (0.0%) | 0 (0.0%) |
| $20,000 to $24,999 | 0 (0.0%) | 0 (0.0%) |
| $25,000 to $34,999 | 25 (2.9%) | 0 (0.0%) |
| $35,000 to $49,999 | 198 (22.6%) | 0 (0.0%) |
| $50,000 to $74,999 | 130 (14.8%) | 50 (22.1%) |
| $75,000 to $99,999 | 128 (14.6%) | 42 (18.6%) |
| $100,000 to $149,999 | 200 (22.8%) | 93 (41.1%) |
| $150,000 or more | 169 (19.3%) | 12 (5.3%) |
| Total | 877 (100.0%) | 226 (100.0%) |
Monthly Housing Cost Tiers in Inwood
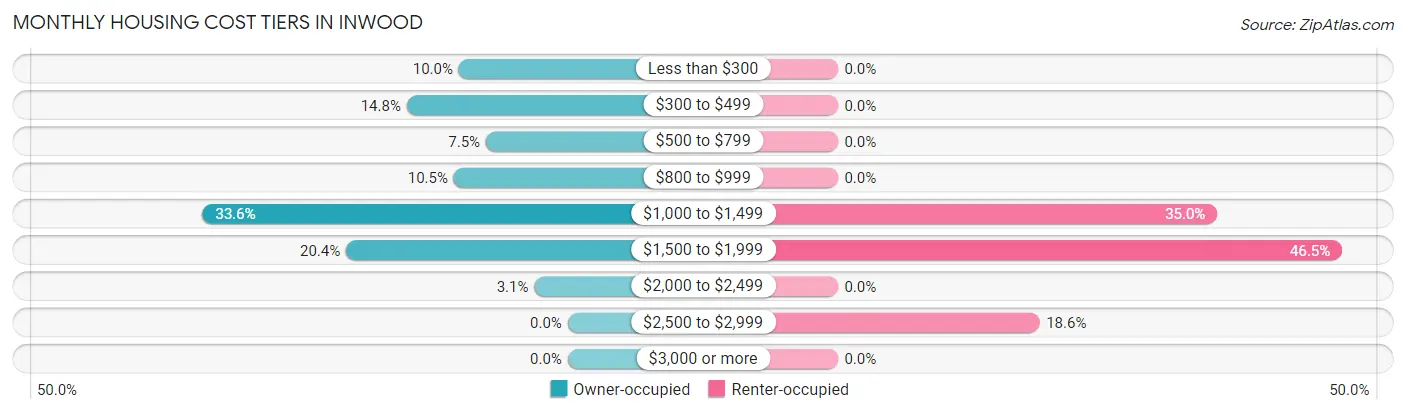
| Monthly Cost | Owner-occupied | Renter-occupied |
| Less than $300 | 88 (10.0%) | 0 (0.0%) |
| $300 to $499 | 130 (14.8%) | 0 (0.0%) |
| $500 to $799 | 66 (7.5%) | 0 (0.0%) |
| $800 to $999 | 92 (10.5%) | 0 (0.0%) |
| $1,000 to $1,499 | 295 (33.6%) | 79 (35.0%) |
| $1,500 to $1,999 | 179 (20.4%) | 105 (46.5%) |
| $2,000 to $2,499 | 27 (3.1%) | 0 (0.0%) |
| $2,500 to $2,999 | 0 (0.0%) | 42 (18.6%) |
| $3,000 or more | 0 (0.0%) | 0 (0.0%) |
| Total | 877 (100.0%) | 226 (100.0%) |
Physical Housing Characteristics in Inwood
Housing Structures in Inwood
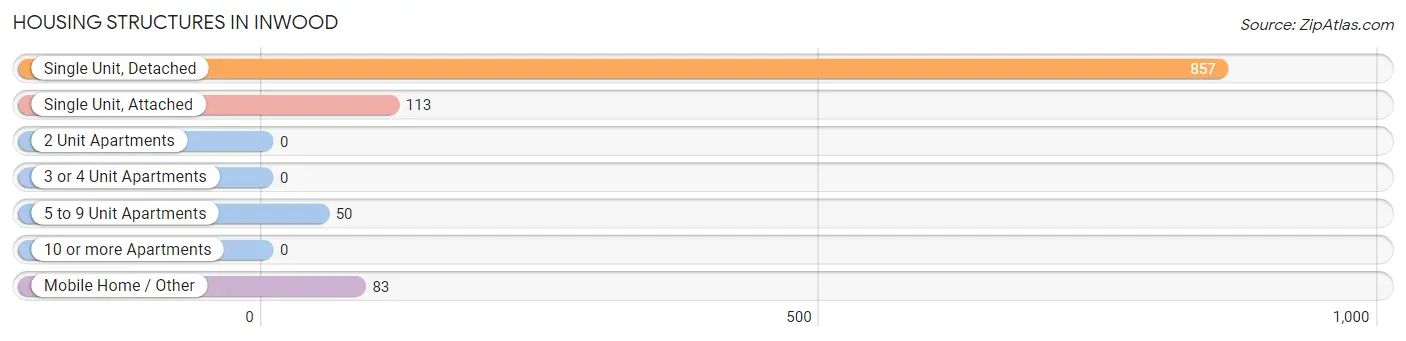
| Structure Type | # Housing Units | % Housing Units |
| Single Unit, Detached | 857 | 77.7% |
| Single Unit, Attached | 113 | 10.2% |
| 2 Unit Apartments | 0 | 0.0% |
| 3 or 4 Unit Apartments | 0 | 0.0% |
| 5 to 9 Unit Apartments | 50 | 4.5% |
| 10 or more Apartments | 0 | 0.0% |
| Mobile Home / Other | 83 | 7.5% |
| Total | 1,103 | 100.0% |
Housing Structures by Occupancy in Inwood
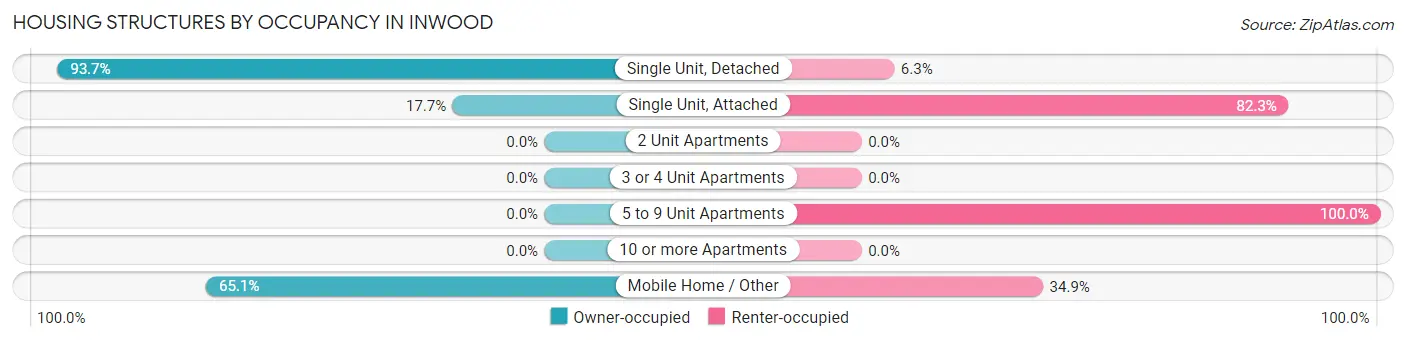
| Structure Type | Owner-occupied | Renter-occupied |
| Single Unit, Detached | 803 (93.7%) | 54 (6.3%) |
| Single Unit, Attached | 20 (17.7%) | 93 (82.3%) |
| 2 Unit Apartments | 0 (0.0%) | 0 (0.0%) |
| 3 or 4 Unit Apartments | 0 (0.0%) | 0 (0.0%) |
| 5 to 9 Unit Apartments | 0 (0.0%) | 50 (100.0%) |
| 10 or more Apartments | 0 (0.0%) | 0 (0.0%) |
| Mobile Home / Other | 54 (65.1%) | 29 (34.9%) |
| Total | 877 (79.5%) | 226 (20.5%) |
Housing Structures by Number of Rooms in Inwood
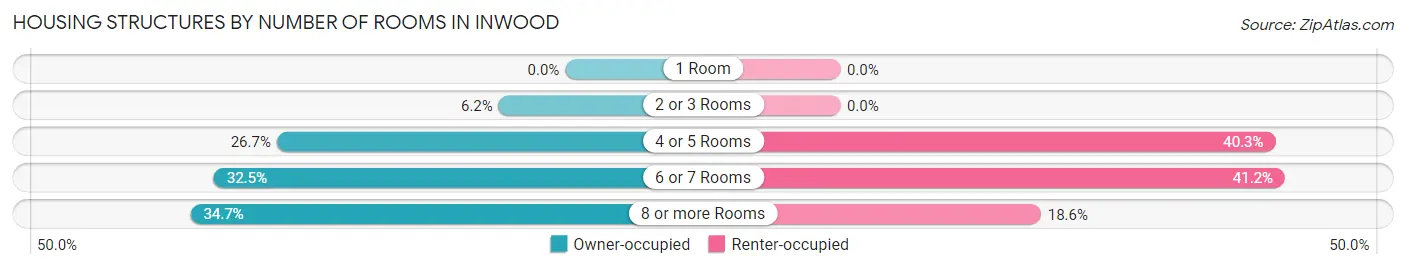
| Number of Rooms | Owner-occupied | Renter-occupied |
| 1 Room | 0 (0.0%) | 0 (0.0%) |
| 2 or 3 Rooms | 54 (6.2%) | 0 (0.0%) |
| 4 or 5 Rooms | 234 (26.7%) | 91 (40.3%) |
| 6 or 7 Rooms | 285 (32.5%) | 93 (41.1%) |
| 8 or more Rooms | 304 (34.7%) | 42 (18.6%) |
| Total | 877 (100.0%) | 226 (100.0%) |
Housing Structure by Heating Type in Inwood
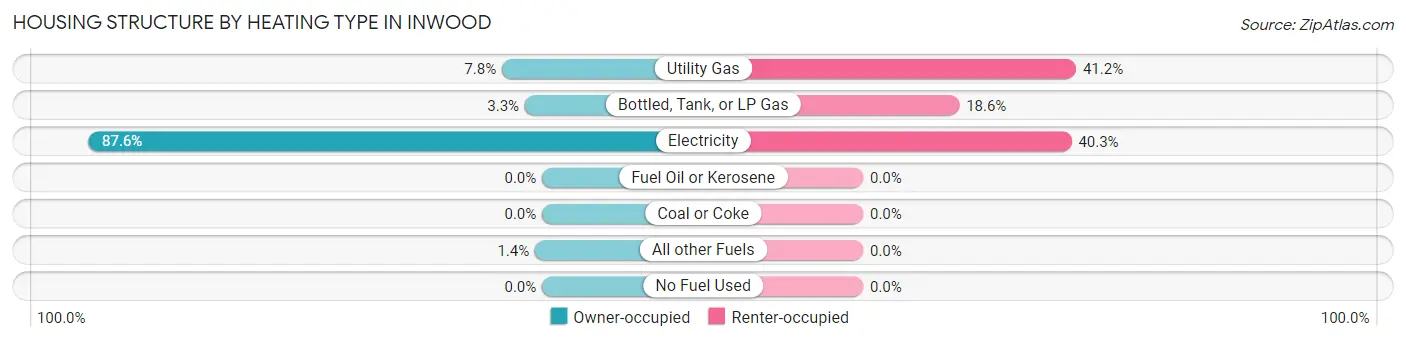
| Heating Type | Owner-occupied | Renter-occupied |
| Utility Gas | 68 (7.7%) | 93 (41.1%) |
| Bottled, Tank, or LP Gas | 29 (3.3%) | 42 (18.6%) |
| Electricity | 768 (87.6%) | 91 (40.3%) |
| Fuel Oil or Kerosene | 0 (0.0%) | 0 (0.0%) |
| Coal or Coke | 0 (0.0%) | 0 (0.0%) |
| All other Fuels | 12 (1.4%) | 0 (0.0%) |
| No Fuel Used | 0 (0.0%) | 0 (0.0%) |
| Total | 877 (100.0%) | 226 (100.0%) |
Household Vehicle Usage in Inwood
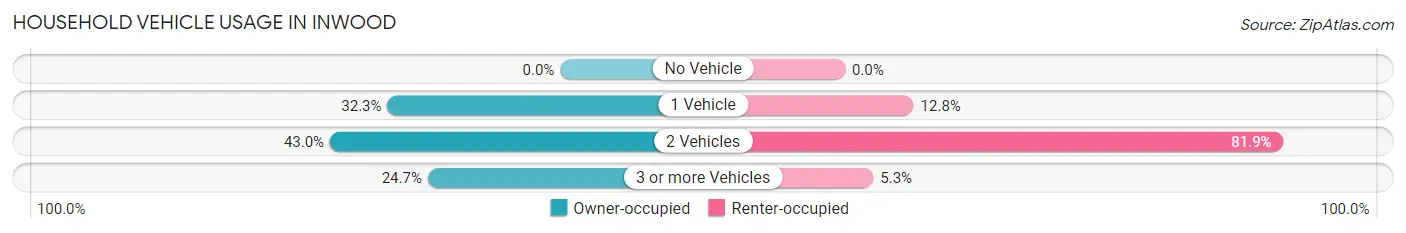
| Vehicles per Household | Owner-occupied | Renter-occupied |
| No Vehicle | 0 (0.0%) | 0 (0.0%) |
| 1 Vehicle | 283 (32.3%) | 29 (12.8%) |
| 2 Vehicles | 377 (43.0%) | 185 (81.9%) |
| 3 or more Vehicles | 217 (24.7%) | 12 (5.3%) |
| Total | 877 (100.0%) | 226 (100.0%) |
Real Estate & Mortgages in Inwood
Real Estate and Mortgage Overview in Inwood
| Characteristic | Without Mortgage | With Mortgage |
| Housing Units | 284 | 593 |
| Median Property Value | $186,300 | $261,500 |
| Median Household Income | $52,875 | $163 |
| Monthly Housing Costs | $343 | $0 |
| Real Estate Taxes | $1,081 | $24 |
Property Value by Mortgage Status in Inwood
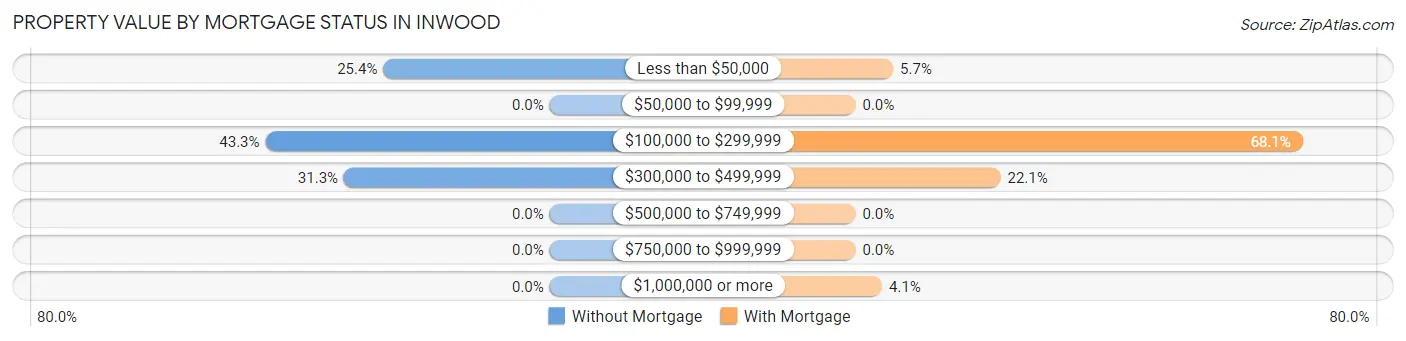
| Property Value | Without Mortgage | With Mortgage |
| Less than $50,000 | 72 (25.4%) | 34 (5.7%) |
| $50,000 to $99,999 | 0 (0.0%) | 0 (0.0%) |
| $100,000 to $299,999 | 123 (43.3%) | 404 (68.1%) |
| $300,000 to $499,999 | 89 (31.3%) | 131 (22.1%) |
| $500,000 to $749,999 | 0 (0.0%) | 0 (0.0%) |
| $750,000 to $999,999 | 0 (0.0%) | 0 (0.0%) |
| $1,000,000 or more | 0 (0.0%) | 24 (4.1%) |
| Total | 284 (100.0%) | 593 (100.0%) |
Household Income by Mortgage Status in Inwood
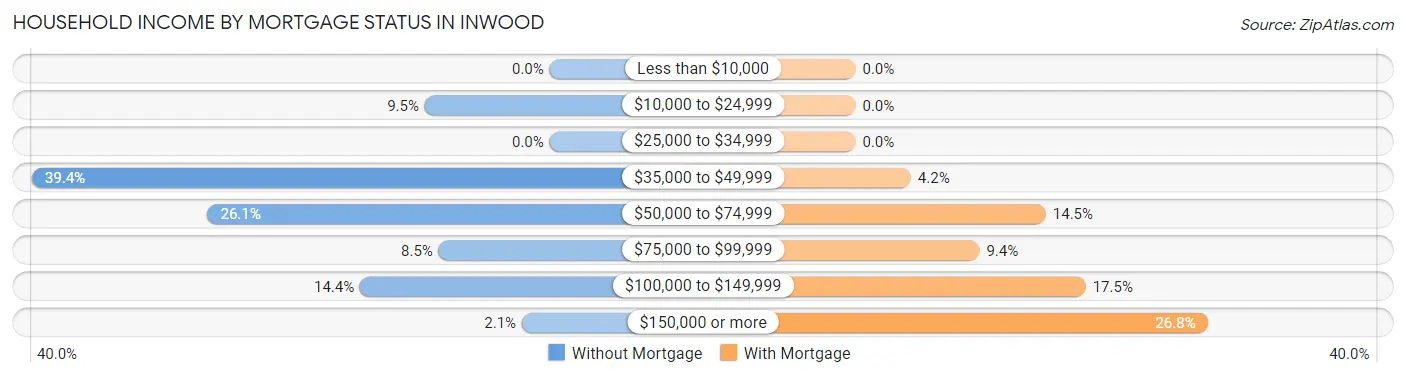
| Household Income | Without Mortgage | With Mortgage |
| Less than $10,000 | 0 (0.0%) | 0 (0.0%) |
| $10,000 to $24,999 | 27 (9.5%) | 0 (0.0%) |
| $25,000 to $34,999 | 0 (0.0%) | 0 (0.0%) |
| $35,000 to $49,999 | 112 (39.4%) | 25 (4.2%) |
| $50,000 to $74,999 | 74 (26.1%) | 86 (14.5%) |
| $75,000 to $99,999 | 24 (8.5%) | 56 (9.4%) |
| $100,000 to $149,999 | 41 (14.4%) | 104 (17.5%) |
| $150,000 or more | 6 (2.1%) | 159 (26.8%) |
| Total | 284 (100.0%) | 593 (100.0%) |
Property Value to Household Income Ratio in Inwood
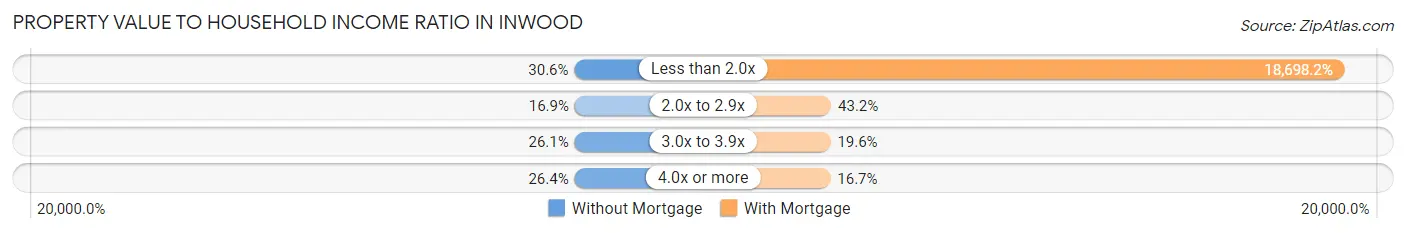
| Value-to-Income Ratio | Without Mortgage | With Mortgage |
| Less than 2.0x | 87 (30.6%) | 110,880 (18,698.2%) |
| 2.0x to 2.9x | 48 (16.9%) | 256 (43.2%) |
| 3.0x to 3.9x | 74 (26.1%) | 116 (19.6%) |
| 4.0x or more | 75 (26.4%) | 99 (16.7%) |
| Total | 284 (100.0%) | 593 (100.0%) |
Real Estate Taxes by Mortgage Status in Inwood
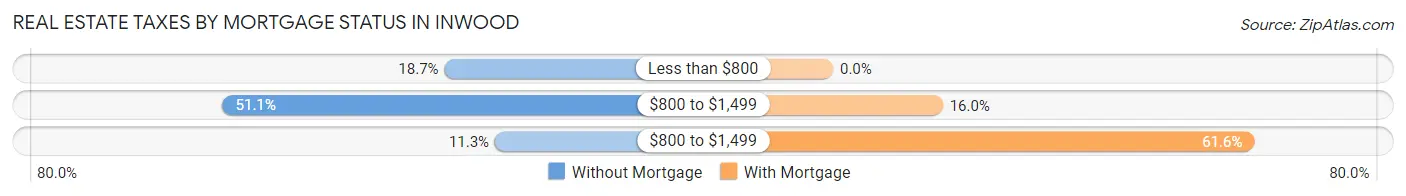
| Property Taxes | Without Mortgage | With Mortgage |
| Less than $800 | 53 (18.7%) | 0 (0.0%) |
| $800 to $1,499 | 145 (51.1%) | 95 (16.0%) |
| $800 to $1,499 | 32 (11.3%) | 365 (61.6%) |
| Total | 284 (100.0%) | 593 (100.0%) |
Health & Disability in Inwood
Health Insurance Coverage by Age in Inwood
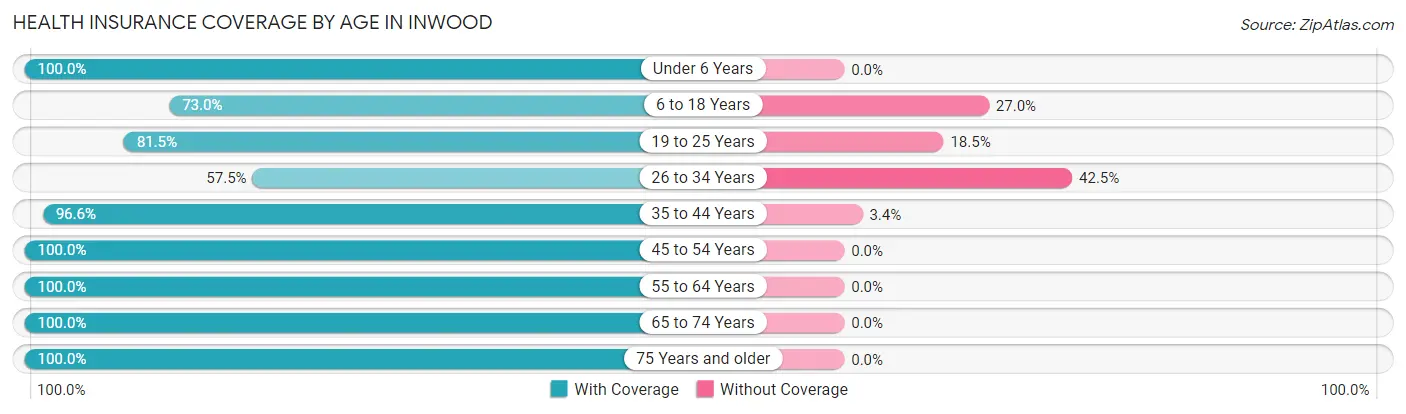
| Age Bracket | With Coverage | Without Coverage |
| Under 6 Years | 246 (100.0%) | 0 (0.0%) |
| 6 to 18 Years | 287 (73.0%) | 106 (27.0%) |
| 19 to 25 Years | 304 (81.5%) | 69 (18.5%) |
| 26 to 34 Years | 176 (57.5%) | 130 (42.5%) |
| 35 to 44 Years | 343 (96.6%) | 12 (3.4%) |
| 45 to 54 Years | 321 (100.0%) | 0 (0.0%) |
| 55 to 64 Years | 334 (100.0%) | 0 (0.0%) |
| 65 to 74 Years | 290 (100.0%) | 0 (0.0%) |
| 75 Years and older | 213 (100.0%) | 0 (0.0%) |
| Total | 2,514 (88.8%) | 317 (11.2%) |
Health Insurance Coverage by Citizenship Status in Inwood
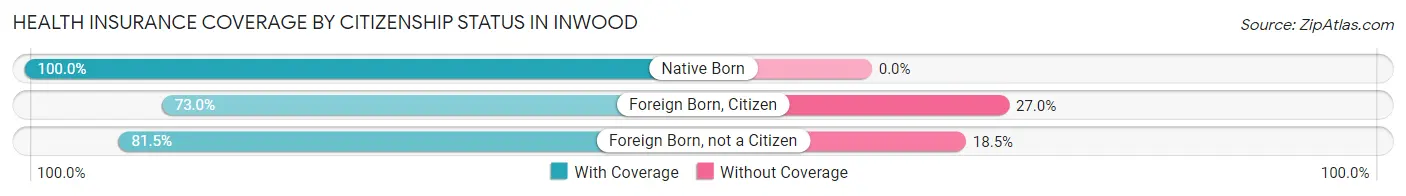
| Citizenship Status | With Coverage | Without Coverage |
| Native Born | 246 (100.0%) | 0 (0.0%) |
| Foreign Born, Citizen | 287 (73.0%) | 106 (27.0%) |
| Foreign Born, not a Citizen | 304 (81.5%) | 69 (18.5%) |
Health Insurance Coverage by Household Income in Inwood
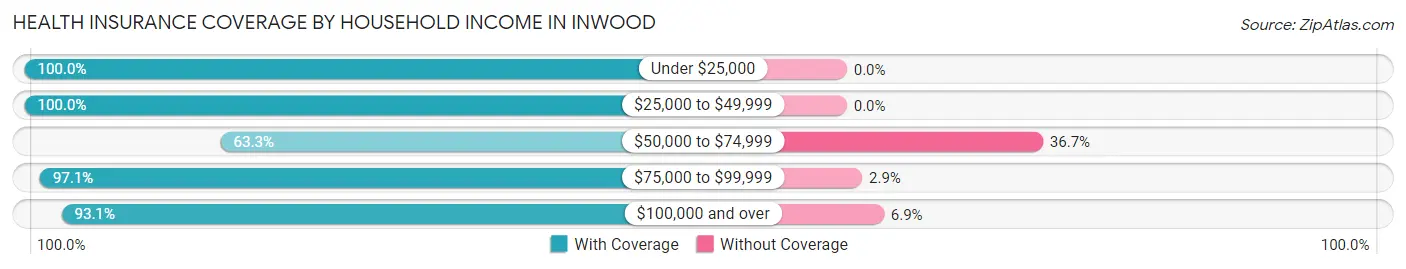
| Household Income | With Coverage | Without Coverage |
| Under $25,000 | 82 (100.0%) | 0 (0.0%) |
| $25,000 to $49,999 | 311 (100.0%) | 0 (0.0%) |
| $50,000 to $74,999 | 365 (63.3%) | 212 (36.7%) |
| $75,000 to $99,999 | 576 (97.1%) | 17 (2.9%) |
| $100,000 and over | 1,180 (93.1%) | 88 (6.9%) |
Public vs Private Health Insurance Coverage by Age in Inwood
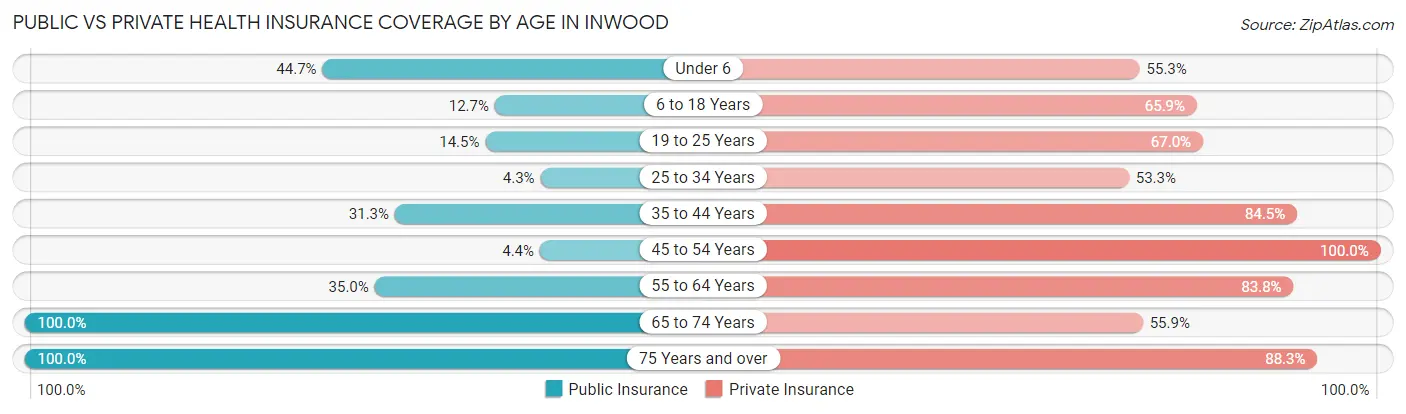
| Age Bracket | Public Insurance | Private Insurance |
| Under 6 | 110 (44.7%) | 136 (55.3%) |
| 6 to 18 Years | 50 (12.7%) | 259 (65.9%) |
| 19 to 25 Years | 54 (14.5%) | 250 (67.0%) |
| 25 to 34 Years | 13 (4.3%) | 163 (53.3%) |
| 35 to 44 Years | 111 (31.3%) | 300 (84.5%) |
| 45 to 54 Years | 14 (4.4%) | 321 (100.0%) |
| 55 to 64 Years | 117 (35.0%) | 280 (83.8%) |
| 65 to 74 Years | 290 (100.0%) | 162 (55.9%) |
| 75 Years and over | 213 (100.0%) | 188 (88.3%) |
| Total | 972 (34.3%) | 2,059 (72.7%) |
Disability Status by Sex by Age in Inwood
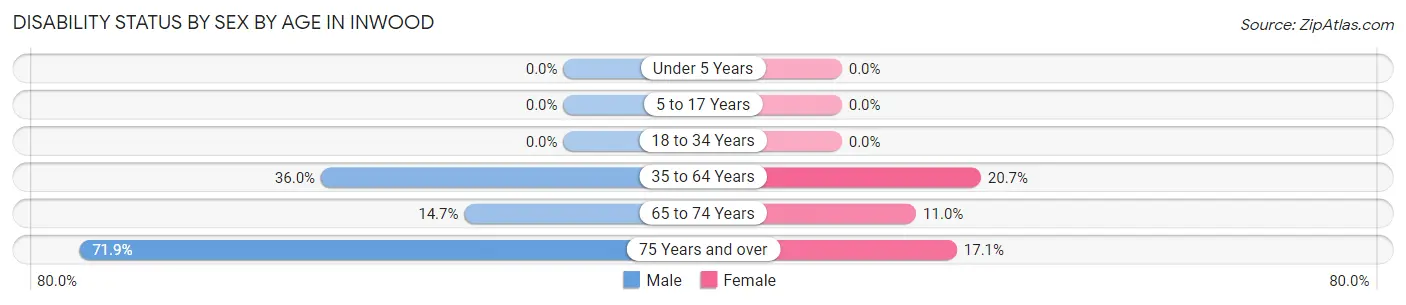
| Age Bracket | Male | Female |
| Under 5 Years | 0 (0.0%) | 0 (0.0%) |
| 5 to 17 Years | 0 (0.0%) | 0 (0.0%) |
| 18 to 34 Years | 0 (0.0%) | 0 (0.0%) |
| 35 to 64 Years | 198 (36.0%) | 95 (20.6%) |
| 65 to 74 Years | 20 (14.7%) | 17 (11.0%) |
| 75 Years and over | 69 (71.9%) | 20 (17.1%) |
Disability Class by Sex by Age in Inwood
Disability Class: Hearing Difficulty
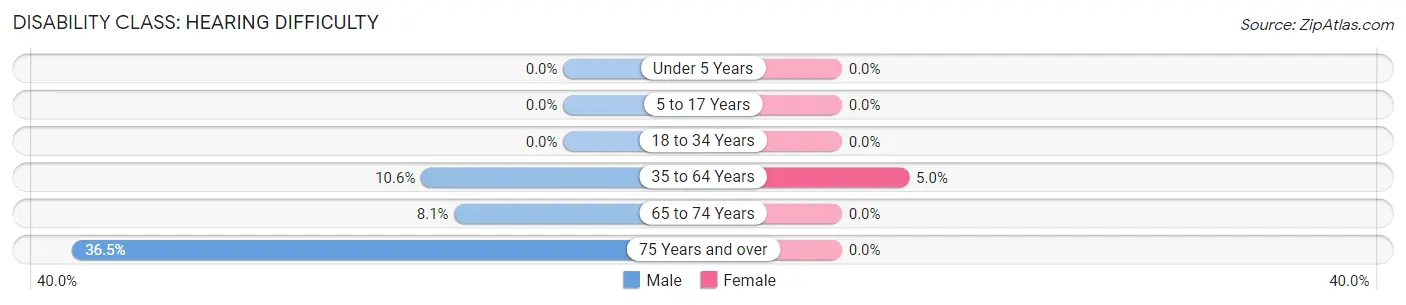
| Age Bracket | Male | Female |
| Under 5 Years | 0 (0.0%) | 0 (0.0%) |
| 5 to 17 Years | 0 (0.0%) | 0 (0.0%) |
| 18 to 34 Years | 0 (0.0%) | 0 (0.0%) |
| 35 to 64 Years | 58 (10.5%) | 23 (5.0%) |
| 65 to 74 Years | 11 (8.1%) | 0 (0.0%) |
| 75 Years and over | 35 (36.5%) | 0 (0.0%) |
Disability Class: Vision Difficulty
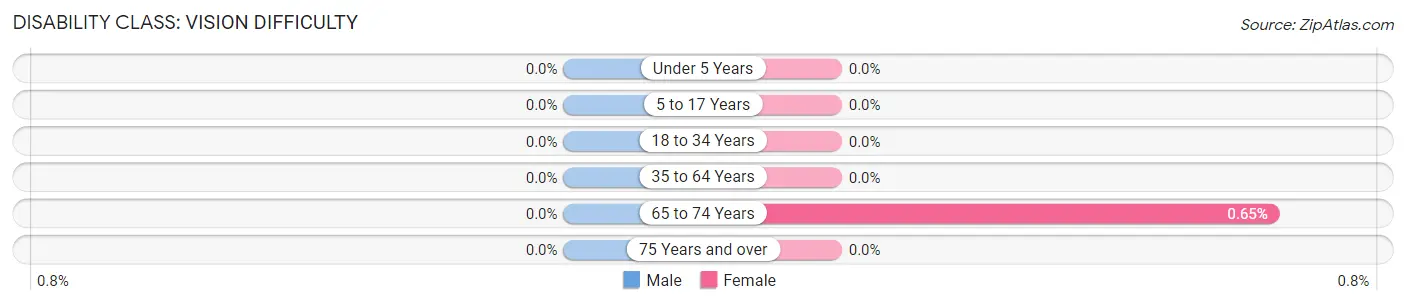
| Age Bracket | Male | Female |
| Under 5 Years | 0 (0.0%) | 0 (0.0%) |
| 5 to 17 Years | 0 (0.0%) | 0 (0.0%) |
| 18 to 34 Years | 0 (0.0%) | 0 (0.0%) |
| 35 to 64 Years | 0 (0.0%) | 0 (0.0%) |
| 65 to 74 Years | 0 (0.0%) | 1 (0.6%) |
| 75 Years and over | 0 (0.0%) | 0 (0.0%) |
Disability Class: Cognitive Difficulty
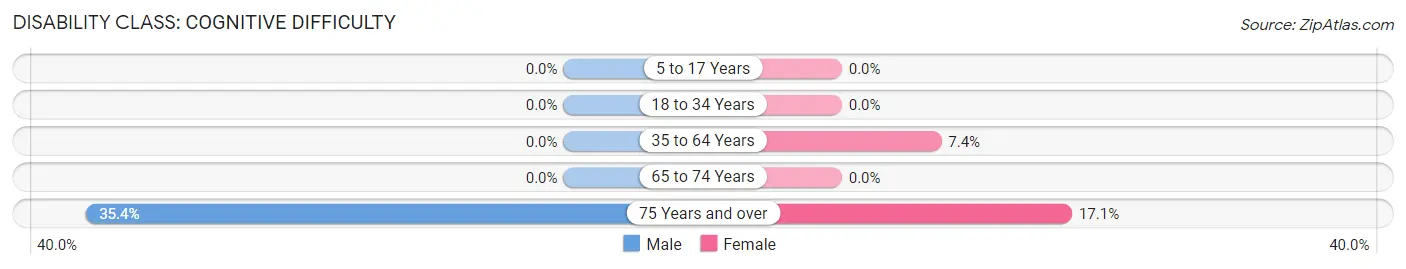
| Age Bracket | Male | Female |
| 5 to 17 Years | 0 (0.0%) | 0 (0.0%) |
| 18 to 34 Years | 0 (0.0%) | 0 (0.0%) |
| 35 to 64 Years | 0 (0.0%) | 34 (7.4%) |
| 65 to 74 Years | 0 (0.0%) | 0 (0.0%) |
| 75 Years and over | 34 (35.4%) | 20 (17.1%) |
Disability Class: Ambulatory Difficulty
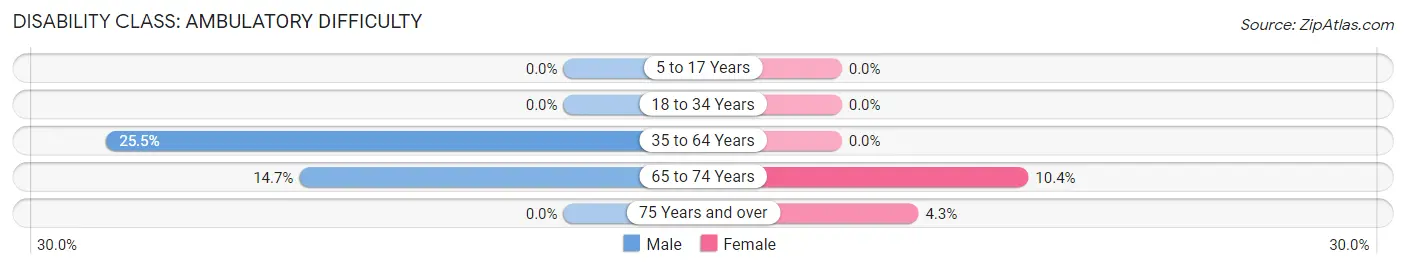
| Age Bracket | Male | Female |
| 5 to 17 Years | 0 (0.0%) | 0 (0.0%) |
| 18 to 34 Years | 0 (0.0%) | 0 (0.0%) |
| 35 to 64 Years | 140 (25.5%) | 0 (0.0%) |
| 65 to 74 Years | 20 (14.7%) | 16 (10.4%) |
| 75 Years and over | 0 (0.0%) | 5 (4.3%) |
Disability Class: Self-Care Difficulty
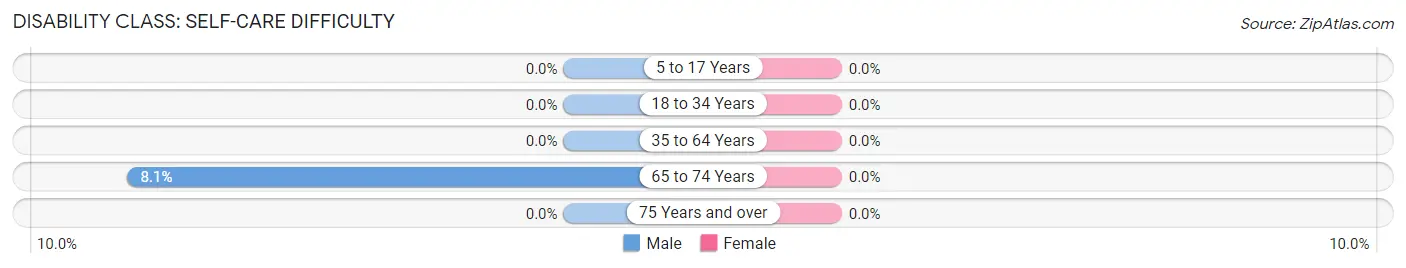
| Age Bracket | Male | Female |
| 5 to 17 Years | 0 (0.0%) | 0 (0.0%) |
| 18 to 34 Years | 0 (0.0%) | 0 (0.0%) |
| 35 to 64 Years | 0 (0.0%) | 0 (0.0%) |
| 65 to 74 Years | 11 (8.1%) | 0 (0.0%) |
| 75 Years and over | 0 (0.0%) | 0 (0.0%) |
Technology Access in Inwood
Computing Device Access in Inwood
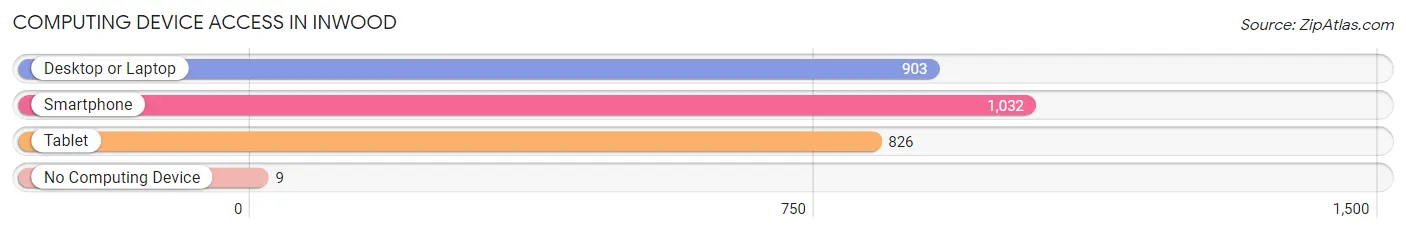
| Device Type | # Households | % Households |
| Desktop or Laptop | 903 | 81.9% |
| Smartphone | 1,032 | 93.6% |
| Tablet | 826 | 74.9% |
| No Computing Device | 9 | 0.8% |
| Total | 1,103 | 100.0% |
Internet Access in Inwood
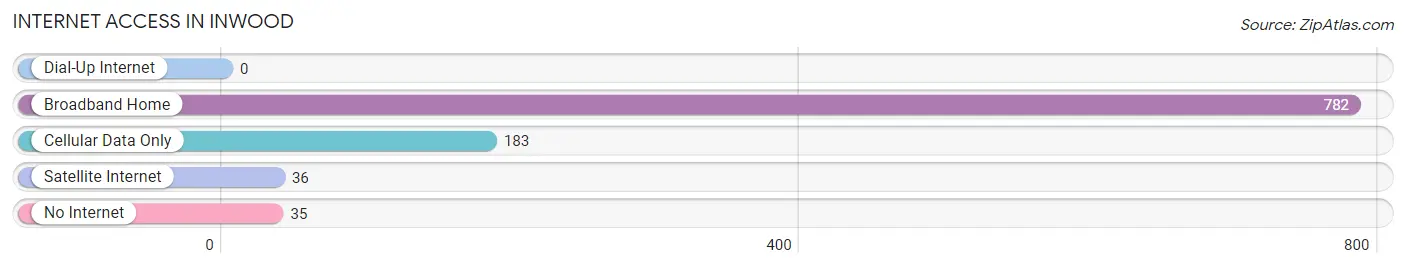
| Internet Type | # Households | % Households |
| Dial-Up Internet | 0 | 0.0% |
| Broadband Home | 782 | 70.9% |
| Cellular Data Only | 183 | 16.6% |
| Satellite Internet | 36 | 3.3% |
| No Internet | 35 | 3.2% |
| Total | 1,103 | 100.0% |
Inwood Summary
Inwood is a small town located in the Eastern Panhandle of West Virginia, United States. It is part of Berkeley County and is situated along the Potomac River, just north of the Maryland border. The town has a population of approximately 2,000 people and is located about an hour and a half from Washington, D.C.
History
Inwood was first settled in the late 1700s by German immigrants. The town was originally known as “Hess’s Crossroads” after the Hess family who owned the land. In 1832, the town was renamed “Inwood” after the Inwood family who had purchased the land. The town was officially incorporated in 1891.
Inwood was a rural farming community for much of its history. In the early 1900s, the town began to grow as a result of the railroad industry. The Baltimore and Ohio Railroad built a line through the town in 1902, connecting it to nearby Martinsburg and Winchester, Virginia. This allowed for the transportation of goods and people, and helped to spur economic growth in the area.
Inwood was also home to a number of industries, including a brickyard, a sawmill, and a gristmill. The town also had a number of stores, including a general store, a drug store, and a hardware store.
Geography
Inwood is located in the Eastern Panhandle of West Virginia, in Berkeley County. It is situated along the Potomac River, just north of the Maryland border. The town is located about an hour and a half from Washington, D.C.
The town is situated in a valley, surrounded by rolling hills and mountains. The climate is temperate, with hot summers and cold winters. The average annual temperature is around 50 degrees Fahrenheit.
Economy
Inwood’s economy is largely based on agriculture and tourism. The town is home to a number of farms, which produce a variety of crops, including corn, soybeans, and hay. The town also has a number of wineries and vineyards, which attract tourists from all over the region.
Inwood is also home to a number of small businesses, including restaurants, shops, and services. The town is also home to a number of manufacturing companies, including a furniture factory and a plastics factory.
Demographics
As of the 2010 census, Inwood had a population of 2,039 people. The racial makeup of the town was 94.3% White, 2.7% African American, 0.3% Native American, 0.7% Asian, 0.1% Pacific Islander, 0.7% from other races, and 1.2% from two or more races. Hispanic or Latino of any race were 1.7% of the population.
The median household income in Inwood was $45,938, and the median family income was $51,964. The per capita income was $20,945. About 8.3% of families and 10.2% of the population were below the poverty line, including 14.2% of those under age 18 and 8.2% of those age 65 or over.
Common Questions
What is Per Capita Income in Inwood?
Per Capita income in Inwood is $36,341.
What is the Median Family Income in Inwood?
Median Family Income in Inwood is $99,474.
What is the Median Household income in Inwood?
Median Household Income in Inwood is $90,327.
What is Income or Wage Gap in Inwood?
Income or Wage Gap in Inwood is 31.8%.
Women in Inwood earn 68.2 cents for every dollar earned by a man.
What is Inequality or Gini Index in Inwood?
Inequality or Gini Index in Inwood is 0.29.
What is the Total Population of Inwood?
Total Population of Inwood is 2,831.
What is the Total Male Population of Inwood?
Total Male Population of Inwood is 1,495.
What is the Total Female Population of Inwood?
Total Female Population of Inwood is 1,336.
What is the Ratio of Males per 100 Females in Inwood?
There are 111.90 Males per 100 Females in Inwood.
What is the Ratio of Females per 100 Males in Inwood?
There are 89.36 Females per 100 Males in Inwood.
What is the Median Population Age in Inwood?
Median Population Age in Inwood is 40.7 Years.
What is the Average Family Size in Inwood
Average Family Size in Inwood is 2.9 People.
What is the Average Household Size in Inwood
Average Household Size in Inwood is 2.6 People.
How Large is the Labor Force in Inwood?
There are 1,441 People in the Labor Forcein in Inwood.
What is the Percentage of People in the Labor Force in Inwood?
63.0% of People are in the Labor Force in Inwood.
What is the Unemployment Rate in Inwood?
Unemployment Rate in Inwood is 10.7%.