Dutch Island, GA Map & Demographics
Dutch Island Map
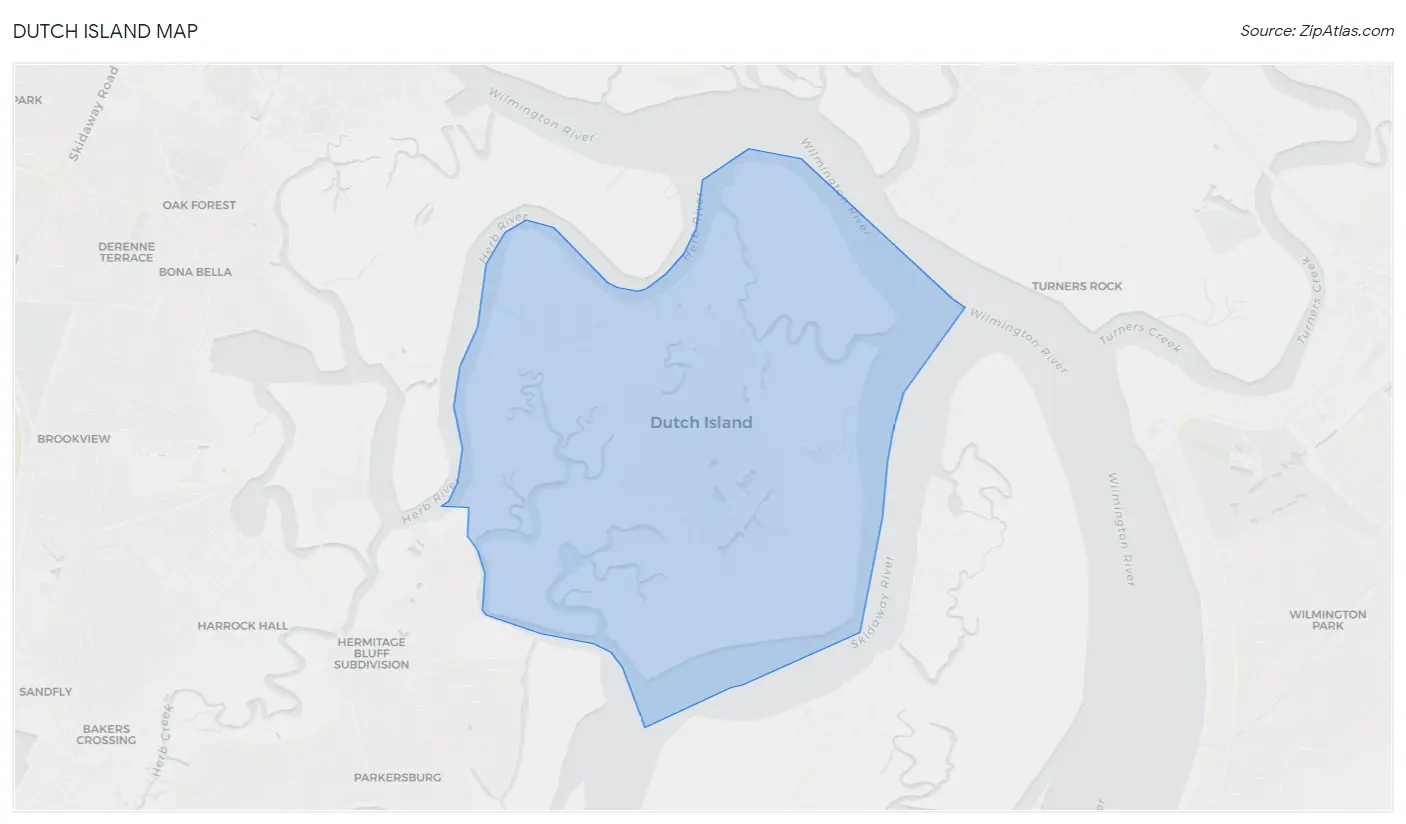
Dutch Island Overview
$73,218
PER CAPITA INCOME
$185,500
AVG FAMILY INCOME
$169,063
AVG HOUSEHOLD INCOME
66.2%
WAGE / INCOME GAP [ % ]
33.8¢/ $1
WAGE / INCOME GAP [ $ ]
0.49
INEQUALITY / GINI INDEX
1,268
TOTAL POPULATION
583
MALE POPULATION
685
FEMALE POPULATION
85.11
MALES / 100 FEMALES
117.50
FEMALES / 100 MALES
45.6
MEDIAN AGE
3.0
AVG FAMILY SIZE
2.8
AVG HOUSEHOLD SIZE
507
LABOR FORCE [ PEOPLE ]
53.9%
PERCENT IN LABOR FORCE
Income in Dutch Island
Income Overview in Dutch Island
Per Capita Income in Dutch Island is $73,218, while median incomes of families and households are $185,500 and $169,063 respectively.
| Characteristic | Number | Measure |
| Per Capita Income | 1,268 | $73,218 |
| Median Family Income | 410 | $185,500 |
| Mean Family Income | 410 | $221,122 |
| Median Household Income | 456 | $169,063 |
| Mean Household Income | 456 | $208,836 |
| Income Deficit | 410 | $0 |
| Wage / Income Gap (%) | 1,268 | 66.25% |
| Wage / Income Gap ($) | 1,268 | 33.75¢ per $1 |
| Gini / Inequality Index | 1,268 | 0.49 |
Earnings by Sex in Dutch Island
Average Earnings in Dutch Island are $98,859, $176,719 for men and $59,643 for women, a difference of 66.2%.
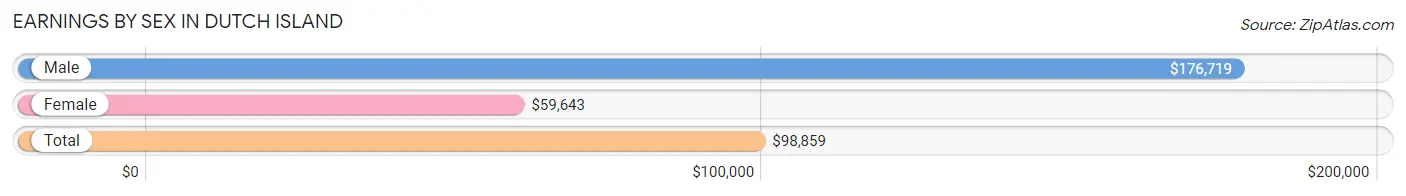
| Sex | Number | Average Earnings |
| Male | 255 (49.5%) | $176,719 |
| Female | 260 (50.5%) | $59,643 |
| Total | 515 (100.0%) | $98,859 |
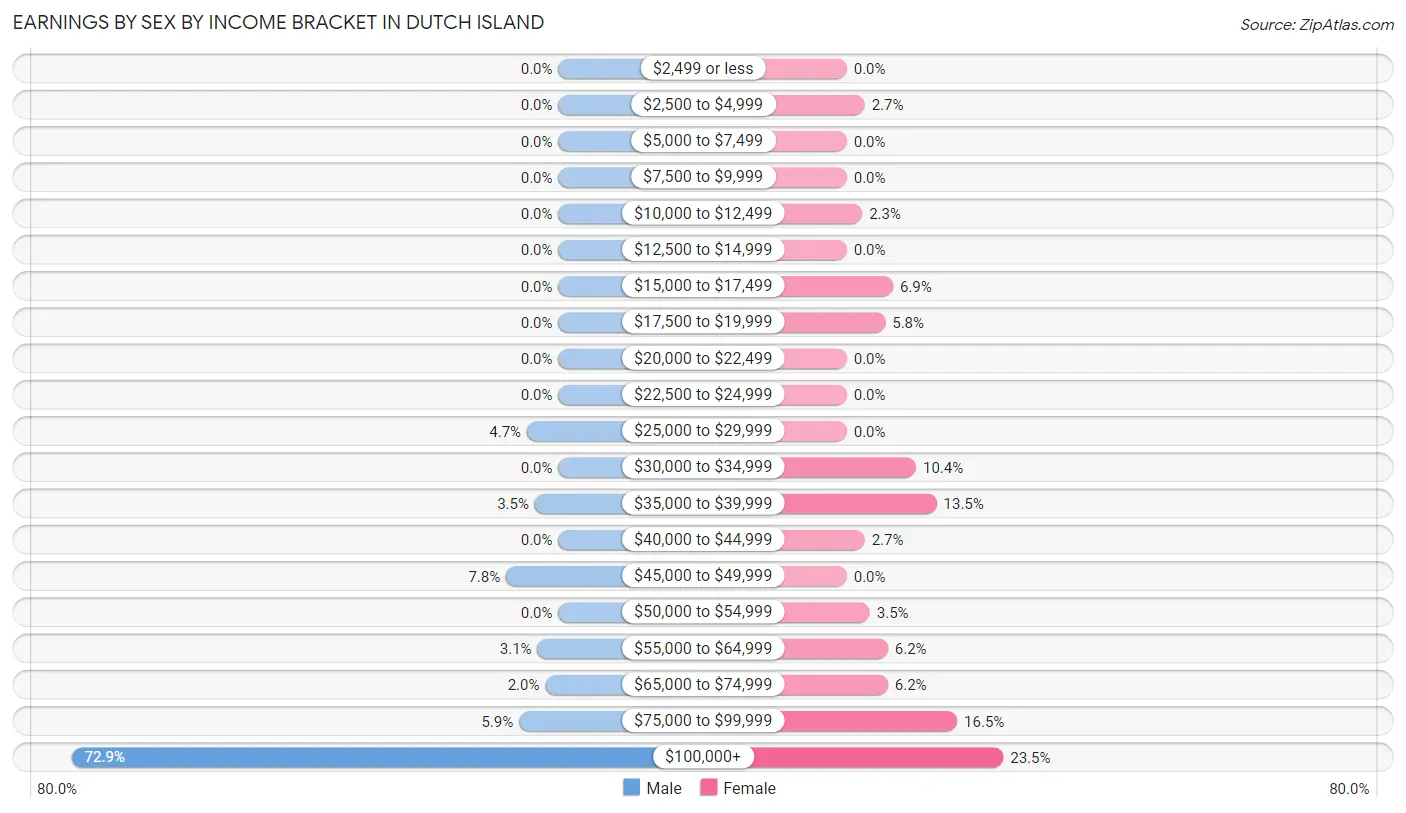
Earnings by Sex by Income Bracket in Dutch Island
The most common earnings brackets in Dutch Island are $100,000+ for men (186 | 72.9%) and $100,000+ for women (61 | 23.5%).
| Income | Male | Female |
| $2,499 or less | 0 (0.0%) | 0 (0.0%) |
| $2,500 to $4,999 | 0 (0.0%) | 7 (2.7%) |
| $5,000 to $7,499 | 0 (0.0%) | 0 (0.0%) |
| $7,500 to $9,999 | 0 (0.0%) | 0 (0.0%) |
| $10,000 to $12,499 | 0 (0.0%) | 6 (2.3%) |
| $12,500 to $14,999 | 0 (0.0%) | 0 (0.0%) |
| $15,000 to $17,499 | 0 (0.0%) | 18 (6.9%) |
| $17,500 to $19,999 | 0 (0.0%) | 15 (5.8%) |
| $20,000 to $22,499 | 0 (0.0%) | 0 (0.0%) |
| $22,500 to $24,999 | 0 (0.0%) | 0 (0.0%) |
| $25,000 to $29,999 | 12 (4.7%) | 0 (0.0%) |
| $30,000 to $34,999 | 0 (0.0%) | 27 (10.4%) |
| $35,000 to $39,999 | 9 (3.5%) | 35 (13.5%) |
| $40,000 to $44,999 | 0 (0.0%) | 7 (2.7%) |
| $45,000 to $49,999 | 20 (7.8%) | 0 (0.0%) |
| $50,000 to $54,999 | 0 (0.0%) | 9 (3.5%) |
| $55,000 to $64,999 | 8 (3.1%) | 16 (6.1%) |
| $65,000 to $74,999 | 5 (2.0%) | 16 (6.1%) |
| $75,000 to $99,999 | 15 (5.9%) | 43 (16.5%) |
| $100,000+ | 186 (72.9%) | 61 (23.5%) |
| Total | 255 (100.0%) | 260 (100.0%) |
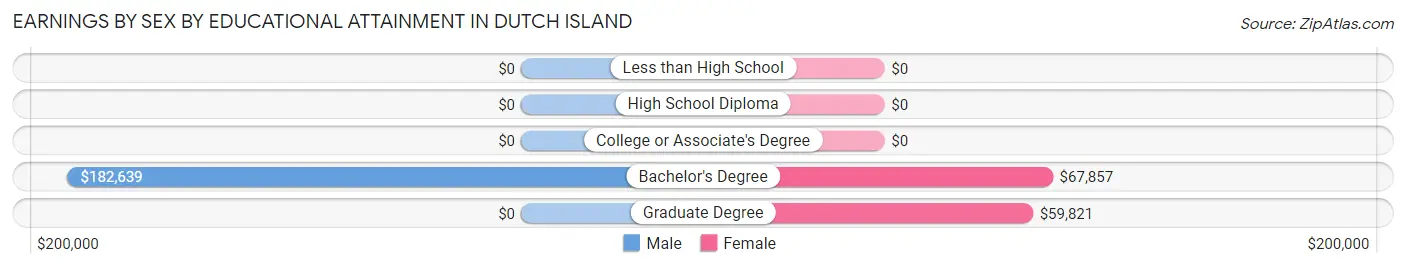
Earnings by Sex by Educational Attainment in Dutch Island
Average earnings in Dutch Island are $176,719 for men and $60,556 for women, a difference of 65.7%. Men with an educational attainment of bachelor's degree enjoy the highest average annual earnings of $182,639, while those with bachelor's degree education earn the least with $182,639. Women with an educational attainment of bachelor's degree earn the most with the average annual earnings of $67,857, while those with graduate degree education have the smallest earnings of $59,821.
| Educational Attainment | Male Income | Female Income |
| Less than High School | - | - |
| High School Diploma | - | - |
| College or Associate's Degree | - | - |
| Bachelor's Degree | $182,639 | $67,857 |
| Graduate Degree | - | - |
| Total | $176,719 | $60,556 |
Family Income in Dutch Island
Family Income Brackets in Dutch Island
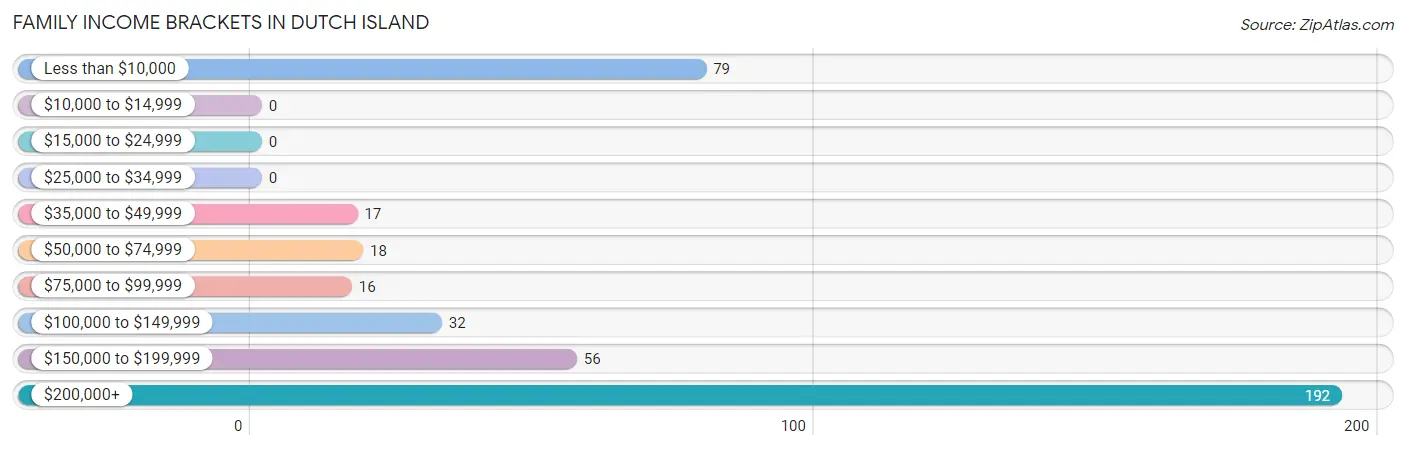
According to the Dutch Island family income data, there are 192 families falling into the $200,000+ income range, which is the most common income bracket and makes up 46.8% of all families.
| Income Bracket | # Families | % Families |
| Less than $10,000 | 79 | 19.3% |
| $10,000 to $14,999 | 0 | 0.0% |
| $15,000 to $24,999 | 0 | 0.0% |
| $25,000 to $34,999 | 0 | 0.0% |
| $35,000 to $49,999 | 17 | 4.1% |
| $50,000 to $74,999 | 18 | 4.4% |
| $75,000 to $99,999 | 16 | 3.9% |
| $100,000 to $149,999 | 32 | 7.8% |
| $150,000 to $199,999 | 56 | 13.7% |
| $200,000+ | 192 | 46.8% |
Family Income by Famaliy Size in Dutch Island
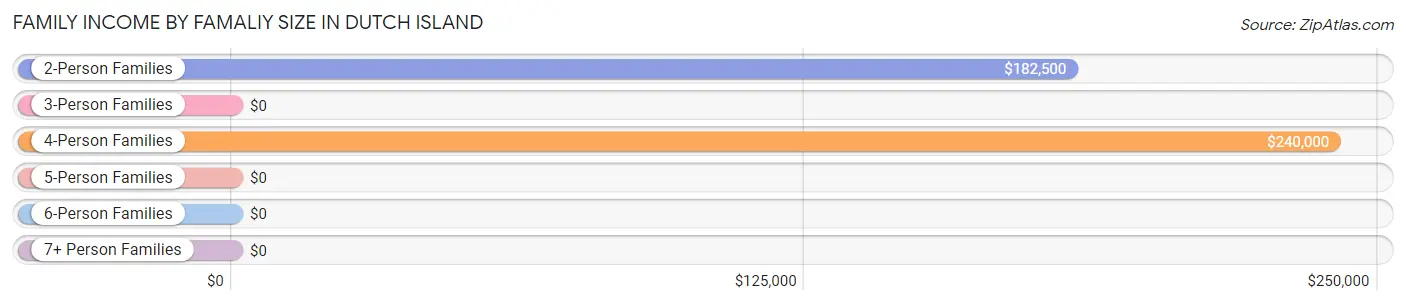
4-person families (68 | 16.6%) account for the highest median family income in Dutch Island with $240,000 per family, while 2-person families (174 | 42.4%) have the highest median income of $91,250 per family member.
| Income Bracket | # Families | Median Income |
| 2-Person Families | 174 (42.4%) | $182,500 |
| 3-Person Families | 123 (30.0%) | $0 |
| 4-Person Families | 68 (16.6%) | $240,000 |
| 5-Person Families | 32 (7.8%) | $0 |
| 6-Person Families | 6 (1.5%) | $0 |
| 7+ Person Families | 7 (1.7%) | $0 |
| Total | 410 (100.0%) | $185,500 |
Family Income by Number of Earners in Dutch Island
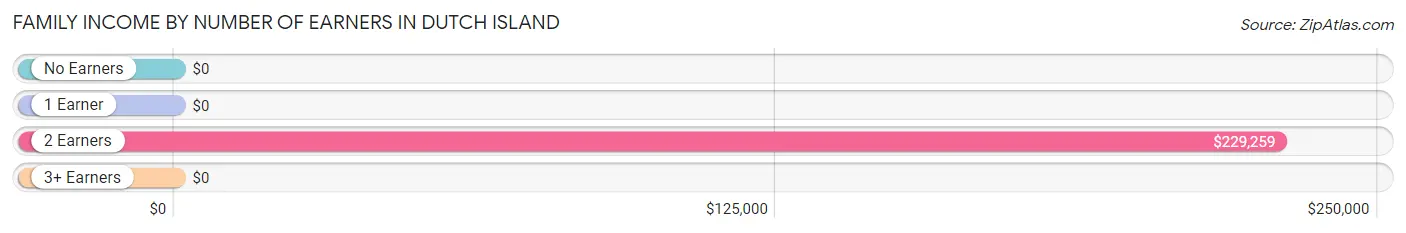
| Number of Earners | # Families | Median Income |
| No Earners | 112 (27.3%) | $0 |
| 1 Earner | 117 (28.5%) | $0 |
| 2 Earners | 158 (38.5%) | $229,259 |
| 3+ Earners | 23 (5.6%) | $0 |
| Total | 410 (100.0%) | $185,500 |
Household Income in Dutch Island
Household Income Brackets in Dutch Island
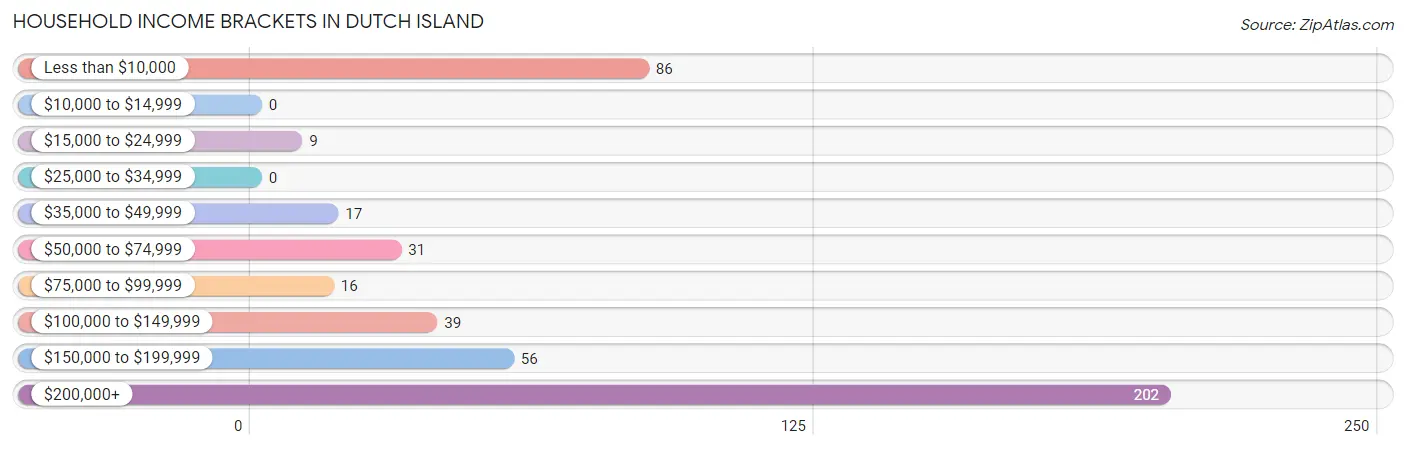
With 202 households falling in the category, the $200,000+ income range is the most frequent in Dutch Island, accounting for 44.3% of all households.
| Income Bracket | # Households | % Households |
| Less than $10,000 | 86 | 18.9% |
| $10,000 to $14,999 | 0 | 0.0% |
| $15,000 to $24,999 | 9 | 2.0% |
| $25,000 to $34,999 | 0 | 0.0% |
| $35,000 to $49,999 | 17 | 3.7% |
| $50,000 to $74,999 | 31 | 6.8% |
| $75,000 to $99,999 | 16 | 3.5% |
| $100,000 to $149,999 | 39 | 8.6% |
| $150,000 to $199,999 | 56 | 12.3% |
| $200,000+ | 202 | 44.3% |
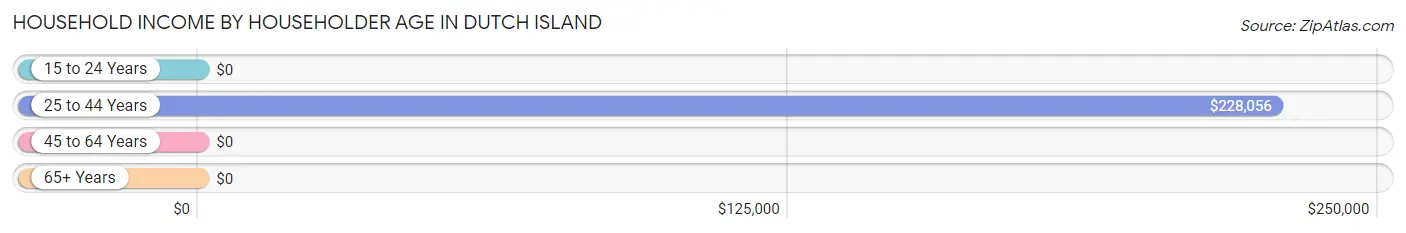
Household Income by Householder Age in Dutch Island
The median household income in Dutch Island is $169,063, with the highest median household income of $228,056 found in the 25 to 44 years age bracket for the primary householder. A total of 90 households (19.7%) fall into this category.
| Income Bracket | # Households | Median Income |
| 15 to 24 Years | 0 (0.0%) | $0 |
| 25 to 44 Years | 90 (19.7%) | $228,056 |
| 45 to 64 Years | 253 (55.5%) | $0 |
| 65+ Years | 113 (24.8%) | $0 |
| Total | 456 (100.0%) | $169,063 |
Poverty in Dutch Island
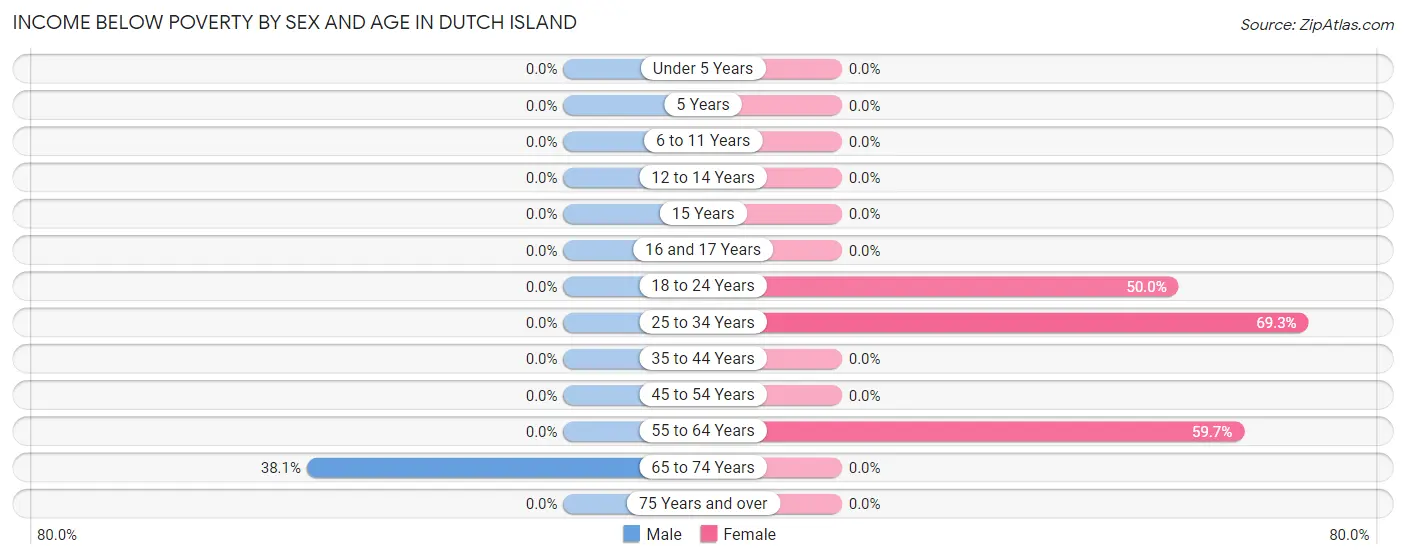
Income Below Poverty by Sex and Age in Dutch Island
With 6.9% poverty level for males and 27.6% for females among the residents of Dutch Island, 65 to 74 year old males and 25 to 34 year old females are the most vulnerable to poverty, with 40 males (38.1%) and 97 females (69.3%) in their respective age groups living below the poverty level.
| Age Bracket | Male | Female |
| Under 5 Years | 0 (0.0%) | 0 (0.0%) |
| 5 Years | 0 (0.0%) | 0 (0.0%) |
| 6 to 11 Years | 0 (0.0%) | 0 (0.0%) |
| 12 to 14 Years | 0 (0.0%) | 0 (0.0%) |
| 15 Years | 0 (0.0%) | 0 (0.0%) |
| 16 and 17 Years | 0 (0.0%) | 0 (0.0%) |
| 18 to 24 Years | 0 (0.0%) | 6 (50.0%) |
| 25 to 34 Years | 0 (0.0%) | 97 (69.3%) |
| 35 to 44 Years | 0 (0.0%) | 0 (0.0%) |
| 45 to 54 Years | 0 (0.0%) | 0 (0.0%) |
| 55 to 64 Years | 0 (0.0%) | 86 (59.7%) |
| 65 to 74 Years | 40 (38.1%) | 0 (0.0%) |
| 75 Years and over | 0 (0.0%) | 0 (0.0%) |
| Total | 40 (6.9%) | 189 (27.6%) |
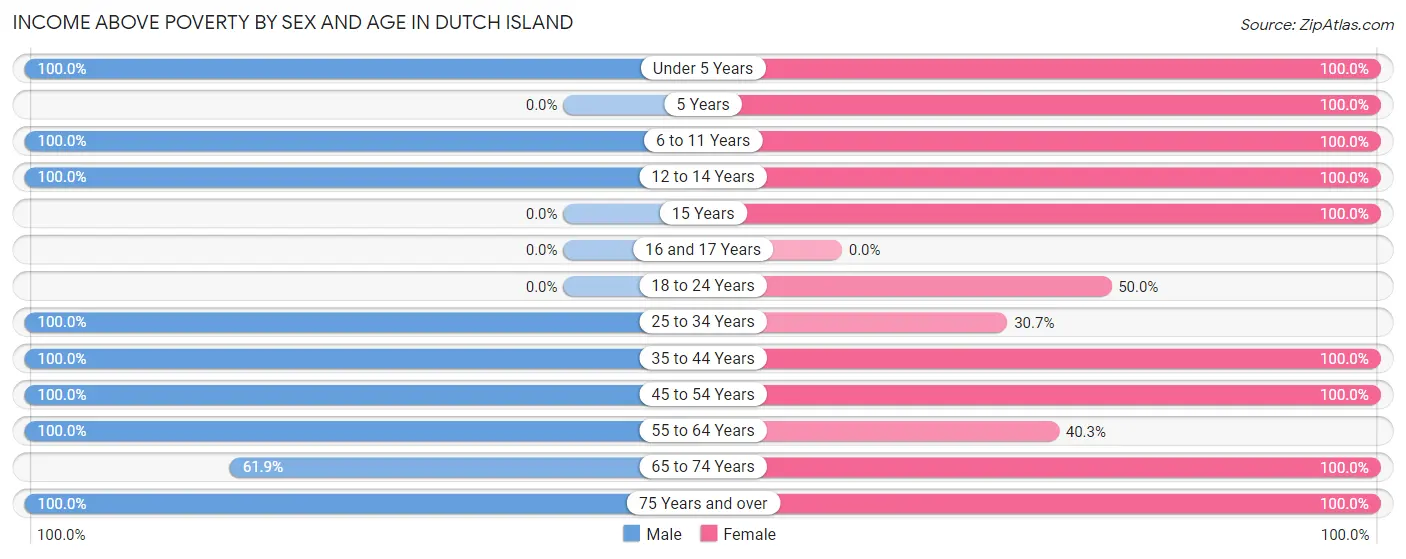
Income Above Poverty by Sex and Age in Dutch Island
According to the poverty statistics in Dutch Island, males aged under 5 years and females aged under 5 years are the age groups that are most secure financially, with 100.0% of males and 100.0% of females in these age groups living above the poverty line.
| Age Bracket | Male | Female |
| Under 5 Years | 49 (100.0%) | 21 (100.0%) |
| 5 Years | 0 (0.0%) | 22 (100.0%) |
| 6 to 11 Years | 92 (100.0%) | 19 (100.0%) |
| 12 to 14 Years | 71 (100.0%) | 21 (100.0%) |
| 15 Years | 0 (0.0%) | 33 (100.0%) |
| 16 and 17 Years | 0 (0.0%) | 0 (0.0%) |
| 18 to 24 Years | 0 (0.0%) | 6 (50.0%) |
| 25 to 34 Years | 35 (100.0%) | 43 (30.7%) |
| 35 to 44 Years | 42 (100.0%) | 55 (100.0%) |
| 45 to 54 Years | 103 (100.0%) | 115 (100.0%) |
| 55 to 64 Years | 44 (100.0%) | 58 (40.3%) |
| 65 to 74 Years | 65 (61.9%) | 81 (100.0%) |
| 75 Years and over | 42 (100.0%) | 22 (100.0%) |
| Total | 543 (93.1%) | 496 (72.4%) |
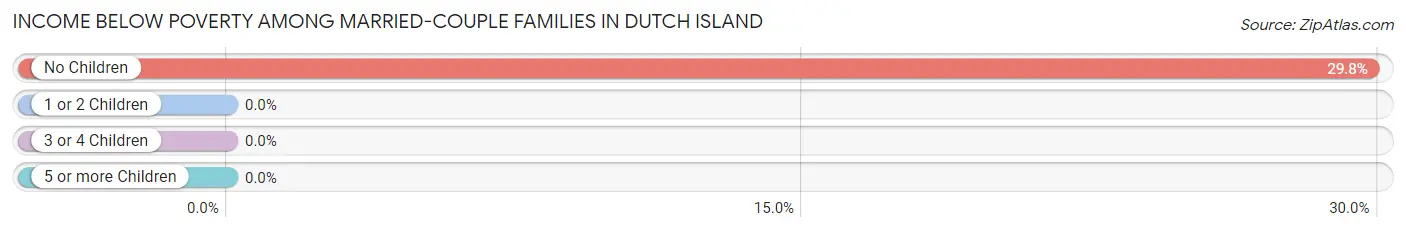
Income Below Poverty Among Married-Couple Families in Dutch Island
The poverty statistics for married-couple families in Dutch Island show that 19.3% or 79 of the total 410 families live below the poverty line. Families with no children have the highest poverty rate of 29.8%, comprising of 79 families. On the other hand, families with 1 or 2 children have the lowest poverty rate of 0.0%, which includes 0 families.
| Children | Above Poverty | Below Poverty |
| No Children | 186 (70.2%) | 79 (29.8%) |
| 1 or 2 Children | 106 (100.0%) | 0 (0.0%) |
| 3 or 4 Children | 32 (100.0%) | 0 (0.0%) |
| 5 or more Children | 7 (100.0%) | 0 (0.0%) |
| Total | 331 (80.7%) | 79 (19.3%) |
Income Below Poverty Among Single-Parent Households in Dutch Island
| Children | Single Father | Single Mother |
| No Children | 0 (0.0%) | 0 (0.0%) |
| 1 or 2 Children | 0 (0.0%) | 0 (0.0%) |
| 3 or 4 Children | 0 (0.0%) | 0 (0.0%) |
| 5 or more Children | 0 (0.0%) | 0 (0.0%) |
| Total | 0 (0.0%) | 0 (0.0%) |
Income Below Poverty Among Married-Couple vs Single-Parent Households in Dutch Island
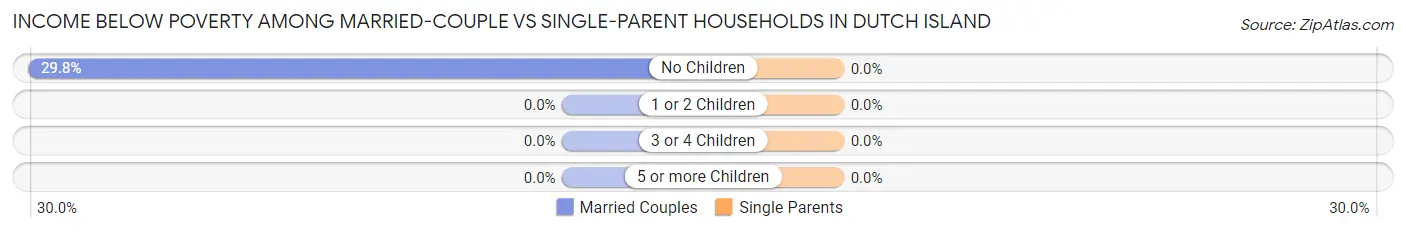
| Children | Married-Couple Families | Single-Parent Households |
| No Children | 79 (29.8%) | 0 (0.0%) |
| 1 or 2 Children | 0 (0.0%) | 0 (0.0%) |
| 3 or 4 Children | 0 (0.0%) | 0 (0.0%) |
| 5 or more Children | 0 (0.0%) | 0 (0.0%) |
| Total | 79 (19.3%) | 0 (0.0%) |
Race in Dutch Island
The most populous races in Dutch Island are White / Caucasian (878 | 69.2%), Black / African American (216 | 17.0%), and Two or more Races (120 | 9.5%).
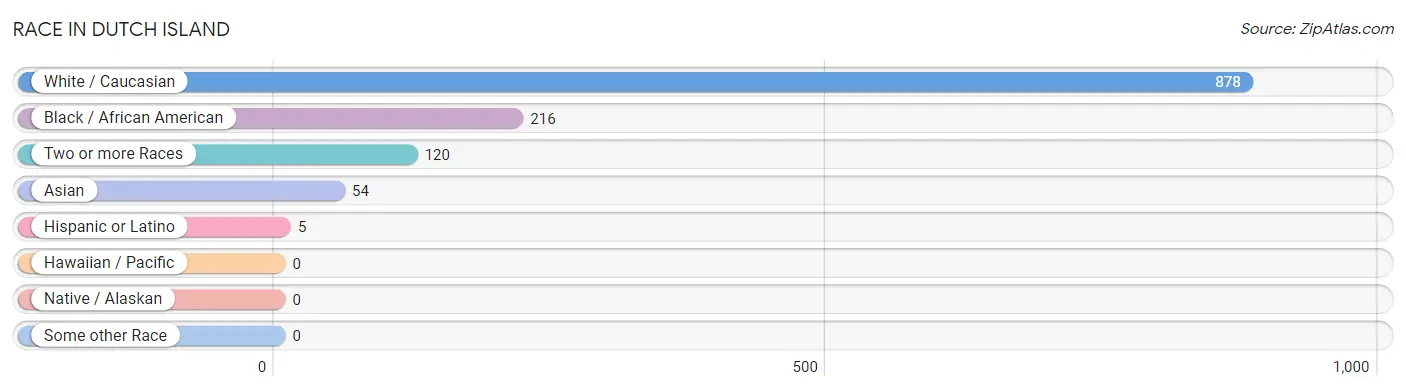
| Race | # Population | % Population |
| Asian | 54 | 4.3% |
| Black / African American | 216 | 17.0% |
| Hawaiian / Pacific | 0 | 0.0% |
| Hispanic or Latino | 5 | 0.4% |
| Native / Alaskan | 0 | 0.0% |
| White / Caucasian | 878 | 69.2% |
| Two or more Races | 120 | 9.5% |
| Some other Race | 0 | 0.0% |
| Total | 1,268 | 100.0% |
Ancestry in Dutch Island
The most populous ancestries reported in Dutch Island are Irish (206 | 16.3%), English (196 | 15.5%), German (144 | 11.4%), Swedish (112 | 8.8%), and Pakistani (99 | 7.8%), together accounting for 59.7% of all Dutch Island residents.
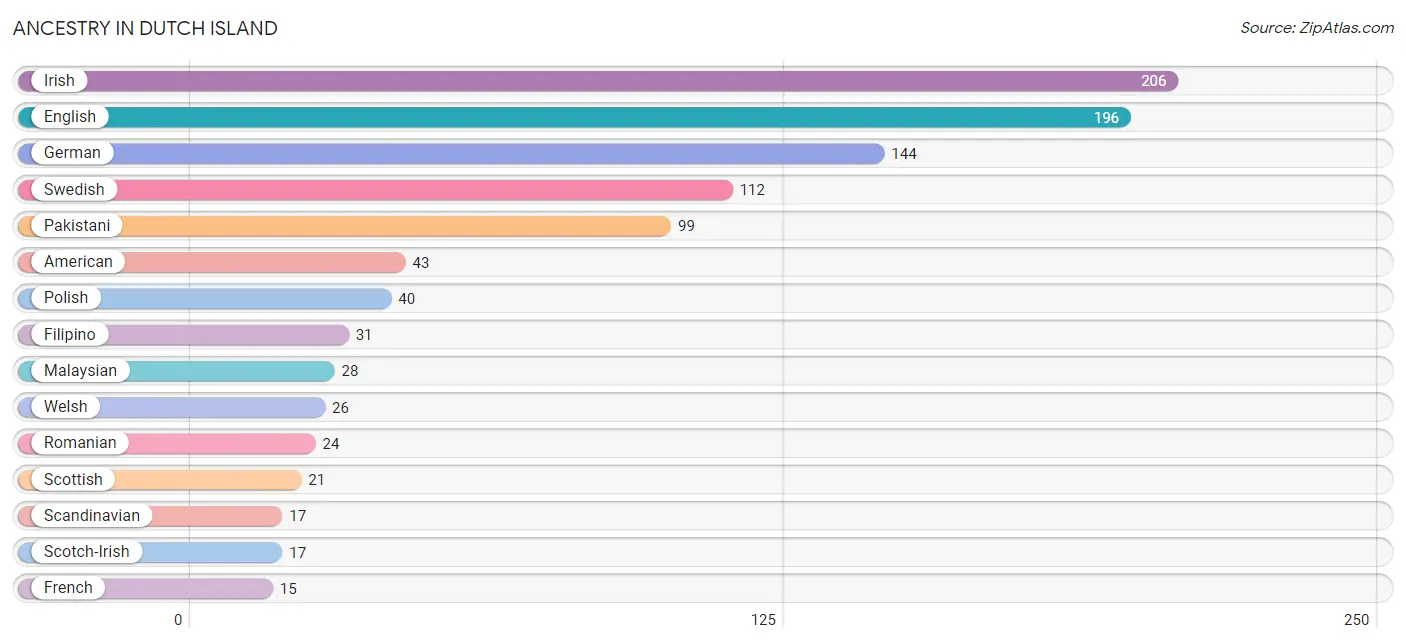
| Ancestry | # Population | % Population |
| American | 43 | 3.4% |
| British | 8 | 0.6% |
| Central American | 5 | 0.4% |
| Dutch | 9 | 0.7% |
| English | 196 | 15.5% |
| European | 7 | 0.5% |
| Filipino | 31 | 2.4% |
| French | 15 | 1.2% |
| German | 144 | 11.4% |
| Honduran | 5 | 0.4% |
| Hungarian | 5 | 0.4% |
| Indian (Asian) | 11 | 0.9% |
| Irish | 206 | 16.3% |
| Italian | 7 | 0.5% |
| Malaysian | 28 | 2.2% |
| Norwegian | 7 | 0.5% |
| Pakistani | 99 | 7.8% |
| Polish | 40 | 3.2% |
| Romanian | 24 | 1.9% |
| Scandinavian | 17 | 1.3% |
| Scotch-Irish | 17 | 1.3% |
| Scottish | 21 | 1.7% |
| South African | 9 | 0.7% |
| Subsaharan African | 9 | 0.7% |
| Swedish | 112 | 8.8% |
| Ukrainian | 6 | 0.5% |
| Welsh | 26 | 2.1% | View All 27 Rows |
Immigrants in Dutch Island
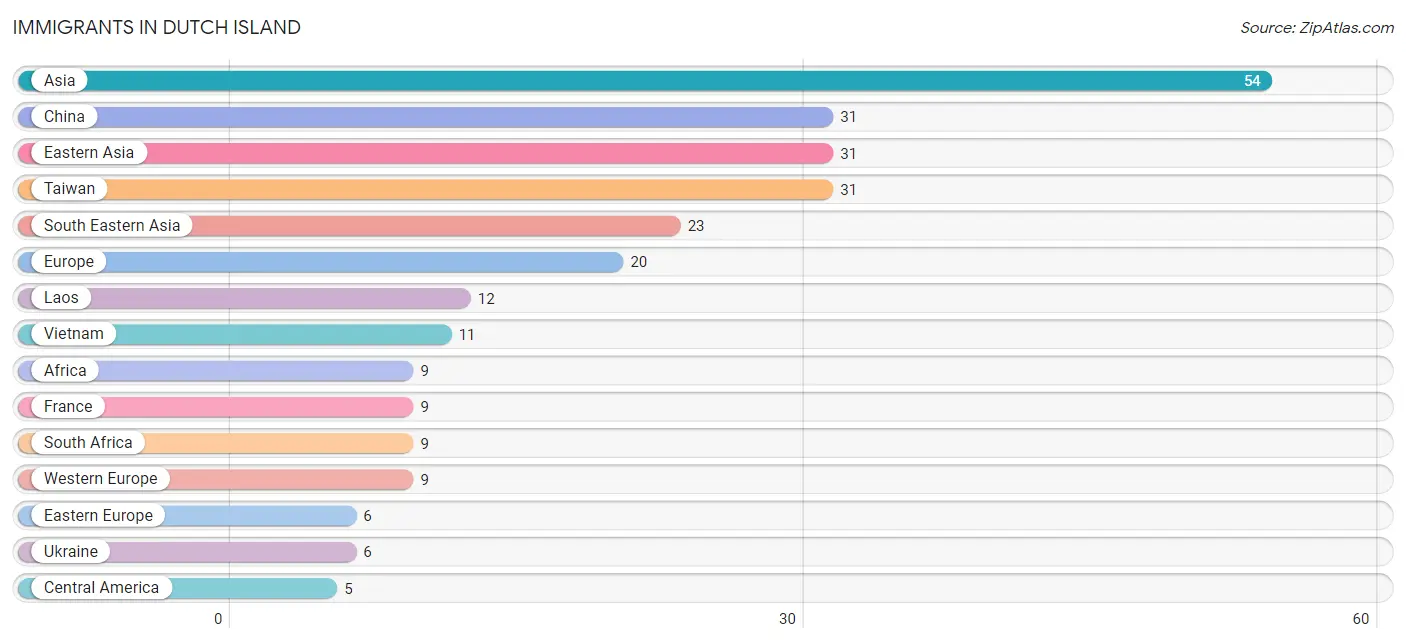
The most numerous immigrant groups reported in Dutch Island came from Asia (54 | 4.3%), China (31 | 2.4%), Eastern Asia (31 | 2.4%), Taiwan (31 | 2.4%), and South Eastern Asia (23 | 1.8%), together accounting for 13.4% of all Dutch Island residents.
| Immigration Origin | # Population | % Population |
| Africa | 9 | 0.7% |
| Asia | 54 | 4.3% |
| Central America | 5 | 0.4% |
| China | 31 | 2.4% |
| Eastern Asia | 31 | 2.4% |
| Eastern Europe | 6 | 0.5% |
| Europe | 20 | 1.6% |
| France | 9 | 0.7% |
| Honduras | 5 | 0.4% |
| Laos | 12 | 0.9% |
| Latin America | 5 | 0.4% |
| Northern Europe | 5 | 0.4% |
| South Africa | 9 | 0.7% |
| South Eastern Asia | 23 | 1.8% |
| Taiwan | 31 | 2.4% |
| Ukraine | 6 | 0.5% |
| Vietnam | 11 | 0.9% |
| Western Europe | 9 | 0.7% | View All 18 Rows |
Sex and Age in Dutch Island
Sex and Age in Dutch Island
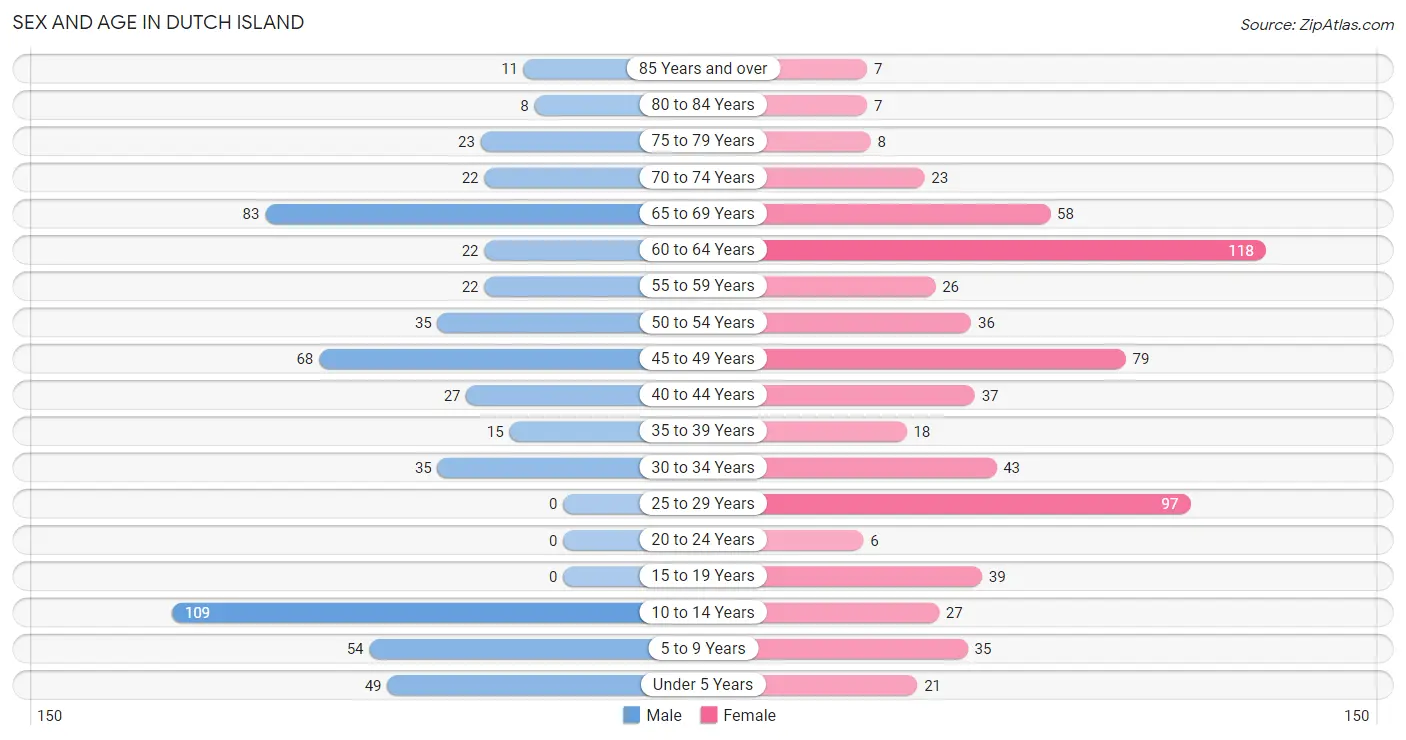
The most populous age groups in Dutch Island are 10 to 14 Years (109 | 18.7%) for men and 60 to 64 Years (118 | 17.2%) for women.
| Age Bracket | Male | Female |
| Under 5 Years | 49 (8.4%) | 21 (3.1%) |
| 5 to 9 Years | 54 (9.3%) | 35 (5.1%) |
| 10 to 14 Years | 109 (18.7%) | 27 (3.9%) |
| 15 to 19 Years | 0 (0.0%) | 39 (5.7%) |
| 20 to 24 Years | 0 (0.0%) | 6 (0.9%) |
| 25 to 29 Years | 0 (0.0%) | 97 (14.2%) |
| 30 to 34 Years | 35 (6.0%) | 43 (6.3%) |
| 35 to 39 Years | 15 (2.6%) | 18 (2.6%) |
| 40 to 44 Years | 27 (4.6%) | 37 (5.4%) |
| 45 to 49 Years | 68 (11.7%) | 79 (11.5%) |
| 50 to 54 Years | 35 (6.0%) | 36 (5.3%) |
| 55 to 59 Years | 22 (3.8%) | 26 (3.8%) |
| 60 to 64 Years | 22 (3.8%) | 118 (17.2%) |
| 65 to 69 Years | 83 (14.2%) | 58 (8.5%) |
| 70 to 74 Years | 22 (3.8%) | 23 (3.4%) |
| 75 to 79 Years | 23 (4.0%) | 8 (1.2%) |
| 80 to 84 Years | 8 (1.4%) | 7 (1.0%) |
| 85 Years and over | 11 (1.9%) | 7 (1.0%) |
| Total | 583 (100.0%) | 685 (100.0%) |
Families and Households in Dutch Island
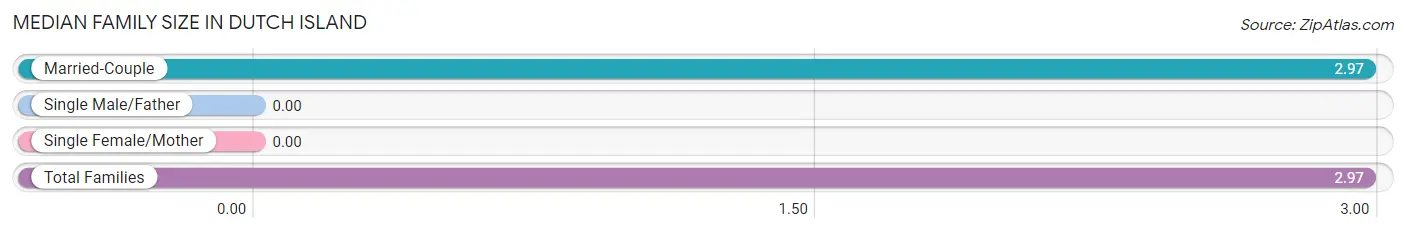
Median Family Size in Dutch Island
| Family Type | # Families | Family Size |
| Married-Couple | 410 (100.0%) | 2.97 |
| Single Male/Father | 0 (0.0%) | - |
| Single Female/Mother | 0 (0.0%) | - |
| Total Families | 410 (100.0%) | 2.97 |
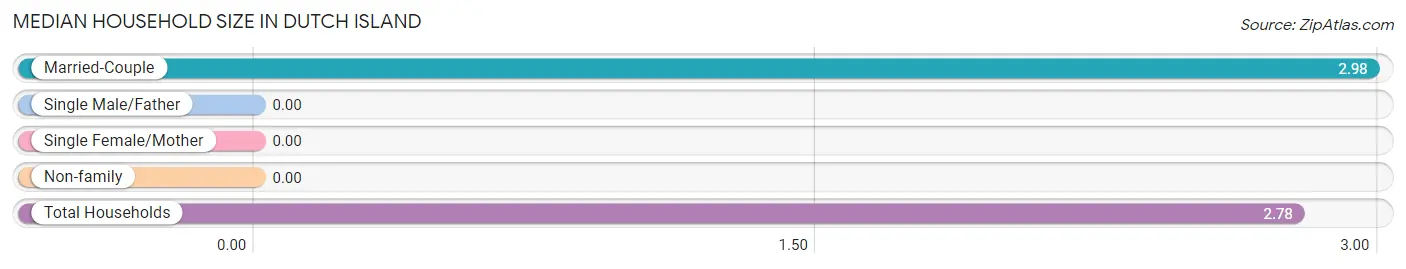
Median Household Size in Dutch Island
| Household Type | # Households | Household Size |
| Married-Couple | 410 (89.9%) | 2.98 |
| Single Male/Father | 0 (0.0%) | - |
| Single Female/Mother | 0 (0.0%) | - |
| Non-family | 46 (10.1%) | - |
| Total Households | 456 (100.0%) | 2.78 |
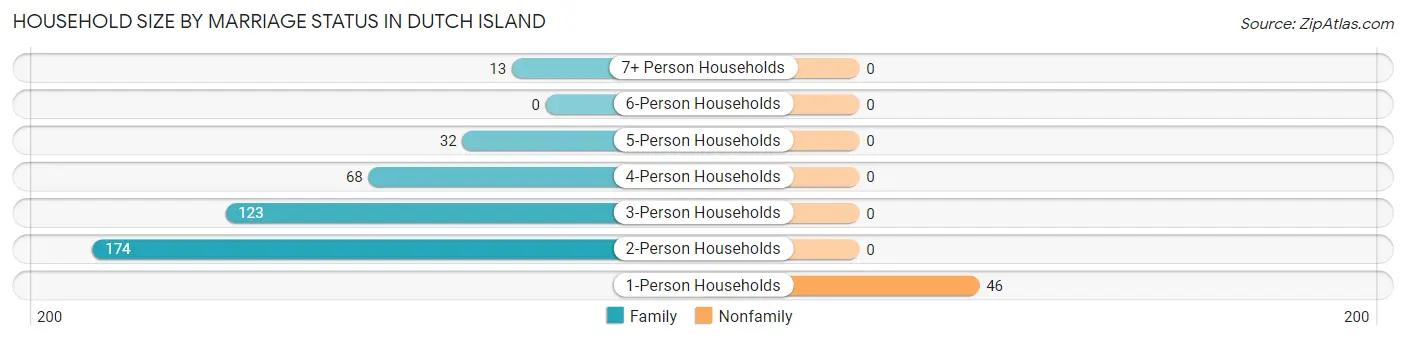
Household Size by Marriage Status in Dutch Island
Out of a total of 456 households in Dutch Island, 410 (89.9%) are family households, while 46 (10.1%) are nonfamily households. The most numerous type of family households are 2-person households, comprising 174, and the most common type of nonfamily households are 1-person households, comprising 46.
| Household Size | Family Households | Nonfamily Households |
| 1-Person Households | - | 46 (10.1%) |
| 2-Person Households | 174 (38.2%) | 0 (0.0%) |
| 3-Person Households | 123 (27.0%) | 0 (0.0%) |
| 4-Person Households | 68 (14.9%) | 0 (0.0%) |
| 5-Person Households | 32 (7.0%) | 0 (0.0%) |
| 6-Person Households | 0 (0.0%) | 0 (0.0%) |
| 7+ Person Households | 13 (2.9%) | 0 (0.0%) |
| Total | 410 (89.9%) | 46 (10.1%) |
Female Fertility in Dutch Island
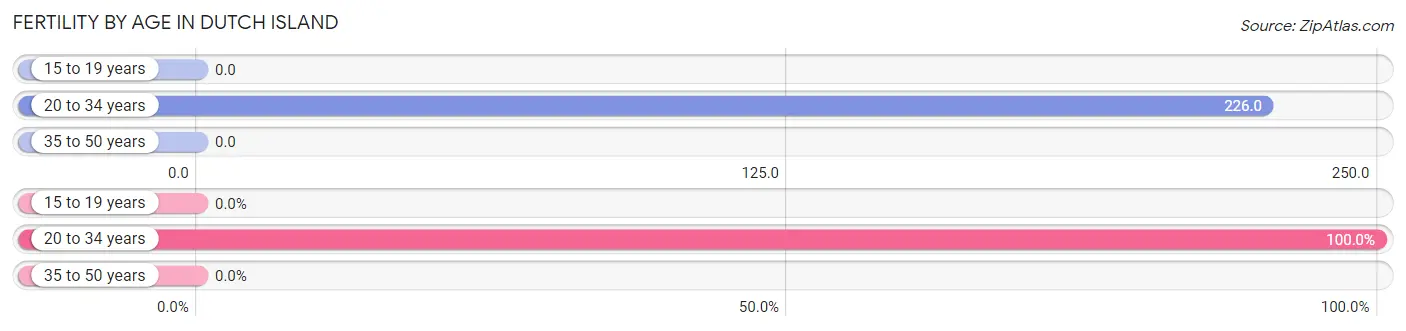
Fertility by Age in Dutch Island
Average fertility rate in Dutch Island is 101.0 births per 1,000 women. Women in the age bracket of 20 to 34 years have the highest fertility rate with 226.0 births per 1,000 women. Women in the age bracket of 20 to 34 years acount for 100.0% of all women with births.
| Age Bracket | Women with Births | Births / 1,000 Women |
| 15 to 19 years | 0 (0.0%) | 0.0 |
| 20 to 34 years | 33 (100.0%) | 226.0 |
| 35 to 50 years | 0 (0.0%) | 0.0 |
| Total | 33 (100.0%) | 101.0 |
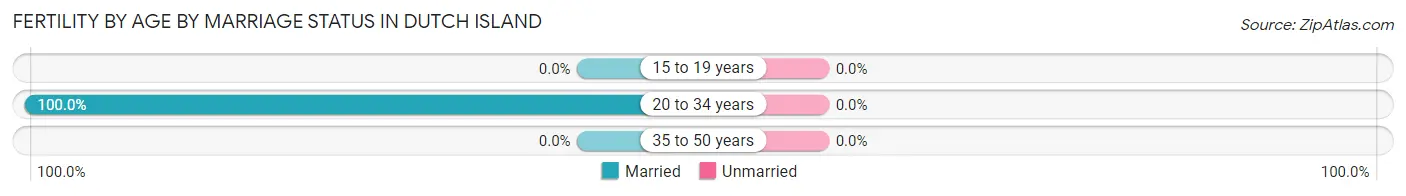
Fertility by Age by Marriage Status in Dutch Island
| Age Bracket | Married | Unmarried |
| 15 to 19 years | 0 (0.0%) | 0 (0.0%) |
| 20 to 34 years | 33 (100.0%) | 0 (0.0%) |
| 35 to 50 years | 0 (0.0%) | 0 (0.0%) |
| Total | 33 (100.0%) | 0 (0.0%) |
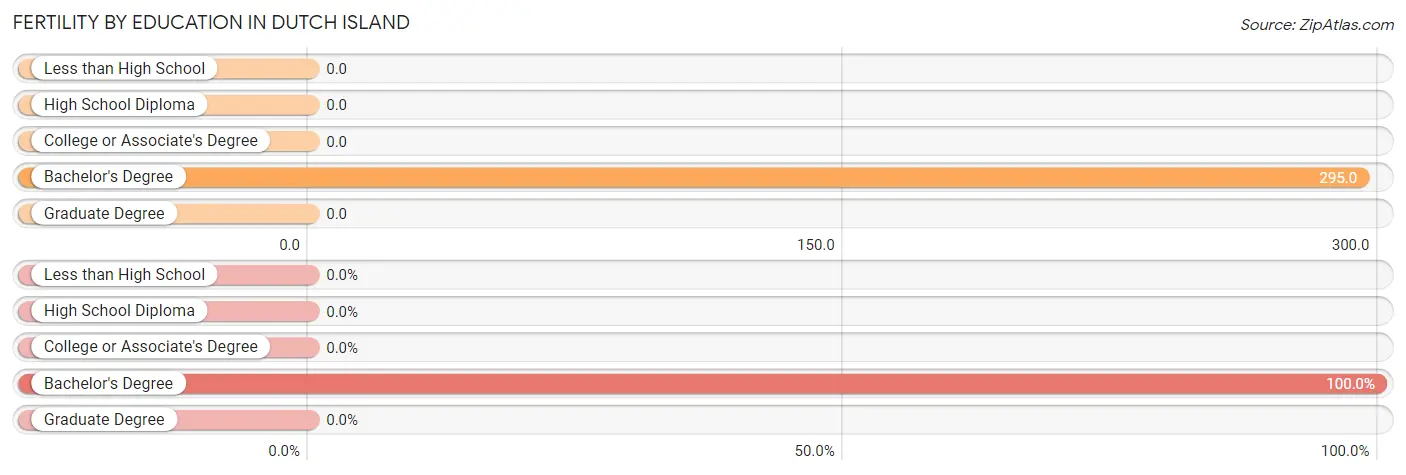
Fertility by Education in Dutch Island
| Educational Attainment | Women with Births | Births / 1,000 Women |
| Less than High School | 0 (0.0%) | 0.0 |
| High School Diploma | 0 (0.0%) | 0.0 |
| College or Associate's Degree | 0 (0.0%) | 0.0 |
| Bachelor's Degree | 33 (100.0%) | 295.0 |
| Graduate Degree | 0 (0.0%) | 0.0 |
| Total | 33 (100.0%) | 101.0 |
Fertility by Education by Marriage Status in Dutch Island
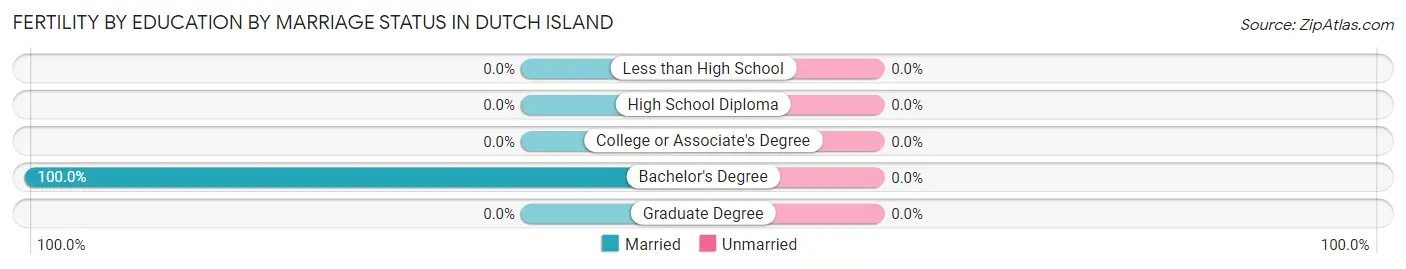
| Educational Attainment | Married | Unmarried |
| Less than High School | 0 (0.0%) | 0 (0.0%) |
| High School Diploma | 0 (0.0%) | 0 (0.0%) |
| College or Associate's Degree | 0 (0.0%) | 0 (0.0%) |
| Bachelor's Degree | 33 (100.0%) | 0 (0.0%) |
| Graduate Degree | 0 (0.0%) | 0 (0.0%) |
| Total | 33 (100.0%) | 0 (0.0%) |
Employment Characteristics in Dutch Island
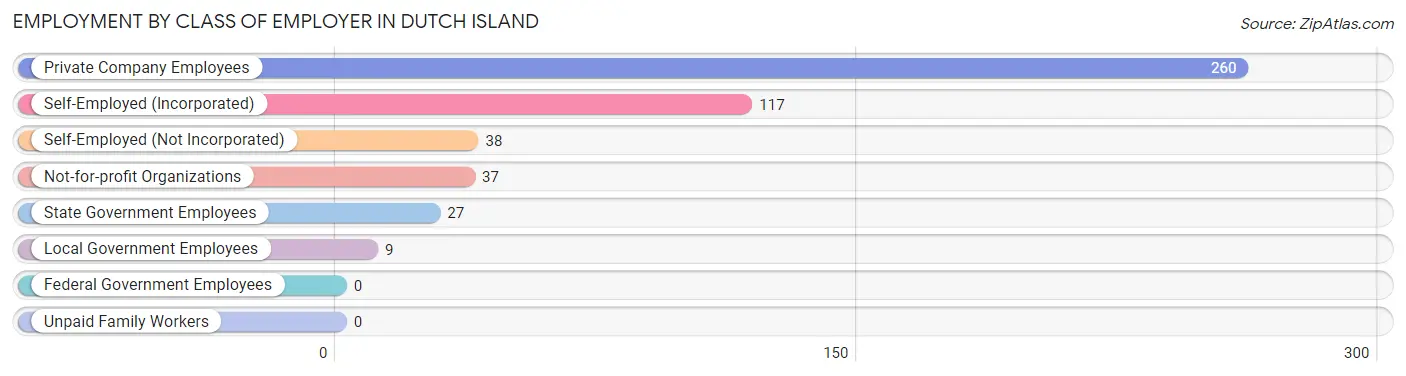
Employment by Class of Employer in Dutch Island
Among the 488 employed individuals in Dutch Island, private company employees (260 | 53.3%), self-employed (incorporated) (117 | 24.0%), and self-employed (not incorporated) (38 | 7.8%) make up the most common classes of employment.
| Employer Class | # Employees | % Employees |
| Private Company Employees | 260 | 53.3% |
| Self-Employed (Incorporated) | 117 | 24.0% |
| Self-Employed (Not Incorporated) | 38 | 7.8% |
| Not-for-profit Organizations | 37 | 7.6% |
| Local Government Employees | 9 | 1.8% |
| State Government Employees | 27 | 5.5% |
| Federal Government Employees | 0 | 0.0% |
| Unpaid Family Workers | 0 | 0.0% |
| Total | 488 | 100.0% |
Employment Status by Age in Dutch Island
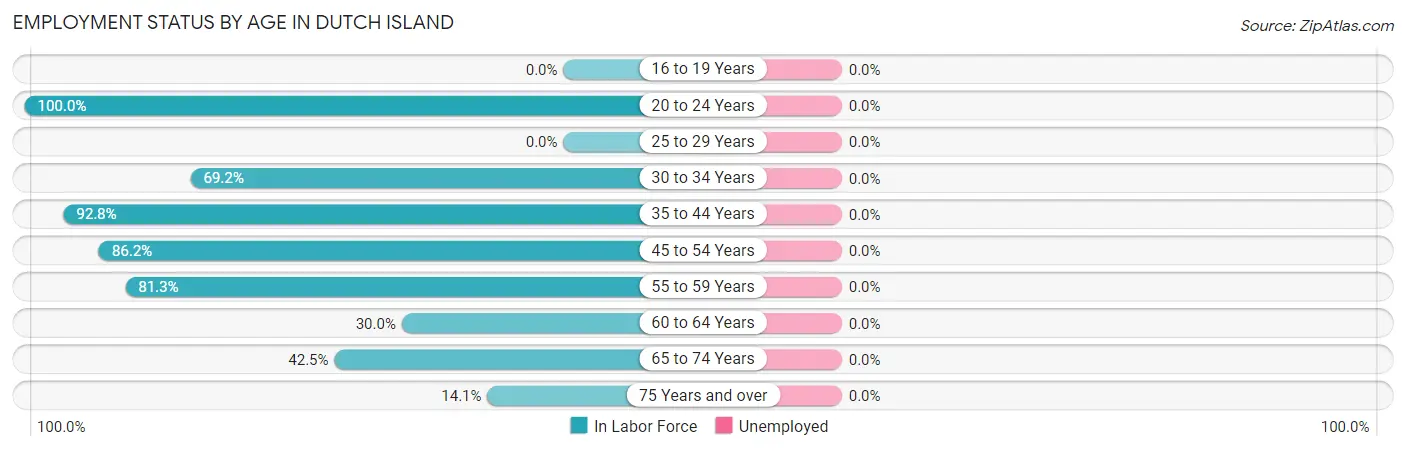
| Age Bracket | In Labor Force | Unemployed |
| 16 to 19 Years | 0 (0.0%) | 0 (0.0%) |
| 20 to 24 Years | 6 (100.0%) | 0 (0.0%) |
| 25 to 29 Years | 0 (0.0%) | 0 (0.0%) |
| 30 to 34 Years | 54 (69.2%) | 0 (0.0%) |
| 35 to 44 Years | 90 (92.8%) | 0 (0.0%) |
| 45 to 54 Years | 188 (86.2%) | 0 (0.0%) |
| 55 to 59 Years | 39 (81.3%) | 0 (0.0%) |
| 60 to 64 Years | 42 (30.0%) | 0 (0.0%) |
| 65 to 74 Years | 79 (42.5%) | 0 (0.0%) |
| 75 Years and over | 9 (14.1%) | 0 (0.0%) |
| Total | 507 (53.9%) | 0 (0.0%) |
Employment Status by Educational Attainment in Dutch Island
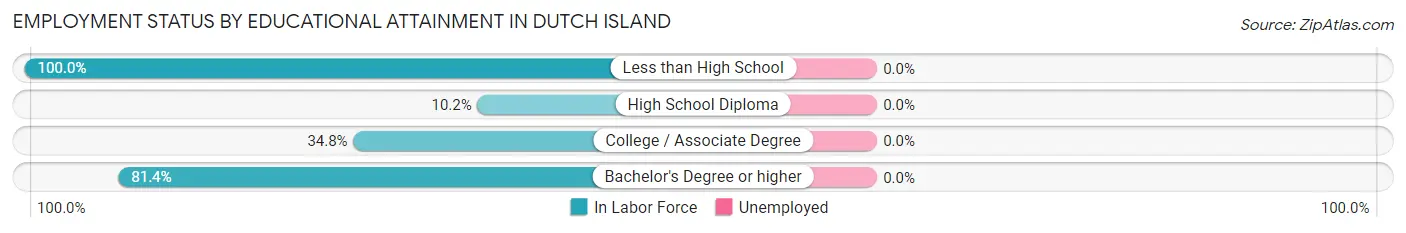
| Educational Attainment | In Labor Force | Unemployed |
| Less than High School | 5 (100.0%) | 0 (0.0%) |
| High School Diploma | 11 (10.2%) | 0 (0.0%) |
| College / Associate Degree | 47 (34.8%) | 0 (0.0%) |
| Bachelor's Degree or higher | 350 (81.4%) | 0 (0.0%) |
| Total | 413 (60.9%) | 0 (0.0%) |
Employment Occupations by Sex in Dutch Island
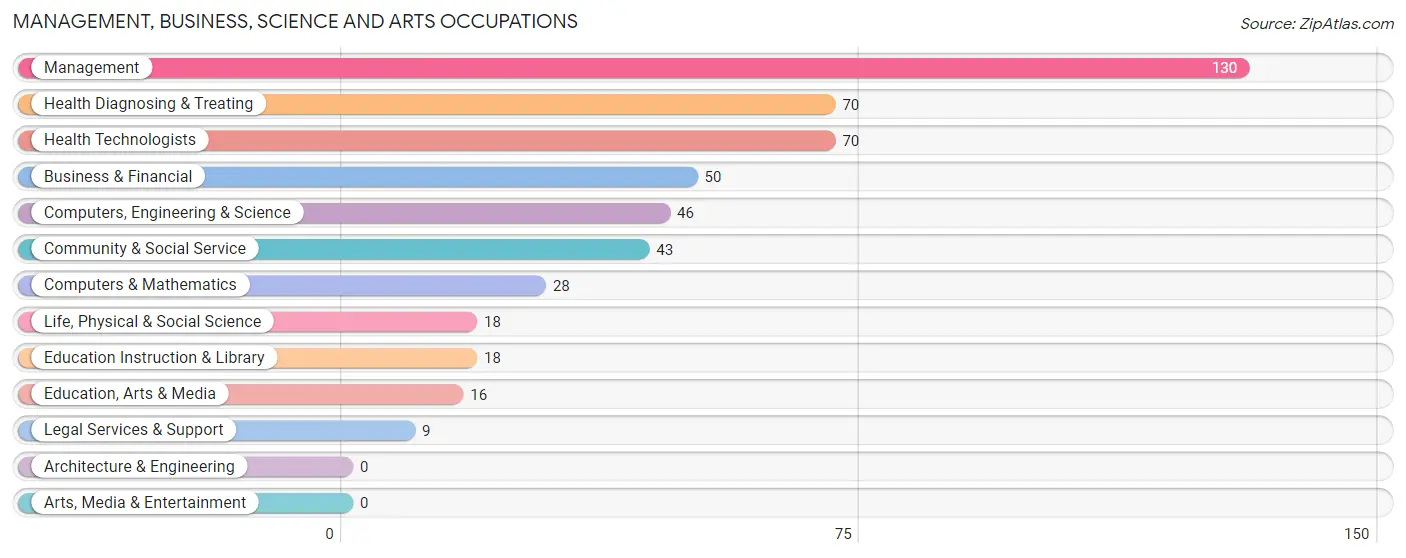
Management, Business, Science and Arts Occupations
The most common Management, Business, Science and Arts occupations in Dutch Island are Management (130 | 25.6%), Health Diagnosing & Treating (70 | 13.8%), Health Technologists (70 | 13.8%), Business & Financial (50 | 9.9%), and Computers, Engineering & Science (46 | 9.1%).
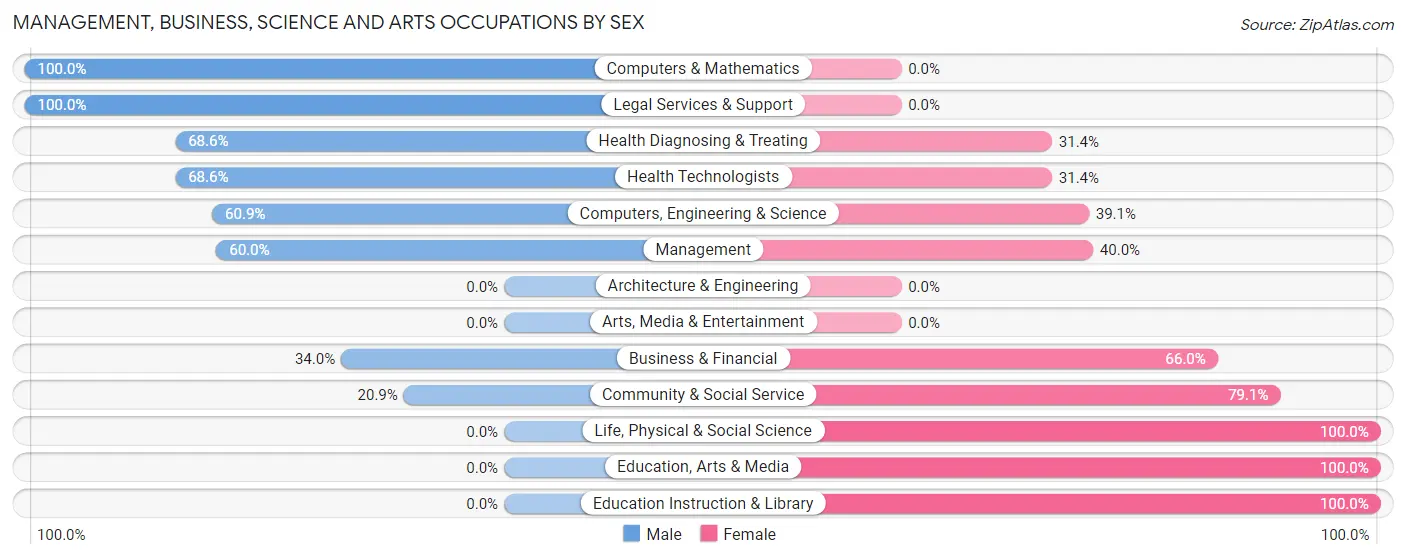
Management, Business, Science and Arts Occupations by Sex
Within the Management, Business, Science and Arts occupations in Dutch Island, the most male-oriented occupations are Computers & Mathematics (100.0%), Legal Services & Support (100.0%), and Health Diagnosing & Treating (68.6%), while the most female-oriented occupations are Life, Physical & Social Science (100.0%), Education, Arts & Media (100.0%), and Education Instruction & Library (100.0%).
| Occupation | Male | Female |
| Management | 78 (60.0%) | 52 (40.0%) |
| Business & Financial | 17 (34.0%) | 33 (66.0%) |
| Computers, Engineering & Science | 28 (60.9%) | 18 (39.1%) |
| Computers & Mathematics | 28 (100.0%) | 0 (0.0%) |
| Architecture & Engineering | 0 (0.0%) | 0 (0.0%) |
| Life, Physical & Social Science | 0 (0.0%) | 18 (100.0%) |
| Community & Social Service | 9 (20.9%) | 34 (79.1%) |
| Education, Arts & Media | 0 (0.0%) | 16 (100.0%) |
| Legal Services & Support | 9 (100.0%) | 0 (0.0%) |
| Education Instruction & Library | 0 (0.0%) | 18 (100.0%) |
| Arts, Media & Entertainment | 0 (0.0%) | 0 (0.0%) |
| Health Diagnosing & Treating | 48 (68.6%) | 22 (31.4%) |
| Health Technologists | 48 (68.6%) | 22 (31.4%) |
| Total (Category) | 180 (53.1%) | 159 (46.9%) |
| Total (Overall) | 255 (50.3%) | 252 (49.7%) |
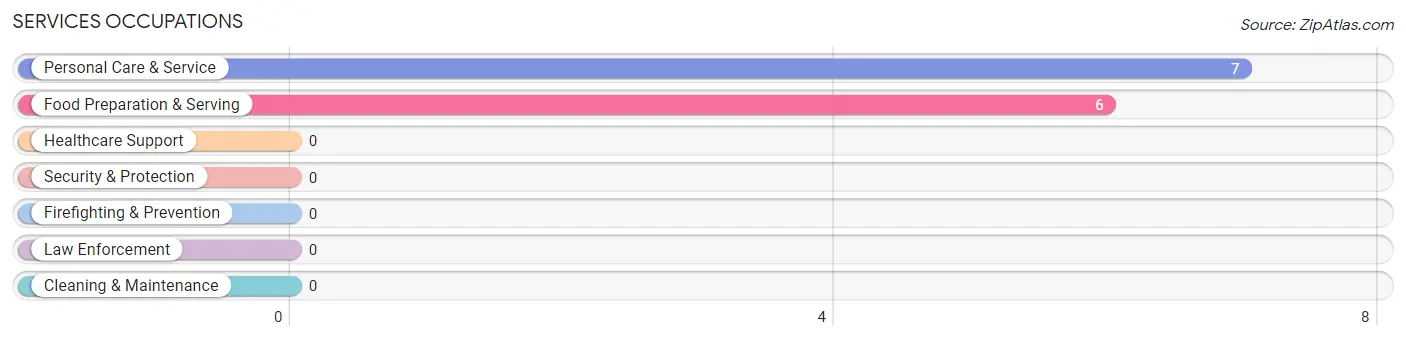
Services Occupations
The most common Services occupations in Dutch Island are Personal Care & Service (7 | 1.4%), and Food Preparation & Serving (6 | 1.2%).
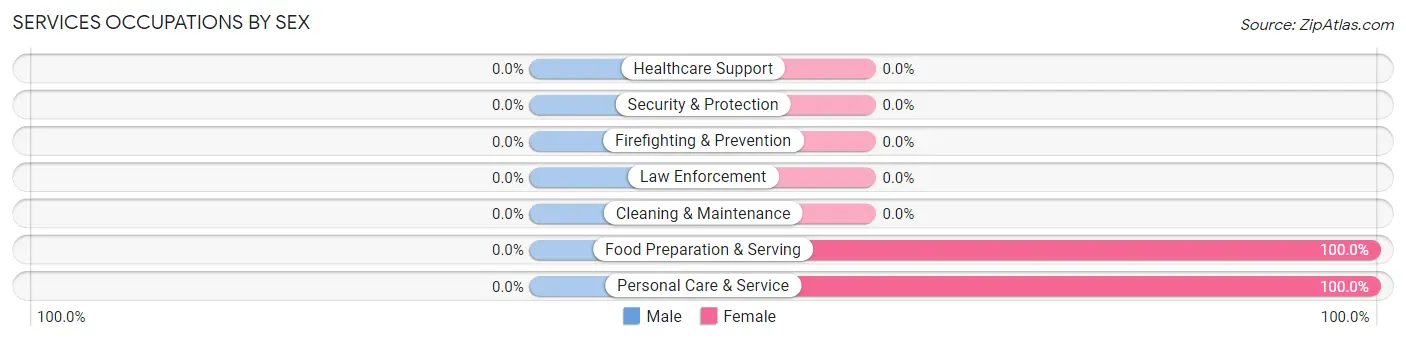
Services Occupations by Sex
| Occupation | Male | Female |
| Healthcare Support | 0 (0.0%) | 0 (0.0%) |
| Security & Protection | 0 (0.0%) | 0 (0.0%) |
| Firefighting & Prevention | 0 (0.0%) | 0 (0.0%) |
| Law Enforcement | 0 (0.0%) | 0 (0.0%) |
| Food Preparation & Serving | 0 (0.0%) | 6 (100.0%) |
| Cleaning & Maintenance | 0 (0.0%) | 0 (0.0%) |
| Personal Care & Service | 0 (0.0%) | 7 (100.0%) |
| Total (Category) | 0 (0.0%) | 13 (100.0%) |
| Total (Overall) | 255 (50.3%) | 252 (49.7%) |
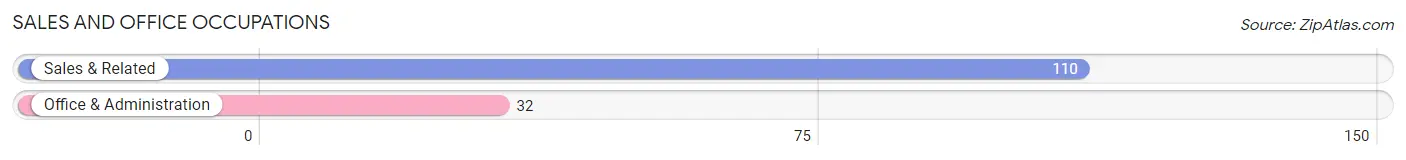
Sales and Office Occupations
The most common Sales and Office occupations in Dutch Island are Sales & Related (110 | 21.7%), and Office & Administration (32 | 6.3%).
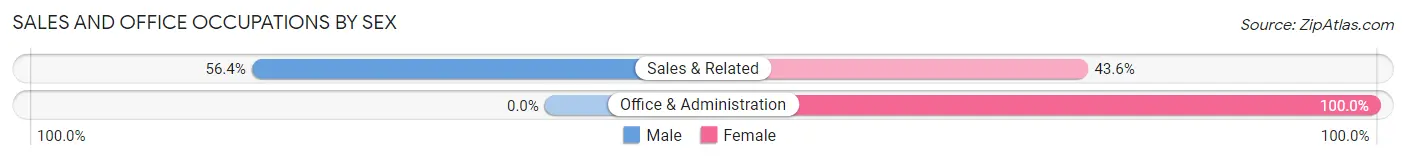
Sales and Office Occupations by Sex
| Occupation | Male | Female |
| Sales & Related | 62 (56.4%) | 48 (43.6%) |
| Office & Administration | 0 (0.0%) | 32 (100.0%) |
| Total (Category) | 62 (43.7%) | 80 (56.3%) |
| Total (Overall) | 255 (50.3%) | 252 (49.7%) |
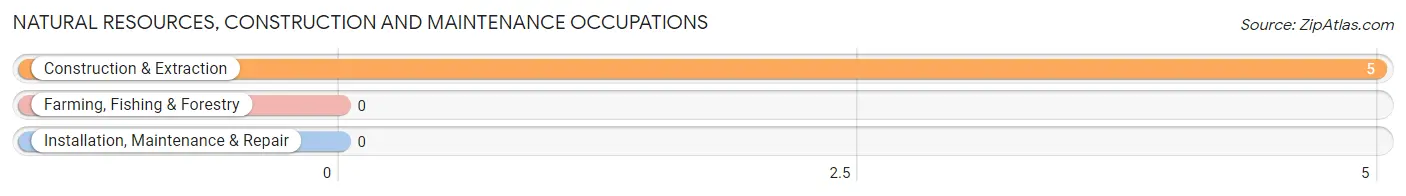
Natural Resources, Construction and Maintenance Occupations
The most common Natural Resources, Construction and Maintenance occupations in Dutch Island are , and Construction & Extraction (5 | 1.0%).
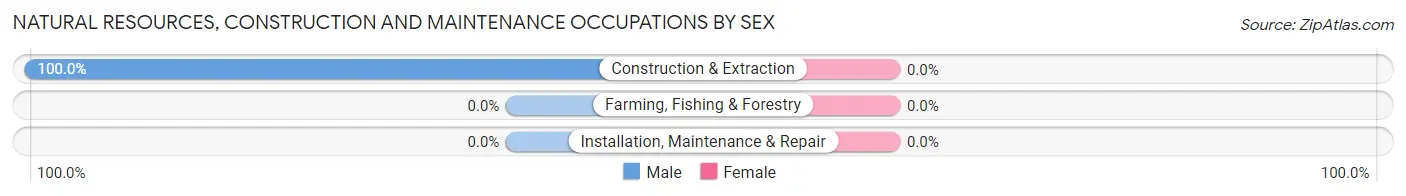
Natural Resources, Construction and Maintenance Occupations by Sex
| Occupation | Male | Female |
| Farming, Fishing & Forestry | 0 (0.0%) | 0 (0.0%) |
| Construction & Extraction | 5 (100.0%) | 0 (0.0%) |
| Installation, Maintenance & Repair | 0 (0.0%) | 0 (0.0%) |
| Total (Category) | 5 (100.0%) | 0 (0.0%) |
| Total (Overall) | 255 (50.3%) | 252 (49.7%) |
Production, Transportation and Moving Occupations
The most common Production, Transportation and Moving occupations in Dutch Island are , and Production (8 | 1.6%).
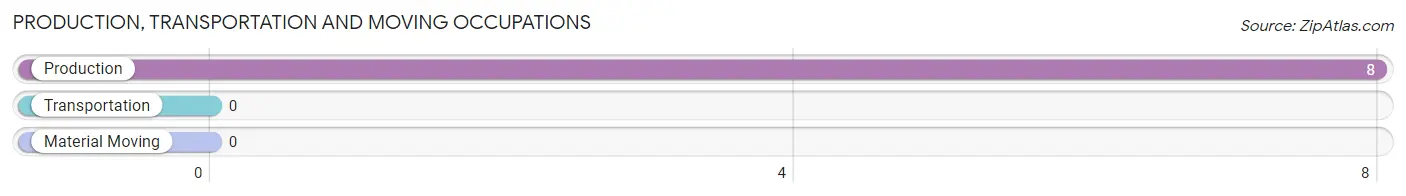
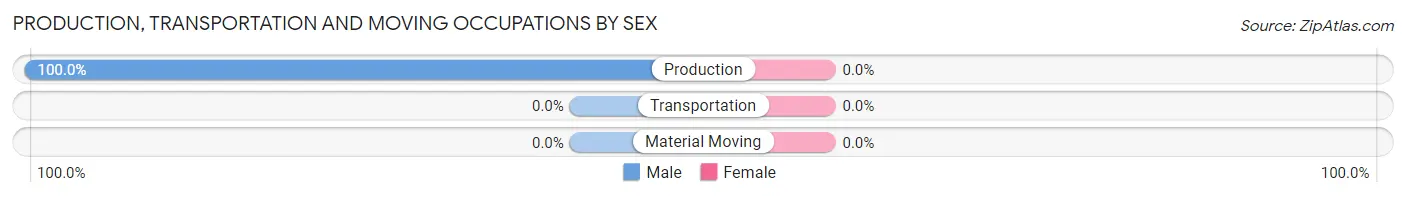
Production, Transportation and Moving Occupations by Sex
| Occupation | Male | Female |
| Production | 8 (100.0%) | 0 (0.0%) |
| Transportation | 0 (0.0%) | 0 (0.0%) |
| Material Moving | 0 (0.0%) | 0 (0.0%) |
| Total (Category) | 8 (100.0%) | 0 (0.0%) |
| Total (Overall) | 255 (50.3%) | 252 (49.7%) |
Employment Industries by Sex in Dutch Island
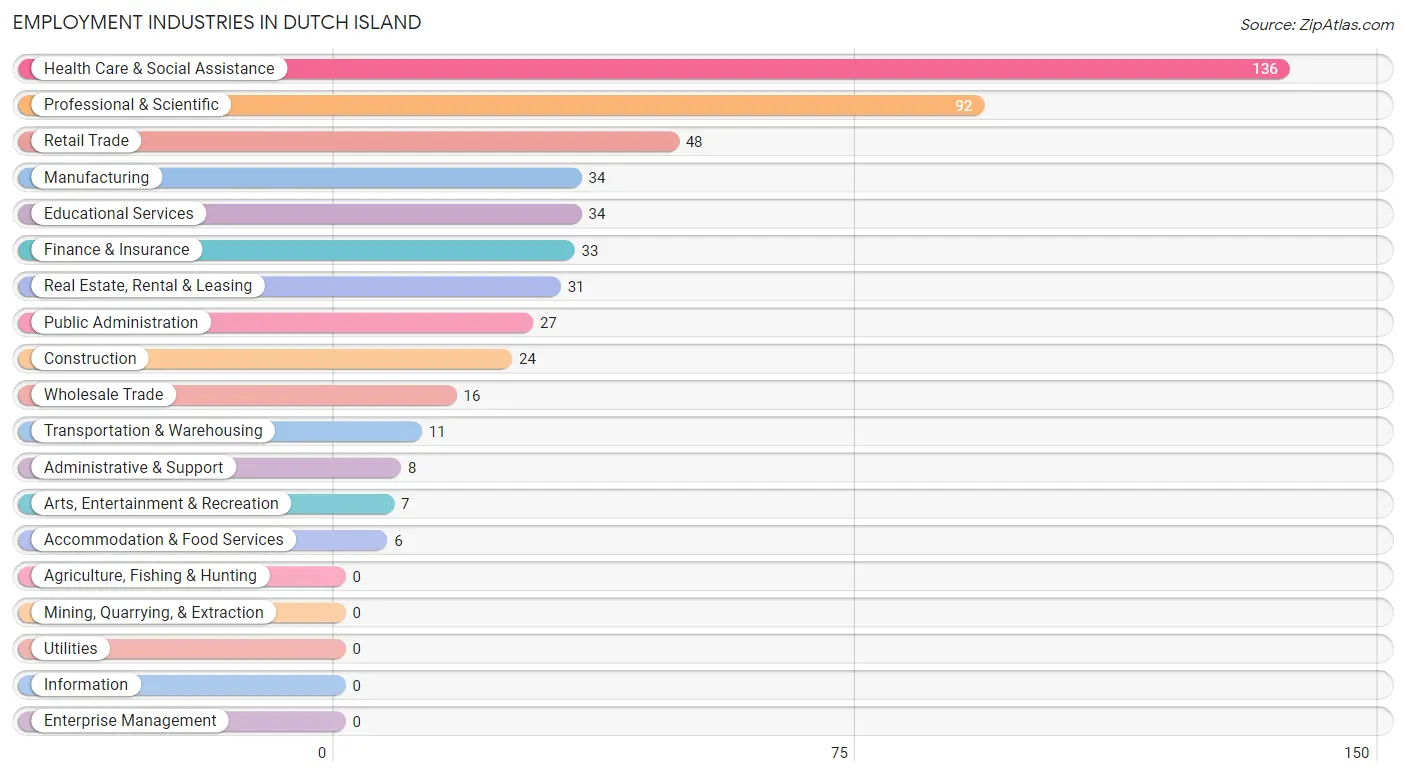
Employment Industries in Dutch Island
The major employment industries in Dutch Island include Health Care & Social Assistance (136 | 26.8%), Professional & Scientific (92 | 18.1%), Retail Trade (48 | 9.5%), Manufacturing (34 | 6.7%), and Educational Services (34 | 6.7%).
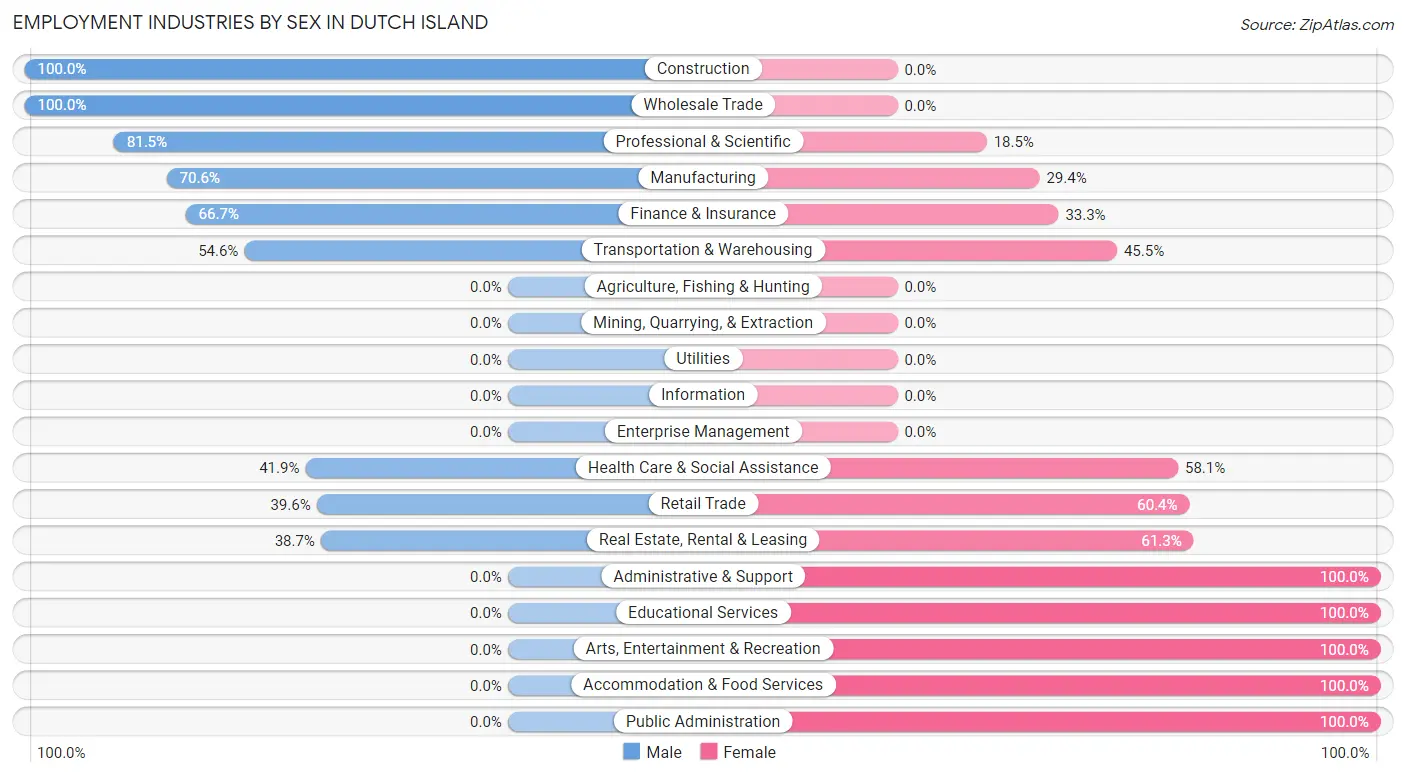
Employment Industries by Sex in Dutch Island
The Dutch Island industries that see more men than women are Construction (100.0%), Wholesale Trade (100.0%), and Professional & Scientific (81.5%), whereas the industries that tend to have a higher number of women are Administrative & Support (100.0%), Educational Services (100.0%), and Arts, Entertainment & Recreation (100.0%).
| Industry | Male | Female |
| Agriculture, Fishing & Hunting | 0 (0.0%) | 0 (0.0%) |
| Mining, Quarrying, & Extraction | 0 (0.0%) | 0 (0.0%) |
| Construction | 24 (100.0%) | 0 (0.0%) |
| Manufacturing | 24 (70.6%) | 10 (29.4%) |
| Wholesale Trade | 16 (100.0%) | 0 (0.0%) |
| Retail Trade | 19 (39.6%) | 29 (60.4%) |
| Transportation & Warehousing | 6 (54.5%) | 5 (45.5%) |
| Utilities | 0 (0.0%) | 0 (0.0%) |
| Information | 0 (0.0%) | 0 (0.0%) |
| Finance & Insurance | 22 (66.7%) | 11 (33.3%) |
| Real Estate, Rental & Leasing | 12 (38.7%) | 19 (61.3%) |
| Professional & Scientific | 75 (81.5%) | 17 (18.5%) |
| Enterprise Management | 0 (0.0%) | 0 (0.0%) |
| Administrative & Support | 0 (0.0%) | 8 (100.0%) |
| Educational Services | 0 (0.0%) | 34 (100.0%) |
| Health Care & Social Assistance | 57 (41.9%) | 79 (58.1%) |
| Arts, Entertainment & Recreation | 0 (0.0%) | 7 (100.0%) |
| Accommodation & Food Services | 0 (0.0%) | 6 (100.0%) |
| Public Administration | 0 (0.0%) | 27 (100.0%) |
| Total | 255 (50.3%) | 252 (49.7%) |
Education in Dutch Island
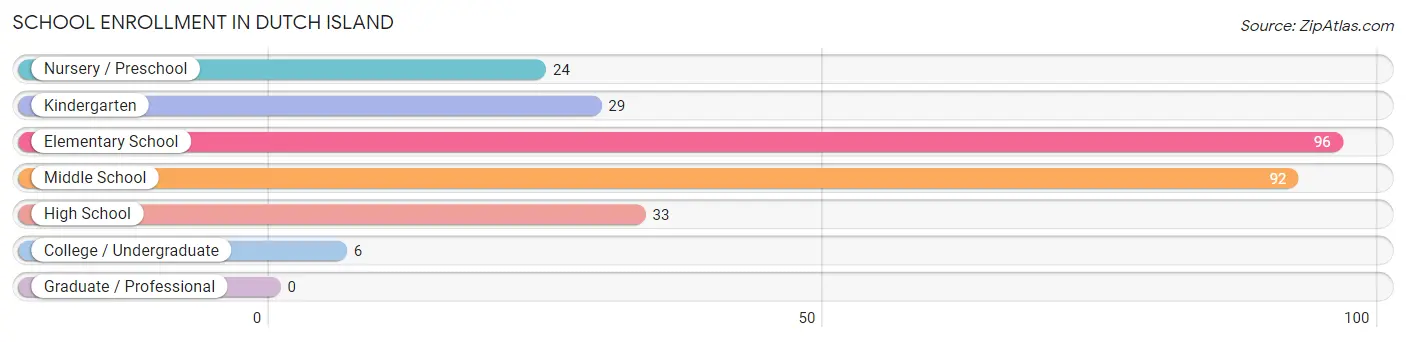
School Enrollment in Dutch Island
The most common levels of schooling among the 280 students in Dutch Island are elementary school (96 | 34.3%), middle school (92 | 32.9%), and high school (33 | 11.8%).
| School Level | # Students | % Students |
| Nursery / Preschool | 24 | 8.6% |
| Kindergarten | 29 | 10.4% |
| Elementary School | 96 | 34.3% |
| Middle School | 92 | 32.9% |
| High School | 33 | 11.8% |
| College / Undergraduate | 6 | 2.1% |
| Graduate / Professional | 0 | 0.0% |
| Total | 280 | 100.0% |
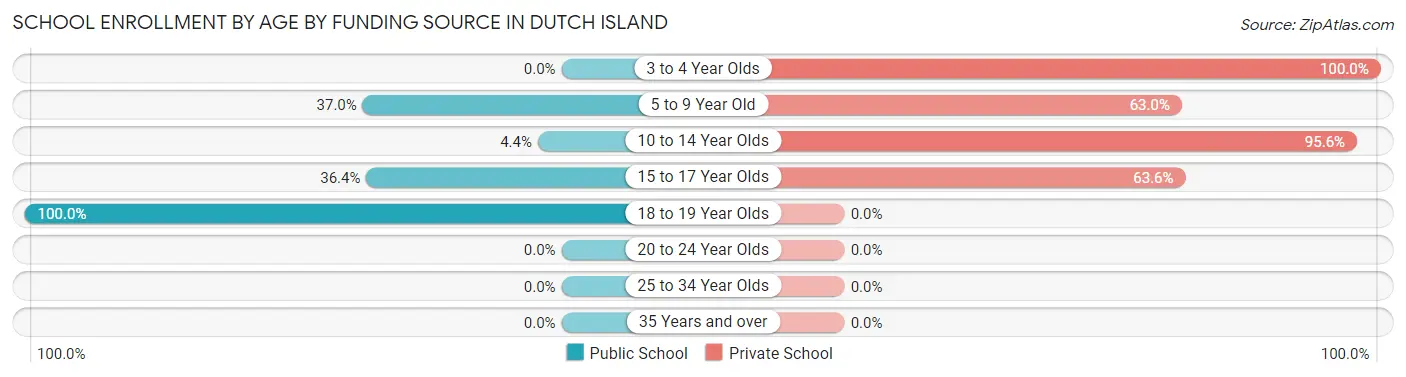
School Enrollment by Age by Funding Source in Dutch Island
Out of a total of 280 students who are enrolled in schools in Dutch Island, 226 (80.7%) attend a private institution, while the remaining 54 (19.3%) are enrolled in public schools. The age group of 3 to 4 year olds has the highest likelihood of being enrolled in private schools, with 24 (100.0% in the age bracket) enrolled. Conversely, the age group of 18 to 19 year olds has the lowest likelihood of being enrolled in a private school, with 6 (100.0% in the age bracket) attending a public institution.
| Age Bracket | Public School | Private School |
| 3 to 4 Year Olds | 0 (0.0%) | 24 (100.0%) |
| 5 to 9 Year Old | 30 (37.0%) | 51 (63.0%) |
| 10 to 14 Year Olds | 6 (4.4%) | 130 (95.6%) |
| 15 to 17 Year Olds | 12 (36.4%) | 21 (63.6%) |
| 18 to 19 Year Olds | 6 (100.0%) | 0 (0.0%) |
| 20 to 24 Year Olds | 0 (0.0%) | 0 (0.0%) |
| 25 to 34 Year Olds | 0 (0.0%) | 0 (0.0%) |
| 35 Years and over | 0 (0.0%) | 0 (0.0%) |
| Total | 54 (19.3%) | 226 (80.7%) |
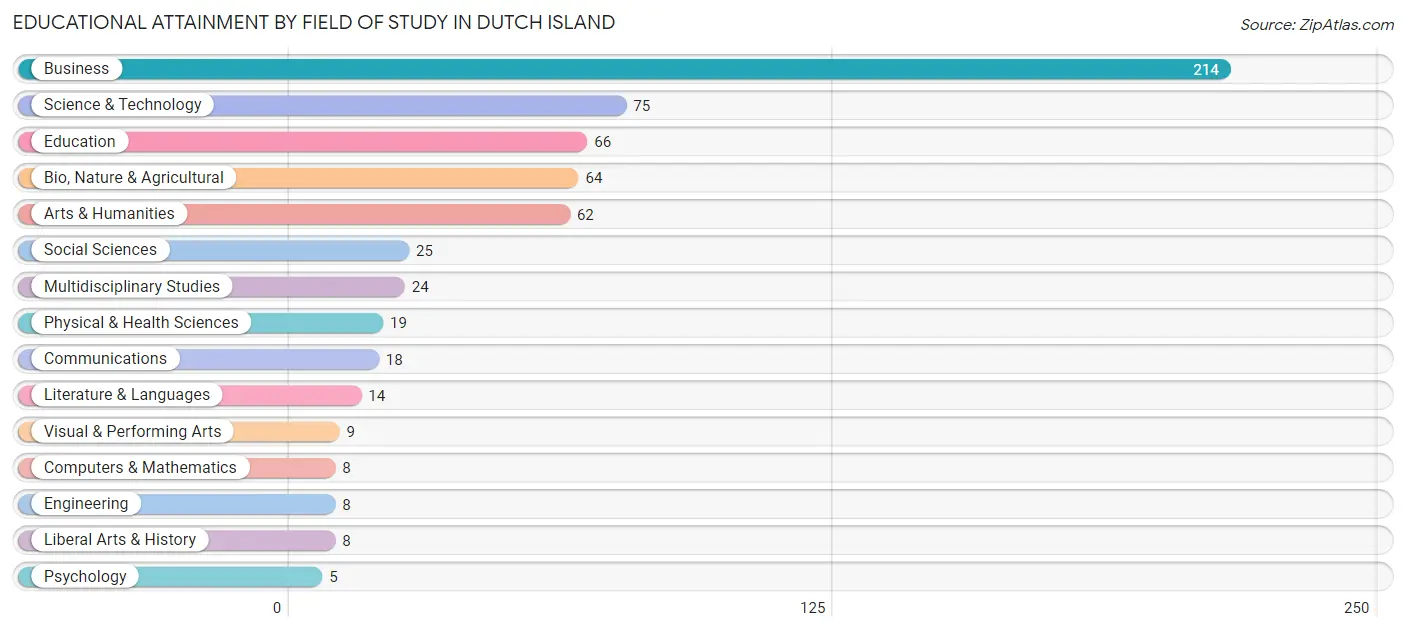
Educational Attainment by Field of Study in Dutch Island
Business (214 | 34.6%), science & technology (75 | 12.1%), education (66 | 10.7%), bio, nature & agricultural (64 | 10.3%), and arts & humanities (62 | 10.0%) are the most common fields of study among 619 individuals in Dutch Island who have obtained a bachelor's degree or higher.
| Field of Study | # Graduates | % Graduates |
| Computers & Mathematics | 8 | 1.3% |
| Bio, Nature & Agricultural | 64 | 10.3% |
| Physical & Health Sciences | 19 | 3.1% |
| Psychology | 5 | 0.8% |
| Social Sciences | 25 | 4.0% |
| Engineering | 8 | 1.3% |
| Multidisciplinary Studies | 24 | 3.9% |
| Science & Technology | 75 | 12.1% |
| Business | 214 | 34.6% |
| Education | 66 | 10.7% |
| Literature & Languages | 14 | 2.3% |
| Liberal Arts & History | 8 | 1.3% |
| Visual & Performing Arts | 9 | 1.5% |
| Communications | 18 | 2.9% |
| Arts & Humanities | 62 | 10.0% |
| Total | 619 | 100.0% |
Transportation & Commute in Dutch Island
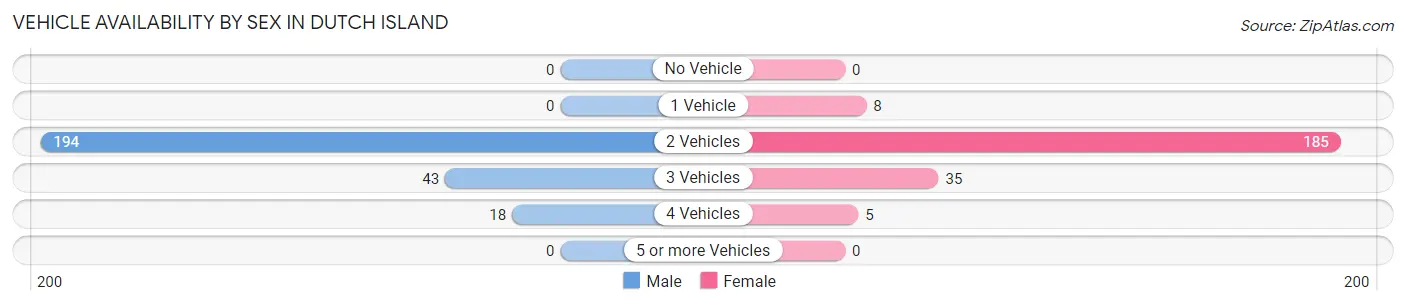
Vehicle Availability by Sex in Dutch Island
The most prevalent vehicle ownership categories in Dutch Island are males with 2 vehicles (194, accounting for 76.1%) and females with 2 vehicles (185, making up 83.3%).
| Vehicles Available | Male | Female |
| No Vehicle | 0 (0.0%) | 0 (0.0%) |
| 1 Vehicle | 0 (0.0%) | 8 (3.4%) |
| 2 Vehicles | 194 (76.1%) | 185 (79.4%) |
| 3 Vehicles | 43 (16.9%) | 35 (15.0%) |
| 4 Vehicles | 18 (7.1%) | 5 (2.1%) |
| 5 or more Vehicles | 0 (0.0%) | 0 (0.0%) |
| Total | 255 (100.0%) | 233 (100.0%) |
Commute Time in Dutch Island
The most frequently occuring commute durations in Dutch Island are 15 to 19 minutes (115 commuters, 29.0%), 20 to 24 minutes (103 commuters, 25.9%), and 30 to 34 minutes (91 commuters, 22.9%).
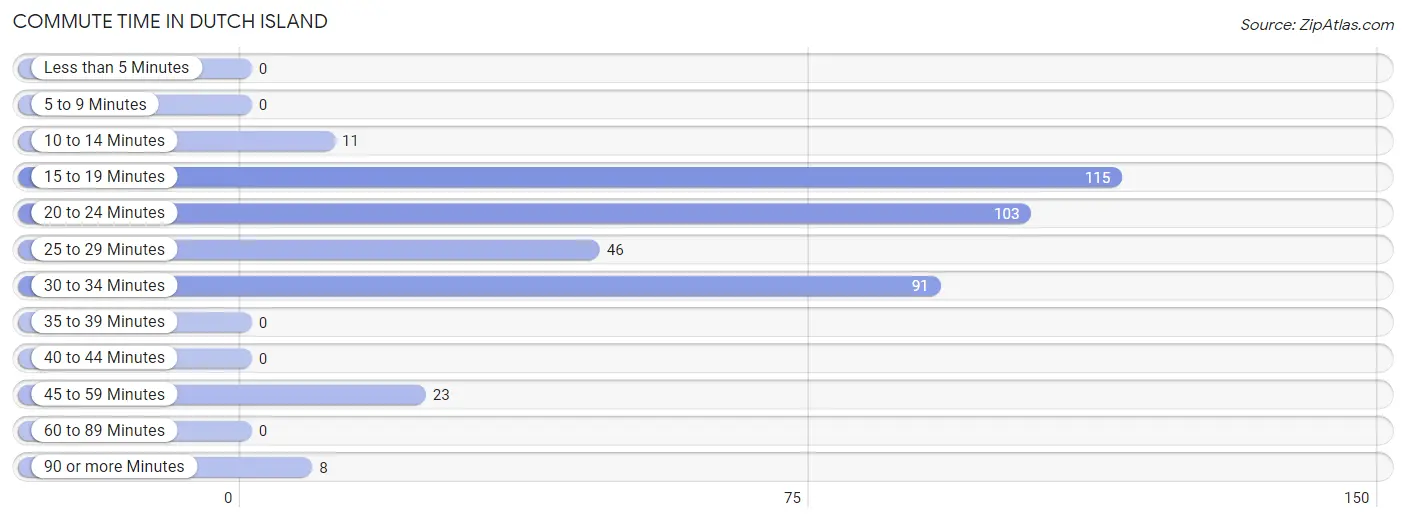
| Commute Time | # Commuters | % Commuters |
| Less than 5 Minutes | 0 | 0.0% |
| 5 to 9 Minutes | 0 | 0.0% |
| 10 to 14 Minutes | 11 | 2.8% |
| 15 to 19 Minutes | 115 | 29.0% |
| 20 to 24 Minutes | 103 | 25.9% |
| 25 to 29 Minutes | 46 | 11.6% |
| 30 to 34 Minutes | 91 | 22.9% |
| 35 to 39 Minutes | 0 | 0.0% |
| 40 to 44 Minutes | 0 | 0.0% |
| 45 to 59 Minutes | 23 | 5.8% |
| 60 to 89 Minutes | 0 | 0.0% |
| 90 or more Minutes | 8 | 2.0% |
Commute Time by Sex in Dutch Island
The most common commute times in Dutch Island are 15 to 19 minutes (75 commuters, 37.7%) for males and 20 to 24 minutes (77 commuters, 38.9%) for females.
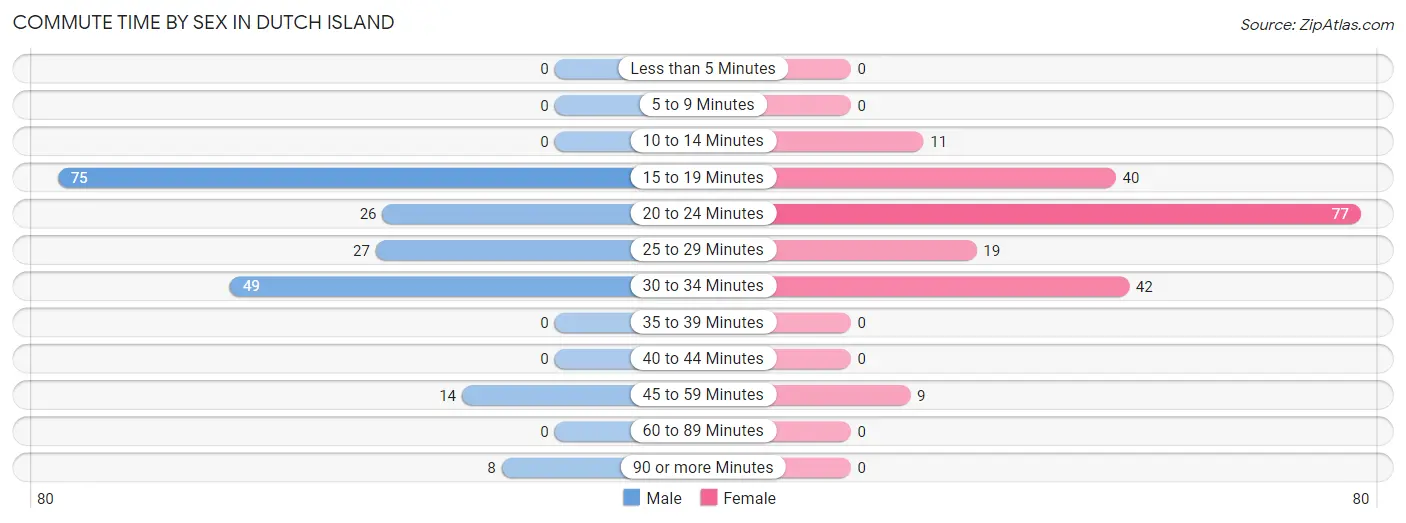
| Commute Time | Male | Female |
| Less than 5 Minutes | 0 (0.0%) | 0 (0.0%) |
| 5 to 9 Minutes | 0 (0.0%) | 0 (0.0%) |
| 10 to 14 Minutes | 0 (0.0%) | 11 (5.6%) |
| 15 to 19 Minutes | 75 (37.7%) | 40 (20.2%) |
| 20 to 24 Minutes | 26 (13.1%) | 77 (38.9%) |
| 25 to 29 Minutes | 27 (13.6%) | 19 (9.6%) |
| 30 to 34 Minutes | 49 (24.6%) | 42 (21.2%) |
| 35 to 39 Minutes | 0 (0.0%) | 0 (0.0%) |
| 40 to 44 Minutes | 0 (0.0%) | 0 (0.0%) |
| 45 to 59 Minutes | 14 (7.0%) | 9 (4.5%) |
| 60 to 89 Minutes | 0 (0.0%) | 0 (0.0%) |
| 90 or more Minutes | 8 (4.0%) | 0 (0.0%) |
Time of Departure to Work by Sex in Dutch Island
The most frequent times of departure to work in Dutch Island are 7:00 AM to 7:29 AM (51, 25.6%) for males and 7:00 AM to 7:29 AM (62, 31.3%) for females.
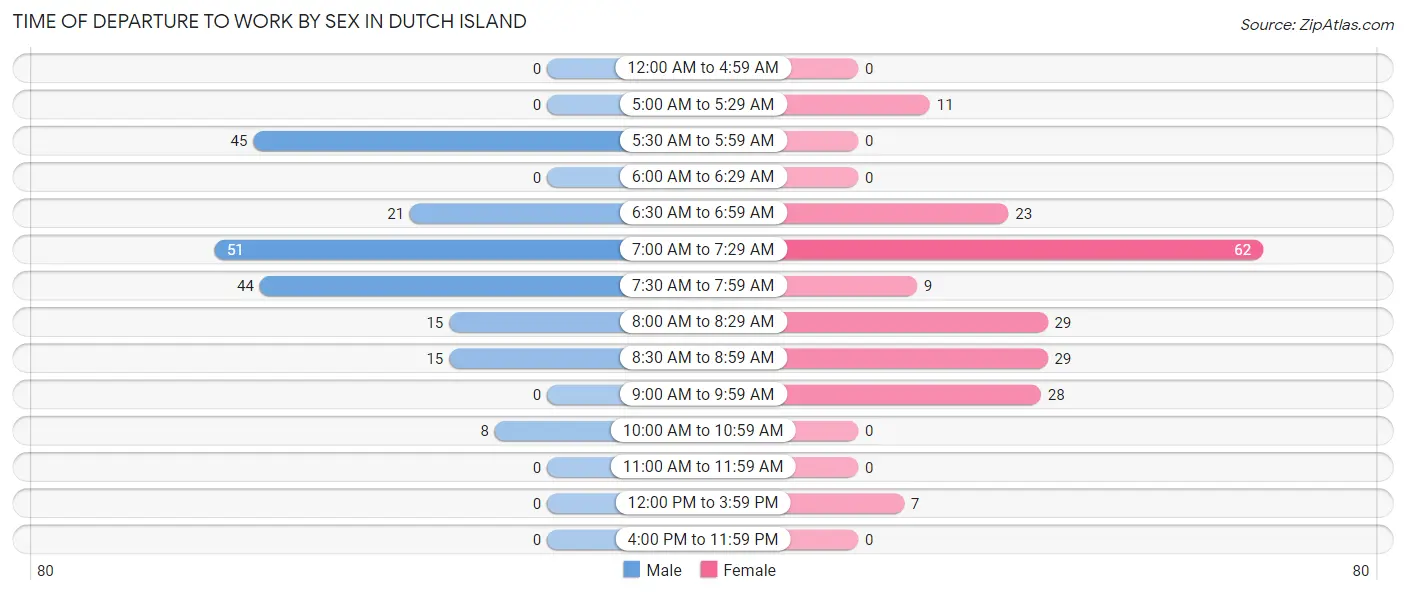
| Time of Departure | Male | Female |
| 12:00 AM to 4:59 AM | 0 (0.0%) | 0 (0.0%) |
| 5:00 AM to 5:29 AM | 0 (0.0%) | 11 (5.6%) |
| 5:30 AM to 5:59 AM | 45 (22.6%) | 0 (0.0%) |
| 6:00 AM to 6:29 AM | 0 (0.0%) | 0 (0.0%) |
| 6:30 AM to 6:59 AM | 21 (10.5%) | 23 (11.6%) |
| 7:00 AM to 7:29 AM | 51 (25.6%) | 62 (31.3%) |
| 7:30 AM to 7:59 AM | 44 (22.1%) | 9 (4.5%) |
| 8:00 AM to 8:29 AM | 15 (7.5%) | 29 (14.6%) |
| 8:30 AM to 8:59 AM | 15 (7.5%) | 29 (14.6%) |
| 9:00 AM to 9:59 AM | 0 (0.0%) | 28 (14.1%) |
| 10:00 AM to 10:59 AM | 8 (4.0%) | 0 (0.0%) |
| 11:00 AM to 11:59 AM | 0 (0.0%) | 0 (0.0%) |
| 12:00 PM to 3:59 PM | 0 (0.0%) | 7 (3.5%) |
| 4:00 PM to 11:59 PM | 0 (0.0%) | 0 (0.0%) |
| Total | 199 (100.0%) | 198 (100.0%) |
Housing Occupancy in Dutch Island
Occupancy by Ownership in Dutch Island
Of the total 456 dwellings in Dutch Island, owner-occupied units account for 448 (98.3%), while renter-occupied units make up 8 (1.8%).
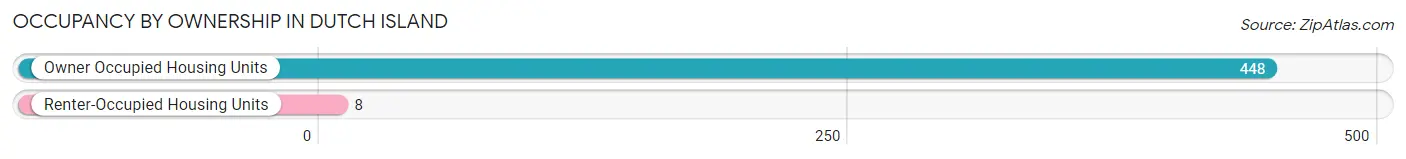
| Occupancy | # Housing Units | % Housing Units |
| Owner Occupied Housing Units | 448 | 98.3% |
| Renter-Occupied Housing Units | 8 | 1.8% |
| Total Occupied Housing Units | 456 | 100.0% |
Occupancy by Household Size in Dutch Island
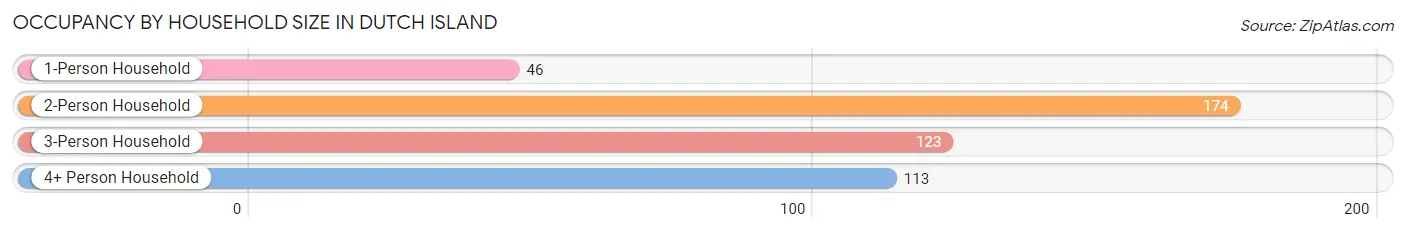
| Household Size | # Housing Units | % Housing Units |
| 1-Person Household | 46 | 10.1% |
| 2-Person Household | 174 | 38.2% |
| 3-Person Household | 123 | 27.0% |
| 4+ Person Household | 113 | 24.8% |
| Total Housing Units | 456 | 100.0% |
Occupancy by Ownership by Household Size in Dutch Island
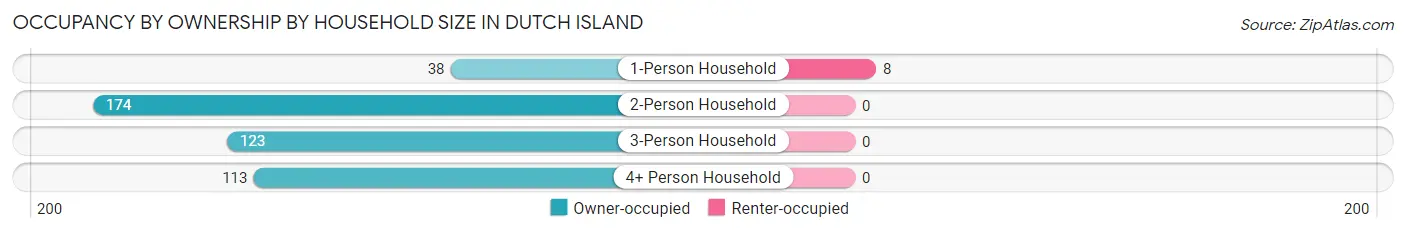
| Household Size | Owner-occupied | Renter-occupied |
| 1-Person Household | 38 (82.6%) | 8 (17.4%) |
| 2-Person Household | 174 (100.0%) | 0 (0.0%) |
| 3-Person Household | 123 (100.0%) | 0 (0.0%) |
| 4+ Person Household | 113 (100.0%) | 0 (0.0%) |
| Total Housing Units | 448 (98.3%) | 8 (1.8%) |
Occupancy by Educational Attainment in Dutch Island
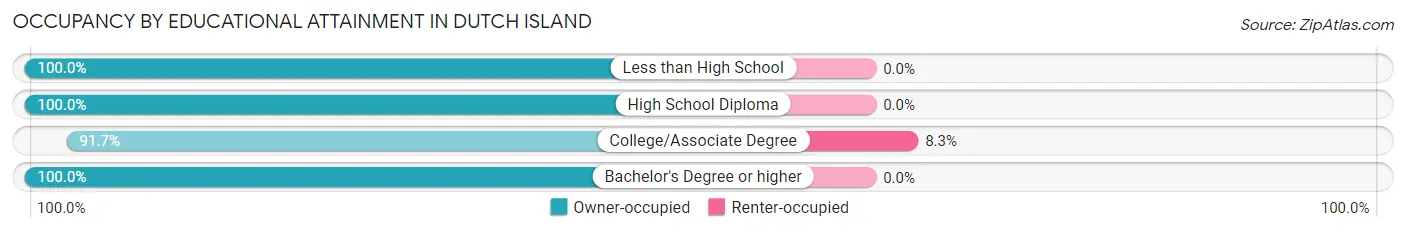
| Household Size | Owner-occupied | Renter-occupied |
| Less than High School | 5 (100.0%) | 0 (0.0%) |
| High School Diploma | 22 (100.0%) | 0 (0.0%) |
| College/Associate Degree | 88 (91.7%) | 8 (8.3%) |
| Bachelor's Degree or higher | 333 (100.0%) | 0 (0.0%) |
Occupancy by Age of Householder in Dutch Island
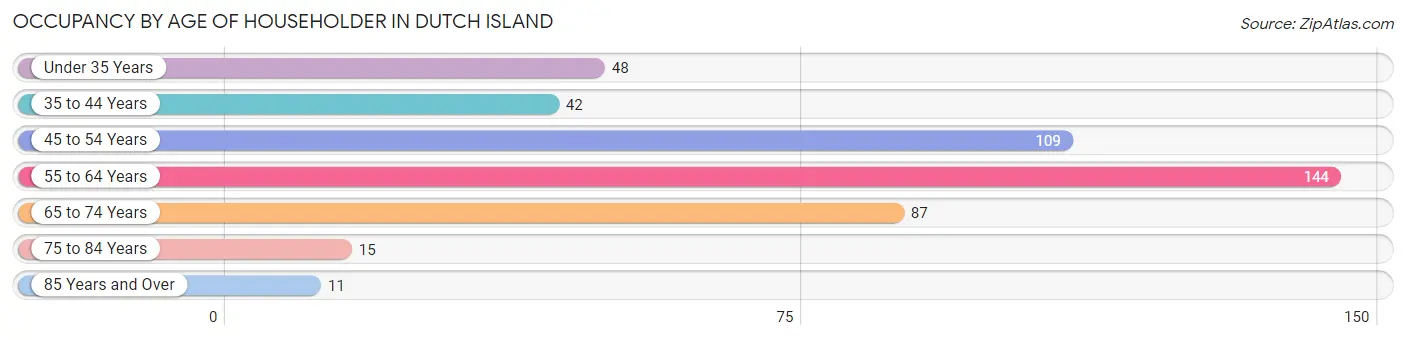
| Age Bracket | # Households | % Households |
| Under 35 Years | 48 | 10.5% |
| 35 to 44 Years | 42 | 9.2% |
| 45 to 54 Years | 109 | 23.9% |
| 55 to 64 Years | 144 | 31.6% |
| 65 to 74 Years | 87 | 19.1% |
| 75 to 84 Years | 15 | 3.3% |
| 85 Years and Over | 11 | 2.4% |
| Total | 456 | 100.0% |
Housing Finances in Dutch Island
Median Income by Occupancy in Dutch Island
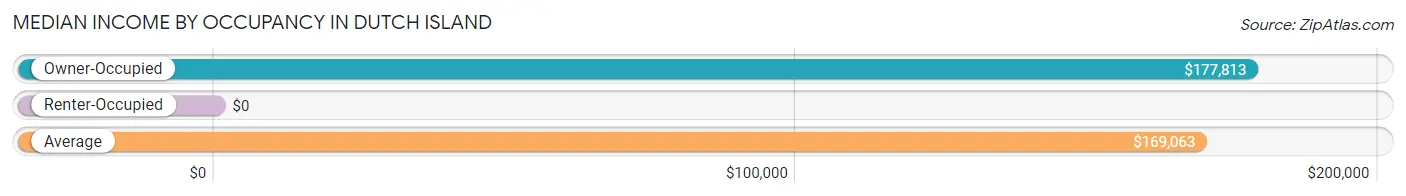
| Occupancy Type | # Households | Median Income |
| Owner-Occupied | 448 (98.3%) | $177,813 |
| Renter-Occupied | 8 (1.8%) | $0 |
| Average | 456 (100.0%) | $169,063 |
Occupancy by Householder Income Bracket in Dutch Island
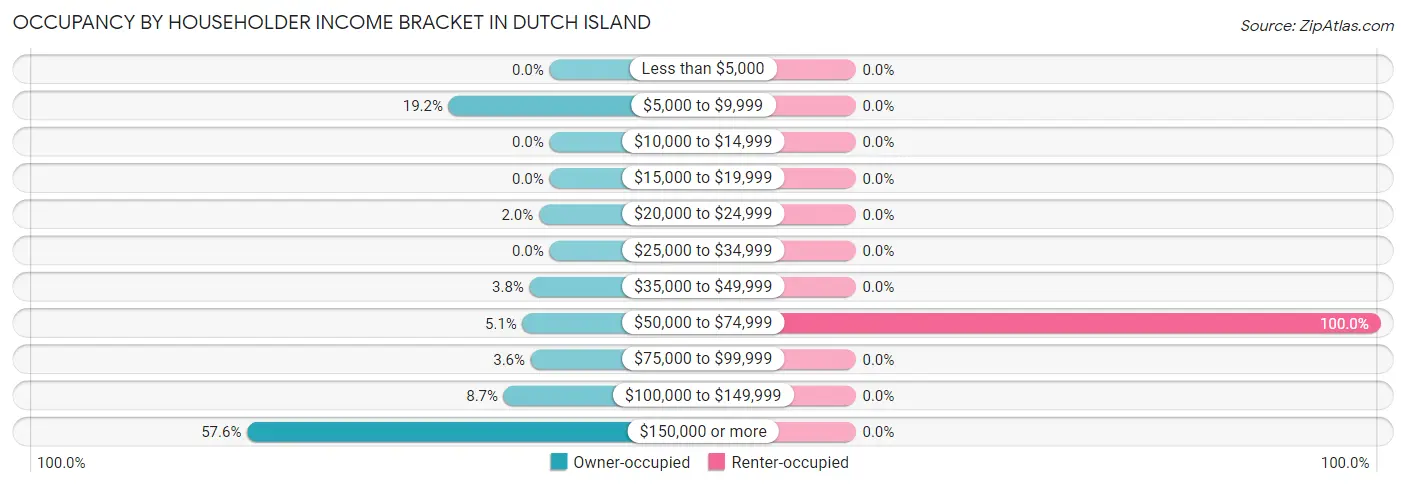
| Income Bracket | Owner-occupied | Renter-occupied |
| Less than $5,000 | 0 (0.0%) | 0 (0.0%) |
| $5,000 to $9,999 | 86 (19.2%) | 0 (0.0%) |
| $10,000 to $14,999 | 0 (0.0%) | 0 (0.0%) |
| $15,000 to $19,999 | 0 (0.0%) | 0 (0.0%) |
| $20,000 to $24,999 | 9 (2.0%) | 0 (0.0%) |
| $25,000 to $34,999 | 0 (0.0%) | 0 (0.0%) |
| $35,000 to $49,999 | 17 (3.8%) | 0 (0.0%) |
| $50,000 to $74,999 | 23 (5.1%) | 8 (100.0%) |
| $75,000 to $99,999 | 16 (3.6%) | 0 (0.0%) |
| $100,000 to $149,999 | 39 (8.7%) | 0 (0.0%) |
| $150,000 or more | 258 (57.6%) | 0 (0.0%) |
| Total | 448 (100.0%) | 8 (100.0%) |
Monthly Housing Cost Tiers in Dutch Island
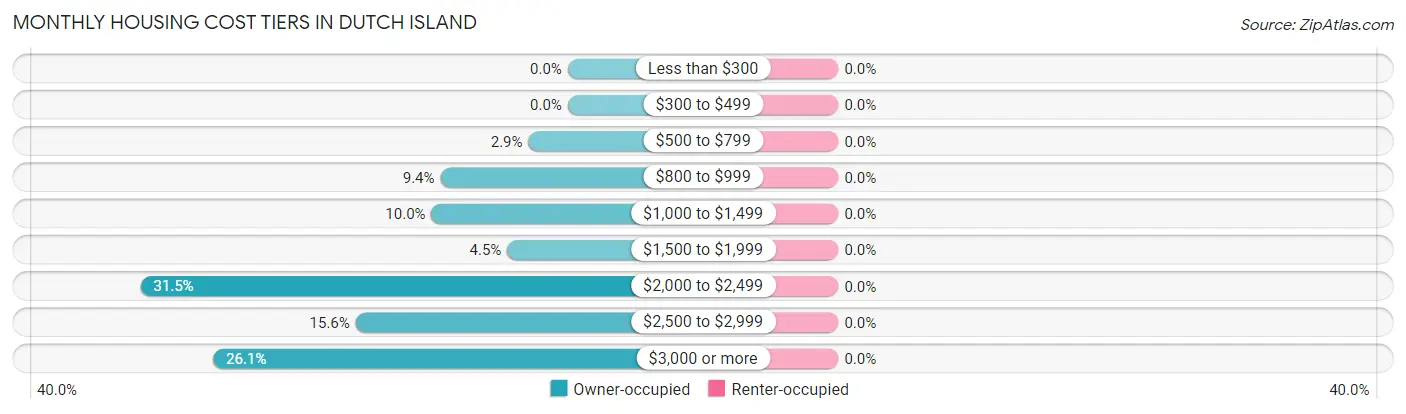
| Monthly Cost | Owner-occupied | Renter-occupied |
| Less than $300 | 0 (0.0%) | 0 (0.0%) |
| $300 to $499 | 0 (0.0%) | 0 (0.0%) |
| $500 to $799 | 13 (2.9%) | 0 (0.0%) |
| $800 to $999 | 42 (9.4%) | 0 (0.0%) |
| $1,000 to $1,499 | 45 (10.0%) | 0 (0.0%) |
| $1,500 to $1,999 | 20 (4.5%) | 0 (0.0%) |
| $2,000 to $2,499 | 141 (31.5%) | 0 (0.0%) |
| $2,500 to $2,999 | 70 (15.6%) | 0 (0.0%) |
| $3,000 or more | 117 (26.1%) | 0 (0.0%) |
| Total | 448 (100.0%) | 8 (100.0%) |
Physical Housing Characteristics in Dutch Island
Housing Structures in Dutch Island
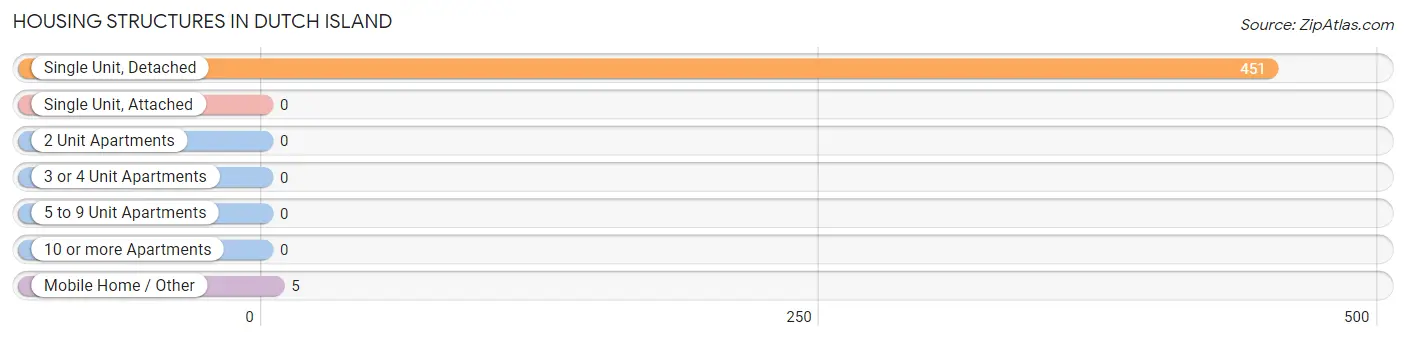
| Structure Type | # Housing Units | % Housing Units |
| Single Unit, Detached | 451 | 98.9% |
| Single Unit, Attached | 0 | 0.0% |
| 2 Unit Apartments | 0 | 0.0% |
| 3 or 4 Unit Apartments | 0 | 0.0% |
| 5 to 9 Unit Apartments | 0 | 0.0% |
| 10 or more Apartments | 0 | 0.0% |
| Mobile Home / Other | 5 | 1.1% |
| Total | 456 | 100.0% |
Housing Structures by Occupancy in Dutch Island
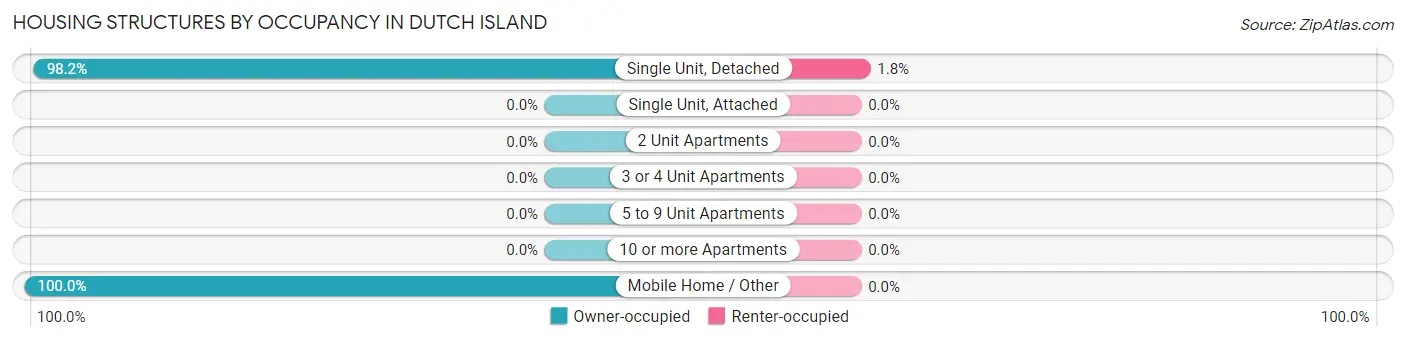
| Structure Type | Owner-occupied | Renter-occupied |
| Single Unit, Detached | 443 (98.2%) | 8 (1.8%) |
| Single Unit, Attached | 0 (0.0%) | 0 (0.0%) |
| 2 Unit Apartments | 0 (0.0%) | 0 (0.0%) |
| 3 or 4 Unit Apartments | 0 (0.0%) | 0 (0.0%) |
| 5 to 9 Unit Apartments | 0 (0.0%) | 0 (0.0%) |
| 10 or more Apartments | 0 (0.0%) | 0 (0.0%) |
| Mobile Home / Other | 5 (100.0%) | 0 (0.0%) |
| Total | 448 (98.3%) | 8 (1.8%) |
Housing Structures by Number of Rooms in Dutch Island
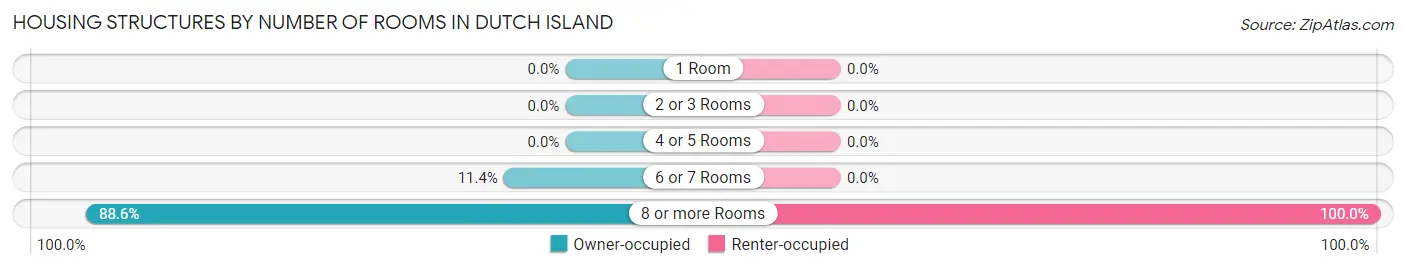
| Number of Rooms | Owner-occupied | Renter-occupied |
| 1 Room | 0 (0.0%) | 0 (0.0%) |
| 2 or 3 Rooms | 0 (0.0%) | 0 (0.0%) |
| 4 or 5 Rooms | 0 (0.0%) | 0 (0.0%) |
| 6 or 7 Rooms | 51 (11.4%) | 0 (0.0%) |
| 8 or more Rooms | 397 (88.6%) | 8 (100.0%) |
| Total | 448 (100.0%) | 8 (100.0%) |
Housing Structure by Heating Type in Dutch Island
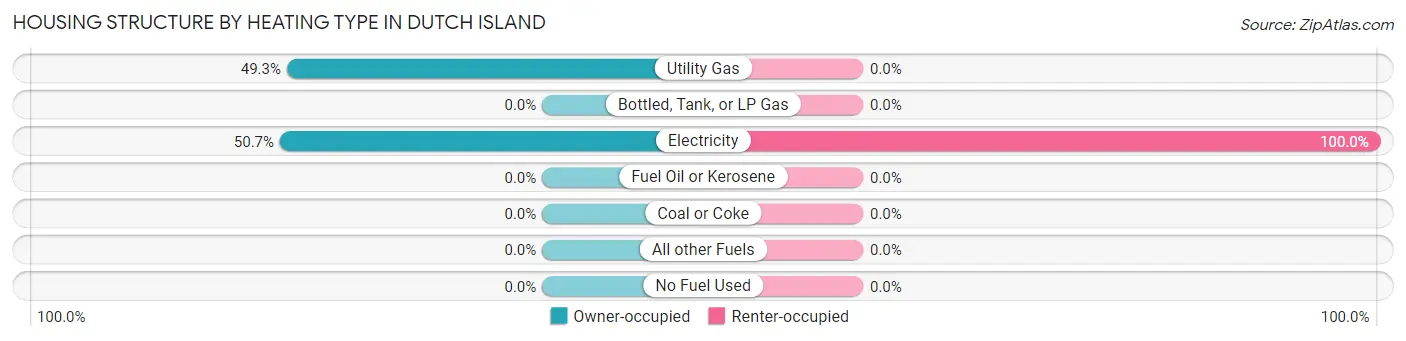
| Heating Type | Owner-occupied | Renter-occupied |
| Utility Gas | 221 (49.3%) | 0 (0.0%) |
| Bottled, Tank, or LP Gas | 0 (0.0%) | 0 (0.0%) |
| Electricity | 227 (50.7%) | 8 (100.0%) |
| Fuel Oil or Kerosene | 0 (0.0%) | 0 (0.0%) |
| Coal or Coke | 0 (0.0%) | 0 (0.0%) |
| All other Fuels | 0 (0.0%) | 0 (0.0%) |
| No Fuel Used | 0 (0.0%) | 0 (0.0%) |
| Total | 448 (100.0%) | 8 (100.0%) |
Household Vehicle Usage in Dutch Island
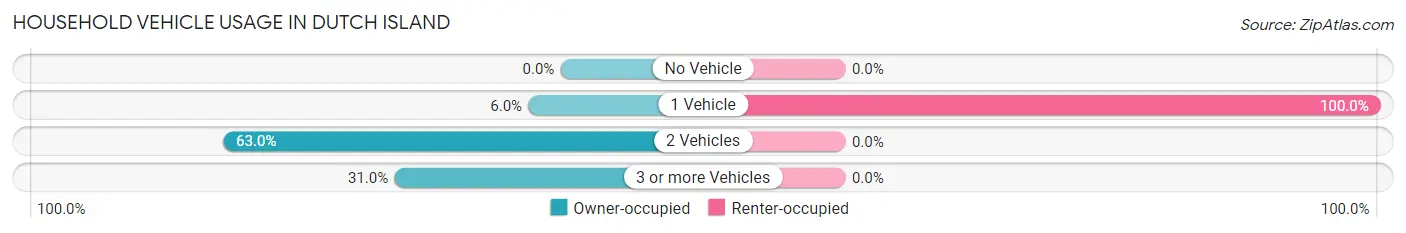
| Vehicles per Household | Owner-occupied | Renter-occupied |
| No Vehicle | 0 (0.0%) | 0 (0.0%) |
| 1 Vehicle | 27 (6.0%) | 8 (100.0%) |
| 2 Vehicles | 282 (62.9%) | 0 (0.0%) |
| 3 or more Vehicles | 139 (31.0%) | 0 (0.0%) |
| Total | 448 (100.0%) | 8 (100.0%) |
Real Estate & Mortgages in Dutch Island
Real Estate and Mortgage Overview in Dutch Island
| Characteristic | Without Mortgage | With Mortgage |
| Housing Units | 129 | 319 |
| Median Property Value | $669,500 | $568,700 |
| Median Household Income | $232,604 | $170 |
| Monthly Housing Costs | $1,063 | $117 |
| Real Estate Taxes | $4,944 | $0 |
Property Value by Mortgage Status in Dutch Island
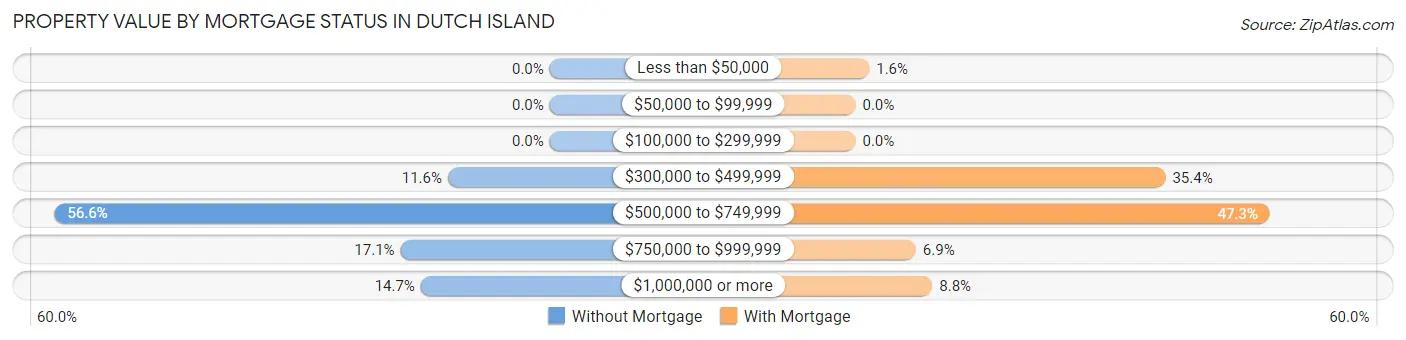
| Property Value | Without Mortgage | With Mortgage |
| Less than $50,000 | 0 (0.0%) | 5 (1.6%) |
| $50,000 to $99,999 | 0 (0.0%) | 0 (0.0%) |
| $100,000 to $299,999 | 0 (0.0%) | 0 (0.0%) |
| $300,000 to $499,999 | 15 (11.6%) | 113 (35.4%) |
| $500,000 to $749,999 | 73 (56.6%) | 151 (47.3%) |
| $750,000 to $999,999 | 22 (17.1%) | 22 (6.9%) |
| $1,000,000 or more | 19 (14.7%) | 28 (8.8%) |
| Total | 129 (100.0%) | 319 (100.0%) |
Household Income by Mortgage Status in Dutch Island
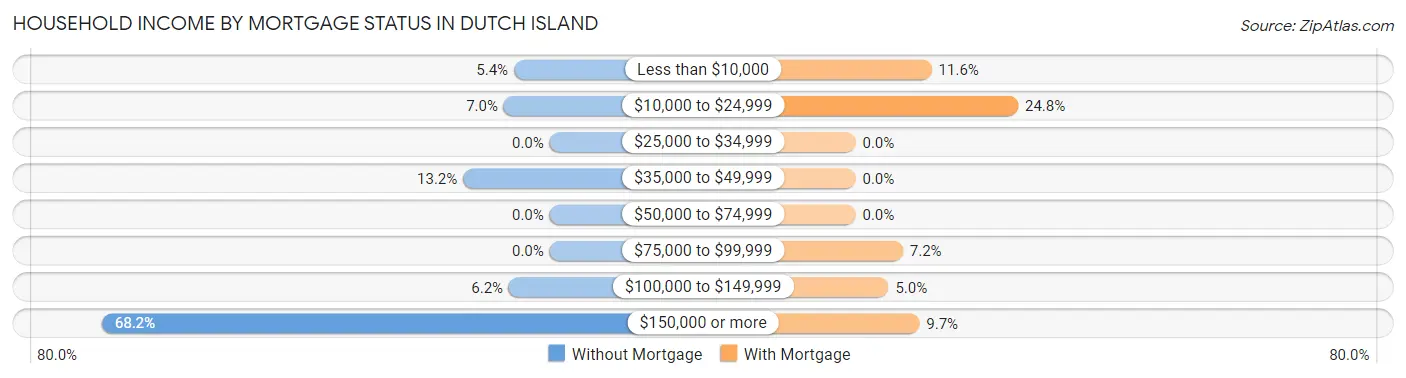
| Household Income | Without Mortgage | With Mortgage |
| Less than $10,000 | 7 (5.4%) | 37 (11.6%) |
| $10,000 to $24,999 | 9 (7.0%) | 79 (24.8%) |
| $25,000 to $34,999 | 0 (0.0%) | 0 (0.0%) |
| $35,000 to $49,999 | 17 (13.2%) | 0 (0.0%) |
| $50,000 to $74,999 | 0 (0.0%) | 0 (0.0%) |
| $75,000 to $99,999 | 0 (0.0%) | 23 (7.2%) |
| $100,000 to $149,999 | 8 (6.2%) | 16 (5.0%) |
| $150,000 or more | 88 (68.2%) | 31 (9.7%) |
| Total | 129 (100.0%) | 319 (100.0%) |
Property Value to Household Income Ratio in Dutch Island
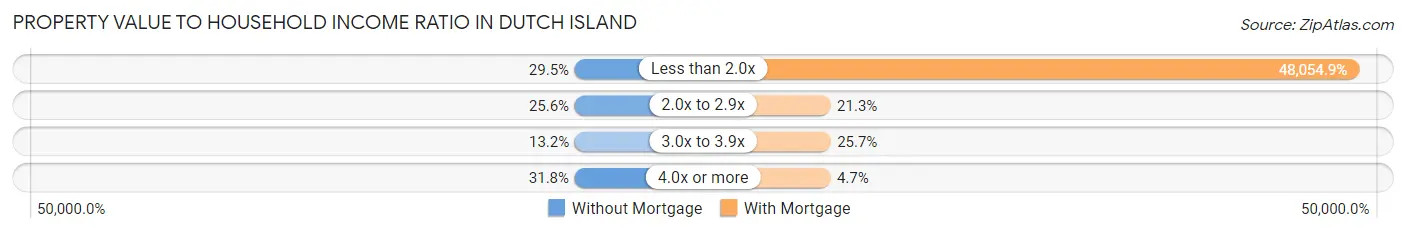
| Value-to-Income Ratio | Without Mortgage | With Mortgage |
| Less than 2.0x | 38 (29.5%) | 153,295 (48,054.9%) |
| 2.0x to 2.9x | 33 (25.6%) | 68 (21.3%) |
| 3.0x to 3.9x | 17 (13.2%) | 82 (25.7%) |
| 4.0x or more | 41 (31.8%) | 15 (4.7%) |
| Total | 129 (100.0%) | 319 (100.0%) |
Real Estate Taxes by Mortgage Status in Dutch Island
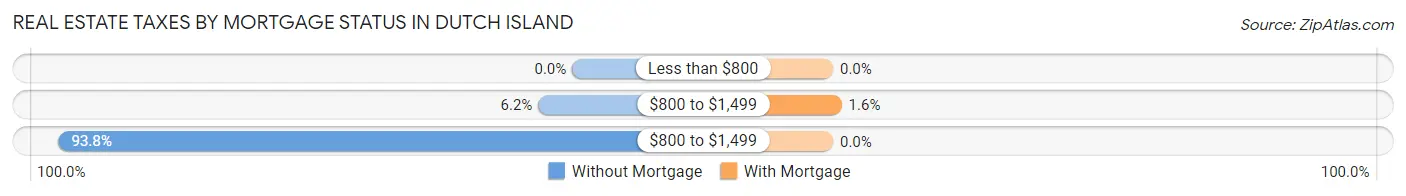
| Property Taxes | Without Mortgage | With Mortgage |
| Less than $800 | 0 (0.0%) | 0 (0.0%) |
| $800 to $1,499 | 8 (6.2%) | 5 (1.6%) |
| $800 to $1,499 | 121 (93.8%) | 0 (0.0%) |
| Total | 129 (100.0%) | 319 (100.0%) |
Health & Disability in Dutch Island
Health Insurance Coverage by Age in Dutch Island
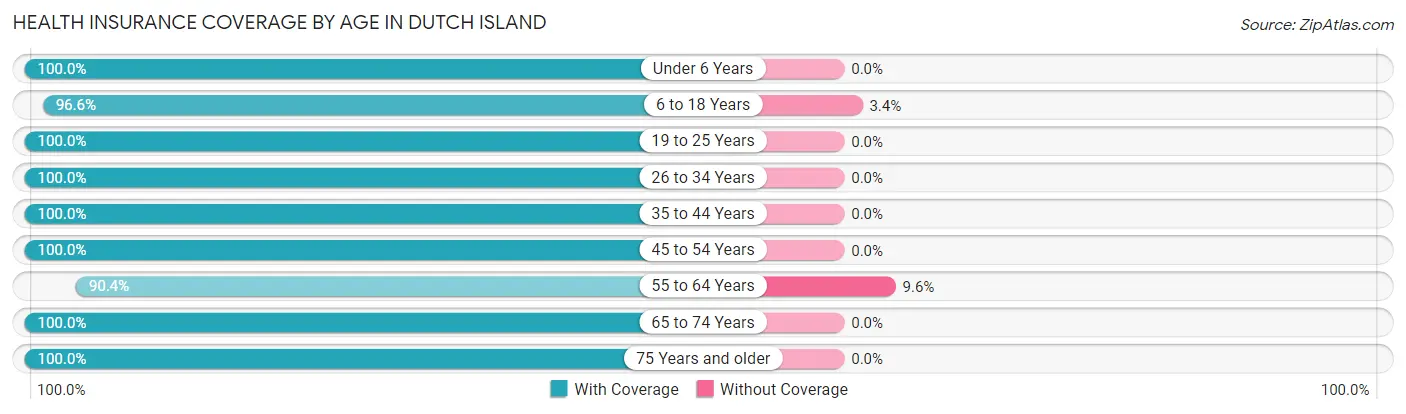
| Age Bracket | With Coverage | Without Coverage |
| Under 6 Years | 92 (100.0%) | 0 (0.0%) |
| 6 to 18 Years | 228 (96.6%) | 8 (3.4%) |
| 19 to 25 Years | 12 (100.0%) | 0 (0.0%) |
| 26 to 34 Years | 175 (100.0%) | 0 (0.0%) |
| 35 to 44 Years | 97 (100.0%) | 0 (0.0%) |
| 45 to 54 Years | 218 (100.0%) | 0 (0.0%) |
| 55 to 64 Years | 170 (90.4%) | 18 (9.6%) |
| 65 to 74 Years | 186 (100.0%) | 0 (0.0%) |
| 75 Years and older | 64 (100.0%) | 0 (0.0%) |
| Total | 1,242 (98.0%) | 26 (2.1%) |
Health Insurance Coverage by Citizenship Status in Dutch Island
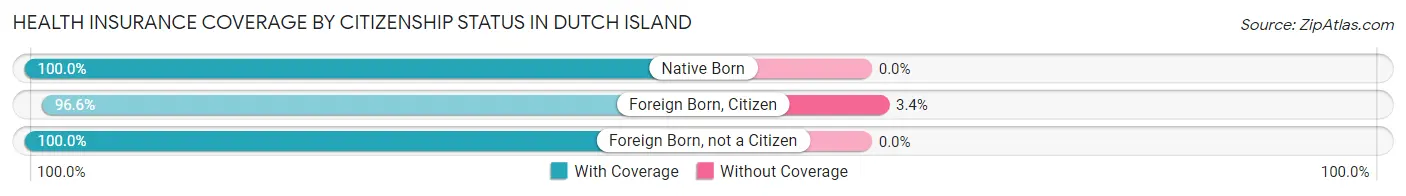
| Citizenship Status | With Coverage | Without Coverage |
| Native Born | 92 (100.0%) | 0 (0.0%) |
| Foreign Born, Citizen | 228 (96.6%) | 8 (3.4%) |
| Foreign Born, not a Citizen | 12 (100.0%) | 0 (0.0%) |
Health Insurance Coverage by Household Income in Dutch Island
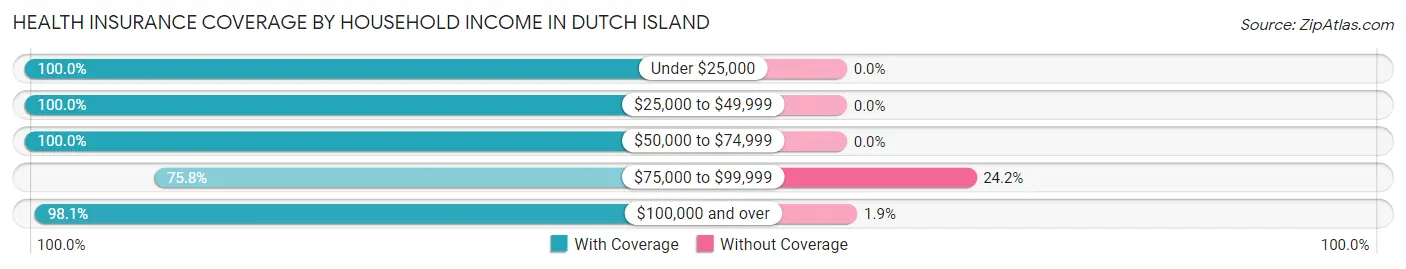
| Household Income | With Coverage | Without Coverage |
| Under $25,000 | 232 (100.0%) | 0 (0.0%) |
| $25,000 to $49,999 | 38 (100.0%) | 0 (0.0%) |
| $50,000 to $74,999 | 36 (100.0%) | 0 (0.0%) |
| $75,000 to $99,999 | 25 (75.8%) | 8 (24.2%) |
| $100,000 and over | 911 (98.1%) | 18 (1.9%) |
Public vs Private Health Insurance Coverage by Age in Dutch Island
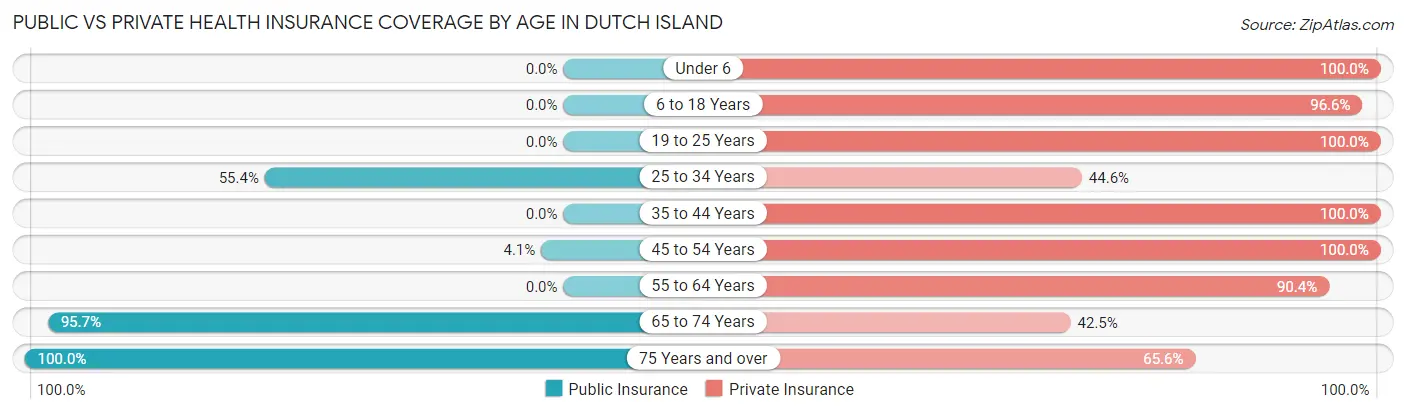
| Age Bracket | Public Insurance | Private Insurance |
| Under 6 | 0 (0.0%) | 92 (100.0%) |
| 6 to 18 Years | 0 (0.0%) | 228 (96.6%) |
| 19 to 25 Years | 0 (0.0%) | 12 (100.0%) |
| 25 to 34 Years | 97 (55.4%) | 78 (44.6%) |
| 35 to 44 Years | 0 (0.0%) | 97 (100.0%) |
| 45 to 54 Years | 9 (4.1%) | 218 (100.0%) |
| 55 to 64 Years | 0 (0.0%) | 170 (90.4%) |
| 65 to 74 Years | 178 (95.7%) | 79 (42.5%) |
| 75 Years and over | 64 (100.0%) | 42 (65.6%) |
| Total | 348 (27.4%) | 1,016 (80.1%) |
Disability Status by Sex by Age in Dutch Island
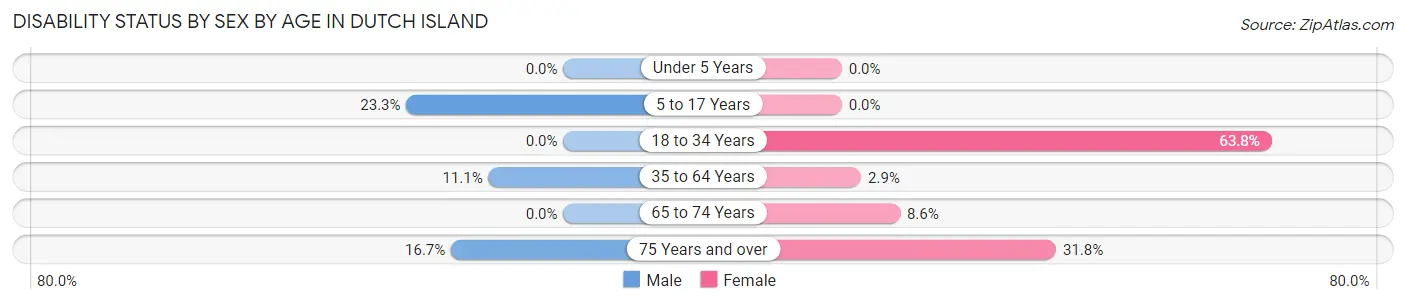
| Age Bracket | Male | Female |
| Under 5 Years | 0 (0.0%) | 0 (0.0%) |
| 5 to 17 Years | 38 (23.3%) | 0 (0.0%) |
| 18 to 34 Years | 0 (0.0%) | 97 (63.8%) |
| 35 to 64 Years | 21 (11.1%) | 9 (2.9%) |
| 65 to 74 Years | 0 (0.0%) | 7 (8.6%) |
| 75 Years and over | 7 (16.7%) | 7 (31.8%) |
Disability Class by Sex by Age in Dutch Island
Disability Class: Hearing Difficulty
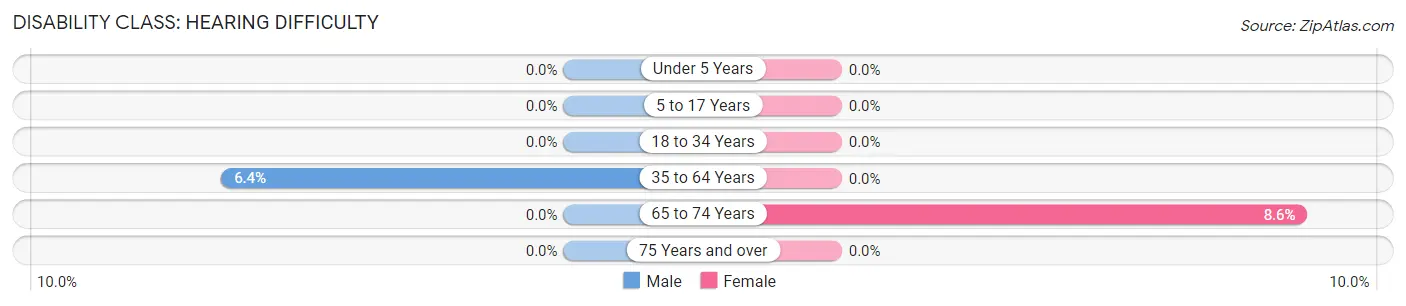
| Age Bracket | Male | Female |
| Under 5 Years | 0 (0.0%) | 0 (0.0%) |
| 5 to 17 Years | 0 (0.0%) | 0 (0.0%) |
| 18 to 34 Years | 0 (0.0%) | 0 (0.0%) |
| 35 to 64 Years | 12 (6.4%) | 0 (0.0%) |
| 65 to 74 Years | 0 (0.0%) | 7 (8.6%) |
| 75 Years and over | 0 (0.0%) | 0 (0.0%) |
Disability Class: Vision Difficulty
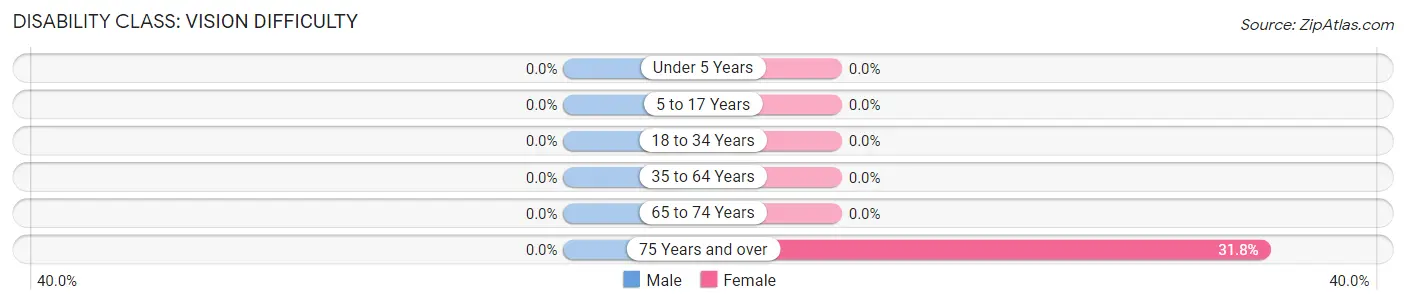
| Age Bracket | Male | Female |
| Under 5 Years | 0 (0.0%) | 0 (0.0%) |
| 5 to 17 Years | 0 (0.0%) | 0 (0.0%) |
| 18 to 34 Years | 0 (0.0%) | 0 (0.0%) |
| 35 to 64 Years | 0 (0.0%) | 0 (0.0%) |
| 65 to 74 Years | 0 (0.0%) | 0 (0.0%) |
| 75 Years and over | 0 (0.0%) | 7 (31.8%) |
Disability Class: Cognitive Difficulty
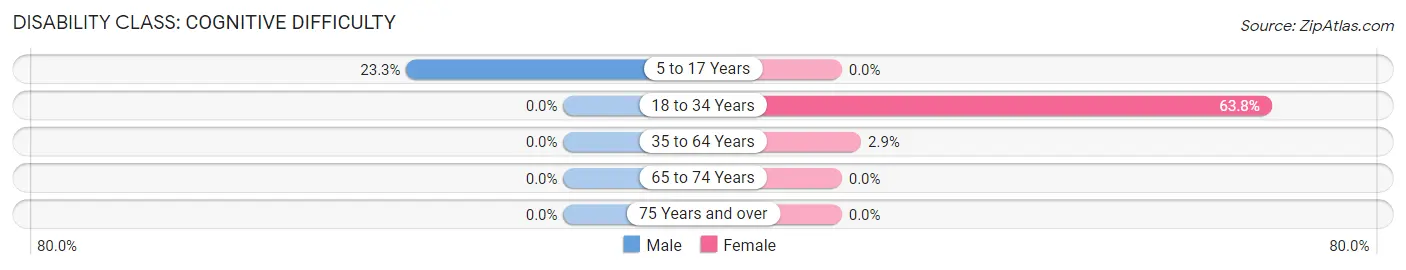
| Age Bracket | Male | Female |
| 5 to 17 Years | 38 (23.3%) | 0 (0.0%) |
| 18 to 34 Years | 0 (0.0%) | 97 (63.8%) |
| 35 to 64 Years | 0 (0.0%) | 9 (2.9%) |
| 65 to 74 Years | 0 (0.0%) | 0 (0.0%) |
| 75 Years and over | 0 (0.0%) | 0 (0.0%) |
Disability Class: Ambulatory Difficulty
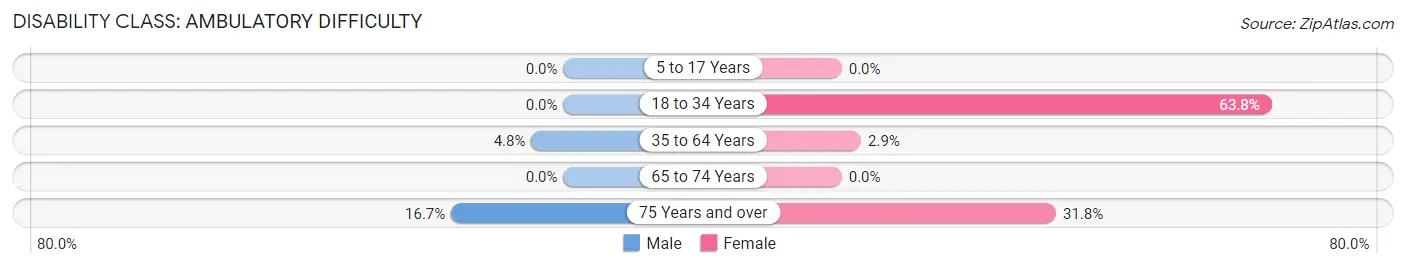
| Age Bracket | Male | Female |
| 5 to 17 Years | 0 (0.0%) | 0 (0.0%) |
| 18 to 34 Years | 0 (0.0%) | 97 (63.8%) |
| 35 to 64 Years | 9 (4.8%) | 9 (2.9%) |
| 65 to 74 Years | 0 (0.0%) | 0 (0.0%) |
| 75 Years and over | 7 (16.7%) | 7 (31.8%) |
Disability Class: Self-Care Difficulty
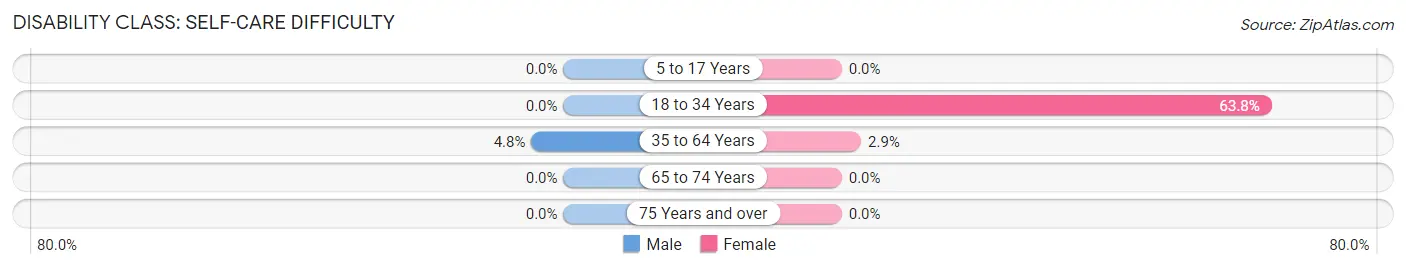
| Age Bracket | Male | Female |
| 5 to 17 Years | 0 (0.0%) | 0 (0.0%) |
| 18 to 34 Years | 0 (0.0%) | 97 (63.8%) |
| 35 to 64 Years | 9 (4.8%) | 9 (2.9%) |
| 65 to 74 Years | 0 (0.0%) | 0 (0.0%) |
| 75 Years and over | 0 (0.0%) | 0 (0.0%) |
Technology Access in Dutch Island
Computing Device Access in Dutch Island
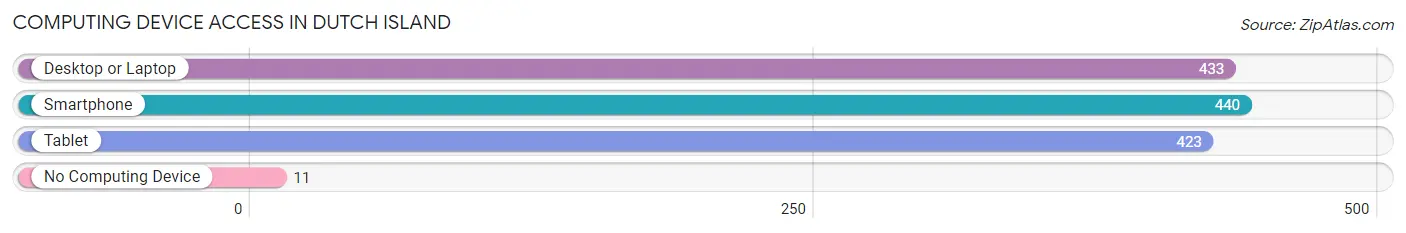
| Device Type | # Households | % Households |
| Desktop or Laptop | 433 | 95.0% |
| Smartphone | 440 | 96.5% |
| Tablet | 423 | 92.8% |
| No Computing Device | 11 | 2.4% |
| Total | 456 | 100.0% |
Internet Access in Dutch Island
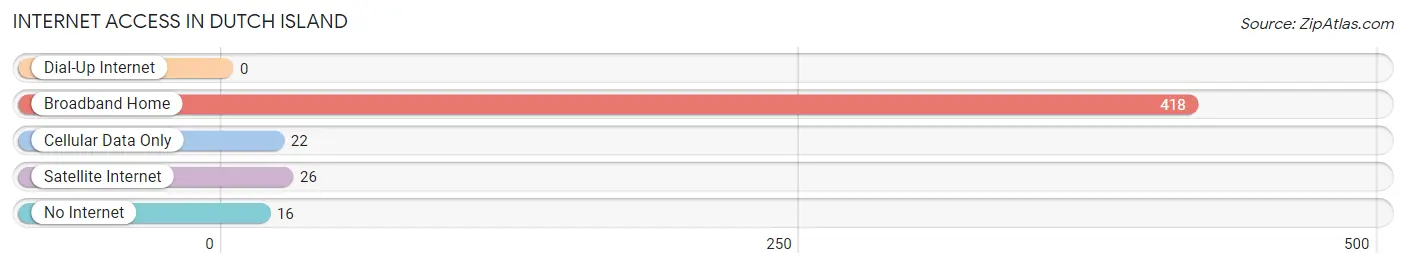
| Internet Type | # Households | % Households |
| Dial-Up Internet | 0 | 0.0% |
| Broadband Home | 418 | 91.7% |
| Cellular Data Only | 22 | 4.8% |
| Satellite Internet | 26 | 5.7% |
| No Internet | 16 | 3.5% |
| Total | 456 | 100.0% |
Dutch Island Summary
History
Dutch Island is a small island located in the southeastern United States, off the coast of Georgia. It is part of the Golden Isles of Georgia, a group of barrier islands located off the coast of Georgia and South Carolina. The island is approximately 1.5 miles long and 0.5 miles wide, and is located approximately 4 miles off the coast of St. Simons Island.
The island was first inhabited by Native Americans, who used it as a fishing and hunting ground. The first European settlers arrived in the late 1700s, and the island was named Dutch Island after the Dutch settlers who arrived in the area. The island was used primarily for farming and fishing, and the population grew steadily throughout the 19th century.
In the early 20th century, the island was purchased by a group of investors who developed it into a resort destination. The island was home to several hotels, a golf course, and a casino. The island was a popular destination for tourists, and the population grew to over 500 people.
In the 1950s, the island was sold to a developer who planned to build a bridge to the mainland. However, the project was never completed, and the island remained largely undeveloped. In the late 1970s, the island was purchased by the state of Georgia, and it is now part of the Georgia Department of Natural Resources.
Geography
Dutch Island is located off the coast of Georgia, approximately 4 miles from St. Simons Island. The island is approximately 1.5 miles long and 0.5 miles wide, and is surrounded by marshland. The island is composed of sand and clay, and is covered with a variety of vegetation, including live oaks, palmettos, and sea oats.
The island is home to a variety of wildlife, including sea turtles, dolphins, and a variety of birds. The island is also home to a variety of fish, including redfish, flounder, and trout.
Economy
The economy of Dutch Island is largely based on tourism. The island is home to several resorts, hotels, and restaurants, which attract visitors from all over the world. The island is also home to a variety of shops and galleries, which sell a variety of local crafts and souvenirs.
The island is also home to a variety of recreational activities, including fishing, boating, and swimming. The island is also home to a golf course, which attracts golfers from all over the world.
Demographics
As of the 2010 census, the population of Dutch Island was 545. The population is largely composed of retirees and seasonal visitors. The median age of the population is 57, and the median household income is $50,000. The island is home to a variety of ethnicities, including African American, Caucasian, and Hispanic. The island is also home to a variety of religious denominations, including Baptist, Catholic, and Methodist.
Common Questions
What is Per Capita Income in Dutch Island?
Per Capita income in Dutch Island is $73,218.
What is the Median Family Income in Dutch Island?
Median Family Income in Dutch Island is $185,500.
What is the Median Household income in Dutch Island?
Median Household Income in Dutch Island is $169,063.
What is Income or Wage Gap in Dutch Island?
Income or Wage Gap in Dutch Island is 66.2%.
Women in Dutch Island earn 33.8 cents for every dollar earned by a man.
What is Inequality or Gini Index in Dutch Island?
Inequality or Gini Index in Dutch Island is 0.49.
What is the Total Population of Dutch Island?
Total Population of Dutch Island is 1,268.
What is the Total Male Population of Dutch Island?
Total Male Population of Dutch Island is 583.
What is the Total Female Population of Dutch Island?
Total Female Population of Dutch Island is 685.
What is the Ratio of Males per 100 Females in Dutch Island?
There are 85.11 Males per 100 Females in Dutch Island.
What is the Ratio of Females per 100 Males in Dutch Island?
There are 117.50 Females per 100 Males in Dutch Island.
What is the Median Population Age in Dutch Island?
Median Population Age in Dutch Island is 45.6 Years.
What is the Average Family Size in Dutch Island
Average Family Size in Dutch Island is 3.0 People.
What is the Average Household Size in Dutch Island
Average Household Size in Dutch Island is 2.8 People.
How Large is the Labor Force in Dutch Island?
There are 507 People in the Labor Forcein in Dutch Island.
What is the Percentage of People in the Labor Force in Dutch Island?
53.9% of People are in the Labor Force in Dutch Island.