Clarkson Valley, MO Map & Demographics
Clarkson Valley Map
Clarkson Valley Overview
$112,065
PER CAPITA INCOME
$230,500
AVG FAMILY INCOME
$218,816
AVG HOUSEHOLD INCOME
56.1%
WAGE / INCOME GAP [ % ]
43.9¢/ $1
WAGE / INCOME GAP [ $ ]
$14,764
FAMILY INCOME DEFICIT
0.41
INEQUALITY / GINI INDEX
2,608
TOTAL POPULATION
1,380
MALE POPULATION
1,228
FEMALE POPULATION
112.38
MALES / 100 FEMALES
88.99
FEMALES / 100 MALES
49.6
MEDIAN AGE
3.2
AVG FAMILY SIZE
2.9
AVG HOUSEHOLD SIZE
1,155
LABOR FORCE [ PEOPLE ]
53.8%
PERCENT IN LABOR FORCE
2.0%
UNEMPLOYMENT RATE
Income in Clarkson Valley
Income Overview in Clarkson Valley
Per Capita Income in Clarkson Valley is $112,065, while median incomes of families and households are $230,500 and $218,816 respectively.
| Characteristic | Number | Measure |
| Per Capita Income | 2,608 | $112,065 |
| Median Family Income | 790 | $230,500 |
| Mean Family Income | 790 | $339,550 |
| Median Household Income | 894 | $218,816 |
| Mean Household Income | 894 | $321,863 |
| Income Deficit | 790 | $14,764 |
| Wage / Income Gap (%) | 2,608 | 56.14% |
| Wage / Income Gap ($) | 2,608 | 43.86¢ per $1 |
| Gini / Inequality Index | 2,608 | 0.41 |
Earnings by Sex in Clarkson Valley
Average Earnings in Clarkson Valley are $105,530, $139,643 for men and $61,250 for women, a difference of 56.1%.
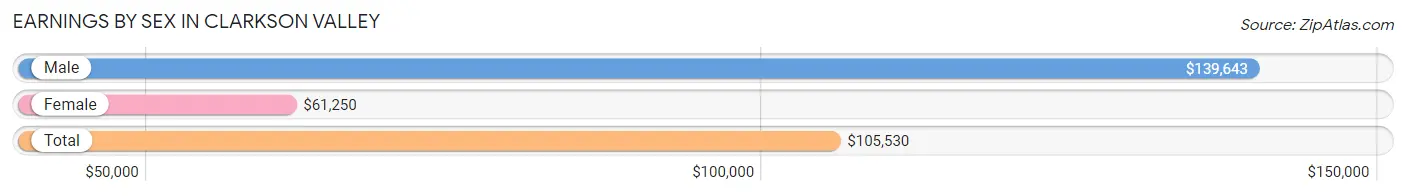
| Sex | Number | Average Earnings |
| Male | 848 (64.3%) | $139,643 |
| Female | 470 (35.7%) | $61,250 |
| Total | 1,318 (100.0%) | $105,530 |
Earnings by Sex by Income Bracket in Clarkson Valley
The most common earnings brackets in Clarkson Valley are $100,000+ for men (537 | 63.3%) and $100,000+ for women (140 | 29.8%).
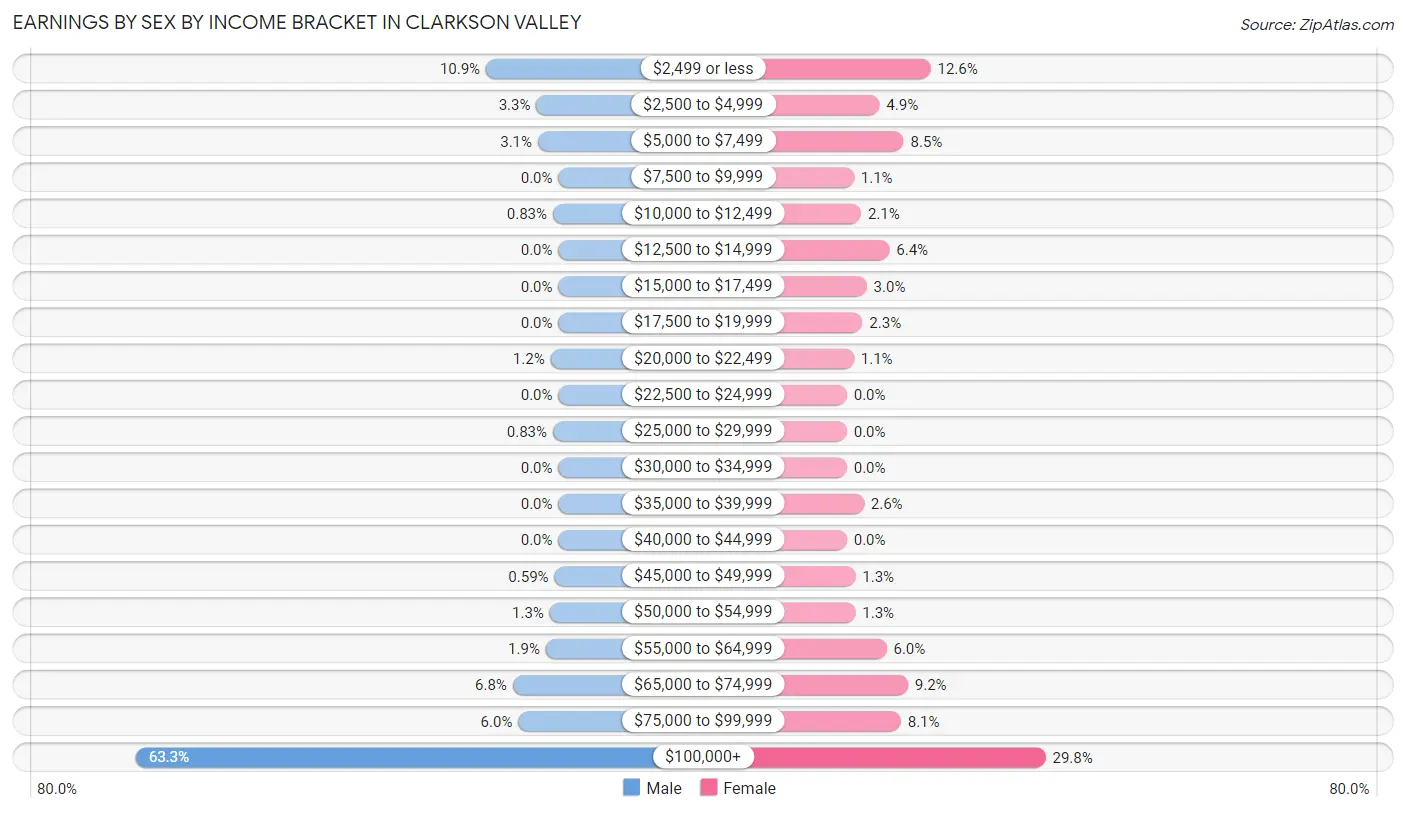
| Income | Male | Female |
| $2,499 or less | 92 (10.8%) | 59 (12.6%) |
| $2,500 to $4,999 | 28 (3.3%) | 23 (4.9%) |
| $5,000 to $7,499 | 26 (3.1%) | 40 (8.5%) |
| $7,500 to $9,999 | 0 (0.0%) | 5 (1.1%) |
| $10,000 to $12,499 | 7 (0.8%) | 10 (2.1%) |
| $12,500 to $14,999 | 0 (0.0%) | 30 (6.4%) |
| $15,000 to $17,499 | 0 (0.0%) | 14 (3.0%) |
| $17,500 to $19,999 | 0 (0.0%) | 11 (2.3%) |
| $20,000 to $22,499 | 10 (1.2%) | 5 (1.1%) |
| $22,500 to $24,999 | 0 (0.0%) | 0 (0.0%) |
| $25,000 to $29,999 | 7 (0.8%) | 0 (0.0%) |
| $30,000 to $34,999 | 0 (0.0%) | 0 (0.0%) |
| $35,000 to $39,999 | 0 (0.0%) | 12 (2.5%) |
| $40,000 to $44,999 | 0 (0.0%) | 0 (0.0%) |
| $45,000 to $49,999 | 5 (0.6%) | 6 (1.3%) |
| $50,000 to $54,999 | 11 (1.3%) | 6 (1.3%) |
| $55,000 to $64,999 | 16 (1.9%) | 28 (6.0%) |
| $65,000 to $74,999 | 58 (6.8%) | 43 (9.1%) |
| $75,000 to $99,999 | 51 (6.0%) | 38 (8.1%) |
| $100,000+ | 537 (63.3%) | 140 (29.8%) |
| Total | 848 (100.0%) | 470 (100.0%) |
Earnings by Sex by Educational Attainment in Clarkson Valley
Average earnings in Clarkson Valley are $185,556 for men and $68,563 for women, a difference of 63.0%. Men with an educational attainment of bachelor's degree enjoy the highest average annual earnings of $188,958, while those with graduate degree education earn the least with $166,042. Women with an educational attainment of bachelor's degree earn the most with the average annual earnings of $86,000, while those with graduate degree education have the smallest earnings of $68,125.
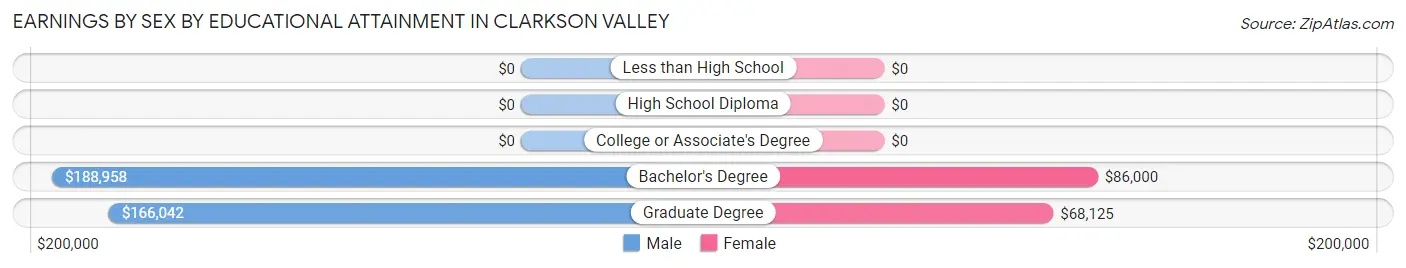
| Educational Attainment | Male Income | Female Income |
| Less than High School | - | - |
| High School Diploma | - | - |
| College or Associate's Degree | - | - |
| Bachelor's Degree | $188,958 | $86,000 |
| Graduate Degree | $166,042 | $68,125 |
| Total | $185,556 | $68,563 |
Family Income in Clarkson Valley
Family Income Brackets in Clarkson Valley
According to the Clarkson Valley family income data, there are 454 families falling into the $200,000+ income range, which is the most common income bracket and makes up 57.5% of all families.
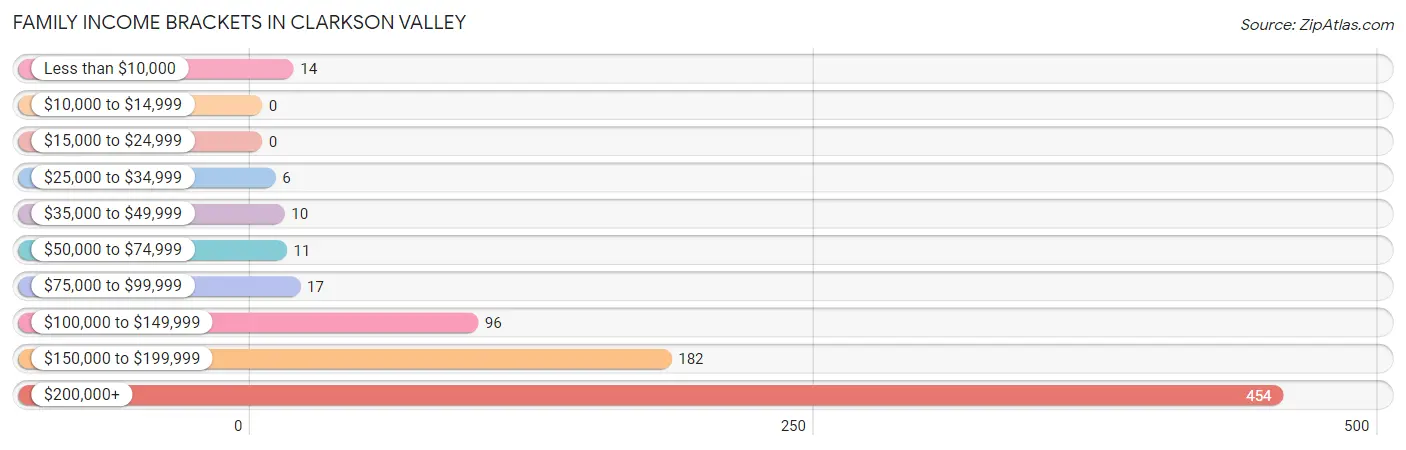
| Income Bracket | # Families | % Families |
| Less than $10,000 | 14 | 1.8% |
| $10,000 to $14,999 | 0 | 0.0% |
| $15,000 to $24,999 | 0 | 0.0% |
| $25,000 to $34,999 | 6 | 0.8% |
| $35,000 to $49,999 | 10 | 1.3% |
| $50,000 to $74,999 | 11 | 1.4% |
| $75,000 to $99,999 | 17 | 2.2% |
| $100,000 to $149,999 | 96 | 12.2% |
| $150,000 to $199,999 | 182 | 23.0% |
| $200,000+ | 454 | 57.5% |
Family Income by Famaliy Size in Clarkson Valley
4-person families (138 | 17.5%) account for the highest median family income in Clarkson Valley with $250,001 per family, while 2-person families (349 | 44.2%) have the highest median income of $97,125 per family member.
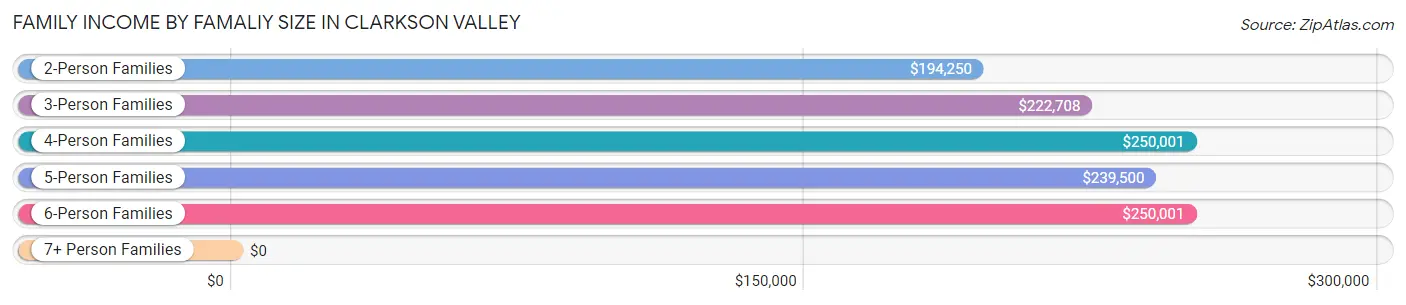
| Income Bracket | # Families | Median Income |
| 2-Person Families | 349 (44.2%) | $194,250 |
| 3-Person Families | 187 (23.7%) | $222,708 |
| 4-Person Families | 138 (17.5%) | $250,001 |
| 5-Person Families | 78 (9.9%) | $239,500 |
| 6-Person Families | 32 (4.1%) | $250,001 |
| 7+ Person Families | 6 (0.8%) | $0 |
| Total | 790 (100.0%) | $230,500 |
Family Income by Number of Earners in Clarkson Valley
The median family income in Clarkson Valley is $230,500, with families comprising 2 earners (389) having the highest median family income of $250,001, while families with no earners (115) have the lowest median family income of $195,972, accounting for 49.2% and 14.6% of families, respectively.
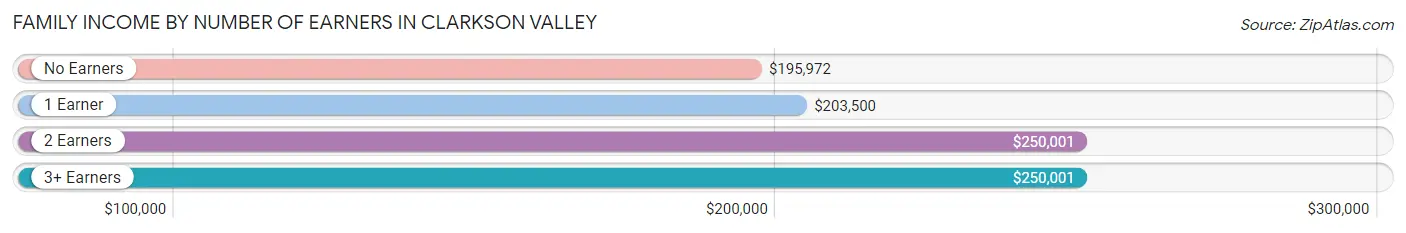
| Number of Earners | # Families | Median Income |
| No Earners | 115 (14.6%) | $195,972 |
| 1 Earner | 216 (27.3%) | $203,500 |
| 2 Earners | 389 (49.2%) | $250,001 |
| 3+ Earners | 70 (8.9%) | $250,001 |
| Total | 790 (100.0%) | $230,500 |
Household Income in Clarkson Valley
Household Income Brackets in Clarkson Valley
With 502 households falling in the category, the $200,000+ income range is the most frequent in Clarkson Valley, accounting for 56.1% of all households.
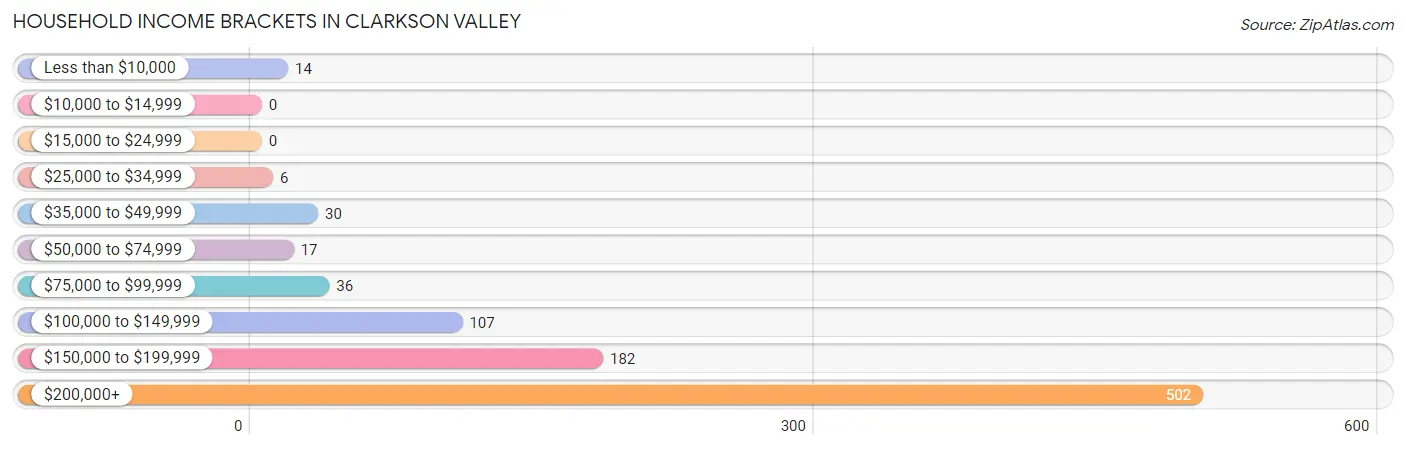
| Income Bracket | # Households | % Households |
| Less than $10,000 | 14 | 1.6% |
| $10,000 to $14,999 | 0 | 0.0% |
| $15,000 to $24,999 | 0 | 0.0% |
| $25,000 to $34,999 | 6 | 0.7% |
| $35,000 to $49,999 | 30 | 3.4% |
| $50,000 to $74,999 | 17 | 1.9% |
| $75,000 to $99,999 | 36 | 4.0% |
| $100,000 to $149,999 | 107 | 12.0% |
| $150,000 to $199,999 | 182 | 20.4% |
| $200,000+ | 502 | 56.2% |
Household Income by Householder Age in Clarkson Valley
The median household income in Clarkson Valley is $218,816, with the highest median household income of $250,001 found in the 45 to 64 years age bracket for the primary householder. A total of 462 households (51.7%) fall into this category.
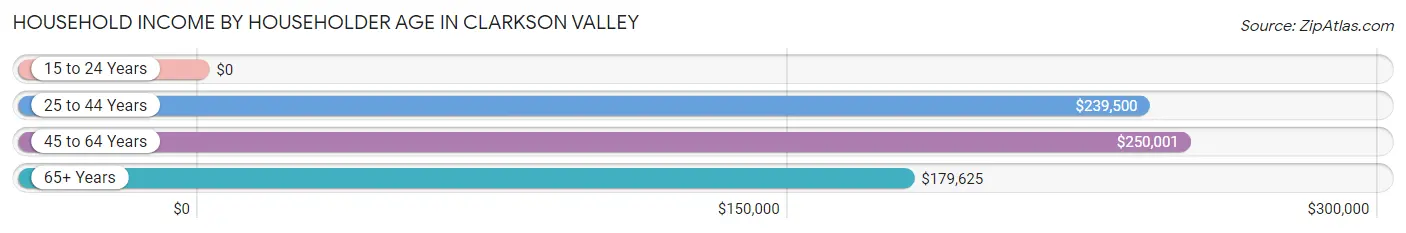
| Income Bracket | # Households | Median Income |
| 15 to 24 Years | 0 (0.0%) | $0 |
| 25 to 44 Years | 116 (13.0%) | $239,500 |
| 45 to 64 Years | 462 (51.7%) | $250,001 |
| 65+ Years | 316 (35.3%) | $179,625 |
| Total | 894 (100.0%) | $218,816 |
Poverty in Clarkson Valley
Income Below Poverty by Sex and Age in Clarkson Valley
With 1.1% poverty level for males and 1.1% for females among the residents of Clarkson Valley, 65 to 74 year old males and 65 to 74 year old females are the most vulnerable to poverty, with 9 males (5.7%) and 9 females (6.6%) in their respective age groups living below the poverty level.
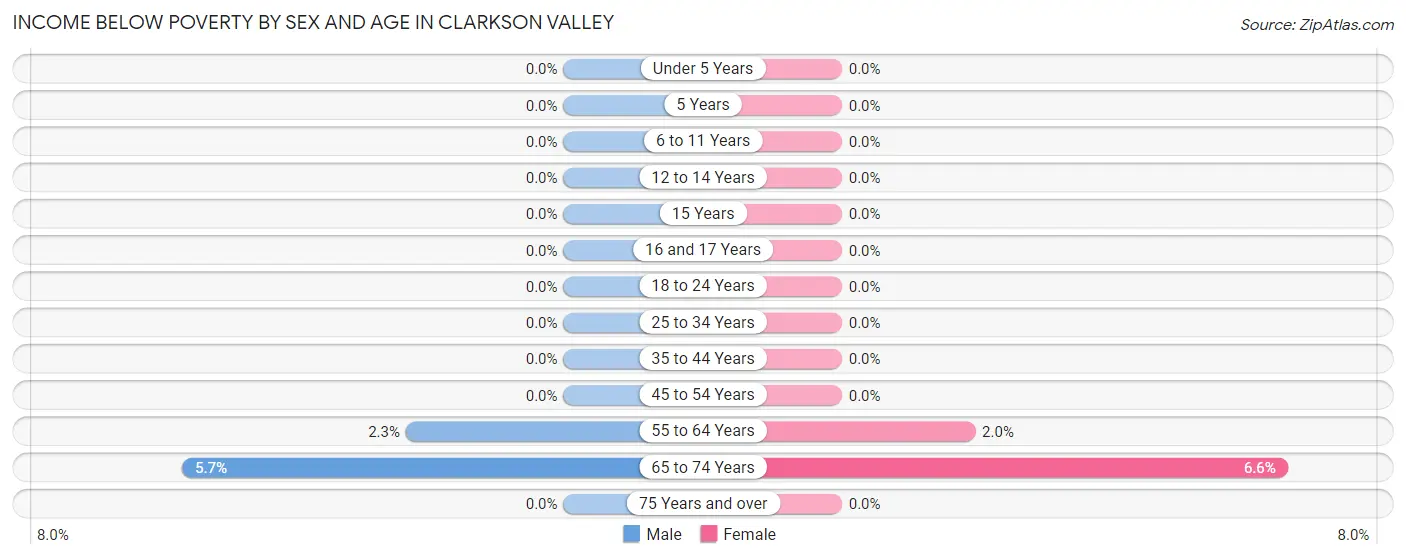
| Age Bracket | Male | Female |
| Under 5 Years | 0 (0.0%) | 0 (0.0%) |
| 5 Years | 0 (0.0%) | 0 (0.0%) |
| 6 to 11 Years | 0 (0.0%) | 0 (0.0%) |
| 12 to 14 Years | 0 (0.0%) | 0 (0.0%) |
| 15 Years | 0 (0.0%) | 0 (0.0%) |
| 16 and 17 Years | 0 (0.0%) | 0 (0.0%) |
| 18 to 24 Years | 0 (0.0%) | 0 (0.0%) |
| 25 to 34 Years | 0 (0.0%) | 0 (0.0%) |
| 35 to 44 Years | 0 (0.0%) | 0 (0.0%) |
| 45 to 54 Years | 0 (0.0%) | 0 (0.0%) |
| 55 to 64 Years | 6 (2.3%) | 5 (2.0%) |
| 65 to 74 Years | 9 (5.7%) | 9 (6.6%) |
| 75 Years and over | 0 (0.0%) | 0 (0.0%) |
| Total | 15 (1.1%) | 14 (1.1%) |
Income Above Poverty by Sex and Age in Clarkson Valley
According to the poverty statistics in Clarkson Valley, males aged under 5 years and females aged under 5 years are the age groups that are most secure financially, with 100.0% of males and 100.0% of females in these age groups living above the poverty line.
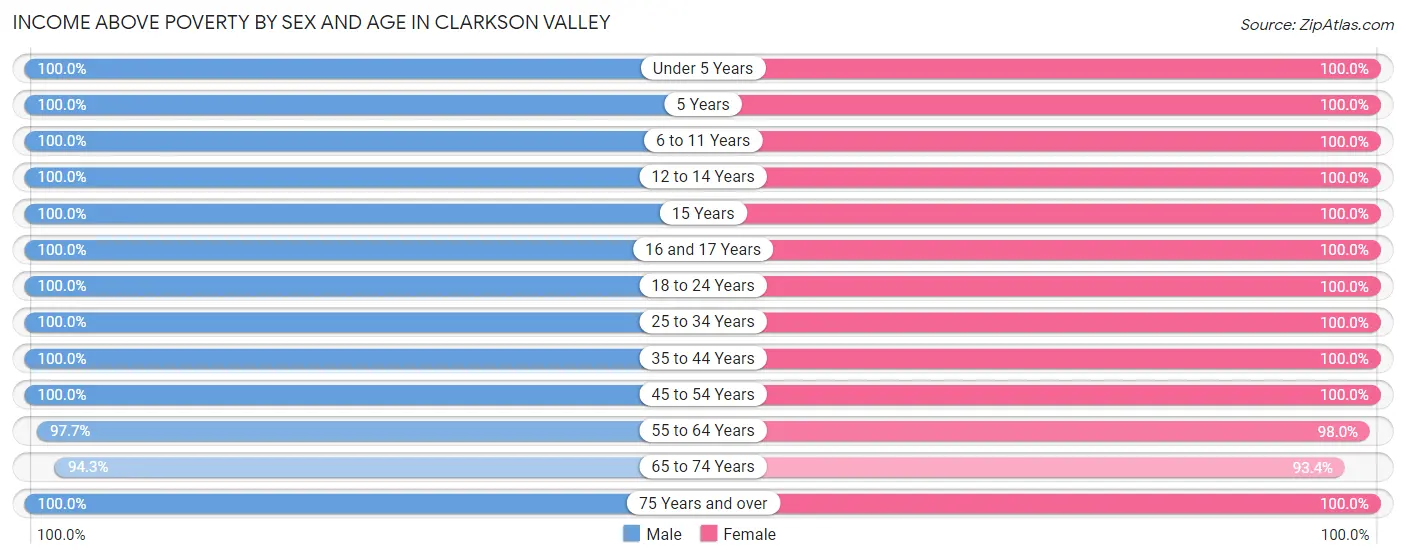
| Age Bracket | Male | Female |
| Under 5 Years | 24 (100.0%) | 30 (100.0%) |
| 5 Years | 22 (100.0%) | 4 (100.0%) |
| 6 to 11 Years | 102 (100.0%) | 96 (100.0%) |
| 12 to 14 Years | 63 (100.0%) | 71 (100.0%) |
| 15 Years | 24 (100.0%) | 26 (100.0%) |
| 16 and 17 Years | 82 (100.0%) | 60 (100.0%) |
| 18 to 24 Years | 164 (100.0%) | 74 (100.0%) |
| 25 to 34 Years | 24 (100.0%) | 32 (100.0%) |
| 35 to 44 Years | 102 (100.0%) | 117 (100.0%) |
| 45 to 54 Years | 207 (100.0%) | 214 (100.0%) |
| 55 to 64 Years | 250 (97.7%) | 248 (98.0%) |
| 65 to 74 Years | 150 (94.3%) | 127 (93.4%) |
| 75 Years and over | 151 (100.0%) | 115 (100.0%) |
| Total | 1,365 (98.9%) | 1,214 (98.9%) |
Income Below Poverty Among Married-Couple Families in Clarkson Valley
The poverty statistics for married-couple families in Clarkson Valley show that 1.8% or 14 of the total 770 families live below the poverty line. Families with no children have the highest poverty rate of 3.1%, comprising of 14 families. On the other hand, families with 1 or 2 children have the lowest poverty rate of 0.0%, which includes 0 families.
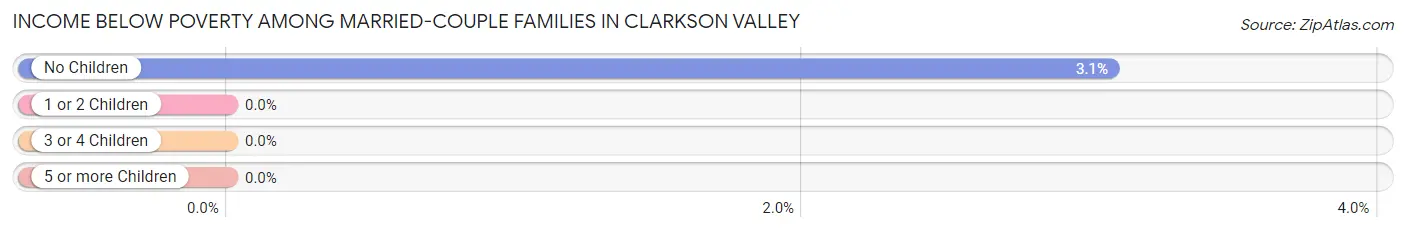
| Children | Above Poverty | Below Poverty |
| No Children | 442 (96.9%) | 14 (3.1%) |
| 1 or 2 Children | 232 (100.0%) | 0 (0.0%) |
| 3 or 4 Children | 82 (100.0%) | 0 (0.0%) |
| 5 or more Children | 0 (0.0%) | 0 (0.0%) |
| Total | 756 (98.2%) | 14 (1.8%) |
Income Below Poverty Among Single-Parent Households in Clarkson Valley
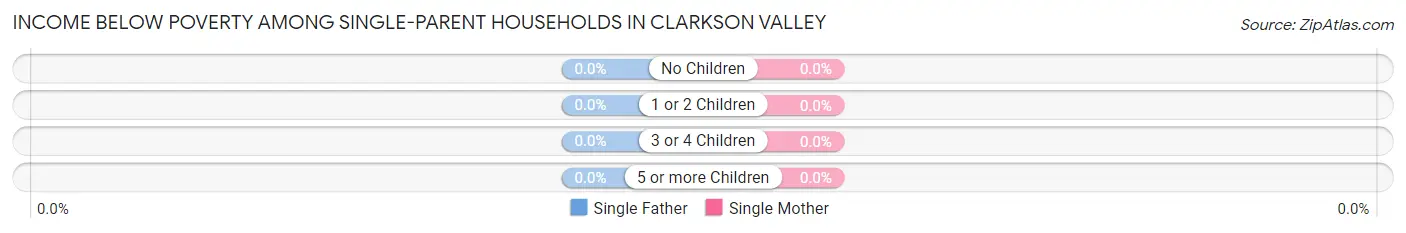
| Children | Single Father | Single Mother |
| No Children | 0 (0.0%) | 0 (0.0%) |
| 1 or 2 Children | 0 (0.0%) | 0 (0.0%) |
| 3 or 4 Children | 0 (0.0%) | 0 (0.0%) |
| 5 or more Children | 0 (0.0%) | 0 (0.0%) |
| Total | 0 (0.0%) | 0 (0.0%) |
Income Below Poverty Among Married-Couple vs Single-Parent Households in Clarkson Valley
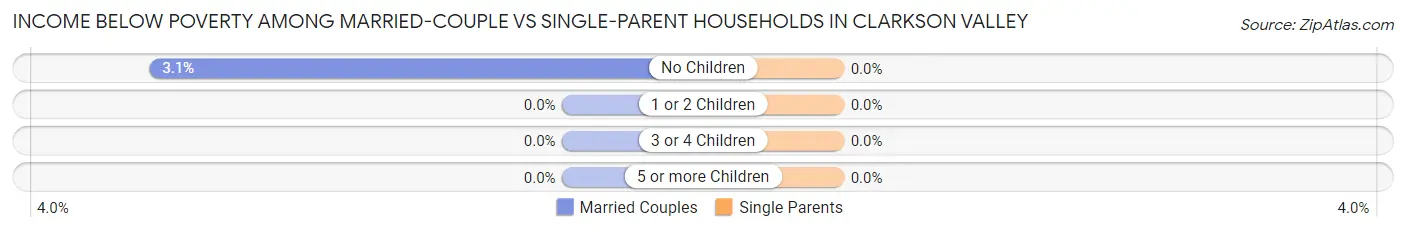
| Children | Married-Couple Families | Single-Parent Households |
| No Children | 14 (3.1%) | 0 (0.0%) |
| 1 or 2 Children | 0 (0.0%) | 0 (0.0%) |
| 3 or 4 Children | 0 (0.0%) | 0 (0.0%) |
| 5 or more Children | 0 (0.0%) | 0 (0.0%) |
| Total | 14 (1.8%) | 0 (0.0%) |
Race in Clarkson Valley
The most populous races in Clarkson Valley are White / Caucasian (2,219 | 85.1%), Two or more Races (233 | 8.9%), and Hispanic or Latino (136 | 5.2%).
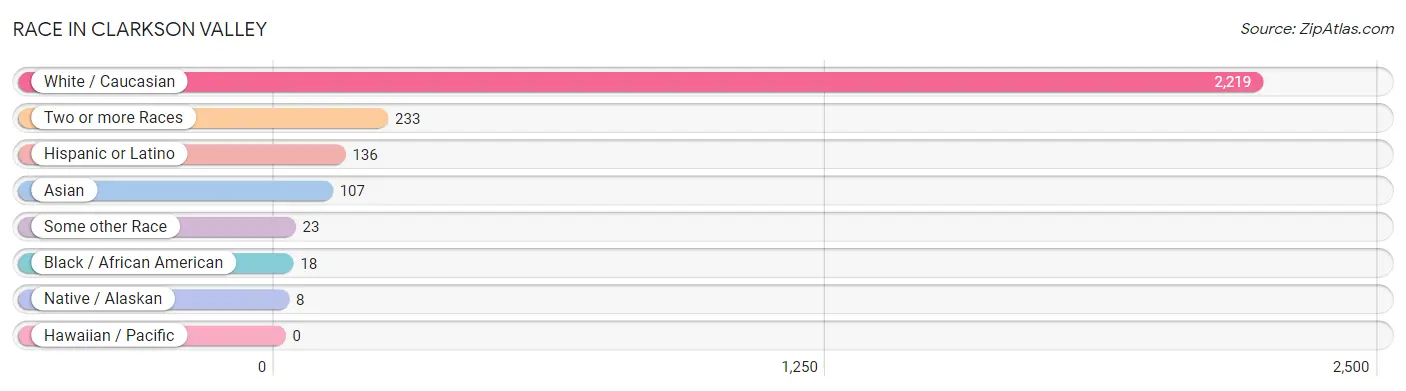
| Race | # Population | % Population |
| Asian | 107 | 4.1% |
| Black / African American | 18 | 0.7% |
| Hawaiian / Pacific | 0 | 0.0% |
| Hispanic or Latino | 136 | 5.2% |
| Native / Alaskan | 8 | 0.3% |
| White / Caucasian | 2,219 | 85.1% |
| Two or more Races | 233 | 8.9% |
| Some other Race | 23 | 0.9% |
| Total | 2,608 | 100.0% |
Ancestry in Clarkson Valley
The most populous ancestries reported in Clarkson Valley are German (764 | 29.3%), English (460 | 17.6%), Irish (454 | 17.4%), Italian (347 | 13.3%), and American (115 | 4.4%), together accounting for 82.1% of all Clarkson Valley residents.
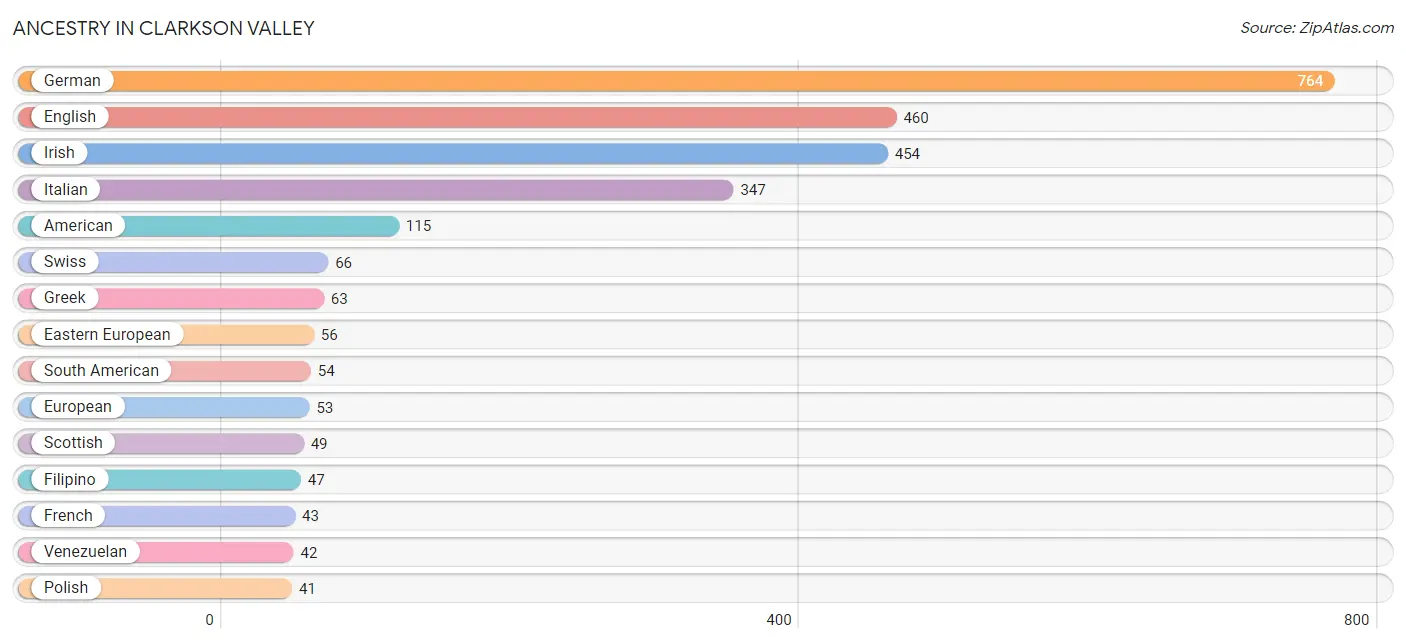
| Ancestry | # Population | % Population |
| American | 115 | 4.4% |
| Arab | 6 | 0.2% |
| Australian | 10 | 0.4% |
| Austrian | 37 | 1.4% |
| Belgian | 11 | 0.4% |
| Bhutanese | 36 | 1.4% |
| British | 23 | 0.9% |
| Burmese | 20 | 0.8% |
| Canadian | 5 | 0.2% |
| Central American | 38 | 1.5% |
| Central American Indian | 8 | 0.3% |
| Colombian | 12 | 0.5% |
| Croatian | 6 | 0.2% |
| Cuban | 21 | 0.8% |
| Czech | 15 | 0.6% |
| Dutch | 14 | 0.5% |
| Eastern European | 56 | 2.1% |
| English | 460 | 17.6% |
| European | 53 | 2.0% |
| Filipino | 47 | 1.8% |
| French | 43 | 1.7% |
| French Canadian | 16 | 0.6% |
| German | 764 | 29.3% |
| Greek | 63 | 2.4% |
| Guatemalan | 24 | 0.9% |
| Hungarian | 37 | 1.4% |
| Irish | 454 | 17.4% |
| Italian | 347 | 13.3% |
| Korean | 20 | 0.8% |
| Lebanese | 6 | 0.2% |
| Nicaraguan | 14 | 0.5% |
| Northern European | 13 | 0.5% |
| Norwegian | 27 | 1.0% |
| Polish | 41 | 1.6% |
| Romanian | 1 | 0.0% |
| Russian | 23 | 0.9% |
| Scotch-Irish | 11 | 0.4% |
| Scottish | 49 | 1.9% |
| Slavic | 9 | 0.4% |
| South African | 28 | 1.1% |
| South American | 54 | 2.1% |
| Spaniard | 13 | 0.5% |
| Spanish | 10 | 0.4% |
| Subsaharan African | 28 | 1.1% |
| Swedish | 5 | 0.2% |
| Swiss | 66 | 2.5% |
| Thai | 32 | 1.2% |
| Ukrainian | 33 | 1.3% |
| Venezuelan | 42 | 1.6% |
| Welsh | 8 | 0.3% | View All 50 Rows |
Immigrants in Clarkson Valley
The most numerous immigrant groups reported in Clarkson Valley came from Europe (70 | 2.7%), Latin America (64 | 2.5%), Asia (60 | 2.3%), South America (35 | 1.3%), and India (32 | 1.2%), together accounting for 10.0% of all Clarkson Valley residents.
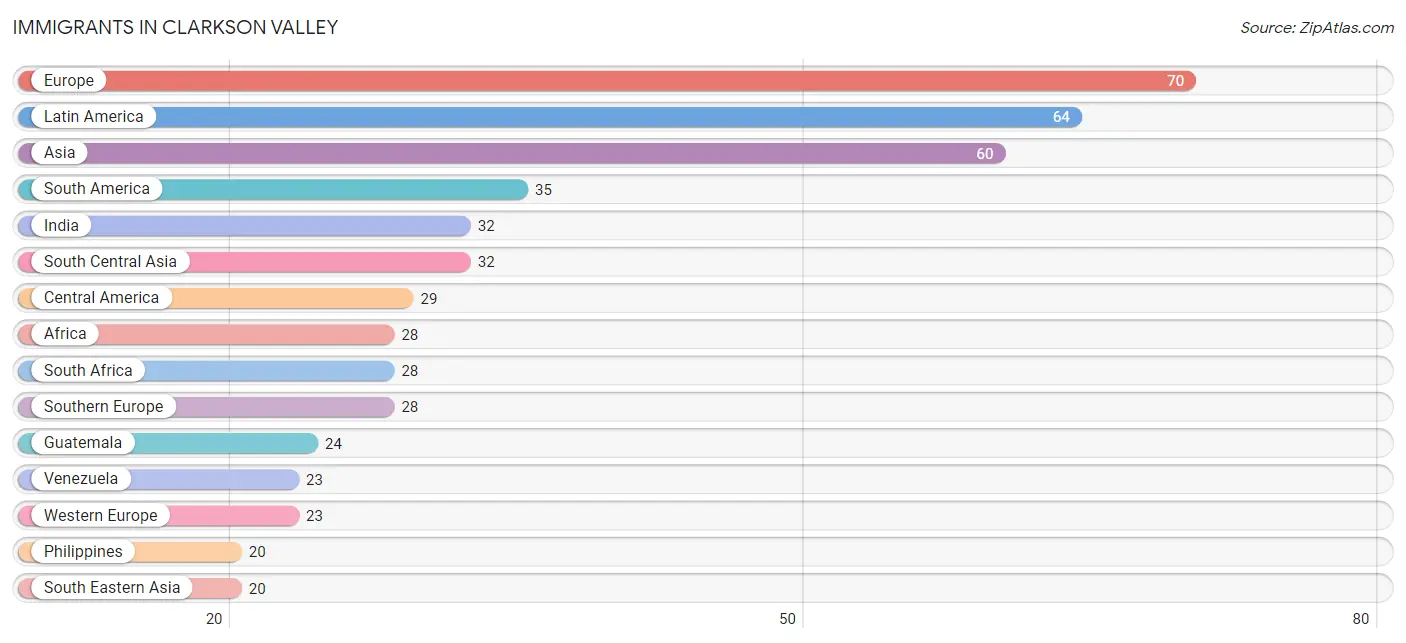
| Immigration Origin | # Population | % Population |
| Africa | 28 | 1.1% |
| Asia | 60 | 2.3% |
| Australia | 10 | 0.4% |
| Belgium | 6 | 0.2% |
| Canada | 7 | 0.3% |
| Central America | 29 | 1.1% |
| China | 8 | 0.3% |
| Colombia | 12 | 0.5% |
| Eastern Asia | 8 | 0.3% |
| Europe | 70 | 2.7% |
| Germany | 12 | 0.5% |
| Greece | 5 | 0.2% |
| Guatemala | 24 | 0.9% |
| India | 32 | 1.2% |
| Italy | 16 | 0.6% |
| Latin America | 64 | 2.5% |
| Netherlands | 5 | 0.2% |
| Nicaragua | 5 | 0.2% |
| Northern Europe | 19 | 0.7% |
| Oceania | 10 | 0.4% |
| Philippines | 20 | 0.8% |
| South Africa | 28 | 1.1% |
| South America | 35 | 1.3% |
| South Central Asia | 32 | 1.2% |
| South Eastern Asia | 20 | 0.8% |
| Southern Europe | 28 | 1.1% |
| Spain | 7 | 0.3% |
| Taiwan | 8 | 0.3% |
| Venezuela | 23 | 0.9% |
| Western Europe | 23 | 0.9% | View All 30 Rows |
Sex and Age in Clarkson Valley
Sex and Age in Clarkson Valley
The most populous age groups in Clarkson Valley are 55 to 59 Years (181 | 13.1%) for men and 55 to 59 Years (176 | 14.3%) for women.
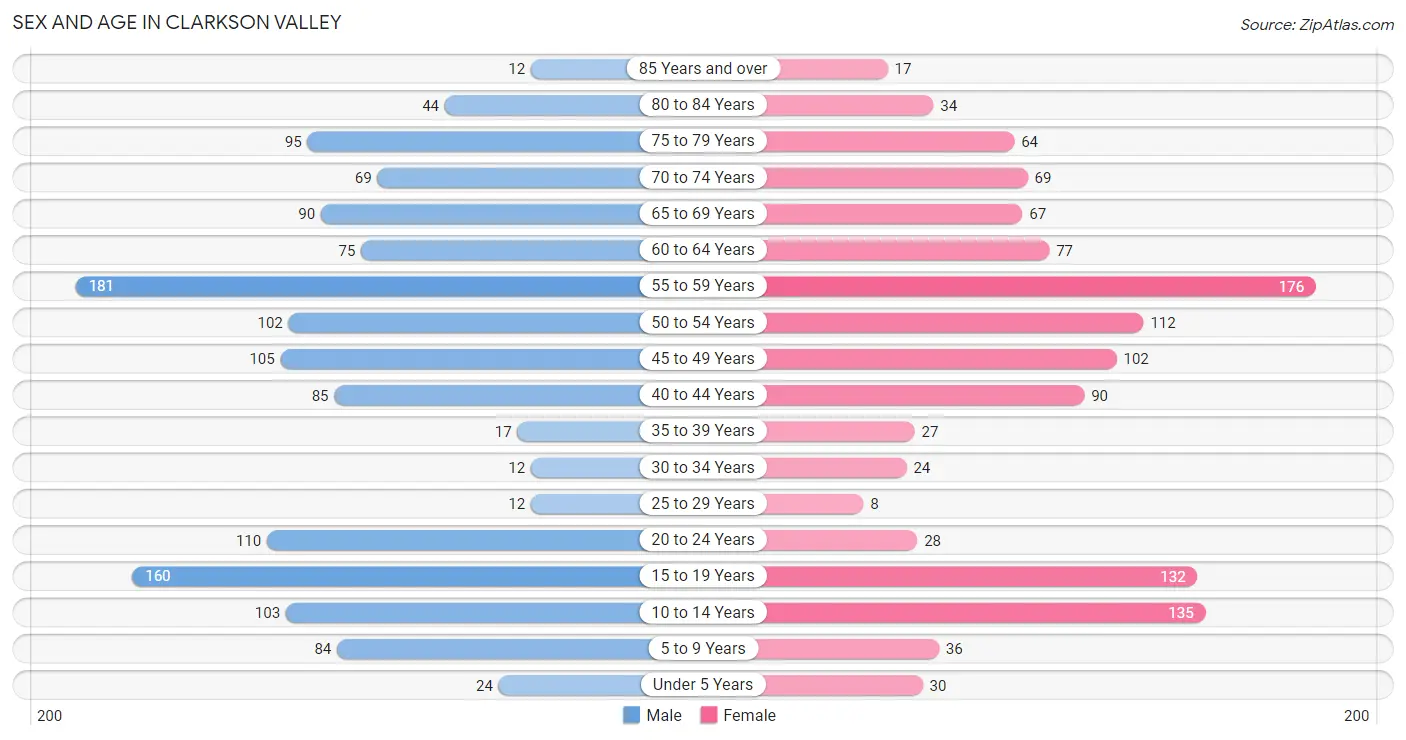
| Age Bracket | Male | Female |
| Under 5 Years | 24 (1.7%) | 30 (2.4%) |
| 5 to 9 Years | 84 (6.1%) | 36 (2.9%) |
| 10 to 14 Years | 103 (7.5%) | 135 (11.0%) |
| 15 to 19 Years | 160 (11.6%) | 132 (10.7%) |
| 20 to 24 Years | 110 (8.0%) | 28 (2.3%) |
| 25 to 29 Years | 12 (0.9%) | 8 (0.6%) |
| 30 to 34 Years | 12 (0.9%) | 24 (1.9%) |
| 35 to 39 Years | 17 (1.2%) | 27 (2.2%) |
| 40 to 44 Years | 85 (6.2%) | 90 (7.3%) |
| 45 to 49 Years | 105 (7.6%) | 102 (8.3%) |
| 50 to 54 Years | 102 (7.4%) | 112 (9.1%) |
| 55 to 59 Years | 181 (13.1%) | 176 (14.3%) |
| 60 to 64 Years | 75 (5.4%) | 77 (6.3%) |
| 65 to 69 Years | 90 (6.5%) | 67 (5.5%) |
| 70 to 74 Years | 69 (5.0%) | 69 (5.6%) |
| 75 to 79 Years | 95 (6.9%) | 64 (5.2%) |
| 80 to 84 Years | 44 (3.2%) | 34 (2.8%) |
| 85 Years and over | 12 (0.9%) | 17 (1.4%) |
| Total | 1,380 (100.0%) | 1,228 (100.0%) |
Families and Households in Clarkson Valley
Median Family Size in Clarkson Valley
The median family size in Clarkson Valley is 3.16 persons per family, with single male/father families (8 | 1.0%) accounting for the largest median family size of 3.63 persons per family. On the other hand, single female/mother families (12 | 1.5%) represent the smallest median family size with 2.92 persons per family.
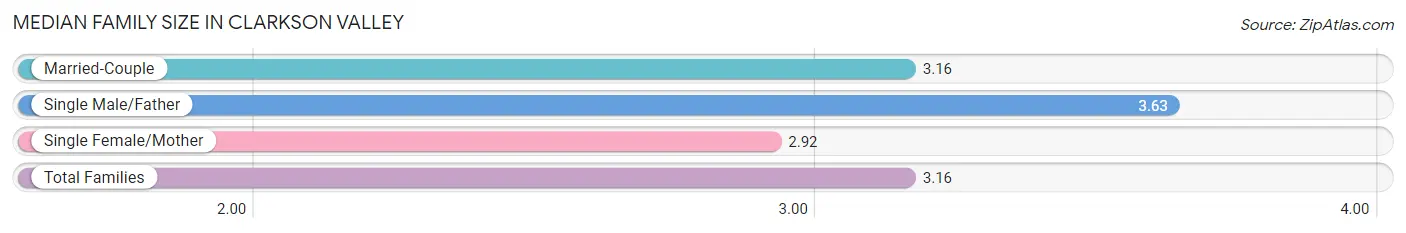
| Family Type | # Families | Family Size |
| Married-Couple | 770 (97.5%) | 3.16 |
| Single Male/Father | 8 (1.0%) | 3.63 |
| Single Female/Mother | 12 (1.5%) | 2.92 |
| Total Families | 790 (100.0%) | 3.16 |
Median Household Size in Clarkson Valley
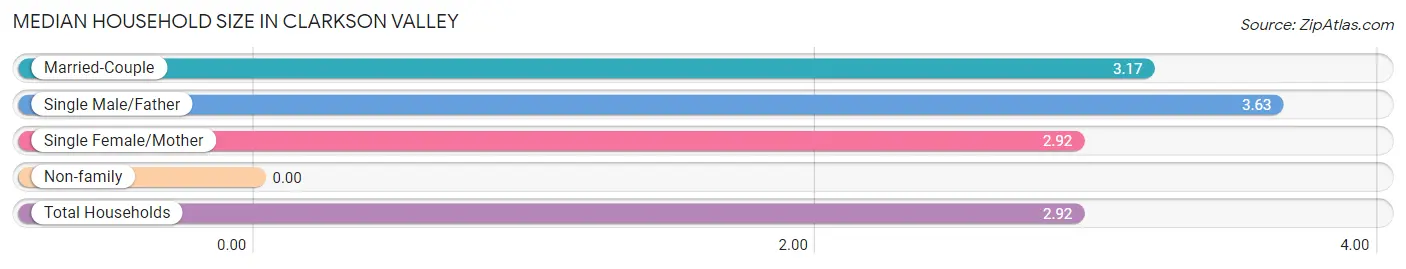
| Household Type | # Households | Household Size |
| Married-Couple | 770 (86.1%) | 3.17 |
| Single Male/Father | 8 (0.9%) | 3.63 |
| Single Female/Mother | 12 (1.3%) | 2.92 |
| Non-family | 104 (11.6%) | - |
| Total Households | 894 (100.0%) | 2.92 |
Household Size by Marriage Status in Clarkson Valley
Out of a total of 894 households in Clarkson Valley, 790 (88.4%) are family households, while 104 (11.6%) are nonfamily households. The most numerous type of family households are 2-person households, comprising 349, and the most common type of nonfamily households are 1-person households, comprising 104.
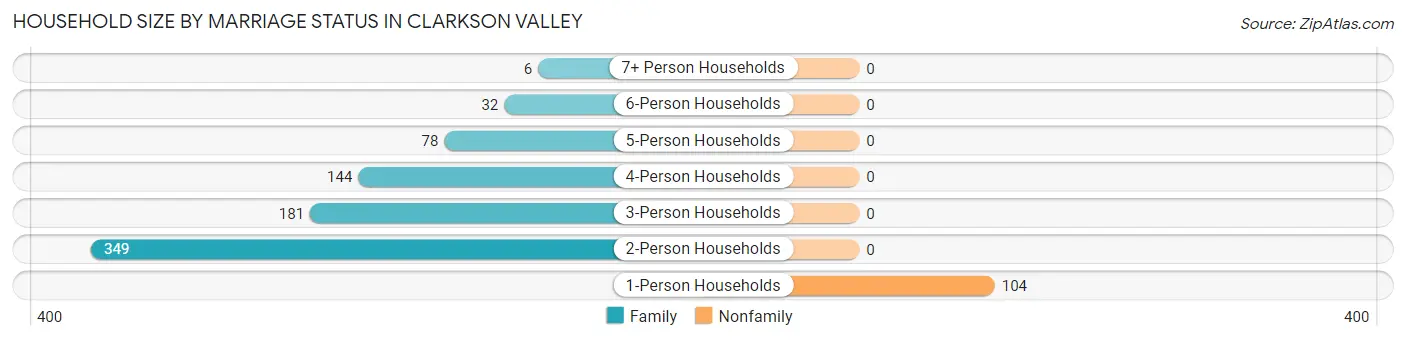
| Household Size | Family Households | Nonfamily Households |
| 1-Person Households | - | 104 (11.6%) |
| 2-Person Households | 349 (39.0%) | 0 (0.0%) |
| 3-Person Households | 181 (20.3%) | 0 (0.0%) |
| 4-Person Households | 144 (16.1%) | 0 (0.0%) |
| 5-Person Households | 78 (8.7%) | 0 (0.0%) |
| 6-Person Households | 32 (3.6%) | 0 (0.0%) |
| 7+ Person Households | 6 (0.7%) | 0 (0.0%) |
| Total | 790 (88.4%) | 104 (11.6%) |
Female Fertility in Clarkson Valley
Fertility by Age in Clarkson Valley
Average fertility rate in Clarkson Valley is 35.0 births per 1,000 women. Women in the age bracket of 20 to 34 years have the highest fertility rate with 100.0 births per 1,000 women. Women in the age bracket of 35 to 50 years acount for 62.5% of all women with births.
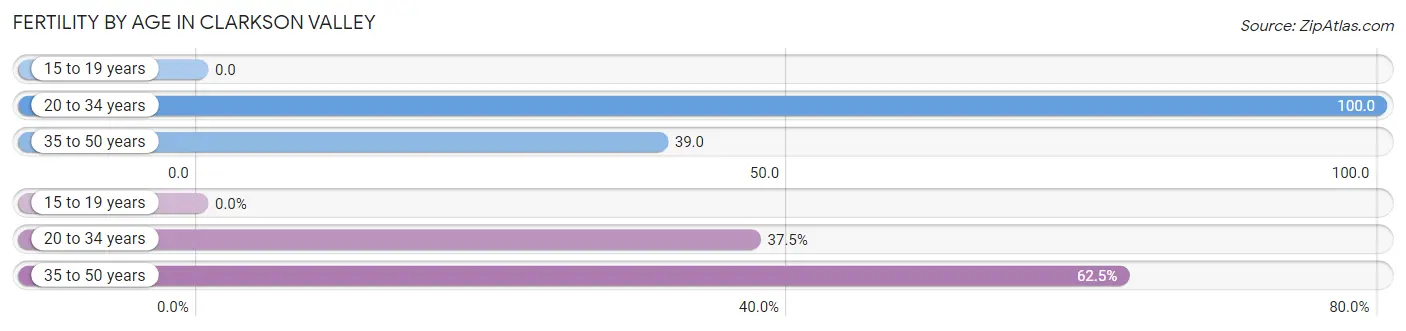
| Age Bracket | Women with Births | Births / 1,000 Women |
| 15 to 19 years | 0 (0.0%) | 0.0 |
| 20 to 34 years | 6 (37.5%) | 100.0 |
| 35 to 50 years | 10 (62.5%) | 39.0 |
| Total | 16 (100.0%) | 35.0 |
Fertility by Age by Marriage Status in Clarkson Valley
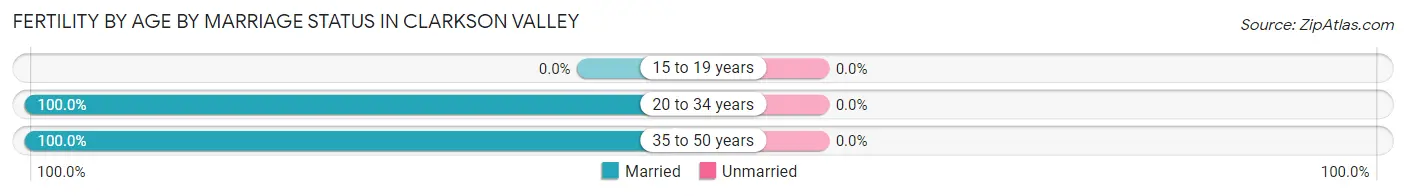
| Age Bracket | Married | Unmarried |
| 15 to 19 years | 0 (0.0%) | 0 (0.0%) |
| 20 to 34 years | 6 (100.0%) | 0 (0.0%) |
| 35 to 50 years | 10 (100.0%) | 0 (0.0%) |
| Total | 16 (100.0%) | 0 (0.0%) |
Fertility by Education in Clarkson Valley
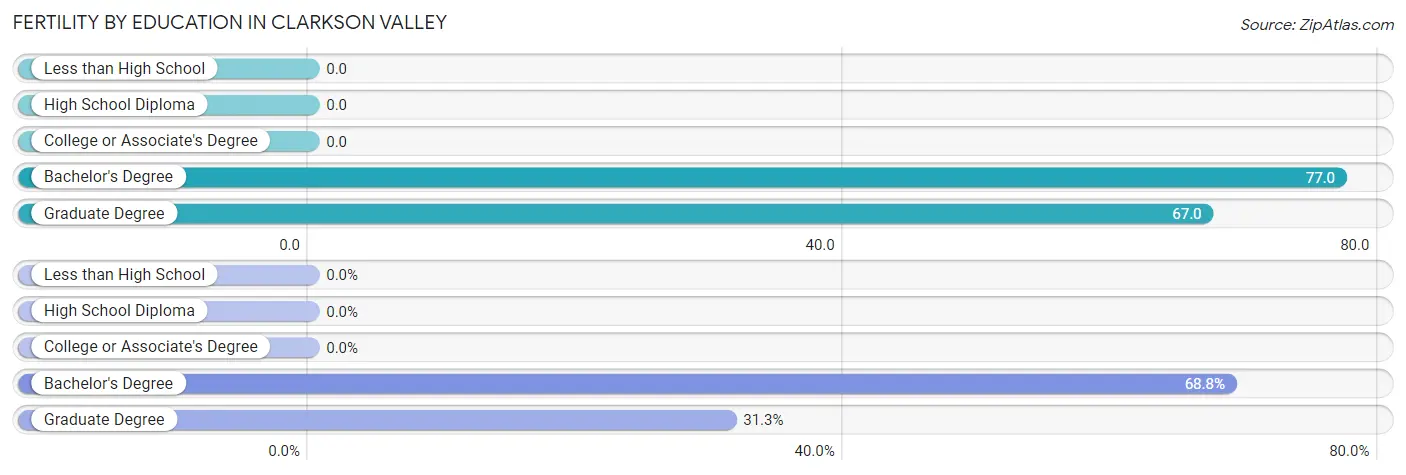
| Educational Attainment | Women with Births | Births / 1,000 Women |
| Less than High School | 0 (0.0%) | 0.0 |
| High School Diploma | 0 (0.0%) | 0.0 |
| College or Associate's Degree | 0 (0.0%) | 0.0 |
| Bachelor's Degree | 11 (68.8%) | 77.0 |
| Graduate Degree | 5 (31.2%) | 67.0 |
| Total | 16 (100.0%) | 35.0 |
Fertility by Education by Marriage Status in Clarkson Valley
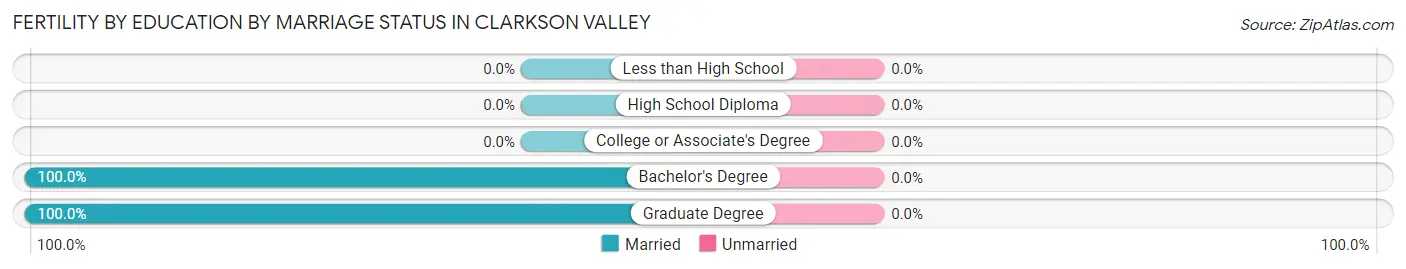
| Educational Attainment | Married | Unmarried |
| Less than High School | 0 (0.0%) | 0 (0.0%) |
| High School Diploma | 0 (0.0%) | 0 (0.0%) |
| College or Associate's Degree | 0 (0.0%) | 0 (0.0%) |
| Bachelor's Degree | 11 (100.0%) | 0 (0.0%) |
| Graduate Degree | 5 (100.0%) | 0 (0.0%) |
| Total | 16 (100.0%) | 0 (0.0%) |
Employment Characteristics in Clarkson Valley
Employment by Class of Employer in Clarkson Valley
Among the 1,096 employed individuals in Clarkson Valley, private company employees (791 | 72.2%), self-employed (incorporated) (101 | 9.2%), and not-for-profit organizations (62 | 5.7%) make up the most common classes of employment.
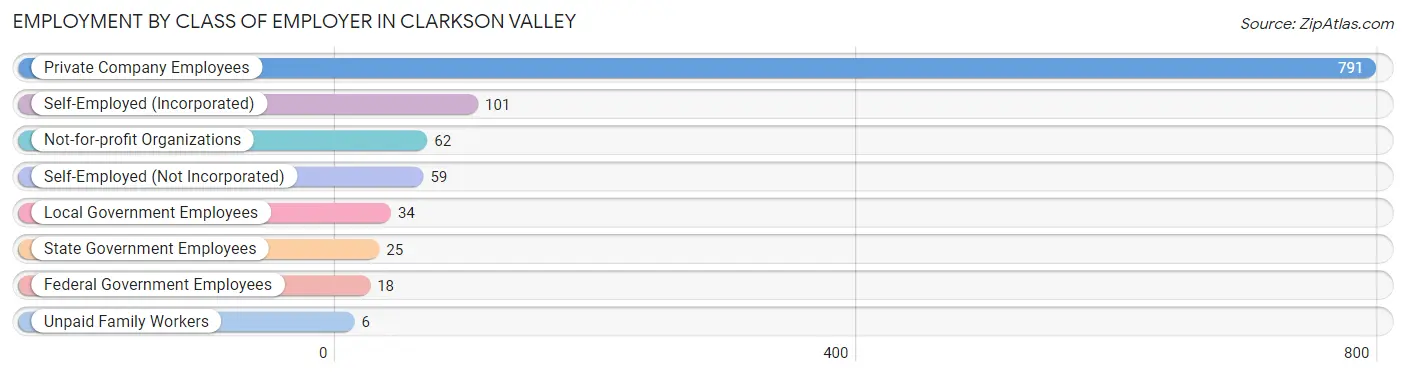
| Employer Class | # Employees | % Employees |
| Private Company Employees | 791 | 72.2% |
| Self-Employed (Incorporated) | 101 | 9.2% |
| Self-Employed (Not Incorporated) | 59 | 5.4% |
| Not-for-profit Organizations | 62 | 5.7% |
| Local Government Employees | 34 | 3.1% |
| State Government Employees | 25 | 2.3% |
| Federal Government Employees | 18 | 1.6% |
| Unpaid Family Workers | 6 | 0.5% |
| Total | 1,096 | 100.0% |
Employment Status by Age in Clarkson Valley
According to the labor force statistics for Clarkson Valley, out of the total population over 16 years of age (2,146), 53.8% or 1,155 individuals are in the labor force, with 2.0% or 23 of them unemployed. The age group with the highest labor force participation rate is 30 to 34 years, with 83.3% or 30 individuals in the labor force. Within the labor force, the 16 to 19 years age range has the highest percentage of unemployed individuals, with 9.4% or 6 of them being unemployed.
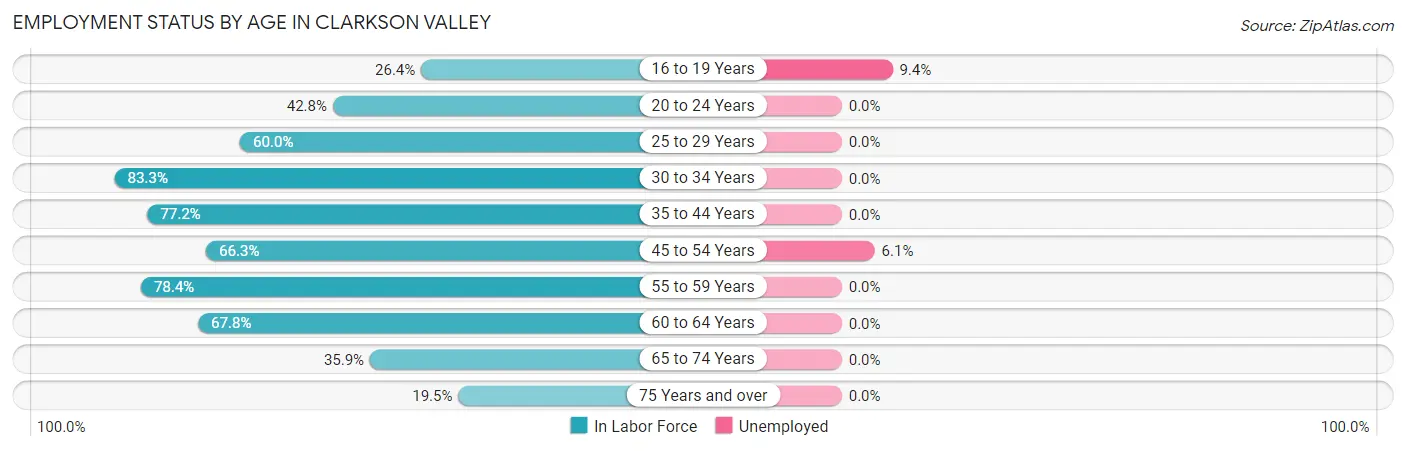
| Age Bracket | In Labor Force | Unemployed |
| 16 to 19 Years | 64 (26.4%) | 6 (9.4%) |
| 20 to 24 Years | 59 (42.8%) | 0 (0.0%) |
| 25 to 29 Years | 12 (60.0%) | 0 (0.0%) |
| 30 to 34 Years | 30 (83.3%) | 0 (0.0%) |
| 35 to 44 Years | 169 (77.2%) | 0 (0.0%) |
| 45 to 54 Years | 279 (66.3%) | 17 (6.1%) |
| 55 to 59 Years | 280 (78.4%) | 0 (0.0%) |
| 60 to 64 Years | 103 (67.8%) | 0 (0.0%) |
| 65 to 74 Years | 106 (35.9%) | 0 (0.0%) |
| 75 Years and over | 52 (19.5%) | 0 (0.0%) |
| Total | 1,155 (53.8%) | 23 (2.0%) |
Employment Status by Educational Attainment in Clarkson Valley
According to labor force statistics for Clarkson Valley, 72.4% of individuals (872) out of the total population between 25 and 64 years of age (1,205) are in the labor force, with 1.9% or 17 of them being unemployed. The group with the highest labor force participation rate are those with the educational attainment of bachelor's degree or higher, with 78.8% or 748 individuals in the labor force. Within the labor force, individuals with college / associate degree education have the highest percentage of unemployment, with 4.2% or 5 of them being unemployed.
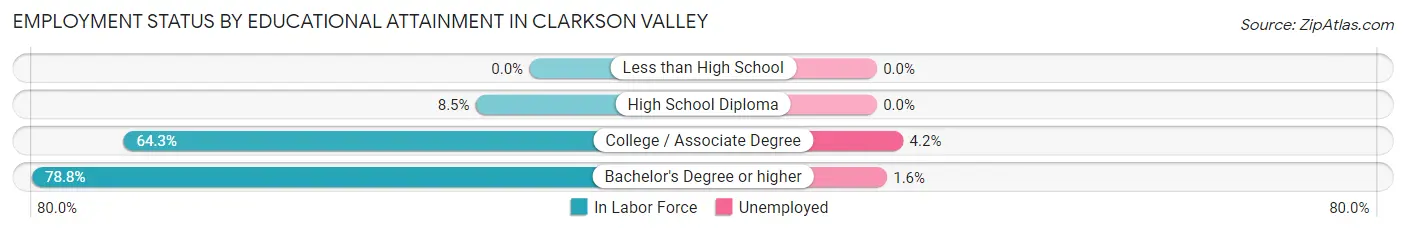
| Educational Attainment | In Labor Force | Unemployed |
| Less than High School | 0 (0.0%) | 0 (0.0%) |
| High School Diploma | 6 (8.5%) | 0 (0.0%) |
| College / Associate Degree | 119 (64.3%) | 8 (4.2%) |
| Bachelor's Degree or higher | 748 (78.8%) | 15 (1.6%) |
| Total | 872 (72.4%) | 23 (1.9%) |
Employment Occupations by Sex in Clarkson Valley
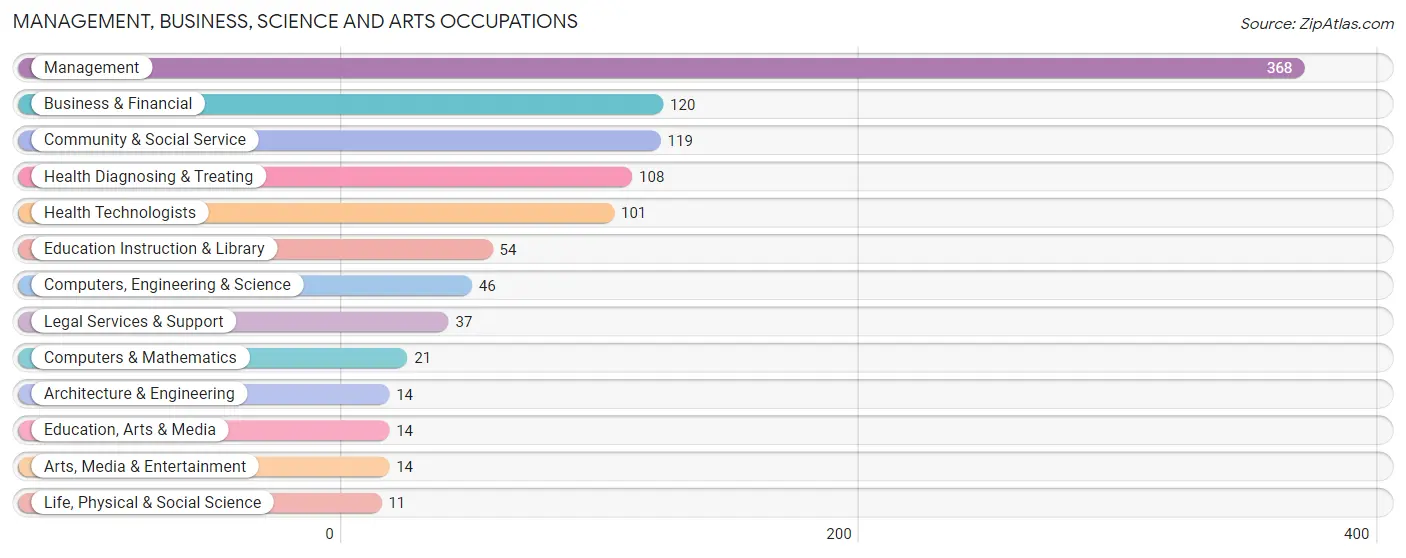
Management, Business, Science and Arts Occupations
The most common Management, Business, Science and Arts occupations in Clarkson Valley are Management (368 | 32.5%), Business & Financial (120 | 10.6%), Community & Social Service (119 | 10.5%), Health Diagnosing & Treating (108 | 9.6%), and Health Technologists (101 | 8.9%).
Management, Business, Science and Arts Occupations by Sex
Within the Management, Business, Science and Arts occupations in Clarkson Valley, the most male-oriented occupations are Architecture & Engineering (100.0%), Education, Arts & Media (100.0%), and Computers & Mathematics (85.7%), while the most female-oriented occupations are Life, Physical & Social Science (100.0%), Arts, Media & Entertainment (100.0%), and Education Instruction & Library (53.7%).
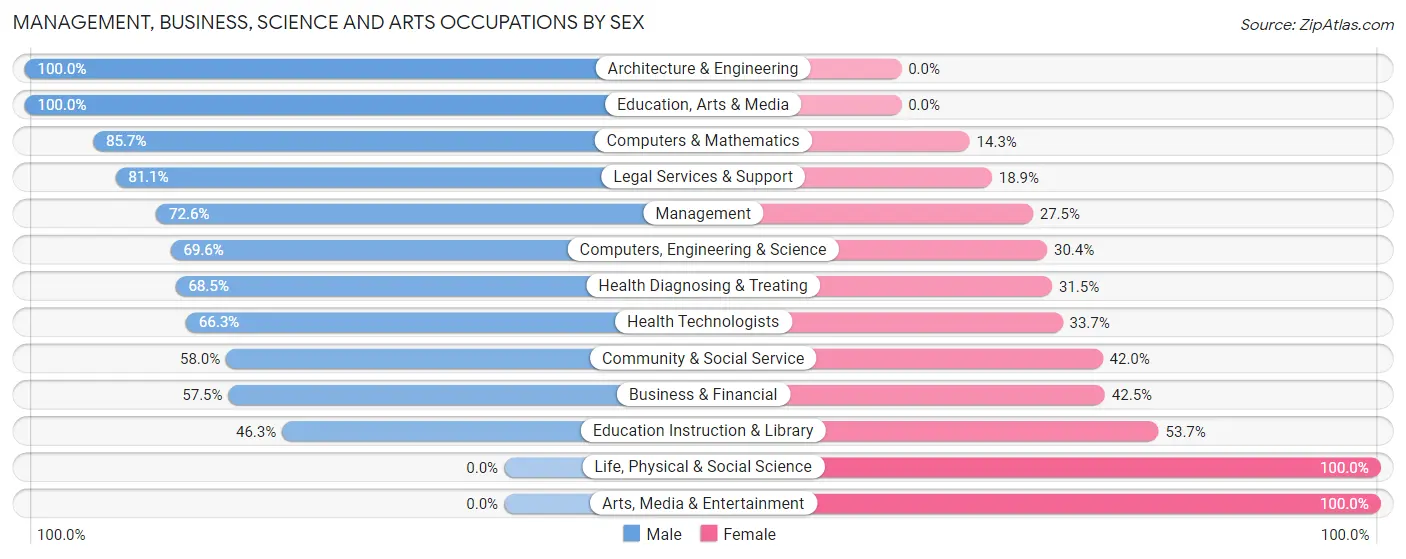
| Occupation | Male | Female |
| Management | 267 (72.6%) | 101 (27.5%) |
| Business & Financial | 69 (57.5%) | 51 (42.5%) |
| Computers, Engineering & Science | 32 (69.6%) | 14 (30.4%) |
| Computers & Mathematics | 18 (85.7%) | 3 (14.3%) |
| Architecture & Engineering | 14 (100.0%) | 0 (0.0%) |
| Life, Physical & Social Science | 0 (0.0%) | 11 (100.0%) |
| Community & Social Service | 69 (58.0%) | 50 (42.0%) |
| Education, Arts & Media | 14 (100.0%) | 0 (0.0%) |
| Legal Services & Support | 30 (81.1%) | 7 (18.9%) |
| Education Instruction & Library | 25 (46.3%) | 29 (53.7%) |
| Arts, Media & Entertainment | 0 (0.0%) | 14 (100.0%) |
| Health Diagnosing & Treating | 74 (68.5%) | 34 (31.5%) |
| Health Technologists | 67 (66.3%) | 34 (33.7%) |
| Total (Category) | 511 (67.1%) | 250 (32.9%) |
| Total (Overall) | 771 (68.2%) | 360 (31.8%) |
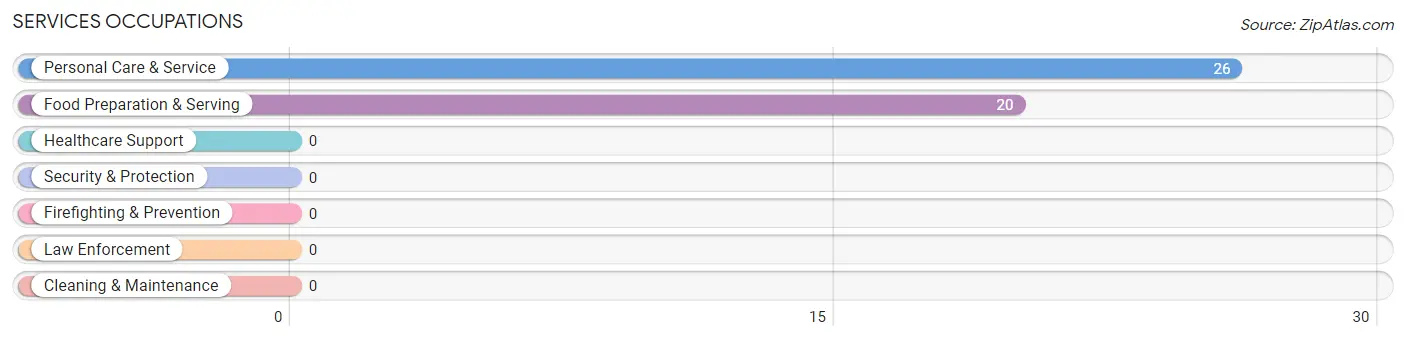
Services Occupations
The most common Services occupations in Clarkson Valley are Personal Care & Service (26 | 2.3%), and Food Preparation & Serving (20 | 1.8%).
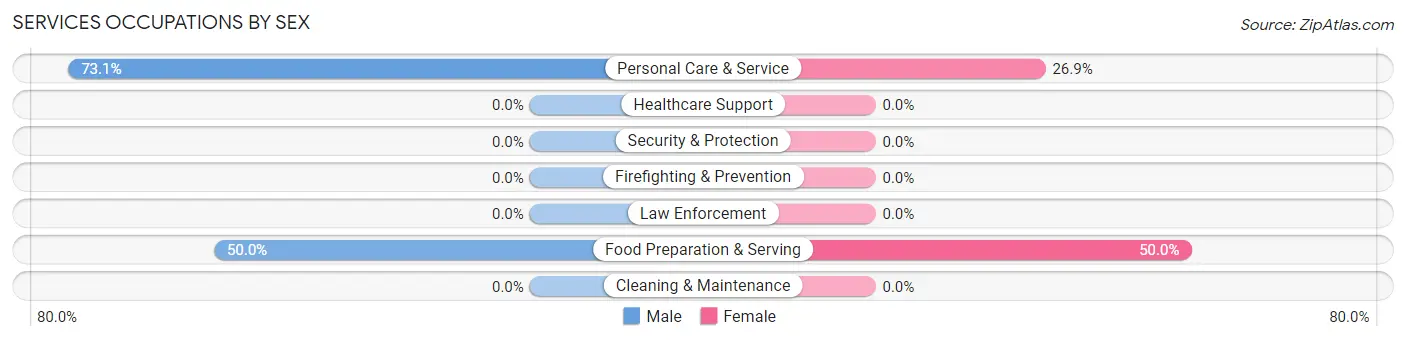
Services Occupations by Sex
Within the Services occupations in Clarkson Valley, the most male-oriented occupations are Personal Care & Service (73.1%), and Food Preparation & Serving (50.0%), while the most female-oriented occupations are Food Preparation & Serving (50.0%), and Personal Care & Service (26.9%).
| Occupation | Male | Female |
| Healthcare Support | 0 (0.0%) | 0 (0.0%) |
| Security & Protection | 0 (0.0%) | 0 (0.0%) |
| Firefighting & Prevention | 0 (0.0%) | 0 (0.0%) |
| Law Enforcement | 0 (0.0%) | 0 (0.0%) |
| Food Preparation & Serving | 10 (50.0%) | 10 (50.0%) |
| Cleaning & Maintenance | 0 (0.0%) | 0 (0.0%) |
| Personal Care & Service | 19 (73.1%) | 7 (26.9%) |
| Total (Category) | 29 (63.0%) | 17 (37.0%) |
| Total (Overall) | 771 (68.2%) | 360 (31.8%) |
Sales and Office Occupations
The most common Sales and Office occupations in Clarkson Valley are Sales & Related (208 | 18.4%), and Office & Administration (49 | 4.3%).
Sales and Office Occupations by Sex
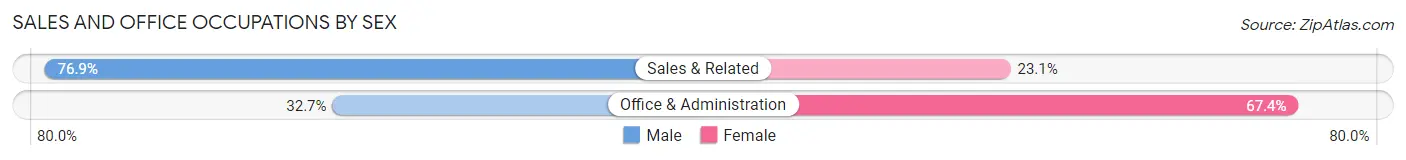
| Occupation | Male | Female |
| Sales & Related | 160 (76.9%) | 48 (23.1%) |
| Office & Administration | 16 (32.7%) | 33 (67.3%) |
| Total (Category) | 176 (68.5%) | 81 (31.5%) |
| Total (Overall) | 771 (68.2%) | 360 (31.8%) |
Natural Resources, Construction and Maintenance Occupations
The most common Natural Resources, Construction and Maintenance occupations in Clarkson Valley are Installation, Maintenance & Repair (6 | 0.5%), and Construction & Extraction (5 | 0.4%).
Natural Resources, Construction and Maintenance Occupations by Sex
| Occupation | Male | Female |
| Farming, Fishing & Forestry | 0 (0.0%) | 0 (0.0%) |
| Construction & Extraction | 5 (100.0%) | 0 (0.0%) |
| Installation, Maintenance & Repair | 6 (100.0%) | 0 (0.0%) |
| Total (Category) | 11 (100.0%) | 0 (0.0%) |
| Total (Overall) | 771 (68.2%) | 360 (31.8%) |
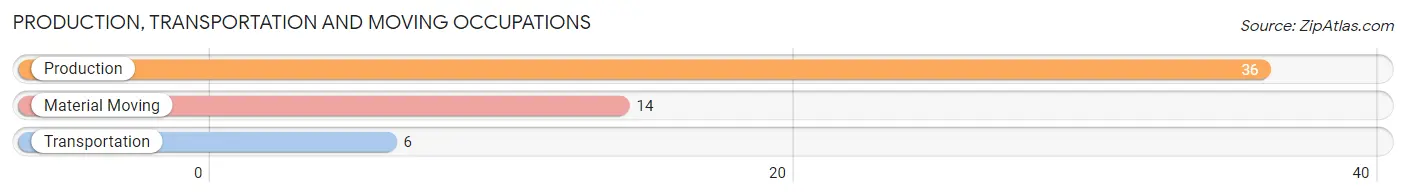
Production, Transportation and Moving Occupations
The most common Production, Transportation and Moving occupations in Clarkson Valley are Production (36 | 3.2%), Material Moving (14 | 1.2%), and Transportation (6 | 0.5%).
Production, Transportation and Moving Occupations by Sex
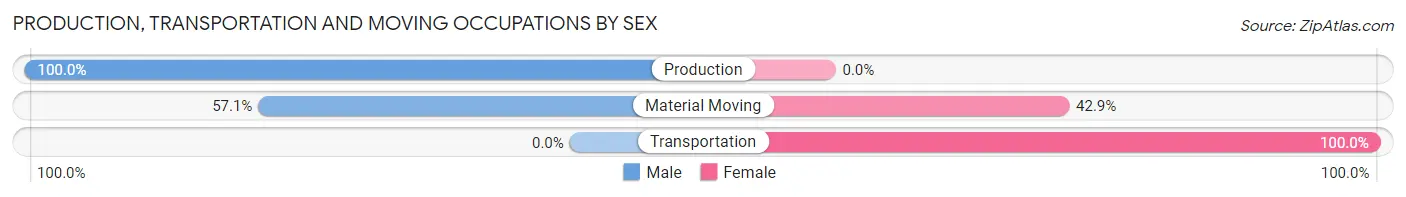
| Occupation | Male | Female |
| Production | 36 (100.0%) | 0 (0.0%) |
| Transportation | 0 (0.0%) | 6 (100.0%) |
| Material Moving | 8 (57.1%) | 6 (42.9%) |
| Total (Category) | 44 (78.6%) | 12 (21.4%) |
| Total (Overall) | 771 (68.2%) | 360 (31.8%) |
Employment Industries by Sex in Clarkson Valley
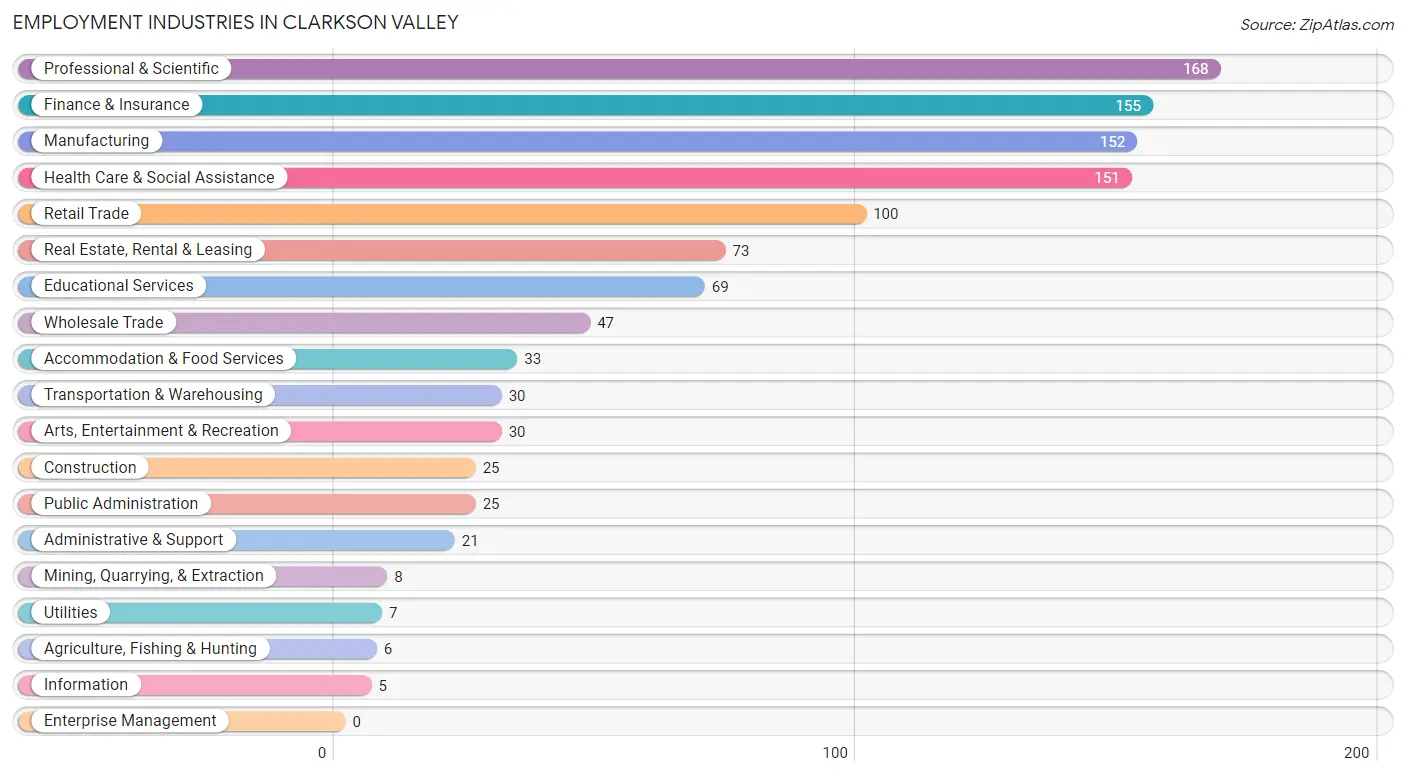
Employment Industries in Clarkson Valley
The major employment industries in Clarkson Valley include Professional & Scientific (168 | 14.8%), Finance & Insurance (155 | 13.7%), Manufacturing (152 | 13.4%), Health Care & Social Assistance (151 | 13.4%), and Retail Trade (100 | 8.8%).
Employment Industries by Sex in Clarkson Valley
The Clarkson Valley industries that see more men than women are Agriculture, Fishing & Hunting (100.0%), Mining, Quarrying, & Extraction (100.0%), and Wholesale Trade (100.0%), whereas the industries that tend to have a higher number of women are Information (100.0%), Administrative & Support (57.1%), and Accommodation & Food Services (48.5%).
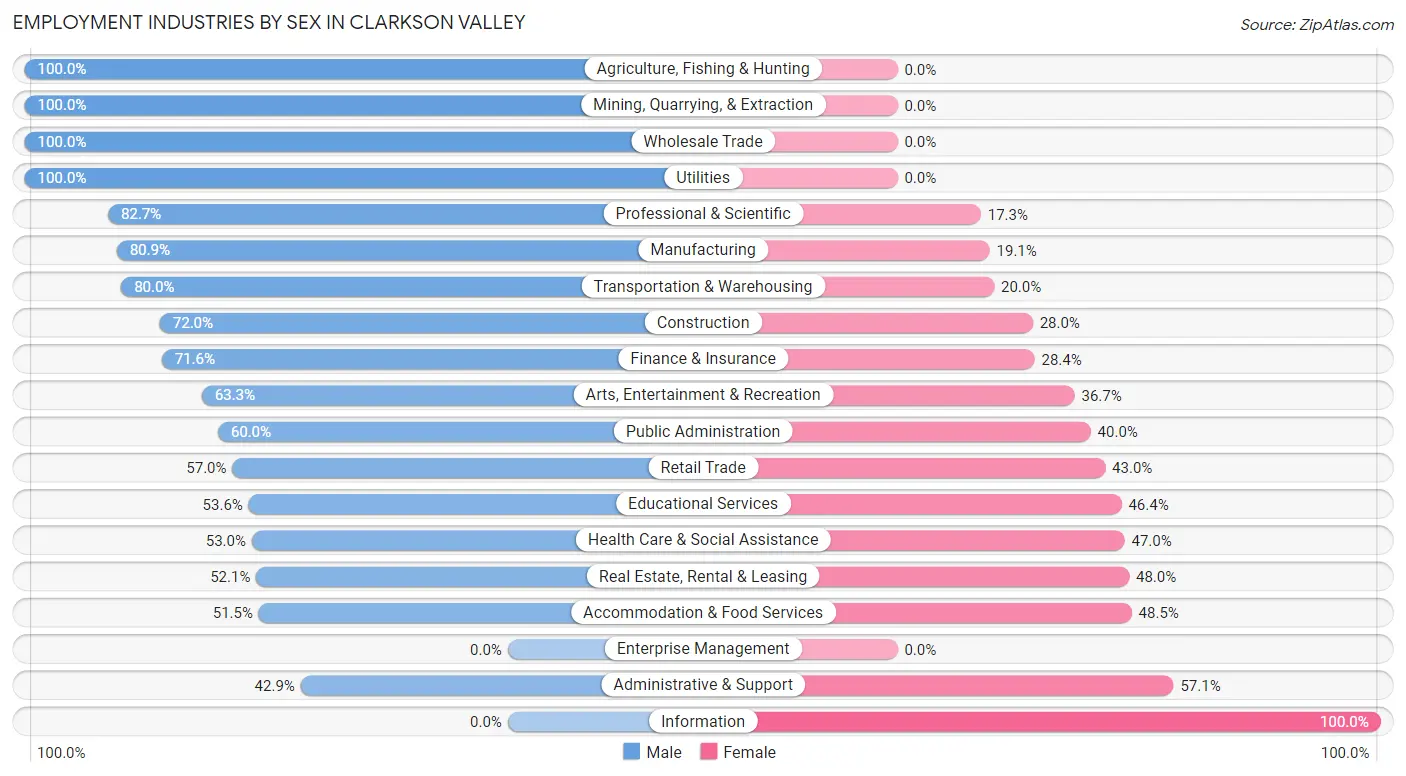
| Industry | Male | Female |
| Agriculture, Fishing & Hunting | 6 (100.0%) | 0 (0.0%) |
| Mining, Quarrying, & Extraction | 8 (100.0%) | 0 (0.0%) |
| Construction | 18 (72.0%) | 7 (28.0%) |
| Manufacturing | 123 (80.9%) | 29 (19.1%) |
| Wholesale Trade | 47 (100.0%) | 0 (0.0%) |
| Retail Trade | 57 (57.0%) | 43 (43.0%) |
| Transportation & Warehousing | 24 (80.0%) | 6 (20.0%) |
| Utilities | 7 (100.0%) | 0 (0.0%) |
| Information | 0 (0.0%) | 5 (100.0%) |
| Finance & Insurance | 111 (71.6%) | 44 (28.4%) |
| Real Estate, Rental & Leasing | 38 (52.0%) | 35 (47.9%) |
| Professional & Scientific | 139 (82.7%) | 29 (17.3%) |
| Enterprise Management | 0 (0.0%) | 0 (0.0%) |
| Administrative & Support | 9 (42.9%) | 12 (57.1%) |
| Educational Services | 37 (53.6%) | 32 (46.4%) |
| Health Care & Social Assistance | 80 (53.0%) | 71 (47.0%) |
| Arts, Entertainment & Recreation | 19 (63.3%) | 11 (36.7%) |
| Accommodation & Food Services | 17 (51.5%) | 16 (48.5%) |
| Public Administration | 15 (60.0%) | 10 (40.0%) |
| Total | 771 (68.2%) | 360 (31.8%) |
Education in Clarkson Valley
School Enrollment in Clarkson Valley
The most common levels of schooling among the 692 students in Clarkson Valley are high school (262 | 37.9%), middle school (186 | 26.9%), and elementary school (107 | 15.5%).
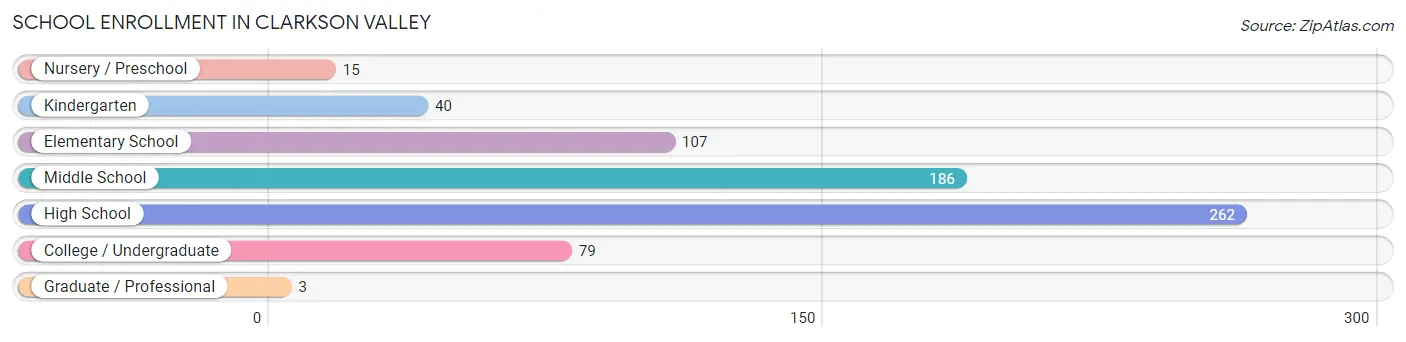
| School Level | # Students | % Students |
| Nursery / Preschool | 15 | 2.2% |
| Kindergarten | 40 | 5.8% |
| Elementary School | 107 | 15.5% |
| Middle School | 186 | 26.9% |
| High School | 262 | 37.9% |
| College / Undergraduate | 79 | 11.4% |
| Graduate / Professional | 3 | 0.4% |
| Total | 692 | 100.0% |
School Enrollment by Age by Funding Source in Clarkson Valley
Out of a total of 692 students who are enrolled in schools in Clarkson Valley, 289 (41.8%) attend a private institution, while the remaining 403 (58.2%) are enrolled in public schools. The age group of 3 to 4 year olds has the highest likelihood of being enrolled in private schools, with 5 (100.0% in the age bracket) enrolled. Conversely, the age group of 35 years and over has the lowest likelihood of being enrolled in a private school, with 9 (100.0% in the age bracket) attending a public institution.
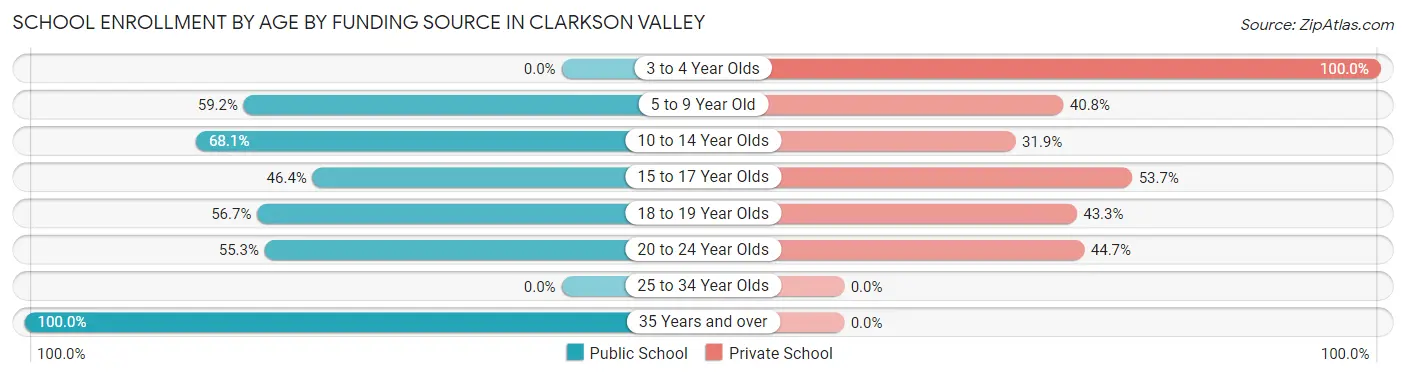
| Age Bracket | Public School | Private School |
| 3 to 4 Year Olds | 0 (0.0%) | 5 (100.0%) |
| 5 to 9 Year Old | 71 (59.2%) | 49 (40.8%) |
| 10 to 14 Year Olds | 162 (68.1%) | 76 (31.9%) |
| 15 to 17 Year Olds | 89 (46.4%) | 103 (53.6%) |
| 18 to 19 Year Olds | 51 (56.7%) | 39 (43.3%) |
| 20 to 24 Year Olds | 21 (55.3%) | 17 (44.7%) |
| 25 to 34 Year Olds | 0 (0.0%) | 0 (0.0%) |
| 35 Years and over | 9 (100.0%) | 0 (0.0%) |
| Total | 403 (58.2%) | 289 (41.8%) |
Educational Attainment by Field of Study in Clarkson Valley
Business (439 | 30.7%), education (179 | 12.5%), engineering (152 | 10.6%), science & technology (99 | 6.9%), and bio, nature & agricultural (95 | 6.6%) are the most common fields of study among 1,430 individuals in Clarkson Valley who have obtained a bachelor's degree or higher.
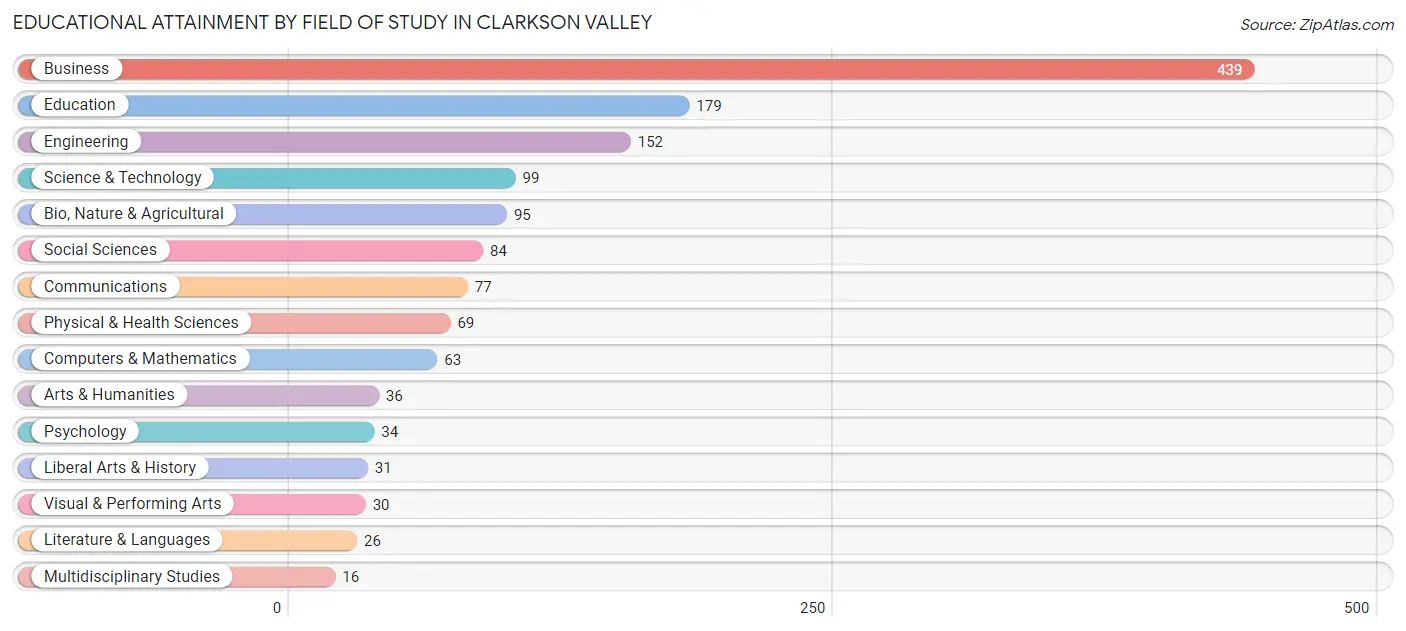
| Field of Study | # Graduates | % Graduates |
| Computers & Mathematics | 63 | 4.4% |
| Bio, Nature & Agricultural | 95 | 6.6% |
| Physical & Health Sciences | 69 | 4.8% |
| Psychology | 34 | 2.4% |
| Social Sciences | 84 | 5.9% |
| Engineering | 152 | 10.6% |
| Multidisciplinary Studies | 16 | 1.1% |
| Science & Technology | 99 | 6.9% |
| Business | 439 | 30.7% |
| Education | 179 | 12.5% |
| Literature & Languages | 26 | 1.8% |
| Liberal Arts & History | 31 | 2.2% |
| Visual & Performing Arts | 30 | 2.1% |
| Communications | 77 | 5.4% |
| Arts & Humanities | 36 | 2.5% |
| Total | 1,430 | 100.0% |
Transportation & Commute in Clarkson Valley
Vehicle Availability by Sex in Clarkson Valley
The most prevalent vehicle ownership categories in Clarkson Valley are males with 3 vehicles (292, accounting for 39.2%) and females with 3 vehicles (125, making up 83.2%).
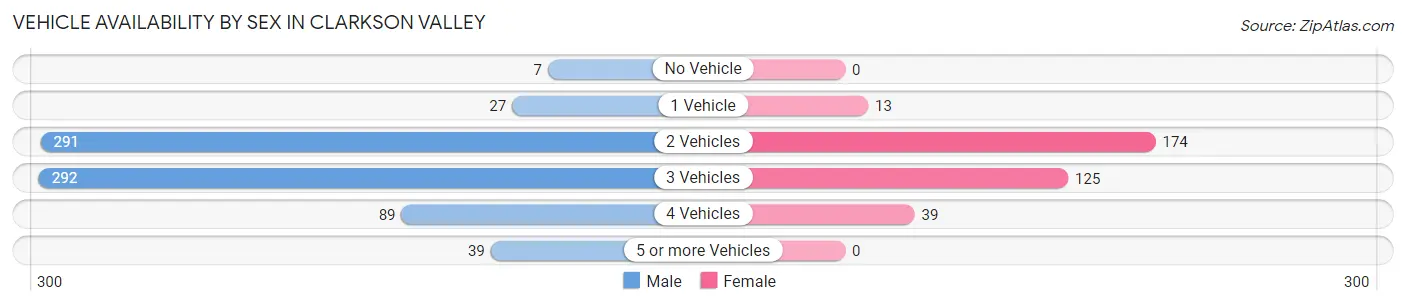
| Vehicles Available | Male | Female |
| No Vehicle | 7 (0.9%) | 0 (0.0%) |
| 1 Vehicle | 27 (3.6%) | 13 (3.7%) |
| 2 Vehicles | 291 (39.1%) | 174 (49.6%) |
| 3 Vehicles | 292 (39.2%) | 125 (35.6%) |
| 4 Vehicles | 89 (11.9%) | 39 (11.1%) |
| 5 or more Vehicles | 39 (5.2%) | 0 (0.0%) |
| Total | 745 (100.0%) | 351 (100.0%) |
Commute Time in Clarkson Valley
The most frequently occuring commute durations in Clarkson Valley are 30 to 34 minutes (192 commuters, 24.0%), 20 to 24 minutes (146 commuters, 18.2%), and 15 to 19 minutes (105 commuters, 13.1%).
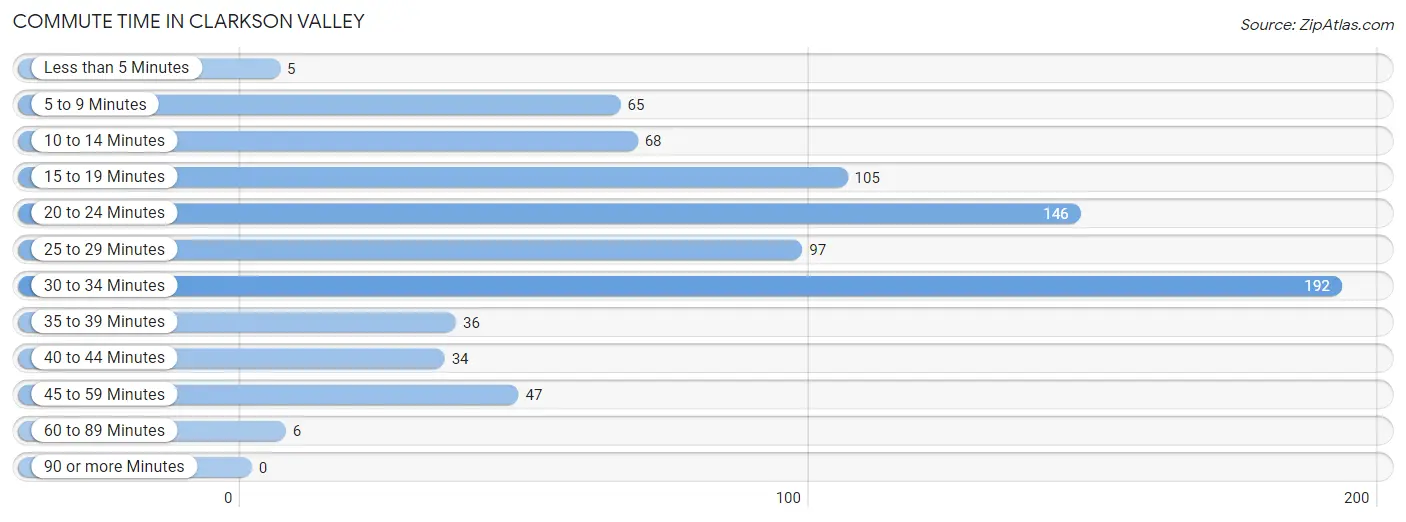
| Commute Time | # Commuters | % Commuters |
| Less than 5 Minutes | 5 | 0.6% |
| 5 to 9 Minutes | 65 | 8.1% |
| 10 to 14 Minutes | 68 | 8.5% |
| 15 to 19 Minutes | 105 | 13.1% |
| 20 to 24 Minutes | 146 | 18.2% |
| 25 to 29 Minutes | 97 | 12.1% |
| 30 to 34 Minutes | 192 | 24.0% |
| 35 to 39 Minutes | 36 | 4.5% |
| 40 to 44 Minutes | 34 | 4.2% |
| 45 to 59 Minutes | 47 | 5.9% |
| 60 to 89 Minutes | 6 | 0.7% |
| 90 or more Minutes | 0 | 0.0% |
Commute Time by Sex in Clarkson Valley
The most common commute times in Clarkson Valley are 30 to 34 minutes (134 commuters, 23.3%) for males and 30 to 34 minutes (58 commuters, 25.6%) for females.
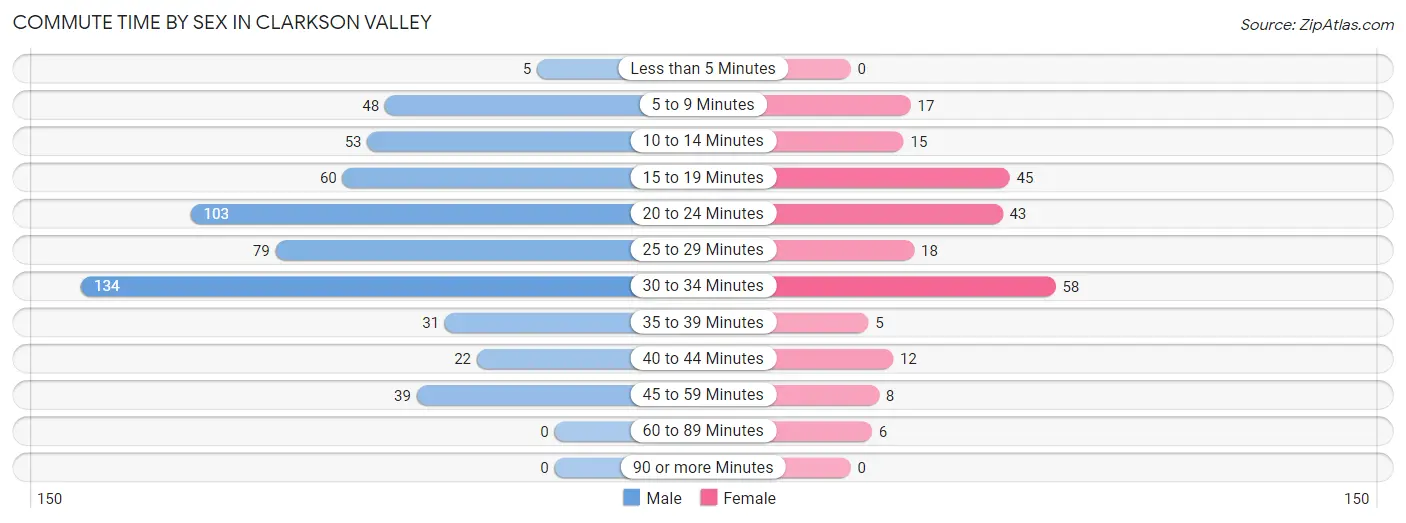
| Commute Time | Male | Female |
| Less than 5 Minutes | 5 (0.9%) | 0 (0.0%) |
| 5 to 9 Minutes | 48 (8.4%) | 17 (7.5%) |
| 10 to 14 Minutes | 53 (9.2%) | 15 (6.6%) |
| 15 to 19 Minutes | 60 (10.4%) | 45 (19.8%) |
| 20 to 24 Minutes | 103 (17.9%) | 43 (18.9%) |
| 25 to 29 Minutes | 79 (13.8%) | 18 (7.9%) |
| 30 to 34 Minutes | 134 (23.3%) | 58 (25.6%) |
| 35 to 39 Minutes | 31 (5.4%) | 5 (2.2%) |
| 40 to 44 Minutes | 22 (3.8%) | 12 (5.3%) |
| 45 to 59 Minutes | 39 (6.8%) | 8 (3.5%) |
| 60 to 89 Minutes | 0 (0.0%) | 6 (2.6%) |
| 90 or more Minutes | 0 (0.0%) | 0 (0.0%) |
Time of Departure to Work by Sex in Clarkson Valley
The most frequent times of departure to work in Clarkson Valley are 7:00 AM to 7:29 AM (164, 28.6%) for males and 6:30 AM to 6:59 AM (45, 19.8%) for females.
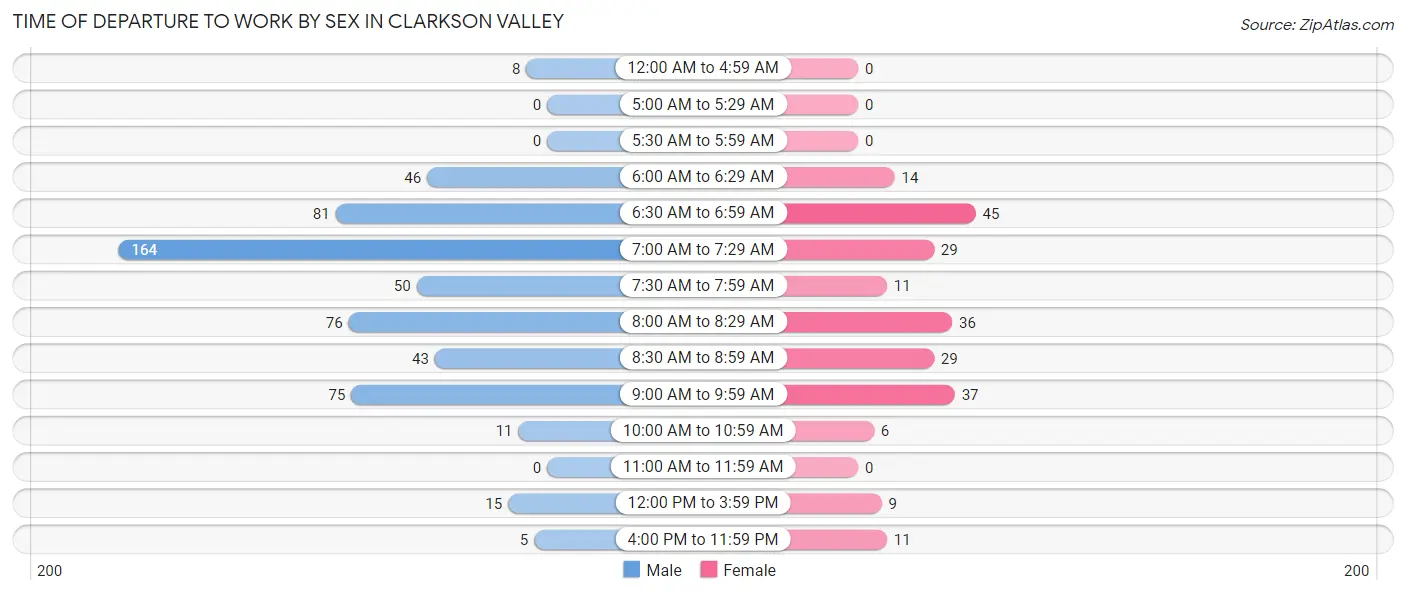
| Time of Departure | Male | Female |
| 12:00 AM to 4:59 AM | 8 (1.4%) | 0 (0.0%) |
| 5:00 AM to 5:29 AM | 0 (0.0%) | 0 (0.0%) |
| 5:30 AM to 5:59 AM | 0 (0.0%) | 0 (0.0%) |
| 6:00 AM to 6:29 AM | 46 (8.0%) | 14 (6.2%) |
| 6:30 AM to 6:59 AM | 81 (14.1%) | 45 (19.8%) |
| 7:00 AM to 7:29 AM | 164 (28.6%) | 29 (12.8%) |
| 7:30 AM to 7:59 AM | 50 (8.7%) | 11 (4.9%) |
| 8:00 AM to 8:29 AM | 76 (13.2%) | 36 (15.9%) |
| 8:30 AM to 8:59 AM | 43 (7.5%) | 29 (12.8%) |
| 9:00 AM to 9:59 AM | 75 (13.1%) | 37 (16.3%) |
| 10:00 AM to 10:59 AM | 11 (1.9%) | 6 (2.6%) |
| 11:00 AM to 11:59 AM | 0 (0.0%) | 0 (0.0%) |
| 12:00 PM to 3:59 PM | 15 (2.6%) | 9 (4.0%) |
| 4:00 PM to 11:59 PM | 5 (0.9%) | 11 (4.9%) |
| Total | 574 (100.0%) | 227 (100.0%) |
Housing Occupancy in Clarkson Valley
Occupancy by Ownership in Clarkson Valley
Of the total 894 dwellings in Clarkson Valley, owner-occupied units account for 863 (96.5%), while renter-occupied units make up 31 (3.5%).
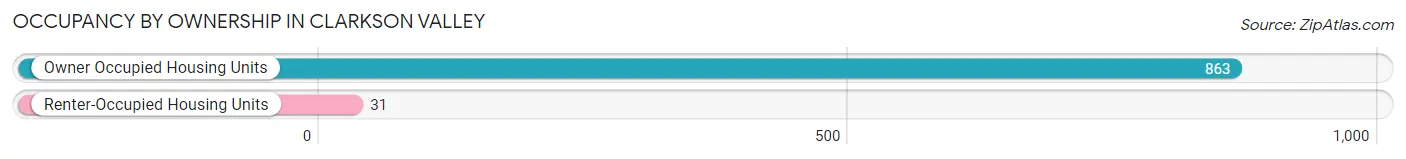
| Occupancy | # Housing Units | % Housing Units |
| Owner Occupied Housing Units | 863 | 96.5% |
| Renter-Occupied Housing Units | 31 | 3.5% |
| Total Occupied Housing Units | 894 | 100.0% |
Occupancy by Household Size in Clarkson Valley

| Household Size | # Housing Units | % Housing Units |
| 1-Person Household | 104 | 11.6% |
| 2-Person Household | 349 | 39.0% |
| 3-Person Household | 181 | 20.3% |
| 4+ Person Household | 260 | 29.1% |
| Total Housing Units | 894 | 100.0% |
Occupancy by Ownership by Household Size in Clarkson Valley
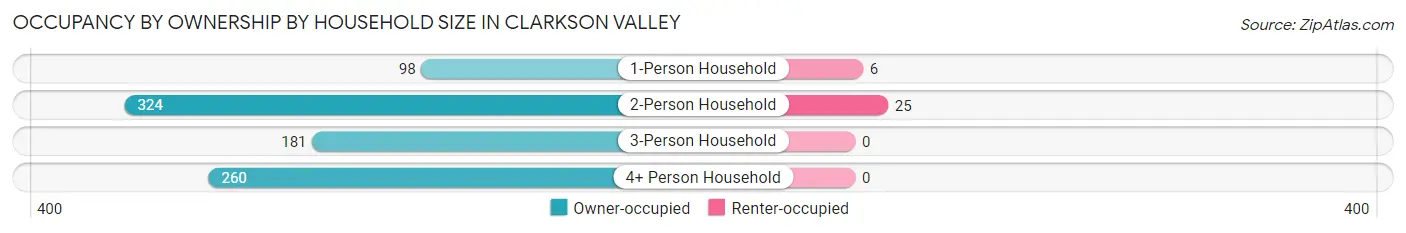
| Household Size | Owner-occupied | Renter-occupied |
| 1-Person Household | 98 (94.2%) | 6 (5.8%) |
| 2-Person Household | 324 (92.8%) | 25 (7.2%) |
| 3-Person Household | 181 (100.0%) | 0 (0.0%) |
| 4+ Person Household | 260 (100.0%) | 0 (0.0%) |
| Total Housing Units | 863 (96.5%) | 31 (3.5%) |
Occupancy by Educational Attainment in Clarkson Valley
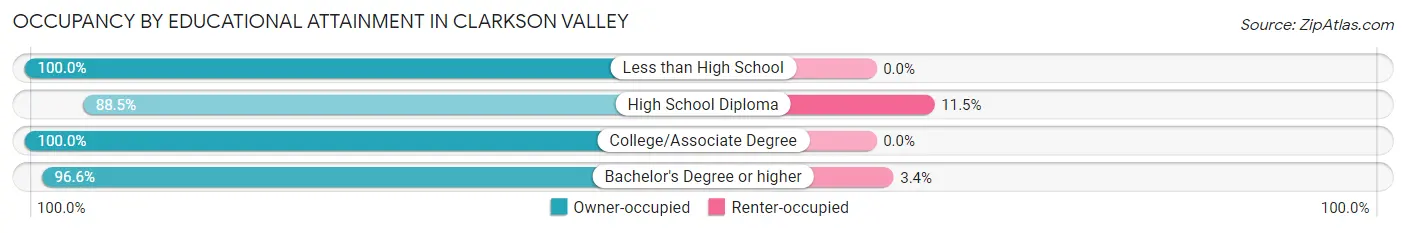
| Household Size | Owner-occupied | Renter-occupied |
| Less than High School | 4 (100.0%) | 0 (0.0%) |
| High School Diploma | 46 (88.5%) | 6 (11.5%) |
| College/Associate Degree | 101 (100.0%) | 0 (0.0%) |
| Bachelor's Degree or higher | 712 (96.6%) | 25 (3.4%) |
Occupancy by Age of Householder in Clarkson Valley
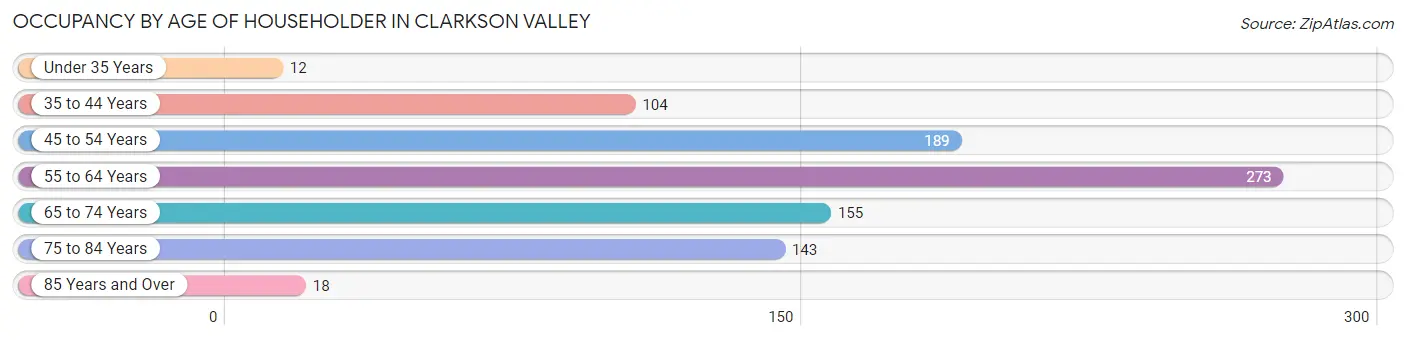
| Age Bracket | # Households | % Households |
| Under 35 Years | 12 | 1.3% |
| 35 to 44 Years | 104 | 11.6% |
| 45 to 54 Years | 189 | 21.1% |
| 55 to 64 Years | 273 | 30.5% |
| 65 to 74 Years | 155 | 17.3% |
| 75 to 84 Years | 143 | 16.0% |
| 85 Years and Over | 18 | 2.0% |
| Total | 894 | 100.0% |
Housing Finances in Clarkson Valley
Median Income by Occupancy in Clarkson Valley
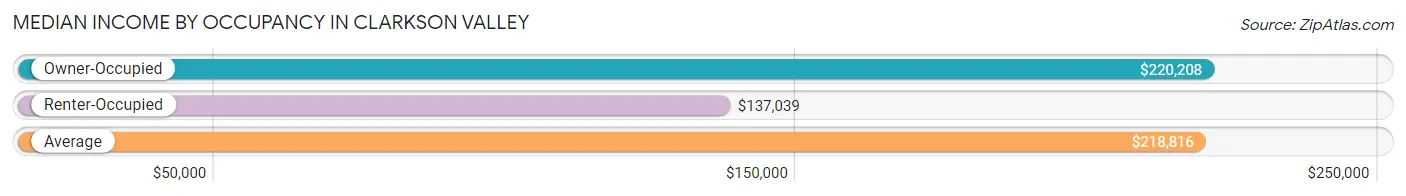
| Occupancy Type | # Households | Median Income |
| Owner-Occupied | 863 (96.5%) | $220,208 |
| Renter-Occupied | 31 (3.5%) | $137,039 |
| Average | 894 (100.0%) | $218,816 |
Occupancy by Householder Income Bracket in Clarkson Valley
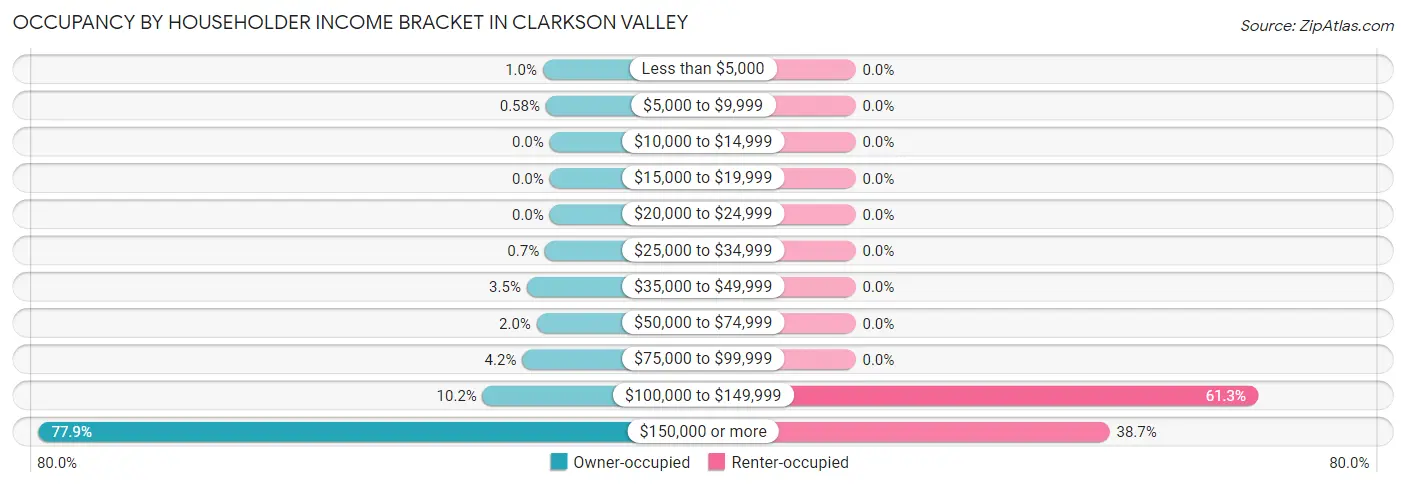
| Income Bracket | Owner-occupied | Renter-occupied |
| Less than $5,000 | 9 (1.0%) | 0 (0.0%) |
| $5,000 to $9,999 | 5 (0.6%) | 0 (0.0%) |
| $10,000 to $14,999 | 0 (0.0%) | 0 (0.0%) |
| $15,000 to $19,999 | 0 (0.0%) | 0 (0.0%) |
| $20,000 to $24,999 | 0 (0.0%) | 0 (0.0%) |
| $25,000 to $34,999 | 6 (0.7%) | 0 (0.0%) |
| $35,000 to $49,999 | 30 (3.5%) | 0 (0.0%) |
| $50,000 to $74,999 | 17 (2.0%) | 0 (0.0%) |
| $75,000 to $99,999 | 36 (4.2%) | 0 (0.0%) |
| $100,000 to $149,999 | 88 (10.2%) | 19 (61.3%) |
| $150,000 or more | 672 (77.9%) | 12 (38.7%) |
| Total | 863 (100.0%) | 31 (100.0%) |
Monthly Housing Cost Tiers in Clarkson Valley
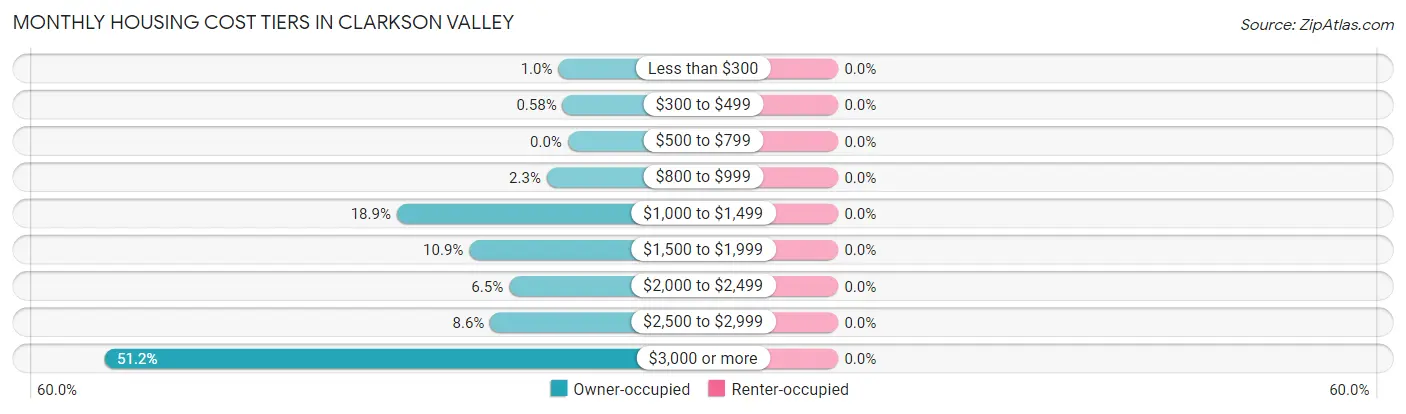
| Monthly Cost | Owner-occupied | Renter-occupied |
| Less than $300 | 9 (1.0%) | 0 (0.0%) |
| $300 to $499 | 5 (0.6%) | 0 (0.0%) |
| $500 to $799 | 0 (0.0%) | 0 (0.0%) |
| $800 to $999 | 20 (2.3%) | 0 (0.0%) |
| $1,000 to $1,499 | 163 (18.9%) | 0 (0.0%) |
| $1,500 to $1,999 | 94 (10.9%) | 0 (0.0%) |
| $2,000 to $2,499 | 56 (6.5%) | 0 (0.0%) |
| $2,500 to $2,999 | 74 (8.6%) | 0 (0.0%) |
| $3,000 or more | 442 (51.2%) | 0 (0.0%) |
| Total | 863 (100.0%) | 31 (100.0%) |
Physical Housing Characteristics in Clarkson Valley
Housing Structures in Clarkson Valley
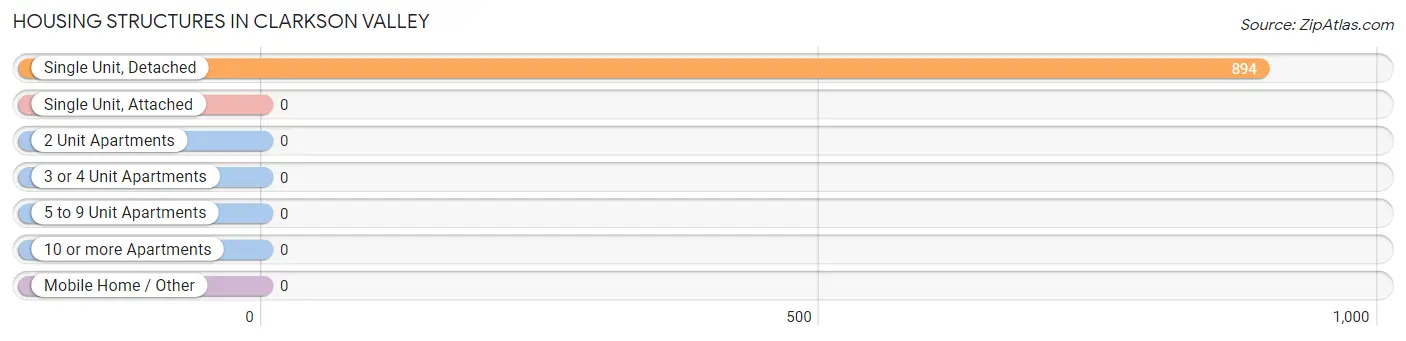
| Structure Type | # Housing Units | % Housing Units |
| Single Unit, Detached | 894 | 100.0% |
| Single Unit, Attached | 0 | 0.0% |
| 2 Unit Apartments | 0 | 0.0% |
| 3 or 4 Unit Apartments | 0 | 0.0% |
| 5 to 9 Unit Apartments | 0 | 0.0% |
| 10 or more Apartments | 0 | 0.0% |
| Mobile Home / Other | 0 | 0.0% |
| Total | 894 | 100.0% |
Housing Structures by Occupancy in Clarkson Valley
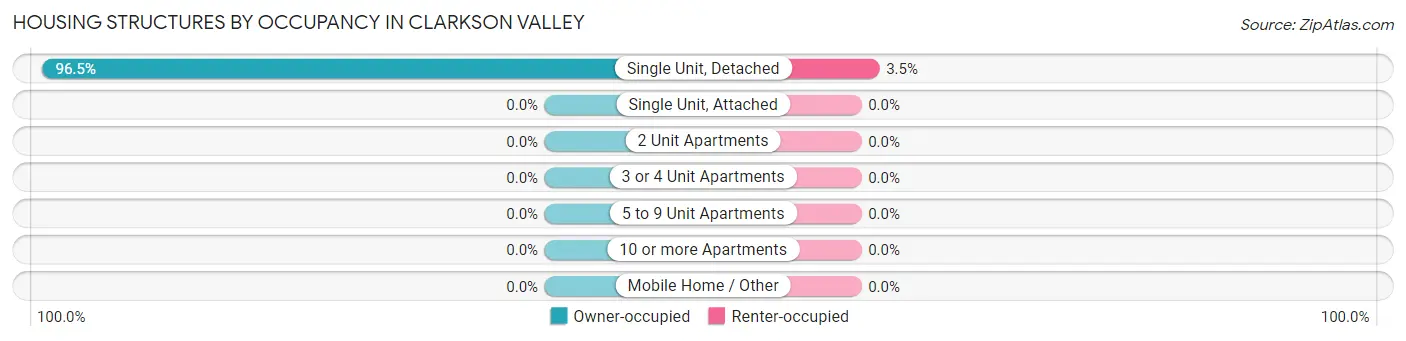
| Structure Type | Owner-occupied | Renter-occupied |
| Single Unit, Detached | 863 (96.5%) | 31 (3.5%) |
| Single Unit, Attached | 0 (0.0%) | 0 (0.0%) |
| 2 Unit Apartments | 0 (0.0%) | 0 (0.0%) |
| 3 or 4 Unit Apartments | 0 (0.0%) | 0 (0.0%) |
| 5 to 9 Unit Apartments | 0 (0.0%) | 0 (0.0%) |
| 10 or more Apartments | 0 (0.0%) | 0 (0.0%) |
| Mobile Home / Other | 0 (0.0%) | 0 (0.0%) |
| Total | 863 (96.5%) | 31 (3.5%) |
Housing Structures by Number of Rooms in Clarkson Valley
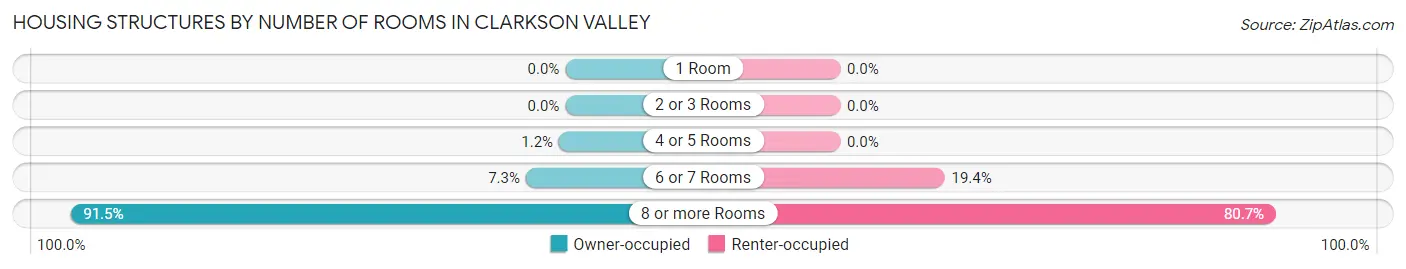
| Number of Rooms | Owner-occupied | Renter-occupied |
| 1 Room | 0 (0.0%) | 0 (0.0%) |
| 2 or 3 Rooms | 0 (0.0%) | 0 (0.0%) |
| 4 or 5 Rooms | 10 (1.2%) | 0 (0.0%) |
| 6 or 7 Rooms | 63 (7.3%) | 6 (19.4%) |
| 8 or more Rooms | 790 (91.5%) | 25 (80.6%) |
| Total | 863 (100.0%) | 31 (100.0%) |
Housing Structure by Heating Type in Clarkson Valley
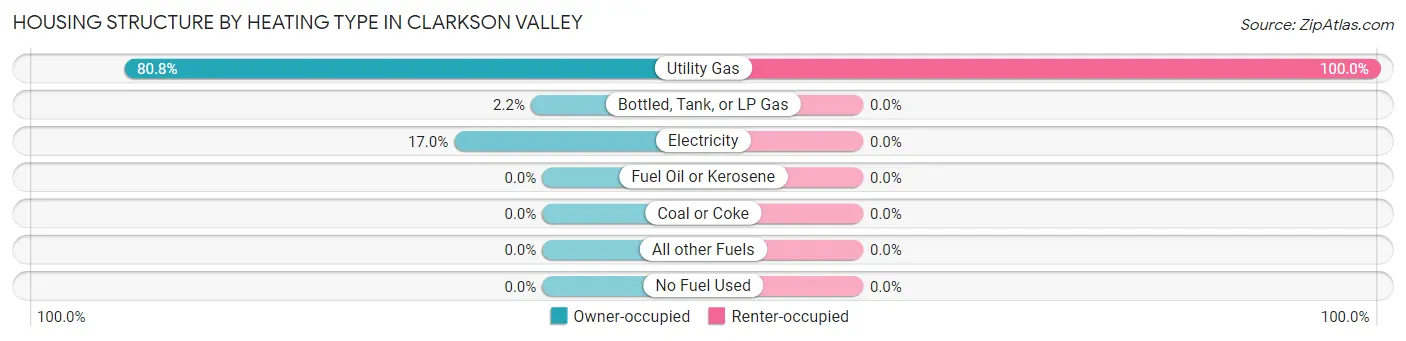
| Heating Type | Owner-occupied | Renter-occupied |
| Utility Gas | 697 (80.8%) | 31 (100.0%) |
| Bottled, Tank, or LP Gas | 19 (2.2%) | 0 (0.0%) |
| Electricity | 147 (17.0%) | 0 (0.0%) |
| Fuel Oil or Kerosene | 0 (0.0%) | 0 (0.0%) |
| Coal or Coke | 0 (0.0%) | 0 (0.0%) |
| All other Fuels | 0 (0.0%) | 0 (0.0%) |
| No Fuel Used | 0 (0.0%) | 0 (0.0%) |
| Total | 863 (100.0%) | 31 (100.0%) |
Household Vehicle Usage in Clarkson Valley
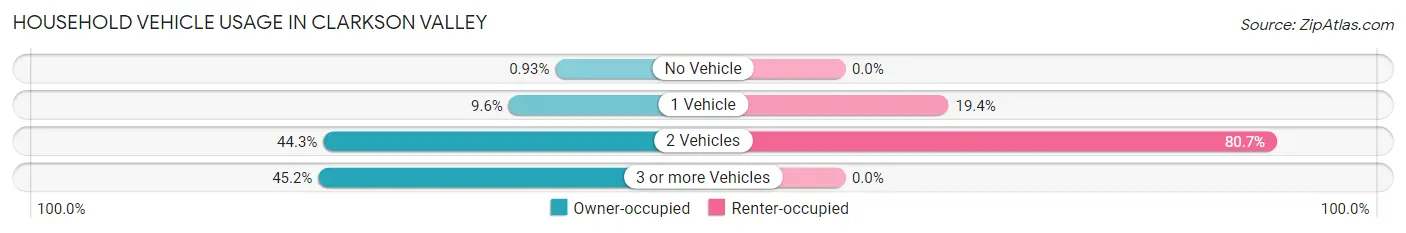
| Vehicles per Household | Owner-occupied | Renter-occupied |
| No Vehicle | 8 (0.9%) | 0 (0.0%) |
| 1 Vehicle | 83 (9.6%) | 6 (19.4%) |
| 2 Vehicles | 382 (44.3%) | 25 (80.6%) |
| 3 or more Vehicles | 390 (45.2%) | 0 (0.0%) |
| Total | 863 (100.0%) | 31 (100.0%) |
Real Estate & Mortgages in Clarkson Valley
Real Estate and Mortgage Overview in Clarkson Valley
| Characteristic | Without Mortgage | With Mortgage |
| Housing Units | 257 | 606 |
| Median Property Value | $736,100 | $813,700 |
| Median Household Income | $206,042 | $481 |
| Monthly Housing Costs | $1,421 | $440 |
| Real Estate Taxes | $9,099 | $0 |
Property Value by Mortgage Status in Clarkson Valley
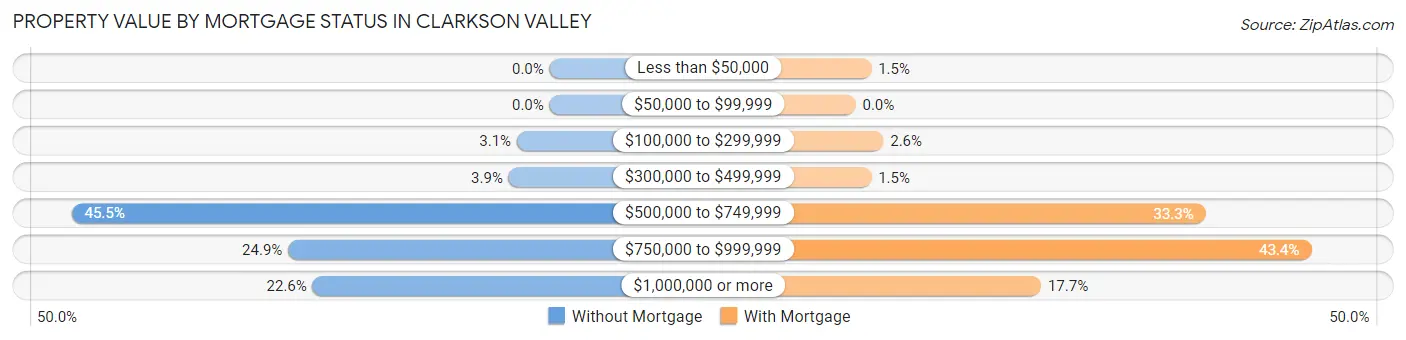
| Property Value | Without Mortgage | With Mortgage |
| Less than $50,000 | 0 (0.0%) | 9 (1.5%) |
| $50,000 to $99,999 | 0 (0.0%) | 0 (0.0%) |
| $100,000 to $299,999 | 8 (3.1%) | 16 (2.6%) |
| $300,000 to $499,999 | 10 (3.9%) | 9 (1.5%) |
| $500,000 to $749,999 | 117 (45.5%) | 202 (33.3%) |
| $750,000 to $999,999 | 64 (24.9%) | 263 (43.4%) |
| $1,000,000 or more | 58 (22.6%) | 107 (17.7%) |
| Total | 257 (100.0%) | 606 (100.0%) |
Household Income by Mortgage Status in Clarkson Valley
| Household Income | Without Mortgage | With Mortgage |
| Less than $10,000 | 14 (5.4%) | 8 (1.3%) |
| $10,000 to $24,999 | 0 (0.0%) | 0 (0.0%) |
| $25,000 to $34,999 | 0 (0.0%) | 0 (0.0%) |
| $35,000 to $49,999 | 11 (4.3%) | 6 (1.0%) |
| $50,000 to $74,999 | 10 (3.9%) | 19 (3.1%) |
| $75,000 to $99,999 | 14 (5.4%) | 7 (1.2%) |
| $100,000 to $149,999 | 17 (6.6%) | 22 (3.6%) |
| $150,000 or more | 191 (74.3%) | 71 (11.7%) |
| Total | 257 (100.0%) | 606 (100.0%) |
Property Value to Household Income Ratio in Clarkson Valley
| Value-to-Income Ratio | Without Mortgage | With Mortgage |
| Less than 2.0x | 52 (20.2%) | 234,583 (38,710.1%) |
| 2.0x to 2.9x | 49 (19.1%) | 177 (29.2%) |
| 3.0x to 3.9x | 41 (16.0%) | 127 (21.0%) |
| 4.0x or more | 109 (42.4%) | 129 (21.3%) |
| Total | 257 (100.0%) | 606 (100.0%) |
Real Estate Taxes by Mortgage Status in Clarkson Valley
| Property Taxes | Without Mortgage | With Mortgage |
| Less than $800 | 0 (0.0%) | 0 (0.0%) |
| $800 to $1,499 | 3 (1.2%) | 9 (1.5%) |
| $800 to $1,499 | 254 (98.8%) | 15 (2.5%) |
| Total | 257 (100.0%) | 606 (100.0%) |
Health & Disability in Clarkson Valley
Health Insurance Coverage by Age in Clarkson Valley
| Age Bracket | With Coverage | Without Coverage |
| Under 6 Years | 80 (100.0%) | 0 (0.0%) |
| 6 to 18 Years | 581 (97.3%) | 16 (2.7%) |
| 19 to 25 Years | 165 (100.0%) | 0 (0.0%) |
| 26 to 34 Years | 56 (100.0%) | 0 (0.0%) |
| 35 to 44 Years | 219 (100.0%) | 0 (0.0%) |
| 45 to 54 Years | 401 (95.3%) | 20 (4.8%) |
| 55 to 64 Years | 509 (100.0%) | 0 (0.0%) |
| 65 to 74 Years | 295 (100.0%) | 0 (0.0%) |
| 75 Years and older | 266 (100.0%) | 0 (0.0%) |
| Total | 2,572 (98.6%) | 36 (1.4%) |
Health Insurance Coverage by Citizenship Status in Clarkson Valley
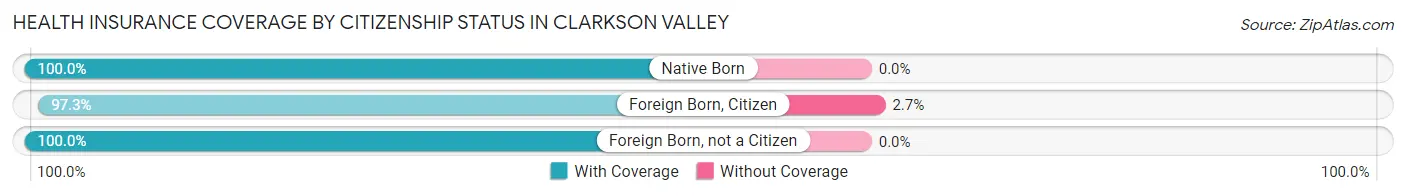
| Citizenship Status | With Coverage | Without Coverage |
| Native Born | 80 (100.0%) | 0 (0.0%) |
| Foreign Born, Citizen | 581 (97.3%) | 16 (2.7%) |
| Foreign Born, not a Citizen | 165 (100.0%) | 0 (0.0%) |
Health Insurance Coverage by Household Income in Clarkson Valley
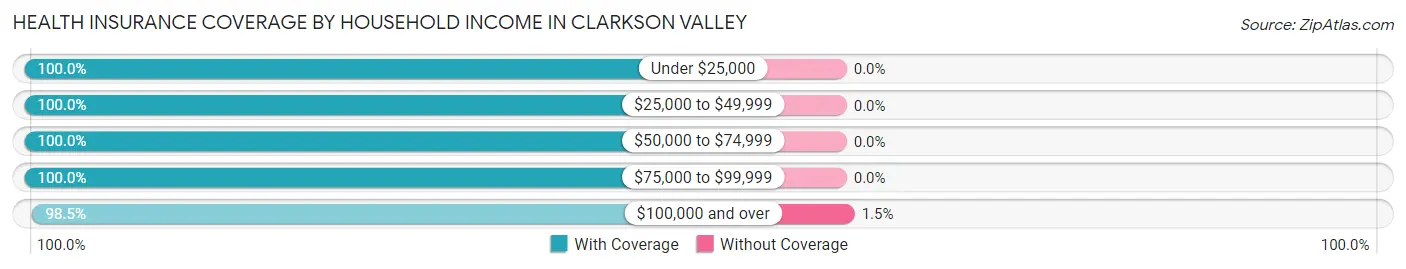
| Household Income | With Coverage | Without Coverage |
| Under $25,000 | 29 (100.0%) | 0 (0.0%) |
| $25,000 to $49,999 | 46 (100.0%) | 0 (0.0%) |
| $50,000 to $74,999 | 30 (100.0%) | 0 (0.0%) |
| $75,000 to $99,999 | 70 (100.0%) | 0 (0.0%) |
| $100,000 and over | 2,397 (98.5%) | 36 (1.5%) |
Public vs Private Health Insurance Coverage by Age in Clarkson Valley
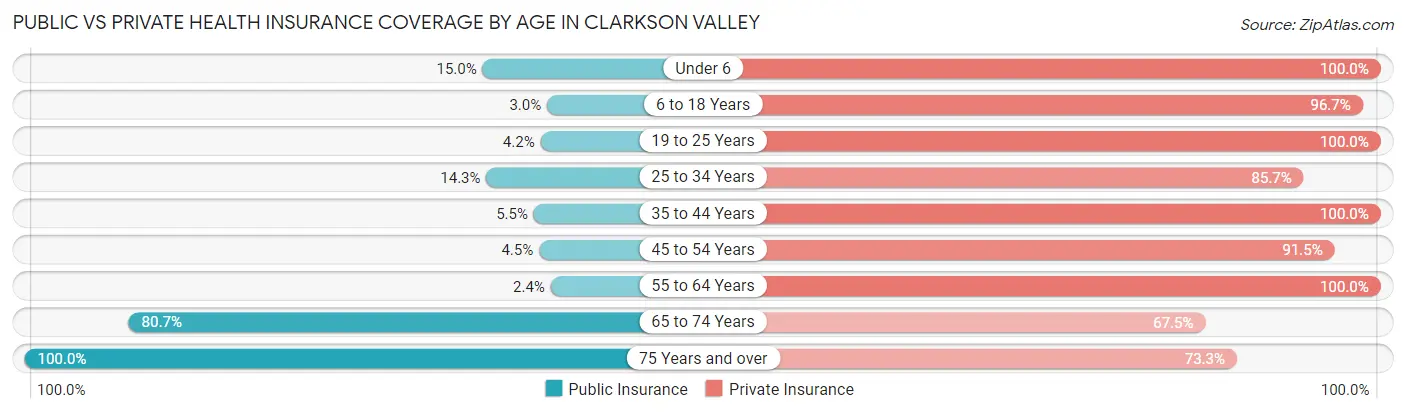
| Age Bracket | Public Insurance | Private Insurance |
| Under 6 | 12 (15.0%) | 80 (100.0%) |
| 6 to 18 Years | 18 (3.0%) | 577 (96.7%) |
| 19 to 25 Years | 7 (4.2%) | 165 (100.0%) |
| 25 to 34 Years | 8 (14.3%) | 48 (85.7%) |
| 35 to 44 Years | 12 (5.5%) | 219 (100.0%) |
| 45 to 54 Years | 19 (4.5%) | 385 (91.4%) |
| 55 to 64 Years | 12 (2.4%) | 509 (100.0%) |
| 65 to 74 Years | 238 (80.7%) | 199 (67.5%) |
| 75 Years and over | 266 (100.0%) | 195 (73.3%) |
| Total | 592 (22.7%) | 2,377 (91.1%) |
Disability Status by Sex by Age in Clarkson Valley
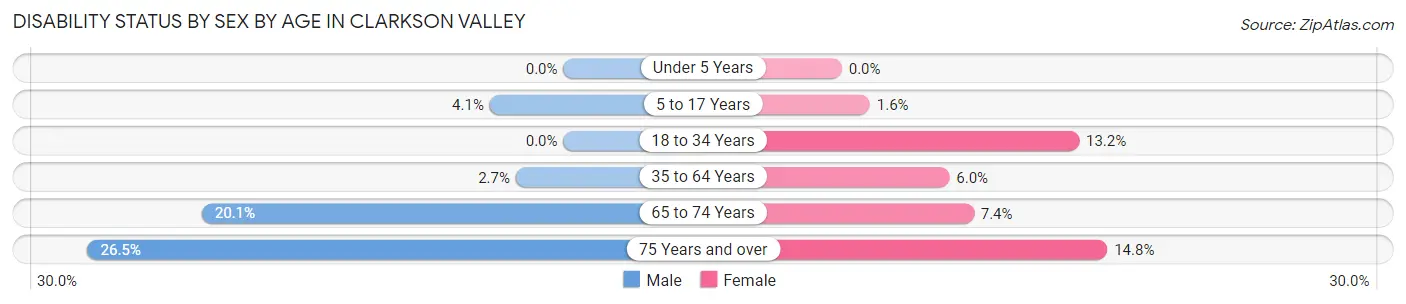
| Age Bracket | Male | Female |
| Under 5 Years | 0 (0.0%) | 0 (0.0%) |
| 5 to 17 Years | 12 (4.1%) | 4 (1.6%) |
| 18 to 34 Years | 0 (0.0%) | 14 (13.2%) |
| 35 to 64 Years | 15 (2.6%) | 35 (6.0%) |
| 65 to 74 Years | 32 (20.1%) | 10 (7.3%) |
| 75 Years and over | 40 (26.5%) | 17 (14.8%) |
Disability Class by Sex by Age in Clarkson Valley
Disability Class: Hearing Difficulty
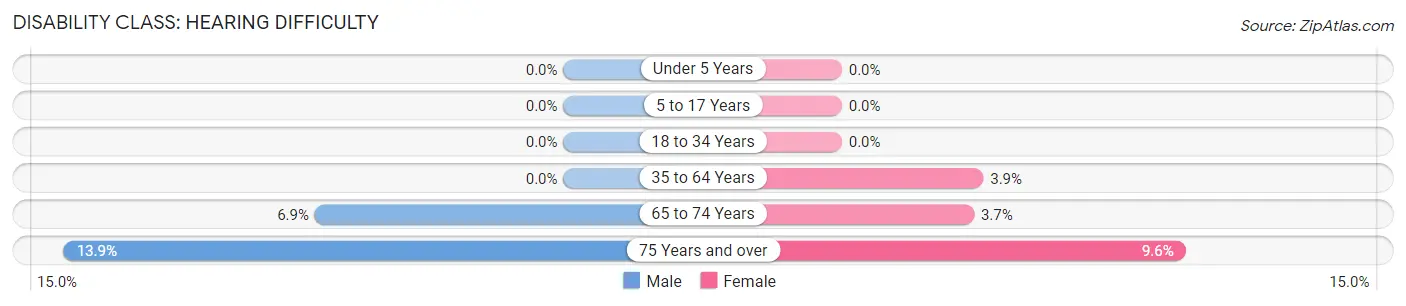
| Age Bracket | Male | Female |
| Under 5 Years | 0 (0.0%) | 0 (0.0%) |
| 5 to 17 Years | 0 (0.0%) | 0 (0.0%) |
| 18 to 34 Years | 0 (0.0%) | 0 (0.0%) |
| 35 to 64 Years | 0 (0.0%) | 23 (3.9%) |
| 65 to 74 Years | 11 (6.9%) | 5 (3.7%) |
| 75 Years and over | 21 (13.9%) | 11 (9.6%) |
Disability Class: Vision Difficulty
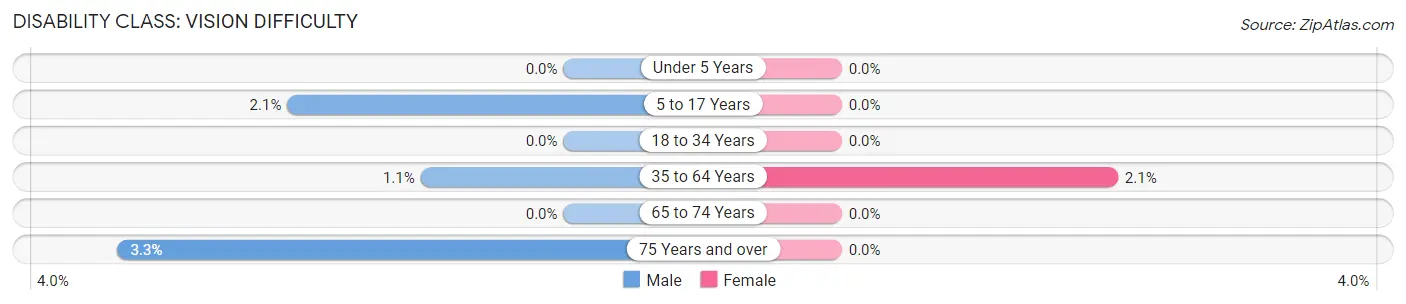
| Age Bracket | Male | Female |
| Under 5 Years | 0 (0.0%) | 0 (0.0%) |
| 5 to 17 Years | 6 (2.1%) | 0 (0.0%) |
| 18 to 34 Years | 0 (0.0%) | 0 (0.0%) |
| 35 to 64 Years | 6 (1.1%) | 12 (2.1%) |
| 65 to 74 Years | 0 (0.0%) | 0 (0.0%) |
| 75 Years and over | 5 (3.3%) | 0 (0.0%) |
Disability Class: Cognitive Difficulty
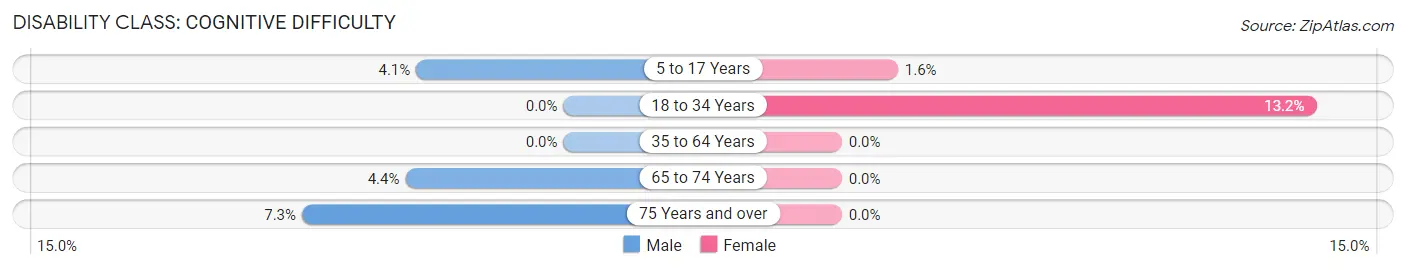
| Age Bracket | Male | Female |
| 5 to 17 Years | 12 (4.1%) | 4 (1.6%) |
| 18 to 34 Years | 0 (0.0%) | 14 (13.2%) |
| 35 to 64 Years | 0 (0.0%) | 0 (0.0%) |
| 65 to 74 Years | 7 (4.4%) | 0 (0.0%) |
| 75 Years and over | 11 (7.3%) | 0 (0.0%) |
Disability Class: Ambulatory Difficulty
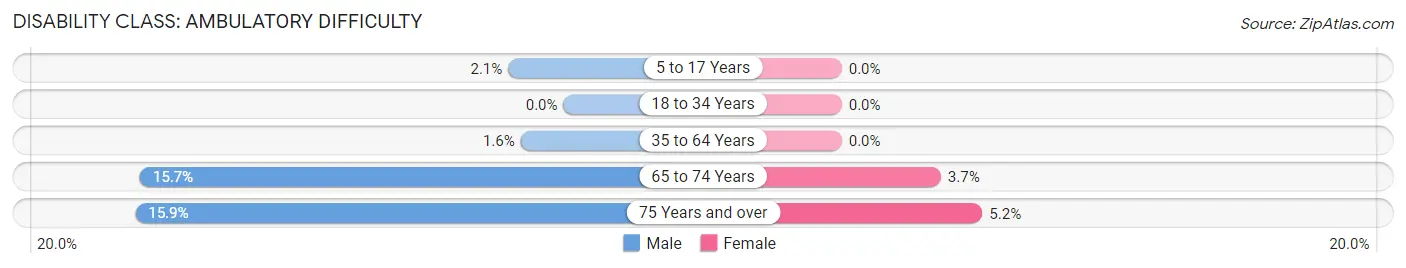
| Age Bracket | Male | Female |
| 5 to 17 Years | 6 (2.1%) | 0 (0.0%) |
| 18 to 34 Years | 0 (0.0%) | 0 (0.0%) |
| 35 to 64 Years | 9 (1.6%) | 0 (0.0%) |
| 65 to 74 Years | 25 (15.7%) | 5 (3.7%) |
| 75 Years and over | 24 (15.9%) | 6 (5.2%) |
Disability Class: Self-Care Difficulty
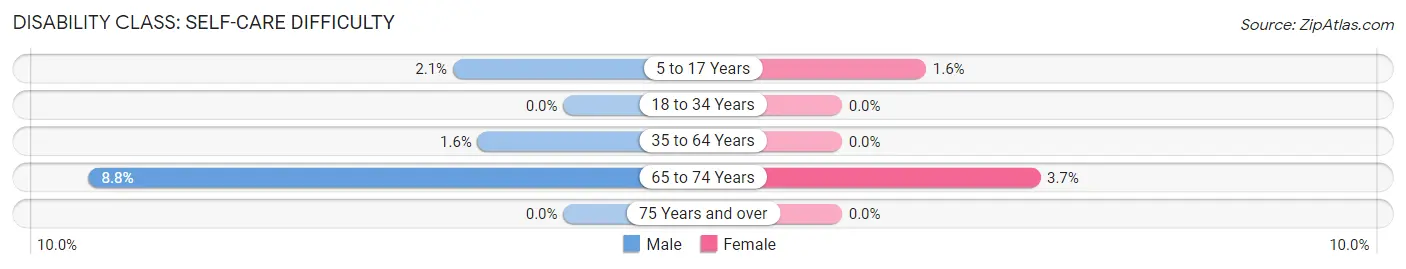
| Age Bracket | Male | Female |
| 5 to 17 Years | 6 (2.1%) | 4 (1.6%) |
| 18 to 34 Years | 0 (0.0%) | 0 (0.0%) |
| 35 to 64 Years | 9 (1.6%) | 0 (0.0%) |
| 65 to 74 Years | 14 (8.8%) | 5 (3.7%) |
| 75 Years and over | 0 (0.0%) | 0 (0.0%) |
Technology Access in Clarkson Valley
Computing Device Access in Clarkson Valley
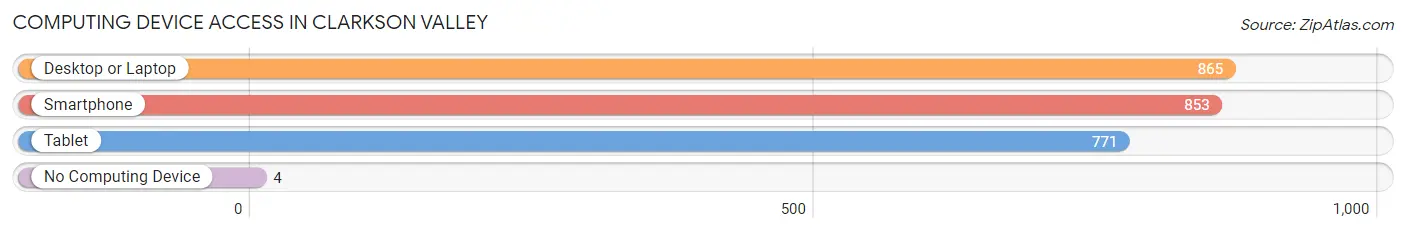
| Device Type | # Households | % Households |
| Desktop or Laptop | 865 | 96.8% |
| Smartphone | 853 | 95.4% |
| Tablet | 771 | 86.2% |
| No Computing Device | 4 | 0.4% |
| Total | 894 | 100.0% |
Internet Access in Clarkson Valley
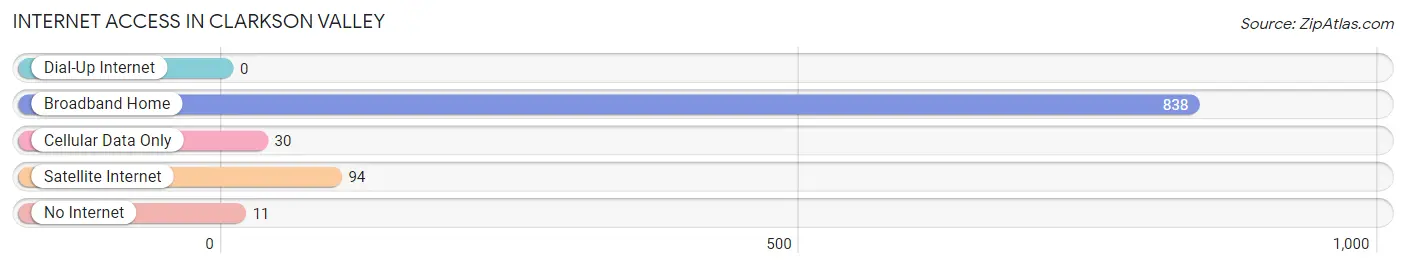
| Internet Type | # Households | % Households |
| Dial-Up Internet | 0 | 0.0% |
| Broadband Home | 838 | 93.7% |
| Cellular Data Only | 30 | 3.4% |
| Satellite Internet | 94 | 10.5% |
| No Internet | 11 | 1.2% |
| Total | 894 | 100.0% |
Clarkson Valley Summary
Clarkson Valley is a small city located in St. Louis County, Missouri. It is situated in the western part of the county, just south of the city of Chesterfield. The city has a population of approximately 4,000 people and covers an area of 1.7 square miles.
History
Clarkson Valley was first settled in the early 1800s by a group of German immigrants. The area was originally known as “Clarkson’s Valley” after the family who owned the land. The town was officially incorporated in 1891 and was named after the family.
In the early 1900s, the town was a popular destination for wealthy St. Louisans who wanted to escape the hustle and bustle of the city. The town was known for its beautiful scenery and peaceful atmosphere.
In the 1950s, the town began to experience rapid growth as more people moved to the area. The population increased from just over 1,000 in 1950 to nearly 4,000 in 2000.
Geography
Clarkson Valley is located in the western part of St. Louis County, just south of the city of Chesterfield. The city is situated on the banks of the Missouri River and is surrounded by rolling hills and lush forests.
The city has a total area of 1.7 square miles, all of which is land. The average elevation is 690 feet above sea level.
Economy
Clarkson Valley’s economy is largely based on the service industry. The city is home to a variety of restaurants, retail stores, and other businesses.
The city is also home to several large corporations, including Express Scripts, a pharmacy benefit management company, and Emerson Electric, a global technology and engineering company.
Demographics
As of the 2010 census, the population of Clarkson Valley was 4,039. The racial makeup of the city was 94.3% White, 1.2% African American, 0.3% Native American, 1.7% Asian, 0.1% Pacific Islander, 0.7% from other races, and 1.9% from two or more races. Hispanic or Latino of any race were 2.3% of the population.
The median income for a household in the city was $90,945, and the median income for a family was $103,945. The per capita income for the city was $45,945. About 2.3% of families and 3.2% of the population were below the poverty line, including 3.7% of those under age 18 and 1.2% of those age 65 or over.
Clarkson Valley is a small city with a rich history and a vibrant economy. The city is home to a diverse population and offers a variety of services and amenities. The city is a great place to live, work, and play.
Common Questions
What is Per Capita Income in Clarkson Valley?
Per Capita income in Clarkson Valley is $112,065.
What is the Median Family Income in Clarkson Valley?
Median Family Income in Clarkson Valley is $230,500.
What is the Median Household income in Clarkson Valley?
Median Household Income in Clarkson Valley is $218,816.
What is Income or Wage Gap in Clarkson Valley?
Income or Wage Gap in Clarkson Valley is 56.1%.
Women in Clarkson Valley earn 43.9 cents for every dollar earned by a man.
What is Family Income Deficit in Clarkson Valley?
Family Income Deficit in Clarkson Valley is $14,764.
Families that are below poverty line in Clarkson Valley earn $14,764 less on average than the poverty threshold level.
What is Inequality or Gini Index in Clarkson Valley?
Inequality or Gini Index in Clarkson Valley is 0.41.
What is the Total Population of Clarkson Valley?
Total Population of Clarkson Valley is 2,608.
What is the Total Male Population of Clarkson Valley?
Total Male Population of Clarkson Valley is 1,380.
What is the Total Female Population of Clarkson Valley?
Total Female Population of Clarkson Valley is 1,228.
What is the Ratio of Males per 100 Females in Clarkson Valley?
There are 112.38 Males per 100 Females in Clarkson Valley.
What is the Ratio of Females per 100 Males in Clarkson Valley?
There are 88.99 Females per 100 Males in Clarkson Valley.
What is the Median Population Age in Clarkson Valley?
Median Population Age in Clarkson Valley is 49.6 Years.
What is the Average Family Size in Clarkson Valley
Average Family Size in Clarkson Valley is 3.2 People.
What is the Average Household Size in Clarkson Valley
Average Household Size in Clarkson Valley is 2.9 People.
How Large is the Labor Force in Clarkson Valley?
There are 1,155 People in the Labor Forcein in Clarkson Valley.
What is the Percentage of People in the Labor Force in Clarkson Valley?
53.8% of People are in the Labor Force in Clarkson Valley.
What is the Unemployment Rate in Clarkson Valley?
Unemployment Rate in Clarkson Valley is 2.0%.