London, AR Map & Demographics
London Map
London Overview
$28,330
PER CAPITA INCOME
$60,250
AVG FAMILY INCOME
$50,750
AVG HOUSEHOLD INCOME
54.4%
WAGE / INCOME GAP [ % ]
45.6¢/ $1
WAGE / INCOME GAP [ $ ]
0.49
INEQUALITY / GINI INDEX
1,113
TOTAL POPULATION
536
MALE POPULATION
577
FEMALE POPULATION
92.89
MALES / 100 FEMALES
107.65
FEMALES / 100 MALES
30.7
MEDIAN AGE
3.4
AVG FAMILY SIZE
2.8
AVG HOUSEHOLD SIZE
517
LABOR FORCE [ PEOPLE ]
64.4%
PERCENT IN LABOR FORCE
4.7%
UNEMPLOYMENT RATE
London Zip Codes
London Area Codes
Income in London
Income Overview in London
Per Capita Income in London is $28,330, while median incomes of families and households are $60,250 and $50,750 respectively.
| Characteristic | Number | Measure |
| Per Capita Income | 1,113 | $28,330 |
| Median Family Income | 275 | $60,250 |
| Mean Family Income | 275 | $77,808 |
| Median Household Income | 400 | $50,750 |
| Mean Household Income | 400 | $73,224 |
| Income Deficit | 275 | $0 |
| Wage / Income Gap (%) | 1,113 | 54.36% |
| Wage / Income Gap ($) | 1,113 | 45.64¢ per $1 |
| Gini / Inequality Index | 1,113 | 0.49 |
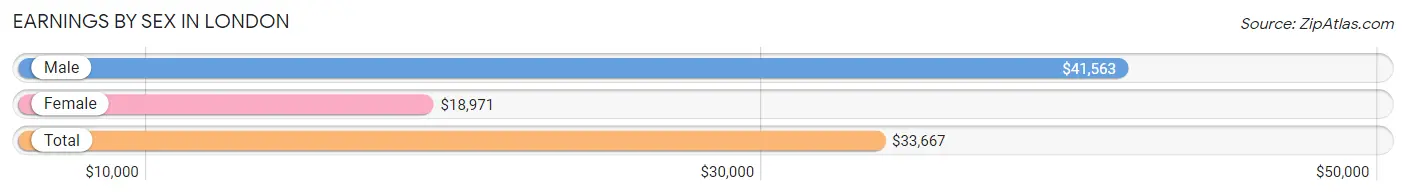
Earnings by Sex in London
Average Earnings in London are $33,667, $41,563 for men and $18,971 for women, a difference of 54.4%.
| Sex | Number | Average Earnings |
| Male | 252 (48.5%) | $41,563 |
| Female | 268 (51.5%) | $18,971 |
| Total | 520 (100.0%) | $33,667 |
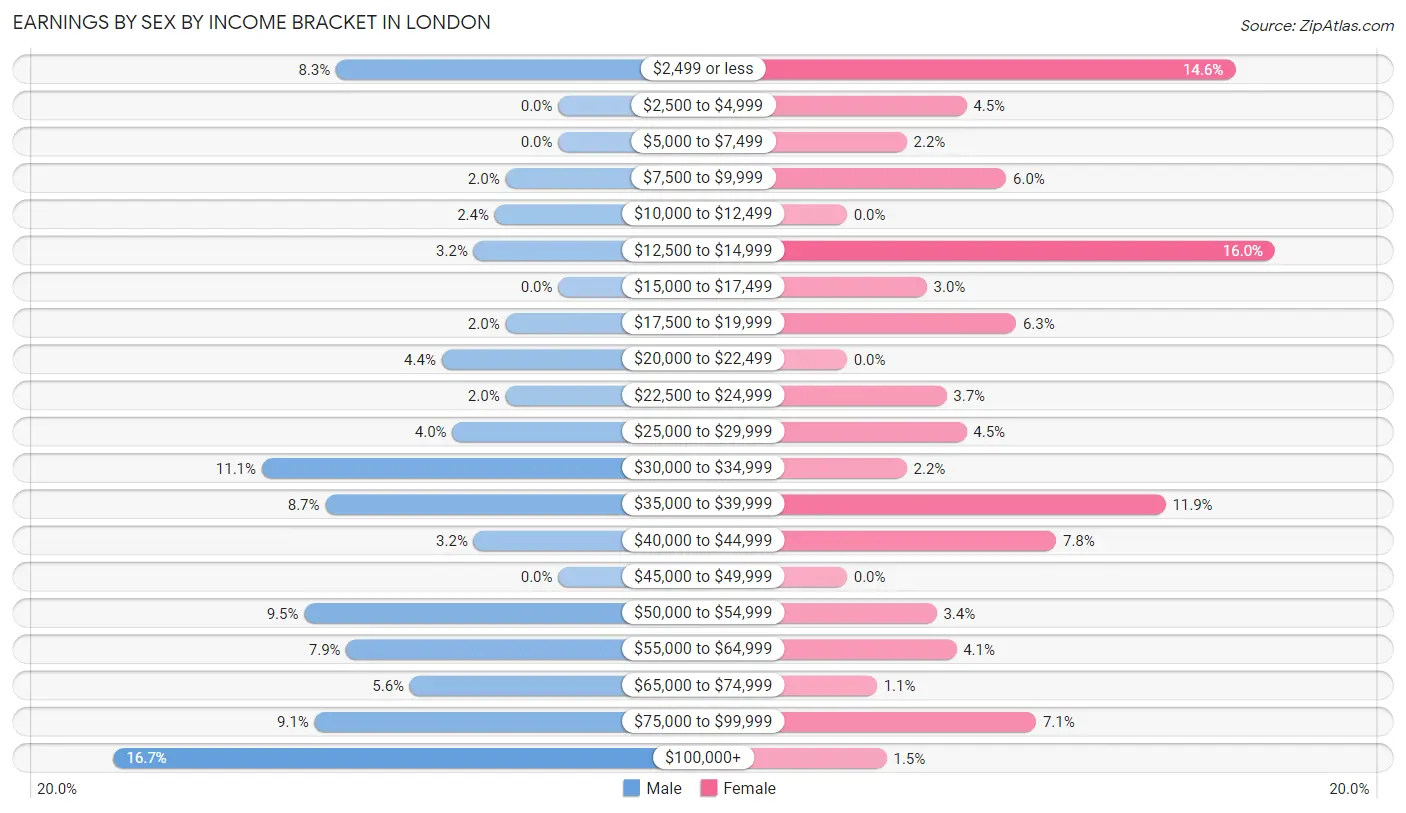
Earnings by Sex by Income Bracket in London
The most common earnings brackets in London are $100,000+ for men (42 | 16.7%) and $12,500 to $14,999 for women (43 | 16.0%).
| Income | Male | Female |
| $2,499 or less | 21 (8.3%) | 39 (14.5%) |
| $2,500 to $4,999 | 0 (0.0%) | 12 (4.5%) |
| $5,000 to $7,499 | 0 (0.0%) | 6 (2.2%) |
| $7,500 to $9,999 | 5 (2.0%) | 16 (6.0%) |
| $10,000 to $12,499 | 6 (2.4%) | 0 (0.0%) |
| $12,500 to $14,999 | 8 (3.2%) | 43 (16.0%) |
| $15,000 to $17,499 | 0 (0.0%) | 8 (3.0%) |
| $17,500 to $19,999 | 5 (2.0%) | 17 (6.3%) |
| $20,000 to $22,499 | 11 (4.4%) | 0 (0.0%) |
| $22,500 to $24,999 | 5 (2.0%) | 10 (3.7%) |
| $25,000 to $29,999 | 10 (4.0%) | 12 (4.5%) |
| $30,000 to $34,999 | 28 (11.1%) | 6 (2.2%) |
| $35,000 to $39,999 | 22 (8.7%) | 32 (11.9%) |
| $40,000 to $44,999 | 8 (3.2%) | 21 (7.8%) |
| $45,000 to $49,999 | 0 (0.0%) | 0 (0.0%) |
| $50,000 to $54,999 | 24 (9.5%) | 9 (3.4%) |
| $55,000 to $64,999 | 20 (7.9%) | 11 (4.1%) |
| $65,000 to $74,999 | 14 (5.6%) | 3 (1.1%) |
| $75,000 to $99,999 | 23 (9.1%) | 19 (7.1%) |
| $100,000+ | 42 (16.7%) | 4 (1.5%) |
| Total | 252 (100.0%) | 268 (100.0%) |
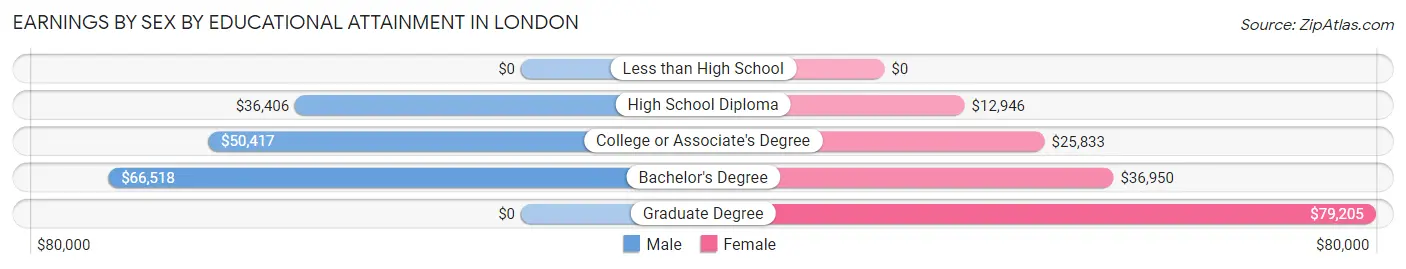
Earnings by Sex by Educational Attainment in London
Average earnings in London are $52,708 for men and $29,583 for women, a difference of 43.9%. Men with an educational attainment of bachelor's degree enjoy the highest average annual earnings of $66,518, while those with high school diploma education earn the least with $36,406. Women with an educational attainment of graduate degree earn the most with the average annual earnings of $79,205, while those with high school diploma education have the smallest earnings of $12,946.
| Educational Attainment | Male Income | Female Income |
| Less than High School | - | - |
| High School Diploma | $36,406 | $12,946 |
| College or Associate's Degree | $50,417 | $25,833 |
| Bachelor's Degree | $66,518 | $36,950 |
| Graduate Degree | - | - |
| Total | $52,708 | $29,583 |
Family Income in London
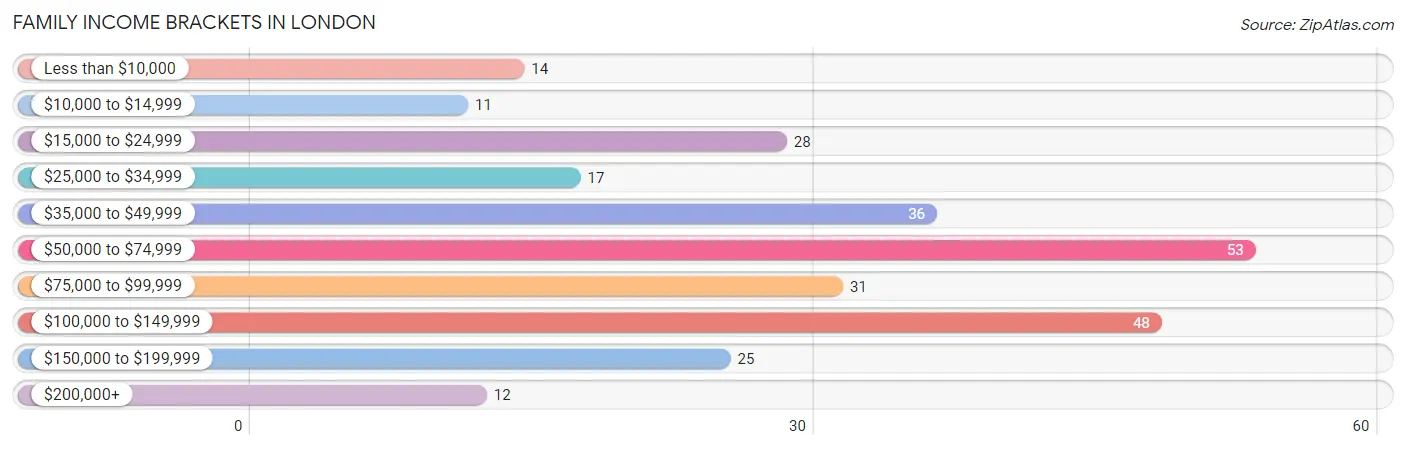
Family Income Brackets in London
According to the London family income data, there are 53 families falling into the $50,000 to $74,999 income range, which is the most common income bracket and makes up 19.3% of all families. Conversely, the $10,000 to $14,999 income bracket is the least frequent group with only 11 families (4.0%) belonging to this category.
| Income Bracket | # Families | % Families |
| Less than $10,000 | 14 | 5.1% |
| $10,000 to $14,999 | 11 | 4.0% |
| $15,000 to $24,999 | 28 | 10.2% |
| $25,000 to $34,999 | 17 | 6.2% |
| $35,000 to $49,999 | 36 | 13.1% |
| $50,000 to $74,999 | 53 | 19.3% |
| $75,000 to $99,999 | 31 | 11.3% |
| $100,000 to $149,999 | 48 | 17.5% |
| $150,000 to $199,999 | 25 | 9.1% |
| $200,000+ | 12 | 4.4% |
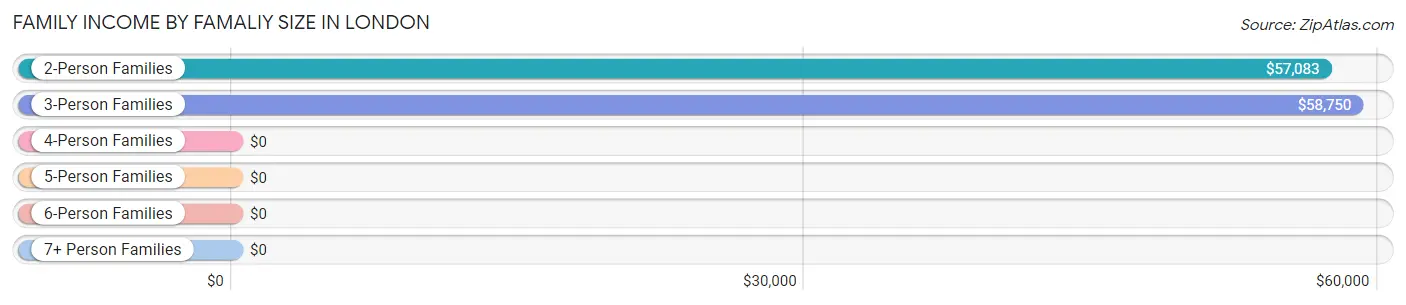
Family Income by Famaliy Size in London
3-person families (91 | 33.1%) account for the highest median family income in London with $58,750 per family, while 2-person families (103 | 37.4%) have the highest median income of $28,542 per family member.
| Income Bracket | # Families | Median Income |
| 2-Person Families | 103 (37.4%) | $57,083 |
| 3-Person Families | 91 (33.1%) | $58,750 |
| 4-Person Families | 41 (14.9%) | $0 |
| 5-Person Families | 14 (5.1%) | $0 |
| 6-Person Families | 20 (7.3%) | $0 |
| 7+ Person Families | 6 (2.2%) | $0 |
| Total | 275 (100.0%) | $60,250 |
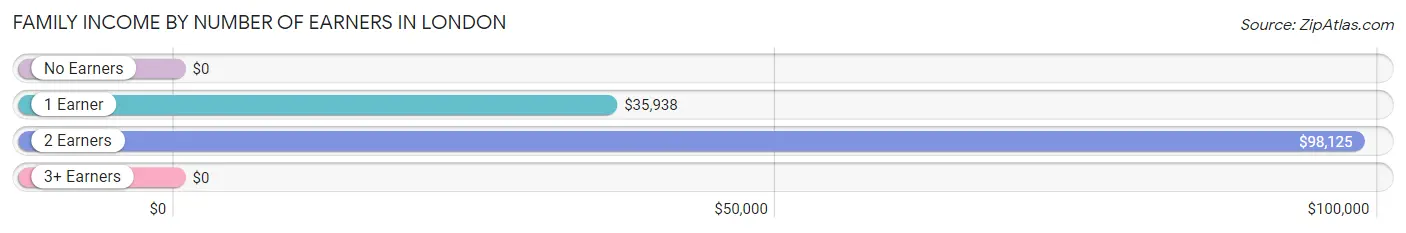
Family Income by Number of Earners in London
| Number of Earners | # Families | Median Income |
| No Earners | 18 (6.6%) | $0 |
| 1 Earner | 126 (45.8%) | $35,938 |
| 2 Earners | 125 (45.5%) | $98,125 |
| 3+ Earners | 6 (2.2%) | $0 |
| Total | 275 (100.0%) | $60,250 |
Household Income in London
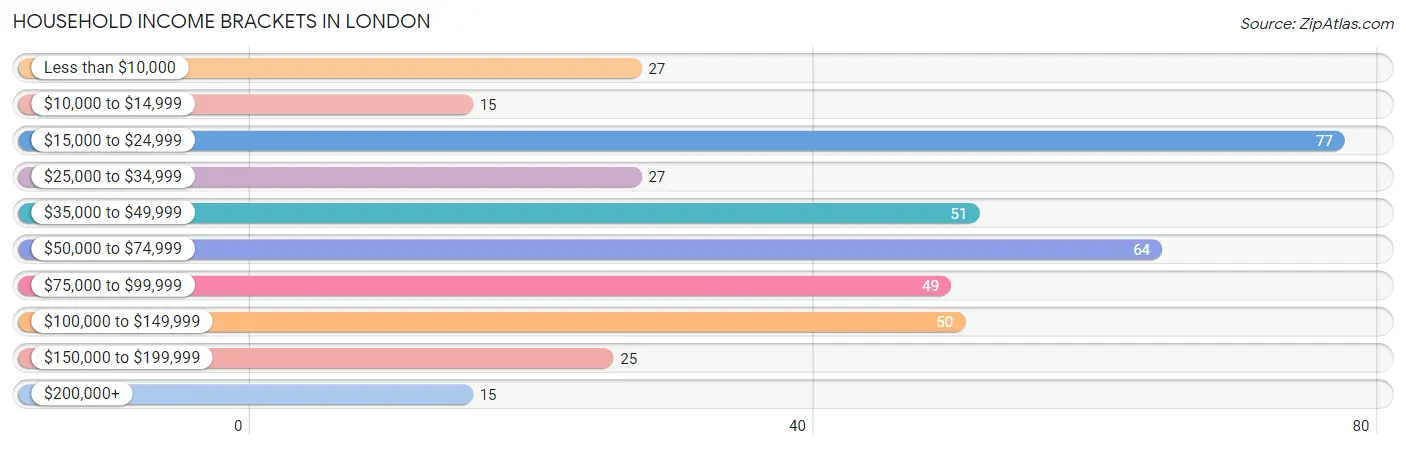
Household Income Brackets in London
With 77 households falling in the category, the $15,000 to $24,999 income range is the most frequent in London, accounting for 19.3% of all households. In contrast, only 15 households (3.7%) fall into the $10,000 to $14,999 income bracket, making it the least populous group.
| Income Bracket | # Households | % Households |
| Less than $10,000 | 27 | 6.8% |
| $10,000 to $14,999 | 15 | 3.8% |
| $15,000 to $24,999 | 77 | 19.3% |
| $25,000 to $34,999 | 27 | 6.8% |
| $35,000 to $49,999 | 51 | 12.8% |
| $50,000 to $74,999 | 64 | 16.0% |
| $75,000 to $99,999 | 49 | 12.3% |
| $100,000 to $149,999 | 50 | 12.5% |
| $150,000 to $199,999 | 25 | 6.3% |
| $200,000+ | 15 | 3.8% |
Household Income by Householder Age in London
The median household income in London is $50,750, with the highest median household income of $57,778 found in the 25 to 44 years age bracket for the primary householder. A total of 178 households (44.5%) fall into this category. Meanwhile, the 65+ years age bracket for the primary householder has the lowest median household income of $24,545, with 60 households (15.0%) in this group.
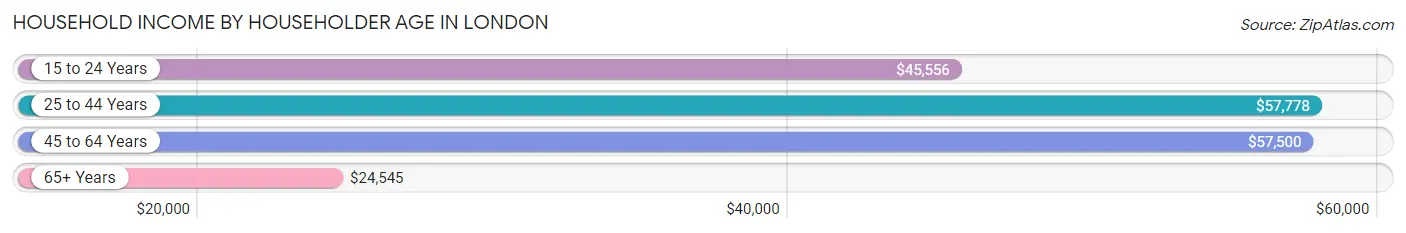
| Income Bracket | # Households | Median Income |
| 15 to 24 Years | 20 (5.0%) | $45,556 |
| 25 to 44 Years | 178 (44.5%) | $57,778 |
| 45 to 64 Years | 142 (35.5%) | $57,500 |
| 65+ Years | 60 (15.0%) | $24,545 |
| Total | 400 (100.0%) | $50,750 |
Poverty in London
Income Below Poverty by Sex and Age in London
With 25.9% poverty level for males and 28.8% for females among the residents of London, under 5 year old males and 16 and 17 year old females are the most vulnerable to poverty, with 25 males (56.8%) and 11 females (78.6%) in their respective age groups living below the poverty level.
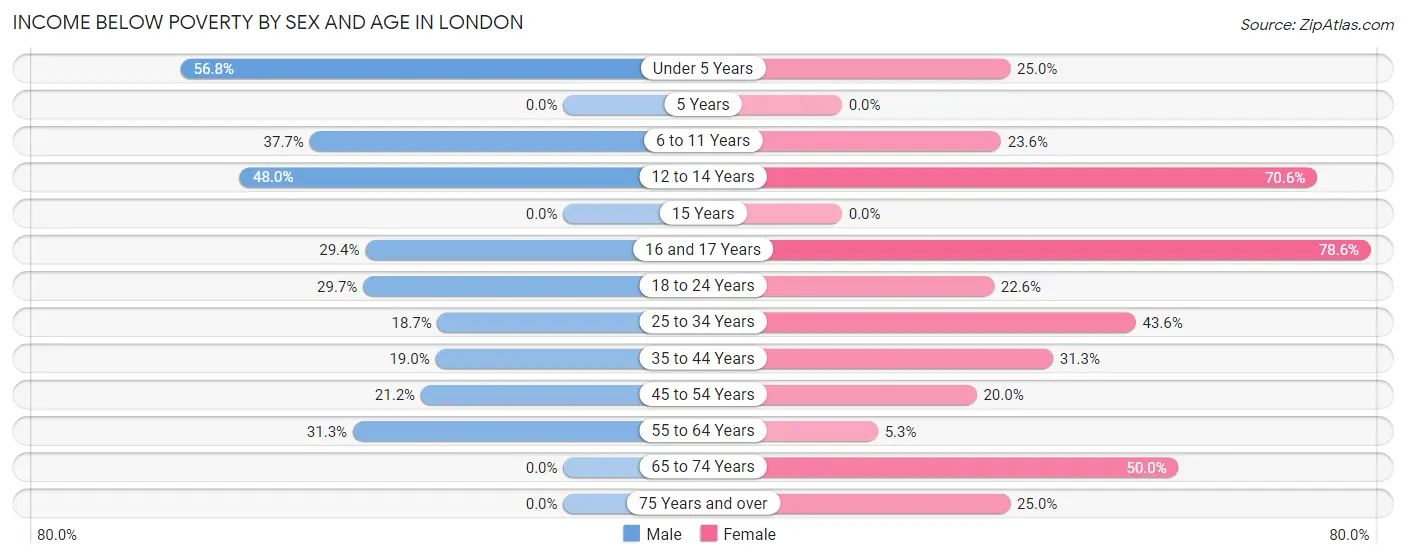
| Age Bracket | Male | Female |
| Under 5 Years | 25 (56.8%) | 13 (25.0%) |
| 5 Years | 0 (0.0%) | 0 (0.0%) |
| 6 to 11 Years | 26 (37.7%) | 17 (23.6%) |
| 12 to 14 Years | 12 (48.0%) | 12 (70.6%) |
| 15 Years | 0 (0.0%) | 0 (0.0%) |
| 16 and 17 Years | 5 (29.4%) | 11 (78.6%) |
| 18 to 24 Years | 11 (29.7%) | 14 (22.6%) |
| 25 to 34 Years | 14 (18.7%) | 41 (43.6%) |
| 35 to 44 Years | 15 (19.0%) | 26 (31.3%) |
| 45 to 54 Years | 11 (21.1%) | 14 (20.0%) |
| 55 to 64 Years | 20 (31.2%) | 4 (5.3%) |
| 65 to 74 Years | 0 (0.0%) | 11 (50.0%) |
| 75 Years and over | 0 (0.0%) | 3 (25.0%) |
| Total | 139 (25.9%) | 166 (28.8%) |
Income Above Poverty by Sex and Age in London
According to the poverty statistics in London, males aged 5 years and females aged 5 years are the age groups that are most secure financially, with 100.0% of males and 100.0% of females in these age groups living above the poverty line.
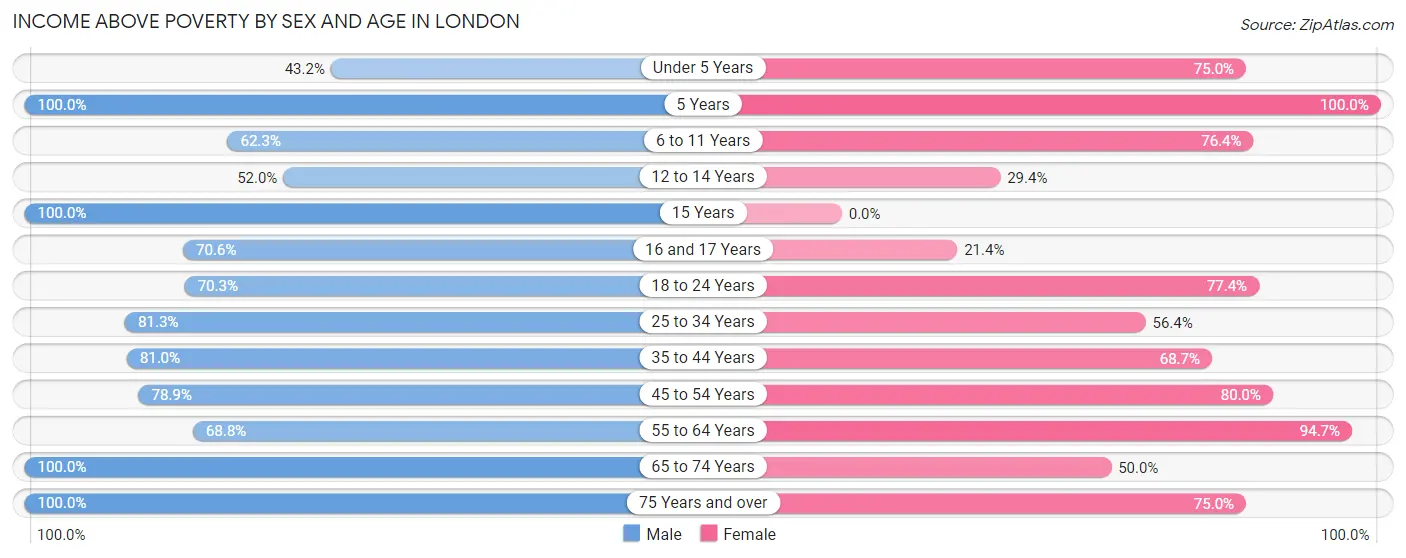
| Age Bracket | Male | Female |
| Under 5 Years | 19 (43.2%) | 39 (75.0%) |
| 5 Years | 3 (100.0%) | 4 (100.0%) |
| 6 to 11 Years | 43 (62.3%) | 55 (76.4%) |
| 12 to 14 Years | 13 (52.0%) | 5 (29.4%) |
| 15 Years | 24 (100.0%) | 0 (0.0%) |
| 16 and 17 Years | 12 (70.6%) | 3 (21.4%) |
| 18 to 24 Years | 26 (70.3%) | 48 (77.4%) |
| 25 to 34 Years | 61 (81.3%) | 53 (56.4%) |
| 35 to 44 Years | 64 (81.0%) | 57 (68.7%) |
| 45 to 54 Years | 41 (78.8%) | 56 (80.0%) |
| 55 to 64 Years | 44 (68.8%) | 71 (94.7%) |
| 65 to 74 Years | 38 (100.0%) | 11 (50.0%) |
| 75 Years and over | 9 (100.0%) | 9 (75.0%) |
| Total | 397 (74.1%) | 411 (71.2%) |
Income Below Poverty Among Married-Couple Families in London
The poverty statistics for married-couple families in London show that 6.0% or 12 of the total 200 families live below the poverty line. Families with 3 or 4 children have the highest poverty rate of 33.3%, comprising of 12 families. On the other hand, families with no children have the lowest poverty rate of 0.0%, which includes 0 families.
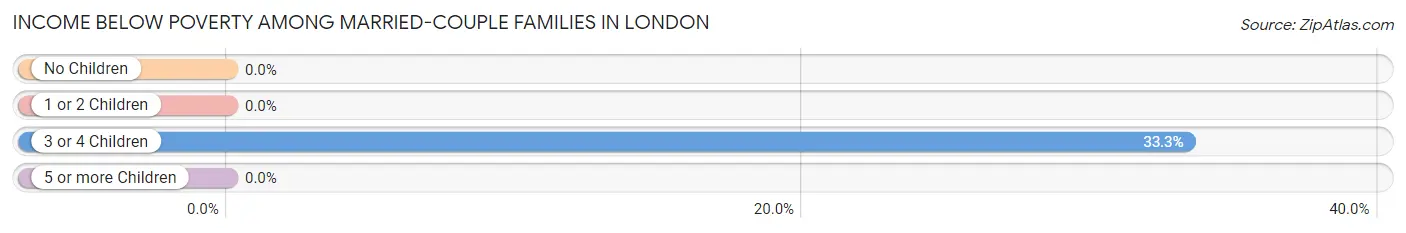
| Children | Above Poverty | Below Poverty |
| No Children | 90 (100.0%) | 0 (0.0%) |
| 1 or 2 Children | 74 (100.0%) | 0 (0.0%) |
| 3 or 4 Children | 24 (66.7%) | 12 (33.3%) |
| 5 or more Children | 0 (0.0%) | 0 (0.0%) |
| Total | 188 (94.0%) | 12 (6.0%) |
Income Below Poverty Among Single-Parent Households in London
According to the poverty data in London, 21.4% or 3 single-father households and 82.0% or 50 single-mother households are living below the poverty line. Among single-father households, those with 1 or 2 children have the highest poverty rate, with 3 households (33.3%) experiencing poverty. Likewise, among single-mother households, those with 3 or 4 children have the highest poverty rate, with 6 households (100.0%) falling below the poverty line.
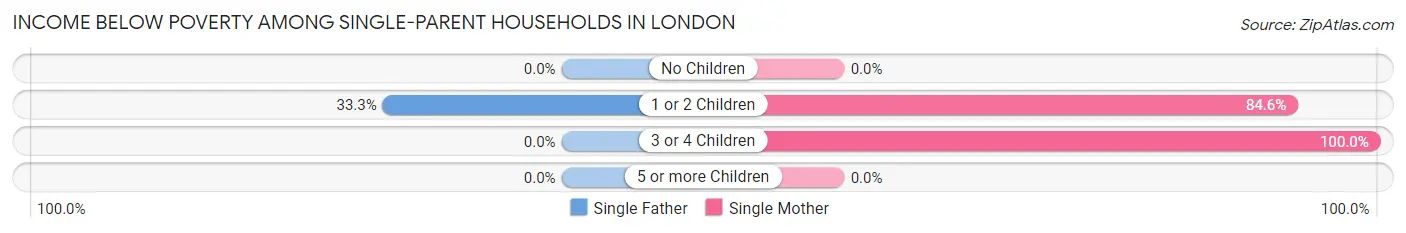
| Children | Single Father | Single Mother |
| No Children | 0 (0.0%) | 0 (0.0%) |
| 1 or 2 Children | 3 (33.3%) | 44 (84.6%) |
| 3 or 4 Children | 0 (0.0%) | 6 (100.0%) |
| 5 or more Children | 0 (0.0%) | 0 (0.0%) |
| Total | 3 (21.4%) | 50 (82.0%) |
Income Below Poverty Among Married-Couple vs Single-Parent Households in London
The poverty data for London shows that 12 of the married-couple family households (6.0%) and 53 of the single-parent households (70.7%) are living below the poverty level. Within the married-couple family households, those with 3 or 4 children have the highest poverty rate, with 12 households (33.3%) falling below the poverty line. Among the single-parent households, those with 3 or 4 children have the highest poverty rate, with 6 household (100.0%) living below poverty.
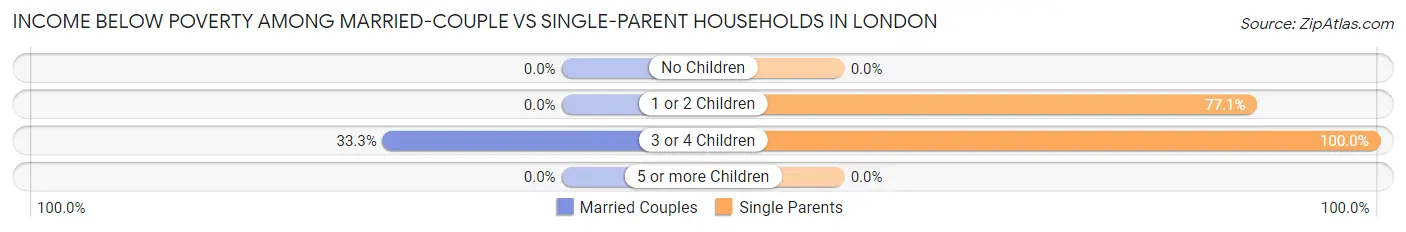
| Children | Married-Couple Families | Single-Parent Households |
| No Children | 0 (0.0%) | 0 (0.0%) |
| 1 or 2 Children | 0 (0.0%) | 47 (77.0%) |
| 3 or 4 Children | 12 (33.3%) | 6 (100.0%) |
| 5 or more Children | 0 (0.0%) | 0 (0.0%) |
| Total | 12 (6.0%) | 53 (70.7%) |
Race in London
The most populous races in London are White / Caucasian (1,026 | 92.2%), Two or more Races (52 | 4.7%), and Hispanic or Latino (37 | 3.3%).
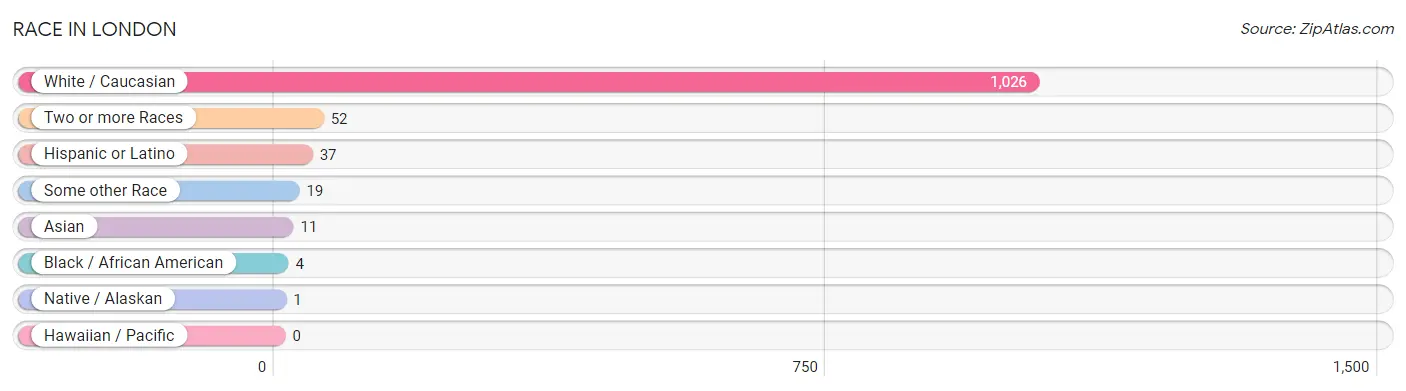
| Race | # Population | % Population |
| Asian | 11 | 1.0% |
| Black / African American | 4 | 0.4% |
| Hawaiian / Pacific | 0 | 0.0% |
| Hispanic or Latino | 37 | 3.3% |
| Native / Alaskan | 1 | 0.1% |
| White / Caucasian | 1,026 | 92.2% |
| Two or more Races | 52 | 4.7% |
| Some other Race | 19 | 1.7% |
| Total | 1,113 | 100.0% |
Ancestry in London
The most populous ancestries reported in London are American (207 | 18.6%), Irish (159 | 14.3%), English (135 | 12.1%), German (103 | 9.2%), and Scottish (73 | 6.6%), together accounting for 60.8% of all London residents.
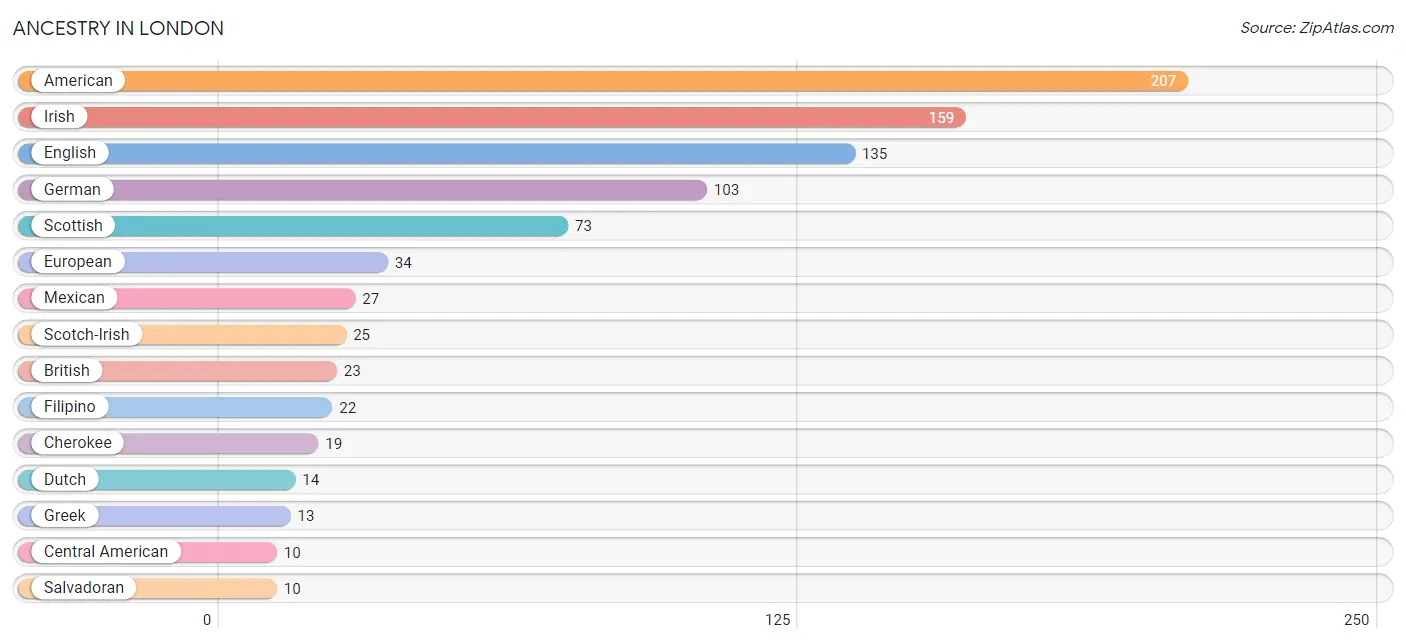
| Ancestry | # Population | % Population |
| American | 207 | 18.6% |
| British | 23 | 2.1% |
| Central American | 10 | 0.9% |
| Cherokee | 19 | 1.7% |
| Choctaw | 1 | 0.1% |
| Dutch | 14 | 1.3% |
| English | 135 | 12.1% |
| European | 34 | 3.0% |
| Filipino | 22 | 2.0% |
| German | 103 | 9.2% |
| Greek | 13 | 1.2% |
| Irish | 159 | 14.3% |
| Mexican | 27 | 2.4% |
| Norwegian | 6 | 0.5% |
| Polish | 3 | 0.3% |
| Portuguese | 7 | 0.6% |
| Russian | 4 | 0.4% |
| Salvadoran | 10 | 0.9% |
| Scotch-Irish | 25 | 2.2% |
| Scottish | 73 | 6.6% |
| Swedish | 2 | 0.2% |
| Welsh | 2 | 0.2% | View All 22 Rows |
Immigrants in London
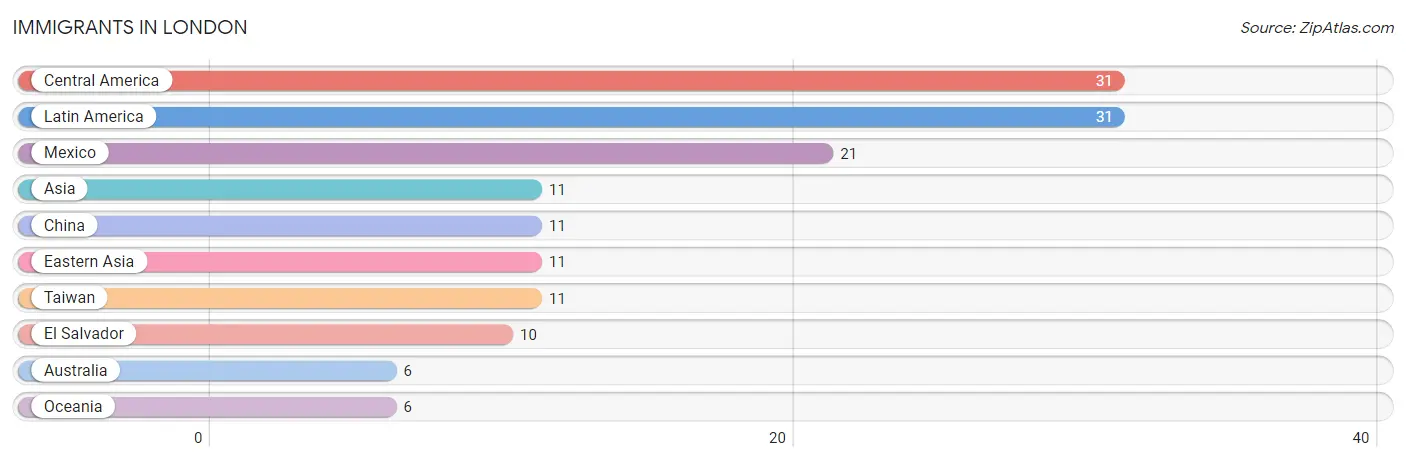
The most numerous immigrant groups reported in London came from Central America (31 | 2.8%), Latin America (31 | 2.8%), Mexico (21 | 1.9%), Asia (11 | 1.0%), and China (11 | 1.0%), together accounting for 9.5% of all London residents.
| Immigration Origin | # Population | % Population |
| Asia | 11 | 1.0% |
| Australia | 6 | 0.5% |
| Central America | 31 | 2.8% |
| China | 11 | 1.0% |
| Eastern Asia | 11 | 1.0% |
| El Salvador | 10 | 0.9% |
| Latin America | 31 | 2.8% |
| Mexico | 21 | 1.9% |
| Oceania | 6 | 0.5% |
| Taiwan | 11 | 1.0% | View All 10 Rows |
Sex and Age in London
Sex and Age in London
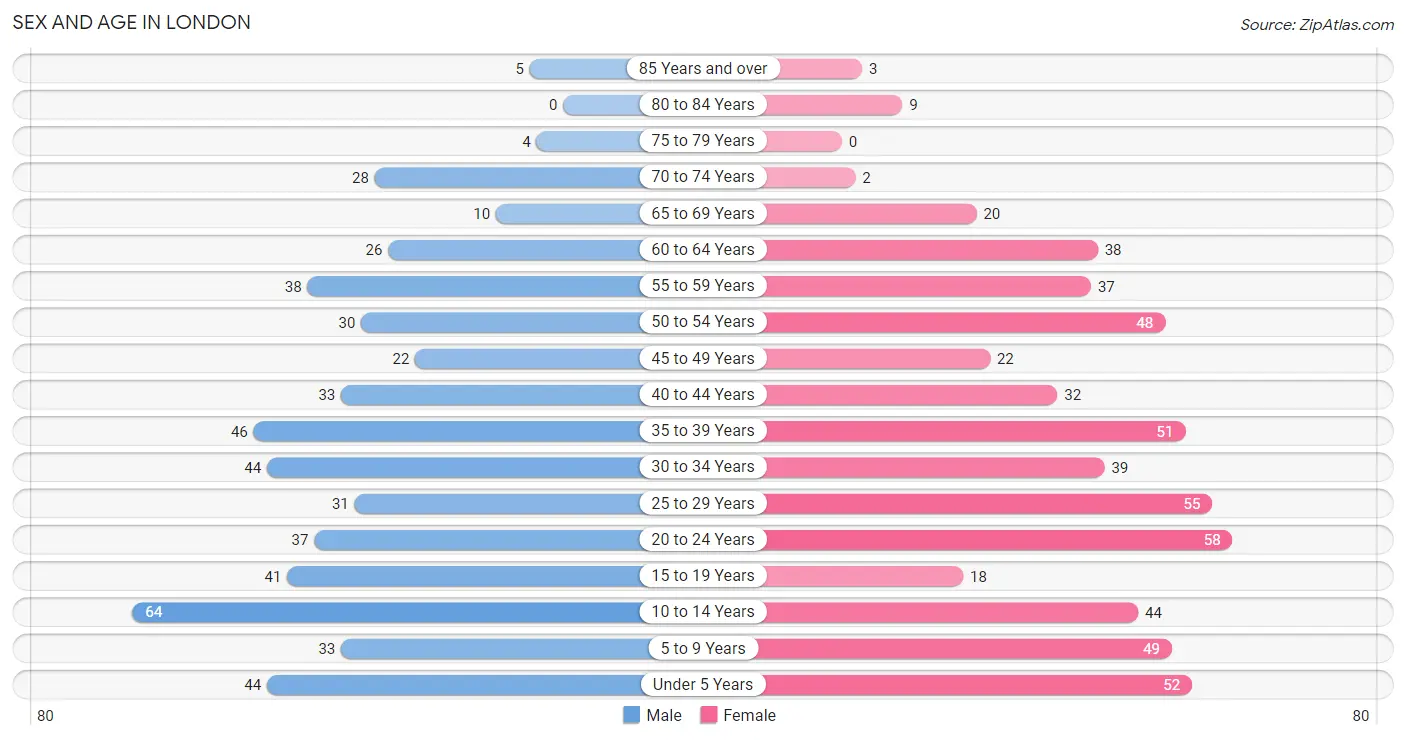
The most populous age groups in London are 10 to 14 Years (64 | 11.9%) for men and 20 to 24 Years (58 | 10.1%) for women.
| Age Bracket | Male | Female |
| Under 5 Years | 44 (8.2%) | 52 (9.0%) |
| 5 to 9 Years | 33 (6.2%) | 49 (8.5%) |
| 10 to 14 Years | 64 (11.9%) | 44 (7.6%) |
| 15 to 19 Years | 41 (7.6%) | 18 (3.1%) |
| 20 to 24 Years | 37 (6.9%) | 58 (10.1%) |
| 25 to 29 Years | 31 (5.8%) | 55 (9.5%) |
| 30 to 34 Years | 44 (8.2%) | 39 (6.8%) |
| 35 to 39 Years | 46 (8.6%) | 51 (8.8%) |
| 40 to 44 Years | 33 (6.2%) | 32 (5.6%) |
| 45 to 49 Years | 22 (4.1%) | 22 (3.8%) |
| 50 to 54 Years | 30 (5.6%) | 48 (8.3%) |
| 55 to 59 Years | 38 (7.1%) | 37 (6.4%) |
| 60 to 64 Years | 26 (4.9%) | 38 (6.6%) |
| 65 to 69 Years | 10 (1.9%) | 20 (3.5%) |
| 70 to 74 Years | 28 (5.2%) | 2 (0.4%) |
| 75 to 79 Years | 4 (0.7%) | 0 (0.0%) |
| 80 to 84 Years | 0 (0.0%) | 9 (1.6%) |
| 85 Years and over | 5 (0.9%) | 3 (0.5%) |
| Total | 536 (100.0%) | 577 (100.0%) |
Families and Households in London
Median Family Size in London
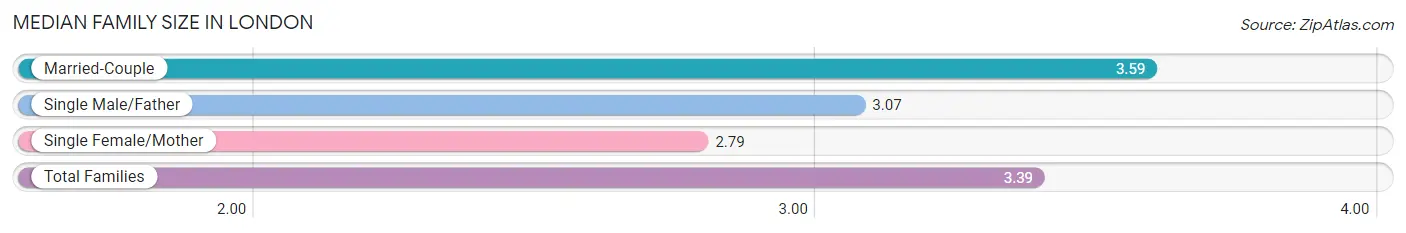
The median family size in London is 3.39 persons per family, with married-couple families (200 | 72.7%) accounting for the largest median family size of 3.59 persons per family. On the other hand, single female/mother families (61 | 22.2%) represent the smallest median family size with 2.79 persons per family.
| Family Type | # Families | Family Size |
| Married-Couple | 200 (72.7%) | 3.59 |
| Single Male/Father | 14 (5.1%) | 3.07 |
| Single Female/Mother | 61 (22.2%) | 2.79 |
| Total Families | 275 (100.0%) | 3.39 |
Median Household Size in London
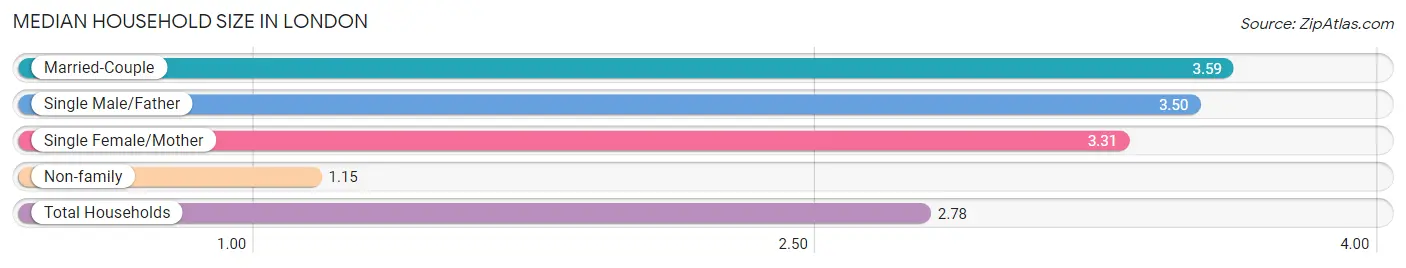
The median household size in London is 2.78 persons per household, with married-couple households (200 | 50.0%) accounting for the largest median household size of 3.59 persons per household. non-family households (125 | 31.2%) represent the smallest median household size with 1.15 persons per household.
| Household Type | # Households | Household Size |
| Married-Couple | 200 (50.0%) | 3.59 |
| Single Male/Father | 14 (3.5%) | 3.50 |
| Single Female/Mother | 61 (15.2%) | 3.31 |
| Non-family | 125 (31.2%) | 1.15 |
| Total Households | 400 (100.0%) | 2.78 |
Household Size by Marriage Status in London
Out of a total of 400 households in London, 275 (68.8%) are family households, while 125 (31.2%) are nonfamily households. The most numerous type of family households are 2-person households, comprising 89, and the most common type of nonfamily households are 1-person households, comprising 105.
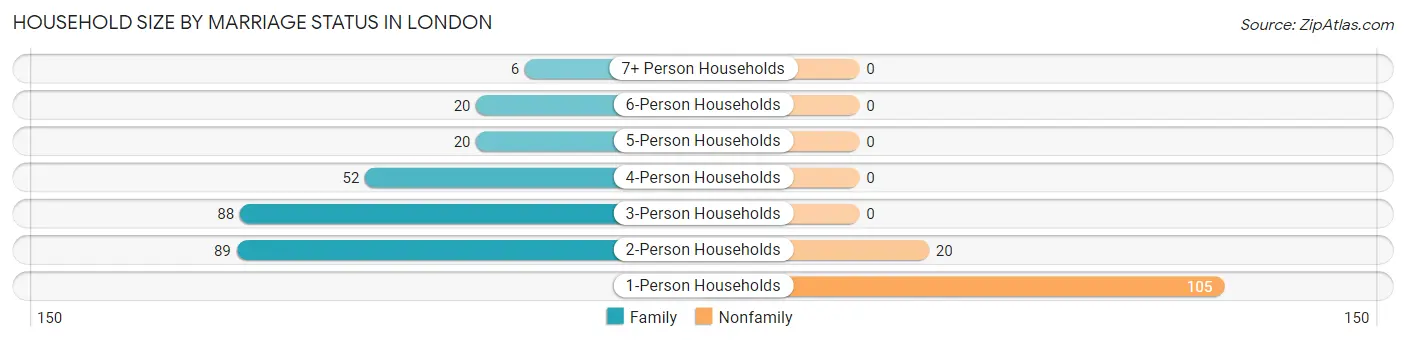
| Household Size | Family Households | Nonfamily Households |
| 1-Person Households | - | 105 (26.3%) |
| 2-Person Households | 89 (22.3%) | 20 (5.0%) |
| 3-Person Households | 88 (22.0%) | 0 (0.0%) |
| 4-Person Households | 52 (13.0%) | 0 (0.0%) |
| 5-Person Households | 20 (5.0%) | 0 (0.0%) |
| 6-Person Households | 20 (5.0%) | 0 (0.0%) |
| 7+ Person Households | 6 (1.5%) | 0 (0.0%) |
| Total | 275 (68.8%) | 125 (31.2%) |
Female Fertility in London
Fertility by Age in London
Average fertility rate in London is 35.0 births per 1,000 women. Women in the age bracket of 20 to 34 years have the highest fertility rate with 66.0 births per 1,000 women. Women in the age bracket of 20 to 34 years acount for 100.0% of all women with births.
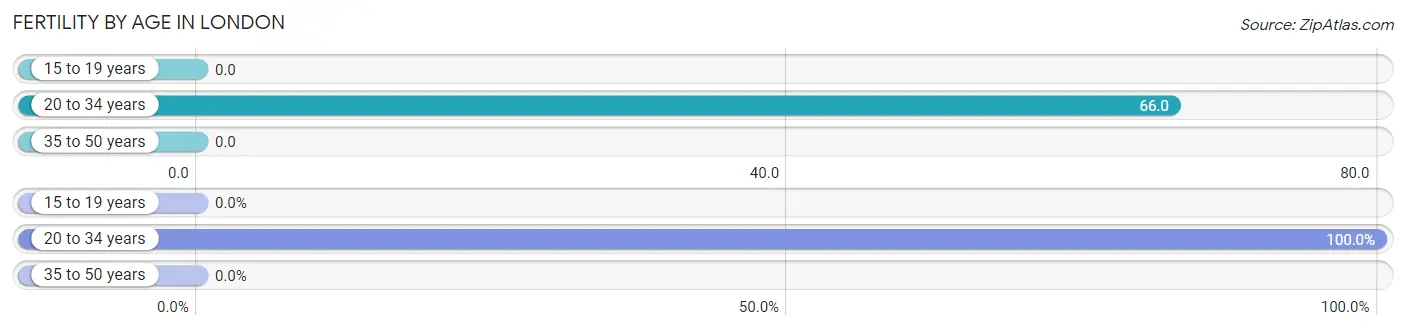
| Age Bracket | Women with Births | Births / 1,000 Women |
| 15 to 19 years | 0 (0.0%) | 0.0 |
| 20 to 34 years | 10 (100.0%) | 66.0 |
| 35 to 50 years | 0 (0.0%) | 0.0 |
| Total | 10 (100.0%) | 35.0 |
Fertility by Age by Marriage Status in London
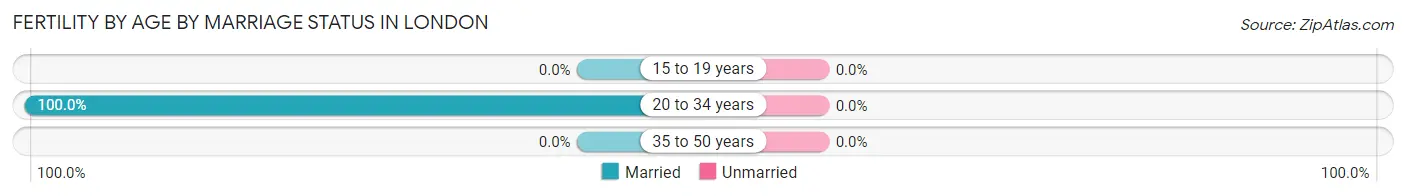
| Age Bracket | Married | Unmarried |
| 15 to 19 years | 0 (0.0%) | 0 (0.0%) |
| 20 to 34 years | 10 (100.0%) | 0 (0.0%) |
| 35 to 50 years | 0 (0.0%) | 0 (0.0%) |
| Total | 10 (100.0%) | 0 (0.0%) |
Fertility by Education in London
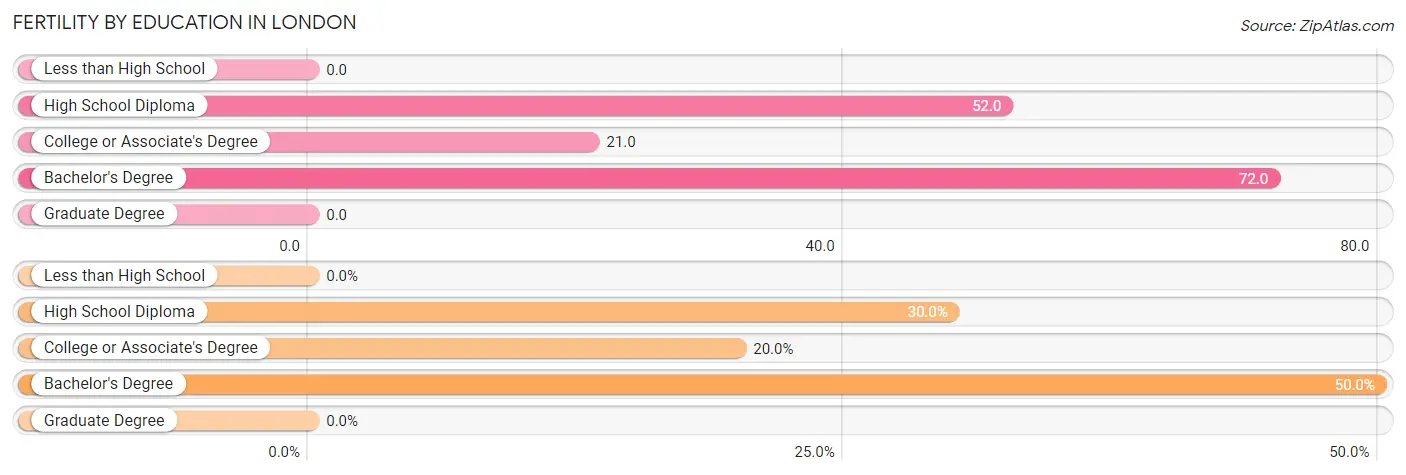
| Educational Attainment | Women with Births | Births / 1,000 Women |
| Less than High School | 0 (0.0%) | 0.0 |
| High School Diploma | 3 (30.0%) | 52.0 |
| College or Associate's Degree | 2 (20.0%) | 21.0 |
| Bachelor's Degree | 5 (50.0%) | 72.0 |
| Graduate Degree | 0 (0.0%) | 0.0 |
| Total | 10 (100.0%) | 35.0 |
Fertility by Education by Marriage Status in London
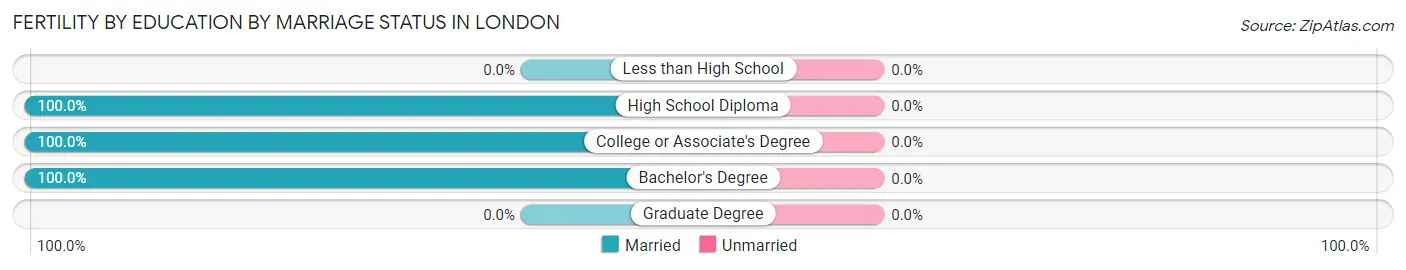
| Educational Attainment | Married | Unmarried |
| Less than High School | 0 (0.0%) | 0 (0.0%) |
| High School Diploma | 3 (100.0%) | 0 (0.0%) |
| College or Associate's Degree | 2 (100.0%) | 0 (0.0%) |
| Bachelor's Degree | 5 (100.0%) | 0 (0.0%) |
| Graduate Degree | 0 (0.0%) | 0 (0.0%) |
| Total | 10 (100.0%) | 0 (0.0%) |
Employment Characteristics in London
Employment by Class of Employer in London
Among the 490 employed individuals in London, private company employees (322 | 65.7%), state government employees (43 | 8.8%), and self-employed (not incorporated) (31 | 6.3%) make up the most common classes of employment.
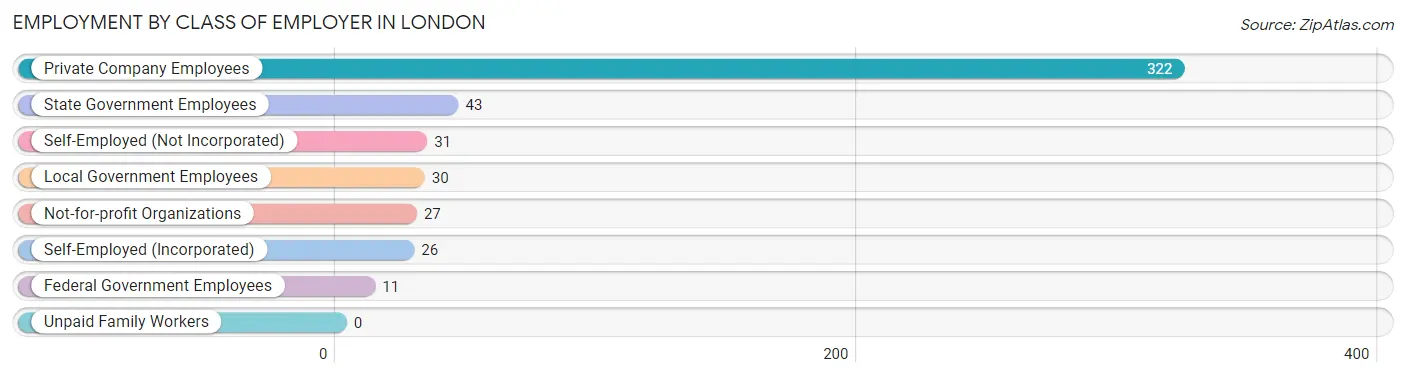
| Employer Class | # Employees | % Employees |
| Private Company Employees | 322 | 65.7% |
| Self-Employed (Incorporated) | 26 | 5.3% |
| Self-Employed (Not Incorporated) | 31 | 6.3% |
| Not-for-profit Organizations | 27 | 5.5% |
| Local Government Employees | 30 | 6.1% |
| State Government Employees | 43 | 8.8% |
| Federal Government Employees | 11 | 2.2% |
| Unpaid Family Workers | 0 | 0.0% |
| Total | 490 | 100.0% |
Employment Status by Age in London
According to the labor force statistics for London, out of the total population over 16 years of age (803), 64.4% or 517 individuals are in the labor force, with 4.7% or 24 of them unemployed. The age group with the highest labor force participation rate is 25 to 29 years, with 96.5% or 83 individuals in the labor force. Within the labor force, the 16 to 19 years age range has the highest percentage of unemployed individuals, with 63.6% or 7 of them being unemployed.
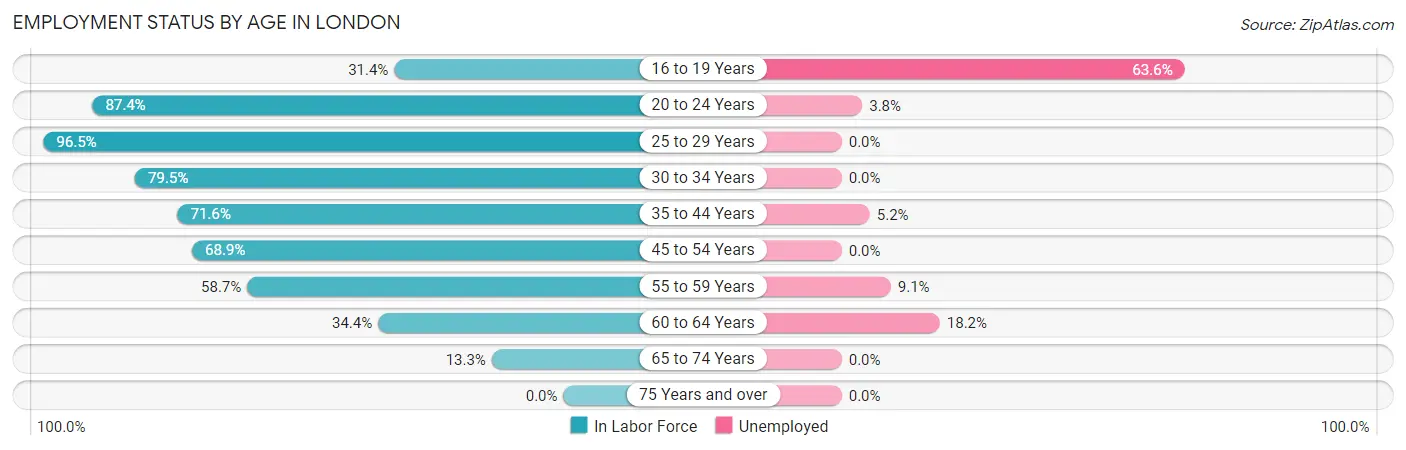
| Age Bracket | In Labor Force | Unemployed |
| 16 to 19 Years | 11 (31.4%) | 7 (63.6%) |
| 20 to 24 Years | 83 (87.4%) | 3 (3.8%) |
| 25 to 29 Years | 83 (96.5%) | 0 (0.0%) |
| 30 to 34 Years | 66 (79.5%) | 0 (0.0%) |
| 35 to 44 Years | 116 (71.6%) | 6 (5.2%) |
| 45 to 54 Years | 84 (68.9%) | 0 (0.0%) |
| 55 to 59 Years | 44 (58.7%) | 4 (9.1%) |
| 60 to 64 Years | 22 (34.4%) | 4 (18.2%) |
| 65 to 74 Years | 8 (13.3%) | 0 (0.0%) |
| 75 Years and over | 0 (0.0%) | 0 (0.0%) |
| Total | 517 (64.4%) | 24 (4.7%) |
Employment Status by Educational Attainment in London
According to labor force statistics for London, 70.1% of individuals (415) out of the total population between 25 and 64 years of age (592) are in the labor force, with 3.4% or 14 of them being unemployed. The group with the highest labor force participation rate are those with the educational attainment of bachelor's degree or higher, with 81.3% or 148 individuals in the labor force. Within the labor force, individuals with less than high school education have the highest percentage of unemployment, with 21.4% or 6 of them being unemployed.
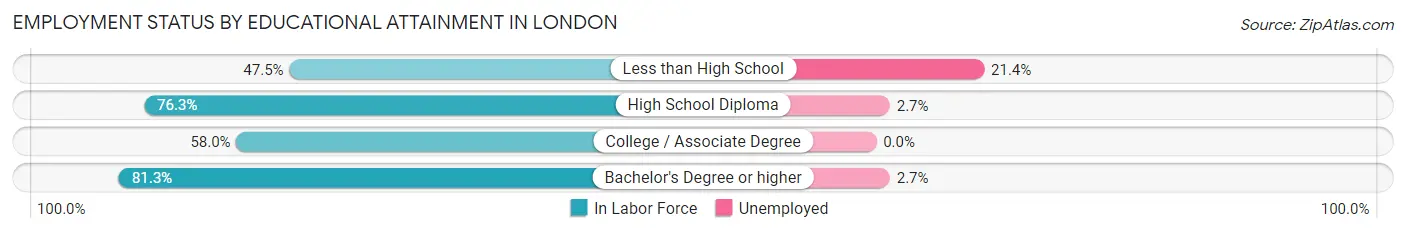
| Educational Attainment | In Labor Force | Unemployed |
| Less than High School | 28 (47.5%) | 13 (21.4%) |
| High School Diploma | 148 (76.3%) | 5 (2.7%) |
| College / Associate Degree | 91 (58.0%) | 0 (0.0%) |
| Bachelor's Degree or higher | 148 (81.3%) | 5 (2.7%) |
| Total | 415 (70.1%) | 20 (3.4%) |
Employment Occupations by Sex in London
Management, Business, Science and Arts Occupations
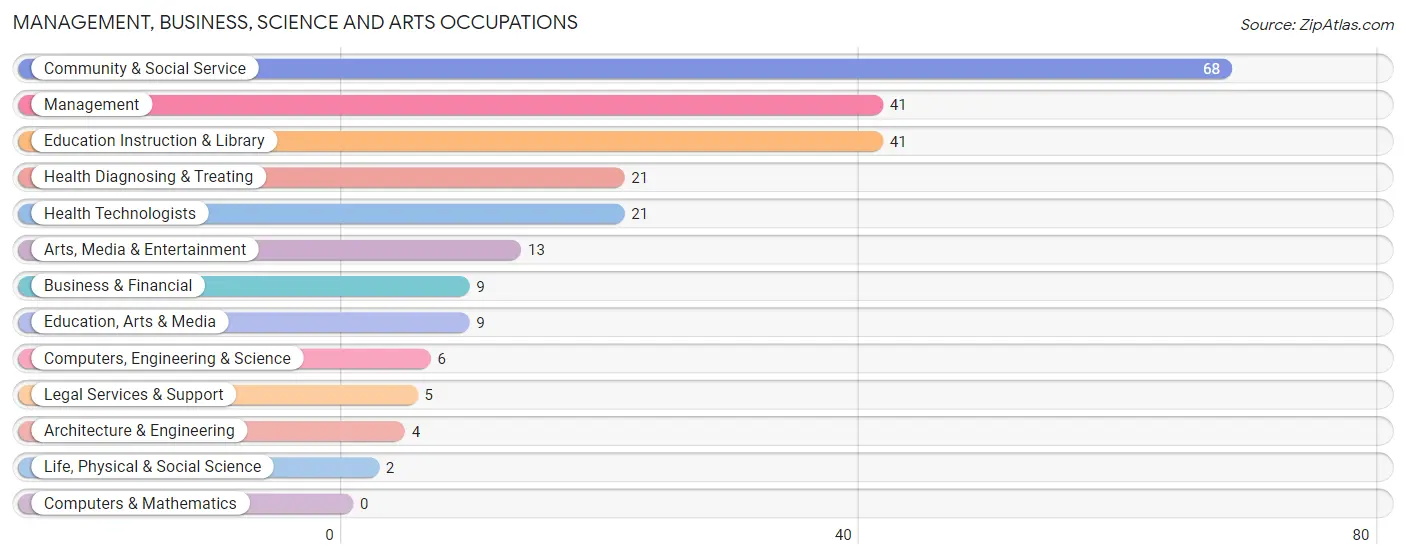
The most common Management, Business, Science and Arts occupations in London are Community & Social Service (68 | 13.9%), Management (41 | 8.4%), Education Instruction & Library (41 | 8.4%), Health Diagnosing & Treating (21 | 4.3%), and Health Technologists (21 | 4.3%).
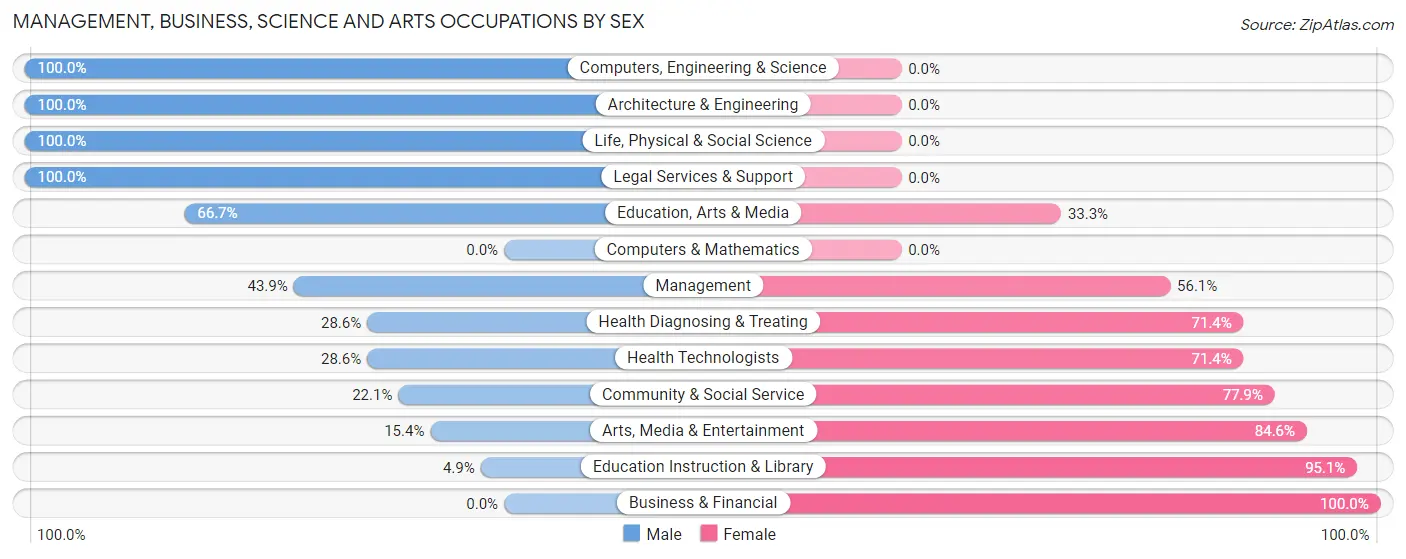
Management, Business, Science and Arts Occupations by Sex
Within the Management, Business, Science and Arts occupations in London, the most male-oriented occupations are Computers, Engineering & Science (100.0%), Architecture & Engineering (100.0%), and Life, Physical & Social Science (100.0%), while the most female-oriented occupations are Business & Financial (100.0%), Education Instruction & Library (95.1%), and Arts, Media & Entertainment (84.6%).
| Occupation | Male | Female |
| Management | 18 (43.9%) | 23 (56.1%) |
| Business & Financial | 0 (0.0%) | 9 (100.0%) |
| Computers, Engineering & Science | 6 (100.0%) | 0 (0.0%) |
| Computers & Mathematics | 0 (0.0%) | 0 (0.0%) |
| Architecture & Engineering | 4 (100.0%) | 0 (0.0%) |
| Life, Physical & Social Science | 2 (100.0%) | 0 (0.0%) |
| Community & Social Service | 15 (22.1%) | 53 (77.9%) |
| Education, Arts & Media | 6 (66.7%) | 3 (33.3%) |
| Legal Services & Support | 5 (100.0%) | 0 (0.0%) |
| Education Instruction & Library | 2 (4.9%) | 39 (95.1%) |
| Arts, Media & Entertainment | 2 (15.4%) | 11 (84.6%) |
| Health Diagnosing & Treating | 6 (28.6%) | 15 (71.4%) |
| Health Technologists | 6 (28.6%) | 15 (71.4%) |
| Total (Category) | 45 (31.0%) | 100 (69.0%) |
| Total (Overall) | 231 (47.3%) | 257 (52.7%) |
Services Occupations
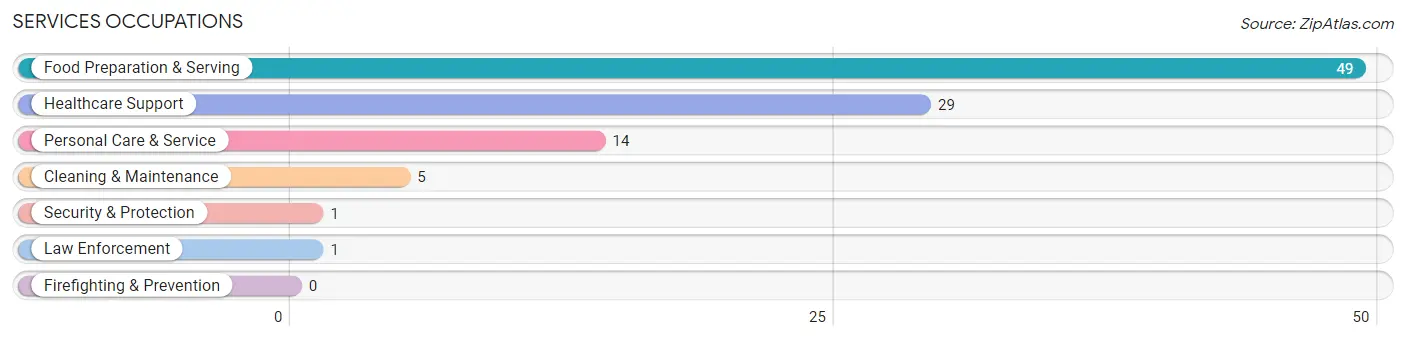
The most common Services occupations in London are Food Preparation & Serving (49 | 10.0%), Healthcare Support (29 | 5.9%), Personal Care & Service (14 | 2.9%), Cleaning & Maintenance (5 | 1.0%), and Security & Protection (1 | 0.2%).
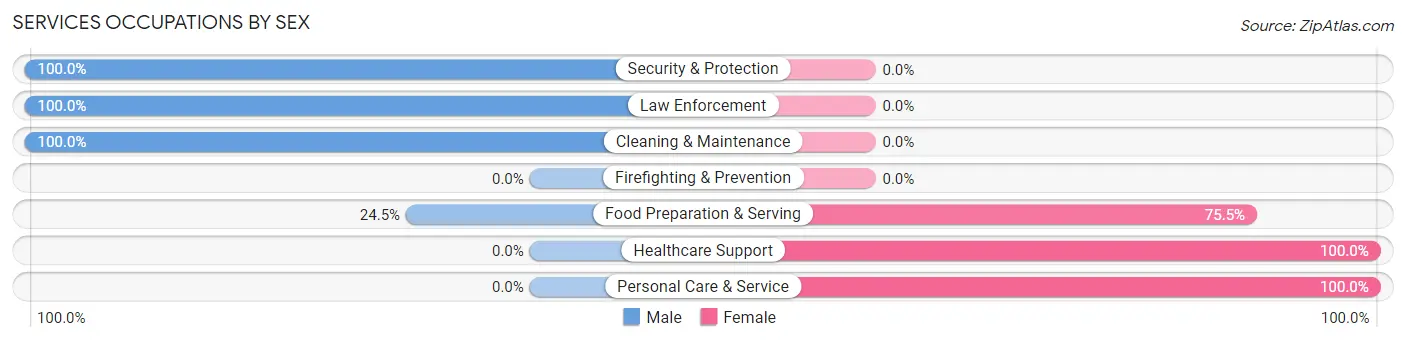
Services Occupations by Sex
Within the Services occupations in London, the most male-oriented occupations are Security & Protection (100.0%), Law Enforcement (100.0%), and Cleaning & Maintenance (100.0%), while the most female-oriented occupations are Healthcare Support (100.0%), Personal Care & Service (100.0%), and Food Preparation & Serving (75.5%).
| Occupation | Male | Female |
| Healthcare Support | 0 (0.0%) | 29 (100.0%) |
| Security & Protection | 1 (100.0%) | 0 (0.0%) |
| Firefighting & Prevention | 0 (0.0%) | 0 (0.0%) |
| Law Enforcement | 1 (100.0%) | 0 (0.0%) |
| Food Preparation & Serving | 12 (24.5%) | 37 (75.5%) |
| Cleaning & Maintenance | 5 (100.0%) | 0 (0.0%) |
| Personal Care & Service | 0 (0.0%) | 14 (100.0%) |
| Total (Category) | 18 (18.4%) | 80 (81.6%) |
| Total (Overall) | 231 (47.3%) | 257 (52.7%) |
Sales and Office Occupations
The most common Sales and Office occupations in London are Sales & Related (32 | 6.6%), and Office & Administration (26 | 5.3%).

Sales and Office Occupations by Sex

| Occupation | Male | Female |
| Sales & Related | 15 (46.9%) | 17 (53.1%) |
| Office & Administration | 17 (65.4%) | 9 (34.6%) |
| Total (Category) | 32 (55.2%) | 26 (44.8%) |
| Total (Overall) | 231 (47.3%) | 257 (52.7%) |
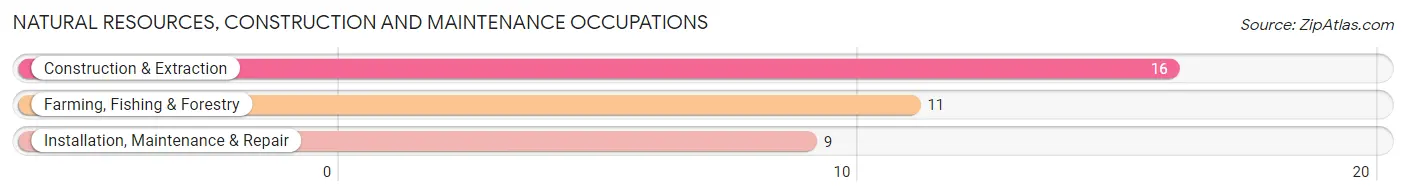
Natural Resources, Construction and Maintenance Occupations
The most common Natural Resources, Construction and Maintenance occupations in London are Construction & Extraction (16 | 3.3%), Farming, Fishing & Forestry (11 | 2.2%), and Installation, Maintenance & Repair (9 | 1.8%).
Natural Resources, Construction and Maintenance Occupations by Sex
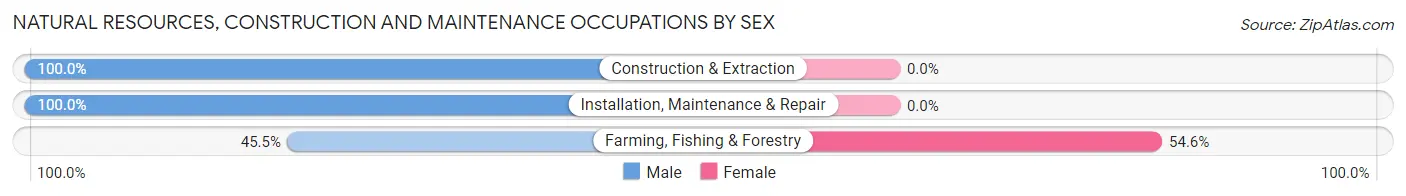
| Occupation | Male | Female |
| Farming, Fishing & Forestry | 5 (45.5%) | 6 (54.5%) |
| Construction & Extraction | 16 (100.0%) | 0 (0.0%) |
| Installation, Maintenance & Repair | 9 (100.0%) | 0 (0.0%) |
| Total (Category) | 30 (83.3%) | 6 (16.7%) |
| Total (Overall) | 231 (47.3%) | 257 (52.7%) |
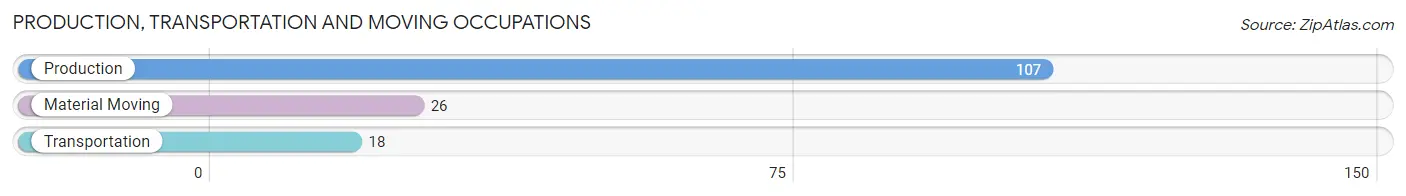
Production, Transportation and Moving Occupations
The most common Production, Transportation and Moving occupations in London are Production (107 | 21.9%), Material Moving (26 | 5.3%), and Transportation (18 | 3.7%).
Production, Transportation and Moving Occupations by Sex
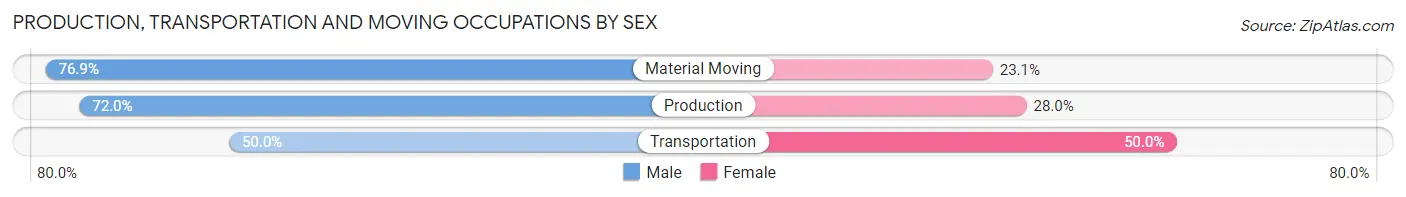
| Occupation | Male | Female |
| Production | 77 (72.0%) | 30 (28.0%) |
| Transportation | 9 (50.0%) | 9 (50.0%) |
| Material Moving | 20 (76.9%) | 6 (23.1%) |
| Total (Category) | 106 (70.2%) | 45 (29.8%) |
| Total (Overall) | 231 (47.3%) | 257 (52.7%) |
Employment Industries by Sex in London
Employment Industries in London
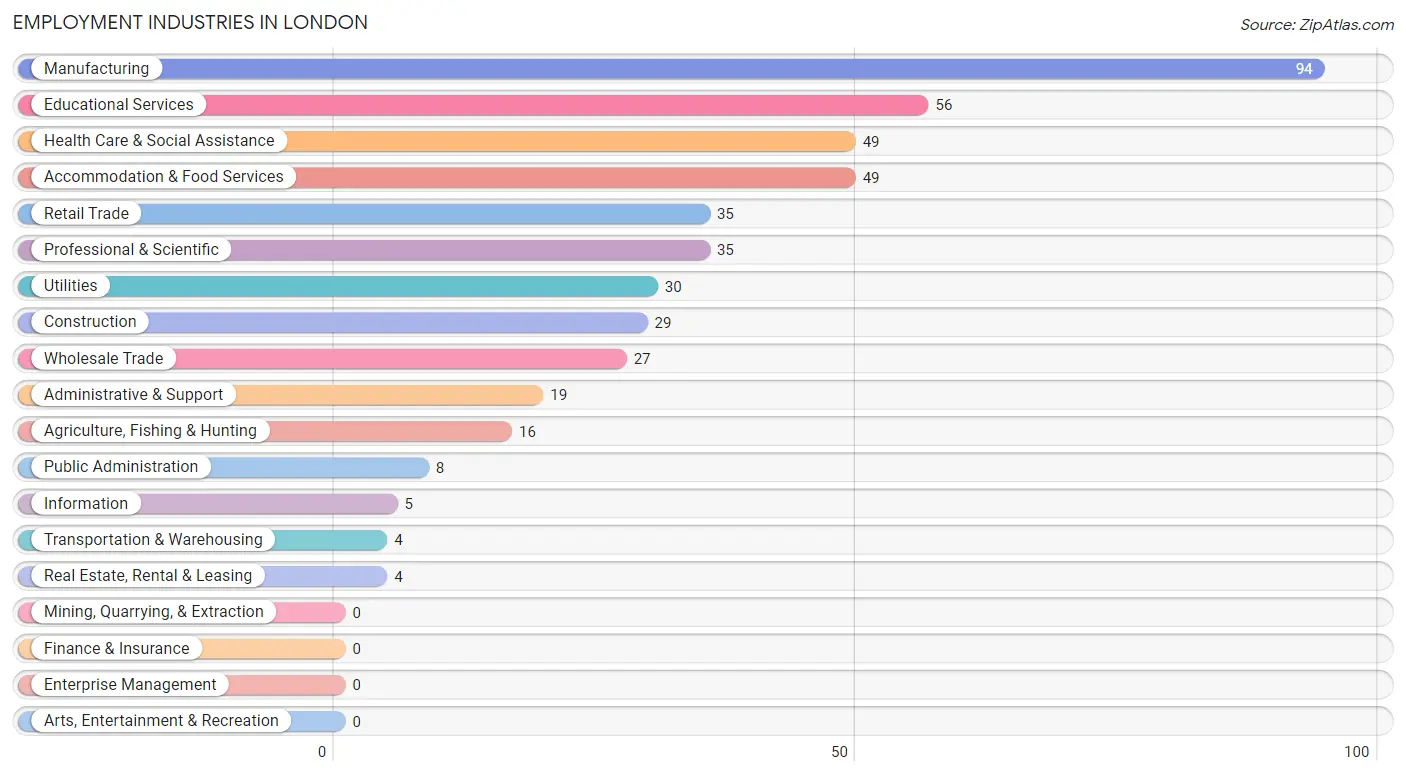
The major employment industries in London include Manufacturing (94 | 19.3%), Educational Services (56 | 11.5%), Health Care & Social Assistance (49 | 10.0%), Accommodation & Food Services (49 | 10.0%), and Retail Trade (35 | 7.2%).
Employment Industries by Sex in London
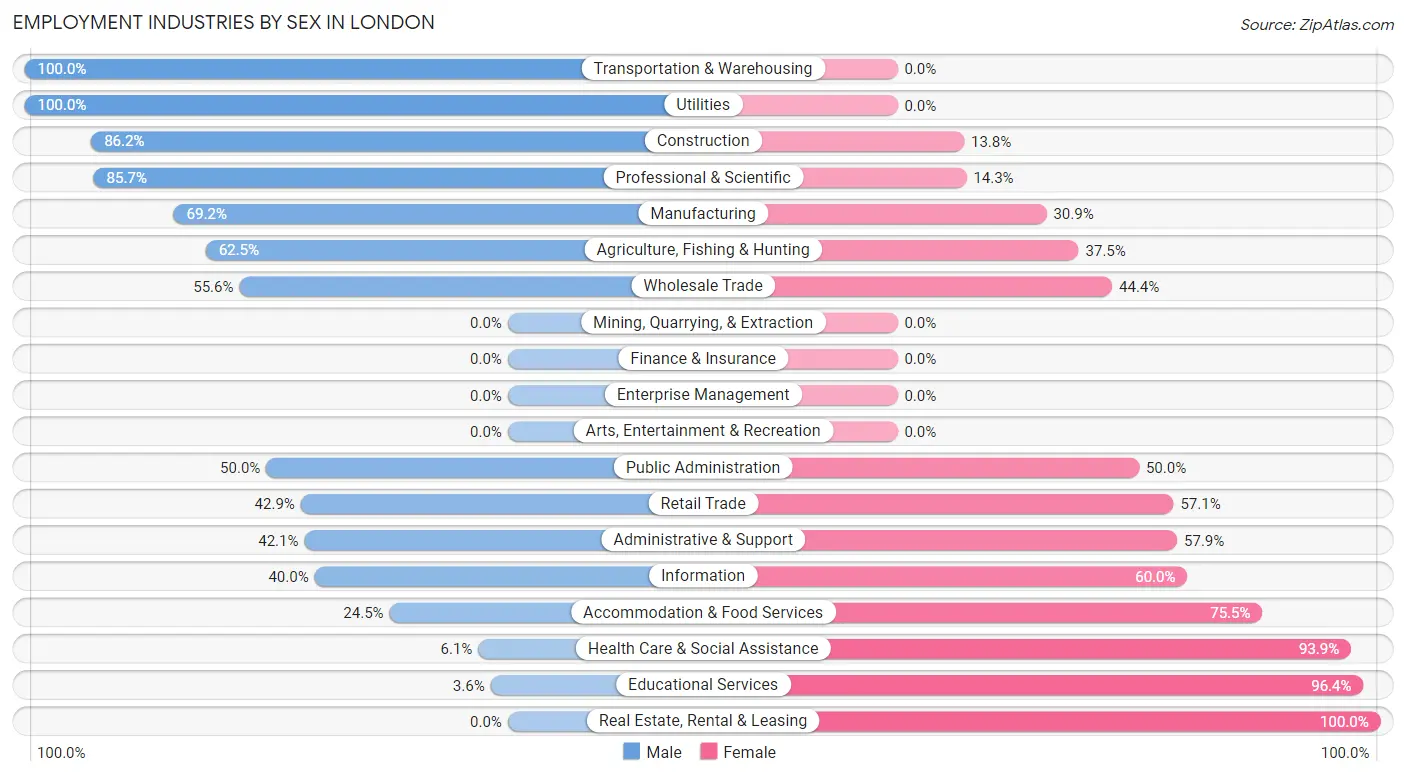
The London industries that see more men than women are Transportation & Warehousing (100.0%), Utilities (100.0%), and Construction (86.2%), whereas the industries that tend to have a higher number of women are Real Estate, Rental & Leasing (100.0%), Educational Services (96.4%), and Health Care & Social Assistance (93.9%).
| Industry | Male | Female |
| Agriculture, Fishing & Hunting | 10 (62.5%) | 6 (37.5%) |
| Mining, Quarrying, & Extraction | 0 (0.0%) | 0 (0.0%) |
| Construction | 25 (86.2%) | 4 (13.8%) |
| Manufacturing | 65 (69.2%) | 29 (30.8%) |
| Wholesale Trade | 15 (55.6%) | 12 (44.4%) |
| Retail Trade | 15 (42.9%) | 20 (57.1%) |
| Transportation & Warehousing | 4 (100.0%) | 0 (0.0%) |
| Utilities | 30 (100.0%) | 0 (0.0%) |
| Information | 2 (40.0%) | 3 (60.0%) |
| Finance & Insurance | 0 (0.0%) | 0 (0.0%) |
| Real Estate, Rental & Leasing | 0 (0.0%) | 4 (100.0%) |
| Professional & Scientific | 30 (85.7%) | 5 (14.3%) |
| Enterprise Management | 0 (0.0%) | 0 (0.0%) |
| Administrative & Support | 8 (42.1%) | 11 (57.9%) |
| Educational Services | 2 (3.6%) | 54 (96.4%) |
| Health Care & Social Assistance | 3 (6.1%) | 46 (93.9%) |
| Arts, Entertainment & Recreation | 0 (0.0%) | 0 (0.0%) |
| Accommodation & Food Services | 12 (24.5%) | 37 (75.5%) |
| Public Administration | 4 (50.0%) | 4 (50.0%) |
| Total | 231 (47.3%) | 257 (52.7%) |
Education in London
School Enrollment in London
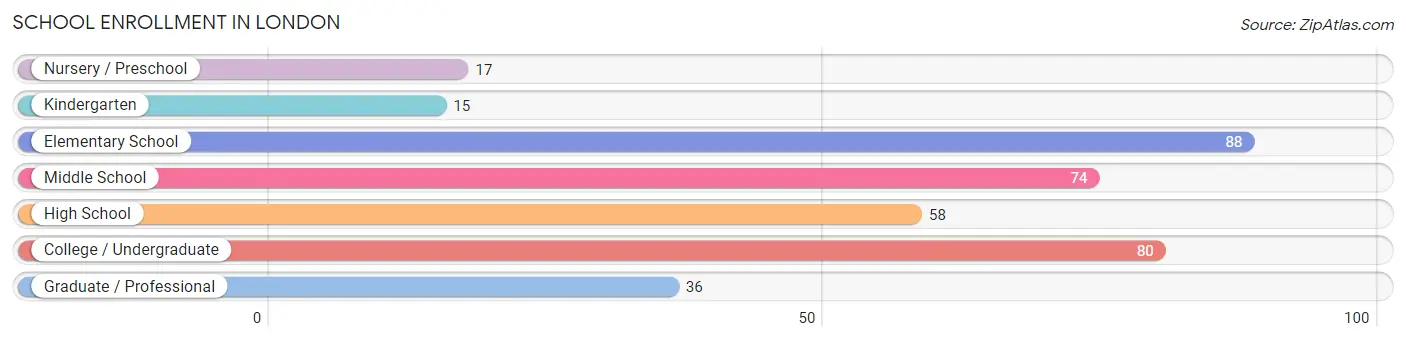
The most common levels of schooling among the 368 students in London are elementary school (88 | 23.9%), college / undergraduate (80 | 21.7%), and middle school (74 | 20.1%).
| School Level | # Students | % Students |
| Nursery / Preschool | 17 | 4.6% |
| Kindergarten | 15 | 4.1% |
| Elementary School | 88 | 23.9% |
| Middle School | 74 | 20.1% |
| High School | 58 | 15.8% |
| College / Undergraduate | 80 | 21.7% |
| Graduate / Professional | 36 | 9.8% |
| Total | 368 | 100.0% |
School Enrollment by Age by Funding Source in London
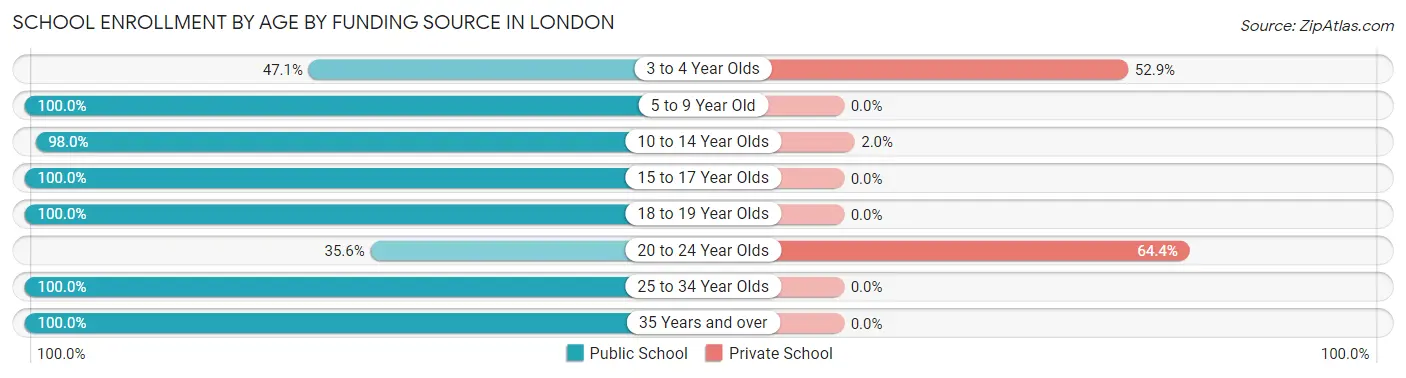
Out of a total of 368 students who are enrolled in schools in London, 40 (10.9%) attend a private institution, while the remaining 328 (89.1%) are enrolled in public schools. The age group of 20 to 24 year olds has the highest likelihood of being enrolled in private schools, with 29 (64.4% in the age bracket) enrolled. Conversely, the age group of 5 to 9 year old has the lowest likelihood of being enrolled in a private school, with 82 (100.0% in the age bracket) attending a public institution.
| Age Bracket | Public School | Private School |
| 3 to 4 Year Olds | 8 (47.1%) | 9 (52.9%) |
| 5 to 9 Year Old | 82 (100.0%) | 0 (0.0%) |
| 10 to 14 Year Olds | 99 (98.0%) | 2 (2.0%) |
| 15 to 17 Year Olds | 52 (100.0%) | 0 (0.0%) |
| 18 to 19 Year Olds | 4 (100.0%) | 0 (0.0%) |
| 20 to 24 Year Olds | 16 (35.6%) | 29 (64.4%) |
| 25 to 34 Year Olds | 44 (100.0%) | 0 (0.0%) |
| 35 Years and over | 23 (100.0%) | 0 (0.0%) |
| Total | 328 (89.1%) | 40 (10.9%) |
Educational Attainment by Field of Study in London
Education (56 | 26.4%), business (42 | 19.8%), arts & humanities (26 | 12.3%), science & technology (23 | 10.8%), and bio, nature & agricultural (20 | 9.4%) are the most common fields of study among 212 individuals in London who have obtained a bachelor's degree or higher.
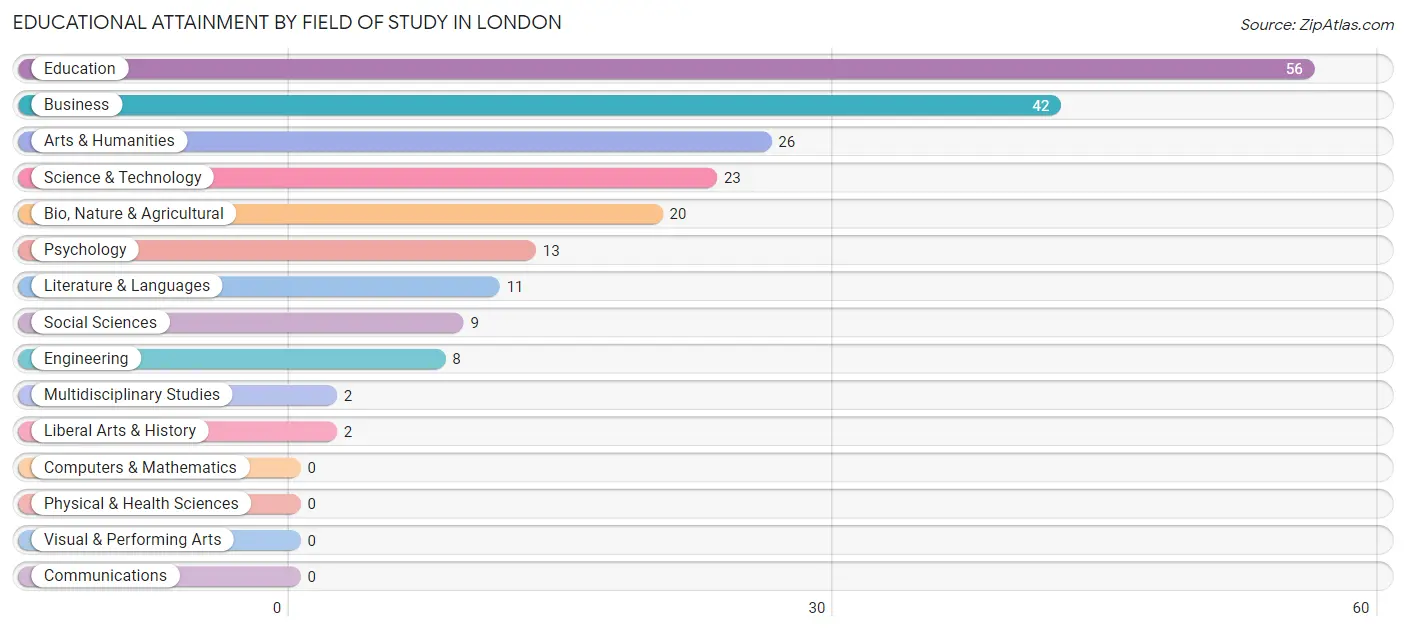
| Field of Study | # Graduates | % Graduates |
| Computers & Mathematics | 0 | 0.0% |
| Bio, Nature & Agricultural | 20 | 9.4% |
| Physical & Health Sciences | 0 | 0.0% |
| Psychology | 13 | 6.1% |
| Social Sciences | 9 | 4.3% |
| Engineering | 8 | 3.8% |
| Multidisciplinary Studies | 2 | 0.9% |
| Science & Technology | 23 | 10.8% |
| Business | 42 | 19.8% |
| Education | 56 | 26.4% |
| Literature & Languages | 11 | 5.2% |
| Liberal Arts & History | 2 | 0.9% |
| Visual & Performing Arts | 0 | 0.0% |
| Communications | 0 | 0.0% |
| Arts & Humanities | 26 | 12.3% |
| Total | 212 | 100.0% |
Transportation & Commute in London
Vehicle Availability by Sex in London
The most prevalent vehicle ownership categories in London are males with 2 vehicles (101, accounting for 42.8%) and females with 2 vehicles (115, making up 39.8%).
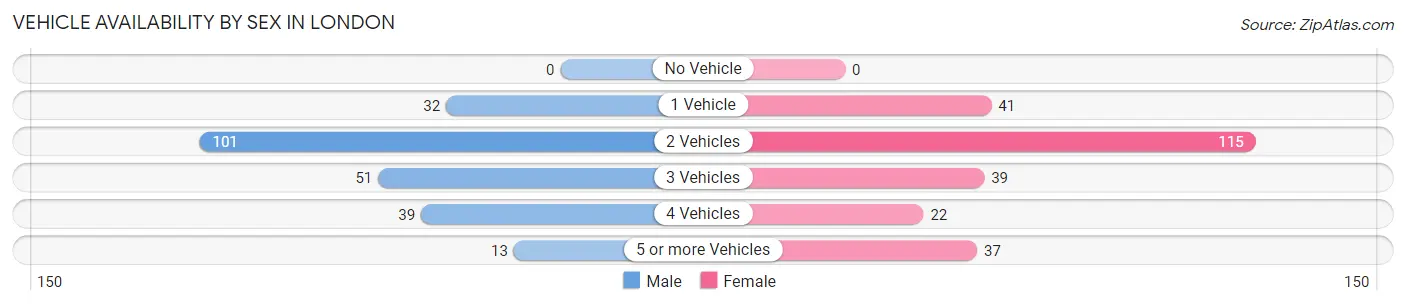
| Vehicles Available | Male | Female |
| No Vehicle | 0 (0.0%) | 0 (0.0%) |
| 1 Vehicle | 32 (13.6%) | 41 (16.1%) |
| 2 Vehicles | 101 (42.8%) | 115 (45.3%) |
| 3 Vehicles | 51 (21.6%) | 39 (15.3%) |
| 4 Vehicles | 39 (16.5%) | 22 (8.7%) |
| 5 or more Vehicles | 13 (5.5%) | 37 (14.6%) |
| Total | 236 (100.0%) | 254 (100.0%) |
Commute Time in London
The most frequently occuring commute durations in London are 15 to 19 minutes (98 commuters, 21.6%), 20 to 24 minutes (90 commuters, 19.9%), and 10 to 14 minutes (76 commuters, 16.8%).
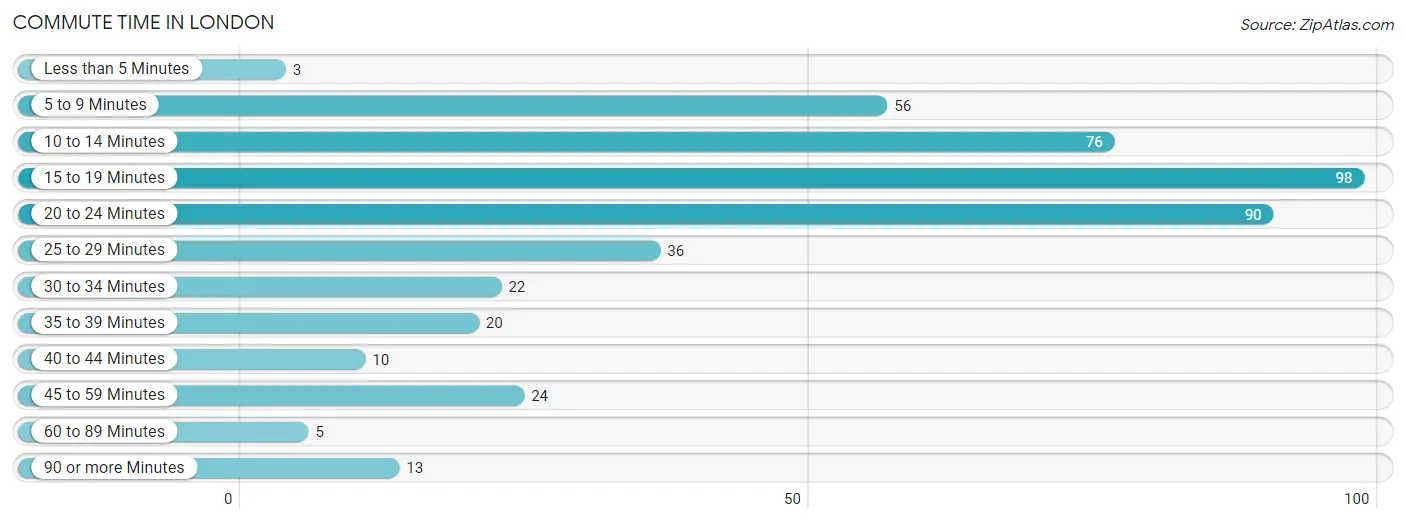
| Commute Time | # Commuters | % Commuters |
| Less than 5 Minutes | 3 | 0.7% |
| 5 to 9 Minutes | 56 | 12.4% |
| 10 to 14 Minutes | 76 | 16.8% |
| 15 to 19 Minutes | 98 | 21.6% |
| 20 to 24 Minutes | 90 | 19.9% |
| 25 to 29 Minutes | 36 | 8.0% |
| 30 to 34 Minutes | 22 | 4.9% |
| 35 to 39 Minutes | 20 | 4.4% |
| 40 to 44 Minutes | 10 | 2.2% |
| 45 to 59 Minutes | 24 | 5.3% |
| 60 to 89 Minutes | 5 | 1.1% |
| 90 or more Minutes | 13 | 2.9% |
Commute Time by Sex in London
The most common commute times in London are 20 to 24 minutes (59 commuters, 26.8%) for males and 15 to 19 minutes (62 commuters, 26.6%) for females.
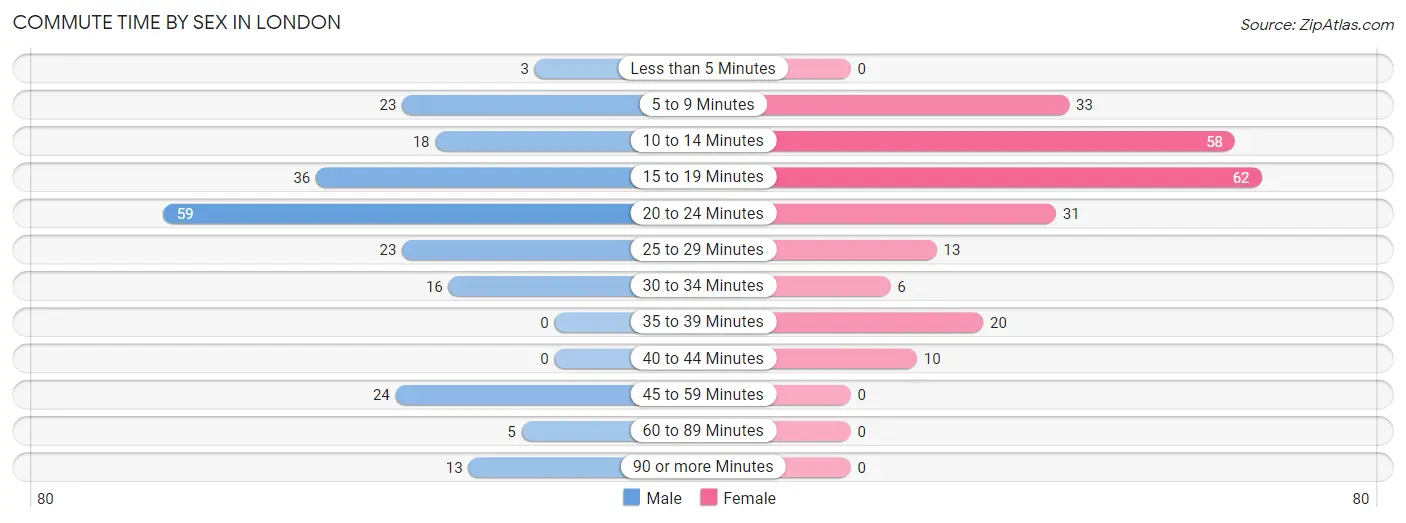
| Commute Time | Male | Female |
| Less than 5 Minutes | 3 (1.4%) | 0 (0.0%) |
| 5 to 9 Minutes | 23 (10.4%) | 33 (14.2%) |
| 10 to 14 Minutes | 18 (8.2%) | 58 (24.9%) |
| 15 to 19 Minutes | 36 (16.4%) | 62 (26.6%) |
| 20 to 24 Minutes | 59 (26.8%) | 31 (13.3%) |
| 25 to 29 Minutes | 23 (10.4%) | 13 (5.6%) |
| 30 to 34 Minutes | 16 (7.3%) | 6 (2.6%) |
| 35 to 39 Minutes | 0 (0.0%) | 20 (8.6%) |
| 40 to 44 Minutes | 0 (0.0%) | 10 (4.3%) |
| 45 to 59 Minutes | 24 (10.9%) | 0 (0.0%) |
| 60 to 89 Minutes | 5 (2.3%) | 0 (0.0%) |
| 90 or more Minutes | 13 (5.9%) | 0 (0.0%) |
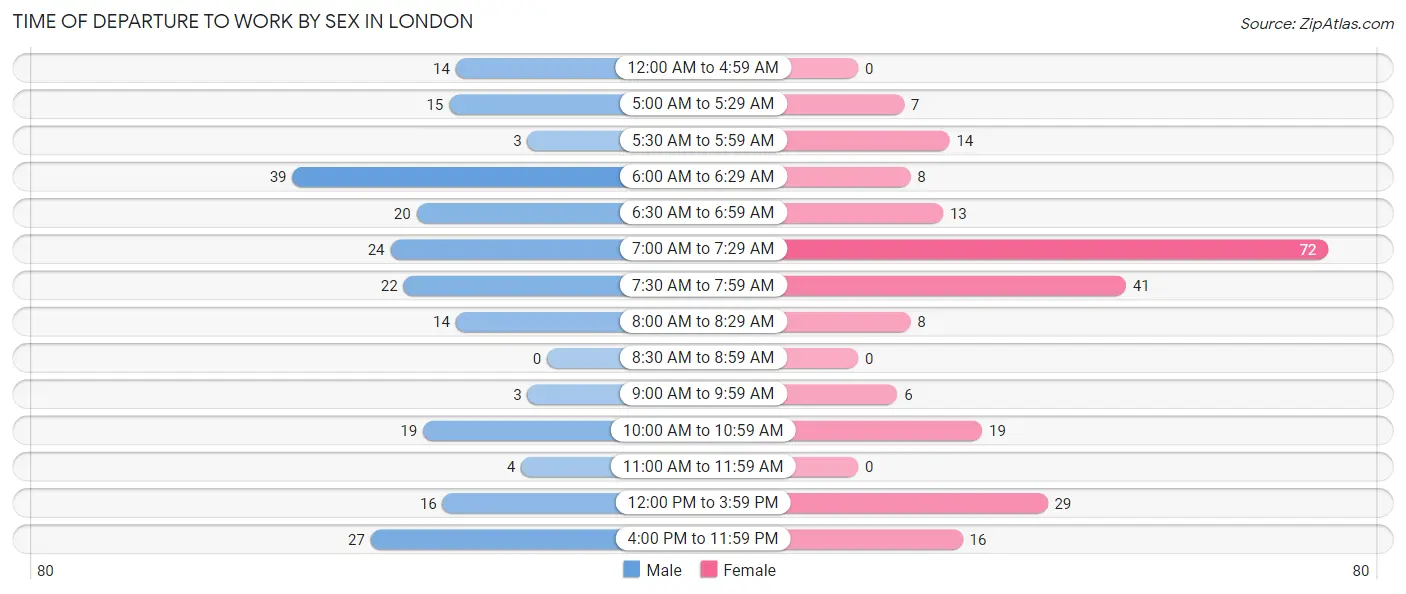
Time of Departure to Work by Sex in London
The most frequent times of departure to work in London are 6:00 AM to 6:29 AM (39, 17.7%) for males and 7:00 AM to 7:29 AM (72, 30.9%) for females.
| Time of Departure | Male | Female |
| 12:00 AM to 4:59 AM | 14 (6.4%) | 0 (0.0%) |
| 5:00 AM to 5:29 AM | 15 (6.8%) | 7 (3.0%) |
| 5:30 AM to 5:59 AM | 3 (1.4%) | 14 (6.0%) |
| 6:00 AM to 6:29 AM | 39 (17.7%) | 8 (3.4%) |
| 6:30 AM to 6:59 AM | 20 (9.1%) | 13 (5.6%) |
| 7:00 AM to 7:29 AM | 24 (10.9%) | 72 (30.9%) |
| 7:30 AM to 7:59 AM | 22 (10.0%) | 41 (17.6%) |
| 8:00 AM to 8:29 AM | 14 (6.4%) | 8 (3.4%) |
| 8:30 AM to 8:59 AM | 0 (0.0%) | 0 (0.0%) |
| 9:00 AM to 9:59 AM | 3 (1.4%) | 6 (2.6%) |
| 10:00 AM to 10:59 AM | 19 (8.6%) | 19 (8.2%) |
| 11:00 AM to 11:59 AM | 4 (1.8%) | 0 (0.0%) |
| 12:00 PM to 3:59 PM | 16 (7.3%) | 29 (12.4%) |
| 4:00 PM to 11:59 PM | 27 (12.3%) | 16 (6.9%) |
| Total | 220 (100.0%) | 233 (100.0%) |
Housing Occupancy in London
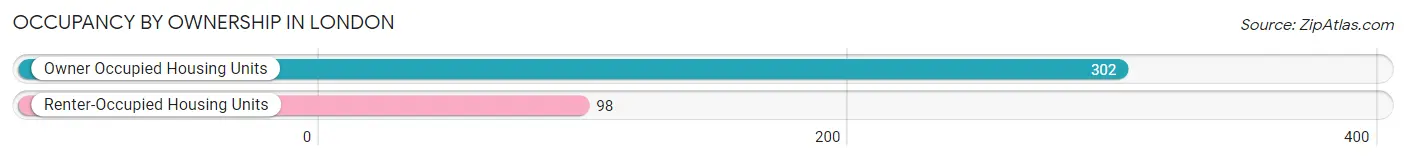
Occupancy by Ownership in London
Of the total 400 dwellings in London, owner-occupied units account for 302 (75.5%), while renter-occupied units make up 98 (24.5%).
| Occupancy | # Housing Units | % Housing Units |
| Owner Occupied Housing Units | 302 | 75.5% |
| Renter-Occupied Housing Units | 98 | 24.5% |
| Total Occupied Housing Units | 400 | 100.0% |
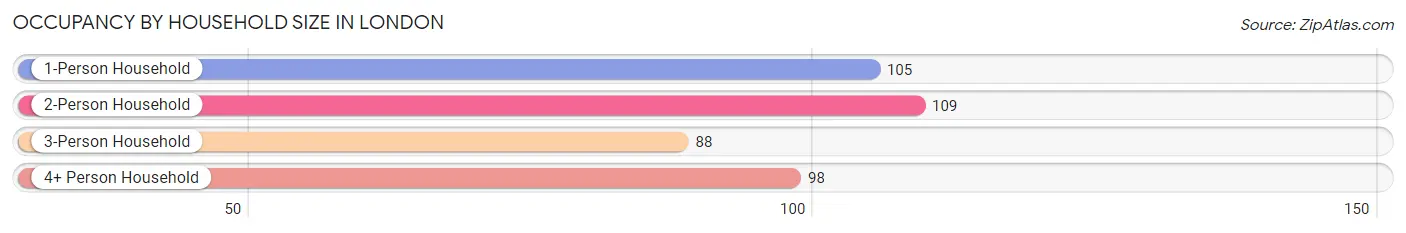
Occupancy by Household Size in London
| Household Size | # Housing Units | % Housing Units |
| 1-Person Household | 105 | 26.3% |
| 2-Person Household | 109 | 27.3% |
| 3-Person Household | 88 | 22.0% |
| 4+ Person Household | 98 | 24.5% |
| Total Housing Units | 400 | 100.0% |
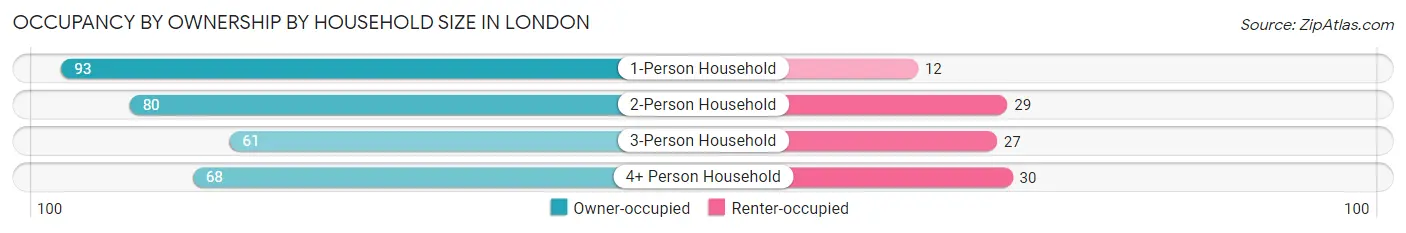
Occupancy by Ownership by Household Size in London
| Household Size | Owner-occupied | Renter-occupied |
| 1-Person Household | 93 (88.6%) | 12 (11.4%) |
| 2-Person Household | 80 (73.4%) | 29 (26.6%) |
| 3-Person Household | 61 (69.3%) | 27 (30.7%) |
| 4+ Person Household | 68 (69.4%) | 30 (30.6%) |
| Total Housing Units | 302 (75.5%) | 98 (24.5%) |
Occupancy by Educational Attainment in London
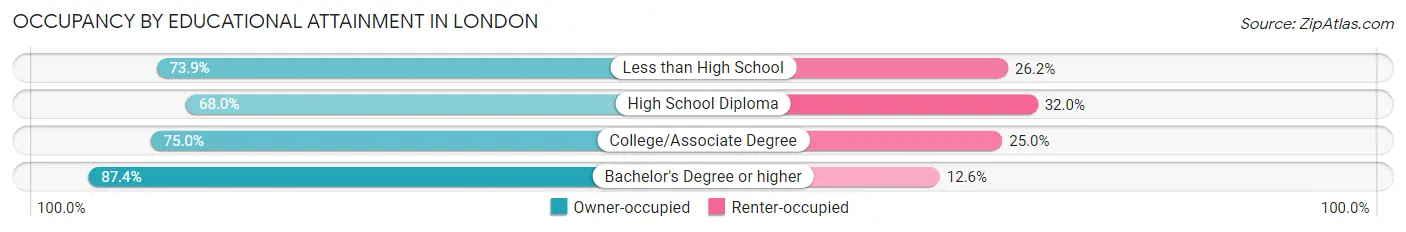
| Household Size | Owner-occupied | Renter-occupied |
| Less than High School | 48 (73.9%) | 17 (26.2%) |
| High School Diploma | 87 (68.0%) | 41 (32.0%) |
| College/Associate Degree | 84 (75.0%) | 28 (25.0%) |
| Bachelor's Degree or higher | 83 (87.4%) | 12 (12.6%) |
Occupancy by Age of Householder in London
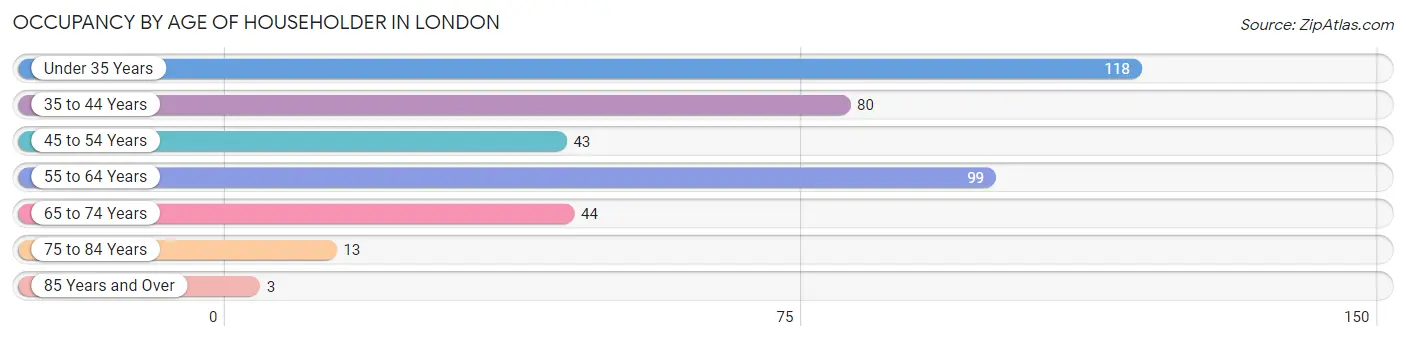
| Age Bracket | # Households | % Households |
| Under 35 Years | 118 | 29.5% |
| 35 to 44 Years | 80 | 20.0% |
| 45 to 54 Years | 43 | 10.7% |
| 55 to 64 Years | 99 | 24.7% |
| 65 to 74 Years | 44 | 11.0% |
| 75 to 84 Years | 13 | 3.3% |
| 85 Years and Over | 3 | 0.7% |
| Total | 400 | 100.0% |
Housing Finances in London
Median Income by Occupancy in London
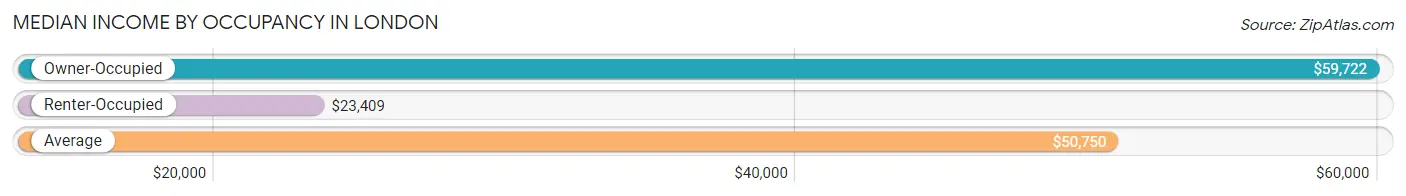
| Occupancy Type | # Households | Median Income |
| Owner-Occupied | 302 (75.5%) | $59,722 |
| Renter-Occupied | 98 (24.5%) | $23,409 |
| Average | 400 (100.0%) | $50,750 |
Occupancy by Householder Income Bracket in London
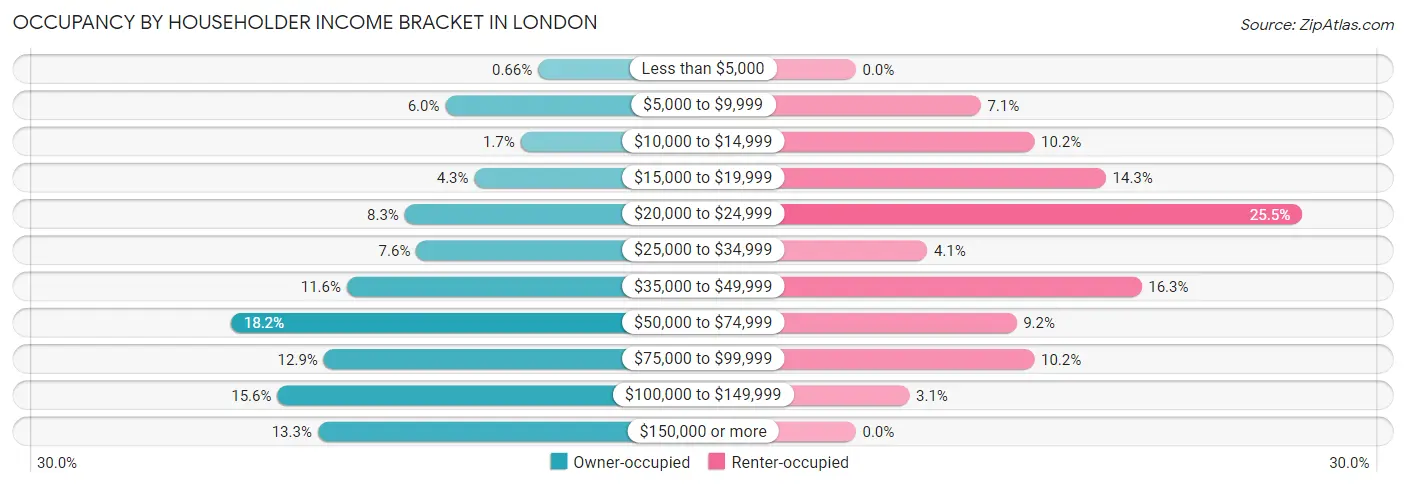
| Income Bracket | Owner-occupied | Renter-occupied |
| Less than $5,000 | 2 (0.7%) | 0 (0.0%) |
| $5,000 to $9,999 | 18 (6.0%) | 7 (7.1%) |
| $10,000 to $14,999 | 5 (1.7%) | 10 (10.2%) |
| $15,000 to $19,999 | 13 (4.3%) | 14 (14.3%) |
| $20,000 to $24,999 | 25 (8.3%) | 25 (25.5%) |
| $25,000 to $34,999 | 23 (7.6%) | 4 (4.1%) |
| $35,000 to $49,999 | 35 (11.6%) | 16 (16.3%) |
| $50,000 to $74,999 | 55 (18.2%) | 9 (9.2%) |
| $75,000 to $99,999 | 39 (12.9%) | 10 (10.2%) |
| $100,000 to $149,999 | 47 (15.6%) | 3 (3.1%) |
| $150,000 or more | 40 (13.3%) | 0 (0.0%) |
| Total | 302 (100.0%) | 98 (100.0%) |
Monthly Housing Cost Tiers in London
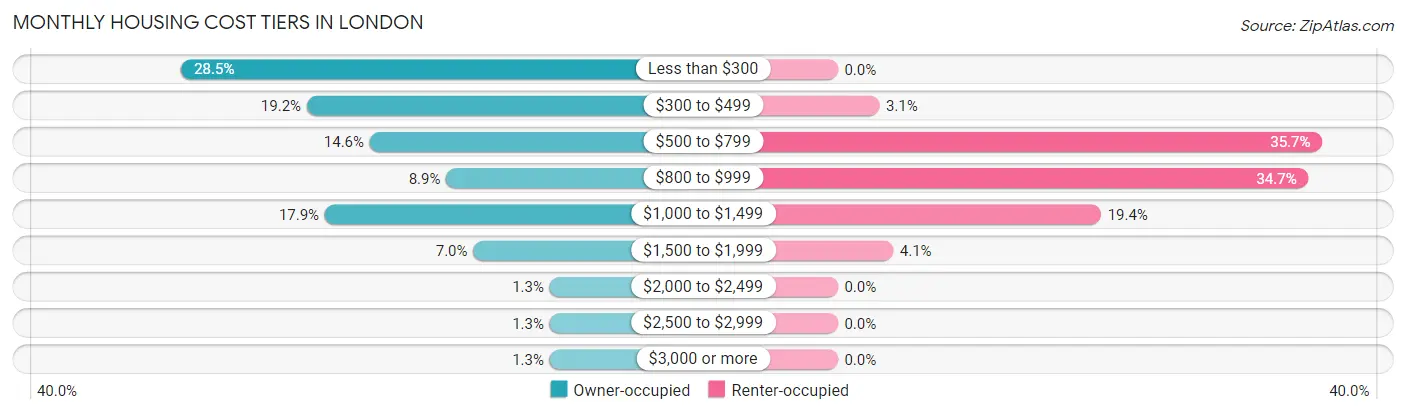
| Monthly Cost | Owner-occupied | Renter-occupied |
| Less than $300 | 86 (28.5%) | 0 (0.0%) |
| $300 to $499 | 58 (19.2%) | 3 (3.1%) |
| $500 to $799 | 44 (14.6%) | 35 (35.7%) |
| $800 to $999 | 27 (8.9%) | 34 (34.7%) |
| $1,000 to $1,499 | 54 (17.9%) | 19 (19.4%) |
| $1,500 to $1,999 | 21 (7.0%) | 4 (4.1%) |
| $2,000 to $2,499 | 4 (1.3%) | 0 (0.0%) |
| $2,500 to $2,999 | 4 (1.3%) | 0 (0.0%) |
| $3,000 or more | 4 (1.3%) | 0 (0.0%) |
| Total | 302 (100.0%) | 98 (100.0%) |
Physical Housing Characteristics in London
Housing Structures in London
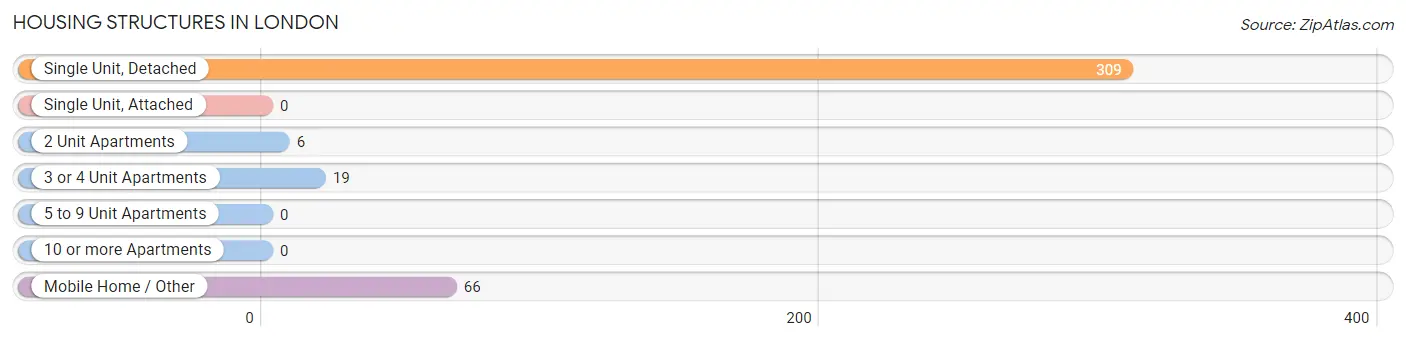
| Structure Type | # Housing Units | % Housing Units |
| Single Unit, Detached | 309 | 77.2% |
| Single Unit, Attached | 0 | 0.0% |
| 2 Unit Apartments | 6 | 1.5% |
| 3 or 4 Unit Apartments | 19 | 4.8% |
| 5 to 9 Unit Apartments | 0 | 0.0% |
| 10 or more Apartments | 0 | 0.0% |
| Mobile Home / Other | 66 | 16.5% |
| Total | 400 | 100.0% |
Housing Structures by Occupancy in London
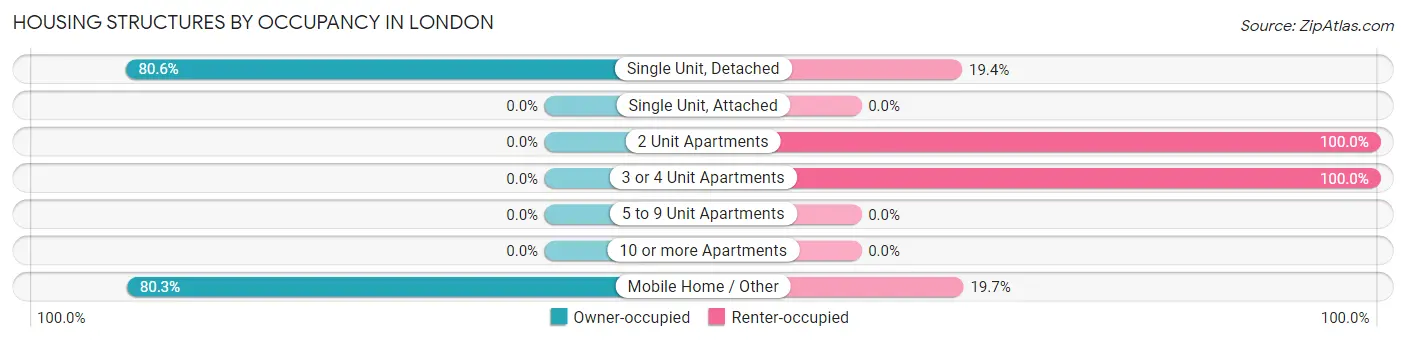
| Structure Type | Owner-occupied | Renter-occupied |
| Single Unit, Detached | 249 (80.6%) | 60 (19.4%) |
| Single Unit, Attached | 0 (0.0%) | 0 (0.0%) |
| 2 Unit Apartments | 0 (0.0%) | 6 (100.0%) |
| 3 or 4 Unit Apartments | 0 (0.0%) | 19 (100.0%) |
| 5 to 9 Unit Apartments | 0 (0.0%) | 0 (0.0%) |
| 10 or more Apartments | 0 (0.0%) | 0 (0.0%) |
| Mobile Home / Other | 53 (80.3%) | 13 (19.7%) |
| Total | 302 (75.5%) | 98 (24.5%) |
Housing Structures by Number of Rooms in London
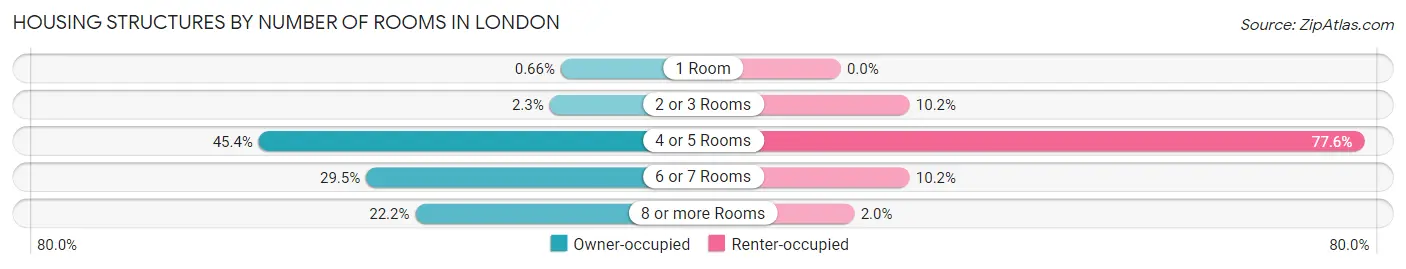
| Number of Rooms | Owner-occupied | Renter-occupied |
| 1 Room | 2 (0.7%) | 0 (0.0%) |
| 2 or 3 Rooms | 7 (2.3%) | 10 (10.2%) |
| 4 or 5 Rooms | 137 (45.4%) | 76 (77.5%) |
| 6 or 7 Rooms | 89 (29.5%) | 10 (10.2%) |
| 8 or more Rooms | 67 (22.2%) | 2 (2.0%) |
| Total | 302 (100.0%) | 98 (100.0%) |
Housing Structure by Heating Type in London
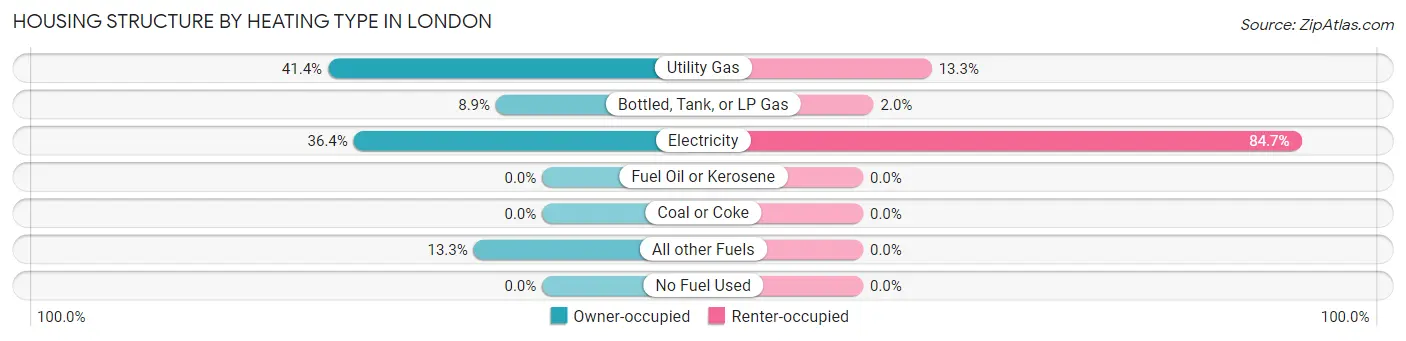
| Heating Type | Owner-occupied | Renter-occupied |
| Utility Gas | 125 (41.4%) | 13 (13.3%) |
| Bottled, Tank, or LP Gas | 27 (8.9%) | 2 (2.0%) |
| Electricity | 110 (36.4%) | 83 (84.7%) |
| Fuel Oil or Kerosene | 0 (0.0%) | 0 (0.0%) |
| Coal or Coke | 0 (0.0%) | 0 (0.0%) |
| All other Fuels | 40 (13.3%) | 0 (0.0%) |
| No Fuel Used | 0 (0.0%) | 0 (0.0%) |
| Total | 302 (100.0%) | 98 (100.0%) |
Household Vehicle Usage in London
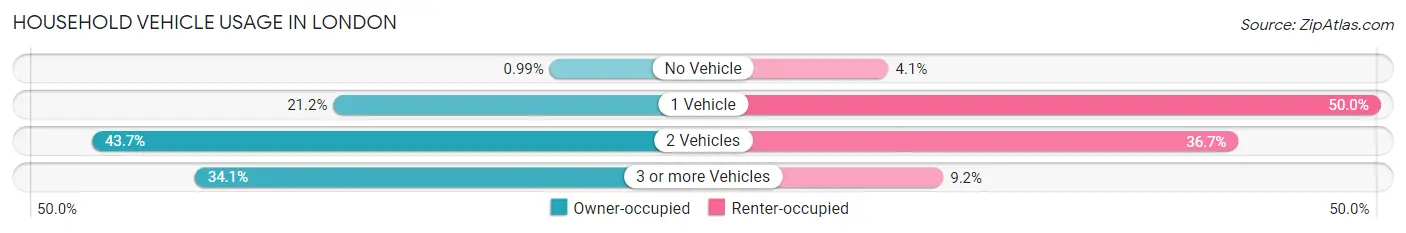
| Vehicles per Household | Owner-occupied | Renter-occupied |
| No Vehicle | 3 (1.0%) | 4 (4.1%) |
| 1 Vehicle | 64 (21.2%) | 49 (50.0%) |
| 2 Vehicles | 132 (43.7%) | 36 (36.7%) |
| 3 or more Vehicles | 103 (34.1%) | 9 (9.2%) |
| Total | 302 (100.0%) | 98 (100.0%) |
Real Estate & Mortgages in London
Real Estate and Mortgage Overview in London
| Characteristic | Without Mortgage | With Mortgage |
| Housing Units | 141 | 161 |
| Median Property Value | $82,200 | $127,500 |
| Median Household Income | $36,042 | $25 |
| Monthly Housing Costs | $270 | $4 |
| Real Estate Taxes | $653 | $7 |
Property Value by Mortgage Status in London
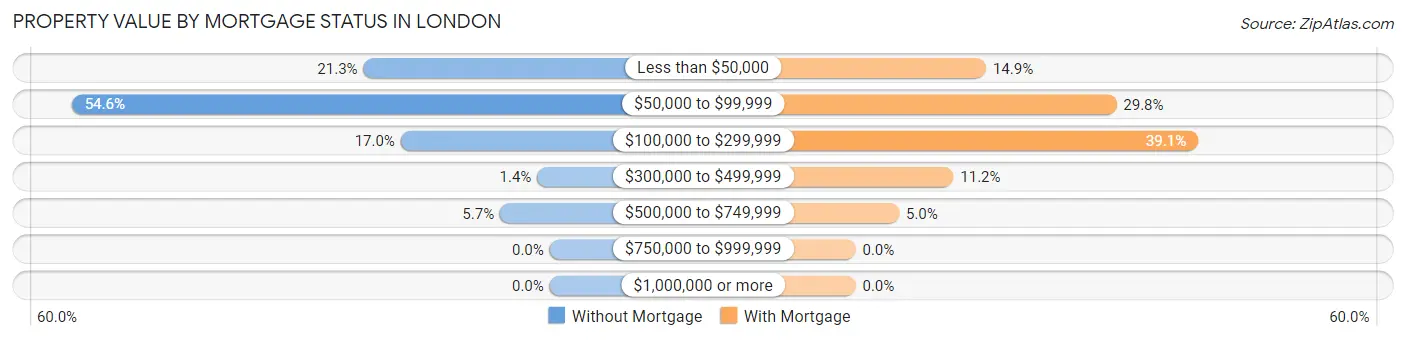
| Property Value | Without Mortgage | With Mortgage |
| Less than $50,000 | 30 (21.3%) | 24 (14.9%) |
| $50,000 to $99,999 | 77 (54.6%) | 48 (29.8%) |
| $100,000 to $299,999 | 24 (17.0%) | 63 (39.1%) |
| $300,000 to $499,999 | 2 (1.4%) | 18 (11.2%) |
| $500,000 to $749,999 | 8 (5.7%) | 8 (5.0%) |
| $750,000 to $999,999 | 0 (0.0%) | 0 (0.0%) |
| $1,000,000 or more | 0 (0.0%) | 0 (0.0%) |
| Total | 141 (100.0%) | 161 (100.0%) |
Household Income by Mortgage Status in London
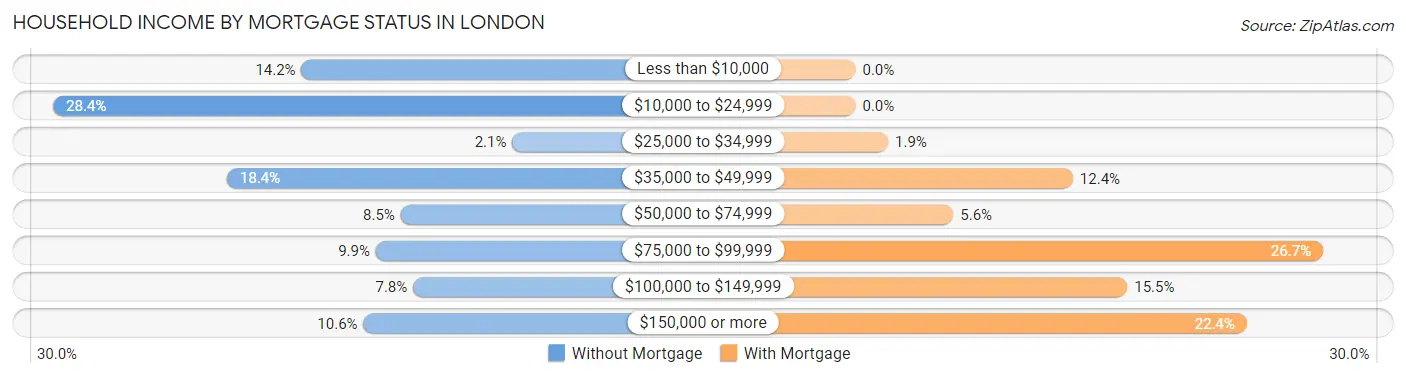
| Household Income | Without Mortgage | With Mortgage |
| Less than $10,000 | 20 (14.2%) | 0 (0.0%) |
| $10,000 to $24,999 | 40 (28.4%) | 0 (0.0%) |
| $25,000 to $34,999 | 3 (2.1%) | 3 (1.9%) |
| $35,000 to $49,999 | 26 (18.4%) | 20 (12.4%) |
| $50,000 to $74,999 | 12 (8.5%) | 9 (5.6%) |
| $75,000 to $99,999 | 14 (9.9%) | 43 (26.7%) |
| $100,000 to $149,999 | 11 (7.8%) | 25 (15.5%) |
| $150,000 or more | 15 (10.6%) | 36 (22.4%) |
| Total | 141 (100.0%) | 161 (100.0%) |
Property Value to Household Income Ratio in London
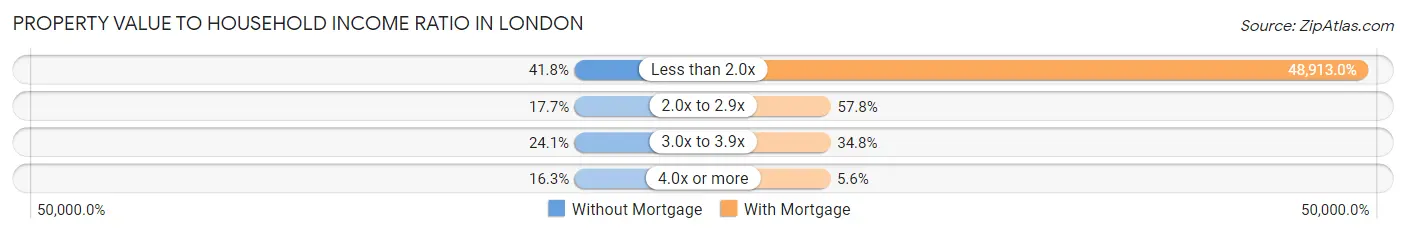
| Value-to-Income Ratio | Without Mortgage | With Mortgage |
| Less than 2.0x | 59 (41.8%) | 78,750 (48,913.0%) |
| 2.0x to 2.9x | 25 (17.7%) | 93 (57.8%) |
| 3.0x to 3.9x | 34 (24.1%) | 56 (34.8%) |
| 4.0x or more | 23 (16.3%) | 9 (5.6%) |
| Total | 141 (100.0%) | 161 (100.0%) |
Real Estate Taxes by Mortgage Status in London
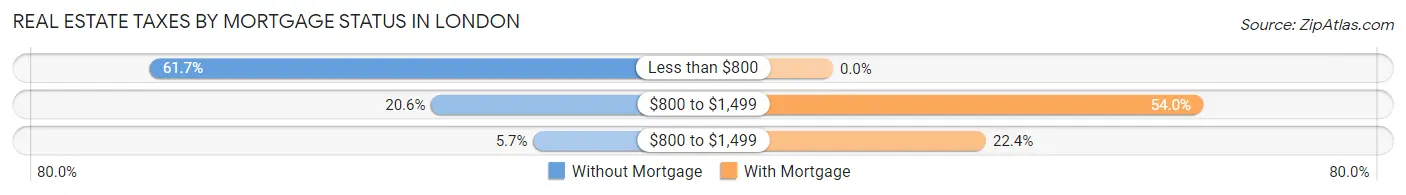
| Property Taxes | Without Mortgage | With Mortgage |
| Less than $800 | 87 (61.7%) | 0 (0.0%) |
| $800 to $1,499 | 29 (20.6%) | 87 (54.0%) |
| $800 to $1,499 | 8 (5.7%) | 36 (22.4%) |
| Total | 141 (100.0%) | 161 (100.0%) |
Health & Disability in London
Health Insurance Coverage by Age in London
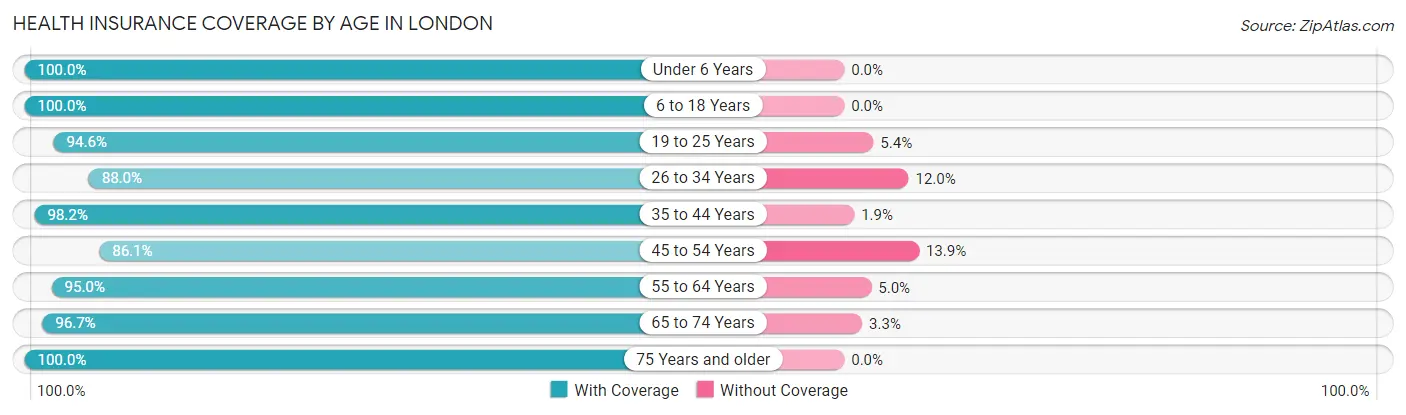
| Age Bracket | With Coverage | Without Coverage |
| Under 6 Years | 103 (100.0%) | 0 (0.0%) |
| 6 to 18 Years | 242 (100.0%) | 0 (0.0%) |
| 19 to 25 Years | 87 (94.6%) | 5 (5.4%) |
| 26 to 34 Years | 147 (88.0%) | 20 (12.0%) |
| 35 to 44 Years | 159 (98.2%) | 3 (1.8%) |
| 45 to 54 Years | 105 (86.1%) | 17 (13.9%) |
| 55 to 64 Years | 132 (95.0%) | 7 (5.0%) |
| 65 to 74 Years | 58 (96.7%) | 2 (3.3%) |
| 75 Years and older | 21 (100.0%) | 0 (0.0%) |
| Total | 1,054 (95.1%) | 54 (4.9%) |
Health Insurance Coverage by Citizenship Status in London
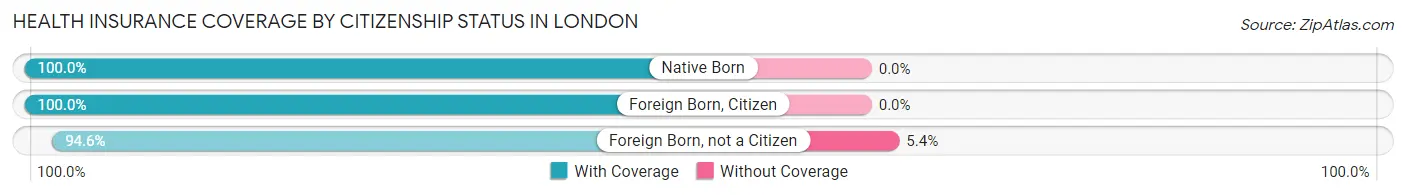
| Citizenship Status | With Coverage | Without Coverage |
| Native Born | 103 (100.0%) | 0 (0.0%) |
| Foreign Born, Citizen | 242 (100.0%) | 0 (0.0%) |
| Foreign Born, not a Citizen | 87 (94.6%) | 5 (5.4%) |
Health Insurance Coverage by Household Income in London
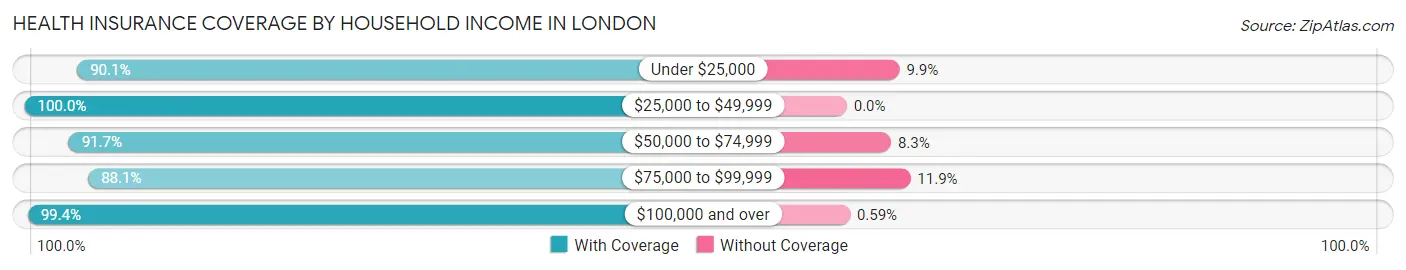
| Household Income | With Coverage | Without Coverage |
| Under $25,000 | 201 (90.1%) | 22 (9.9%) |
| $25,000 to $49,999 | 252 (100.0%) | 0 (0.0%) |
| $50,000 to $74,999 | 133 (91.7%) | 12 (8.3%) |
| $75,000 to $99,999 | 133 (88.1%) | 18 (11.9%) |
| $100,000 and over | 335 (99.4%) | 2 (0.6%) |
Public vs Private Health Insurance Coverage by Age in London
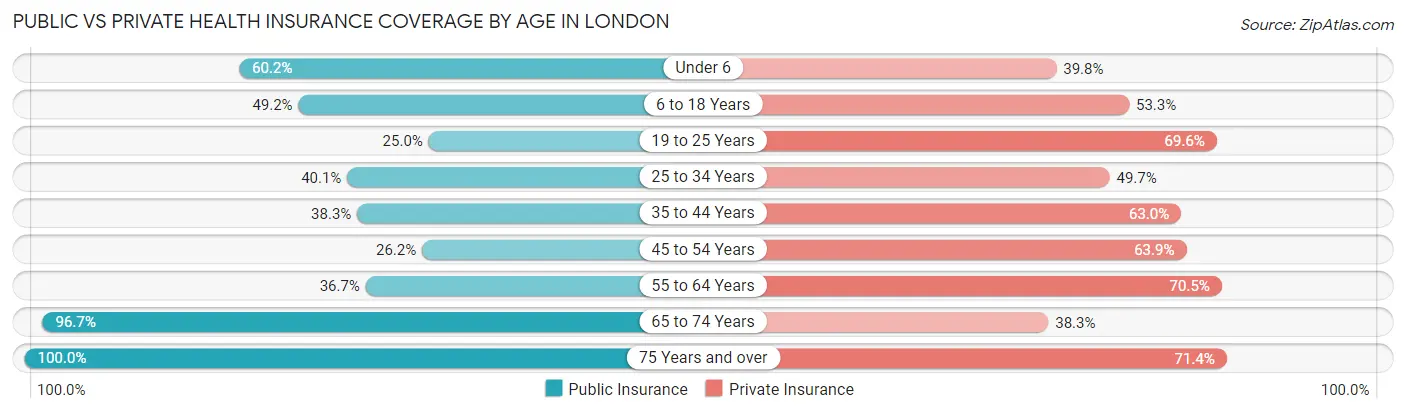
| Age Bracket | Public Insurance | Private Insurance |
| Under 6 | 62 (60.2%) | 41 (39.8%) |
| 6 to 18 Years | 119 (49.2%) | 129 (53.3%) |
| 19 to 25 Years | 23 (25.0%) | 64 (69.6%) |
| 25 to 34 Years | 67 (40.1%) | 83 (49.7%) |
| 35 to 44 Years | 62 (38.3%) | 102 (63.0%) |
| 45 to 54 Years | 32 (26.2%) | 78 (63.9%) |
| 55 to 64 Years | 51 (36.7%) | 98 (70.5%) |
| 65 to 74 Years | 58 (96.7%) | 23 (38.3%) |
| 75 Years and over | 21 (100.0%) | 15 (71.4%) |
| Total | 495 (44.7%) | 633 (57.1%) |
Disability Status by Sex by Age in London
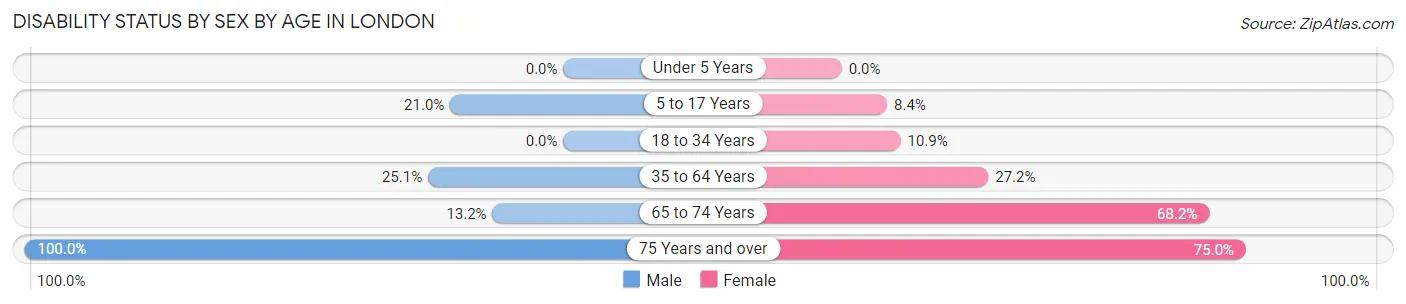
| Age Bracket | Male | Female |
| Under 5 Years | 0 (0.0%) | 0 (0.0%) |
| 5 to 17 Years | 29 (21.0%) | 9 (8.4%) |
| 18 to 34 Years | 0 (0.0%) | 17 (10.9%) |
| 35 to 64 Years | 49 (25.1%) | 62 (27.2%) |
| 65 to 74 Years | 5 (13.2%) | 15 (68.2%) |
| 75 Years and over | 9 (100.0%) | 9 (75.0%) |
Disability Class by Sex by Age in London
Disability Class: Hearing Difficulty
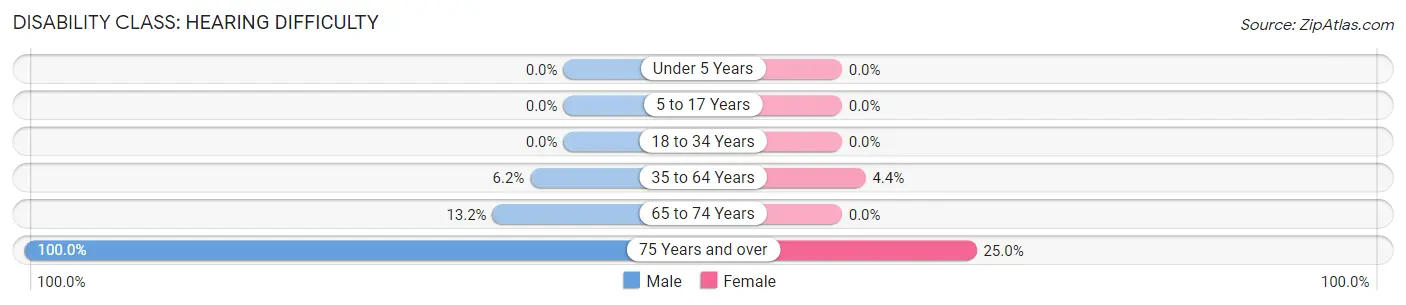
| Age Bracket | Male | Female |
| Under 5 Years | 0 (0.0%) | 0 (0.0%) |
| 5 to 17 Years | 0 (0.0%) | 0 (0.0%) |
| 18 to 34 Years | 0 (0.0%) | 0 (0.0%) |
| 35 to 64 Years | 12 (6.1%) | 10 (4.4%) |
| 65 to 74 Years | 5 (13.2%) | 0 (0.0%) |
| 75 Years and over | 9 (100.0%) | 3 (25.0%) |
Disability Class: Vision Difficulty
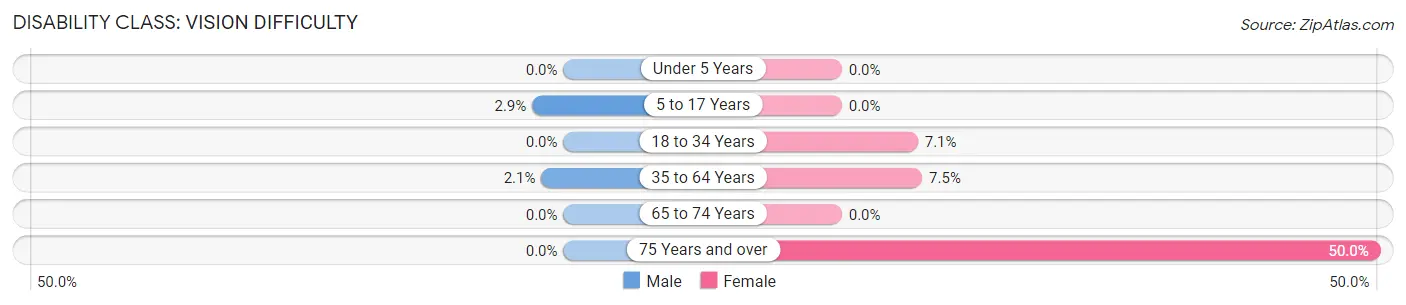
| Age Bracket | Male | Female |
| Under 5 Years | 0 (0.0%) | 0 (0.0%) |
| 5 to 17 Years | 4 (2.9%) | 0 (0.0%) |
| 18 to 34 Years | 0 (0.0%) | 11 (7.0%) |
| 35 to 64 Years | 4 (2.1%) | 17 (7.5%) |
| 65 to 74 Years | 0 (0.0%) | 0 (0.0%) |
| 75 Years and over | 0 (0.0%) | 6 (50.0%) |
Disability Class: Cognitive Difficulty
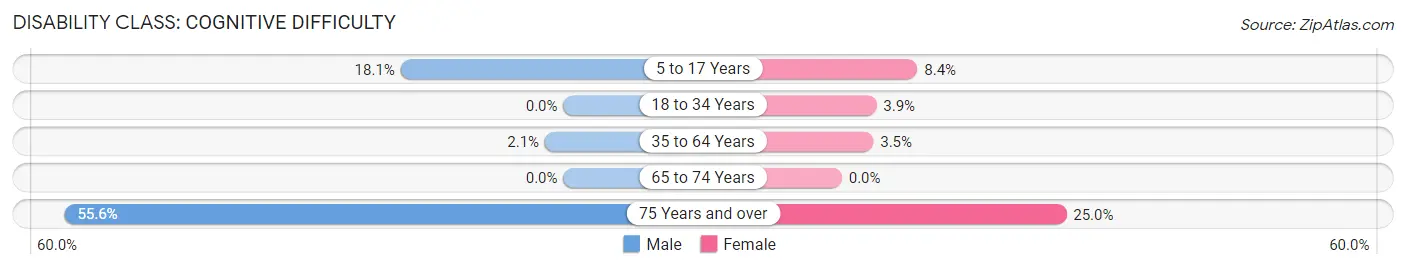
| Age Bracket | Male | Female |
| 5 to 17 Years | 25 (18.1%) | 9 (8.4%) |
| 18 to 34 Years | 0 (0.0%) | 6 (3.8%) |
| 35 to 64 Years | 4 (2.1%) | 8 (3.5%) |
| 65 to 74 Years | 0 (0.0%) | 0 (0.0%) |
| 75 Years and over | 5 (55.6%) | 3 (25.0%) |
Disability Class: Ambulatory Difficulty
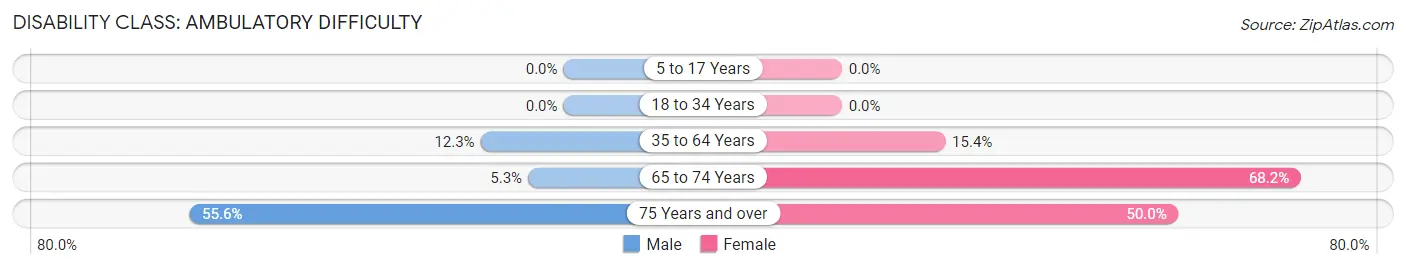
| Age Bracket | Male | Female |
| 5 to 17 Years | 0 (0.0%) | 0 (0.0%) |
| 18 to 34 Years | 0 (0.0%) | 0 (0.0%) |
| 35 to 64 Years | 24 (12.3%) | 35 (15.3%) |
| 65 to 74 Years | 2 (5.3%) | 15 (68.2%) |
| 75 Years and over | 5 (55.6%) | 6 (50.0%) |
Disability Class: Self-Care Difficulty
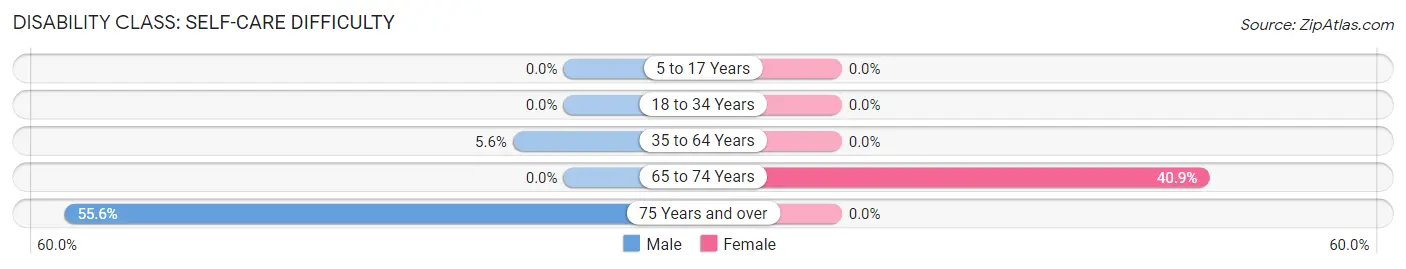
| Age Bracket | Male | Female |
| 5 to 17 Years | 0 (0.0%) | 0 (0.0%) |
| 18 to 34 Years | 0 (0.0%) | 0 (0.0%) |
| 35 to 64 Years | 11 (5.6%) | 0 (0.0%) |
| 65 to 74 Years | 0 (0.0%) | 9 (40.9%) |
| 75 Years and over | 5 (55.6%) | 0 (0.0%) |
Technology Access in London
Computing Device Access in London
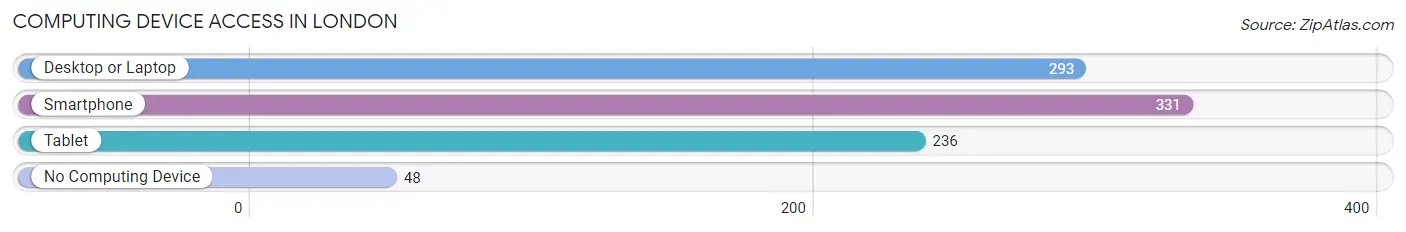
| Device Type | # Households | % Households |
| Desktop or Laptop | 293 | 73.3% |
| Smartphone | 331 | 82.8% |
| Tablet | 236 | 59.0% |
| No Computing Device | 48 | 12.0% |
| Total | 400 | 100.0% |
Internet Access in London
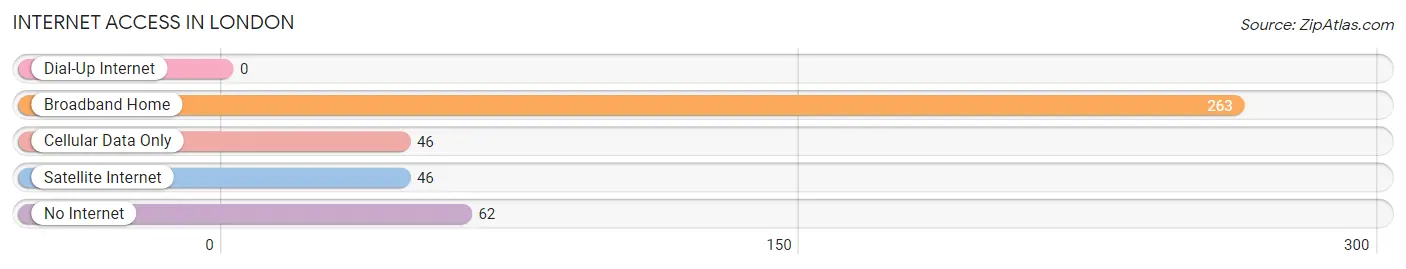
| Internet Type | # Households | % Households |
| Dial-Up Internet | 0 | 0.0% |
| Broadband Home | 263 | 65.7% |
| Cellular Data Only | 46 | 11.5% |
| Satellite Internet | 46 | 11.5% |
| No Internet | 62 | 15.5% |
| Total | 400 | 100.0% |
London Summary
London is the capital and largest city of England and the United Kingdom. It is located on the River Thames in the south-east of England, at the head of its 50-mile (80 km) estuary leading to the North Sea. London has been a major settlement for two millennia, and was originally called Londinium by the Romans. It is one of the world's most important global cities and has been described as the world's most powerful, most desirable, most influential, most visited, most expensive, innovative, sustainable, most investment friendly, most popular for work, and the most vegetarian-friendly city in the world.
Geography
London is located in the south-east of England, at the head of its 50-mile (80 km) estuary leading to the North Sea. It is surrounded by the counties of Essex to the east, Hertfordshire to the north, Surrey to the south and Buckinghamshire to the west. The city covers an area of 1,572 square kilometres (605 sq mi) and is the largest city in the United Kingdom.
The River Thames runs through the centre of London, from the estuary at the Thames Barrier to the west, to the Tower of London and the City of London in the east. The Thames is tidal and is spanned by numerous bridges, including Tower Bridge, London Bridge, Waterloo Bridge, Westminster Bridge, and the Millennium Bridge.
Economy
London is one of the world's leading financial centres and is home to the London Stock Exchange, the Bank of England, and the London International Financial Futures and Options Exchange. It is also a major centre for banking, insurance, and other financial services.
London is a major centre for business and commerce and is home to many of the world's largest companies, including HSBC, Barclays, Lloyds Banking Group, and Standard Chartered. It is also home to many of the world's leading law firms, including Clifford Chance, Freshfields Bruckhaus Deringer, and Linklaters.
Demographics
London is one of the most populous cities in the world, with an estimated population of 8.9 million in 2019. It is the most populous city in the United Kingdom and the European Union.
London is a diverse city, with people from a wide range of backgrounds and cultures. The largest ethnic group is White British, followed by Indian, Pakistani, Bangladeshi, and Black African. Other significant ethnic groups include Chinese, Irish, and Caribbean.
London is also home to a large number of immigrants from other parts of the world, including the United States, Canada, Australia, and New Zealand.
London is a major centre for education, with over 40 universities and colleges, including the University of London, Imperial College London, and the London School of Economics. It is also home to a number of world-renowned museums, galleries, and other cultural institutions, including the British Museum, the National Gallery, and the Tate Modern.
Common Questions
What is Per Capita Income in London?
Per Capita income in London is $28,330.
What is the Median Family Income in London?
Median Family Income in London is $60,250.
What is the Median Household income in London?
Median Household Income in London is $50,750.
What is Income or Wage Gap in London?
Income or Wage Gap in London is 54.4%.
Women in London earn 45.6 cents for every dollar earned by a man.
What is Inequality or Gini Index in London?
Inequality or Gini Index in London is 0.49.
What is the Total Population of London?
Total Population of London is 1,113.
What is the Total Male Population of London?
Total Male Population of London is 536.
What is the Total Female Population of London?
Total Female Population of London is 577.
What is the Ratio of Males per 100 Females in London?
There are 92.89 Males per 100 Females in London.
What is the Ratio of Females per 100 Males in London?
There are 107.65 Females per 100 Males in London.
What is the Median Population Age in London?
Median Population Age in London is 30.7 Years.
What is the Average Family Size in London
Average Family Size in London is 3.4 People.
What is the Average Household Size in London
Average Household Size in London is 2.8 People.
How Large is the Labor Force in London?
There are 517 People in the Labor Forcein in London.
What is the Percentage of People in the Labor Force in London?
64.4% of People are in the Labor Force in London.
What is the Unemployment Rate in London?
Unemployment Rate in London is 4.7%.