Lonsdale, MN Map & Demographics
Lonsdale Map
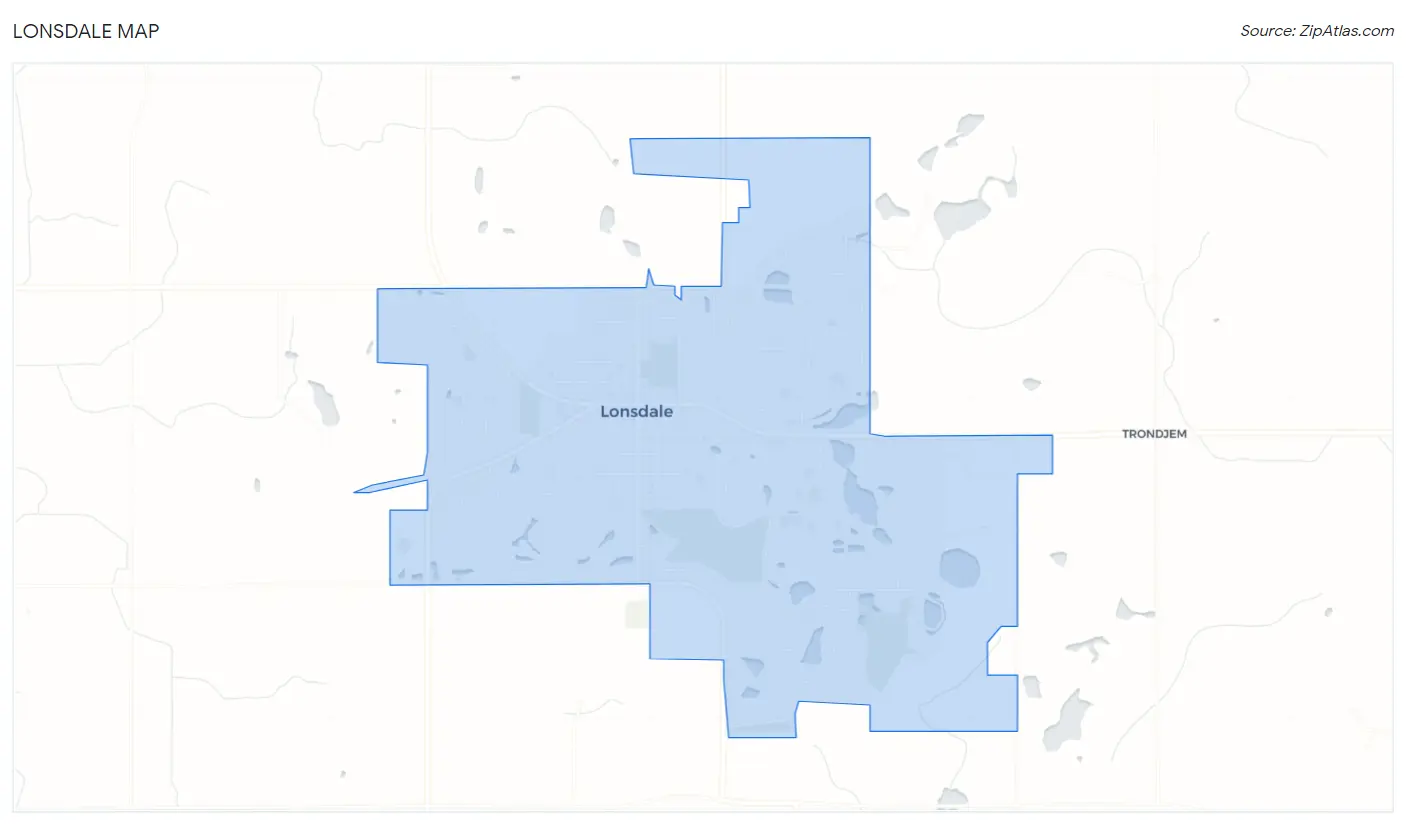
Lonsdale Overview
$33,840
PER CAPITA INCOME
$108,897
AVG FAMILY INCOME
$95,265
AVG HOUSEHOLD INCOME
35.4%
WAGE / INCOME GAP [ % ]
64.6¢/ $1
WAGE / INCOME GAP [ $ ]
0.31
INEQUALITY / GINI INDEX
4,727
TOTAL POPULATION
2,470
MALE POPULATION
2,257
FEMALE POPULATION
109.44
MALES / 100 FEMALES
91.38
FEMALES / 100 MALES
30.1
MEDIAN AGE
3.5
AVG FAMILY SIZE
3.1
AVG HOUSEHOLD SIZE
2,363
LABOR FORCE [ PEOPLE ]
73.6%
PERCENT IN LABOR FORCE
0.9%
UNEMPLOYMENT RATE
Lonsdale Zip Codes
Lonsdale Area Codes
Income in Lonsdale
Income Overview in Lonsdale
Per Capita Income in Lonsdale is $33,840, while median incomes of families and households are $108,897 and $95,265 respectively.
| Characteristic | Number | Measure |
| Per Capita Income | 4,727 | $33,840 |
| Median Family Income | 1,222 | $108,897 |
| Mean Family Income | 1,222 | $115,251 |
| Median Household Income | 1,529 | $95,265 |
| Mean Household Income | 1,529 | $104,197 |
| Income Deficit | 1,222 | $0 |
| Wage / Income Gap (%) | 4,727 | 35.36% |
| Wage / Income Gap ($) | 4,727 | 64.64¢ per $1 |
| Gini / Inequality Index | 4,727 | 0.31 |
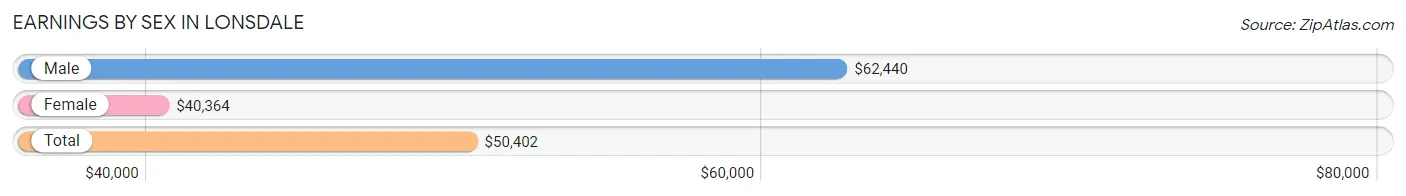
Earnings by Sex in Lonsdale
Average Earnings in Lonsdale are $50,402, $62,440 for men and $40,364 for women, a difference of 35.4%.
| Sex | Number | Average Earnings |
| Male | 1,421 (55.0%) | $62,440 |
| Female | 1,163 (45.0%) | $40,364 |
| Total | 2,584 (100.0%) | $50,402 |
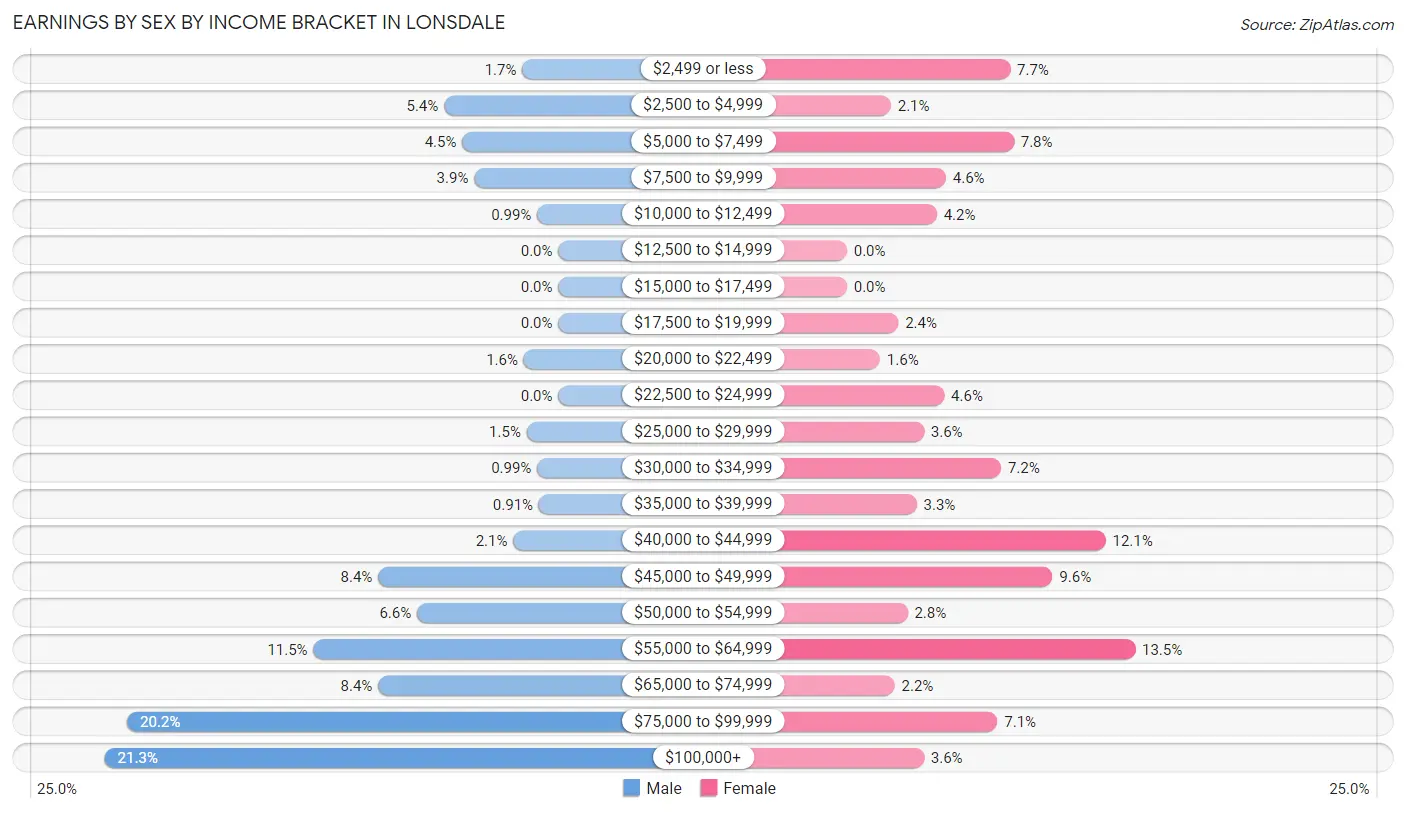
Earnings by Sex by Income Bracket in Lonsdale
The most common earnings brackets in Lonsdale are $100,000+ for men (302 | 21.2%) and $55,000 to $64,999 for women (157 | 13.5%).
| Income | Male | Female |
| $2,499 or less | 24 (1.7%) | 89 (7.6%) |
| $2,500 to $4,999 | 76 (5.3%) | 24 (2.1%) |
| $5,000 to $7,499 | 64 (4.5%) | 91 (7.8%) |
| $7,500 to $9,999 | 56 (3.9%) | 54 (4.6%) |
| $10,000 to $12,499 | 14 (1.0%) | 49 (4.2%) |
| $12,500 to $14,999 | 0 (0.0%) | 0 (0.0%) |
| $15,000 to $17,499 | 0 (0.0%) | 0 (0.0%) |
| $17,500 to $19,999 | 0 (0.0%) | 28 (2.4%) |
| $20,000 to $22,499 | 23 (1.6%) | 18 (1.5%) |
| $22,500 to $24,999 | 0 (0.0%) | 53 (4.6%) |
| $25,000 to $29,999 | 21 (1.5%) | 42 (3.6%) |
| $30,000 to $34,999 | 14 (1.0%) | 84 (7.2%) |
| $35,000 to $39,999 | 13 (0.9%) | 38 (3.3%) |
| $40,000 to $44,999 | 30 (2.1%) | 141 (12.1%) |
| $45,000 to $49,999 | 120 (8.4%) | 112 (9.6%) |
| $50,000 to $54,999 | 94 (6.6%) | 33 (2.8%) |
| $55,000 to $64,999 | 163 (11.5%) | 157 (13.5%) |
| $65,000 to $74,999 | 120 (8.4%) | 26 (2.2%) |
| $75,000 to $99,999 | 287 (20.2%) | 82 (7.0%) |
| $100,000+ | 302 (21.2%) | 42 (3.6%) |
| Total | 1,421 (100.0%) | 1,163 (100.0%) |
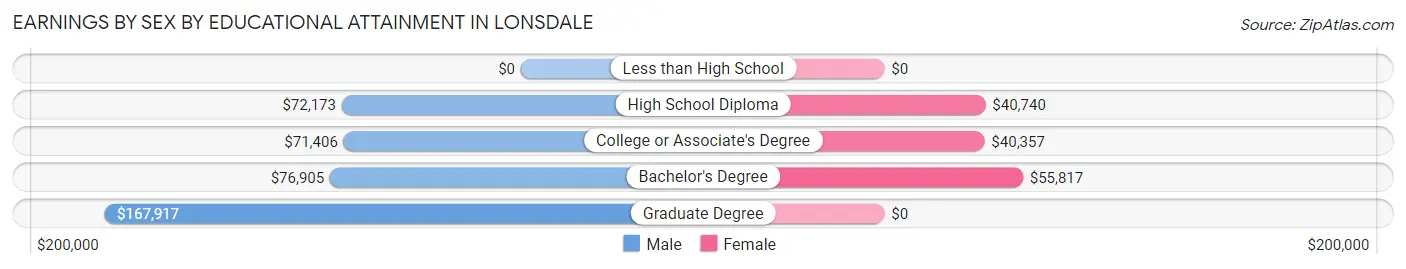
Earnings by Sex by Educational Attainment in Lonsdale
Average earnings in Lonsdale are $75,447 for men and $44,536 for women, a difference of 41.0%. Men with an educational attainment of graduate degree enjoy the highest average annual earnings of $167,917, while those with college or associate's degree education earn the least with $71,406. Women with an educational attainment of bachelor's degree earn the most with the average annual earnings of $55,817, while those with college or associate's degree education have the smallest earnings of $40,357.
| Educational Attainment | Male Income | Female Income |
| Less than High School | - | - |
| High School Diploma | $72,173 | $40,740 |
| College or Associate's Degree | $71,406 | $40,357 |
| Bachelor's Degree | $76,905 | $55,817 |
| Graduate Degree | $167,917 | $0 |
| Total | $75,447 | $44,536 |
Family Income in Lonsdale
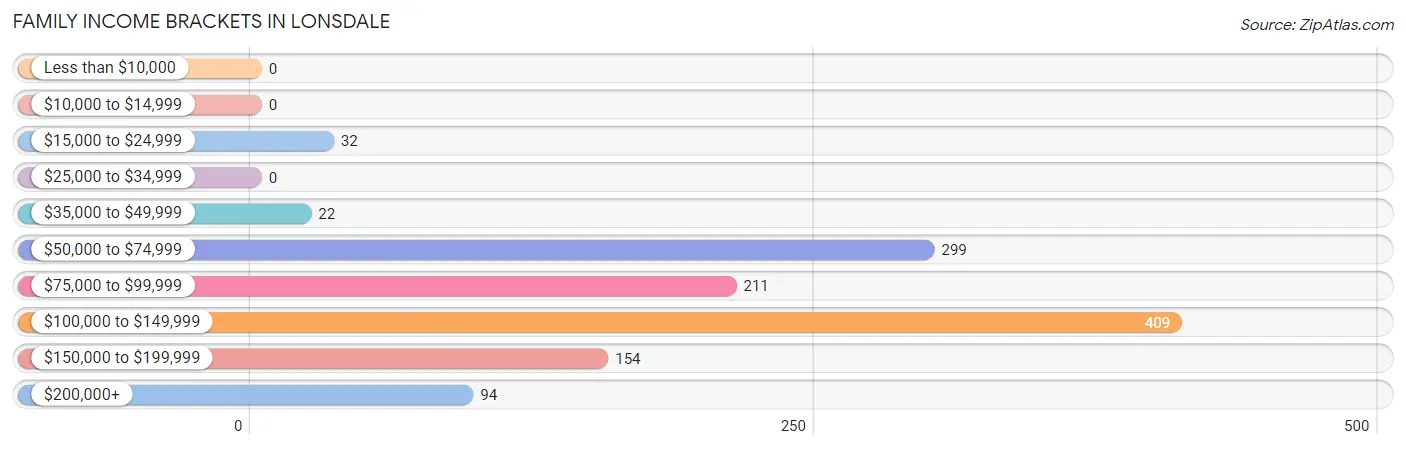
Family Income Brackets in Lonsdale
According to the Lonsdale family income data, there are 409 families falling into the $100,000 to $149,999 income range, which is the most common income bracket and makes up 33.5% of all families.
| Income Bracket | # Families | % Families |
| Less than $10,000 | 0 | 0.0% |
| $10,000 to $14,999 | 0 | 0.0% |
| $15,000 to $24,999 | 32 | 2.6% |
| $25,000 to $34,999 | 0 | 0.0% |
| $35,000 to $49,999 | 22 | 1.8% |
| $50,000 to $74,999 | 299 | 24.5% |
| $75,000 to $99,999 | 211 | 17.3% |
| $100,000 to $149,999 | 409 | 33.5% |
| $150,000 to $199,999 | 154 | 12.6% |
| $200,000+ | 94 | 7.7% |
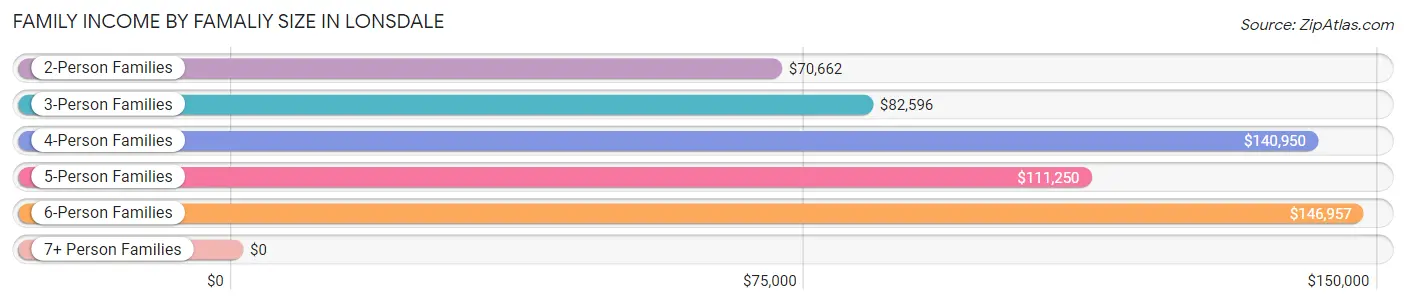
Family Income by Famaliy Size in Lonsdale
6-person families (100 | 8.2%) account for the highest median family income in Lonsdale with $146,957 per family, while 2-person families (415 | 34.0%) have the highest median income of $35,331 per family member.
| Income Bracket | # Families | Median Income |
| 2-Person Families | 415 (34.0%) | $70,662 |
| 3-Person Families | 166 (13.6%) | $82,596 |
| 4-Person Families | 275 (22.5%) | $140,950 |
| 5-Person Families | 266 (21.8%) | $111,250 |
| 6-Person Families | 100 (8.2%) | $146,957 |
| 7+ Person Families | 0 (0.0%) | $0 |
| Total | 1,222 (100.0%) | $108,897 |
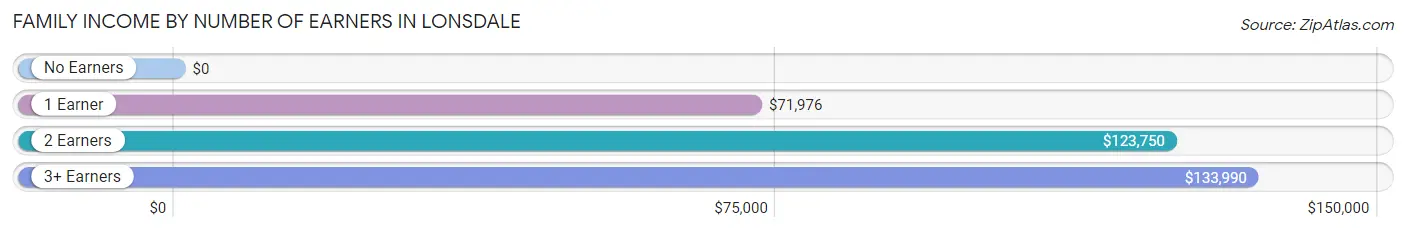
Family Income by Number of Earners in Lonsdale
| Number of Earners | # Families | Median Income |
| No Earners | 56 (4.6%) | $0 |
| 1 Earner | 305 (25.0%) | $71,976 |
| 2 Earners | 604 (49.4%) | $123,750 |
| 3+ Earners | 257 (21.0%) | $133,990 |
| Total | 1,222 (100.0%) | $108,897 |
Household Income in Lonsdale
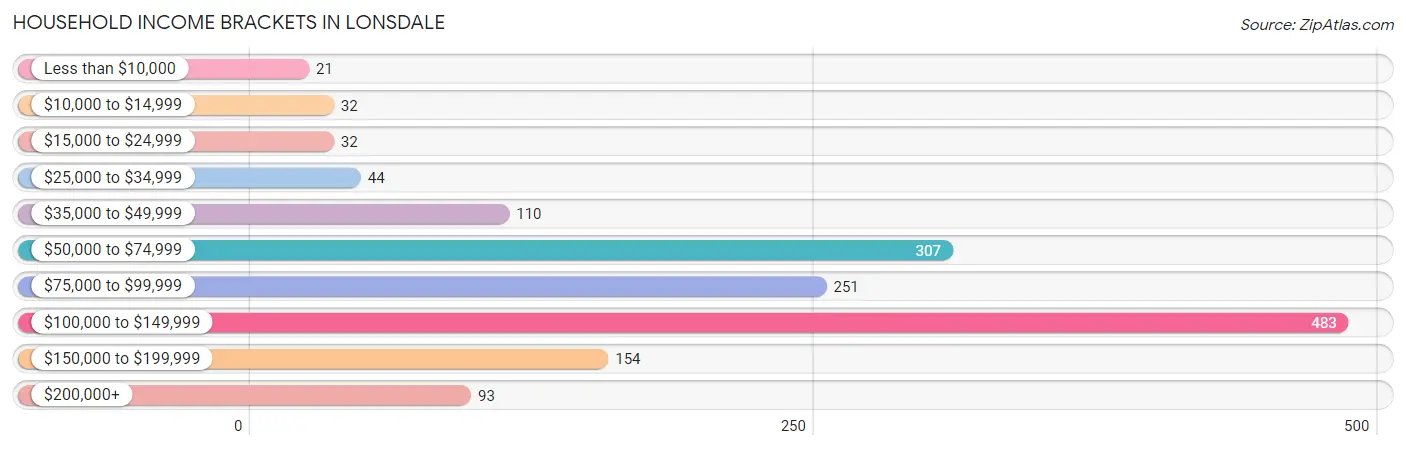
Household Income Brackets in Lonsdale
With 483 households falling in the category, the $100,000 to $149,999 income range is the most frequent in Lonsdale, accounting for 31.6% of all households. In contrast, only 21 households (1.4%) fall into the less than $10,000 income bracket, making it the least populous group.
| Income Bracket | # Households | % Households |
| Less than $10,000 | 21 | 1.4% |
| $10,000 to $14,999 | 32 | 2.1% |
| $15,000 to $24,999 | 32 | 2.1% |
| $25,000 to $34,999 | 44 | 2.9% |
| $35,000 to $49,999 | 110 | 7.2% |
| $50,000 to $74,999 | 307 | 20.1% |
| $75,000 to $99,999 | 251 | 16.4% |
| $100,000 to $149,999 | 483 | 31.6% |
| $150,000 to $199,999 | 154 | 10.1% |
| $200,000+ | 93 | 6.1% |
Household Income by Householder Age in Lonsdale
The median household income in Lonsdale is $95,265, with the highest median household income of $116,797 found in the 45 to 64 years age bracket for the primary householder. A total of 416 households (27.2%) fall into this category. Meanwhile, the 65+ years age bracket for the primary householder has the lowest median household income of $31,250, with 204 households (13.3%) in this group.
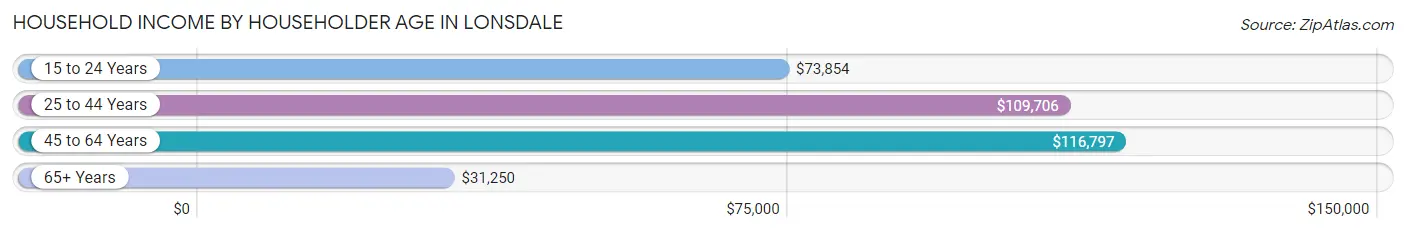
| Income Bracket | # Households | Median Income |
| 15 to 24 Years | 41 (2.7%) | $73,854 |
| 25 to 44 Years | 868 (56.8%) | $109,706 |
| 45 to 64 Years | 416 (27.2%) | $116,797 |
| 65+ Years | 204 (13.3%) | $31,250 |
| Total | 1,529 (100.0%) | $95,265 |
Poverty in Lonsdale
Income Below Poverty by Sex and Age in Lonsdale
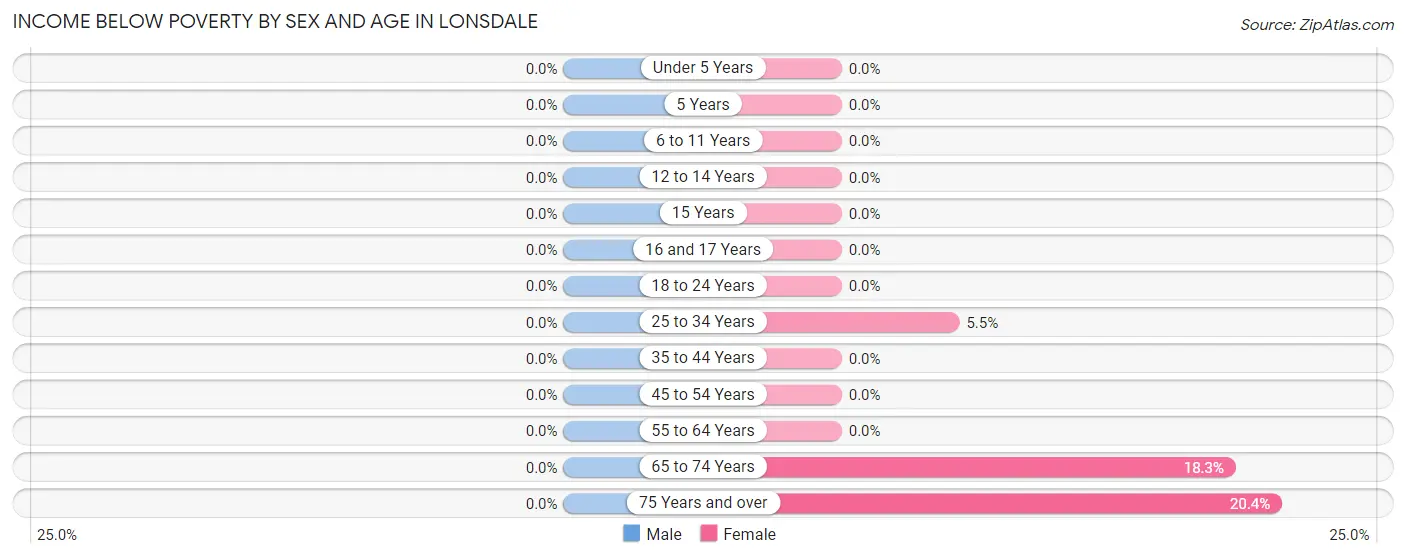
| Age Bracket | Male | Female |
| Under 5 Years | 0 (0.0%) | 0 (0.0%) |
| 5 Years | 0 (0.0%) | 0 (0.0%) |
| 6 to 11 Years | 0 (0.0%) | 0 (0.0%) |
| 12 to 14 Years | 0 (0.0%) | 0 (0.0%) |
| 15 Years | 0 (0.0%) | 0 (0.0%) |
| 16 and 17 Years | 0 (0.0%) | 0 (0.0%) |
| 18 to 24 Years | 0 (0.0%) | 0 (0.0%) |
| 25 to 34 Years | 0 (0.0%) | 19 (5.5%) |
| 35 to 44 Years | 0 (0.0%) | 0 (0.0%) |
| 45 to 54 Years | 0 (0.0%) | 0 (0.0%) |
| 55 to 64 Years | 0 (0.0%) | 0 (0.0%) |
| 65 to 74 Years | 0 (0.0%) | 17 (18.3%) |
| 75 Years and over | 0 (0.0%) | 19 (20.4%) |
| Total | 0 (0.0%) | 55 (2.4%) |
Income Above Poverty by Sex and Age in Lonsdale
According to the poverty statistics in Lonsdale, males aged under 5 years and females aged under 5 years are the age groups that are most secure financially, with 100.0% of males and 100.0% of females in these age groups living above the poverty line.
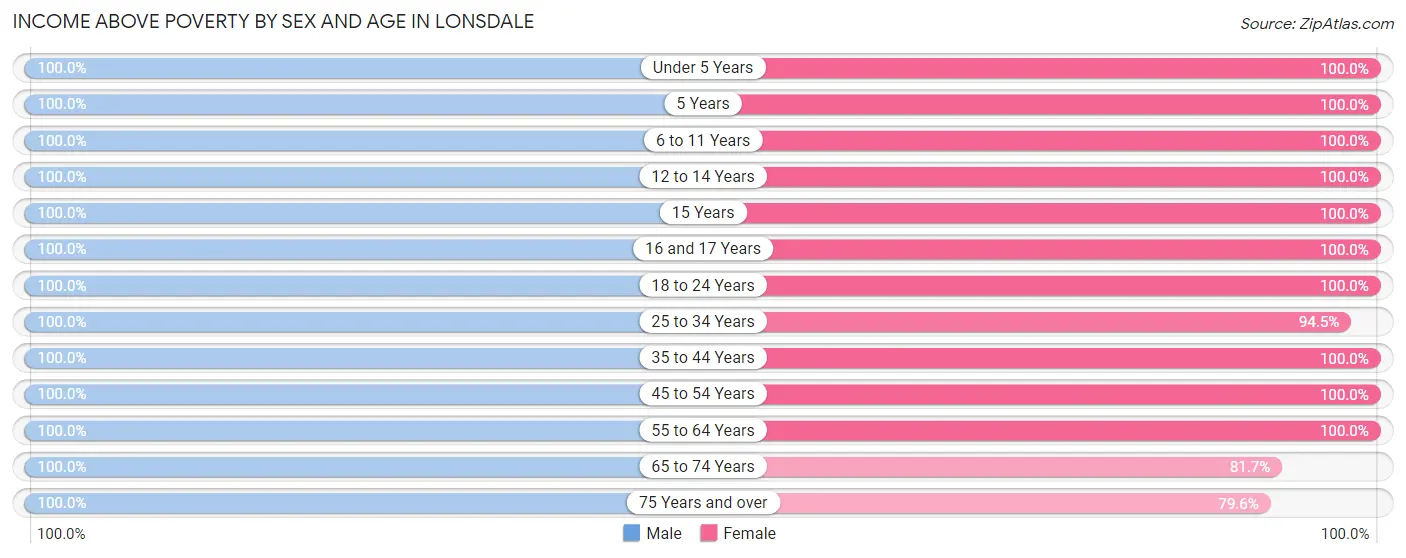
| Age Bracket | Male | Female |
| Under 5 Years | 279 (100.0%) | 256 (100.0%) |
| 5 Years | 31 (100.0%) | 38 (100.0%) |
| 6 to 11 Years | 182 (100.0%) | 218 (100.0%) |
| 12 to 14 Years | 251 (100.0%) | 178 (100.0%) |
| 15 Years | 24 (100.0%) | 36 (100.0%) |
| 16 and 17 Years | 146 (100.0%) | 72 (100.0%) |
| 18 to 24 Years | 194 (100.0%) | 169 (100.0%) |
| 25 to 34 Years | 386 (100.0%) | 329 (94.5%) |
| 35 to 44 Years | 432 (100.0%) | 410 (100.0%) |
| 45 to 54 Years | 182 (100.0%) | 220 (100.0%) |
| 55 to 64 Years | 198 (100.0%) | 126 (100.0%) |
| 65 to 74 Years | 98 (100.0%) | 76 (81.7%) |
| 75 Years and over | 35 (100.0%) | 74 (79.6%) |
| Total | 2,438 (100.0%) | 2,202 (97.6%) |
Income Below Poverty Among Married-Couple Families in Lonsdale
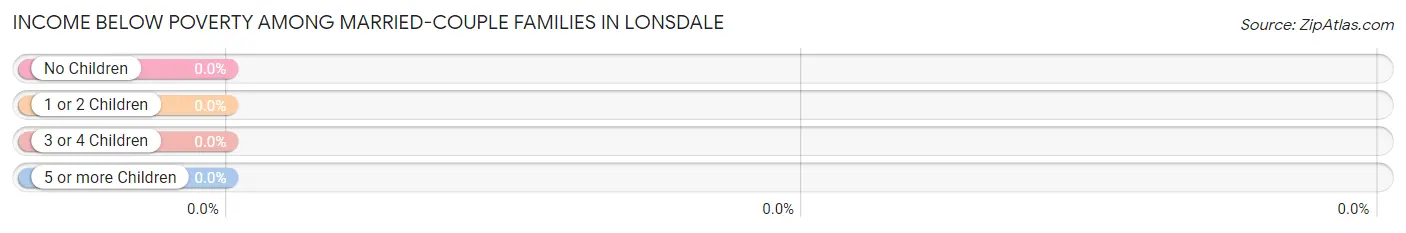
| Children | Above Poverty | Below Poverty |
| No Children | 422 (100.0%) | 0 (0.0%) |
| 1 or 2 Children | 398 (100.0%) | 0 (0.0%) |
| 3 or 4 Children | 283 (100.0%) | 0 (0.0%) |
| 5 or more Children | 0 (0.0%) | 0 (0.0%) |
| Total | 1,103 (100.0%) | 0 (0.0%) |
Income Below Poverty Among Single-Parent Households in Lonsdale
| Children | Single Father | Single Mother |
| No Children | 0 (0.0%) | 0 (0.0%) |
| 1 or 2 Children | 0 (0.0%) | 0 (0.0%) |
| 3 or 4 Children | 0 (0.0%) | 0 (0.0%) |
| 5 or more Children | 0 (0.0%) | 0 (0.0%) |
| Total | 0 (0.0%) | 0 (0.0%) |
Income Below Poverty Among Married-Couple vs Single-Parent Households in Lonsdale
| Children | Married-Couple Families | Single-Parent Households |
| No Children | 0 (0.0%) | 0 (0.0%) |
| 1 or 2 Children | 0 (0.0%) | 0 (0.0%) |
| 3 or 4 Children | 0 (0.0%) | 0 (0.0%) |
| 5 or more Children | 0 (0.0%) | 0 (0.0%) |
| Total | 0 (0.0%) | 0 (0.0%) |
Race in Lonsdale
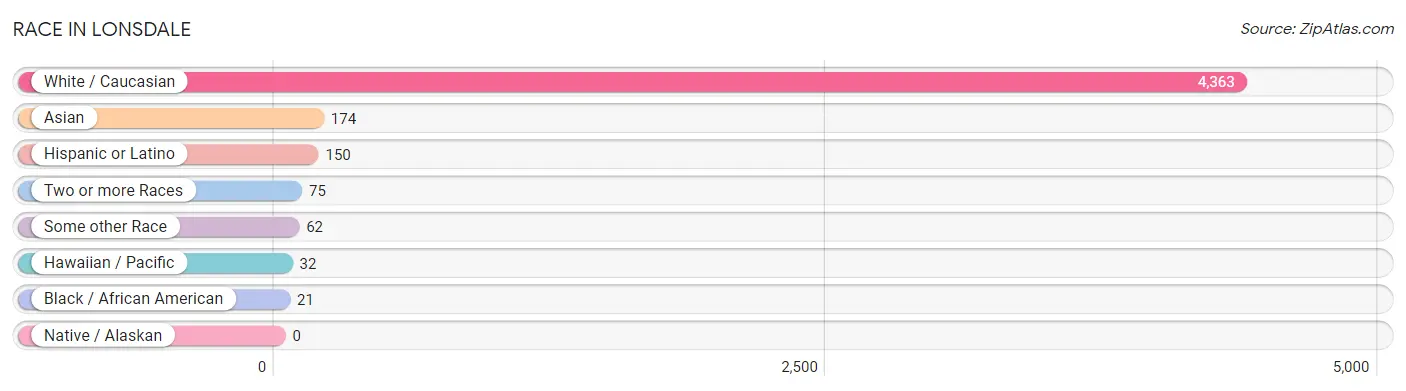
The most populous races in Lonsdale are White / Caucasian (4,363 | 92.3%), Asian (174 | 3.7%), and Hispanic or Latino (150 | 3.2%).
| Race | # Population | % Population |
| Asian | 174 | 3.7% |
| Black / African American | 21 | 0.4% |
| Hawaiian / Pacific | 32 | 0.7% |
| Hispanic or Latino | 150 | 3.2% |
| Native / Alaskan | 0 | 0.0% |
| White / Caucasian | 4,363 | 92.3% |
| Two or more Races | 75 | 1.6% |
| Some other Race | 62 | 1.3% |
| Total | 4,727 | 100.0% |
Ancestry in Lonsdale
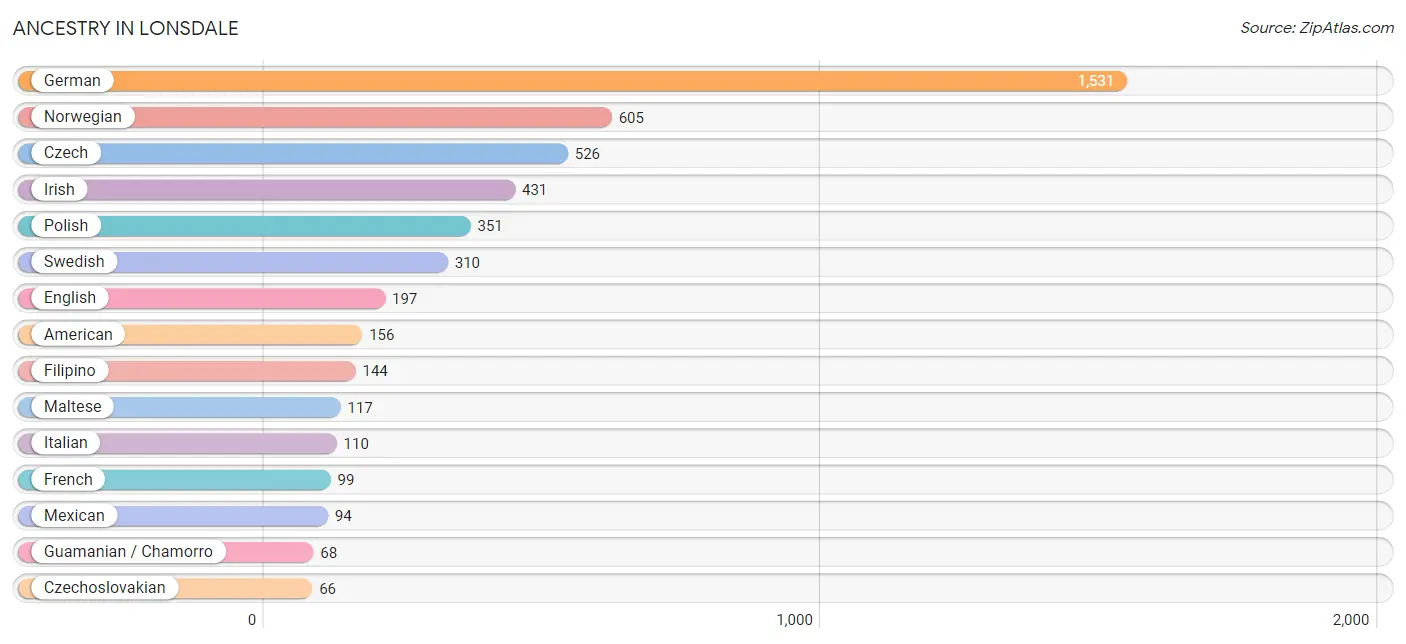
The most populous ancestries reported in Lonsdale are German (1,531 | 32.4%), Norwegian (605 | 12.8%), Czech (526 | 11.1%), Irish (431 | 9.1%), and Polish (351 | 7.4%), together accounting for 72.9% of all Lonsdale residents.
| Ancestry | # Population | % Population |
| American | 156 | 3.3% |
| British | 15 | 0.3% |
| Burmese | 30 | 0.6% |
| Cherokee | 10 | 0.2% |
| Chippewa | 10 | 0.2% |
| Czech | 526 | 11.1% |
| Czechoslovakian | 66 | 1.4% |
| Danish | 14 | 0.3% |
| Dutch | 23 | 0.5% |
| Eastern European | 16 | 0.3% |
| English | 197 | 4.2% |
| European | 11 | 0.2% |
| Filipino | 144 | 3.0% |
| Finnish | 37 | 0.8% |
| French | 99 | 2.1% |
| German | 1,531 | 32.4% |
| Guamanian / Chamorro | 68 | 1.4% |
| Irish | 431 | 9.1% |
| Italian | 110 | 2.3% |
| Maltese | 117 | 2.5% |
| Mexican | 94 | 2.0% |
| Norwegian | 605 | 12.8% |
| Polish | 351 | 7.4% |
| Portuguese | 12 | 0.3% |
| Puerto Rican | 51 | 1.1% |
| Scandinavian | 41 | 0.9% |
| Scotch-Irish | 7 | 0.2% |
| Scottish | 24 | 0.5% |
| Spanish | 5 | 0.1% |
| Swedish | 310 | 6.6% | View All 30 Rows |
Immigrants in Lonsdale
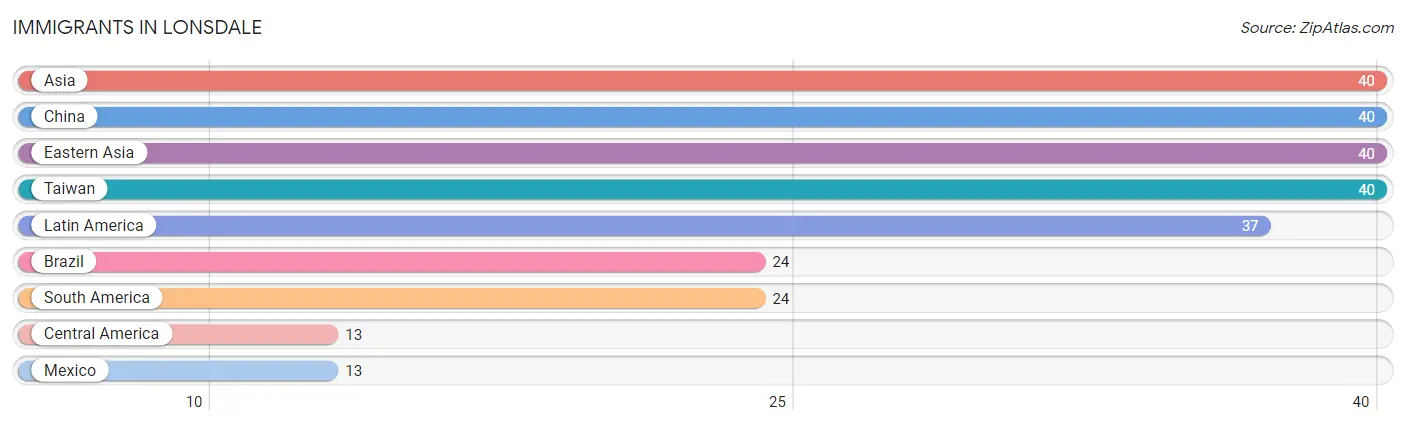
The most numerous immigrant groups reported in Lonsdale came from Asia (40 | 0.9%), China (40 | 0.9%), Eastern Asia (40 | 0.9%), Taiwan (40 | 0.9%), and Latin America (37 | 0.8%), together accounting for 4.2% of all Lonsdale residents.
| Immigration Origin | # Population | % Population |
| Asia | 40 | 0.9% |
| Brazil | 24 | 0.5% |
| Central America | 13 | 0.3% |
| China | 40 | 0.9% |
| Eastern Asia | 40 | 0.9% |
| Latin America | 37 | 0.8% |
| Mexico | 13 | 0.3% |
| South America | 24 | 0.5% |
| Taiwan | 40 | 0.9% | View All 9 Rows |
Sex and Age in Lonsdale
Sex and Age in Lonsdale
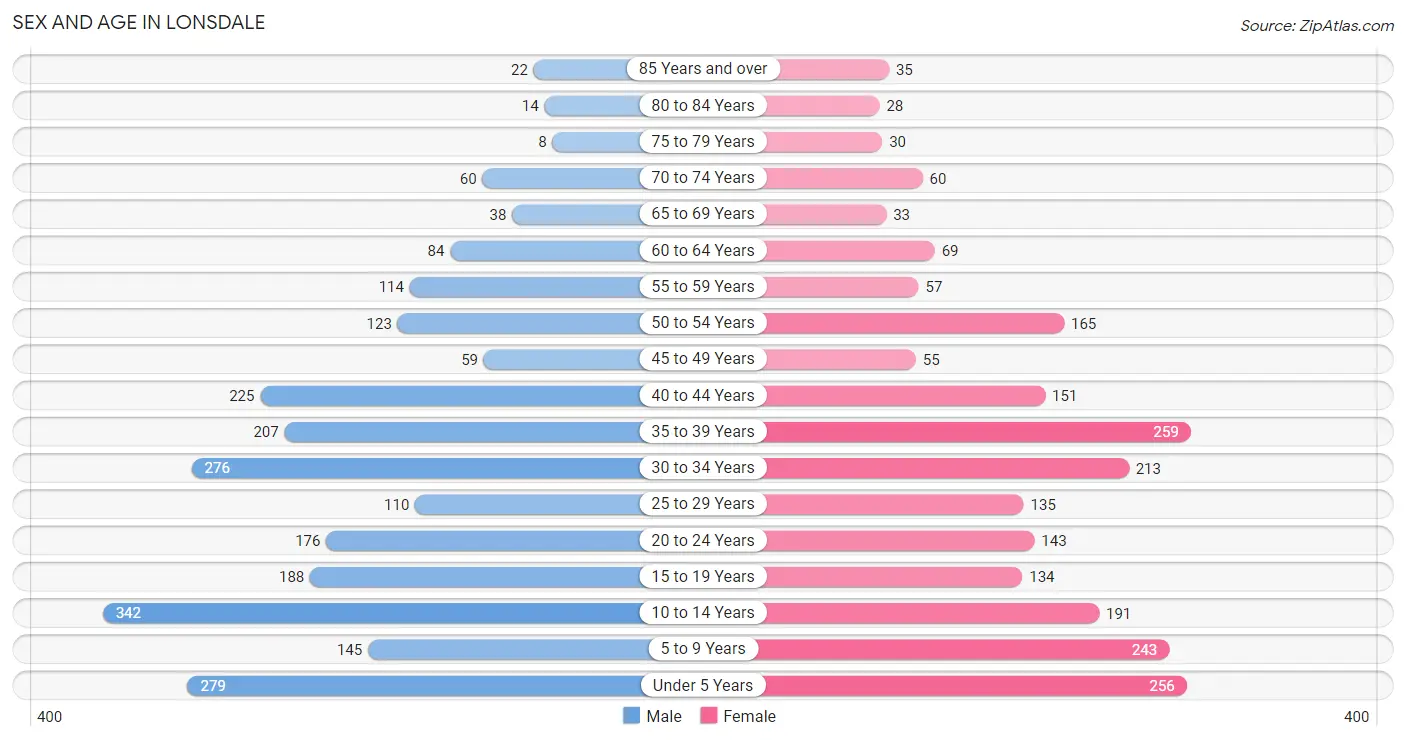
The most populous age groups in Lonsdale are 10 to 14 Years (342 | 13.9%) for men and 35 to 39 Years (259 | 11.5%) for women.
| Age Bracket | Male | Female |
| Under 5 Years | 279 (11.3%) | 256 (11.3%) |
| 5 to 9 Years | 145 (5.9%) | 243 (10.8%) |
| 10 to 14 Years | 342 (13.9%) | 191 (8.5%) |
| 15 to 19 Years | 188 (7.6%) | 134 (5.9%) |
| 20 to 24 Years | 176 (7.1%) | 143 (6.3%) |
| 25 to 29 Years | 110 (4.4%) | 135 (6.0%) |
| 30 to 34 Years | 276 (11.2%) | 213 (9.4%) |
| 35 to 39 Years | 207 (8.4%) | 259 (11.5%) |
| 40 to 44 Years | 225 (9.1%) | 151 (6.7%) |
| 45 to 49 Years | 59 (2.4%) | 55 (2.4%) |
| 50 to 54 Years | 123 (5.0%) | 165 (7.3%) |
| 55 to 59 Years | 114 (4.6%) | 57 (2.5%) |
| 60 to 64 Years | 84 (3.4%) | 69 (3.1%) |
| 65 to 69 Years | 38 (1.5%) | 33 (1.5%) |
| 70 to 74 Years | 60 (2.4%) | 60 (2.7%) |
| 75 to 79 Years | 8 (0.3%) | 30 (1.3%) |
| 80 to 84 Years | 14 (0.6%) | 28 (1.2%) |
| 85 Years and over | 22 (0.9%) | 35 (1.5%) |
| Total | 2,470 (100.0%) | 2,257 (100.0%) |
Families and Households in Lonsdale
Median Family Size in Lonsdale
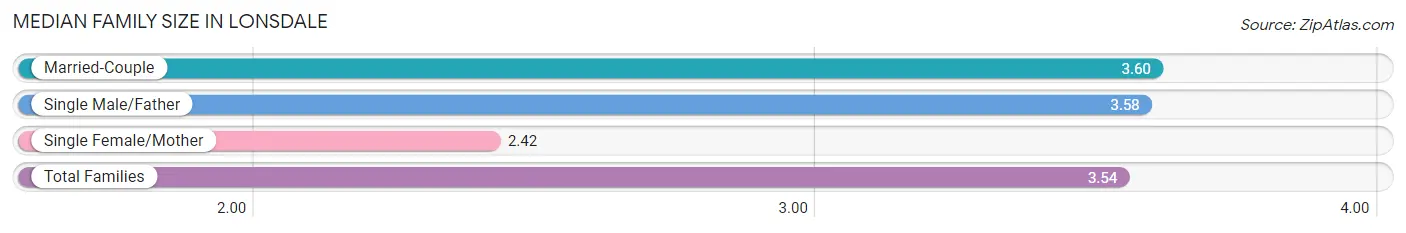
The median family size in Lonsdale is 3.54 persons per family, with married-couple families (1,103 | 90.3%) accounting for the largest median family size of 3.6 persons per family. On the other hand, single female/mother families (66 | 5.4%) represent the smallest median family size with 2.42 persons per family.
| Family Type | # Families | Family Size |
| Married-Couple | 1,103 (90.3%) | 3.60 |
| Single Male/Father | 53 (4.3%) | 3.58 |
| Single Female/Mother | 66 (5.4%) | 2.42 |
| Total Families | 1,222 (100.0%) | 3.54 |
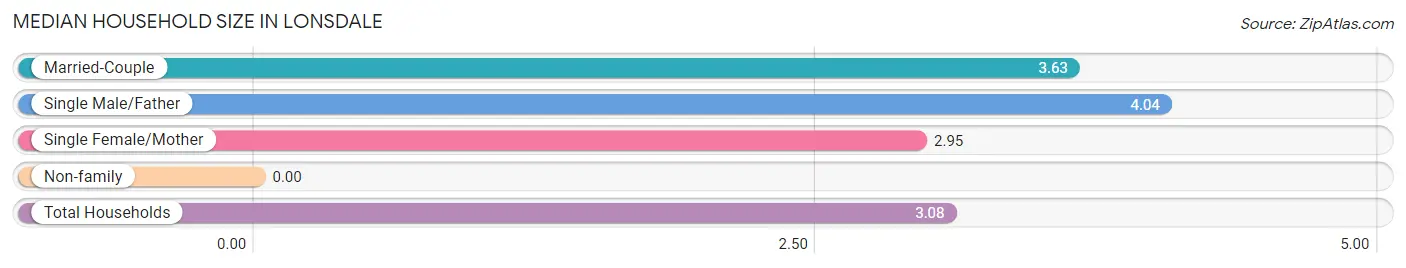
Median Household Size in Lonsdale
| Household Type | # Households | Household Size |
| Married-Couple | 1,103 (72.1%) | 3.63 |
| Single Male/Father | 53 (3.5%) | 4.04 |
| Single Female/Mother | 66 (4.3%) | 2.95 |
| Non-family | 307 (20.1%) | - |
| Total Households | 1,529 (100.0%) | 3.08 |
Household Size by Marriage Status in Lonsdale
Out of a total of 1,529 households in Lonsdale, 1,222 (79.9%) are family households, while 307 (20.1%) are nonfamily households. The most numerous type of family households are 2-person households, comprising 387, and the most common type of nonfamily households are 1-person households, comprising 307.
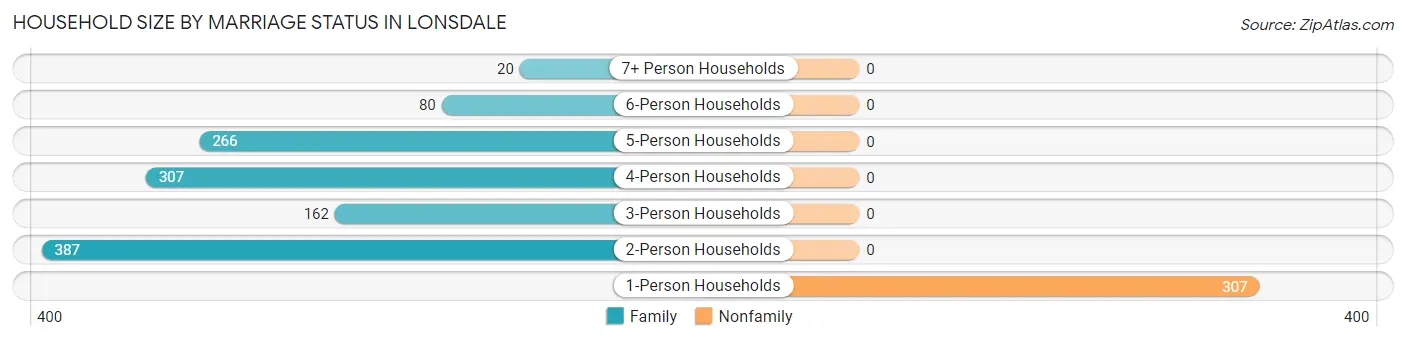
| Household Size | Family Households | Nonfamily Households |
| 1-Person Households | - | 307 (20.1%) |
| 2-Person Households | 387 (25.3%) | 0 (0.0%) |
| 3-Person Households | 162 (10.6%) | 0 (0.0%) |
| 4-Person Households | 307 (20.1%) | 0 (0.0%) |
| 5-Person Households | 266 (17.4%) | 0 (0.0%) |
| 6-Person Households | 80 (5.2%) | 0 (0.0%) |
| 7+ Person Households | 20 (1.3%) | 0 (0.0%) |
| Total | 1,222 (79.9%) | 307 (20.1%) |
Female Fertility in Lonsdale
Fertility by Age in Lonsdale
Average fertility rate in Lonsdale is 83.0 births per 1,000 women. Women in the age bracket of 20 to 34 years have the highest fertility rate with 183.0 births per 1,000 women. Women in the age bracket of 20 to 34 years acount for 100.0% of all women with births.
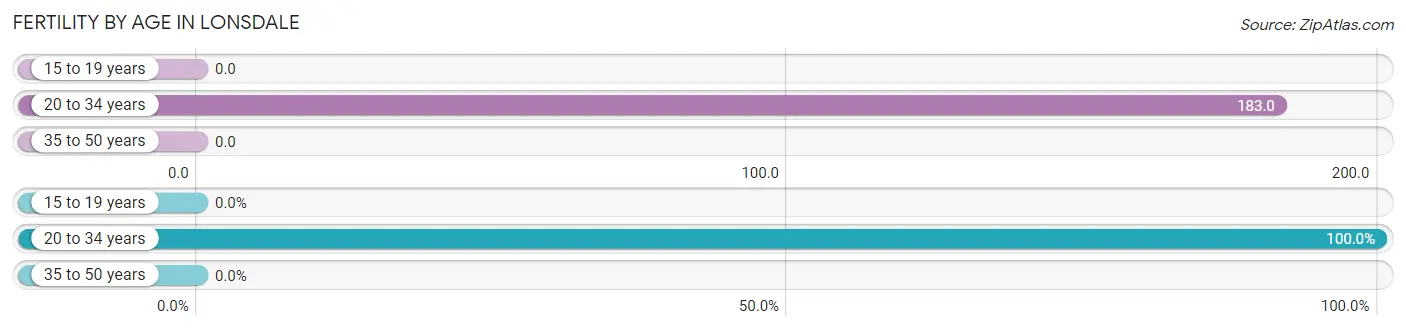
| Age Bracket | Women with Births | Births / 1,000 Women |
| 15 to 19 years | 0 (0.0%) | 0.0 |
| 20 to 34 years | 90 (100.0%) | 183.0 |
| 35 to 50 years | 0 (0.0%) | 0.0 |
| Total | 90 (100.0%) | 83.0 |
Fertility by Age by Marriage Status in Lonsdale
93.3% of women with births (90) in Lonsdale are married. The highest percentage of unmarried women with births falls into 20 to 34 years age bracket with 6.7% of them unmarried at the time of birth, while the lowest percentage of unmarried women with births belong to 20 to 34 years age bracket with 6.7% of them unmarried.
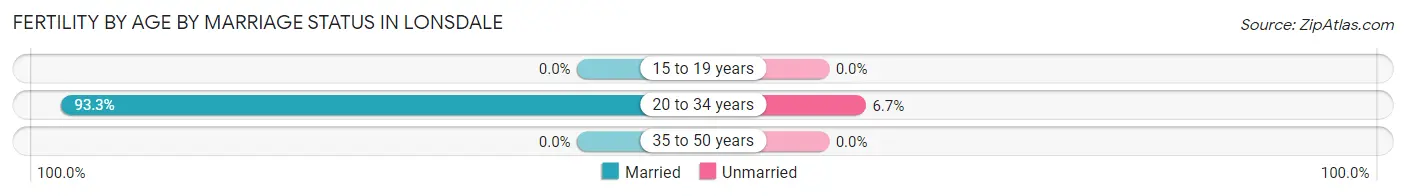
| Age Bracket | Married | Unmarried |
| 15 to 19 years | 0 (0.0%) | 0 (0.0%) |
| 20 to 34 years | 84 (93.3%) | 6 (6.7%) |
| 35 to 50 years | 0 (0.0%) | 0 (0.0%) |
| Total | 84 (93.3%) | 6 (6.7%) |
Fertility by Education in Lonsdale
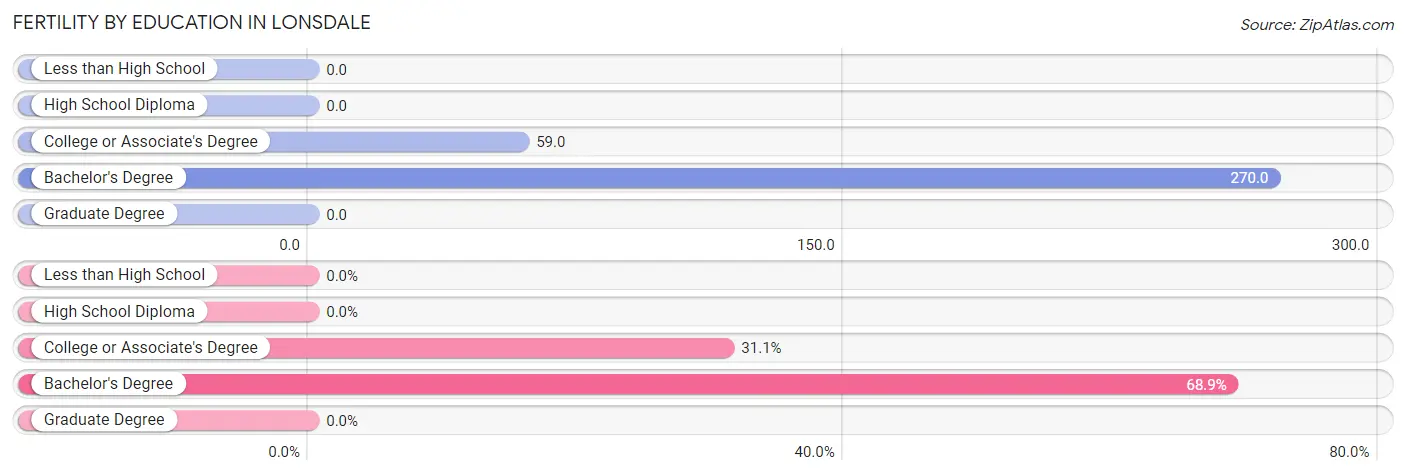
| Educational Attainment | Women with Births | Births / 1,000 Women |
| Less than High School | 0 (0.0%) | 0.0 |
| High School Diploma | 0 (0.0%) | 0.0 |
| College or Associate's Degree | 28 (31.1%) | 59.0 |
| Bachelor's Degree | 62 (68.9%) | 270.0 |
| Graduate Degree | 0 (0.0%) | 0.0 |
| Total | 90 (100.0%) | 83.0 |
Fertility by Education by Marriage Status in Lonsdale
6.7% of women with births in Lonsdale are unmarried. Women with the educational attainment of college or associate's degree are most likely to be married with 100.0% of them married at childbirth, while women with the educational attainment of bachelor's degree are least likely to be married with 9.7% of them unmarried at childbirth.
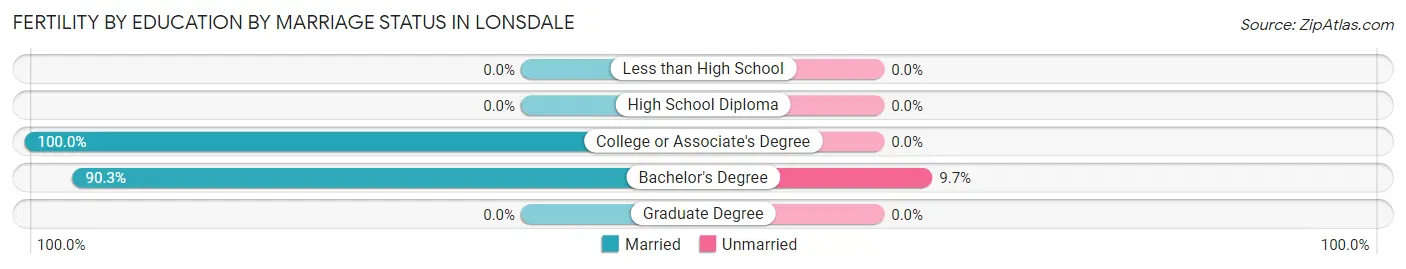
| Educational Attainment | Married | Unmarried |
| Less than High School | 0 (0.0%) | 0 (0.0%) |
| High School Diploma | 0 (0.0%) | 0 (0.0%) |
| College or Associate's Degree | 28 (100.0%) | 0 (0.0%) |
| Bachelor's Degree | 56 (90.3%) | 6 (9.7%) |
| Graduate Degree | 0 (0.0%) | 0 (0.0%) |
| Total | 84 (93.3%) | 6 (6.7%) |
Employment Characteristics in Lonsdale
Employment by Class of Employer in Lonsdale
Among the 2,328 employed individuals in Lonsdale, private company employees (1,977 | 84.9%), not-for-profit organizations (97 | 4.2%), and local government employees (84 | 3.6%) make up the most common classes of employment.
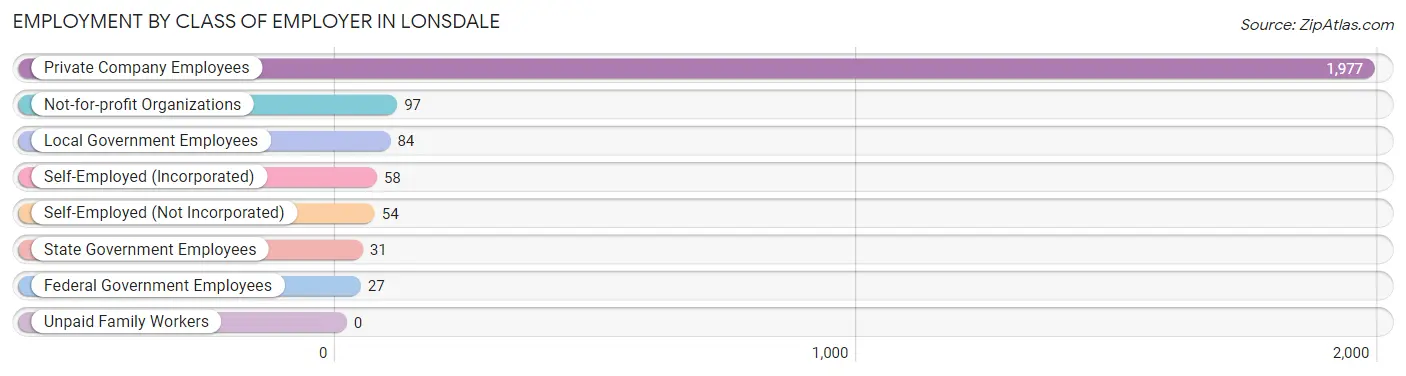
| Employer Class | # Employees | % Employees |
| Private Company Employees | 1,977 | 84.9% |
| Self-Employed (Incorporated) | 58 | 2.5% |
| Self-Employed (Not Incorporated) | 54 | 2.3% |
| Not-for-profit Organizations | 97 | 4.2% |
| Local Government Employees | 84 | 3.6% |
| State Government Employees | 31 | 1.3% |
| Federal Government Employees | 27 | 1.2% |
| Unpaid Family Workers | 0 | 0.0% |
| Total | 2,328 | 100.0% |
Employment Status by Age in Lonsdale
According to the labor force statistics for Lonsdale, out of the total population over 16 years of age (3,211), 73.6% or 2,363 individuals are in the labor force, with 0.9% or 21 of them unemployed. The age group with the highest labor force participation rate is 55 to 59 years, with 95.3% or 163 individuals in the labor force. Within the labor force, the 60 to 64 years age range has the highest percentage of unemployed individuals, with 7.3% or 8 of them being unemployed.
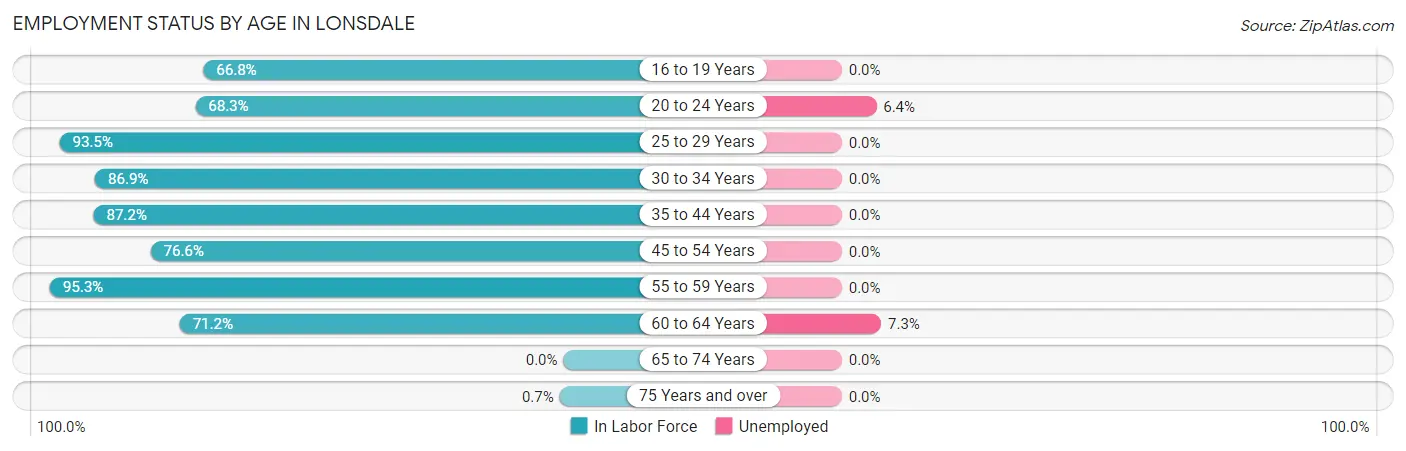
| Age Bracket | In Labor Force | Unemployed |
| 16 to 19 Years | 175 (66.8%) | 0 (0.0%) |
| 20 to 24 Years | 218 (68.3%) | 14 (6.4%) |
| 25 to 29 Years | 229 (93.5%) | 0 (0.0%) |
| 30 to 34 Years | 425 (86.9%) | 0 (0.0%) |
| 35 to 44 Years | 734 (87.2%) | 0 (0.0%) |
| 45 to 54 Years | 308 (76.6%) | 0 (0.0%) |
| 55 to 59 Years | 163 (95.3%) | 0 (0.0%) |
| 60 to 64 Years | 109 (71.2%) | 8 (7.3%) |
| 65 to 74 Years | 0 (0.0%) | 0 (0.0%) |
| 75 Years and over | 1 (0.7%) | 0 (0.0%) |
| Total | 2,363 (73.6%) | 21 (0.9%) |
Employment Status by Educational Attainment in Lonsdale
According to labor force statistics for Lonsdale, 85.5% of individuals (1,968) out of the total population between 25 and 64 years of age (2,302) are in the labor force, with 0.4% or 8 of them being unemployed. The group with the highest labor force participation rate are those with the educational attainment of bachelor's degree or higher, with 100.0% or 560 individuals in the labor force. Within the labor force, individuals with high school diploma education have the highest percentage of unemployment, with 1.7% or 8 of them being unemployed.
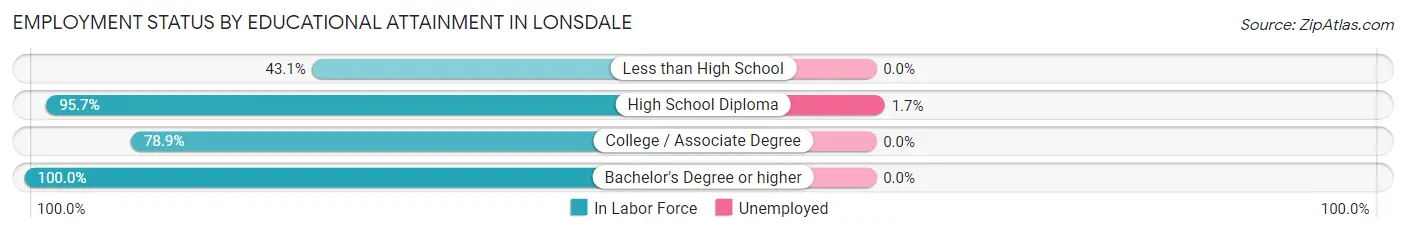
| Educational Attainment | In Labor Force | Unemployed |
| Less than High School | 59 (43.1%) | 0 (0.0%) |
| High School Diploma | 471 (95.7%) | 8 (1.7%) |
| College / Associate Degree | 878 (78.9%) | 0 (0.0%) |
| Bachelor's Degree or higher | 560 (100.0%) | 0 (0.0%) |
| Total | 1,968 (85.5%) | 9 (0.4%) |
Employment Occupations by Sex in Lonsdale
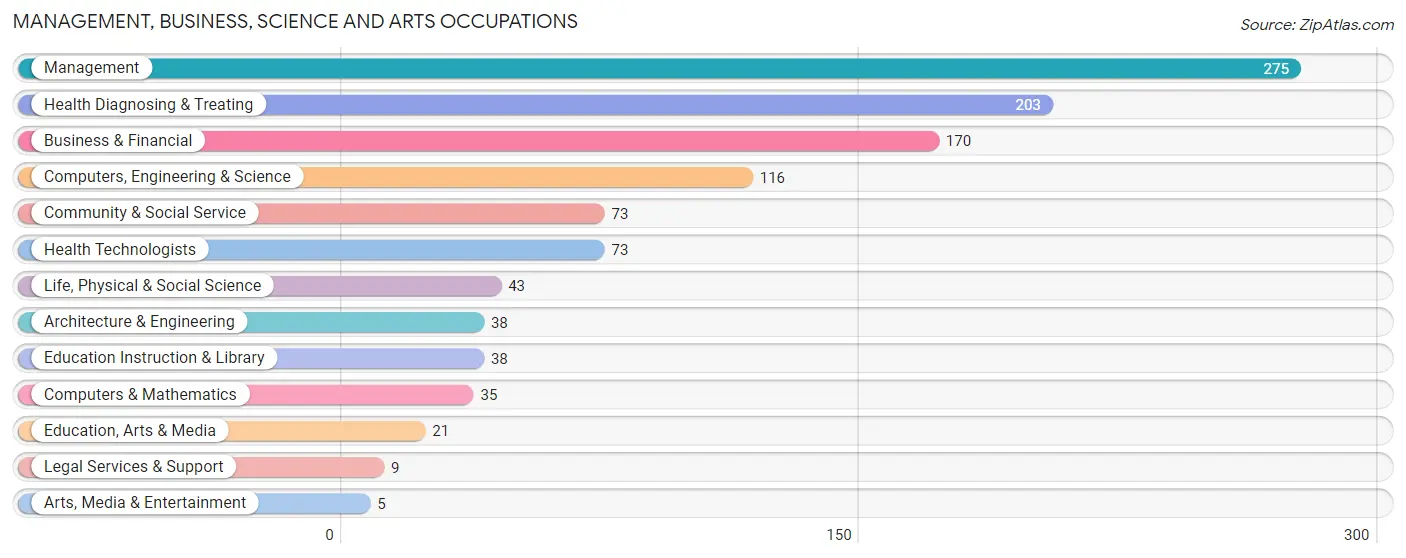
Management, Business, Science and Arts Occupations
The most common Management, Business, Science and Arts occupations in Lonsdale are Management (275 | 11.7%), Health Diagnosing & Treating (203 | 8.7%), Business & Financial (170 | 7.3%), Computers, Engineering & Science (116 | 5.0%), and Community & Social Service (73 | 3.1%).
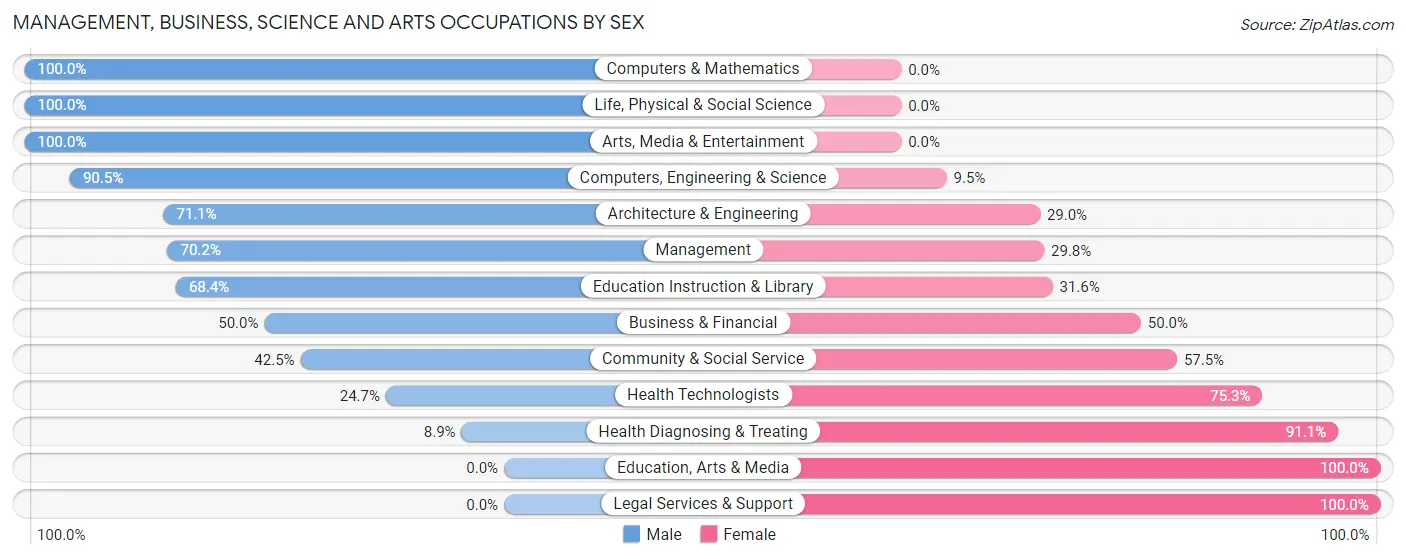
Management, Business, Science and Arts Occupations by Sex
Within the Management, Business, Science and Arts occupations in Lonsdale, the most male-oriented occupations are Computers & Mathematics (100.0%), Life, Physical & Social Science (100.0%), and Arts, Media & Entertainment (100.0%), while the most female-oriented occupations are Education, Arts & Media (100.0%), Legal Services & Support (100.0%), and Health Diagnosing & Treating (91.1%).
| Occupation | Male | Female |
| Management | 193 (70.2%) | 82 (29.8%) |
| Business & Financial | 85 (50.0%) | 85 (50.0%) |
| Computers, Engineering & Science | 105 (90.5%) | 11 (9.5%) |
| Computers & Mathematics | 35 (100.0%) | 0 (0.0%) |
| Architecture & Engineering | 27 (71.1%) | 11 (28.9%) |
| Life, Physical & Social Science | 43 (100.0%) | 0 (0.0%) |
| Community & Social Service | 31 (42.5%) | 42 (57.5%) |
| Education, Arts & Media | 0 (0.0%) | 21 (100.0%) |
| Legal Services & Support | 0 (0.0%) | 9 (100.0%) |
| Education Instruction & Library | 26 (68.4%) | 12 (31.6%) |
| Arts, Media & Entertainment | 5 (100.0%) | 0 (0.0%) |
| Health Diagnosing & Treating | 18 (8.9%) | 185 (91.1%) |
| Health Technologists | 18 (24.7%) | 55 (75.3%) |
| Total (Category) | 432 (51.6%) | 405 (48.4%) |
| Total (Overall) | 1,321 (56.5%) | 1,019 (43.5%) |
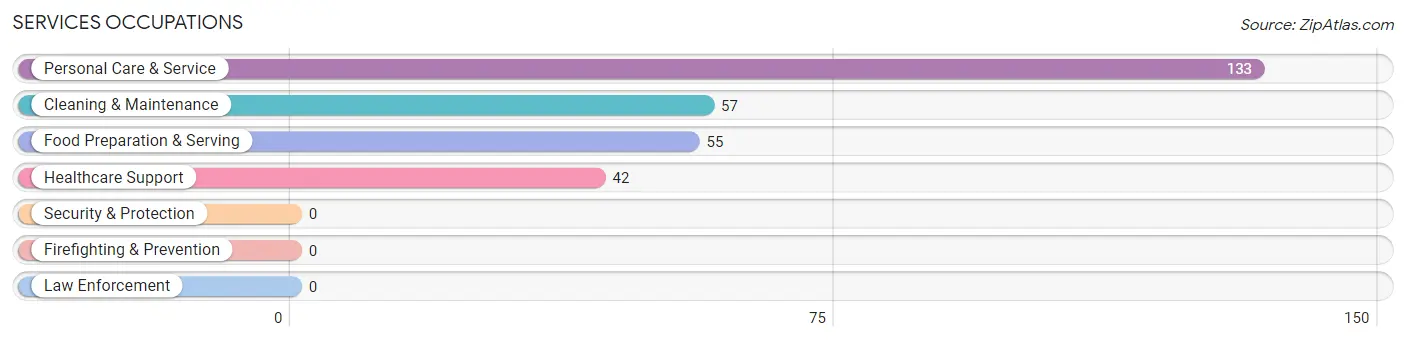
Services Occupations
The most common Services occupations in Lonsdale are Personal Care & Service (133 | 5.7%), Cleaning & Maintenance (57 | 2.4%), Food Preparation & Serving (55 | 2.4%), and Healthcare Support (42 | 1.8%).
Services Occupations by Sex
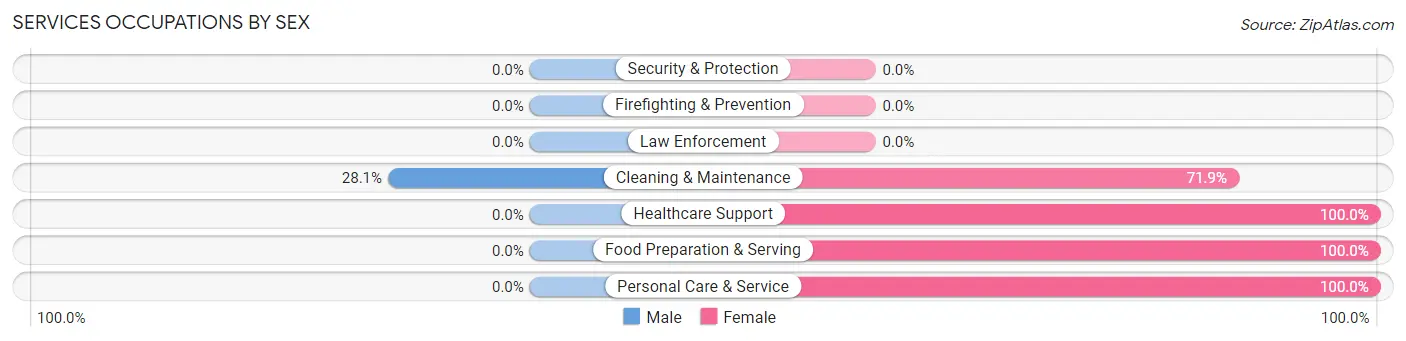
| Occupation | Male | Female |
| Healthcare Support | 0 (0.0%) | 42 (100.0%) |
| Security & Protection | 0 (0.0%) | 0 (0.0%) |
| Firefighting & Prevention | 0 (0.0%) | 0 (0.0%) |
| Law Enforcement | 0 (0.0%) | 0 (0.0%) |
| Food Preparation & Serving | 0 (0.0%) | 55 (100.0%) |
| Cleaning & Maintenance | 16 (28.1%) | 41 (71.9%) |
| Personal Care & Service | 0 (0.0%) | 133 (100.0%) |
| Total (Category) | 16 (5.6%) | 271 (94.4%) |
| Total (Overall) | 1,321 (56.5%) | 1,019 (43.5%) |
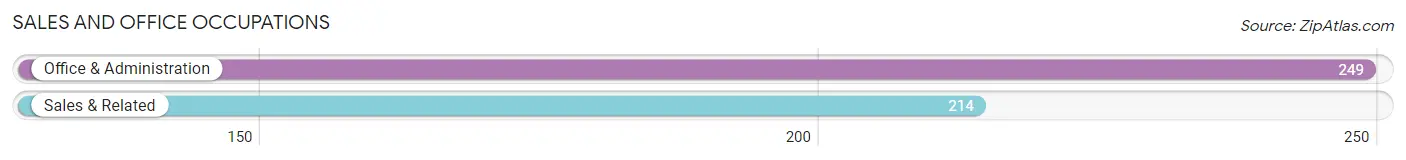
Sales and Office Occupations
The most common Sales and Office occupations in Lonsdale are Office & Administration (249 | 10.6%), and Sales & Related (214 | 9.1%).
Sales and Office Occupations by Sex
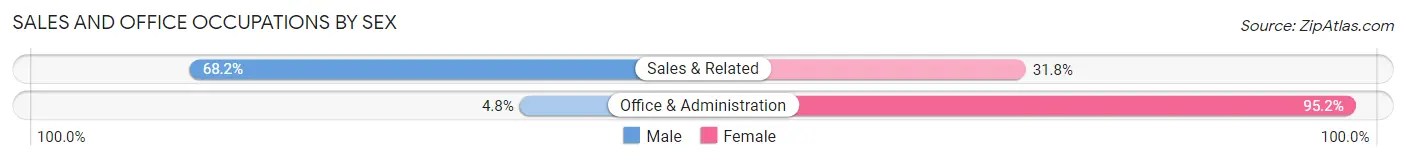
| Occupation | Male | Female |
| Sales & Related | 146 (68.2%) | 68 (31.8%) |
| Office & Administration | 12 (4.8%) | 237 (95.2%) |
| Total (Category) | 158 (34.1%) | 305 (65.9%) |
| Total (Overall) | 1,321 (56.5%) | 1,019 (43.5%) |
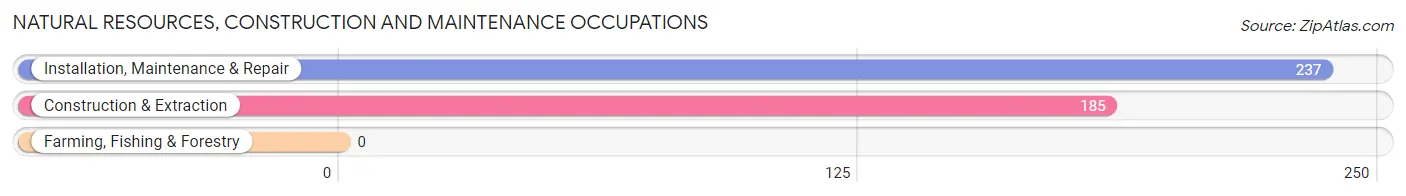
Natural Resources, Construction and Maintenance Occupations
The most common Natural Resources, Construction and Maintenance occupations in Lonsdale are Installation, Maintenance & Repair (237 | 10.1%), and Construction & Extraction (185 | 7.9%).
Natural Resources, Construction and Maintenance Occupations by Sex
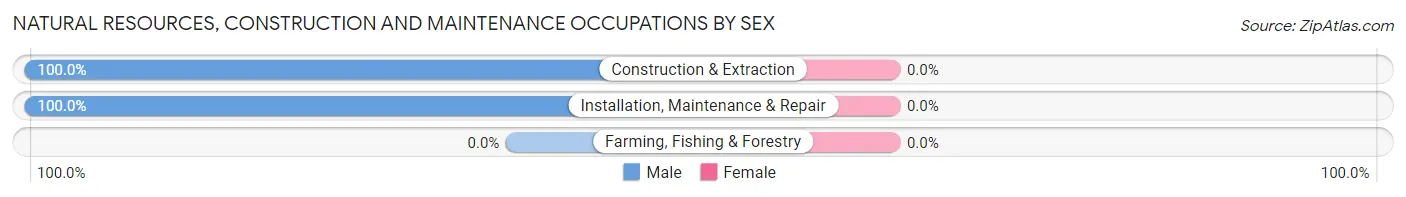
| Occupation | Male | Female |
| Farming, Fishing & Forestry | 0 (0.0%) | 0 (0.0%) |
| Construction & Extraction | 185 (100.0%) | 0 (0.0%) |
| Installation, Maintenance & Repair | 237 (100.0%) | 0 (0.0%) |
| Total (Category) | 422 (100.0%) | 0 (0.0%) |
| Total (Overall) | 1,321 (56.5%) | 1,019 (43.5%) |
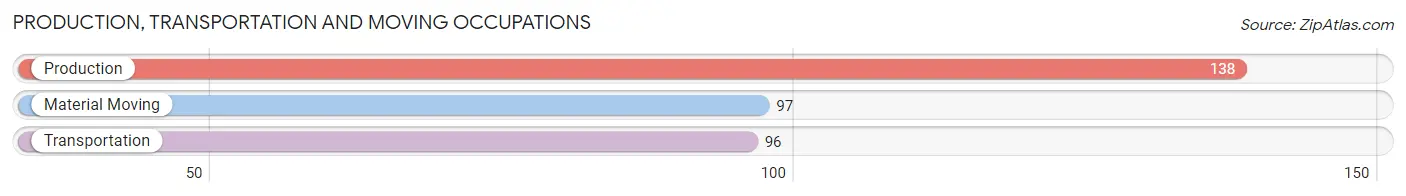
Production, Transportation and Moving Occupations
The most common Production, Transportation and Moving occupations in Lonsdale are Production (138 | 5.9%), Material Moving (97 | 4.2%), and Transportation (96 | 4.1%).
Production, Transportation and Moving Occupations by Sex
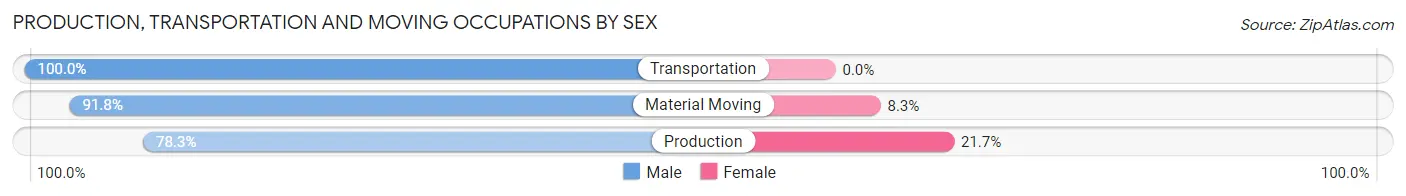
| Occupation | Male | Female |
| Production | 108 (78.3%) | 30 (21.7%) |
| Transportation | 96 (100.0%) | 0 (0.0%) |
| Material Moving | 89 (91.7%) | 8 (8.3%) |
| Total (Category) | 293 (88.5%) | 38 (11.5%) |
| Total (Overall) | 1,321 (56.5%) | 1,019 (43.5%) |
Employment Industries by Sex in Lonsdale
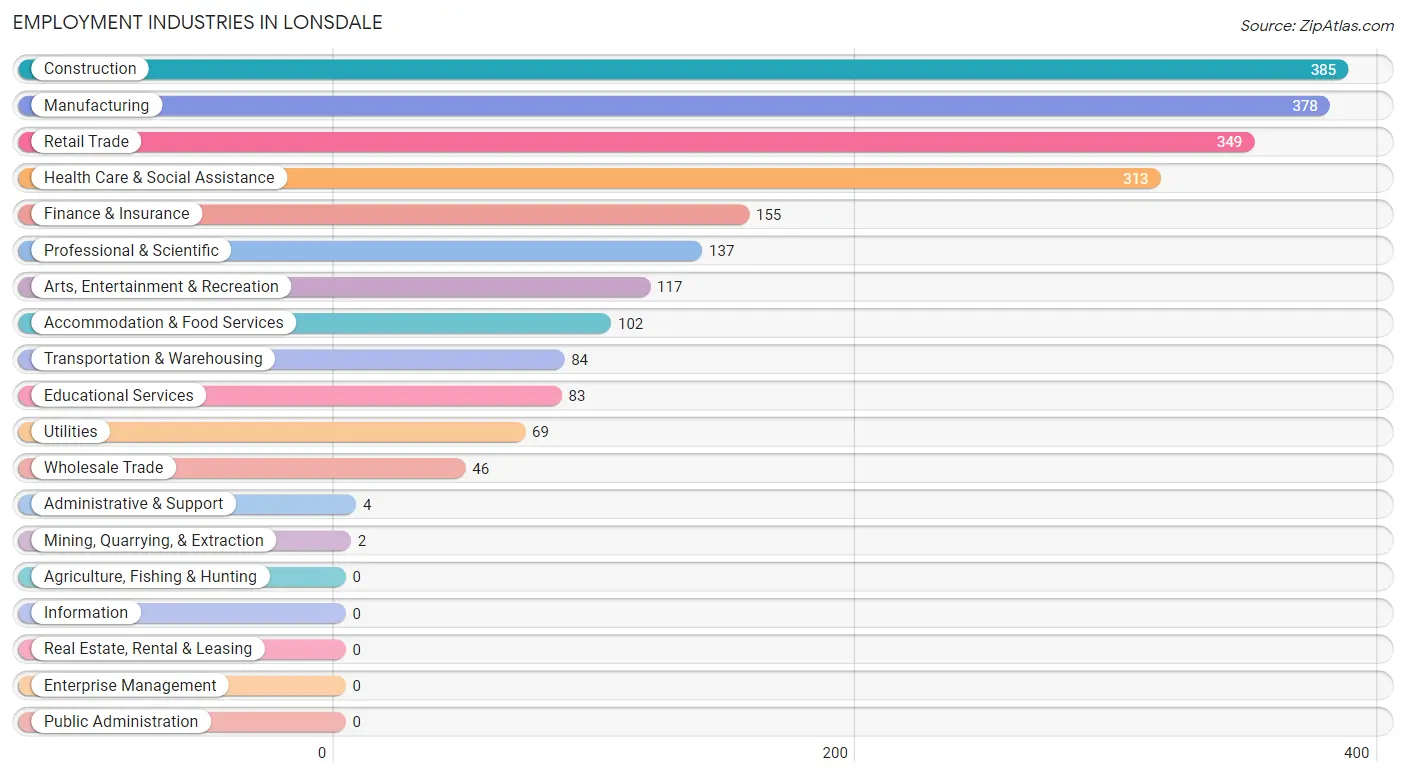
Employment Industries in Lonsdale
The major employment industries in Lonsdale include Construction (385 | 16.5%), Manufacturing (378 | 16.2%), Retail Trade (349 | 14.9%), Health Care & Social Assistance (313 | 13.4%), and Finance & Insurance (155 | 6.6%).
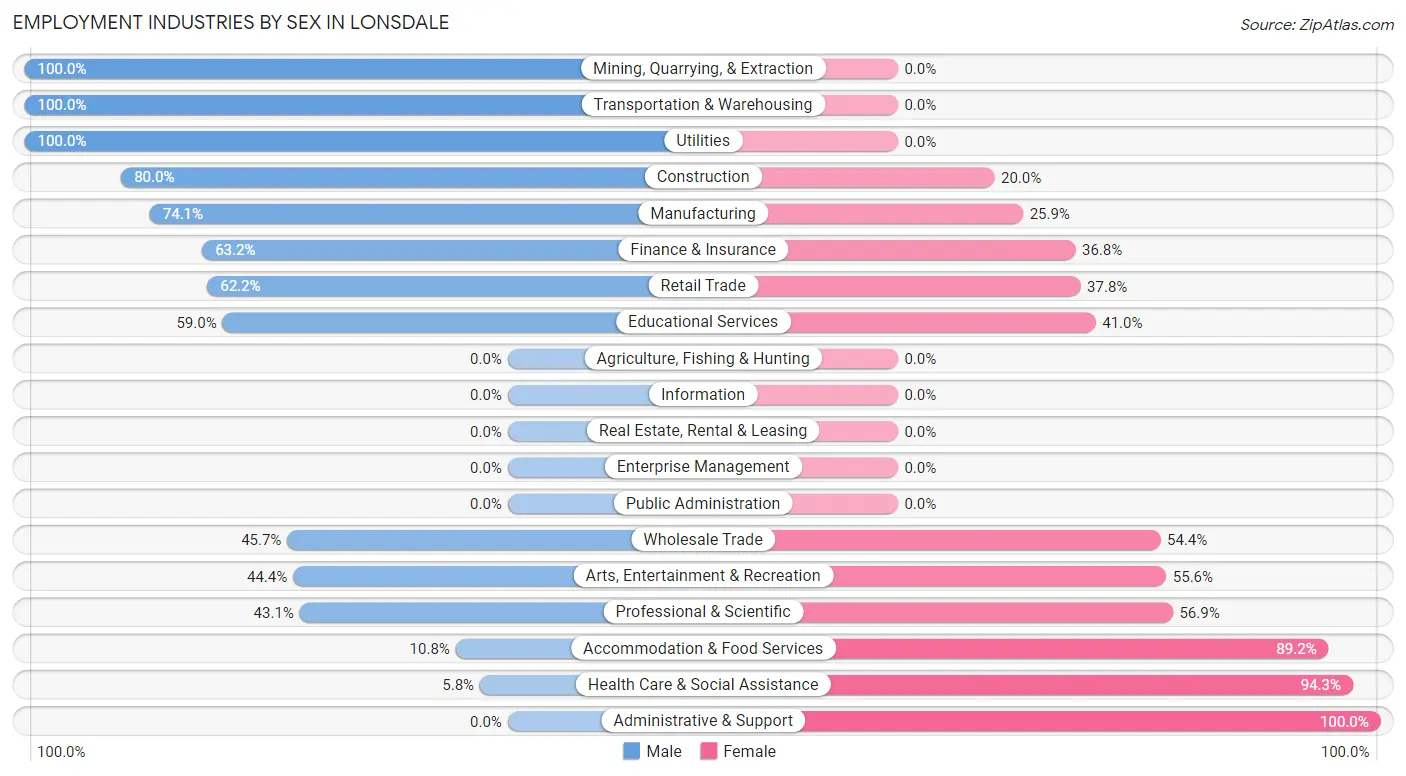
Employment Industries by Sex in Lonsdale
The Lonsdale industries that see more men than women are Mining, Quarrying, & Extraction (100.0%), Transportation & Warehousing (100.0%), and Utilities (100.0%), whereas the industries that tend to have a higher number of women are Administrative & Support (100.0%), Health Care & Social Assistance (94.3%), and Accommodation & Food Services (89.2%).
| Industry | Male | Female |
| Agriculture, Fishing & Hunting | 0 (0.0%) | 0 (0.0%) |
| Mining, Quarrying, & Extraction | 2 (100.0%) | 0 (0.0%) |
| Construction | 308 (80.0%) | 77 (20.0%) |
| Manufacturing | 280 (74.1%) | 98 (25.9%) |
| Wholesale Trade | 21 (45.7%) | 25 (54.3%) |
| Retail Trade | 217 (62.2%) | 132 (37.8%) |
| Transportation & Warehousing | 84 (100.0%) | 0 (0.0%) |
| Utilities | 69 (100.0%) | 0 (0.0%) |
| Information | 0 (0.0%) | 0 (0.0%) |
| Finance & Insurance | 98 (63.2%) | 57 (36.8%) |
| Real Estate, Rental & Leasing | 0 (0.0%) | 0 (0.0%) |
| Professional & Scientific | 59 (43.1%) | 78 (56.9%) |
| Enterprise Management | 0 (0.0%) | 0 (0.0%) |
| Administrative & Support | 0 (0.0%) | 4 (100.0%) |
| Educational Services | 49 (59.0%) | 34 (41.0%) |
| Health Care & Social Assistance | 18 (5.8%) | 295 (94.3%) |
| Arts, Entertainment & Recreation | 52 (44.4%) | 65 (55.6%) |
| Accommodation & Food Services | 11 (10.8%) | 91 (89.2%) |
| Public Administration | 0 (0.0%) | 0 (0.0%) |
| Total | 1,321 (56.5%) | 1,019 (43.5%) |
Education in Lonsdale
School Enrollment in Lonsdale
The most common levels of schooling among the 1,623 students in Lonsdale are middle school (449 | 27.7%), high school (356 | 21.9%), and elementary school (314 | 19.4%).
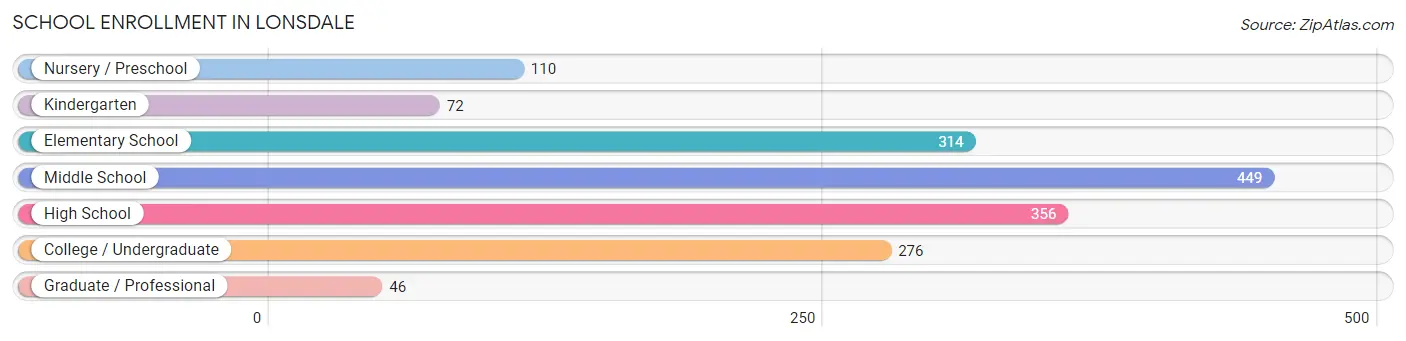
| School Level | # Students | % Students |
| Nursery / Preschool | 110 | 6.8% |
| Kindergarten | 72 | 4.4% |
| Elementary School | 314 | 19.4% |
| Middle School | 449 | 27.7% |
| High School | 356 | 21.9% |
| College / Undergraduate | 276 | 17.0% |
| Graduate / Professional | 46 | 2.8% |
| Total | 1,623 | 100.0% |
School Enrollment by Age by Funding Source in Lonsdale
Out of a total of 1,623 students who are enrolled in schools in Lonsdale, 45 (2.8%) attend a private institution, while the remaining 1,578 (97.2%) are enrolled in public schools. The age group of 20 to 24 year olds has the highest likelihood of being enrolled in private schools, with 17 (8.3% in the age bracket) enrolled. Conversely, the age group of 3 to 4 year olds has the lowest likelihood of being enrolled in a private school, with 79 (100.0% in the age bracket) attending a public institution.
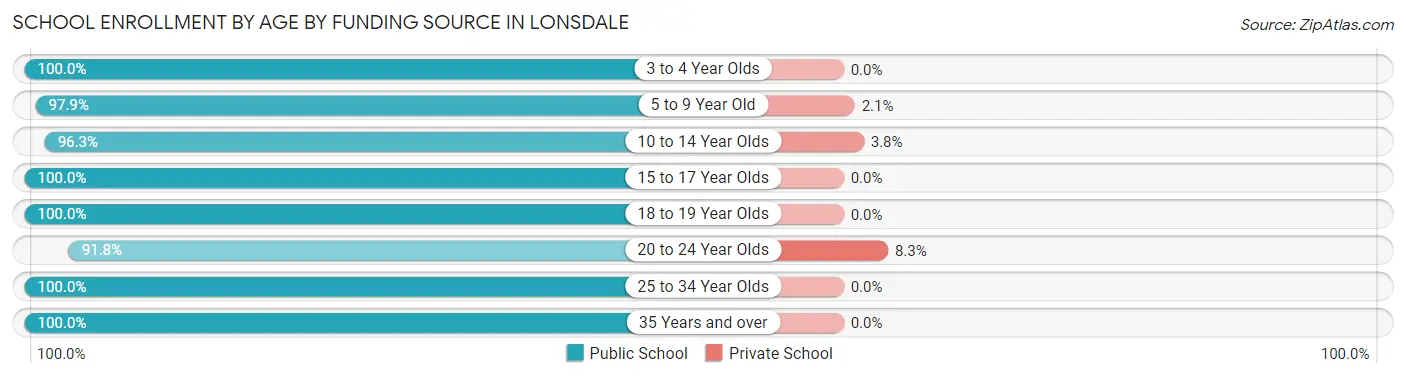
| Age Bracket | Public School | Private School |
| 3 to 4 Year Olds | 79 (100.0%) | 0 (0.0%) |
| 5 to 9 Year Old | 380 (97.9%) | 8 (2.1%) |
| 10 to 14 Year Olds | 513 (96.3%) | 20 (3.7%) |
| 15 to 17 Year Olds | 278 (100.0%) | 0 (0.0%) |
| 18 to 19 Year Olds | 44 (100.0%) | 0 (0.0%) |
| 20 to 24 Year Olds | 189 (91.7%) | 17 (8.3%) |
| 25 to 34 Year Olds | 68 (100.0%) | 0 (0.0%) |
| 35 Years and over | 27 (100.0%) | 0 (0.0%) |
| Total | 1,578 (97.2%) | 45 (2.8%) |
Educational Attainment by Field of Study in Lonsdale
Business (118 | 19.5%), education (113 | 18.6%), arts & humanities (109 | 18.0%), engineering (91 | 15.0%), and social sciences (67 | 11.1%) are the most common fields of study among 606 individuals in Lonsdale who have obtained a bachelor's degree or higher.
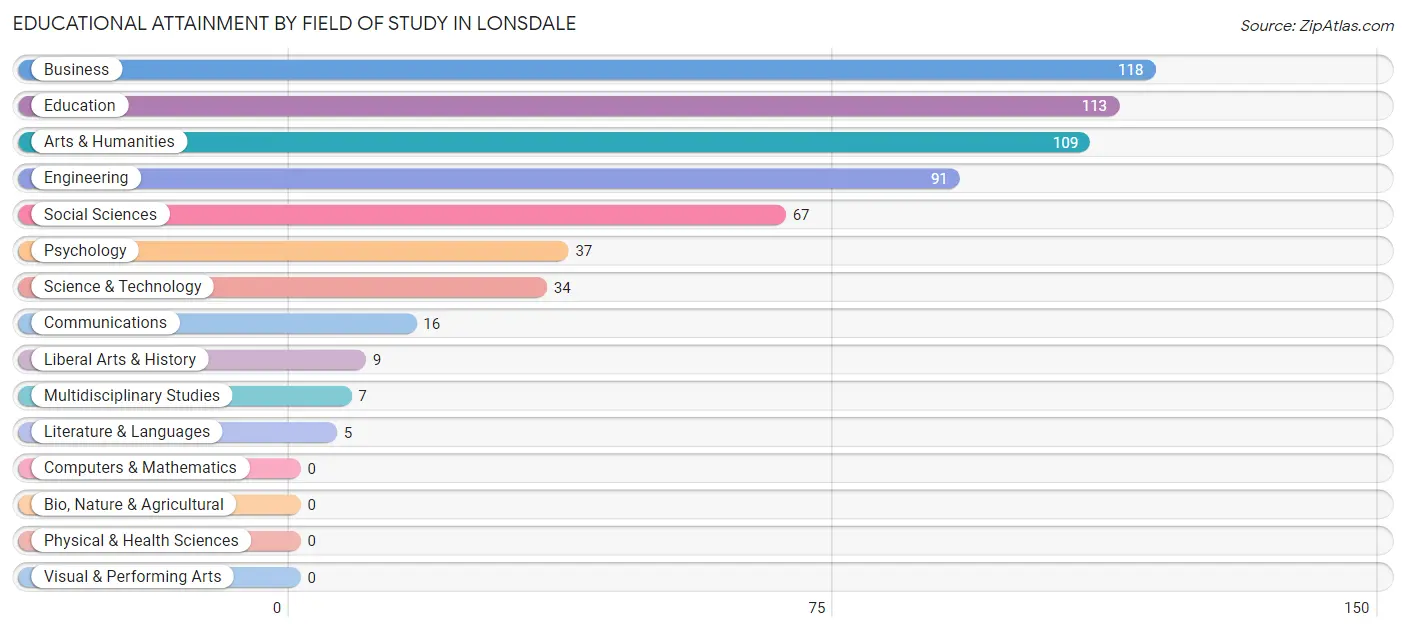
| Field of Study | # Graduates | % Graduates |
| Computers & Mathematics | 0 | 0.0% |
| Bio, Nature & Agricultural | 0 | 0.0% |
| Physical & Health Sciences | 0 | 0.0% |
| Psychology | 37 | 6.1% |
| Social Sciences | 67 | 11.1% |
| Engineering | 91 | 15.0% |
| Multidisciplinary Studies | 7 | 1.2% |
| Science & Technology | 34 | 5.6% |
| Business | 118 | 19.5% |
| Education | 113 | 18.6% |
| Literature & Languages | 5 | 0.8% |
| Liberal Arts & History | 9 | 1.5% |
| Visual & Performing Arts | 0 | 0.0% |
| Communications | 16 | 2.6% |
| Arts & Humanities | 109 | 18.0% |
| Total | 606 | 100.0% |
Transportation & Commute in Lonsdale
Vehicle Availability by Sex in Lonsdale
The most prevalent vehicle ownership categories in Lonsdale are males with 2 vehicles (622, accounting for 47.1%) and females with 2 vehicles (447, making up 62.0%).
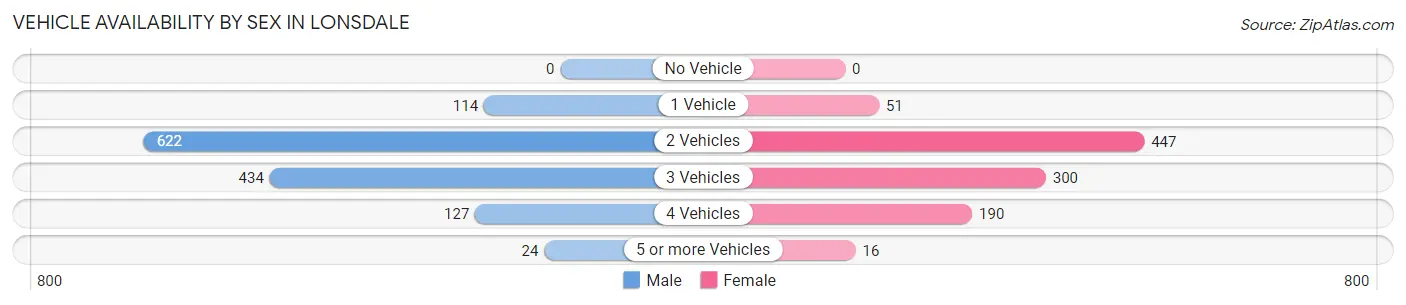
| Vehicles Available | Male | Female |
| No Vehicle | 0 (0.0%) | 0 (0.0%) |
| 1 Vehicle | 114 (8.6%) | 51 (5.1%) |
| 2 Vehicles | 622 (47.1%) | 447 (44.5%) |
| 3 Vehicles | 434 (32.9%) | 300 (29.9%) |
| 4 Vehicles | 127 (9.6%) | 190 (18.9%) |
| 5 or more Vehicles | 24 (1.8%) | 16 (1.6%) |
| Total | 1,321 (100.0%) | 1,004 (100.0%) |
Commute Time in Lonsdale
The most frequently occuring commute durations in Lonsdale are 30 to 34 minutes (443 commuters, 20.7%), 45 to 59 minutes (373 commuters, 17.5%), and 20 to 24 minutes (319 commuters, 14.9%).
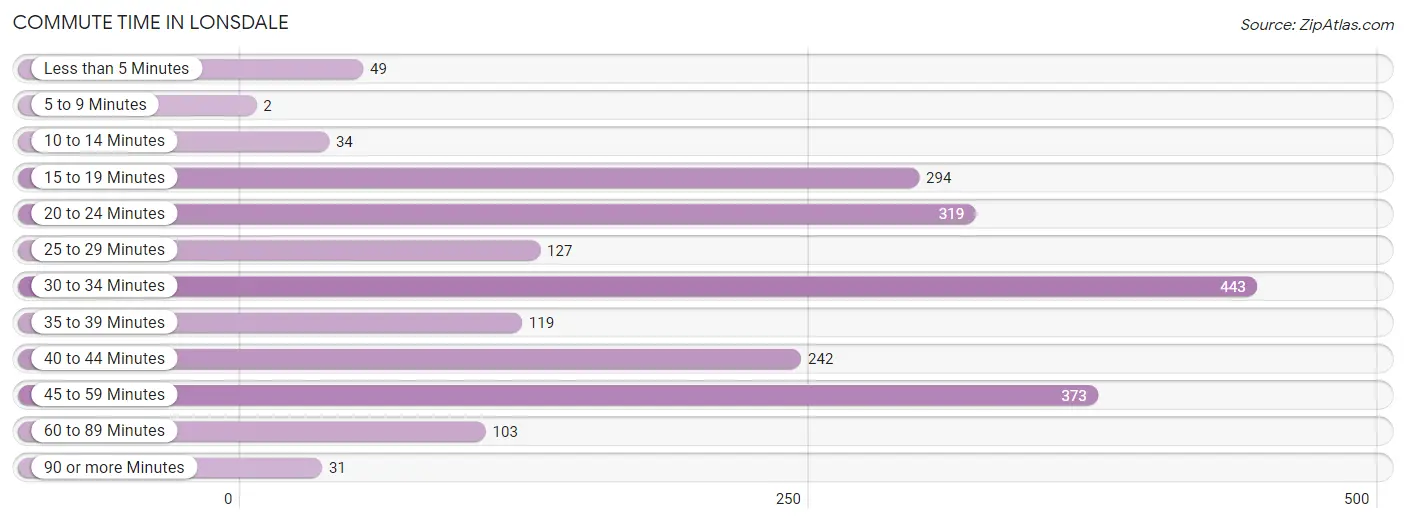
| Commute Time | # Commuters | % Commuters |
| Less than 5 Minutes | 49 | 2.3% |
| 5 to 9 Minutes | 2 | 0.1% |
| 10 to 14 Minutes | 34 | 1.6% |
| 15 to 19 Minutes | 294 | 13.8% |
| 20 to 24 Minutes | 319 | 14.9% |
| 25 to 29 Minutes | 127 | 5.9% |
| 30 to 34 Minutes | 443 | 20.7% |
| 35 to 39 Minutes | 119 | 5.6% |
| 40 to 44 Minutes | 242 | 11.3% |
| 45 to 59 Minutes | 373 | 17.5% |
| 60 to 89 Minutes | 103 | 4.8% |
| 90 or more Minutes | 31 | 1.5% |
Commute Time by Sex in Lonsdale
The most common commute times in Lonsdale are 45 to 59 minutes (221 commuters, 18.6%) for males and 30 to 34 minutes (232 commuters, 24.5%) for females.
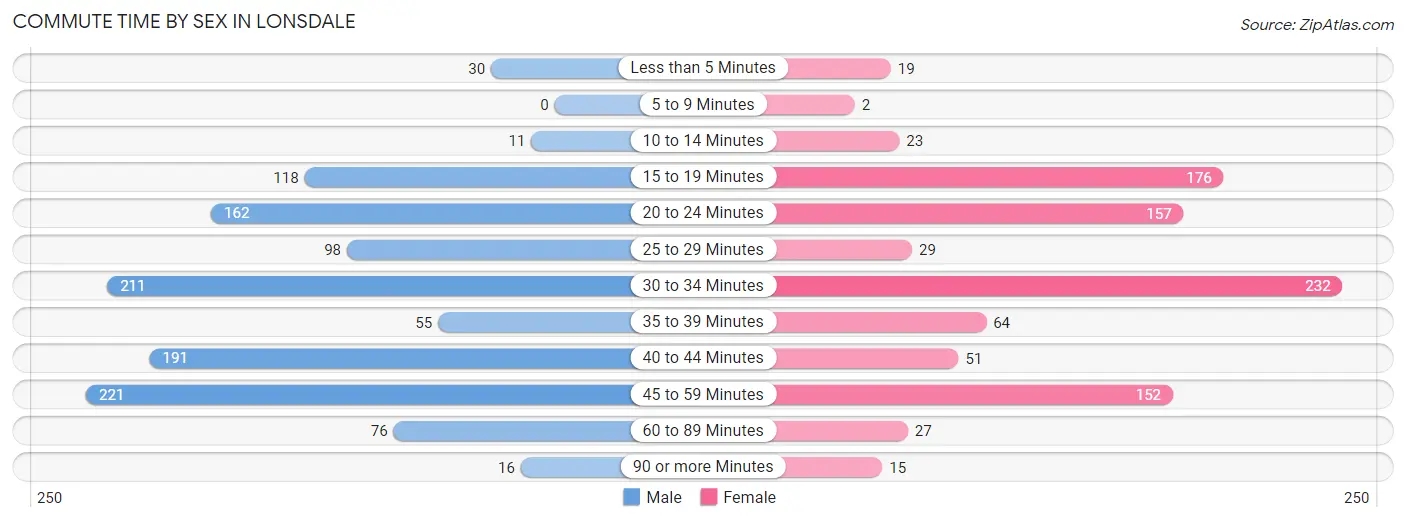
| Commute Time | Male | Female |
| Less than 5 Minutes | 30 (2.5%) | 19 (2.0%) |
| 5 to 9 Minutes | 0 (0.0%) | 2 (0.2%) |
| 10 to 14 Minutes | 11 (0.9%) | 23 (2.4%) |
| 15 to 19 Minutes | 118 (9.9%) | 176 (18.6%) |
| 20 to 24 Minutes | 162 (13.6%) | 157 (16.6%) |
| 25 to 29 Minutes | 98 (8.2%) | 29 (3.1%) |
| 30 to 34 Minutes | 211 (17.7%) | 232 (24.5%) |
| 35 to 39 Minutes | 55 (4.6%) | 64 (6.8%) |
| 40 to 44 Minutes | 191 (16.1%) | 51 (5.4%) |
| 45 to 59 Minutes | 221 (18.6%) | 152 (16.1%) |
| 60 to 89 Minutes | 76 (6.4%) | 27 (2.9%) |
| 90 or more Minutes | 16 (1.3%) | 15 (1.6%) |
Time of Departure to Work by Sex in Lonsdale
The most frequent times of departure to work in Lonsdale are 5:00 AM to 5:29 AM (287, 24.1%) for males and 7:00 AM to 7:29 AM (209, 22.1%) for females.
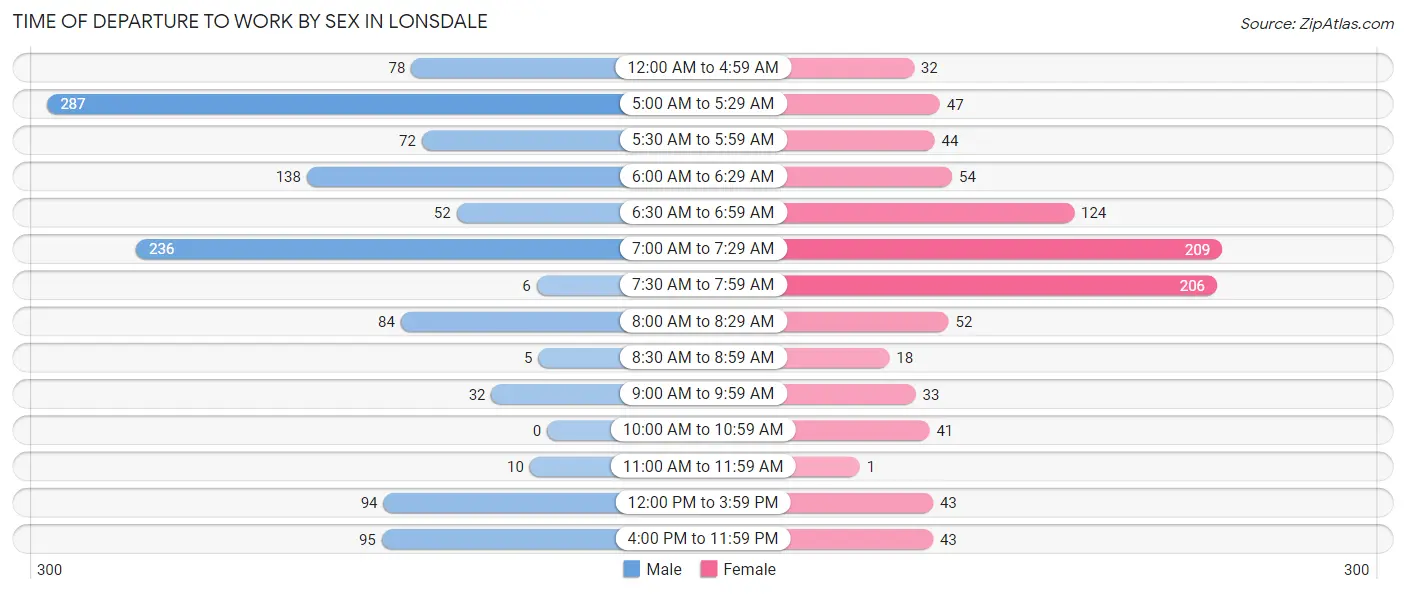
| Time of Departure | Male | Female |
| 12:00 AM to 4:59 AM | 78 (6.6%) | 32 (3.4%) |
| 5:00 AM to 5:29 AM | 287 (24.1%) | 47 (5.0%) |
| 5:30 AM to 5:59 AM | 72 (6.1%) | 44 (4.6%) |
| 6:00 AM to 6:29 AM | 138 (11.6%) | 54 (5.7%) |
| 6:30 AM to 6:59 AM | 52 (4.4%) | 124 (13.1%) |
| 7:00 AM to 7:29 AM | 236 (19.9%) | 209 (22.1%) |
| 7:30 AM to 7:59 AM | 6 (0.5%) | 206 (21.7%) |
| 8:00 AM to 8:29 AM | 84 (7.1%) | 52 (5.5%) |
| 8:30 AM to 8:59 AM | 5 (0.4%) | 18 (1.9%) |
| 9:00 AM to 9:59 AM | 32 (2.7%) | 33 (3.5%) |
| 10:00 AM to 10:59 AM | 0 (0.0%) | 41 (4.3%) |
| 11:00 AM to 11:59 AM | 10 (0.8%) | 1 (0.1%) |
| 12:00 PM to 3:59 PM | 94 (7.9%) | 43 (4.5%) |
| 4:00 PM to 11:59 PM | 95 (8.0%) | 43 (4.5%) |
| Total | 1,189 (100.0%) | 947 (100.0%) |
Housing Occupancy in Lonsdale
Occupancy by Ownership in Lonsdale
Of the total 1,529 dwellings in Lonsdale, owner-occupied units account for 1,337 (87.4%), while renter-occupied units make up 192 (12.6%).
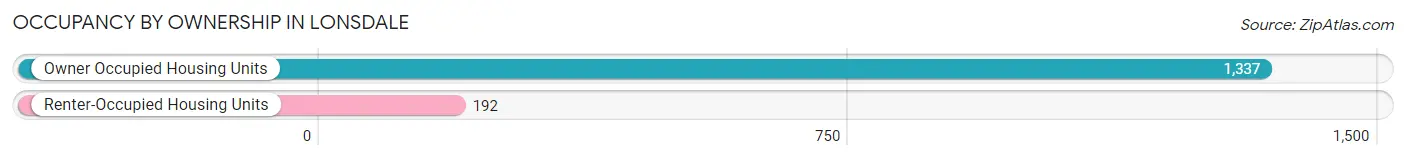
| Occupancy | # Housing Units | % Housing Units |
| Owner Occupied Housing Units | 1,337 | 87.4% |
| Renter-Occupied Housing Units | 192 | 12.6% |
| Total Occupied Housing Units | 1,529 | 100.0% |
Occupancy by Household Size in Lonsdale
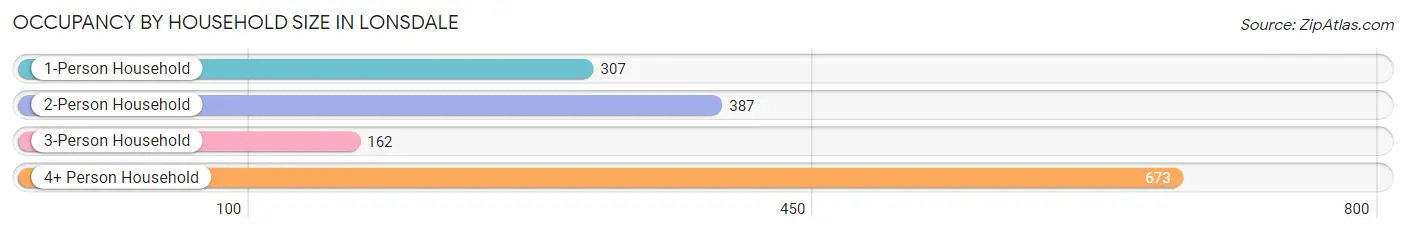
| Household Size | # Housing Units | % Housing Units |
| 1-Person Household | 307 | 20.1% |
| 2-Person Household | 387 | 25.3% |
| 3-Person Household | 162 | 10.6% |
| 4+ Person Household | 673 | 44.0% |
| Total Housing Units | 1,529 | 100.0% |
Occupancy by Ownership by Household Size in Lonsdale
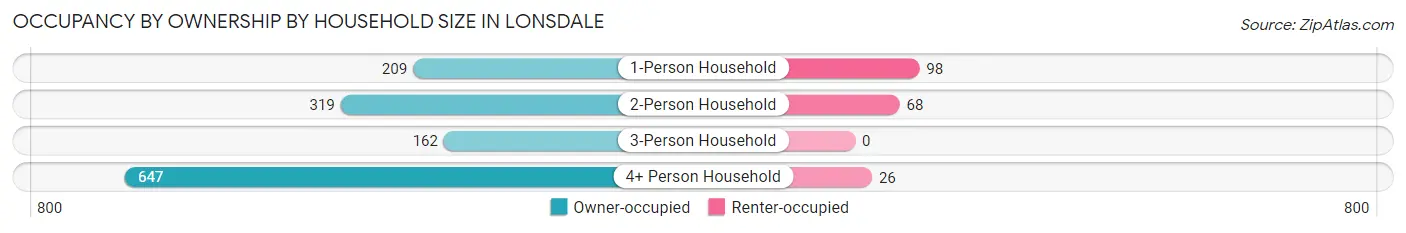
| Household Size | Owner-occupied | Renter-occupied |
| 1-Person Household | 209 (68.1%) | 98 (31.9%) |
| 2-Person Household | 319 (82.4%) | 68 (17.6%) |
| 3-Person Household | 162 (100.0%) | 0 (0.0%) |
| 4+ Person Household | 647 (96.1%) | 26 (3.9%) |
| Total Housing Units | 1,337 (87.4%) | 192 (12.6%) |
Occupancy by Educational Attainment in Lonsdale
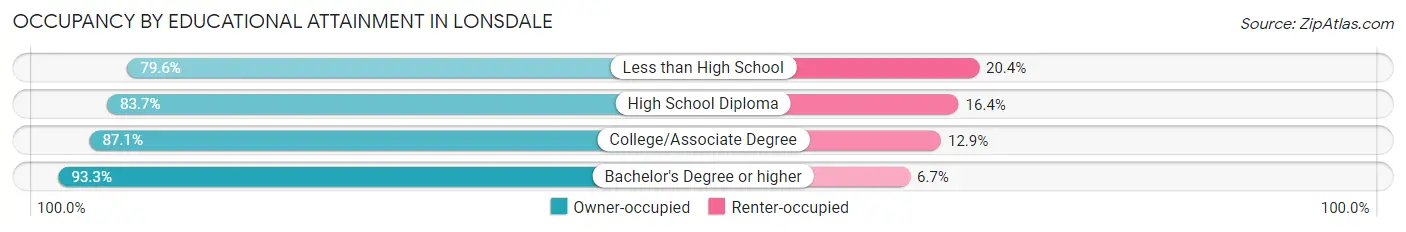
| Household Size | Owner-occupied | Renter-occupied |
| Less than High School | 82 (79.6%) | 21 (20.4%) |
| High School Diploma | 312 (83.7%) | 61 (16.4%) |
| College/Associate Degree | 555 (87.1%) | 82 (12.9%) |
| Bachelor's Degree or higher | 388 (93.3%) | 28 (6.7%) |
Occupancy by Age of Householder in Lonsdale
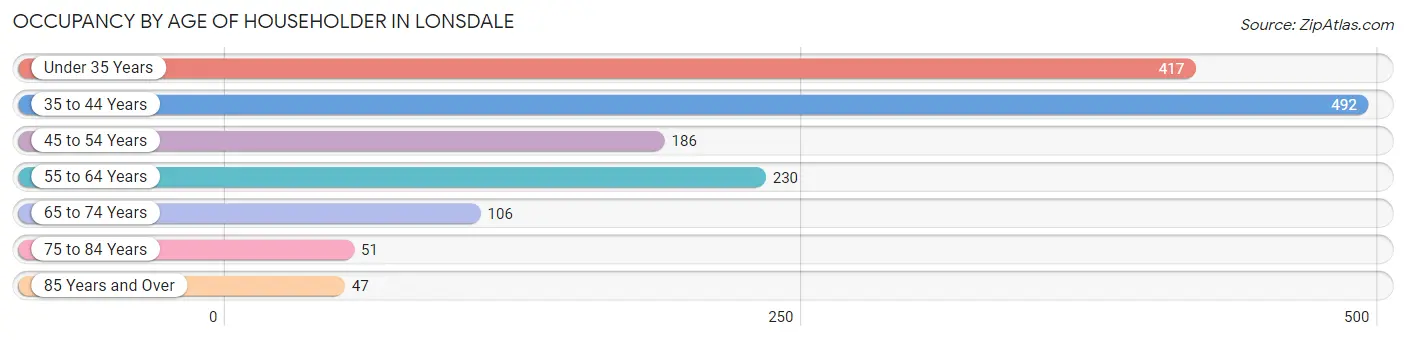
| Age Bracket | # Households | % Households |
| Under 35 Years | 417 | 27.3% |
| 35 to 44 Years | 492 | 32.2% |
| 45 to 54 Years | 186 | 12.2% |
| 55 to 64 Years | 230 | 15.0% |
| 65 to 74 Years | 106 | 6.9% |
| 75 to 84 Years | 51 | 3.3% |
| 85 Years and Over | 47 | 3.1% |
| Total | 1,529 | 100.0% |
Housing Finances in Lonsdale
Median Income by Occupancy in Lonsdale
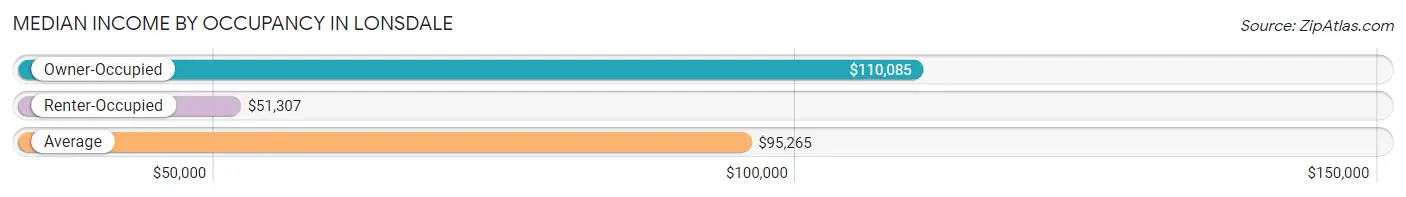
| Occupancy Type | # Households | Median Income |
| Owner-Occupied | 1,337 (87.4%) | $110,085 |
| Renter-Occupied | 192 (12.6%) | $51,307 |
| Average | 1,529 (100.0%) | $95,265 |
Occupancy by Householder Income Bracket in Lonsdale
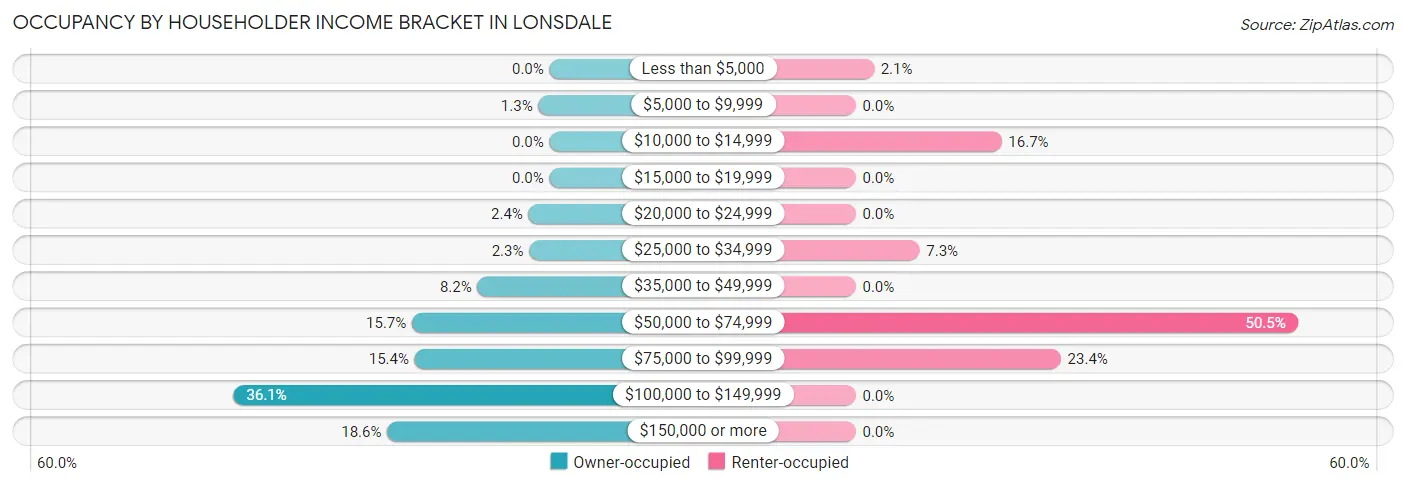
| Income Bracket | Owner-occupied | Renter-occupied |
| Less than $5,000 | 0 (0.0%) | 4 (2.1%) |
| $5,000 to $9,999 | 17 (1.3%) | 0 (0.0%) |
| $10,000 to $14,999 | 0 (0.0%) | 32 (16.7%) |
| $15,000 to $19,999 | 0 (0.0%) | 0 (0.0%) |
| $20,000 to $24,999 | 32 (2.4%) | 0 (0.0%) |
| $25,000 to $34,999 | 31 (2.3%) | 14 (7.3%) |
| $35,000 to $49,999 | 110 (8.2%) | 0 (0.0%) |
| $50,000 to $74,999 | 210 (15.7%) | 97 (50.5%) |
| $75,000 to $99,999 | 206 (15.4%) | 45 (23.4%) |
| $100,000 to $149,999 | 483 (36.1%) | 0 (0.0%) |
| $150,000 or more | 248 (18.5%) | 0 (0.0%) |
| Total | 1,337 (100.0%) | 192 (100.0%) |
Monthly Housing Cost Tiers in Lonsdale
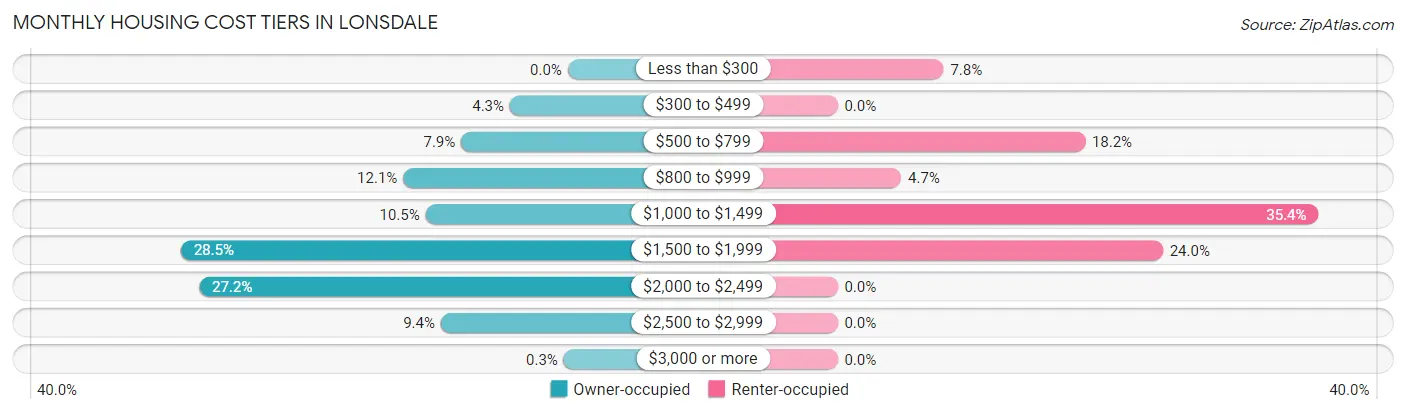
| Monthly Cost | Owner-occupied | Renter-occupied |
| Less than $300 | 0 (0.0%) | 15 (7.8%) |
| $300 to $499 | 57 (4.3%) | 0 (0.0%) |
| $500 to $799 | 105 (7.9%) | 35 (18.2%) |
| $800 to $999 | 162 (12.1%) | 9 (4.7%) |
| $1,000 to $1,499 | 140 (10.5%) | 68 (35.4%) |
| $1,500 to $1,999 | 381 (28.5%) | 46 (24.0%) |
| $2,000 to $2,499 | 363 (27.2%) | 0 (0.0%) |
| $2,500 to $2,999 | 125 (9.3%) | 0 (0.0%) |
| $3,000 or more | 4 (0.3%) | 0 (0.0%) |
| Total | 1,337 (100.0%) | 192 (100.0%) |
Physical Housing Characteristics in Lonsdale
Housing Structures in Lonsdale
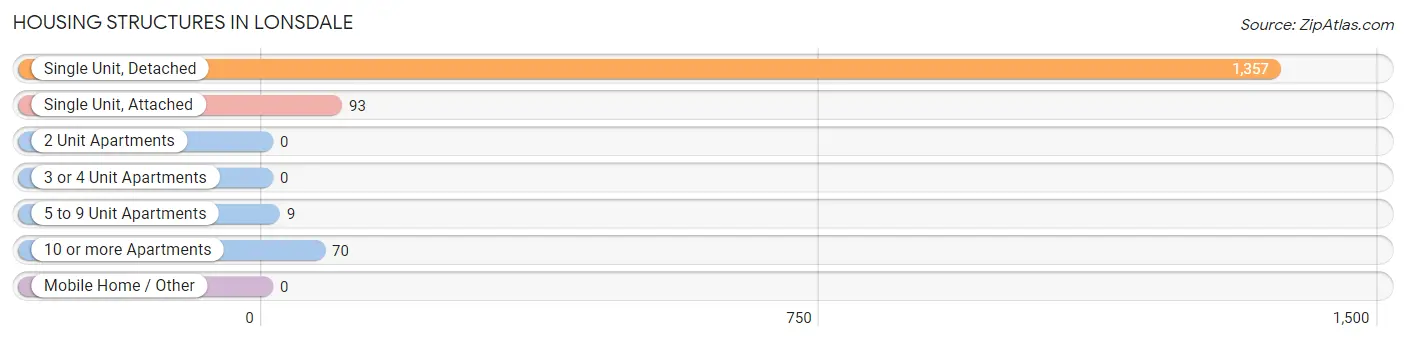
| Structure Type | # Housing Units | % Housing Units |
| Single Unit, Detached | 1,357 | 88.7% |
| Single Unit, Attached | 93 | 6.1% |
| 2 Unit Apartments | 0 | 0.0% |
| 3 or 4 Unit Apartments | 0 | 0.0% |
| 5 to 9 Unit Apartments | 9 | 0.6% |
| 10 or more Apartments | 70 | 4.6% |
| Mobile Home / Other | 0 | 0.0% |
| Total | 1,529 | 100.0% |
Housing Structures by Occupancy in Lonsdale
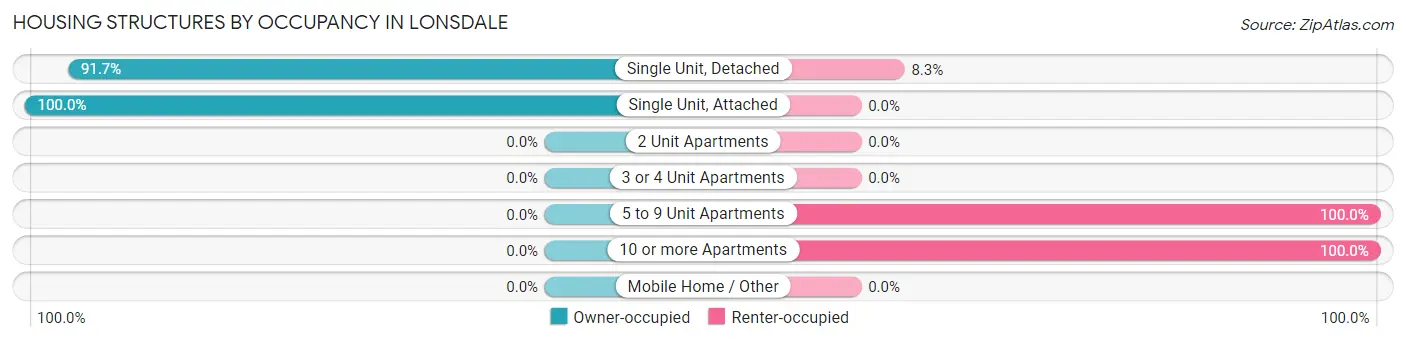
| Structure Type | Owner-occupied | Renter-occupied |
| Single Unit, Detached | 1,244 (91.7%) | 113 (8.3%) |
| Single Unit, Attached | 93 (100.0%) | 0 (0.0%) |
| 2 Unit Apartments | 0 (0.0%) | 0 (0.0%) |
| 3 or 4 Unit Apartments | 0 (0.0%) | 0 (0.0%) |
| 5 to 9 Unit Apartments | 0 (0.0%) | 9 (100.0%) |
| 10 or more Apartments | 0 (0.0%) | 70 (100.0%) |
| Mobile Home / Other | 0 (0.0%) | 0 (0.0%) |
| Total | 1,337 (87.4%) | 192 (12.6%) |
Housing Structures by Number of Rooms in Lonsdale
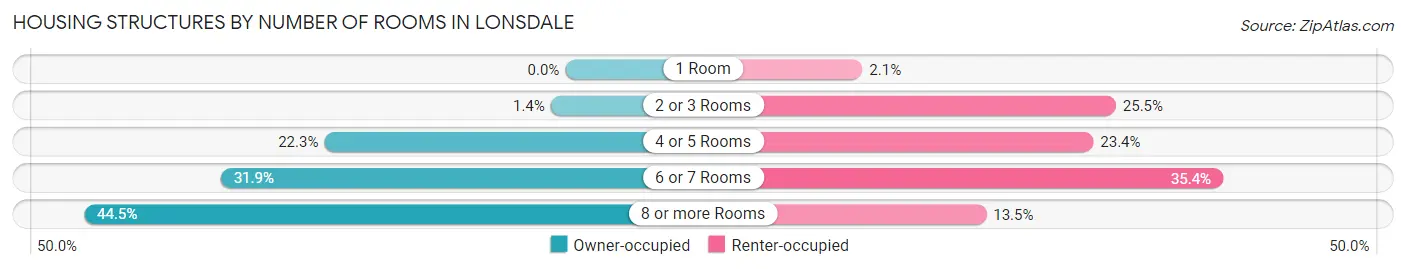
| Number of Rooms | Owner-occupied | Renter-occupied |
| 1 Room | 0 (0.0%) | 4 (2.1%) |
| 2 or 3 Rooms | 18 (1.3%) | 49 (25.5%) |
| 4 or 5 Rooms | 298 (22.3%) | 45 (23.4%) |
| 6 or 7 Rooms | 426 (31.9%) | 68 (35.4%) |
| 8 or more Rooms | 595 (44.5%) | 26 (13.5%) |
| Total | 1,337 (100.0%) | 192 (100.0%) |
Housing Structure by Heating Type in Lonsdale
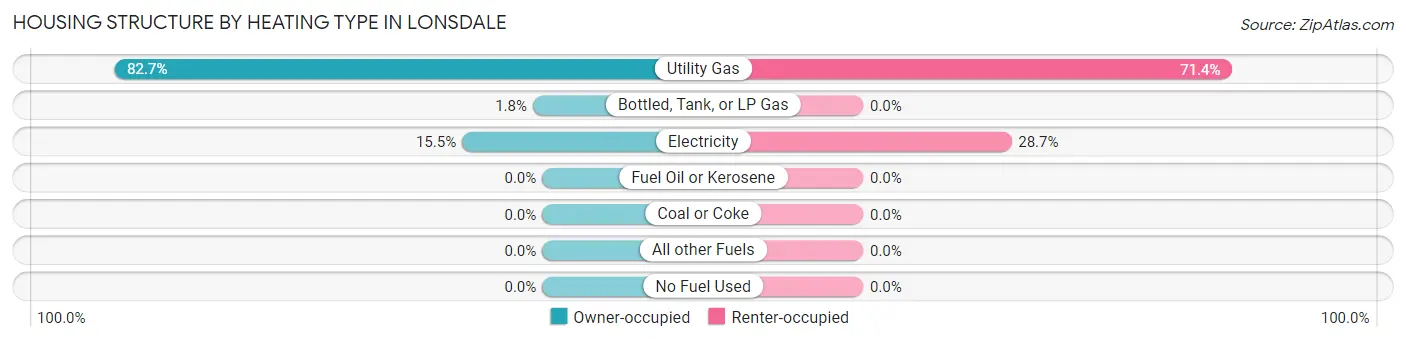
| Heating Type | Owner-occupied | Renter-occupied |
| Utility Gas | 1,106 (82.7%) | 137 (71.4%) |
| Bottled, Tank, or LP Gas | 24 (1.8%) | 0 (0.0%) |
| Electricity | 207 (15.5%) | 55 (28.6%) |
| Fuel Oil or Kerosene | 0 (0.0%) | 0 (0.0%) |
| Coal or Coke | 0 (0.0%) | 0 (0.0%) |
| All other Fuels | 0 (0.0%) | 0 (0.0%) |
| No Fuel Used | 0 (0.0%) | 0 (0.0%) |
| Total | 1,337 (100.0%) | 192 (100.0%) |
Household Vehicle Usage in Lonsdale

| Vehicles per Household | Owner-occupied | Renter-occupied |
| No Vehicle | 0 (0.0%) | 4 (2.1%) |
| 1 Vehicle | 169 (12.6%) | 75 (39.1%) |
| 2 Vehicles | 703 (52.6%) | 68 (35.4%) |
| 3 or more Vehicles | 465 (34.8%) | 45 (23.4%) |
| Total | 1,337 (100.0%) | 192 (100.0%) |
Real Estate & Mortgages in Lonsdale
Real Estate and Mortgage Overview in Lonsdale
| Characteristic | Without Mortgage | With Mortgage |
| Housing Units | 283 | 1,054 |
| Median Property Value | $323,300 | $292,900 |
| Median Household Income | $67,679 | $207 |
| Monthly Housing Costs | $875 | $4 |
| Real Estate Taxes | $3,693 | $20 |
Property Value by Mortgage Status in Lonsdale
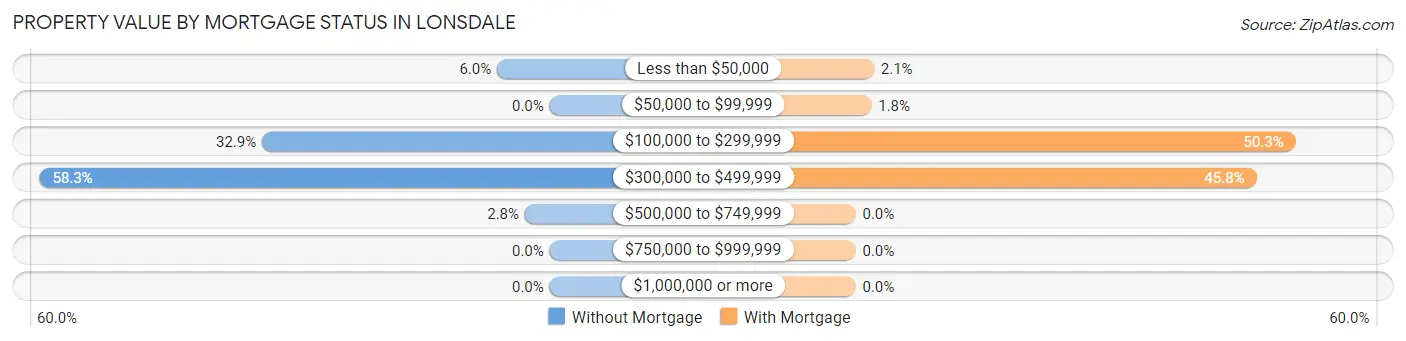
| Property Value | Without Mortgage | With Mortgage |
| Less than $50,000 | 17 (6.0%) | 22 (2.1%) |
| $50,000 to $99,999 | 0 (0.0%) | 19 (1.8%) |
| $100,000 to $299,999 | 93 (32.9%) | 530 (50.3%) |
| $300,000 to $499,999 | 165 (58.3%) | 483 (45.8%) |
| $500,000 to $749,999 | 8 (2.8%) | 0 (0.0%) |
| $750,000 to $999,999 | 0 (0.0%) | 0 (0.0%) |
| $1,000,000 or more | 0 (0.0%) | 0 (0.0%) |
| Total | 283 (100.0%) | 1,054 (100.0%) |
Household Income by Mortgage Status in Lonsdale
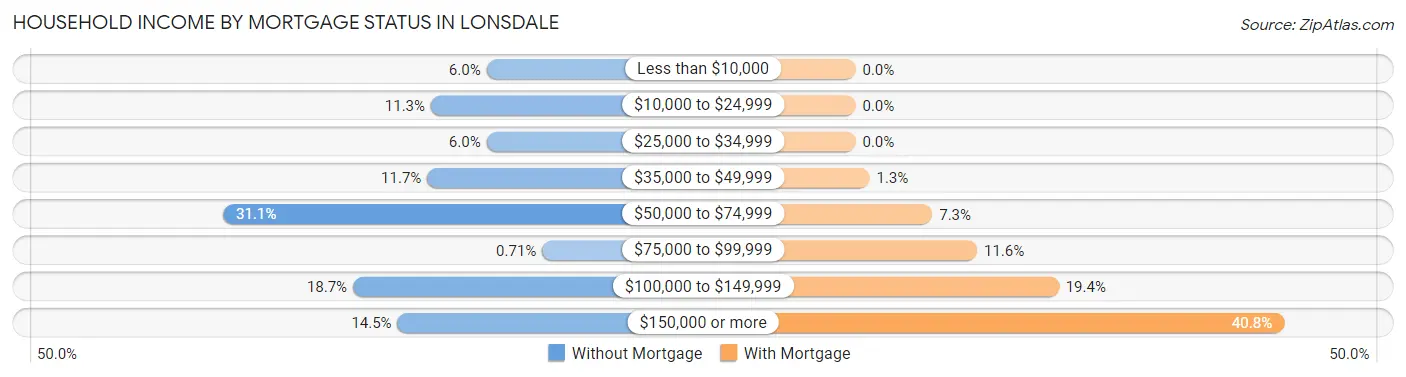
| Household Income | Without Mortgage | With Mortgage |
| Less than $10,000 | 17 (6.0%) | 0 (0.0%) |
| $10,000 to $24,999 | 32 (11.3%) | 0 (0.0%) |
| $25,000 to $34,999 | 17 (6.0%) | 0 (0.0%) |
| $35,000 to $49,999 | 33 (11.7%) | 14 (1.3%) |
| $50,000 to $74,999 | 88 (31.1%) | 77 (7.3%) |
| $75,000 to $99,999 | 2 (0.7%) | 122 (11.6%) |
| $100,000 to $149,999 | 53 (18.7%) | 204 (19.4%) |
| $150,000 or more | 41 (14.5%) | 430 (40.8%) |
| Total | 283 (100.0%) | 1,054 (100.0%) |
Property Value to Household Income Ratio in Lonsdale
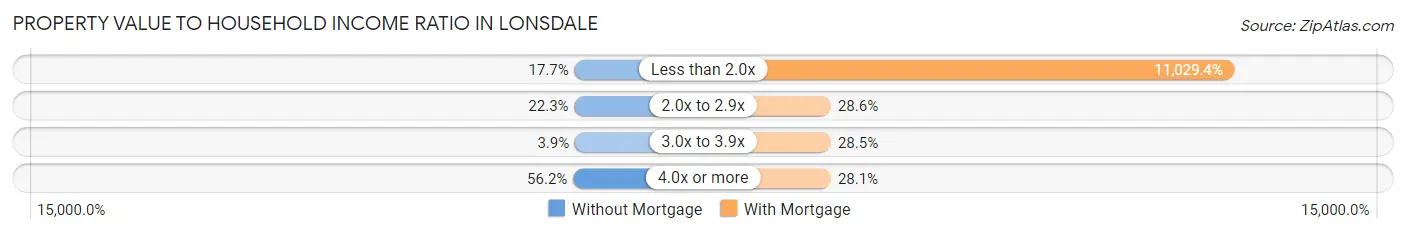
| Value-to-Income Ratio | Without Mortgage | With Mortgage |
| Less than 2.0x | 50 (17.7%) | 116,250 (11,029.4%) |
| 2.0x to 2.9x | 63 (22.3%) | 301 (28.6%) |
| 3.0x to 3.9x | 11 (3.9%) | 300 (28.5%) |
| 4.0x or more | 159 (56.2%) | 296 (28.1%) |
| Total | 283 (100.0%) | 1,054 (100.0%) |
Real Estate Taxes by Mortgage Status in Lonsdale
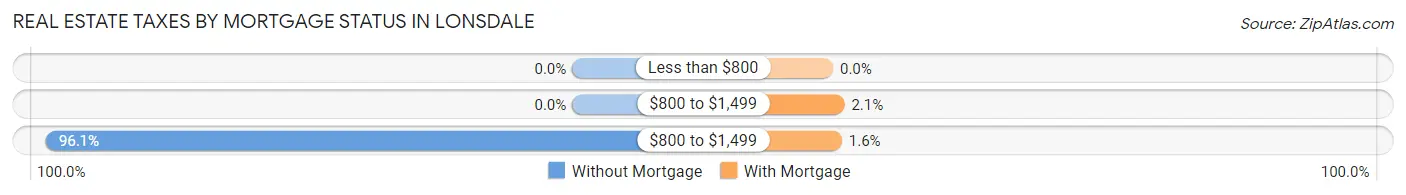
| Property Taxes | Without Mortgage | With Mortgage |
| Less than $800 | 0 (0.0%) | 0 (0.0%) |
| $800 to $1,499 | 0 (0.0%) | 22 (2.1%) |
| $800 to $1,499 | 272 (96.1%) | 17 (1.6%) |
| Total | 283 (100.0%) | 1,054 (100.0%) |
Health & Disability in Lonsdale
Health Insurance Coverage by Age in Lonsdale
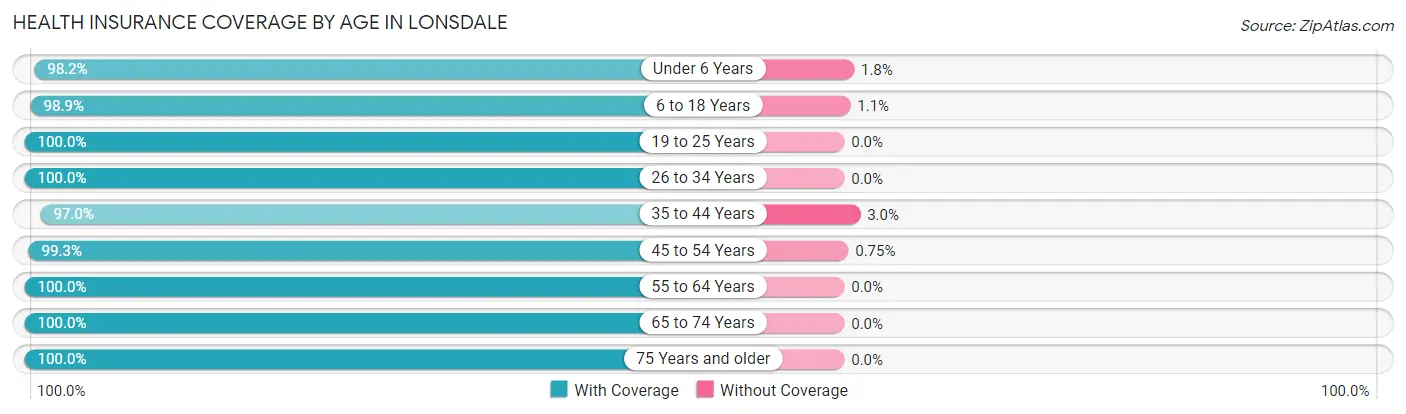
| Age Bracket | With Coverage | Without Coverage |
| Under 6 Years | 593 (98.2%) | 11 (1.8%) |
| 6 to 18 Years | 1,140 (98.9%) | 13 (1.1%) |
| 19 to 25 Years | 382 (100.0%) | 0 (0.0%) |
| 26 to 34 Years | 692 (100.0%) | 0 (0.0%) |
| 35 to 44 Years | 817 (97.0%) | 25 (3.0%) |
| 45 to 54 Years | 399 (99.3%) | 3 (0.7%) |
| 55 to 64 Years | 324 (100.0%) | 0 (0.0%) |
| 65 to 74 Years | 191 (100.0%) | 0 (0.0%) |
| 75 Years and older | 128 (100.0%) | 0 (0.0%) |
| Total | 4,666 (98.9%) | 52 (1.1%) |
Health Insurance Coverage by Citizenship Status in Lonsdale
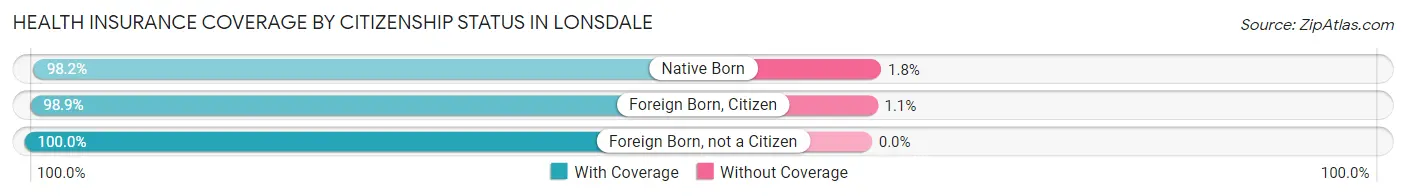
| Citizenship Status | With Coverage | Without Coverage |
| Native Born | 593 (98.2%) | 11 (1.8%) |
| Foreign Born, Citizen | 1,140 (98.9%) | 13 (1.1%) |
| Foreign Born, not a Citizen | 382 (100.0%) | 0 (0.0%) |
Health Insurance Coverage by Household Income in Lonsdale
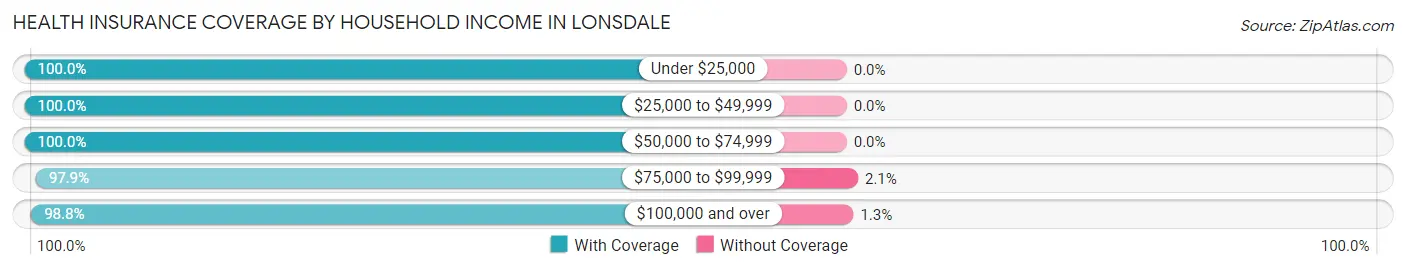
| Household Income | With Coverage | Without Coverage |
| Under $25,000 | 120 (100.0%) | 0 (0.0%) |
| $25,000 to $49,999 | 190 (100.0%) | 0 (0.0%) |
| $50,000 to $74,999 | 772 (100.0%) | 0 (0.0%) |
| $75,000 to $99,999 | 742 (97.9%) | 16 (2.1%) |
| $100,000 and over | 2,839 (98.8%) | 36 (1.3%) |
Public vs Private Health Insurance Coverage by Age in Lonsdale
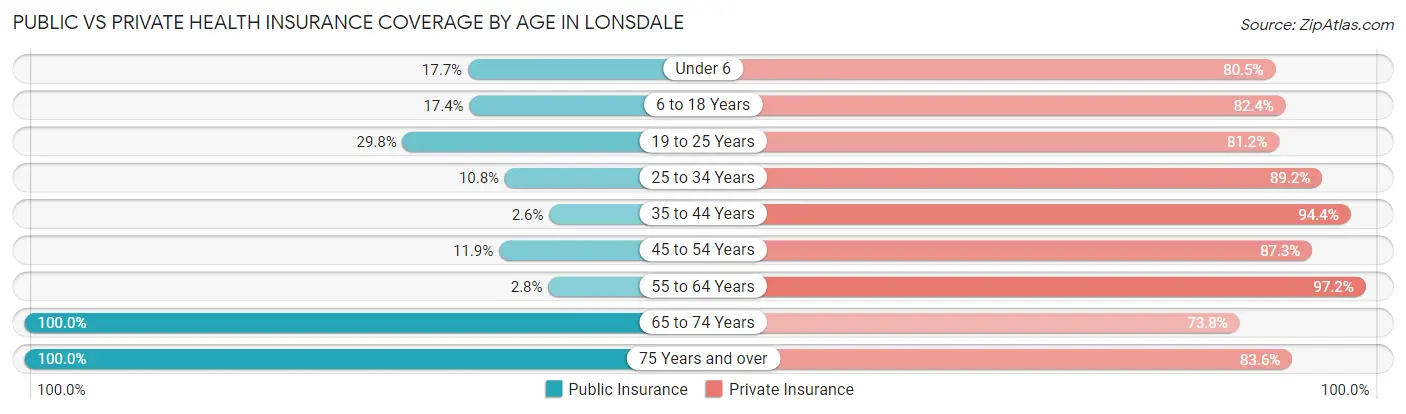
| Age Bracket | Public Insurance | Private Insurance |
| Under 6 | 107 (17.7%) | 486 (80.5%) |
| 6 to 18 Years | 201 (17.4%) | 950 (82.4%) |
| 19 to 25 Years | 114 (29.8%) | 310 (81.1%) |
| 25 to 34 Years | 75 (10.8%) | 617 (89.2%) |
| 35 to 44 Years | 22 (2.6%) | 795 (94.4%) |
| 45 to 54 Years | 48 (11.9%) | 351 (87.3%) |
| 55 to 64 Years | 9 (2.8%) | 315 (97.2%) |
| 65 to 74 Years | 191 (100.0%) | 141 (73.8%) |
| 75 Years and over | 128 (100.0%) | 107 (83.6%) |
| Total | 895 (19.0%) | 4,072 (86.3%) |
Disability Status by Sex by Age in Lonsdale
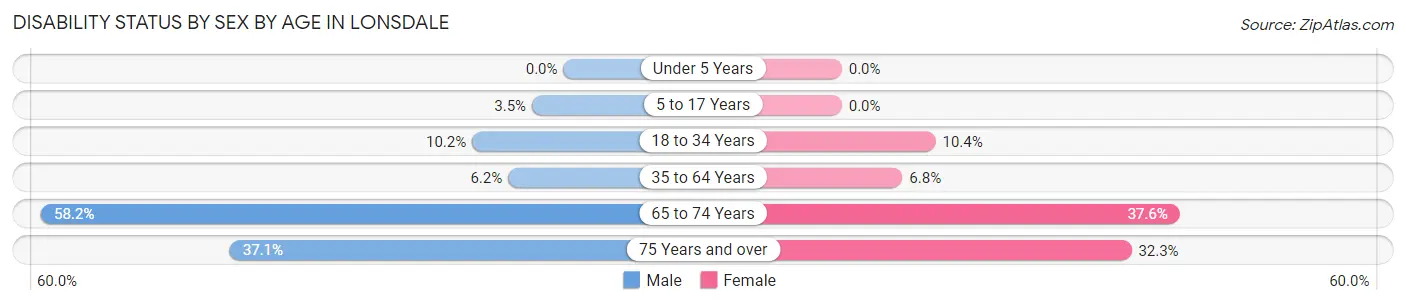
| Age Bracket | Male | Female |
| Under 5 Years | 0 (0.0%) | 0 (0.0%) |
| 5 to 17 Years | 23 (3.5%) | 0 (0.0%) |
| 18 to 34 Years | 59 (10.2%) | 54 (10.4%) |
| 35 to 64 Years | 50 (6.2%) | 51 (6.8%) |
| 65 to 74 Years | 57 (58.2%) | 35 (37.6%) |
| 75 Years and over | 13 (37.1%) | 30 (32.3%) |
Disability Class by Sex by Age in Lonsdale
Disability Class: Hearing Difficulty
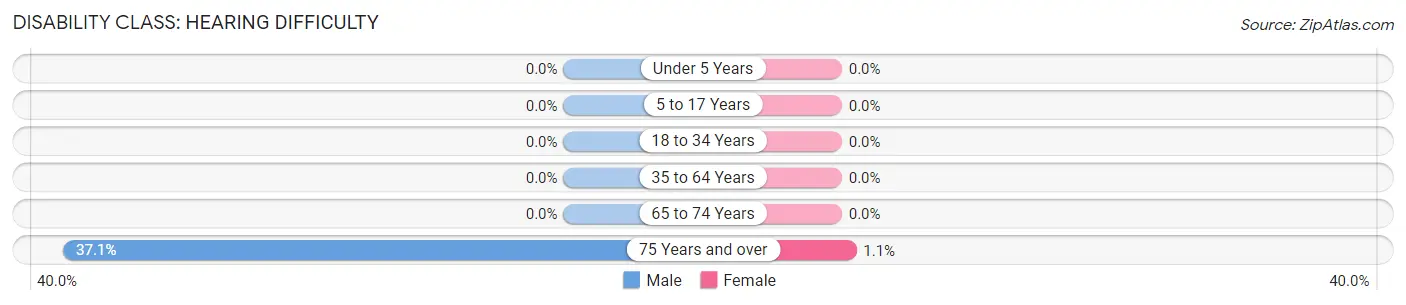
| Age Bracket | Male | Female |
| Under 5 Years | 0 (0.0%) | 0 (0.0%) |
| 5 to 17 Years | 0 (0.0%) | 0 (0.0%) |
| 18 to 34 Years | 0 (0.0%) | 0 (0.0%) |
| 35 to 64 Years | 0 (0.0%) | 0 (0.0%) |
| 65 to 74 Years | 0 (0.0%) | 0 (0.0%) |
| 75 Years and over | 13 (37.1%) | 1 (1.1%) |
Disability Class: Vision Difficulty
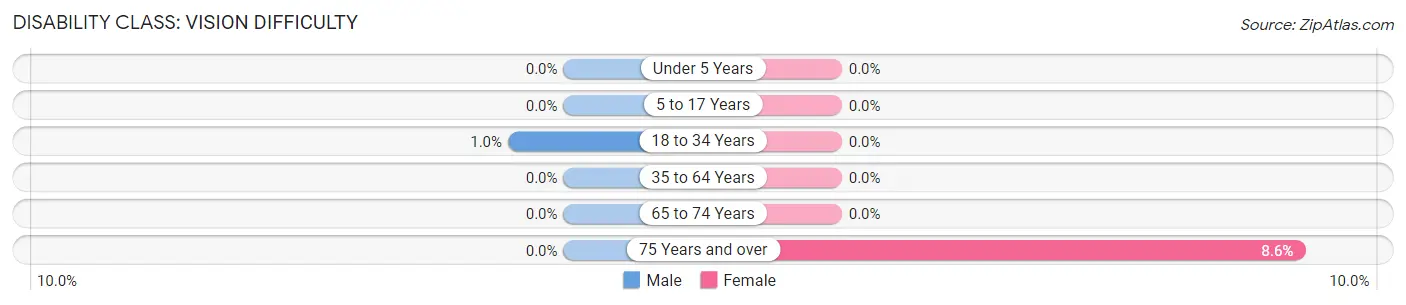
| Age Bracket | Male | Female |
| Under 5 Years | 0 (0.0%) | 0 (0.0%) |
| 5 to 17 Years | 0 (0.0%) | 0 (0.0%) |
| 18 to 34 Years | 6 (1.0%) | 0 (0.0%) |
| 35 to 64 Years | 0 (0.0%) | 0 (0.0%) |
| 65 to 74 Years | 0 (0.0%) | 0 (0.0%) |
| 75 Years and over | 0 (0.0%) | 8 (8.6%) |
Disability Class: Cognitive Difficulty
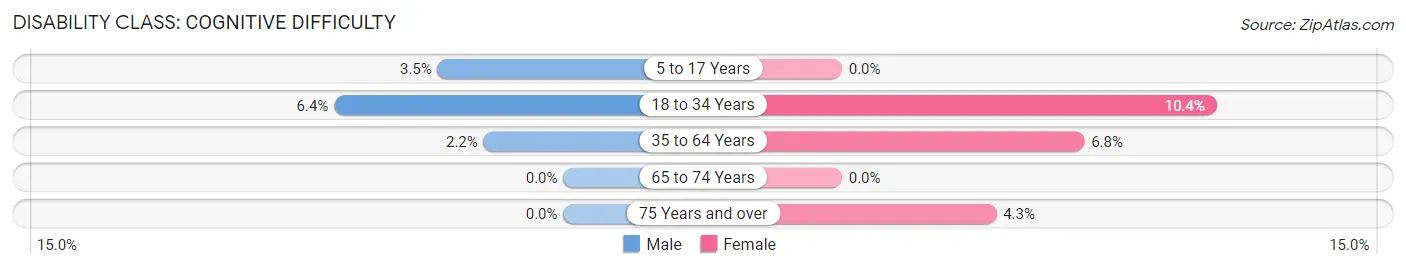
| Age Bracket | Male | Female |
| 5 to 17 Years | 23 (3.5%) | 0 (0.0%) |
| 18 to 34 Years | 37 (6.4%) | 54 (10.4%) |
| 35 to 64 Years | 18 (2.2%) | 51 (6.8%) |
| 65 to 74 Years | 0 (0.0%) | 0 (0.0%) |
| 75 Years and over | 0 (0.0%) | 4 (4.3%) |
Disability Class: Ambulatory Difficulty
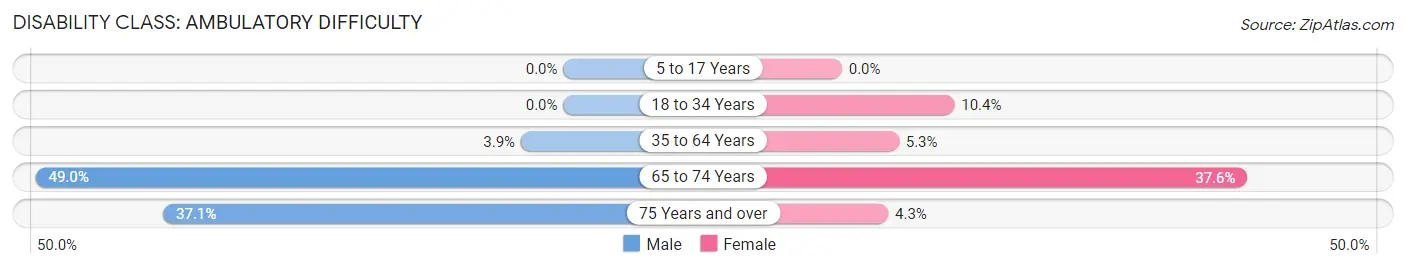
| Age Bracket | Male | Female |
| 5 to 17 Years | 0 (0.0%) | 0 (0.0%) |
| 18 to 34 Years | 0 (0.0%) | 54 (10.4%) |
| 35 to 64 Years | 32 (3.9%) | 40 (5.3%) |
| 65 to 74 Years | 48 (49.0%) | 35 (37.6%) |
| 75 Years and over | 13 (37.1%) | 4 (4.3%) |
Disability Class: Self-Care Difficulty
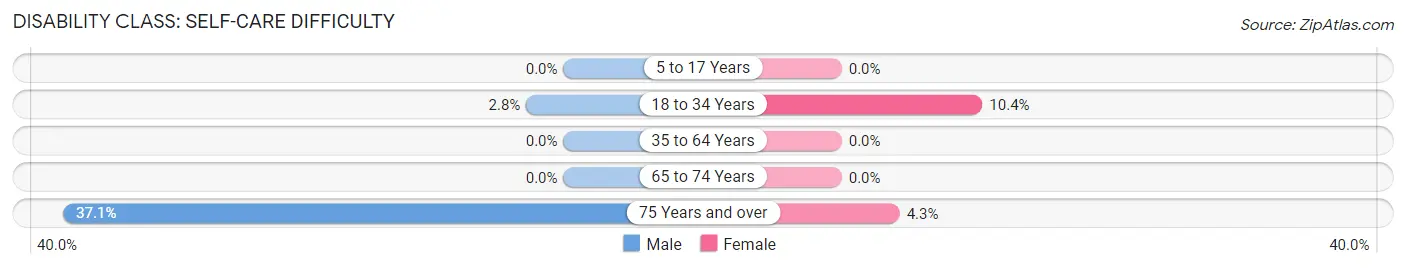
| Age Bracket | Male | Female |
| 5 to 17 Years | 0 (0.0%) | 0 (0.0%) |
| 18 to 34 Years | 16 (2.8%) | 54 (10.4%) |
| 35 to 64 Years | 0 (0.0%) | 0 (0.0%) |
| 65 to 74 Years | 0 (0.0%) | 0 (0.0%) |
| 75 Years and over | 13 (37.1%) | 4 (4.3%) |
Technology Access in Lonsdale
Computing Device Access in Lonsdale
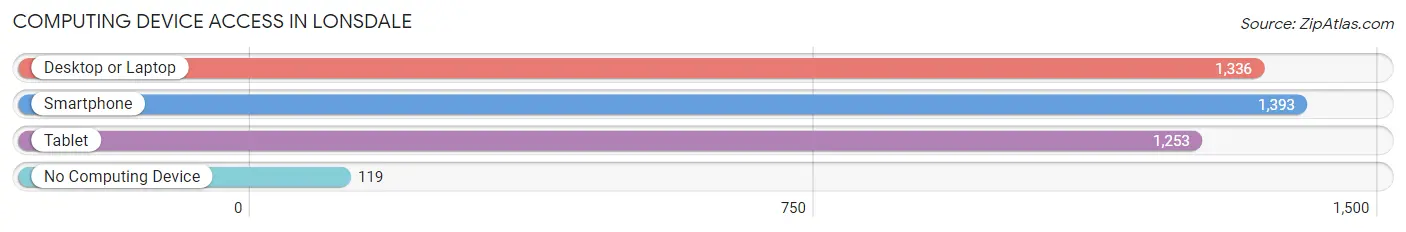
| Device Type | # Households | % Households |
| Desktop or Laptop | 1,336 | 87.4% |
| Smartphone | 1,393 | 91.1% |
| Tablet | 1,253 | 82.0% |
| No Computing Device | 119 | 7.8% |
| Total | 1,529 | 100.0% |
Internet Access in Lonsdale
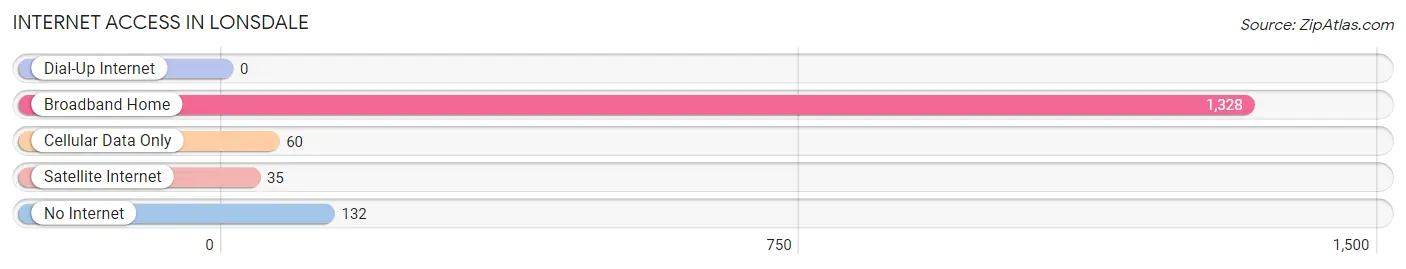
| Internet Type | # Households | % Households |
| Dial-Up Internet | 0 | 0.0% |
| Broadband Home | 1,328 | 86.9% |
| Cellular Data Only | 60 | 3.9% |
| Satellite Internet | 35 | 2.3% |
| No Internet | 132 | 8.6% |
| Total | 1,529 | 100.0% |
Lonsdale Summary
Lonsdale, Minnesota is a small city located in Rice County, Minnesota, United States. The city is situated along the Cannon River and is part of the Twin Cities metropolitan area. As of the 2010 census, the population of Lonsdale was 1,521.
History
Lonsdale was founded in 1856 by a group of settlers from New York. The city was named after a town in England, and the settlers chose the name because of its similarity to their hometown. The city was incorporated in 1872.
In the late 19th century, Lonsdale was a thriving agricultural community. The city was home to several grain elevators, a creamery, and a cheese factory. The city also had a number of businesses, including a hotel, a bank, a blacksmith shop, and a general store.
In the early 20th century, Lonsdale experienced a period of growth. The city was home to several churches, a school, and a library. The city also had a number of businesses, including a hardware store, a furniture store, and a movie theater.
Geography
Lonsdale is located in Rice County, Minnesota, United States. The city is situated along the Cannon River and is part of the Twin Cities metropolitan area. The city has a total area of 1.2 square miles, all of which is land.
Economy
Lonsdale’s economy is largely based on agriculture. The city is home to several grain elevators, a creamery, and a cheese factory. The city also has a number of businesses, including a hardware store, a furniture store, and a movie theater.
Demographics
As of the 2010 census, the population of Lonsdale was 1,521. The racial makeup of the city was 97.2% White, 0.3% African American, 0.2% Native American, 0.3% Asian, 0.1% Pacific Islander, 0.7% from other races, and 1.2% from two or more races. Hispanic or Latino of any race were 1.7% of the population.
The median income for a household in the city was $50,938, and the median income for a family was $58,750. The per capita income for the city was $21,945. About 4.2% of families and 5.3% of the population were below the poverty line, including 6.2% of those under age 18 and 5.2% of those age 65 or over.
Common Questions
What is Per Capita Income in Lonsdale?
Per Capita income in Lonsdale is $33,840.
What is the Median Family Income in Lonsdale?
Median Family Income in Lonsdale is $108,897.
What is the Median Household income in Lonsdale?
Median Household Income in Lonsdale is $95,265.
What is Income or Wage Gap in Lonsdale?
Income or Wage Gap in Lonsdale is 35.4%.
Women in Lonsdale earn 64.6 cents for every dollar earned by a man.
What is Inequality or Gini Index in Lonsdale?
Inequality or Gini Index in Lonsdale is 0.31.
What is the Total Population of Lonsdale?
Total Population of Lonsdale is 4,727.
What is the Total Male Population of Lonsdale?
Total Male Population of Lonsdale is 2,470.
What is the Total Female Population of Lonsdale?
Total Female Population of Lonsdale is 2,257.
What is the Ratio of Males per 100 Females in Lonsdale?
There are 109.44 Males per 100 Females in Lonsdale.
What is the Ratio of Females per 100 Males in Lonsdale?
There are 91.38 Females per 100 Males in Lonsdale.
What is the Median Population Age in Lonsdale?
Median Population Age in Lonsdale is 30.1 Years.
What is the Average Family Size in Lonsdale
Average Family Size in Lonsdale is 3.5 People.
What is the Average Household Size in Lonsdale
Average Household Size in Lonsdale is 3.1 People.
How Large is the Labor Force in Lonsdale?
There are 2,363 People in the Labor Forcein in Lonsdale.
What is the Percentage of People in the Labor Force in Lonsdale?
73.6% of People are in the Labor Force in Lonsdale.
What is the Unemployment Rate in Lonsdale?
Unemployment Rate in Lonsdale is 0.9%.