Edwards, CO Map & Demographics
Edwards Map
Edwards Overview
$58,762
PER CAPITA INCOME
$115,357
AVG FAMILY INCOME
$89,399
AVG HOUSEHOLD INCOME
1.2%
WAGE / INCOME GAP [ % ]
98.8¢/ $1
WAGE / INCOME GAP [ $ ]
0.56
INEQUALITY / GINI INDEX
10,721
TOTAL POPULATION
5,825
MALE POPULATION
4,896
FEMALE POPULATION
118.97
MALES / 100 FEMALES
84.05
FEMALES / 100 MALES
37.5
MEDIAN AGE
3.2
AVG FAMILY SIZE
2.8
AVG HOUSEHOLD SIZE
6,189
LABOR FORCE [ PEOPLE ]
71.4%
PERCENT IN LABOR FORCE
7.8%
UNEMPLOYMENT RATE
Edwards Zip Codes
Edwards Area Codes
Income in Edwards
Income Overview in Edwards
Per Capita Income in Edwards is $58,762, while median incomes of families and households are $115,357 and $89,399 respectively.
| Characteristic | Number | Measure |
| Per Capita Income | 10,721 | $58,762 |
| Median Family Income | 2,472 | $115,357 |
| Mean Family Income | 2,472 | $194,910 |
| Median Household Income | 3,824 | $89,399 |
| Mean Household Income | 3,824 | $154,591 |
| Income Deficit | 2,472 | $0 |
| Wage / Income Gap (%) | 10,721 | 1.16% |
| Wage / Income Gap ($) | 10,721 | 98.84¢ per $1 |
| Gini / Inequality Index | 10,721 | 0.56 |
Earnings by Sex in Edwards
Average Earnings in Edwards are $47,718, $47,585 for men and $48,142 for women, a difference of 1.2%.
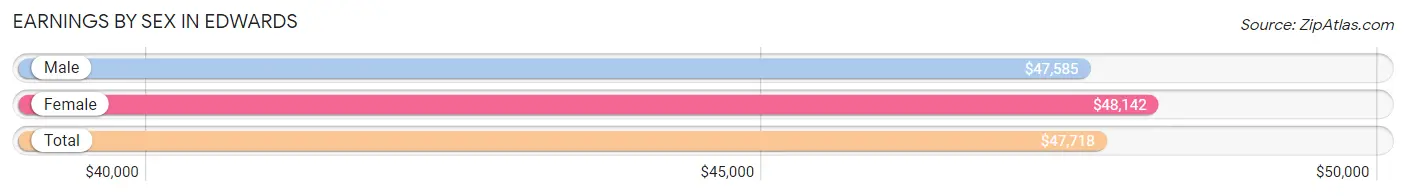
| Sex | Number | Average Earnings |
| Male | 3,898 (61.0%) | $47,585 |
| Female | 2,488 (39.0%) | $48,142 |
| Total | 6,386 (100.0%) | $47,718 |
Earnings by Sex by Income Bracket in Edwards
The most common earnings brackets in Edwards are $100,000+ for men (778 | 20.0%) and $25,000 to $29,999 for women (316 | 12.7%).
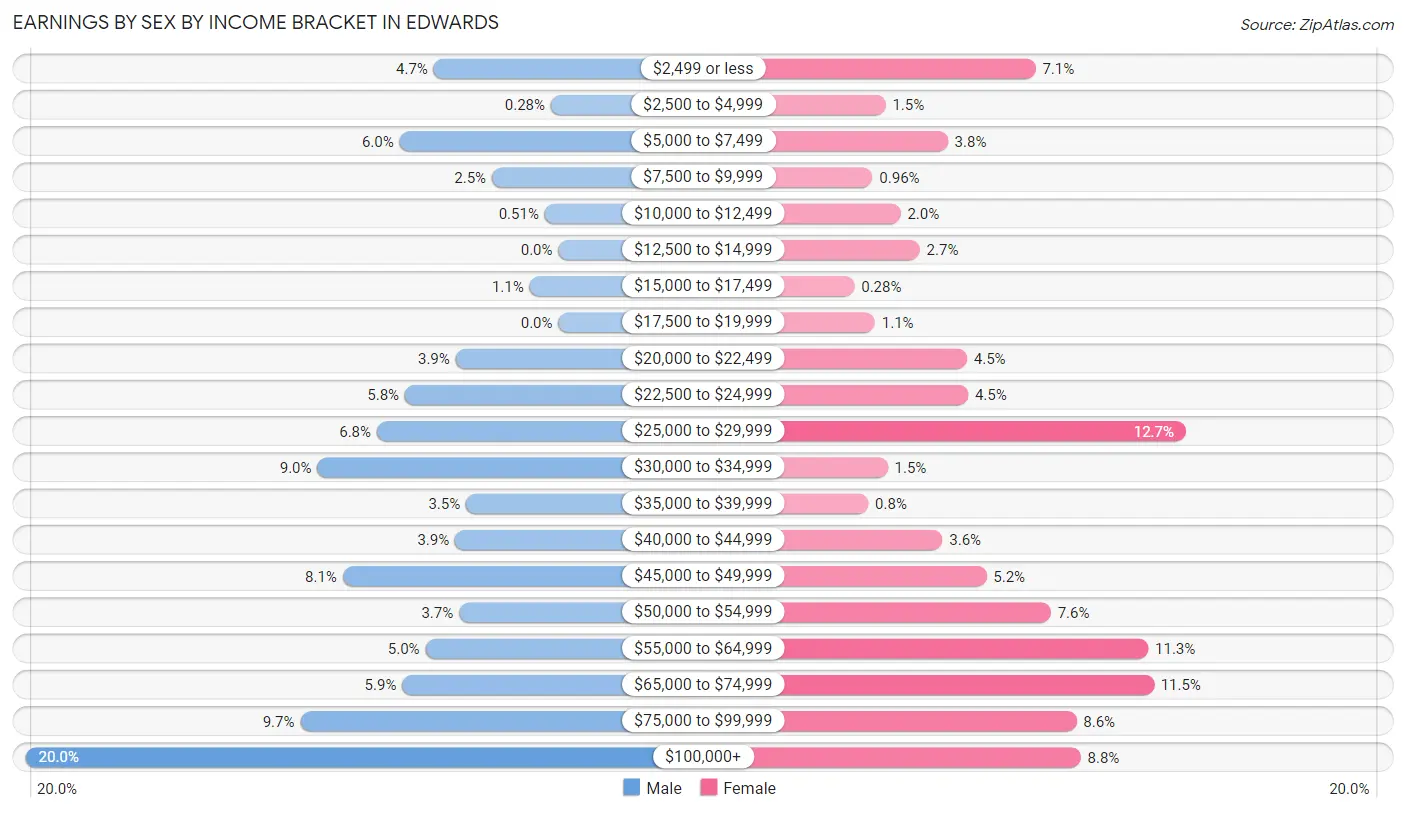
| Income | Male | Female |
| $2,499 or less | 182 (4.7%) | 176 (7.1%) |
| $2,500 to $4,999 | 11 (0.3%) | 36 (1.5%) |
| $5,000 to $7,499 | 232 (5.9%) | 94 (3.8%) |
| $7,500 to $9,999 | 97 (2.5%) | 24 (1.0%) |
| $10,000 to $12,499 | 20 (0.5%) | 50 (2.0%) |
| $12,500 to $14,999 | 0 (0.0%) | 68 (2.7%) |
| $15,000 to $17,499 | 42 (1.1%) | 7 (0.3%) |
| $17,500 to $19,999 | 0 (0.0%) | 26 (1.1%) |
| $20,000 to $22,499 | 150 (3.8%) | 112 (4.5%) |
| $22,500 to $24,999 | 224 (5.8%) | 113 (4.5%) |
| $25,000 to $29,999 | 265 (6.8%) | 316 (12.7%) |
| $30,000 to $34,999 | 352 (9.0%) | 38 (1.5%) |
| $35,000 to $39,999 | 135 (3.5%) | 20 (0.8%) |
| $40,000 to $44,999 | 151 (3.9%) | 89 (3.6%) |
| $45,000 to $49,999 | 315 (8.1%) | 130 (5.2%) |
| $50,000 to $54,999 | 145 (3.7%) | 190 (7.6%) |
| $55,000 to $64,999 | 194 (5.0%) | 281 (11.3%) |
| $65,000 to $74,999 | 228 (5.9%) | 286 (11.5%) |
| $75,000 to $99,999 | 377 (9.7%) | 214 (8.6%) |
| $100,000+ | 778 (20.0%) | 218 (8.8%) |
| Total | 3,898 (100.0%) | 2,488 (100.0%) |
Earnings by Sex by Educational Attainment in Edwards
Average earnings in Edwards are $49,372 for men and $50,772 for women, a difference of 2.8%. Men with an educational attainment of graduate degree enjoy the highest average annual earnings of $101,402, while those with less than high school education earn the least with $28,616. Women with an educational attainment of graduate degree earn the most with the average annual earnings of $63,464, while those with high school diploma education have the smallest earnings of $20,330.
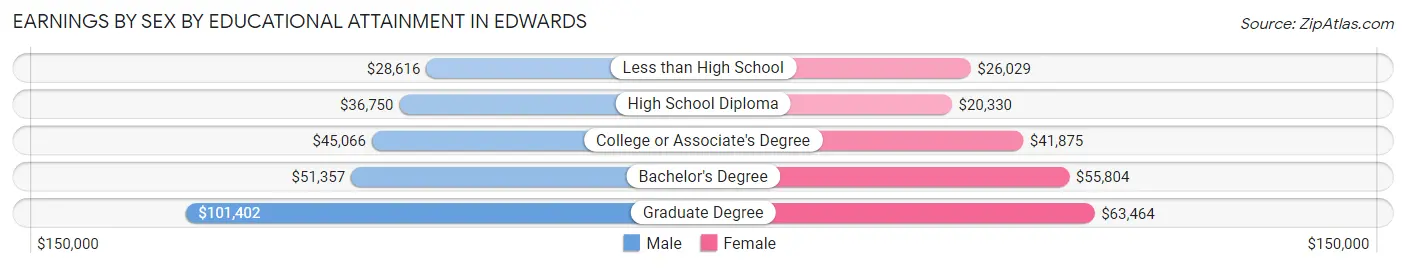
| Educational Attainment | Male Income | Female Income |
| Less than High School | $28,616 | $26,029 |
| High School Diploma | $36,750 | $20,330 |
| College or Associate's Degree | $45,066 | $41,875 |
| Bachelor's Degree | $51,357 | $55,804 |
| Graduate Degree | $101,402 | $63,464 |
| Total | $49,372 | $50,772 |
Family Income in Edwards
Family Income Brackets in Edwards
According to the Edwards family income data, there are 643 families falling into the $200,000+ income range, which is the most common income bracket and makes up 26.0% of all families.
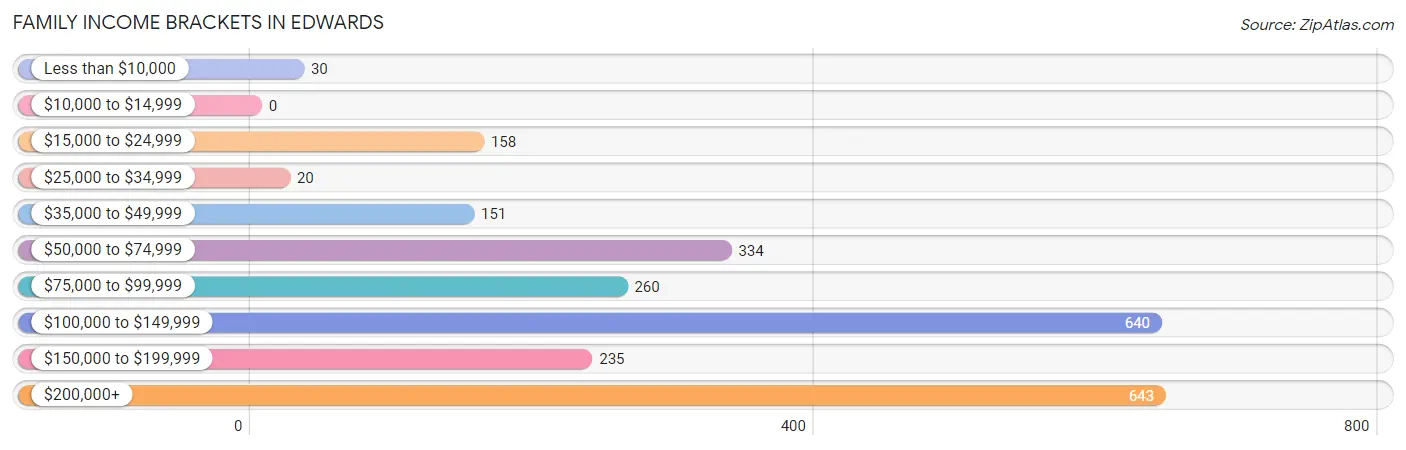
| Income Bracket | # Families | % Families |
| Less than $10,000 | 30 | 1.2% |
| $10,000 to $14,999 | 0 | 0.0% |
| $15,000 to $24,999 | 158 | 6.4% |
| $25,000 to $34,999 | 20 | 0.8% |
| $35,000 to $49,999 | 151 | 6.1% |
| $50,000 to $74,999 | 334 | 13.5% |
| $75,000 to $99,999 | 260 | 10.5% |
| $100,000 to $149,999 | 640 | 25.9% |
| $150,000 to $199,999 | 235 | 9.5% |
| $200,000+ | 643 | 26.0% |
Family Income by Famaliy Size in Edwards
2-person families (1,066 | 43.1%) account for the highest median family income in Edwards with $126,988 per family, while 2-person families (1,066 | 43.1%) have the highest median income of $63,494 per family member.
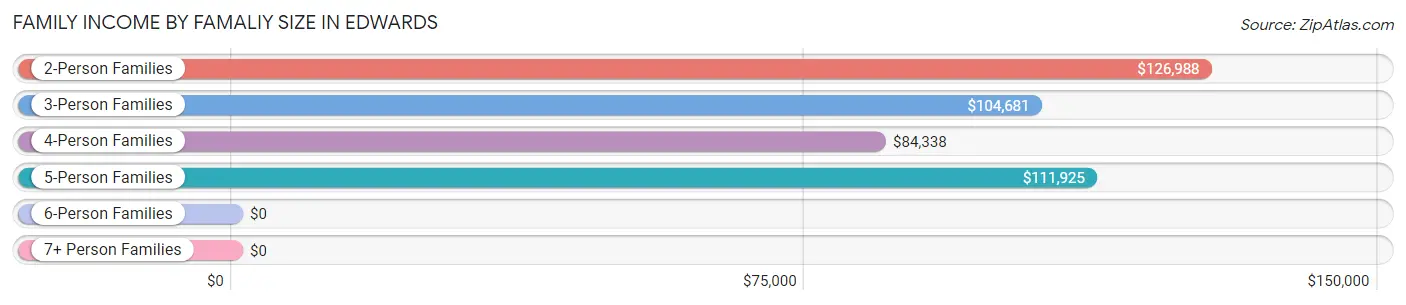
| Income Bracket | # Families | Median Income |
| 2-Person Families | 1,066 (43.1%) | $126,988 |
| 3-Person Families | 659 (26.7%) | $104,681 |
| 4-Person Families | 526 (21.3%) | $84,338 |
| 5-Person Families | 133 (5.4%) | $111,925 |
| 6-Person Families | 88 (3.6%) | $0 |
| 7+ Person Families | 0 (0.0%) | $0 |
| Total | 2,472 (100.0%) | $115,357 |
Family Income by Number of Earners in Edwards
The median family income in Edwards is $115,357, with families comprising no earners (240) having the highest median family income of $226,719, while families with 1 earner (777) have the lowest median family income of $79,738, accounting for 9.7% and 31.4% of families, respectively.
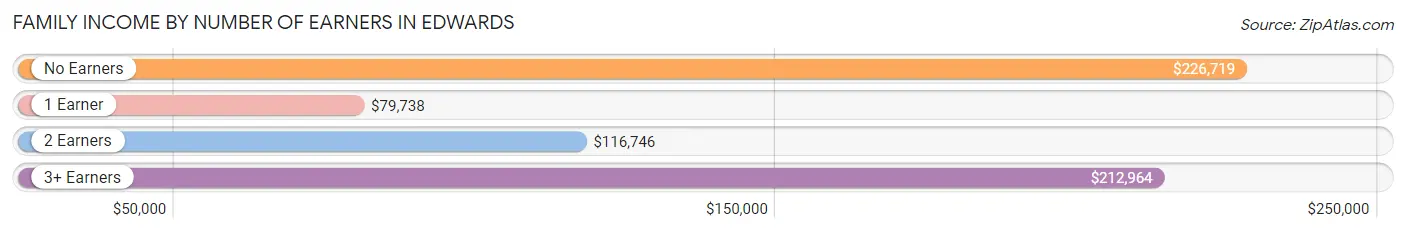
| Number of Earners | # Families | Median Income |
| No Earners | 240 (9.7%) | $226,719 |
| 1 Earner | 777 (31.4%) | $79,738 |
| 2 Earners | 1,246 (50.4%) | $116,746 |
| 3+ Earners | 209 (8.5%) | $212,964 |
| Total | 2,472 (100.0%) | $115,357 |
Household Income in Edwards
Household Income Brackets in Edwards
With 742 households falling in the category, the $200,000+ income range is the most frequent in Edwards, accounting for 19.4% of all households. In contrast, only 73 households (1.9%) fall into the $10,000 to $14,999 income bracket, making it the least populous group.
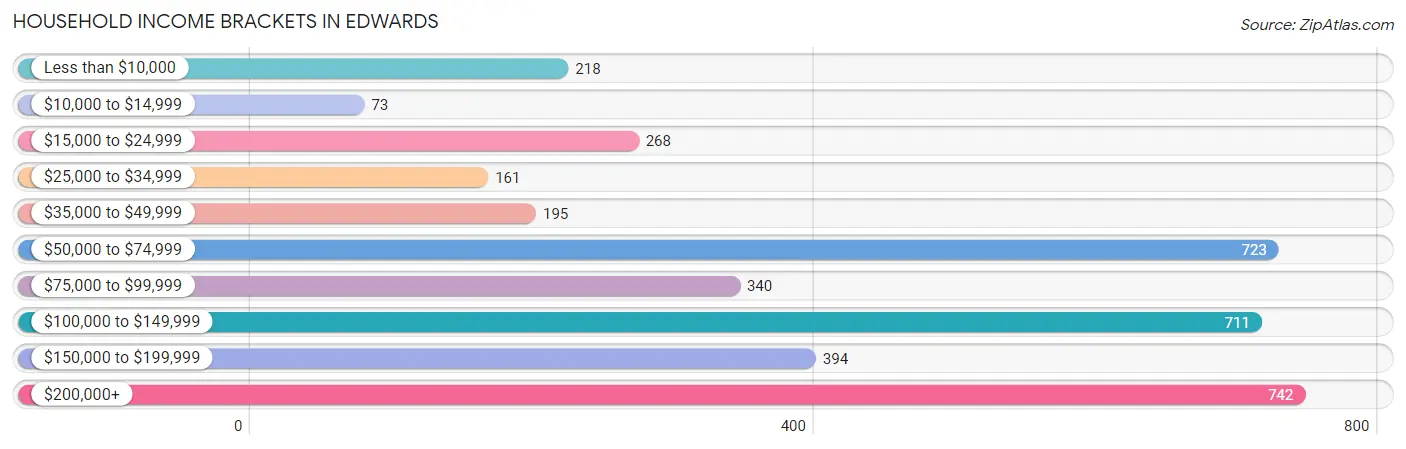
| Income Bracket | # Households | % Households |
| Less than $10,000 | 218 | 5.7% |
| $10,000 to $14,999 | 73 | 1.9% |
| $15,000 to $24,999 | 268 | 7.0% |
| $25,000 to $34,999 | 161 | 4.2% |
| $35,000 to $49,999 | 195 | 5.1% |
| $50,000 to $74,999 | 723 | 18.9% |
| $75,000 to $99,999 | 340 | 8.9% |
| $100,000 to $149,999 | 711 | 18.6% |
| $150,000 to $199,999 | 394 | 10.3% |
| $200,000+ | 742 | 19.4% |
Household Income by Householder Age in Edwards
The median household income in Edwards is $89,399, with the highest median household income of $103,986 found in the 45 to 64 years age bracket for the primary householder. A total of 1,518 households (39.7%) fall into this category. Meanwhile, the 25 to 44 years age bracket for the primary householder has the lowest median household income of $66,625, with 1,324 households (34.6%) in this group.
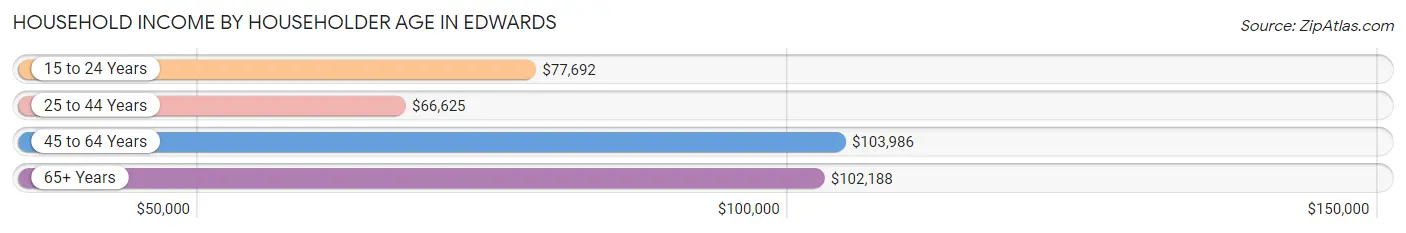
| Income Bracket | # Households | Median Income |
| 15 to 24 Years | 100 (2.6%) | $77,692 |
| 25 to 44 Years | 1,324 (34.6%) | $66,625 |
| 45 to 64 Years | 1,518 (39.7%) | $103,986 |
| 65+ Years | 882 (23.1%) | $102,188 |
| Total | 3,824 (100.0%) | $89,399 |
Poverty in Edwards
Income Below Poverty by Sex and Age in Edwards
With 10.2% poverty level for males and 13.3% for females among the residents of Edwards, 25 to 34 year old males and 55 to 64 year old females are the most vulnerable to poverty, with 259 males (21.4%) and 229 females (35.3%) in their respective age groups living below the poverty level.
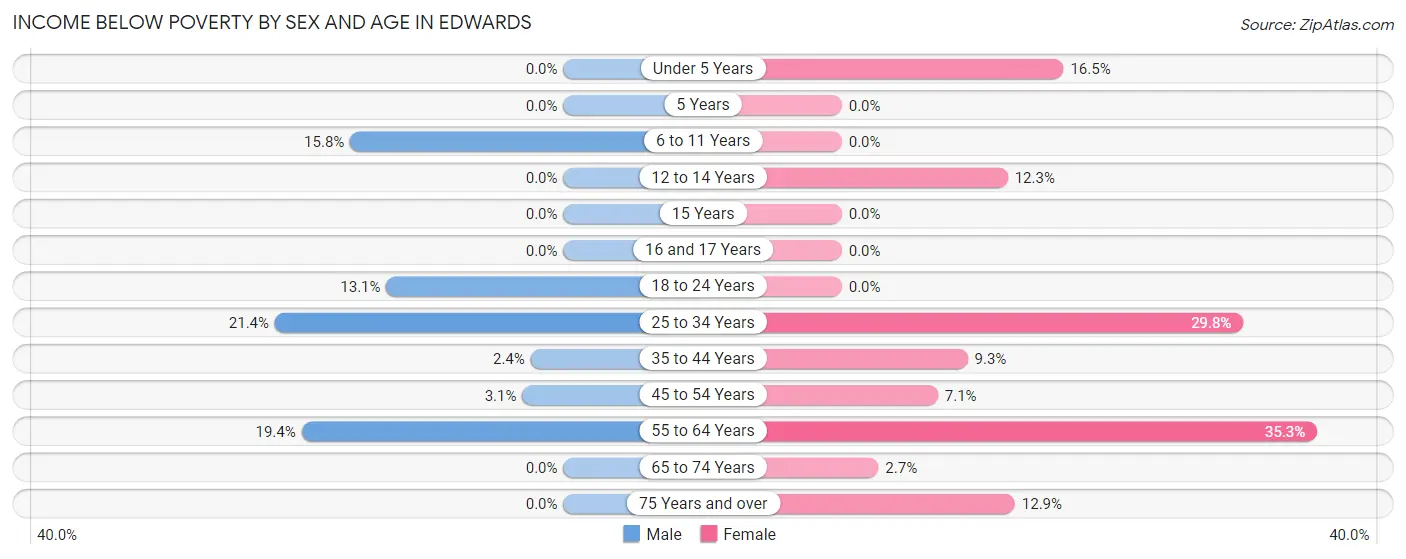
| Age Bracket | Male | Female |
| Under 5 Years | 0 (0.0%) | 65 (16.5%) |
| 5 Years | 0 (0.0%) | 0 (0.0%) |
| 6 to 11 Years | 76 (15.8%) | 0 (0.0%) |
| 12 to 14 Years | 0 (0.0%) | 25 (12.3%) |
| 15 Years | 0 (0.0%) | 0 (0.0%) |
| 16 and 17 Years | 0 (0.0%) | 0 (0.0%) |
| 18 to 24 Years | 74 (13.1%) | 0 (0.0%) |
| 25 to 34 Years | 259 (21.4%) | 166 (29.8%) |
| 35 to 44 Years | 24 (2.4%) | 61 (9.3%) |
| 45 to 54 Years | 19 (3.0%) | 51 (7.1%) |
| 55 to 64 Years | 139 (19.4%) | 229 (35.3%) |
| 65 to 74 Years | 0 (0.0%) | 11 (2.7%) |
| 75 Years and over | 0 (0.0%) | 41 (12.9%) |
| Total | 591 (10.2%) | 649 (13.3%) |
Income Above Poverty by Sex and Age in Edwards
According to the poverty statistics in Edwards, males aged under 5 years and females aged 5 years are the age groups that are most secure financially, with 100.0% of males and 100.0% of females in these age groups living above the poverty line.
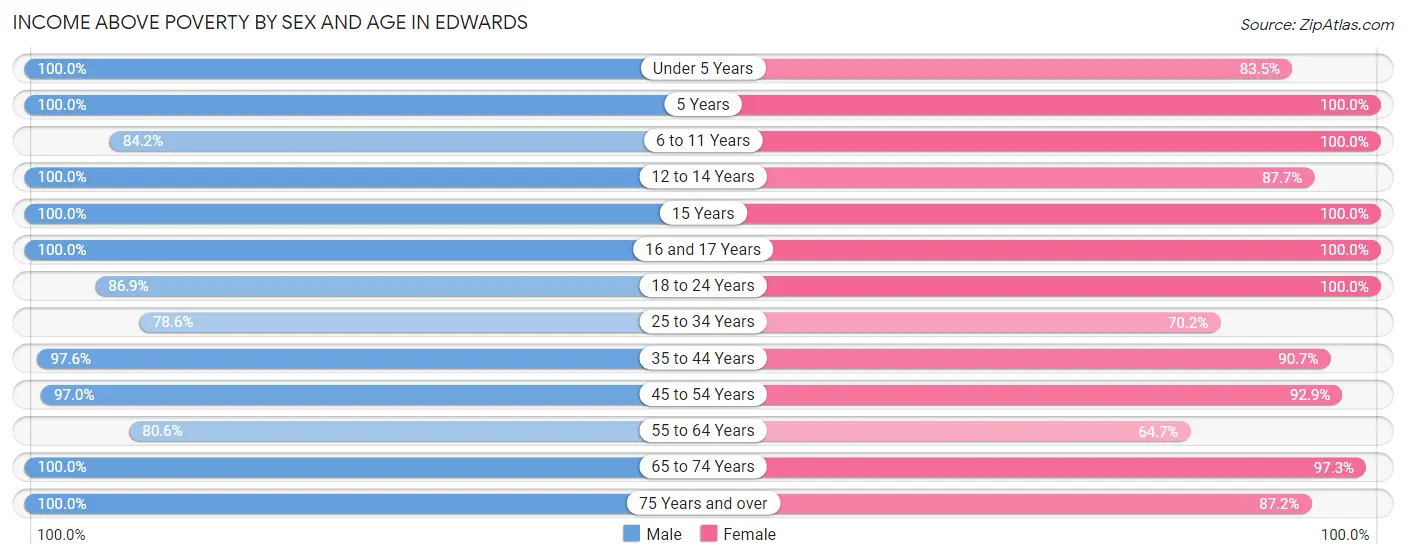
| Age Bracket | Male | Female |
| Under 5 Years | 116 (100.0%) | 330 (83.5%) |
| 5 Years | 24 (100.0%) | 45 (100.0%) |
| 6 to 11 Years | 404 (84.2%) | 384 (100.0%) |
| 12 to 14 Years | 247 (100.0%) | 178 (87.7%) |
| 15 Years | 10 (100.0%) | 149 (100.0%) |
| 16 and 17 Years | 167 (100.0%) | 73 (100.0%) |
| 18 to 24 Years | 489 (86.9%) | 350 (100.0%) |
| 25 to 34 Years | 950 (78.6%) | 391 (70.2%) |
| 35 to 44 Years | 963 (97.6%) | 592 (90.7%) |
| 45 to 54 Years | 604 (97.0%) | 664 (92.9%) |
| 55 to 64 Years | 576 (80.6%) | 420 (64.7%) |
| 65 to 74 Years | 495 (100.0%) | 393 (97.3%) |
| 75 Years and over | 189 (100.0%) | 278 (87.2%) |
| Total | 5,234 (89.8%) | 4,247 (86.7%) |
Income Below Poverty Among Married-Couple Families in Edwards
The poverty statistics for married-couple families in Edwards show that 7.1% or 149 of the total 2,090 families live below the poverty line. Families with 1 or 2 children have the highest poverty rate of 16.6%, comprising of 149 families. On the other hand, families with no children have the lowest poverty rate of 0.0%, which includes 0 families.
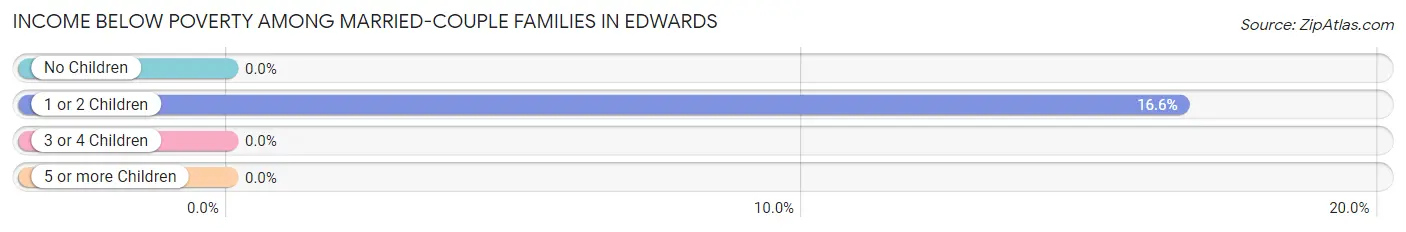
| Children | Above Poverty | Below Poverty |
| No Children | 1,030 (100.0%) | 0 (0.0%) |
| 1 or 2 Children | 751 (83.4%) | 149 (16.6%) |
| 3 or 4 Children | 160 (100.0%) | 0 (0.0%) |
| 5 or more Children | 0 (0.0%) | 0 (0.0%) |
| Total | 1,941 (92.9%) | 149 (7.1%) |
Income Below Poverty Among Single-Parent Households in Edwards
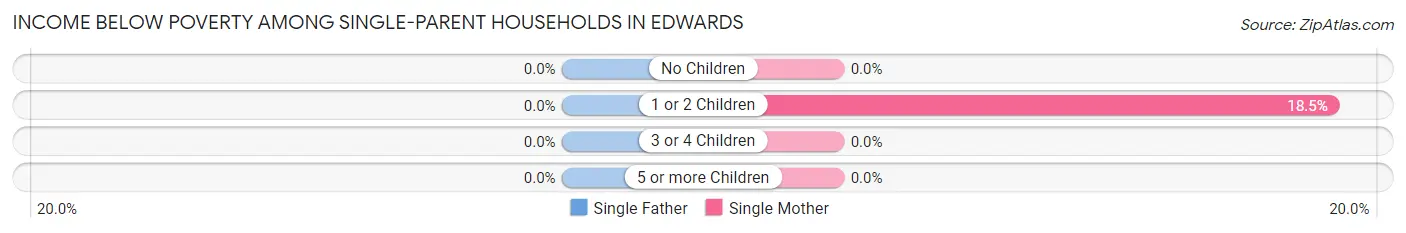
| Children | Single Father | Single Mother |
| No Children | 0 (0.0%) | 0 (0.0%) |
| 1 or 2 Children | 0 (0.0%) | 29 (18.5%) |
| 3 or 4 Children | 0 (0.0%) | 0 (0.0%) |
| 5 or more Children | 0 (0.0%) | 0 (0.0%) |
| Total | 0 (0.0%) | 29 (11.6%) |
Income Below Poverty Among Married-Couple vs Single-Parent Households in Edwards
The poverty data for Edwards shows that 149 of the married-couple family households (7.1%) and 29 of the single-parent households (7.6%) are living below the poverty level. Within the married-couple family households, those with 1 or 2 children have the highest poverty rate, with 149 households (16.6%) falling below the poverty line. Among the single-parent households, those with 1 or 2 children have the highest poverty rate, with 29 household (10.9%) living below poverty.
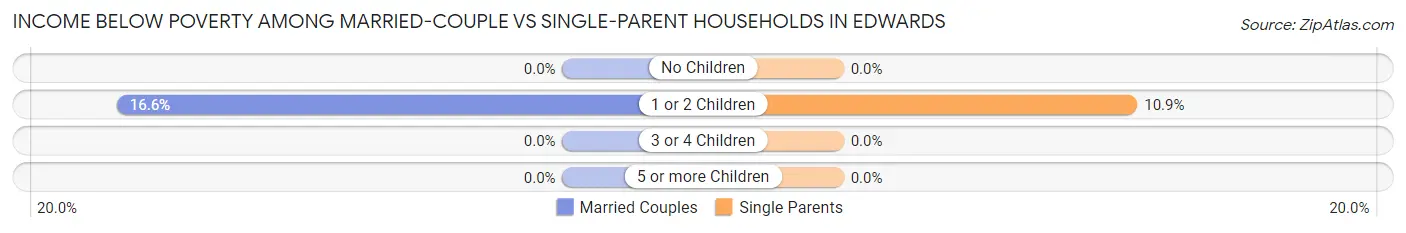
| Children | Married-Couple Families | Single-Parent Households |
| No Children | 0 (0.0%) | 0 (0.0%) |
| 1 or 2 Children | 149 (16.6%) | 29 (10.9%) |
| 3 or 4 Children | 0 (0.0%) | 0 (0.0%) |
| 5 or more Children | 0 (0.0%) | 0 (0.0%) |
| Total | 149 (7.1%) | 29 (7.6%) |
Race in Edwards
The most populous races in Edwards are White / Caucasian (7,826 | 73.0%), Hispanic or Latino (3,352 | 31.3%), and Two or more Races (1,828 | 17.1%).
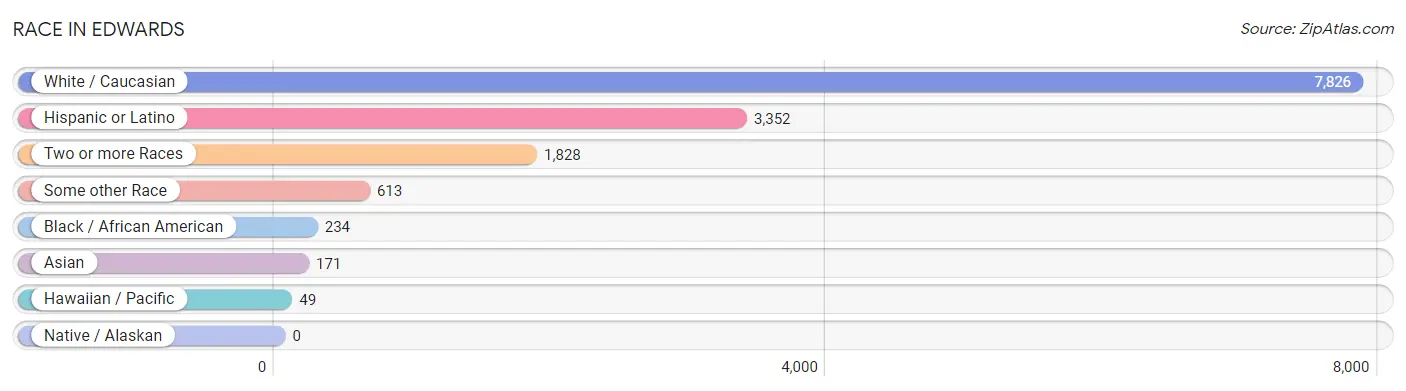
| Race | # Population | % Population |
| Asian | 171 | 1.6% |
| Black / African American | 234 | 2.2% |
| Hawaiian / Pacific | 49 | 0.5% |
| Hispanic or Latino | 3,352 | 31.3% |
| Native / Alaskan | 0 | 0.0% |
| White / Caucasian | 7,826 | 73.0% |
| Two or more Races | 1,828 | 17.1% |
| Some other Race | 613 | 5.7% |
| Total | 10,721 | 100.0% |
Ancestry in Edwards
The most populous ancestries reported in Edwards are Mexican (2,948 | 27.5%), German (1,602 | 14.9%), Irish (1,319 | 12.3%), Italian (885 | 8.3%), and English (872 | 8.1%), together accounting for 71.1% of all Edwards residents.
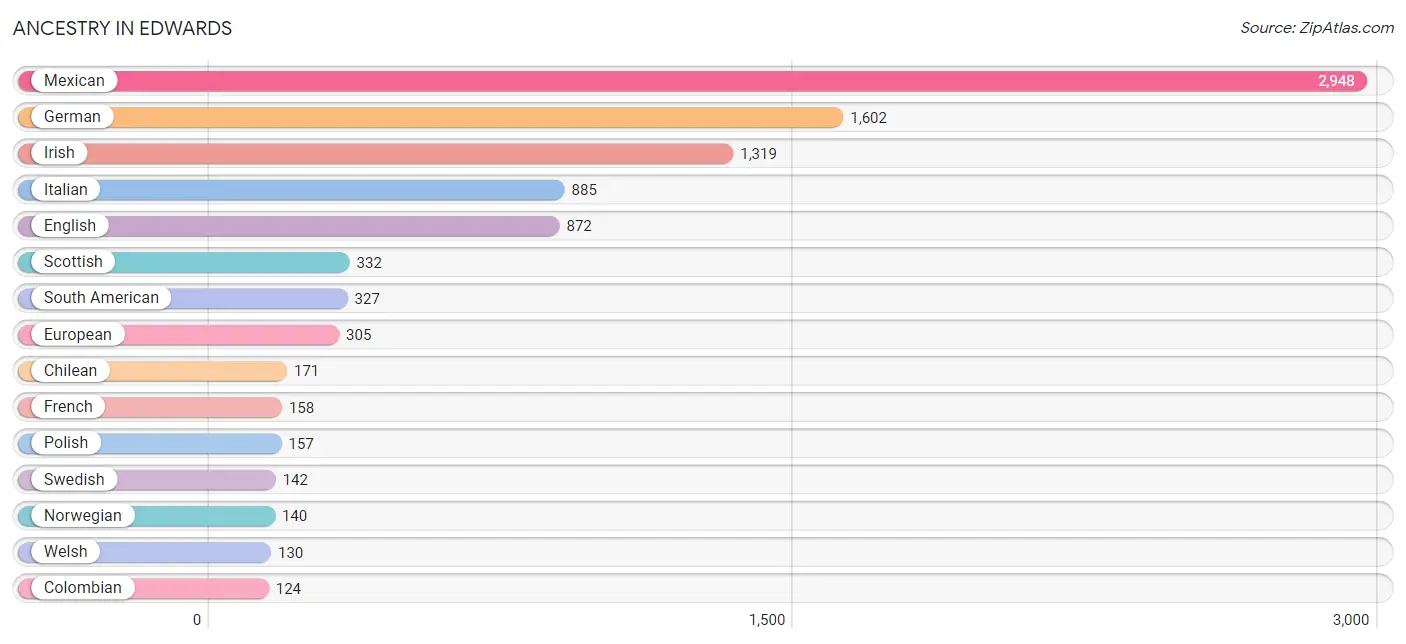
| Ancestry | # Population | % Population |
| American | 116 | 1.1% |
| Argentinean | 32 | 0.3% |
| Australian | 5 | 0.1% |
| Belgian | 16 | 0.2% |
| British | 109 | 1.0% |
| Burmese | 19 | 0.2% |
| Canadian | 53 | 0.5% |
| Central American | 64 | 0.6% |
| Chilean | 171 | 1.6% |
| Colombian | 124 | 1.2% |
| Croatian | 7 | 0.1% |
| Danish | 78 | 0.7% |
| Dutch | 112 | 1.0% |
| Eastern European | 45 | 0.4% |
| English | 872 | 8.1% |
| Estonian | 10 | 0.1% |
| European | 305 | 2.8% |
| French | 158 | 1.5% |
| French Canadian | 53 | 0.5% |
| German | 1,602 | 14.9% |
| Greek | 47 | 0.4% |
| Honduran | 64 | 0.6% |
| Hungarian | 51 | 0.5% |
| Indian (Asian) | 88 | 0.8% |
| Irish | 1,319 | 12.3% |
| Italian | 885 | 8.3% |
| Jamaican | 81 | 0.8% |
| Korean | 56 | 0.5% |
| Lithuanian | 21 | 0.2% |
| Mexican | 2,948 | 27.5% |
| Northern European | 41 | 0.4% |
| Norwegian | 140 | 1.3% |
| Polish | 157 | 1.5% |
| Romanian | 31 | 0.3% |
| Russian | 87 | 0.8% |
| Samoan | 49 | 0.5% |
| Scandinavian | 11 | 0.1% |
| Scotch-Irish | 42 | 0.4% |
| Scottish | 332 | 3.1% |
| Slovene | 29 | 0.3% |
| South American | 327 | 3.0% |
| Spanish | 13 | 0.1% |
| Swedish | 142 | 1.3% |
| Swiss | 39 | 0.4% |
| Thai | 21 | 0.2% |
| Ukrainian | 63 | 0.6% |
| Welsh | 130 | 1.2% | View All 47 Rows |
Immigrants in Edwards
The most numerous immigrant groups reported in Edwards came from Latin America (1,688 | 15.7%), Central America (1,470 | 13.7%), Mexico (1,385 | 12.9%), South America (201 | 1.9%), and Europe (154 | 1.4%), together accounting for 45.7% of all Edwards residents.
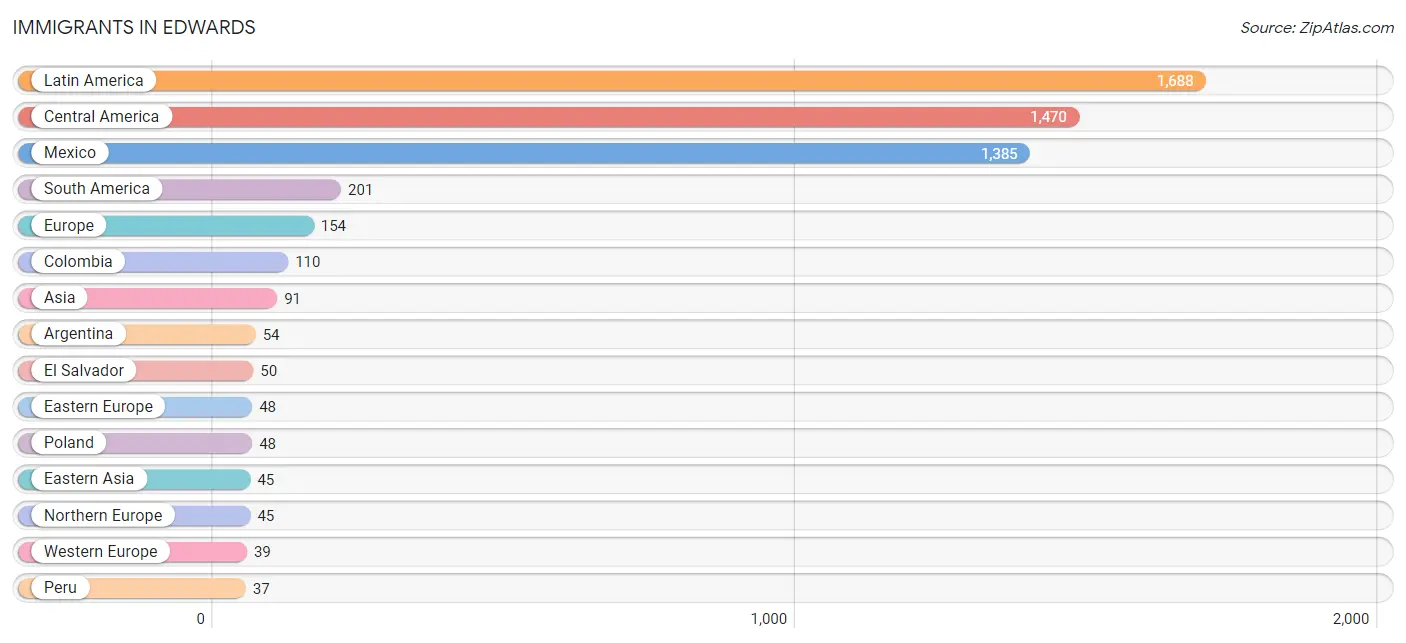
| Immigration Origin | # Population | % Population |
| Argentina | 54 | 0.5% |
| Asia | 91 | 0.9% |
| Belgium | 16 | 0.2% |
| Canada | 35 | 0.3% |
| Caribbean | 17 | 0.2% |
| Central America | 1,470 | 13.7% |
| China | 26 | 0.2% |
| Colombia | 110 | 1.0% |
| Eastern Asia | 45 | 0.4% |
| Eastern Europe | 48 | 0.4% |
| El Salvador | 50 | 0.5% |
| Europe | 154 | 1.4% |
| Honduras | 35 | 0.3% |
| India | 11 | 0.1% |
| Jamaica | 17 | 0.2% |
| Korea | 19 | 0.2% |
| Latin America | 1,688 | 15.7% |
| Mexico | 1,385 | 12.9% |
| Nepal | 25 | 0.2% |
| Northern Europe | 45 | 0.4% |
| Oceania | 15 | 0.1% |
| Peru | 37 | 0.4% |
| Philippines | 10 | 0.1% |
| Poland | 48 | 0.4% |
| Scotland | 32 | 0.3% |
| South America | 201 | 1.9% |
| South Central Asia | 36 | 0.3% |
| South Eastern Asia | 10 | 0.1% |
| Southern Europe | 22 | 0.2% |
| Spain | 22 | 0.2% |
| Sweden | 13 | 0.1% |
| Switzerland | 23 | 0.2% |
| Western Europe | 39 | 0.4% | View All 33 Rows |
Sex and Age in Edwards
Sex and Age in Edwards
The most populous age groups in Edwards are 30 to 34 Years (764 | 13.1%) for men and 50 to 54 Years (409 | 8.4%) for women.
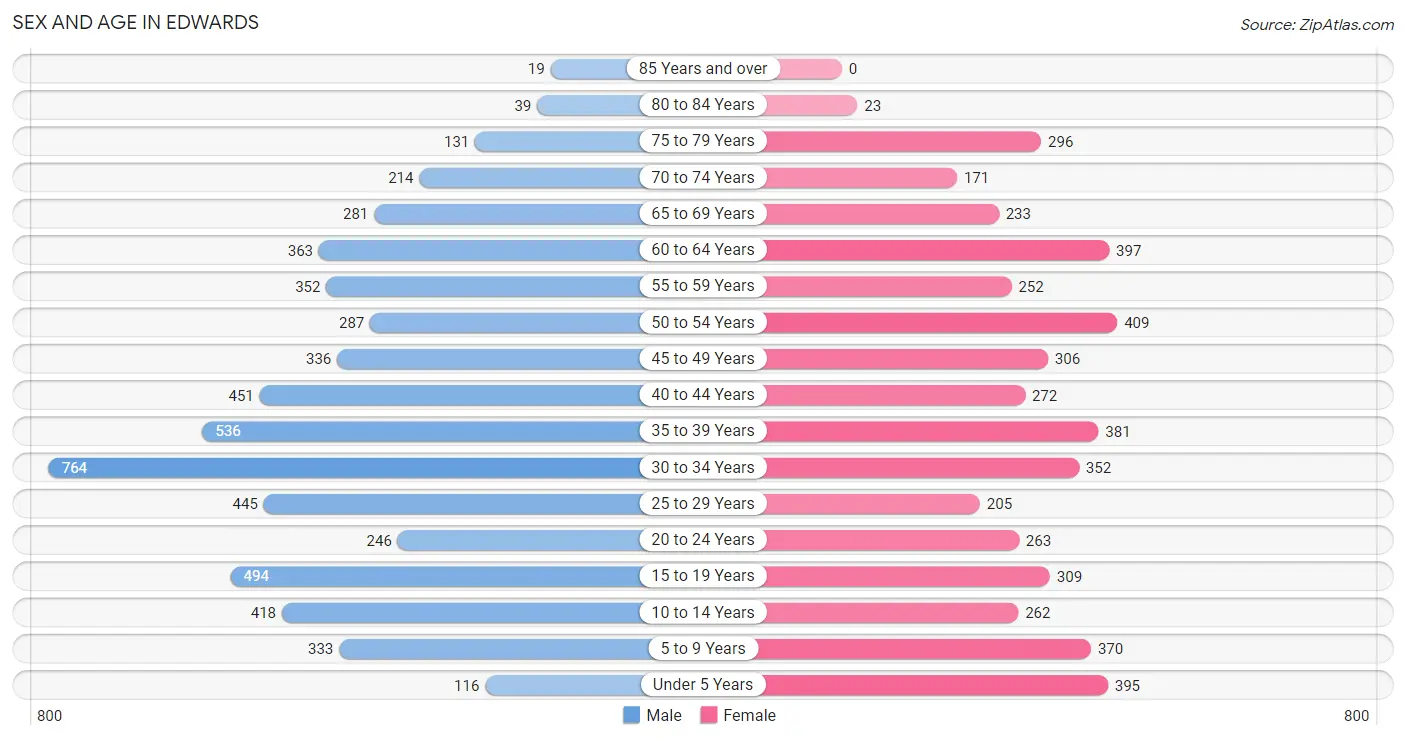
| Age Bracket | Male | Female |
| Under 5 Years | 116 (2.0%) | 395 (8.1%) |
| 5 to 9 Years | 333 (5.7%) | 370 (7.6%) |
| 10 to 14 Years | 418 (7.2%) | 262 (5.3%) |
| 15 to 19 Years | 494 (8.5%) | 309 (6.3%) |
| 20 to 24 Years | 246 (4.2%) | 263 (5.4%) |
| 25 to 29 Years | 445 (7.6%) | 205 (4.2%) |
| 30 to 34 Years | 764 (13.1%) | 352 (7.2%) |
| 35 to 39 Years | 536 (9.2%) | 381 (7.8%) |
| 40 to 44 Years | 451 (7.7%) | 272 (5.6%) |
| 45 to 49 Years | 336 (5.8%) | 306 (6.2%) |
| 50 to 54 Years | 287 (4.9%) | 409 (8.4%) |
| 55 to 59 Years | 352 (6.0%) | 252 (5.1%) |
| 60 to 64 Years | 363 (6.2%) | 397 (8.1%) |
| 65 to 69 Years | 281 (4.8%) | 233 (4.8%) |
| 70 to 74 Years | 214 (3.7%) | 171 (3.5%) |
| 75 to 79 Years | 131 (2.2%) | 296 (6.0%) |
| 80 to 84 Years | 39 (0.7%) | 23 (0.5%) |
| 85 Years and over | 19 (0.3%) | 0 (0.0%) |
| Total | 5,825 (100.0%) | 4,896 (100.0%) |
Families and Households in Edwards
Median Family Size in Edwards
The median family size in Edwards is 3.21 persons per family, with single male/father families (132 | 5.3%) accounting for the largest median family size of 5.01 persons per family. On the other hand, married-couple families (2,090 | 84.6%) represent the smallest median family size with 3.08 persons per family.
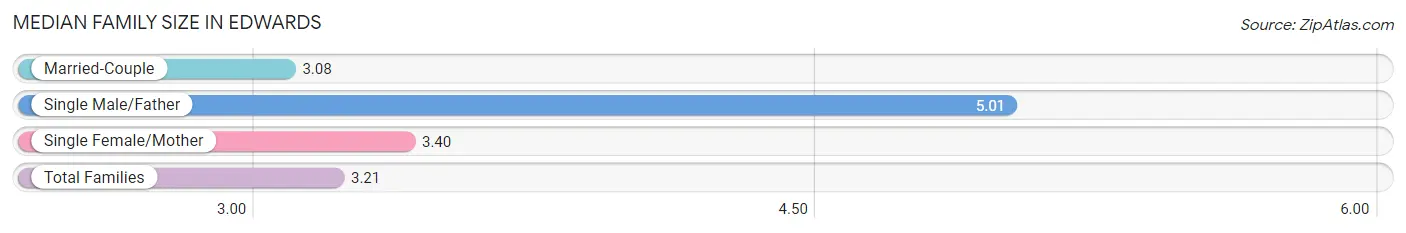
| Family Type | # Families | Family Size |
| Married-Couple | 2,090 (84.6%) | 3.08 |
| Single Male/Father | 132 (5.3%) | 5.01 |
| Single Female/Mother | 250 (10.1%) | 3.40 |
| Total Families | 2,472 (100.0%) | 3.21 |
Median Household Size in Edwards
The median household size in Edwards is 2.80 persons per household, with single male/father households (132 | 3.5%) accounting for the largest median household size of 5.36 persons per household. non-family households (1,352 | 35.4%) represent the smallest median household size with 1.73 persons per household.
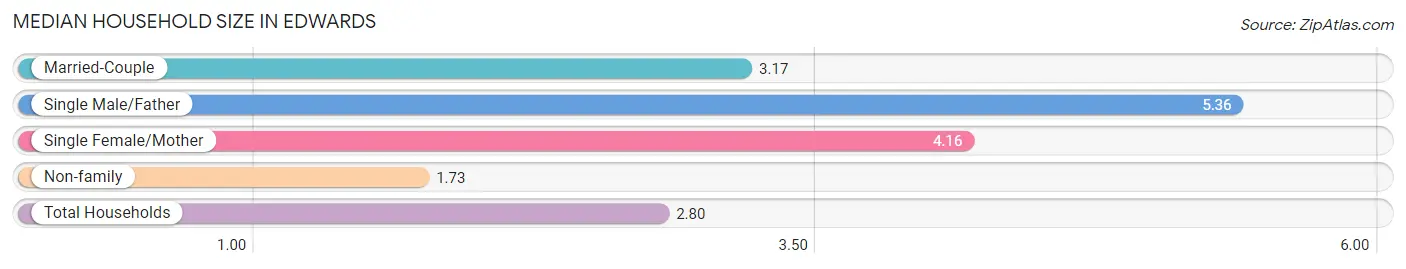
| Household Type | # Households | Household Size |
| Married-Couple | 2,090 (54.6%) | 3.17 |
| Single Male/Father | 132 (3.5%) | 5.36 |
| Single Female/Mother | 250 (6.5%) | 4.16 |
| Non-family | 1,352 (35.4%) | 1.73 |
| Total Households | 3,824 (100.0%) | 2.80 |
Household Size by Marriage Status in Edwards
Out of a total of 3,824 households in Edwards, 2,472 (64.6%) are family households, while 1,352 (35.4%) are nonfamily households. The most numerous type of family households are 2-person households, comprising 1,027, and the most common type of nonfamily households are 1-person households, comprising 997.
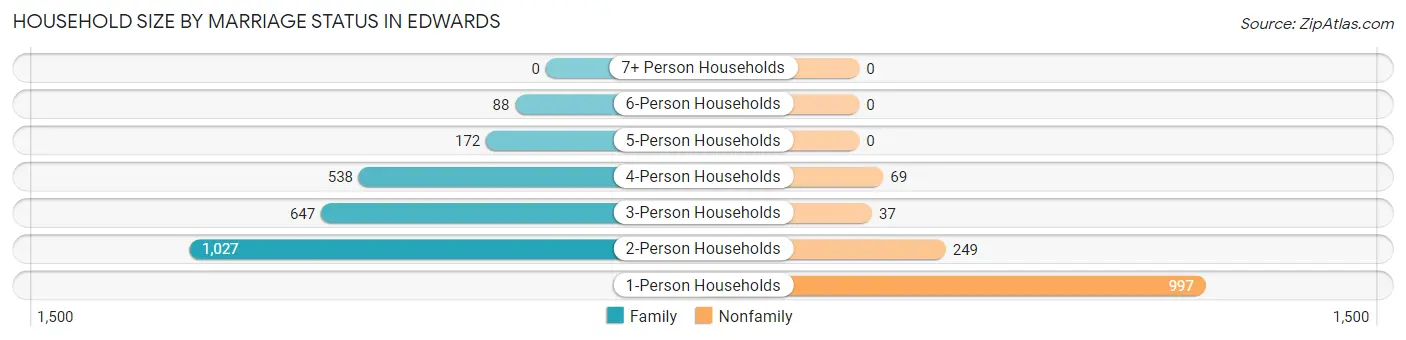
| Household Size | Family Households | Nonfamily Households |
| 1-Person Households | - | 997 (26.1%) |
| 2-Person Households | 1,027 (26.9%) | 249 (6.5%) |
| 3-Person Households | 647 (16.9%) | 37 (1.0%) |
| 4-Person Households | 538 (14.1%) | 69 (1.8%) |
| 5-Person Households | 172 (4.5%) | 0 (0.0%) |
| 6-Person Households | 88 (2.3%) | 0 (0.0%) |
| 7+ Person Households | 0 (0.0%) | 0 (0.0%) |
| Total | 2,472 (64.6%) | 1,352 (35.4%) |
Female Fertility in Edwards
Fertility by Age in Edwards
Average fertility rate in Edwards is 51.0 births per 1,000 women. Women in the age bracket of 20 to 34 years have the highest fertility rate with 78.0 births per 1,000 women. Women in the age bracket of 20 to 34 years acount for 57.1% of all women with births.
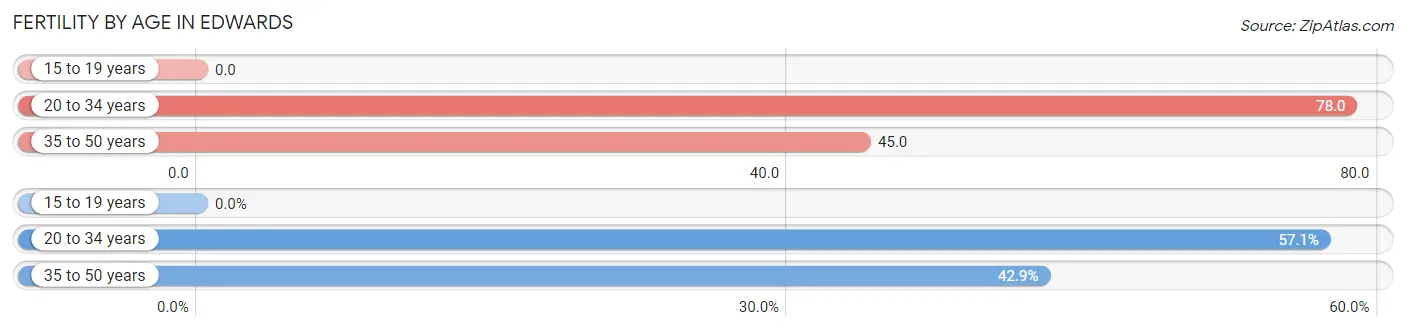
| Age Bracket | Women with Births | Births / 1,000 Women |
| 15 to 19 years | 0 (0.0%) | 0.0 |
| 20 to 34 years | 64 (57.1%) | 78.0 |
| 35 to 50 years | 48 (42.9%) | 45.0 |
| Total | 112 (100.0%) | 51.0 |
Fertility by Age by Marriage Status in Edwards
67.9% of women with births (112) in Edwards are married. The highest percentage of unmarried women with births falls into 20 to 34 years age bracket with 56.2% of them unmarried at the time of birth, while the lowest percentage of unmarried women with births belong to 35 to 50 years age bracket with 0.0% of them unmarried.
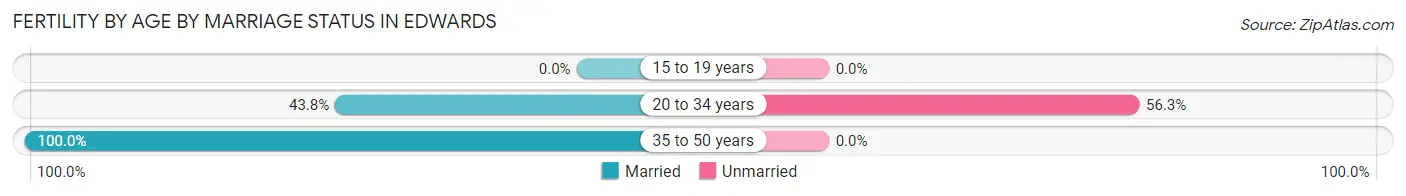
| Age Bracket | Married | Unmarried |
| 15 to 19 years | 0 (0.0%) | 0 (0.0%) |
| 20 to 34 years | 28 (43.8%) | 36 (56.2%) |
| 35 to 50 years | 48 (100.0%) | 0 (0.0%) |
| Total | 76 (67.9%) | 36 (32.1%) |
Fertility by Education in Edwards
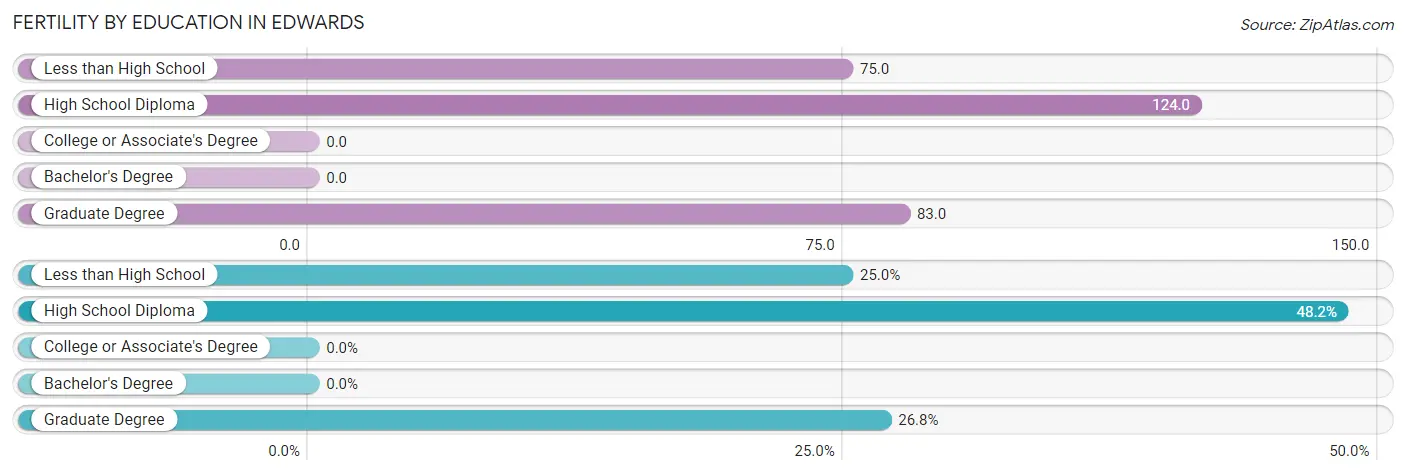
| Educational Attainment | Women with Births | Births / 1,000 Women |
| Less than High School | 28 (25.0%) | 75.0 |
| High School Diploma | 54 (48.2%) | 124.0 |
| College or Associate's Degree | 0 (0.0%) | 0.0 |
| Bachelor's Degree | 0 (0.0%) | 0.0 |
| Graduate Degree | 30 (26.8%) | 83.0 |
| Total | 112 (100.0%) | 51.0 |
Fertility by Education by Marriage Status in Edwards
32.1% of women with births in Edwards are unmarried. Women with the educational attainment of less than high school are most likely to be married with 100.0% of them married at childbirth, while women with the educational attainment of high school diploma are least likely to be married with 66.7% of them unmarried at childbirth.
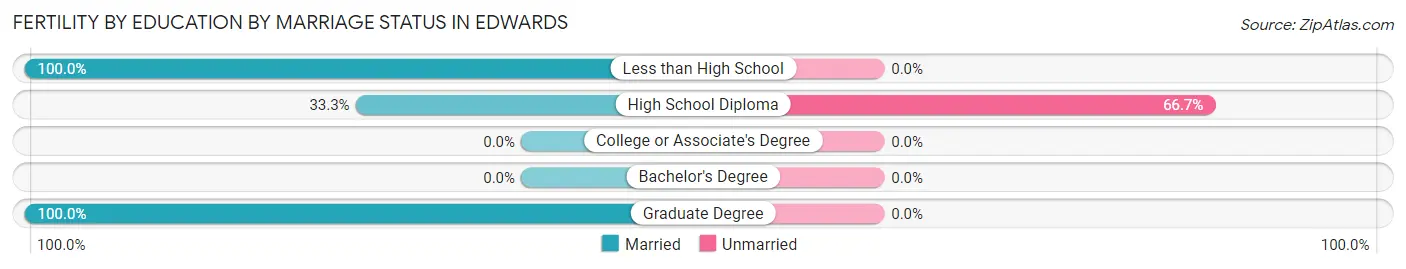
| Educational Attainment | Married | Unmarried |
| Less than High School | 28 (100.0%) | 0 (0.0%) |
| High School Diploma | 18 (33.3%) | 36 (66.7%) |
| College or Associate's Degree | 0 (0.0%) | 0 (0.0%) |
| Bachelor's Degree | 0 (0.0%) | 0 (0.0%) |
| Graduate Degree | 30 (100.0%) | 0 (0.0%) |
| Total | 76 (67.9%) | 36 (32.1%) |
Employment Characteristics in Edwards
Employment by Class of Employer in Edwards
Among the 5,704 employed individuals in Edwards, private company employees (3,817 | 66.9%), local government employees (556 | 9.8%), and not-for-profit organizations (533 | 9.3%) make up the most common classes of employment.
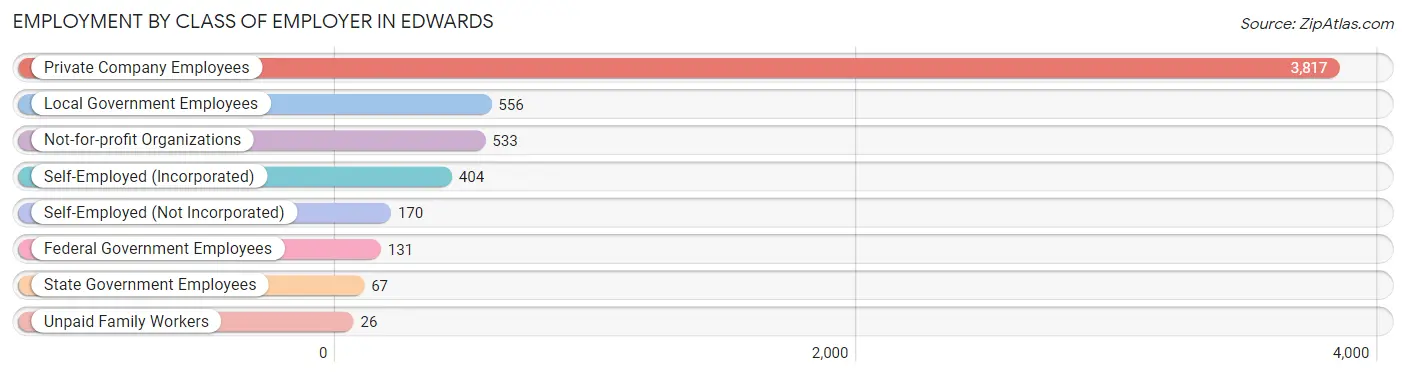
| Employer Class | # Employees | % Employees |
| Private Company Employees | 3,817 | 66.9% |
| Self-Employed (Incorporated) | 404 | 7.1% |
| Self-Employed (Not Incorporated) | 170 | 3.0% |
| Not-for-profit Organizations | 533 | 9.3% |
| Local Government Employees | 556 | 9.8% |
| State Government Employees | 67 | 1.2% |
| Federal Government Employees | 131 | 2.3% |
| Unpaid Family Workers | 26 | 0.5% |
| Total | 5,704 | 100.0% |
Employment Status by Age in Edwards
According to the labor force statistics for Edwards, out of the total population over 16 years of age (8,668), 71.4% or 6,189 individuals are in the labor force, with 7.8% or 483 of them unemployed. The age group with the highest labor force participation rate is 20 to 24 years, with 97.4% or 496 individuals in the labor force. Within the labor force, the 25 to 29 years age range has the highest percentage of unemployed individuals, with 44.6% or 282 of them being unemployed.
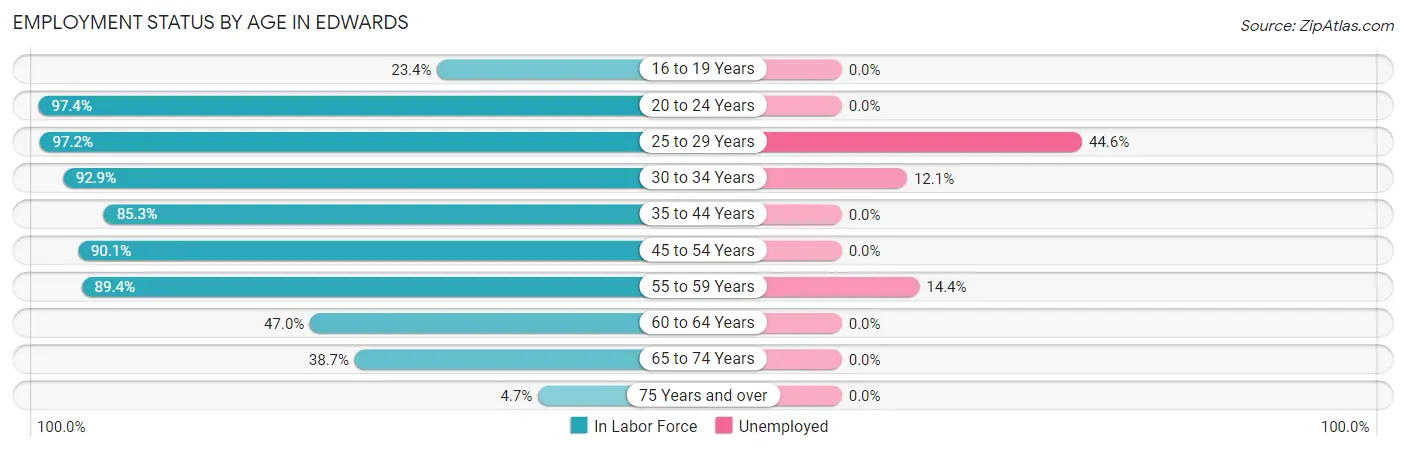
| Age Bracket | In Labor Force | Unemployed |
| 16 to 19 Years | 151 (23.4%) | 0 (0.0%) |
| 20 to 24 Years | 496 (97.4%) | 0 (0.0%) |
| 25 to 29 Years | 632 (97.2%) | 282 (44.6%) |
| 30 to 34 Years | 1,037 (92.9%) | 125 (12.1%) |
| 35 to 44 Years | 1,399 (85.3%) | 0 (0.0%) |
| 45 to 54 Years | 1,206 (90.1%) | 0 (0.0%) |
| 55 to 59 Years | 540 (89.4%) | 78 (14.4%) |
| 60 to 64 Years | 357 (47.0%) | 0 (0.0%) |
| 65 to 74 Years | 348 (38.7%) | 0 (0.0%) |
| 75 Years and over | 24 (4.7%) | 0 (0.0%) |
| Total | 6,189 (71.4%) | 483 (7.8%) |
Employment Status by Educational Attainment in Edwards
According to labor force statistics for Edwards, 84.6% of individuals (5,167) out of the total population between 25 and 64 years of age (6,108) are in the labor force, with 9.4% or 486 of them being unemployed. The group with the highest labor force participation rate are those with the educational attainment of college / associate degree, with 90.6% or 1,039 individuals in the labor force. Within the labor force, individuals with less than high school education have the highest percentage of unemployment, with 27.0% or 125 of them being unemployed.
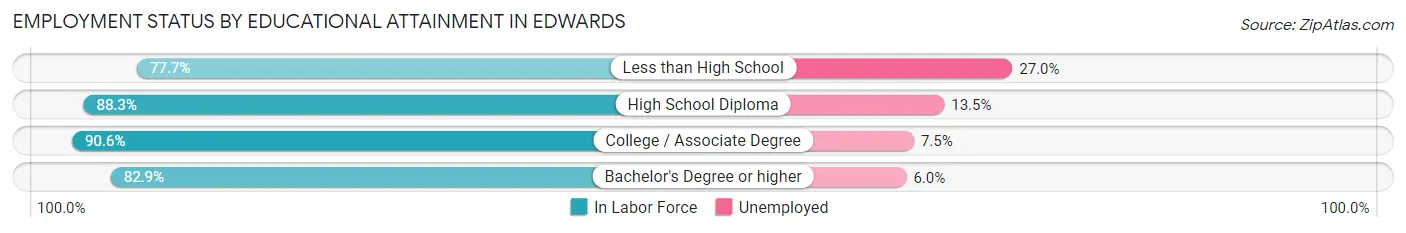
| Educational Attainment | In Labor Force | Unemployed |
| Less than High School | 463 (77.7%) | 161 (27.0%) |
| High School Diploma | 820 (88.3%) | 125 (13.5%) |
| College / Associate Degree | 1,039 (90.6%) | 86 (7.5%) |
| Bachelor's Degree or higher | 2,848 (82.9%) | 206 (6.0%) |
| Total | 5,167 (84.6%) | 574 (9.4%) |
Employment Occupations by Sex in Edwards
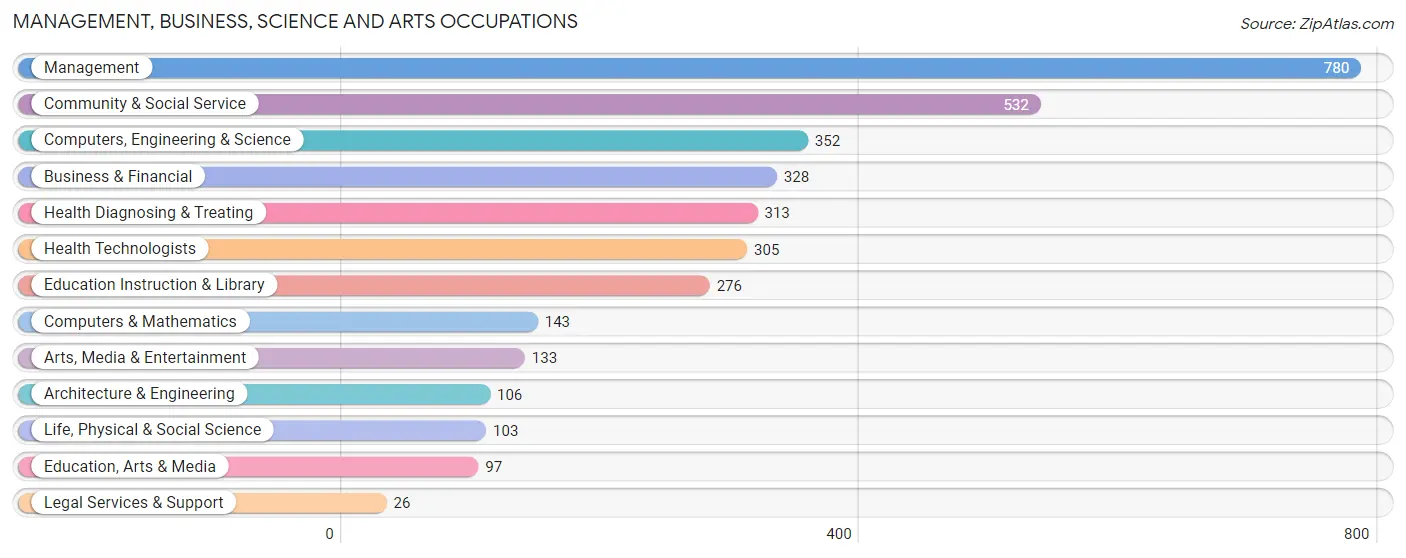
Management, Business, Science and Arts Occupations
The most common Management, Business, Science and Arts occupations in Edwards are Management (780 | 13.7%), Community & Social Service (532 | 9.3%), Computers, Engineering & Science (352 | 6.2%), Business & Financial (328 | 5.8%), and Health Diagnosing & Treating (313 | 5.5%).
Management, Business, Science and Arts Occupations by Sex
Within the Management, Business, Science and Arts occupations in Edwards, the most male-oriented occupations are Architecture & Engineering (100.0%), Legal Services & Support (100.0%), and Management (72.4%), while the most female-oriented occupations are Education, Arts & Media (100.0%), Education Instruction & Library (100.0%), and Community & Social Service (84.6%).
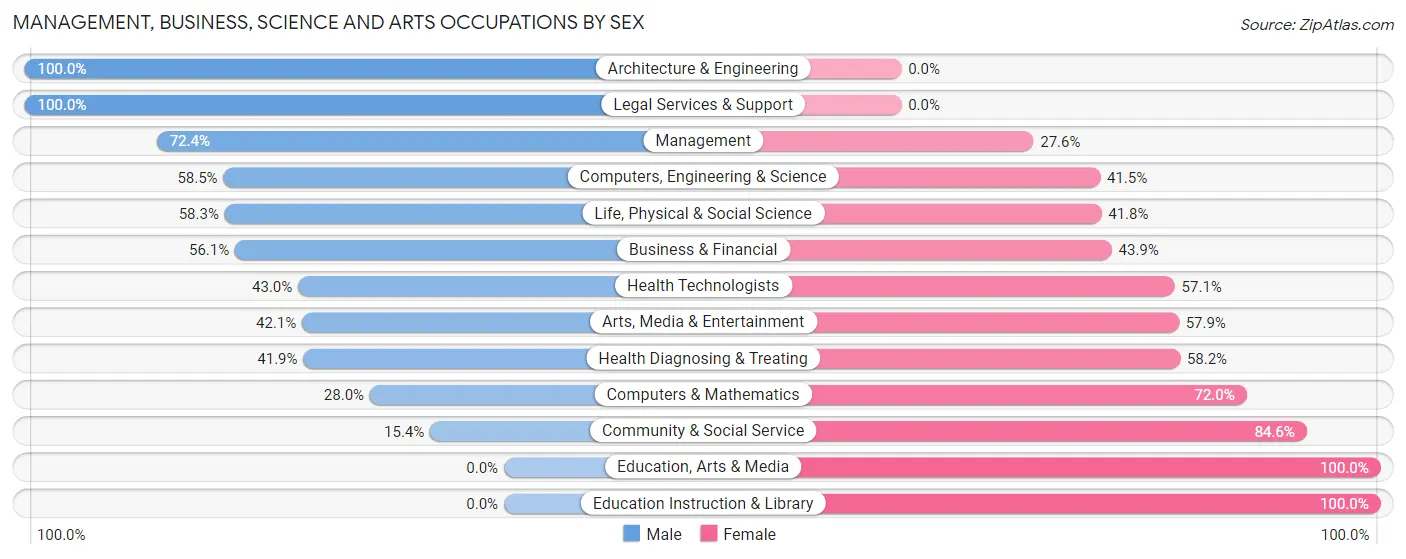
| Occupation | Male | Female |
| Management | 565 (72.4%) | 215 (27.6%) |
| Business & Financial | 184 (56.1%) | 144 (43.9%) |
| Computers, Engineering & Science | 206 (58.5%) | 146 (41.5%) |
| Computers & Mathematics | 40 (28.0%) | 103 (72.0%) |
| Architecture & Engineering | 106 (100.0%) | 0 (0.0%) |
| Life, Physical & Social Science | 60 (58.3%) | 43 (41.7%) |
| Community & Social Service | 82 (15.4%) | 450 (84.6%) |
| Education, Arts & Media | 0 (0.0%) | 97 (100.0%) |
| Legal Services & Support | 26 (100.0%) | 0 (0.0%) |
| Education Instruction & Library | 0 (0.0%) | 276 (100.0%) |
| Arts, Media & Entertainment | 56 (42.1%) | 77 (57.9%) |
| Health Diagnosing & Treating | 131 (41.8%) | 182 (58.2%) |
| Health Technologists | 131 (42.9%) | 174 (57.1%) |
| Total (Category) | 1,168 (50.7%) | 1,137 (49.3%) |
| Total (Overall) | 3,322 (58.2%) | 2,382 (41.8%) |
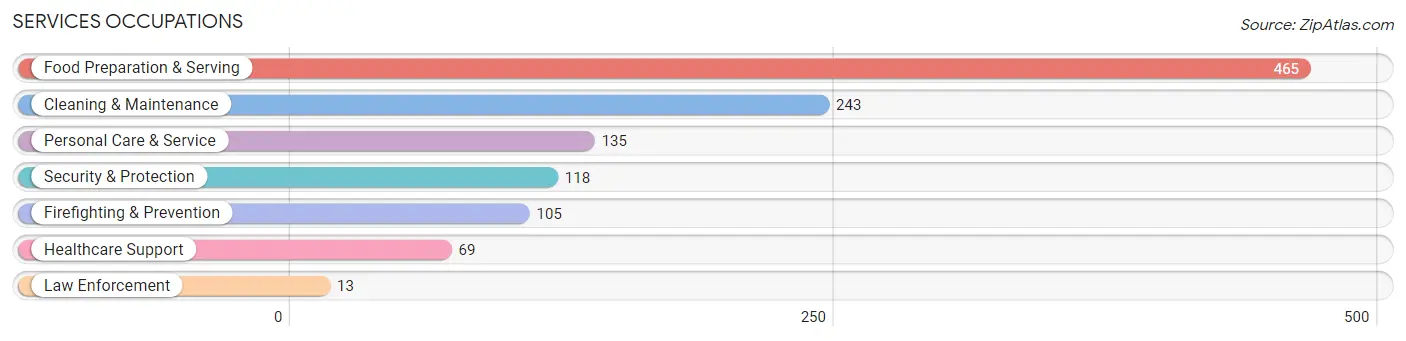
Services Occupations
The most common Services occupations in Edwards are Food Preparation & Serving (465 | 8.2%), Cleaning & Maintenance (243 | 4.3%), Personal Care & Service (135 | 2.4%), Security & Protection (118 | 2.1%), and Firefighting & Prevention (105 | 1.8%).
Services Occupations by Sex
Within the Services occupations in Edwards, the most male-oriented occupations are Firefighting & Prevention (100.0%), Security & Protection (89.0%), and Healthcare Support (60.9%), while the most female-oriented occupations are Law Enforcement (100.0%), Personal Care & Service (92.6%), and Cleaning & Maintenance (51.0%).
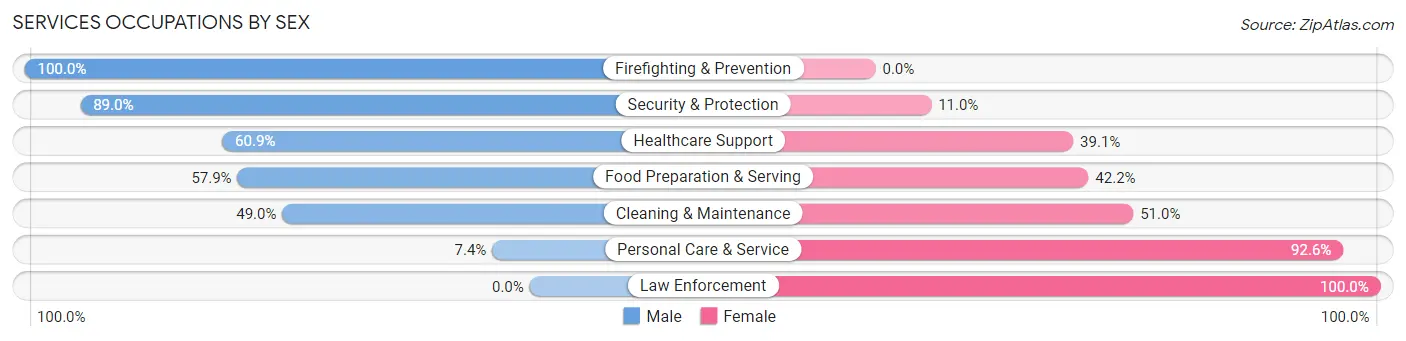
| Occupation | Male | Female |
| Healthcare Support | 42 (60.9%) | 27 (39.1%) |
| Security & Protection | 105 (89.0%) | 13 (11.0%) |
| Firefighting & Prevention | 105 (100.0%) | 0 (0.0%) |
| Law Enforcement | 0 (0.0%) | 13 (100.0%) |
| Food Preparation & Serving | 269 (57.9%) | 196 (42.1%) |
| Cleaning & Maintenance | 119 (49.0%) | 124 (51.0%) |
| Personal Care & Service | 10 (7.4%) | 125 (92.6%) |
| Total (Category) | 545 (52.9%) | 485 (47.1%) |
| Total (Overall) | 3,322 (58.2%) | 2,382 (41.8%) |
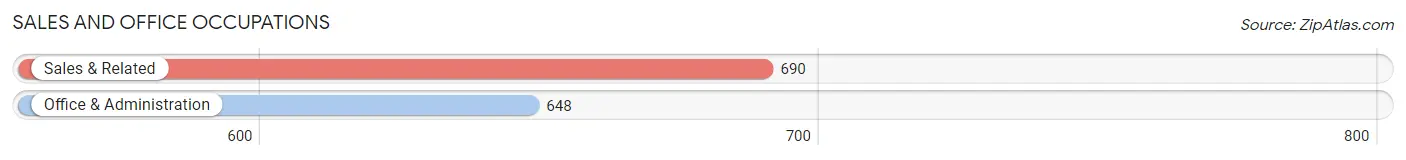
Sales and Office Occupations
The most common Sales and Office occupations in Edwards are Sales & Related (690 | 12.1%), and Office & Administration (648 | 11.4%).
Sales and Office Occupations by Sex
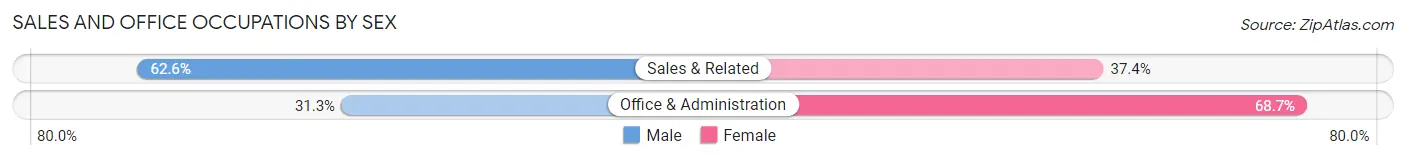
| Occupation | Male | Female |
| Sales & Related | 432 (62.6%) | 258 (37.4%) |
| Office & Administration | 203 (31.3%) | 445 (68.7%) |
| Total (Category) | 635 (47.5%) | 703 (52.5%) |
| Total (Overall) | 3,322 (58.2%) | 2,382 (41.8%) |
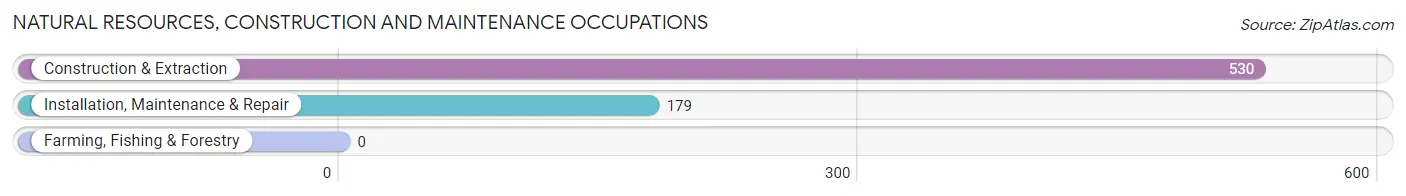
Natural Resources, Construction and Maintenance Occupations
The most common Natural Resources, Construction and Maintenance occupations in Edwards are Construction & Extraction (530 | 9.3%), and Installation, Maintenance & Repair (179 | 3.1%).
Natural Resources, Construction and Maintenance Occupations by Sex
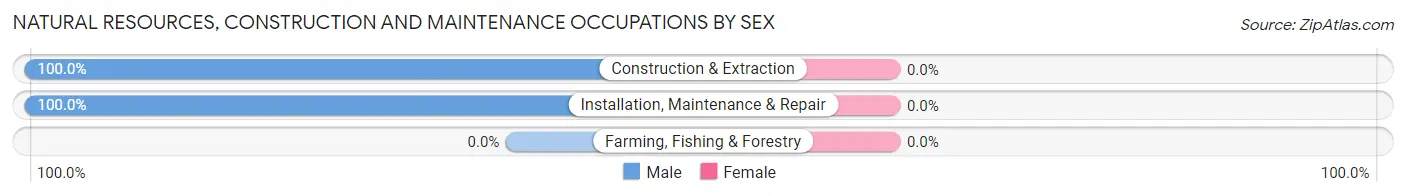
| Occupation | Male | Female |
| Farming, Fishing & Forestry | 0 (0.0%) | 0 (0.0%) |
| Construction & Extraction | 530 (100.0%) | 0 (0.0%) |
| Installation, Maintenance & Repair | 179 (100.0%) | 0 (0.0%) |
| Total (Category) | 709 (100.0%) | 0 (0.0%) |
| Total (Overall) | 3,322 (58.2%) | 2,382 (41.8%) |
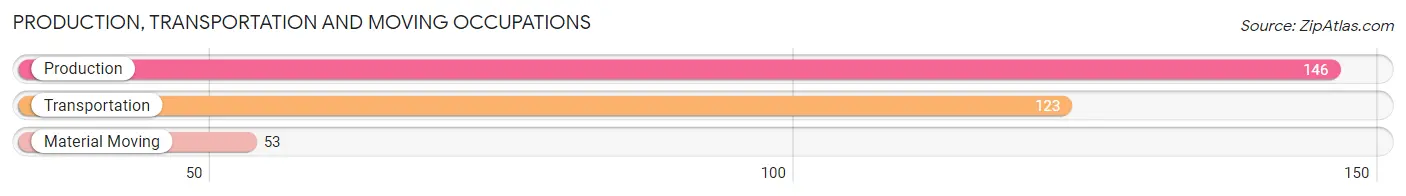
Production, Transportation and Moving Occupations
The most common Production, Transportation and Moving occupations in Edwards are Production (146 | 2.6%), Transportation (123 | 2.2%), and Material Moving (53 | 0.9%).
Production, Transportation and Moving Occupations by Sex
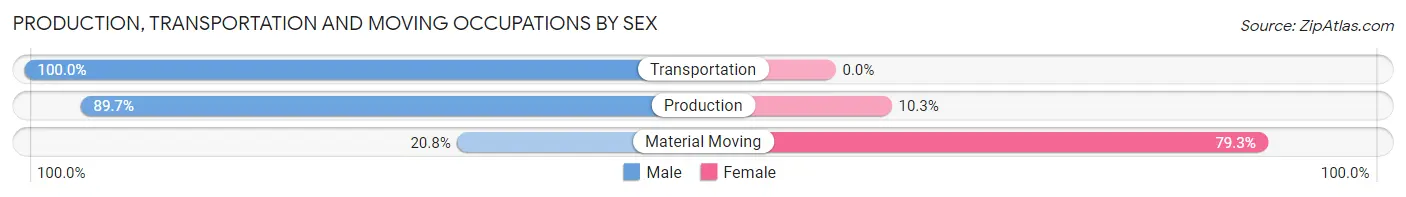
| Occupation | Male | Female |
| Production | 131 (89.7%) | 15 (10.3%) |
| Transportation | 123 (100.0%) | 0 (0.0%) |
| Material Moving | 11 (20.7%) | 42 (79.2%) |
| Total (Category) | 265 (82.3%) | 57 (17.7%) |
| Total (Overall) | 3,322 (58.2%) | 2,382 (41.8%) |
Employment Industries by Sex in Edwards
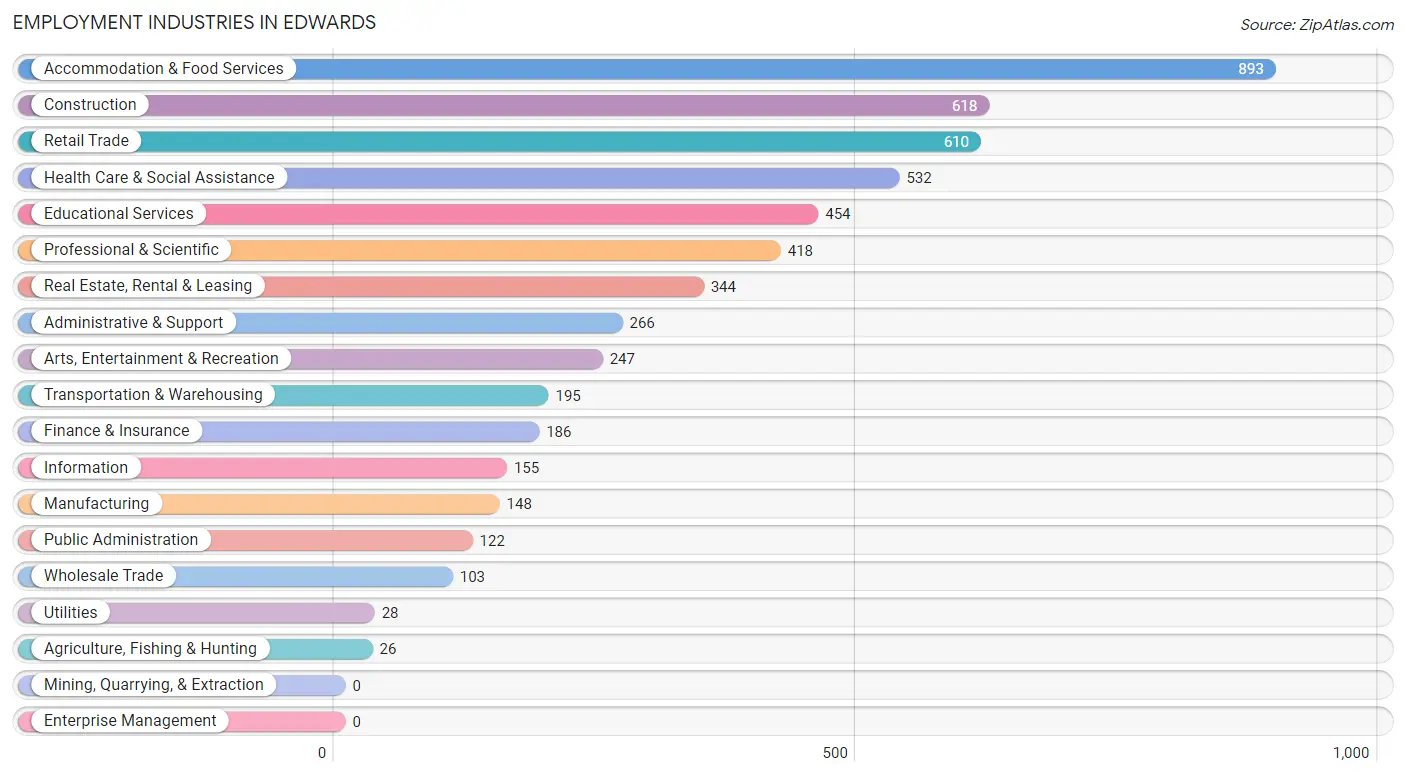
Employment Industries in Edwards
The major employment industries in Edwards include Accommodation & Food Services (893 | 15.7%), Construction (618 | 10.8%), Retail Trade (610 | 10.7%), Health Care & Social Assistance (532 | 9.3%), and Educational Services (454 | 8.0%).
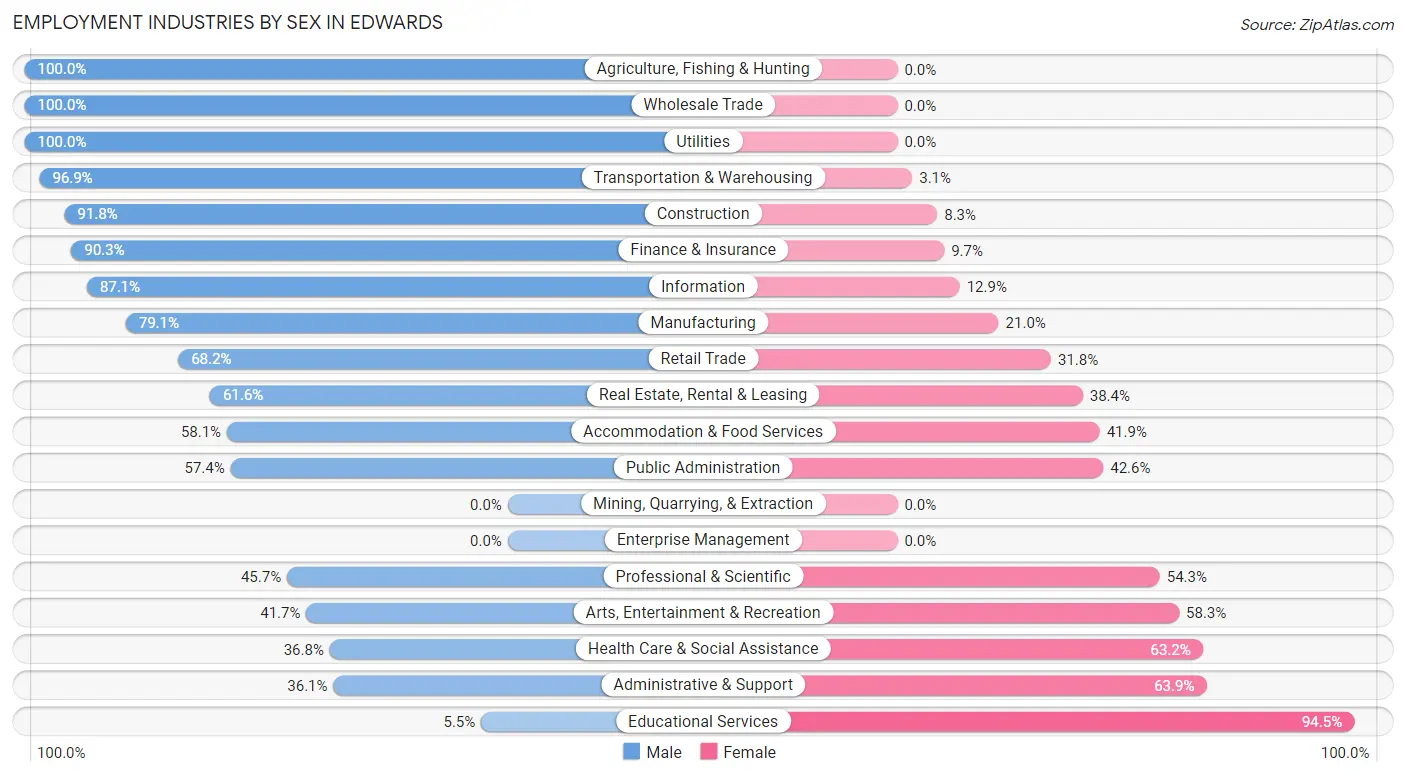
Employment Industries by Sex in Edwards
The Edwards industries that see more men than women are Agriculture, Fishing & Hunting (100.0%), Wholesale Trade (100.0%), and Utilities (100.0%), whereas the industries that tend to have a higher number of women are Educational Services (94.5%), Administrative & Support (63.9%), and Health Care & Social Assistance (63.2%).
| Industry | Male | Female |
| Agriculture, Fishing & Hunting | 26 (100.0%) | 0 (0.0%) |
| Mining, Quarrying, & Extraction | 0 (0.0%) | 0 (0.0%) |
| Construction | 567 (91.7%) | 51 (8.3%) |
| Manufacturing | 117 (79.0%) | 31 (20.9%) |
| Wholesale Trade | 103 (100.0%) | 0 (0.0%) |
| Retail Trade | 416 (68.2%) | 194 (31.8%) |
| Transportation & Warehousing | 189 (96.9%) | 6 (3.1%) |
| Utilities | 28 (100.0%) | 0 (0.0%) |
| Information | 135 (87.1%) | 20 (12.9%) |
| Finance & Insurance | 168 (90.3%) | 18 (9.7%) |
| Real Estate, Rental & Leasing | 212 (61.6%) | 132 (38.4%) |
| Professional & Scientific | 191 (45.7%) | 227 (54.3%) |
| Enterprise Management | 0 (0.0%) | 0 (0.0%) |
| Administrative & Support | 96 (36.1%) | 170 (63.9%) |
| Educational Services | 25 (5.5%) | 429 (94.5%) |
| Health Care & Social Assistance | 196 (36.8%) | 336 (63.2%) |
| Arts, Entertainment & Recreation | 103 (41.7%) | 144 (58.3%) |
| Accommodation & Food Services | 519 (58.1%) | 374 (41.9%) |
| Public Administration | 70 (57.4%) | 52 (42.6%) |
| Total | 3,322 (58.2%) | 2,382 (41.8%) |
Education in Edwards
School Enrollment in Edwards
The most common levels of schooling among the 2,598 students in Edwards are high school (571 | 22.0%), college / undergraduate (533 | 20.5%), and middle school (530 | 20.4%).
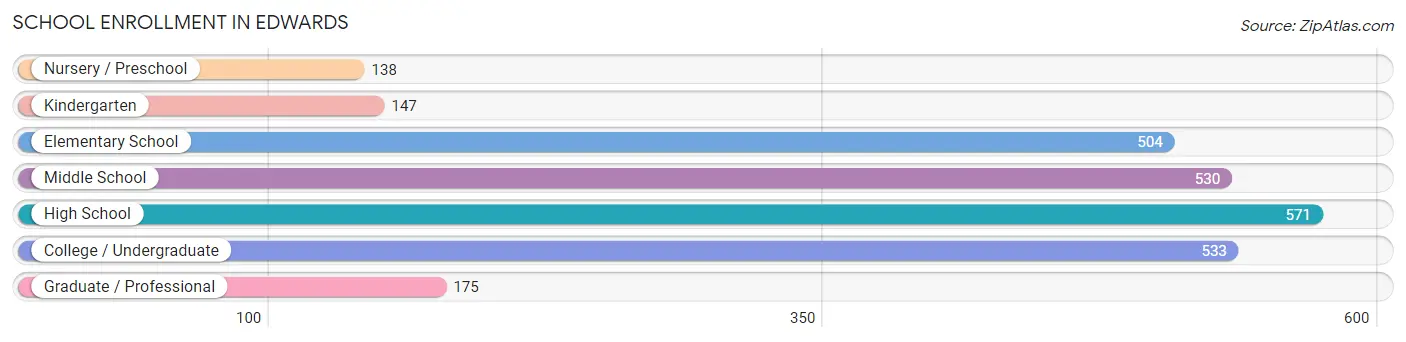
| School Level | # Students | % Students |
| Nursery / Preschool | 138 | 5.3% |
| Kindergarten | 147 | 5.7% |
| Elementary School | 504 | 19.4% |
| Middle School | 530 | 20.4% |
| High School | 571 | 22.0% |
| College / Undergraduate | 533 | 20.5% |
| Graduate / Professional | 175 | 6.7% |
| Total | 2,598 | 100.0% |
School Enrollment by Age by Funding Source in Edwards
Out of a total of 2,598 students who are enrolled in schools in Edwards, 460 (17.7%) attend a private institution, while the remaining 2,138 (82.3%) are enrolled in public schools. The age group of 3 to 4 year olds has the highest likelihood of being enrolled in private schools, with 82 (71.3% in the age bracket) enrolled. Conversely, the age group of 20 to 24 year olds has the lowest likelihood of being enrolled in a private school, with 118 (100.0% in the age bracket) attending a public institution.
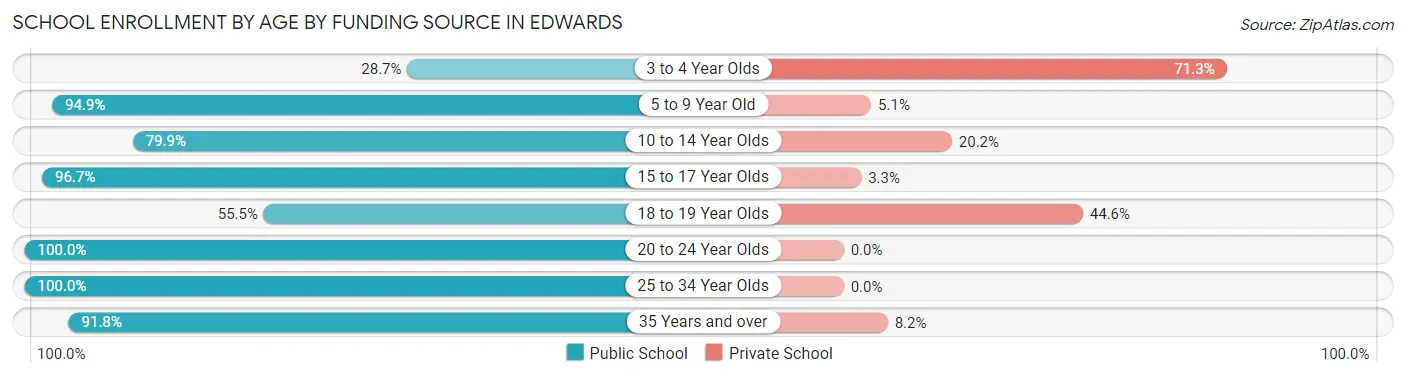
| Age Bracket | Public School | Private School |
| 3 to 4 Year Olds | 33 (28.7%) | 82 (71.3%) |
| 5 to 9 Year Old | 630 (94.9%) | 34 (5.1%) |
| 10 to 14 Year Olds | 543 (79.8%) | 137 (20.2%) |
| 15 to 17 Year Olds | 386 (96.7%) | 13 (3.3%) |
| 18 to 19 Year Olds | 224 (55.4%) | 180 (44.6%) |
| 20 to 24 Year Olds | 118 (100.0%) | 0 (0.0%) |
| 25 to 34 Year Olds | 35 (100.0%) | 0 (0.0%) |
| 35 Years and over | 168 (91.8%) | 15 (8.2%) |
| Total | 2,138 (82.3%) | 460 (17.7%) |
Educational Attainment by Field of Study in Edwards
Business (1,125 | 23.1%), engineering (563 | 11.6%), science & technology (491 | 10.1%), psychology (486 | 10.0%), and bio, nature & agricultural (422 | 8.7%) are the most common fields of study among 4,869 individuals in Edwards who have obtained a bachelor's degree or higher.
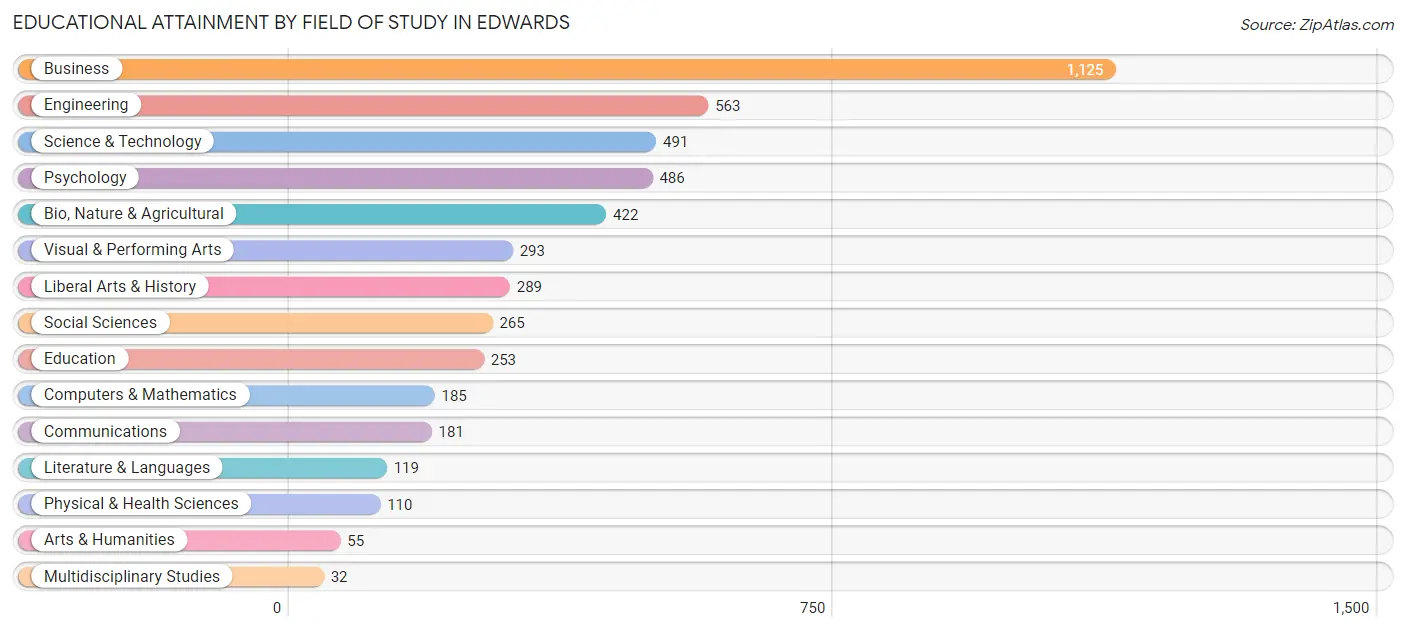
| Field of Study | # Graduates | % Graduates |
| Computers & Mathematics | 185 | 3.8% |
| Bio, Nature & Agricultural | 422 | 8.7% |
| Physical & Health Sciences | 110 | 2.3% |
| Psychology | 486 | 10.0% |
| Social Sciences | 265 | 5.4% |
| Engineering | 563 | 11.6% |
| Multidisciplinary Studies | 32 | 0.7% |
| Science & Technology | 491 | 10.1% |
| Business | 1,125 | 23.1% |
| Education | 253 | 5.2% |
| Literature & Languages | 119 | 2.4% |
| Liberal Arts & History | 289 | 5.9% |
| Visual & Performing Arts | 293 | 6.0% |
| Communications | 181 | 3.7% |
| Arts & Humanities | 55 | 1.1% |
| Total | 4,869 | 100.0% |
Transportation & Commute in Edwards
Vehicle Availability by Sex in Edwards
The most prevalent vehicle ownership categories in Edwards are males with 2 vehicles (1,512, accounting for 45.5%) and females with 2 vehicles (1,180, making up 63.5%).
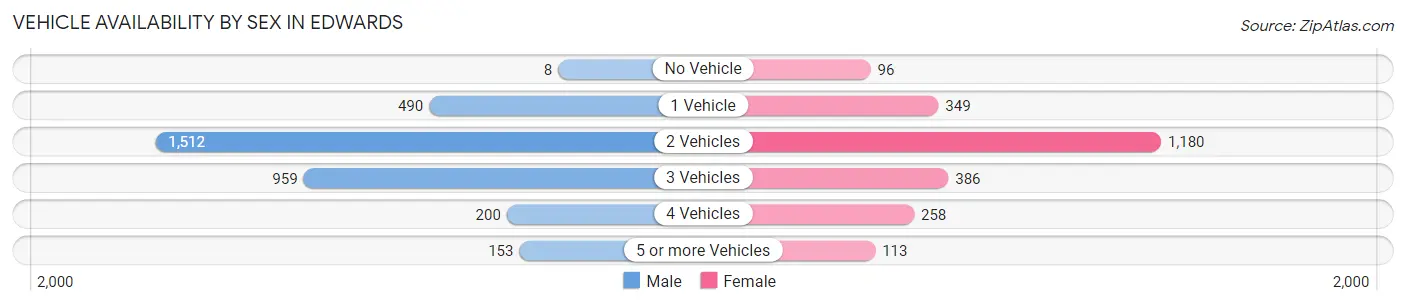
| Vehicles Available | Male | Female |
| No Vehicle | 8 (0.2%) | 96 (4.0%) |
| 1 Vehicle | 490 (14.7%) | 349 (14.6%) |
| 2 Vehicles | 1,512 (45.5%) | 1,180 (49.5%) |
| 3 Vehicles | 959 (28.9%) | 386 (16.2%) |
| 4 Vehicles | 200 (6.0%) | 258 (10.8%) |
| 5 or more Vehicles | 153 (4.6%) | 113 (4.7%) |
| Total | 3,322 (100.0%) | 2,382 (100.0%) |
Commute Time in Edwards
The most frequently occuring commute durations in Edwards are 20 to 24 minutes (1,291 commuters, 27.9%), 15 to 19 minutes (852 commuters, 18.4%), and 10 to 14 minutes (821 commuters, 17.7%).
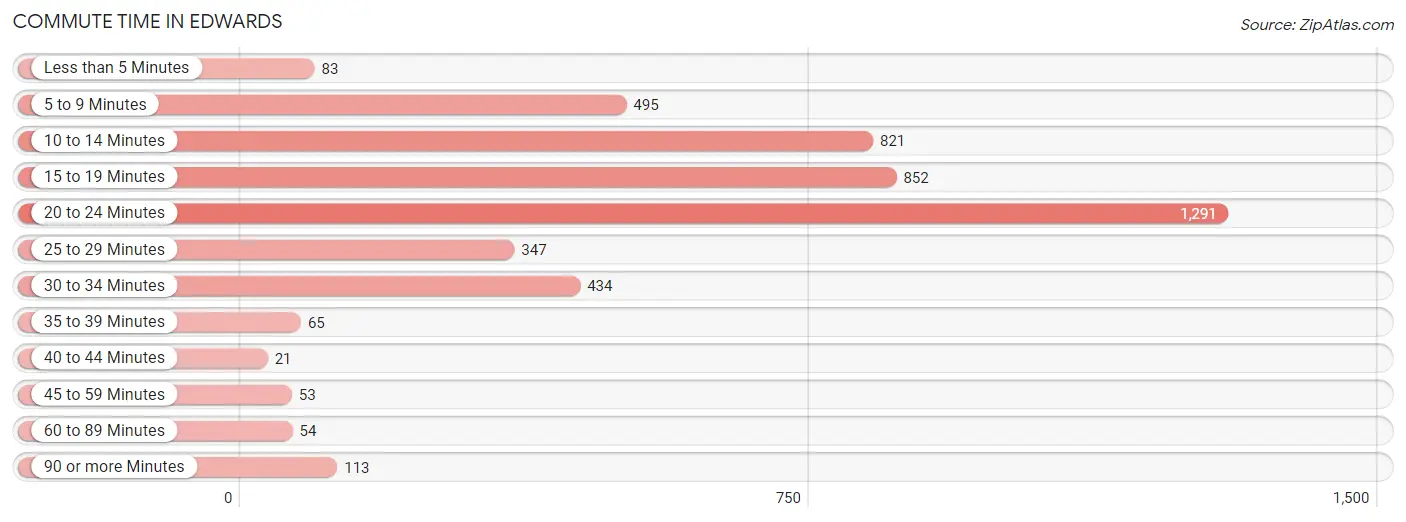
| Commute Time | # Commuters | % Commuters |
| Less than 5 Minutes | 83 | 1.8% |
| 5 to 9 Minutes | 495 | 10.7% |
| 10 to 14 Minutes | 821 | 17.7% |
| 15 to 19 Minutes | 852 | 18.4% |
| 20 to 24 Minutes | 1,291 | 27.9% |
| 25 to 29 Minutes | 347 | 7.5% |
| 30 to 34 Minutes | 434 | 9.4% |
| 35 to 39 Minutes | 65 | 1.4% |
| 40 to 44 Minutes | 21 | 0.4% |
| 45 to 59 Minutes | 53 | 1.1% |
| 60 to 89 Minutes | 54 | 1.2% |
| 90 or more Minutes | 113 | 2.4% |
Commute Time by Sex in Edwards
The most common commute times in Edwards are 20 to 24 minutes (710 commuters, 26.5%) for males and 20 to 24 minutes (581 commuters, 29.8%) for females.
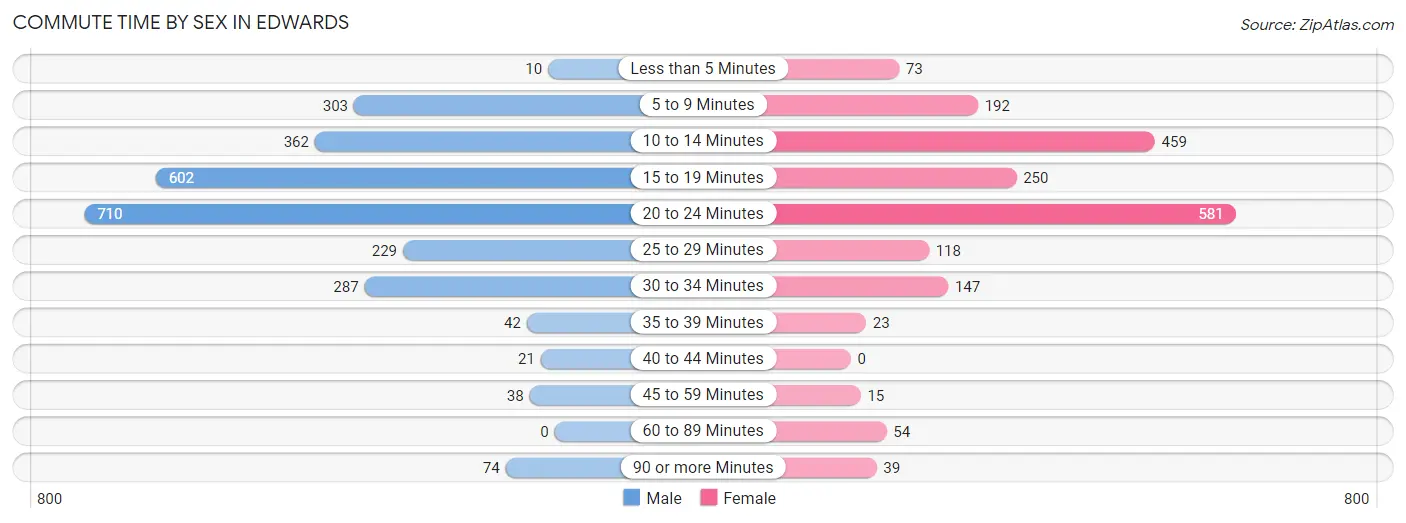
| Commute Time | Male | Female |
| Less than 5 Minutes | 10 (0.4%) | 73 (3.7%) |
| 5 to 9 Minutes | 303 (11.3%) | 192 (9.8%) |
| 10 to 14 Minutes | 362 (13.5%) | 459 (23.5%) |
| 15 to 19 Minutes | 602 (22.5%) | 250 (12.8%) |
| 20 to 24 Minutes | 710 (26.5%) | 581 (29.8%) |
| 25 to 29 Minutes | 229 (8.6%) | 118 (6.0%) |
| 30 to 34 Minutes | 287 (10.7%) | 147 (7.5%) |
| 35 to 39 Minutes | 42 (1.6%) | 23 (1.2%) |
| 40 to 44 Minutes | 21 (0.8%) | 0 (0.0%) |
| 45 to 59 Minutes | 38 (1.4%) | 15 (0.8%) |
| 60 to 89 Minutes | 0 (0.0%) | 54 (2.8%) |
| 90 or more Minutes | 74 (2.8%) | 39 (2.0%) |
Time of Departure to Work by Sex in Edwards
The most frequent times of departure to work in Edwards are 6:30 AM to 6:59 AM (470, 17.5%) for males and 7:30 AM to 7:59 AM (509, 26.1%) for females.
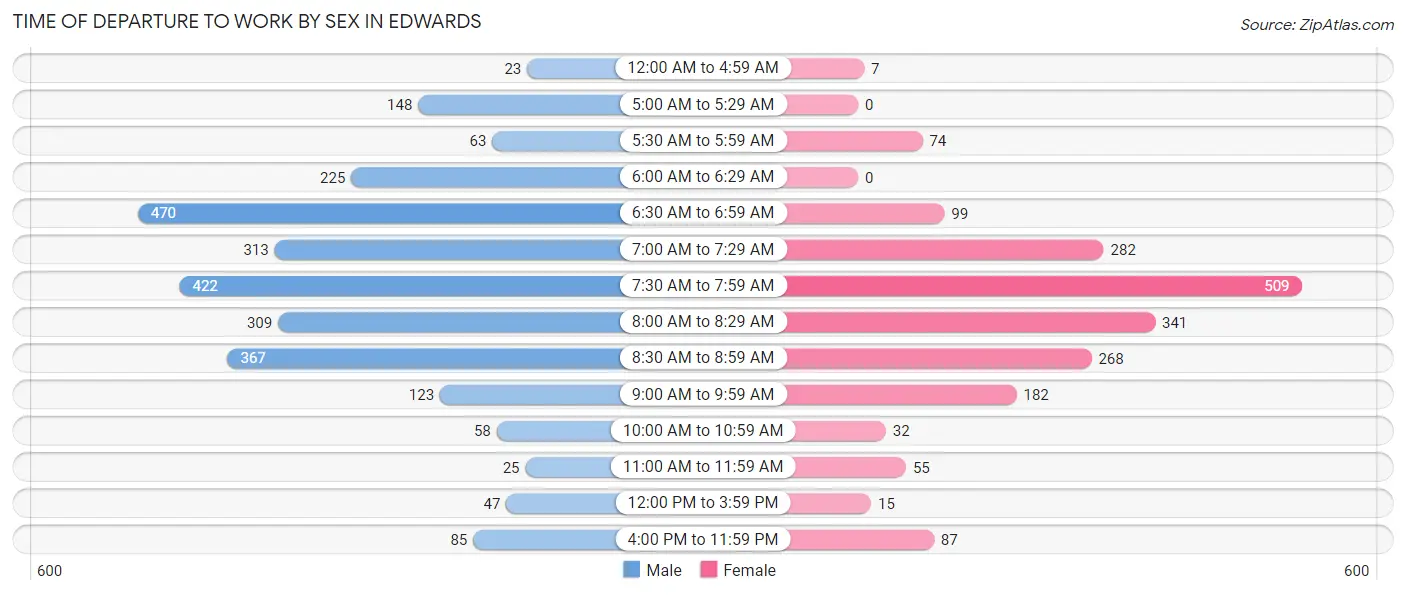
| Time of Departure | Male | Female |
| 12:00 AM to 4:59 AM | 23 (0.9%) | 7 (0.4%) |
| 5:00 AM to 5:29 AM | 148 (5.5%) | 0 (0.0%) |
| 5:30 AM to 5:59 AM | 63 (2.4%) | 74 (3.8%) |
| 6:00 AM to 6:29 AM | 225 (8.4%) | 0 (0.0%) |
| 6:30 AM to 6:59 AM | 470 (17.5%) | 99 (5.1%) |
| 7:00 AM to 7:29 AM | 313 (11.7%) | 282 (14.4%) |
| 7:30 AM to 7:59 AM | 422 (15.8%) | 509 (26.1%) |
| 8:00 AM to 8:29 AM | 309 (11.5%) | 341 (17.5%) |
| 8:30 AM to 8:59 AM | 367 (13.7%) | 268 (13.7%) |
| 9:00 AM to 9:59 AM | 123 (4.6%) | 182 (9.3%) |
| 10:00 AM to 10:59 AM | 58 (2.2%) | 32 (1.6%) |
| 11:00 AM to 11:59 AM | 25 (0.9%) | 55 (2.8%) |
| 12:00 PM to 3:59 PM | 47 (1.8%) | 15 (0.8%) |
| 4:00 PM to 11:59 PM | 85 (3.2%) | 87 (4.5%) |
| Total | 2,678 (100.0%) | 1,951 (100.0%) |
Housing Occupancy in Edwards
Occupancy by Ownership in Edwards
Of the total 3,824 dwellings in Edwards, owner-occupied units account for 2,642 (69.1%), while renter-occupied units make up 1,182 (30.9%).
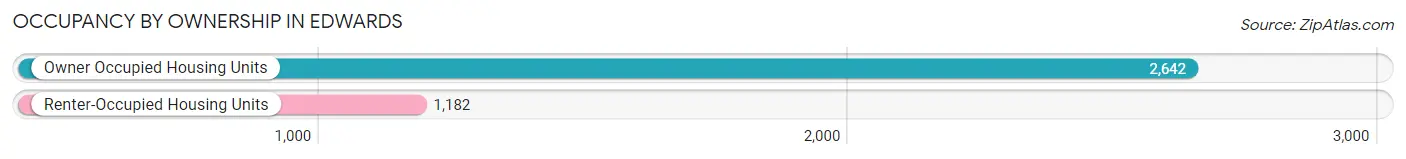
| Occupancy | # Housing Units | % Housing Units |
| Owner Occupied Housing Units | 2,642 | 69.1% |
| Renter-Occupied Housing Units | 1,182 | 30.9% |
| Total Occupied Housing Units | 3,824 | 100.0% |
Occupancy by Household Size in Edwards
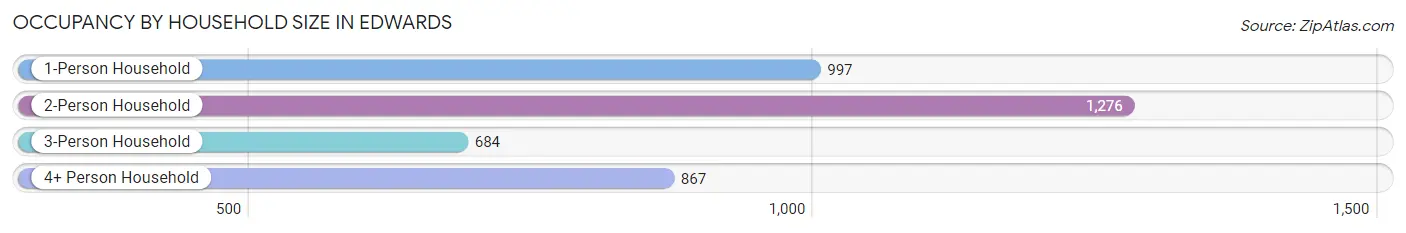
| Household Size | # Housing Units | % Housing Units |
| 1-Person Household | 997 | 26.1% |
| 2-Person Household | 1,276 | 33.4% |
| 3-Person Household | 684 | 17.9% |
| 4+ Person Household | 867 | 22.7% |
| Total Housing Units | 3,824 | 100.0% |
Occupancy by Ownership by Household Size in Edwards
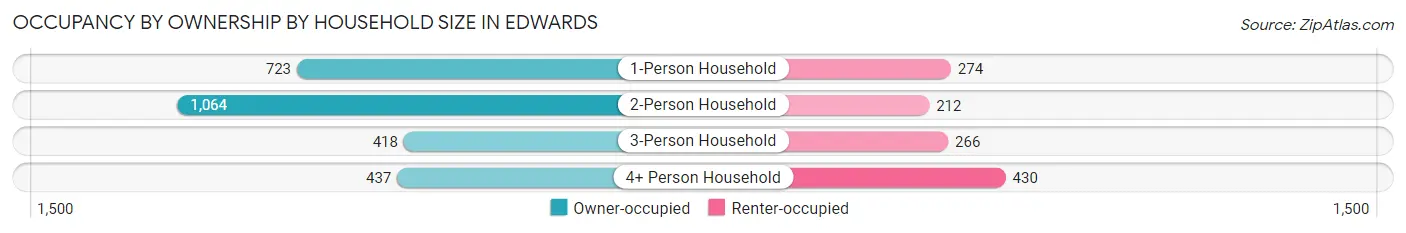
| Household Size | Owner-occupied | Renter-occupied |
| 1-Person Household | 723 (72.5%) | 274 (27.5%) |
| 2-Person Household | 1,064 (83.4%) | 212 (16.6%) |
| 3-Person Household | 418 (61.1%) | 266 (38.9%) |
| 4+ Person Household | 437 (50.4%) | 430 (49.6%) |
| Total Housing Units | 2,642 (69.1%) | 1,182 (30.9%) |
Occupancy by Educational Attainment in Edwards
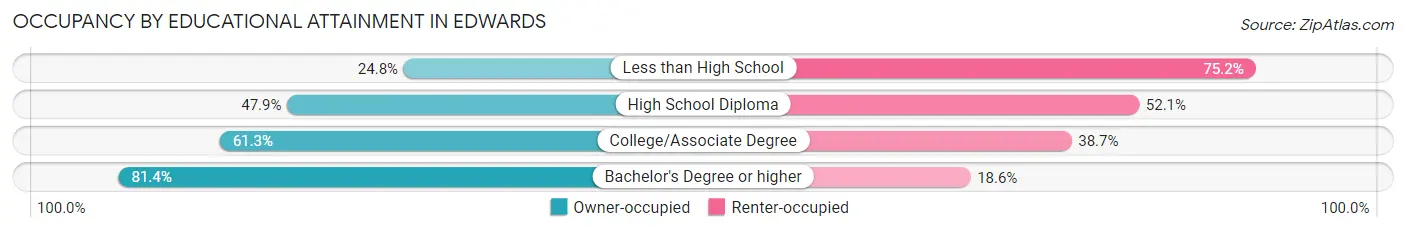
| Household Size | Owner-occupied | Renter-occupied |
| Less than High School | 91 (24.8%) | 276 (75.2%) |
| High School Diploma | 173 (47.9%) | 188 (52.1%) |
| College/Associate Degree | 431 (61.3%) | 272 (38.7%) |
| Bachelor's Degree or higher | 1,947 (81.4%) | 446 (18.6%) |
Occupancy by Age of Householder in Edwards
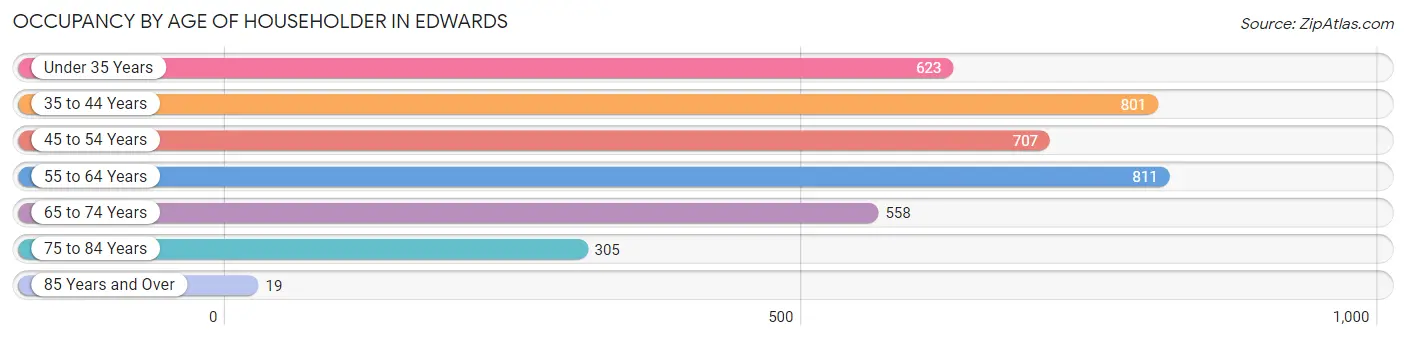
| Age Bracket | # Households | % Households |
| Under 35 Years | 623 | 16.3% |
| 35 to 44 Years | 801 | 20.9% |
| 45 to 54 Years | 707 | 18.5% |
| 55 to 64 Years | 811 | 21.2% |
| 65 to 74 Years | 558 | 14.6% |
| 75 to 84 Years | 305 | 8.0% |
| 85 Years and Over | 19 | 0.5% |
| Total | 3,824 | 100.0% |
Housing Finances in Edwards
Median Income by Occupancy in Edwards
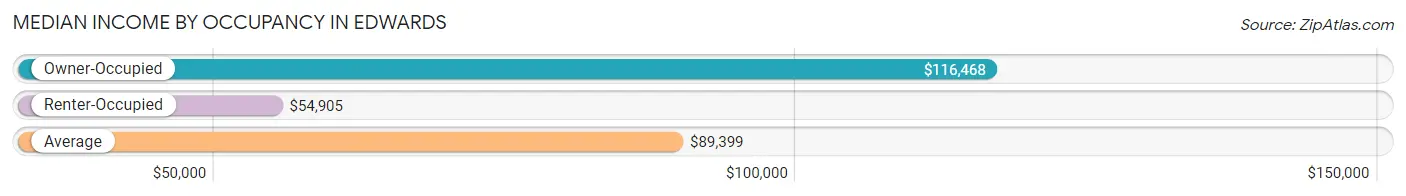
| Occupancy Type | # Households | Median Income |
| Owner-Occupied | 2,642 (69.1%) | $116,468 |
| Renter-Occupied | 1,182 (30.9%) | $54,905 |
| Average | 3,824 (100.0%) | $89,399 |
Occupancy by Householder Income Bracket in Edwards
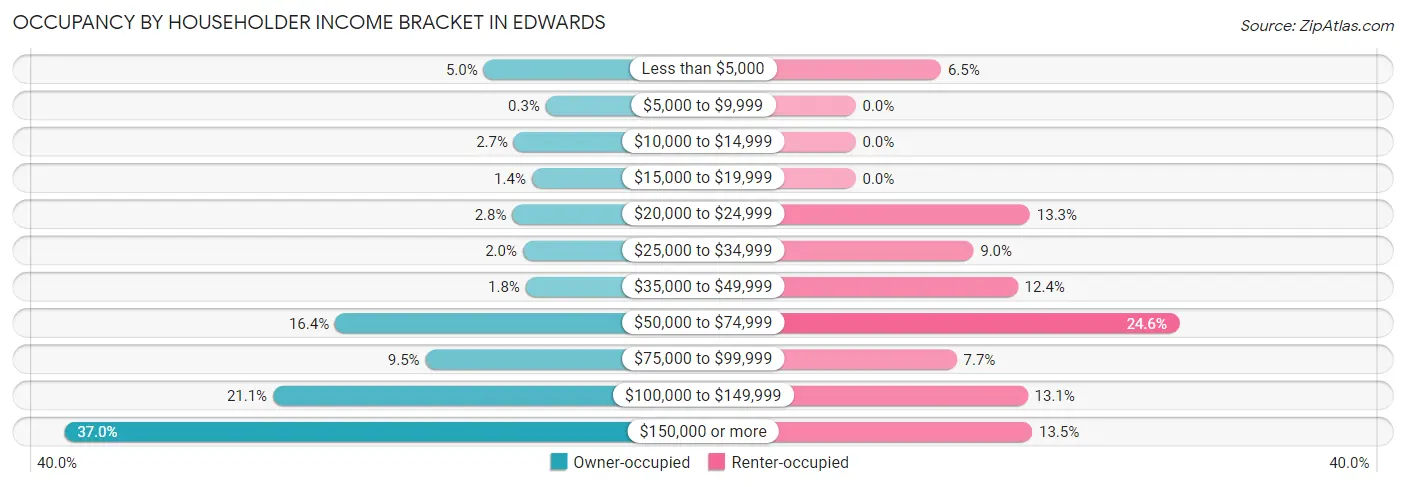
| Income Bracket | Owner-occupied | Renter-occupied |
| Less than $5,000 | 133 (5.0%) | 77 (6.5%) |
| $5,000 to $9,999 | 8 (0.3%) | 0 (0.0%) |
| $10,000 to $14,999 | 72 (2.7%) | 0 (0.0%) |
| $15,000 to $19,999 | 36 (1.4%) | 0 (0.0%) |
| $20,000 to $24,999 | 75 (2.8%) | 157 (13.3%) |
| $25,000 to $34,999 | 54 (2.0%) | 106 (9.0%) |
| $35,000 to $49,999 | 48 (1.8%) | 146 (12.3%) |
| $50,000 to $74,999 | 432 (16.4%) | 291 (24.6%) |
| $75,000 to $99,999 | 250 (9.5%) | 91 (7.7%) |
| $100,000 to $149,999 | 557 (21.1%) | 155 (13.1%) |
| $150,000 or more | 977 (37.0%) | 159 (13.5%) |
| Total | 2,642 (100.0%) | 1,182 (100.0%) |
Monthly Housing Cost Tiers in Edwards
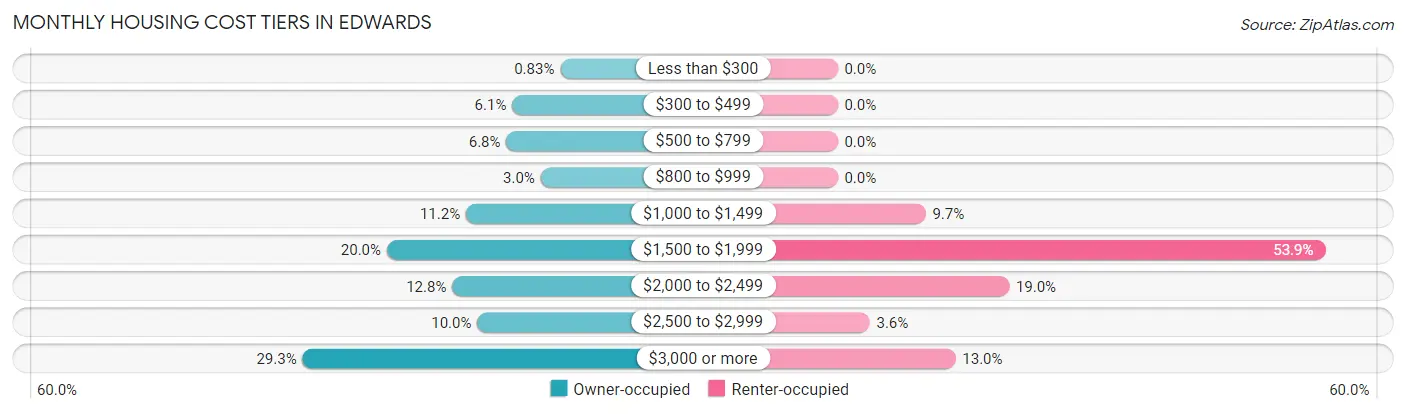
| Monthly Cost | Owner-occupied | Renter-occupied |
| Less than $300 | 22 (0.8%) | 0 (0.0%) |
| $300 to $499 | 162 (6.1%) | 0 (0.0%) |
| $500 to $799 | 179 (6.8%) | 0 (0.0%) |
| $800 to $999 | 79 (3.0%) | 0 (0.0%) |
| $1,000 to $1,499 | 297 (11.2%) | 115 (9.7%) |
| $1,500 to $1,999 | 528 (20.0%) | 637 (53.9%) |
| $2,000 to $2,499 | 337 (12.8%) | 224 (19.0%) |
| $2,500 to $2,999 | 264 (10.0%) | 42 (3.5%) |
| $3,000 or more | 774 (29.3%) | 154 (13.0%) |
| Total | 2,642 (100.0%) | 1,182 (100.0%) |
Physical Housing Characteristics in Edwards
Housing Structures in Edwards
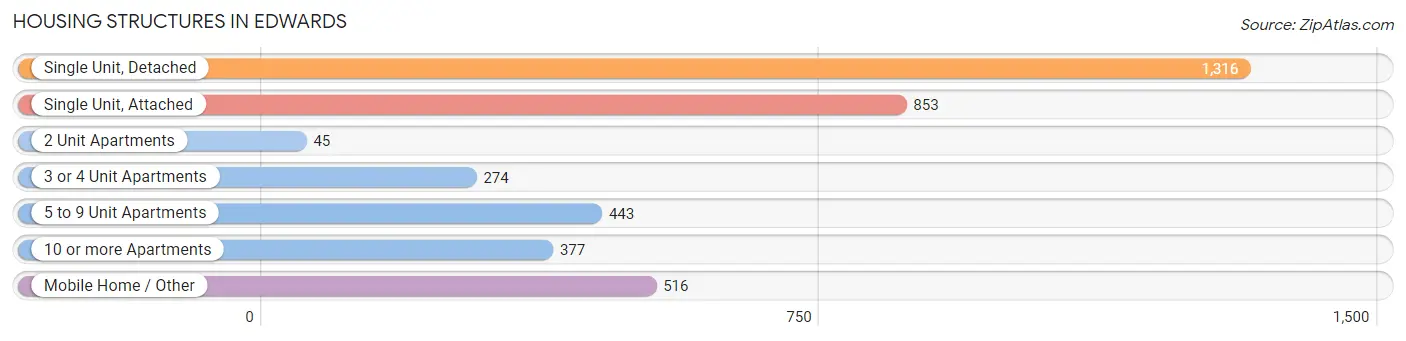
| Structure Type | # Housing Units | % Housing Units |
| Single Unit, Detached | 1,316 | 34.4% |
| Single Unit, Attached | 853 | 22.3% |
| 2 Unit Apartments | 45 | 1.2% |
| 3 or 4 Unit Apartments | 274 | 7.2% |
| 5 to 9 Unit Apartments | 443 | 11.6% |
| 10 or more Apartments | 377 | 9.9% |
| Mobile Home / Other | 516 | 13.5% |
| Total | 3,824 | 100.0% |
Housing Structures by Occupancy in Edwards
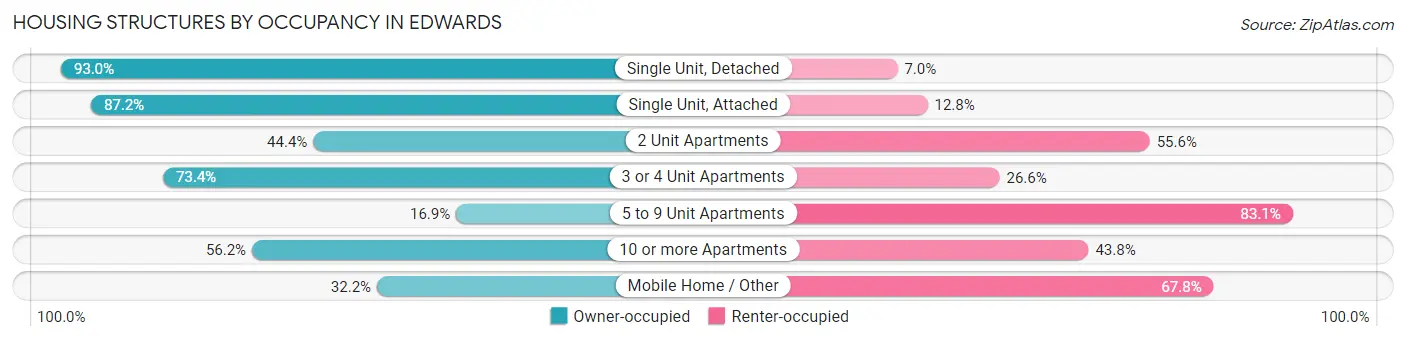
| Structure Type | Owner-occupied | Renter-occupied |
| Single Unit, Detached | 1,224 (93.0%) | 92 (7.0%) |
| Single Unit, Attached | 744 (87.2%) | 109 (12.8%) |
| 2 Unit Apartments | 20 (44.4%) | 25 (55.6%) |
| 3 or 4 Unit Apartments | 201 (73.4%) | 73 (26.6%) |
| 5 to 9 Unit Apartments | 75 (16.9%) | 368 (83.1%) |
| 10 or more Apartments | 212 (56.2%) | 165 (43.8%) |
| Mobile Home / Other | 166 (32.2%) | 350 (67.8%) |
| Total | 2,642 (69.1%) | 1,182 (30.9%) |
Housing Structures by Number of Rooms in Edwards
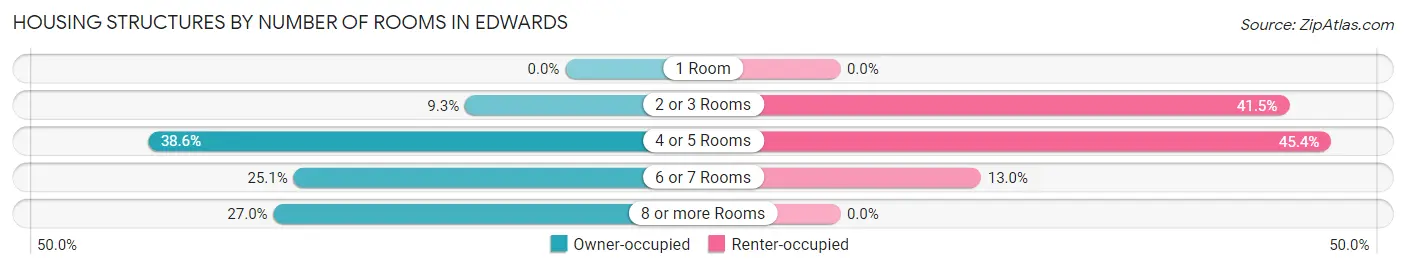
| Number of Rooms | Owner-occupied | Renter-occupied |
| 1 Room | 0 (0.0%) | 0 (0.0%) |
| 2 or 3 Rooms | 245 (9.3%) | 491 (41.5%) |
| 4 or 5 Rooms | 1,020 (38.6%) | 537 (45.4%) |
| 6 or 7 Rooms | 664 (25.1%) | 154 (13.0%) |
| 8 or more Rooms | 713 (27.0%) | 0 (0.0%) |
| Total | 2,642 (100.0%) | 1,182 (100.0%) |
Housing Structure by Heating Type in Edwards
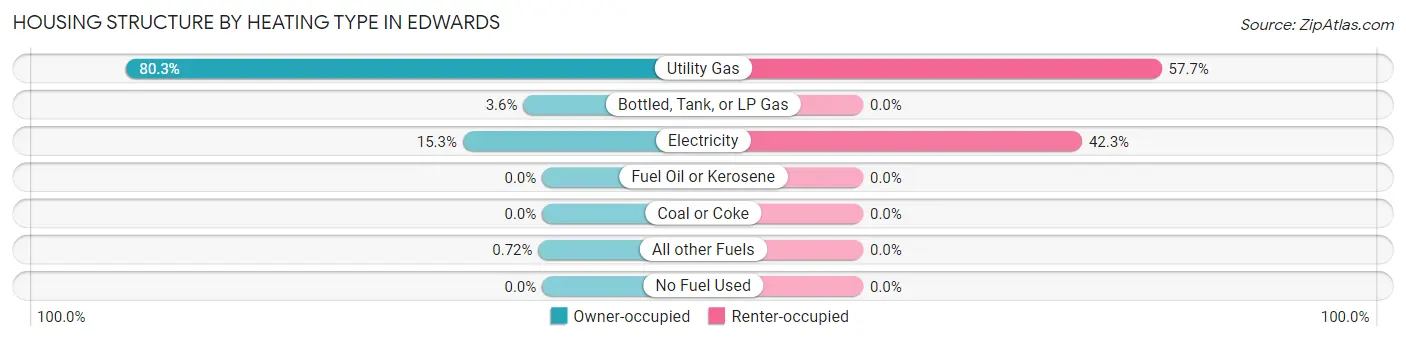
| Heating Type | Owner-occupied | Renter-occupied |
| Utility Gas | 2,122 (80.3%) | 682 (57.7%) |
| Bottled, Tank, or LP Gas | 96 (3.6%) | 0 (0.0%) |
| Electricity | 405 (15.3%) | 500 (42.3%) |
| Fuel Oil or Kerosene | 0 (0.0%) | 0 (0.0%) |
| Coal or Coke | 0 (0.0%) | 0 (0.0%) |
| All other Fuels | 19 (0.7%) | 0 (0.0%) |
| No Fuel Used | 0 (0.0%) | 0 (0.0%) |
| Total | 2,642 (100.0%) | 1,182 (100.0%) |
Household Vehicle Usage in Edwards
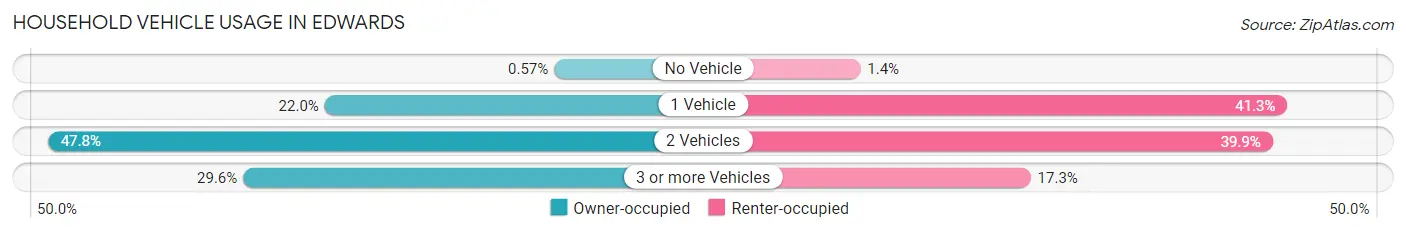
| Vehicles per Household | Owner-occupied | Renter-occupied |
| No Vehicle | 15 (0.6%) | 17 (1.4%) |
| 1 Vehicle | 581 (22.0%) | 488 (41.3%) |
| 2 Vehicles | 1,264 (47.8%) | 472 (39.9%) |
| 3 or more Vehicles | 782 (29.6%) | 205 (17.3%) |
| Total | 2,642 (100.0%) | 1,182 (100.0%) |
Real Estate & Mortgages in Edwards
Real Estate and Mortgage Overview in Edwards
| Characteristic | Without Mortgage | With Mortgage |
| Housing Units | 876 | 1,766 |
| Median Property Value | $1,075,600 | $680,900 |
| Median Household Income | $78,776 | $658 |
| Monthly Housing Costs | $1,056 | $703 |
| Real Estate Taxes | $4,306 | $12 |
Property Value by Mortgage Status in Edwards
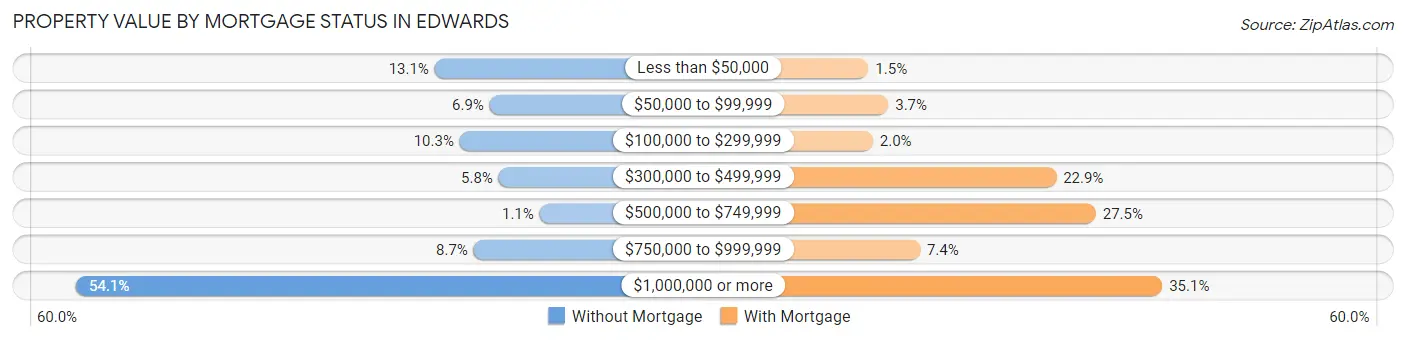
| Property Value | Without Mortgage | With Mortgage |
| Less than $50,000 | 115 (13.1%) | 26 (1.5%) |
| $50,000 to $99,999 | 60 (6.9%) | 66 (3.7%) |
| $100,000 to $299,999 | 90 (10.3%) | 35 (2.0%) |
| $300,000 to $499,999 | 51 (5.8%) | 405 (22.9%) |
| $500,000 to $749,999 | 10 (1.1%) | 485 (27.5%) |
| $750,000 to $999,999 | 76 (8.7%) | 130 (7.4%) |
| $1,000,000 or more | 474 (54.1%) | 619 (35.0%) |
| Total | 876 (100.0%) | 1,766 (100.0%) |
Household Income by Mortgage Status in Edwards
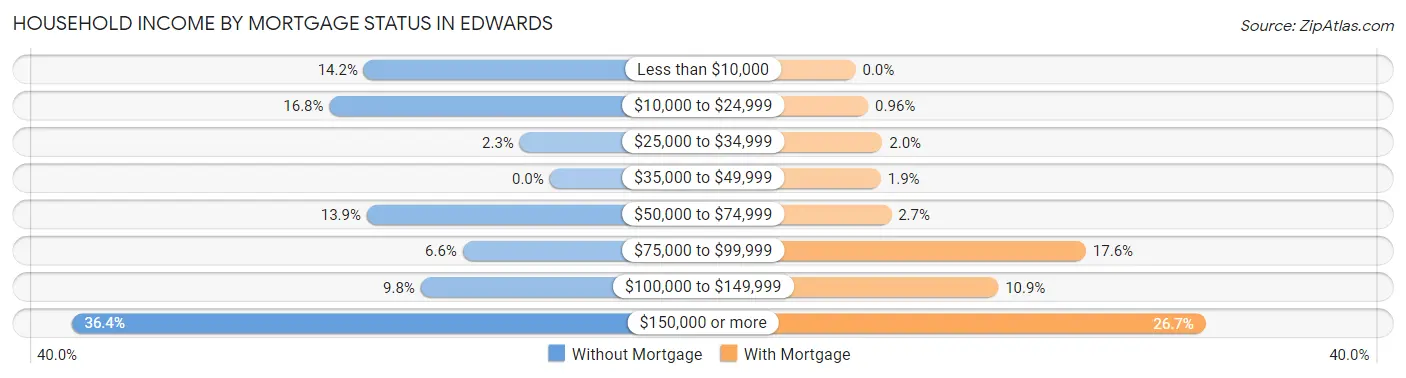
| Household Income | Without Mortgage | With Mortgage |
| Less than $10,000 | 124 (14.2%) | 0 (0.0%) |
| $10,000 to $24,999 | 147 (16.8%) | 17 (1.0%) |
| $25,000 to $34,999 | 20 (2.3%) | 36 (2.0%) |
| $35,000 to $49,999 | 0 (0.0%) | 34 (1.9%) |
| $50,000 to $74,999 | 122 (13.9%) | 48 (2.7%) |
| $75,000 to $99,999 | 58 (6.6%) | 310 (17.5%) |
| $100,000 to $149,999 | 86 (9.8%) | 192 (10.9%) |
| $150,000 or more | 319 (36.4%) | 471 (26.7%) |
| Total | 876 (100.0%) | 1,766 (100.0%) |
Property Value to Household Income Ratio in Edwards
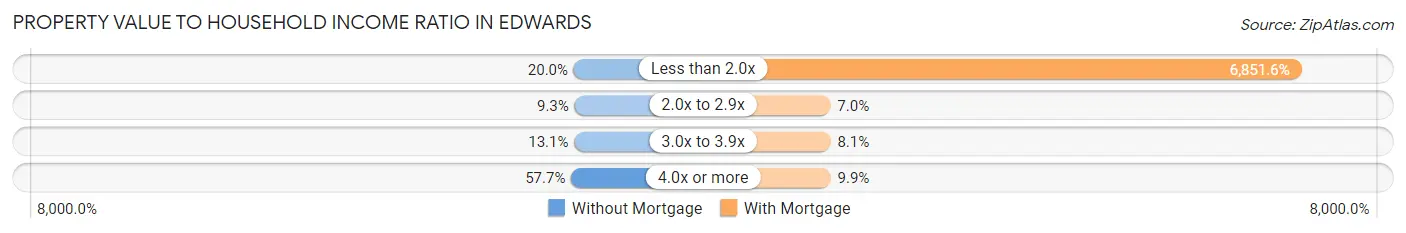
| Value-to-Income Ratio | Without Mortgage | With Mortgage |
| Less than 2.0x | 175 (20.0%) | 121,000 (6,851.6%) |
| 2.0x to 2.9x | 81 (9.2%) | 123 (7.0%) |
| 3.0x to 3.9x | 115 (13.1%) | 143 (8.1%) |
| 4.0x or more | 505 (57.7%) | 174 (9.9%) |
| Total | 876 (100.0%) | 1,766 (100.0%) |
Real Estate Taxes by Mortgage Status in Edwards
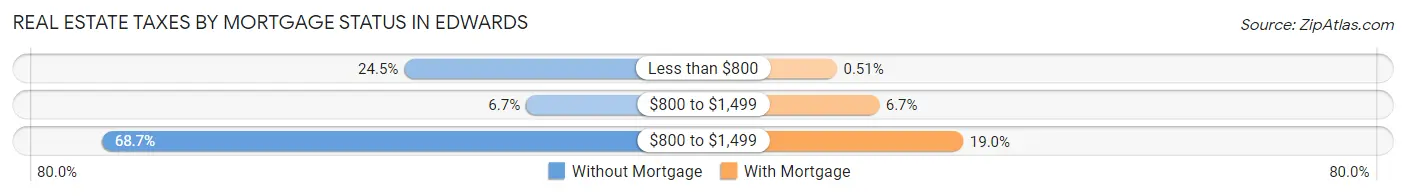
| Property Taxes | Without Mortgage | With Mortgage |
| Less than $800 | 215 (24.5%) | 9 (0.5%) |
| $800 to $1,499 | 59 (6.7%) | 118 (6.7%) |
| $800 to $1,499 | 602 (68.7%) | 335 (19.0%) |
| Total | 876 (100.0%) | 1,766 (100.0%) |
Health & Disability in Edwards
Health Insurance Coverage by Age in Edwards
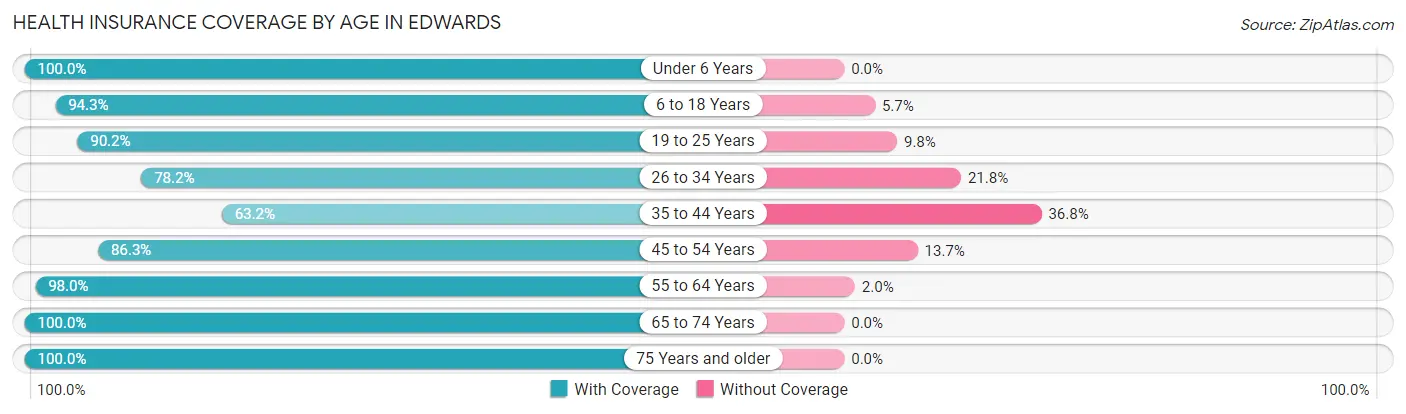
| Age Bracket | With Coverage | Without Coverage |
| Under 6 Years | 580 (100.0%) | 0 (0.0%) |
| 6 to 18 Years | 1,894 (94.3%) | 115 (5.7%) |
| 19 to 25 Years | 669 (90.2%) | 73 (9.8%) |
| 26 to 34 Years | 1,284 (78.2%) | 357 (21.8%) |
| 35 to 44 Years | 1,037 (63.2%) | 603 (36.8%) |
| 45 to 54 Years | 1,155 (86.3%) | 183 (13.7%) |
| 55 to 64 Years | 1,337 (98.0%) | 27 (2.0%) |
| 65 to 74 Years | 899 (100.0%) | 0 (0.0%) |
| 75 Years and older | 508 (100.0%) | 0 (0.0%) |
| Total | 9,363 (87.3%) | 1,358 (12.7%) |
Health Insurance Coverage by Citizenship Status in Edwards
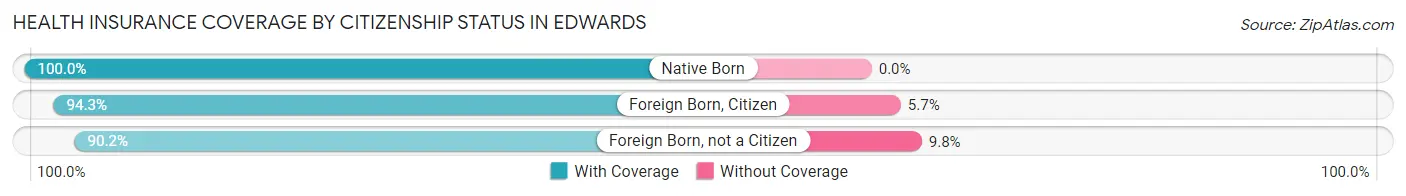
| Citizenship Status | With Coverage | Without Coverage |
| Native Born | 580 (100.0%) | 0 (0.0%) |
| Foreign Born, Citizen | 1,894 (94.3%) | 115 (5.7%) |
| Foreign Born, not a Citizen | 669 (90.2%) | 73 (9.8%) |
Health Insurance Coverage by Household Income in Edwards
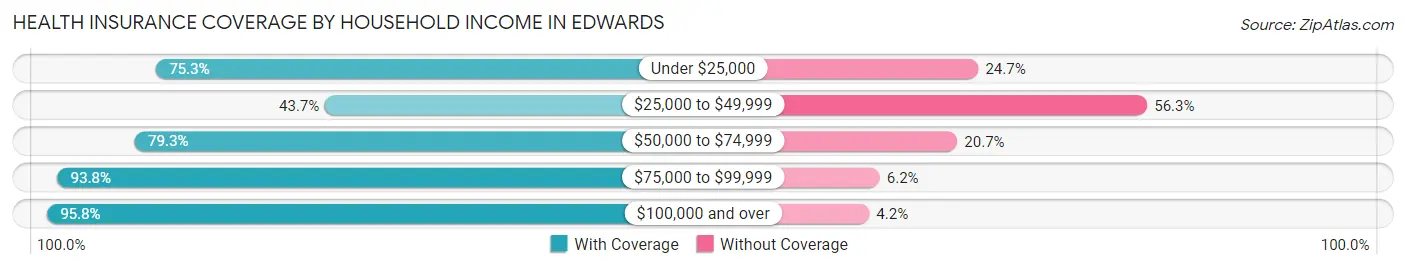
| Household Income | With Coverage | Without Coverage |
| Under $25,000 | 620 (75.3%) | 203 (24.7%) |
| $25,000 to $49,999 | 312 (43.7%) | 402 (56.3%) |
| $50,000 to $74,999 | 1,661 (79.3%) | 434 (20.7%) |
| $75,000 to $99,999 | 910 (93.8%) | 60 (6.2%) |
| $100,000 and over | 5,854 (95.8%) | 259 (4.2%) |
Public vs Private Health Insurance Coverage by Age in Edwards
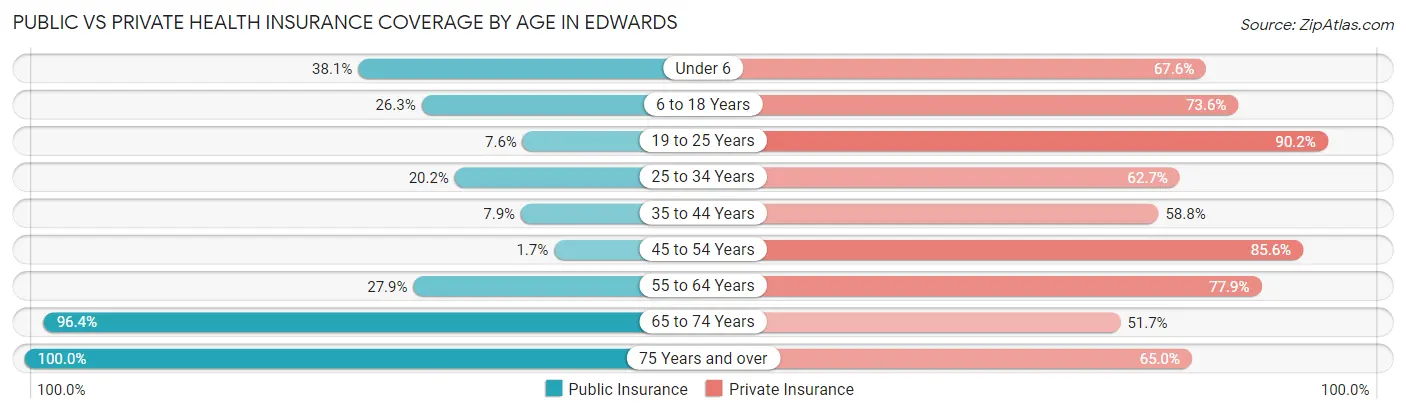
| Age Bracket | Public Insurance | Private Insurance |
| Under 6 | 221 (38.1%) | 392 (67.6%) |
| 6 to 18 Years | 529 (26.3%) | 1,478 (73.6%) |
| 19 to 25 Years | 56 (7.5%) | 669 (90.2%) |
| 25 to 34 Years | 331 (20.2%) | 1,029 (62.7%) |
| 35 to 44 Years | 129 (7.9%) | 964 (58.8%) |
| 45 to 54 Years | 23 (1.7%) | 1,145 (85.6%) |
| 55 to 64 Years | 380 (27.9%) | 1,062 (77.9%) |
| 65 to 74 Years | 867 (96.4%) | 465 (51.7%) |
| 75 Years and over | 508 (100.0%) | 330 (65.0%) |
| Total | 3,044 (28.4%) | 7,534 (70.3%) |
Disability Status by Sex by Age in Edwards
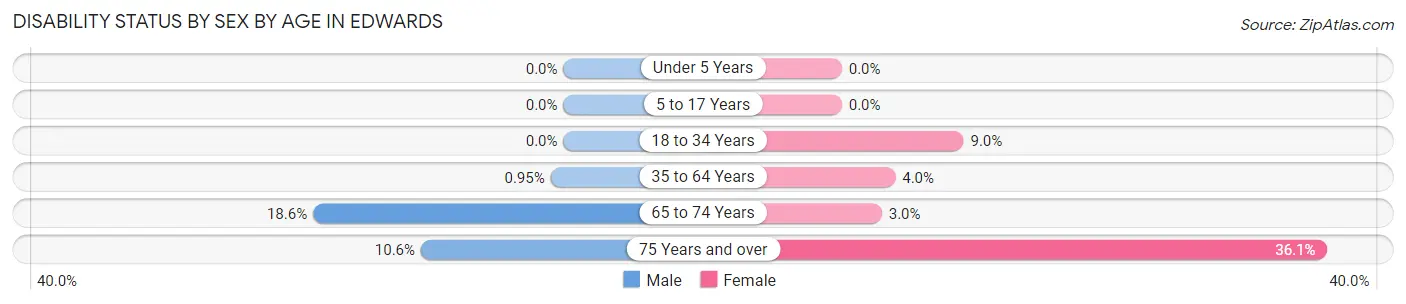
| Age Bracket | Male | Female |
| Under 5 Years | 0 (0.0%) | 0 (0.0%) |
| 5 to 17 Years | 0 (0.0%) | 0 (0.0%) |
| 18 to 34 Years | 0 (0.0%) | 82 (9.0%) |
| 35 to 64 Years | 22 (0.9%) | 80 (4.0%) |
| 65 to 74 Years | 92 (18.6%) | 12 (3.0%) |
| 75 Years and over | 20 (10.6%) | 115 (36.0%) |
Disability Class by Sex by Age in Edwards
Disability Class: Hearing Difficulty
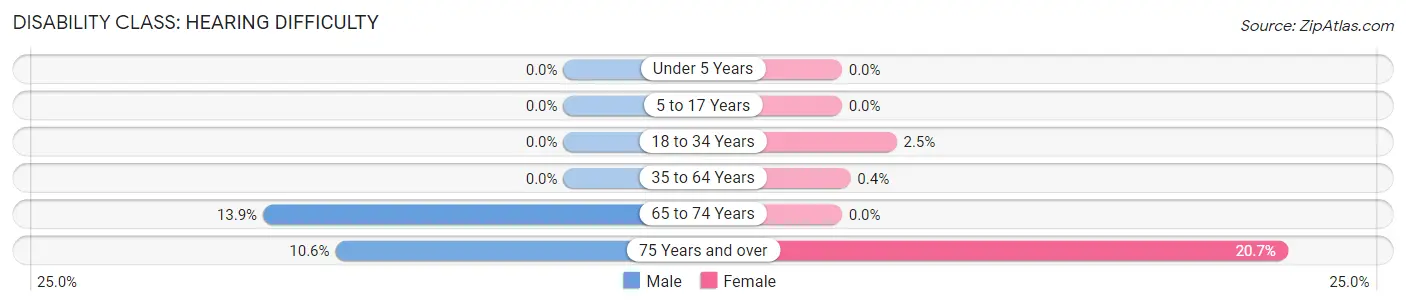
| Age Bracket | Male | Female |
| Under 5 Years | 0 (0.0%) | 0 (0.0%) |
| 5 to 17 Years | 0 (0.0%) | 0 (0.0%) |
| 18 to 34 Years | 0 (0.0%) | 23 (2.5%) |
| 35 to 64 Years | 0 (0.0%) | 8 (0.4%) |
| 65 to 74 Years | 69 (13.9%) | 0 (0.0%) |
| 75 Years and over | 20 (10.6%) | 66 (20.7%) |
Disability Class: Vision Difficulty
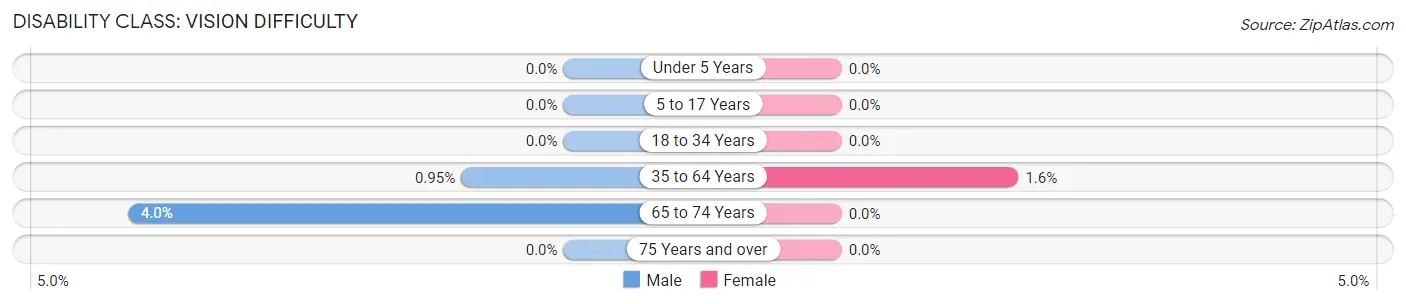
| Age Bracket | Male | Female |
| Under 5 Years | 0 (0.0%) | 0 (0.0%) |
| 5 to 17 Years | 0 (0.0%) | 0 (0.0%) |
| 18 to 34 Years | 0 (0.0%) | 0 (0.0%) |
| 35 to 64 Years | 22 (0.9%) | 33 (1.6%) |
| 65 to 74 Years | 20 (4.0%) | 0 (0.0%) |
| 75 Years and over | 0 (0.0%) | 0 (0.0%) |
Disability Class: Cognitive Difficulty
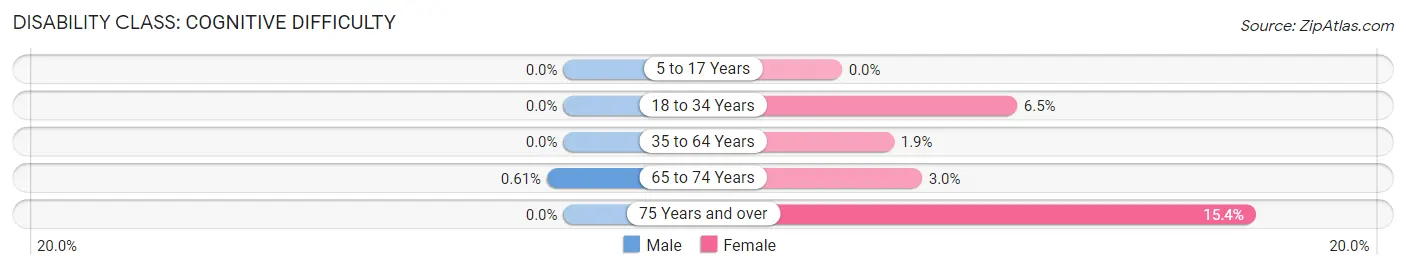
| Age Bracket | Male | Female |
| 5 to 17 Years | 0 (0.0%) | 0 (0.0%) |
| 18 to 34 Years | 0 (0.0%) | 59 (6.5%) |
| 35 to 64 Years | 0 (0.0%) | 39 (1.9%) |
| 65 to 74 Years | 3 (0.6%) | 12 (3.0%) |
| 75 Years and over | 0 (0.0%) | 49 (15.4%) |
Disability Class: Ambulatory Difficulty
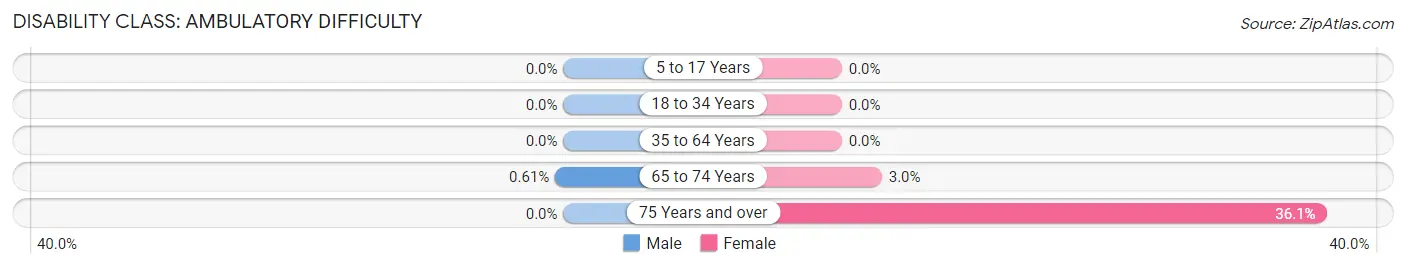
| Age Bracket | Male | Female |
| 5 to 17 Years | 0 (0.0%) | 0 (0.0%) |
| 18 to 34 Years | 0 (0.0%) | 0 (0.0%) |
| 35 to 64 Years | 0 (0.0%) | 0 (0.0%) |
| 65 to 74 Years | 3 (0.6%) | 12 (3.0%) |
| 75 Years and over | 0 (0.0%) | 115 (36.0%) |
Disability Class: Self-Care Difficulty
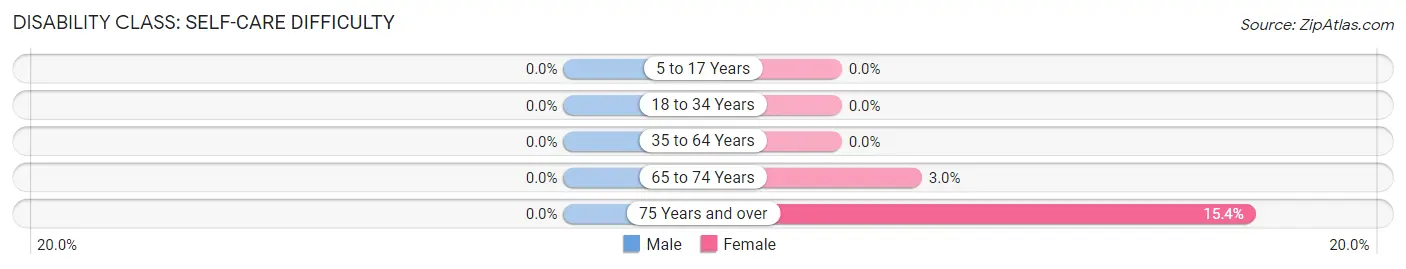
| Age Bracket | Male | Female |
| 5 to 17 Years | 0 (0.0%) | 0 (0.0%) |
| 18 to 34 Years | 0 (0.0%) | 0 (0.0%) |
| 35 to 64 Years | 0 (0.0%) | 0 (0.0%) |
| 65 to 74 Years | 0 (0.0%) | 12 (3.0%) |
| 75 Years and over | 0 (0.0%) | 49 (15.4%) |
Technology Access in Edwards
Computing Device Access in Edwards
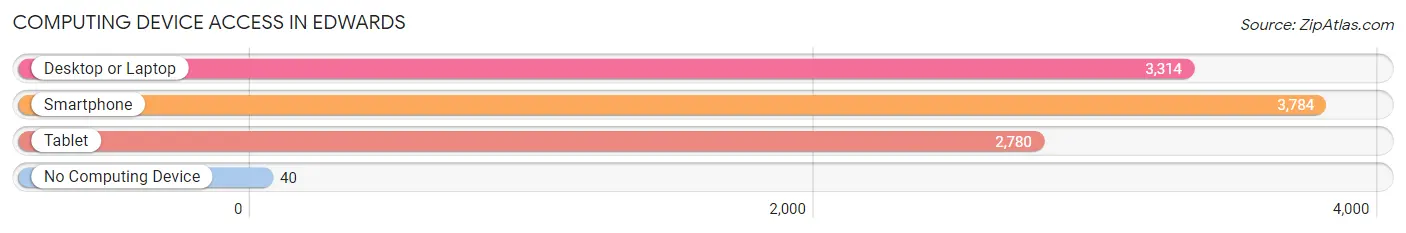
| Device Type | # Households | % Households |
| Desktop or Laptop | 3,314 | 86.7% |
| Smartphone | 3,784 | 99.0% |
| Tablet | 2,780 | 72.7% |
| No Computing Device | 40 | 1.1% |
| Total | 3,824 | 100.0% |
Internet Access in Edwards
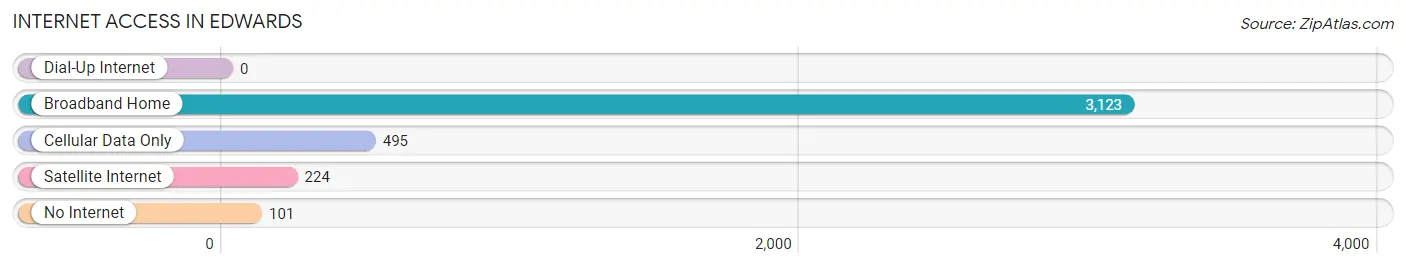
| Internet Type | # Households | % Households |
| Dial-Up Internet | 0 | 0.0% |
| Broadband Home | 3,123 | 81.7% |
| Cellular Data Only | 495 | 12.9% |
| Satellite Internet | 224 | 5.9% |
| No Internet | 101 | 2.6% |
| Total | 3,824 | 100.0% |
Edwards Summary
Edwards, Colorado is a small town located in Eagle County, Colorado. It is situated in the heart of the Rocky Mountains, just west of Vail and Beaver Creek ski resorts. The town was founded in 1883 and has a population of approximately 10,000 people.
Geography
Edwards is located in the heart of the Rocky Mountains, at an elevation of 8,000 feet. The town is surrounded by the White River National Forest and is close to the Eagle River. The town is located in a valley, surrounded by mountains on all sides. The climate is generally mild, with temperatures ranging from the mid-30s in the winter to the mid-70s in the summer.
Economy
Edwards is a small town with a diverse economy. The town is home to a variety of businesses, including restaurants, retail stores, and professional services. The town is also home to several ski resorts, including Vail and Beaver Creek, which bring in a large number of tourists each year. The town is also home to a number of corporate offices, including the headquarters of Vail Resorts.
Demographics
As of the 2010 census, Edwards had a population of 10,266 people. The racial makeup of the town was 91.3% White, 0.7% African American, 0.3% Native American, 1.2% Asian, 0.1% Pacific Islander, 4.2% from other races, and 2.4% from two or more races. Hispanic or Latino of any race were 11.2% of the population.
The median income for a household in Edwards was $68,958, and the median income for a family was $77,958. The per capita income for the town was $37,958. About 4.2% of families and 6.2% of the population were below the poverty line, including 8.2% of those under age 18 and 4.2% of those age 65 or over.
Conclusion
Edwards, Colorado is a small town located in the heart of the Rocky Mountains. The town is home to a variety of businesses, including restaurants, retail stores, and professional services. The town is also home to several ski resorts, which bring in a large number of tourists each year. The town has a diverse population, with a median income of $68,958. Edwards is a great place to live, work, and play, and is a great example of a small mountain town.
Common Questions
What is Per Capita Income in Edwards?
Per Capita income in Edwards is $58,762.
What is the Median Family Income in Edwards?
Median Family Income in Edwards is $115,357.
What is the Median Household income in Edwards?
Median Household Income in Edwards is $89,399.
What is Income or Wage Gap in Edwards?
Income or Wage Gap in Edwards is 1.2%.
Women in Edwards earn 98.8 cents for every dollar earned by a man.
What is Inequality or Gini Index in Edwards?
Inequality or Gini Index in Edwards is 0.56.
What is the Total Population of Edwards?
Total Population of Edwards is 10,721.
What is the Total Male Population of Edwards?
Total Male Population of Edwards is 5,825.
What is the Total Female Population of Edwards?
Total Female Population of Edwards is 4,896.
What is the Ratio of Males per 100 Females in Edwards?
There are 118.97 Males per 100 Females in Edwards.
What is the Ratio of Females per 100 Males in Edwards?
There are 84.05 Females per 100 Males in Edwards.
What is the Median Population Age in Edwards?
Median Population Age in Edwards is 37.5 Years.
What is the Average Family Size in Edwards
Average Family Size in Edwards is 3.2 People.
What is the Average Household Size in Edwards
Average Household Size in Edwards is 2.8 People.
How Large is the Labor Force in Edwards?
There are 6,189 People in the Labor Forcein in Edwards.
What is the Percentage of People in the Labor Force in Edwards?
71.4% of People are in the Labor Force in Edwards.
What is the Unemployment Rate in Edwards?
Unemployment Rate in Edwards is 7.8%.