Lewisburg, WV Map & Demographics
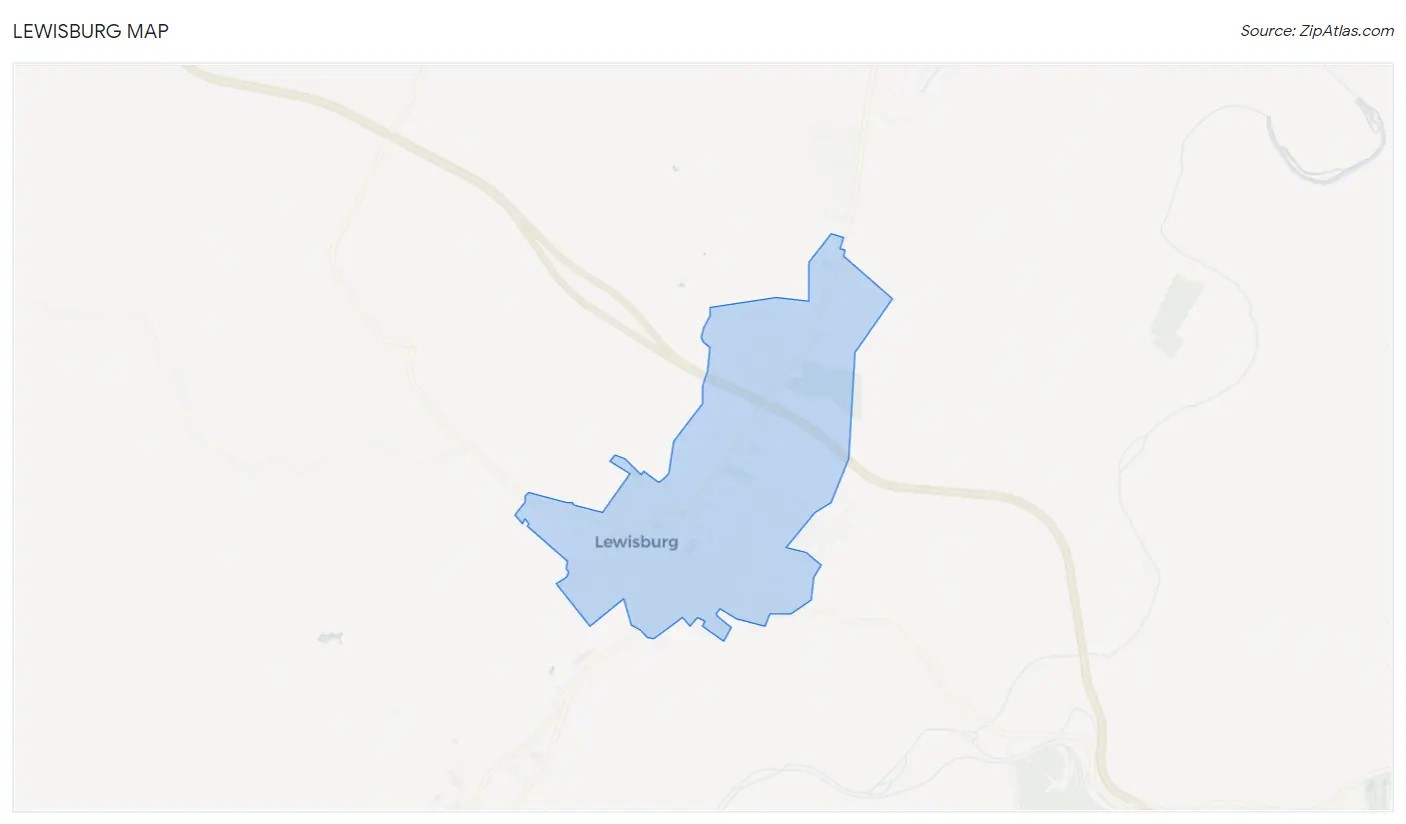
Lewisburg Map
Lewisburg Overview
$39,968
PER CAPITA INCOME
$76,739
AVG FAMILY INCOME
$47,563
AVG HOUSEHOLD INCOME
21.0%
WAGE / INCOME GAP [ % ]
79.0¢/ $1
WAGE / INCOME GAP [ $ ]
0.58
INEQUALITY / GINI INDEX
3,890
TOTAL POPULATION
1,676
MALE POPULATION
2,214
FEMALE POPULATION
75.70
MALES / 100 FEMALES
132.10
FEMALES / 100 MALES
39.1
MEDIAN AGE
3.4
AVG FAMILY SIZE
2.1
AVG HOUSEHOLD SIZE
1,465
LABOR FORCE [ PEOPLE ]
48.2%
PERCENT IN LABOR FORCE
Lewisburg Zip Codes
Income in Lewisburg
Income Overview in Lewisburg
Per Capita Income in Lewisburg is $39,968, while median incomes of families and households are $76,739 and $47,563 respectively.
| Characteristic | Number | Measure |
| Per Capita Income | 3,890 | $39,968 |
| Median Family Income | 698 | $76,739 |
| Mean Family Income | 698 | $103,321 |
| Median Household Income | 1,852 | $47,563 |
| Mean Household Income | 1,852 | $80,218 |
| Income Deficit | 698 | $0 |
| Wage / Income Gap (%) | 3,890 | 20.98% |
| Wage / Income Gap ($) | 3,890 | 79.02¢ per $1 |
| Gini / Inequality Index | 3,890 | 0.58 |
Earnings by Sex in Lewisburg
Average Earnings in Lewisburg are $46,367, $40,477 for men and $51,221 for women, a difference of 21.0%.
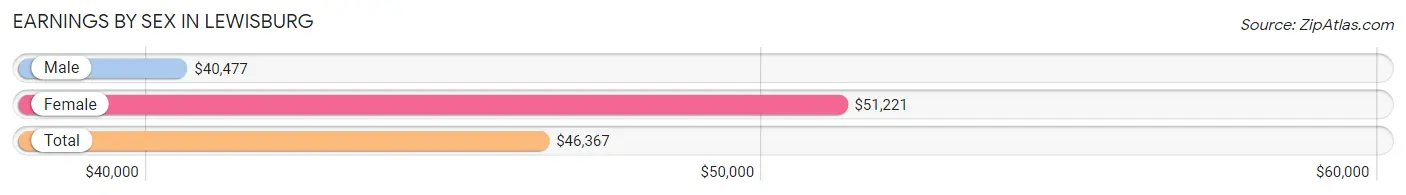
| Sex | Number | Average Earnings |
| Male | 668 (40.7%) | $40,477 |
| Female | 974 (59.3%) | $51,221 |
| Total | 1,642 (100.0%) | $46,367 |
Earnings by Sex by Income Bracket in Lewisburg
The most common earnings brackets in Lewisburg are $40,000 to $44,999 for men (110 | 16.5%) and $45,000 to $49,999 for women (179 | 18.4%).
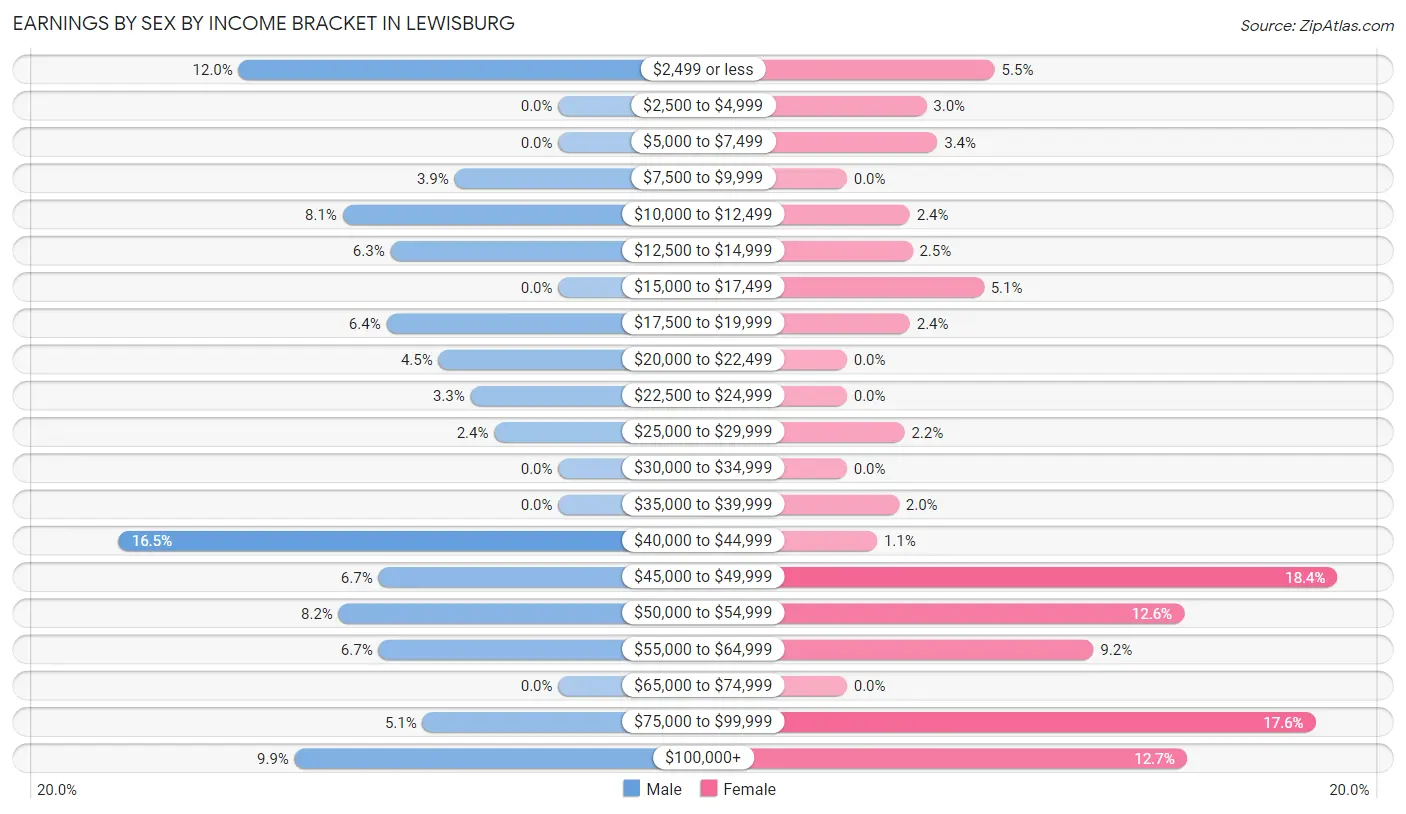
| Income | Male | Female |
| $2,499 or less | 80 (12.0%) | 54 (5.5%) |
| $2,500 to $4,999 | 0 (0.0%) | 29 (3.0%) |
| $5,000 to $7,499 | 0 (0.0%) | 33 (3.4%) |
| $7,500 to $9,999 | 26 (3.9%) | 0 (0.0%) |
| $10,000 to $12,499 | 54 (8.1%) | 23 (2.4%) |
| $12,500 to $14,999 | 42 (6.3%) | 24 (2.5%) |
| $15,000 to $17,499 | 0 (0.0%) | 50 (5.1%) |
| $17,500 to $19,999 | 43 (6.4%) | 23 (2.4%) |
| $20,000 to $22,499 | 30 (4.5%) | 0 (0.0%) |
| $22,500 to $24,999 | 22 (3.3%) | 0 (0.0%) |
| $25,000 to $29,999 | 16 (2.4%) | 21 (2.2%) |
| $30,000 to $34,999 | 0 (0.0%) | 0 (0.0%) |
| $35,000 to $39,999 | 0 (0.0%) | 19 (1.9%) |
| $40,000 to $44,999 | 110 (16.5%) | 11 (1.1%) |
| $45,000 to $49,999 | 45 (6.7%) | 179 (18.4%) |
| $50,000 to $54,999 | 55 (8.2%) | 123 (12.6%) |
| $55,000 to $64,999 | 45 (6.7%) | 90 (9.2%) |
| $65,000 to $74,999 | 0 (0.0%) | 0 (0.0%) |
| $75,000 to $99,999 | 34 (5.1%) | 171 (17.6%) |
| $100,000+ | 66 (9.9%) | 124 (12.7%) |
| Total | 668 (100.0%) | 974 (100.0%) |
Earnings by Sex by Educational Attainment in Lewisburg
Average earnings in Lewisburg are $40,261 for men and $52,781 for women, a difference of 23.7%. Men with an educational attainment of bachelor's degree enjoy the highest average annual earnings of $41,068, while those with bachelor's degree education earn the least with $41,068. Women with an educational attainment of bachelor's degree earn the most with the average annual earnings of $52,672, while those with bachelor's degree education have the smallest earnings of $52,672.
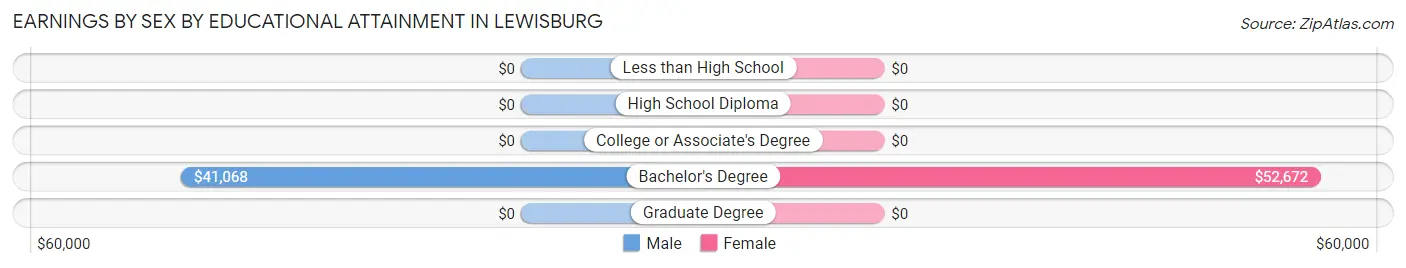
| Educational Attainment | Male Income | Female Income |
| Less than High School | - | - |
| High School Diploma | - | - |
| College or Associate's Degree | - | - |
| Bachelor's Degree | $41,068 | $52,672 |
| Graduate Degree | - | - |
| Total | $40,261 | $52,781 |
Family Income in Lewisburg
Family Income Brackets in Lewisburg
According to the Lewisburg family income data, there are 180 families falling into the $75,000 to $99,999 income range, which is the most common income bracket and makes up 25.8% of all families.
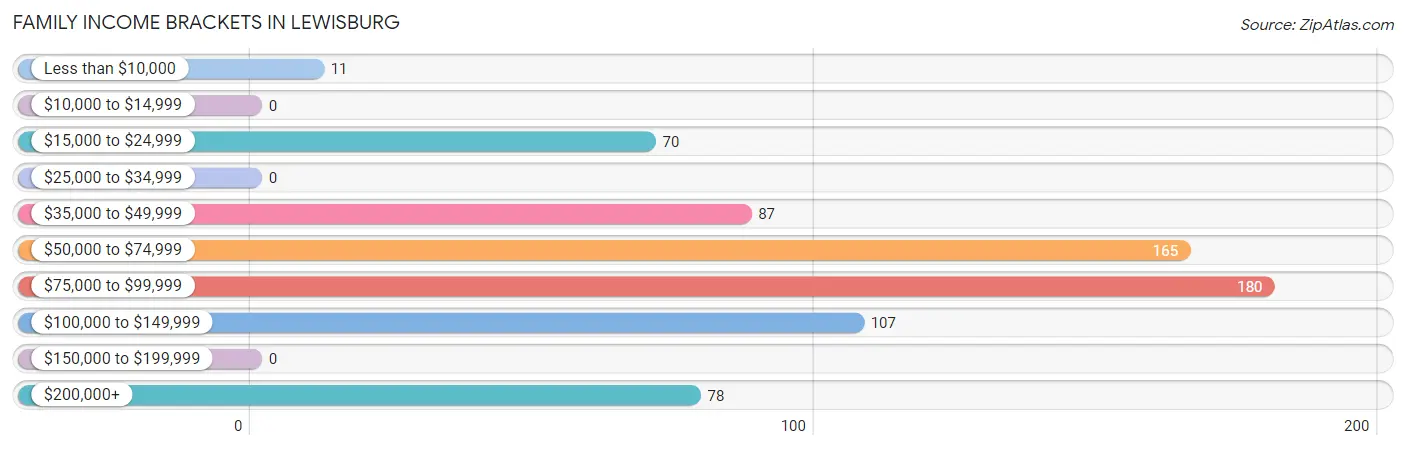
| Income Bracket | # Families | % Families |
| Less than $10,000 | 11 | 1.6% |
| $10,000 to $14,999 | 0 | 0.0% |
| $15,000 to $24,999 | 70 | 10.0% |
| $25,000 to $34,999 | 0 | 0.0% |
| $35,000 to $49,999 | 87 | 12.5% |
| $50,000 to $74,999 | 165 | 23.6% |
| $75,000 to $99,999 | 180 | 25.8% |
| $100,000 to $149,999 | 107 | 15.3% |
| $150,000 to $199,999 | 0 | 0.0% |
| $200,000+ | 78 | 11.2% |
Family Income by Famaliy Size in Lewisburg
3-person families (126 | 18.0%) account for the highest median family income in Lewisburg with $117,500 per family, while 3-person families (126 | 18.0%) have the highest median income of $39,167 per family member.
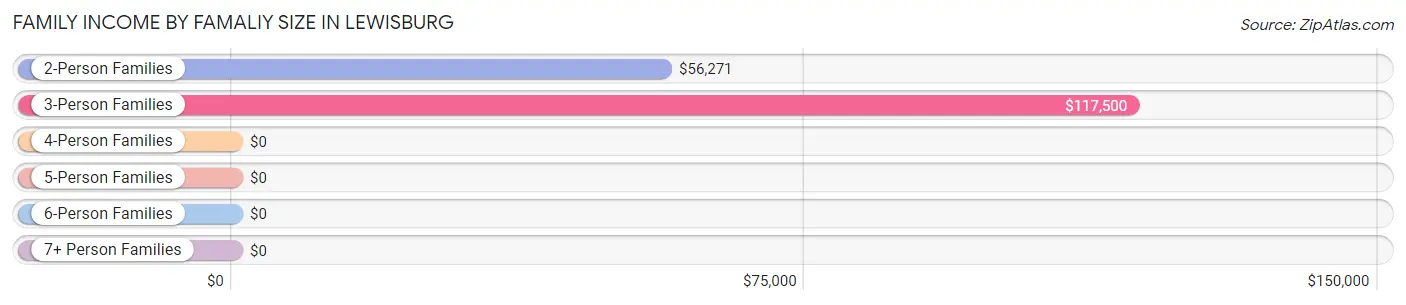
| Income Bracket | # Families | Median Income |
| 2-Person Families | 400 (57.3%) | $56,271 |
| 3-Person Families | 126 (18.0%) | $117,500 |
| 4-Person Families | 101 (14.5%) | $0 |
| 5-Person Families | 19 (2.7%) | $0 |
| 6-Person Families | 19 (2.7%) | $0 |
| 7+ Person Families | 33 (4.7%) | $0 |
| Total | 698 (100.0%) | $76,739 |
Family Income by Number of Earners in Lewisburg
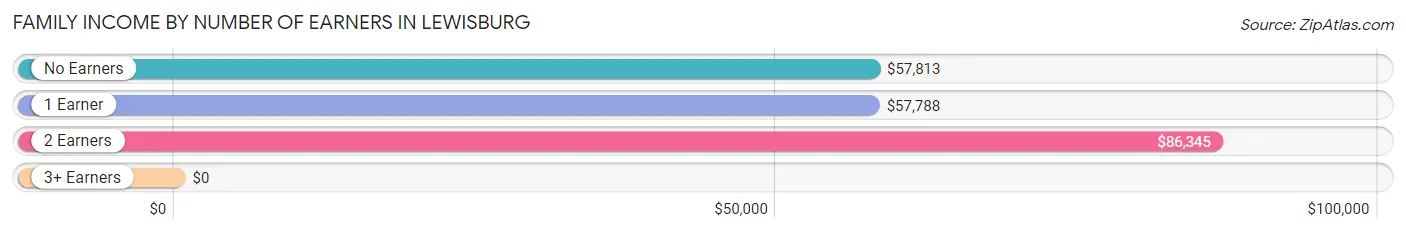
| Number of Earners | # Families | Median Income |
| No Earners | 147 (21.1%) | $57,813 |
| 1 Earner | 177 (25.4%) | $57,788 |
| 2 Earners | 341 (48.8%) | $86,345 |
| 3+ Earners | 33 (4.7%) | $0 |
| Total | 698 (100.0%) | $76,739 |
Household Income in Lewisburg
Household Income Brackets in Lewisburg
With 346 households falling in the category, the $75,000 to $99,999 income range is the most frequent in Lewisburg, accounting for 18.7% of all households. In contrast, only 41 households (2.2%) fall into the $150,000 to $199,999 income bracket, making it the least populous group.
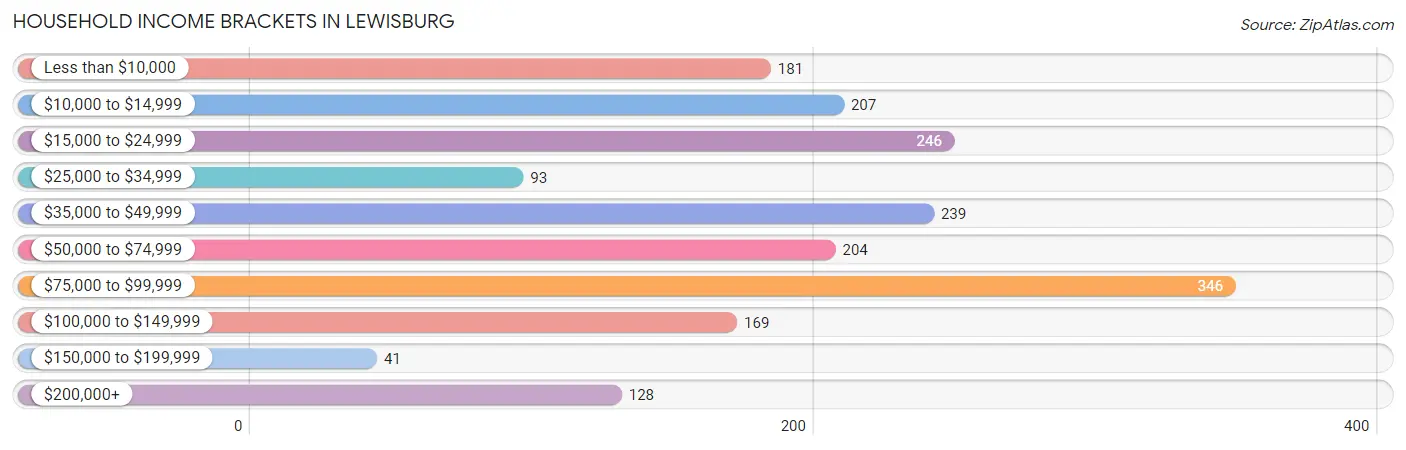
| Income Bracket | # Households | % Households |
| Less than $10,000 | 181 | 9.8% |
| $10,000 to $14,999 | 207 | 11.2% |
| $15,000 to $24,999 | 246 | 13.3% |
| $25,000 to $34,999 | 93 | 5.0% |
| $35,000 to $49,999 | 239 | 12.9% |
| $50,000 to $74,999 | 204 | 11.0% |
| $75,000 to $99,999 | 346 | 18.7% |
| $100,000 to $149,999 | 169 | 9.1% |
| $150,000 to $199,999 | 41 | 2.2% |
| $200,000+ | 128 | 6.9% |
Household Income by Householder Age in Lewisburg
The median household income in Lewisburg is $47,563, with the highest median household income of $57,353 found in the 45 to 64 years age bracket for the primary householder. A total of 380 households (20.5%) fall into this category. Meanwhile, the 15 to 24 years age bracket for the primary householder has the lowest median household income of $0, with 45 households (2.4%) in this group.
| Income Bracket | # Households | Median Income |
| 15 to 24 Years | 45 (2.4%) | $0 |
| 25 to 44 Years | 613 (33.1%) | $46,211 |
| 45 to 64 Years | 380 (20.5%) | $57,353 |
| 65+ Years | 814 (44.0%) | $41,809 |
| Total | 1,852 (100.0%) | $47,563 |
Poverty in Lewisburg
Income Below Poverty by Sex and Age in Lewisburg
With 26.7% poverty level for males and 21.0% for females among the residents of Lewisburg, 12 to 14 year old males and 18 to 24 year old females are the most vulnerable to poverty, with 19 males (100.0%) and 98 females (100.0%) in their respective age groups living below the poverty level.
| Age Bracket | Male | Female |
| Under 5 Years | 84 (44.4%) | 0 (0.0%) |
| 5 Years | 0 (0.0%) | 0 (0.0%) |
| 6 to 11 Years | 0 (0.0%) | 0 (0.0%) |
| 12 to 14 Years | 19 (100.0%) | 22 (13.6%) |
| 15 Years | 0 (0.0%) | 0 (0.0%) |
| 16 and 17 Years | 0 (0.0%) | 22 (36.7%) |
| 18 to 24 Years | 65 (47.8%) | 98 (100.0%) |
| 25 to 34 Years | 80 (45.5%) | 88 (34.8%) |
| 35 to 44 Years | 67 (27.0%) | 72 (23.0%) |
| 45 to 54 Years | 69 (48.9%) | 15 (7.5%) |
| 55 to 64 Years | 43 (19.8%) | 0 (0.0%) |
| 65 to 74 Years | 5 (2.8%) | 127 (33.6%) |
| 75 Years and over | 16 (7.9%) | 11 (4.6%) |
| Total | 448 (26.7%) | 455 (21.0%) |
Income Above Poverty by Sex and Age in Lewisburg
According to the poverty statistics in Lewisburg, males aged 6 to 11 years and females aged 5 years are the age groups that are most secure financially, with 100.0% of males and 100.0% of females in these age groups living above the poverty line.
| Age Bracket | Male | Female |
| Under 5 Years | 105 (55.6%) | 0 (0.0%) |
| 5 Years | 0 (0.0%) | 88 (100.0%) |
| 6 to 11 Years | 167 (100.0%) | 171 (100.0%) |
| 12 to 14 Years | 0 (0.0%) | 140 (86.4%) |
| 15 Years | 0 (0.0%) | 37 (100.0%) |
| 16 and 17 Years | 0 (0.0%) | 38 (63.3%) |
| 18 to 24 Years | 71 (52.2%) | 0 (0.0%) |
| 25 to 34 Years | 96 (54.5%) | 165 (65.2%) |
| 35 to 44 Years | 181 (73.0%) | 241 (77.0%) |
| 45 to 54 Years | 72 (51.1%) | 186 (92.5%) |
| 55 to 64 Years | 174 (80.2%) | 166 (100.0%) |
| 65 to 74 Years | 175 (97.2%) | 251 (66.4%) |
| 75 Years and over | 187 (92.1%) | 228 (95.4%) |
| Total | 1,228 (73.3%) | 1,711 (79.0%) |
Income Below Poverty Among Married-Couple Families in Lewisburg
| Children | Above Poverty | Below Poverty |
| No Children | 246 (100.0%) | 0 (0.0%) |
| 1 or 2 Children | 210 (100.0%) | 0 (0.0%) |
| 3 or 4 Children | 52 (100.0%) | 0 (0.0%) |
| 5 or more Children | 0 (0.0%) | 0 (0.0%) |
| Total | 508 (100.0%) | 0 (0.0%) |
Income Below Poverty Among Single-Parent Households in Lewisburg
According to the poverty data in Lewisburg, 61.3% or 19 single-father households and 50.9% or 81 single-mother households are living below the poverty line. Among single-father households, those with 3 or 4 children have the highest poverty rate, with 19 households (100.0%) experiencing poverty. Likewise, among single-mother households, those with no children have the highest poverty rate, with 20 households (74.1%) falling below the poverty line.
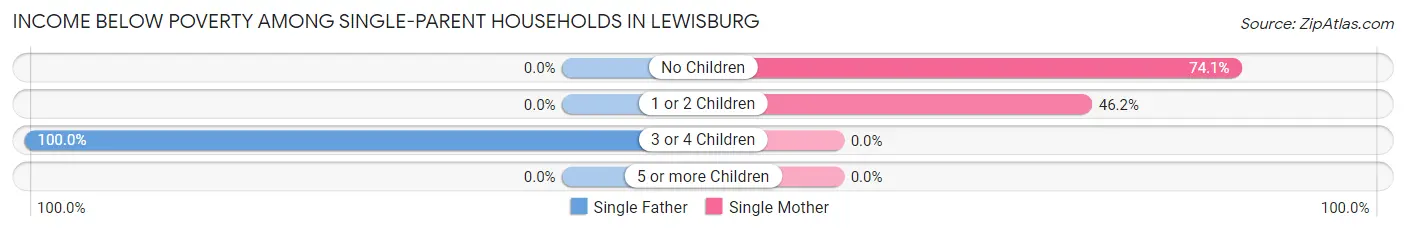
| Children | Single Father | Single Mother |
| No Children | 0 (0.0%) | 20 (74.1%) |
| 1 or 2 Children | 0 (0.0%) | 61 (46.2%) |
| 3 or 4 Children | 19 (100.0%) | 0 (0.0%) |
| 5 or more Children | 0 (0.0%) | 0 (0.0%) |
| Total | 19 (61.3%) | 81 (50.9%) |
Income Below Poverty Among Married-Couple vs Single-Parent Households in Lewisburg
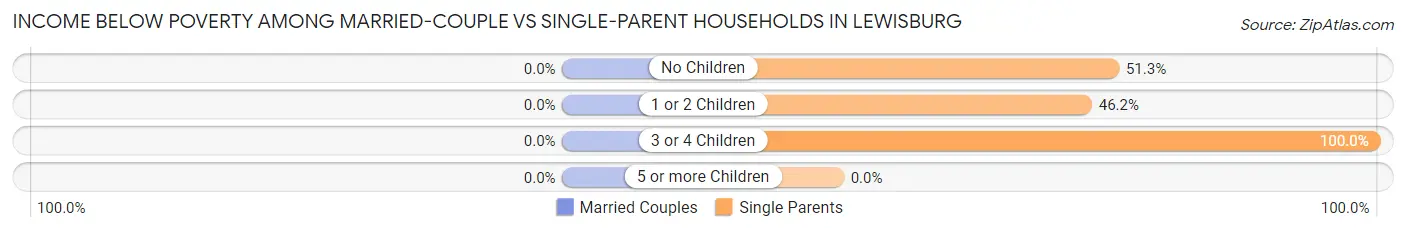
| Children | Married-Couple Families | Single-Parent Households |
| No Children | 0 (0.0%) | 20 (51.3%) |
| 1 or 2 Children | 0 (0.0%) | 61 (46.2%) |
| 3 or 4 Children | 0 (0.0%) | 19 (100.0%) |
| 5 or more Children | 0 (0.0%) | 0 (0.0%) |
| Total | 0 (0.0%) | 100 (52.6%) |
Race in Lewisburg
The most populous races in Lewisburg are White / Caucasian (3,591 | 92.3%), Asian (194 | 5.0%), and Hispanic or Latino (150 | 3.9%).
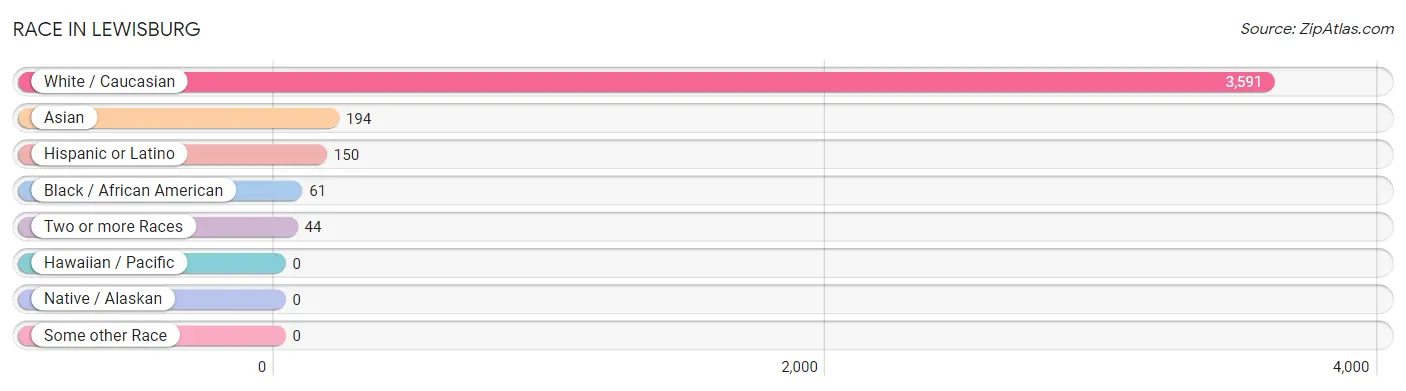
| Race | # Population | % Population |
| Asian | 194 | 5.0% |
| Black / African American | 61 | 1.6% |
| Hawaiian / Pacific | 0 | 0.0% |
| Hispanic or Latino | 150 | 3.9% |
| Native / Alaskan | 0 | 0.0% |
| White / Caucasian | 3,591 | 92.3% |
| Two or more Races | 44 | 1.1% |
| Some other Race | 0 | 0.0% |
| Total | 3,890 | 100.0% |
Ancestry in Lewisburg
The most populous ancestries reported in Lewisburg are English (1,108 | 28.5%), American (1,097 | 28.2%), Irish (608 | 15.6%), German (297 | 7.6%), and French (149 | 3.8%), together accounting for 83.8% of all Lewisburg residents.
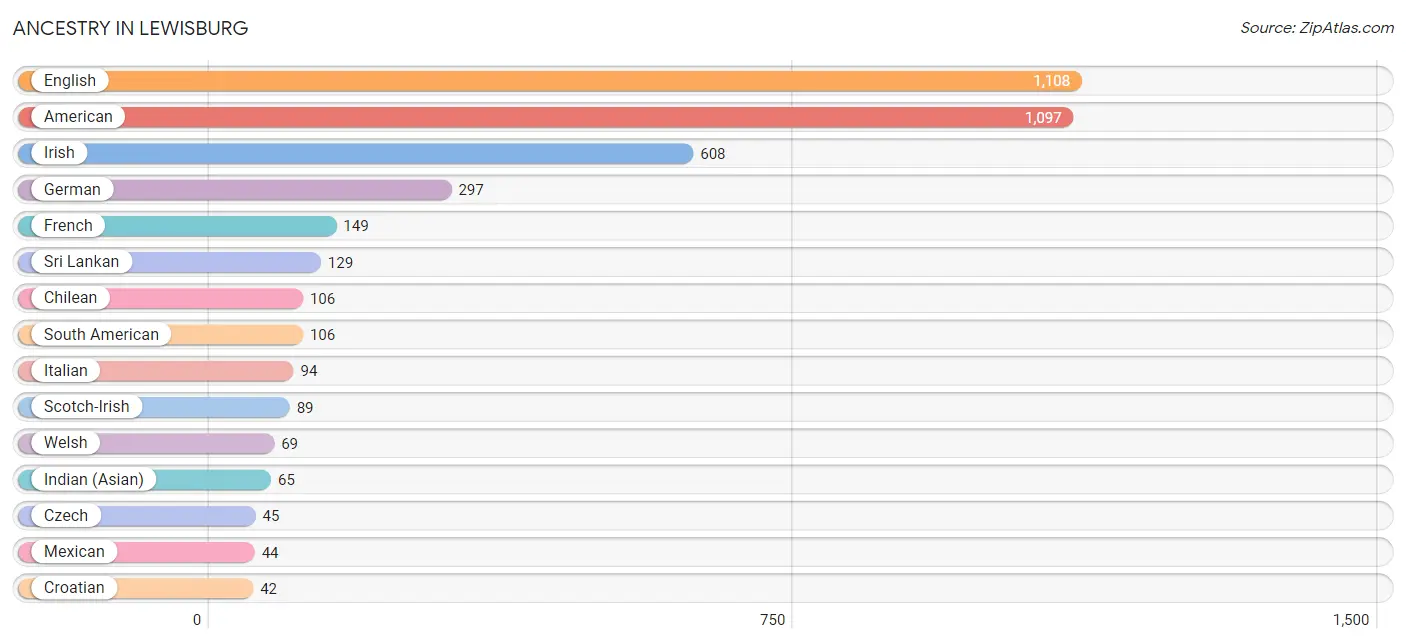
| Ancestry | # Population | % Population |
| American | 1,097 | 28.2% |
| British | 10 | 0.3% |
| Chilean | 106 | 2.7% |
| Croatian | 42 | 1.1% |
| Czech | 45 | 1.2% |
| English | 1,108 | 28.5% |
| European | 23 | 0.6% |
| French | 149 | 3.8% |
| German | 297 | 7.6% |
| Greek | 11 | 0.3% |
| Indian (Asian) | 65 | 1.7% |
| Irish | 608 | 15.6% |
| Italian | 94 | 2.4% |
| Mexican | 44 | 1.1% |
| Norwegian | 9 | 0.2% |
| Polish | 16 | 0.4% |
| Romanian | 18 | 0.5% |
| Russian | 25 | 0.6% |
| Scotch-Irish | 89 | 2.3% |
| Scottish | 42 | 1.1% |
| South American | 106 | 2.7% |
| Sri Lankan | 129 | 3.3% |
| Swedish | 10 | 0.3% |
| Ukrainian | 32 | 0.8% |
| Welsh | 69 | 1.8% | View All 25 Rows |
Immigrants in Lewisburg
The most numerous immigrant groups reported in Lewisburg came from Asia (128 | 3.3%), China (65 | 1.7%), Eastern Asia (65 | 1.7%), South Eastern Asia (63 | 1.6%), and Vietnam (63 | 1.6%), together accounting for 9.9% of all Lewisburg residents.
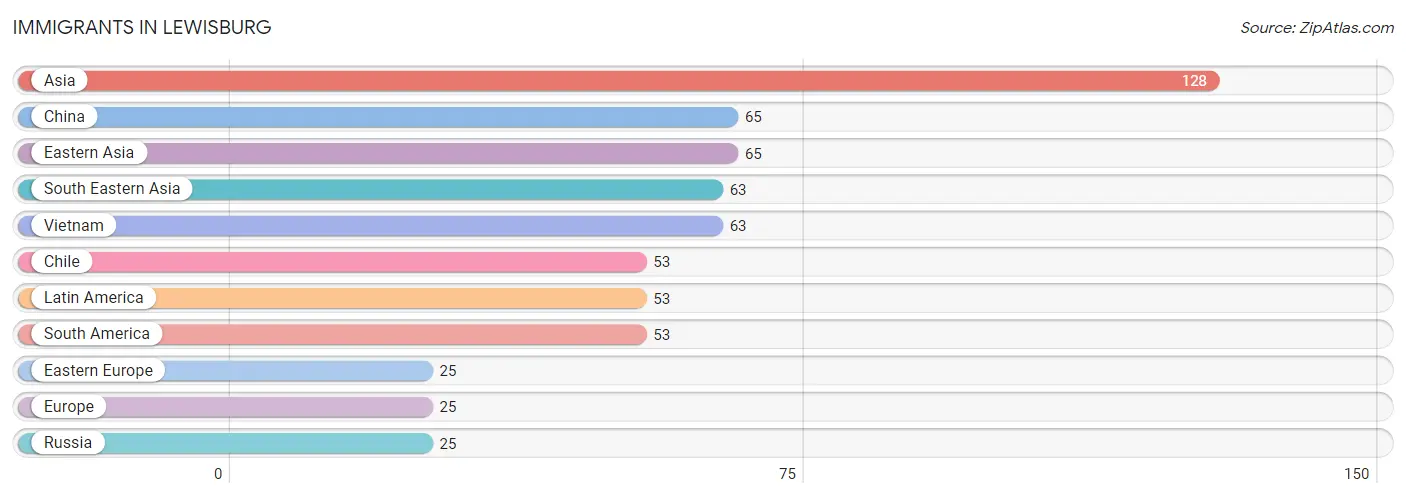
| Immigration Origin | # Population | % Population |
| Asia | 128 | 3.3% |
| Chile | 53 | 1.4% |
| China | 65 | 1.7% |
| Eastern Asia | 65 | 1.7% |
| Eastern Europe | 25 | 0.6% |
| Europe | 25 | 0.6% |
| Latin America | 53 | 1.4% |
| Russia | 25 | 0.6% |
| South America | 53 | 1.4% |
| South Eastern Asia | 63 | 1.6% |
| Vietnam | 63 | 1.6% | View All 11 Rows |
Sex and Age in Lewisburg
Sex and Age in Lewisburg
The most populous age groups in Lewisburg are 35 to 39 Years (195 | 11.6%) for men and 35 to 39 Years (273 | 12.3%) for women.
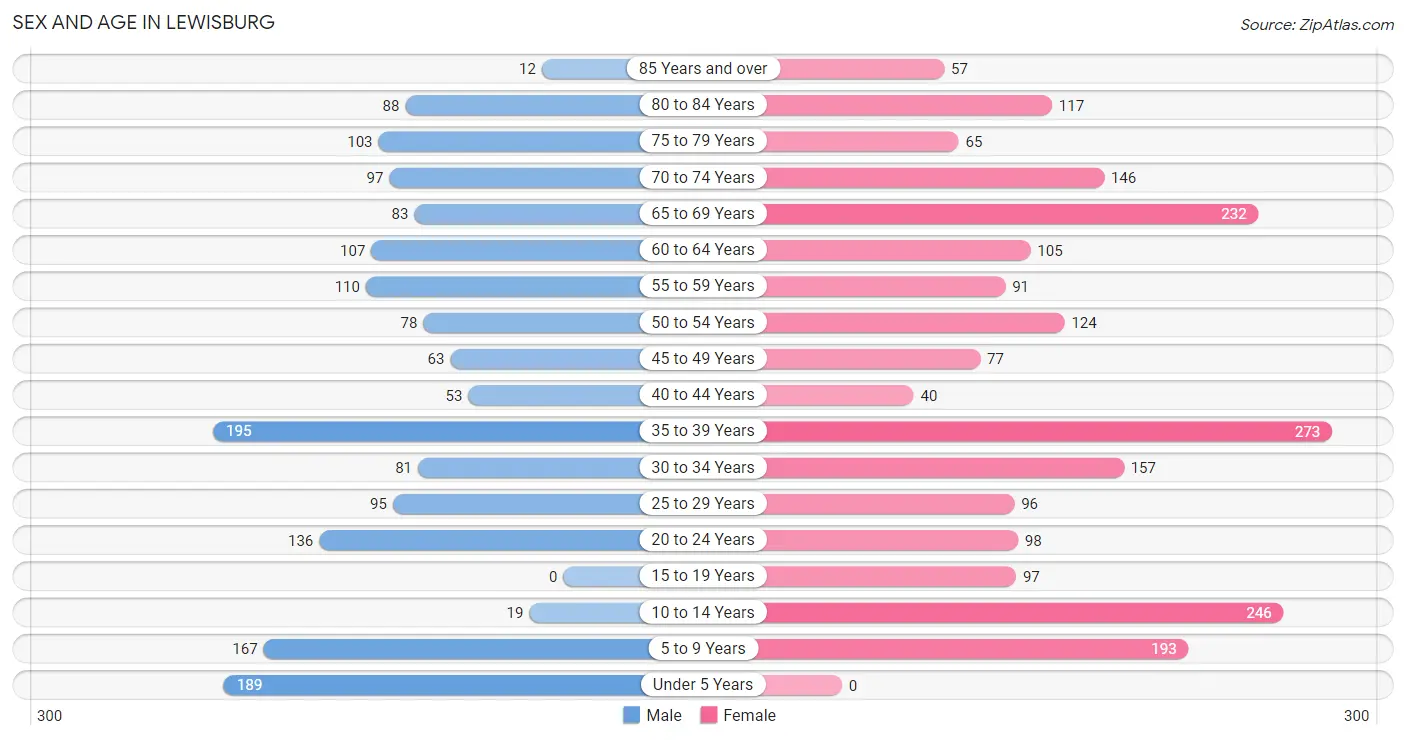
| Age Bracket | Male | Female |
| Under 5 Years | 189 (11.3%) | 0 (0.0%) |
| 5 to 9 Years | 167 (10.0%) | 193 (8.7%) |
| 10 to 14 Years | 19 (1.1%) | 246 (11.1%) |
| 15 to 19 Years | 0 (0.0%) | 97 (4.4%) |
| 20 to 24 Years | 136 (8.1%) | 98 (4.4%) |
| 25 to 29 Years | 95 (5.7%) | 96 (4.3%) |
| 30 to 34 Years | 81 (4.8%) | 157 (7.1%) |
| 35 to 39 Years | 195 (11.6%) | 273 (12.3%) |
| 40 to 44 Years | 53 (3.2%) | 40 (1.8%) |
| 45 to 49 Years | 63 (3.8%) | 77 (3.5%) |
| 50 to 54 Years | 78 (4.6%) | 124 (5.6%) |
| 55 to 59 Years | 110 (6.6%) | 91 (4.1%) |
| 60 to 64 Years | 107 (6.4%) | 105 (4.7%) |
| 65 to 69 Years | 83 (5.0%) | 232 (10.5%) |
| 70 to 74 Years | 97 (5.8%) | 146 (6.6%) |
| 75 to 79 Years | 103 (6.1%) | 65 (2.9%) |
| 80 to 84 Years | 88 (5.2%) | 117 (5.3%) |
| 85 Years and over | 12 (0.7%) | 57 (2.6%) |
| Total | 1,676 (100.0%) | 2,214 (100.0%) |
Families and Households in Lewisburg
Median Family Size in Lewisburg
The median family size in Lewisburg is 3.40 persons per family, with single male/father families (31 | 4.4%) accounting for the largest median family size of 5.03 persons per family. On the other hand, single female/mother families (159 | 22.8%) represent the smallest median family size with 2.39 persons per family.
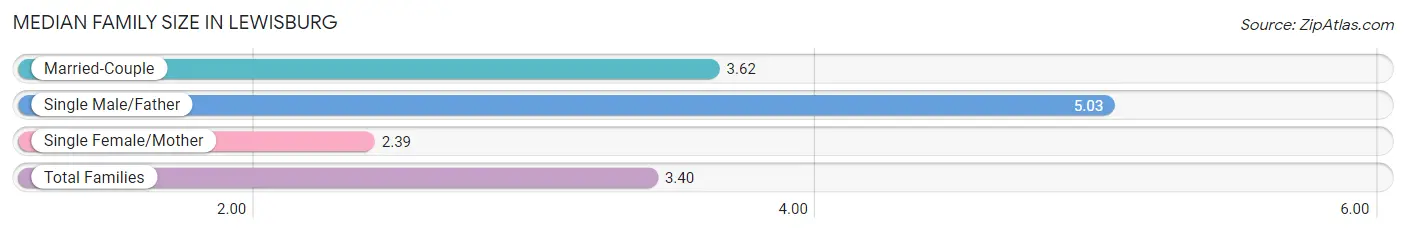
| Family Type | # Families | Family Size |
| Married-Couple | 508 (72.8%) | 3.62 |
| Single Male/Father | 31 (4.4%) | 5.03 |
| Single Female/Mother | 159 (22.8%) | 2.39 |
| Total Families | 698 (100.0%) | 3.40 |
Median Household Size in Lewisburg
The median household size in Lewisburg is 2.06 persons per household, with single male/father households (31 | 1.7%) accounting for the largest median household size of 5.03 persons per household. non-family households (1,154 | 62.3%) represent the smallest median household size with 1.20 persons per household.
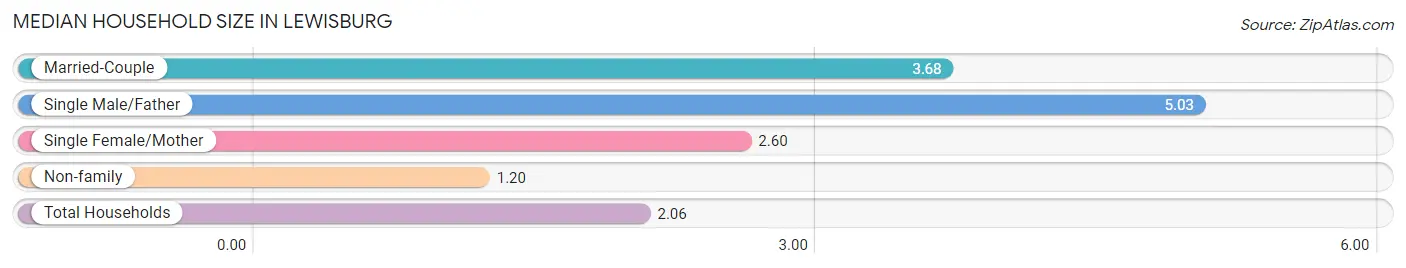
| Household Type | # Households | Household Size |
| Married-Couple | 508 (27.4%) | 3.68 |
| Single Male/Father | 31 (1.7%) | 5.03 |
| Single Female/Mother | 159 (8.6%) | 2.60 |
| Non-family | 1,154 (62.3%) | 1.20 |
| Total Households | 1,852 (100.0%) | 2.06 |
Household Size by Marriage Status in Lewisburg
Out of a total of 1,852 households in Lewisburg, 698 (37.7%) are family households, while 1,154 (62.3%) are nonfamily households. The most numerous type of family households are 2-person households, comprising 367, and the most common type of nonfamily households are 1-person households, comprising 1,006.
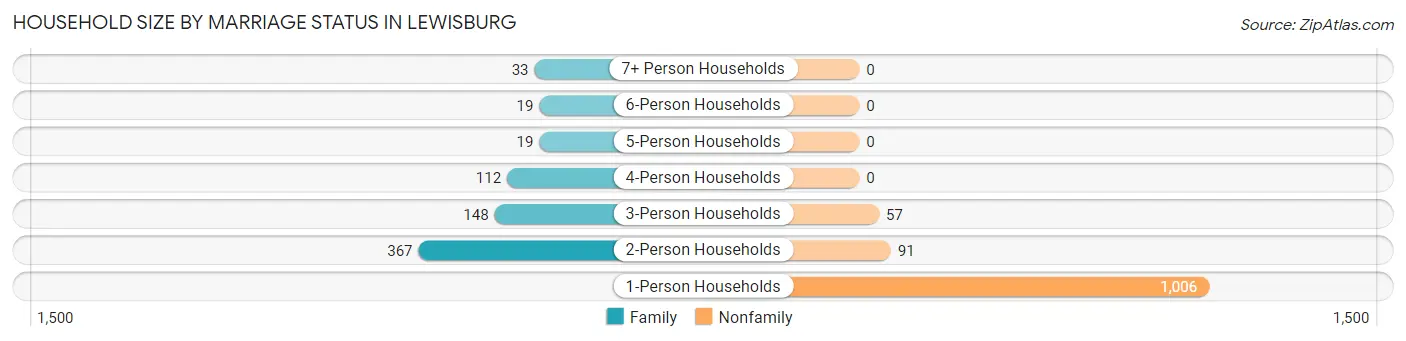
| Household Size | Family Households | Nonfamily Households |
| 1-Person Households | - | 1,006 (54.3%) |
| 2-Person Households | 367 (19.8%) | 91 (4.9%) |
| 3-Person Households | 148 (8.0%) | 57 (3.1%) |
| 4-Person Households | 112 (6.0%) | 0 (0.0%) |
| 5-Person Households | 19 (1.0%) | 0 (0.0%) |
| 6-Person Households | 19 (1.0%) | 0 (0.0%) |
| 7+ Person Households | 33 (1.8%) | 0 (0.0%) |
| Total | 698 (37.7%) | 1,154 (62.3%) |
Female Fertility in Lewisburg
Fertility by Age in Lewisburg
Average fertility rate in Lewisburg is 61.0 births per 1,000 women. Women in the age bracket of 20 to 34 years have the highest fertility rate with 151.0 births per 1,000 women. Women in the age bracket of 20 to 34 years acount for 100.0% of all women with births.
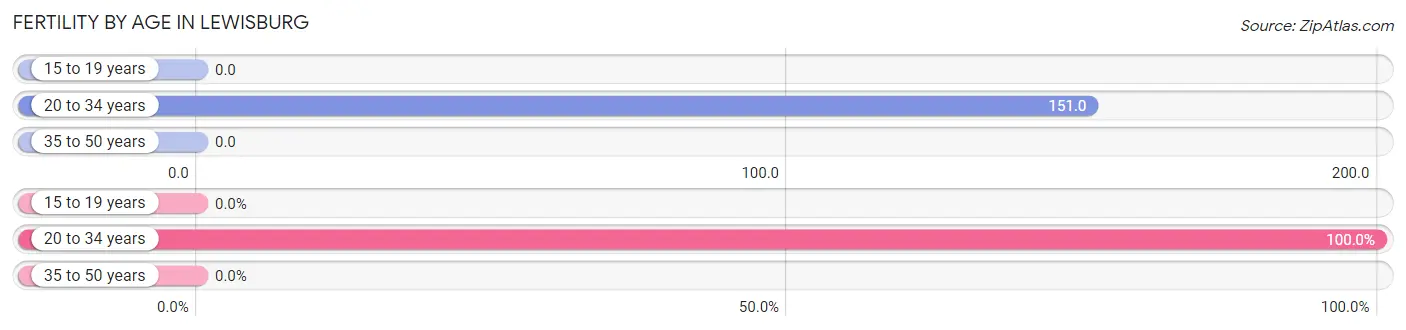
| Age Bracket | Women with Births | Births / 1,000 Women |
| 15 to 19 years | 0 (0.0%) | 0.0 |
| 20 to 34 years | 53 (100.0%) | 151.0 |
| 35 to 50 years | 0 (0.0%) | 0.0 |
| Total | 53 (100.0%) | 61.0 |
Fertility by Age by Marriage Status in Lewisburg
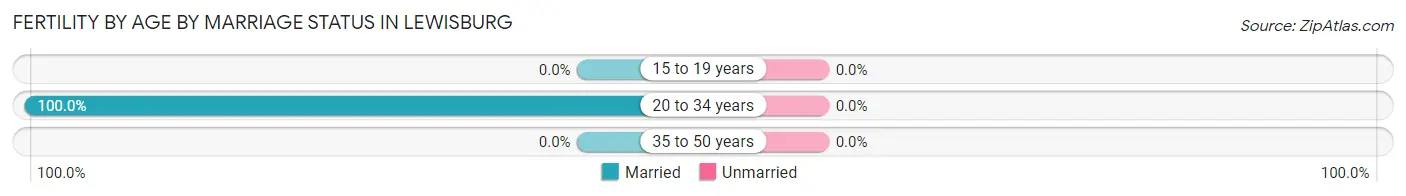
| Age Bracket | Married | Unmarried |
| 15 to 19 years | 0 (0.0%) | 0 (0.0%) |
| 20 to 34 years | 53 (100.0%) | 0 (0.0%) |
| 35 to 50 years | 0 (0.0%) | 0 (0.0%) |
| Total | 53 (100.0%) | 0 (0.0%) |
Fertility by Education in Lewisburg
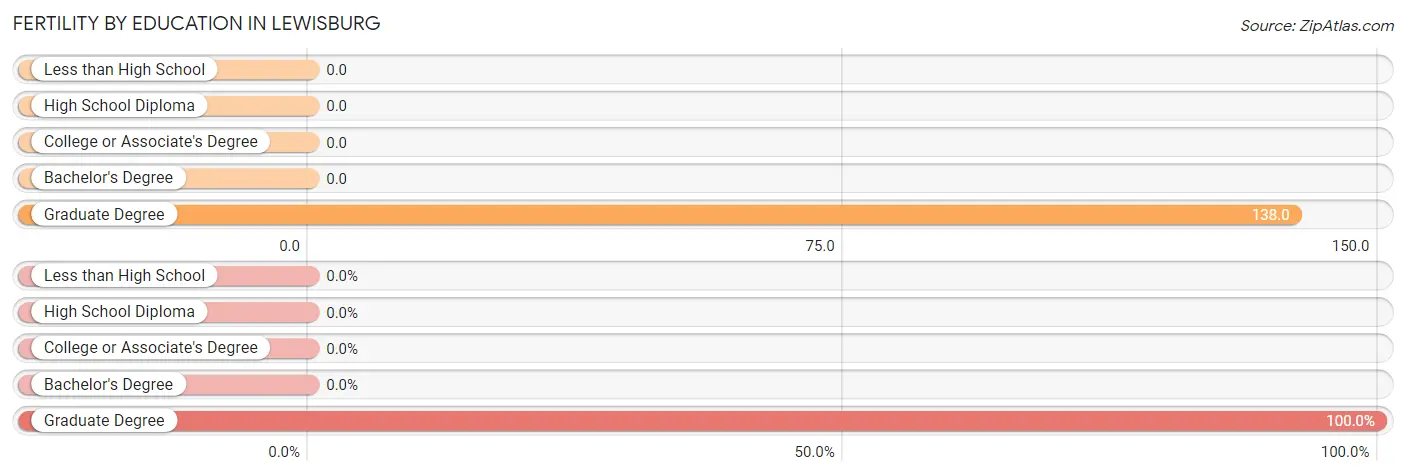
| Educational Attainment | Women with Births | Births / 1,000 Women |
| Less than High School | 0 (0.0%) | 0.0 |
| High School Diploma | 0 (0.0%) | 0.0 |
| College or Associate's Degree | 0 (0.0%) | 0.0 |
| Bachelor's Degree | 0 (0.0%) | 0.0 |
| Graduate Degree | 53 (100.0%) | 138.0 |
| Total | 53 (100.0%) | 61.0 |
Fertility by Education by Marriage Status in Lewisburg
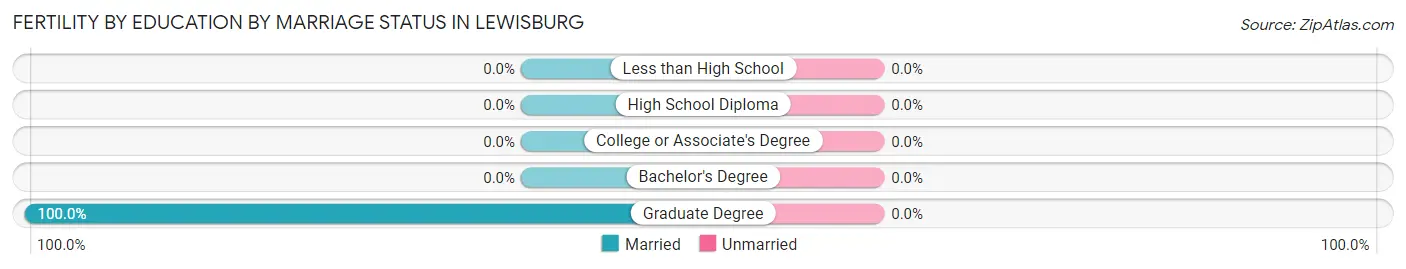
| Educational Attainment | Married | Unmarried |
| Less than High School | 0 (0.0%) | 0 (0.0%) |
| High School Diploma | 0 (0.0%) | 0 (0.0%) |
| College or Associate's Degree | 0 (0.0%) | 0 (0.0%) |
| Bachelor's Degree | 0 (0.0%) | 0 (0.0%) |
| Graduate Degree | 53 (100.0%) | 0 (0.0%) |
| Total | 53 (100.0%) | 0 (0.0%) |
Employment Characteristics in Lewisburg
Employment by Class of Employer in Lewisburg
Among the 1,465 employed individuals in Lewisburg, private company employees (811 | 55.4%), state government employees (217 | 14.8%), and not-for-profit organizations (202 | 13.8%) make up the most common classes of employment.
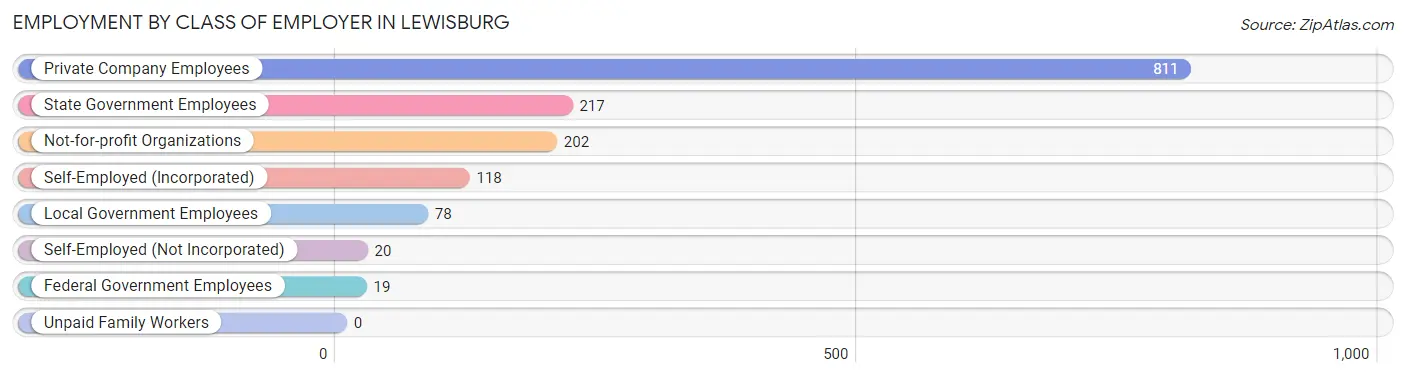
| Employer Class | # Employees | % Employees |
| Private Company Employees | 811 | 55.4% |
| Self-Employed (Incorporated) | 118 | 8.1% |
| Self-Employed (Not Incorporated) | 20 | 1.4% |
| Not-for-profit Organizations | 202 | 13.8% |
| Local Government Employees | 78 | 5.3% |
| State Government Employees | 217 | 14.8% |
| Federal Government Employees | 19 | 1.3% |
| Unpaid Family Workers | 0 | 0.0% |
| Total | 1,465 | 100.0% |
Employment Status by Age in Lewisburg
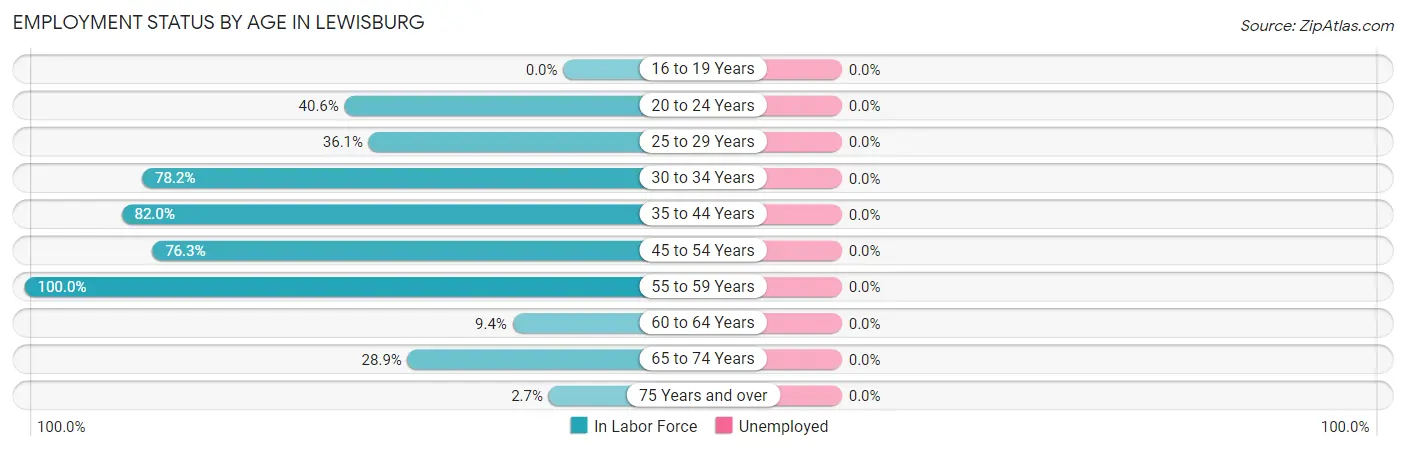
| Age Bracket | In Labor Force | Unemployed |
| 16 to 19 Years | 0 (0.0%) | 0 (0.0%) |
| 20 to 24 Years | 95 (40.6%) | 0 (0.0%) |
| 25 to 29 Years | 69 (36.1%) | 0 (0.0%) |
| 30 to 34 Years | 186 (78.2%) | 0 (0.0%) |
| 35 to 44 Years | 460 (82.0%) | 0 (0.0%) |
| 45 to 54 Years | 261 (76.3%) | 0 (0.0%) |
| 55 to 59 Years | 201 (100.0%) | 0 (0.0%) |
| 60 to 64 Years | 20 (9.4%) | 0 (0.0%) |
| 65 to 74 Years | 161 (28.9%) | 0 (0.0%) |
| 75 Years and over | 12 (2.7%) | 0 (0.0%) |
| Total | 1,465 (48.2%) | 0 (0.0%) |
Employment Status by Educational Attainment in Lewisburg
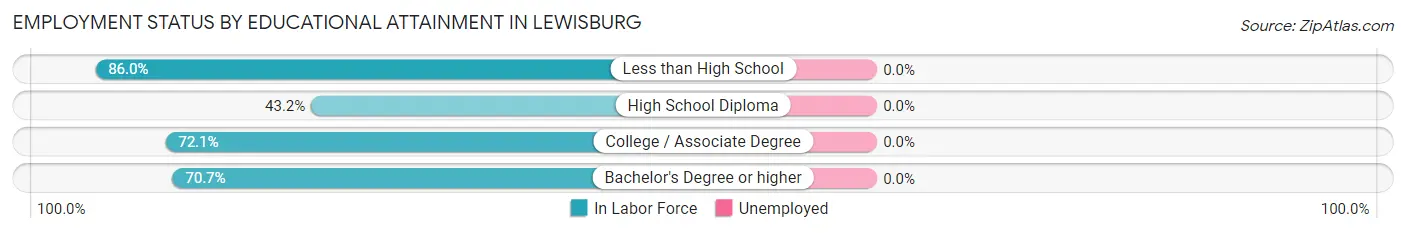
| Educational Attainment | In Labor Force | Unemployed |
| Less than High School | 43 (86.0%) | 0 (0.0%) |
| High School Diploma | 79 (43.2%) | 0 (0.0%) |
| College / Associate Degree | 313 (72.1%) | 0 (0.0%) |
| Bachelor's Degree or higher | 762 (70.7%) | 0 (0.0%) |
| Total | 1,197 (68.6%) | 0 (0.0%) |
Employment Occupations by Sex in Lewisburg
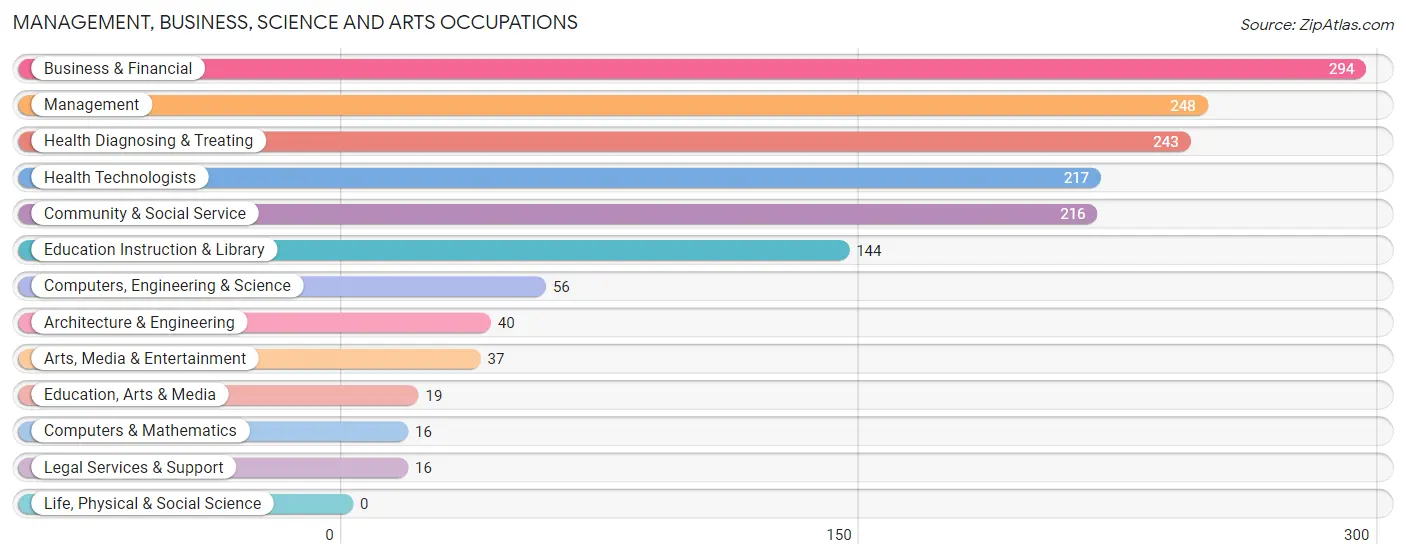
Management, Business, Science and Arts Occupations
The most common Management, Business, Science and Arts occupations in Lewisburg are Business & Financial (294 | 20.1%), Management (248 | 16.9%), Health Diagnosing & Treating (243 | 16.6%), Health Technologists (217 | 14.8%), and Community & Social Service (216 | 14.7%).
Management, Business, Science and Arts Occupations by Sex
Within the Management, Business, Science and Arts occupations in Lewisburg, the most male-oriented occupations are Computers, Engineering & Science (100.0%), Computers & Mathematics (100.0%), and Architecture & Engineering (100.0%), while the most female-oriented occupations are Community & Social Service (100.0%), Education, Arts & Media (100.0%), and Legal Services & Support (100.0%).
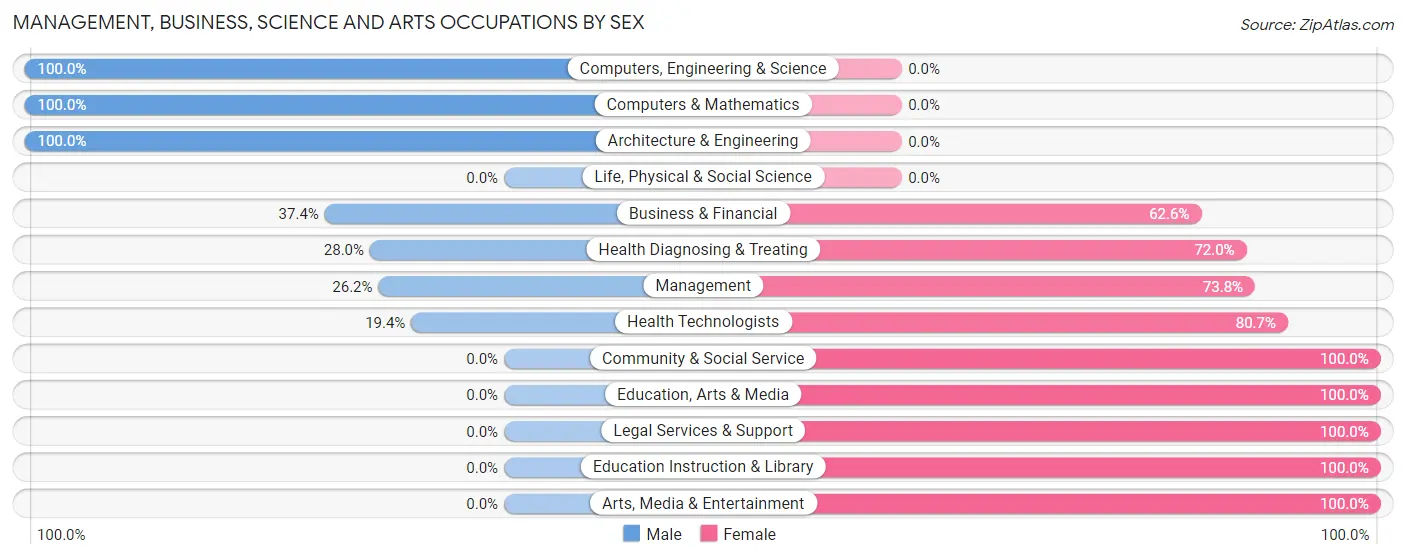
| Occupation | Male | Female |
| Management | 65 (26.2%) | 183 (73.8%) |
| Business & Financial | 110 (37.4%) | 184 (62.6%) |
| Computers, Engineering & Science | 56 (100.0%) | 0 (0.0%) |
| Computers & Mathematics | 16 (100.0%) | 0 (0.0%) |
| Architecture & Engineering | 40 (100.0%) | 0 (0.0%) |
| Life, Physical & Social Science | 0 (0.0%) | 0 (0.0%) |
| Community & Social Service | 0 (0.0%) | 216 (100.0%) |
| Education, Arts & Media | 0 (0.0%) | 19 (100.0%) |
| Legal Services & Support | 0 (0.0%) | 16 (100.0%) |
| Education Instruction & Library | 0 (0.0%) | 144 (100.0%) |
| Arts, Media & Entertainment | 0 (0.0%) | 37 (100.0%) |
| Health Diagnosing & Treating | 68 (28.0%) | 175 (72.0%) |
| Health Technologists | 42 (19.4%) | 175 (80.6%) |
| Total (Category) | 299 (28.3%) | 758 (71.7%) |
| Total (Overall) | 587 (40.1%) | 878 (59.9%) |
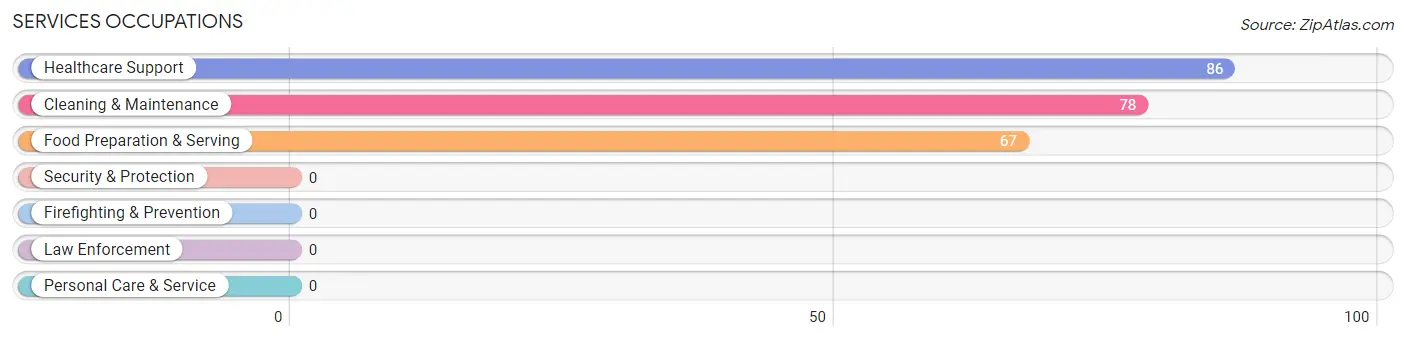
Services Occupations
The most common Services occupations in Lewisburg are Healthcare Support (86 | 5.9%), Cleaning & Maintenance (78 | 5.3%), and Food Preparation & Serving (67 | 4.6%).
Services Occupations by Sex
Within the Services occupations in Lewisburg, the most male-oriented occupations are Food Preparation & Serving (100.0%), Cleaning & Maintenance (74.4%), and Healthcare Support (14.0%), while the most female-oriented occupations are Healthcare Support (86.1%), and Cleaning & Maintenance (25.6%).
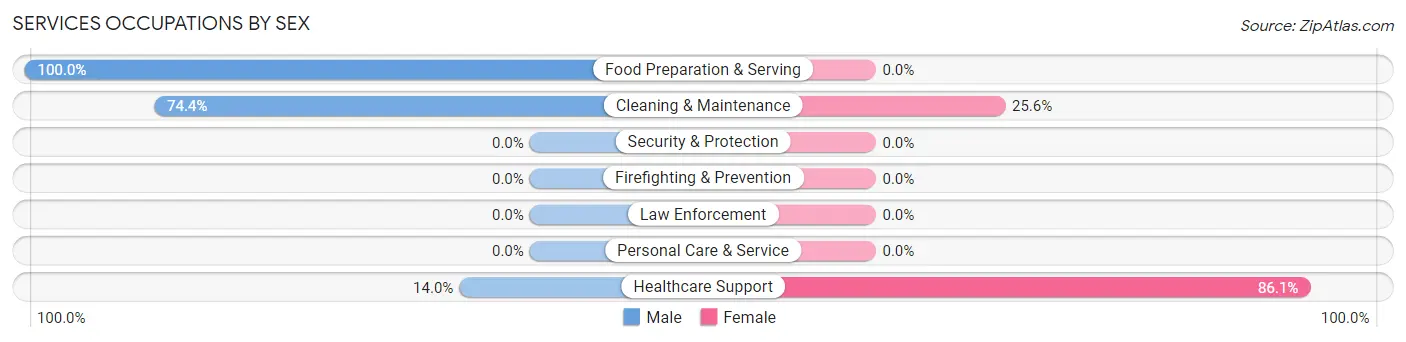
| Occupation | Male | Female |
| Healthcare Support | 12 (14.0%) | 74 (86.1%) |
| Security & Protection | 0 (0.0%) | 0 (0.0%) |
| Firefighting & Prevention | 0 (0.0%) | 0 (0.0%) |
| Law Enforcement | 0 (0.0%) | 0 (0.0%) |
| Food Preparation & Serving | 67 (100.0%) | 0 (0.0%) |
| Cleaning & Maintenance | 58 (74.4%) | 20 (25.6%) |
| Personal Care & Service | 0 (0.0%) | 0 (0.0%) |
| Total (Category) | 137 (59.3%) | 94 (40.7%) |
| Total (Overall) | 587 (40.1%) | 878 (59.9%) |
Sales and Office Occupations
The most common Sales and Office occupations in Lewisburg are , and Sales & Related (88 | 6.0%).
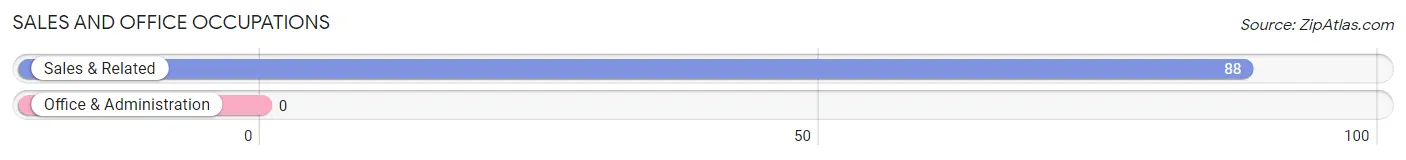
Sales and Office Occupations by Sex
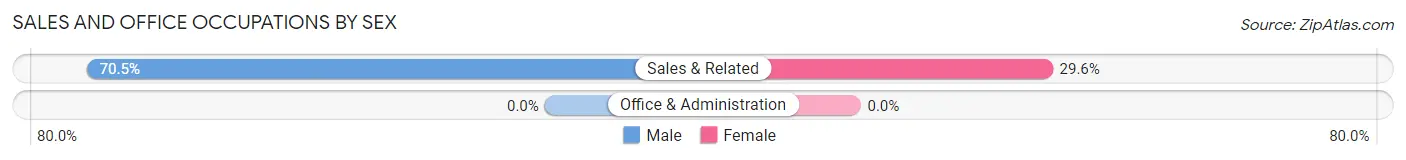
| Occupation | Male | Female |
| Sales & Related | 62 (70.5%) | 26 (29.5%) |
| Office & Administration | 0 (0.0%) | 0 (0.0%) |
| Total (Category) | 62 (70.5%) | 26 (29.5%) |
| Total (Overall) | 587 (40.1%) | 878 (59.9%) |
Natural Resources, Construction and Maintenance Occupations
The most common Natural Resources, Construction and Maintenance occupations in Lewisburg are , and Construction & Extraction (16 | 1.1%).
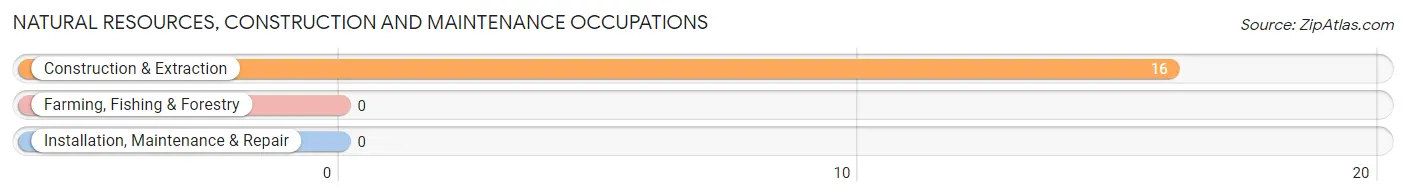
Natural Resources, Construction and Maintenance Occupations by Sex
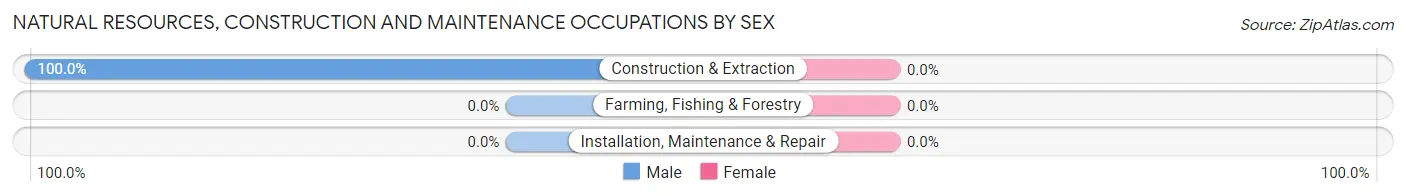
| Occupation | Male | Female |
| Farming, Fishing & Forestry | 0 (0.0%) | 0 (0.0%) |
| Construction & Extraction | 16 (100.0%) | 0 (0.0%) |
| Installation, Maintenance & Repair | 0 (0.0%) | 0 (0.0%) |
| Total (Category) | 16 (100.0%) | 0 (0.0%) |
| Total (Overall) | 587 (40.1%) | 878 (59.9%) |
Production, Transportation and Moving Occupations
The most common Production, Transportation and Moving occupations in Lewisburg are Transportation (30 | 2.1%), Material Moving (22 | 1.5%), and Production (21 | 1.4%).

Production, Transportation and Moving Occupations by Sex
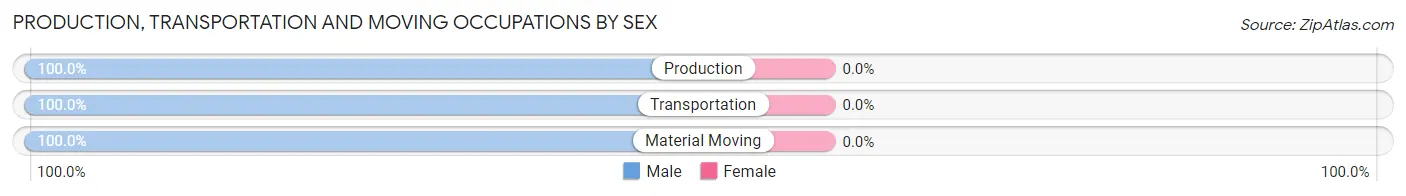
| Occupation | Male | Female |
| Production | 21 (100.0%) | 0 (0.0%) |
| Transportation | 30 (100.0%) | 0 (0.0%) |
| Material Moving | 22 (100.0%) | 0 (0.0%) |
| Total (Category) | 73 (100.0%) | 0 (0.0%) |
| Total (Overall) | 587 (40.1%) | 878 (59.9%) |
Employment Industries by Sex in Lewisburg
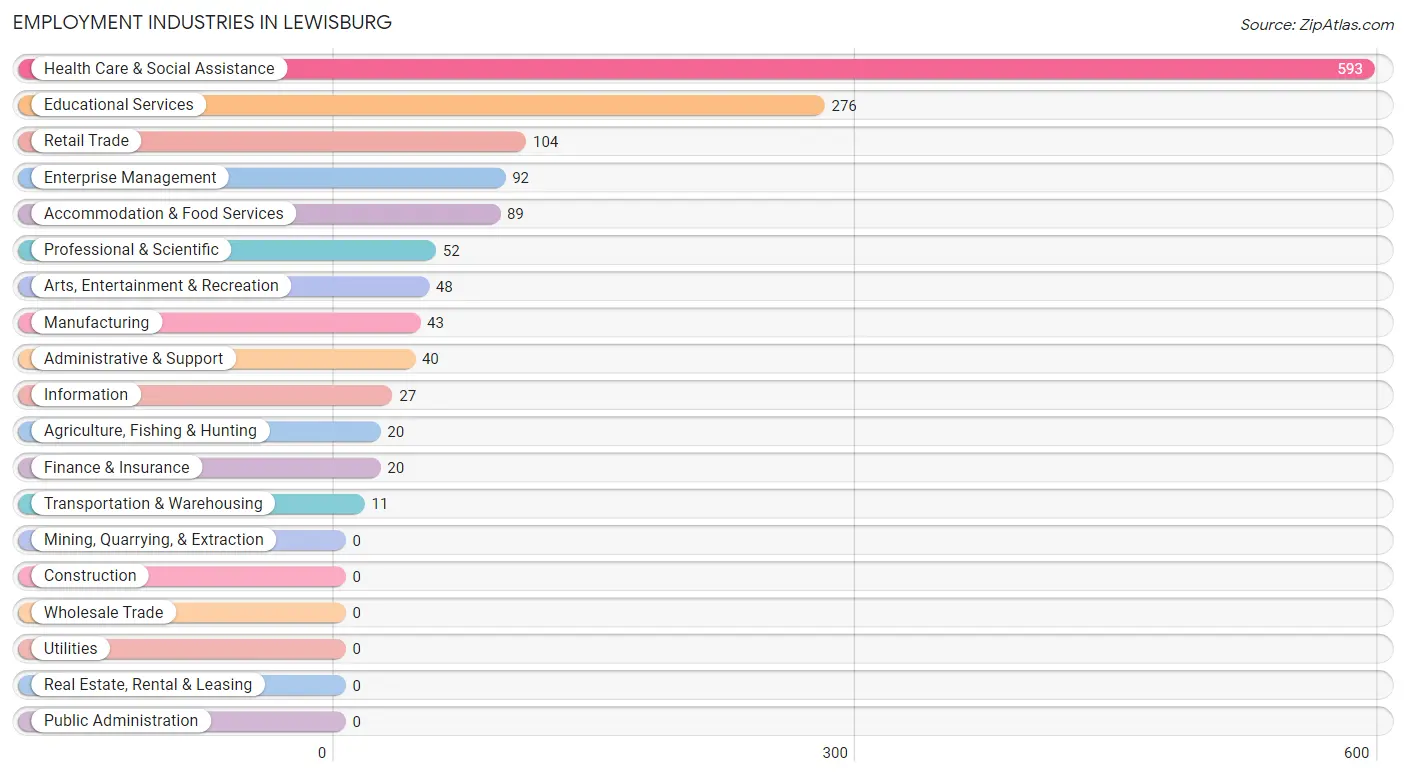
Employment Industries in Lewisburg
The major employment industries in Lewisburg include Health Care & Social Assistance (593 | 40.5%), Educational Services (276 | 18.8%), Retail Trade (104 | 7.1%), Enterprise Management (92 | 6.3%), and Accommodation & Food Services (89 | 6.1%).
Employment Industries by Sex in Lewisburg
The Lewisburg industries that see more men than women are Agriculture, Fishing & Hunting (100.0%), Manufacturing (100.0%), and Transportation & Warehousing (100.0%), whereas the industries that tend to have a higher number of women are Enterprise Management (100.0%), Administrative & Support (100.0%), and Health Care & Social Assistance (79.3%).
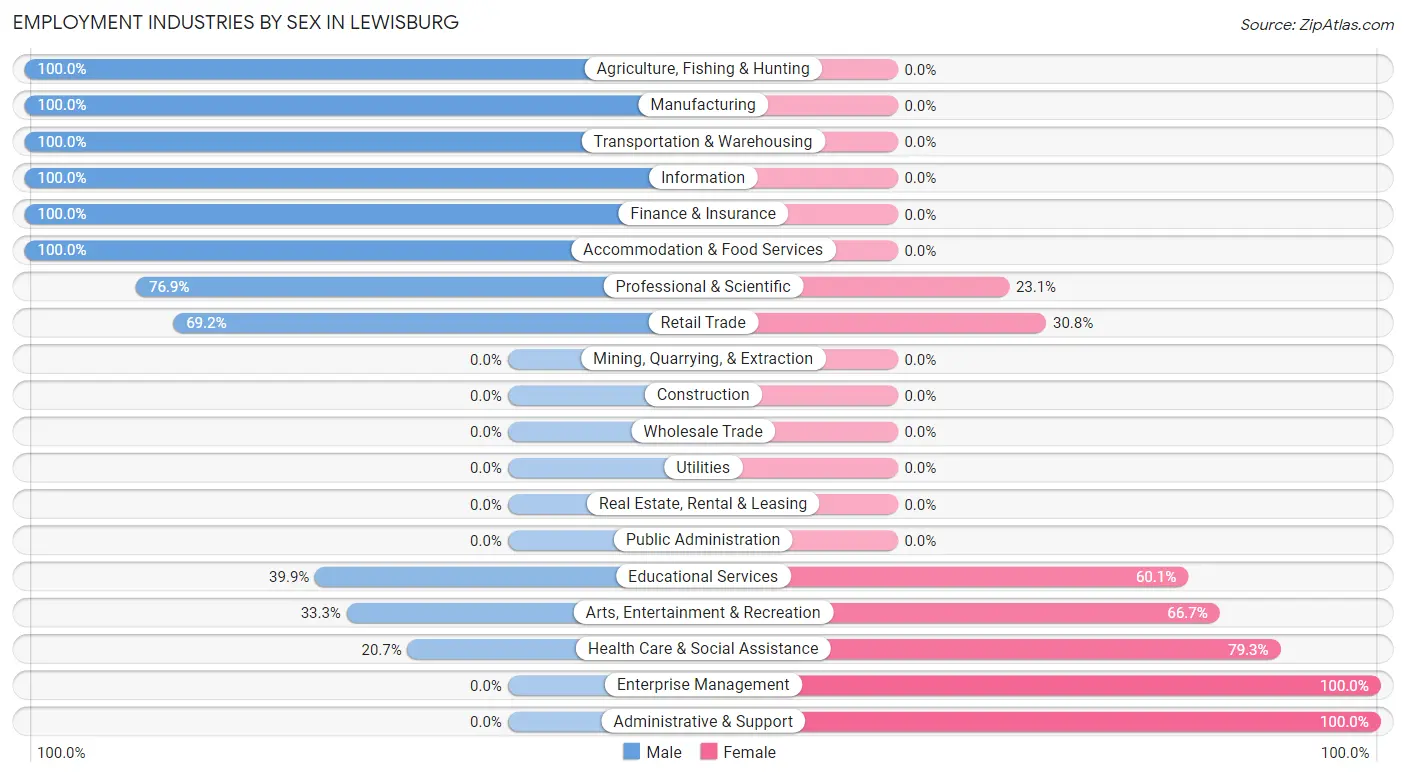
| Industry | Male | Female |
| Agriculture, Fishing & Hunting | 20 (100.0%) | 0 (0.0%) |
| Mining, Quarrying, & Extraction | 0 (0.0%) | 0 (0.0%) |
| Construction | 0 (0.0%) | 0 (0.0%) |
| Manufacturing | 43 (100.0%) | 0 (0.0%) |
| Wholesale Trade | 0 (0.0%) | 0 (0.0%) |
| Retail Trade | 72 (69.2%) | 32 (30.8%) |
| Transportation & Warehousing | 11 (100.0%) | 0 (0.0%) |
| Utilities | 0 (0.0%) | 0 (0.0%) |
| Information | 27 (100.0%) | 0 (0.0%) |
| Finance & Insurance | 20 (100.0%) | 0 (0.0%) |
| Real Estate, Rental & Leasing | 0 (0.0%) | 0 (0.0%) |
| Professional & Scientific | 40 (76.9%) | 12 (23.1%) |
| Enterprise Management | 0 (0.0%) | 92 (100.0%) |
| Administrative & Support | 0 (0.0%) | 40 (100.0%) |
| Educational Services | 110 (39.9%) | 166 (60.1%) |
| Health Care & Social Assistance | 123 (20.7%) | 470 (79.3%) |
| Arts, Entertainment & Recreation | 16 (33.3%) | 32 (66.7%) |
| Accommodation & Food Services | 89 (100.0%) | 0 (0.0%) |
| Public Administration | 0 (0.0%) | 0 (0.0%) |
| Total | 587 (40.1%) | 878 (59.9%) |
Education in Lewisburg
School Enrollment in Lewisburg
The most common levels of schooling among the 1,001 students in Lewisburg are graduate / professional (257 | 25.7%), elementary school (243 | 24.3%), and middle school (209 | 20.9%).
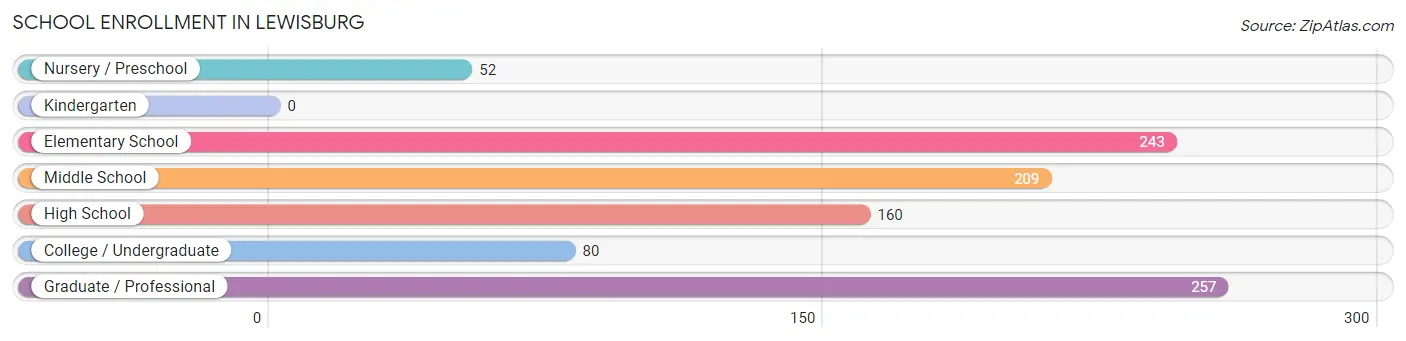
| School Level | # Students | % Students |
| Nursery / Preschool | 52 | 5.2% |
| Kindergarten | 0 | 0.0% |
| Elementary School | 243 | 24.3% |
| Middle School | 209 | 20.9% |
| High School | 160 | 16.0% |
| College / Undergraduate | 80 | 8.0% |
| Graduate / Professional | 257 | 25.7% |
| Total | 1,001 | 100.0% |
School Enrollment by Age by Funding Source in Lewisburg
Out of a total of 1,001 students who are enrolled in schools in Lewisburg, 647 (64.6%) attend a private institution, while the remaining 354 (35.4%) are enrolled in public schools. The age group of 3 to 4 year olds has the highest likelihood of being enrolled in private schools, with 23 (100.0% in the age bracket) enrolled. Conversely, the age group of 15 to 17 year olds has the lowest likelihood of being enrolled in a private school, with 97 (100.0% in the age bracket) attending a public institution.
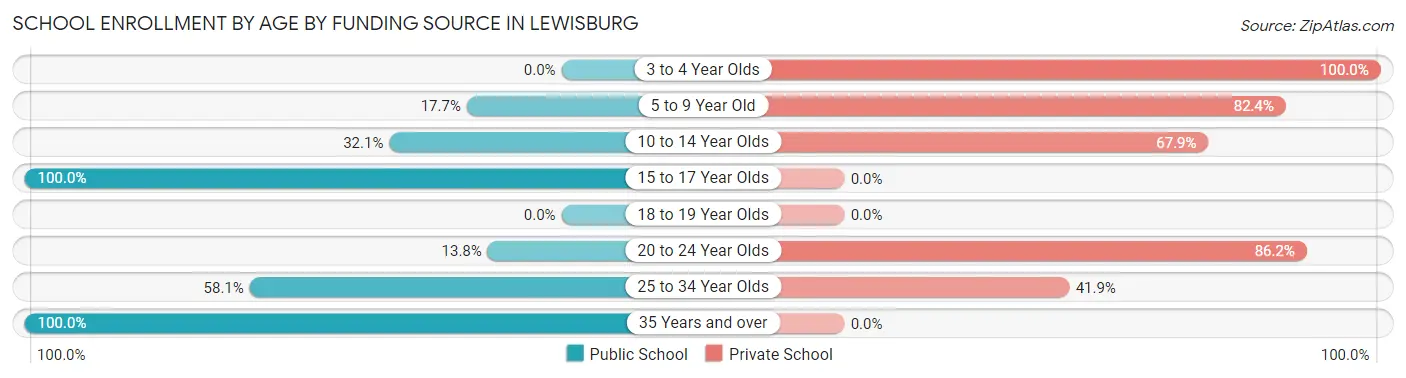
| Age Bracket | Public School | Private School |
| 3 to 4 Year Olds | 0 (0.0%) | 23 (100.0%) |
| 5 to 9 Year Old | 48 (17.6%) | 224 (82.4%) |
| 10 to 14 Year Olds | 85 (32.1%) | 180 (67.9%) |
| 15 to 17 Year Olds | 97 (100.0%) | 0 (0.0%) |
| 18 to 19 Year Olds | 0 (0.0%) | 0 (0.0%) |
| 20 to 24 Year Olds | 26 (13.8%) | 163 (86.2%) |
| 25 to 34 Year Olds | 79 (58.1%) | 57 (41.9%) |
| 35 Years and over | 19 (100.0%) | 0 (0.0%) |
| Total | 354 (35.4%) | 647 (64.6%) |
Educational Attainment by Field of Study in Lewisburg
Education (292 | 18.1%), bio, nature & agricultural (288 | 17.9%), business (230 | 14.3%), science & technology (192 | 11.9%), and liberal arts & history (156 | 9.7%) are the most common fields of study among 1,612 individuals in Lewisburg who have obtained a bachelor's degree or higher.
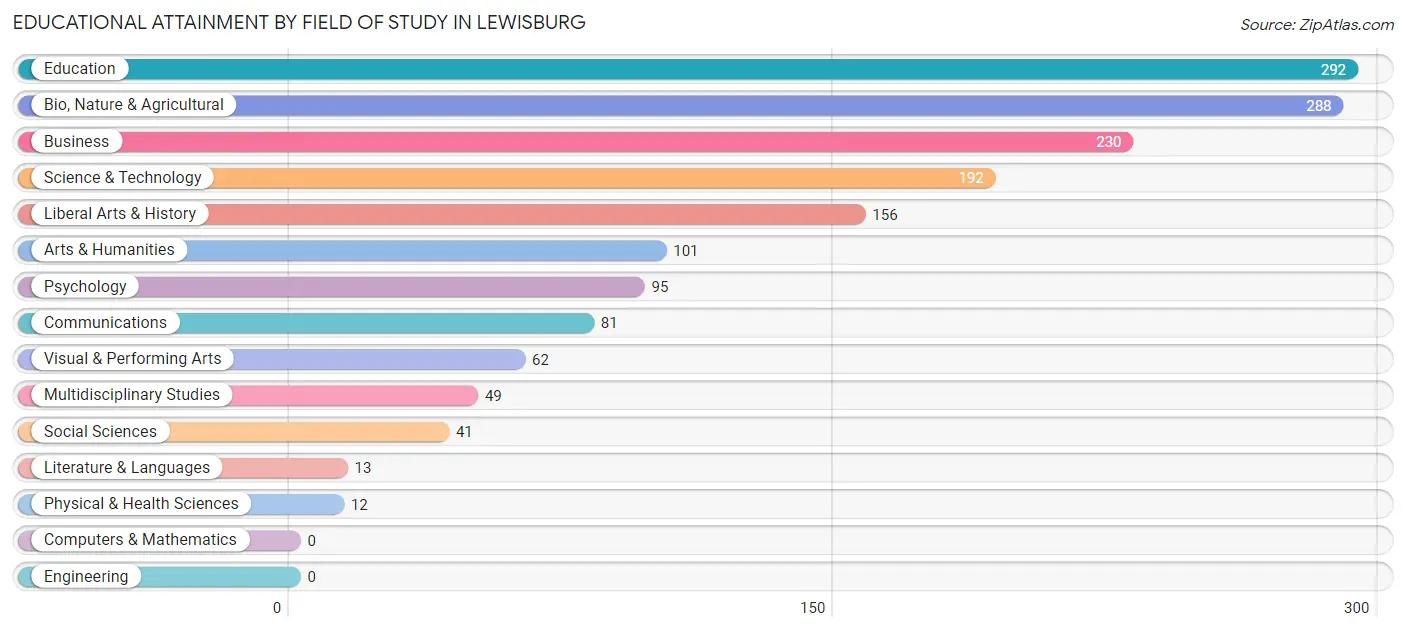
| Field of Study | # Graduates | % Graduates |
| Computers & Mathematics | 0 | 0.0% |
| Bio, Nature & Agricultural | 288 | 17.9% |
| Physical & Health Sciences | 12 | 0.7% |
| Psychology | 95 | 5.9% |
| Social Sciences | 41 | 2.5% |
| Engineering | 0 | 0.0% |
| Multidisciplinary Studies | 49 | 3.0% |
| Science & Technology | 192 | 11.9% |
| Business | 230 | 14.3% |
| Education | 292 | 18.1% |
| Literature & Languages | 13 | 0.8% |
| Liberal Arts & History | 156 | 9.7% |
| Visual & Performing Arts | 62 | 3.8% |
| Communications | 81 | 5.0% |
| Arts & Humanities | 101 | 6.3% |
| Total | 1,612 | 100.0% |
Transportation & Commute in Lewisburg
Vehicle Availability by Sex in Lewisburg
The most prevalent vehicle ownership categories in Lewisburg are males with 2 vehicles (224, accounting for 38.2%) and females with 2 vehicles (377, making up 25.5%).
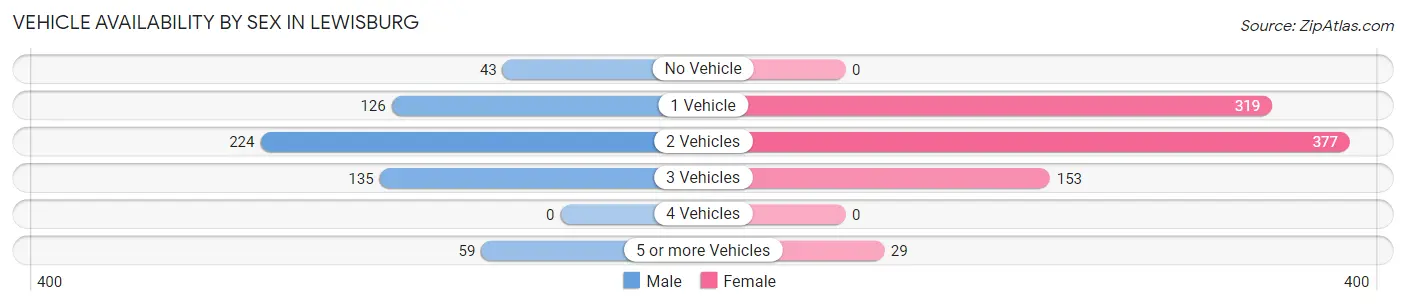
| Vehicles Available | Male | Female |
| No Vehicle | 43 (7.3%) | 0 (0.0%) |
| 1 Vehicle | 126 (21.5%) | 319 (36.3%) |
| 2 Vehicles | 224 (38.2%) | 377 (42.9%) |
| 3 Vehicles | 135 (23.0%) | 153 (17.4%) |
| 4 Vehicles | 0 (0.0%) | 0 (0.0%) |
| 5 or more Vehicles | 59 (10.1%) | 29 (3.3%) |
| Total | 587 (100.0%) | 878 (100.0%) |
Commute Time in Lewisburg
The most frequently occuring commute durations in Lewisburg are 5 to 9 minutes (435 commuters, 30.4%), 10 to 14 minutes (316 commuters, 22.1%), and 40 to 44 minutes (207 commuters, 14.5%).
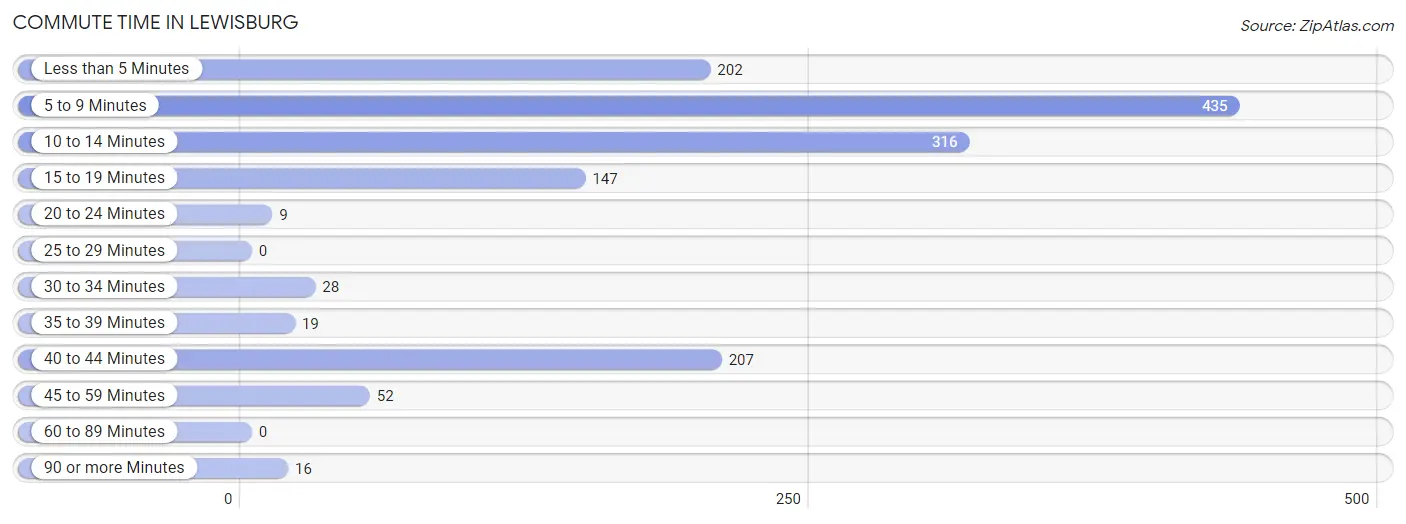
| Commute Time | # Commuters | % Commuters |
| Less than 5 Minutes | 202 | 14.1% |
| 5 to 9 Minutes | 435 | 30.4% |
| 10 to 14 Minutes | 316 | 22.1% |
| 15 to 19 Minutes | 147 | 10.3% |
| 20 to 24 Minutes | 9 | 0.6% |
| 25 to 29 Minutes | 0 | 0.0% |
| 30 to 34 Minutes | 28 | 2.0% |
| 35 to 39 Minutes | 19 | 1.3% |
| 40 to 44 Minutes | 207 | 14.5% |
| 45 to 59 Minutes | 52 | 3.6% |
| 60 to 89 Minutes | 0 | 0.0% |
| 90 or more Minutes | 16 | 1.1% |
Commute Time by Sex in Lewisburg
The most common commute times in Lewisburg are 5 to 9 minutes (266 commuters, 45.3%) for males and 10 to 14 minutes (229 commuters, 27.1%) for females.
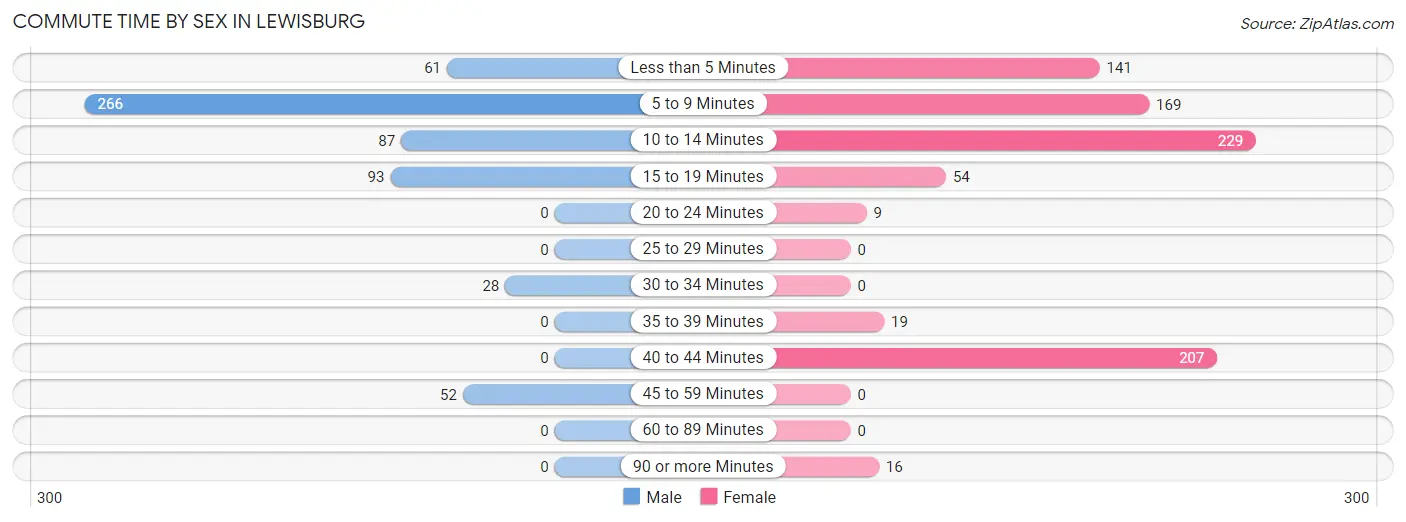
| Commute Time | Male | Female |
| Less than 5 Minutes | 61 (10.4%) | 141 (16.7%) |
| 5 to 9 Minutes | 266 (45.3%) | 169 (20.0%) |
| 10 to 14 Minutes | 87 (14.8%) | 229 (27.1%) |
| 15 to 19 Minutes | 93 (15.8%) | 54 (6.4%) |
| 20 to 24 Minutes | 0 (0.0%) | 9 (1.1%) |
| 25 to 29 Minutes | 0 (0.0%) | 0 (0.0%) |
| 30 to 34 Minutes | 28 (4.8%) | 0 (0.0%) |
| 35 to 39 Minutes | 0 (0.0%) | 19 (2.2%) |
| 40 to 44 Minutes | 0 (0.0%) | 207 (24.5%) |
| 45 to 59 Minutes | 52 (8.9%) | 0 (0.0%) |
| 60 to 89 Minutes | 0 (0.0%) | 0 (0.0%) |
| 90 or more Minutes | 0 (0.0%) | 16 (1.9%) |
Time of Departure to Work by Sex in Lewisburg
The most frequent times of departure to work in Lewisburg are 6:30 AM to 6:59 AM (244, 41.6%) for males and 8:00 AM to 8:29 AM (282, 33.4%) for females.
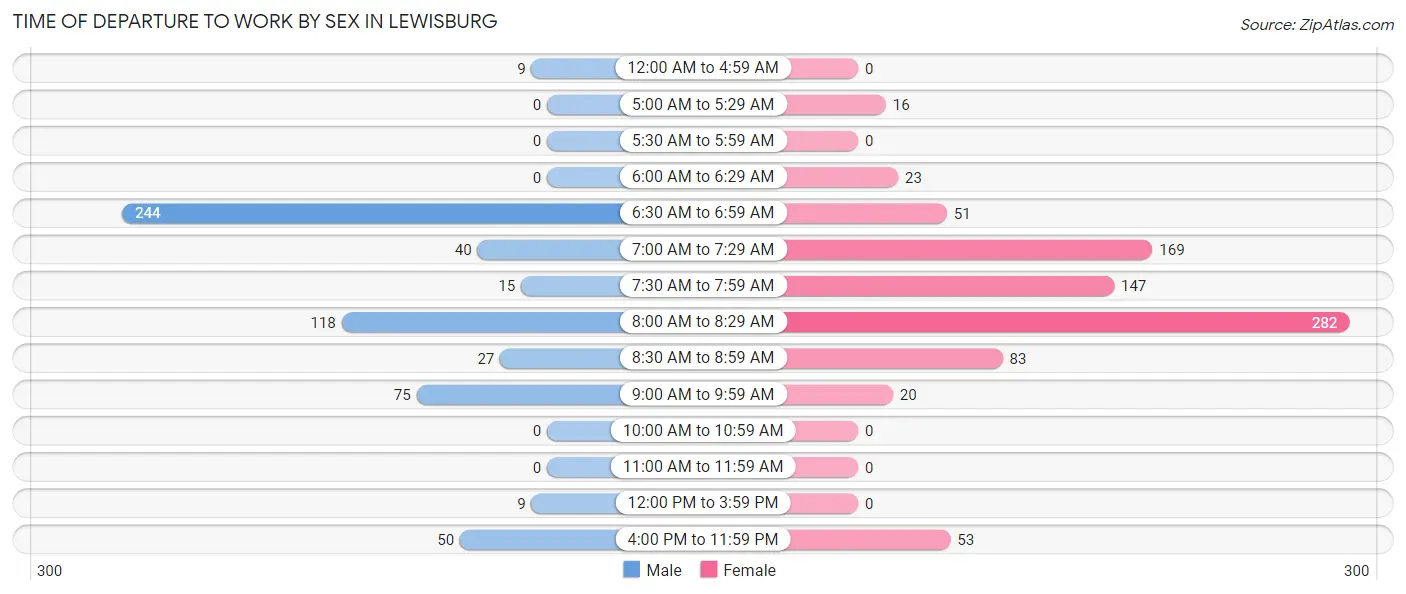
| Time of Departure | Male | Female |
| 12:00 AM to 4:59 AM | 9 (1.5%) | 0 (0.0%) |
| 5:00 AM to 5:29 AM | 0 (0.0%) | 16 (1.9%) |
| 5:30 AM to 5:59 AM | 0 (0.0%) | 0 (0.0%) |
| 6:00 AM to 6:29 AM | 0 (0.0%) | 23 (2.7%) |
| 6:30 AM to 6:59 AM | 244 (41.6%) | 51 (6.0%) |
| 7:00 AM to 7:29 AM | 40 (6.8%) | 169 (20.0%) |
| 7:30 AM to 7:59 AM | 15 (2.6%) | 147 (17.4%) |
| 8:00 AM to 8:29 AM | 118 (20.1%) | 282 (33.4%) |
| 8:30 AM to 8:59 AM | 27 (4.6%) | 83 (9.8%) |
| 9:00 AM to 9:59 AM | 75 (12.8%) | 20 (2.4%) |
| 10:00 AM to 10:59 AM | 0 (0.0%) | 0 (0.0%) |
| 11:00 AM to 11:59 AM | 0 (0.0%) | 0 (0.0%) |
| 12:00 PM to 3:59 PM | 9 (1.5%) | 0 (0.0%) |
| 4:00 PM to 11:59 PM | 50 (8.5%) | 53 (6.3%) |
| Total | 587 (100.0%) | 844 (100.0%) |
Housing Occupancy in Lewisburg
Occupancy by Ownership in Lewisburg
Of the total 1,852 dwellings in Lewisburg, owner-occupied units account for 1,118 (60.4%), while renter-occupied units make up 734 (39.6%).
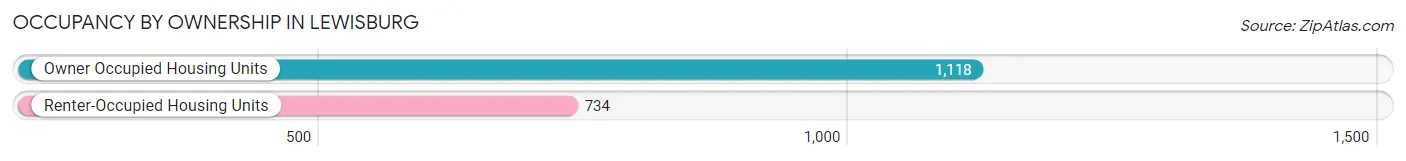
| Occupancy | # Housing Units | % Housing Units |
| Owner Occupied Housing Units | 1,118 | 60.4% |
| Renter-Occupied Housing Units | 734 | 39.6% |
| Total Occupied Housing Units | 1,852 | 100.0% |
Occupancy by Household Size in Lewisburg
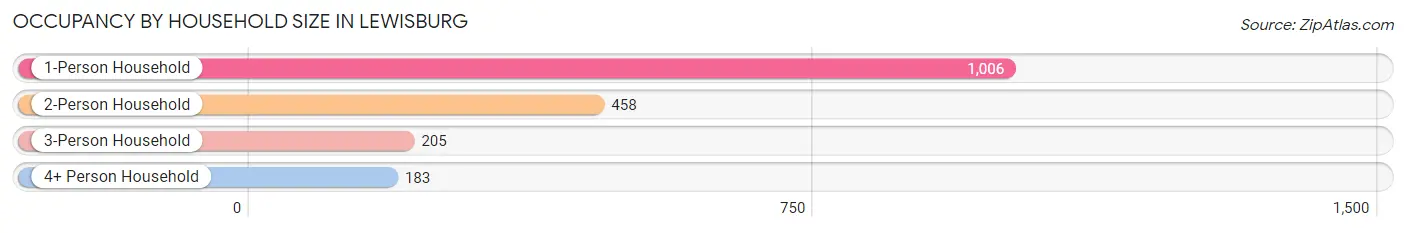
| Household Size | # Housing Units | % Housing Units |
| 1-Person Household | 1,006 | 54.3% |
| 2-Person Household | 458 | 24.7% |
| 3-Person Household | 205 | 11.1% |
| 4+ Person Household | 183 | 9.9% |
| Total Housing Units | 1,852 | 100.0% |
Occupancy by Ownership by Household Size in Lewisburg
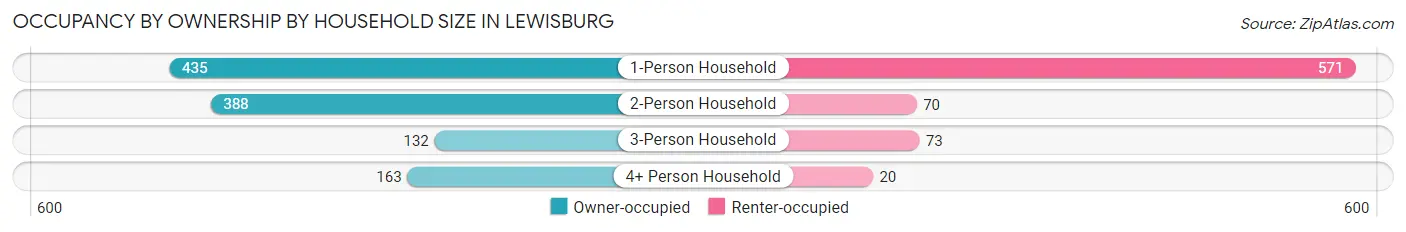
| Household Size | Owner-occupied | Renter-occupied |
| 1-Person Household | 435 (43.2%) | 571 (56.8%) |
| 2-Person Household | 388 (84.7%) | 70 (15.3%) |
| 3-Person Household | 132 (64.4%) | 73 (35.6%) |
| 4+ Person Household | 163 (89.1%) | 20 (10.9%) |
| Total Housing Units | 1,118 (60.4%) | 734 (39.6%) |
Occupancy by Educational Attainment in Lewisburg
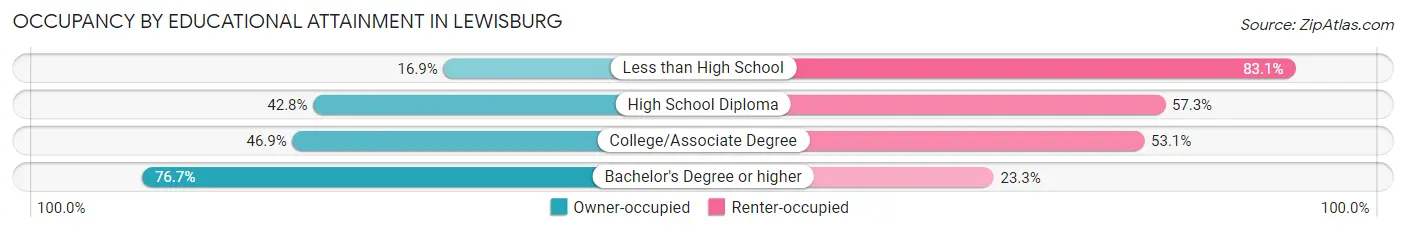
| Household Size | Owner-occupied | Renter-occupied |
| Less than High School | 22 (16.9%) | 108 (83.1%) |
| High School Diploma | 115 (42.7%) | 154 (57.3%) |
| College/Associate Degree | 210 (46.9%) | 238 (53.1%) |
| Bachelor's Degree or higher | 771 (76.7%) | 234 (23.3%) |
Occupancy by Age of Householder in Lewisburg
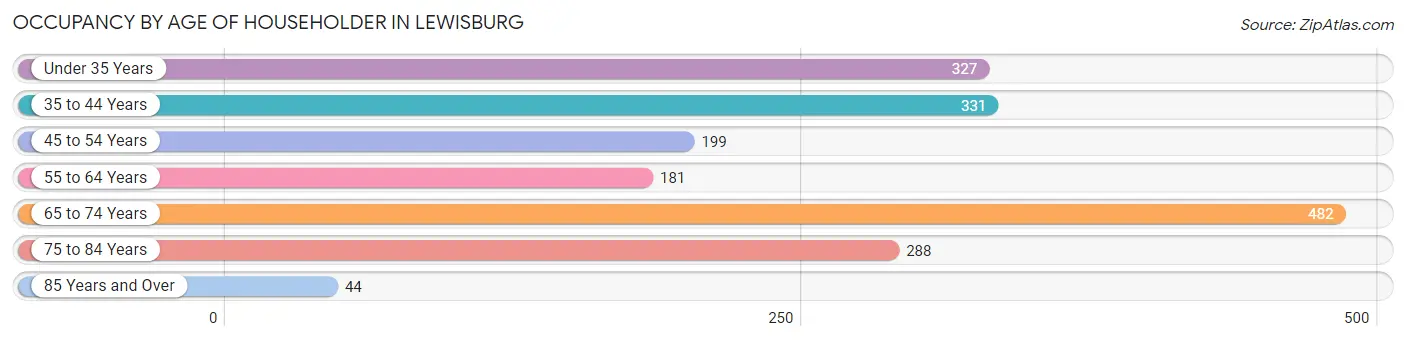
| Age Bracket | # Households | % Households |
| Under 35 Years | 327 | 17.7% |
| 35 to 44 Years | 331 | 17.9% |
| 45 to 54 Years | 199 | 10.7% |
| 55 to 64 Years | 181 | 9.8% |
| 65 to 74 Years | 482 | 26.0% |
| 75 to 84 Years | 288 | 15.5% |
| 85 Years and Over | 44 | 2.4% |
| Total | 1,852 | 100.0% |
Housing Finances in Lewisburg
Median Income by Occupancy in Lewisburg
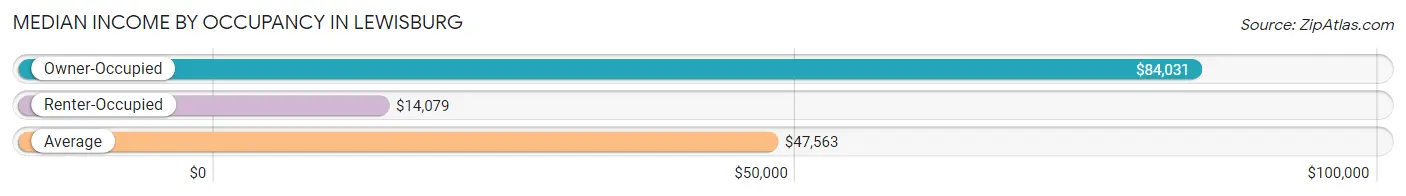
| Occupancy Type | # Households | Median Income |
| Owner-Occupied | 1,118 (60.4%) | $84,031 |
| Renter-Occupied | 734 (39.6%) | $14,079 |
| Average | 1,852 (100.0%) | $47,563 |
Occupancy by Householder Income Bracket in Lewisburg
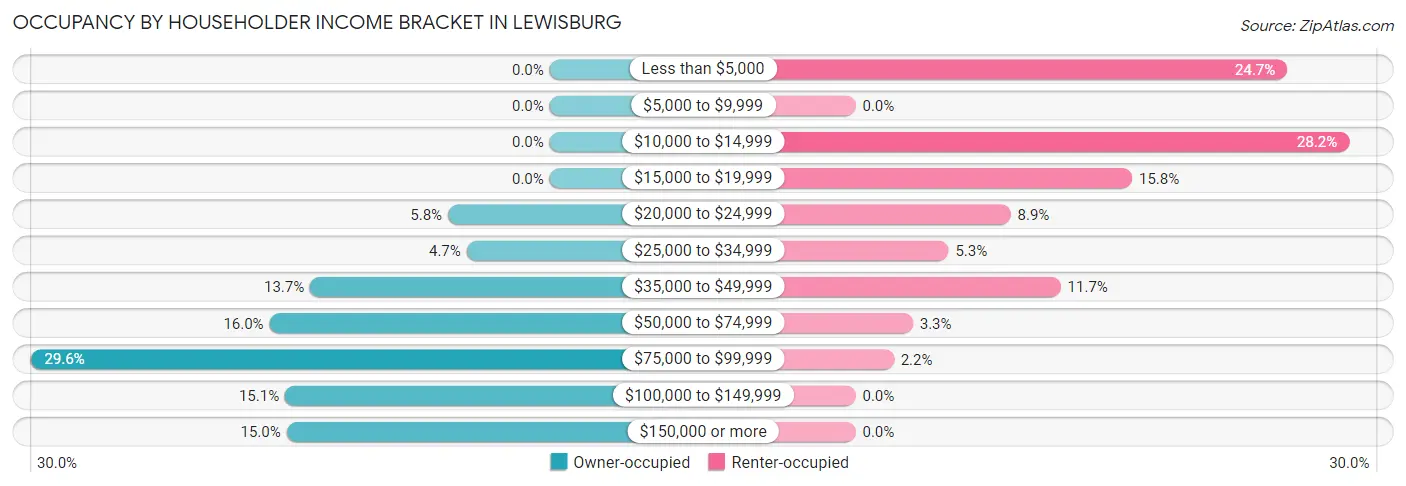
| Income Bracket | Owner-occupied | Renter-occupied |
| Less than $5,000 | 0 (0.0%) | 181 (24.7%) |
| $5,000 to $9,999 | 0 (0.0%) | 0 (0.0%) |
| $10,000 to $14,999 | 0 (0.0%) | 207 (28.2%) |
| $15,000 to $19,999 | 0 (0.0%) | 116 (15.8%) |
| $20,000 to $24,999 | 65 (5.8%) | 65 (8.9%) |
| $25,000 to $34,999 | 53 (4.7%) | 39 (5.3%) |
| $35,000 to $49,999 | 153 (13.7%) | 86 (11.7%) |
| $50,000 to $74,999 | 179 (16.0%) | 24 (3.3%) |
| $75,000 to $99,999 | 331 (29.6%) | 16 (2.2%) |
| $100,000 to $149,999 | 169 (15.1%) | 0 (0.0%) |
| $150,000 or more | 168 (15.0%) | 0 (0.0%) |
| Total | 1,118 (100.0%) | 734 (100.0%) |
Monthly Housing Cost Tiers in Lewisburg
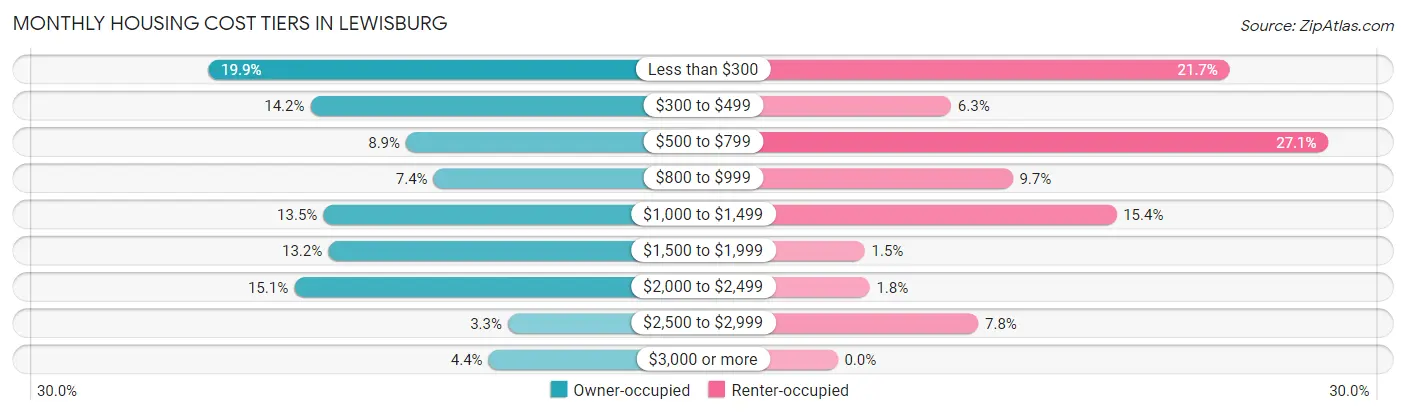
| Monthly Cost | Owner-occupied | Renter-occupied |
| Less than $300 | 222 (19.9%) | 159 (21.7%) |
| $300 to $499 | 159 (14.2%) | 46 (6.3%) |
| $500 to $799 | 100 (8.9%) | 199 (27.1%) |
| $800 to $999 | 83 (7.4%) | 71 (9.7%) |
| $1,000 to $1,499 | 151 (13.5%) | 113 (15.4%) |
| $1,500 to $1,999 | 148 (13.2%) | 11 (1.5%) |
| $2,000 to $2,499 | 169 (15.1%) | 13 (1.8%) |
| $2,500 to $2,999 | 37 (3.3%) | 57 (7.8%) |
| $3,000 or more | 49 (4.4%) | 0 (0.0%) |
| Total | 1,118 (100.0%) | 734 (100.0%) |
Physical Housing Characteristics in Lewisburg
Housing Structures in Lewisburg
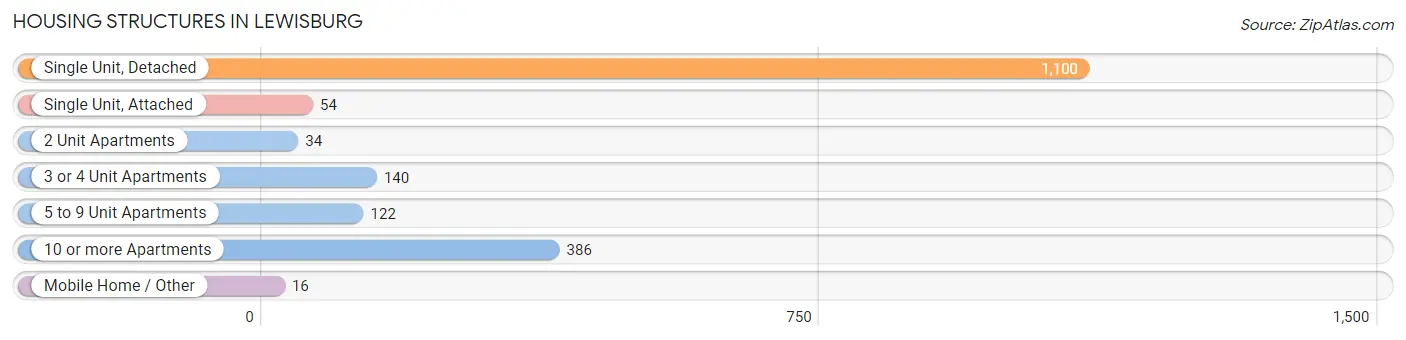
| Structure Type | # Housing Units | % Housing Units |
| Single Unit, Detached | 1,100 | 59.4% |
| Single Unit, Attached | 54 | 2.9% |
| 2 Unit Apartments | 34 | 1.8% |
| 3 or 4 Unit Apartments | 140 | 7.6% |
| 5 to 9 Unit Apartments | 122 | 6.6% |
| 10 or more Apartments | 386 | 20.8% |
| Mobile Home / Other | 16 | 0.9% |
| Total | 1,852 | 100.0% |
Housing Structures by Occupancy in Lewisburg
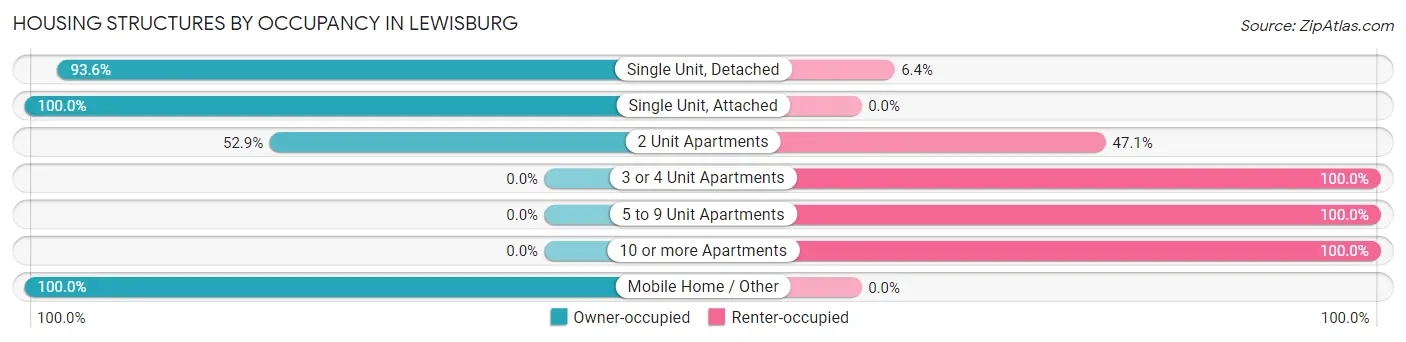
| Structure Type | Owner-occupied | Renter-occupied |
| Single Unit, Detached | 1,030 (93.6%) | 70 (6.4%) |
| Single Unit, Attached | 54 (100.0%) | 0 (0.0%) |
| 2 Unit Apartments | 18 (52.9%) | 16 (47.1%) |
| 3 or 4 Unit Apartments | 0 (0.0%) | 140 (100.0%) |
| 5 to 9 Unit Apartments | 0 (0.0%) | 122 (100.0%) |
| 10 or more Apartments | 0 (0.0%) | 386 (100.0%) |
| Mobile Home / Other | 16 (100.0%) | 0 (0.0%) |
| Total | 1,118 (60.4%) | 734 (39.6%) |
Housing Structures by Number of Rooms in Lewisburg
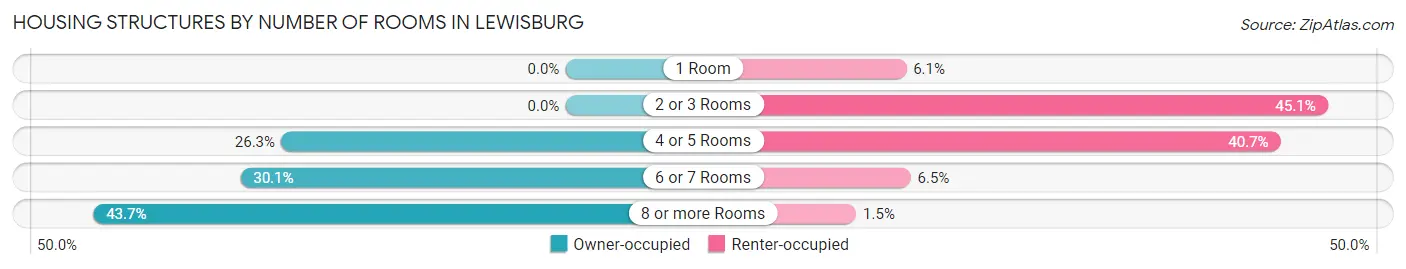
| Number of Rooms | Owner-occupied | Renter-occupied |
| 1 Room | 0 (0.0%) | 45 (6.1%) |
| 2 or 3 Rooms | 0 (0.0%) | 331 (45.1%) |
| 4 or 5 Rooms | 294 (26.3%) | 299 (40.7%) |
| 6 or 7 Rooms | 336 (30.0%) | 48 (6.5%) |
| 8 or more Rooms | 488 (43.6%) | 11 (1.5%) |
| Total | 1,118 (100.0%) | 734 (100.0%) |
Housing Structure by Heating Type in Lewisburg
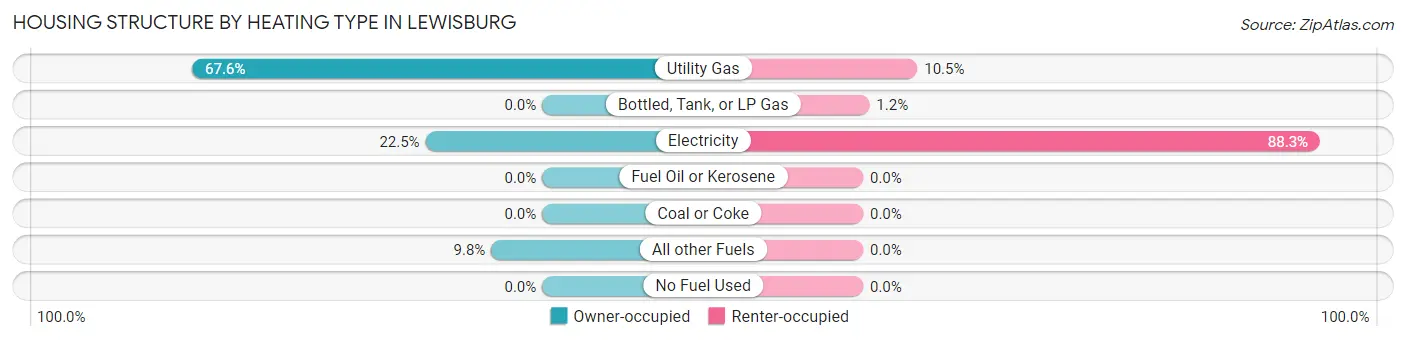
| Heating Type | Owner-occupied | Renter-occupied |
| Utility Gas | 756 (67.6%) | 77 (10.5%) |
| Bottled, Tank, or LP Gas | 0 (0.0%) | 9 (1.2%) |
| Electricity | 252 (22.5%) | 648 (88.3%) |
| Fuel Oil or Kerosene | 0 (0.0%) | 0 (0.0%) |
| Coal or Coke | 0 (0.0%) | 0 (0.0%) |
| All other Fuels | 110 (9.8%) | 0 (0.0%) |
| No Fuel Used | 0 (0.0%) | 0 (0.0%) |
| Total | 1,118 (100.0%) | 734 (100.0%) |
Household Vehicle Usage in Lewisburg
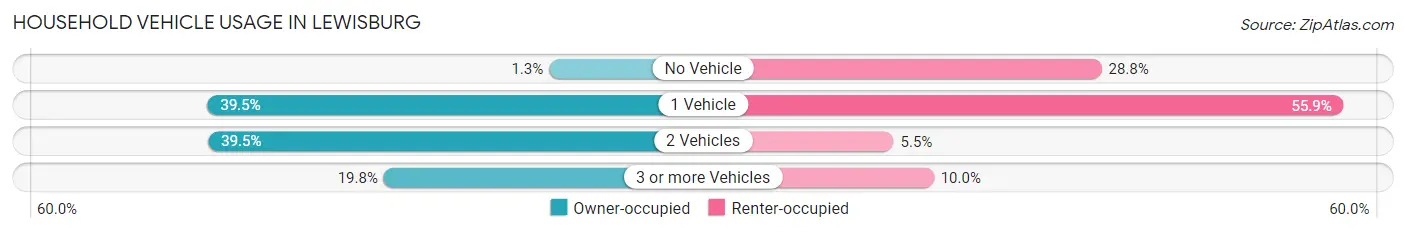
| Vehicles per Household | Owner-occupied | Renter-occupied |
| No Vehicle | 14 (1.3%) | 211 (28.7%) |
| 1 Vehicle | 442 (39.5%) | 410 (55.9%) |
| 2 Vehicles | 441 (39.5%) | 40 (5.4%) |
| 3 or more Vehicles | 221 (19.8%) | 73 (10.0%) |
| Total | 1,118 (100.0%) | 734 (100.0%) |
Real Estate & Mortgages in Lewisburg
Real Estate and Mortgage Overview in Lewisburg
| Characteristic | Without Mortgage | With Mortgage |
| Housing Units | 473 | 645 |
| Median Property Value | $220,100 | $359,300 |
| Median Household Income | $71,625 | $113 |
| Monthly Housing Costs | $323 | $49 |
| Real Estate Taxes | $1,003 | $0 |
Property Value by Mortgage Status in Lewisburg
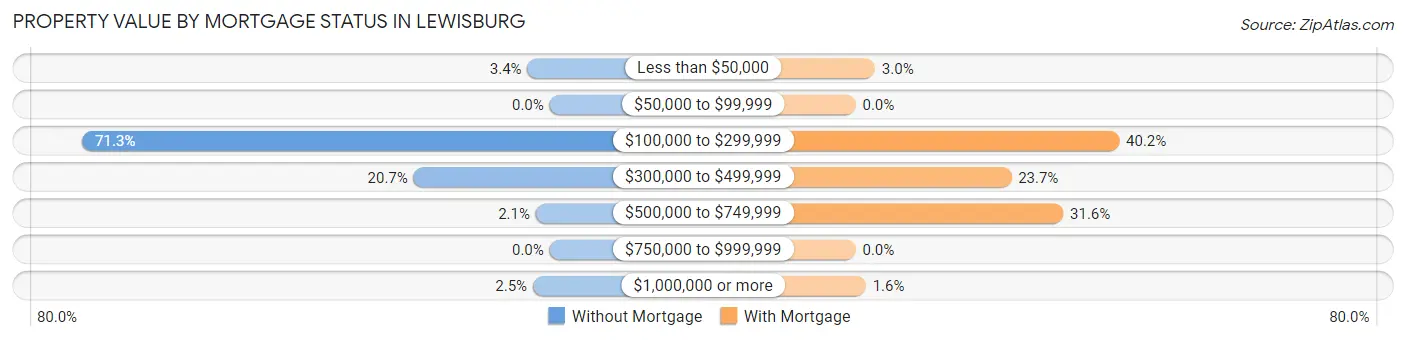
| Property Value | Without Mortgage | With Mortgage |
| Less than $50,000 | 16 (3.4%) | 19 (2.9%) |
| $50,000 to $99,999 | 0 (0.0%) | 0 (0.0%) |
| $100,000 to $299,999 | 337 (71.3%) | 259 (40.2%) |
| $300,000 to $499,999 | 98 (20.7%) | 153 (23.7%) |
| $500,000 to $749,999 | 10 (2.1%) | 204 (31.6%) |
| $750,000 to $999,999 | 0 (0.0%) | 0 (0.0%) |
| $1,000,000 or more | 12 (2.5%) | 10 (1.5%) |
| Total | 473 (100.0%) | 645 (100.0%) |
Household Income by Mortgage Status in Lewisburg
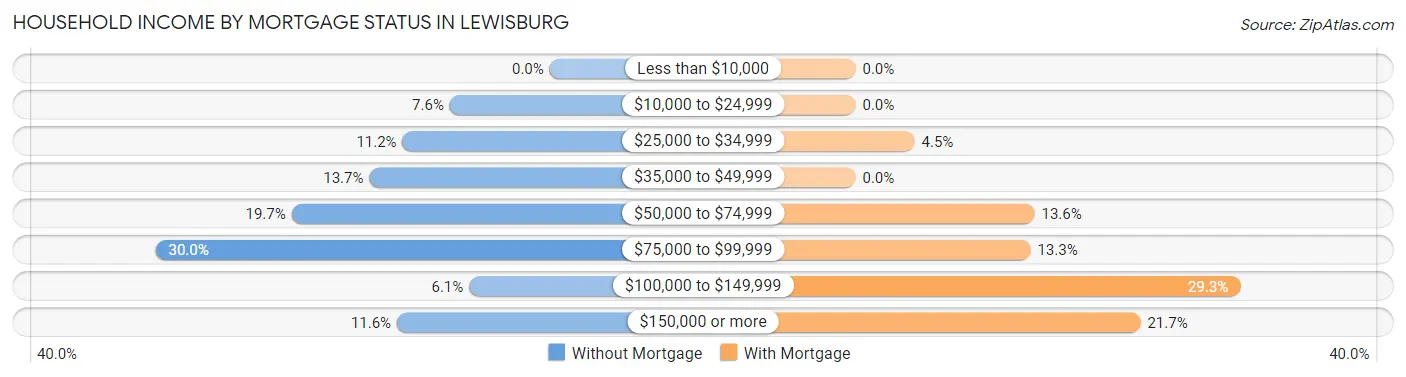
| Household Income | Without Mortgage | With Mortgage |
| Less than $10,000 | 0 (0.0%) | 0 (0.0%) |
| $10,000 to $24,999 | 36 (7.6%) | 0 (0.0%) |
| $25,000 to $34,999 | 53 (11.2%) | 29 (4.5%) |
| $35,000 to $49,999 | 65 (13.7%) | 0 (0.0%) |
| $50,000 to $74,999 | 93 (19.7%) | 88 (13.6%) |
| $75,000 to $99,999 | 142 (30.0%) | 86 (13.3%) |
| $100,000 to $149,999 | 29 (6.1%) | 189 (29.3%) |
| $150,000 or more | 55 (11.6%) | 140 (21.7%) |
| Total | 473 (100.0%) | 645 (100.0%) |
Property Value to Household Income Ratio in Lewisburg
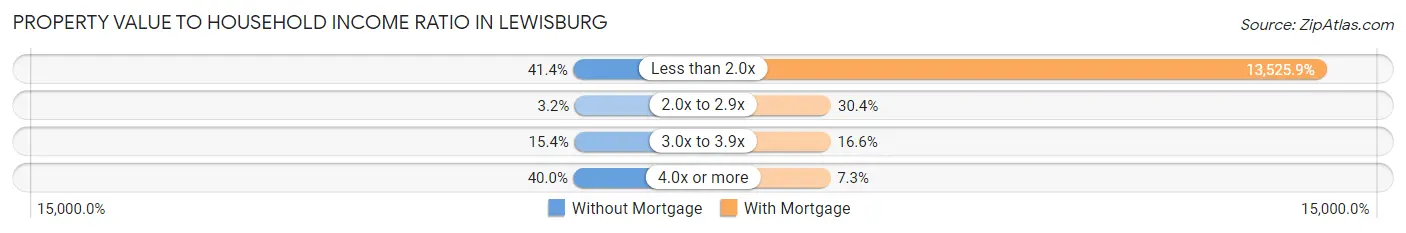
| Value-to-Income Ratio | Without Mortgage | With Mortgage |
| Less than 2.0x | 196 (41.4%) | 87,242 (13,525.9%) |
| 2.0x to 2.9x | 15 (3.2%) | 196 (30.4%) |
| 3.0x to 3.9x | 73 (15.4%) | 107 (16.6%) |
| 4.0x or more | 189 (40.0%) | 47 (7.3%) |
| Total | 473 (100.0%) | 645 (100.0%) |
Real Estate Taxes by Mortgage Status in Lewisburg
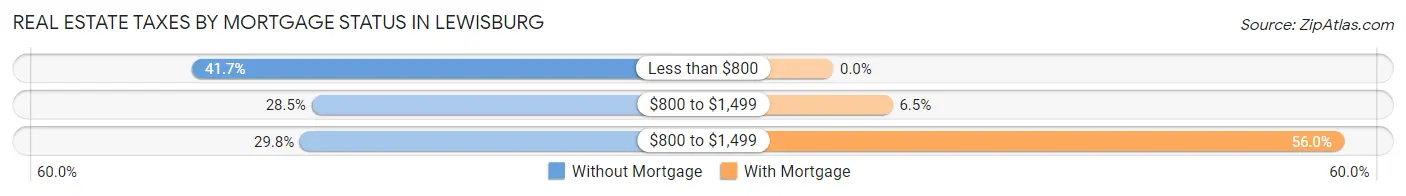
| Property Taxes | Without Mortgage | With Mortgage |
| Less than $800 | 197 (41.6%) | 0 (0.0%) |
| $800 to $1,499 | 135 (28.5%) | 42 (6.5%) |
| $800 to $1,499 | 141 (29.8%) | 361 (56.0%) |
| Total | 473 (100.0%) | 645 (100.0%) |
Health & Disability in Lewisburg
Health Insurance Coverage by Age in Lewisburg
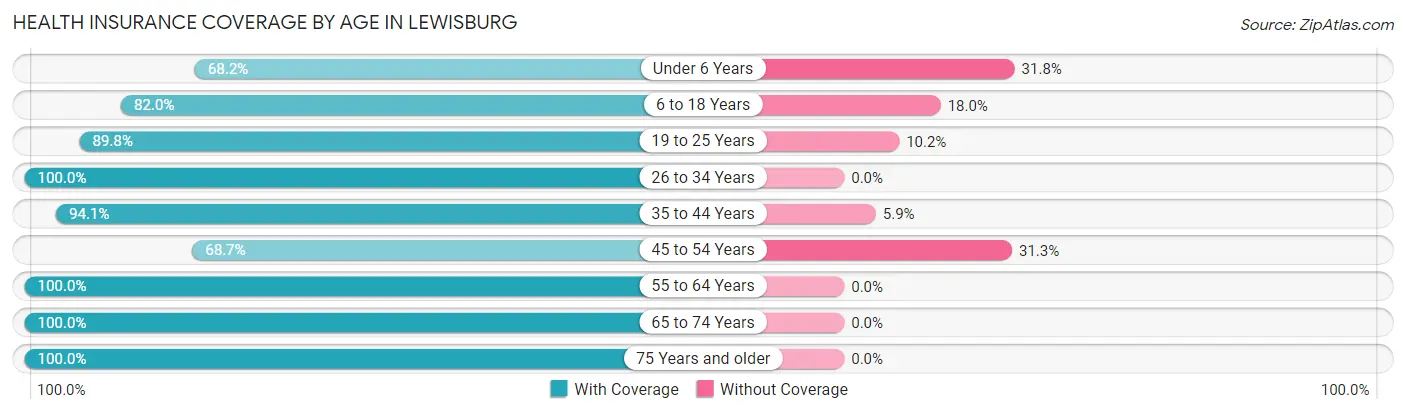
| Age Bracket | With Coverage | Without Coverage |
| Under 6 Years | 189 (68.2%) | 88 (31.8%) |
| 6 to 18 Years | 520 (82.0%) | 114 (18.0%) |
| 19 to 25 Years | 228 (89.8%) | 26 (10.2%) |
| 26 to 34 Years | 409 (100.0%) | 0 (0.0%) |
| 35 to 44 Years | 528 (94.1%) | 33 (5.9%) |
| 45 to 54 Years | 235 (68.7%) | 107 (31.3%) |
| 55 to 64 Years | 383 (100.0%) | 0 (0.0%) |
| 65 to 74 Years | 558 (100.0%) | 0 (0.0%) |
| 75 Years and older | 442 (100.0%) | 0 (0.0%) |
| Total | 3,492 (90.5%) | 368 (9.5%) |
Health Insurance Coverage by Citizenship Status in Lewisburg
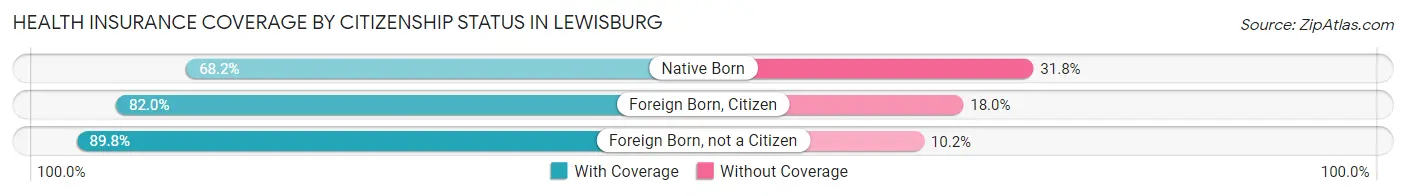
| Citizenship Status | With Coverage | Without Coverage |
| Native Born | 189 (68.2%) | 88 (31.8%) |
| Foreign Born, Citizen | 520 (82.0%) | 114 (18.0%) |
| Foreign Born, not a Citizen | 228 (89.8%) | 26 (10.2%) |
Health Insurance Coverage by Household Income in Lewisburg
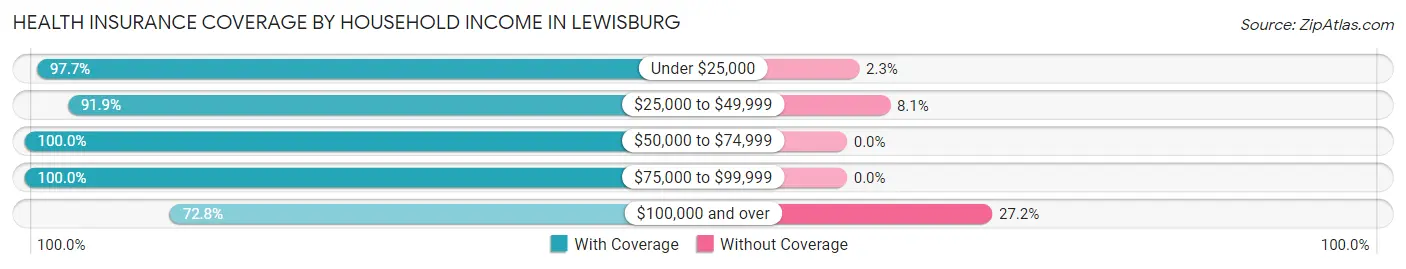
| Household Income | With Coverage | Without Coverage |
| Under $25,000 | 890 (97.7%) | 21 (2.3%) |
| $25,000 to $49,999 | 511 (91.9%) | 45 (8.1%) |
| $50,000 to $74,999 | 397 (100.0%) | 0 (0.0%) |
| $75,000 to $99,999 | 846 (100.0%) | 0 (0.0%) |
| $100,000 and over | 808 (72.8%) | 302 (27.2%) |
Public vs Private Health Insurance Coverage by Age in Lewisburg
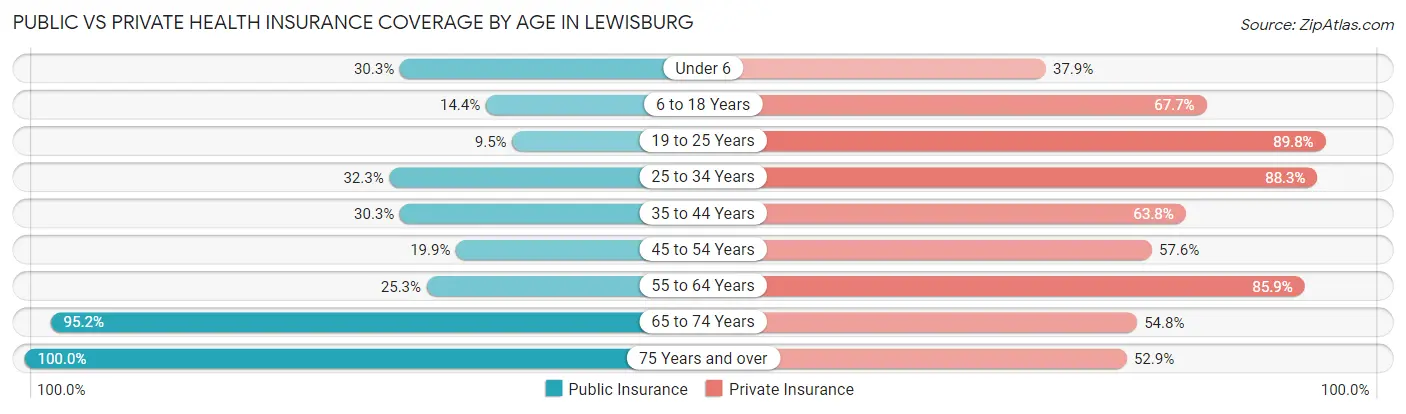
| Age Bracket | Public Insurance | Private Insurance |
| Under 6 | 84 (30.3%) | 105 (37.9%) |
| 6 to 18 Years | 91 (14.3%) | 429 (67.7%) |
| 19 to 25 Years | 24 (9.5%) | 228 (89.8%) |
| 25 to 34 Years | 132 (32.3%) | 361 (88.3%) |
| 35 to 44 Years | 170 (30.3%) | 358 (63.8%) |
| 45 to 54 Years | 68 (19.9%) | 197 (57.6%) |
| 55 to 64 Years | 97 (25.3%) | 329 (85.9%) |
| 65 to 74 Years | 531 (95.2%) | 306 (54.8%) |
| 75 Years and over | 442 (100.0%) | 234 (52.9%) |
| Total | 1,639 (42.5%) | 2,547 (66.0%) |
Disability Status by Sex by Age in Lewisburg
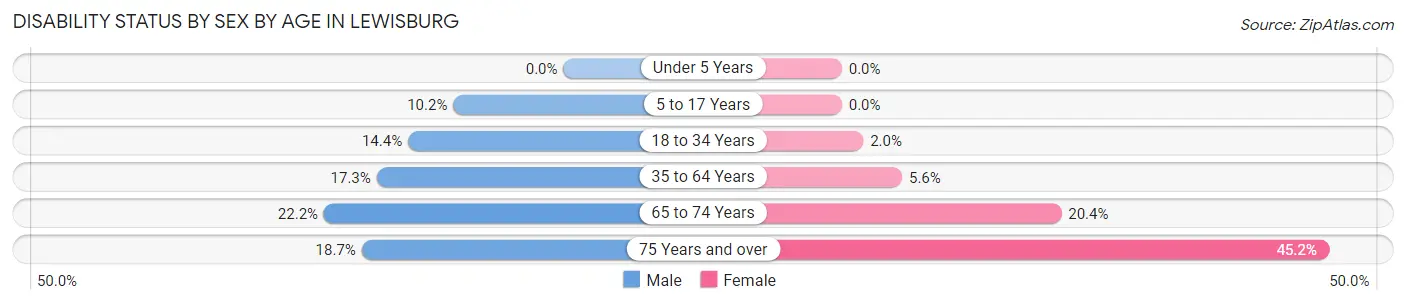
| Age Bracket | Male | Female |
| Under 5 Years | 0 (0.0%) | 0 (0.0%) |
| 5 to 17 Years | 19 (10.2%) | 0 (0.0%) |
| 18 to 34 Years | 45 (14.4%) | 7 (2.0%) |
| 35 to 64 Years | 105 (17.3%) | 38 (5.6%) |
| 65 to 74 Years | 40 (22.2%) | 77 (20.4%) |
| 75 Years and over | 38 (18.7%) | 108 (45.2%) |
Disability Class by Sex by Age in Lewisburg
Disability Class: Hearing Difficulty
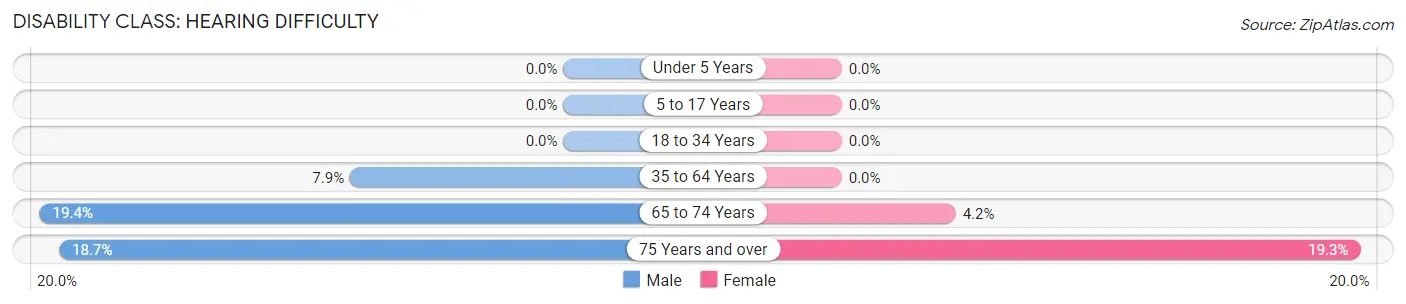
| Age Bracket | Male | Female |
| Under 5 Years | 0 (0.0%) | 0 (0.0%) |
| 5 to 17 Years | 0 (0.0%) | 0 (0.0%) |
| 18 to 34 Years | 0 (0.0%) | 0 (0.0%) |
| 35 to 64 Years | 48 (7.9%) | 0 (0.0%) |
| 65 to 74 Years | 35 (19.4%) | 16 (4.2%) |
| 75 Years and over | 38 (18.7%) | 46 (19.3%) |
Disability Class: Vision Difficulty
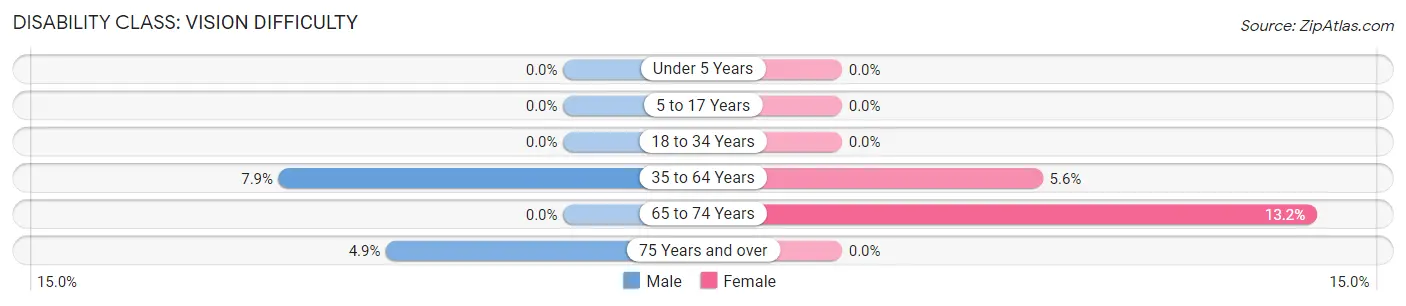
| Age Bracket | Male | Female |
| Under 5 Years | 0 (0.0%) | 0 (0.0%) |
| 5 to 17 Years | 0 (0.0%) | 0 (0.0%) |
| 18 to 34 Years | 0 (0.0%) | 0 (0.0%) |
| 35 to 64 Years | 48 (7.9%) | 38 (5.6%) |
| 65 to 74 Years | 0 (0.0%) | 50 (13.2%) |
| 75 Years and over | 10 (4.9%) | 0 (0.0%) |
Disability Class: Cognitive Difficulty
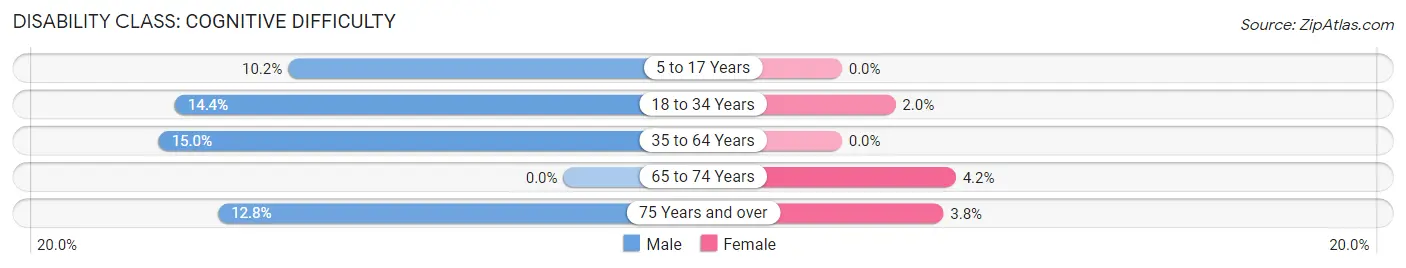
| Age Bracket | Male | Female |
| 5 to 17 Years | 19 (10.2%) | 0 (0.0%) |
| 18 to 34 Years | 45 (14.4%) | 7 (2.0%) |
| 35 to 64 Years | 91 (15.0%) | 0 (0.0%) |
| 65 to 74 Years | 0 (0.0%) | 16 (4.2%) |
| 75 Years and over | 26 (12.8%) | 9 (3.8%) |
Disability Class: Ambulatory Difficulty
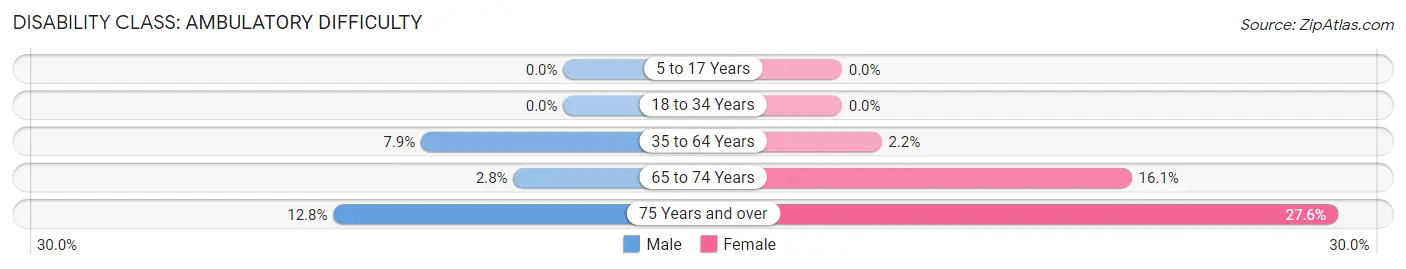
| Age Bracket | Male | Female |
| 5 to 17 Years | 0 (0.0%) | 0 (0.0%) |
| 18 to 34 Years | 0 (0.0%) | 0 (0.0%) |
| 35 to 64 Years | 48 (7.9%) | 15 (2.2%) |
| 65 to 74 Years | 5 (2.8%) | 61 (16.1%) |
| 75 Years and over | 26 (12.8%) | 66 (27.6%) |
Disability Class: Self-Care Difficulty
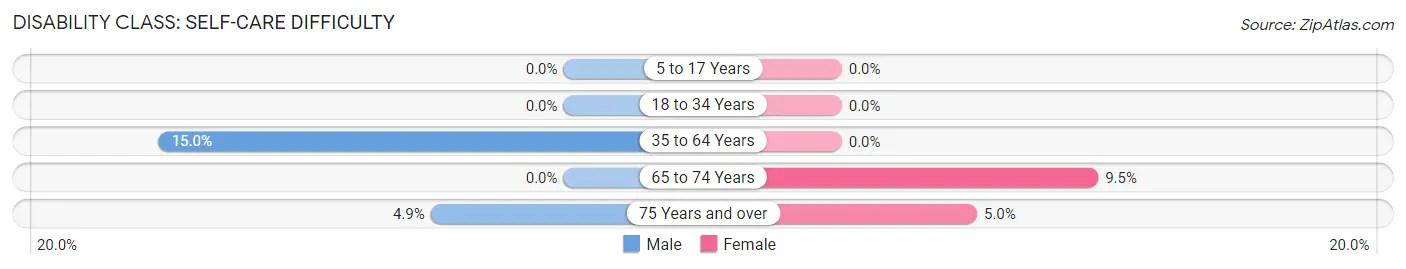
| Age Bracket | Male | Female |
| 5 to 17 Years | 0 (0.0%) | 0 (0.0%) |
| 18 to 34 Years | 0 (0.0%) | 0 (0.0%) |
| 35 to 64 Years | 91 (15.0%) | 0 (0.0%) |
| 65 to 74 Years | 0 (0.0%) | 36 (9.5%) |
| 75 Years and over | 10 (4.9%) | 12 (5.0%) |
Technology Access in Lewisburg
Computing Device Access in Lewisburg
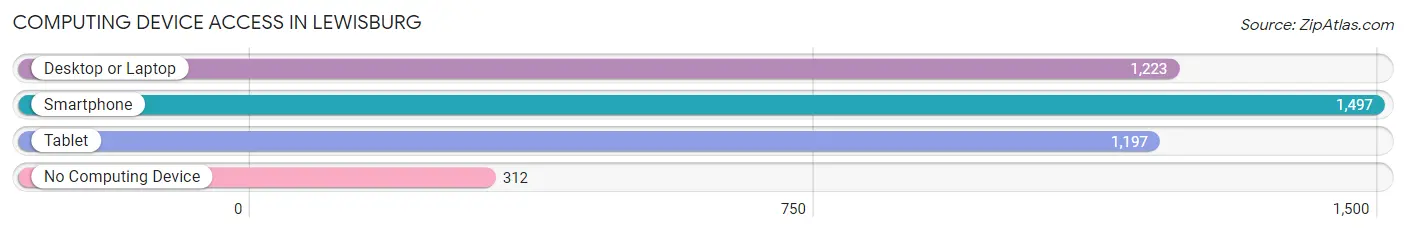
| Device Type | # Households | % Households |
| Desktop or Laptop | 1,223 | 66.0% |
| Smartphone | 1,497 | 80.8% |
| Tablet | 1,197 | 64.6% |
| No Computing Device | 312 | 16.9% |
| Total | 1,852 | 100.0% |
Internet Access in Lewisburg
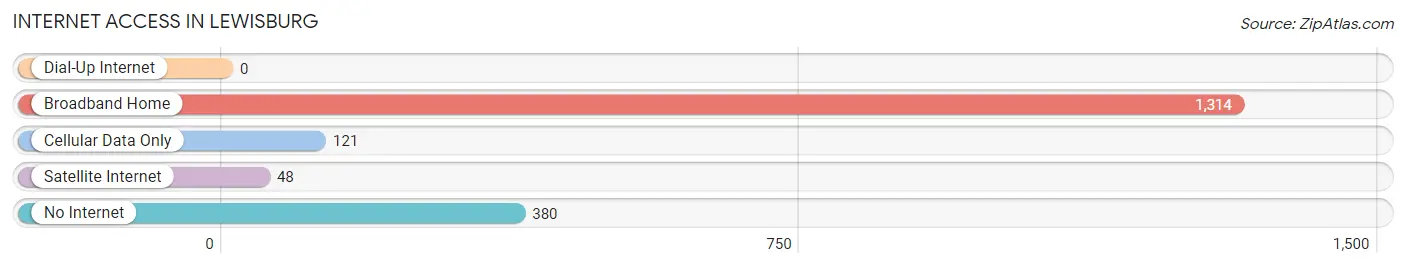
| Internet Type | # Households | % Households |
| Dial-Up Internet | 0 | 0.0% |
| Broadband Home | 1,314 | 71.0% |
| Cellular Data Only | 121 | 6.5% |
| Satellite Internet | 48 | 2.6% |
| No Internet | 380 | 20.5% |
| Total | 1,852 | 100.0% |
Lewisburg Summary
Lewisburg, West Virginia is a small city located in the eastern part of the state, in Greenbrier County. It is the county seat and the largest city in the county. The city is situated in the Allegheny Mountains, and is known for its historic downtown area, which is listed on the National Register of Historic Places. The city is also home to the West Virginia State Fair, which is held annually in August.
History
Lewisburg was founded in 1782 by General Andrew Lewis, who was a Revolutionary War hero. The city was named after him, and was originally part of the Virginia Colony. In 1799, the Virginia General Assembly established Greenbrier County, and Lewisburg was chosen as the county seat. The city was incorporated in 1834, and the first courthouse was built in 1837.
In the 19th century, Lewisburg was a major center for the production of salt, which was used in the curing of meat. The city was also a major stop on the James River and Kanawha Canal, which connected the Ohio River to the Chesapeake Bay. The canal was completed in 1851, and it helped to make Lewisburg a major transportation hub.
In the late 19th century, Lewisburg became a popular tourist destination, due to its proximity to the Greenbrier River and the Allegheny Mountains. The city was also home to several resorts, including the Greenbrier Hotel, which was built in 1913.
Geography
Lewisburg is located in the eastern part of West Virginia, in Greenbrier County. The city is situated in the Allegheny Mountains, and is surrounded by the Greenbrier River and the Greenbrier Valley. The city has a total area of 2.3 square miles, and is located at an elevation of 1,845 feet.
The climate in Lewisburg is humid subtropical, with hot, humid summers and cold, snowy winters. The average annual temperature is 54 degrees Fahrenheit, and the average annual precipitation is 43 inches.
Economy
The economy of Lewisburg is largely based on tourism, retail, and education. The city is home to several tourist attractions, including the Greenbrier Hotel, the West Virginia State Fair, and the Lewisburg Historic District. The city is also home to several retail stores, restaurants, and other businesses.
The city is also home to several educational institutions, including the University of Charleston, the Greenbrier Valley Campus of New River Community and Technical College, and the Lewisburg Baptist College.
Demographics
As of the 2010 census, the population of Lewisburg was 3,830. The racial makeup of the city was 95.3% White, 1.3% African American, 0.3% Native American, 0.7% Asian, 0.1% Pacific Islander, 0.7% from other races, and 1.6% from two or more races. The median household income was $35,938, and the median family income was $45,938. The per capita income was $20,938.
The population of Lewisburg is largely Christian, with the largest denominations being Baptist, Methodist, and Presbyterian. The city is also home to a small Jewish community.
Common Questions
What is Per Capita Income in Lewisburg?
Per Capita income in Lewisburg is $39,968.
What is the Median Family Income in Lewisburg?
Median Family Income in Lewisburg is $76,739.
What is the Median Household income in Lewisburg?
Median Household Income in Lewisburg is $47,563.
What is Income or Wage Gap in Lewisburg?
Income or Wage Gap in Lewisburg is 21.0%.
Women in Lewisburg earn 79.0 cents for every dollar earned by a man.
What is Inequality or Gini Index in Lewisburg?
Inequality or Gini Index in Lewisburg is 0.58.
What is the Total Population of Lewisburg?
Total Population of Lewisburg is 3,890.
What is the Total Male Population of Lewisburg?
Total Male Population of Lewisburg is 1,676.
What is the Total Female Population of Lewisburg?
Total Female Population of Lewisburg is 2,214.
What is the Ratio of Males per 100 Females in Lewisburg?
There are 75.70 Males per 100 Females in Lewisburg.
What is the Ratio of Females per 100 Males in Lewisburg?
There are 132.10 Females per 100 Males in Lewisburg.
What is the Median Population Age in Lewisburg?
Median Population Age in Lewisburg is 39.1 Years.
What is the Average Family Size in Lewisburg
Average Family Size in Lewisburg is 3.4 People.
What is the Average Household Size in Lewisburg
Average Household Size in Lewisburg is 2.1 People.
How Large is the Labor Force in Lewisburg?
There are 1,465 People in the Labor Forcein in Lewisburg.
What is the Percentage of People in the Labor Force in Lewisburg?
48.2% of People are in the Labor Force in Lewisburg.