Woodlawn Heights, IN Map & Demographics
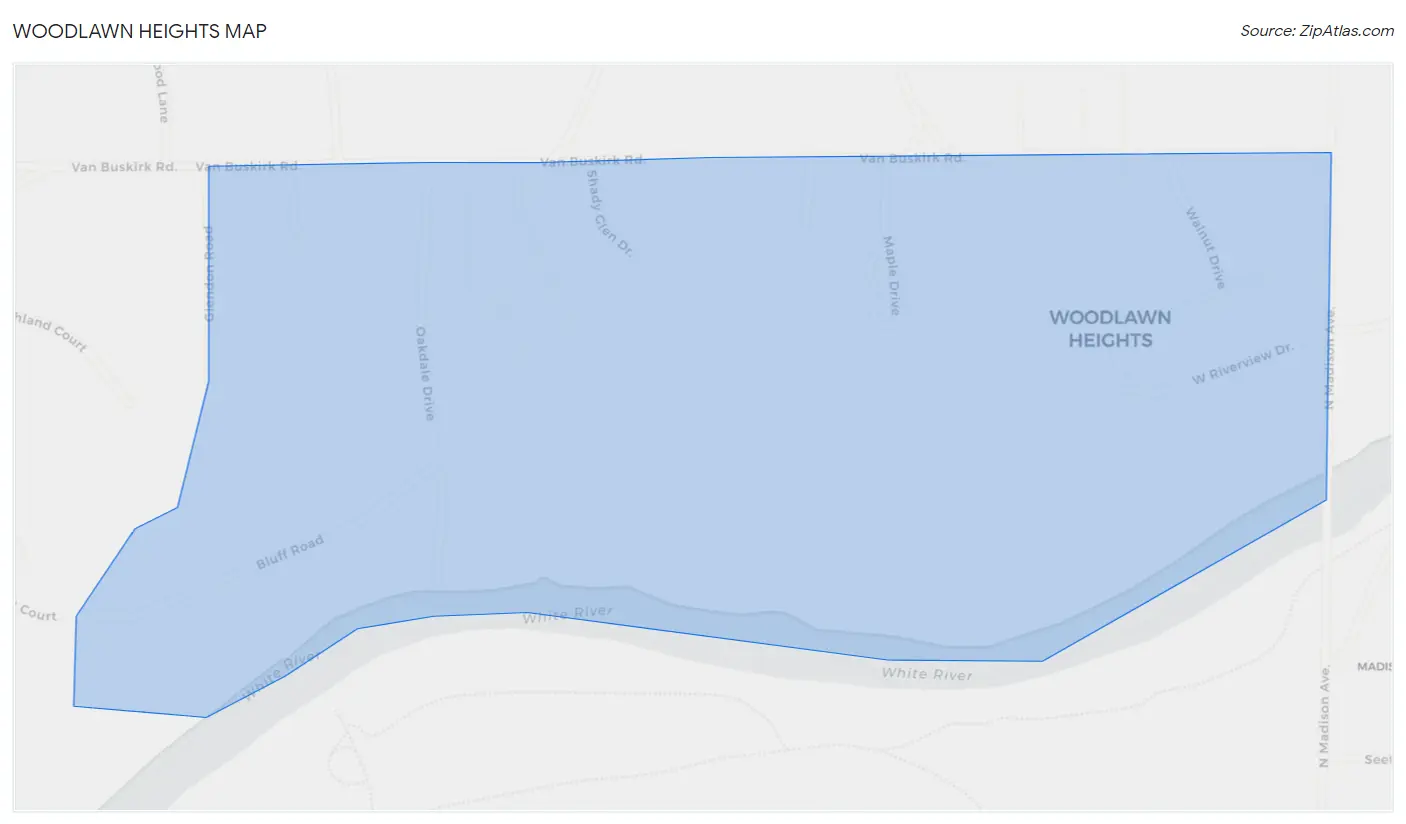
Woodlawn Heights Map
Woodlawn Heights Overview
$45,183
PER CAPITA INCOME
$113,542
AVG FAMILY INCOME
$110,000
AVG HOUSEHOLD INCOME
0.40
INEQUALITY / GINI INDEX
113
TOTAL POPULATION
56
MALE POPULATION
57
FEMALE POPULATION
98.25
MALES / 100 FEMALES
101.79
FEMALES / 100 MALES
35.4
MEDIAN AGE
3.3
AVG FAMILY SIZE
3.0
AVG HOUSEHOLD SIZE
52
LABOR FORCE [ PEOPLE ]
72.2%
PERCENT IN LABOR FORCE
Woodlawn Heights Area Codes
Income in Woodlawn Heights
Income Overview in Woodlawn Heights
Per Capita Income in Woodlawn Heights is $45,183, while median incomes of families and households are $113,542 and $110,000 respectively.
| Characteristic | Number | Measure |
| Per Capita Income | 113 | $45,183 |
| Median Family Income | 33 | $113,542 |
| Mean Family Income | 33 | $143,367 |
| Median Household Income | 38 | $110,000 |
| Mean Household Income | 38 | $131,905 |
| Income Deficit | 33 | $0 |
| Wage / Income Gap (%) | 113 | 0.00% |
| Wage / Income Gap ($) | 113 | 100.00¢ per $1 |
| Gini / Inequality Index | 113 | 0.40 |
Earnings by Sex in Woodlawn Heights
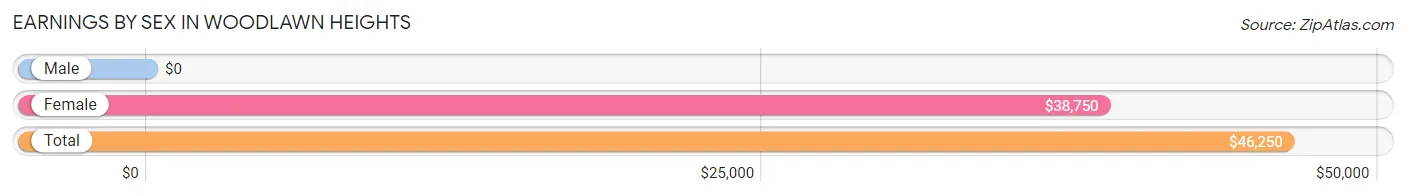
| Sex | Number | Average Earnings |
| Male | 27 (49.1%) | $0 |
| Female | 28 (50.9%) | $38,750 |
| Total | 55 (100.0%) | $46,250 |
Earnings by Sex by Income Bracket in Woodlawn Heights
The most common earnings brackets in Woodlawn Heights are $100,000+ for men (6 | 22.2%) and $30,000 to $34,999 for women (7 | 25.0%).
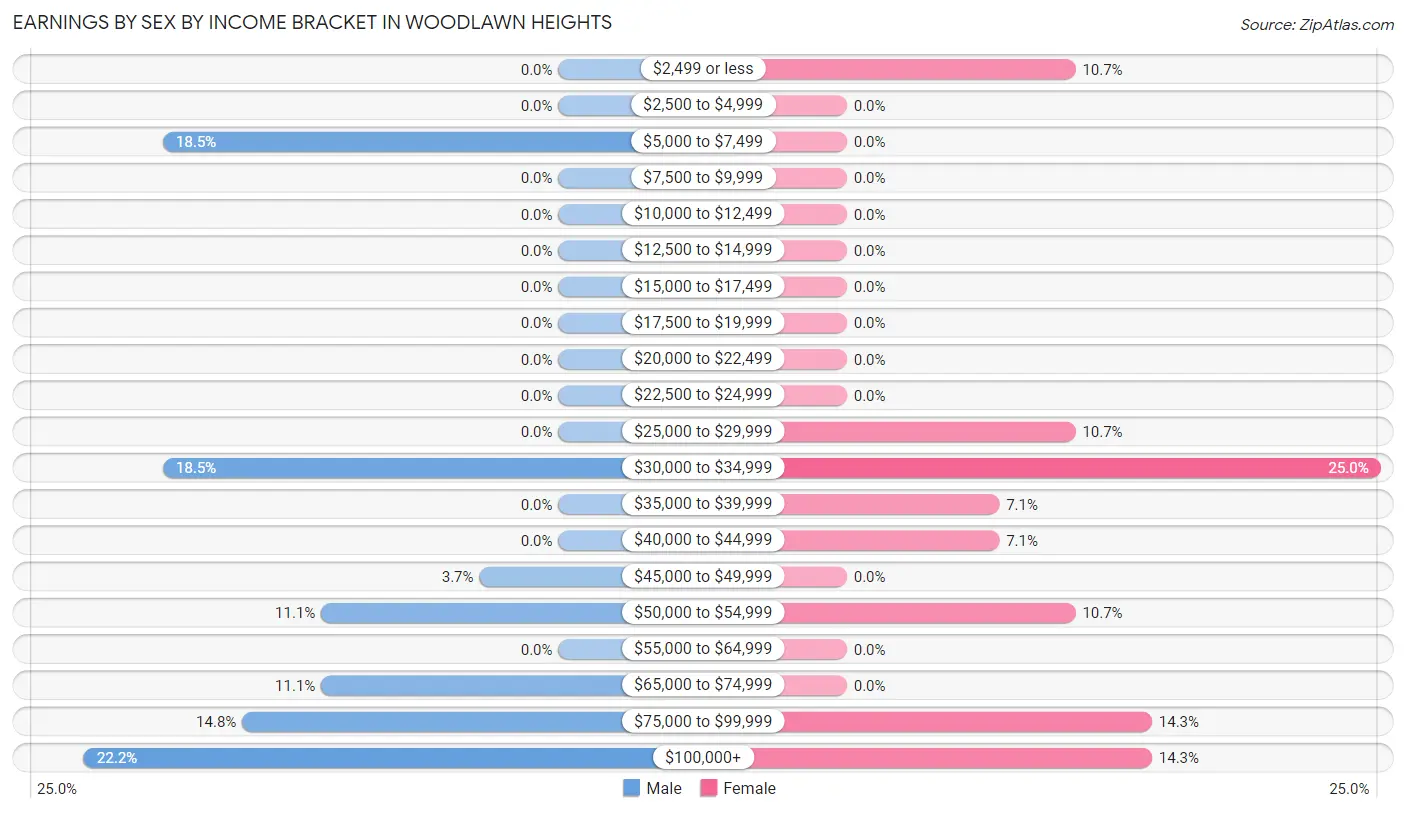
| Income | Male | Female |
| $2,499 or less | 0 (0.0%) | 3 (10.7%) |
| $2,500 to $4,999 | 0 (0.0%) | 0 (0.0%) |
| $5,000 to $7,499 | 5 (18.5%) | 0 (0.0%) |
| $7,500 to $9,999 | 0 (0.0%) | 0 (0.0%) |
| $10,000 to $12,499 | 0 (0.0%) | 0 (0.0%) |
| $12,500 to $14,999 | 0 (0.0%) | 0 (0.0%) |
| $15,000 to $17,499 | 0 (0.0%) | 0 (0.0%) |
| $17,500 to $19,999 | 0 (0.0%) | 0 (0.0%) |
| $20,000 to $22,499 | 0 (0.0%) | 0 (0.0%) |
| $22,500 to $24,999 | 0 (0.0%) | 0 (0.0%) |
| $25,000 to $29,999 | 0 (0.0%) | 3 (10.7%) |
| $30,000 to $34,999 | 5 (18.5%) | 7 (25.0%) |
| $35,000 to $39,999 | 0 (0.0%) | 2 (7.1%) |
| $40,000 to $44,999 | 0 (0.0%) | 2 (7.1%) |
| $45,000 to $49,999 | 1 (3.7%) | 0 (0.0%) |
| $50,000 to $54,999 | 3 (11.1%) | 3 (10.7%) |
| $55,000 to $64,999 | 0 (0.0%) | 0 (0.0%) |
| $65,000 to $74,999 | 3 (11.1%) | 0 (0.0%) |
| $75,000 to $99,999 | 4 (14.8%) | 4 (14.3%) |
| $100,000+ | 6 (22.2%) | 4 (14.3%) |
| Total | 27 (100.0%) | 28 (100.0%) |
Earnings by Sex by Educational Attainment in Woodlawn Heights
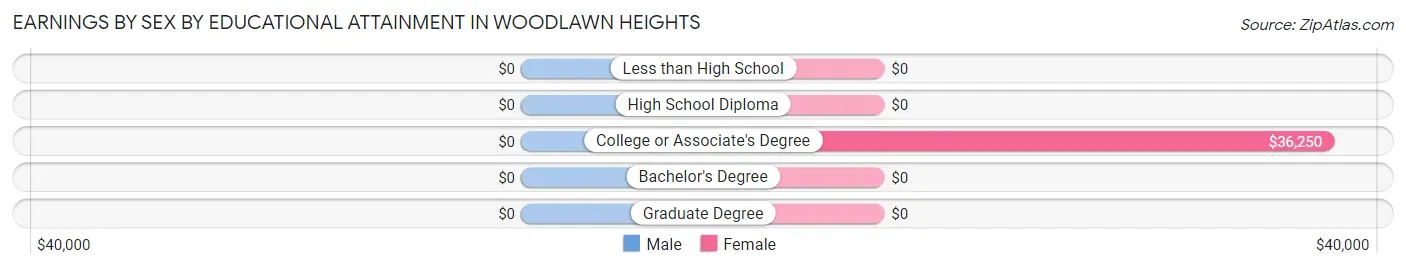
| Educational Attainment | Male Income | Female Income |
| Less than High School | - | - |
| High School Diploma | - | - |
| College or Associate's Degree | - | - |
| Bachelor's Degree | - | - |
| Graduate Degree | - | - |
| Total | $72,917 | $38,750 |
Family Income in Woodlawn Heights
Family Income Brackets in Woodlawn Heights
According to the Woodlawn Heights family income data, there are 10 families falling into the $100,000 to $149,999 income range, which is the most common income bracket and makes up 30.3% of all families.
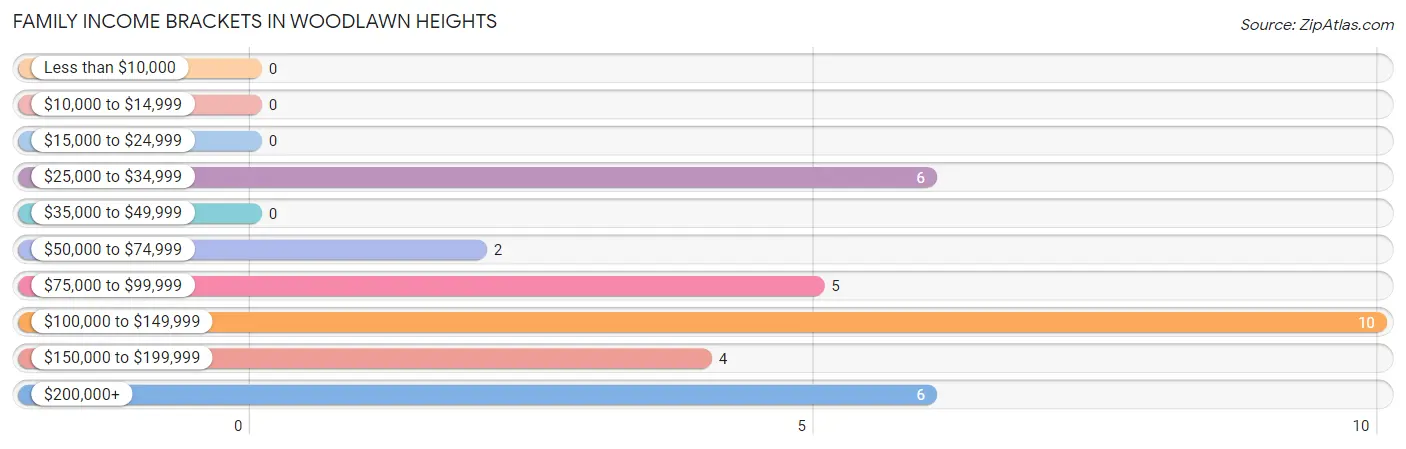
| Income Bracket | # Families | % Families |
| Less than $10,000 | 0 | 0.0% |
| $10,000 to $14,999 | 0 | 0.0% |
| $15,000 to $24,999 | 0 | 0.0% |
| $25,000 to $34,999 | 6 | 18.2% |
| $35,000 to $49,999 | 0 | 0.0% |
| $50,000 to $74,999 | 2 | 6.1% |
| $75,000 to $99,999 | 5 | 15.2% |
| $100,000 to $149,999 | 10 | 30.3% |
| $150,000 to $199,999 | 4 | 12.1% |
| $200,000+ | 6 | 18.2% |
Family Income by Famaliy Size in Woodlawn Heights
| Income Bracket | # Families | Median Income |
| 2-Person Families | 15 (45.5%) | $0 |
| 3-Person Families | 2 (6.1%) | $0 |
| 4-Person Families | 7 (21.2%) | $0 |
| 5-Person Families | 6 (18.2%) | $0 |
| 6-Person Families | 3 (9.1%) | $0 |
| 7+ Person Families | 0 (0.0%) | $0 |
| Total | 33 (100.0%) | $113,542 |
Family Income by Number of Earners in Woodlawn Heights
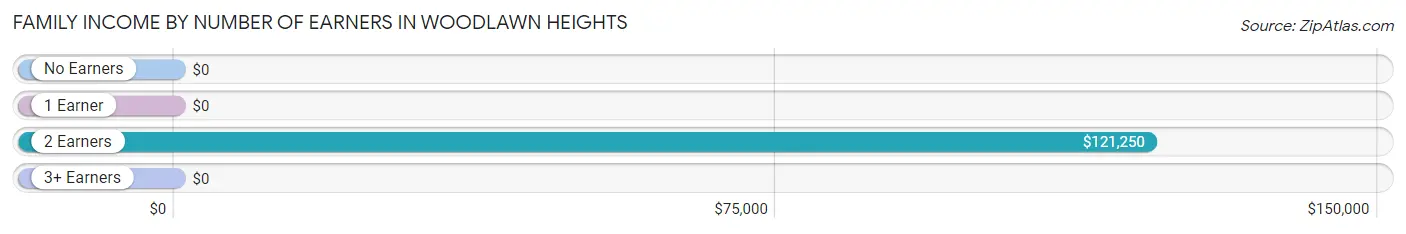
| Number of Earners | # Families | Median Income |
| No Earners | 7 (21.2%) | $0 |
| 1 Earner | 4 (12.1%) | $0 |
| 2 Earners | 20 (60.6%) | $121,250 |
| 3+ Earners | 2 (6.1%) | $0 |
| Total | 33 (100.0%) | $113,542 |
Household Income in Woodlawn Heights
Household Income Brackets in Woodlawn Heights
With 10 households falling in the category, the $100,000 to $149,999 income range is the most frequent in Woodlawn Heights, accounting for 26.3% of all households.
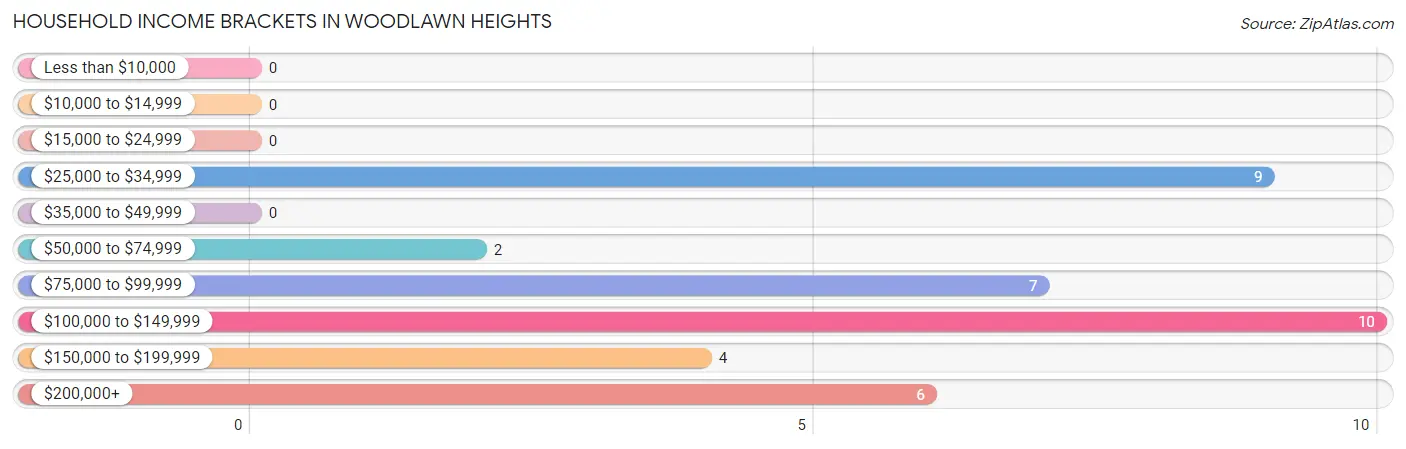
| Income Bracket | # Households | % Households |
| Less than $10,000 | 0 | 0.0% |
| $10,000 to $14,999 | 0 | 0.0% |
| $15,000 to $24,999 | 0 | 0.0% |
| $25,000 to $34,999 | 9 | 23.7% |
| $35,000 to $49,999 | 0 | 0.0% |
| $50,000 to $74,999 | 2 | 5.3% |
| $75,000 to $99,999 | 7 | 18.4% |
| $100,000 to $149,999 | 10 | 26.3% |
| $150,000 to $199,999 | 4 | 10.5% |
| $200,000+ | 6 | 15.8% |
Household Income by Householder Age in Woodlawn Heights
The median household income in Woodlawn Heights is $110,000, with the highest median household income of $113,750 found in the 25 to 44 years age bracket for the primary householder. A total of 18 households (47.4%) fall into this category.
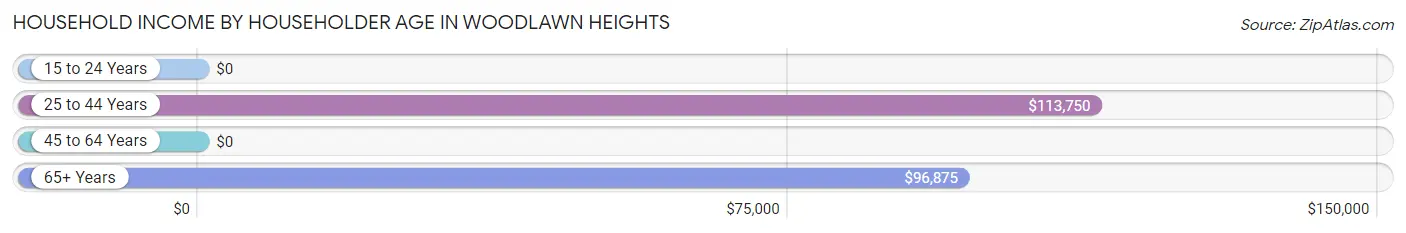
| Income Bracket | # Households | Median Income |
| 15 to 24 Years | 0 (0.0%) | $0 |
| 25 to 44 Years | 18 (47.4%) | $113,750 |
| 45 to 64 Years | 7 (18.4%) | $0 |
| 65+ Years | 13 (34.2%) | $96,875 |
| Total | 38 (100.0%) | $110,000 |
Poverty in Woodlawn Heights
Income Below Poverty by Sex and Age in Woodlawn Heights
| Age Bracket | Male | Female |
| Under 5 Years | 0 (0.0%) | 0 (0.0%) |
| 5 Years | 0 (0.0%) | 0 (0.0%) |
| 6 to 11 Years | 0 (0.0%) | 0 (0.0%) |
| 12 to 14 Years | 0 (0.0%) | 0 (0.0%) |
| 15 Years | 0 (0.0%) | 0 (0.0%) |
| 16 and 17 Years | 0 (0.0%) | 0 (0.0%) |
| 18 to 24 Years | 0 (0.0%) | 0 (0.0%) |
| 25 to 34 Years | 0 (0.0%) | 0 (0.0%) |
| 35 to 44 Years | 0 (0.0%) | 0 (0.0%) |
| 45 to 54 Years | 0 (0.0%) | 0 (0.0%) |
| 55 to 64 Years | 0 (0.0%) | 0 (0.0%) |
| 65 to 74 Years | 0 (0.0%) | 0 (0.0%) |
| 75 Years and over | 0 (0.0%) | 0 (0.0%) |
| Total | 0 (0.0%) | 0 (0.0%) |
Income Above Poverty by Sex and Age in Woodlawn Heights
According to the poverty statistics in Woodlawn Heights, males aged under 5 years and females aged under 5 years are the age groups that are most secure financially, with 100.0% of males and 100.0% of females in these age groups living above the poverty line.
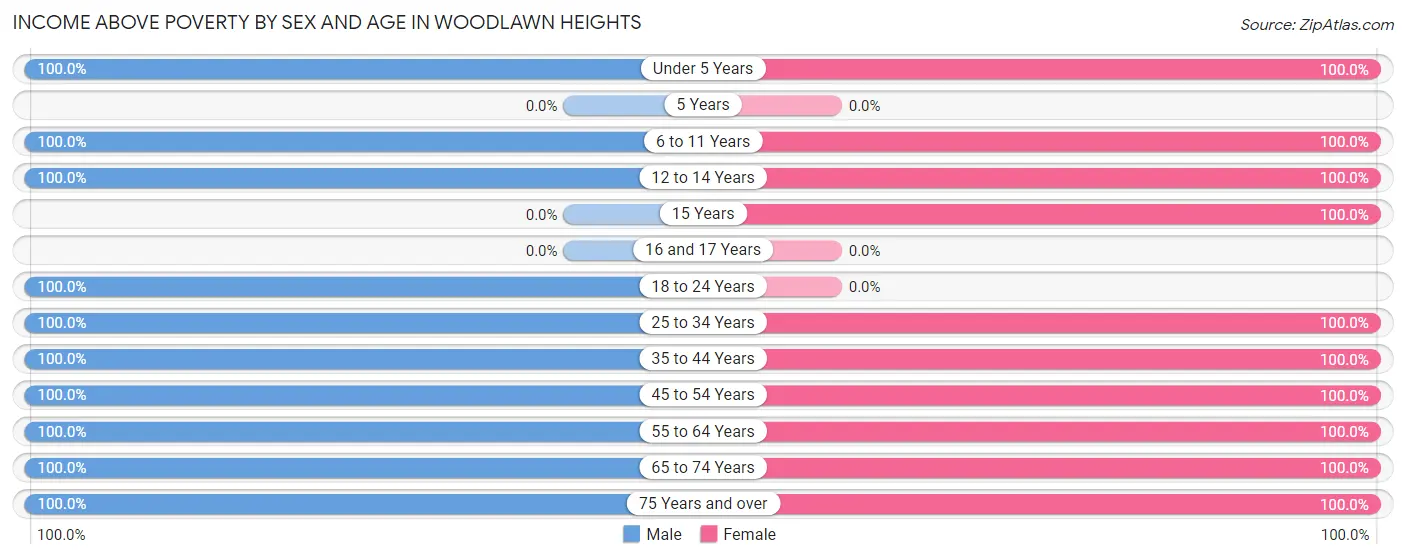
| Age Bracket | Male | Female |
| Under 5 Years | 8 (100.0%) | 2 (100.0%) |
| 5 Years | 0 (0.0%) | 0 (0.0%) |
| 6 to 11 Years | 12 (100.0%) | 6 (100.0%) |
| 12 to 14 Years | 2 (100.0%) | 9 (100.0%) |
| 15 Years | 0 (0.0%) | 2 (100.0%) |
| 16 and 17 Years | 0 (0.0%) | 0 (0.0%) |
| 18 to 24 Years | 2 (100.0%) | 0 (0.0%) |
| 25 to 34 Years | 4 (100.0%) | 7 (100.0%) |
| 35 to 44 Years | 8 (100.0%) | 15 (100.0%) |
| 45 to 54 Years | 4 (100.0%) | 3 (100.0%) |
| 55 to 64 Years | 3 (100.0%) | 3 (100.0%) |
| 65 to 74 Years | 6 (100.0%) | 7 (100.0%) |
| 75 Years and over | 7 (100.0%) | 3 (100.0%) |
| Total | 56 (100.0%) | 57 (100.0%) |
Income Below Poverty Among Married-Couple Families in Woodlawn Heights
| Children | Above Poverty | Below Poverty |
| No Children | 14 (100.0%) | 0 (0.0%) |
| 1 or 2 Children | 7 (100.0%) | 0 (0.0%) |
| 3 or 4 Children | 9 (100.0%) | 0 (0.0%) |
| 5 or more Children | 0 (0.0%) | 0 (0.0%) |
| Total | 30 (100.0%) | 0 (0.0%) |
Income Below Poverty Among Single-Parent Households in Woodlawn Heights
| Children | Single Father | Single Mother |
| No Children | 0 (0.0%) | 0 (0.0%) |
| 1 or 2 Children | 0 (0.0%) | 0 (0.0%) |
| 3 or 4 Children | 0 (0.0%) | 0 (0.0%) |
| 5 or more Children | 0 (0.0%) | 0 (0.0%) |
| Total | 0 (0.0%) | 0 (0.0%) |
Income Below Poverty Among Married-Couple vs Single-Parent Households in Woodlawn Heights
| Children | Married-Couple Families | Single-Parent Households |
| No Children | 0 (0.0%) | 0 (0.0%) |
| 1 or 2 Children | 0 (0.0%) | 0 (0.0%) |
| 3 or 4 Children | 0 (0.0%) | 0 (0.0%) |
| 5 or more Children | 0 (0.0%) | 0 (0.0%) |
| Total | 0 (0.0%) | 0 (0.0%) |
Race in Woodlawn Heights
The most populous races in Woodlawn Heights are White / Caucasian (105 | 92.9%), Two or more Races (8 | 7.1%), and Hispanic or Latino (7 | 6.2%).
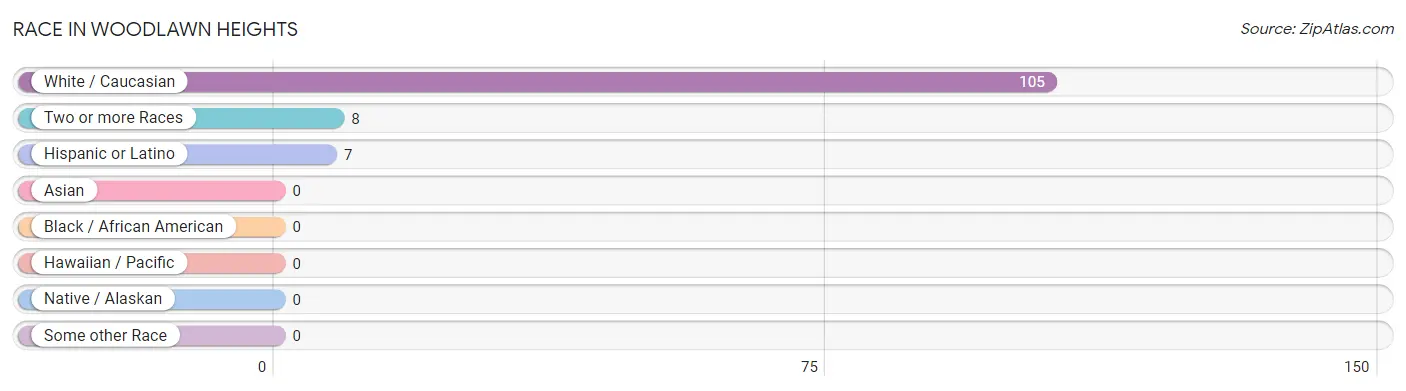
| Race | # Population | % Population |
| Asian | 0 | 0.0% |
| Black / African American | 0 | 0.0% |
| Hawaiian / Pacific | 0 | 0.0% |
| Hispanic or Latino | 7 | 6.2% |
| Native / Alaskan | 0 | 0.0% |
| White / Caucasian | 105 | 92.9% |
| Two or more Races | 8 | 7.1% |
| Some other Race | 0 | 0.0% |
| Total | 113 | 100.0% |
Ancestry in Woodlawn Heights
The most populous ancestries reported in Woodlawn Heights are English (38 | 33.6%), German (26 | 23.0%), Irish (15 | 13.3%), Polish (12 | 10.6%), and Norwegian (10 | 8.8%), together accounting for 89.4% of all Woodlawn Heights residents.
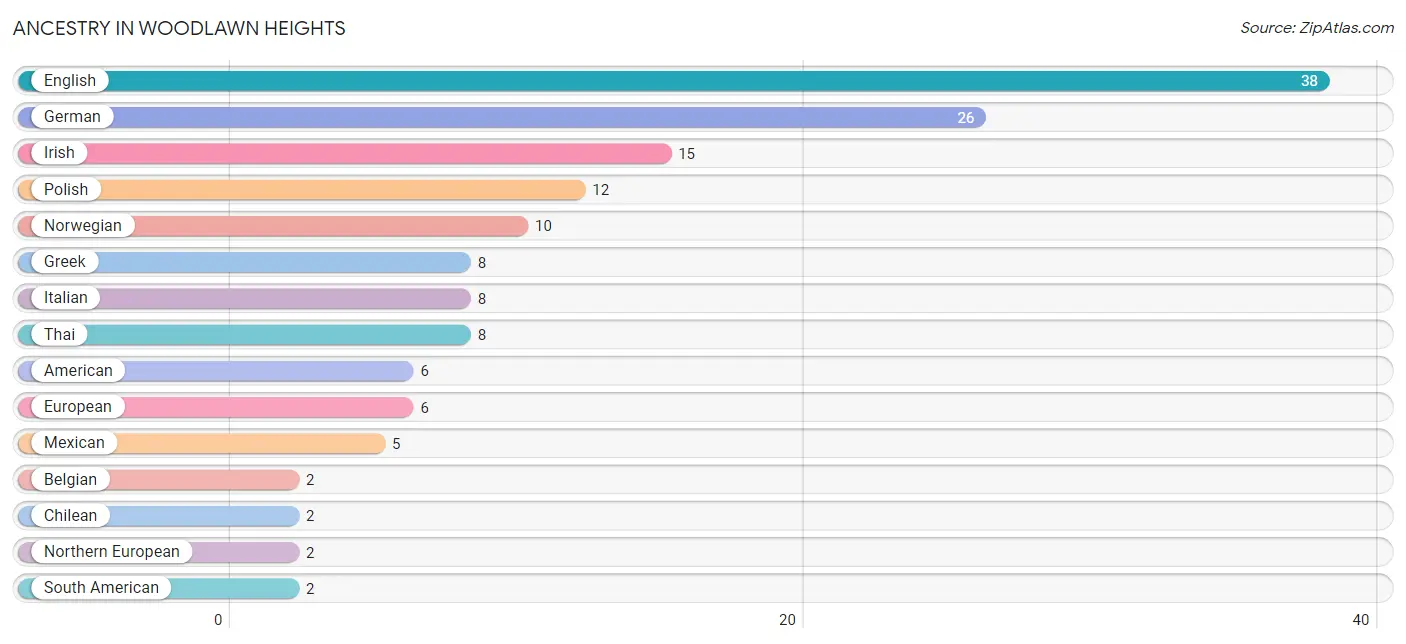
| Ancestry | # Population | % Population |
| American | 6 | 5.3% |
| Belgian | 2 | 1.8% |
| Chilean | 2 | 1.8% |
| English | 38 | 33.6% |
| European | 6 | 5.3% |
| German | 26 | 23.0% |
| Greek | 8 | 7.1% |
| Irish | 15 | 13.3% |
| Italian | 8 | 7.1% |
| Mexican | 5 | 4.4% |
| Northern European | 2 | 1.8% |
| Norwegian | 10 | 8.8% |
| Polish | 12 | 10.6% |
| South American | 2 | 1.8% |
| Thai | 8 | 7.1% | View All 15 Rows |
Immigrants in Woodlawn Heights
The most numerous immigrant groups reported in Woodlawn Heights came from Latin America (3 | 2.6%), Central America (2 | 1.8%), Mexico (2 | 1.8%), Chile (1 | 0.9%), and South America (1 | 0.9%), together accounting for 8.0% of all Woodlawn Heights residents.
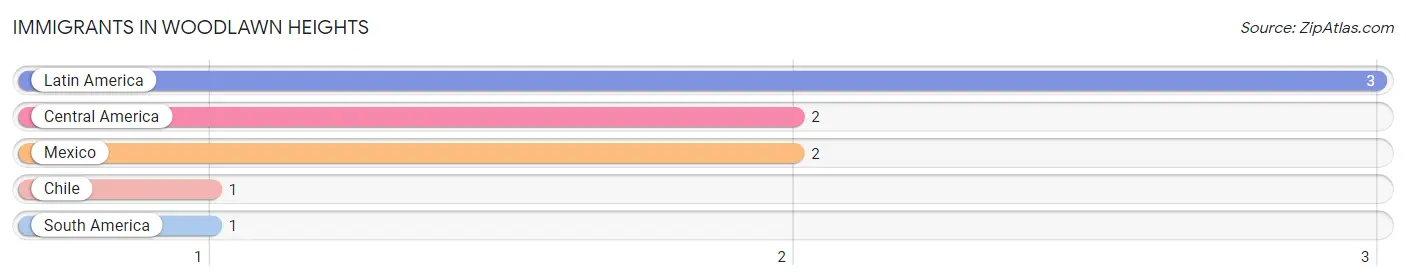
| Immigration Origin | # Population | % Population |
| Central America | 2 | 1.8% |
| Chile | 1 | 0.9% |
| Latin America | 3 | 2.6% |
| Mexico | 2 | 1.8% |
| South America | 1 | 0.9% | View All 5 Rows |
Sex and Age in Woodlawn Heights
Sex and Age in Woodlawn Heights
The most populous age groups in Woodlawn Heights are Under 5 Years (8 | 14.3%) for men and 35 to 39 Years (11 | 19.3%) for women.
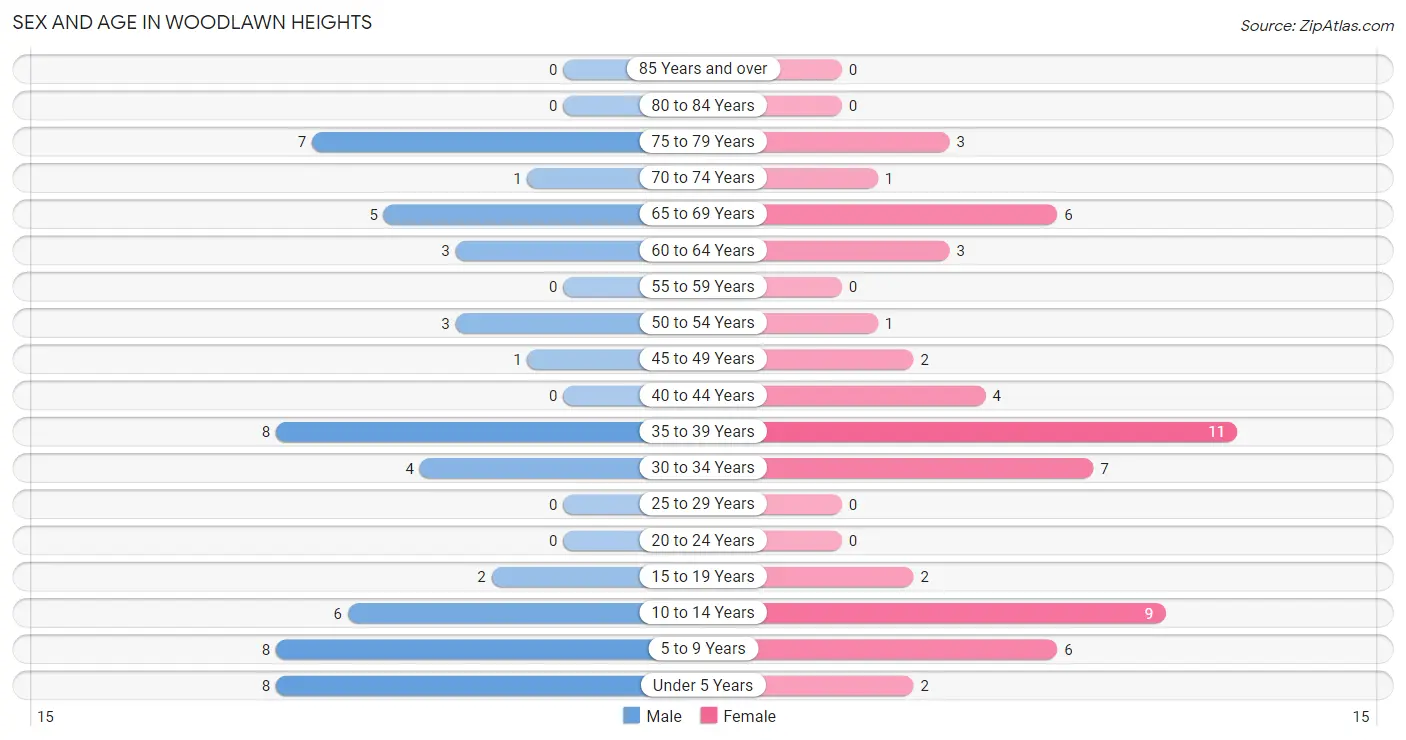
| Age Bracket | Male | Female |
| Under 5 Years | 8 (14.3%) | 2 (3.5%) |
| 5 to 9 Years | 8 (14.3%) | 6 (10.5%) |
| 10 to 14 Years | 6 (10.7%) | 9 (15.8%) |
| 15 to 19 Years | 2 (3.6%) | 2 (3.5%) |
| 20 to 24 Years | 0 (0.0%) | 0 (0.0%) |
| 25 to 29 Years | 0 (0.0%) | 0 (0.0%) |
| 30 to 34 Years | 4 (7.1%) | 7 (12.3%) |
| 35 to 39 Years | 8 (14.3%) | 11 (19.3%) |
| 40 to 44 Years | 0 (0.0%) | 4 (7.0%) |
| 45 to 49 Years | 1 (1.8%) | 2 (3.5%) |
| 50 to 54 Years | 3 (5.4%) | 1 (1.8%) |
| 55 to 59 Years | 0 (0.0%) | 0 (0.0%) |
| 60 to 64 Years | 3 (5.4%) | 3 (5.3%) |
| 65 to 69 Years | 5 (8.9%) | 6 (10.5%) |
| 70 to 74 Years | 1 (1.8%) | 1 (1.8%) |
| 75 to 79 Years | 7 (12.5%) | 3 (5.3%) |
| 80 to 84 Years | 0 (0.0%) | 0 (0.0%) |
| 85 Years and over | 0 (0.0%) | 0 (0.0%) |
| Total | 56 (100.0%) | 57 (100.0%) |
Families and Households in Woodlawn Heights
Median Family Size in Woodlawn Heights
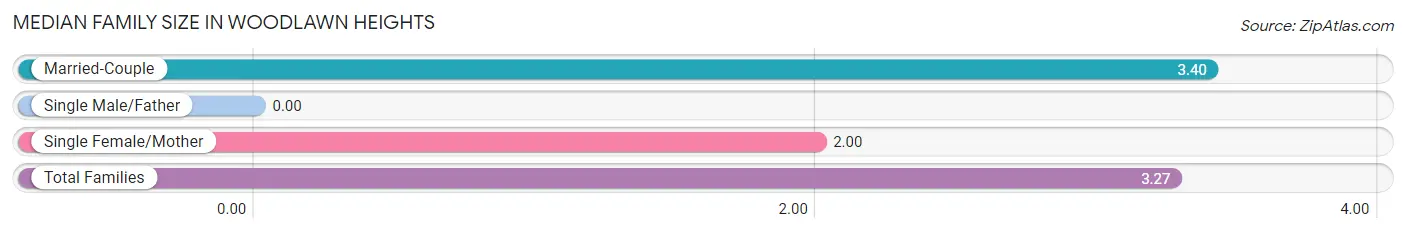
| Family Type | # Families | Family Size |
| Married-Couple | 30 (90.9%) | 3.40 |
| Single Male/Father | 0 (0.0%) | - |
| Single Female/Mother | 3 (9.1%) | 2.00 |
| Total Families | 33 (100.0%) | 3.27 |
Median Household Size in Woodlawn Heights
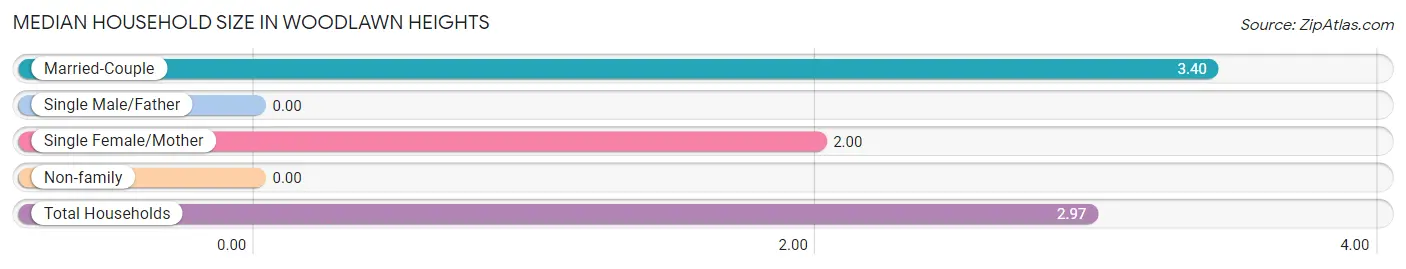
| Household Type | # Households | Household Size |
| Married-Couple | 30 (78.9%) | 3.40 |
| Single Male/Father | 0 (0.0%) | - |
| Single Female/Mother | 3 (7.9%) | 2.00 |
| Non-family | 5 (13.2%) | - |
| Total Households | 38 (100.0%) | 2.97 |
Household Size by Marriage Status in Woodlawn Heights
Out of a total of 38 households in Woodlawn Heights, 33 (86.8%) are family households, while 5 (13.2%) are nonfamily households. The most numerous type of family households are 2-person households, comprising 15, and the most common type of nonfamily households are 1-person households, comprising 5.
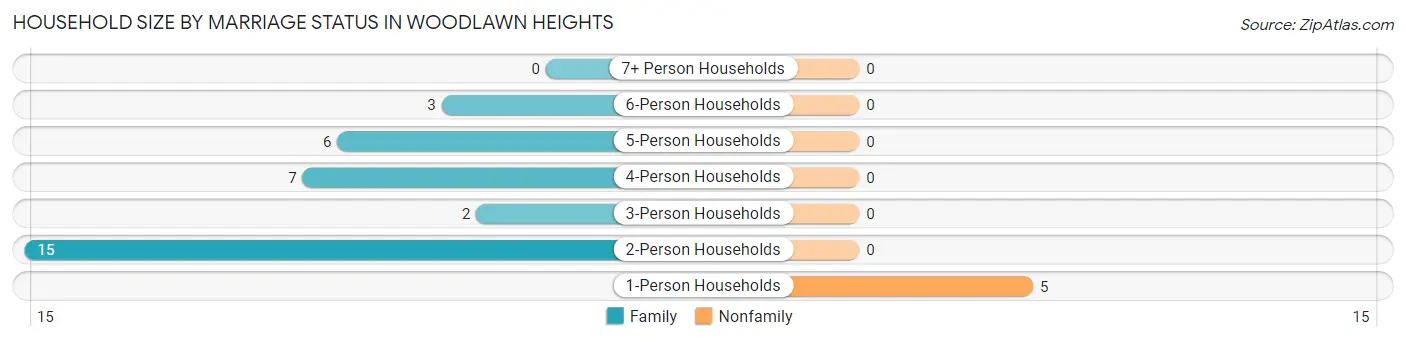
| Household Size | Family Households | Nonfamily Households |
| 1-Person Households | - | 5 (13.2%) |
| 2-Person Households | 15 (39.5%) | 0 (0.0%) |
| 3-Person Households | 2 (5.3%) | 0 (0.0%) |
| 4-Person Households | 7 (18.4%) | 0 (0.0%) |
| 5-Person Households | 6 (15.8%) | 0 (0.0%) |
| 6-Person Households | 3 (7.9%) | 0 (0.0%) |
| 7+ Person Households | 0 (0.0%) | 0 (0.0%) |
| Total | 33 (86.8%) | 5 (13.2%) |
Female Fertility in Woodlawn Heights
Fertility by Age in Woodlawn Heights
Average fertility rate in Woodlawn Heights is 77.0 births per 1,000 women. Women in the age bracket of 35 to 50 years have the highest fertility rate with 118.0 births per 1,000 women. Women in the age bracket of 35 to 50 years acount for 100.0% of all women with births.
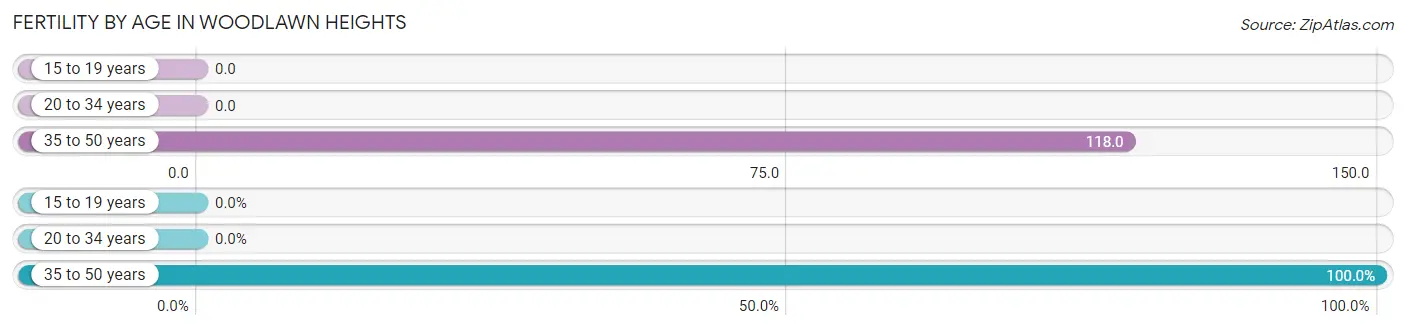
| Age Bracket | Women with Births | Births / 1,000 Women |
| 15 to 19 years | 0 (0.0%) | 0.0 |
| 20 to 34 years | 0 (0.0%) | 0.0 |
| 35 to 50 years | 2 (100.0%) | 118.0 |
| Total | 2 (100.0%) | 77.0 |
Fertility by Age by Marriage Status in Woodlawn Heights
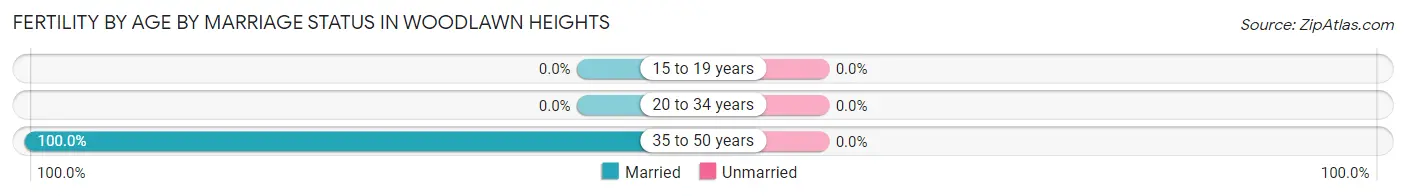
| Age Bracket | Married | Unmarried |
| 15 to 19 years | 0 (0.0%) | 0 (0.0%) |
| 20 to 34 years | 0 (0.0%) | 0 (0.0%) |
| 35 to 50 years | 2 (100.0%) | 0 (0.0%) |
| Total | 2 (100.0%) | 0 (0.0%) |
Fertility by Education in Woodlawn Heights
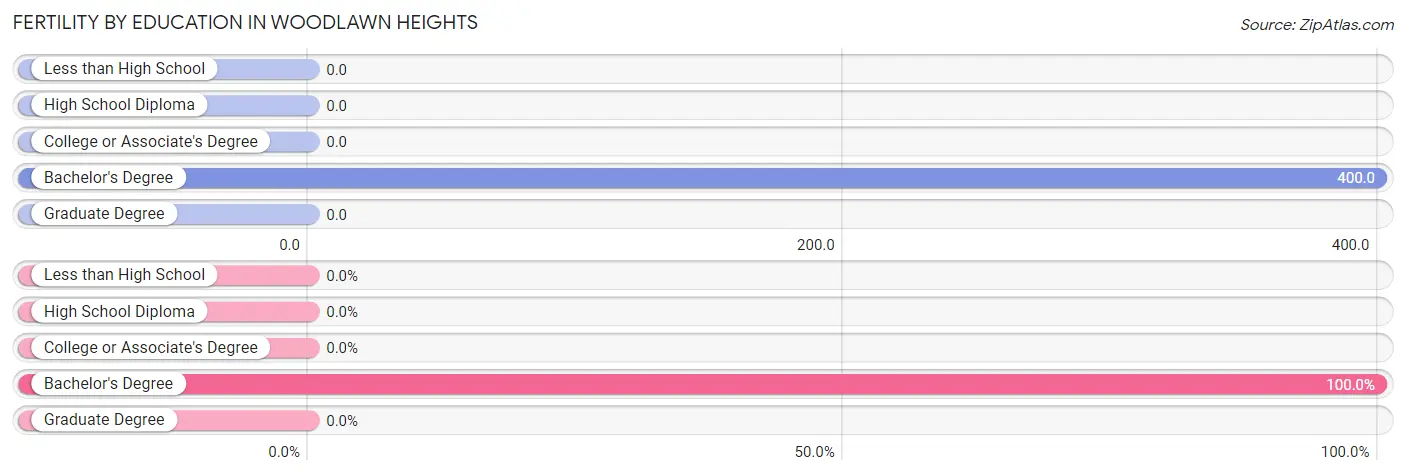
| Educational Attainment | Women with Births | Births / 1,000 Women |
| Less than High School | 0 (0.0%) | 0.0 |
| High School Diploma | 0 (0.0%) | 0.0 |
| College or Associate's Degree | 0 (0.0%) | 0.0 |
| Bachelor's Degree | 2 (100.0%) | 400.0 |
| Graduate Degree | 0 (0.0%) | 0.0 |
| Total | 2 (100.0%) | 77.0 |
Fertility by Education by Marriage Status in Woodlawn Heights
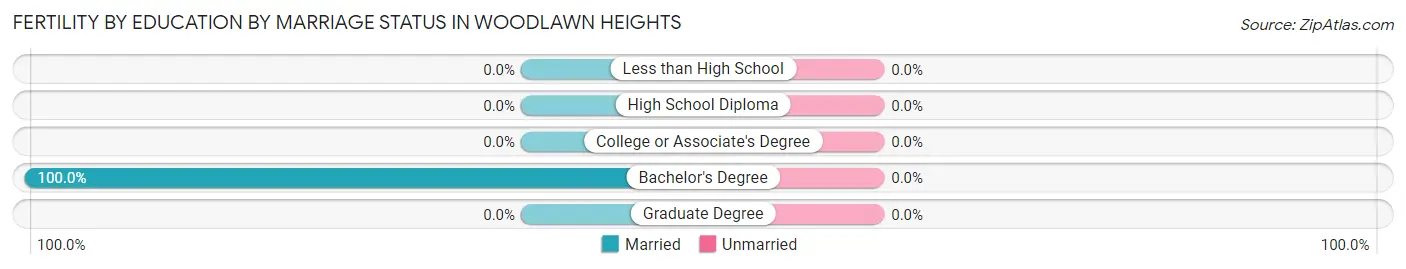
| Educational Attainment | Married | Unmarried |
| Less than High School | 0 (0.0%) | 0 (0.0%) |
| High School Diploma | 0 (0.0%) | 0 (0.0%) |
| College or Associate's Degree | 0 (0.0%) | 0 (0.0%) |
| Bachelor's Degree | 2 (100.0%) | 0 (0.0%) |
| Graduate Degree | 0 (0.0%) | 0 (0.0%) |
| Total | 2 (100.0%) | 0 (0.0%) |
Employment Characteristics in Woodlawn Heights
Employment by Class of Employer in Woodlawn Heights
Among the 48 employed individuals in Woodlawn Heights, private company employees (31 | 64.6%), self-employed (not incorporated) (11 | 22.9%), and not-for-profit organizations (5 | 10.4%) make up the most common classes of employment.
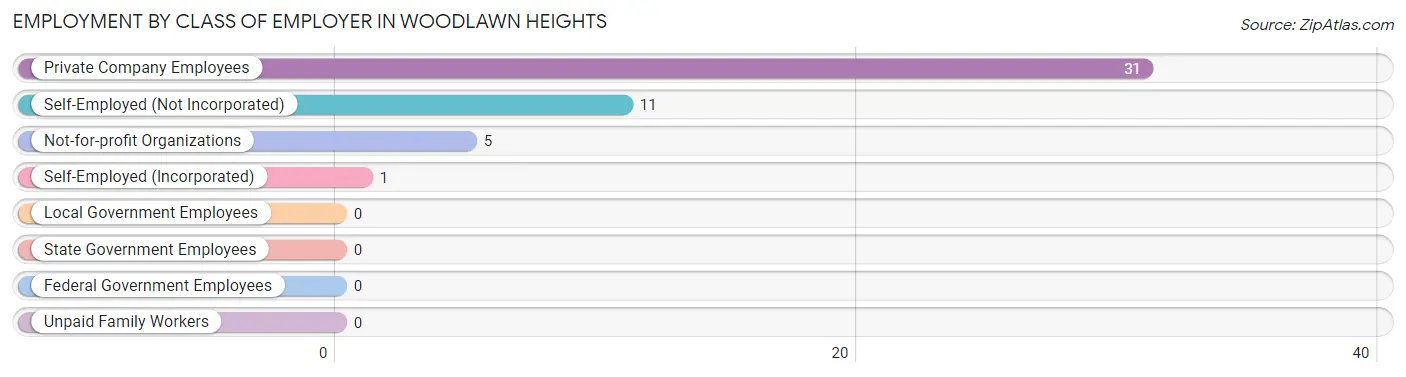
| Employer Class | # Employees | % Employees |
| Private Company Employees | 31 | 64.6% |
| Self-Employed (Incorporated) | 1 | 2.1% |
| Self-Employed (Not Incorporated) | 11 | 22.9% |
| Not-for-profit Organizations | 5 | 10.4% |
| Local Government Employees | 0 | 0.0% |
| State Government Employees | 0 | 0.0% |
| Federal Government Employees | 0 | 0.0% |
| Unpaid Family Workers | 0 | 0.0% |
| Total | 48 | 100.0% |
Employment Status by Age in Woodlawn Heights
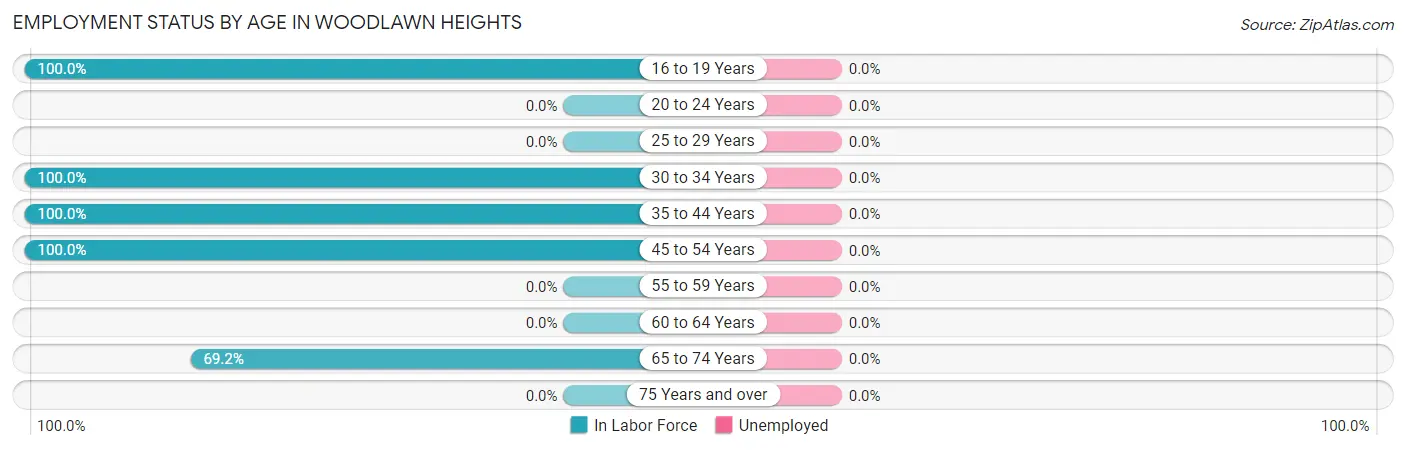
| Age Bracket | In Labor Force | Unemployed |
| 16 to 19 Years | 2 (100.0%) | 0 (0.0%) |
| 20 to 24 Years | 0 (0.0%) | 0 (0.0%) |
| 25 to 29 Years | 0 (0.0%) | 0 (0.0%) |
| 30 to 34 Years | 11 (100.0%) | 0 (0.0%) |
| 35 to 44 Years | 23 (100.0%) | 0 (0.0%) |
| 45 to 54 Years | 7 (100.0%) | 0 (0.0%) |
| 55 to 59 Years | 0 (0.0%) | 0 (0.0%) |
| 60 to 64 Years | 0 (0.0%) | 0 (0.0%) |
| 65 to 74 Years | 9 (69.2%) | 0 (0.0%) |
| 75 Years and over | 0 (0.0%) | 0 (0.0%) |
| Total | 52 (72.2%) | 0 (0.0%) |
Employment Status by Educational Attainment in Woodlawn Heights
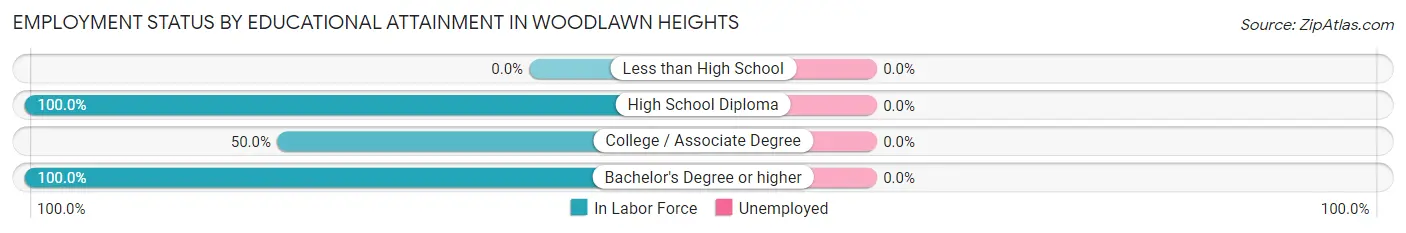
| Educational Attainment | In Labor Force | Unemployed |
| Less than High School | 0 (0.0%) | 0 (0.0%) |
| High School Diploma | 16 (100.0%) | 0 (0.0%) |
| College / Associate Degree | 6 (50.0%) | 0 (0.0%) |
| Bachelor's Degree or higher | 19 (100.0%) | 0 (0.0%) |
| Total | 41 (87.2%) | 0 (0.0%) |
Employment Occupations by Sex in Woodlawn Heights
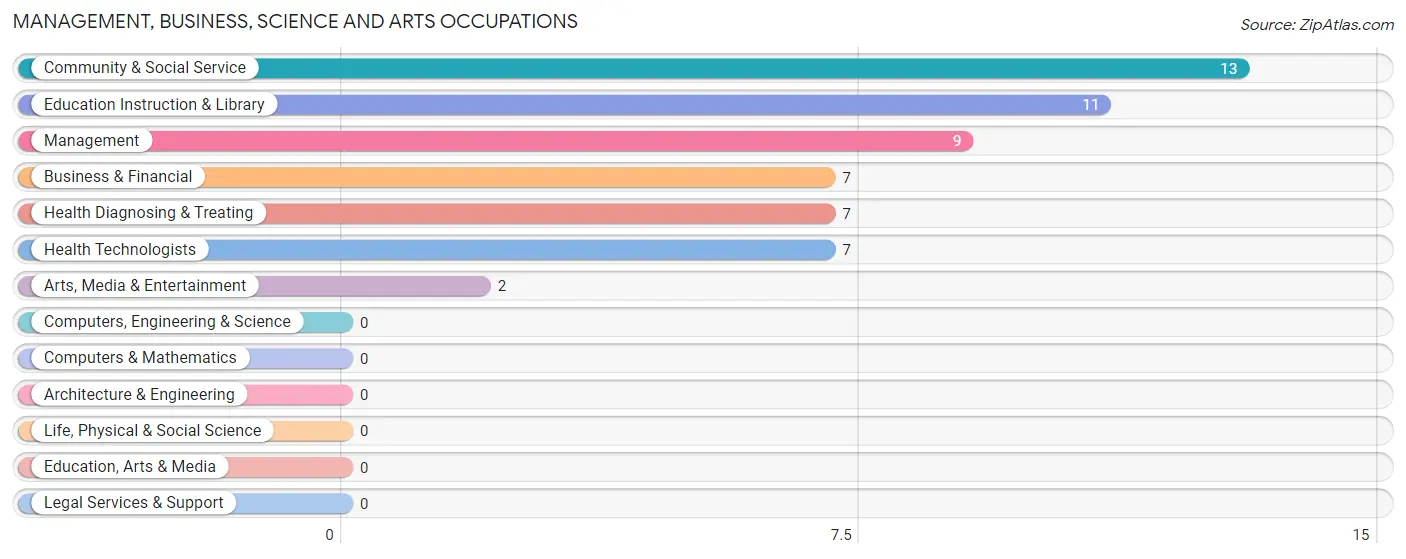
Management, Business, Science and Arts Occupations
The most common Management, Business, Science and Arts occupations in Woodlawn Heights are Community & Social Service (13 | 25.0%), Education Instruction & Library (11 | 21.1%), Management (9 | 17.3%), Business & Financial (7 | 13.5%), and Health Diagnosing & Treating (7 | 13.5%).
Management, Business, Science and Arts Occupations by Sex
Within the Management, Business, Science and Arts occupations in Woodlawn Heights, the most male-oriented occupations are Business & Financial (85.7%), Education Instruction & Library (45.5%), and Management (44.4%), while the most female-oriented occupations are Arts, Media & Entertainment (100.0%), Health Diagnosing & Treating (85.7%), and Health Technologists (85.7%).
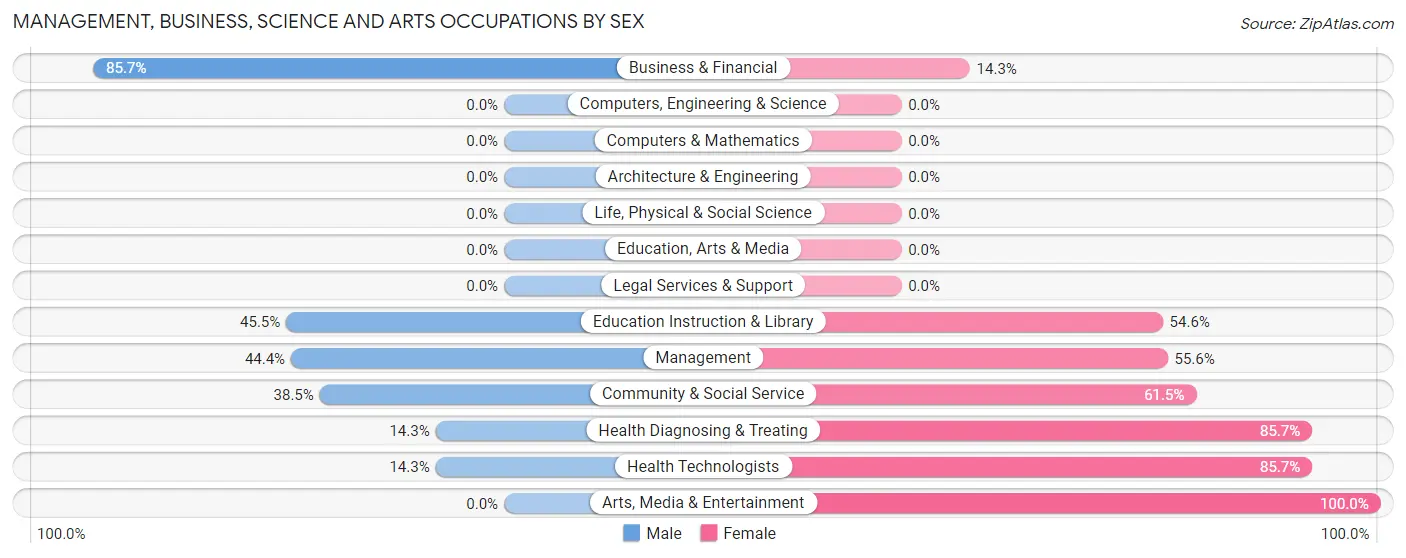
| Occupation | Male | Female |
| Management | 4 (44.4%) | 5 (55.6%) |
| Business & Financial | 6 (85.7%) | 1 (14.3%) |
| Computers, Engineering & Science | 0 (0.0%) | 0 (0.0%) |
| Computers & Mathematics | 0 (0.0%) | 0 (0.0%) |
| Architecture & Engineering | 0 (0.0%) | 0 (0.0%) |
| Life, Physical & Social Science | 0 (0.0%) | 0 (0.0%) |
| Community & Social Service | 5 (38.5%) | 8 (61.5%) |
| Education, Arts & Media | 0 (0.0%) | 0 (0.0%) |
| Legal Services & Support | 0 (0.0%) | 0 (0.0%) |
| Education Instruction & Library | 5 (45.5%) | 6 (54.5%) |
| Arts, Media & Entertainment | 0 (0.0%) | 2 (100.0%) |
| Health Diagnosing & Treating | 1 (14.3%) | 6 (85.7%) |
| Health Technologists | 1 (14.3%) | 6 (85.7%) |
| Total (Category) | 16 (44.4%) | 20 (55.6%) |
| Total (Overall) | 24 (46.2%) | 28 (53.8%) |
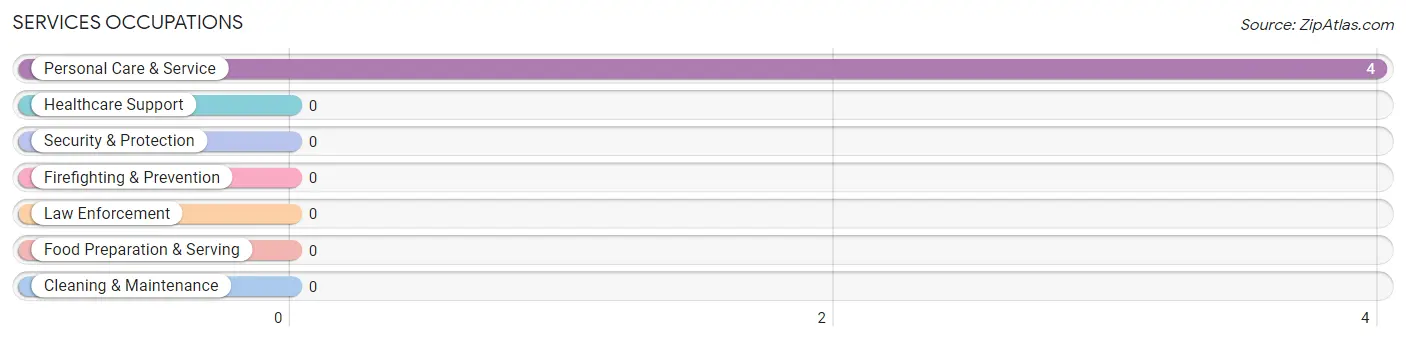
Services Occupations
The most common Services occupations in Woodlawn Heights are , and Personal Care & Service (4 | 7.7%).
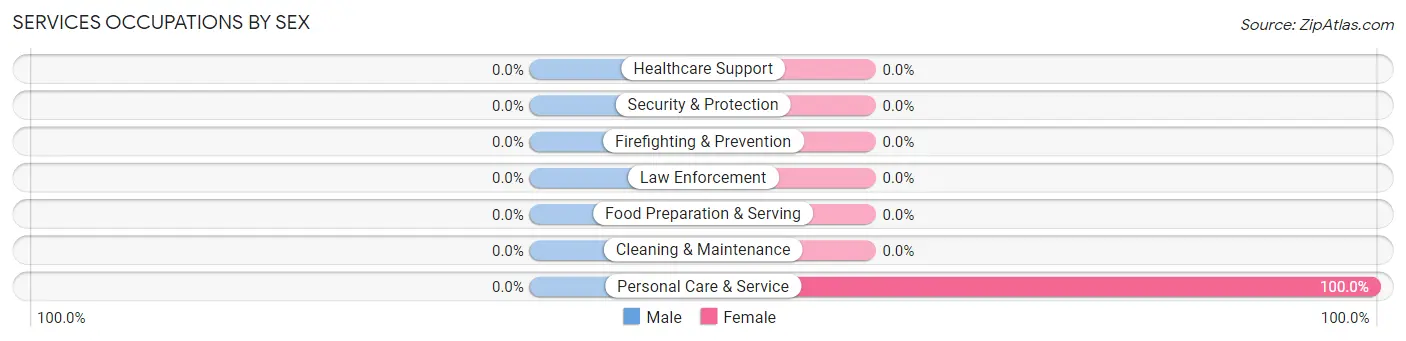
Services Occupations by Sex
| Occupation | Male | Female |
| Healthcare Support | 0 (0.0%) | 0 (0.0%) |
| Security & Protection | 0 (0.0%) | 0 (0.0%) |
| Firefighting & Prevention | 0 (0.0%) | 0 (0.0%) |
| Law Enforcement | 0 (0.0%) | 0 (0.0%) |
| Food Preparation & Serving | 0 (0.0%) | 0 (0.0%) |
| Cleaning & Maintenance | 0 (0.0%) | 0 (0.0%) |
| Personal Care & Service | 0 (0.0%) | 4 (100.0%) |
| Total (Category) | 0 (0.0%) | 4 (100.0%) |
| Total (Overall) | 24 (46.2%) | 28 (53.8%) |
Sales and Office Occupations
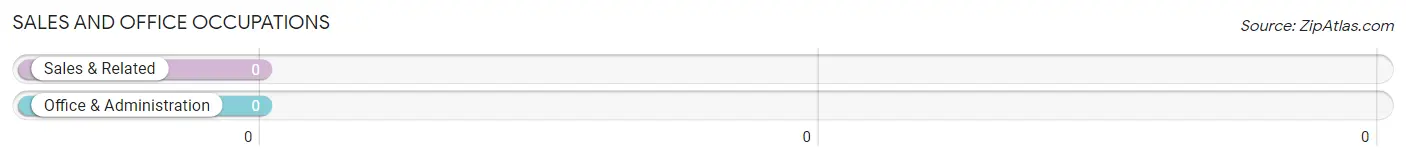
Sales and Office Occupations by Sex
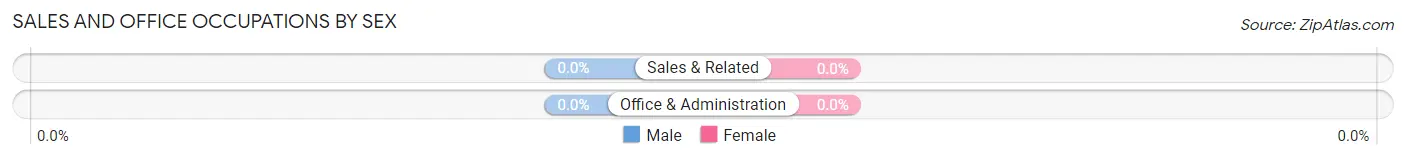
| Occupation | Male | Female |
| Sales & Related | 0 (0.0%) | 0 (0.0%) |
| Office & Administration | 0 (0.0%) | 0 (0.0%) |
| Total (Category) | 0 (0.0%) | 0 (0.0%) |
| Total (Overall) | 24 (46.2%) | 28 (53.8%) |
Natural Resources, Construction and Maintenance Occupations
The most common Natural Resources, Construction and Maintenance occupations in Woodlawn Heights are , and Construction & Extraction (6 | 11.5%).
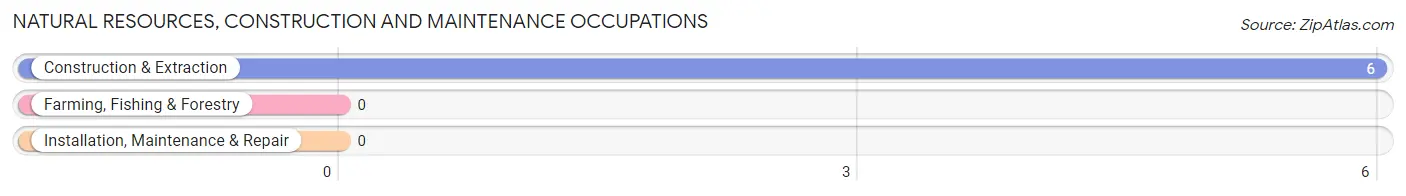
Natural Resources, Construction and Maintenance Occupations by Sex
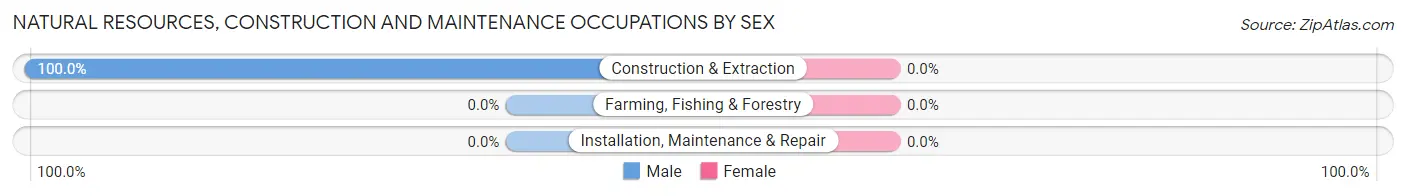
| Occupation | Male | Female |
| Farming, Fishing & Forestry | 0 (0.0%) | 0 (0.0%) |
| Construction & Extraction | 6 (100.0%) | 0 (0.0%) |
| Installation, Maintenance & Repair | 0 (0.0%) | 0 (0.0%) |
| Total (Category) | 6 (100.0%) | 0 (0.0%) |
| Total (Overall) | 24 (46.2%) | 28 (53.8%) |
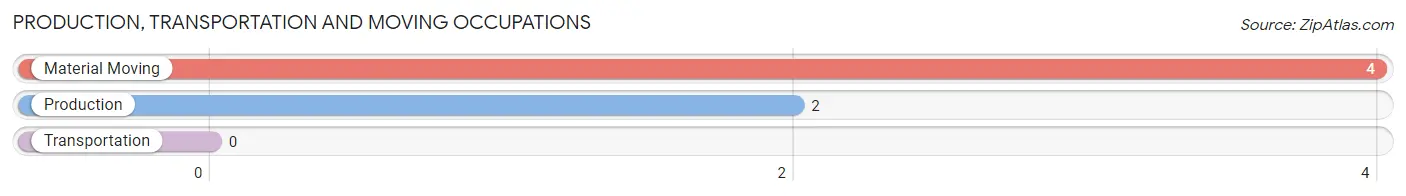
Production, Transportation and Moving Occupations
The most common Production, Transportation and Moving occupations in Woodlawn Heights are Material Moving (4 | 7.7%), and Production (2 | 3.8%).
Production, Transportation and Moving Occupations by Sex
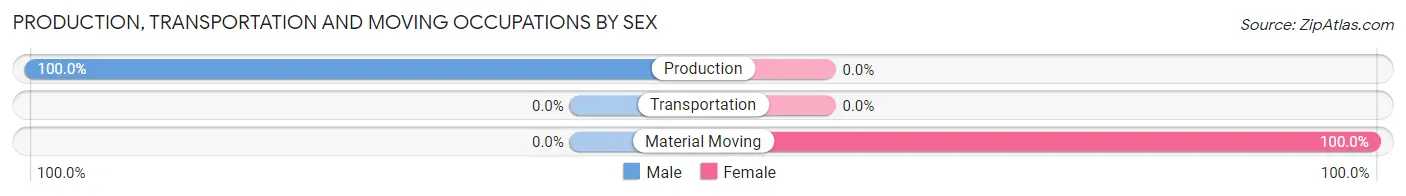
| Occupation | Male | Female |
| Production | 2 (100.0%) | 0 (0.0%) |
| Transportation | 0 (0.0%) | 0 (0.0%) |
| Material Moving | 0 (0.0%) | 4 (100.0%) |
| Total (Category) | 2 (33.3%) | 4 (66.7%) |
| Total (Overall) | 24 (46.2%) | 28 (53.8%) |
Employment Industries by Sex in Woodlawn Heights
Employment Industries in Woodlawn Heights
The major employment industries in Woodlawn Heights include Educational Services (11 | 21.1%), Health Care & Social Assistance (10 | 19.2%), Construction (7 | 13.5%), Manufacturing (6 | 11.5%), and Information (5 | 9.6%).
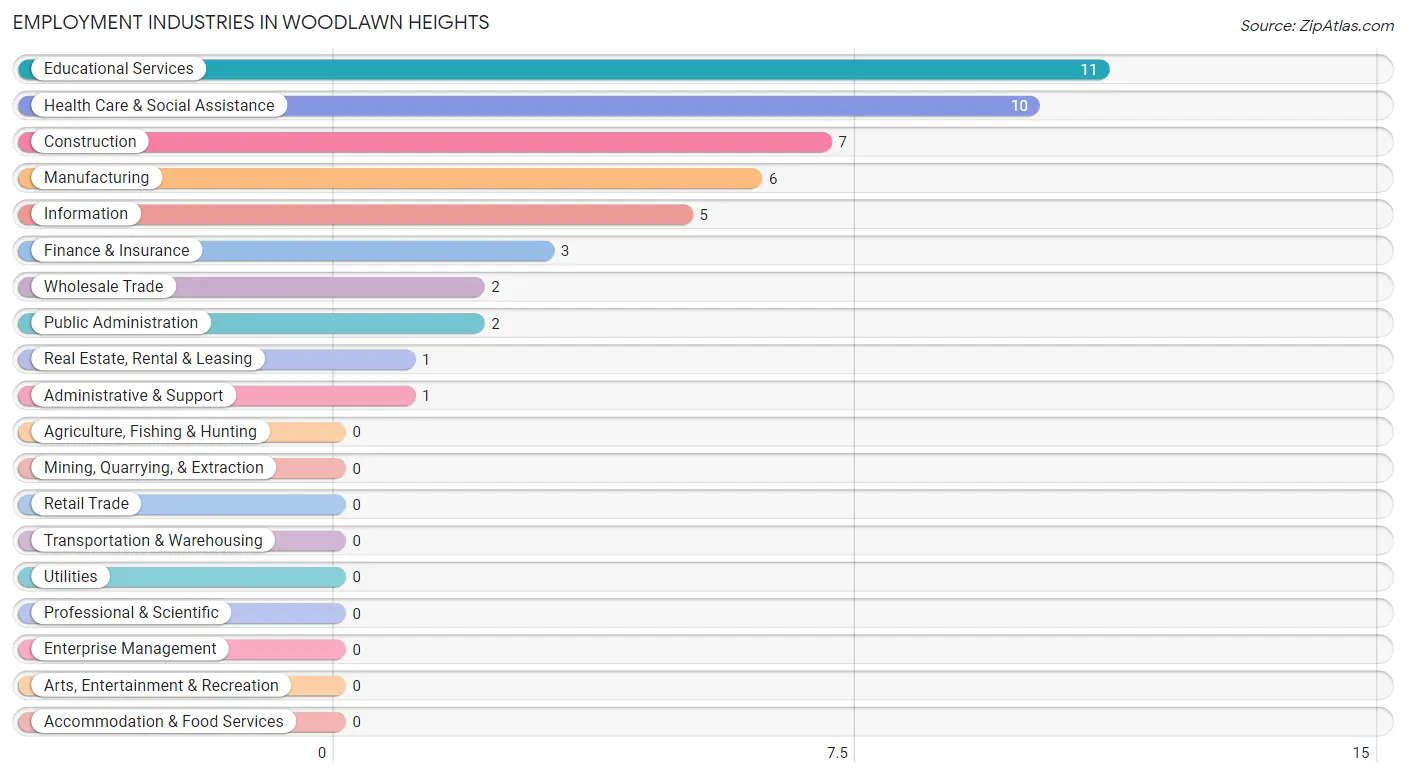
Employment Industries by Sex in Woodlawn Heights
The Woodlawn Heights industries that see more men than women are Construction (100.0%), Wholesale Trade (100.0%), and Finance & Insurance (100.0%), whereas the industries that tend to have a higher number of women are Real Estate, Rental & Leasing (100.0%), Public Administration (100.0%), and Health Care & Social Assistance (90.0%).
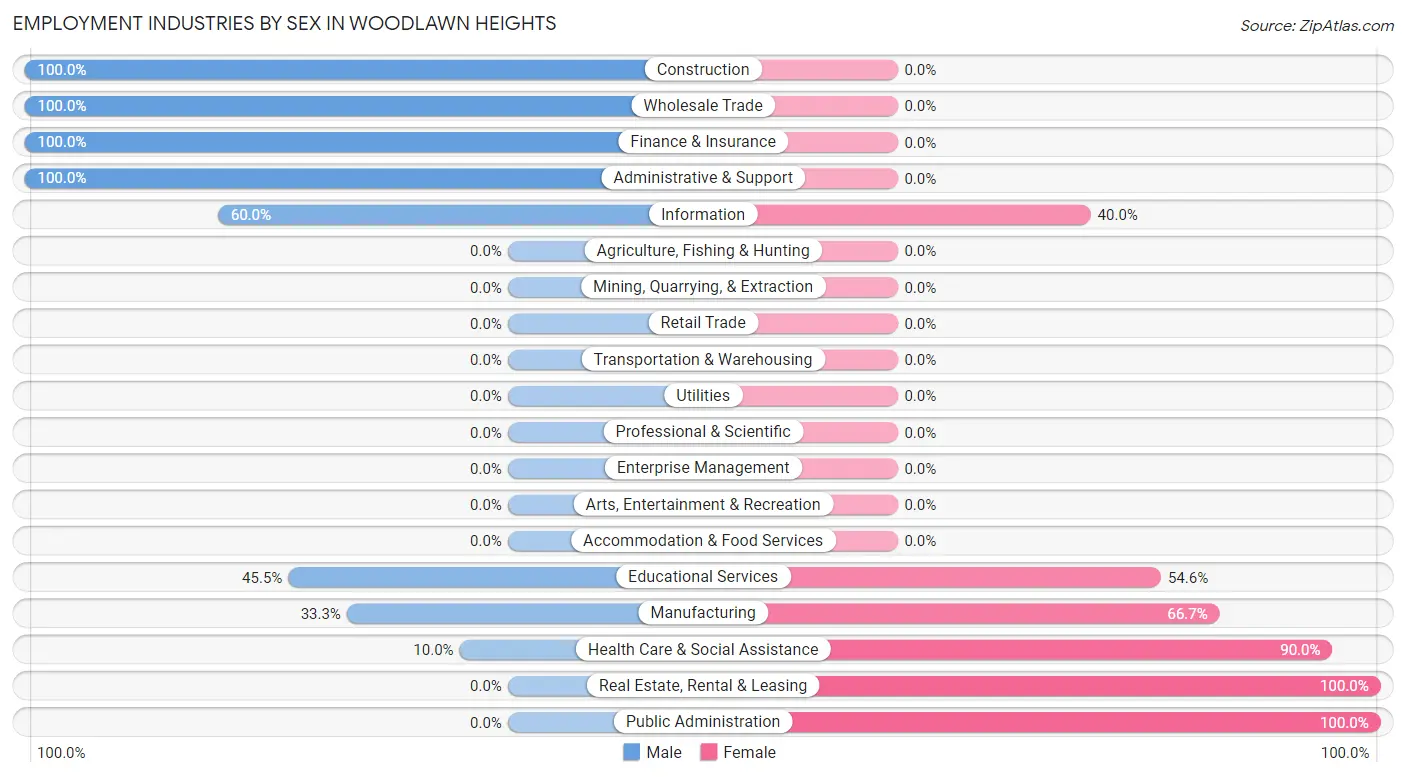
| Industry | Male | Female |
| Agriculture, Fishing & Hunting | 0 (0.0%) | 0 (0.0%) |
| Mining, Quarrying, & Extraction | 0 (0.0%) | 0 (0.0%) |
| Construction | 7 (100.0%) | 0 (0.0%) |
| Manufacturing | 2 (33.3%) | 4 (66.7%) |
| Wholesale Trade | 2 (100.0%) | 0 (0.0%) |
| Retail Trade | 0 (0.0%) | 0 (0.0%) |
| Transportation & Warehousing | 0 (0.0%) | 0 (0.0%) |
| Utilities | 0 (0.0%) | 0 (0.0%) |
| Information | 3 (60.0%) | 2 (40.0%) |
| Finance & Insurance | 3 (100.0%) | 0 (0.0%) |
| Real Estate, Rental & Leasing | 0 (0.0%) | 1 (100.0%) |
| Professional & Scientific | 0 (0.0%) | 0 (0.0%) |
| Enterprise Management | 0 (0.0%) | 0 (0.0%) |
| Administrative & Support | 1 (100.0%) | 0 (0.0%) |
| Educational Services | 5 (45.5%) | 6 (54.5%) |
| Health Care & Social Assistance | 1 (10.0%) | 9 (90.0%) |
| Arts, Entertainment & Recreation | 0 (0.0%) | 0 (0.0%) |
| Accommodation & Food Services | 0 (0.0%) | 0 (0.0%) |
| Public Administration | 0 (0.0%) | 2 (100.0%) |
| Total | 24 (46.2%) | 28 (53.8%) |
Education in Woodlawn Heights
School Enrollment in Woodlawn Heights
The most common levels of schooling among the 36 students in Woodlawn Heights are middle school (15 | 41.7%), elementary school (9 | 25.0%), and nursery / preschool (5 | 13.9%).
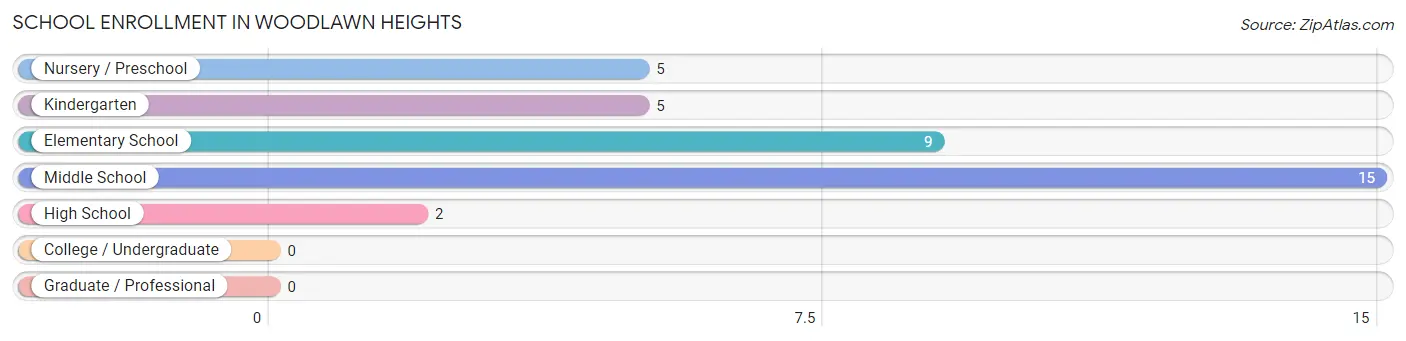
| School Level | # Students | % Students |
| Nursery / Preschool | 5 | 13.9% |
| Kindergarten | 5 | 13.9% |
| Elementary School | 9 | 25.0% |
| Middle School | 15 | 41.7% |
| High School | 2 | 5.6% |
| College / Undergraduate | 0 | 0.0% |
| Graduate / Professional | 0 | 0.0% |
| Total | 36 | 100.0% |
School Enrollment by Age by Funding Source in Woodlawn Heights
Out of a total of 36 students who are enrolled in schools in Woodlawn Heights, 15 (41.7%) attend a private institution, while the remaining 21 (58.3%) are enrolled in public schools. The age group of 15 to 17 year olds has the highest likelihood of being enrolled in private schools, with 2 (100.0% in the age bracket) enrolled. Conversely, the age group of 10 to 14 year olds has the lowest likelihood of being enrolled in a private school, with 14 (93.3% in the age bracket) attending a public institution.
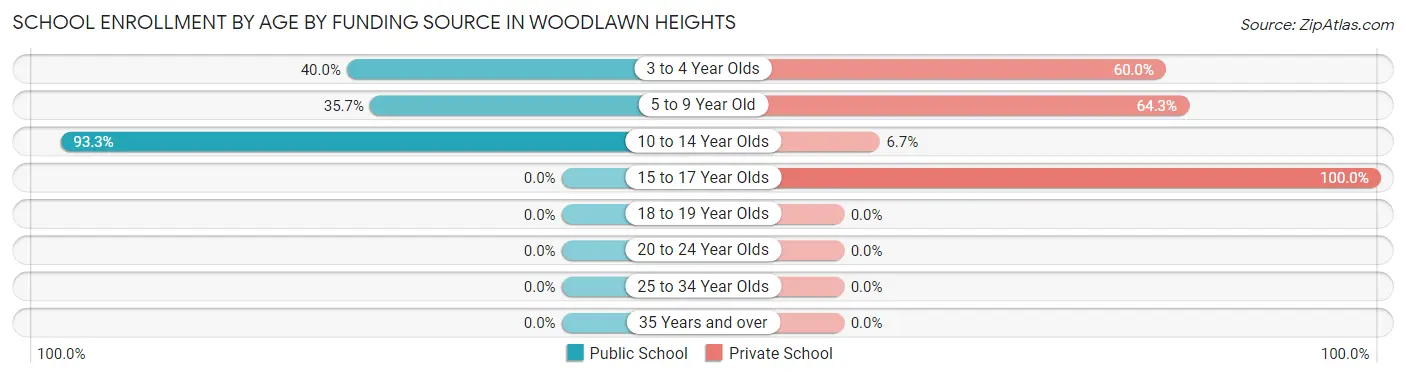
| Age Bracket | Public School | Private School |
| 3 to 4 Year Olds | 2 (40.0%) | 3 (60.0%) |
| 5 to 9 Year Old | 5 (35.7%) | 9 (64.3%) |
| 10 to 14 Year Olds | 14 (93.3%) | 1 (6.7%) |
| 15 to 17 Year Olds | 0 (0.0%) | 2 (100.0%) |
| 18 to 19 Year Olds | 0 (0.0%) | 0 (0.0%) |
| 20 to 24 Year Olds | 0 (0.0%) | 0 (0.0%) |
| 25 to 34 Year Olds | 0 (0.0%) | 0 (0.0%) |
| 35 Years and over | 0 (0.0%) | 0 (0.0%) |
| Total | 21 (58.3%) | 15 (41.7%) |
Educational Attainment by Field of Study in Woodlawn Heights
Business (11 | 25.6%), liberal arts & history (6 | 14.0%), computers & mathematics (5 | 11.6%), visual & performing arts (5 | 11.6%), and science & technology (4 | 9.3%) are the most common fields of study among 43 individuals in Woodlawn Heights who have obtained a bachelor's degree or higher.
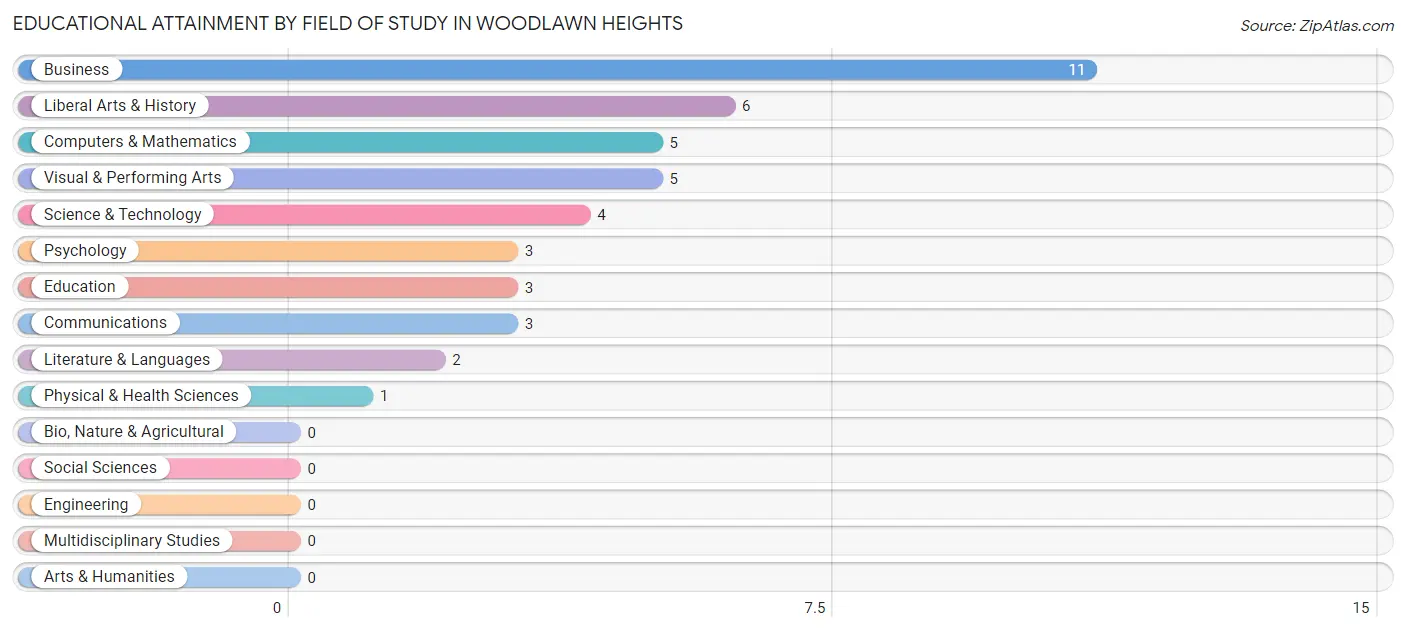
| Field of Study | # Graduates | % Graduates |
| Computers & Mathematics | 5 | 11.6% |
| Bio, Nature & Agricultural | 0 | 0.0% |
| Physical & Health Sciences | 1 | 2.3% |
| Psychology | 3 | 7.0% |
| Social Sciences | 0 | 0.0% |
| Engineering | 0 | 0.0% |
| Multidisciplinary Studies | 0 | 0.0% |
| Science & Technology | 4 | 9.3% |
| Business | 11 | 25.6% |
| Education | 3 | 7.0% |
| Literature & Languages | 2 | 4.6% |
| Liberal Arts & History | 6 | 14.0% |
| Visual & Performing Arts | 5 | 11.6% |
| Communications | 3 | 7.0% |
| Arts & Humanities | 0 | 0.0% |
| Total | 43 | 100.0% |
Transportation & Commute in Woodlawn Heights
Vehicle Availability by Sex in Woodlawn Heights
The most prevalent vehicle ownership categories in Woodlawn Heights are males with 2 vehicles (20, accounting for 83.3%) and females with 2 vehicles (14, making up 83.3%).
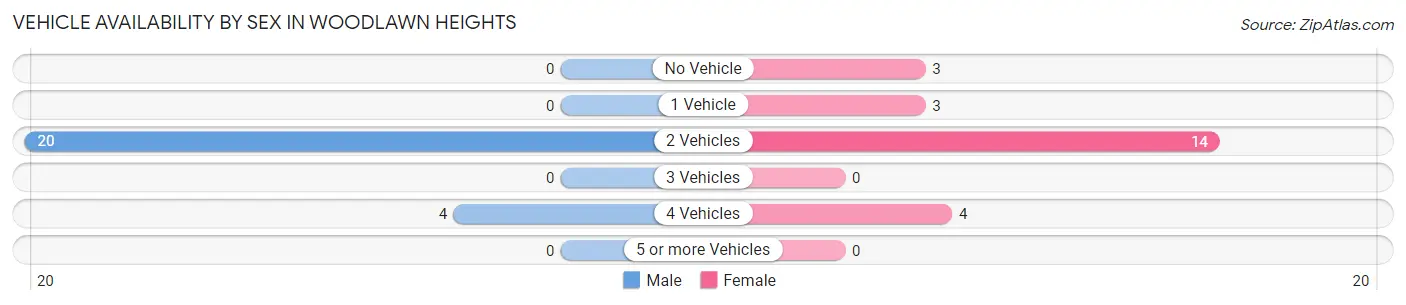
| Vehicles Available | Male | Female |
| No Vehicle | 0 (0.0%) | 3 (12.5%) |
| 1 Vehicle | 0 (0.0%) | 3 (12.5%) |
| 2 Vehicles | 20 (83.3%) | 14 (58.3%) |
| 3 Vehicles | 0 (0.0%) | 0 (0.0%) |
| 4 Vehicles | 4 (16.7%) | 4 (16.7%) |
| 5 or more Vehicles | 0 (0.0%) | 0 (0.0%) |
| Total | 24 (100.0%) | 24 (100.0%) |
Commute Time in Woodlawn Heights
The most frequently occuring commute durations in Woodlawn Heights are 10 to 14 minutes (8 commuters, 21.6%), 5 to 9 minutes (7 commuters, 18.9%), and 40 to 44 minutes (7 commuters, 18.9%).
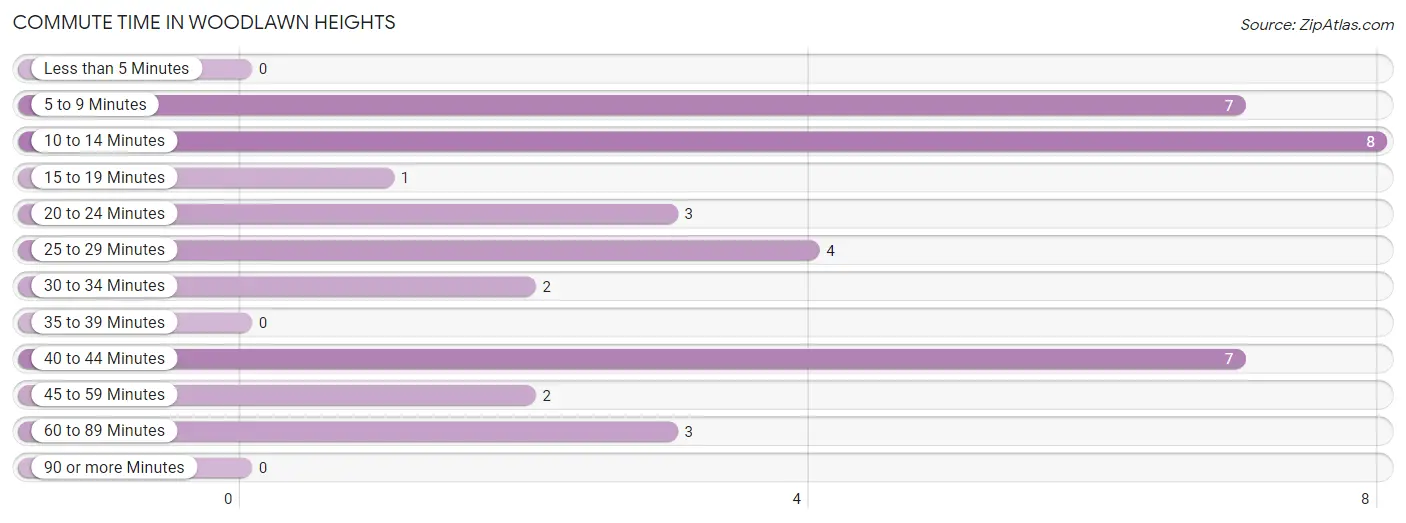
| Commute Time | # Commuters | % Commuters |
| Less than 5 Minutes | 0 | 0.0% |
| 5 to 9 Minutes | 7 | 18.9% |
| 10 to 14 Minutes | 8 | 21.6% |
| 15 to 19 Minutes | 1 | 2.7% |
| 20 to 24 Minutes | 3 | 8.1% |
| 25 to 29 Minutes | 4 | 10.8% |
| 30 to 34 Minutes | 2 | 5.4% |
| 35 to 39 Minutes | 0 | 0.0% |
| 40 to 44 Minutes | 7 | 18.9% |
| 45 to 59 Minutes | 2 | 5.4% |
| 60 to 89 Minutes | 3 | 8.1% |
| 90 or more Minutes | 0 | 0.0% |
Commute Time by Sex in Woodlawn Heights
The most common commute times in Woodlawn Heights are 5 to 9 minutes (5 commuters, 31.2%) for males and 40 to 44 minutes (7 commuters, 33.3%) for females.
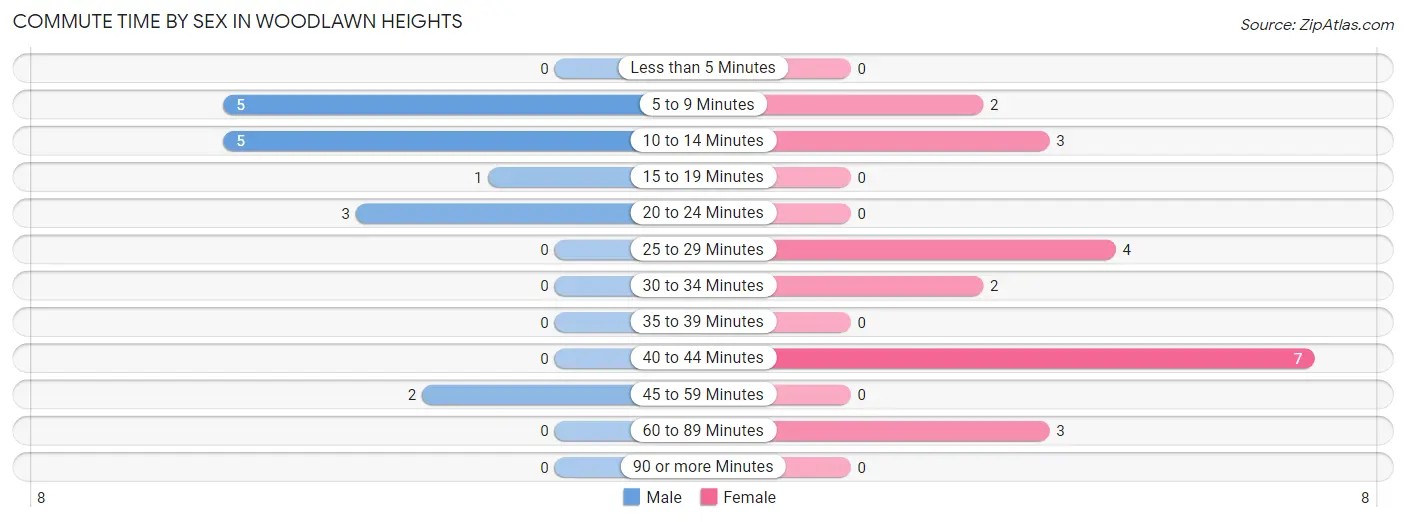
| Commute Time | Male | Female |
| Less than 5 Minutes | 0 (0.0%) | 0 (0.0%) |
| 5 to 9 Minutes | 5 (31.2%) | 2 (9.5%) |
| 10 to 14 Minutes | 5 (31.2%) | 3 (14.3%) |
| 15 to 19 Minutes | 1 (6.2%) | 0 (0.0%) |
| 20 to 24 Minutes | 3 (18.8%) | 0 (0.0%) |
| 25 to 29 Minutes | 0 (0.0%) | 4 (19.1%) |
| 30 to 34 Minutes | 0 (0.0%) | 2 (9.5%) |
| 35 to 39 Minutes | 0 (0.0%) | 0 (0.0%) |
| 40 to 44 Minutes | 0 (0.0%) | 7 (33.3%) |
| 45 to 59 Minutes | 2 (12.5%) | 0 (0.0%) |
| 60 to 89 Minutes | 0 (0.0%) | 3 (14.3%) |
| 90 or more Minutes | 0 (0.0%) | 0 (0.0%) |
Time of Departure to Work by Sex in Woodlawn Heights
The most frequent times of departure to work in Woodlawn Heights are 7:30 AM to 7:59 AM (6, 37.5%) for males and 6:00 AM to 6:29 AM (8, 38.1%) for females.
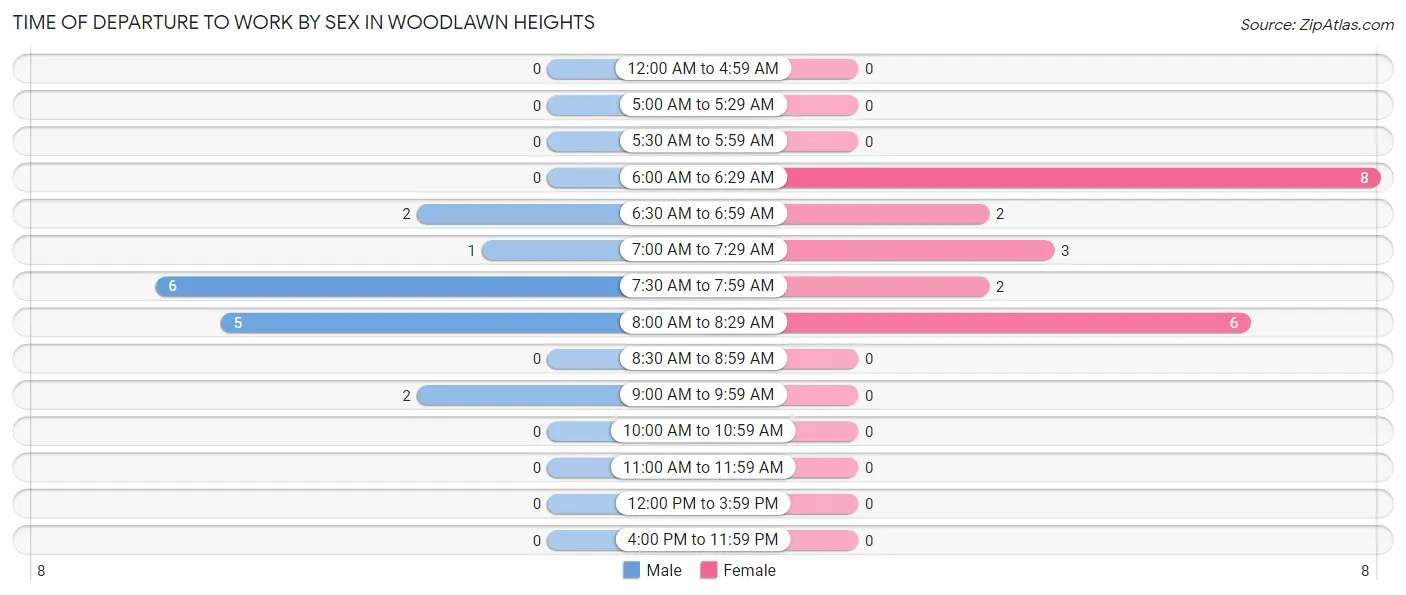
| Time of Departure | Male | Female |
| 12:00 AM to 4:59 AM | 0 (0.0%) | 0 (0.0%) |
| 5:00 AM to 5:29 AM | 0 (0.0%) | 0 (0.0%) |
| 5:30 AM to 5:59 AM | 0 (0.0%) | 0 (0.0%) |
| 6:00 AM to 6:29 AM | 0 (0.0%) | 8 (38.1%) |
| 6:30 AM to 6:59 AM | 2 (12.5%) | 2 (9.5%) |
| 7:00 AM to 7:29 AM | 1 (6.2%) | 3 (14.3%) |
| 7:30 AM to 7:59 AM | 6 (37.5%) | 2 (9.5%) |
| 8:00 AM to 8:29 AM | 5 (31.2%) | 6 (28.6%) |
| 8:30 AM to 8:59 AM | 0 (0.0%) | 0 (0.0%) |
| 9:00 AM to 9:59 AM | 2 (12.5%) | 0 (0.0%) |
| 10:00 AM to 10:59 AM | 0 (0.0%) | 0 (0.0%) |
| 11:00 AM to 11:59 AM | 0 (0.0%) | 0 (0.0%) |
| 12:00 PM to 3:59 PM | 0 (0.0%) | 0 (0.0%) |
| 4:00 PM to 11:59 PM | 0 (0.0%) | 0 (0.0%) |
| Total | 16 (100.0%) | 21 (100.0%) |
Housing Occupancy in Woodlawn Heights
Occupancy by Ownership in Woodlawn Heights
Of the total 38 dwellings in Woodlawn Heights, owner-occupied units account for 35 (92.1%), while renter-occupied units make up 3 (7.9%).
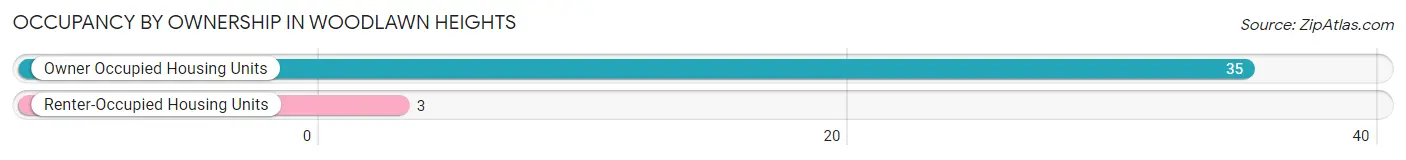
| Occupancy | # Housing Units | % Housing Units |
| Owner Occupied Housing Units | 35 | 92.1% |
| Renter-Occupied Housing Units | 3 | 7.9% |
| Total Occupied Housing Units | 38 | 100.0% |
Occupancy by Household Size in Woodlawn Heights
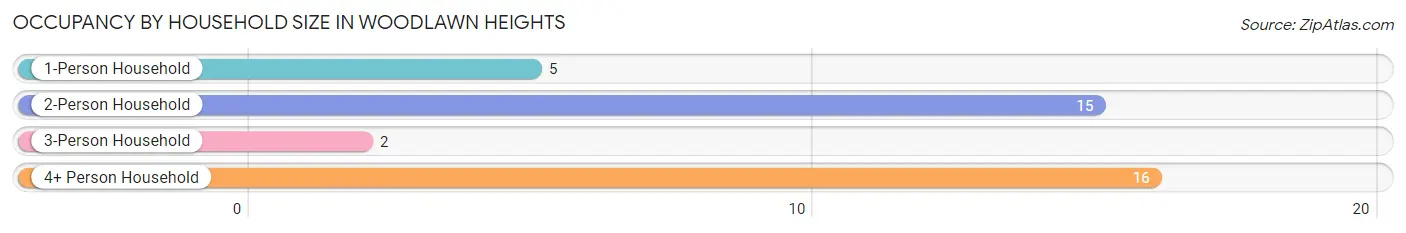
| Household Size | # Housing Units | % Housing Units |
| 1-Person Household | 5 | 13.2% |
| 2-Person Household | 15 | 39.5% |
| 3-Person Household | 2 | 5.3% |
| 4+ Person Household | 16 | 42.1% |
| Total Housing Units | 38 | 100.0% |
Occupancy by Ownership by Household Size in Woodlawn Heights
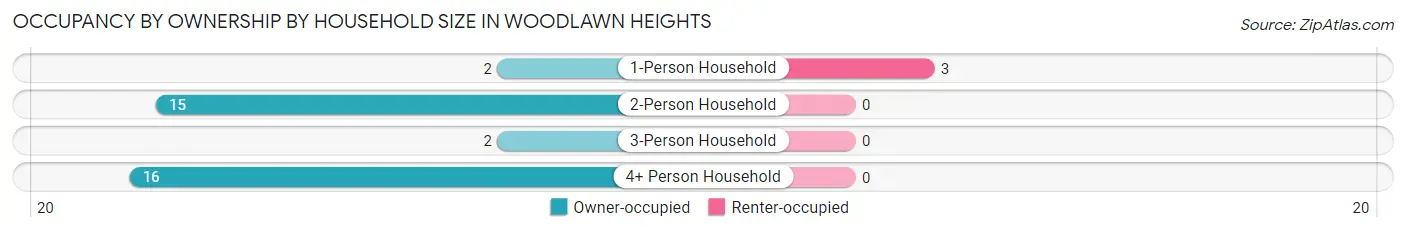
| Household Size | Owner-occupied | Renter-occupied |
| 1-Person Household | 2 (40.0%) | 3 (60.0%) |
| 2-Person Household | 15 (100.0%) | 0 (0.0%) |
| 3-Person Household | 2 (100.0%) | 0 (0.0%) |
| 4+ Person Household | 16 (100.0%) | 0 (0.0%) |
| Total Housing Units | 35 (92.1%) | 3 (7.9%) |
Occupancy by Educational Attainment in Woodlawn Heights
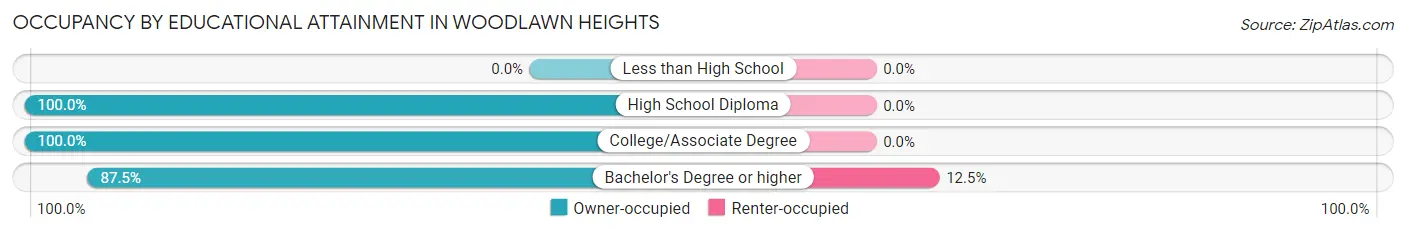
| Household Size | Owner-occupied | Renter-occupied |
| Less than High School | 0 (0.0%) | 0 (0.0%) |
| High School Diploma | 6 (100.0%) | 0 (0.0%) |
| College/Associate Degree | 8 (100.0%) | 0 (0.0%) |
| Bachelor's Degree or higher | 21 (87.5%) | 3 (12.5%) |
Occupancy by Age of Householder in Woodlawn Heights
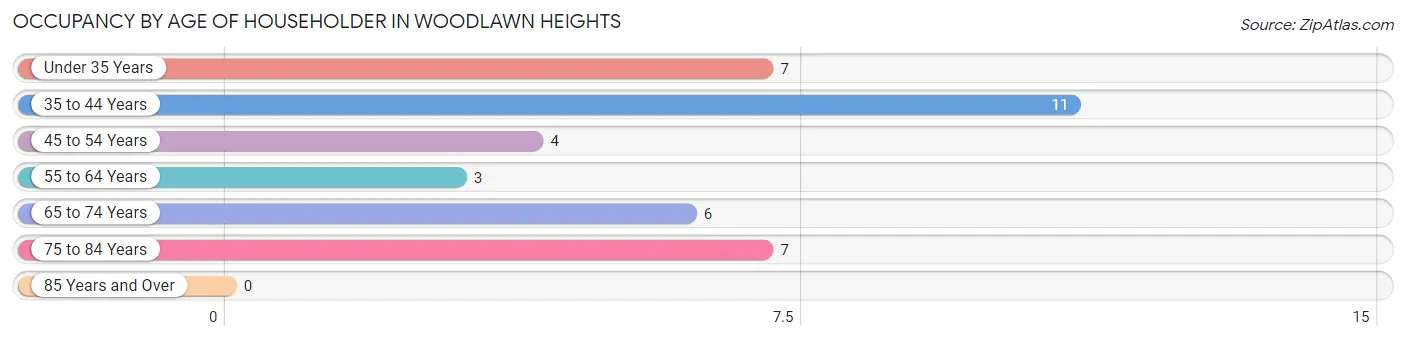
| Age Bracket | # Households | % Households |
| Under 35 Years | 7 | 18.4% |
| 35 to 44 Years | 11 | 28.9% |
| 45 to 54 Years | 4 | 10.5% |
| 55 to 64 Years | 3 | 7.9% |
| 65 to 74 Years | 6 | 15.8% |
| 75 to 84 Years | 7 | 18.4% |
| 85 Years and Over | 0 | 0.0% |
| Total | 38 | 100.0% |
Housing Finances in Woodlawn Heights
Median Income by Occupancy in Woodlawn Heights
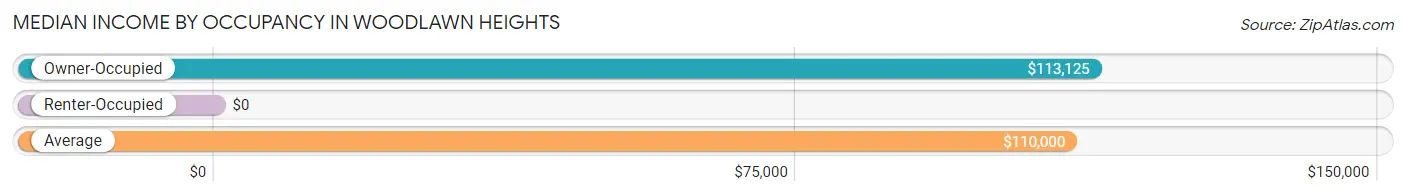
| Occupancy Type | # Households | Median Income |
| Owner-Occupied | 35 (92.1%) | $113,125 |
| Renter-Occupied | 3 (7.9%) | $0 |
| Average | 38 (100.0%) | $110,000 |
Occupancy by Householder Income Bracket in Woodlawn Heights
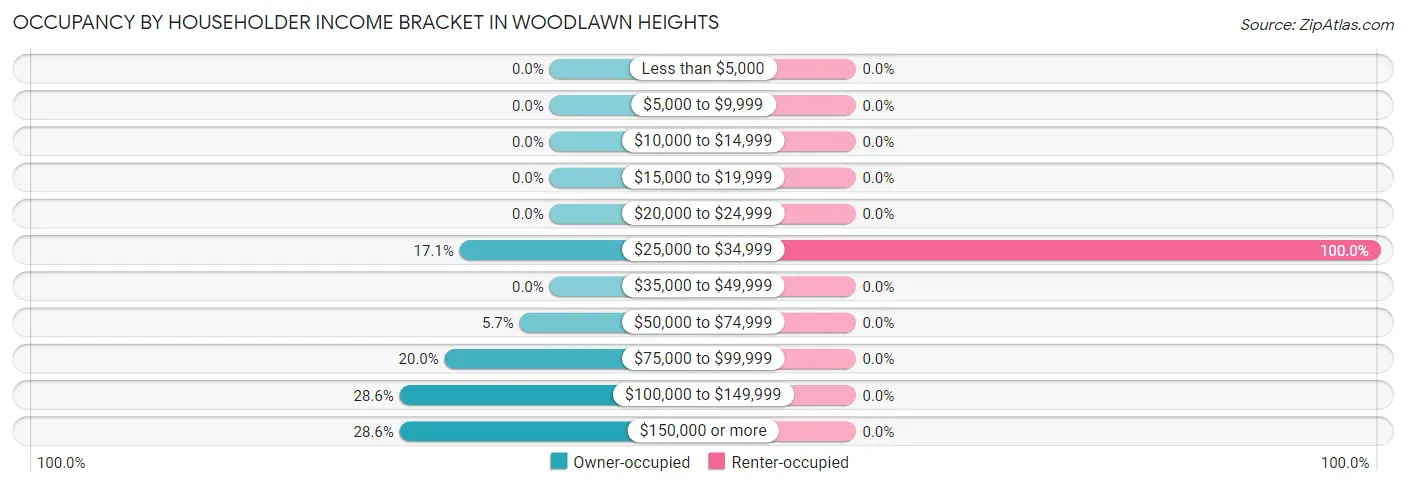
| Income Bracket | Owner-occupied | Renter-occupied |
| Less than $5,000 | 0 (0.0%) | 0 (0.0%) |
| $5,000 to $9,999 | 0 (0.0%) | 0 (0.0%) |
| $10,000 to $14,999 | 0 (0.0%) | 0 (0.0%) |
| $15,000 to $19,999 | 0 (0.0%) | 0 (0.0%) |
| $20,000 to $24,999 | 0 (0.0%) | 0 (0.0%) |
| $25,000 to $34,999 | 6 (17.1%) | 3 (100.0%) |
| $35,000 to $49,999 | 0 (0.0%) | 0 (0.0%) |
| $50,000 to $74,999 | 2 (5.7%) | 0 (0.0%) |
| $75,000 to $99,999 | 7 (20.0%) | 0 (0.0%) |
| $100,000 to $149,999 | 10 (28.6%) | 0 (0.0%) |
| $150,000 or more | 10 (28.6%) | 0 (0.0%) |
| Total | 35 (100.0%) | 3 (100.0%) |
Monthly Housing Cost Tiers in Woodlawn Heights
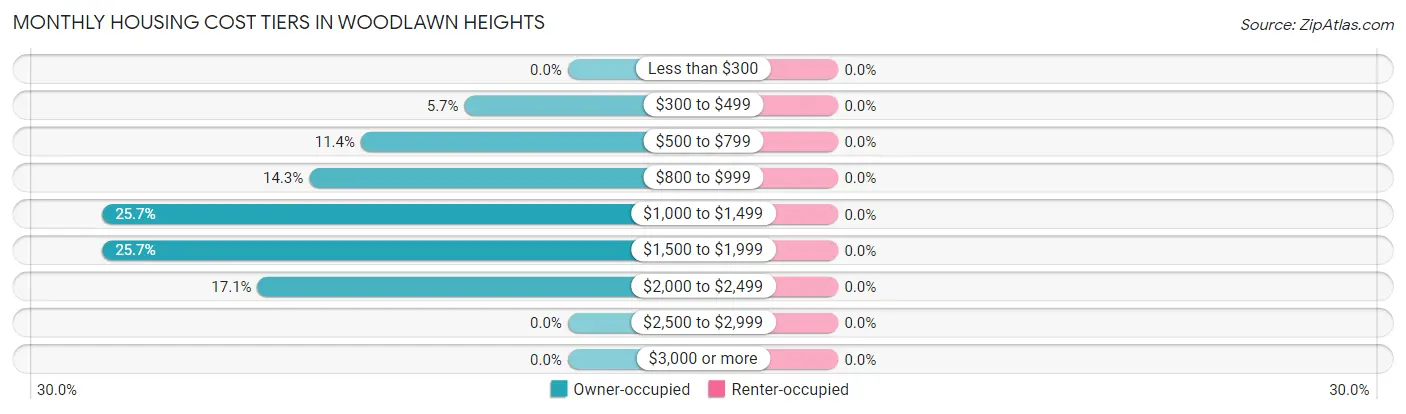
| Monthly Cost | Owner-occupied | Renter-occupied |
| Less than $300 | 0 (0.0%) | 0 (0.0%) |
| $300 to $499 | 2 (5.7%) | 0 (0.0%) |
| $500 to $799 | 4 (11.4%) | 0 (0.0%) |
| $800 to $999 | 5 (14.3%) | 0 (0.0%) |
| $1,000 to $1,499 | 9 (25.7%) | 0 (0.0%) |
| $1,500 to $1,999 | 9 (25.7%) | 0 (0.0%) |
| $2,000 to $2,499 | 6 (17.1%) | 0 (0.0%) |
| $2,500 to $2,999 | 0 (0.0%) | 0 (0.0%) |
| $3,000 or more | 0 (0.0%) | 0 (0.0%) |
| Total | 35 (100.0%) | 3 (100.0%) |
Physical Housing Characteristics in Woodlawn Heights
Housing Structures in Woodlawn Heights
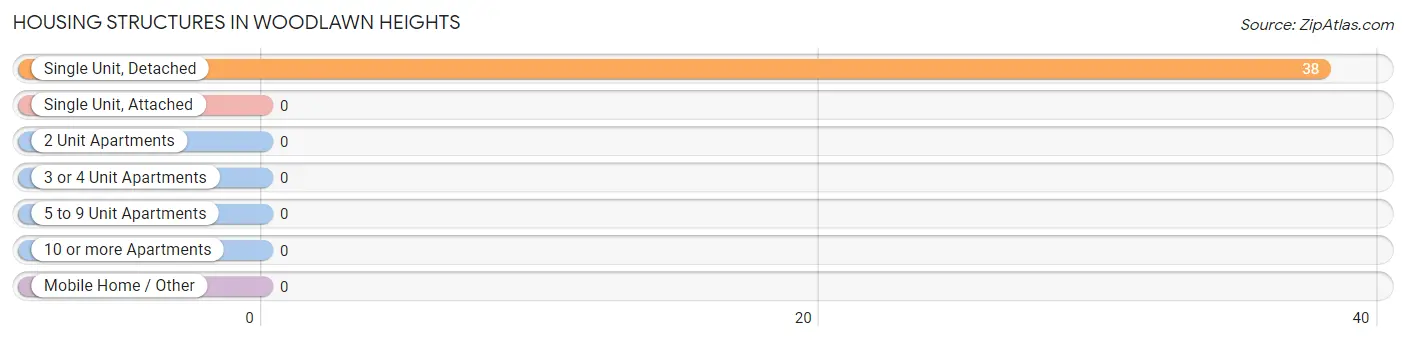
| Structure Type | # Housing Units | % Housing Units |
| Single Unit, Detached | 38 | 100.0% |
| Single Unit, Attached | 0 | 0.0% |
| 2 Unit Apartments | 0 | 0.0% |
| 3 or 4 Unit Apartments | 0 | 0.0% |
| 5 to 9 Unit Apartments | 0 | 0.0% |
| 10 or more Apartments | 0 | 0.0% |
| Mobile Home / Other | 0 | 0.0% |
| Total | 38 | 100.0% |
Housing Structures by Occupancy in Woodlawn Heights
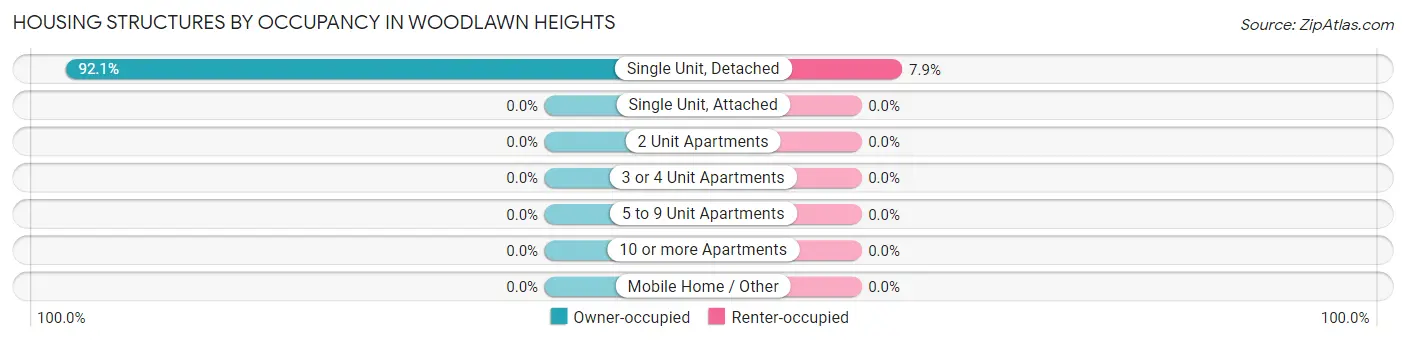
| Structure Type | Owner-occupied | Renter-occupied |
| Single Unit, Detached | 35 (92.1%) | 3 (7.9%) |
| Single Unit, Attached | 0 (0.0%) | 0 (0.0%) |
| 2 Unit Apartments | 0 (0.0%) | 0 (0.0%) |
| 3 or 4 Unit Apartments | 0 (0.0%) | 0 (0.0%) |
| 5 to 9 Unit Apartments | 0 (0.0%) | 0 (0.0%) |
| 10 or more Apartments | 0 (0.0%) | 0 (0.0%) |
| Mobile Home / Other | 0 (0.0%) | 0 (0.0%) |
| Total | 35 (92.1%) | 3 (7.9%) |
Housing Structures by Number of Rooms in Woodlawn Heights
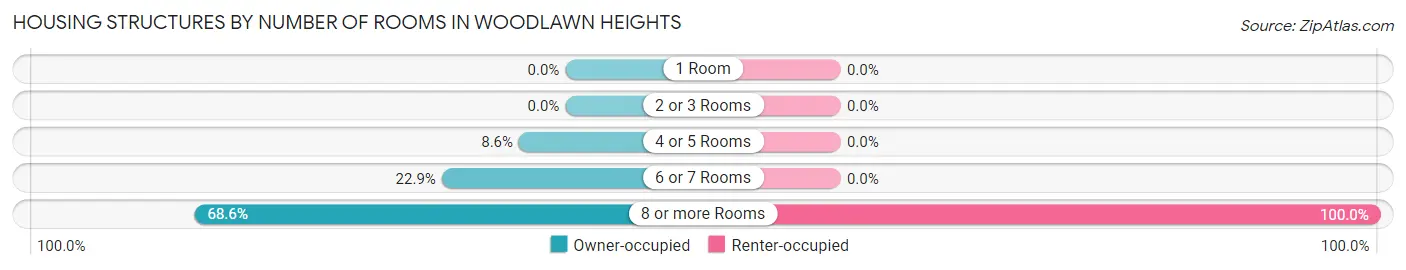
| Number of Rooms | Owner-occupied | Renter-occupied |
| 1 Room | 0 (0.0%) | 0 (0.0%) |
| 2 or 3 Rooms | 0 (0.0%) | 0 (0.0%) |
| 4 or 5 Rooms | 3 (8.6%) | 0 (0.0%) |
| 6 or 7 Rooms | 8 (22.9%) | 0 (0.0%) |
| 8 or more Rooms | 24 (68.6%) | 3 (100.0%) |
| Total | 35 (100.0%) | 3 (100.0%) |
Housing Structure by Heating Type in Woodlawn Heights
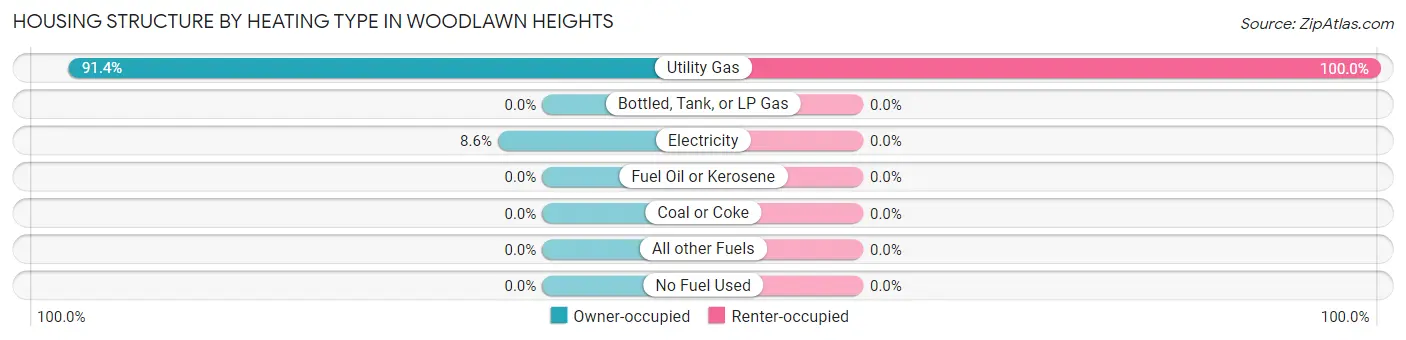
| Heating Type | Owner-occupied | Renter-occupied |
| Utility Gas | 32 (91.4%) | 3 (100.0%) |
| Bottled, Tank, or LP Gas | 0 (0.0%) | 0 (0.0%) |
| Electricity | 3 (8.6%) | 0 (0.0%) |
| Fuel Oil or Kerosene | 0 (0.0%) | 0 (0.0%) |
| Coal or Coke | 0 (0.0%) | 0 (0.0%) |
| All other Fuels | 0 (0.0%) | 0 (0.0%) |
| No Fuel Used | 0 (0.0%) | 0 (0.0%) |
| Total | 35 (100.0%) | 3 (100.0%) |
Household Vehicle Usage in Woodlawn Heights
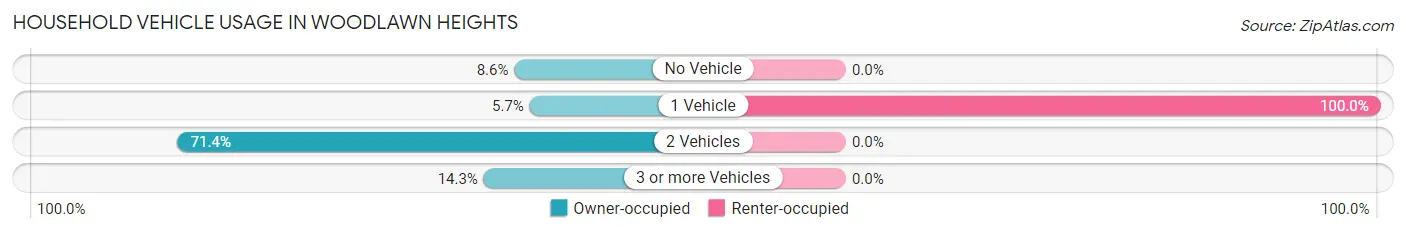
| Vehicles per Household | Owner-occupied | Renter-occupied |
| No Vehicle | 3 (8.6%) | 0 (0.0%) |
| 1 Vehicle | 2 (5.7%) | 3 (100.0%) |
| 2 Vehicles | 25 (71.4%) | 0 (0.0%) |
| 3 or more Vehicles | 5 (14.3%) | 0 (0.0%) |
| Total | 35 (100.0%) | 3 (100.0%) |
Real Estate & Mortgages in Woodlawn Heights
Real Estate and Mortgage Overview in Woodlawn Heights
| Characteristic | Without Mortgage | With Mortgage |
| Housing Units | 11 | 24 |
| Median Property Value | $277,500 | $270,000 |
| Median Household Income | - | - |
| Monthly Housing Costs | $775 | $0 |
| Real Estate Taxes | $3,500 | $0 |
Property Value by Mortgage Status in Woodlawn Heights
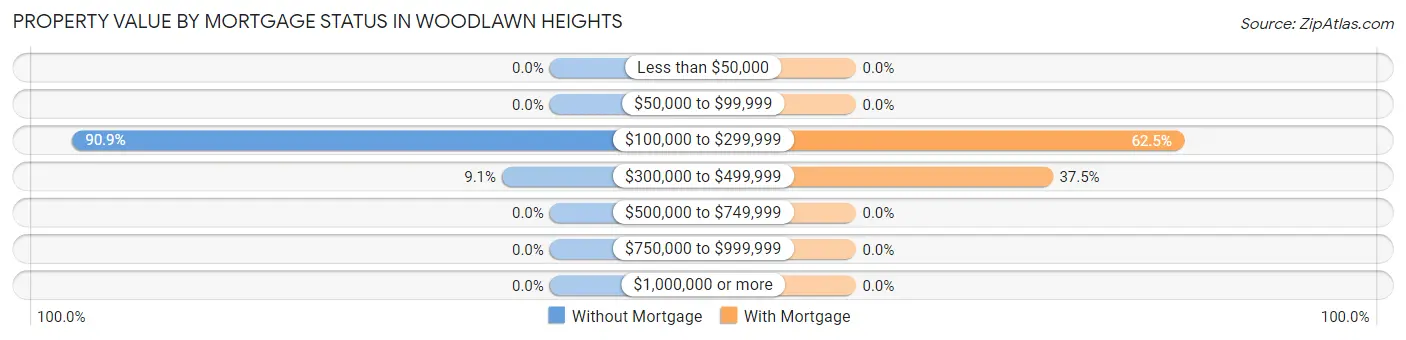
| Property Value | Without Mortgage | With Mortgage |
| Less than $50,000 | 0 (0.0%) | 0 (0.0%) |
| $50,000 to $99,999 | 0 (0.0%) | 0 (0.0%) |
| $100,000 to $299,999 | 10 (90.9%) | 15 (62.5%) |
| $300,000 to $499,999 | 1 (9.1%) | 9 (37.5%) |
| $500,000 to $749,999 | 0 (0.0%) | 0 (0.0%) |
| $750,000 to $999,999 | 0 (0.0%) | 0 (0.0%) |
| $1,000,000 or more | 0 (0.0%) | 0 (0.0%) |
| Total | 11 (100.0%) | 24 (100.0%) |
Household Income by Mortgage Status in Woodlawn Heights
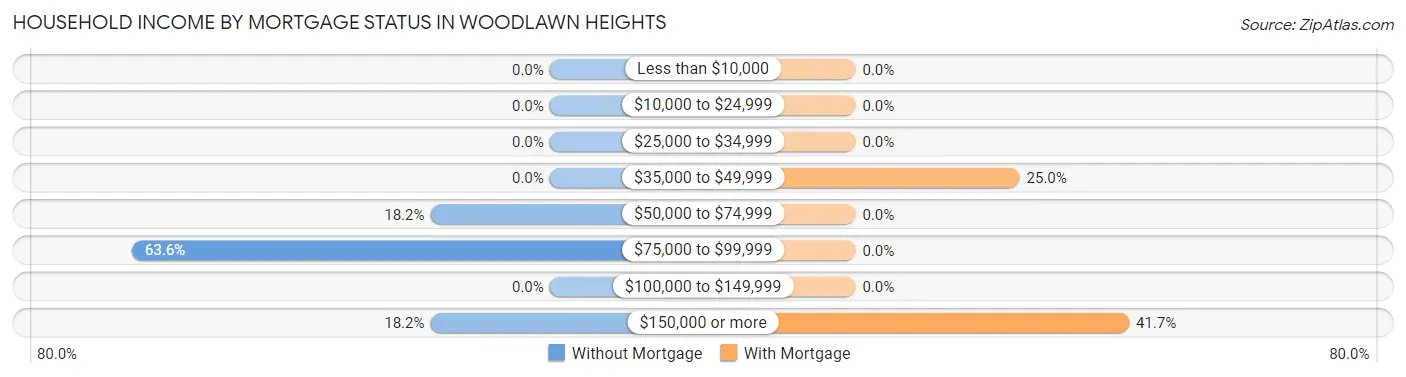
| Household Income | Without Mortgage | With Mortgage |
| Less than $10,000 | 0 (0.0%) | 0 (0.0%) |
| $10,000 to $24,999 | 0 (0.0%) | 0 (0.0%) |
| $25,000 to $34,999 | 0 (0.0%) | 0 (0.0%) |
| $35,000 to $49,999 | 0 (0.0%) | 6 (25.0%) |
| $50,000 to $74,999 | 2 (18.2%) | 0 (0.0%) |
| $75,000 to $99,999 | 7 (63.6%) | 0 (0.0%) |
| $100,000 to $149,999 | 0 (0.0%) | 0 (0.0%) |
| $150,000 or more | 2 (18.2%) | 10 (41.7%) |
| Total | 11 (100.0%) | 24 (100.0%) |
Property Value to Household Income Ratio in Woodlawn Heights
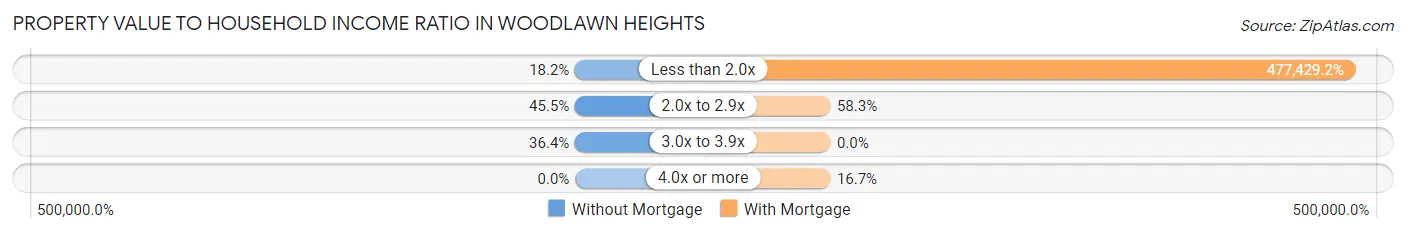
| Value-to-Income Ratio | Without Mortgage | With Mortgage |
| Less than 2.0x | 2 (18.2%) | 114,583 (477,429.2%) |
| 2.0x to 2.9x | 5 (45.5%) | 14 (58.3%) |
| 3.0x to 3.9x | 4 (36.4%) | 0 (0.0%) |
| 4.0x or more | 0 (0.0%) | 4 (16.7%) |
| Total | 11 (100.0%) | 24 (100.0%) |
Real Estate Taxes by Mortgage Status in Woodlawn Heights
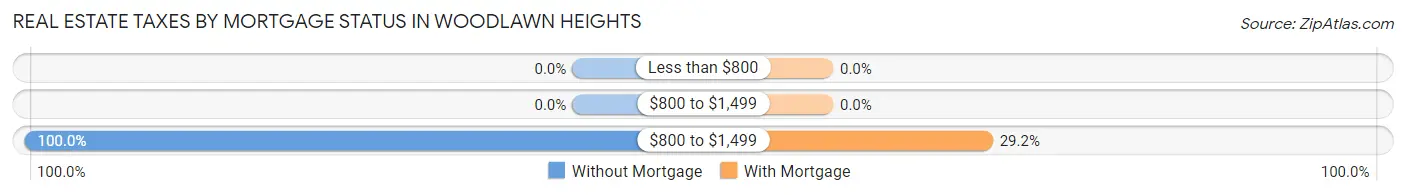
| Property Taxes | Without Mortgage | With Mortgage |
| Less than $800 | 0 (0.0%) | 0 (0.0%) |
| $800 to $1,499 | 0 (0.0%) | 0 (0.0%) |
| $800 to $1,499 | 11 (100.0%) | 7 (29.2%) |
| Total | 11 (100.0%) | 24 (100.0%) |
Health & Disability in Woodlawn Heights
Health Insurance Coverage by Age in Woodlawn Heights
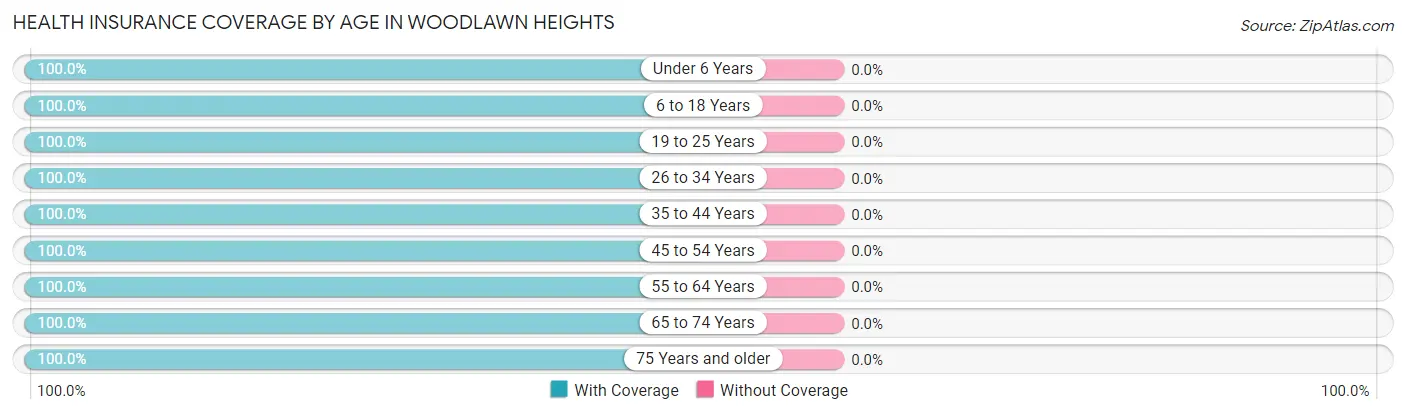
| Age Bracket | With Coverage | Without Coverage |
| Under 6 Years | 10 (100.0%) | 0 (0.0%) |
| 6 to 18 Years | 31 (100.0%) | 0 (0.0%) |
| 19 to 25 Years | 2 (100.0%) | 0 (0.0%) |
| 26 to 34 Years | 11 (100.0%) | 0 (0.0%) |
| 35 to 44 Years | 23 (100.0%) | 0 (0.0%) |
| 45 to 54 Years | 7 (100.0%) | 0 (0.0%) |
| 55 to 64 Years | 6 (100.0%) | 0 (0.0%) |
| 65 to 74 Years | 13 (100.0%) | 0 (0.0%) |
| 75 Years and older | 10 (100.0%) | 0 (0.0%) |
| Total | 113 (100.0%) | 0 (0.0%) |
Health Insurance Coverage by Citizenship Status in Woodlawn Heights
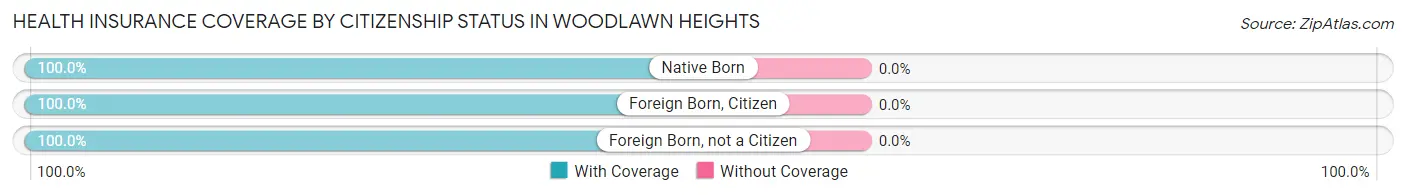
| Citizenship Status | With Coverage | Without Coverage |
| Native Born | 10 (100.0%) | 0 (0.0%) |
| Foreign Born, Citizen | 31 (100.0%) | 0 (0.0%) |
| Foreign Born, not a Citizen | 2 (100.0%) | 0 (0.0%) |
Health Insurance Coverage by Household Income in Woodlawn Heights

| Household Income | With Coverage | Without Coverage |
| Under $25,000 | 0 (0.0%) | 0 (0.0%) |
| $25,000 to $49,999 | 17 (100.0%) | 0 (0.0%) |
| $50,000 to $74,999 | 3 (100.0%) | 0 (0.0%) |
| $75,000 to $99,999 | 10 (100.0%) | 0 (0.0%) |
| $100,000 and over | 83 (100.0%) | 0 (0.0%) |
Public vs Private Health Insurance Coverage by Age in Woodlawn Heights
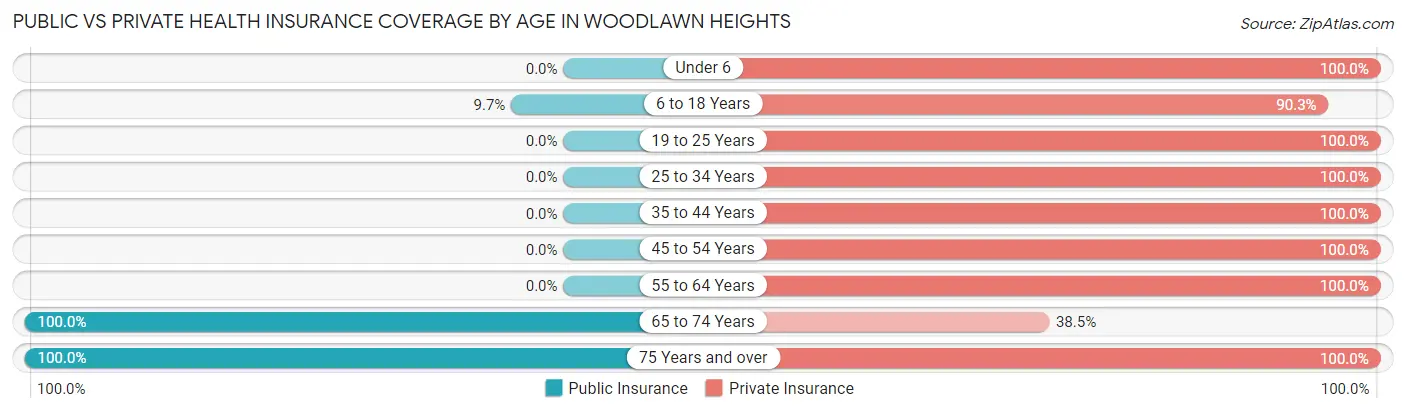
| Age Bracket | Public Insurance | Private Insurance |
| Under 6 | 0 (0.0%) | 10 (100.0%) |
| 6 to 18 Years | 3 (9.7%) | 28 (90.3%) |
| 19 to 25 Years | 0 (0.0%) | 2 (100.0%) |
| 25 to 34 Years | 0 (0.0%) | 11 (100.0%) |
| 35 to 44 Years | 0 (0.0%) | 23 (100.0%) |
| 45 to 54 Years | 0 (0.0%) | 7 (100.0%) |
| 55 to 64 Years | 0 (0.0%) | 6 (100.0%) |
| 65 to 74 Years | 13 (100.0%) | 5 (38.5%) |
| 75 Years and over | 10 (100.0%) | 10 (100.0%) |
| Total | 26 (23.0%) | 102 (90.3%) |
Disability Status by Sex by Age in Woodlawn Heights

| Age Bracket | Male | Female |
| Under 5 Years | 0 (0.0%) | 0 (0.0%) |
| 5 to 17 Years | 0 (0.0%) | 0 (0.0%) |
| 18 to 34 Years | 0 (0.0%) | 0 (0.0%) |
| 35 to 64 Years | 3 (20.0%) | 3 (14.3%) |
| 65 to 74 Years | 0 (0.0%) | 1 (14.3%) |
| 75 Years and over | 0 (0.0%) | 3 (100.0%) |
Disability Class by Sex by Age in Woodlawn Heights
Disability Class: Hearing Difficulty
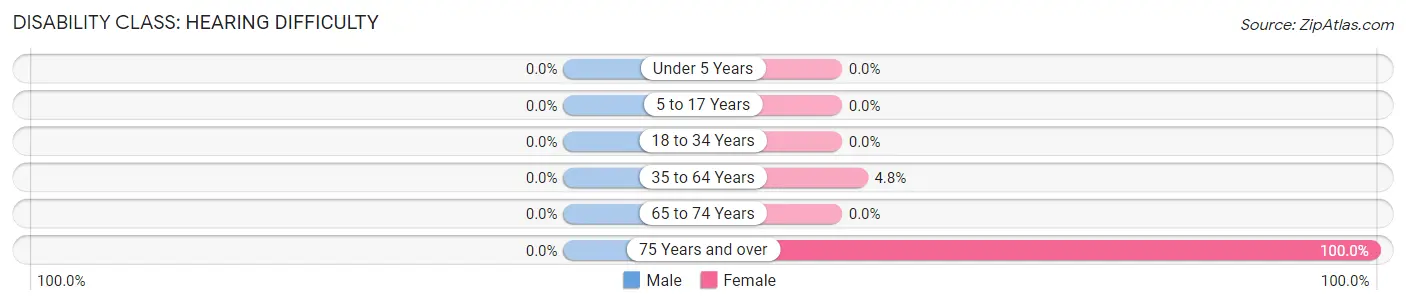
| Age Bracket | Male | Female |
| Under 5 Years | 0 (0.0%) | 0 (0.0%) |
| 5 to 17 Years | 0 (0.0%) | 0 (0.0%) |
| 18 to 34 Years | 0 (0.0%) | 0 (0.0%) |
| 35 to 64 Years | 0 (0.0%) | 1 (4.8%) |
| 65 to 74 Years | 0 (0.0%) | 0 (0.0%) |
| 75 Years and over | 0 (0.0%) | 3 (100.0%) |
Disability Class: Vision Difficulty
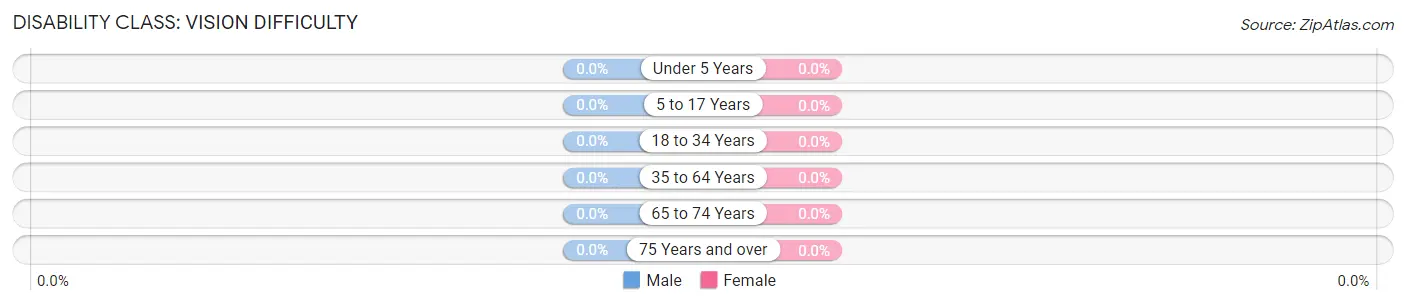
| Age Bracket | Male | Female |
| Under 5 Years | 0 (0.0%) | 0 (0.0%) |
| 5 to 17 Years | 0 (0.0%) | 0 (0.0%) |
| 18 to 34 Years | 0 (0.0%) | 0 (0.0%) |
| 35 to 64 Years | 0 (0.0%) | 0 (0.0%) |
| 65 to 74 Years | 0 (0.0%) | 0 (0.0%) |
| 75 Years and over | 0 (0.0%) | 0 (0.0%) |
Disability Class: Cognitive Difficulty
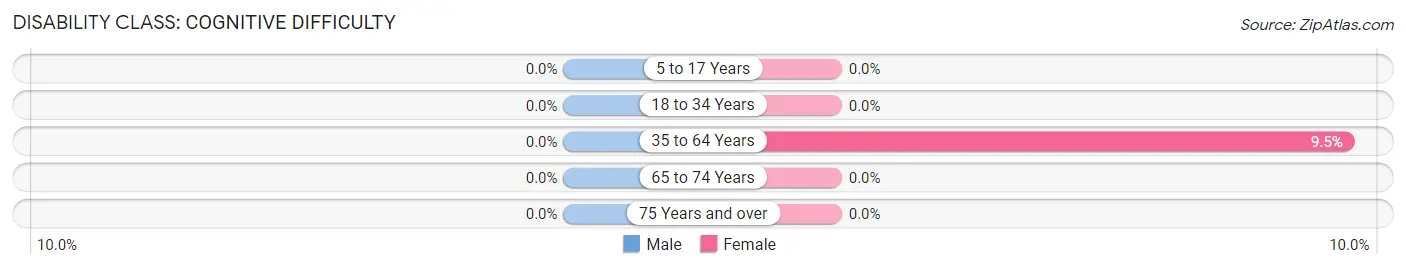
| Age Bracket | Male | Female |
| 5 to 17 Years | 0 (0.0%) | 0 (0.0%) |
| 18 to 34 Years | 0 (0.0%) | 0 (0.0%) |
| 35 to 64 Years | 0 (0.0%) | 2 (9.5%) |
| 65 to 74 Years | 0 (0.0%) | 0 (0.0%) |
| 75 Years and over | 0 (0.0%) | 0 (0.0%) |
Disability Class: Ambulatory Difficulty
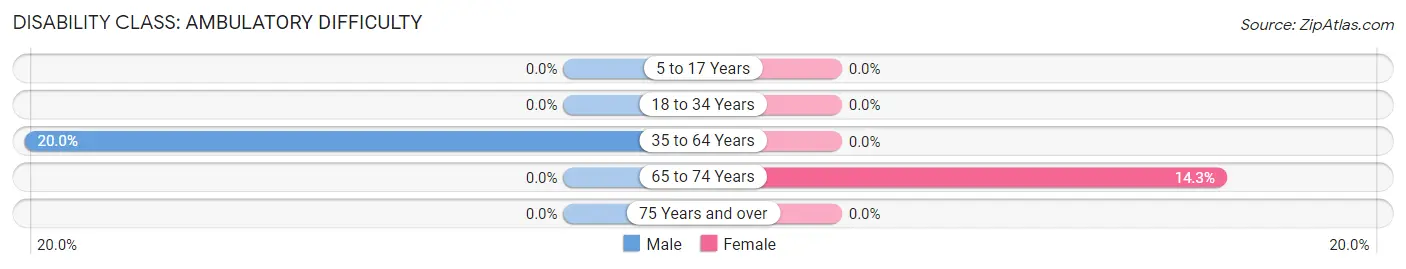
| Age Bracket | Male | Female |
| 5 to 17 Years | 0 (0.0%) | 0 (0.0%) |
| 18 to 34 Years | 0 (0.0%) | 0 (0.0%) |
| 35 to 64 Years | 3 (20.0%) | 0 (0.0%) |
| 65 to 74 Years | 0 (0.0%) | 1 (14.3%) |
| 75 Years and over | 0 (0.0%) | 0 (0.0%) |
Disability Class: Self-Care Difficulty
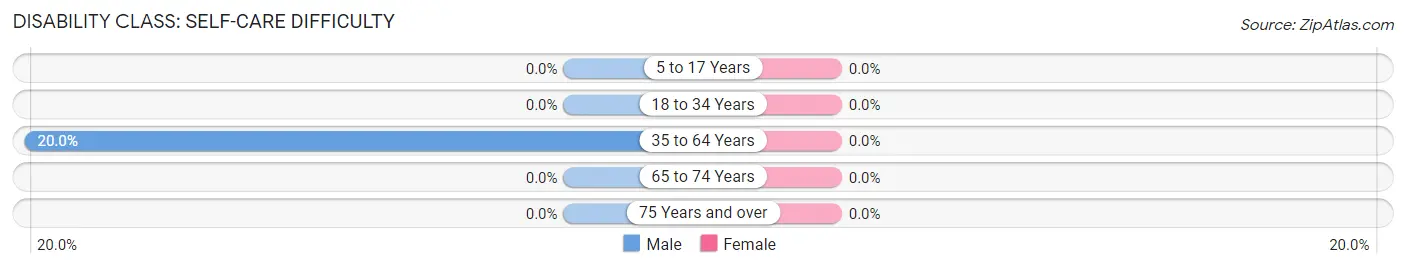
| Age Bracket | Male | Female |
| 5 to 17 Years | 0 (0.0%) | 0 (0.0%) |
| 18 to 34 Years | 0 (0.0%) | 0 (0.0%) |
| 35 to 64 Years | 3 (20.0%) | 0 (0.0%) |
| 65 to 74 Years | 0 (0.0%) | 0 (0.0%) |
| 75 Years and over | 0 (0.0%) | 0 (0.0%) |
Technology Access in Woodlawn Heights
Computing Device Access in Woodlawn Heights
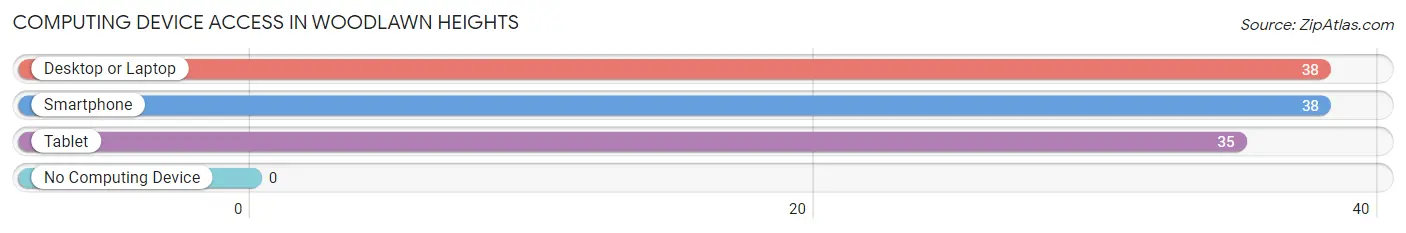
| Device Type | # Households | % Households |
| Desktop or Laptop | 38 | 100.0% |
| Smartphone | 38 | 100.0% |
| Tablet | 35 | 92.1% |
| No Computing Device | 0 | 0.0% |
| Total | 38 | 100.0% |
Internet Access in Woodlawn Heights
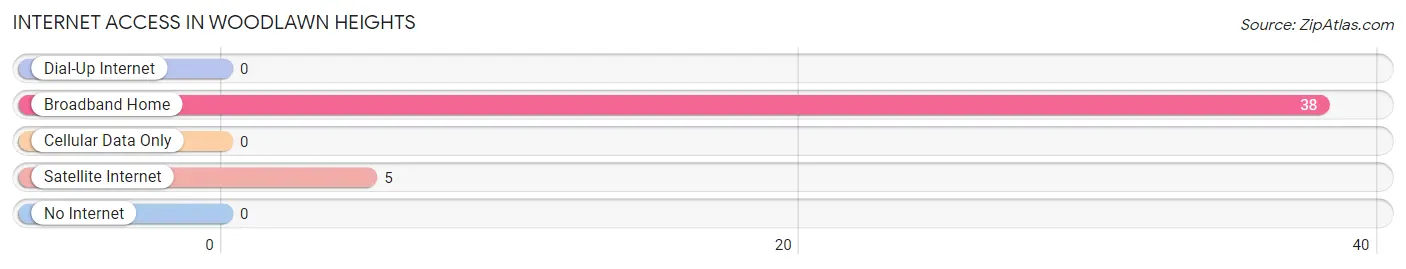
| Internet Type | # Households | % Households |
| Dial-Up Internet | 0 | 0.0% |
| Broadband Home | 38 | 100.0% |
| Cellular Data Only | 0 | 0.0% |
| Satellite Internet | 5 | 13.2% |
| No Internet | 0 | 0.0% |
| Total | 38 | 100.0% |
Woodlawn Heights Summary
Woodlawn Heights is a small unincorporated community located in the state of Indiana. It is situated in the northern part of the state, in the county of Allen. The community is located just south of Fort Wayne, the state’s second largest city. Woodlawn Heights is a rural community with a population of just over 1,000 people.
History
Woodlawn Heights was first settled in the early 1800s by a group of German immigrants. The area was originally known as “Woodlawn” and was part of the larger township of Aboite. The area was primarily used for farming and the settlers built a small church and schoolhouse. In 1851, the area was officially incorporated as the town of Woodlawn Heights.
The town grew slowly over the years and by the early 1900s, it had become a popular destination for tourists. The town was known for its beautiful scenery and its many outdoor activities. In the 1920s, the town was home to a popular amusement park called “Woodlawn Heights Park”. The park featured a roller coaster, a ferris wheel, and a carousel.
The town continued to grow throughout the 20th century and by the year 2000, the population had grown to over 1,000 people.
Geography
Woodlawn Heights is located in the northern part of the state of Indiana. It is situated in the county of Allen, just south of Fort Wayne. The town is located on the banks of the St. Joseph River and is surrounded by rolling hills and farmland. The town is located at an elevation of 845 feet above sea level.
The climate in Woodlawn Heights is typical of the Midwest. Summers are hot and humid, while winters are cold and snowy. The average temperature in the summer is around 75 degrees Fahrenheit, while the average temperature in the winter is around 25 degrees Fahrenheit.
Economy
The economy of Woodlawn Heights is primarily based on agriculture. The town is home to several farms that produce corn, soybeans, and other crops. The town also has a few small businesses, including a grocery store, a hardware store, and a few restaurants.
The town is also home to a few manufacturing companies, including a furniture factory and a plastics factory.
Demographics
As of the 2010 census, the population of Woodlawn Heights was 1,072. The racial makeup of the town was 97.3% White, 0.9% African American, 0.2% Native American, 0.2% Asian, and 1.4% from other races. The median household income was $45,000 and the median home value was $117,000.
Conclusion
Woodlawn Heights is a small rural community located in the northern part of the state of Indiana. The town has a long history and is home to a diverse population. The economy of the town is primarily based on agriculture and small businesses. The town is also home to a few manufacturing companies. The town has a population of just over 1,000 people and the median household income is $45,000.
Common Questions
What is Per Capita Income in Woodlawn Heights?
Per Capita income in Woodlawn Heights is $45,183.
What is the Median Family Income in Woodlawn Heights?
Median Family Income in Woodlawn Heights is $113,542.
What is the Median Household income in Woodlawn Heights?
Median Household Income in Woodlawn Heights is $110,000.
What is Inequality or Gini Index in Woodlawn Heights?
Inequality or Gini Index in Woodlawn Heights is 0.40.
What is the Total Population of Woodlawn Heights?
Total Population of Woodlawn Heights is 113.
What is the Total Male Population of Woodlawn Heights?
Total Male Population of Woodlawn Heights is 56.
What is the Total Female Population of Woodlawn Heights?
Total Female Population of Woodlawn Heights is 57.
What is the Ratio of Males per 100 Females in Woodlawn Heights?
There are 98.25 Males per 100 Females in Woodlawn Heights.
What is the Ratio of Females per 100 Males in Woodlawn Heights?
There are 101.79 Females per 100 Males in Woodlawn Heights.
What is the Median Population Age in Woodlawn Heights?
Median Population Age in Woodlawn Heights is 35.4 Years.
What is the Average Family Size in Woodlawn Heights
Average Family Size in Woodlawn Heights is 3.3 People.
What is the Average Household Size in Woodlawn Heights
Average Household Size in Woodlawn Heights is 3.0 People.
How Large is the Labor Force in Woodlawn Heights?
There are 52 People in the Labor Forcein in Woodlawn Heights.
What is the Percentage of People in the Labor Force in Woodlawn Heights?
72.2% of People are in the Labor Force in Woodlawn Heights.