Southern Shops, SC Map & Demographics
Southern Shops Map
Southern Shops Overview
$14,811
PER CAPITA INCOME
$35,363
AVG FAMILY INCOME
$32,500
AVG HOUSEHOLD INCOME
24.4%
WAGE / INCOME GAP [ % ]
75.6¢/ $1
WAGE / INCOME GAP [ $ ]
0.41
INEQUALITY / GINI INDEX
3,856
TOTAL POPULATION
2,668
MALE POPULATION
1,188
FEMALE POPULATION
224.58
MALES / 100 FEMALES
44.53
FEMALES / 100 MALES
34.8
MEDIAN AGE
3.1
AVG FAMILY SIZE
2.9
AVG HOUSEHOLD SIZE
1,866
LABOR FORCE [ PEOPLE ]
57.3%
PERCENT IN LABOR FORCE
6.3%
UNEMPLOYMENT RATE
Income in Southern Shops
Income Overview in Southern Shops
Per Capita Income in Southern Shops is $14,811, while median incomes of families and households are $35,363 and $32,500 respectively.
| Characteristic | Number | Measure |
| Per Capita Income | 3,856 | $14,811 |
| Median Family Income | 867 | $35,363 |
| Mean Family Income | 867 | $44,118 |
| Median Household Income | 1,158 | $32,500 |
| Mean Household Income | 1,158 | $42,397 |
| Income Deficit | 867 | $0 |
| Wage / Income Gap (%) | 3,856 | 24.37% |
| Wage / Income Gap ($) | 3,856 | 75.63¢ per $1 |
| Gini / Inequality Index | 3,856 | 0.41 |
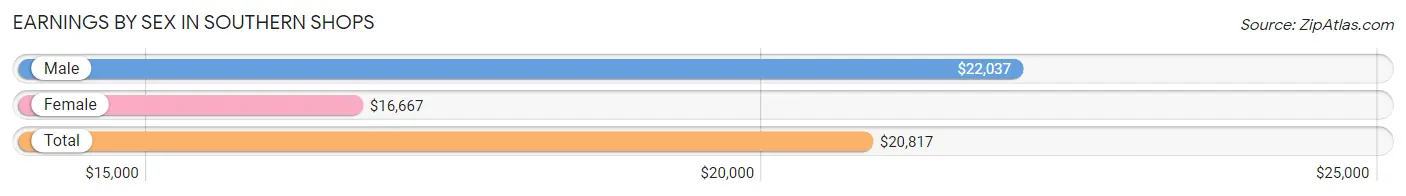
Earnings by Sex in Southern Shops
Average Earnings in Southern Shops are $20,817, $22,037 for men and $16,667 for women, a difference of 24.4%.
| Sex | Number | Average Earnings |
| Male | 1,476 (78.0%) | $22,037 |
| Female | 416 (22.0%) | $16,667 |
| Total | 1,892 (100.0%) | $20,817 |
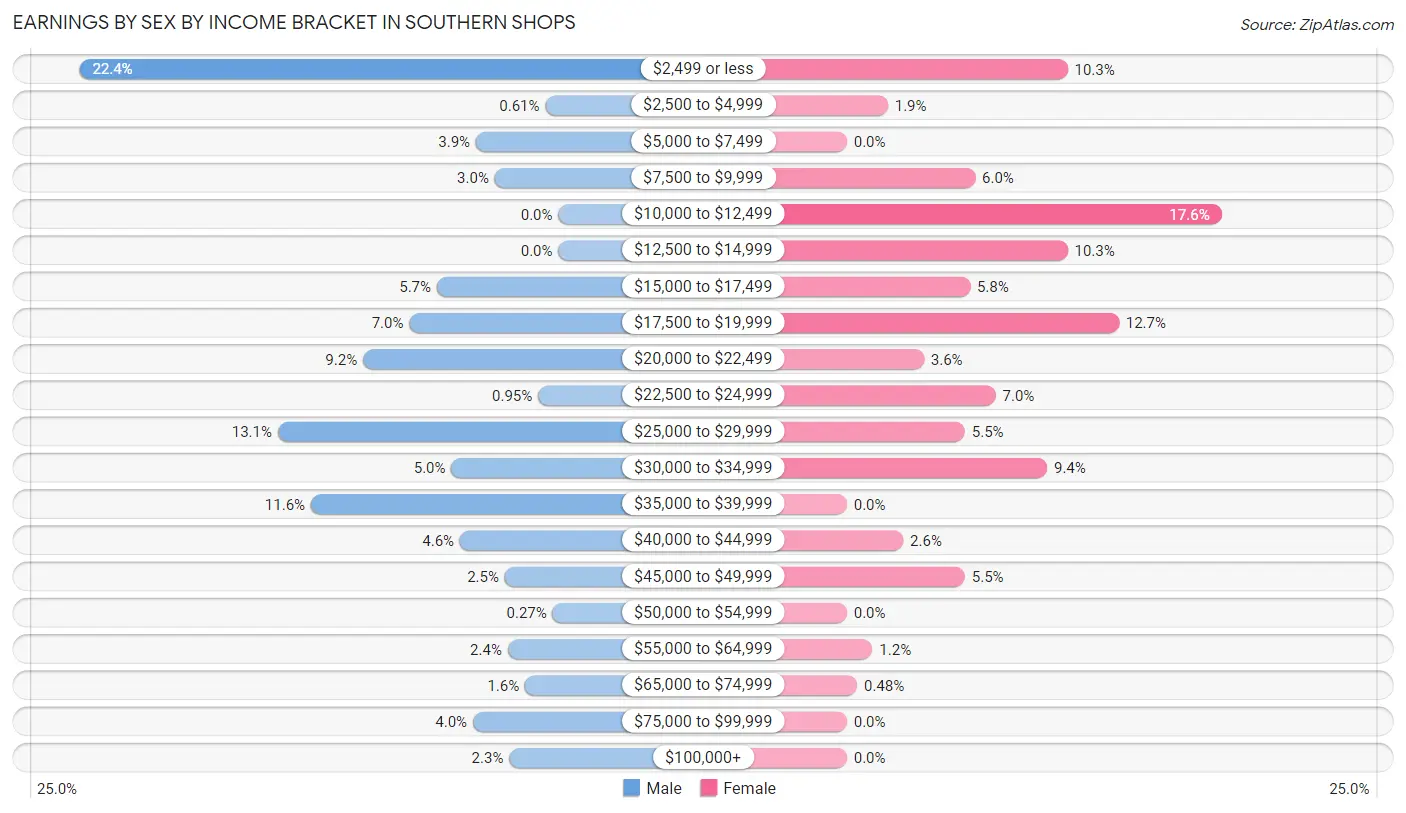
Earnings by Sex by Income Bracket in Southern Shops
The most common earnings brackets in Southern Shops are $2,499 or less for men (331 | 22.4%) and $10,000 to $12,499 for women (73 | 17.5%).
| Income | Male | Female |
| $2,499 or less | 331 (22.4%) | 43 (10.3%) |
| $2,500 to $4,999 | 9 (0.6%) | 8 (1.9%) |
| $5,000 to $7,499 | 57 (3.9%) | 0 (0.0%) |
| $7,500 to $9,999 | 44 (3.0%) | 25 (6.0%) |
| $10,000 to $12,499 | 0 (0.0%) | 73 (17.5%) |
| $12,500 to $14,999 | 0 (0.0%) | 43 (10.3%) |
| $15,000 to $17,499 | 84 (5.7%) | 24 (5.8%) |
| $17,500 to $19,999 | 103 (7.0%) | 53 (12.7%) |
| $20,000 to $22,499 | 135 (9.1%) | 15 (3.6%) |
| $22,500 to $24,999 | 14 (0.9%) | 29 (7.0%) |
| $25,000 to $29,999 | 194 (13.1%) | 23 (5.5%) |
| $30,000 to $34,999 | 74 (5.0%) | 39 (9.4%) |
| $35,000 to $39,999 | 171 (11.6%) | 0 (0.0%) |
| $40,000 to $44,999 | 68 (4.6%) | 11 (2.6%) |
| $45,000 to $49,999 | 37 (2.5%) | 23 (5.5%) |
| $50,000 to $54,999 | 4 (0.3%) | 0 (0.0%) |
| $55,000 to $64,999 | 35 (2.4%) | 5 (1.2%) |
| $65,000 to $74,999 | 23 (1.6%) | 2 (0.5%) |
| $75,000 to $99,999 | 59 (4.0%) | 0 (0.0%) |
| $100,000+ | 34 (2.3%) | 0 (0.0%) |
| Total | 1,476 (100.0%) | 416 (100.0%) |
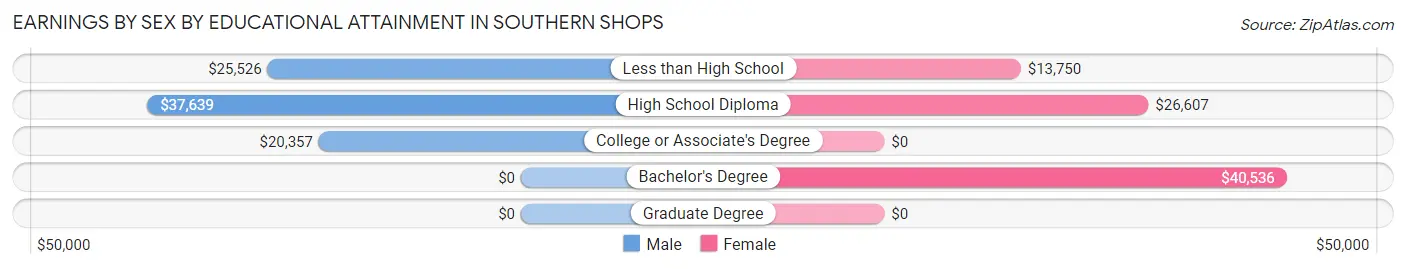
Earnings by Sex by Educational Attainment in Southern Shops
Average earnings in Southern Shops are $28,166 for men and $17,031 for women, a difference of 39.5%. Men with an educational attainment of high school diploma enjoy the highest average annual earnings of $37,639, while those with college or associate's degree education earn the least with $20,357. Women with an educational attainment of bachelor's degree earn the most with the average annual earnings of $40,536, while those with less than high school education have the smallest earnings of $13,750.
| Educational Attainment | Male Income | Female Income |
| Less than High School | $25,526 | $13,750 |
| High School Diploma | $37,639 | $26,607 |
| College or Associate's Degree | $20,357 | $0 |
| Bachelor's Degree | - | - |
| Graduate Degree | - | - |
| Total | $28,166 | $17,031 |
Family Income in Southern Shops
Family Income Brackets in Southern Shops
According to the Southern Shops family income data, there are 236 families falling into the $15,000 to $24,999 income range, which is the most common income bracket and makes up 27.2% of all families.
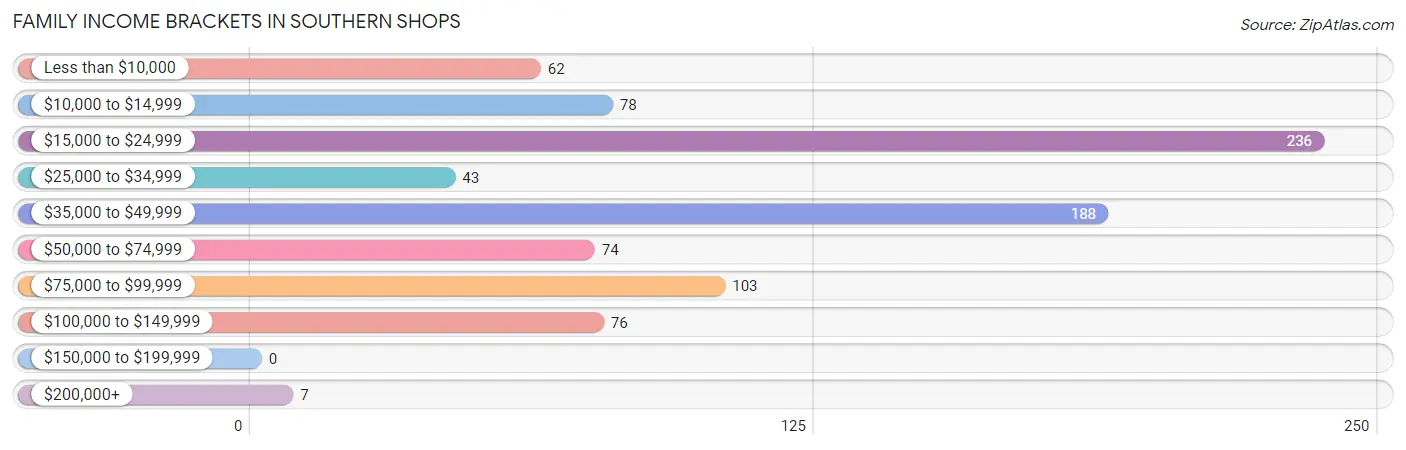
| Income Bracket | # Families | % Families |
| Less than $10,000 | 62 | 7.2% |
| $10,000 to $14,999 | 78 | 9.0% |
| $15,000 to $24,999 | 236 | 27.2% |
| $25,000 to $34,999 | 43 | 5.0% |
| $35,000 to $49,999 | 188 | 21.7% |
| $50,000 to $74,999 | 74 | 8.5% |
| $75,000 to $99,999 | 103 | 11.9% |
| $100,000 to $149,999 | 76 | 8.8% |
| $150,000 to $199,999 | 0 | 0.0% |
| $200,000+ | 7 | 0.8% |
Family Income by Famaliy Size in Southern Shops
4-person families (173 | 20.0%) account for the highest median family income in Southern Shops with $44,940 per family, while 3-person families (323 | 37.2%) have the highest median income of $11,846 per family member.
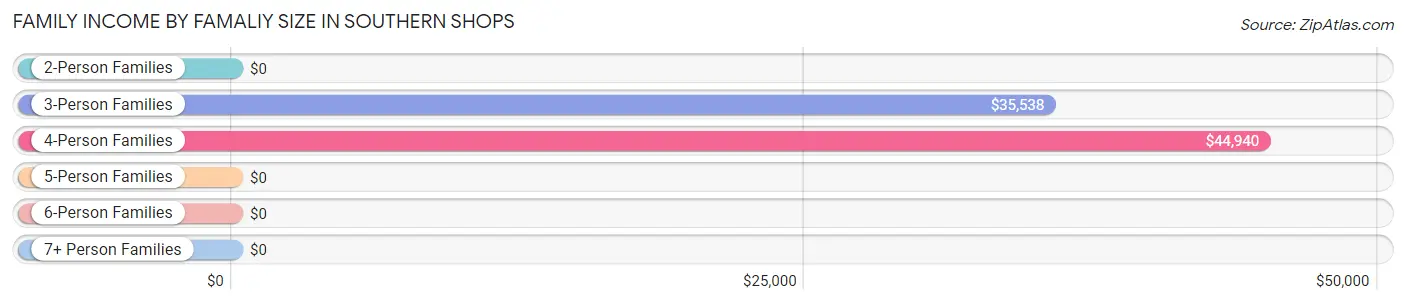
| Income Bracket | # Families | Median Income |
| 2-Person Families | 359 (41.4%) | $0 |
| 3-Person Families | 323 (37.2%) | $35,538 |
| 4-Person Families | 173 (20.0%) | $44,940 |
| 5-Person Families | 6 (0.7%) | $0 |
| 6-Person Families | 5 (0.6%) | $0 |
| 7+ Person Families | 1 (0.1%) | $0 |
| Total | 867 (100.0%) | $35,363 |
Family Income by Number of Earners in Southern Shops
The median family income in Southern Shops is $35,363, with families comprising 3+ earners (39) having the highest median family income of $91,908, while families with no earners (158) have the lowest median family income of $15,662, accounting for 4.5% and 18.2% of families, respectively.
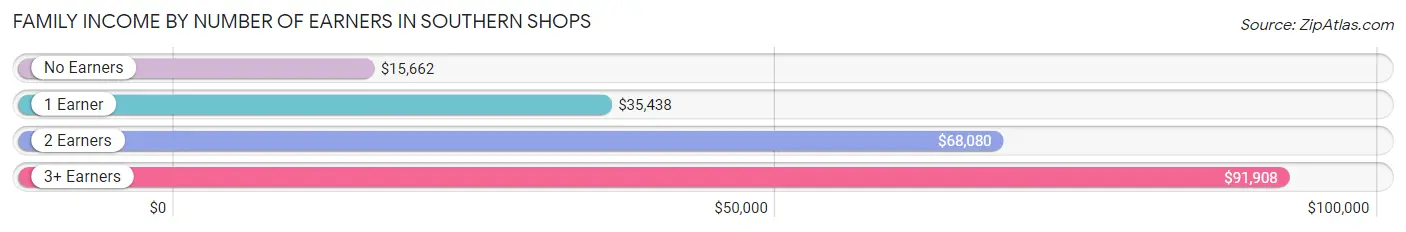
| Number of Earners | # Families | Median Income |
| No Earners | 158 (18.2%) | $15,662 |
| 1 Earner | 399 (46.0%) | $35,438 |
| 2 Earners | 271 (31.3%) | $68,080 |
| 3+ Earners | 39 (4.5%) | $91,908 |
| Total | 867 (100.0%) | $35,363 |
Household Income in Southern Shops
Household Income Brackets in Southern Shops
With 378 households falling in the category, the $15,000 to $24,999 income range is the most frequent in Southern Shops, accounting for 32.6% of all households.
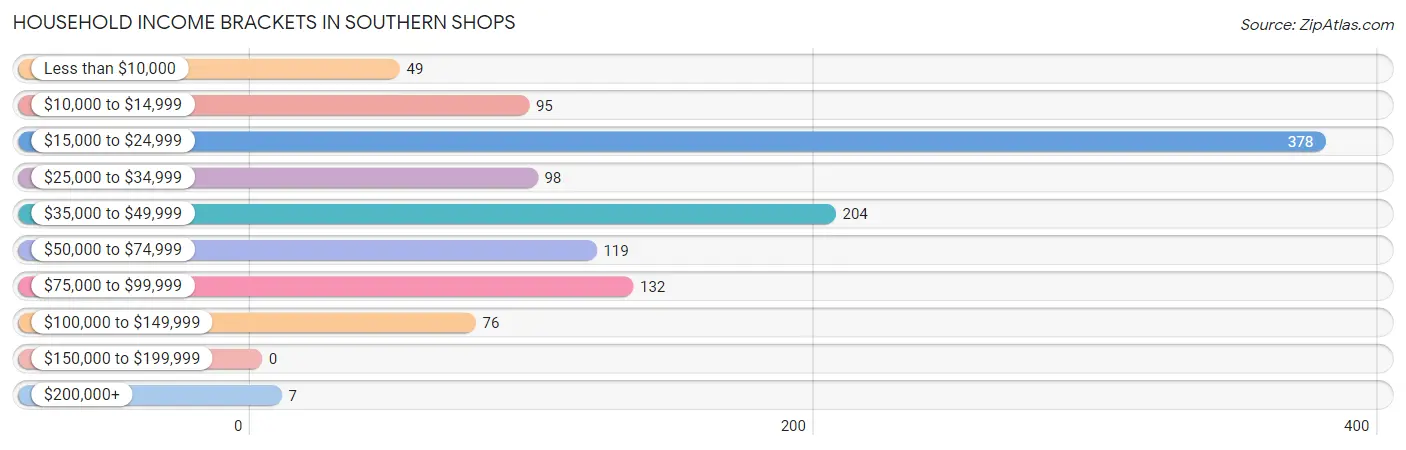
| Income Bracket | # Households | % Households |
| Less than $10,000 | 49 | 4.2% |
| $10,000 to $14,999 | 95 | 8.2% |
| $15,000 to $24,999 | 378 | 32.6% |
| $25,000 to $34,999 | 98 | 8.5% |
| $35,000 to $49,999 | 204 | 17.6% |
| $50,000 to $74,999 | 119 | 10.3% |
| $75,000 to $99,999 | 132 | 11.4% |
| $100,000 to $149,999 | 76 | 6.6% |
| $150,000 to $199,999 | 0 | 0.0% |
| $200,000+ | 7 | 0.6% |
Household Income by Householder Age in Southern Shops
The median household income in Southern Shops is $32,500, with the highest median household income of $33,209 found in the 45 to 64 years age bracket for the primary householder. A total of 423 households (36.5%) fall into this category. Meanwhile, the 15 to 24 years age bracket for the primary householder has the lowest median household income of $0, with 47 households (4.1%) in this group.
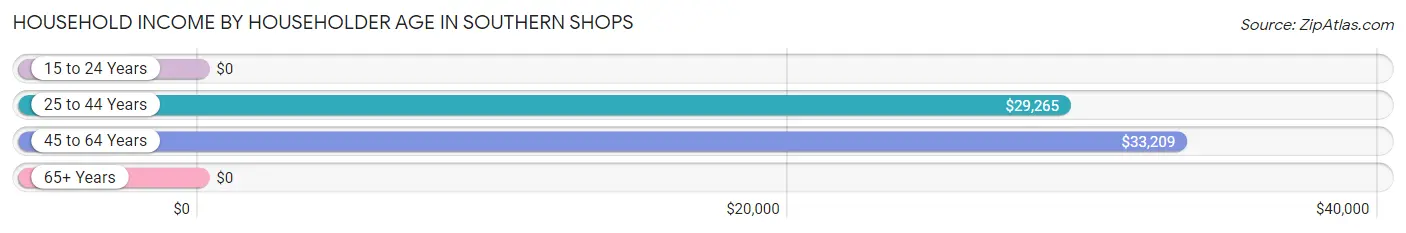
| Income Bracket | # Households | Median Income |
| 15 to 24 Years | 47 (4.1%) | $0 |
| 25 to 44 Years | 546 (47.1%) | $29,265 |
| 45 to 64 Years | 423 (36.5%) | $33,209 |
| 65+ Years | 142 (12.3%) | $0 |
| Total | 1,158 (100.0%) | $32,500 |
Poverty in Southern Shops
Income Below Poverty by Sex and Age in Southern Shops
With 49.0% poverty level for males and 38.7% for females among the residents of Southern Shops, 5 year old males and 65 to 74 year old females are the most vulnerable to poverty, with 32 males (100.0%) and 74 females (71.8%) in their respective age groups living below the poverty level.
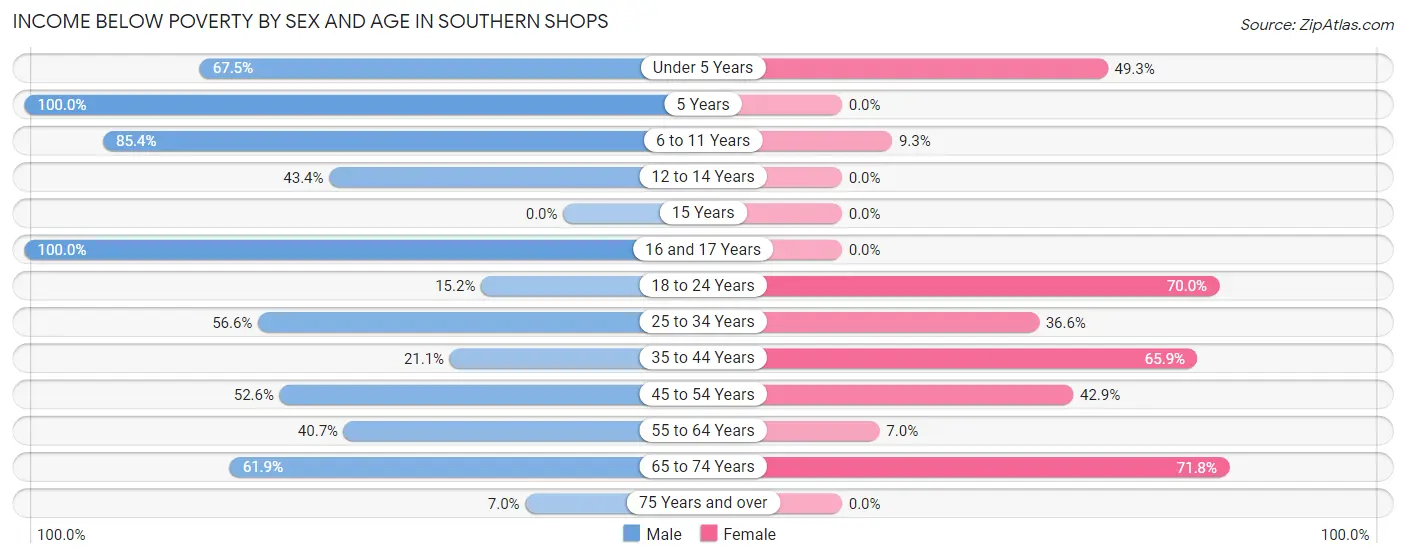
| Age Bracket | Male | Female |
| Under 5 Years | 114 (67.5%) | 37 (49.3%) |
| 5 Years | 32 (100.0%) | 0 (0.0%) |
| 6 to 11 Years | 41 (85.4%) | 11 (9.3%) |
| 12 to 14 Years | 43 (43.4%) | 0 (0.0%) |
| 15 Years | 0 (0.0%) | 0 (0.0%) |
| 16 and 17 Years | 211 (100.0%) | 0 (0.0%) |
| 18 to 24 Years | 32 (15.2%) | 21 (70.0%) |
| 25 to 34 Years | 239 (56.6%) | 87 (36.5%) |
| 35 to 44 Years | 64 (21.0%) | 145 (65.9%) |
| 45 to 54 Years | 80 (52.6%) | 79 (42.9%) |
| 55 to 64 Years | 134 (40.7%) | 6 (7.0%) |
| 65 to 74 Years | 39 (61.9%) | 74 (71.8%) |
| 75 Years and over | 5 (7.0%) | 0 (0.0%) |
| Total | 1,034 (49.0%) | 460 (38.7%) |
Income Above Poverty by Sex and Age in Southern Shops
According to the poverty statistics in Southern Shops, males aged 75 years and over and females aged 12 to 14 years are the age groups that are most secure financially, with 93.0% of males and 100.0% of females in these age groups living above the poverty line.
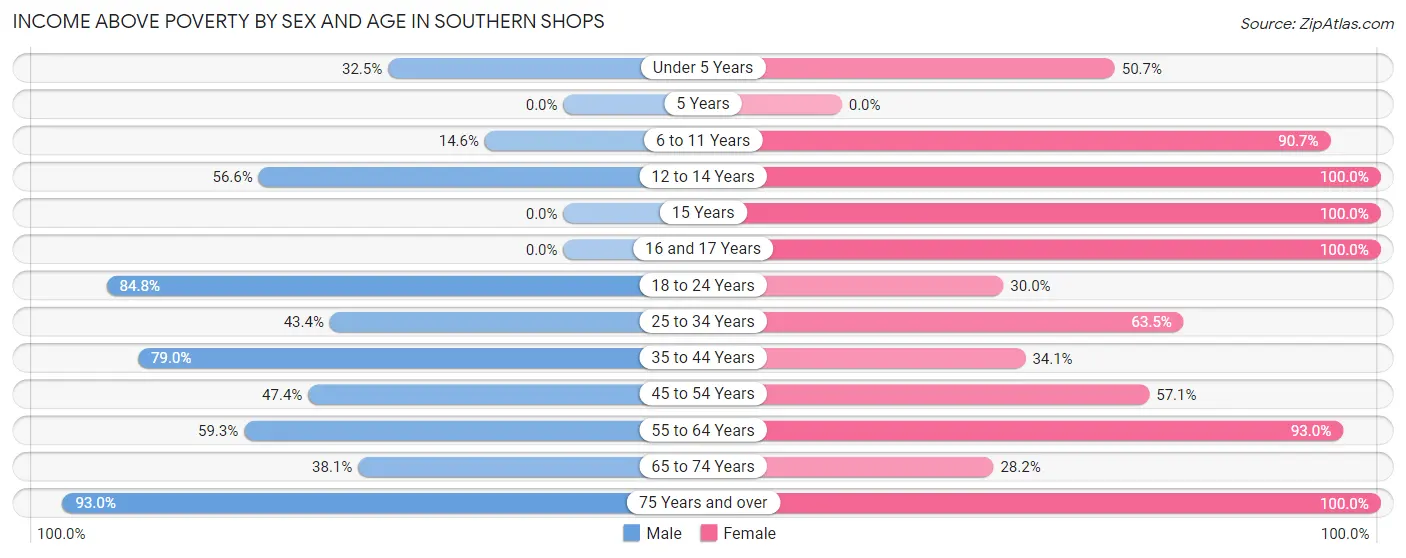
| Age Bracket | Male | Female |
| Under 5 Years | 55 (32.5%) | 38 (50.7%) |
| 5 Years | 0 (0.0%) | 0 (0.0%) |
| 6 to 11 Years | 7 (14.6%) | 107 (90.7%) |
| 12 to 14 Years | 56 (56.6%) | 17 (100.0%) |
| 15 Years | 0 (0.0%) | 41 (100.0%) |
| 16 and 17 Years | 0 (0.0%) | 16 (100.0%) |
| 18 to 24 Years | 178 (84.8%) | 9 (30.0%) |
| 25 to 34 Years | 183 (43.4%) | 151 (63.4%) |
| 35 to 44 Years | 240 (78.9%) | 75 (34.1%) |
| 45 to 54 Years | 72 (47.4%) | 105 (57.1%) |
| 55 to 64 Years | 195 (59.3%) | 80 (93.0%) |
| 65 to 74 Years | 24 (38.1%) | 29 (28.2%) |
| 75 Years and over | 66 (93.0%) | 60 (100.0%) |
| Total | 1,076 (51.0%) | 728 (61.3%) |
Income Below Poverty Among Married-Couple Families in Southern Shops
The poverty statistics for married-couple families in Southern Shops show that 36.5% or 189 of the total 518 families live below the poverty line. Families with no children have the highest poverty rate of 52.5%, comprising of 166 families. On the other hand, families with 3 or 4 children have the lowest poverty rate of 0.0%, which includes 0 families.
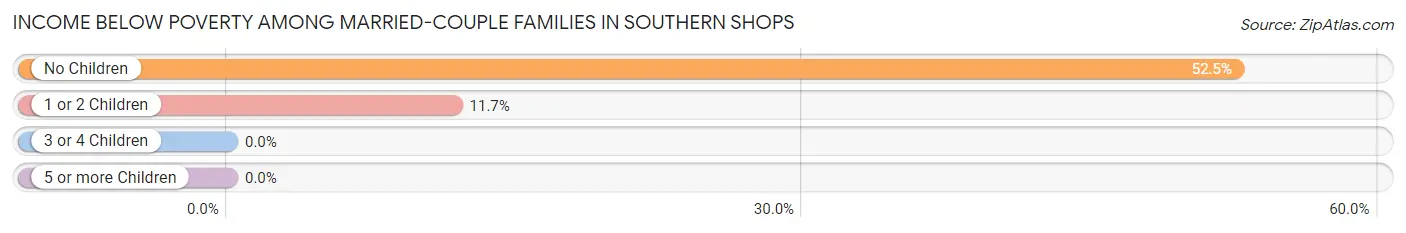
| Children | Above Poverty | Below Poverty |
| No Children | 150 (47.5%) | 166 (52.5%) |
| 1 or 2 Children | 173 (88.3%) | 23 (11.7%) |
| 3 or 4 Children | 6 (100.0%) | 0 (0.0%) |
| 5 or more Children | 0 (0.0%) | 0 (0.0%) |
| Total | 329 (63.5%) | 189 (36.5%) |
Income Below Poverty Among Single-Parent Households in Southern Shops
According to the poverty data in Southern Shops, 48.4% or 46 single-father households and 53.9% or 137 single-mother households are living below the poverty line. Among single-father households, those with 1 or 2 children have the highest poverty rate, with 46 households (48.4%) experiencing poverty. Likewise, among single-mother households, those with 3 or 4 children have the highest poverty rate, with 32 households (97.0%) falling below the poverty line.
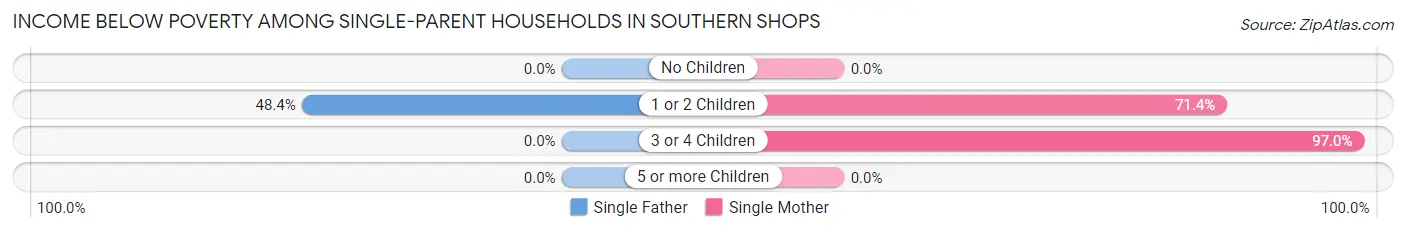
| Children | Single Father | Single Mother |
| No Children | 0 (0.0%) | 0 (0.0%) |
| 1 or 2 Children | 46 (48.4%) | 105 (71.4%) |
| 3 or 4 Children | 0 (0.0%) | 32 (97.0%) |
| 5 or more Children | 0 (0.0%) | 0 (0.0%) |
| Total | 46 (48.4%) | 137 (53.9%) |
Income Below Poverty Among Married-Couple vs Single-Parent Households in Southern Shops
The poverty data for Southern Shops shows that 189 of the married-couple family households (36.5%) and 183 of the single-parent households (52.4%) are living below the poverty level. Within the married-couple family households, those with no children have the highest poverty rate, with 166 households (52.5%) falling below the poverty line. Among the single-parent households, those with 3 or 4 children have the highest poverty rate, with 32 household (97.0%) living below poverty.
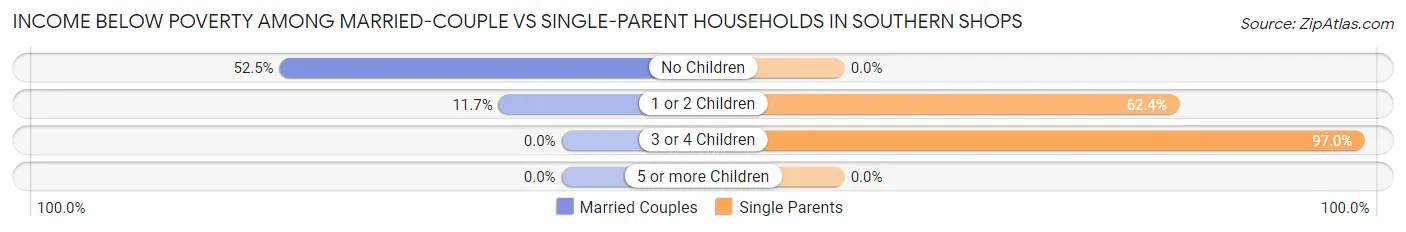
| Children | Married-Couple Families | Single-Parent Households |
| No Children | 166 (52.5%) | 0 (0.0%) |
| 1 or 2 Children | 23 (11.7%) | 151 (62.4%) |
| 3 or 4 Children | 0 (0.0%) | 32 (97.0%) |
| 5 or more Children | 0 (0.0%) | 0 (0.0%) |
| Total | 189 (36.5%) | 183 (52.4%) |
Race in Southern Shops
The most populous races in Southern Shops are Hispanic or Latino (1,888 | 49.0%), White / Caucasian (1,323 | 34.3%), and Two or more Races (1,144 | 29.7%).
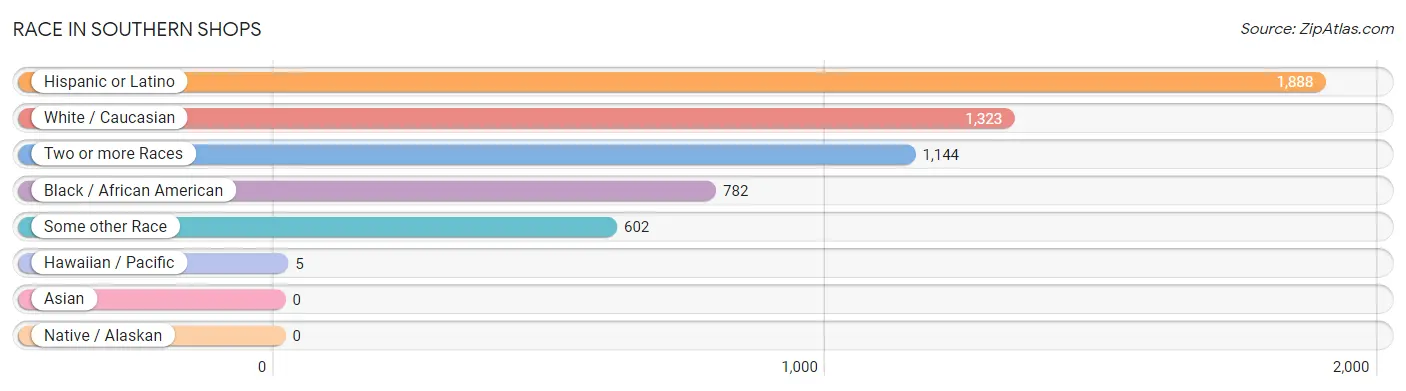
| Race | # Population | % Population |
| Asian | 0 | 0.0% |
| Black / African American | 782 | 20.3% |
| Hawaiian / Pacific | 5 | 0.1% |
| Hispanic or Latino | 1,888 | 49.0% |
| Native / Alaskan | 0 | 0.0% |
| White / Caucasian | 1,323 | 34.3% |
| Two or more Races | 1,144 | 29.7% |
| Some other Race | 602 | 15.6% |
| Total | 3,856 | 100.0% |
Ancestry in Southern Shops
The most populous ancestries reported in Southern Shops are Mexican (1,374 | 35.6%), Central American (331 | 8.6%), Irish (241 | 6.2%), English (190 | 4.9%), and Guatemalan (158 | 4.1%), together accounting for 59.5% of all Southern Shops residents.
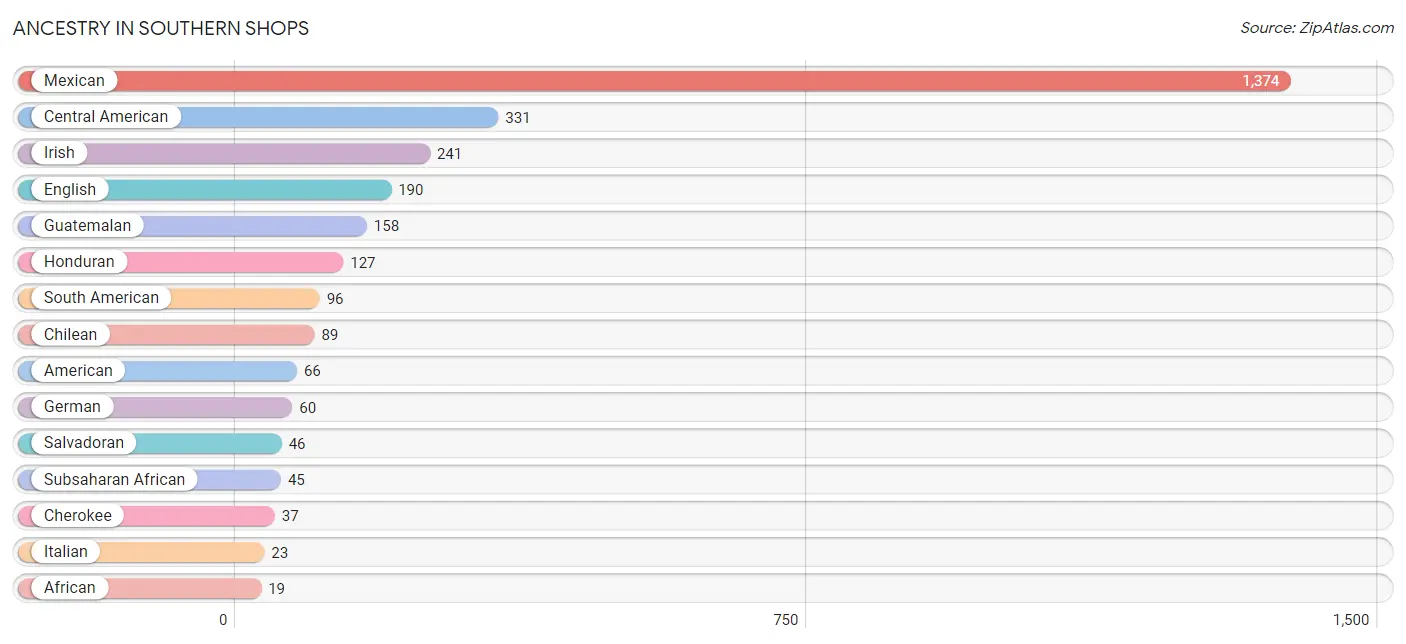
| Ancestry | # Population | % Population |
| African | 19 | 0.5% |
| American | 66 | 1.7% |
| Arab | 6 | 0.2% |
| British | 8 | 0.2% |
| Central American | 331 | 8.6% |
| Cherokee | 37 | 1.0% |
| Chilean | 89 | 2.3% |
| Chippewa | 7 | 0.2% |
| Cuban | 4 | 0.1% |
| Eastern European | 8 | 0.2% |
| English | 190 | 4.9% |
| Ethiopian | 18 | 0.5% |
| European | 7 | 0.2% |
| French | 7 | 0.2% |
| French Canadian | 11 | 0.3% |
| German | 60 | 1.6% |
| Guatemalan | 158 | 4.1% |
| Honduran | 127 | 3.3% |
| Irish | 241 | 6.2% |
| Italian | 23 | 0.6% |
| Mexican | 1,374 | 35.6% |
| Native Hawaiian | 5 | 0.1% |
| Nigerian | 8 | 0.2% |
| Polish | 13 | 0.3% |
| Puerto Rican | 17 | 0.4% |
| Salvadoran | 46 | 1.2% |
| Scandinavian | 2 | 0.1% |
| Scotch-Irish | 11 | 0.3% |
| Scottish | 4 | 0.1% |
| South American | 96 | 2.5% |
| Spanish | 18 | 0.5% |
| Subsaharan African | 45 | 1.2% |
| Ukrainian | 16 | 0.4% |
| Venezuelan | 7 | 0.2% | View All 34 Rows |
Immigrants in Southern Shops
The most numerous immigrant groups reported in Southern Shops came from Latin America (1,055 | 27.4%), Central America (998 | 25.9%), Mexico (727 | 18.9%), Guatemala (133 | 3.5%), and Honduras (127 | 3.3%), together accounting for 78.8% of all Southern Shops residents.
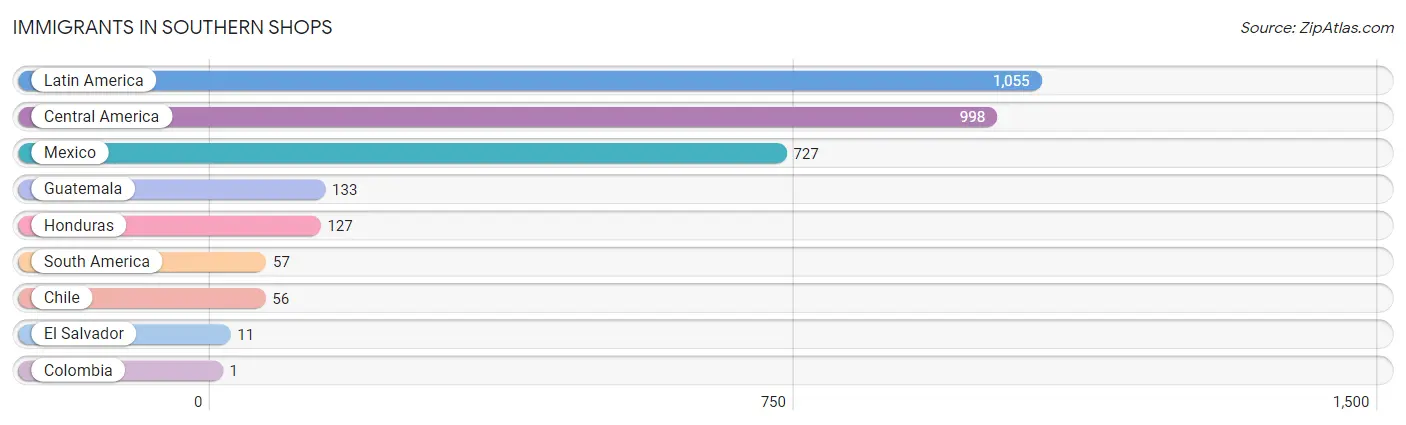
| Immigration Origin | # Population | % Population |
| Central America | 998 | 25.9% |
| Chile | 56 | 1.5% |
| Colombia | 1 | 0.0% |
| El Salvador | 11 | 0.3% |
| Guatemala | 133 | 3.5% |
| Honduras | 127 | 3.3% |
| Latin America | 1,055 | 27.4% |
| Mexico | 727 | 18.9% |
| South America | 57 | 1.5% | View All 9 Rows |
Sex and Age in Southern Shops
Sex and Age in Southern Shops
The most populous age groups in Southern Shops are 25 to 29 Years (388 | 14.5%) for men and 50 to 54 Years (148 | 12.5%) for women.
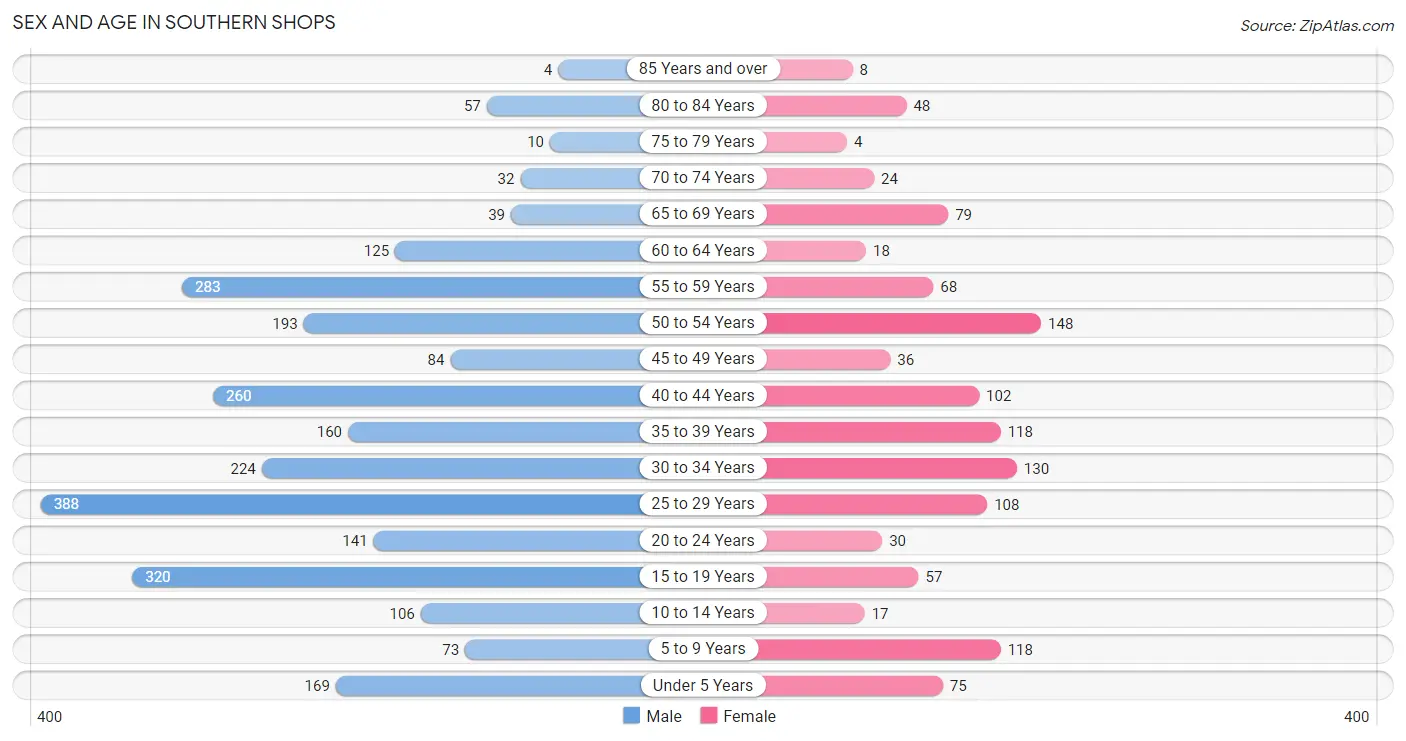
| Age Bracket | Male | Female |
| Under 5 Years | 169 (6.3%) | 75 (6.3%) |
| 5 to 9 Years | 73 (2.7%) | 118 (9.9%) |
| 10 to 14 Years | 106 (4.0%) | 17 (1.4%) |
| 15 to 19 Years | 320 (12.0%) | 57 (4.8%) |
| 20 to 24 Years | 141 (5.3%) | 30 (2.5%) |
| 25 to 29 Years | 388 (14.5%) | 108 (9.1%) |
| 30 to 34 Years | 224 (8.4%) | 130 (10.9%) |
| 35 to 39 Years | 160 (6.0%) | 118 (9.9%) |
| 40 to 44 Years | 260 (9.8%) | 102 (8.6%) |
| 45 to 49 Years | 84 (3.2%) | 36 (3.0%) |
| 50 to 54 Years | 193 (7.2%) | 148 (12.5%) |
| 55 to 59 Years | 283 (10.6%) | 68 (5.7%) |
| 60 to 64 Years | 125 (4.7%) | 18 (1.5%) |
| 65 to 69 Years | 39 (1.5%) | 79 (6.7%) |
| 70 to 74 Years | 32 (1.2%) | 24 (2.0%) |
| 75 to 79 Years | 10 (0.4%) | 4 (0.3%) |
| 80 to 84 Years | 57 (2.1%) | 48 (4.0%) |
| 85 Years and over | 4 (0.2%) | 8 (0.7%) |
| Total | 2,668 (100.0%) | 1,188 (100.0%) |
Families and Households in Southern Shops
Median Family Size in Southern Shops
The median family size in Southern Shops is 3.12 persons per family, with single female/mother families (254 | 29.3%) accounting for the largest median family size of 4.17 persons per family. On the other hand, single male/father families (95 | 11.0%) represent the smallest median family size with 2.47 persons per family.
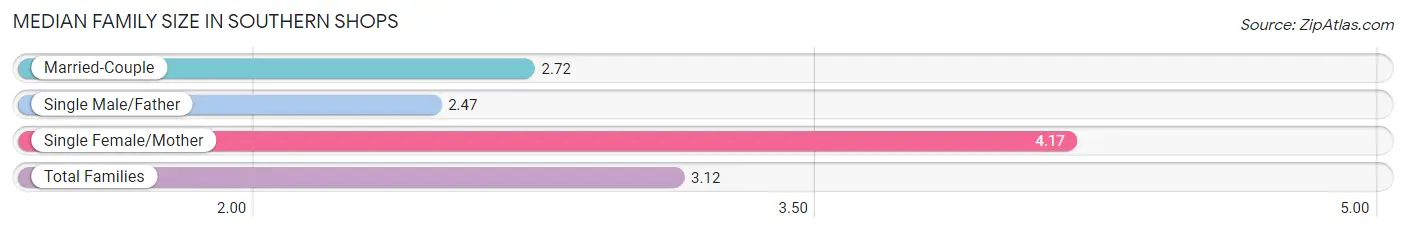
| Family Type | # Families | Family Size |
| Married-Couple | 518 (59.8%) | 2.72 |
| Single Male/Father | 95 (11.0%) | 2.47 |
| Single Female/Mother | 254 (29.3%) | 4.17 |
| Total Families | 867 (100.0%) | 3.12 |
Median Household Size in Southern Shops
The median household size in Southern Shops is 2.85 persons per household, with single female/mother households (254 | 21.9%) accounting for the largest median household size of 4.61 persons per household. non-family households (291 | 25.1%) represent the smallest median household size with 1.38 persons per household.
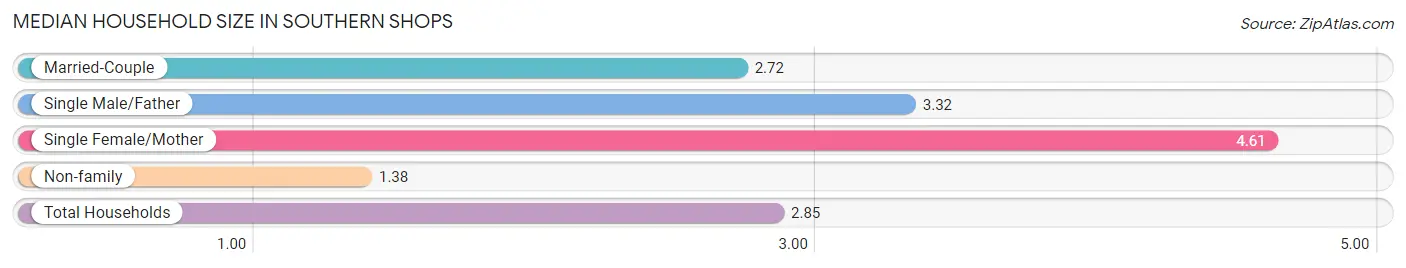
| Household Type | # Households | Household Size |
| Married-Couple | 518 (44.7%) | 2.72 |
| Single Male/Father | 95 (8.2%) | 3.32 |
| Single Female/Mother | 254 (21.9%) | 4.61 |
| Non-family | 291 (25.1%) | 1.38 |
| Total Households | 1,158 (100.0%) | 2.85 |
Household Size by Marriage Status in Southern Shops
Out of a total of 1,158 households in Southern Shops, 867 (74.9%) are family households, while 291 (25.1%) are nonfamily households. The most numerous type of family households are 2-person households, comprising 318, and the most common type of nonfamily households are 1-person households, comprising 236.
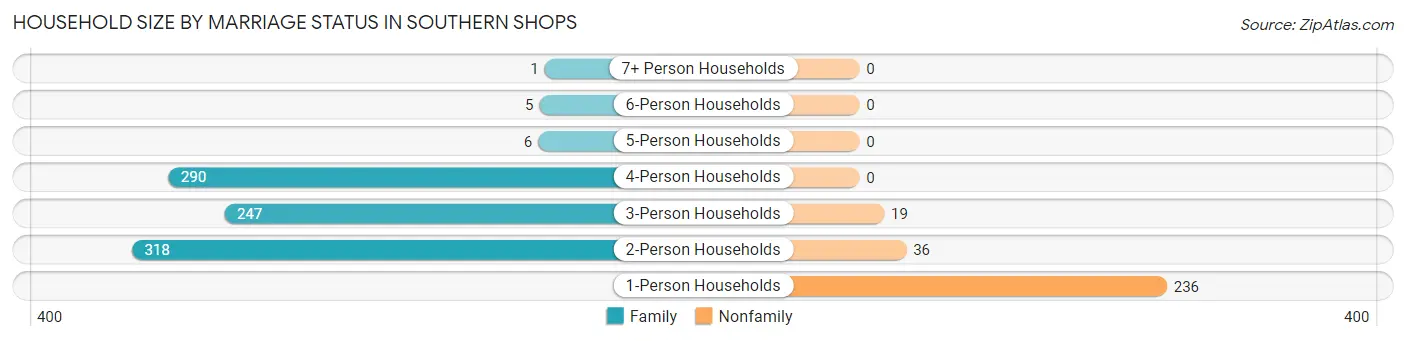
| Household Size | Family Households | Nonfamily Households |
| 1-Person Households | - | 236 (20.4%) |
| 2-Person Households | 318 (27.5%) | 36 (3.1%) |
| 3-Person Households | 247 (21.3%) | 19 (1.6%) |
| 4-Person Households | 290 (25.0%) | 0 (0.0%) |
| 5-Person Households | 6 (0.5%) | 0 (0.0%) |
| 6-Person Households | 5 (0.4%) | 0 (0.0%) |
| 7+ Person Households | 1 (0.1%) | 0 (0.0%) |
| Total | 867 (74.9%) | 291 (25.1%) |
Female Fertility in Southern Shops
Fertility by Age in Southern Shops
Average fertility rate in Southern Shops is 34.0 births per 1,000 women. Women in the age bracket of 35 to 50 years have the highest fertility rate with 42.0 births per 1,000 women. Women in the age bracket of 35 to 50 years acount for 55.0% of all women with births.
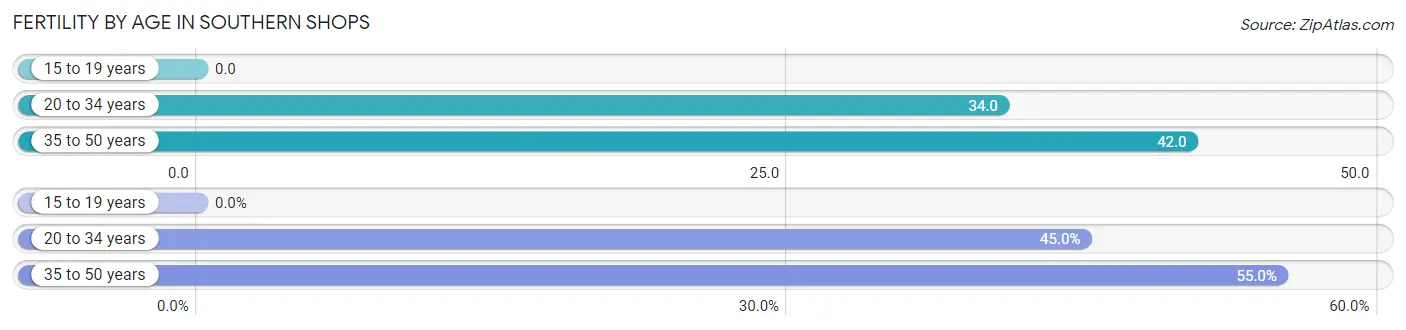
| Age Bracket | Women with Births | Births / 1,000 Women |
| 15 to 19 years | 0 (0.0%) | 0.0 |
| 20 to 34 years | 9 (45.0%) | 34.0 |
| 35 to 50 years | 11 (55.0%) | 42.0 |
| Total | 20 (100.0%) | 34.0 |
Fertility by Age by Marriage Status in Southern Shops
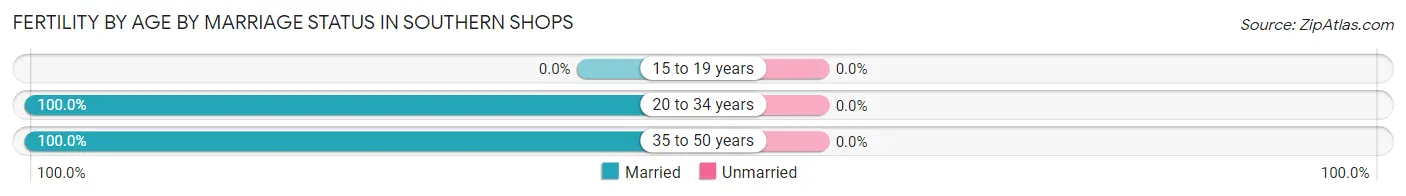
| Age Bracket | Married | Unmarried |
| 15 to 19 years | 0 (0.0%) | 0 (0.0%) |
| 20 to 34 years | 9 (100.0%) | 0 (0.0%) |
| 35 to 50 years | 11 (100.0%) | 0 (0.0%) |
| Total | 20 (100.0%) | 0 (0.0%) |
Fertility by Education in Southern Shops
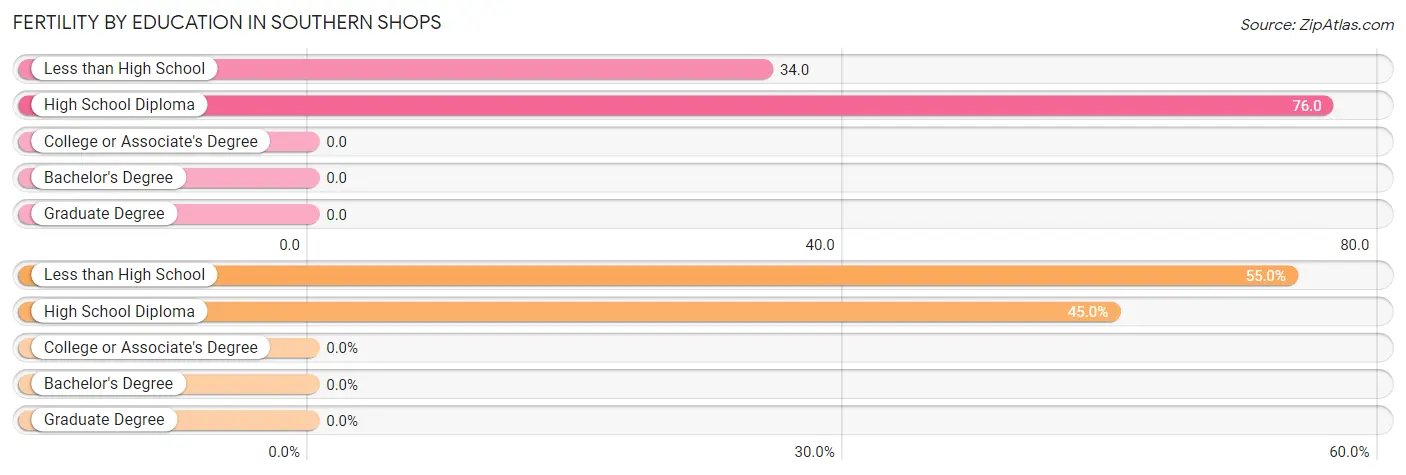
| Educational Attainment | Women with Births | Births / 1,000 Women |
| Less than High School | 11 (55.0%) | 34.0 |
| High School Diploma | 9 (45.0%) | 76.0 |
| College or Associate's Degree | 0 (0.0%) | 0.0 |
| Bachelor's Degree | 0 (0.0%) | 0.0 |
| Graduate Degree | 0 (0.0%) | 0.0 |
| Total | 20 (100.0%) | 34.0 |
Fertility by Education by Marriage Status in Southern Shops
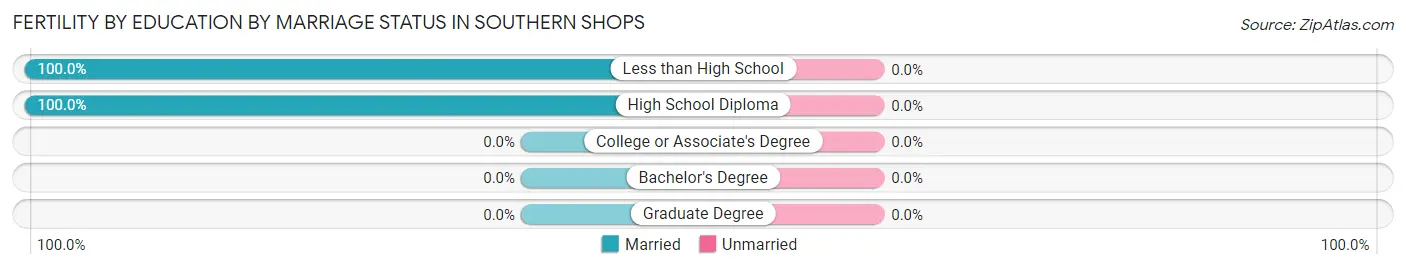
| Educational Attainment | Married | Unmarried |
| Less than High School | 11 (100.0%) | 0 (0.0%) |
| High School Diploma | 9 (100.0%) | 0 (0.0%) |
| College or Associate's Degree | 0 (0.0%) | 0 (0.0%) |
| Bachelor's Degree | 0 (0.0%) | 0 (0.0%) |
| Graduate Degree | 0 (0.0%) | 0 (0.0%) |
| Total | 20 (100.0%) | 0 (0.0%) |
Employment Characteristics in Southern Shops
Employment by Class of Employer in Southern Shops
Among the 1,729 employed individuals in Southern Shops, private company employees (1,613 | 93.3%), self-employed (not incorporated) (57 | 3.3%), and unpaid family workers (26 | 1.5%) make up the most common classes of employment.
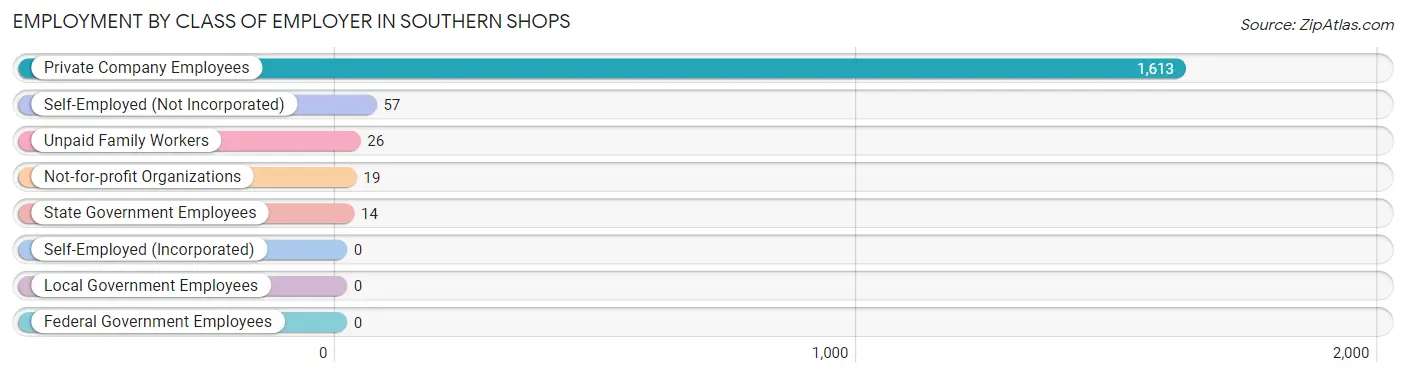
| Employer Class | # Employees | % Employees |
| Private Company Employees | 1,613 | 93.3% |
| Self-Employed (Incorporated) | 0 | 0.0% |
| Self-Employed (Not Incorporated) | 57 | 3.3% |
| Not-for-profit Organizations | 19 | 1.1% |
| Local Government Employees | 0 | 0.0% |
| State Government Employees | 14 | 0.8% |
| Federal Government Employees | 0 | 0.0% |
| Unpaid Family Workers | 26 | 1.5% |
| Total | 1,729 | 100.0% |
Employment Status by Age in Southern Shops
According to the labor force statistics for Southern Shops, out of the total population over 16 years of age (3,257), 57.3% or 1,866 individuals are in the labor force, with 6.3% or 118 of them unemployed. The age group with the highest labor force participation rate is 16 to 19 years, with 89.0% or 299 individuals in the labor force. Within the labor force, the 35 to 44 years age range has the highest percentage of unemployed individuals, with 18.8% or 70 of them being unemployed.
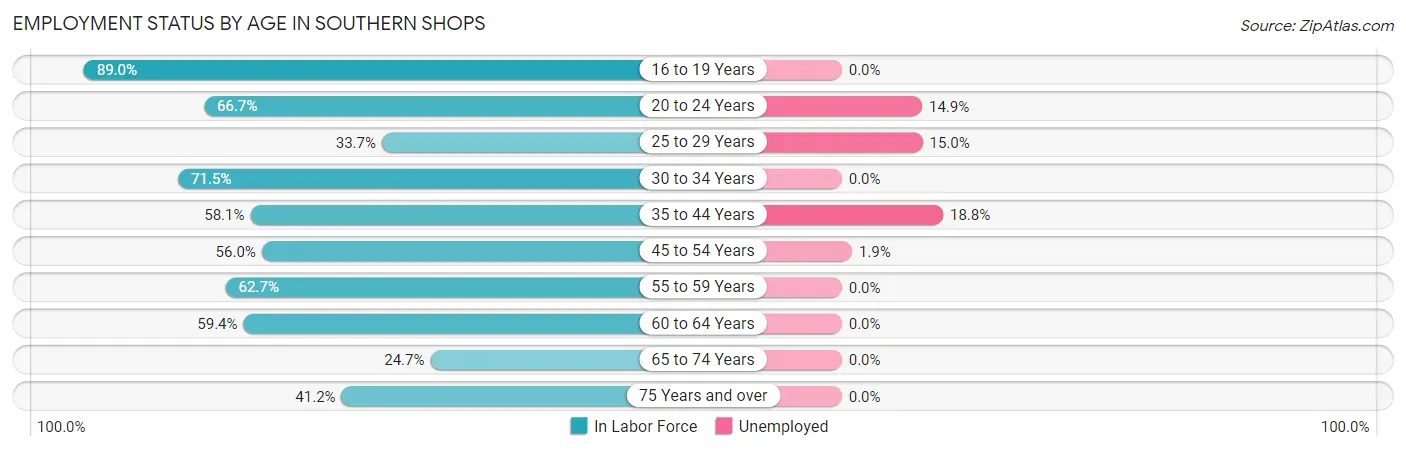
| Age Bracket | In Labor Force | Unemployed |
| 16 to 19 Years | 299 (89.0%) | 0 (0.0%) |
| 20 to 24 Years | 114 (66.7%) | 17 (14.9%) |
| 25 to 29 Years | 167 (33.7%) | 25 (15.0%) |
| 30 to 34 Years | 253 (71.5%) | 0 (0.0%) |
| 35 to 44 Years | 372 (58.1%) | 70 (18.8%) |
| 45 to 54 Years | 258 (56.0%) | 5 (1.9%) |
| 55 to 59 Years | 220 (62.7%) | 0 (0.0%) |
| 60 to 64 Years | 85 (59.4%) | 0 (0.0%) |
| 65 to 74 Years | 43 (24.7%) | 0 (0.0%) |
| 75 Years and over | 54 (41.2%) | 0 (0.0%) |
| Total | 1,866 (57.3%) | 118 (6.3%) |
Employment Status by Educational Attainment in Southern Shops
According to labor force statistics for Southern Shops, 55.4% of individuals (1,355) out of the total population between 25 and 64 years of age (2,445) are in the labor force, with 7.4% or 100 of them being unemployed. The group with the highest labor force participation rate are those with the educational attainment of bachelor's degree or higher, with 95.2% or 40 individuals in the labor force. Within the labor force, individuals with less than high school education have the highest percentage of unemployment, with 11.5% or 59 of them being unemployed.
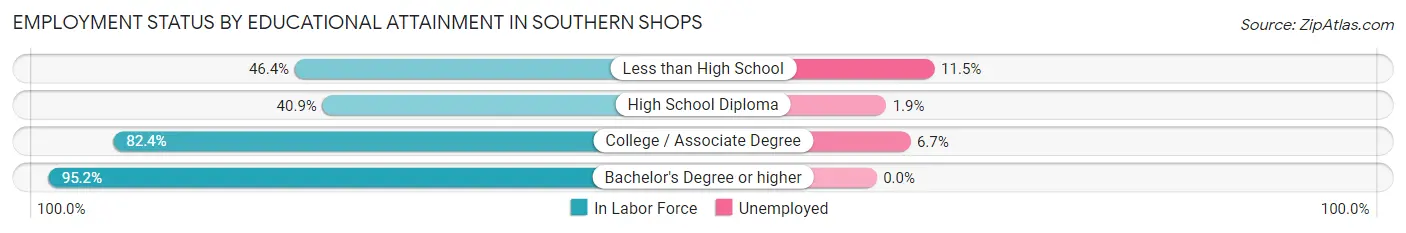
| Educational Attainment | In Labor Force | Unemployed |
| Less than High School | 512 (46.4%) | 127 (11.5%) |
| High School Diploma | 264 (40.9%) | 12 (1.9%) |
| College / Associate Degree | 539 (82.4%) | 44 (6.7%) |
| Bachelor's Degree or higher | 40 (95.2%) | 0 (0.0%) |
| Total | 1,355 (55.4%) | 181 (7.4%) |
Employment Occupations by Sex in Southern Shops
Management, Business, Science and Arts Occupations
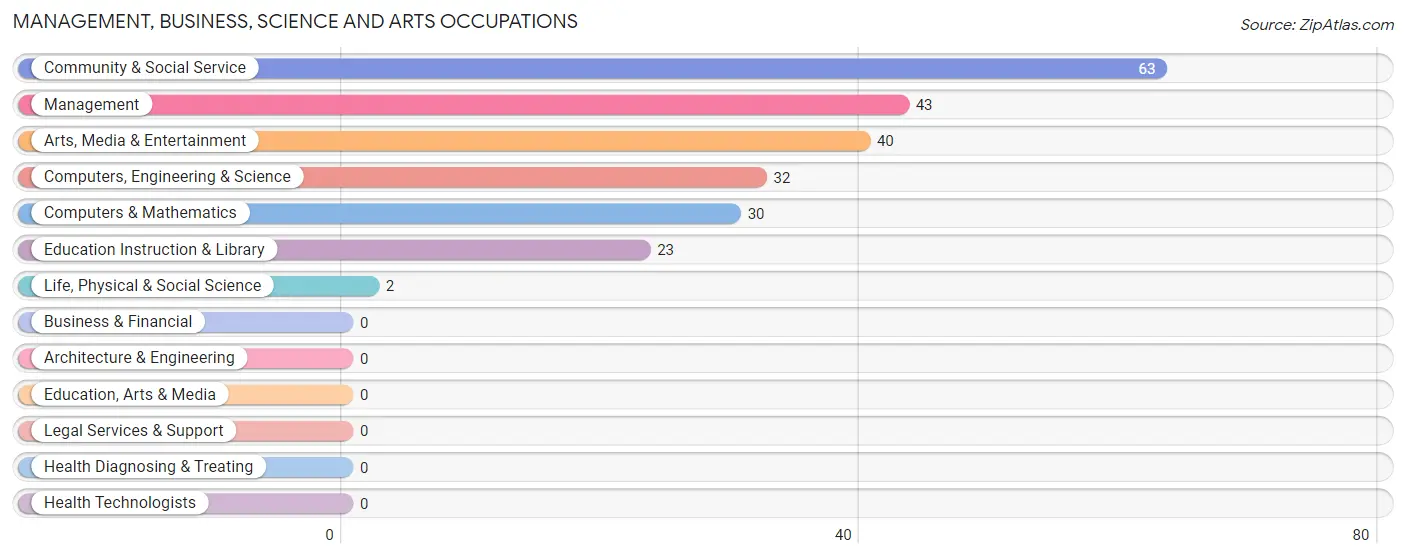
The most common Management, Business, Science and Arts occupations in Southern Shops are Community & Social Service (63 | 3.6%), Management (43 | 2.5%), Arts, Media & Entertainment (40 | 2.3%), Computers, Engineering & Science (32 | 1.8%), and Computers & Mathematics (30 | 1.7%).
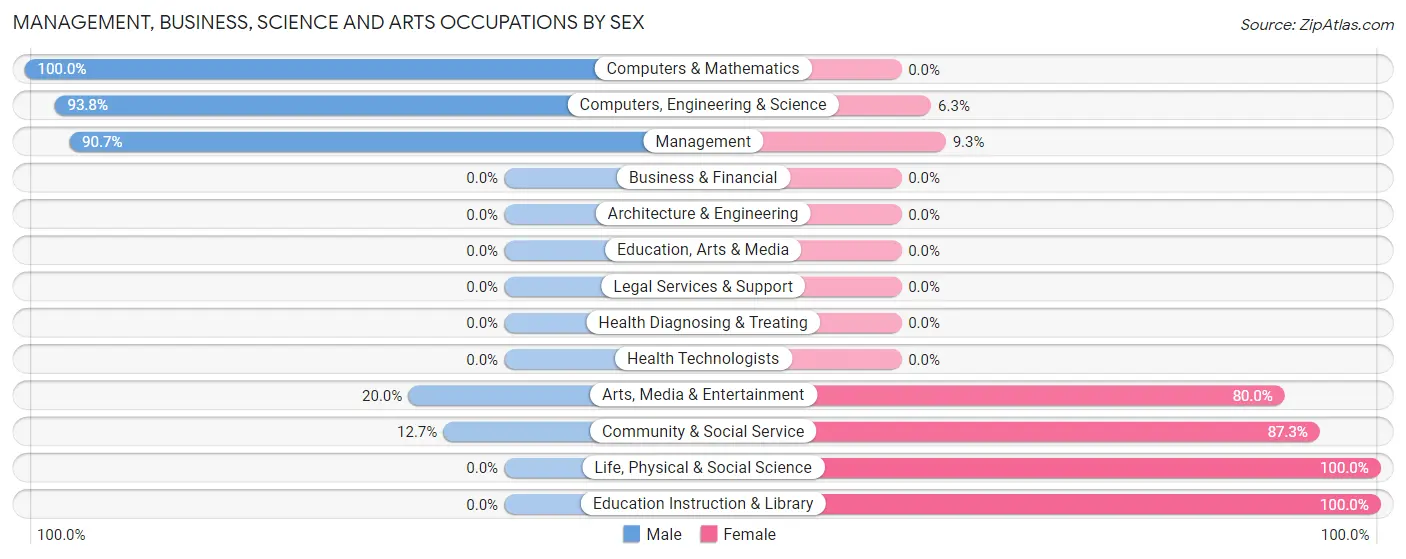
Management, Business, Science and Arts Occupations by Sex
Within the Management, Business, Science and Arts occupations in Southern Shops, the most male-oriented occupations are Computers & Mathematics (100.0%), Computers, Engineering & Science (93.8%), and Management (90.7%), while the most female-oriented occupations are Life, Physical & Social Science (100.0%), Education Instruction & Library (100.0%), and Community & Social Service (87.3%).
| Occupation | Male | Female |
| Management | 39 (90.7%) | 4 (9.3%) |
| Business & Financial | 0 (0.0%) | 0 (0.0%) |
| Computers, Engineering & Science | 30 (93.8%) | 2 (6.2%) |
| Computers & Mathematics | 30 (100.0%) | 0 (0.0%) |
| Architecture & Engineering | 0 (0.0%) | 0 (0.0%) |
| Life, Physical & Social Science | 0 (0.0%) | 2 (100.0%) |
| Community & Social Service | 8 (12.7%) | 55 (87.3%) |
| Education, Arts & Media | 0 (0.0%) | 0 (0.0%) |
| Legal Services & Support | 0 (0.0%) | 0 (0.0%) |
| Education Instruction & Library | 0 (0.0%) | 23 (100.0%) |
| Arts, Media & Entertainment | 8 (20.0%) | 32 (80.0%) |
| Health Diagnosing & Treating | 0 (0.0%) | 0 (0.0%) |
| Health Technologists | 0 (0.0%) | 0 (0.0%) |
| Total (Category) | 77 (55.8%) | 61 (44.2%) |
| Total (Overall) | 1,342 (76.8%) | 406 (23.2%) |
Services Occupations
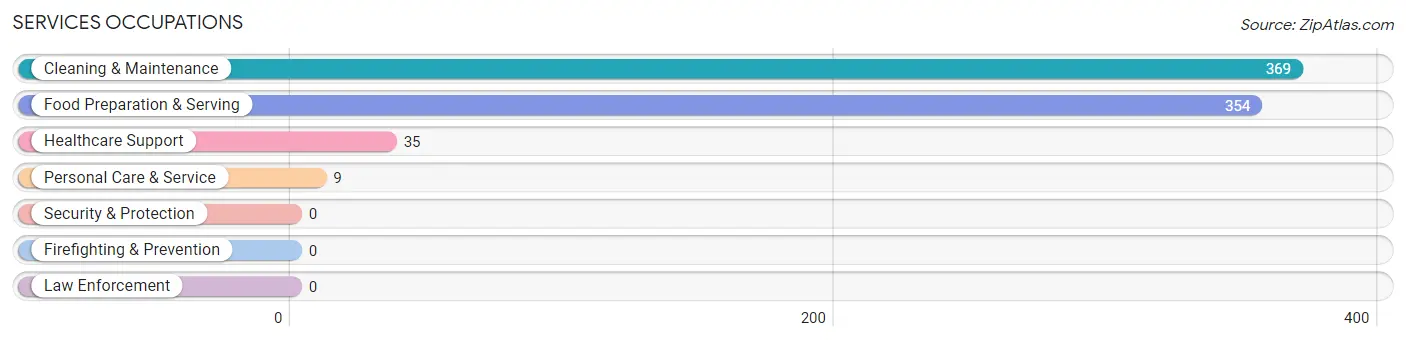
The most common Services occupations in Southern Shops are Cleaning & Maintenance (369 | 21.1%), Food Preparation & Serving (354 | 20.3%), Healthcare Support (35 | 2.0%), and Personal Care & Service (9 | 0.5%).
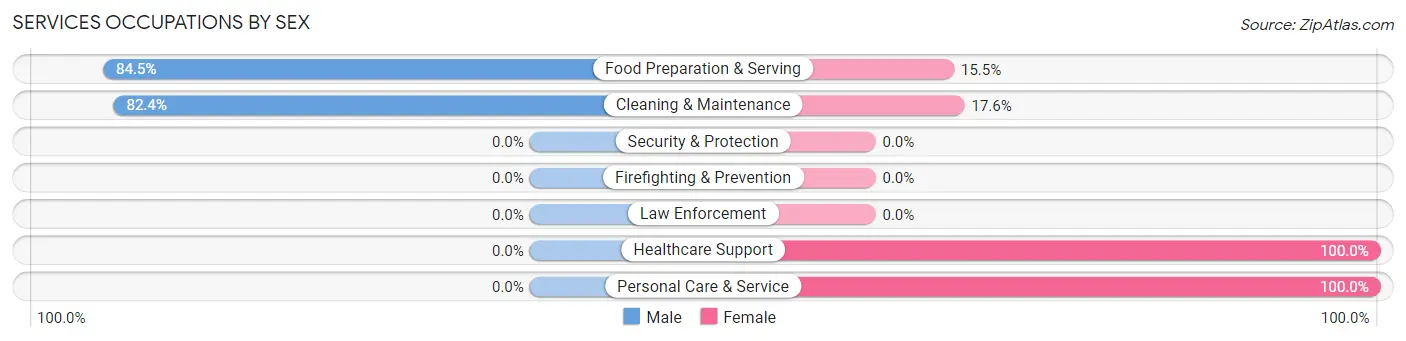
Services Occupations by Sex
Within the Services occupations in Southern Shops, the most male-oriented occupations are Food Preparation & Serving (84.5%), and Cleaning & Maintenance (82.4%), while the most female-oriented occupations are Healthcare Support (100.0%), Personal Care & Service (100.0%), and Cleaning & Maintenance (17.6%).
| Occupation | Male | Female |
| Healthcare Support | 0 (0.0%) | 35 (100.0%) |
| Security & Protection | 0 (0.0%) | 0 (0.0%) |
| Firefighting & Prevention | 0 (0.0%) | 0 (0.0%) |
| Law Enforcement | 0 (0.0%) | 0 (0.0%) |
| Food Preparation & Serving | 299 (84.5%) | 55 (15.5%) |
| Cleaning & Maintenance | 304 (82.4%) | 65 (17.6%) |
| Personal Care & Service | 0 (0.0%) | 9 (100.0%) |
| Total (Category) | 603 (78.6%) | 164 (21.4%) |
| Total (Overall) | 1,342 (76.8%) | 406 (23.2%) |
Sales and Office Occupations
The most common Sales and Office occupations in Southern Shops are Sales & Related (145 | 8.3%), and Office & Administration (28 | 1.6%).
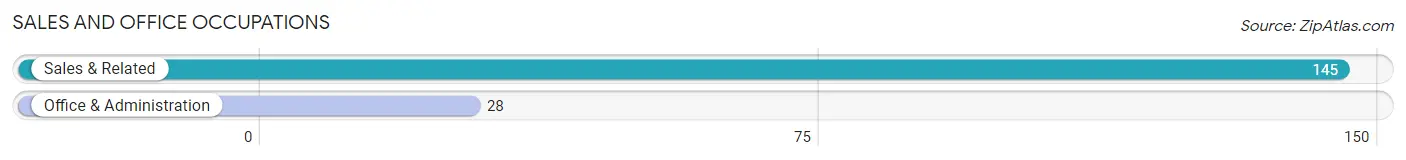
Sales and Office Occupations by Sex
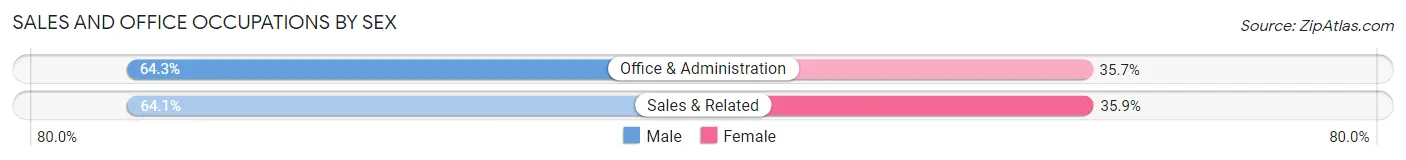
| Occupation | Male | Female |
| Sales & Related | 93 (64.1%) | 52 (35.9%) |
| Office & Administration | 18 (64.3%) | 10 (35.7%) |
| Total (Category) | 111 (64.2%) | 62 (35.8%) |
| Total (Overall) | 1,342 (76.8%) | 406 (23.2%) |
Natural Resources, Construction and Maintenance Occupations
The most common Natural Resources, Construction and Maintenance occupations in Southern Shops are Construction & Extraction (245 | 14.0%), and Installation, Maintenance & Repair (54 | 3.1%).
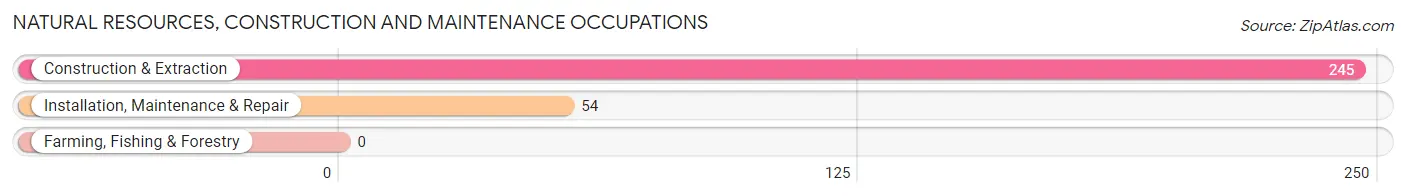
Natural Resources, Construction and Maintenance Occupations by Sex
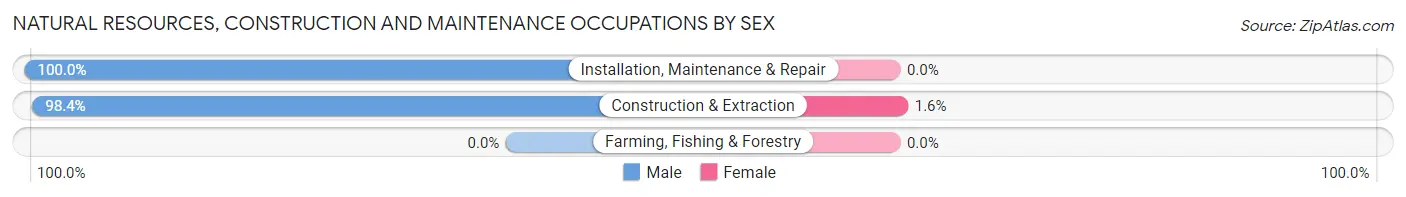
| Occupation | Male | Female |
| Farming, Fishing & Forestry | 0 (0.0%) | 0 (0.0%) |
| Construction & Extraction | 241 (98.4%) | 4 (1.6%) |
| Installation, Maintenance & Repair | 54 (100.0%) | 0 (0.0%) |
| Total (Category) | 295 (98.7%) | 4 (1.3%) |
| Total (Overall) | 1,342 (76.8%) | 406 (23.2%) |
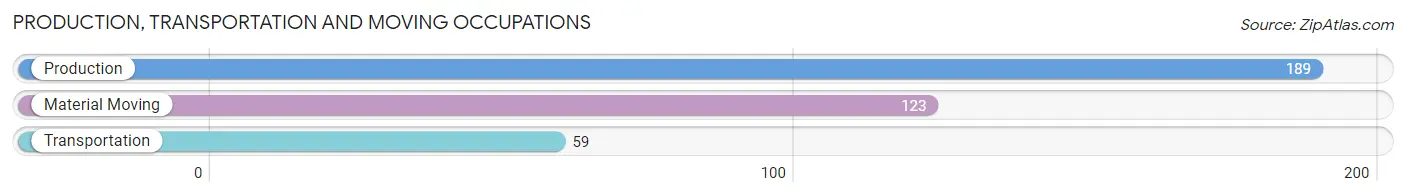
Production, Transportation and Moving Occupations
The most common Production, Transportation and Moving occupations in Southern Shops are Production (189 | 10.8%), Material Moving (123 | 7.0%), and Transportation (59 | 3.4%).
Production, Transportation and Moving Occupations by Sex
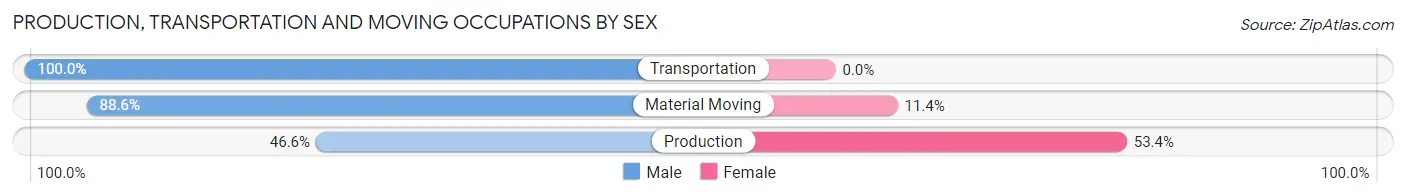
| Occupation | Male | Female |
| Production | 88 (46.6%) | 101 (53.4%) |
| Transportation | 59 (100.0%) | 0 (0.0%) |
| Material Moving | 109 (88.6%) | 14 (11.4%) |
| Total (Category) | 256 (69.0%) | 115 (31.0%) |
| Total (Overall) | 1,342 (76.8%) | 406 (23.2%) |
Employment Industries by Sex in Southern Shops
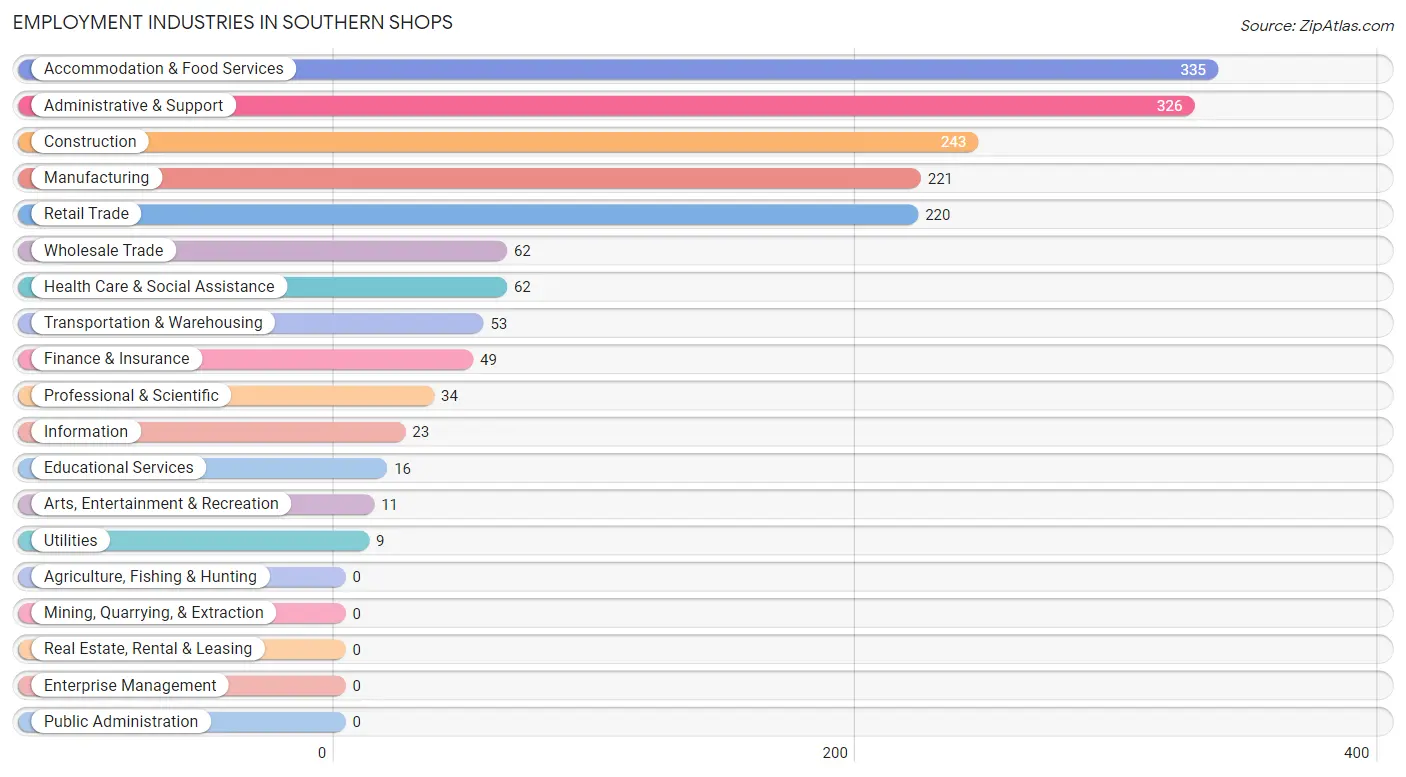
Employment Industries in Southern Shops
The major employment industries in Southern Shops include Accommodation & Food Services (335 | 19.2%), Administrative & Support (326 | 18.6%), Construction (243 | 13.9%), Manufacturing (221 | 12.6%), and Retail Trade (220 | 12.6%).
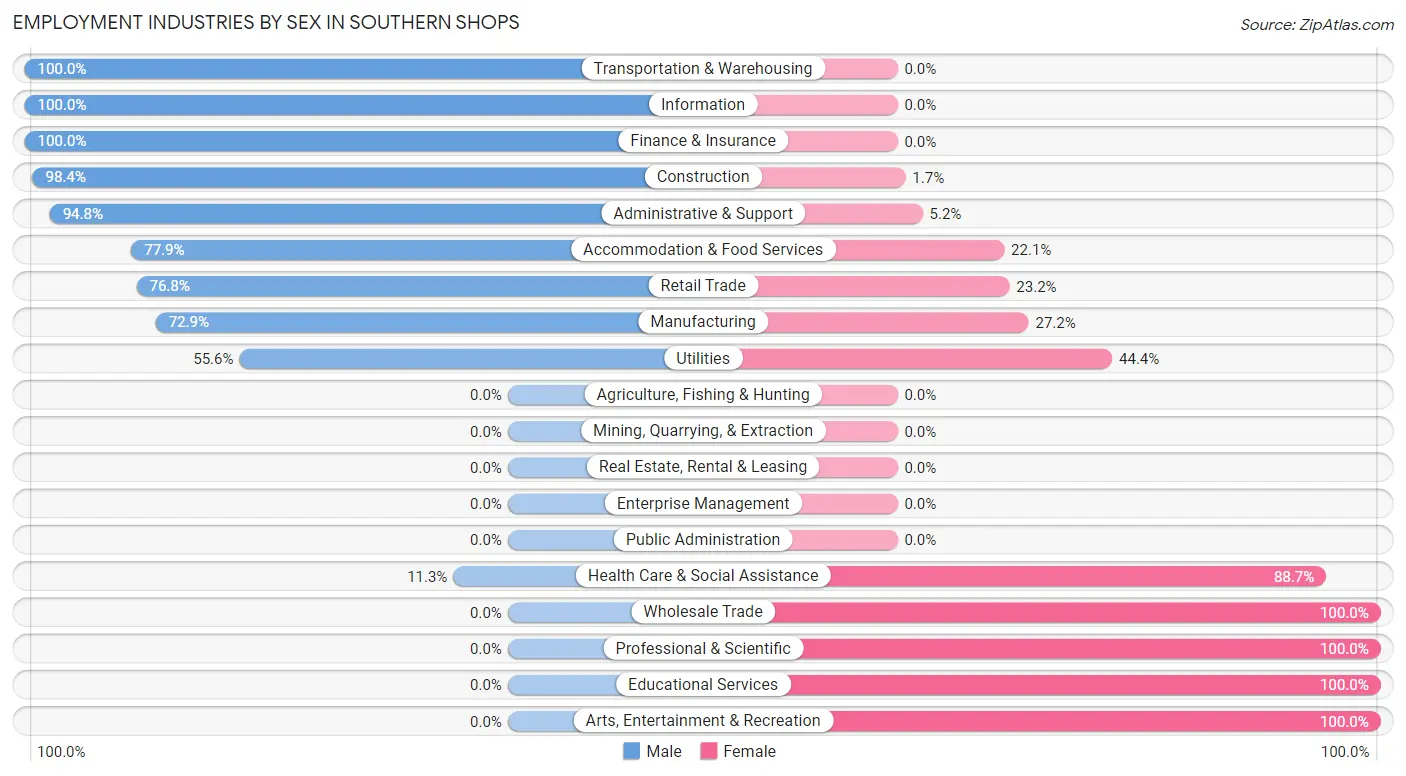
Employment Industries by Sex in Southern Shops
The Southern Shops industries that see more men than women are Transportation & Warehousing (100.0%), Information (100.0%), and Finance & Insurance (100.0%), whereas the industries that tend to have a higher number of women are Wholesale Trade (100.0%), Professional & Scientific (100.0%), and Educational Services (100.0%).
| Industry | Male | Female |
| Agriculture, Fishing & Hunting | 0 (0.0%) | 0 (0.0%) |
| Mining, Quarrying, & Extraction | 0 (0.0%) | 0 (0.0%) |
| Construction | 239 (98.4%) | 4 (1.7%) |
| Manufacturing | 161 (72.9%) | 60 (27.2%) |
| Wholesale Trade | 0 (0.0%) | 62 (100.0%) |
| Retail Trade | 169 (76.8%) | 51 (23.2%) |
| Transportation & Warehousing | 53 (100.0%) | 0 (0.0%) |
| Utilities | 5 (55.6%) | 4 (44.4%) |
| Information | 23 (100.0%) | 0 (0.0%) |
| Finance & Insurance | 49 (100.0%) | 0 (0.0%) |
| Real Estate, Rental & Leasing | 0 (0.0%) | 0 (0.0%) |
| Professional & Scientific | 0 (0.0%) | 34 (100.0%) |
| Enterprise Management | 0 (0.0%) | 0 (0.0%) |
| Administrative & Support | 309 (94.8%) | 17 (5.2%) |
| Educational Services | 0 (0.0%) | 16 (100.0%) |
| Health Care & Social Assistance | 7 (11.3%) | 55 (88.7%) |
| Arts, Entertainment & Recreation | 0 (0.0%) | 11 (100.0%) |
| Accommodation & Food Services | 261 (77.9%) | 74 (22.1%) |
| Public Administration | 0 (0.0%) | 0 (0.0%) |
| Total | 1,342 (76.8%) | 406 (23.2%) |
Education in Southern Shops
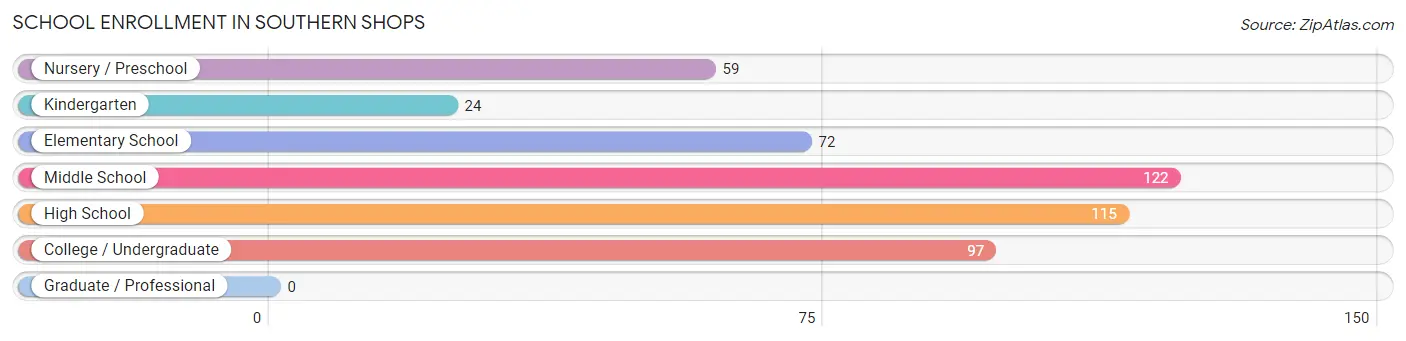
School Enrollment in Southern Shops
The most common levels of schooling among the 489 students in Southern Shops are middle school (122 | 24.9%), high school (115 | 23.5%), and college / undergraduate (97 | 19.8%).
| School Level | # Students | % Students |
| Nursery / Preschool | 59 | 12.1% |
| Kindergarten | 24 | 4.9% |
| Elementary School | 72 | 14.7% |
| Middle School | 122 | 24.9% |
| High School | 115 | 23.5% |
| College / Undergraduate | 97 | 19.8% |
| Graduate / Professional | 0 | 0.0% |
| Total | 489 | 100.0% |
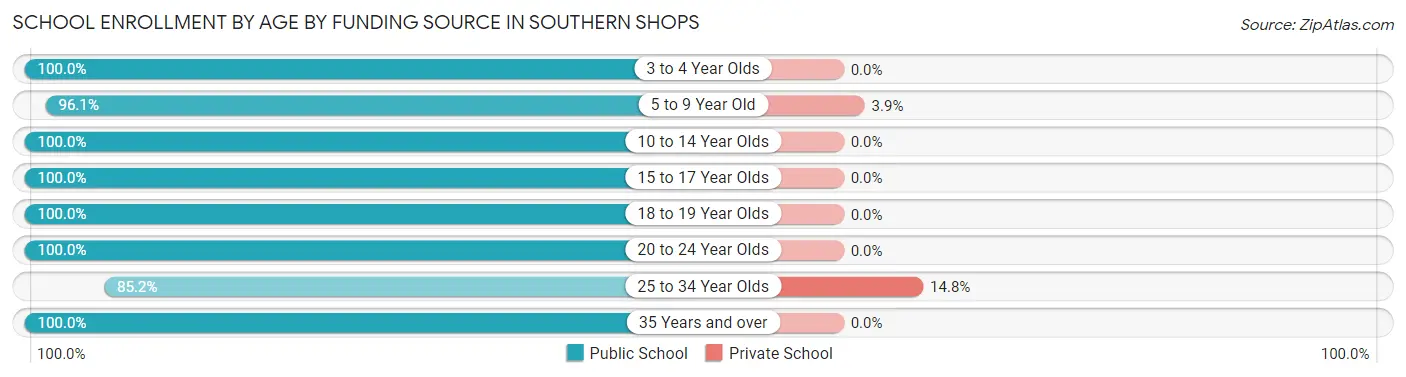
School Enrollment by Age by Funding Source in Southern Shops
Out of a total of 489 students who are enrolled in schools in Southern Shops, 9 (1.8%) attend a private institution, while the remaining 480 (98.2%) are enrolled in public schools. The age group of 25 to 34 year olds has the highest likelihood of being enrolled in private schools, with 4 (14.8% in the age bracket) enrolled. Conversely, the age group of 3 to 4 year olds has the lowest likelihood of being enrolled in a private school, with 27 (100.0% in the age bracket) attending a public institution.
| Age Bracket | Public School | Private School |
| 3 to 4 Year Olds | 27 (100.0%) | 0 (0.0%) |
| 5 to 9 Year Old | 123 (96.1%) | 5 (3.9%) |
| 10 to 14 Year Olds | 94 (100.0%) | 0 (0.0%) |
| 15 to 17 Year Olds | 57 (100.0%) | 0 (0.0%) |
| 18 to 19 Year Olds | 20 (100.0%) | 0 (0.0%) |
| 20 to 24 Year Olds | 70 (100.0%) | 0 (0.0%) |
| 25 to 34 Year Olds | 23 (85.2%) | 4 (14.8%) |
| 35 Years and over | 66 (100.0%) | 0 (0.0%) |
| Total | 480 (98.2%) | 9 (1.8%) |
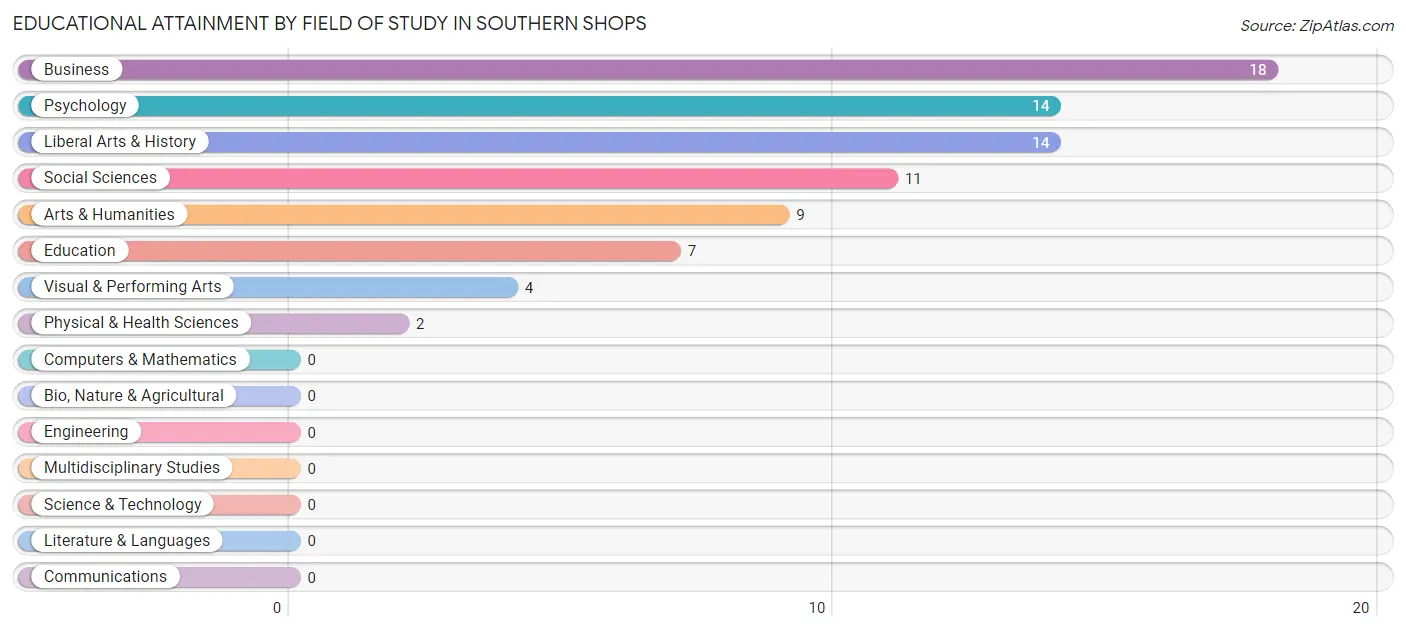
Educational Attainment by Field of Study in Southern Shops
Business (18 | 22.8%), psychology (14 | 17.7%), liberal arts & history (14 | 17.7%), social sciences (11 | 13.9%), and arts & humanities (9 | 11.4%) are the most common fields of study among 79 individuals in Southern Shops who have obtained a bachelor's degree or higher.
| Field of Study | # Graduates | % Graduates |
| Computers & Mathematics | 0 | 0.0% |
| Bio, Nature & Agricultural | 0 | 0.0% |
| Physical & Health Sciences | 2 | 2.5% |
| Psychology | 14 | 17.7% |
| Social Sciences | 11 | 13.9% |
| Engineering | 0 | 0.0% |
| Multidisciplinary Studies | 0 | 0.0% |
| Science & Technology | 0 | 0.0% |
| Business | 18 | 22.8% |
| Education | 7 | 8.9% |
| Literature & Languages | 0 | 0.0% |
| Liberal Arts & History | 14 | 17.7% |
| Visual & Performing Arts | 4 | 5.1% |
| Communications | 0 | 0.0% |
| Arts & Humanities | 9 | 11.4% |
| Total | 79 | 100.0% |
Transportation & Commute in Southern Shops
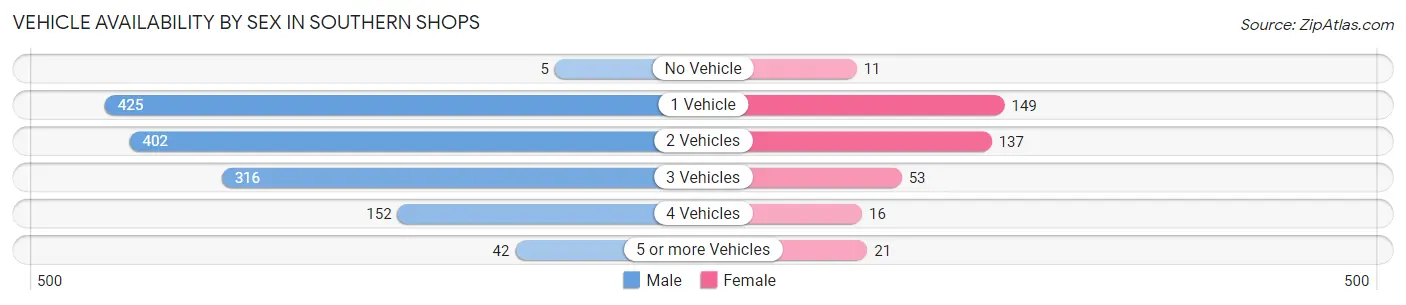
Vehicle Availability by Sex in Southern Shops
The most prevalent vehicle ownership categories in Southern Shops are males with 1 vehicle (425, accounting for 31.7%) and females with 1 vehicle (149, making up 109.8%).
| Vehicles Available | Male | Female |
| No Vehicle | 5 (0.4%) | 11 (2.8%) |
| 1 Vehicle | 425 (31.7%) | 149 (38.5%) |
| 2 Vehicles | 402 (30.0%) | 137 (35.4%) |
| 3 Vehicles | 316 (23.5%) | 53 (13.7%) |
| 4 Vehicles | 152 (11.3%) | 16 (4.1%) |
| 5 or more Vehicles | 42 (3.1%) | 21 (5.4%) |
| Total | 1,342 (100.0%) | 387 (100.0%) |
Commute Time in Southern Shops
The most frequently occuring commute durations in Southern Shops are 15 to 19 minutes (452 commuters, 26.3%), 20 to 24 minutes (427 commuters, 24.8%), and 10 to 14 minutes (298 commuters, 17.3%).
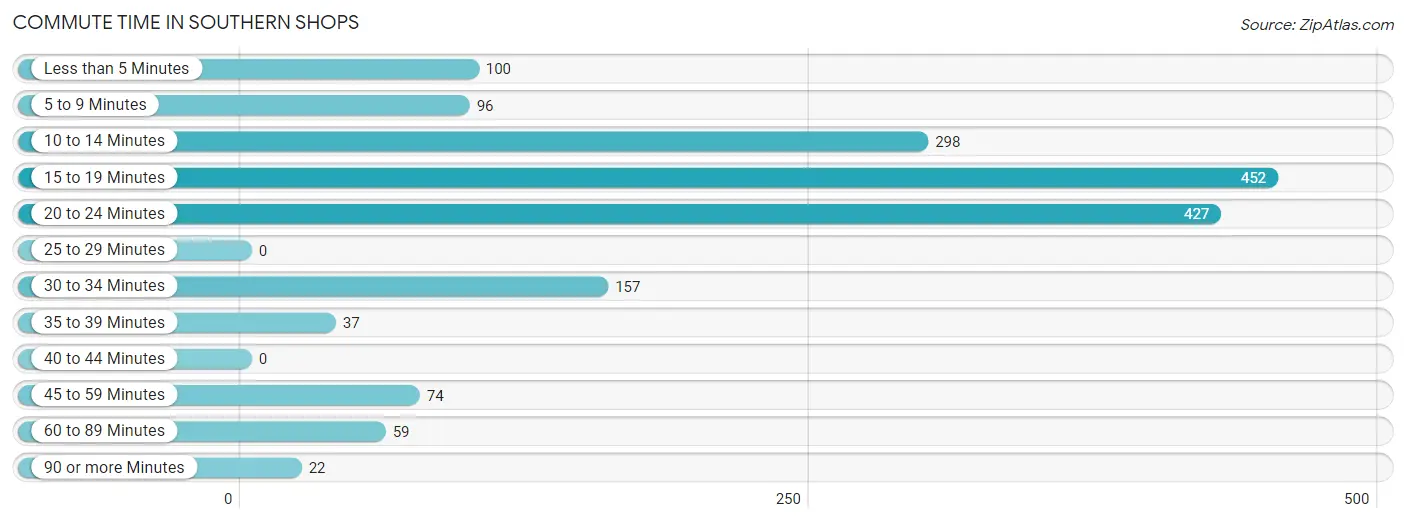
| Commute Time | # Commuters | % Commuters |
| Less than 5 Minutes | 100 | 5.8% |
| 5 to 9 Minutes | 96 | 5.6% |
| 10 to 14 Minutes | 298 | 17.3% |
| 15 to 19 Minutes | 452 | 26.3% |
| 20 to 24 Minutes | 427 | 24.8% |
| 25 to 29 Minutes | 0 | 0.0% |
| 30 to 34 Minutes | 157 | 9.1% |
| 35 to 39 Minutes | 37 | 2.1% |
| 40 to 44 Minutes | 0 | 0.0% |
| 45 to 59 Minutes | 74 | 4.3% |
| 60 to 89 Minutes | 59 | 3.4% |
| 90 or more Minutes | 22 | 1.3% |
Commute Time by Sex in Southern Shops
The most common commute times in Southern Shops are 20 to 24 minutes (366 commuters, 27.4%) for males and 10 to 14 minutes (130 commuters, 33.8%) for females.
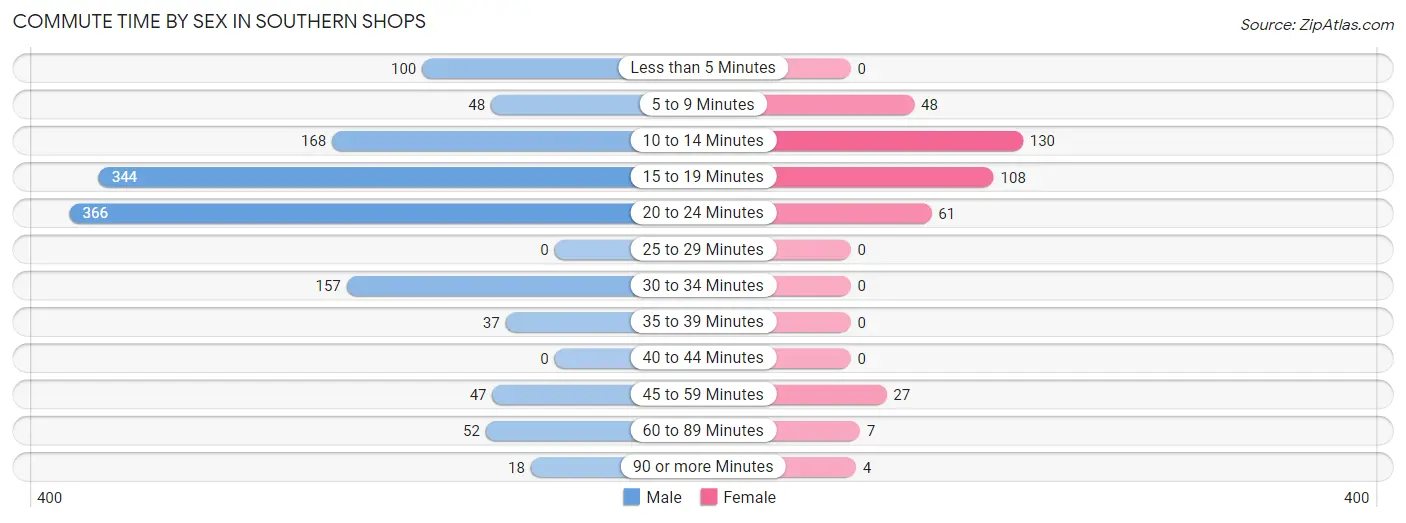
| Commute Time | Male | Female |
| Less than 5 Minutes | 100 (7.5%) | 0 (0.0%) |
| 5 to 9 Minutes | 48 (3.6%) | 48 (12.5%) |
| 10 to 14 Minutes | 168 (12.6%) | 130 (33.8%) |
| 15 to 19 Minutes | 344 (25.7%) | 108 (28.1%) |
| 20 to 24 Minutes | 366 (27.4%) | 61 (15.8%) |
| 25 to 29 Minutes | 0 (0.0%) | 0 (0.0%) |
| 30 to 34 Minutes | 157 (11.7%) | 0 (0.0%) |
| 35 to 39 Minutes | 37 (2.8%) | 0 (0.0%) |
| 40 to 44 Minutes | 0 (0.0%) | 0 (0.0%) |
| 45 to 59 Minutes | 47 (3.5%) | 27 (7.0%) |
| 60 to 89 Minutes | 52 (3.9%) | 7 (1.8%) |
| 90 or more Minutes | 18 (1.3%) | 4 (1.0%) |
Time of Departure to Work by Sex in Southern Shops
The most frequent times of departure to work in Southern Shops are 6:00 AM to 6:29 AM (435, 32.5%) for males and 8:00 AM to 8:29 AM (65, 16.9%) for females.
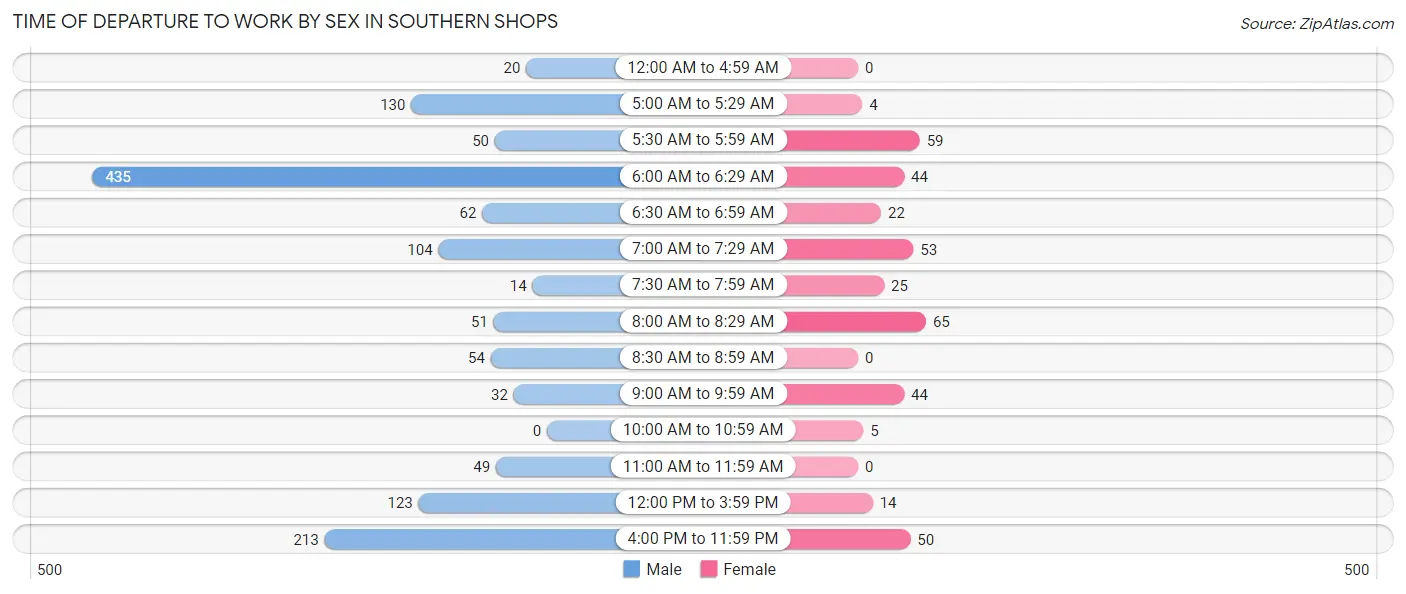
| Time of Departure | Male | Female |
| 12:00 AM to 4:59 AM | 20 (1.5%) | 0 (0.0%) |
| 5:00 AM to 5:29 AM | 130 (9.7%) | 4 (1.0%) |
| 5:30 AM to 5:59 AM | 50 (3.7%) | 59 (15.3%) |
| 6:00 AM to 6:29 AM | 435 (32.5%) | 44 (11.4%) |
| 6:30 AM to 6:59 AM | 62 (4.6%) | 22 (5.7%) |
| 7:00 AM to 7:29 AM | 104 (7.8%) | 53 (13.8%) |
| 7:30 AM to 7:59 AM | 14 (1.1%) | 25 (6.5%) |
| 8:00 AM to 8:29 AM | 51 (3.8%) | 65 (16.9%) |
| 8:30 AM to 8:59 AM | 54 (4.0%) | 0 (0.0%) |
| 9:00 AM to 9:59 AM | 32 (2.4%) | 44 (11.4%) |
| 10:00 AM to 10:59 AM | 0 (0.0%) | 5 (1.3%) |
| 11:00 AM to 11:59 AM | 49 (3.7%) | 0 (0.0%) |
| 12:00 PM to 3:59 PM | 123 (9.2%) | 14 (3.6%) |
| 4:00 PM to 11:59 PM | 213 (15.9%) | 50 (13.0%) |
| Total | 1,337 (100.0%) | 385 (100.0%) |
Housing Occupancy in Southern Shops
Occupancy by Ownership in Southern Shops
Of the total 1,158 dwellings in Southern Shops, owner-occupied units account for 517 (44.7%), while renter-occupied units make up 641 (55.3%).
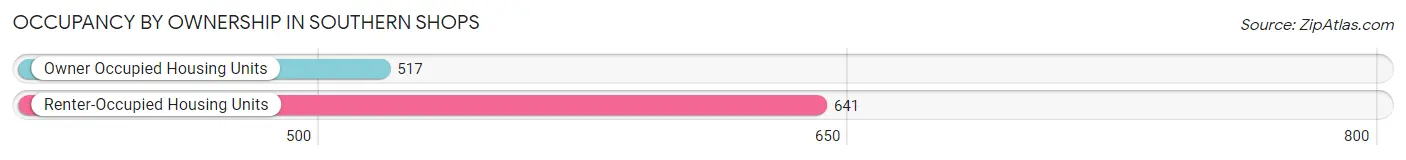
| Occupancy | # Housing Units | % Housing Units |
| Owner Occupied Housing Units | 517 | 44.7% |
| Renter-Occupied Housing Units | 641 | 55.3% |
| Total Occupied Housing Units | 1,158 | 100.0% |
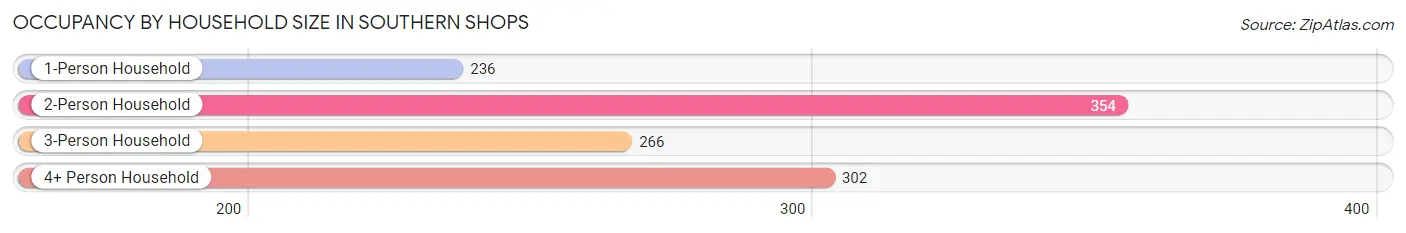
Occupancy by Household Size in Southern Shops
| Household Size | # Housing Units | % Housing Units |
| 1-Person Household | 236 | 20.4% |
| 2-Person Household | 354 | 30.6% |
| 3-Person Household | 266 | 23.0% |
| 4+ Person Household | 302 | 26.1% |
| Total Housing Units | 1,158 | 100.0% |
Occupancy by Ownership by Household Size in Southern Shops
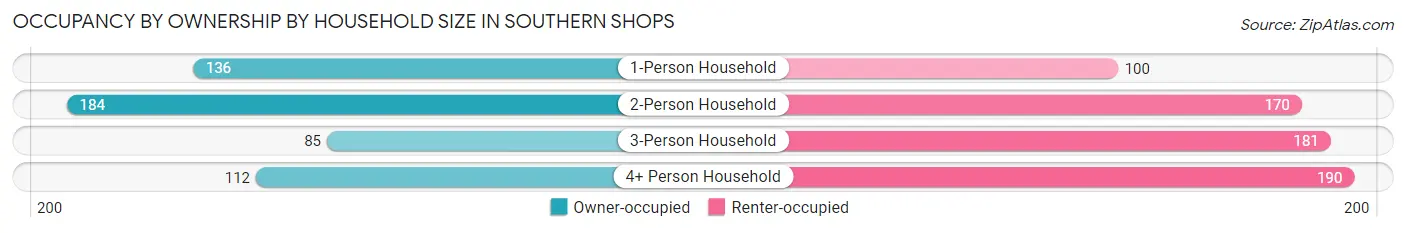
| Household Size | Owner-occupied | Renter-occupied |
| 1-Person Household | 136 (57.6%) | 100 (42.4%) |
| 2-Person Household | 184 (52.0%) | 170 (48.0%) |
| 3-Person Household | 85 (32.0%) | 181 (68.0%) |
| 4+ Person Household | 112 (37.1%) | 190 (62.9%) |
| Total Housing Units | 517 (44.7%) | 641 (55.3%) |
Occupancy by Educational Attainment in Southern Shops
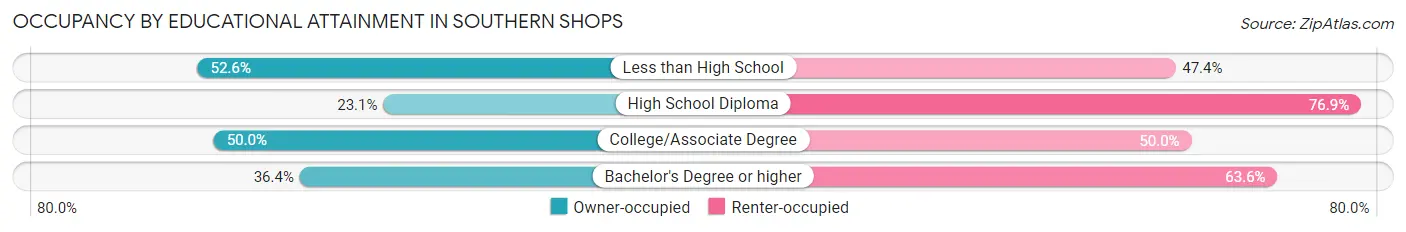
| Household Size | Owner-occupied | Renter-occupied |
| Less than High School | 277 (52.6%) | 250 (47.4%) |
| High School Diploma | 61 (23.1%) | 203 (76.9%) |
| College/Associate Degree | 167 (50.0%) | 167 (50.0%) |
| Bachelor's Degree or higher | 12 (36.4%) | 21 (63.6%) |
Occupancy by Age of Householder in Southern Shops
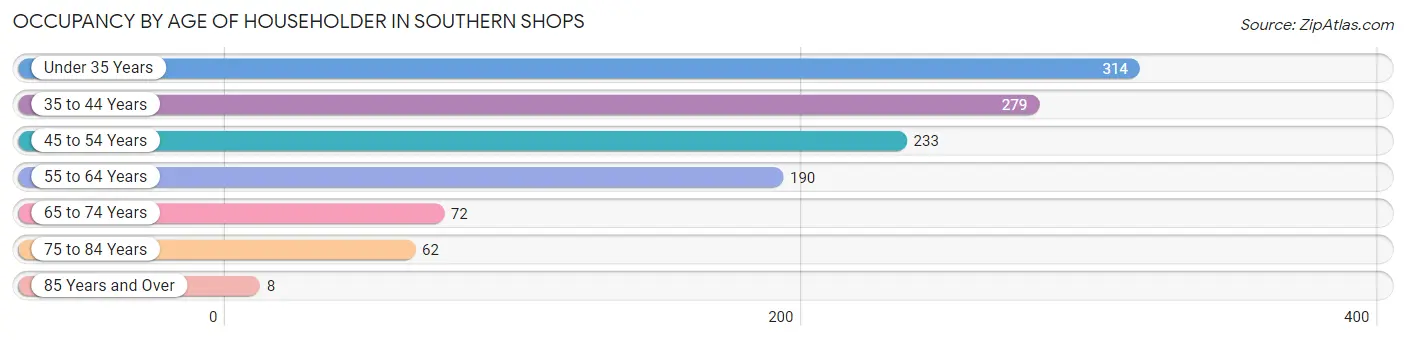
| Age Bracket | # Households | % Households |
| Under 35 Years | 314 | 27.1% |
| 35 to 44 Years | 279 | 24.1% |
| 45 to 54 Years | 233 | 20.1% |
| 55 to 64 Years | 190 | 16.4% |
| 65 to 74 Years | 72 | 6.2% |
| 75 to 84 Years | 62 | 5.3% |
| 85 Years and Over | 8 | 0.7% |
| Total | 1,158 | 100.0% |
Housing Finances in Southern Shops
Median Income by Occupancy in Southern Shops
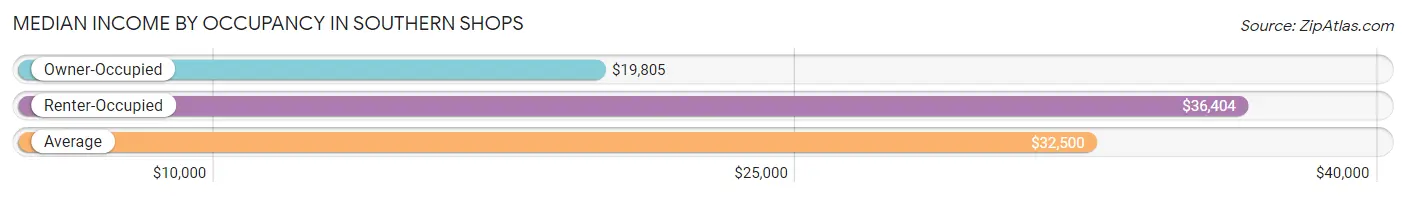
| Occupancy Type | # Households | Median Income |
| Owner-Occupied | 517 (44.7%) | $19,805 |
| Renter-Occupied | 641 (55.3%) | $36,404 |
| Average | 1,158 (100.0%) | $32,500 |
Occupancy by Householder Income Bracket in Southern Shops
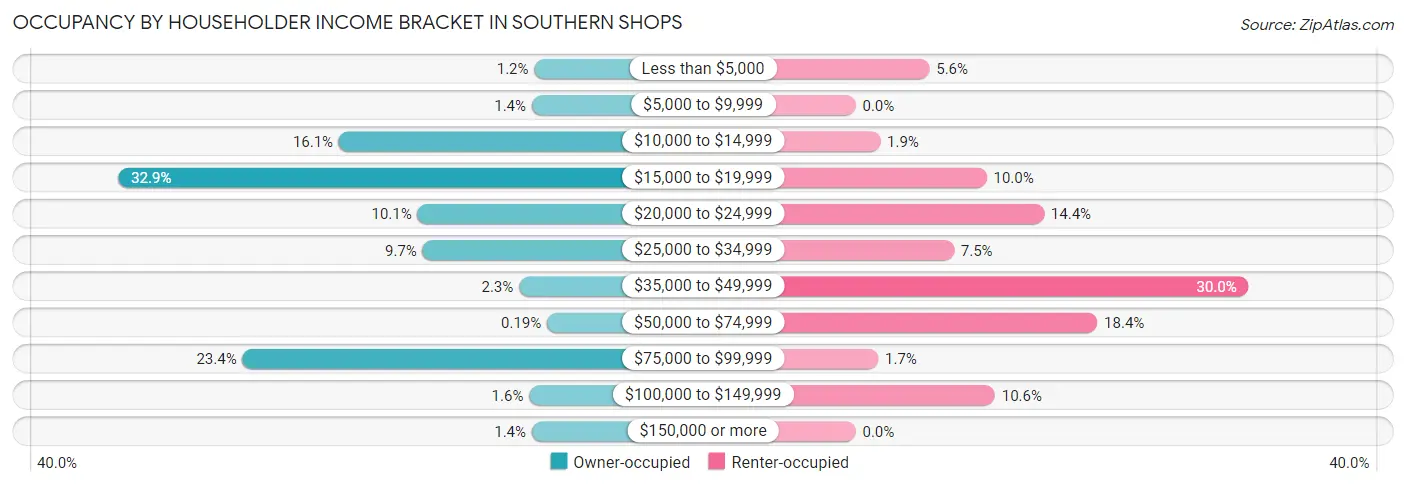
| Income Bracket | Owner-occupied | Renter-occupied |
| Less than $5,000 | 6 (1.2%) | 36 (5.6%) |
| $5,000 to $9,999 | 7 (1.3%) | 0 (0.0%) |
| $10,000 to $14,999 | 83 (16.1%) | 12 (1.9%) |
| $15,000 to $19,999 | 170 (32.9%) | 64 (10.0%) |
| $20,000 to $24,999 | 52 (10.1%) | 92 (14.3%) |
| $25,000 to $34,999 | 50 (9.7%) | 48 (7.5%) |
| $35,000 to $49,999 | 12 (2.3%) | 192 (29.9%) |
| $50,000 to $74,999 | 1 (0.2%) | 118 (18.4%) |
| $75,000 to $99,999 | 121 (23.4%) | 11 (1.7%) |
| $100,000 to $149,999 | 8 (1.5%) | 68 (10.6%) |
| $150,000 or more | 7 (1.3%) | 0 (0.0%) |
| Total | 517 (100.0%) | 641 (100.0%) |
Monthly Housing Cost Tiers in Southern Shops
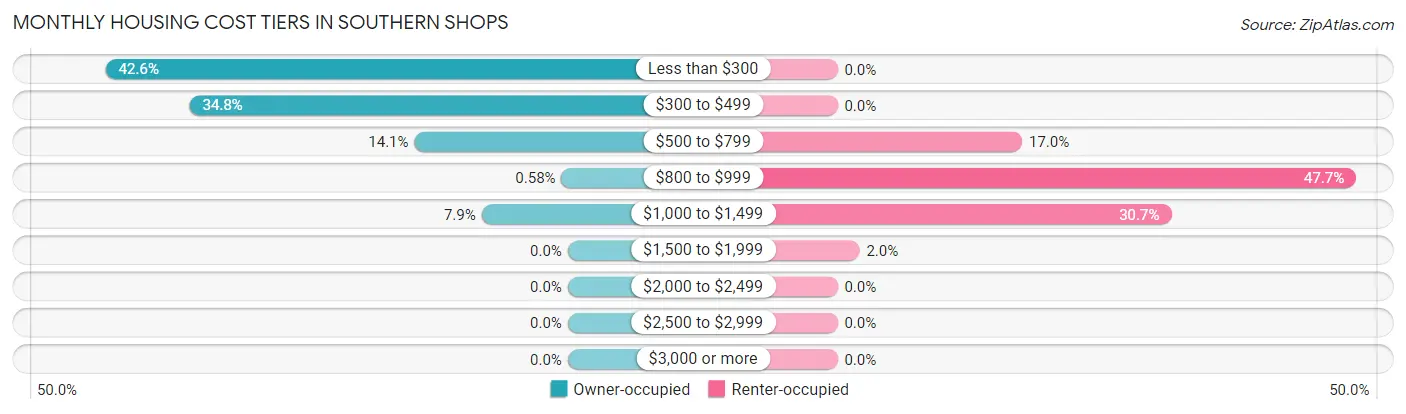
| Monthly Cost | Owner-occupied | Renter-occupied |
| Less than $300 | 220 (42.5%) | 0 (0.0%) |
| $300 to $499 | 180 (34.8%) | 0 (0.0%) |
| $500 to $799 | 73 (14.1%) | 109 (17.0%) |
| $800 to $999 | 3 (0.6%) | 306 (47.7%) |
| $1,000 to $1,499 | 41 (7.9%) | 197 (30.7%) |
| $1,500 to $1,999 | 0 (0.0%) | 13 (2.0%) |
| $2,000 to $2,499 | 0 (0.0%) | 0 (0.0%) |
| $2,500 to $2,999 | 0 (0.0%) | 0 (0.0%) |
| $3,000 or more | 0 (0.0%) | 0 (0.0%) |
| Total | 517 (100.0%) | 641 (100.0%) |
Physical Housing Characteristics in Southern Shops
Housing Structures in Southern Shops
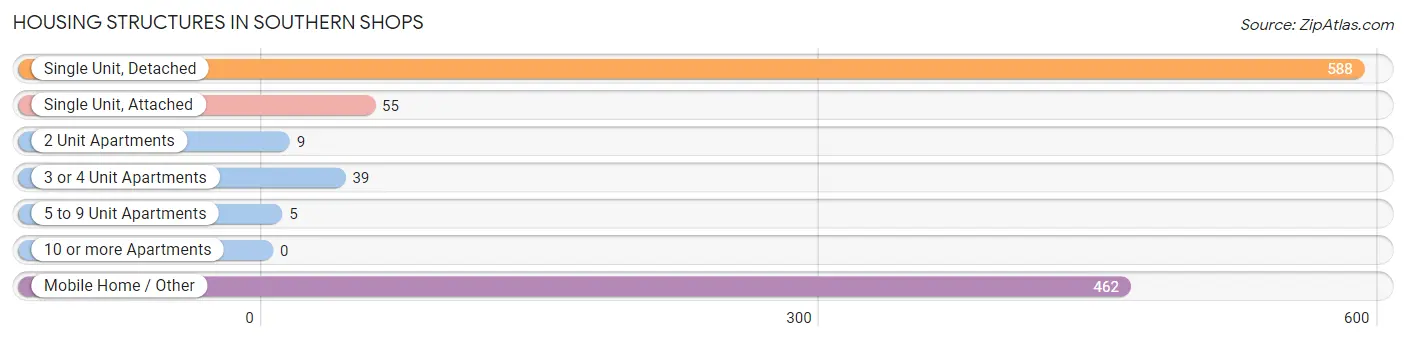
| Structure Type | # Housing Units | % Housing Units |
| Single Unit, Detached | 588 | 50.8% |
| Single Unit, Attached | 55 | 4.8% |
| 2 Unit Apartments | 9 | 0.8% |
| 3 or 4 Unit Apartments | 39 | 3.4% |
| 5 to 9 Unit Apartments | 5 | 0.4% |
| 10 or more Apartments | 0 | 0.0% |
| Mobile Home / Other | 462 | 39.9% |
| Total | 1,158 | 100.0% |
Housing Structures by Occupancy in Southern Shops
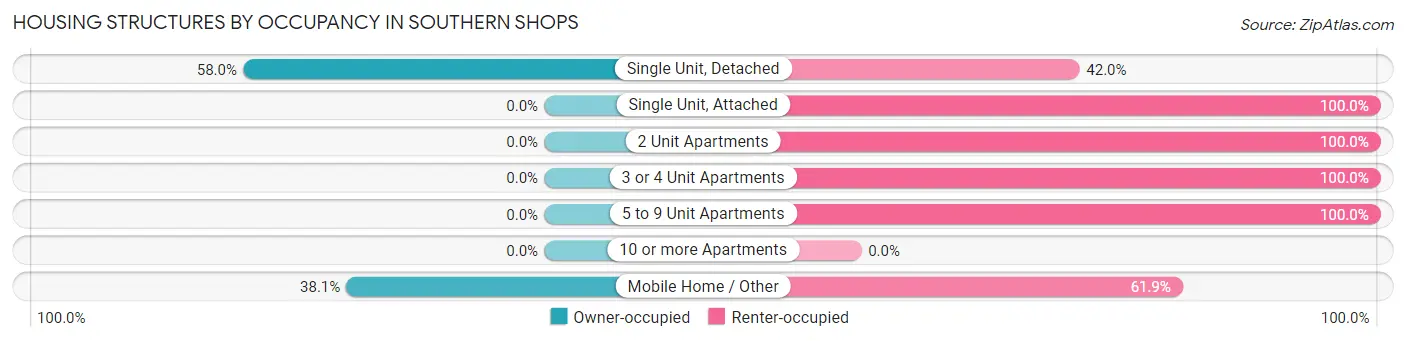
| Structure Type | Owner-occupied | Renter-occupied |
| Single Unit, Detached | 341 (58.0%) | 247 (42.0%) |
| Single Unit, Attached | 0 (0.0%) | 55 (100.0%) |
| 2 Unit Apartments | 0 (0.0%) | 9 (100.0%) |
| 3 or 4 Unit Apartments | 0 (0.0%) | 39 (100.0%) |
| 5 to 9 Unit Apartments | 0 (0.0%) | 5 (100.0%) |
| 10 or more Apartments | 0 (0.0%) | 0 (0.0%) |
| Mobile Home / Other | 176 (38.1%) | 286 (61.9%) |
| Total | 517 (44.7%) | 641 (55.3%) |
Housing Structures by Number of Rooms in Southern Shops
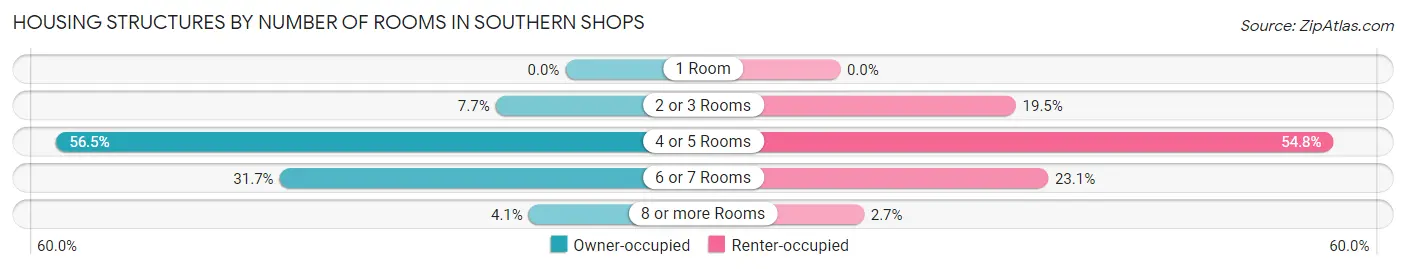
| Number of Rooms | Owner-occupied | Renter-occupied |
| 1 Room | 0 (0.0%) | 0 (0.0%) |
| 2 or 3 Rooms | 40 (7.7%) | 125 (19.5%) |
| 4 or 5 Rooms | 292 (56.5%) | 351 (54.8%) |
| 6 or 7 Rooms | 164 (31.7%) | 148 (23.1%) |
| 8 or more Rooms | 21 (4.1%) | 17 (2.6%) |
| Total | 517 (100.0%) | 641 (100.0%) |
Housing Structure by Heating Type in Southern Shops
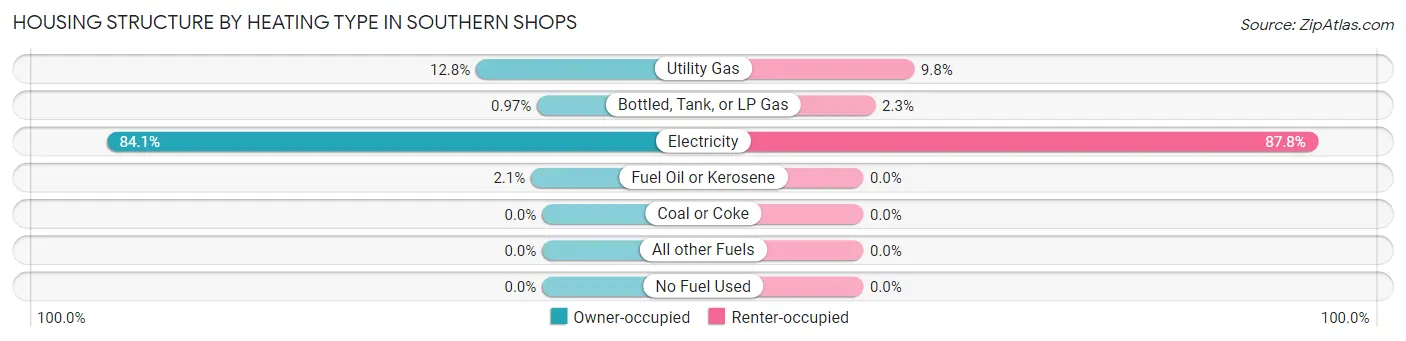
| Heating Type | Owner-occupied | Renter-occupied |
| Utility Gas | 66 (12.8%) | 63 (9.8%) |
| Bottled, Tank, or LP Gas | 5 (1.0%) | 15 (2.3%) |
| Electricity | 435 (84.1%) | 563 (87.8%) |
| Fuel Oil or Kerosene | 11 (2.1%) | 0 (0.0%) |
| Coal or Coke | 0 (0.0%) | 0 (0.0%) |
| All other Fuels | 0 (0.0%) | 0 (0.0%) |
| No Fuel Used | 0 (0.0%) | 0 (0.0%) |
| Total | 517 (100.0%) | 641 (100.0%) |
Household Vehicle Usage in Southern Shops
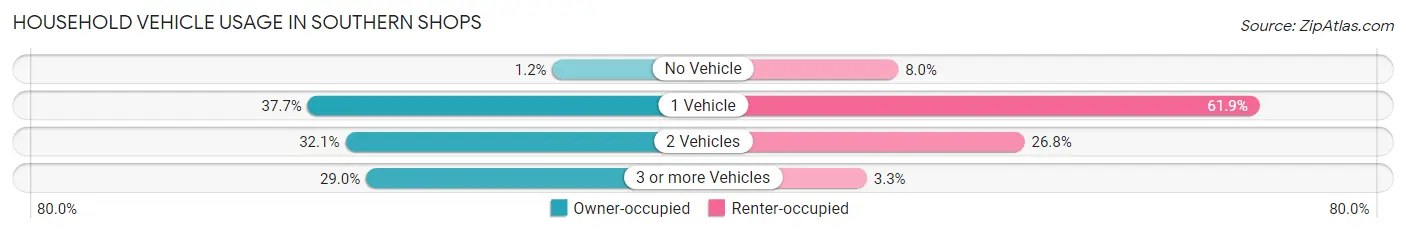
| Vehicles per Household | Owner-occupied | Renter-occupied |
| No Vehicle | 6 (1.2%) | 51 (8.0%) |
| 1 Vehicle | 195 (37.7%) | 397 (61.9%) |
| 2 Vehicles | 166 (32.1%) | 172 (26.8%) |
| 3 or more Vehicles | 150 (29.0%) | 21 (3.3%) |
| Total | 517 (100.0%) | 641 (100.0%) |
Real Estate & Mortgages in Southern Shops
Real Estate and Mortgage Overview in Southern Shops
| Characteristic | Without Mortgage | With Mortgage |
| Housing Units | 463 | 54 |
| Median Property Value | $87,200 | $0 |
| Median Household Income | $19,701 | $7 |
| Monthly Housing Costs | $308 | $0 |
| Real Estate Taxes | $541 | $0 |
Property Value by Mortgage Status in Southern Shops
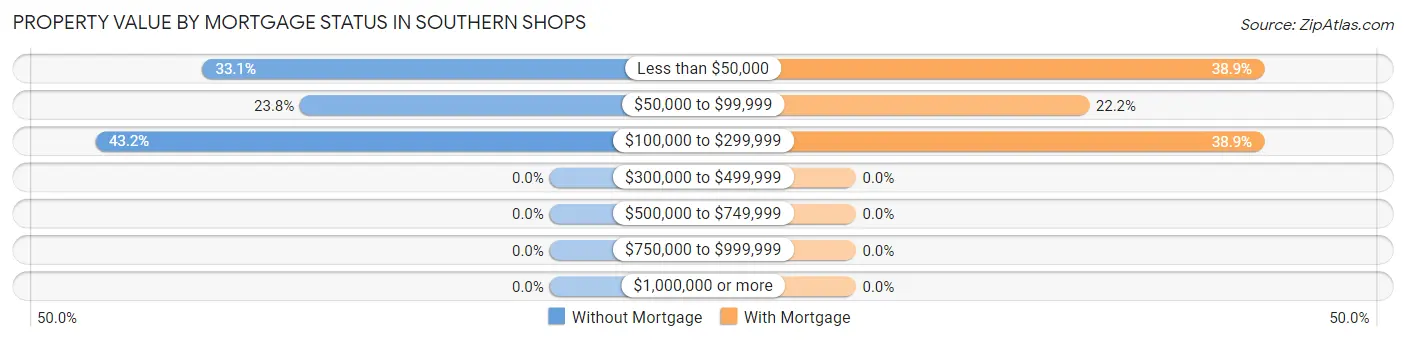
| Property Value | Without Mortgage | With Mortgage |
| Less than $50,000 | 153 (33.1%) | 21 (38.9%) |
| $50,000 to $99,999 | 110 (23.8%) | 12 (22.2%) |
| $100,000 to $299,999 | 200 (43.2%) | 21 (38.9%) |
| $300,000 to $499,999 | 0 (0.0%) | 0 (0.0%) |
| $500,000 to $749,999 | 0 (0.0%) | 0 (0.0%) |
| $750,000 to $999,999 | 0 (0.0%) | 0 (0.0%) |
| $1,000,000 or more | 0 (0.0%) | 0 (0.0%) |
| Total | 463 (100.0%) | 54 (100.0%) |
Household Income by Mortgage Status in Southern Shops
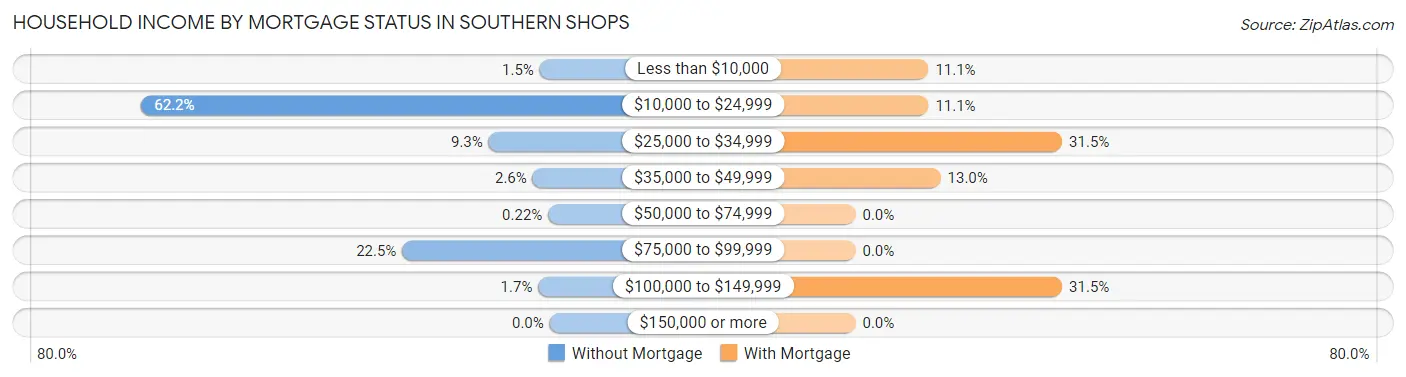
| Household Income | Without Mortgage | With Mortgage |
| Less than $10,000 | 7 (1.5%) | 6 (11.1%) |
| $10,000 to $24,999 | 288 (62.2%) | 6 (11.1%) |
| $25,000 to $34,999 | 43 (9.3%) | 17 (31.5%) |
| $35,000 to $49,999 | 12 (2.6%) | 7 (13.0%) |
| $50,000 to $74,999 | 1 (0.2%) | 0 (0.0%) |
| $75,000 to $99,999 | 104 (22.5%) | 0 (0.0%) |
| $100,000 to $149,999 | 8 (1.7%) | 17 (31.5%) |
| $150,000 or more | 0 (0.0%) | 0 (0.0%) |
| Total | 463 (100.0%) | 54 (100.0%) |
Property Value to Household Income Ratio in Southern Shops
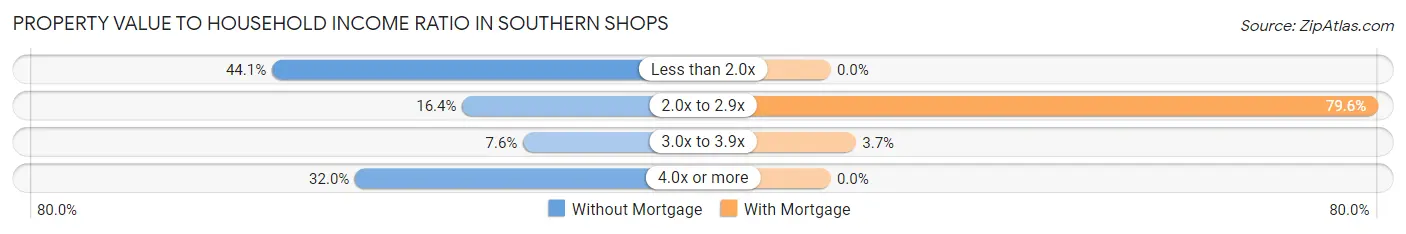
| Value-to-Income Ratio | Without Mortgage | With Mortgage |
| Less than 2.0x | 204 (44.1%) | 0 (0.0%) |
| 2.0x to 2.9x | 76 (16.4%) | 43 (79.6%) |
| 3.0x to 3.9x | 35 (7.6%) | 2 (3.7%) |
| 4.0x or more | 148 (32.0%) | 0 (0.0%) |
| Total | 463 (100.0%) | 54 (100.0%) |
Real Estate Taxes by Mortgage Status in Southern Shops
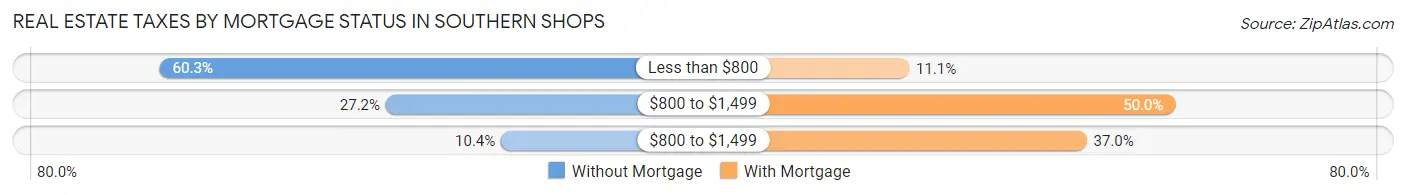
| Property Taxes | Without Mortgage | With Mortgage |
| Less than $800 | 279 (60.3%) | 6 (11.1%) |
| $800 to $1,499 | 126 (27.2%) | 27 (50.0%) |
| $800 to $1,499 | 48 (10.4%) | 20 (37.0%) |
| Total | 463 (100.0%) | 54 (100.0%) |
Health & Disability in Southern Shops
Health Insurance Coverage by Age in Southern Shops
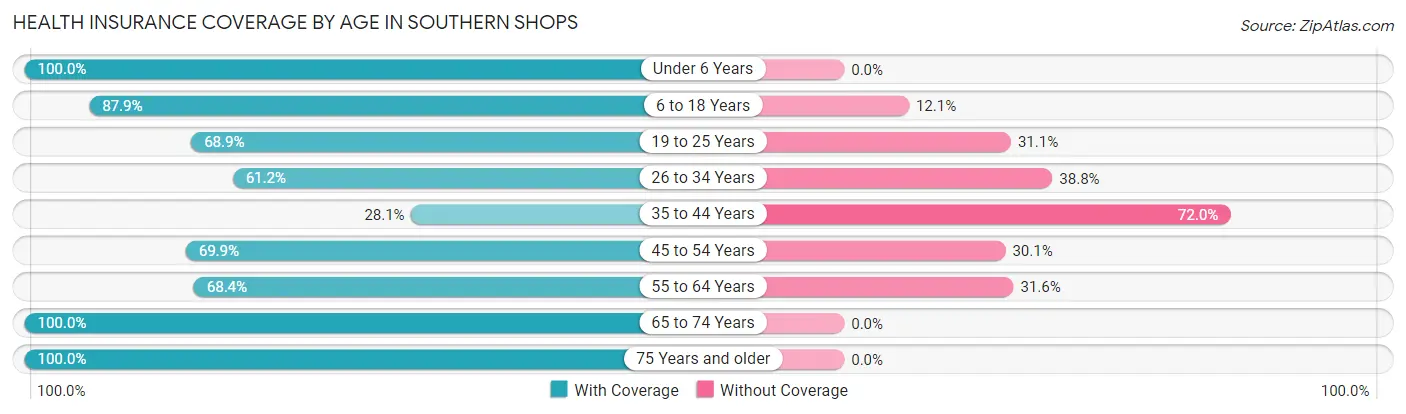
| Age Bracket | With Coverage | Without Coverage |
| Under 6 Years | 276 (100.0%) | 0 (0.0%) |
| 6 to 18 Years | 496 (87.9%) | 68 (12.1%) |
| 19 to 25 Years | 204 (68.9%) | 92 (31.1%) |
| 26 to 34 Years | 361 (61.2%) | 229 (38.8%) |
| 35 to 44 Years | 147 (28.1%) | 377 (72.0%) |
| 45 to 54 Years | 235 (69.9%) | 101 (30.1%) |
| 55 to 64 Years | 284 (68.4%) | 131 (31.6%) |
| 65 to 74 Years | 166 (100.0%) | 0 (0.0%) |
| 75 Years and older | 131 (100.0%) | 0 (0.0%) |
| Total | 2,300 (69.7%) | 998 (30.3%) |
Health Insurance Coverage by Citizenship Status in Southern Shops
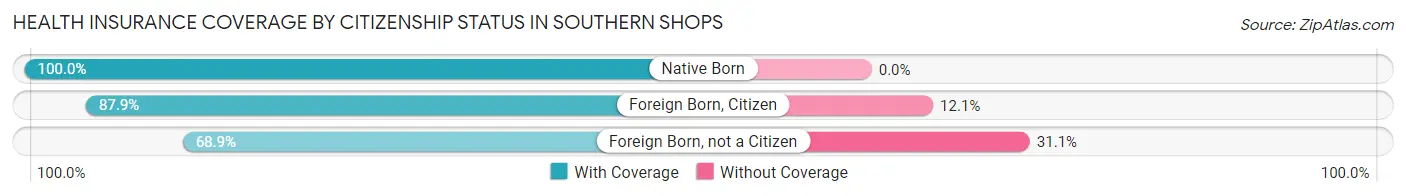
| Citizenship Status | With Coverage | Without Coverage |
| Native Born | 276 (100.0%) | 0 (0.0%) |
| Foreign Born, Citizen | 496 (87.9%) | 68 (12.1%) |
| Foreign Born, not a Citizen | 204 (68.9%) | 92 (31.1%) |
Health Insurance Coverage by Household Income in Southern Shops
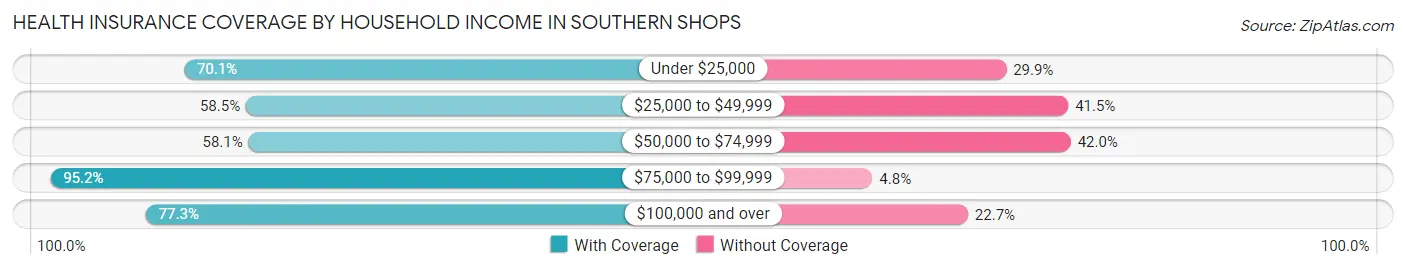
| Household Income | With Coverage | Without Coverage |
| Under $25,000 | 1,024 (70.1%) | 436 (29.9%) |
| $25,000 to $49,999 | 402 (58.5%) | 285 (41.5%) |
| $50,000 to $74,999 | 274 (58.1%) | 198 (41.9%) |
| $75,000 to $99,999 | 397 (95.2%) | 20 (4.8%) |
| $100,000 and over | 201 (77.3%) | 59 (22.7%) |
Public vs Private Health Insurance Coverage by Age in Southern Shops
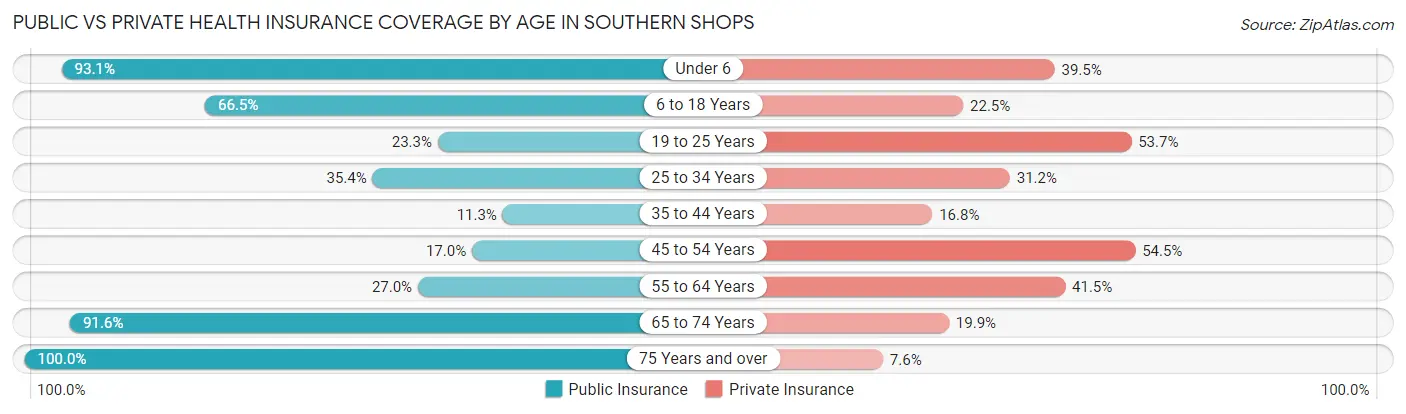
| Age Bracket | Public Insurance | Private Insurance |
| Under 6 | 257 (93.1%) | 109 (39.5%) |
| 6 to 18 Years | 375 (66.5%) | 127 (22.5%) |
| 19 to 25 Years | 69 (23.3%) | 159 (53.7%) |
| 25 to 34 Years | 209 (35.4%) | 184 (31.2%) |
| 35 to 44 Years | 59 (11.3%) | 88 (16.8%) |
| 45 to 54 Years | 57 (17.0%) | 183 (54.5%) |
| 55 to 64 Years | 112 (27.0%) | 172 (41.4%) |
| 65 to 74 Years | 152 (91.6%) | 33 (19.9%) |
| 75 Years and over | 131 (100.0%) | 10 (7.6%) |
| Total | 1,421 (43.1%) | 1,065 (32.3%) |
Disability Status by Sex by Age in Southern Shops
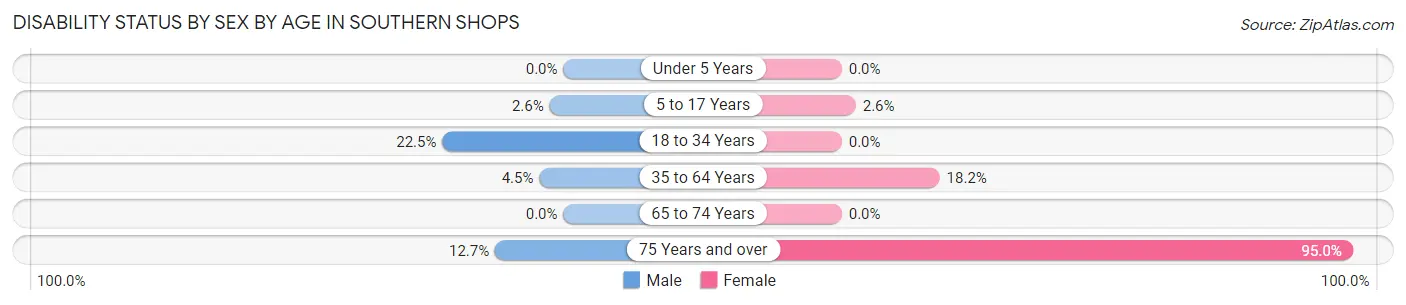
| Age Bracket | Male | Female |
| Under 5 Years | 0 (0.0%) | 0 (0.0%) |
| 5 to 17 Years | 10 (2.6%) | 5 (2.6%) |
| 18 to 34 Years | 142 (22.5%) | 0 (0.0%) |
| 35 to 64 Years | 35 (4.5%) | 89 (18.2%) |
| 65 to 74 Years | 0 (0.0%) | 0 (0.0%) |
| 75 Years and over | 9 (12.7%) | 57 (95.0%) |
Disability Class by Sex by Age in Southern Shops
Disability Class: Hearing Difficulty
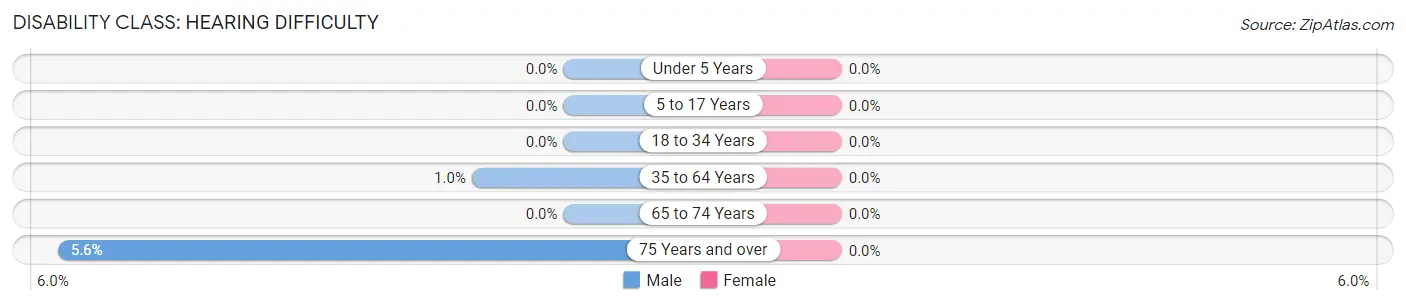
| Age Bracket | Male | Female |
| Under 5 Years | 0 (0.0%) | 0 (0.0%) |
| 5 to 17 Years | 0 (0.0%) | 0 (0.0%) |
| 18 to 34 Years | 0 (0.0%) | 0 (0.0%) |
| 35 to 64 Years | 8 (1.0%) | 0 (0.0%) |
| 65 to 74 Years | 0 (0.0%) | 0 (0.0%) |
| 75 Years and over | 4 (5.6%) | 0 (0.0%) |
Disability Class: Vision Difficulty
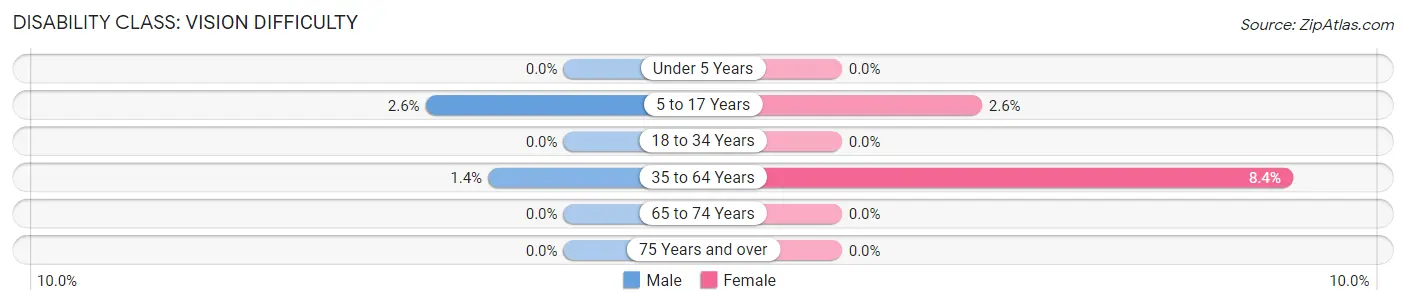
| Age Bracket | Male | Female |
| Under 5 Years | 0 (0.0%) | 0 (0.0%) |
| 5 to 17 Years | 10 (2.6%) | 5 (2.6%) |
| 18 to 34 Years | 0 (0.0%) | 0 (0.0%) |
| 35 to 64 Years | 11 (1.4%) | 41 (8.4%) |
| 65 to 74 Years | 0 (0.0%) | 0 (0.0%) |
| 75 Years and over | 0 (0.0%) | 0 (0.0%) |
Disability Class: Cognitive Difficulty
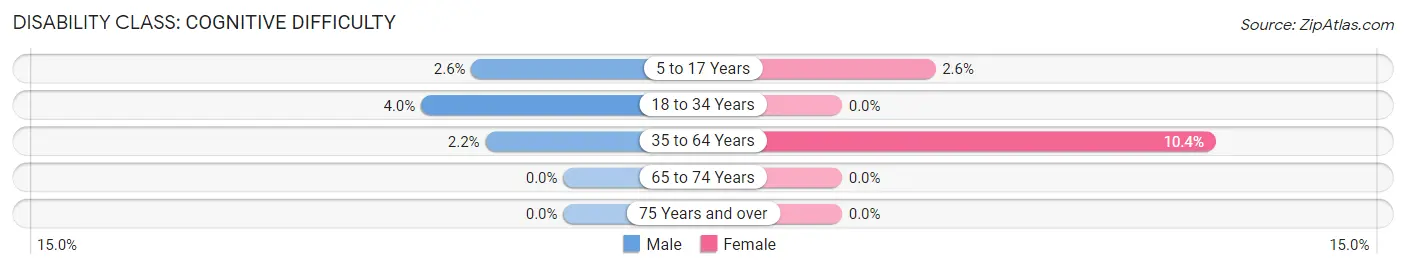
| Age Bracket | Male | Female |
| 5 to 17 Years | 10 (2.6%) | 5 (2.6%) |
| 18 to 34 Years | 25 (4.0%) | 0 (0.0%) |
| 35 to 64 Years | 17 (2.2%) | 51 (10.4%) |
| 65 to 74 Years | 0 (0.0%) | 0 (0.0%) |
| 75 Years and over | 0 (0.0%) | 0 (0.0%) |
Disability Class: Ambulatory Difficulty
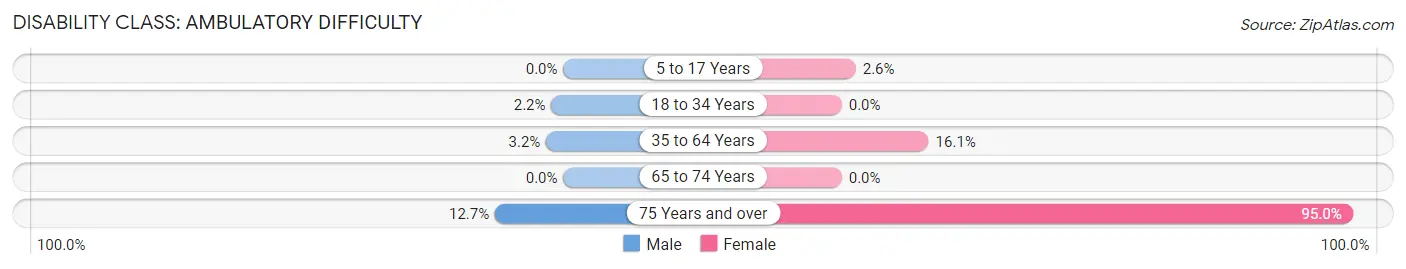
| Age Bracket | Male | Female |
| 5 to 17 Years | 0 (0.0%) | 5 (2.6%) |
| 18 to 34 Years | 14 (2.2%) | 0 (0.0%) |
| 35 to 64 Years | 25 (3.2%) | 79 (16.1%) |
| 65 to 74 Years | 0 (0.0%) | 0 (0.0%) |
| 75 Years and over | 9 (12.7%) | 57 (95.0%) |
Disability Class: Self-Care Difficulty
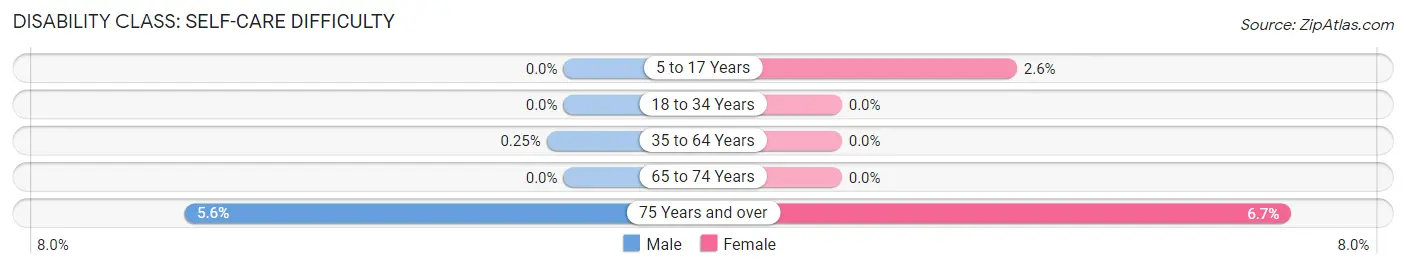
| Age Bracket | Male | Female |
| 5 to 17 Years | 0 (0.0%) | 5 (2.6%) |
| 18 to 34 Years | 0 (0.0%) | 0 (0.0%) |
| 35 to 64 Years | 2 (0.3%) | 0 (0.0%) |
| 65 to 74 Years | 0 (0.0%) | 0 (0.0%) |
| 75 Years and over | 4 (5.6%) | 4 (6.7%) |
Technology Access in Southern Shops
Computing Device Access in Southern Shops
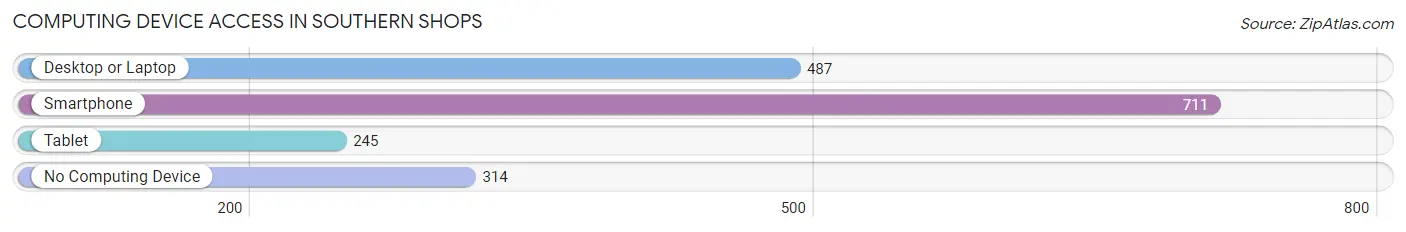
| Device Type | # Households | % Households |
| Desktop or Laptop | 487 | 42.1% |
| Smartphone | 711 | 61.4% |
| Tablet | 245 | 21.2% |
| No Computing Device | 314 | 27.1% |
| Total | 1,158 | 100.0% |
Internet Access in Southern Shops
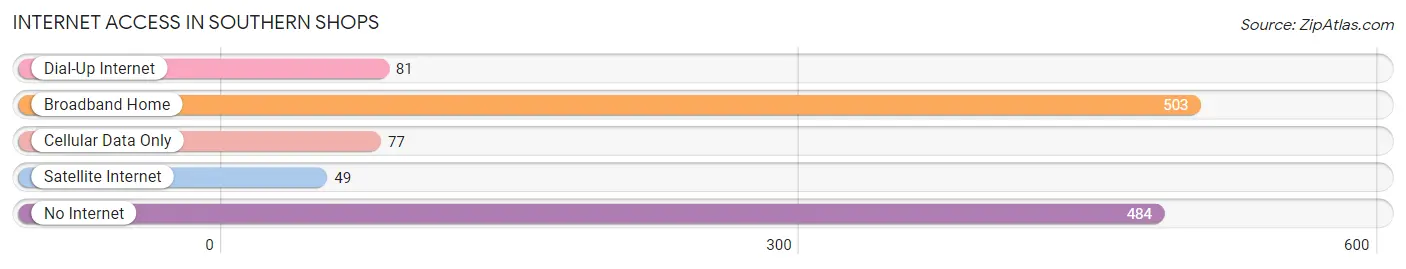
| Internet Type | # Households | % Households |
| Dial-Up Internet | 81 | 7.0% |
| Broadband Home | 503 | 43.4% |
| Cellular Data Only | 77 | 6.7% |
| Satellite Internet | 49 | 4.2% |
| No Internet | 484 | 41.8% |
| Total | 1,158 | 100.0% |
Southern Shops Summary
Southern Shops is a small town located in South Carolina, United States. It is situated in the foothills of the Blue Ridge Mountains, approximately 30 miles from the state capital of Columbia. The town has a population of approximately 1,500 people and is known for its rural charm and friendly atmosphere.
History
Southern Shops was founded in 1820 by a group of settlers from North Carolina. The town was originally called “New Hope” and was a small farming community. In 1845, the town was renamed “Southern Shops” after the local blacksmith shop. The town grew slowly over the years and by the early 1900s, it had become a popular tourist destination.
In the 1950s, the town began to experience a decline in population as many of its residents moved away in search of better economic opportunities. However, in the late 1970s, the town experienced a resurgence in population as people began to move back to the area. Today, Southern Shops is a thriving community with a strong sense of community and pride.
Geography
Southern Shops is located in the foothills of the Blue Ridge Mountains in South Carolina. The town is situated in a valley surrounded by rolling hills and lush forests. The town is located approximately 30 miles from the state capital of Columbia. The town is also close to the cities of Greenville and Spartanburg.
The climate in Southern Shops is mild and humid. Summers are hot and humid with temperatures reaching up to 90 degrees Fahrenheit. Winters are mild with temperatures rarely dropping below freezing. The town receives an average of 48 inches of rain per year.
Economy
The economy of Southern Shops is largely based on tourism. The town is home to several popular tourist attractions, including the historic Southern Shops Railroad Museum and the Southern Shops Antique Mall. The town also has several restaurants, shops, and other businesses that cater to tourists.
In addition to tourism, the town is also home to several small businesses. These businesses include a local grocery store, a hardware store, and a few small manufacturing companies. The town also has a few small farms that produce fruits and vegetables for local consumption.
Demographics
As of the 2010 census, the population of Southern Shops was 1,500 people. The town is predominantly white, with approximately 85% of the population being white. The remaining 15% of the population is made up of African Americans, Hispanics, and other ethnicities. The median household income in the town is $35,000. The town has a low unemployment rate of 4.5%.
Southern Shops is a small town with a strong sense of community and pride. The town is known for its rural charm and friendly atmosphere. The town is home to several popular tourist attractions and businesses, making it a great place to visit or live.
Common Questions
What is Per Capita Income in Southern Shops?
Per Capita income in Southern Shops is $14,811.
What is the Median Family Income in Southern Shops?
Median Family Income in Southern Shops is $35,363.
What is the Median Household income in Southern Shops?
Median Household Income in Southern Shops is $32,500.
What is Income or Wage Gap in Southern Shops?
Income or Wage Gap in Southern Shops is 24.4%.
Women in Southern Shops earn 75.6 cents for every dollar earned by a man.
What is Inequality or Gini Index in Southern Shops?
Inequality or Gini Index in Southern Shops is 0.41.
What is the Total Population of Southern Shops?
Total Population of Southern Shops is 3,856.
What is the Total Male Population of Southern Shops?
Total Male Population of Southern Shops is 2,668.
What is the Total Female Population of Southern Shops?
Total Female Population of Southern Shops is 1,188.
What is the Ratio of Males per 100 Females in Southern Shops?
There are 224.58 Males per 100 Females in Southern Shops.
What is the Ratio of Females per 100 Males in Southern Shops?
There are 44.53 Females per 100 Males in Southern Shops.
What is the Median Population Age in Southern Shops?
Median Population Age in Southern Shops is 34.8 Years.
What is the Average Family Size in Southern Shops
Average Family Size in Southern Shops is 3.1 People.
What is the Average Household Size in Southern Shops
Average Household Size in Southern Shops is 2.9 People.
How Large is the Labor Force in Southern Shops?
There are 1,866 People in the Labor Forcein in Southern Shops.
What is the Percentage of People in the Labor Force in Southern Shops?
57.3% of People are in the Labor Force in Southern Shops.
What is the Unemployment Rate in Southern Shops?
Unemployment Rate in Southern Shops is 6.3%.