Corrales, NM Map & Demographics
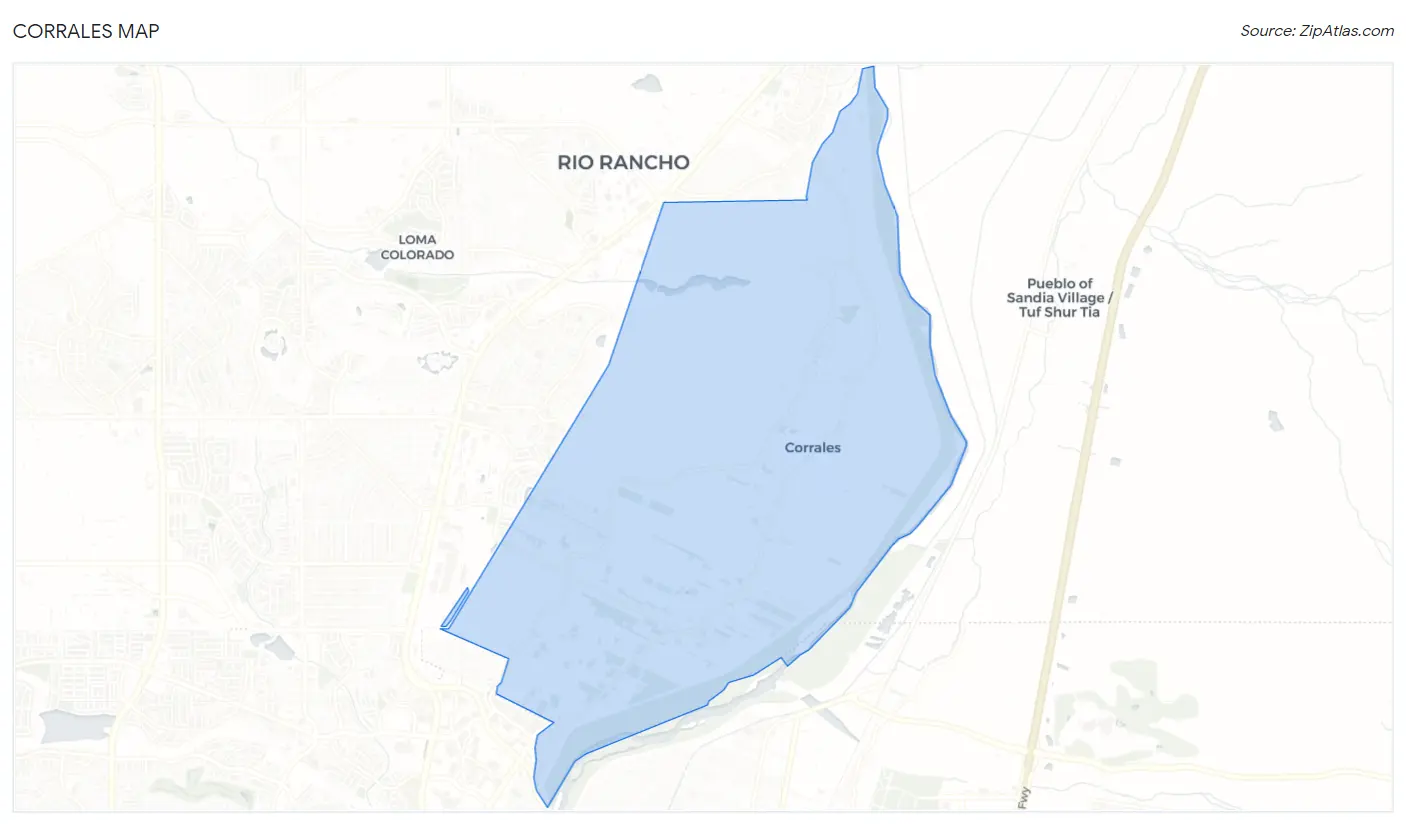
Corrales Map
Corrales Overview
$61,160
PER CAPITA INCOME
$133,487
AVG FAMILY INCOME
$94,966
AVG HOUSEHOLD INCOME
33.6%
WAGE / INCOME GAP [ % ]
66.4¢/ $1
WAGE / INCOME GAP [ $ ]
0.46
INEQUALITY / GINI INDEX
8,495
TOTAL POPULATION
4,000
MALE POPULATION
4,495
FEMALE POPULATION
88.99
MALES / 100 FEMALES
112.38
FEMALES / 100 MALES
56.5
MEDIAN AGE
2.7
AVG FAMILY SIZE
2.4
AVG HOUSEHOLD SIZE
4,093
LABOR FORCE [ PEOPLE ]
54.9%
PERCENT IN LABOR FORCE
4.6%
UNEMPLOYMENT RATE
Corrales Zip Codes
Corrales Area Codes
Income in Corrales
Income Overview in Corrales
Per Capita Income in Corrales is $61,160, while median incomes of families and households are $133,487 and $94,966 respectively.
| Characteristic | Number | Measure |
| Per Capita Income | 8,495 | $61,160 |
| Median Family Income | 2,615 | $133,487 |
| Mean Family Income | 2,615 | $167,801 |
| Median Household Income | 3,574 | $94,966 |
| Mean Household Income | 3,574 | $143,205 |
| Income Deficit | 2,615 | $0 |
| Wage / Income Gap (%) | 8,495 | 33.64% |
| Wage / Income Gap ($) | 8,495 | 66.36¢ per $1 |
| Gini / Inequality Index | 8,495 | 0.46 |
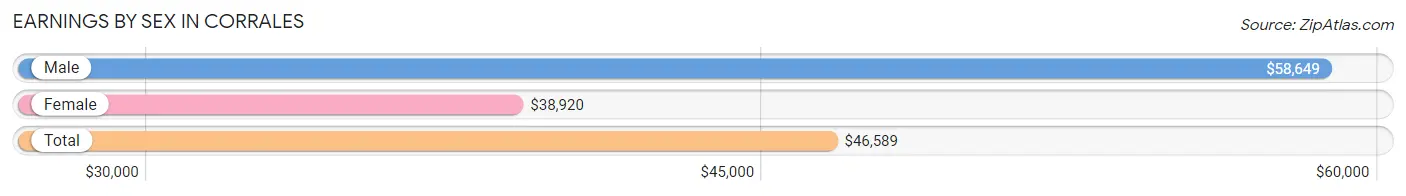
Earnings by Sex in Corrales
Average Earnings in Corrales are $46,589, $58,649 for men and $38,920 for women, a difference of 33.6%.
| Sex | Number | Average Earnings |
| Male | 2,271 (53.6%) | $58,649 |
| Female | 1,969 (46.4%) | $38,920 |
| Total | 4,240 (100.0%) | $46,589 |
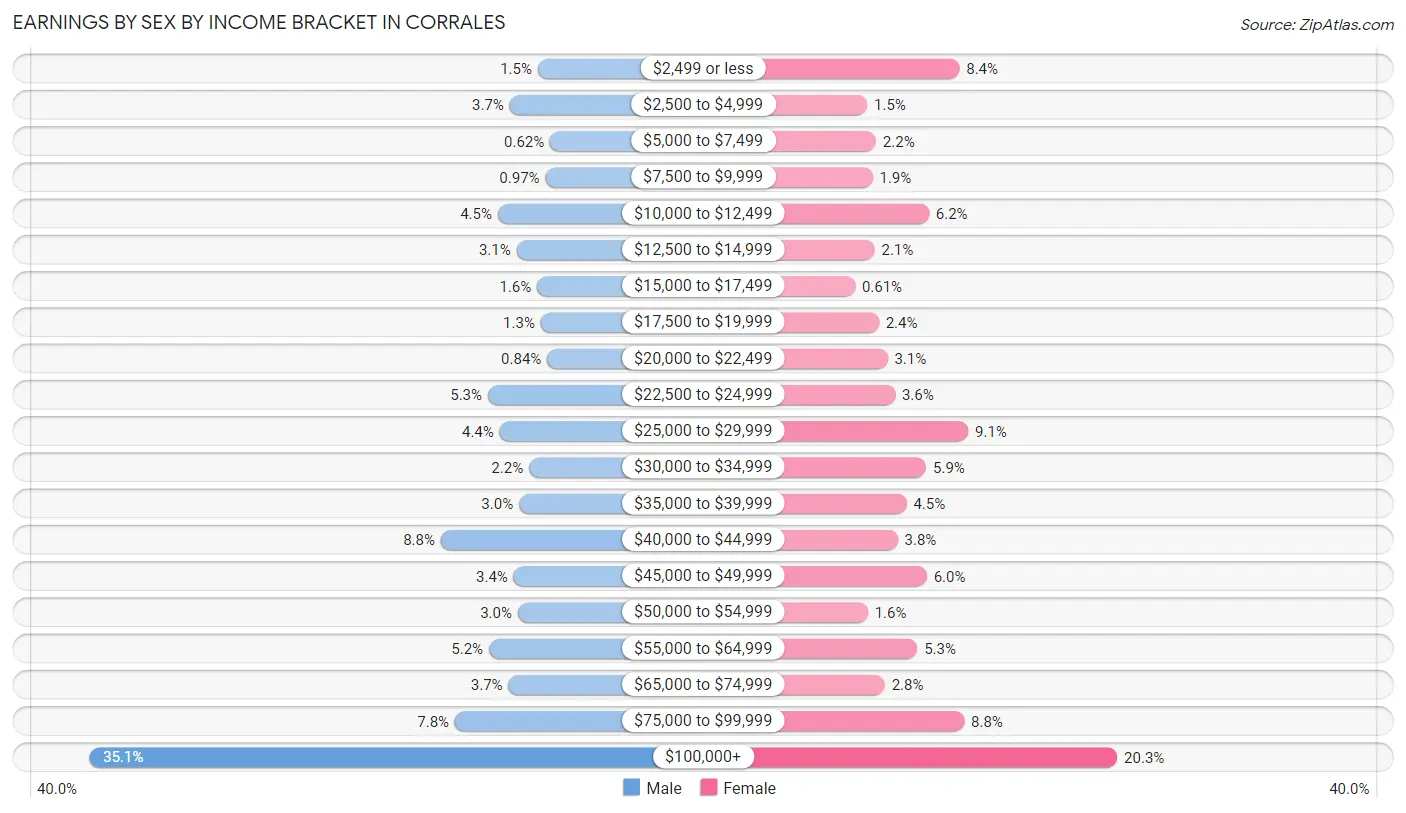
Earnings by Sex by Income Bracket in Corrales
The most common earnings brackets in Corrales are $100,000+ for men (797 | 35.1%) and $100,000+ for women (399 | 20.3%).
| Income | Male | Female |
| $2,499 or less | 35 (1.5%) | 166 (8.4%) |
| $2,500 to $4,999 | 83 (3.6%) | 30 (1.5%) |
| $5,000 to $7,499 | 14 (0.6%) | 43 (2.2%) |
| $7,500 to $9,999 | 22 (1.0%) | 38 (1.9%) |
| $10,000 to $12,499 | 103 (4.5%) | 121 (6.1%) |
| $12,500 to $14,999 | 71 (3.1%) | 41 (2.1%) |
| $15,000 to $17,499 | 36 (1.6%) | 12 (0.6%) |
| $17,500 to $19,999 | 30 (1.3%) | 47 (2.4%) |
| $20,000 to $22,499 | 19 (0.8%) | 60 (3.0%) |
| $22,500 to $24,999 | 120 (5.3%) | 71 (3.6%) |
| $25,000 to $29,999 | 100 (4.4%) | 179 (9.1%) |
| $30,000 to $34,999 | 50 (2.2%) | 117 (5.9%) |
| $35,000 to $39,999 | 67 (2.9%) | 88 (4.5%) |
| $40,000 to $44,999 | 200 (8.8%) | 75 (3.8%) |
| $45,000 to $49,999 | 76 (3.4%) | 118 (6.0%) |
| $50,000 to $54,999 | 69 (3.0%) | 31 (1.6%) |
| $55,000 to $64,999 | 118 (5.2%) | 104 (5.3%) |
| $65,000 to $74,999 | 85 (3.7%) | 56 (2.8%) |
| $75,000 to $99,999 | 176 (7.7%) | 173 (8.8%) |
| $100,000+ | 797 (35.1%) | 399 (20.3%) |
| Total | 2,271 (100.0%) | 1,969 (100.0%) |
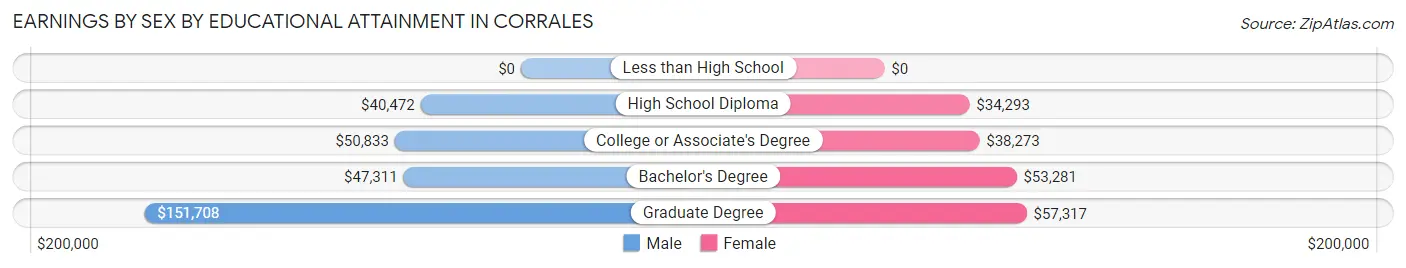
Earnings by Sex by Educational Attainment in Corrales
Average earnings in Corrales are $64,697 for men and $42,433 for women, a difference of 34.4%. Men with an educational attainment of graduate degree enjoy the highest average annual earnings of $151,708, while those with high school diploma education earn the least with $40,472. Women with an educational attainment of graduate degree earn the most with the average annual earnings of $57,317, while those with high school diploma education have the smallest earnings of $34,293.
| Educational Attainment | Male Income | Female Income |
| Less than High School | - | - |
| High School Diploma | $40,472 | $34,293 |
| College or Associate's Degree | $50,833 | $38,273 |
| Bachelor's Degree | $47,311 | $53,281 |
| Graduate Degree | $151,708 | $57,317 |
| Total | $64,697 | $42,433 |
Family Income in Corrales
Family Income Brackets in Corrales
According to the Corrales family income data, there are 751 families falling into the $200,000+ income range, which is the most common income bracket and makes up 28.7% of all families. Conversely, the less than $10,000 income bracket is the least frequent group with only 13 families (0.5%) belonging to this category.
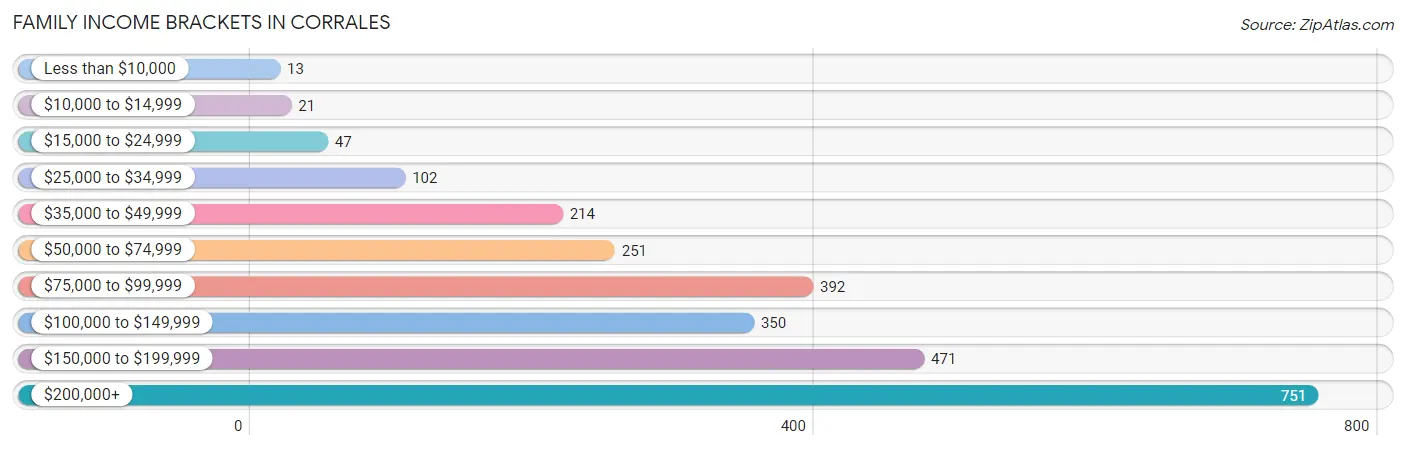
| Income Bracket | # Families | % Families |
| Less than $10,000 | 13 | 0.5% |
| $10,000 to $14,999 | 21 | 0.8% |
| $15,000 to $24,999 | 47 | 1.8% |
| $25,000 to $34,999 | 102 | 3.9% |
| $35,000 to $49,999 | 214 | 8.2% |
| $50,000 to $74,999 | 251 | 9.6% |
| $75,000 to $99,999 | 392 | 15.0% |
| $100,000 to $149,999 | 350 | 13.4% |
| $150,000 to $199,999 | 471 | 18.0% |
| $200,000+ | 751 | 28.7% |
Family Income by Famaliy Size in Corrales
5-person families (100 | 3.8%) account for the highest median family income in Corrales with $250,001 per family, while 2-person families (1,671 | 63.9%) have the highest median income of $55,438 per family member.
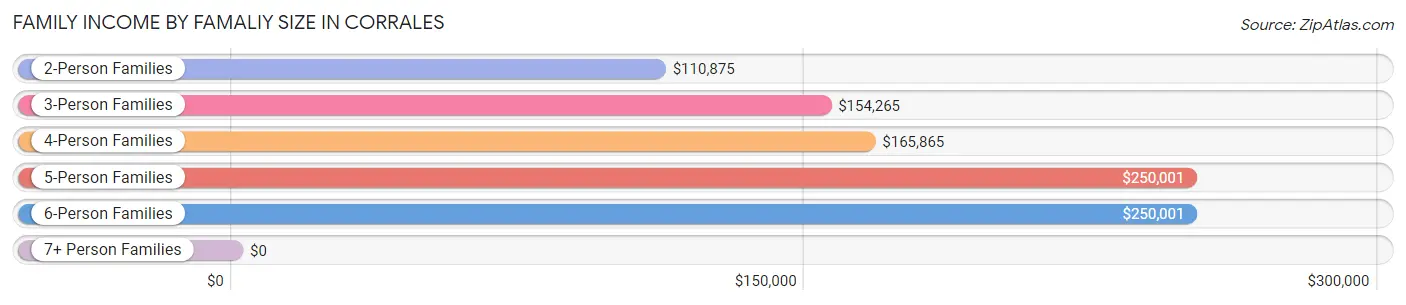
| Income Bracket | # Families | Median Income |
| 2-Person Families | 1,671 (63.9%) | $110,875 |
| 3-Person Families | 492 (18.8%) | $154,265 |
| 4-Person Families | 300 (11.5%) | $165,865 |
| 5-Person Families | 100 (3.8%) | $250,001 |
| 6-Person Families | 32 (1.2%) | $250,001 |
| 7+ Person Families | 20 (0.8%) | $0 |
| Total | 2,615 (100.0%) | $133,487 |
Family Income by Number of Earners in Corrales
The median family income in Corrales is $133,487, with families comprising 3+ earners (184) having the highest median family income of $244,722, while families with no earners (729) have the lowest median family income of $78,750, accounting for 7.0% and 27.9% of families, respectively.
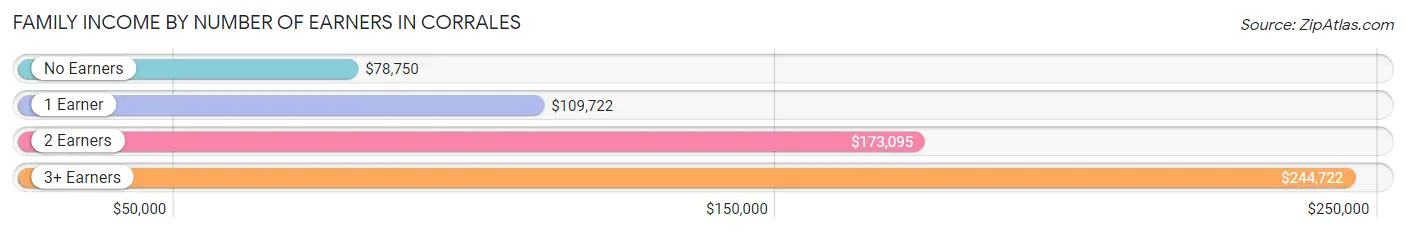
| Number of Earners | # Families | Median Income |
| No Earners | 729 (27.9%) | $78,750 |
| 1 Earner | 806 (30.8%) | $109,722 |
| 2 Earners | 896 (34.3%) | $173,095 |
| 3+ Earners | 184 (7.0%) | $244,722 |
| Total | 2,615 (100.0%) | $133,487 |
Household Income in Corrales
Household Income Brackets in Corrales
With 836 households falling in the category, the $200,000+ income range is the most frequent in Corrales, accounting for 23.4% of all households. In contrast, only 25 households (0.7%) fall into the less than $10,000 income bracket, making it the least populous group.
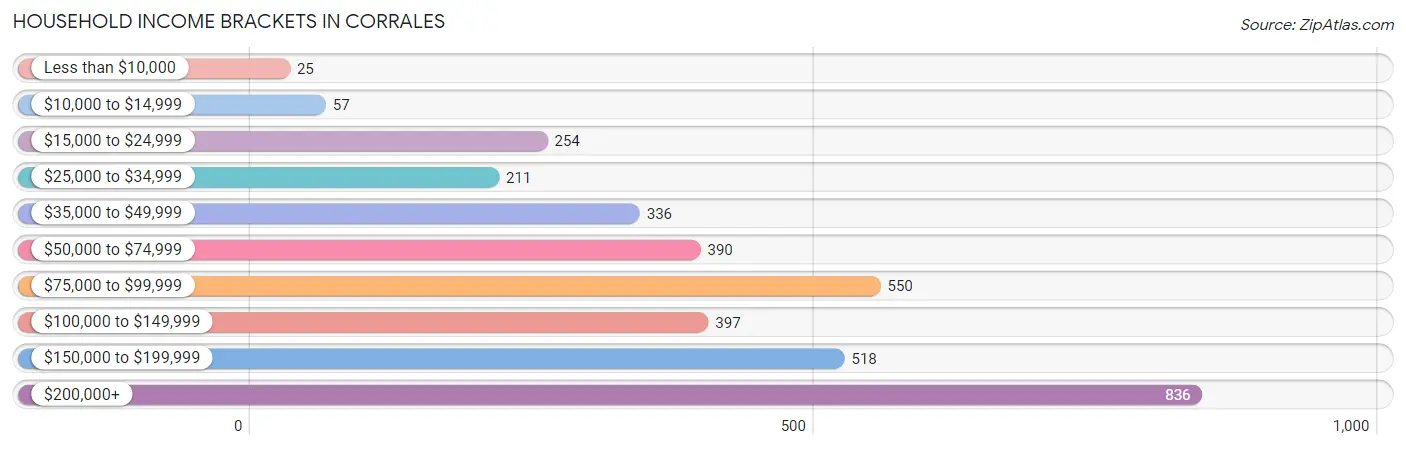
| Income Bracket | # Households | % Households |
| Less than $10,000 | 25 | 0.7% |
| $10,000 to $14,999 | 57 | 1.6% |
| $15,000 to $24,999 | 254 | 7.1% |
| $25,000 to $34,999 | 211 | 5.9% |
| $35,000 to $49,999 | 336 | 9.4% |
| $50,000 to $74,999 | 390 | 10.9% |
| $75,000 to $99,999 | 550 | 15.4% |
| $100,000 to $149,999 | 397 | 11.1% |
| $150,000 to $199,999 | 518 | 14.5% |
| $200,000+ | 836 | 23.4% |
Household Income by Householder Age in Corrales
The median household income in Corrales is $94,966, with the highest median household income of $152,123 found in the 25 to 44 years age bracket for the primary householder. A total of 472 households (13.2%) fall into this category. Meanwhile, the 15 to 24 years age bracket for the primary householder has the lowest median household income of $0, with 2 households (0.1%) in this group.
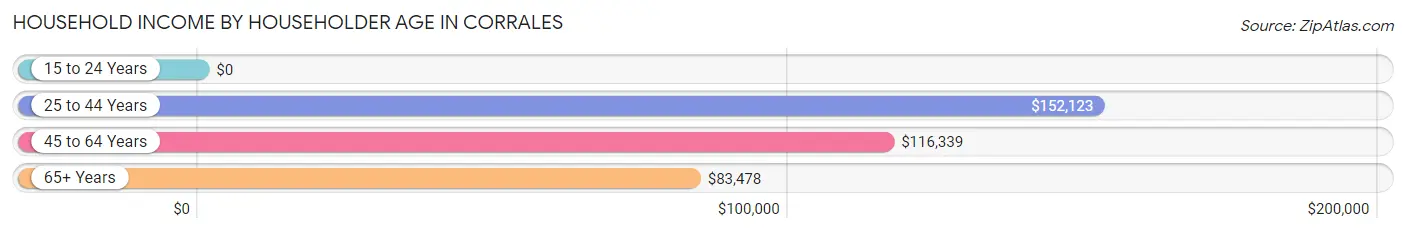
| Income Bracket | # Households | Median Income |
| 15 to 24 Years | 2 (0.1%) | $0 |
| 25 to 44 Years | 472 (13.2%) | $152,123 |
| 45 to 64 Years | 1,424 (39.8%) | $116,339 |
| 65+ Years | 1,676 (46.9%) | $83,478 |
| Total | 3,574 (100.0%) | $94,966 |
Poverty in Corrales
Income Below Poverty by Sex and Age in Corrales
With 2.4% poverty level for males and 4.3% for females among the residents of Corrales, 15 year old males and 25 to 34 year old females are the most vulnerable to poverty, with 4 males (19.1%) and 19 females (12.6%) in their respective age groups living below the poverty level.
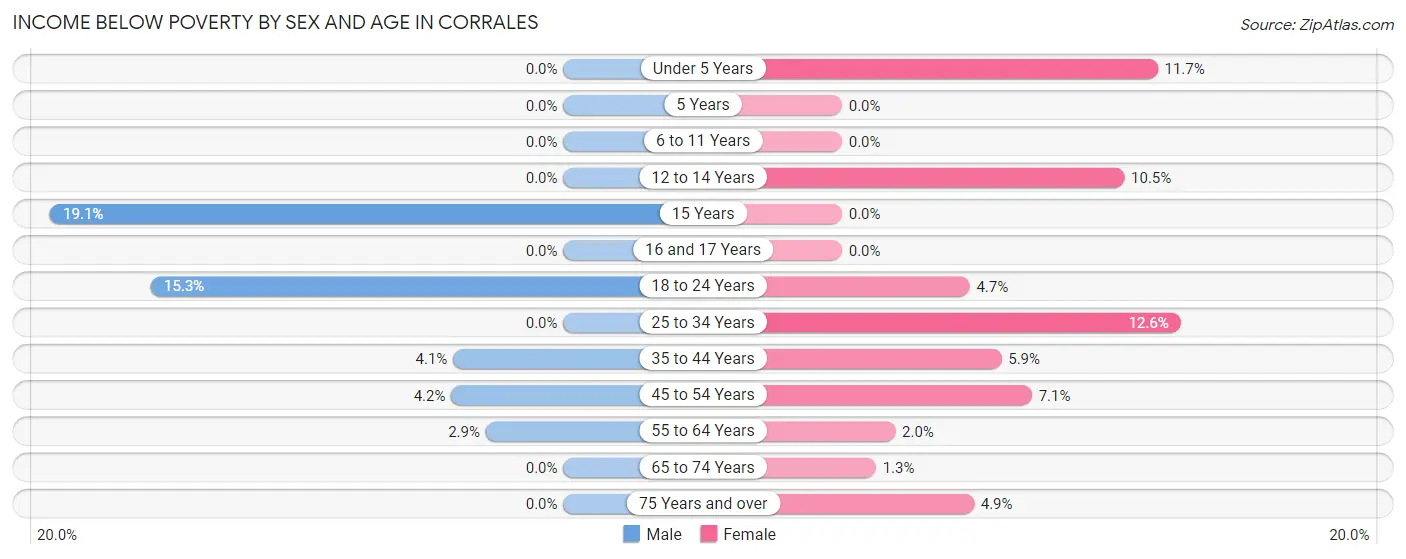
| Age Bracket | Male | Female |
| Under 5 Years | 0 (0.0%) | 17 (11.7%) |
| 5 Years | 0 (0.0%) | 0 (0.0%) |
| 6 to 11 Years | 0 (0.0%) | 0 (0.0%) |
| 12 to 14 Years | 0 (0.0%) | 13 (10.5%) |
| 15 Years | 4 (19.1%) | 0 (0.0%) |
| 16 and 17 Years | 0 (0.0%) | 0 (0.0%) |
| 18 to 24 Years | 32 (15.3%) | 10 (4.7%) |
| 25 to 34 Years | 0 (0.0%) | 19 (12.6%) |
| 35 to 44 Years | 14 (4.1%) | 29 (5.9%) |
| 45 to 54 Years | 21 (4.2%) | 39 (7.0%) |
| 55 to 64 Years | 23 (2.9%) | 14 (2.0%) |
| 65 to 74 Years | 0 (0.0%) | 11 (1.3%) |
| 75 Years and over | 0 (0.0%) | 41 (4.9%) |
| Total | 94 (2.4%) | 193 (4.3%) |
Income Above Poverty by Sex and Age in Corrales
According to the poverty statistics in Corrales, males aged under 5 years and females aged 6 to 11 years are the age groups that are most secure financially, with 100.0% of males and 100.0% of females in these age groups living above the poverty line.
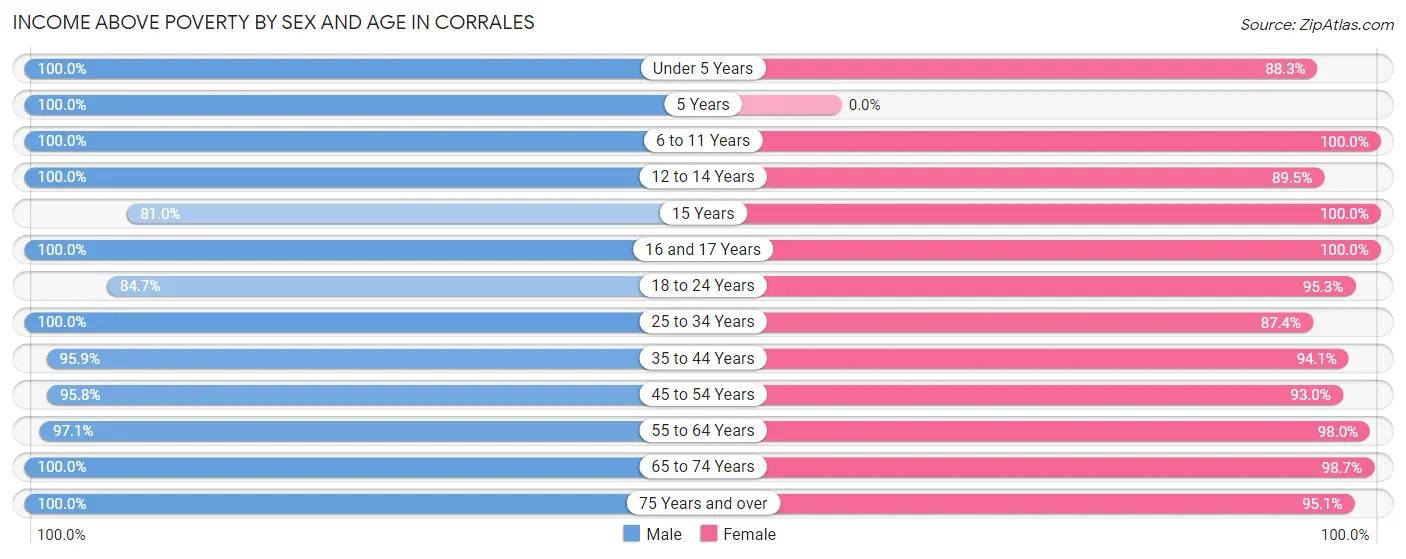
| Age Bracket | Male | Female |
| Under 5 Years | 100 (100.0%) | 128 (88.3%) |
| 5 Years | 53 (100.0%) | 0 (0.0%) |
| 6 to 11 Years | 174 (100.0%) | 262 (100.0%) |
| 12 to 14 Years | 99 (100.0%) | 111 (89.5%) |
| 15 Years | 17 (80.9%) | 55 (100.0%) |
| 16 and 17 Years | 28 (100.0%) | 69 (100.0%) |
| 18 to 24 Years | 177 (84.7%) | 201 (95.3%) |
| 25 to 34 Years | 304 (100.0%) | 132 (87.4%) |
| 35 to 44 Years | 328 (95.9%) | 461 (94.1%) |
| 45 to 54 Years | 484 (95.8%) | 514 (92.9%) |
| 55 to 64 Years | 777 (97.1%) | 692 (98.0%) |
| 65 to 74 Years | 695 (100.0%) | 862 (98.7%) |
| 75 Years and over | 670 (100.0%) | 796 (95.1%) |
| Total | 3,906 (97.7%) | 4,283 (95.7%) |
Income Below Poverty Among Married-Couple Families in Corrales
The poverty statistics for married-couple families in Corrales show that 1.4% or 34 of the total 2,383 families live below the poverty line. Families with 1 or 2 children have the highest poverty rate of 4.8%, comprising of 22 families. On the other hand, families with 3 or 4 children have the lowest poverty rate of 0.0%, which includes 0 families.
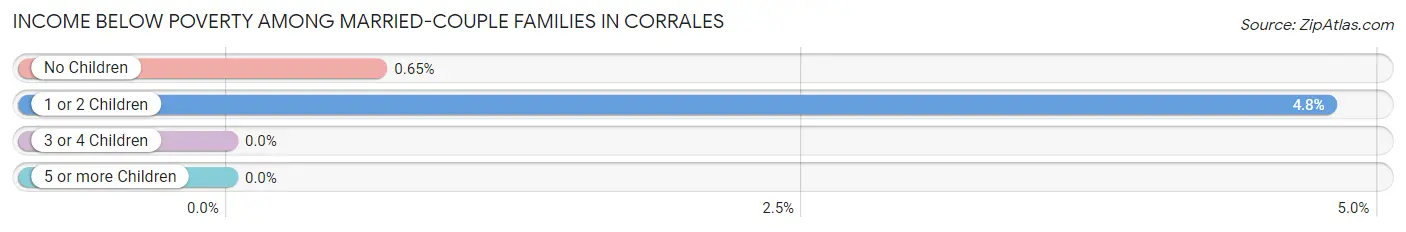
| Children | Above Poverty | Below Poverty |
| No Children | 1,839 (99.4%) | 12 (0.6%) |
| 1 or 2 Children | 438 (95.2%) | 22 (4.8%) |
| 3 or 4 Children | 52 (100.0%) | 0 (0.0%) |
| 5 or more Children | 20 (100.0%) | 0 (0.0%) |
| Total | 2,349 (98.6%) | 34 (1.4%) |
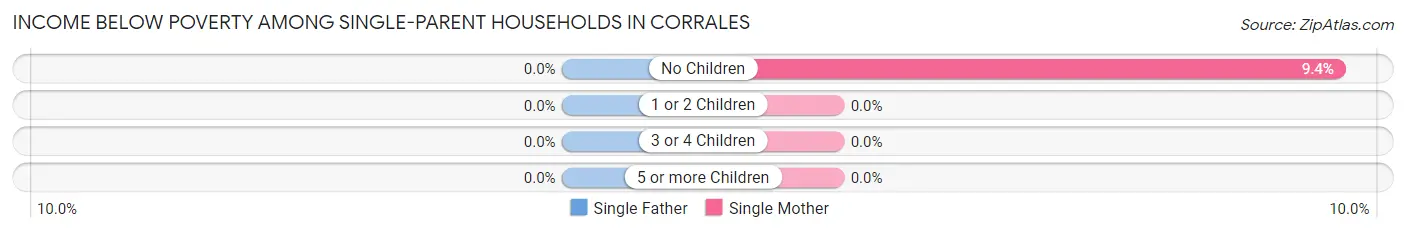
Income Below Poverty Among Single-Parent Households in Corrales
| Children | Single Father | Single Mother |
| No Children | 0 (0.0%) | 10 (9.3%) |
| 1 or 2 Children | 0 (0.0%) | 0 (0.0%) |
| 3 or 4 Children | 0 (0.0%) | 0 (0.0%) |
| 5 or more Children | 0 (0.0%) | 0 (0.0%) |
| Total | 0 (0.0%) | 10 (6.9%) |
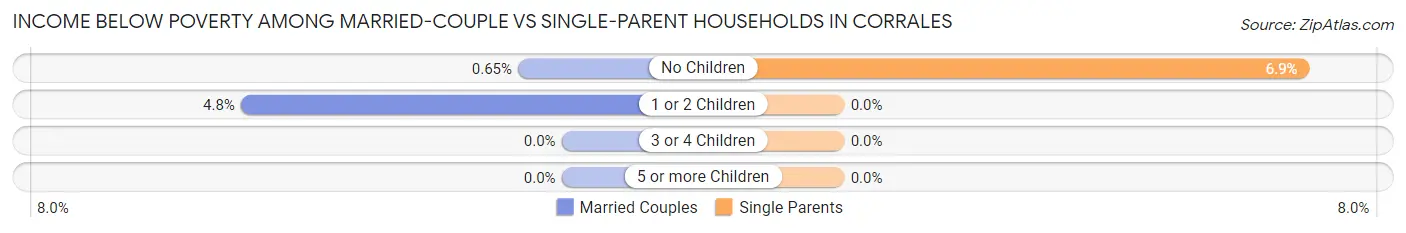
Income Below Poverty Among Married-Couple vs Single-Parent Households in Corrales
The poverty data for Corrales shows that 34 of the married-couple family households (1.4%) and 10 of the single-parent households (4.3%) are living below the poverty level. Within the married-couple family households, those with 1 or 2 children have the highest poverty rate, with 22 households (4.8%) falling below the poverty line. Among the single-parent households, those with no children have the highest poverty rate, with 10 household (6.9%) living below poverty.
| Children | Married-Couple Families | Single-Parent Households |
| No Children | 12 (0.6%) | 10 (6.9%) |
| 1 or 2 Children | 22 (4.8%) | 0 (0.0%) |
| 3 or 4 Children | 0 (0.0%) | 0 (0.0%) |
| 5 or more Children | 0 (0.0%) | 0 (0.0%) |
| Total | 34 (1.4%) | 10 (4.3%) |
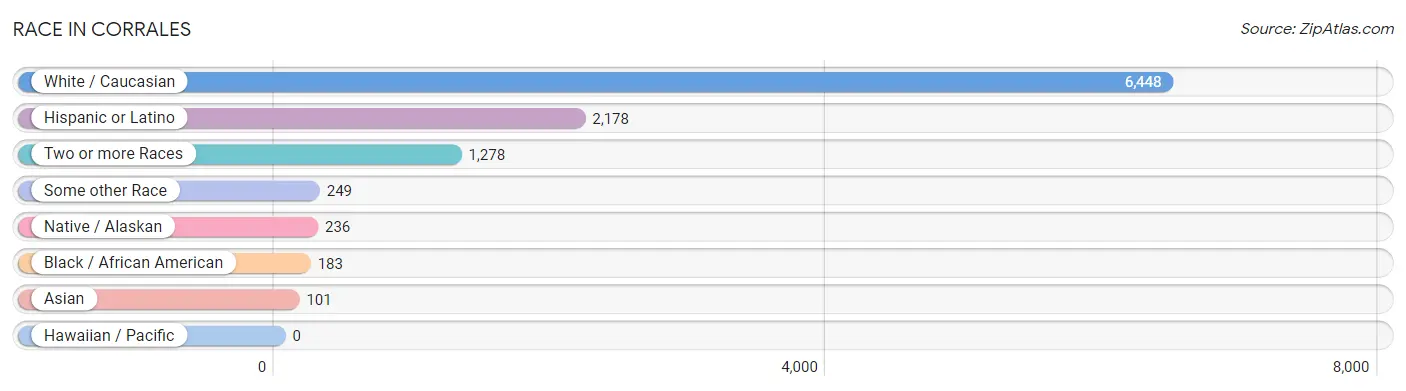
Race in Corrales
The most populous races in Corrales are White / Caucasian (6,448 | 75.9%), Hispanic or Latino (2,178 | 25.6%), and Two or more Races (1,278 | 15.0%).
| Race | # Population | % Population |
| Asian | 101 | 1.2% |
| Black / African American | 183 | 2.1% |
| Hawaiian / Pacific | 0 | 0.0% |
| Hispanic or Latino | 2,178 | 25.6% |
| Native / Alaskan | 236 | 2.8% |
| White / Caucasian | 6,448 | 75.9% |
| Two or more Races | 1,278 | 15.0% |
| Some other Race | 249 | 2.9% |
| Total | 8,495 | 100.0% |
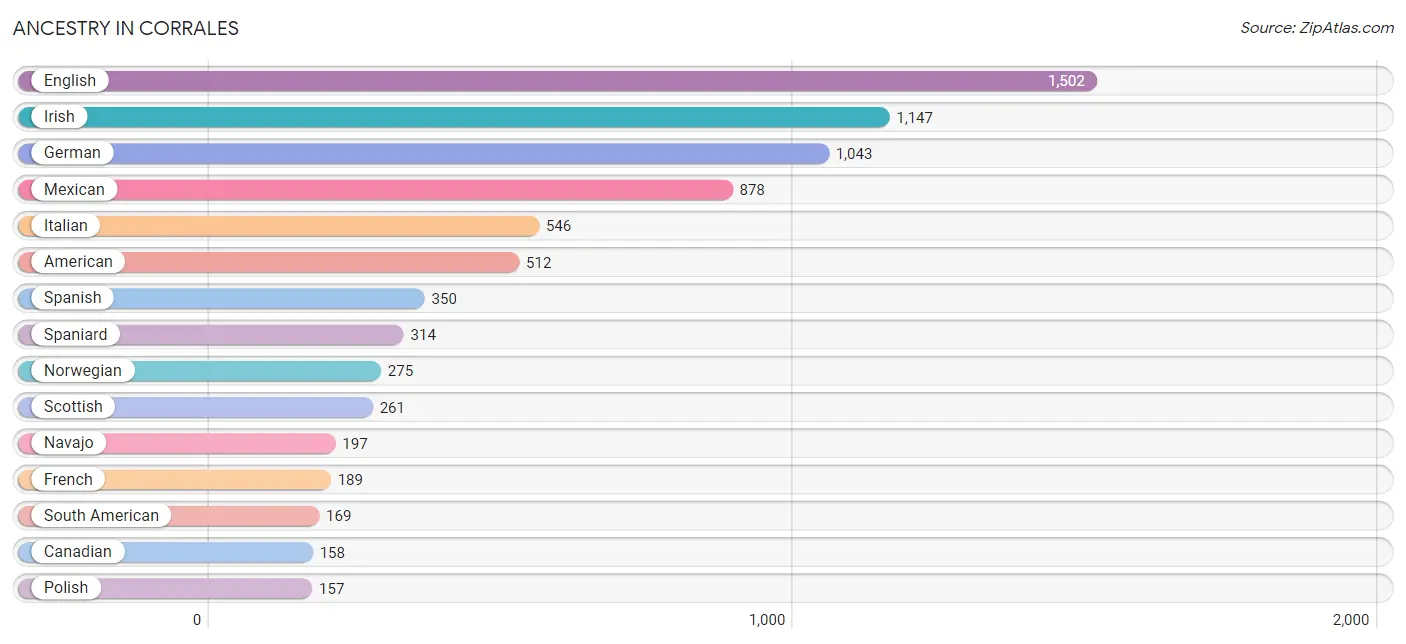
Ancestry in Corrales
The most populous ancestries reported in Corrales are English (1,502 | 17.7%), Irish (1,147 | 13.5%), German (1,043 | 12.3%), Mexican (878 | 10.3%), and Italian (546 | 6.4%), together accounting for 60.2% of all Corrales residents.
| Ancestry | # Population | % Population |
| African | 4 | 0.1% |
| American | 512 | 6.0% |
| Apache | 83 | 1.0% |
| Arab | 78 | 0.9% |
| Argentinean | 7 | 0.1% |
| Armenian | 10 | 0.1% |
| Australian | 11 | 0.1% |
| Austrian | 1 | 0.0% |
| Belgian | 9 | 0.1% |
| Bhutanese | 28 | 0.3% |
| British | 102 | 1.2% |
| Burmese | 69 | 0.8% |
| Canadian | 158 | 1.9% |
| Celtic | 11 | 0.1% |
| Central American | 69 | 0.8% |
| Central American Indian | 17 | 0.2% |
| Chickasaw | 12 | 0.1% |
| Chilean | 128 | 1.5% |
| Choctaw | 29 | 0.3% |
| Colombian | 30 | 0.4% |
| Costa Rican | 7 | 0.1% |
| Croatian | 7 | 0.1% |
| Czech | 29 | 0.3% |
| Danish | 33 | 0.4% |
| Dutch | 62 | 0.7% |
| Eastern European | 39 | 0.5% |
| English | 1,502 | 17.7% |
| European | 82 | 1.0% |
| Finnish | 16 | 0.2% |
| French | 189 | 2.2% |
| French Canadian | 46 | 0.5% |
| German | 1,043 | 12.3% |
| Greek | 61 | 0.7% |
| Guatemalan | 10 | 0.1% |
| Haitian | 14 | 0.2% |
| Hungarian | 8 | 0.1% |
| Indian (Asian) | 36 | 0.4% |
| Indonesian | 16 | 0.2% |
| Irish | 1,147 | 13.5% |
| Italian | 546 | 6.4% |
| Korean | 23 | 0.3% |
| Lebanese | 57 | 0.7% |
| Lithuanian | 27 | 0.3% |
| Mexican | 878 | 10.3% |
| Navajo | 197 | 2.3% |
| Northern European | 48 | 0.6% |
| Norwegian | 275 | 3.2% |
| Pakistani | 3 | 0.0% |
| Polish | 157 | 1.8% |
| Pueblo | 46 | 0.5% |
| Puerto Rican | 1 | 0.0% |
| Russian | 96 | 1.1% |
| Salvadoran | 52 | 0.6% |
| Scandinavian | 52 | 0.6% |
| Scotch-Irish | 134 | 1.6% |
| Scottish | 261 | 3.1% |
| Slavic | 13 | 0.2% |
| Slovak | 29 | 0.3% |
| South American | 169 | 2.0% |
| Spaniard | 314 | 3.7% |
| Spanish | 350 | 4.1% |
| Spanish American | 61 | 0.7% |
| Sri Lankan | 21 | 0.3% |
| Subsaharan African | 4 | 0.1% |
| Swedish | 53 | 0.6% |
| Swiss | 38 | 0.4% |
| Turkish | 13 | 0.2% |
| Ukrainian | 15 | 0.2% |
| Venezuelan | 4 | 0.1% |
| Welsh | 11 | 0.1% | View All 70 Rows |
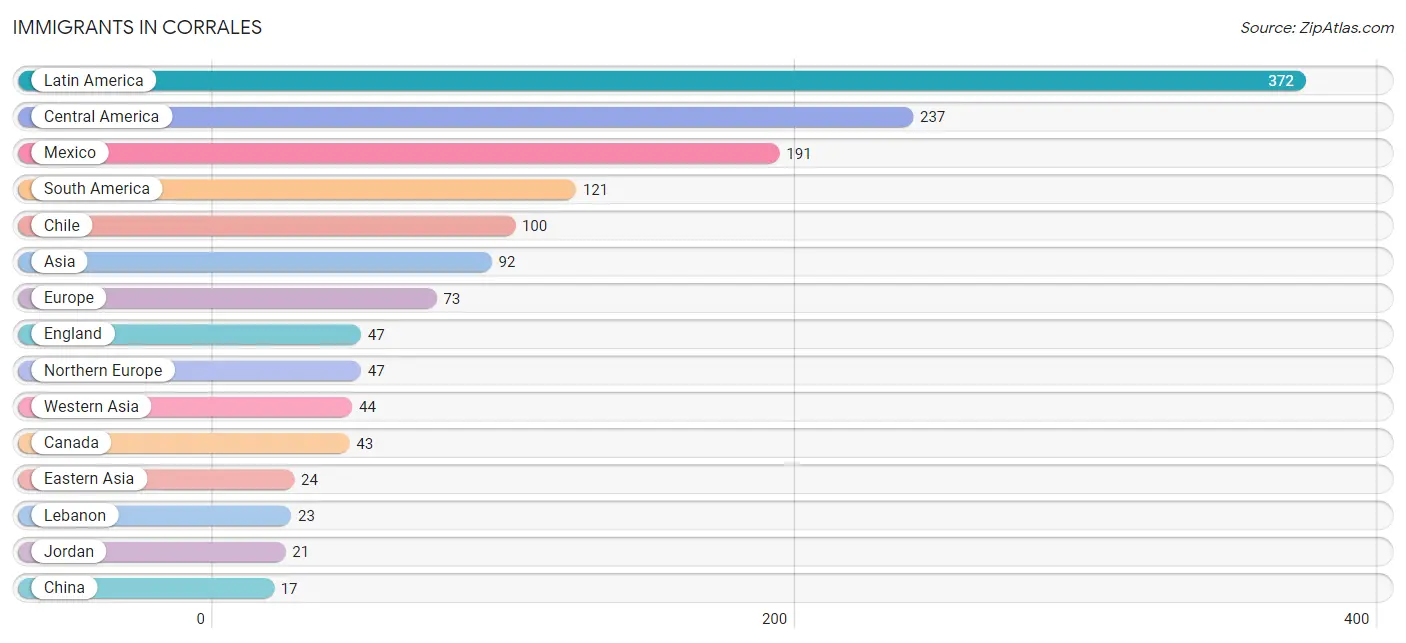
Immigrants in Corrales
The most numerous immigrant groups reported in Corrales came from Latin America (372 | 4.4%), Central America (237 | 2.8%), Mexico (191 | 2.2%), South America (121 | 1.4%), and Chile (100 | 1.2%), together accounting for 12.0% of all Corrales residents.
| Immigration Origin | # Population | % Population |
| Africa | 13 | 0.2% |
| Argentina | 7 | 0.1% |
| Asia | 92 | 1.1% |
| Australia | 5 | 0.1% |
| Canada | 43 | 0.5% |
| Caribbean | 14 | 0.2% |
| Central America | 237 | 2.8% |
| Chile | 100 | 1.2% |
| China | 17 | 0.2% |
| Colombia | 14 | 0.2% |
| Costa Rica | 17 | 0.2% |
| Eastern Africa | 4 | 0.1% |
| Eastern Asia | 24 | 0.3% |
| Egypt | 9 | 0.1% |
| El Salvador | 17 | 0.2% |
| England | 47 | 0.5% |
| Europe | 73 | 0.9% |
| Germany | 6 | 0.1% |
| Greece | 9 | 0.1% |
| Guatemala | 12 | 0.1% |
| Haiti | 14 | 0.2% |
| India | 8 | 0.1% |
| Jordan | 21 | 0.3% |
| Korea | 7 | 0.1% |
| Latin America | 372 | 4.4% |
| Lebanon | 23 | 0.3% |
| Mexico | 191 | 2.2% |
| Netherlands | 11 | 0.1% |
| Northern Africa | 9 | 0.1% |
| Northern Europe | 47 | 0.5% |
| Oceania | 5 | 0.1% |
| Philippines | 13 | 0.2% |
| South America | 121 | 1.4% |
| South Central Asia | 8 | 0.1% |
| South Eastern Asia | 16 | 0.2% |
| Southern Europe | 9 | 0.1% |
| Thailand | 3 | 0.0% |
| Western Asia | 44 | 0.5% |
| Western Europe | 17 | 0.2% | View All 39 Rows |
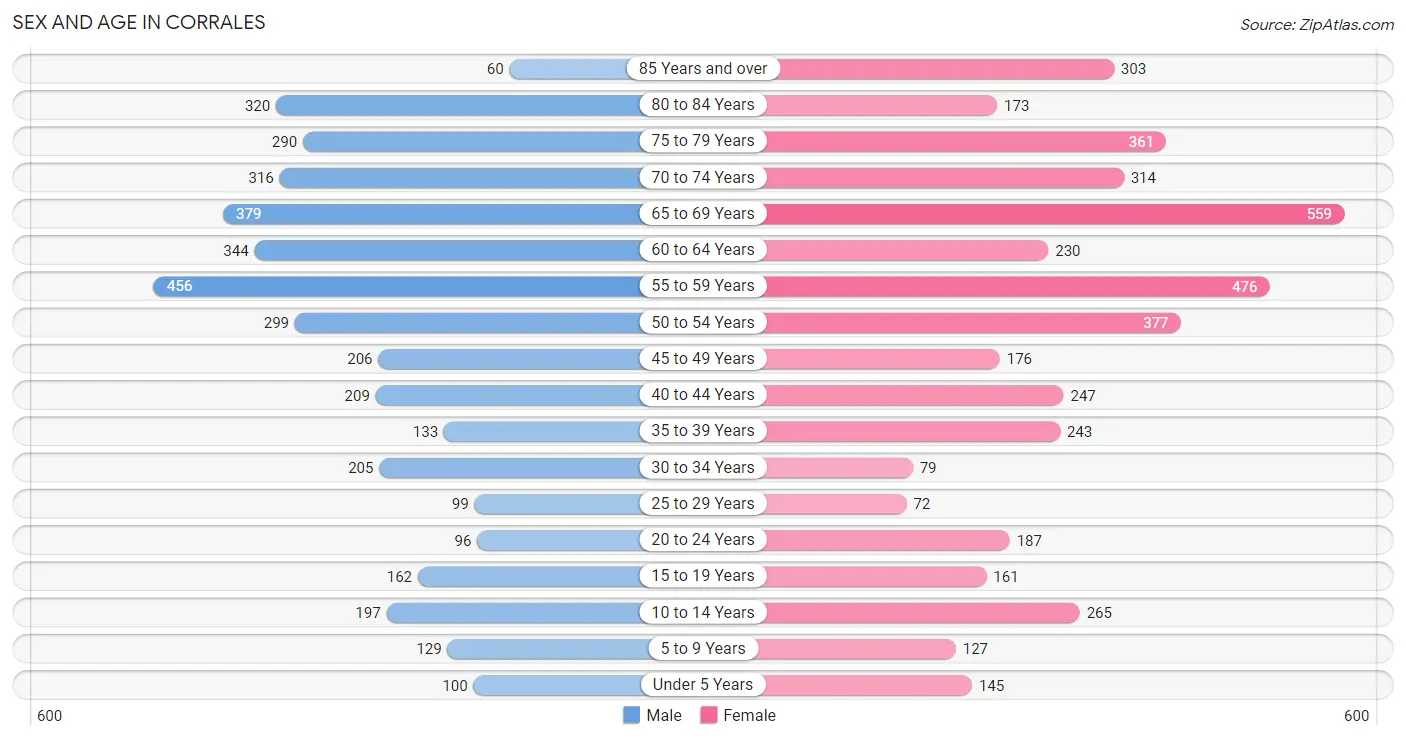
Sex and Age in Corrales
Sex and Age in Corrales
The most populous age groups in Corrales are 55 to 59 Years (456 | 11.4%) for men and 65 to 69 Years (559 | 12.4%) for women.
| Age Bracket | Male | Female |
| Under 5 Years | 100 (2.5%) | 145 (3.2%) |
| 5 to 9 Years | 129 (3.2%) | 127 (2.8%) |
| 10 to 14 Years | 197 (4.9%) | 265 (5.9%) |
| 15 to 19 Years | 162 (4.1%) | 161 (3.6%) |
| 20 to 24 Years | 96 (2.4%) | 187 (4.2%) |
| 25 to 29 Years | 99 (2.5%) | 72 (1.6%) |
| 30 to 34 Years | 205 (5.1%) | 79 (1.8%) |
| 35 to 39 Years | 133 (3.3%) | 243 (5.4%) |
| 40 to 44 Years | 209 (5.2%) | 247 (5.5%) |
| 45 to 49 Years | 206 (5.1%) | 176 (3.9%) |
| 50 to 54 Years | 299 (7.5%) | 377 (8.4%) |
| 55 to 59 Years | 456 (11.4%) | 476 (10.6%) |
| 60 to 64 Years | 344 (8.6%) | 230 (5.1%) |
| 65 to 69 Years | 379 (9.5%) | 559 (12.4%) |
| 70 to 74 Years | 316 (7.9%) | 314 (7.0%) |
| 75 to 79 Years | 290 (7.2%) | 361 (8.0%) |
| 80 to 84 Years | 320 (8.0%) | 173 (3.8%) |
| 85 Years and over | 60 (1.5%) | 303 (6.7%) |
| Total | 4,000 (100.0%) | 4,495 (100.0%) |
Families and Households in Corrales
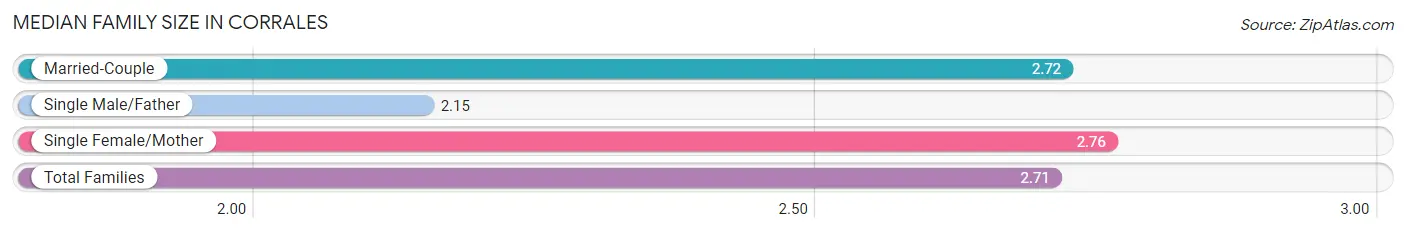
Median Family Size in Corrales
The median family size in Corrales is 2.71 persons per family, with single female/mother families (145 | 5.5%) accounting for the largest median family size of 2.76 persons per family. On the other hand, single male/father families (87 | 3.3%) represent the smallest median family size with 2.15 persons per family.
| Family Type | # Families | Family Size |
| Married-Couple | 2,383 (91.1%) | 2.72 |
| Single Male/Father | 87 (3.3%) | 2.15 |
| Single Female/Mother | 145 (5.5%) | 2.76 |
| Total Families | 2,615 (100.0%) | 2.71 |
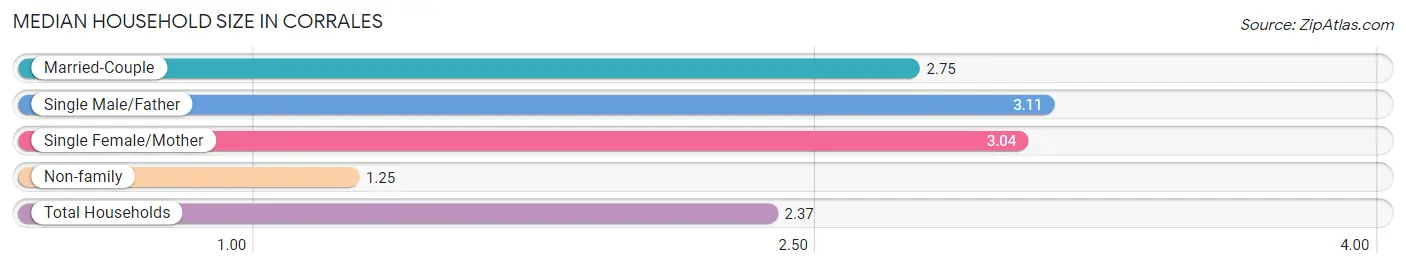
Median Household Size in Corrales
The median household size in Corrales is 2.37 persons per household, with single male/father households (87 | 2.4%) accounting for the largest median household size of 3.11 persons per household. non-family households (959 | 26.8%) represent the smallest median household size with 1.25 persons per household.
| Household Type | # Households | Household Size |
| Married-Couple | 2,383 (66.7%) | 2.75 |
| Single Male/Father | 87 (2.4%) | 3.11 |
| Single Female/Mother | 145 (4.1%) | 3.04 |
| Non-family | 959 (26.8%) | 1.25 |
| Total Households | 3,574 (100.0%) | 2.37 |
Household Size by Marriage Status in Corrales
Out of a total of 3,574 households in Corrales, 2,615 (73.2%) are family households, while 959 (26.8%) are nonfamily households. The most numerous type of family households are 2-person households, comprising 1,645, and the most common type of nonfamily households are 1-person households, comprising 739.
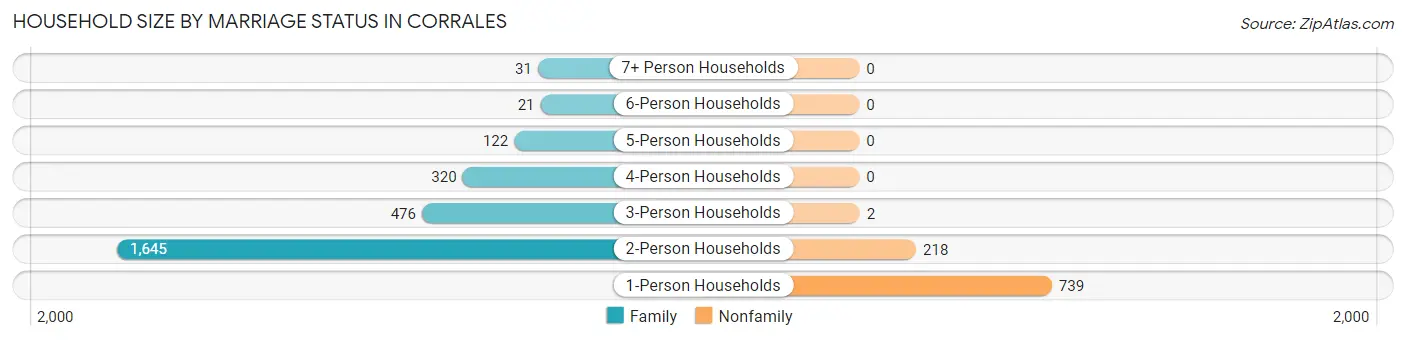
| Household Size | Family Households | Nonfamily Households |
| 1-Person Households | - | 739 (20.7%) |
| 2-Person Households | 1,645 (46.0%) | 218 (6.1%) |
| 3-Person Households | 476 (13.3%) | 2 (0.1%) |
| 4-Person Households | 320 (8.9%) | 0 (0.0%) |
| 5-Person Households | 122 (3.4%) | 0 (0.0%) |
| 6-Person Households | 21 (0.6%) | 0 (0.0%) |
| 7+ Person Households | 31 (0.9%) | 0 (0.0%) |
| Total | 2,615 (73.2%) | 959 (26.8%) |
Female Fertility in Corrales
Fertility by Age in Corrales
Average fertility rate in Corrales is 22.0 births per 1,000 women. Women in the age bracket of 20 to 34 years have the highest fertility rate with 59.0 births per 1,000 women. Women in the age bracket of 20 to 34 years acount for 74.1% of all women with births.
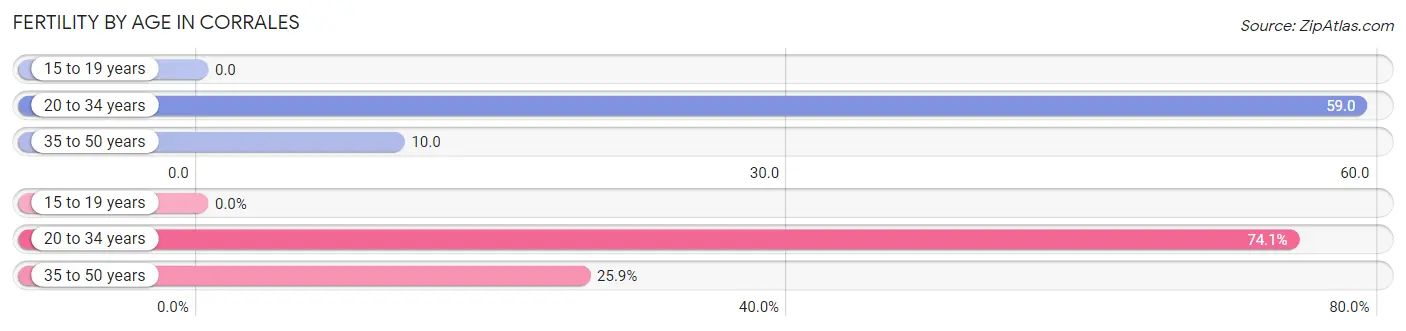
| Age Bracket | Women with Births | Births / 1,000 Women |
| 15 to 19 years | 0 (0.0%) | 0.0 |
| 20 to 34 years | 20 (74.1%) | 59.0 |
| 35 to 50 years | 7 (25.9%) | 10.0 |
| Total | 27 (100.0%) | 22.0 |
Fertility by Age by Marriage Status in Corrales
51.9% of women with births (27) in Corrales are married. The highest percentage of unmarried women with births falls into 20 to 34 years age bracket with 65.0% of them unmarried at the time of birth, while the lowest percentage of unmarried women with births belong to 35 to 50 years age bracket with 0.0% of them unmarried.
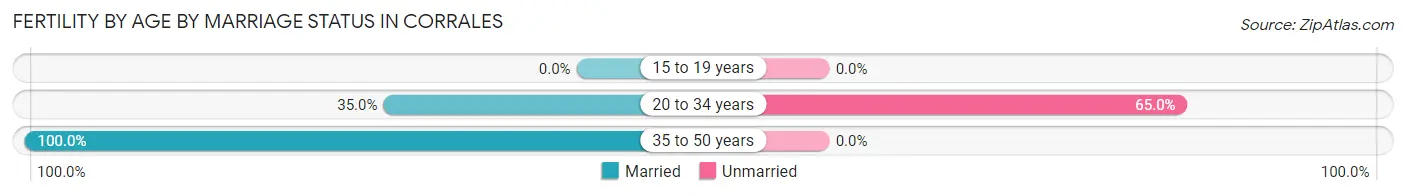
| Age Bracket | Married | Unmarried |
| 15 to 19 years | 0 (0.0%) | 0 (0.0%) |
| 20 to 34 years | 7 (35.0%) | 13 (65.0%) |
| 35 to 50 years | 7 (100.0%) | 0 (0.0%) |
| Total | 14 (51.8%) | 13 (48.1%) |
Fertility by Education in Corrales
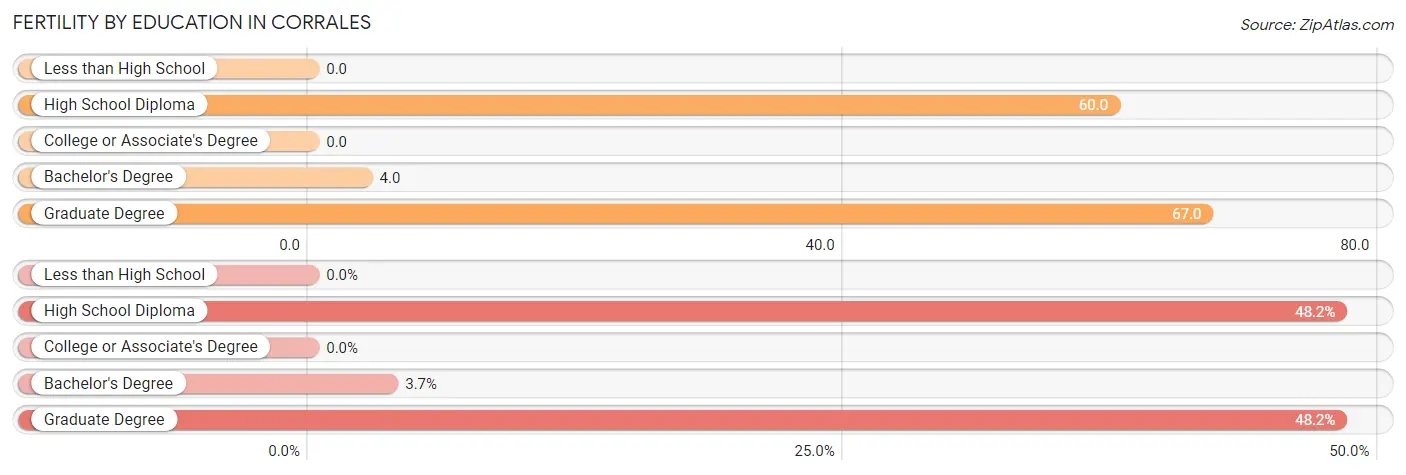
| Educational Attainment | Women with Births | Births / 1,000 Women |
| Less than High School | 0 (0.0%) | 0.0 |
| High School Diploma | 13 (48.1%) | 60.0 |
| College or Associate's Degree | 0 (0.0%) | 0.0 |
| Bachelor's Degree | 1 (3.7%) | 4.0 |
| Graduate Degree | 13 (48.1%) | 67.0 |
| Total | 27 (100.0%) | 22.0 |
Fertility by Education by Marriage Status in Corrales
48.1% of women with births in Corrales are unmarried. Women with the educational attainment of bachelor's degree are most likely to be married with 100.0% of them married at childbirth, while women with the educational attainment of high school diploma are least likely to be married with 100.0% of them unmarried at childbirth.
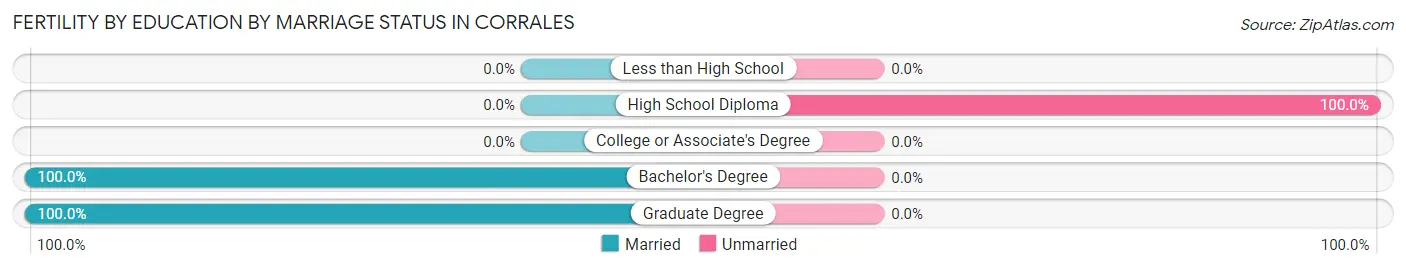
| Educational Attainment | Married | Unmarried |
| Less than High School | 0 (0.0%) | 0 (0.0%) |
| High School Diploma | 0 (0.0%) | 13 (100.0%) |
| College or Associate's Degree | 0 (0.0%) | 0 (0.0%) |
| Bachelor's Degree | 1 (100.0%) | 0 (0.0%) |
| Graduate Degree | 13 (100.0%) | 0 (0.0%) |
| Total | 14 (51.8%) | 13 (48.1%) |
Employment Characteristics in Corrales
Employment by Class of Employer in Corrales
Among the 3,866 employed individuals in Corrales, private company employees (1,928 | 49.9%), self-employed (not incorporated) (553 | 14.3%), and self-employed (incorporated) (453 | 11.7%) make up the most common classes of employment.
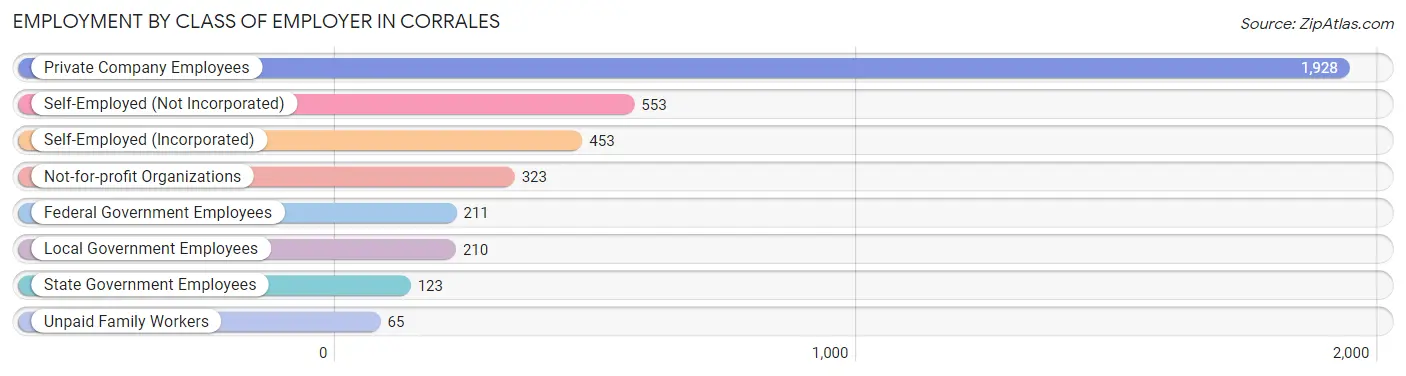
| Employer Class | # Employees | % Employees |
| Private Company Employees | 1,928 | 49.9% |
| Self-Employed (Incorporated) | 453 | 11.7% |
| Self-Employed (Not Incorporated) | 553 | 14.3% |
| Not-for-profit Organizations | 323 | 8.4% |
| Local Government Employees | 210 | 5.4% |
| State Government Employees | 123 | 3.2% |
| Federal Government Employees | 211 | 5.5% |
| Unpaid Family Workers | 65 | 1.7% |
| Total | 3,866 | 100.0% |
Employment Status by Age in Corrales
According to the labor force statistics for Corrales, out of the total population over 16 years of age (7,456), 54.9% or 4,093 individuals are in the labor force, with 4.6% or 188 of them unemployed. The age group with the highest labor force participation rate is 55 to 59 years, with 90.6% or 844 individuals in the labor force. Within the labor force, the 25 to 29 years age range has the highest percentage of unemployed individuals, with 15.5% or 17 of them being unemployed.
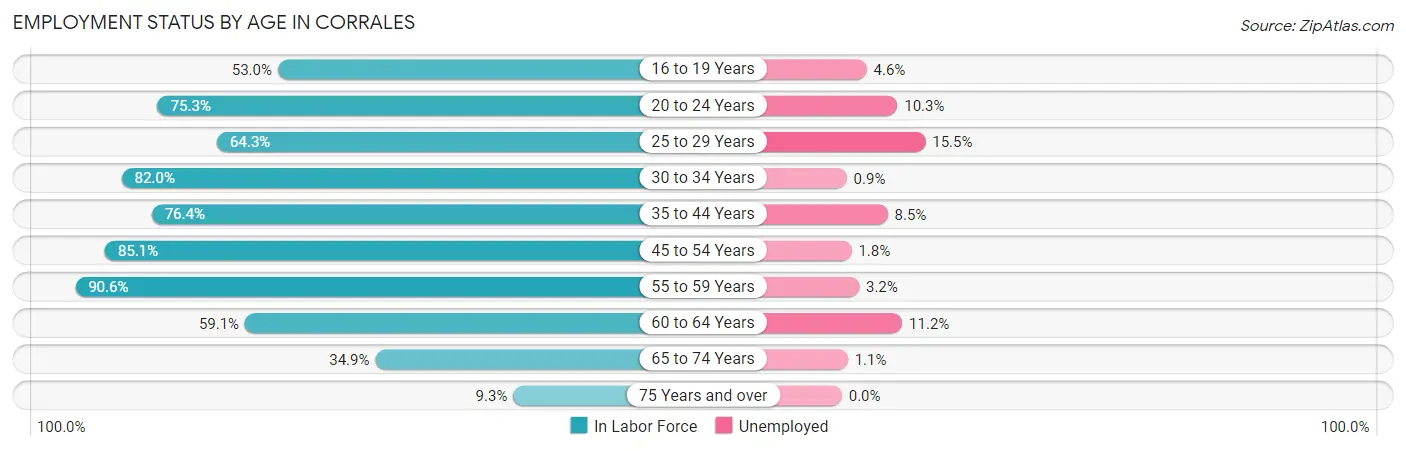
| Age Bracket | In Labor Force | Unemployed |
| 16 to 19 Years | 131 (53.0%) | 6 (4.6%) |
| 20 to 24 Years | 213 (75.3%) | 22 (10.3%) |
| 25 to 29 Years | 110 (64.3%) | 17 (15.5%) |
| 30 to 34 Years | 233 (82.0%) | 2 (0.9%) |
| 35 to 44 Years | 636 (76.4%) | 54 (8.5%) |
| 45 to 54 Years | 900 (85.1%) | 16 (1.8%) |
| 55 to 59 Years | 844 (90.6%) | 27 (3.2%) |
| 60 to 64 Years | 339 (59.1%) | 38 (11.2%) |
| 65 to 74 Years | 547 (34.9%) | 6 (1.1%) |
| 75 Years and over | 140 (9.3%) | 0 (0.0%) |
| Total | 4,093 (54.9%) | 188 (4.6%) |
Employment Status by Educational Attainment in Corrales
According to labor force statistics for Corrales, 79.5% of individuals (3,062) out of the total population between 25 and 64 years of age (3,851) are in the labor force, with 5.0% or 153 of them being unemployed. The group with the highest labor force participation rate are those with the educational attainment of bachelor's degree or higher, with 84.2% or 1,769 individuals in the labor force. Within the labor force, individuals with less than high school education have the highest percentage of unemployment, with 20.3% or 31 of them being unemployed.
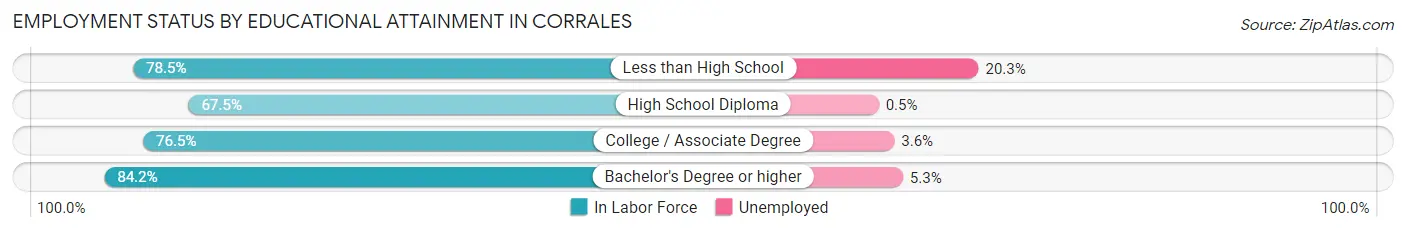
| Educational Attainment | In Labor Force | Unemployed |
| Less than High School | 153 (78.5%) | 40 (20.3%) |
| High School Diploma | 382 (67.5%) | 3 (0.5%) |
| College / Associate Degree | 757 (76.5%) | 36 (3.6%) |
| Bachelor's Degree or higher | 1,769 (84.2%) | 111 (5.3%) |
| Total | 3,062 (79.5%) | 193 (5.0%) |
Employment Occupations by Sex in Corrales
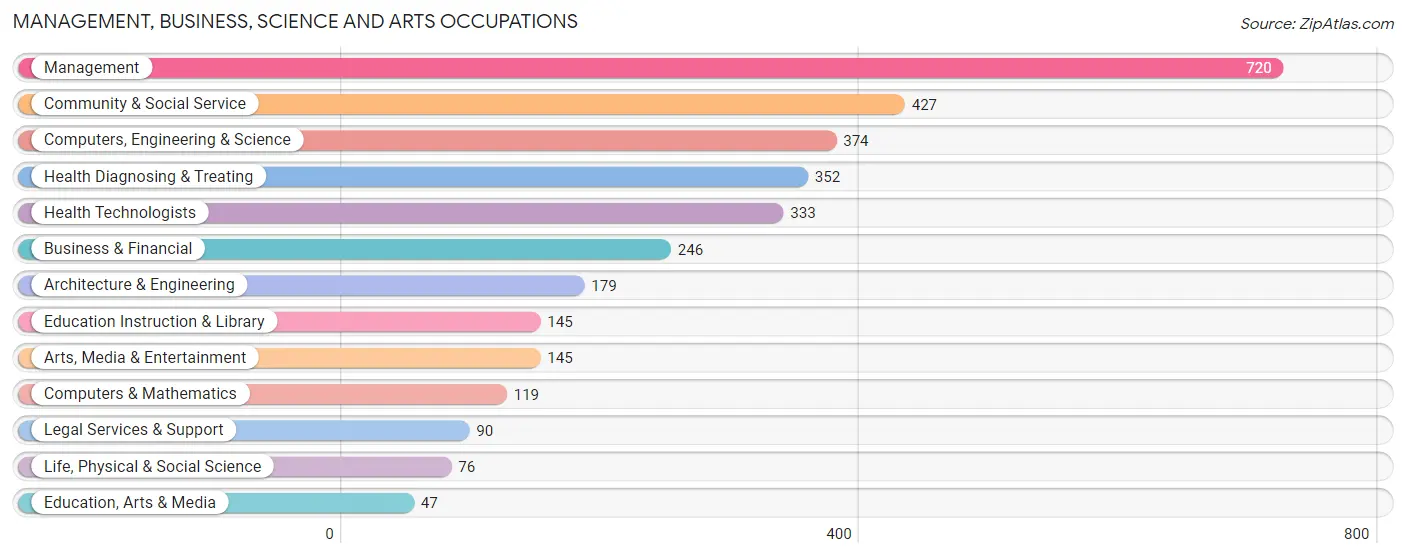
Management, Business, Science and Arts Occupations
The most common Management, Business, Science and Arts occupations in Corrales are Management (720 | 18.4%), Community & Social Service (427 | 10.9%), Computers, Engineering & Science (374 | 9.6%), Health Diagnosing & Treating (352 | 9.0%), and Health Technologists (333 | 8.5%).
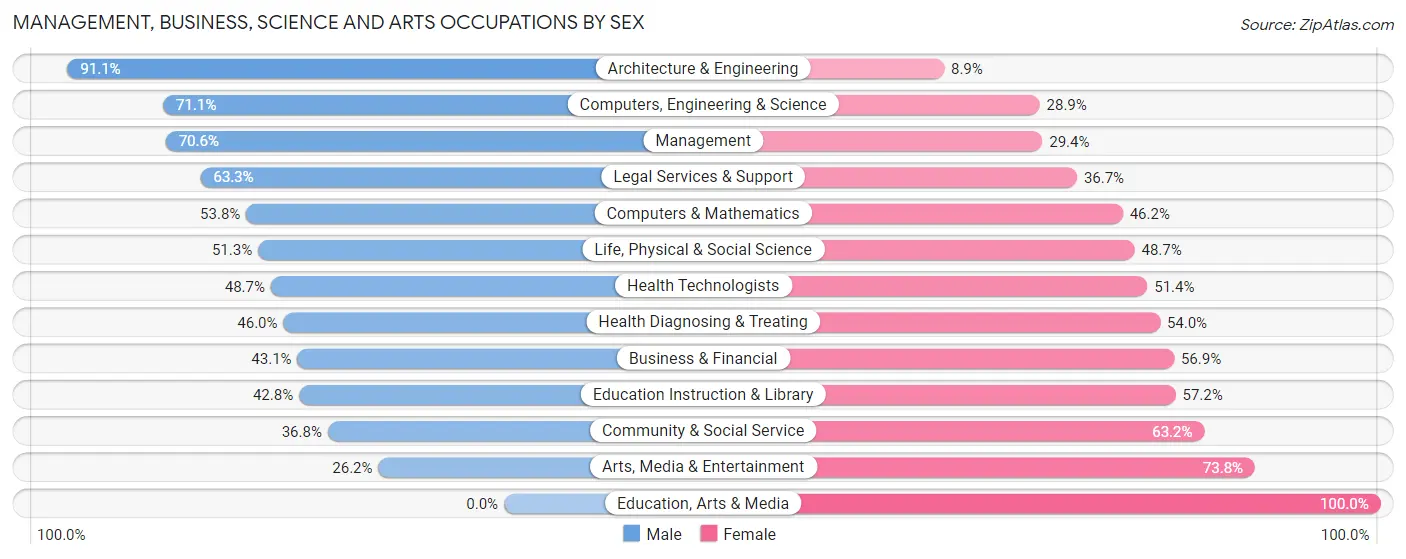
Management, Business, Science and Arts Occupations by Sex
Within the Management, Business, Science and Arts occupations in Corrales, the most male-oriented occupations are Architecture & Engineering (91.1%), Computers, Engineering & Science (71.1%), and Management (70.6%), while the most female-oriented occupations are Education, Arts & Media (100.0%), Arts, Media & Entertainment (73.8%), and Community & Social Service (63.2%).
| Occupation | Male | Female |
| Management | 508 (70.6%) | 212 (29.4%) |
| Business & Financial | 106 (43.1%) | 140 (56.9%) |
| Computers, Engineering & Science | 266 (71.1%) | 108 (28.9%) |
| Computers & Mathematics | 64 (53.8%) | 55 (46.2%) |
| Architecture & Engineering | 163 (91.1%) | 16 (8.9%) |
| Life, Physical & Social Science | 39 (51.3%) | 37 (48.7%) |
| Community & Social Service | 157 (36.8%) | 270 (63.2%) |
| Education, Arts & Media | 0 (0.0%) | 47 (100.0%) |
| Legal Services & Support | 57 (63.3%) | 33 (36.7%) |
| Education Instruction & Library | 62 (42.8%) | 83 (57.2%) |
| Arts, Media & Entertainment | 38 (26.2%) | 107 (73.8%) |
| Health Diagnosing & Treating | 162 (46.0%) | 190 (54.0%) |
| Health Technologists | 162 (48.6%) | 171 (51.3%) |
| Total (Category) | 1,199 (56.6%) | 920 (43.4%) |
| Total (Overall) | 2,125 (54.4%) | 1,778 (45.6%) |
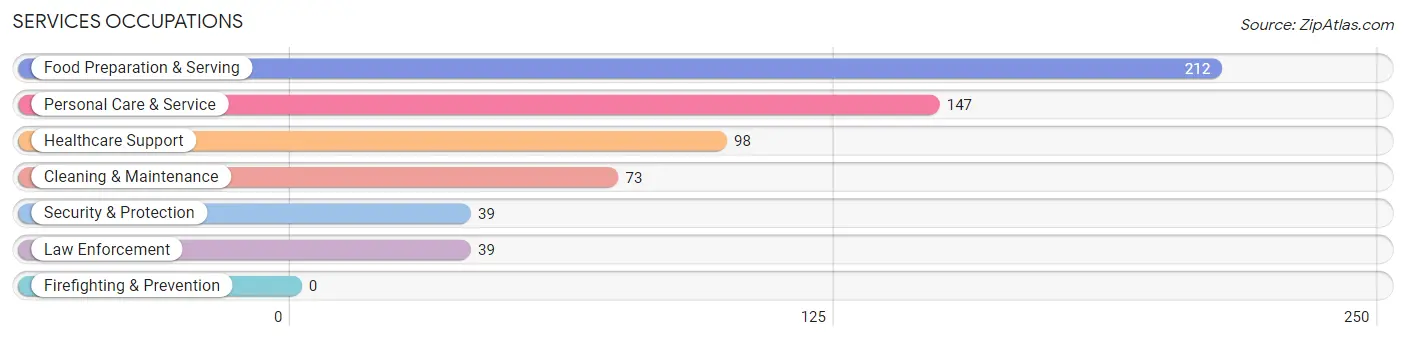
Services Occupations
The most common Services occupations in Corrales are Food Preparation & Serving (212 | 5.4%), Personal Care & Service (147 | 3.8%), Healthcare Support (98 | 2.5%), Cleaning & Maintenance (73 | 1.9%), and Security & Protection (39 | 1.0%).
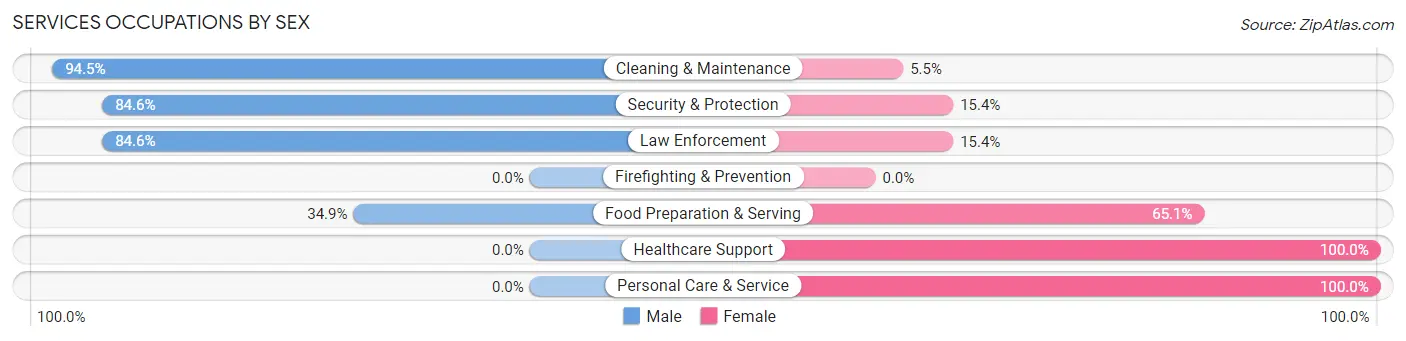
Services Occupations by Sex
Within the Services occupations in Corrales, the most male-oriented occupations are Cleaning & Maintenance (94.5%), Security & Protection (84.6%), and Law Enforcement (84.6%), while the most female-oriented occupations are Healthcare Support (100.0%), Personal Care & Service (100.0%), and Food Preparation & Serving (65.1%).
| Occupation | Male | Female |
| Healthcare Support | 0 (0.0%) | 98 (100.0%) |
| Security & Protection | 33 (84.6%) | 6 (15.4%) |
| Firefighting & Prevention | 0 (0.0%) | 0 (0.0%) |
| Law Enforcement | 33 (84.6%) | 6 (15.4%) |
| Food Preparation & Serving | 74 (34.9%) | 138 (65.1%) |
| Cleaning & Maintenance | 69 (94.5%) | 4 (5.5%) |
| Personal Care & Service | 0 (0.0%) | 147 (100.0%) |
| Total (Category) | 176 (30.9%) | 393 (69.1%) |
| Total (Overall) | 2,125 (54.4%) | 1,778 (45.6%) |
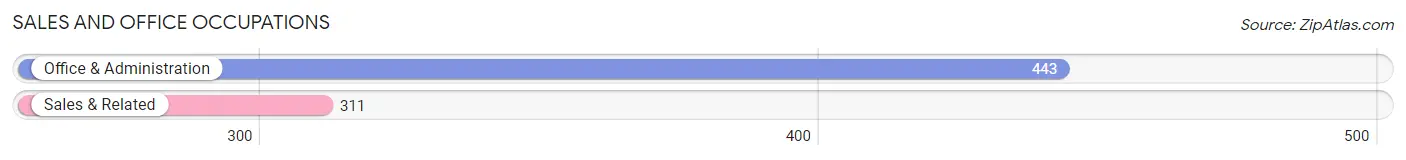
Sales and Office Occupations
The most common Sales and Office occupations in Corrales are Office & Administration (443 | 11.4%), and Sales & Related (311 | 8.0%).
Sales and Office Occupations by Sex
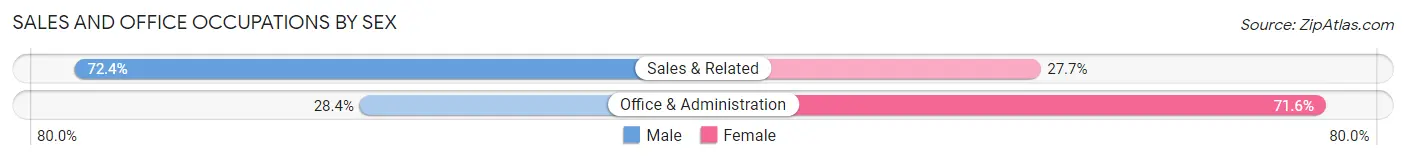
| Occupation | Male | Female |
| Sales & Related | 225 (72.4%) | 86 (27.7%) |
| Office & Administration | 126 (28.4%) | 317 (71.6%) |
| Total (Category) | 351 (46.6%) | 403 (53.4%) |
| Total (Overall) | 2,125 (54.4%) | 1,778 (45.6%) |
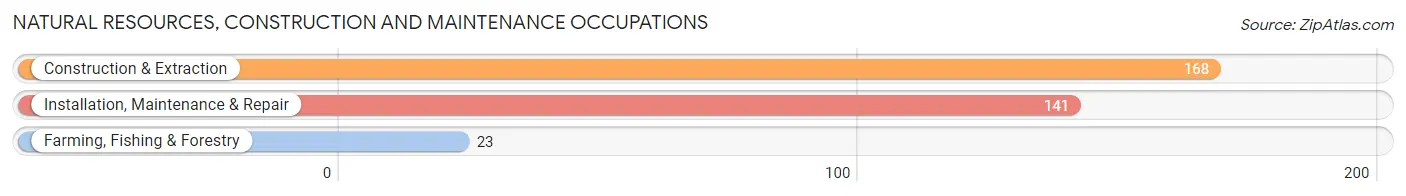
Natural Resources, Construction and Maintenance Occupations
The most common Natural Resources, Construction and Maintenance occupations in Corrales are Construction & Extraction (168 | 4.3%), Installation, Maintenance & Repair (141 | 3.6%), and Farming, Fishing & Forestry (23 | 0.6%).
Natural Resources, Construction and Maintenance Occupations by Sex
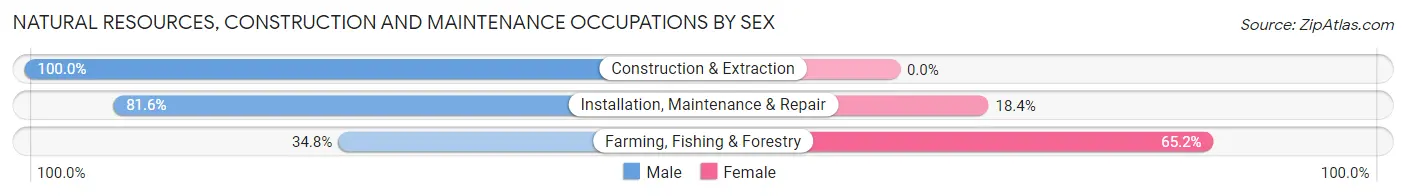
| Occupation | Male | Female |
| Farming, Fishing & Forestry | 8 (34.8%) | 15 (65.2%) |
| Construction & Extraction | 168 (100.0%) | 0 (0.0%) |
| Installation, Maintenance & Repair | 115 (81.6%) | 26 (18.4%) |
| Total (Category) | 291 (87.6%) | 41 (12.3%) |
| Total (Overall) | 2,125 (54.4%) | 1,778 (45.6%) |
Production, Transportation and Moving Occupations
The most common Production, Transportation and Moving occupations in Corrales are Production (76 | 1.9%), Transportation (32 | 0.8%), and Material Moving (21 | 0.5%).
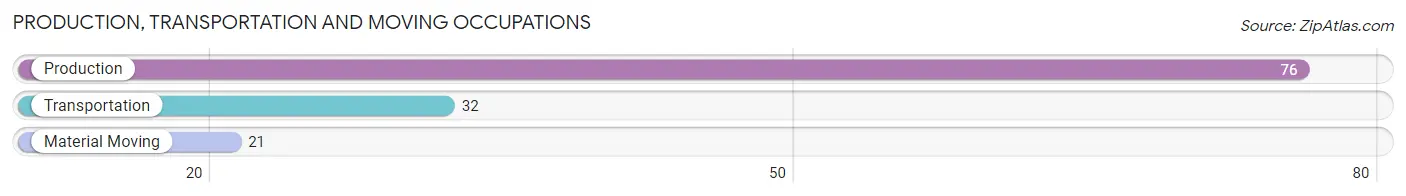
Production, Transportation and Moving Occupations by Sex
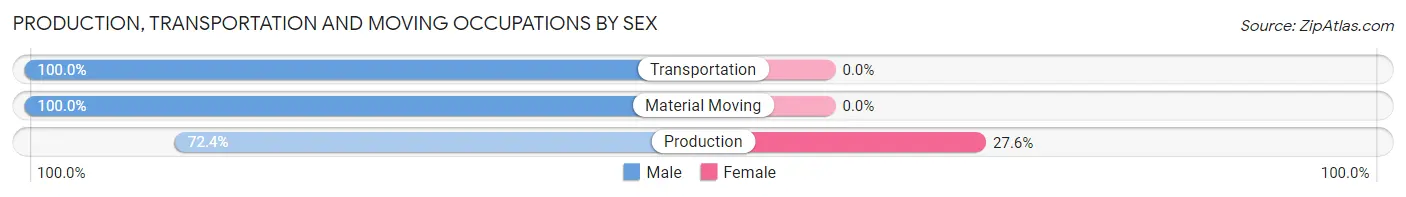
| Occupation | Male | Female |
| Production | 55 (72.4%) | 21 (27.6%) |
| Transportation | 32 (100.0%) | 0 (0.0%) |
| Material Moving | 21 (100.0%) | 0 (0.0%) |
| Total (Category) | 108 (83.7%) | 21 (16.3%) |
| Total (Overall) | 2,125 (54.4%) | 1,778 (45.6%) |
Employment Industries by Sex in Corrales
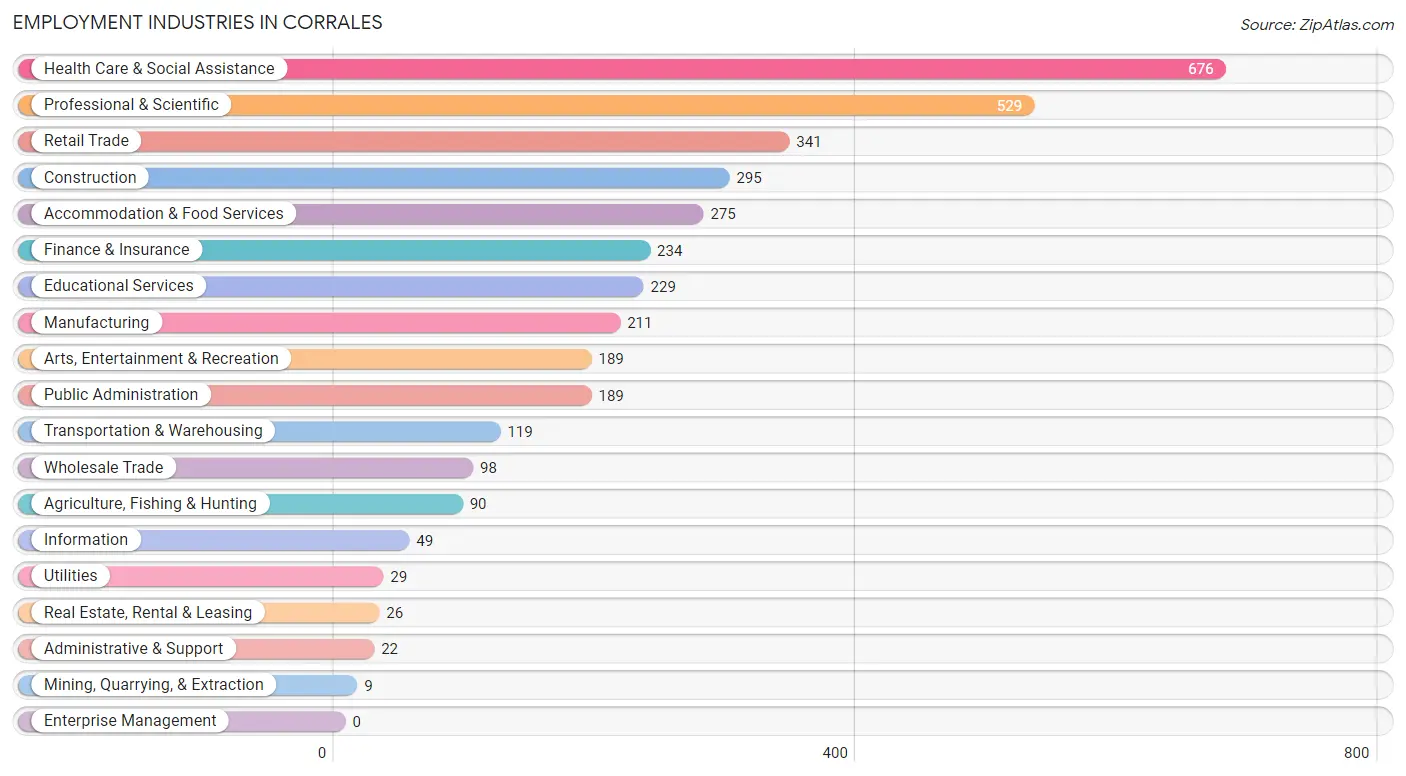
Employment Industries in Corrales
The major employment industries in Corrales include Health Care & Social Assistance (676 | 17.3%), Professional & Scientific (529 | 13.6%), Retail Trade (341 | 8.7%), Construction (295 | 7.6%), and Accommodation & Food Services (275 | 7.0%).
Employment Industries by Sex in Corrales
The Corrales industries that see more men than women are Mining, Quarrying, & Extraction (100.0%), Transportation & Warehousing (100.0%), and Utilities (100.0%), whereas the industries that tend to have a higher number of women are Arts, Entertainment & Recreation (76.2%), Finance & Insurance (72.2%), and Information (69.4%).
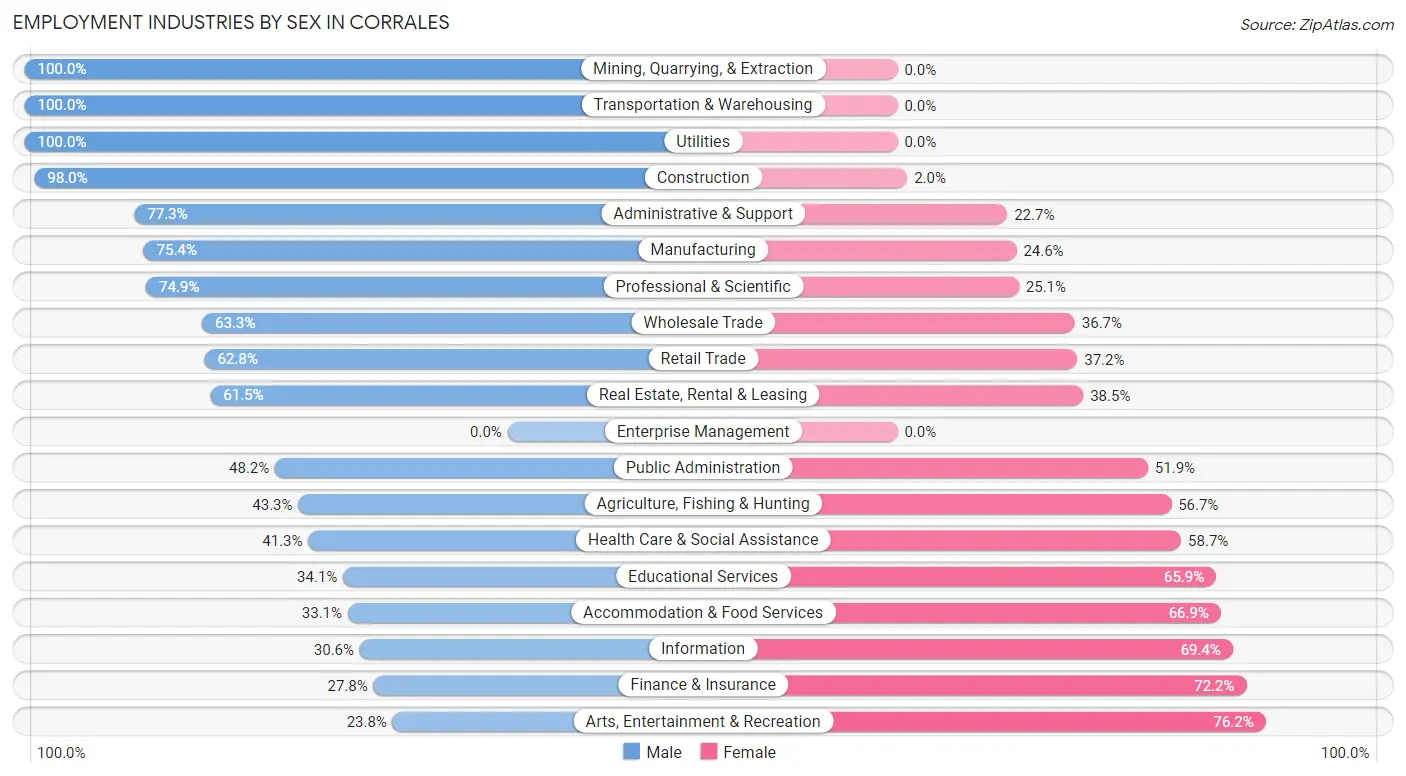
| Industry | Male | Female |
| Agriculture, Fishing & Hunting | 39 (43.3%) | 51 (56.7%) |
| Mining, Quarrying, & Extraction | 9 (100.0%) | 0 (0.0%) |
| Construction | 289 (98.0%) | 6 (2.0%) |
| Manufacturing | 159 (75.4%) | 52 (24.6%) |
| Wholesale Trade | 62 (63.3%) | 36 (36.7%) |
| Retail Trade | 214 (62.8%) | 127 (37.2%) |
| Transportation & Warehousing | 119 (100.0%) | 0 (0.0%) |
| Utilities | 29 (100.0%) | 0 (0.0%) |
| Information | 15 (30.6%) | 34 (69.4%) |
| Finance & Insurance | 65 (27.8%) | 169 (72.2%) |
| Real Estate, Rental & Leasing | 16 (61.5%) | 10 (38.5%) |
| Professional & Scientific | 396 (74.9%) | 133 (25.1%) |
| Enterprise Management | 0 (0.0%) | 0 (0.0%) |
| Administrative & Support | 17 (77.3%) | 5 (22.7%) |
| Educational Services | 78 (34.1%) | 151 (65.9%) |
| Health Care & Social Assistance | 279 (41.3%) | 397 (58.7%) |
| Arts, Entertainment & Recreation | 45 (23.8%) | 144 (76.2%) |
| Accommodation & Food Services | 91 (33.1%) | 184 (66.9%) |
| Public Administration | 91 (48.1%) | 98 (51.8%) |
| Total | 2,125 (54.4%) | 1,778 (45.6%) |
Education in Corrales
School Enrollment in Corrales
The most common levels of schooling among the 1,265 students in Corrales are middle school (347 | 27.4%), college / undergraduate (248 | 19.6%), and elementary school (235 | 18.6%).
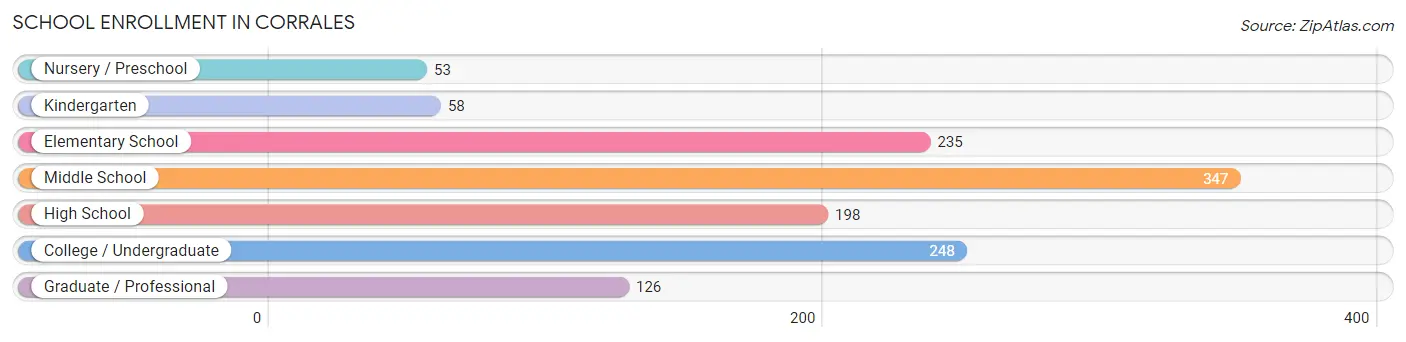
| School Level | # Students | % Students |
| Nursery / Preschool | 53 | 4.2% |
| Kindergarten | 58 | 4.6% |
| Elementary School | 235 | 18.6% |
| Middle School | 347 | 27.4% |
| High School | 198 | 15.7% |
| College / Undergraduate | 248 | 19.6% |
| Graduate / Professional | 126 | 10.0% |
| Total | 1,265 | 100.0% |
School Enrollment by Age by Funding Source in Corrales
Out of a total of 1,265 students who are enrolled in schools in Corrales, 286 (22.6%) attend a private institution, while the remaining 979 (77.4%) are enrolled in public schools. The age group of 3 to 4 year olds has the highest likelihood of being enrolled in private schools, with 40 (75.5% in the age bracket) enrolled. Conversely, the age group of 20 to 24 year olds has the lowest likelihood of being enrolled in a private school, with 130 (89.7% in the age bracket) attending a public institution.
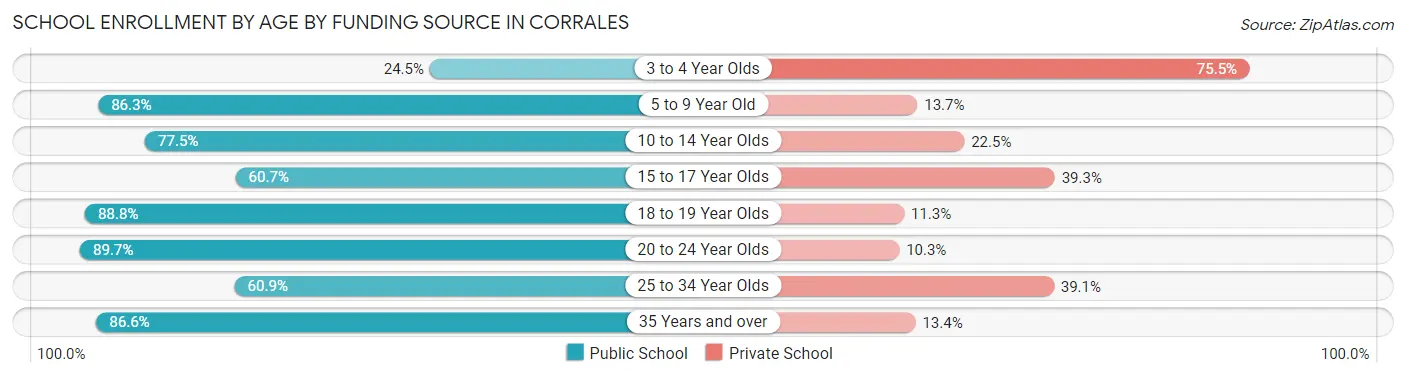
| Age Bracket | Public School | Private School |
| 3 to 4 Year Olds | 13 (24.5%) | 40 (75.5%) |
| 5 to 9 Year Old | 195 (86.3%) | 31 (13.7%) |
| 10 to 14 Year Olds | 328 (77.5%) | 95 (22.5%) |
| 15 to 17 Year Olds | 105 (60.7%) | 68 (39.3%) |
| 18 to 19 Year Olds | 71 (88.7%) | 9 (11.3%) |
| 20 to 24 Year Olds | 130 (89.7%) | 15 (10.3%) |
| 25 to 34 Year Olds | 14 (60.9%) | 9 (39.1%) |
| 35 Years and over | 123 (86.6%) | 19 (13.4%) |
| Total | 979 (77.4%) | 286 (22.6%) |
Educational Attainment by Field of Study in Corrales
Business (691 | 17.6%), bio, nature & agricultural (440 | 11.2%), science & technology (382 | 9.7%), education (350 | 8.9%), and engineering (311 | 7.9%) are the most common fields of study among 3,933 individuals in Corrales who have obtained a bachelor's degree or higher.
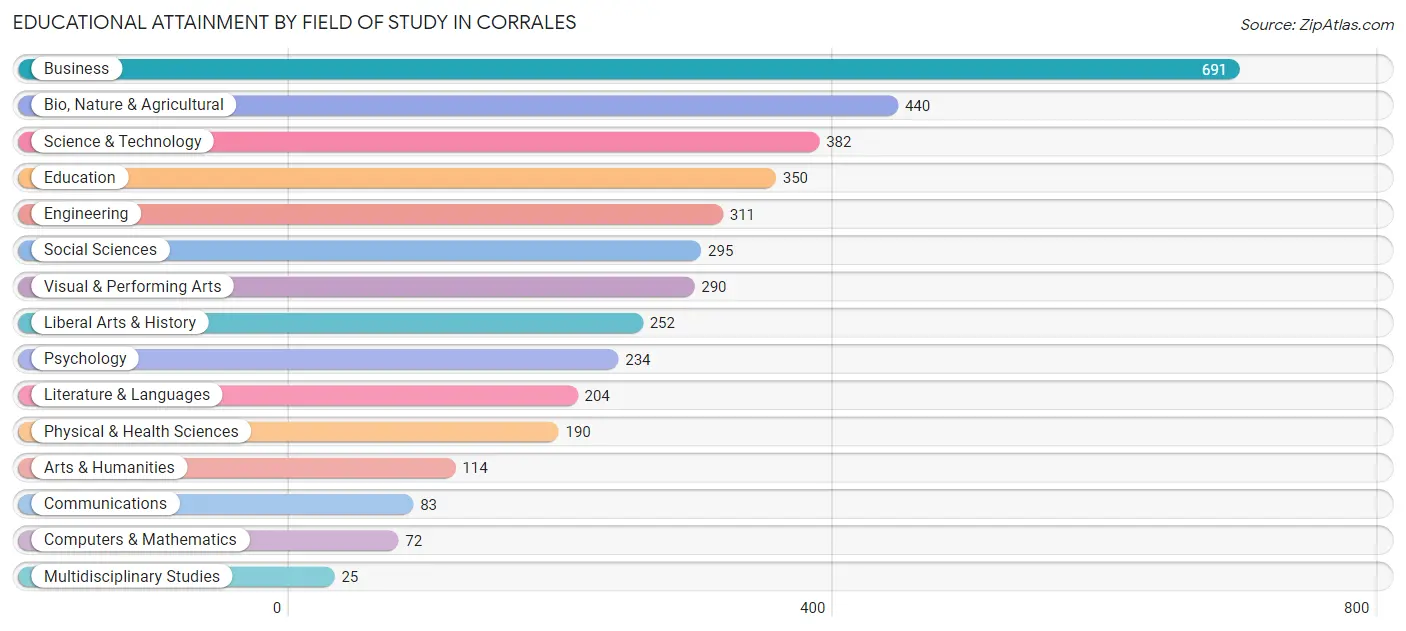
| Field of Study | # Graduates | % Graduates |
| Computers & Mathematics | 72 | 1.8% |
| Bio, Nature & Agricultural | 440 | 11.2% |
| Physical & Health Sciences | 190 | 4.8% |
| Psychology | 234 | 5.9% |
| Social Sciences | 295 | 7.5% |
| Engineering | 311 | 7.9% |
| Multidisciplinary Studies | 25 | 0.6% |
| Science & Technology | 382 | 9.7% |
| Business | 691 | 17.6% |
| Education | 350 | 8.9% |
| Literature & Languages | 204 | 5.2% |
| Liberal Arts & History | 252 | 6.4% |
| Visual & Performing Arts | 290 | 7.4% |
| Communications | 83 | 2.1% |
| Arts & Humanities | 114 | 2.9% |
| Total | 3,933 | 100.0% |
Transportation & Commute in Corrales
Vehicle Availability by Sex in Corrales
The most prevalent vehicle ownership categories in Corrales are males with 2 vehicles (763, accounting for 36.5%) and females with 2 vehicles (569, making up 43.5%).
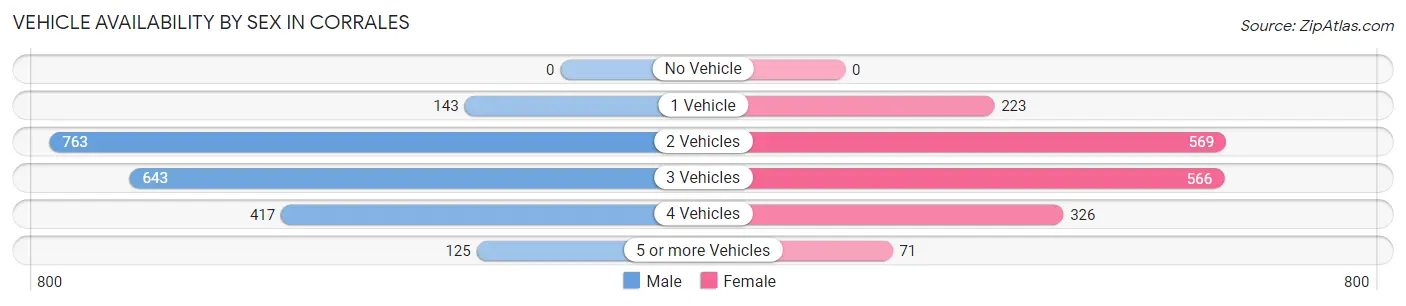
| Vehicles Available | Male | Female |
| No Vehicle | 0 (0.0%) | 0 (0.0%) |
| 1 Vehicle | 143 (6.8%) | 223 (12.7%) |
| 2 Vehicles | 763 (36.5%) | 569 (32.4%) |
| 3 Vehicles | 643 (30.7%) | 566 (32.3%) |
| 4 Vehicles | 417 (19.9%) | 326 (18.6%) |
| 5 or more Vehicles | 125 (6.0%) | 71 (4.1%) |
| Total | 2,091 (100.0%) | 1,755 (100.0%) |
Commute Time in Corrales
The most frequently occuring commute durations in Corrales are 20 to 24 minutes (523 commuters, 17.0%), 25 to 29 minutes (496 commuters, 16.1%), and 30 to 34 minutes (436 commuters, 14.2%).
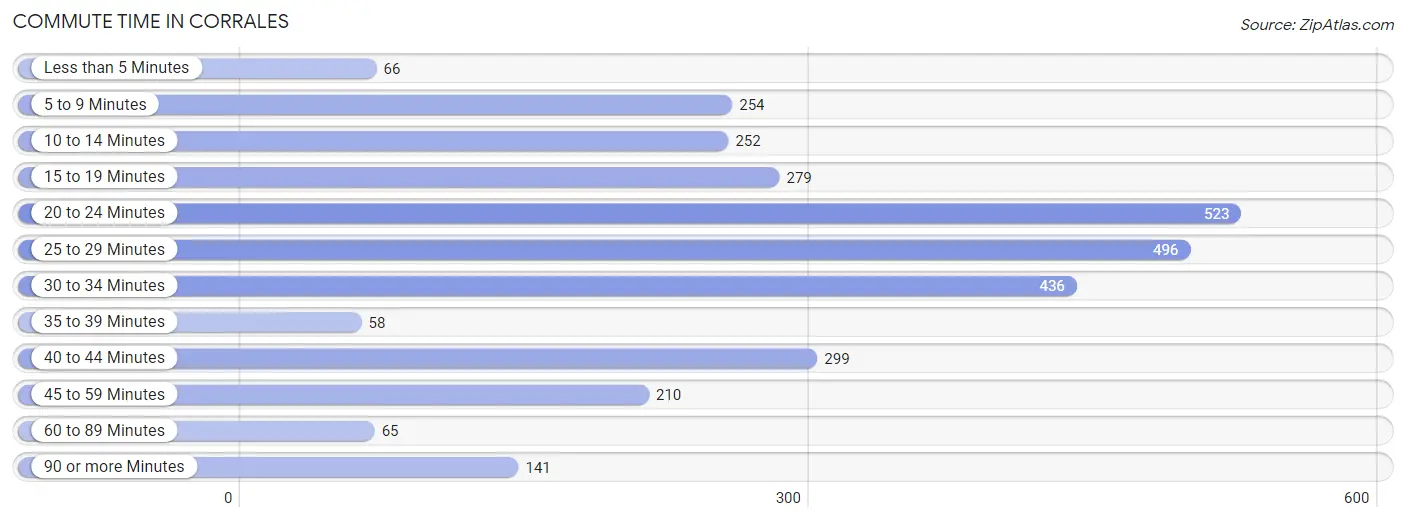
| Commute Time | # Commuters | % Commuters |
| Less than 5 Minutes | 66 | 2.1% |
| 5 to 9 Minutes | 254 | 8.3% |
| 10 to 14 Minutes | 252 | 8.2% |
| 15 to 19 Minutes | 279 | 9.1% |
| 20 to 24 Minutes | 523 | 17.0% |
| 25 to 29 Minutes | 496 | 16.1% |
| 30 to 34 Minutes | 436 | 14.2% |
| 35 to 39 Minutes | 58 | 1.9% |
| 40 to 44 Minutes | 299 | 9.7% |
| 45 to 59 Minutes | 210 | 6.8% |
| 60 to 89 Minutes | 65 | 2.1% |
| 90 or more Minutes | 141 | 4.6% |
Commute Time by Sex in Corrales
The most common commute times in Corrales are 25 to 29 minutes (285 commuters, 16.0%) for males and 20 to 24 minutes (249 commuters, 19.2%) for females.
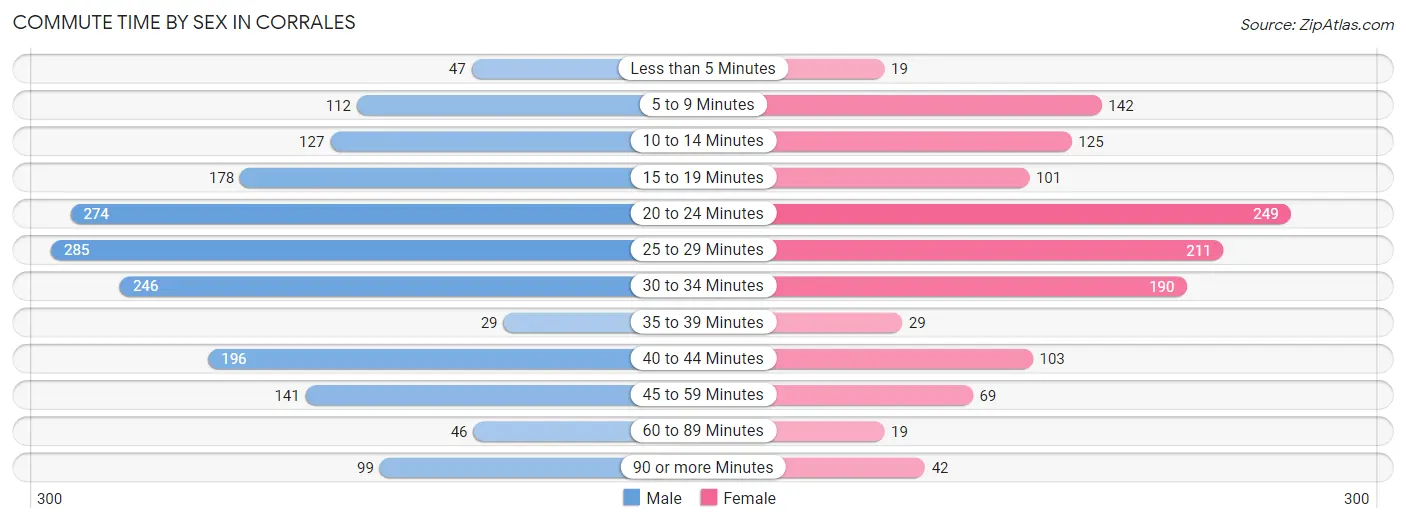
| Commute Time | Male | Female |
| Less than 5 Minutes | 47 (2.6%) | 19 (1.5%) |
| 5 to 9 Minutes | 112 (6.3%) | 142 (10.9%) |
| 10 to 14 Minutes | 127 (7.1%) | 125 (9.6%) |
| 15 to 19 Minutes | 178 (10.0%) | 101 (7.8%) |
| 20 to 24 Minutes | 274 (15.4%) | 249 (19.2%) |
| 25 to 29 Minutes | 285 (16.0%) | 211 (16.2%) |
| 30 to 34 Minutes | 246 (13.8%) | 190 (14.6%) |
| 35 to 39 Minutes | 29 (1.6%) | 29 (2.2%) |
| 40 to 44 Minutes | 196 (11.0%) | 103 (7.9%) |
| 45 to 59 Minutes | 141 (7.9%) | 69 (5.3%) |
| 60 to 89 Minutes | 46 (2.6%) | 19 (1.5%) |
| 90 or more Minutes | 99 (5.6%) | 42 (3.2%) |
Time of Departure to Work by Sex in Corrales
The most frequent times of departure to work in Corrales are 6:00 AM to 6:29 AM (404, 22.7%) for males and 6:00 AM to 6:29 AM (224, 17.2%) for females.
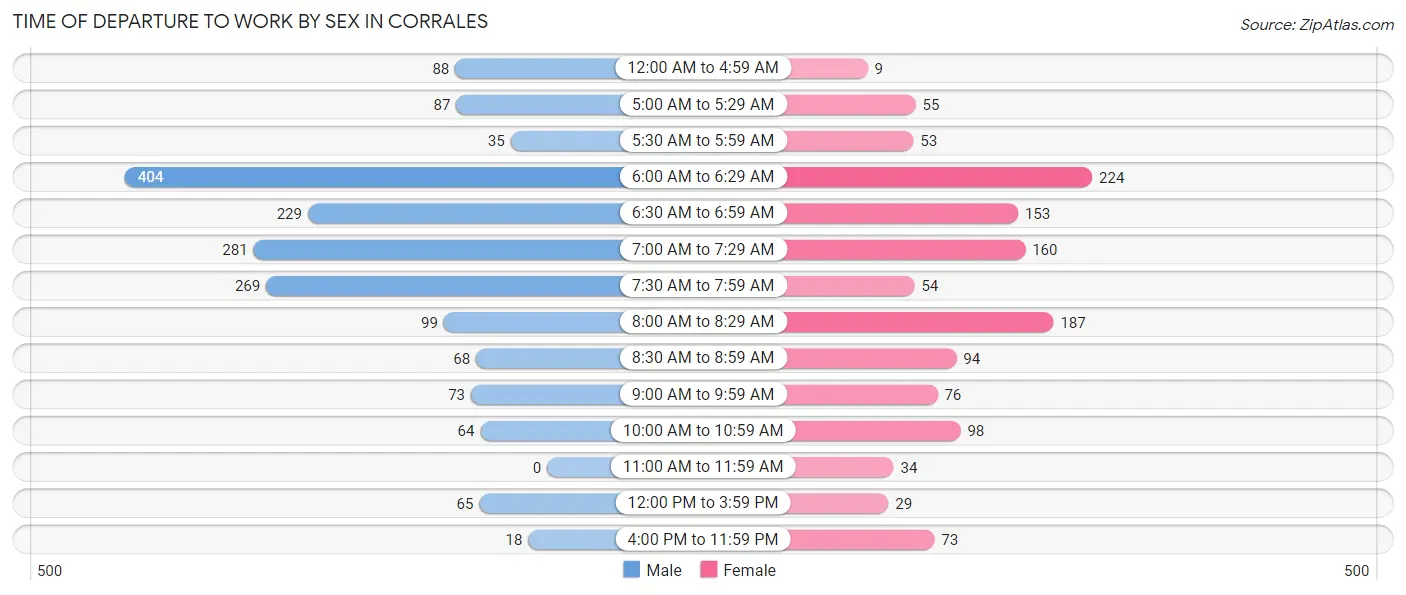
| Time of Departure | Male | Female |
| 12:00 AM to 4:59 AM | 88 (4.9%) | 9 (0.7%) |
| 5:00 AM to 5:29 AM | 87 (4.9%) | 55 (4.2%) |
| 5:30 AM to 5:59 AM | 35 (2.0%) | 53 (4.1%) |
| 6:00 AM to 6:29 AM | 404 (22.7%) | 224 (17.2%) |
| 6:30 AM to 6:59 AM | 229 (12.9%) | 153 (11.8%) |
| 7:00 AM to 7:29 AM | 281 (15.8%) | 160 (12.3%) |
| 7:30 AM to 7:59 AM | 269 (15.1%) | 54 (4.2%) |
| 8:00 AM to 8:29 AM | 99 (5.6%) | 187 (14.4%) |
| 8:30 AM to 8:59 AM | 68 (3.8%) | 94 (7.2%) |
| 9:00 AM to 9:59 AM | 73 (4.1%) | 76 (5.9%) |
| 10:00 AM to 10:59 AM | 64 (3.6%) | 98 (7.5%) |
| 11:00 AM to 11:59 AM | 0 (0.0%) | 34 (2.6%) |
| 12:00 PM to 3:59 PM | 65 (3.6%) | 29 (2.2%) |
| 4:00 PM to 11:59 PM | 18 (1.0%) | 73 (5.6%) |
| Total | 1,780 (100.0%) | 1,299 (100.0%) |
Housing Occupancy in Corrales
Occupancy by Ownership in Corrales
Of the total 3,574 dwellings in Corrales, owner-occupied units account for 3,195 (89.4%), while renter-occupied units make up 379 (10.6%).
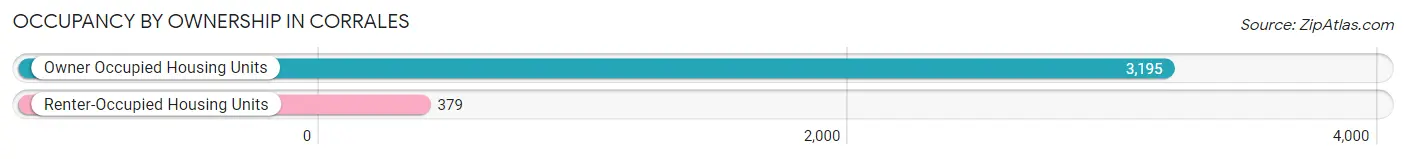
| Occupancy | # Housing Units | % Housing Units |
| Owner Occupied Housing Units | 3,195 | 89.4% |
| Renter-Occupied Housing Units | 379 | 10.6% |
| Total Occupied Housing Units | 3,574 | 100.0% |
Occupancy by Household Size in Corrales
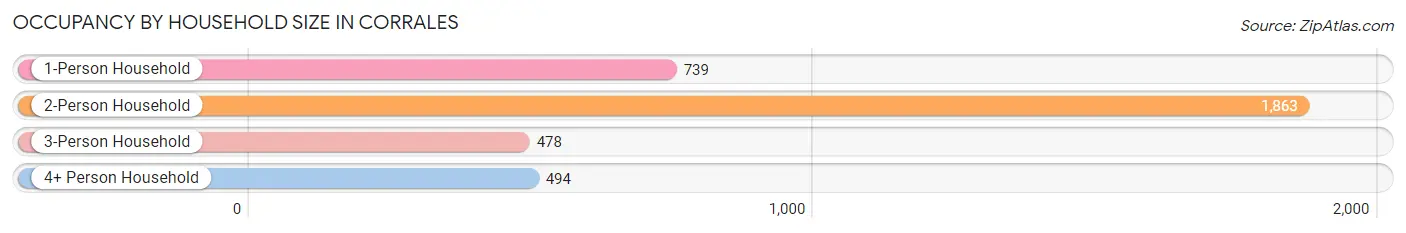
| Household Size | # Housing Units | % Housing Units |
| 1-Person Household | 739 | 20.7% |
| 2-Person Household | 1,863 | 52.1% |
| 3-Person Household | 478 | 13.4% |
| 4+ Person Household | 494 | 13.8% |
| Total Housing Units | 3,574 | 100.0% |
Occupancy by Ownership by Household Size in Corrales
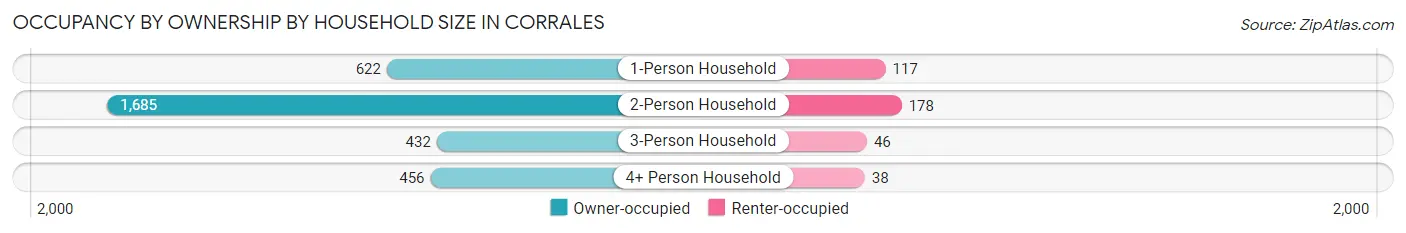
| Household Size | Owner-occupied | Renter-occupied |
| 1-Person Household | 622 (84.2%) | 117 (15.8%) |
| 2-Person Household | 1,685 (90.4%) | 178 (9.6%) |
| 3-Person Household | 432 (90.4%) | 46 (9.6%) |
| 4+ Person Household | 456 (92.3%) | 38 (7.7%) |
| Total Housing Units | 3,195 (89.4%) | 379 (10.6%) |
Occupancy by Educational Attainment in Corrales
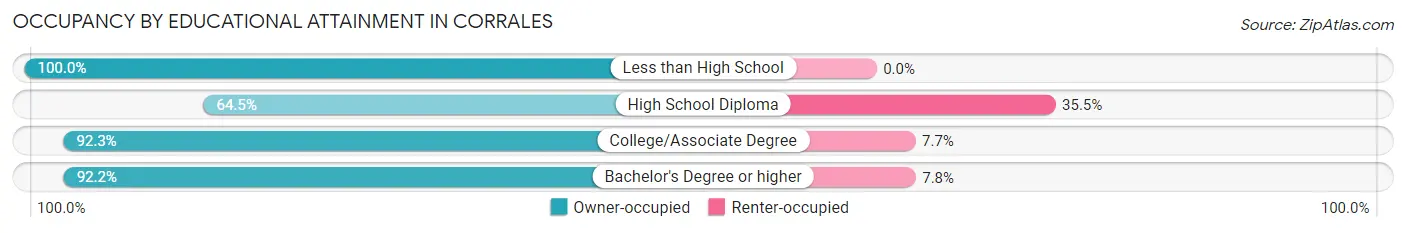
| Household Size | Owner-occupied | Renter-occupied |
| Less than High School | 124 (100.0%) | 0 (0.0%) |
| High School Diploma | 260 (64.5%) | 143 (35.5%) |
| College/Associate Degree | 910 (92.3%) | 76 (7.7%) |
| Bachelor's Degree or higher | 1,901 (92.2%) | 160 (7.8%) |
Occupancy by Age of Householder in Corrales
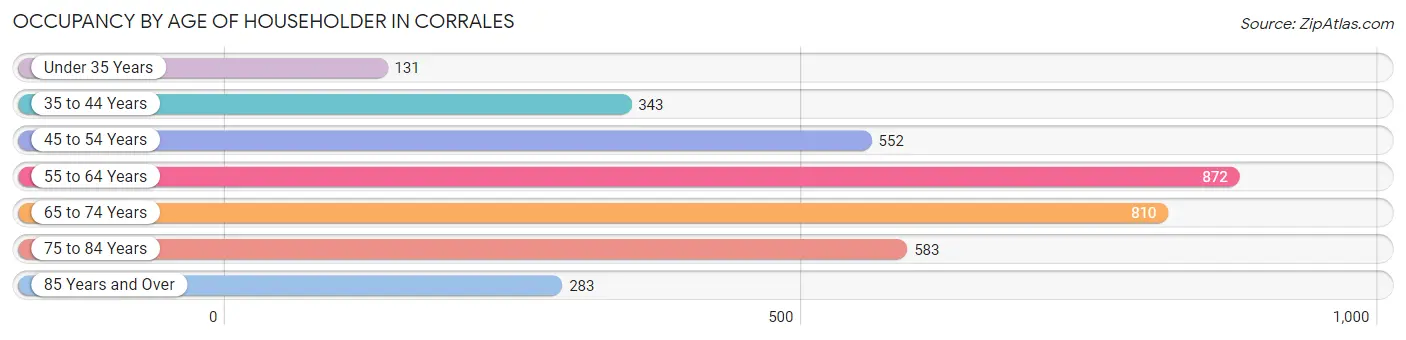
| Age Bracket | # Households | % Households |
| Under 35 Years | 131 | 3.7% |
| 35 to 44 Years | 343 | 9.6% |
| 45 to 54 Years | 552 | 15.4% |
| 55 to 64 Years | 872 | 24.4% |
| 65 to 74 Years | 810 | 22.7% |
| 75 to 84 Years | 583 | 16.3% |
| 85 Years and Over | 283 | 7.9% |
| Total | 3,574 | 100.0% |
Housing Finances in Corrales
Median Income by Occupancy in Corrales
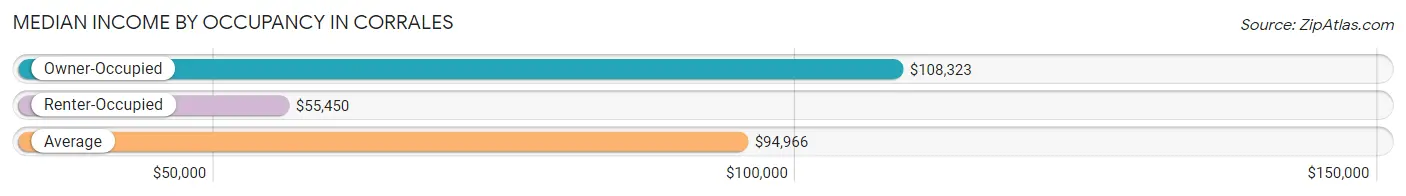
| Occupancy Type | # Households | Median Income |
| Owner-Occupied | 3,195 (89.4%) | $108,323 |
| Renter-Occupied | 379 (10.6%) | $55,450 |
| Average | 3,574 (100.0%) | $94,966 |
Occupancy by Householder Income Bracket in Corrales
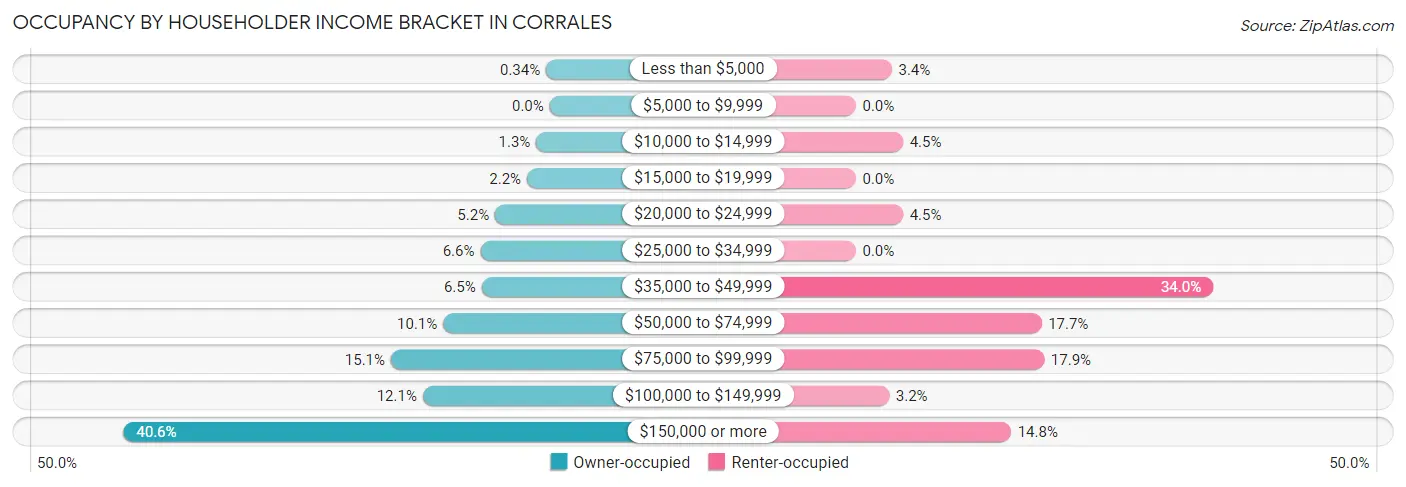
| Income Bracket | Owner-occupied | Renter-occupied |
| Less than $5,000 | 11 (0.3%) | 13 (3.4%) |
| $5,000 to $9,999 | 0 (0.0%) | 0 (0.0%) |
| $10,000 to $14,999 | 41 (1.3%) | 17 (4.5%) |
| $15,000 to $19,999 | 69 (2.2%) | 0 (0.0%) |
| $20,000 to $24,999 | 166 (5.2%) | 17 (4.5%) |
| $25,000 to $34,999 | 211 (6.6%) | 0 (0.0%) |
| $35,000 to $49,999 | 207 (6.5%) | 129 (34.0%) |
| $50,000 to $74,999 | 324 (10.1%) | 67 (17.7%) |
| $75,000 to $99,999 | 483 (15.1%) | 68 (17.9%) |
| $100,000 to $149,999 | 386 (12.1%) | 12 (3.2%) |
| $150,000 or more | 1,297 (40.6%) | 56 (14.8%) |
| Total | 3,195 (100.0%) | 379 (100.0%) |
Monthly Housing Cost Tiers in Corrales
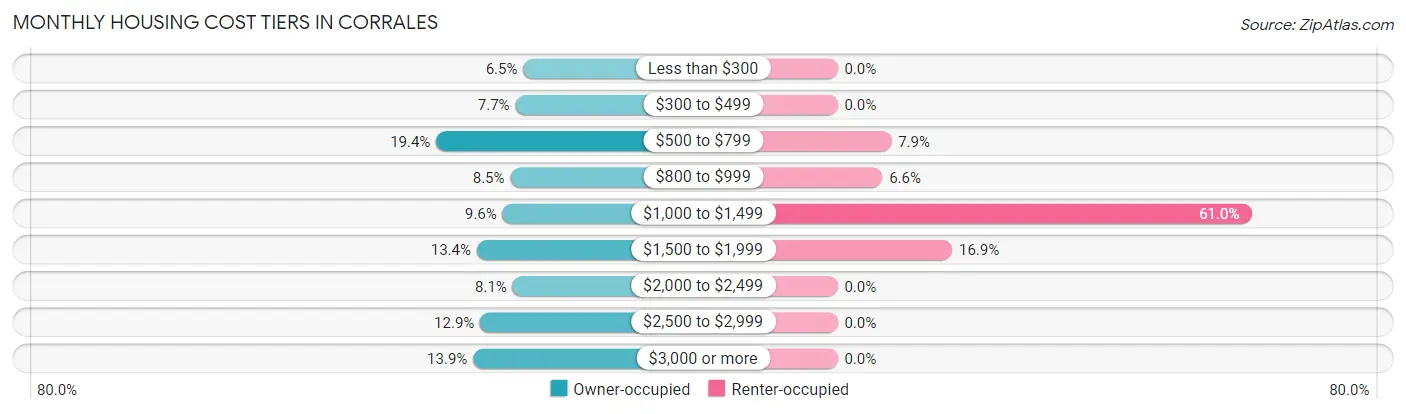
| Monthly Cost | Owner-occupied | Renter-occupied |
| Less than $300 | 209 (6.5%) | 0 (0.0%) |
| $300 to $499 | 246 (7.7%) | 0 (0.0%) |
| $500 to $799 | 619 (19.4%) | 30 (7.9%) |
| $800 to $999 | 270 (8.5%) | 25 (6.6%) |
| $1,000 to $1,499 | 307 (9.6%) | 231 (61.0%) |
| $1,500 to $1,999 | 428 (13.4%) | 64 (16.9%) |
| $2,000 to $2,499 | 259 (8.1%) | 0 (0.0%) |
| $2,500 to $2,999 | 412 (12.9%) | 0 (0.0%) |
| $3,000 or more | 445 (13.9%) | 0 (0.0%) |
| Total | 3,195 (100.0%) | 379 (100.0%) |
Physical Housing Characteristics in Corrales
Housing Structures in Corrales
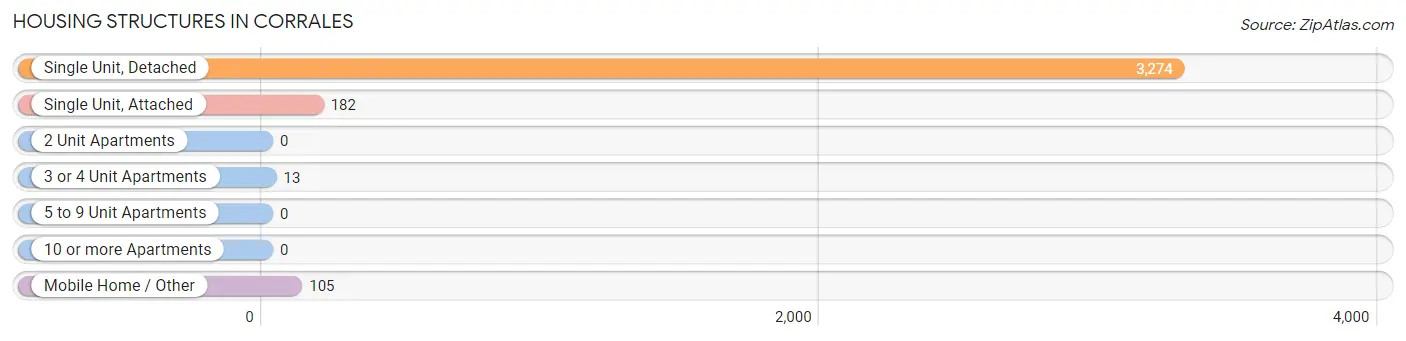
| Structure Type | # Housing Units | % Housing Units |
| Single Unit, Detached | 3,274 | 91.6% |
| Single Unit, Attached | 182 | 5.1% |
| 2 Unit Apartments | 0 | 0.0% |
| 3 or 4 Unit Apartments | 13 | 0.4% |
| 5 to 9 Unit Apartments | 0 | 0.0% |
| 10 or more Apartments | 0 | 0.0% |
| Mobile Home / Other | 105 | 2.9% |
| Total | 3,574 | 100.0% |
Housing Structures by Occupancy in Corrales
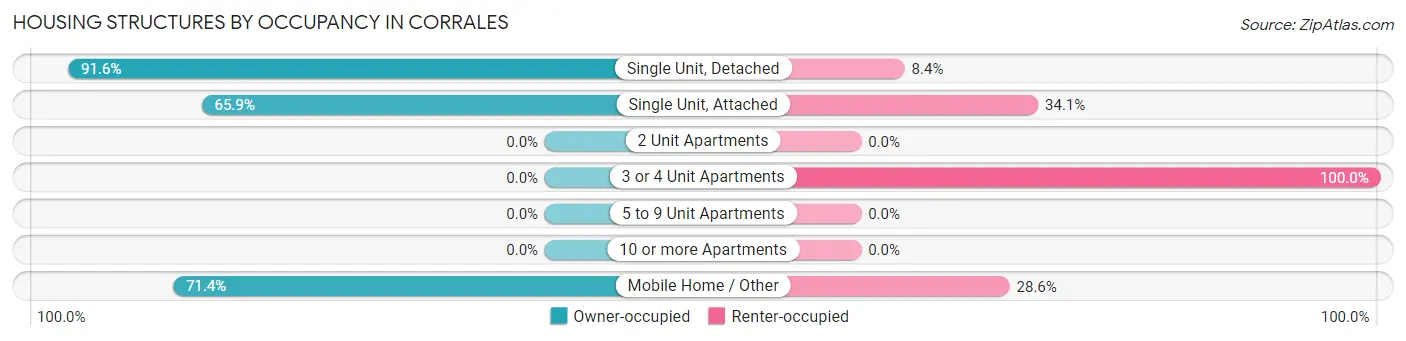
| Structure Type | Owner-occupied | Renter-occupied |
| Single Unit, Detached | 3,000 (91.6%) | 274 (8.4%) |
| Single Unit, Attached | 120 (65.9%) | 62 (34.1%) |
| 2 Unit Apartments | 0 (0.0%) | 0 (0.0%) |
| 3 or 4 Unit Apartments | 0 (0.0%) | 13 (100.0%) |
| 5 to 9 Unit Apartments | 0 (0.0%) | 0 (0.0%) |
| 10 or more Apartments | 0 (0.0%) | 0 (0.0%) |
| Mobile Home / Other | 75 (71.4%) | 30 (28.6%) |
| Total | 3,195 (89.4%) | 379 (10.6%) |
Housing Structures by Number of Rooms in Corrales
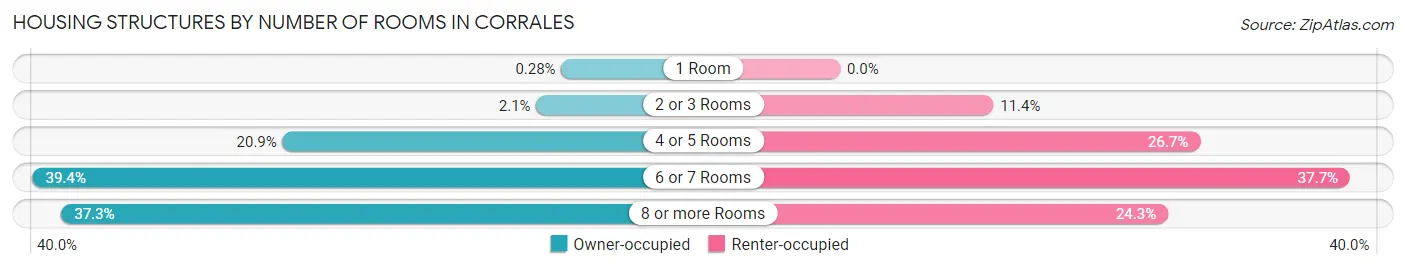
| Number of Rooms | Owner-occupied | Renter-occupied |
| 1 Room | 9 (0.3%) | 0 (0.0%) |
| 2 or 3 Rooms | 68 (2.1%) | 43 (11.4%) |
| 4 or 5 Rooms | 668 (20.9%) | 101 (26.7%) |
| 6 or 7 Rooms | 1,259 (39.4%) | 143 (37.7%) |
| 8 or more Rooms | 1,191 (37.3%) | 92 (24.3%) |
| Total | 3,195 (100.0%) | 379 (100.0%) |
Housing Structure by Heating Type in Corrales
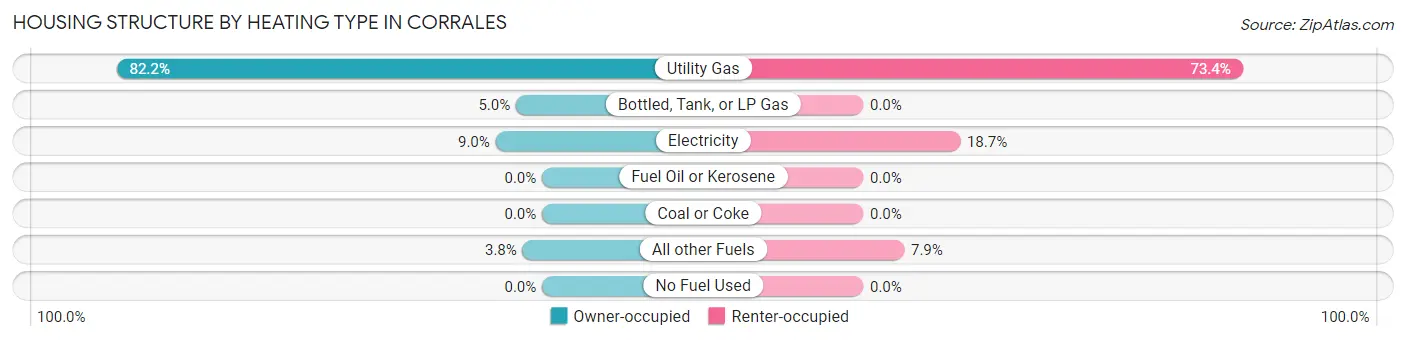
| Heating Type | Owner-occupied | Renter-occupied |
| Utility Gas | 2,627 (82.2%) | 278 (73.4%) |
| Bottled, Tank, or LP Gas | 161 (5.0%) | 0 (0.0%) |
| Electricity | 287 (9.0%) | 71 (18.7%) |
| Fuel Oil or Kerosene | 0 (0.0%) | 0 (0.0%) |
| Coal or Coke | 0 (0.0%) | 0 (0.0%) |
| All other Fuels | 120 (3.8%) | 30 (7.9%) |
| No Fuel Used | 0 (0.0%) | 0 (0.0%) |
| Total | 3,195 (100.0%) | 379 (100.0%) |
Household Vehicle Usage in Corrales
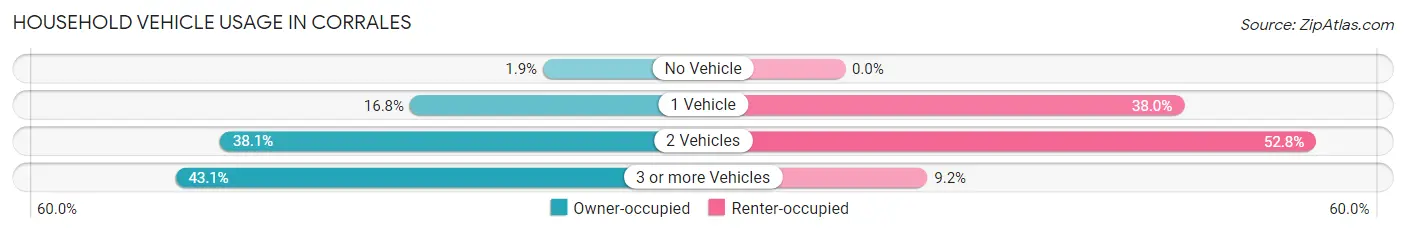
| Vehicles per Household | Owner-occupied | Renter-occupied |
| No Vehicle | 62 (1.9%) | 0 (0.0%) |
| 1 Vehicle | 538 (16.8%) | 144 (38.0%) |
| 2 Vehicles | 1,218 (38.1%) | 200 (52.8%) |
| 3 or more Vehicles | 1,377 (43.1%) | 35 (9.2%) |
| Total | 3,195 (100.0%) | 379 (100.0%) |
Real Estate & Mortgages in Corrales
Real Estate and Mortgage Overview in Corrales
| Characteristic | Without Mortgage | With Mortgage |
| Housing Units | 1,407 | 1,788 |
| Median Property Value | $453,000 | $567,800 |
| Median Household Income | $77,438 | $924 |
| Monthly Housing Costs | $557 | $445 |
| Real Estate Taxes | $2,899 | $20 |
Property Value by Mortgage Status in Corrales
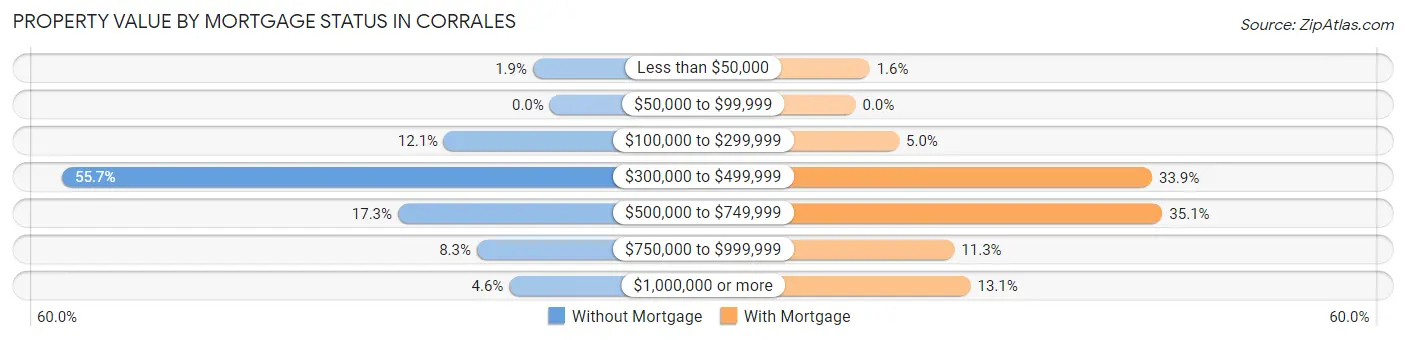
| Property Value | Without Mortgage | With Mortgage |
| Less than $50,000 | 27 (1.9%) | 29 (1.6%) |
| $50,000 to $99,999 | 0 (0.0%) | 0 (0.0%) |
| $100,000 to $299,999 | 170 (12.1%) | 89 (5.0%) |
| $300,000 to $499,999 | 784 (55.7%) | 606 (33.9%) |
| $500,000 to $749,999 | 244 (17.3%) | 627 (35.1%) |
| $750,000 to $999,999 | 117 (8.3%) | 202 (11.3%) |
| $1,000,000 or more | 65 (4.6%) | 235 (13.1%) |
| Total | 1,407 (100.0%) | 1,788 (100.0%) |
Household Income by Mortgage Status in Corrales
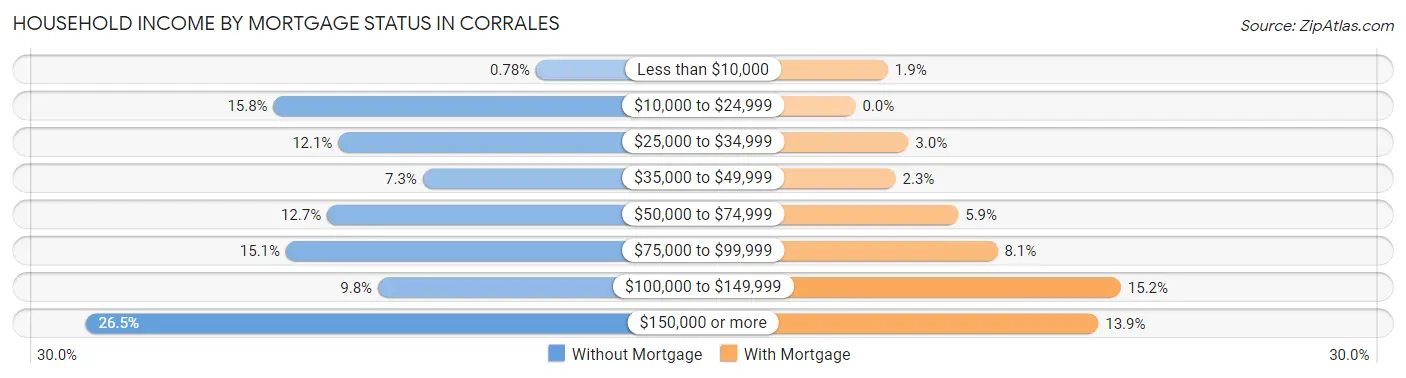
| Household Income | Without Mortgage | With Mortgage |
| Less than $10,000 | 11 (0.8%) | 33 (1.8%) |
| $10,000 to $24,999 | 222 (15.8%) | 0 (0.0%) |
| $25,000 to $34,999 | 170 (12.1%) | 54 (3.0%) |
| $35,000 to $49,999 | 102 (7.2%) | 41 (2.3%) |
| $50,000 to $74,999 | 179 (12.7%) | 105 (5.9%) |
| $75,000 to $99,999 | 212 (15.1%) | 145 (8.1%) |
| $100,000 to $149,999 | 138 (9.8%) | 271 (15.2%) |
| $150,000 or more | 373 (26.5%) | 248 (13.9%) |
| Total | 1,407 (100.0%) | 1,788 (100.0%) |
Property Value to Household Income Ratio in Corrales
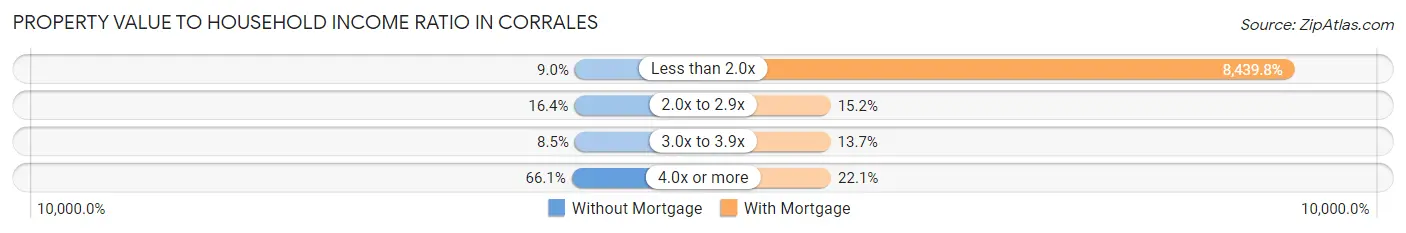
| Value-to-Income Ratio | Without Mortgage | With Mortgage |
| Less than 2.0x | 127 (9.0%) | 150,904 (8,439.8%) |
| 2.0x to 2.9x | 230 (16.4%) | 272 (15.2%) |
| 3.0x to 3.9x | 120 (8.5%) | 244 (13.7%) |
| 4.0x or more | 930 (66.1%) | 395 (22.1%) |
| Total | 1,407 (100.0%) | 1,788 (100.0%) |
Real Estate Taxes by Mortgage Status in Corrales
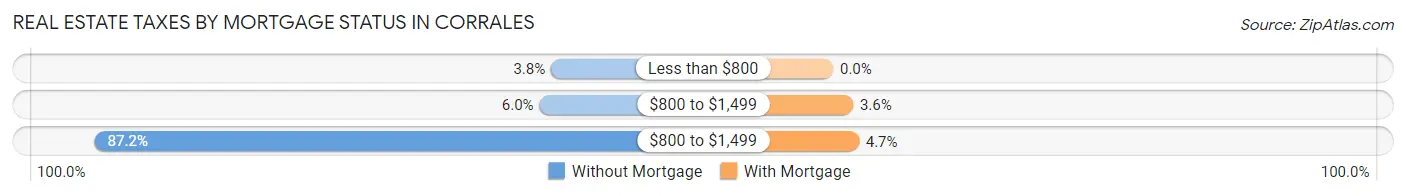
| Property Taxes | Without Mortgage | With Mortgage |
| Less than $800 | 54 (3.8%) | 0 (0.0%) |
| $800 to $1,499 | 84 (6.0%) | 65 (3.6%) |
| $800 to $1,499 | 1,227 (87.2%) | 84 (4.7%) |
| Total | 1,407 (100.0%) | 1,788 (100.0%) |
Health & Disability in Corrales
Health Insurance Coverage by Age in Corrales
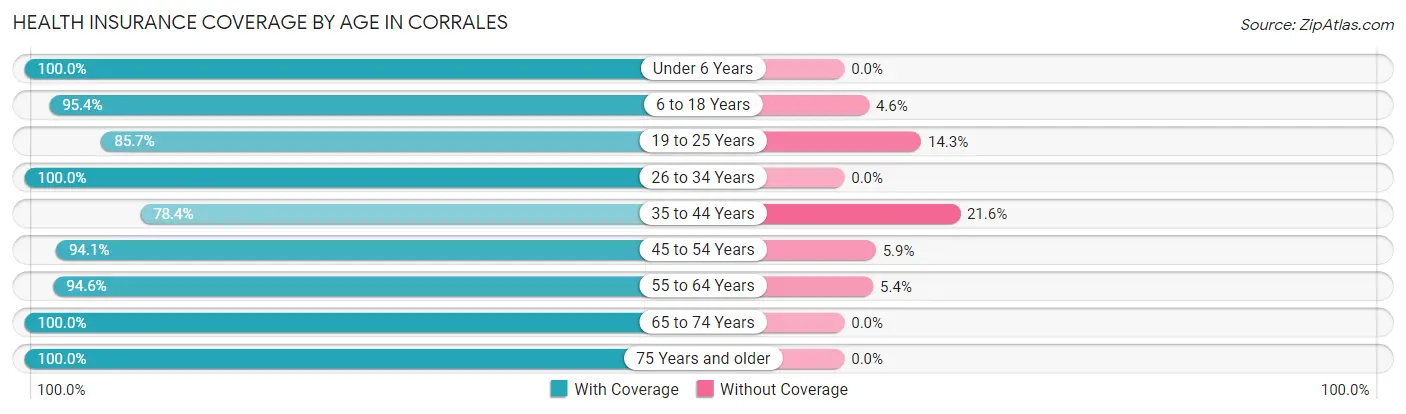
| Age Bracket | With Coverage | Without Coverage |
| Under 6 Years | 298 (100.0%) | 0 (0.0%) |
| 6 to 18 Years | 830 (95.4%) | 40 (4.6%) |
| 19 to 25 Years | 371 (85.7%) | 62 (14.3%) |
| 26 to 34 Years | 423 (100.0%) | 0 (0.0%) |
| 35 to 44 Years | 651 (78.4%) | 179 (21.6%) |
| 45 to 54 Years | 996 (94.1%) | 62 (5.9%) |
| 55 to 64 Years | 1,425 (94.6%) | 81 (5.4%) |
| 65 to 74 Years | 1,568 (100.0%) | 0 (0.0%) |
| 75 Years and older | 1,507 (100.0%) | 0 (0.0%) |
| Total | 8,069 (95.0%) | 424 (5.0%) |
Health Insurance Coverage by Citizenship Status in Corrales
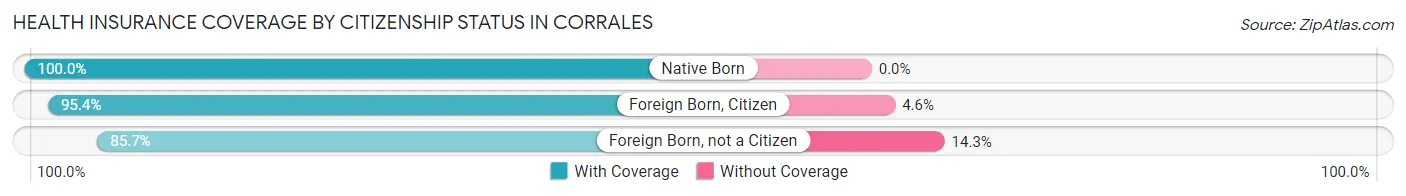
| Citizenship Status | With Coverage | Without Coverage |
| Native Born | 298 (100.0%) | 0 (0.0%) |
| Foreign Born, Citizen | 830 (95.4%) | 40 (4.6%) |
| Foreign Born, not a Citizen | 371 (85.7%) | 62 (14.3%) |
Health Insurance Coverage by Household Income in Corrales
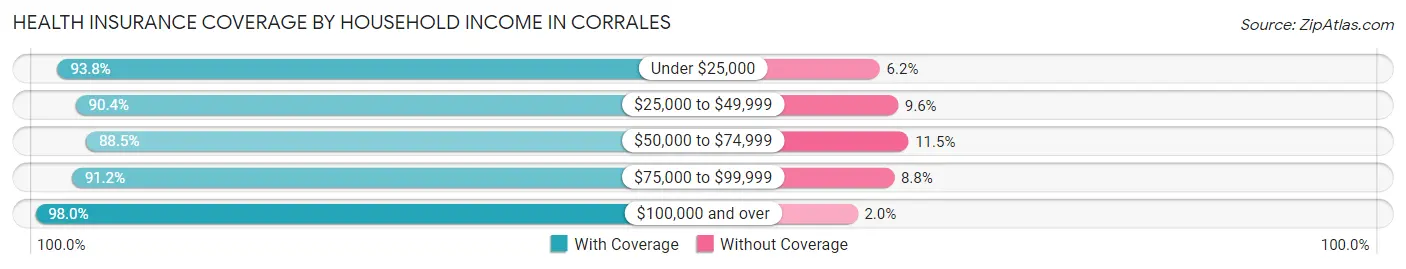
| Household Income | With Coverage | Without Coverage |
| Under $25,000 | 411 (93.8%) | 27 (6.2%) |
| $25,000 to $49,999 | 860 (90.4%) | 91 (9.6%) |
| $50,000 to $74,999 | 715 (88.5%) | 93 (11.5%) |
| $75,000 to $99,999 | 1,165 (91.2%) | 113 (8.8%) |
| $100,000 and over | 4,892 (98.0%) | 100 (2.0%) |
Public vs Private Health Insurance Coverage by Age in Corrales
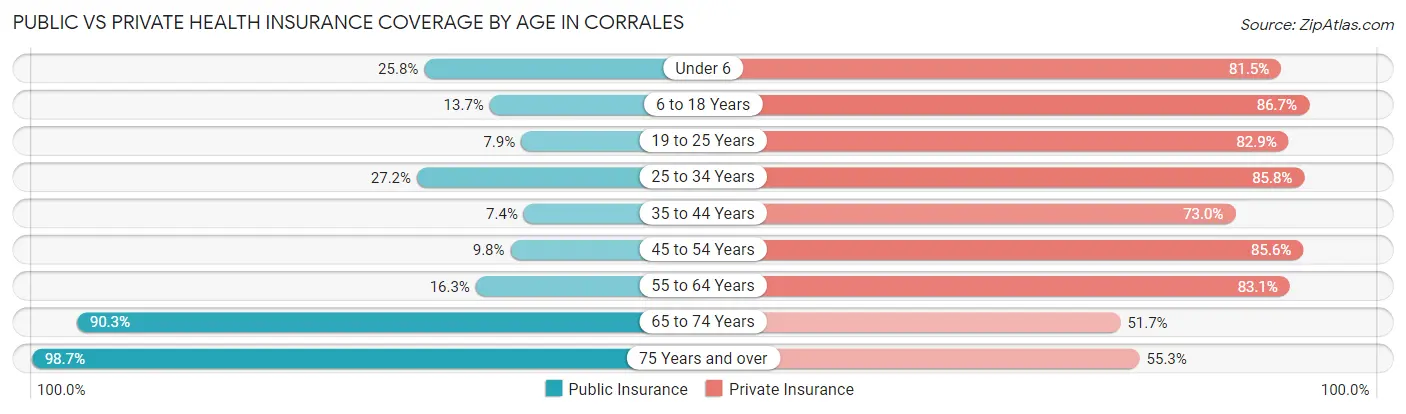
| Age Bracket | Public Insurance | Private Insurance |
| Under 6 | 77 (25.8%) | 243 (81.5%) |
| 6 to 18 Years | 119 (13.7%) | 754 (86.7%) |
| 19 to 25 Years | 34 (7.9%) | 359 (82.9%) |
| 25 to 34 Years | 115 (27.2%) | 363 (85.8%) |
| 35 to 44 Years | 61 (7.3%) | 606 (73.0%) |
| 45 to 54 Years | 104 (9.8%) | 906 (85.6%) |
| 55 to 64 Years | 245 (16.3%) | 1,252 (83.1%) |
| 65 to 74 Years | 1,416 (90.3%) | 811 (51.7%) |
| 75 Years and over | 1,487 (98.7%) | 833 (55.3%) |
| Total | 3,658 (43.1%) | 6,127 (72.1%) |
Disability Status by Sex by Age in Corrales
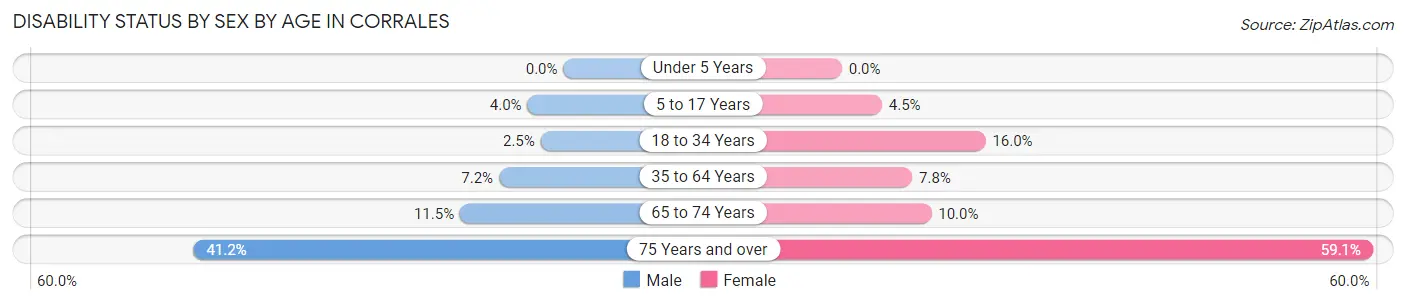
| Age Bracket | Male | Female |
| Under 5 Years | 0 (0.0%) | 0 (0.0%) |
| 5 to 17 Years | 15 (4.0%) | 23 (4.5%) |
| 18 to 34 Years | 13 (2.5%) | 60 (16.0%) |
| 35 to 64 Years | 118 (7.2%) | 137 (7.8%) |
| 65 to 74 Years | 80 (11.5%) | 87 (10.0%) |
| 75 Years and over | 276 (41.2%) | 495 (59.1%) |
Disability Class by Sex by Age in Corrales
Disability Class: Hearing Difficulty
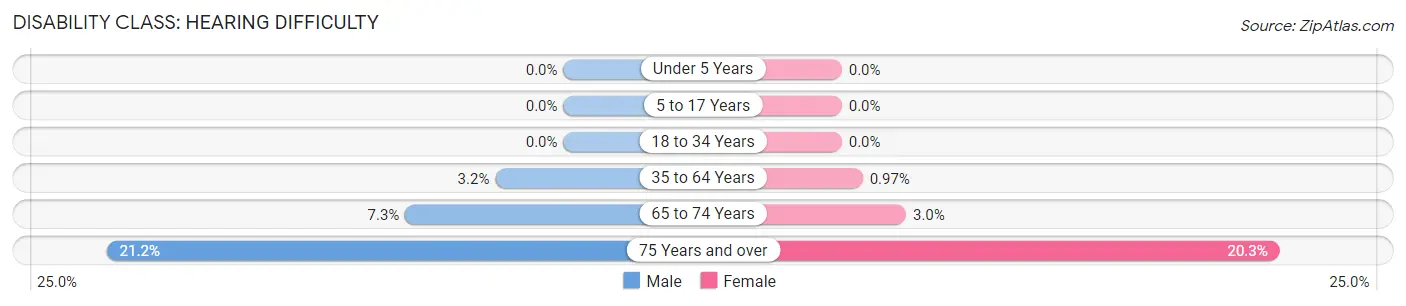
| Age Bracket | Male | Female |
| Under 5 Years | 0 (0.0%) | 0 (0.0%) |
| 5 to 17 Years | 0 (0.0%) | 0 (0.0%) |
| 18 to 34 Years | 0 (0.0%) | 0 (0.0%) |
| 35 to 64 Years | 52 (3.2%) | 17 (1.0%) |
| 65 to 74 Years | 51 (7.3%) | 26 (3.0%) |
| 75 Years and over | 142 (21.2%) | 170 (20.3%) |
Disability Class: Vision Difficulty
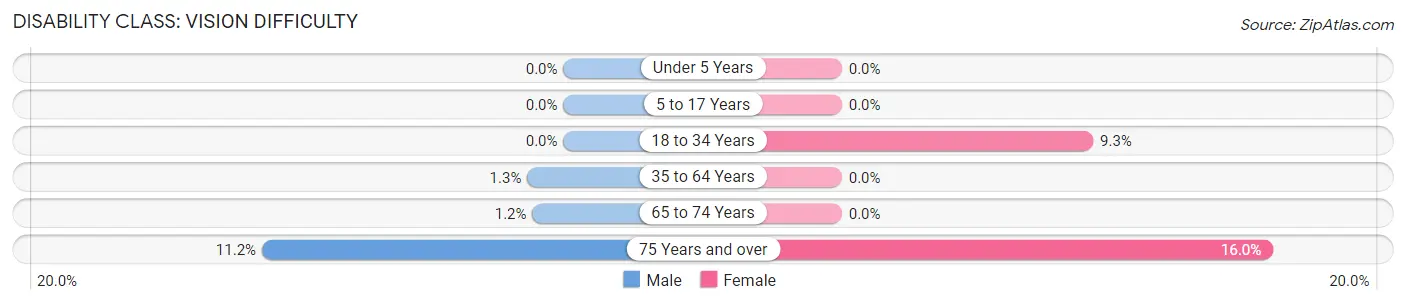
| Age Bracket | Male | Female |
| Under 5 Years | 0 (0.0%) | 0 (0.0%) |
| 5 to 17 Years | 0 (0.0%) | 0 (0.0%) |
| 18 to 34 Years | 0 (0.0%) | 35 (9.3%) |
| 35 to 64 Years | 22 (1.3%) | 0 (0.0%) |
| 65 to 74 Years | 8 (1.1%) | 0 (0.0%) |
| 75 Years and over | 75 (11.2%) | 134 (16.0%) |
Disability Class: Cognitive Difficulty
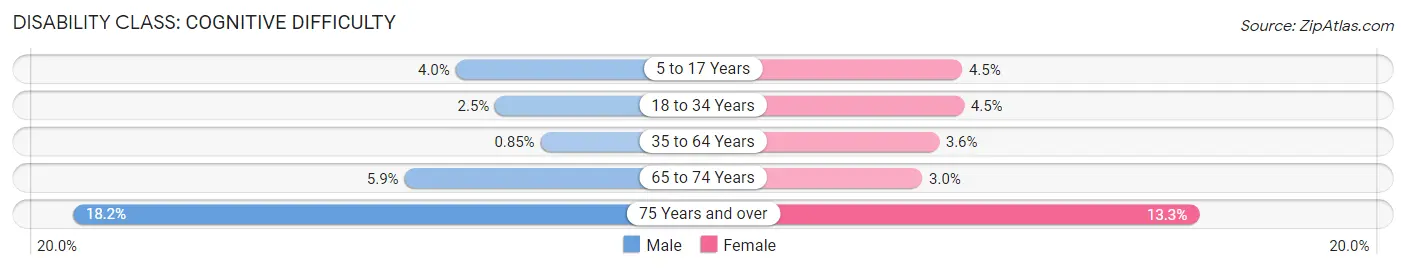
| Age Bracket | Male | Female |
| 5 to 17 Years | 15 (4.0%) | 23 (4.5%) |
| 18 to 34 Years | 13 (2.5%) | 17 (4.5%) |
| 35 to 64 Years | 14 (0.9%) | 63 (3.6%) |
| 65 to 74 Years | 41 (5.9%) | 26 (3.0%) |
| 75 Years and over | 122 (18.2%) | 111 (13.3%) |
Disability Class: Ambulatory Difficulty
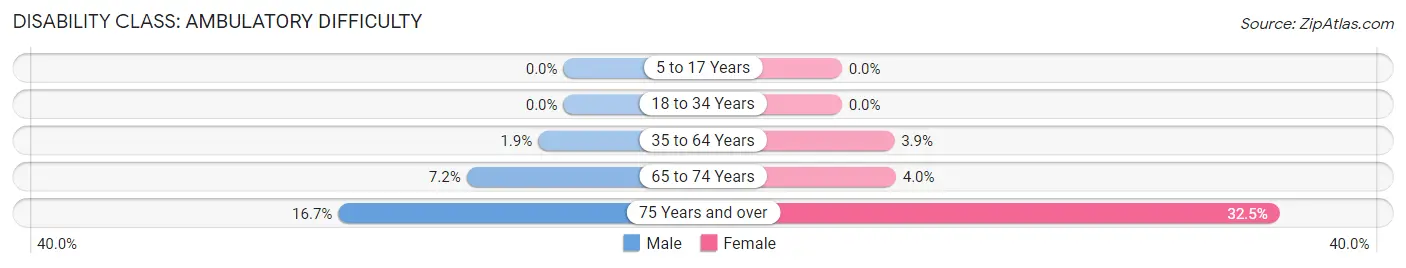
| Age Bracket | Male | Female |
| 5 to 17 Years | 0 (0.0%) | 0 (0.0%) |
| 18 to 34 Years | 0 (0.0%) | 0 (0.0%) |
| 35 to 64 Years | 31 (1.9%) | 68 (3.9%) |
| 65 to 74 Years | 50 (7.2%) | 35 (4.0%) |
| 75 Years and over | 112 (16.7%) | 272 (32.5%) |
Disability Class: Self-Care Difficulty
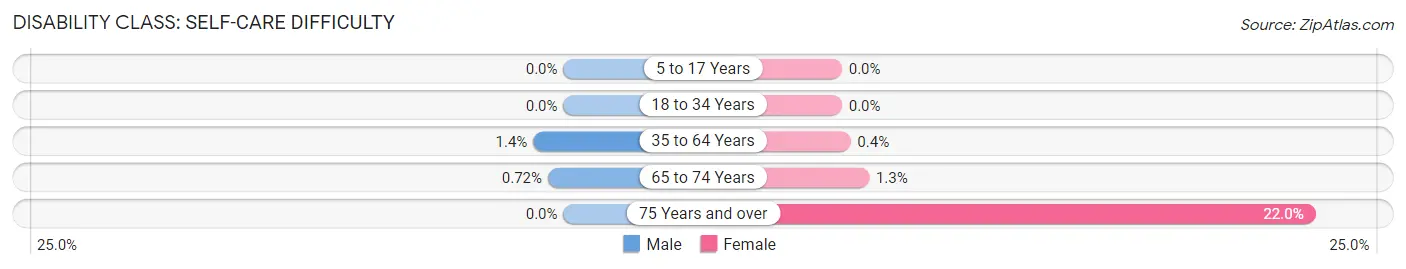
| Age Bracket | Male | Female |
| 5 to 17 Years | 0 (0.0%) | 0 (0.0%) |
| 18 to 34 Years | 0 (0.0%) | 0 (0.0%) |
| 35 to 64 Years | 23 (1.4%) | 7 (0.4%) |
| 65 to 74 Years | 5 (0.7%) | 11 (1.3%) |
| 75 Years and over | 0 (0.0%) | 184 (22.0%) |
Technology Access in Corrales
Computing Device Access in Corrales
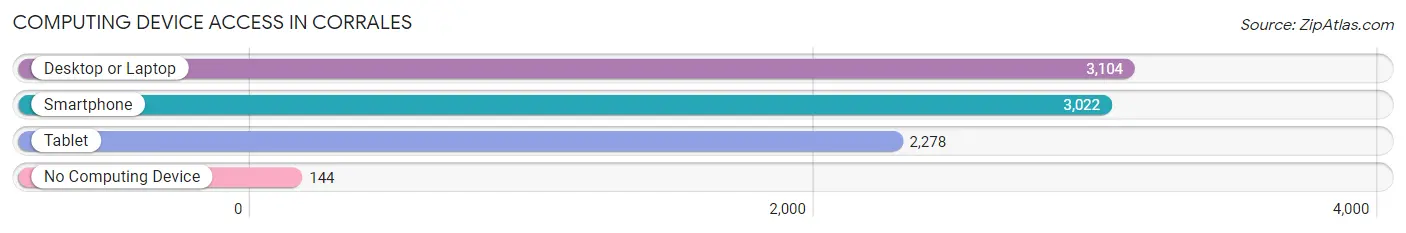
| Device Type | # Households | % Households |
| Desktop or Laptop | 3,104 | 86.9% |
| Smartphone | 3,022 | 84.6% |
| Tablet | 2,278 | 63.7% |
| No Computing Device | 144 | 4.0% |
| Total | 3,574 | 100.0% |
Internet Access in Corrales
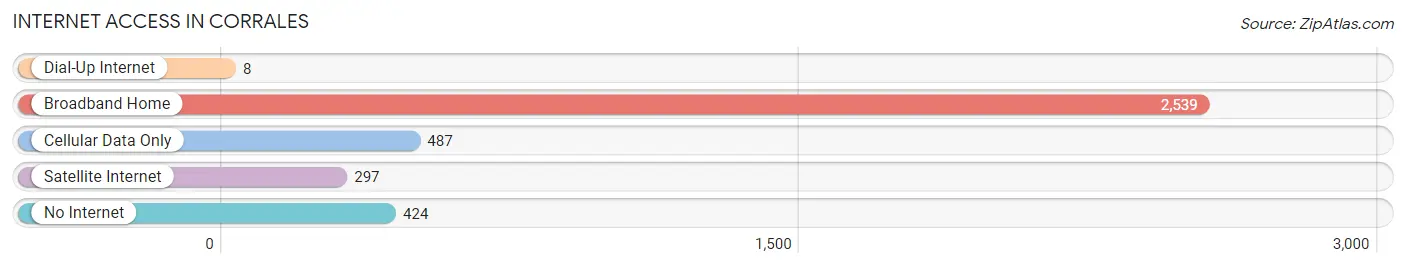
| Internet Type | # Households | % Households |
| Dial-Up Internet | 8 | 0.2% |
| Broadband Home | 2,539 | 71.0% |
| Cellular Data Only | 487 | 13.6% |
| Satellite Internet | 297 | 8.3% |
| No Internet | 424 | 11.9% |
| Total | 3,574 | 100.0% |
Corrales Summary
Corrales, New Mexico is a small village located in the Rio Grande Valley in the southwestern part of the state. It is situated between the cities of Albuquerque and Rio Rancho, and is part of the Albuquerque Metropolitan Statistical Area. The village has a population of 8,329 as of the 2010 census, and is known for its rural atmosphere and its proximity to the Rio Grande River.
History
The area that is now Corrales was originally inhabited by the Pueblo Indians, who lived in the area for centuries before the arrival of the Spanish in the 16th century. The Spanish established a mission in the area in 1680, and the village of Corrales was founded in 1712. The village was named after the Spanish word for “corral,” which was used to describe the area’s many small farms.
In the 19th century, the village was a popular stop for travelers on the Santa Fe Trail. The village was also home to a number of ranches, which were used to raise cattle and horses. In the late 19th century, the village was home to a number of small businesses, including a general store, a blacksmith shop, and a post office.
Geography
Corrales is located in the Rio Grande Valley, which is part of the Rio Grande Rift. The village is situated between the cities of Albuquerque and Rio Rancho, and is part of the Albuquerque Metropolitan Statistical Area. The village is located at an elevation of 5,000 feet above sea level, and is surrounded by the Sandia Mountains to the east and the Manzano Mountains to the west.
The village is located on the banks of the Rio Grande River, and is home to a number of parks and recreational areas. The Corrales Bosque Preserve is a popular destination for bird watching, and the Corrales Nature Center offers educational programs and guided tours.
Economy
The economy of Corrales is largely based on agriculture and tourism. The village is home to a number of small farms, which produce a variety of fruits and vegetables, as well as hay and alfalfa. The village is also home to a number of wineries, which produce a variety of wines.
The village is also home to a number of small businesses, including restaurants, shops, and galleries. The village is also home to a number of bed and breakfasts, which attract visitors from around the world.
Demographics
As of the 2010 census, the population of Corrales was 8,329. The population is largely Hispanic, with a majority of the population being of Mexican descent. The median household income in the village is $63,945, and the median age is 41.
Conclusion
Corrales, New Mexico is a small village located in the Rio Grande Valley in the southwestern part of the state. It is situated between the cities of Albuquerque and Rio Rancho, and is part of the Albuquerque Metropolitan Statistical Area. The village has a population of 8,329 as of the 2010 census, and is known for its rural atmosphere and its proximity to the Rio Grande River. The economy of Corrales is largely based on agriculture and tourism, and the population is largely Hispanic. The village is home to a number of small businesses, parks, and recreational areas, and is a popular destination for visitors from around the world.
Common Questions
What is Per Capita Income in Corrales?
Per Capita income in Corrales is $61,160.
What is the Median Family Income in Corrales?
Median Family Income in Corrales is $133,487.
What is the Median Household income in Corrales?
Median Household Income in Corrales is $94,966.
What is Income or Wage Gap in Corrales?
Income or Wage Gap in Corrales is 33.6%.
Women in Corrales earn 66.4 cents for every dollar earned by a man.
What is Inequality or Gini Index in Corrales?
Inequality or Gini Index in Corrales is 0.46.
What is the Total Population of Corrales?
Total Population of Corrales is 8,495.
What is the Total Male Population of Corrales?
Total Male Population of Corrales is 4,000.
What is the Total Female Population of Corrales?
Total Female Population of Corrales is 4,495.
What is the Ratio of Males per 100 Females in Corrales?
There are 88.99 Males per 100 Females in Corrales.
What is the Ratio of Females per 100 Males in Corrales?
There are 112.38 Females per 100 Males in Corrales.
What is the Median Population Age in Corrales?
Median Population Age in Corrales is 56.5 Years.
What is the Average Family Size in Corrales
Average Family Size in Corrales is 2.7 People.
What is the Average Household Size in Corrales
Average Household Size in Corrales is 2.4 People.
How Large is the Labor Force in Corrales?
There are 4,093 People in the Labor Forcein in Corrales.
What is the Percentage of People in the Labor Force in Corrales?
54.9% of People are in the Labor Force in Corrales.
What is the Unemployment Rate in Corrales?
Unemployment Rate in Corrales is 4.6%.