Punaluu, HI Map & Demographics
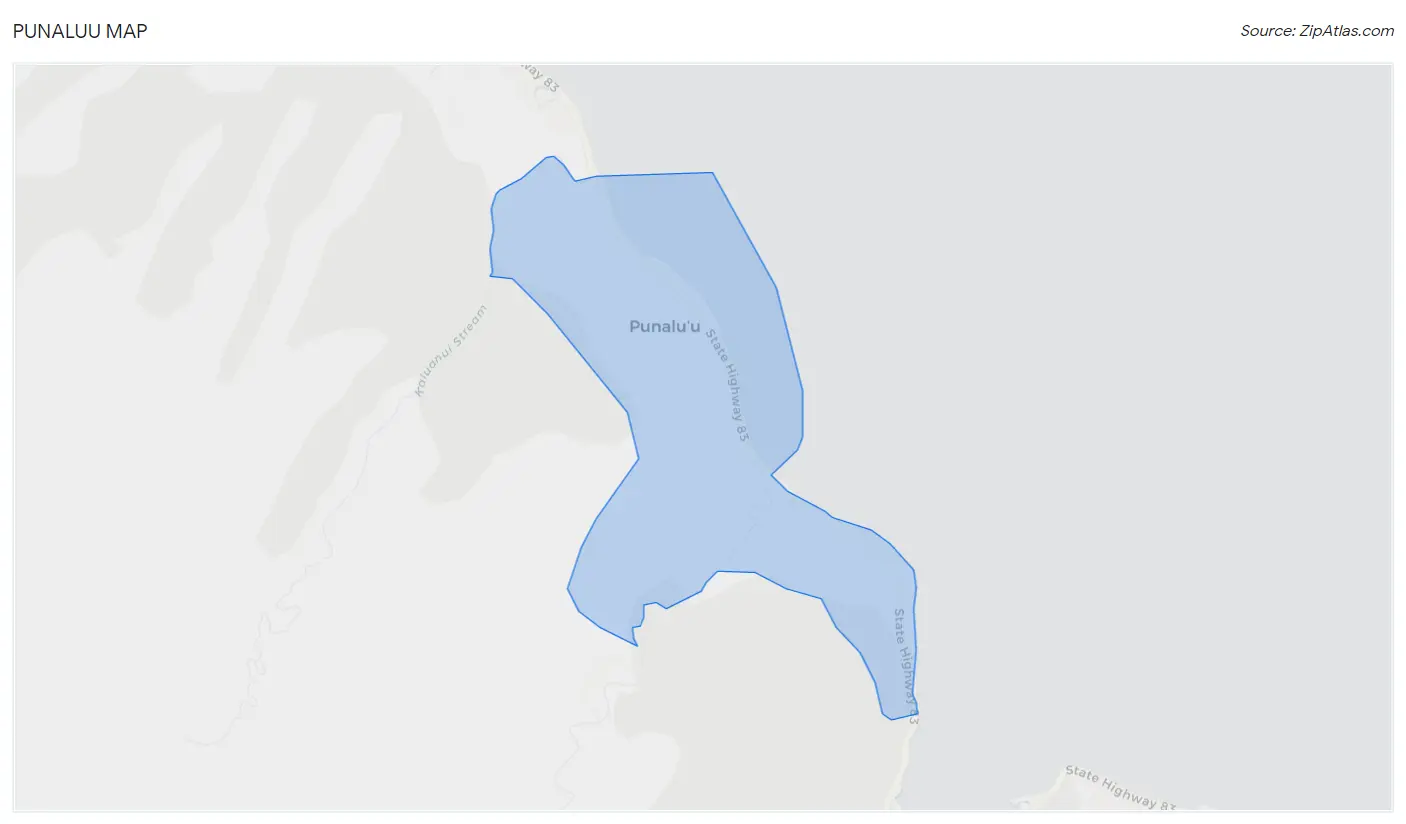
Punaluu Map
Punaluu Overview
$43,771
PER CAPITA INCOME
$116,207
AVG FAMILY INCOME
$83,929
AVG HOUSEHOLD INCOME
39.8%
WAGE / INCOME GAP [ % ]
60.2¢/ $1
WAGE / INCOME GAP [ $ ]
$13,660
FAMILY INCOME DEFICIT
0.47
INEQUALITY / GINI INDEX
917
TOTAL POPULATION
464
MALE POPULATION
453
FEMALE POPULATION
102.43
MALES / 100 FEMALES
97.63
FEMALES / 100 MALES
39.9
MEDIAN AGE
3.8
AVG FAMILY SIZE
2.6
AVG HOUSEHOLD SIZE
461
LABOR FORCE [ PEOPLE ]
60.9%
PERCENT IN LABOR FORCE
4.4%
UNEMPLOYMENT RATE
Income in Punaluu
Income Overview in Punaluu
Per Capita Income in Punaluu is $43,771, while median incomes of families and households are $116,207 and $83,929 respectively.
| Characteristic | Number | Measure |
| Per Capita Income | 917 | $43,771 |
| Median Family Income | 168 | $116,207 |
| Mean Family Income | 168 | $124,629 |
| Median Household Income | 338 | $83,929 |
| Mean Household Income | 338 | $113,328 |
| Income Deficit | 168 | $13,660 |
| Wage / Income Gap (%) | 917 | 39.81% |
| Wage / Income Gap ($) | 917 | 60.19¢ per $1 |
| Gini / Inequality Index | 917 | 0.47 |
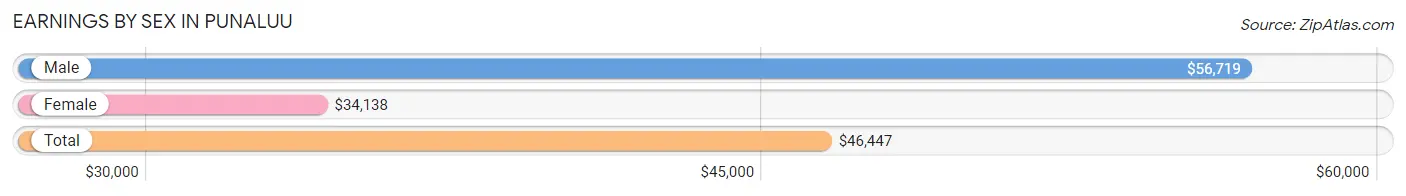
Earnings by Sex in Punaluu
Average Earnings in Punaluu are $46,447, $56,719 for men and $34,138 for women, a difference of 39.8%.
| Sex | Number | Average Earnings |
| Male | 288 (59.3%) | $56,719 |
| Female | 198 (40.7%) | $34,138 |
| Total | 486 (100.0%) | $46,447 |
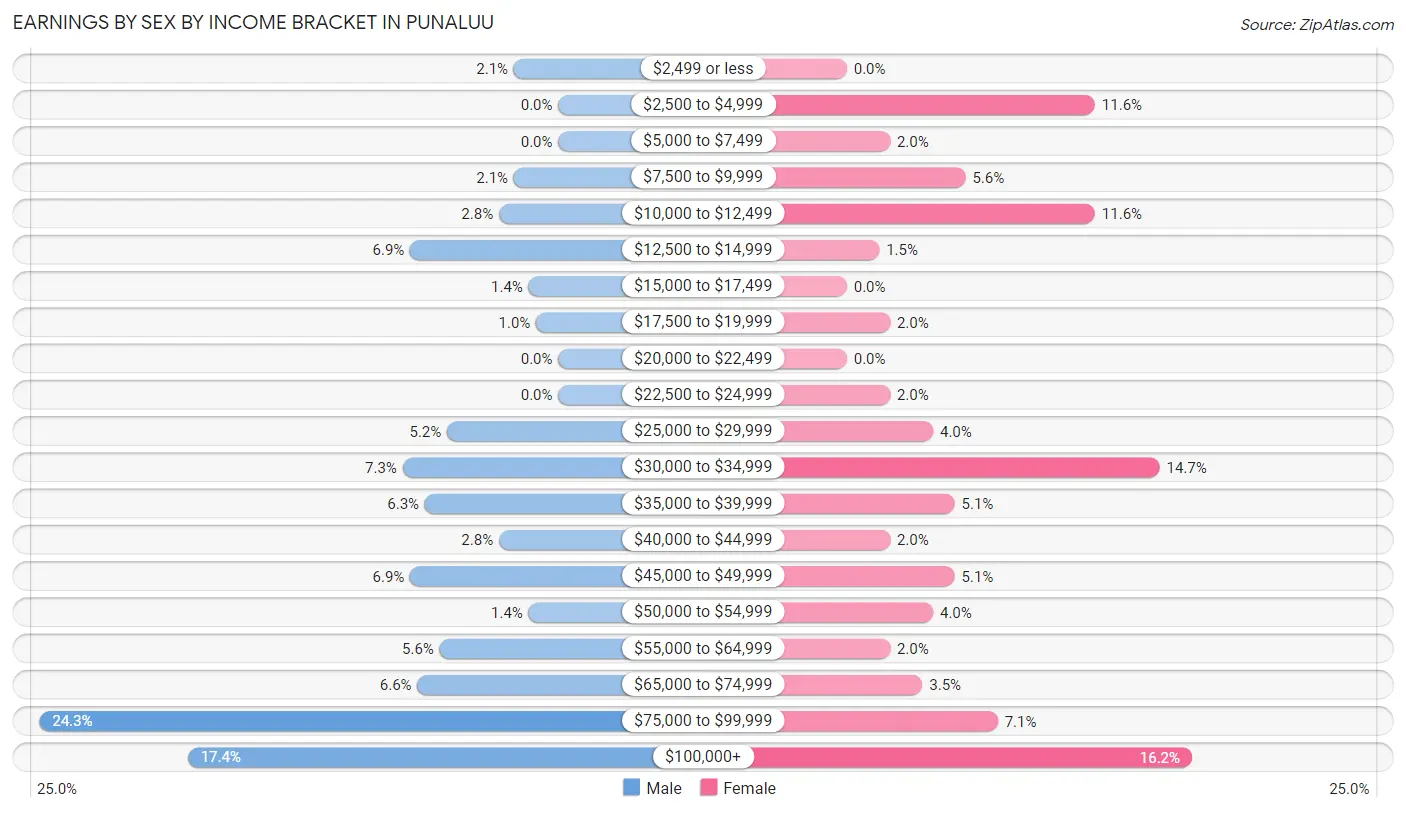
Earnings by Sex by Income Bracket in Punaluu
The most common earnings brackets in Punaluu are $75,000 to $99,999 for men (70 | 24.3%) and $100,000+ for women (32 | 16.2%).
| Income | Male | Female |
| $2,499 or less | 6 (2.1%) | 0 (0.0%) |
| $2,500 to $4,999 | 0 (0.0%) | 23 (11.6%) |
| $5,000 to $7,499 | 0 (0.0%) | 4 (2.0%) |
| $7,500 to $9,999 | 6 (2.1%) | 11 (5.6%) |
| $10,000 to $12,499 | 8 (2.8%) | 23 (11.6%) |
| $12,500 to $14,999 | 20 (6.9%) | 3 (1.5%) |
| $15,000 to $17,499 | 4 (1.4%) | 0 (0.0%) |
| $17,500 to $19,999 | 3 (1.0%) | 4 (2.0%) |
| $20,000 to $22,499 | 0 (0.0%) | 0 (0.0%) |
| $22,500 to $24,999 | 0 (0.0%) | 4 (2.0%) |
| $25,000 to $29,999 | 15 (5.2%) | 8 (4.0%) |
| $30,000 to $34,999 | 21 (7.3%) | 29 (14.6%) |
| $35,000 to $39,999 | 18 (6.2%) | 10 (5.1%) |
| $40,000 to $44,999 | 8 (2.8%) | 4 (2.0%) |
| $45,000 to $49,999 | 20 (6.9%) | 10 (5.1%) |
| $50,000 to $54,999 | 4 (1.4%) | 8 (4.0%) |
| $55,000 to $64,999 | 16 (5.6%) | 4 (2.0%) |
| $65,000 to $74,999 | 19 (6.6%) | 7 (3.5%) |
| $75,000 to $99,999 | 70 (24.3%) | 14 (7.1%) |
| $100,000+ | 50 (17.4%) | 32 (16.2%) |
| Total | 288 (100.0%) | 198 (100.0%) |
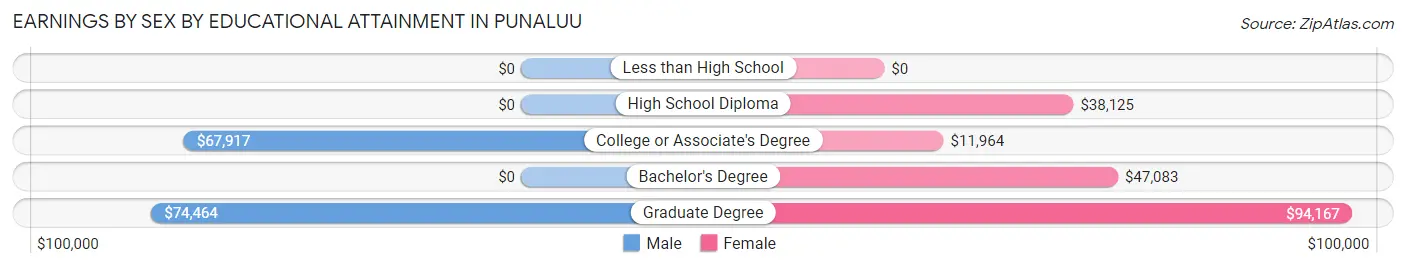
Earnings by Sex by Educational Attainment in Punaluu
Average earnings in Punaluu are $67,604 for men and $39,306 for women, a difference of 41.9%. Men with an educational attainment of graduate degree enjoy the highest average annual earnings of $74,464, while those with college or associate's degree education earn the least with $67,917. Women with an educational attainment of graduate degree earn the most with the average annual earnings of $94,167, while those with college or associate's degree education have the smallest earnings of $11,964.
| Educational Attainment | Male Income | Female Income |
| Less than High School | - | - |
| High School Diploma | - | - |
| College or Associate's Degree | $67,917 | $11,964 |
| Bachelor's Degree | - | - |
| Graduate Degree | $74,464 | $94,167 |
| Total | $67,604 | $39,306 |
Family Income in Punaluu
Family Income Brackets in Punaluu
According to the Punaluu family income data, there are 50 families falling into the $100,000 to $149,999 income range, which is the most common income bracket and makes up 29.8% of all families.
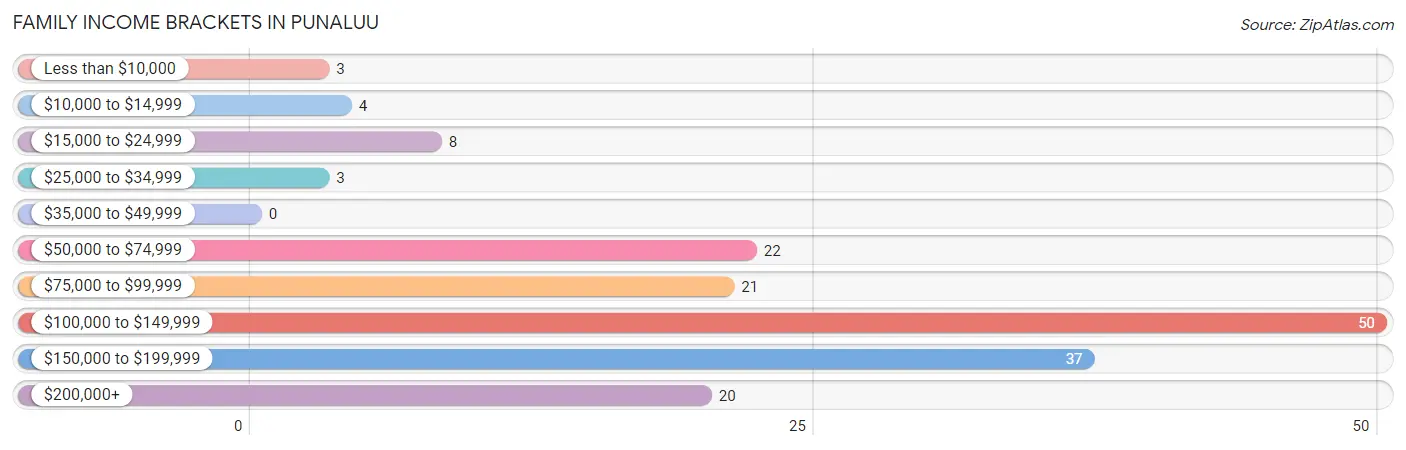
| Income Bracket | # Families | % Families |
| Less than $10,000 | 3 | 1.8% |
| $10,000 to $14,999 | 4 | 2.4% |
| $15,000 to $24,999 | 8 | 4.8% |
| $25,000 to $34,999 | 3 | 1.8% |
| $35,000 to $49,999 | 0 | 0.0% |
| $50,000 to $74,999 | 22 | 13.1% |
| $75,000 to $99,999 | 21 | 12.5% |
| $100,000 to $149,999 | 50 | 29.8% |
| $150,000 to $199,999 | 37 | 22.0% |
| $200,000+ | 20 | 11.9% |
Family Income by Famaliy Size in Punaluu
3-person families (46 | 27.4%) account for the highest median family income in Punaluu with $116,466 per family, while 2-person families (49 | 29.2%) have the highest median income of $56,146 per family member.
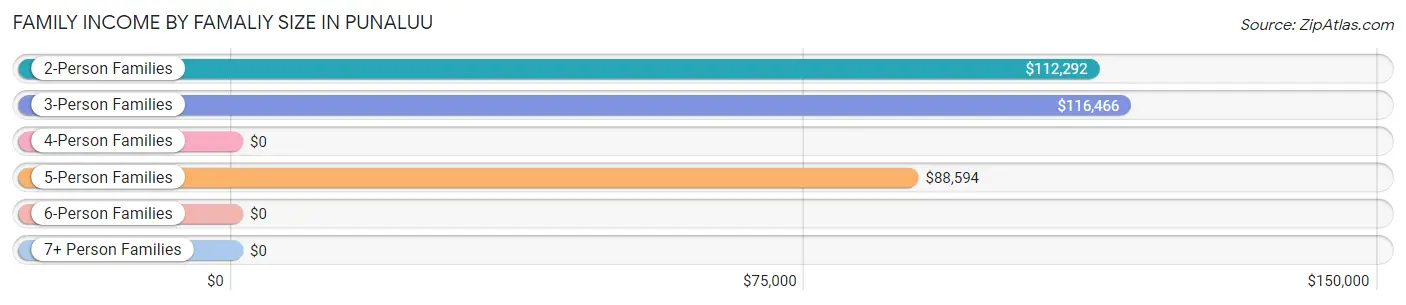
| Income Bracket | # Families | Median Income |
| 2-Person Families | 49 (29.2%) | $112,292 |
| 3-Person Families | 46 (27.4%) | $116,466 |
| 4-Person Families | 42 (25.0%) | $0 |
| 5-Person Families | 23 (13.7%) | $88,594 |
| 6-Person Families | 8 (4.8%) | $0 |
| 7+ Person Families | 0 (0.0%) | $0 |
| Total | 168 (100.0%) | $116,207 |
Family Income by Number of Earners in Punaluu
The median family income in Punaluu is $116,207, with families comprising 3+ earners (23) having the highest median family income of $175,313, while families with 1 earner (37) have the lowest median family income of $86,250, accounting for 13.7% and 22.0% of families, respectively.
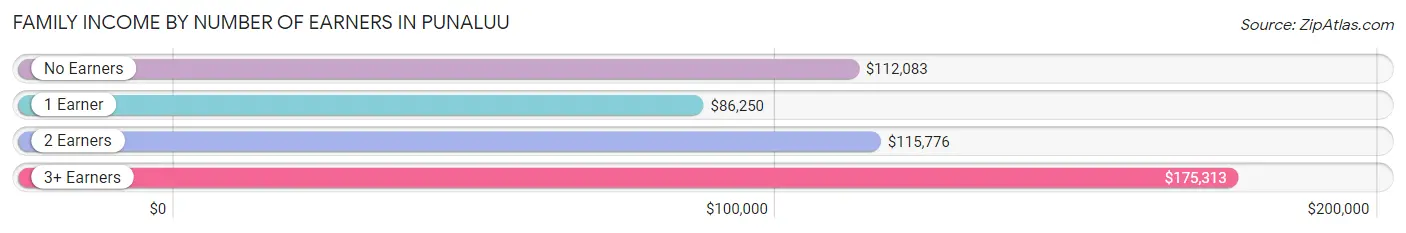
| Number of Earners | # Families | Median Income |
| No Earners | 22 (13.1%) | $112,083 |
| 1 Earner | 37 (22.0%) | $86,250 |
| 2 Earners | 86 (51.2%) | $115,776 |
| 3+ Earners | 23 (13.7%) | $175,313 |
| Total | 168 (100.0%) | $116,207 |
Household Income in Punaluu
Household Income Brackets in Punaluu
With 65 households falling in the category, the $200,000+ income range is the most frequent in Punaluu, accounting for 19.2% of all households. In contrast, only 7 households (2.1%) fall into the less than $10,000 income bracket, making it the least populous group.
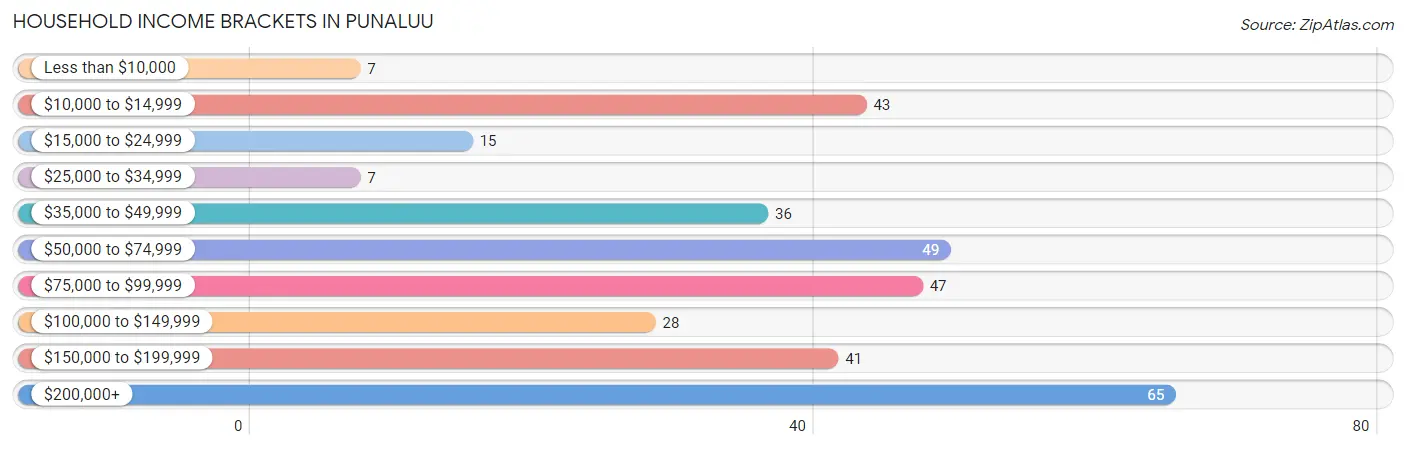
| Income Bracket | # Households | % Households |
| Less than $10,000 | 7 | 2.1% |
| $10,000 to $14,999 | 43 | 12.7% |
| $15,000 to $24,999 | 15 | 4.4% |
| $25,000 to $34,999 | 7 | 2.1% |
| $35,000 to $49,999 | 36 | 10.7% |
| $50,000 to $74,999 | 49 | 14.5% |
| $75,000 to $99,999 | 47 | 13.9% |
| $100,000 to $149,999 | 28 | 8.3% |
| $150,000 to $199,999 | 41 | 12.1% |
| $200,000+ | 65 | 19.2% |
Household Income by Householder Age in Punaluu
The median household income in Punaluu is $83,929, with the highest median household income of $98,036 found in the 45 to 64 years age bracket for the primary householder. A total of 151 households (44.7%) fall into this category. Meanwhile, the 15 to 24 years age bracket for the primary householder has the lowest median household income of $0, with 4 households (1.2%) in this group.
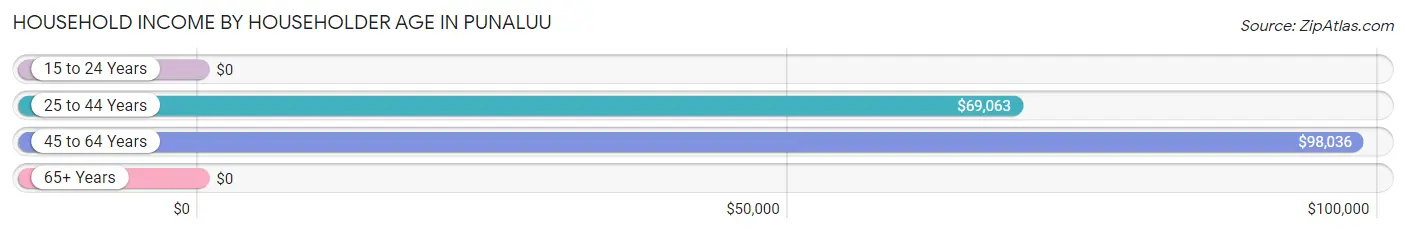
| Income Bracket | # Households | Median Income |
| 15 to 24 Years | 4 (1.2%) | $0 |
| 25 to 44 Years | 99 (29.3%) | $69,063 |
| 45 to 64 Years | 151 (44.7%) | $98,036 |
| 65+ Years | 84 (24.8%) | $0 |
| Total | 338 (100.0%) | $83,929 |
Poverty in Punaluu
Income Below Poverty by Sex and Age in Punaluu
With 8.2% poverty level for males and 16.4% for females among the residents of Punaluu, 18 to 24 year old males and under 5 year old females are the most vulnerable to poverty, with 6 males (30.0%) and 7 females (100.0%) in their respective age groups living below the poverty level.
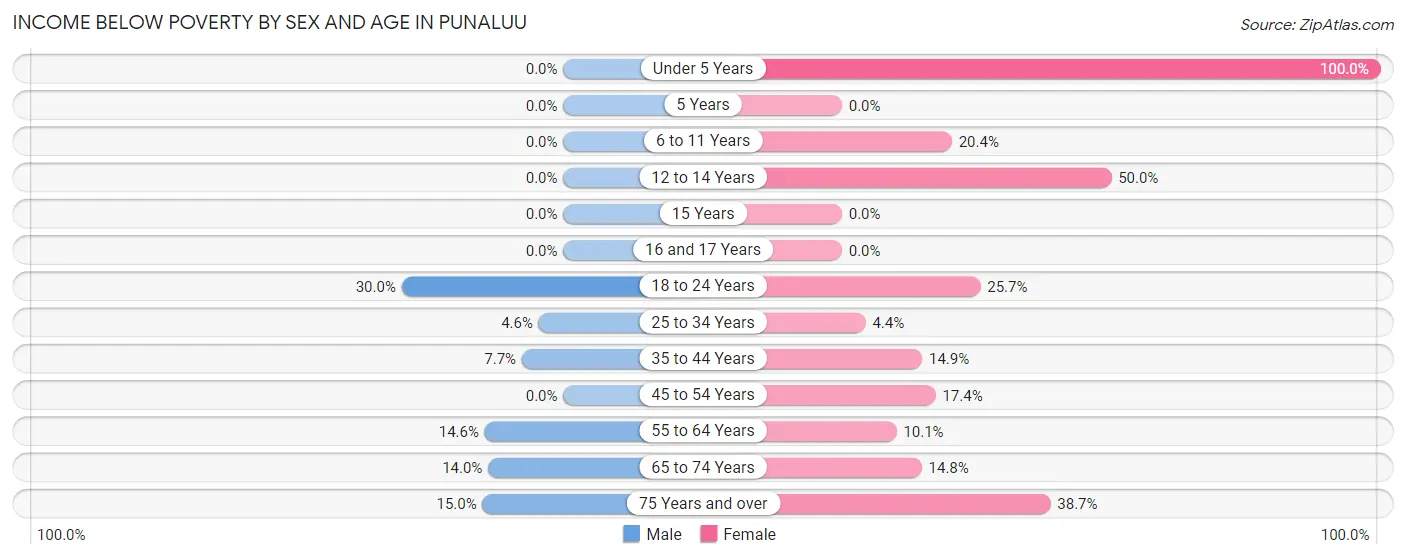
| Age Bracket | Male | Female |
| Under 5 Years | 0 (0.0%) | 7 (100.0%) |
| 5 Years | 0 (0.0%) | 0 (0.0%) |
| 6 to 11 Years | 0 (0.0%) | 10 (20.4%) |
| 12 to 14 Years | 0 (0.0%) | 3 (50.0%) |
| 15 Years | 0 (0.0%) | 0 (0.0%) |
| 16 and 17 Years | 0 (0.0%) | 0 (0.0%) |
| 18 to 24 Years | 6 (30.0%) | 9 (25.7%) |
| 25 to 34 Years | 4 (4.5%) | 4 (4.4%) |
| 35 to 44 Years | 4 (7.7%) | 7 (14.9%) |
| 45 to 54 Years | 0 (0.0%) | 4 (17.4%) |
| 55 to 64 Years | 14 (14.6%) | 7 (10.1%) |
| 65 to 74 Years | 6 (14.0%) | 8 (14.8%) |
| 75 Years and over | 3 (15.0%) | 12 (38.7%) |
| Total | 37 (8.2%) | 71 (16.4%) |
Income Above Poverty by Sex and Age in Punaluu
According to the poverty statistics in Punaluu, males aged under 5 years and females aged 5 years are the age groups that are most secure financially, with 100.0% of males and 100.0% of females in these age groups living above the poverty line.
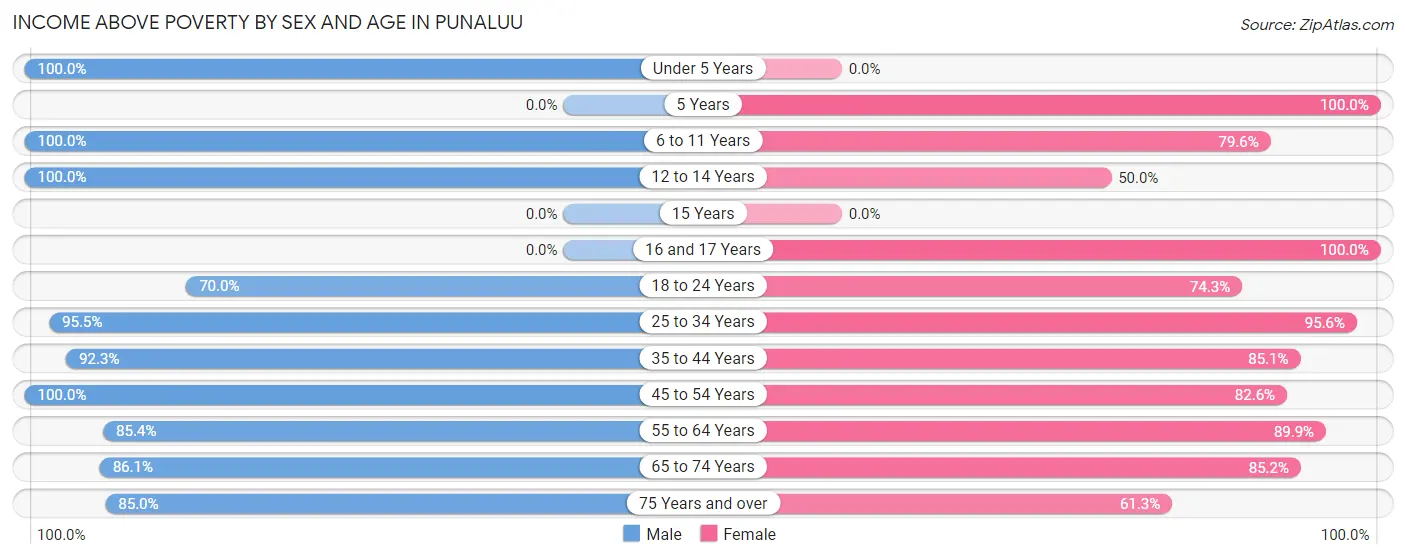
| Age Bracket | Male | Female |
| Under 5 Years | 27 (100.0%) | 0 (0.0%) |
| 5 Years | 0 (0.0%) | 15 (100.0%) |
| 6 to 11 Years | 38 (100.0%) | 39 (79.6%) |
| 12 to 14 Years | 11 (100.0%) | 3 (50.0%) |
| 15 Years | 0 (0.0%) | 0 (0.0%) |
| 16 and 17 Years | 0 (0.0%) | 7 (100.0%) |
| 18 to 24 Years | 14 (70.0%) | 26 (74.3%) |
| 25 to 34 Years | 84 (95.5%) | 87 (95.6%) |
| 35 to 44 Years | 48 (92.3%) | 40 (85.1%) |
| 45 to 54 Years | 58 (100.0%) | 19 (82.6%) |
| 55 to 64 Years | 82 (85.4%) | 62 (89.9%) |
| 65 to 74 Years | 37 (86.1%) | 46 (85.2%) |
| 75 Years and over | 17 (85.0%) | 19 (61.3%) |
| Total | 416 (91.8%) | 363 (83.6%) |
Income Below Poverty Among Married-Couple Families in Punaluu
The poverty statistics for married-couple families in Punaluu show that 10.5% or 15 of the total 143 families live below the poverty line. Families with 3 or 4 children have the highest poverty rate of 25.0%, comprising of 4 families. On the other hand, families with no children have the lowest poverty rate of 4.6%, which includes 4 families.
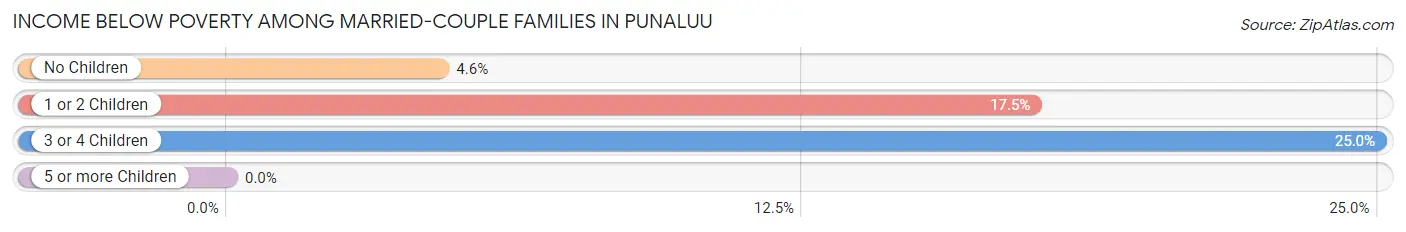
| Children | Above Poverty | Below Poverty |
| No Children | 83 (95.4%) | 4 (4.6%) |
| 1 or 2 Children | 33 (82.5%) | 7 (17.5%) |
| 3 or 4 Children | 12 (75.0%) | 4 (25.0%) |
| 5 or more Children | 0 (0.0%) | 0 (0.0%) |
| Total | 128 (89.5%) | 15 (10.5%) |
Income Below Poverty Among Single-Parent Households in Punaluu
| Children | Single Father | Single Mother |
| No Children | 0 (0.0%) | 0 (0.0%) |
| 1 or 2 Children | 0 (0.0%) | 0 (0.0%) |
| 3 or 4 Children | 0 (0.0%) | 0 (0.0%) |
| 5 or more Children | 0 (0.0%) | 0 (0.0%) |
| Total | 0 (0.0%) | 0 (0.0%) |
Income Below Poverty Among Married-Couple vs Single-Parent Households in Punaluu
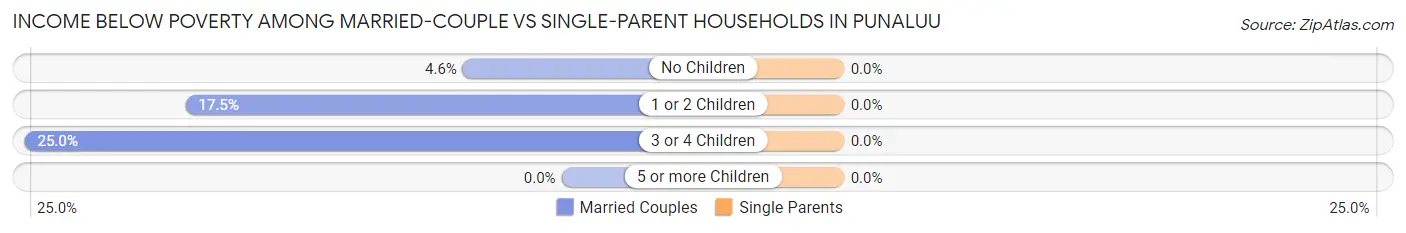
| Children | Married-Couple Families | Single-Parent Households |
| No Children | 4 (4.6%) | 0 (0.0%) |
| 1 or 2 Children | 7 (17.5%) | 0 (0.0%) |
| 3 or 4 Children | 4 (25.0%) | 0 (0.0%) |
| 5 or more Children | 0 (0.0%) | 0 (0.0%) |
| Total | 15 (10.5%) | 0 (0.0%) |
Race in Punaluu
The most populous races in Punaluu are White / Caucasian (350 | 38.2%), Two or more Races (254 | 27.7%), and Hawaiian / Pacific (172 | 18.8%).
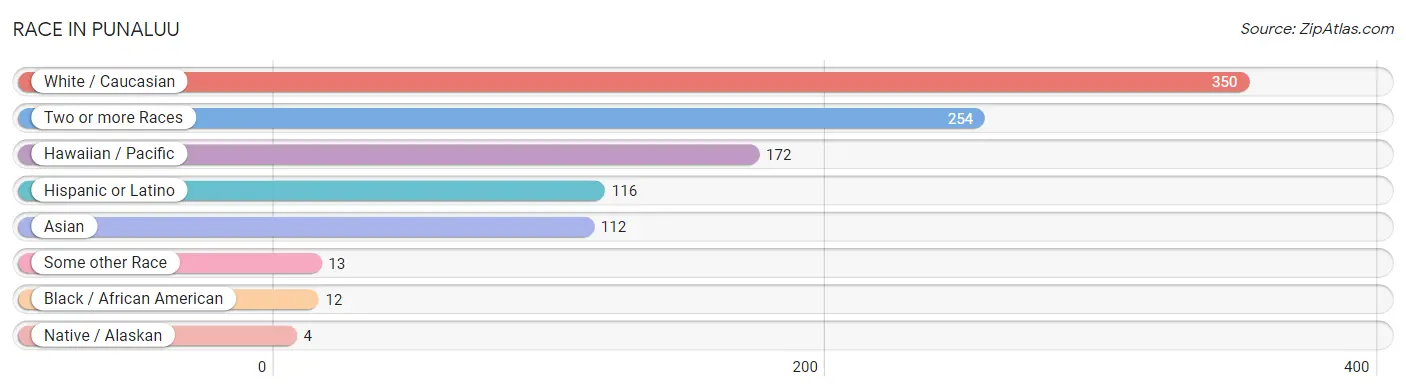
| Race | # Population | % Population |
| Asian | 112 | 12.2% |
| Black / African American | 12 | 1.3% |
| Hawaiian / Pacific | 172 | 18.8% |
| Hispanic or Latino | 116 | 12.7% |
| Native / Alaskan | 4 | 0.4% |
| White / Caucasian | 350 | 38.2% |
| Two or more Races | 254 | 27.7% |
| Some other Race | 13 | 1.4% |
| Total | 917 | 100.0% |
Ancestry in Punaluu
The most populous ancestries reported in Punaluu are Native Hawaiian (266 | 29.0%), English (181 | 19.7%), Bhutanese (127 | 13.9%), Korean (120 | 13.1%), and Indian (Asian) (107 | 11.7%), together accounting for 87.4% of all Punaluu residents.
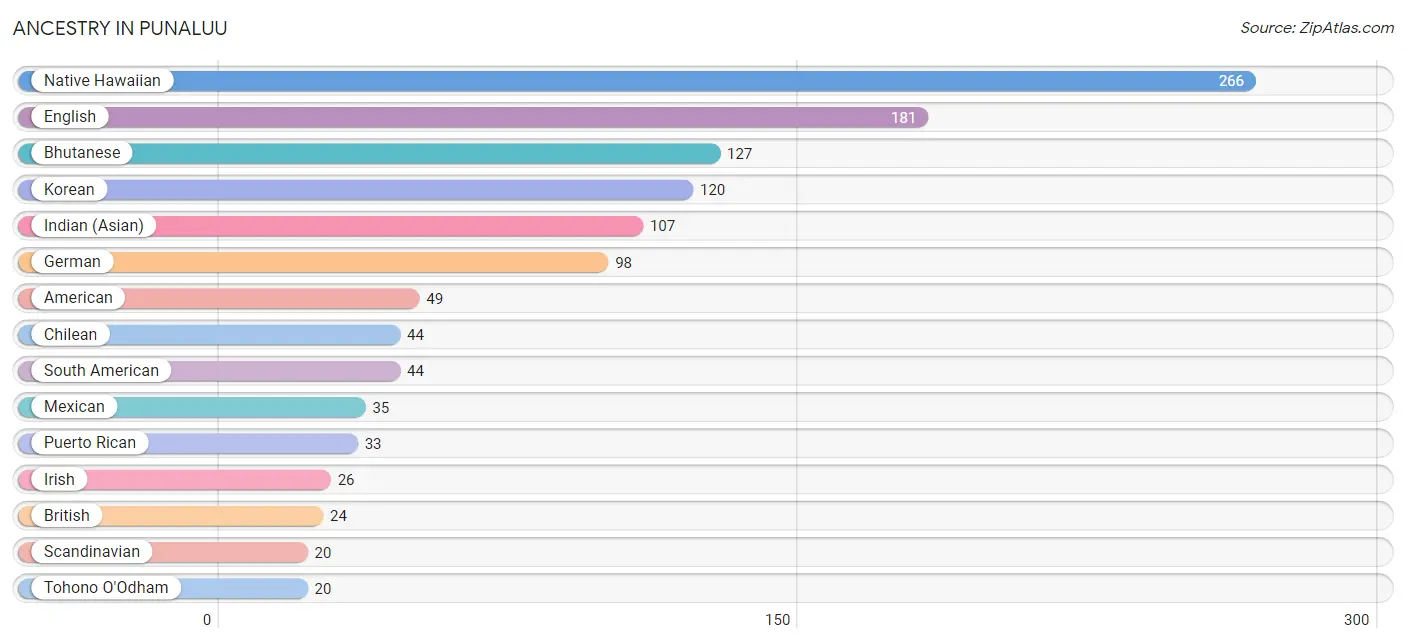
| Ancestry | # Population | % Population |
| American | 49 | 5.3% |
| Bhutanese | 127 | 13.9% |
| British | 24 | 2.6% |
| Central American | 3 | 0.3% |
| Cherokee | 2 | 0.2% |
| Chilean | 44 | 4.8% |
| Dutch | 3 | 0.3% |
| English | 181 | 19.7% |
| European | 4 | 0.4% |
| French | 15 | 1.6% |
| French Canadian | 3 | 0.3% |
| German | 98 | 10.7% |
| Hungarian | 6 | 0.6% |
| Indian (Asian) | 107 | 11.7% |
| Irish | 26 | 2.8% |
| Italian | 7 | 0.8% |
| Korean | 120 | 13.1% |
| Mexican | 35 | 3.8% |
| Native Hawaiian | 266 | 29.0% |
| Navajo | 4 | 0.4% |
| Portuguese | 7 | 0.8% |
| Puerto Rican | 33 | 3.6% |
| Russian | 7 | 0.8% |
| Salvadoran | 3 | 0.3% |
| Samoan | 16 | 1.7% |
| Scandinavian | 20 | 2.2% |
| Scotch-Irish | 12 | 1.3% |
| Scottish | 7 | 0.8% |
| Slavic | 3 | 0.3% |
| South American | 44 | 4.8% |
| Spanish | 1 | 0.1% |
| Sri Lankan | 8 | 0.9% |
| Swiss | 3 | 0.3% |
| Tohono O'Odham | 20 | 2.2% |
| Tongan | 9 | 1.0% | View All 35 Rows |
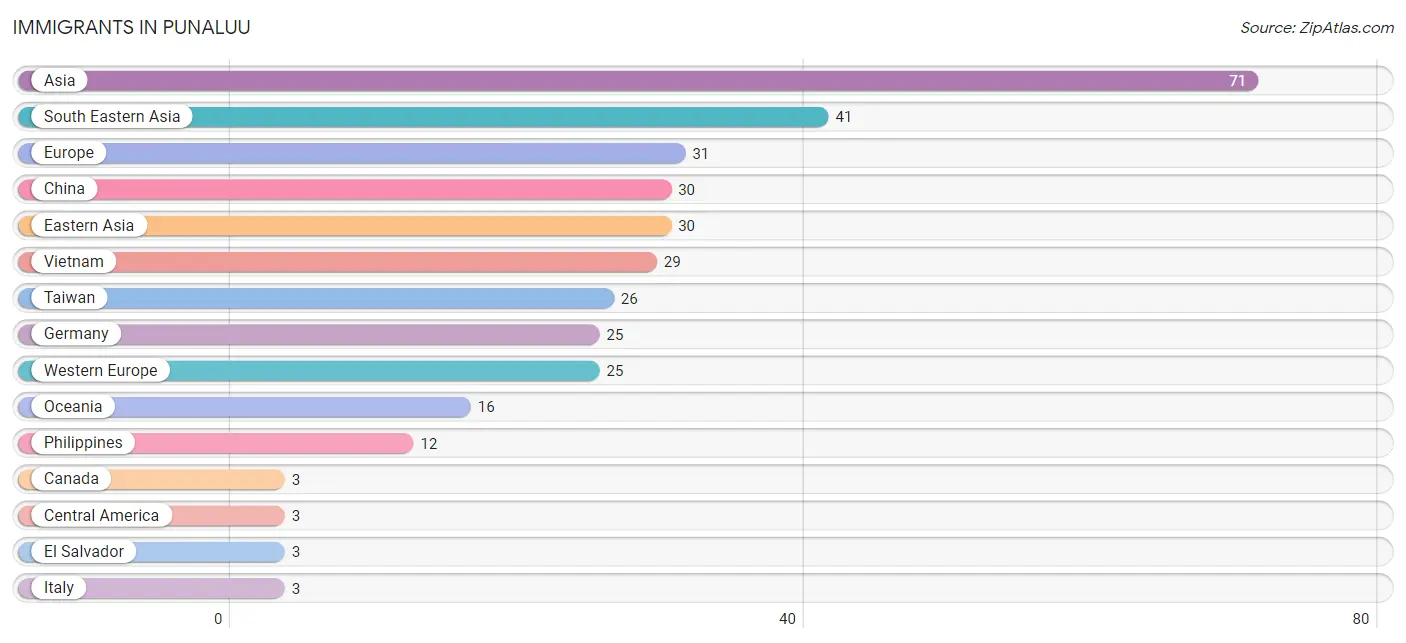
Immigrants in Punaluu
The most numerous immigrant groups reported in Punaluu came from Asia (71 | 7.7%), South Eastern Asia (41 | 4.5%), Europe (31 | 3.4%), China (30 | 3.3%), and Eastern Asia (30 | 3.3%), together accounting for 22.1% of all Punaluu residents.
| Immigration Origin | # Population | % Population |
| Asia | 71 | 7.7% |
| Canada | 3 | 0.3% |
| Central America | 3 | 0.3% |
| China | 30 | 3.3% |
| Eastern Asia | 30 | 3.3% |
| El Salvador | 3 | 0.3% |
| Europe | 31 | 3.4% |
| Germany | 25 | 2.7% |
| Italy | 3 | 0.3% |
| Latin America | 3 | 0.3% |
| Northern Europe | 3 | 0.3% |
| Oceania | 16 | 1.7% |
| Philippines | 12 | 1.3% |
| South Eastern Asia | 41 | 4.5% |
| Southern Europe | 3 | 0.3% |
| Taiwan | 26 | 2.8% |
| Vietnam | 29 | 3.2% |
| Western Europe | 25 | 2.7% | View All 18 Rows |
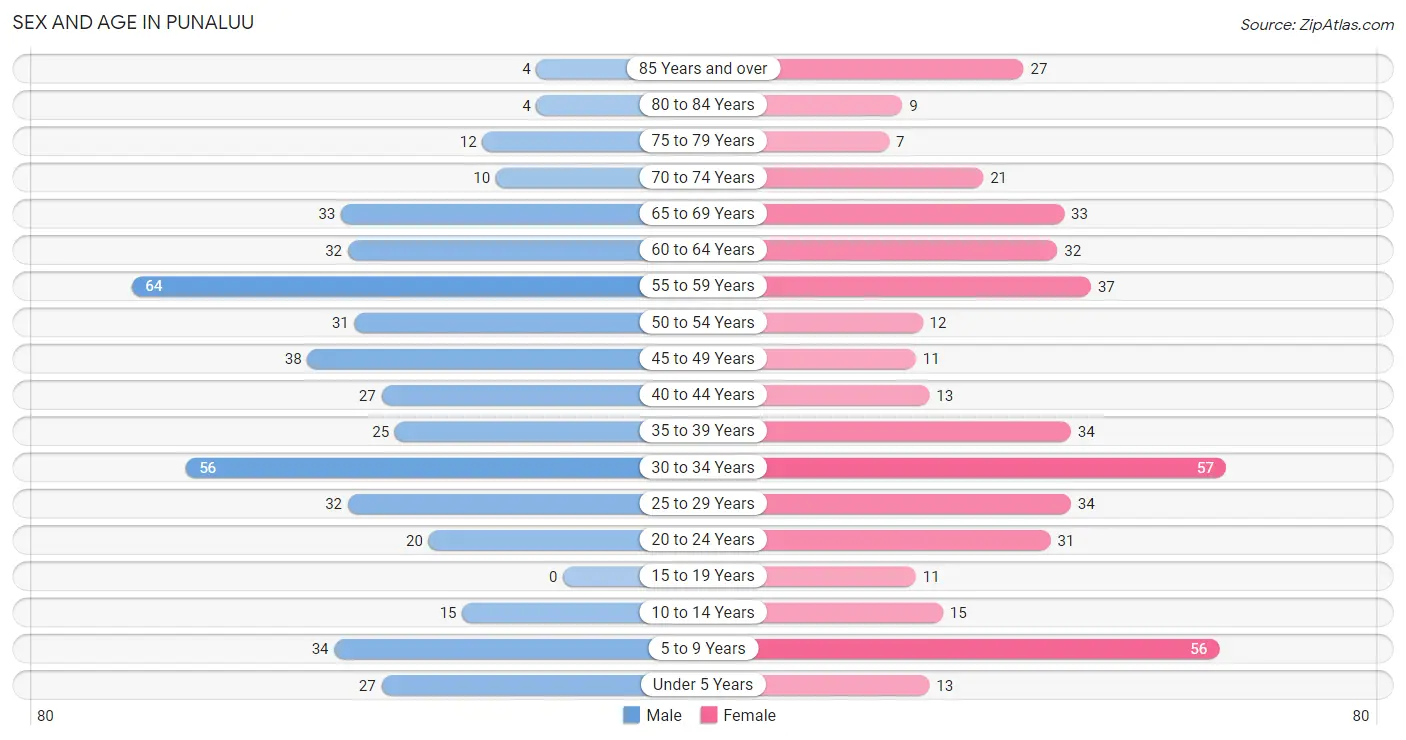
Sex and Age in Punaluu
Sex and Age in Punaluu
The most populous age groups in Punaluu are 55 to 59 Years (64 | 13.8%) for men and 30 to 34 Years (57 | 12.6%) for women.
| Age Bracket | Male | Female |
| Under 5 Years | 27 (5.8%) | 13 (2.9%) |
| 5 to 9 Years | 34 (7.3%) | 56 (12.4%) |
| 10 to 14 Years | 15 (3.2%) | 15 (3.3%) |
| 15 to 19 Years | 0 (0.0%) | 11 (2.4%) |
| 20 to 24 Years | 20 (4.3%) | 31 (6.8%) |
| 25 to 29 Years | 32 (6.9%) | 34 (7.5%) |
| 30 to 34 Years | 56 (12.1%) | 57 (12.6%) |
| 35 to 39 Years | 25 (5.4%) | 34 (7.5%) |
| 40 to 44 Years | 27 (5.8%) | 13 (2.9%) |
| 45 to 49 Years | 38 (8.2%) | 11 (2.4%) |
| 50 to 54 Years | 31 (6.7%) | 12 (2.6%) |
| 55 to 59 Years | 64 (13.8%) | 37 (8.2%) |
| 60 to 64 Years | 32 (6.9%) | 32 (7.1%) |
| 65 to 69 Years | 33 (7.1%) | 33 (7.3%) |
| 70 to 74 Years | 10 (2.2%) | 21 (4.6%) |
| 75 to 79 Years | 12 (2.6%) | 7 (1.5%) |
| 80 to 84 Years | 4 (0.9%) | 9 (2.0%) |
| 85 Years and over | 4 (0.9%) | 27 (6.0%) |
| Total | 464 (100.0%) | 453 (100.0%) |
Families and Households in Punaluu
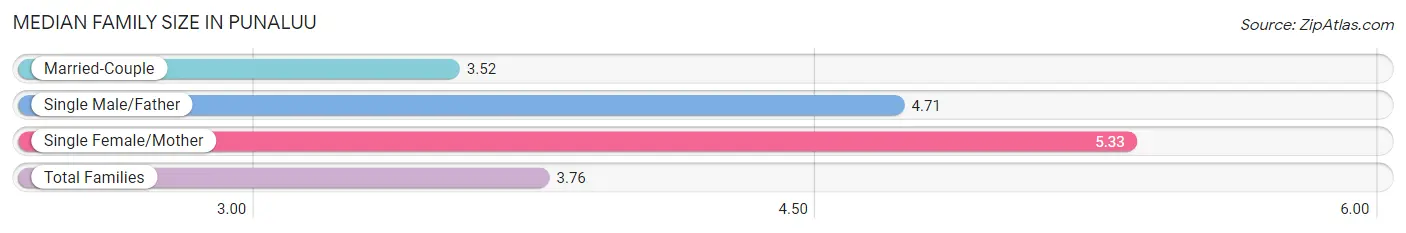
Median Family Size in Punaluu
The median family size in Punaluu is 3.76 persons per family, with single female/mother families (18 | 10.7%) accounting for the largest median family size of 5.33 persons per family. On the other hand, married-couple families (143 | 85.1%) represent the smallest median family size with 3.52 persons per family.
| Family Type | # Families | Family Size |
| Married-Couple | 143 (85.1%) | 3.52 |
| Single Male/Father | 7 (4.2%) | 4.71 |
| Single Female/Mother | 18 (10.7%) | 5.33 |
| Total Families | 168 (100.0%) | 3.76 |
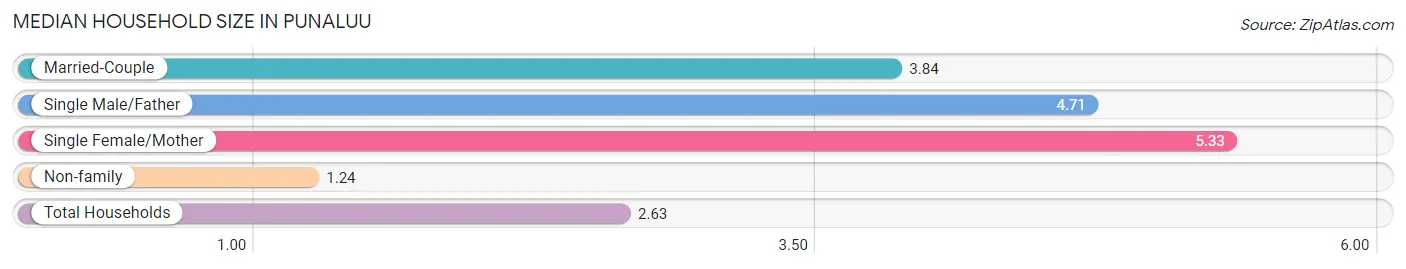
Median Household Size in Punaluu
The median household size in Punaluu is 2.63 persons per household, with single female/mother households (18 | 5.3%) accounting for the largest median household size of 5.33 persons per household. non-family households (170 | 50.3%) represent the smallest median household size with 1.24 persons per household.
| Household Type | # Households | Household Size |
| Married-Couple | 143 (42.3%) | 3.84 |
| Single Male/Father | 7 (2.1%) | 4.71 |
| Single Female/Mother | 18 (5.3%) | 5.33 |
| Non-family | 170 (50.3%) | 1.24 |
| Total Households | 338 (100.0%) | 2.63 |
Household Size by Marriage Status in Punaluu
Out of a total of 338 households in Punaluu, 168 (49.7%) are family households, while 170 (50.3%) are nonfamily households. The most numerous type of family households are 4-person households, comprising 67, and the most common type of nonfamily households are 1-person households, comprising 122.
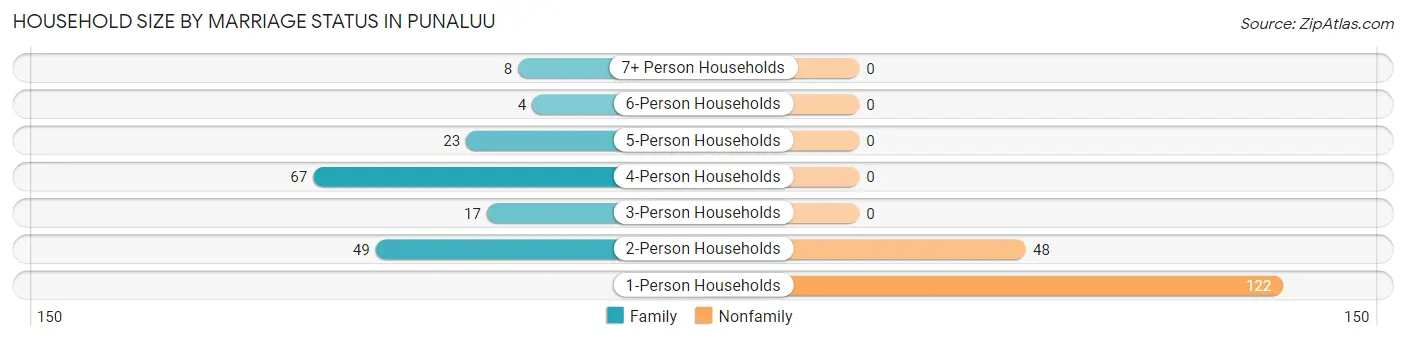
| Household Size | Family Households | Nonfamily Households |
| 1-Person Households | - | 122 (36.1%) |
| 2-Person Households | 49 (14.5%) | 48 (14.2%) |
| 3-Person Households | 17 (5.0%) | 0 (0.0%) |
| 4-Person Households | 67 (19.8%) | 0 (0.0%) |
| 5-Person Households | 23 (6.8%) | 0 (0.0%) |
| 6-Person Households | 4 (1.2%) | 0 (0.0%) |
| 7+ Person Households | 8 (2.4%) | 0 (0.0%) |
| Total | 168 (49.7%) | 170 (50.3%) |
Female Fertility in Punaluu
Fertility by Age in Punaluu
Average fertility rate in Punaluu is 89.0 births per 1,000 women. Women in the age bracket of 20 to 34 years have the highest fertility rate with 107.0 births per 1,000 women. Women in the age bracket of 20 to 34 years acount for 76.5% of all women with births.
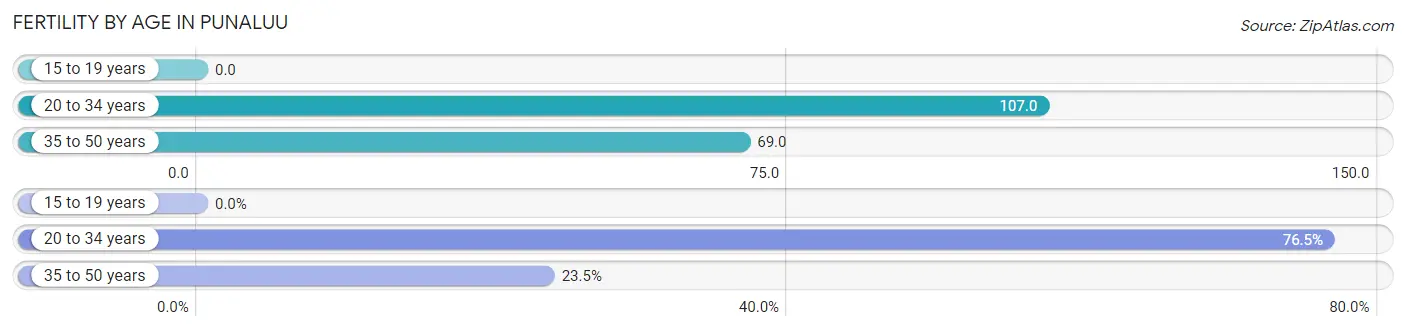
| Age Bracket | Women with Births | Births / 1,000 Women |
| 15 to 19 years | 0 (0.0%) | 0.0 |
| 20 to 34 years | 13 (76.5%) | 107.0 |
| 35 to 50 years | 4 (23.5%) | 69.0 |
| Total | 17 (100.0%) | 89.0 |
Fertility by Age by Marriage Status in Punaluu
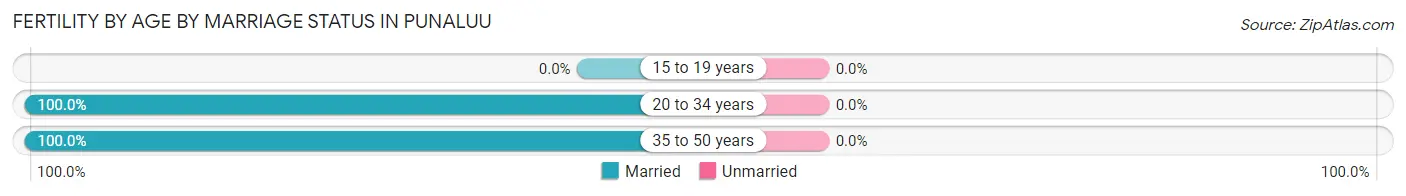
| Age Bracket | Married | Unmarried |
| 15 to 19 years | 0 (0.0%) | 0 (0.0%) |
| 20 to 34 years | 13 (100.0%) | 0 (0.0%) |
| 35 to 50 years | 4 (100.0%) | 0 (0.0%) |
| Total | 17 (100.0%) | 0 (0.0%) |
Fertility by Education in Punaluu
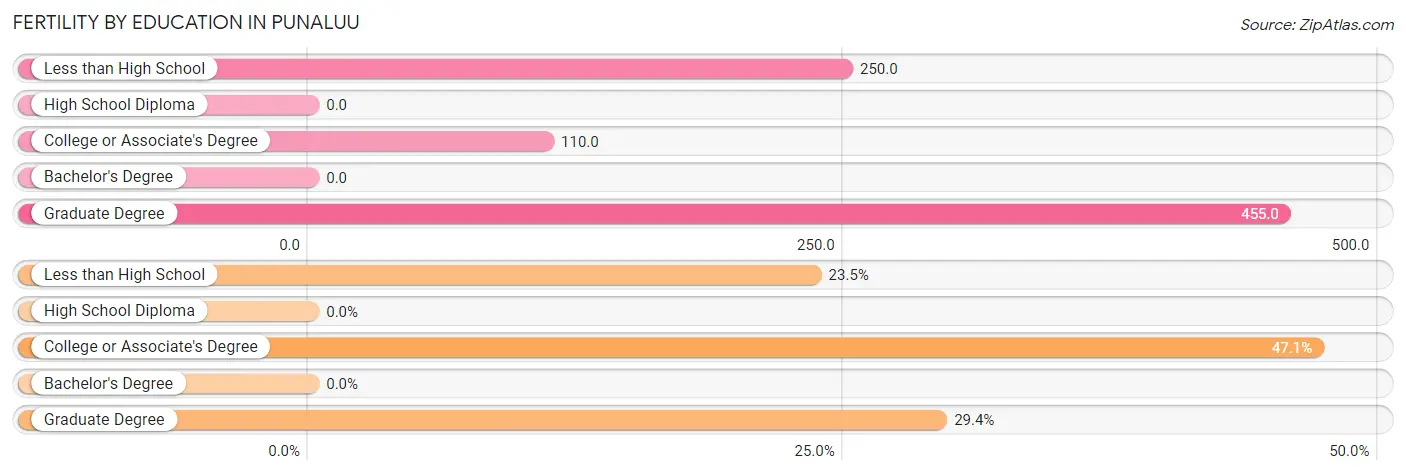
| Educational Attainment | Women with Births | Births / 1,000 Women |
| Less than High School | 4 (23.5%) | 250.0 |
| High School Diploma | 0 (0.0%) | 0.0 |
| College or Associate's Degree | 8 (47.1%) | 110.0 |
| Bachelor's Degree | 0 (0.0%) | 0.0 |
| Graduate Degree | 5 (29.4%) | 455.0 |
| Total | 17 (100.0%) | 89.0 |
Fertility by Education by Marriage Status in Punaluu
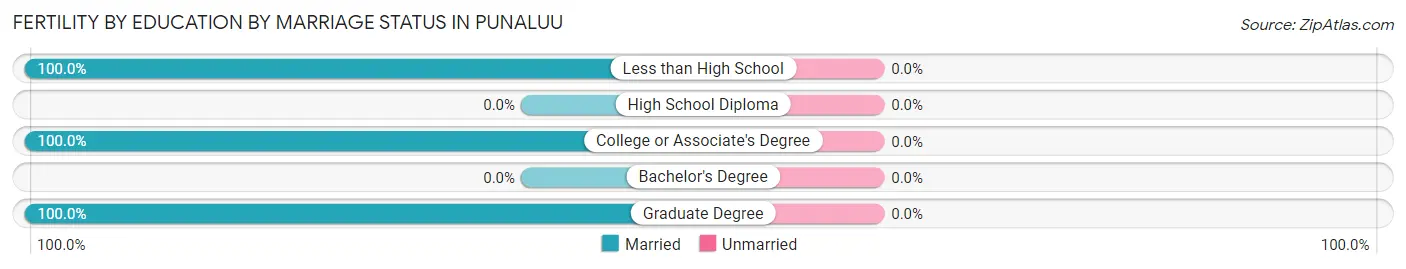
| Educational Attainment | Married | Unmarried |
| Less than High School | 4 (100.0%) | 0 (0.0%) |
| High School Diploma | 0 (0.0%) | 0 (0.0%) |
| College or Associate's Degree | 8 (100.0%) | 0 (0.0%) |
| Bachelor's Degree | 0 (0.0%) | 0 (0.0%) |
| Graduate Degree | 5 (100.0%) | 0 (0.0%) |
| Total | 17 (100.0%) | 0 (0.0%) |
Employment Characteristics in Punaluu
Employment by Class of Employer in Punaluu
Among the 441 employed individuals in Punaluu, private company employees (183 | 41.5%), self-employed (not incorporated) (62 | 14.1%), and not-for-profit organizations (56 | 12.7%) make up the most common classes of employment.
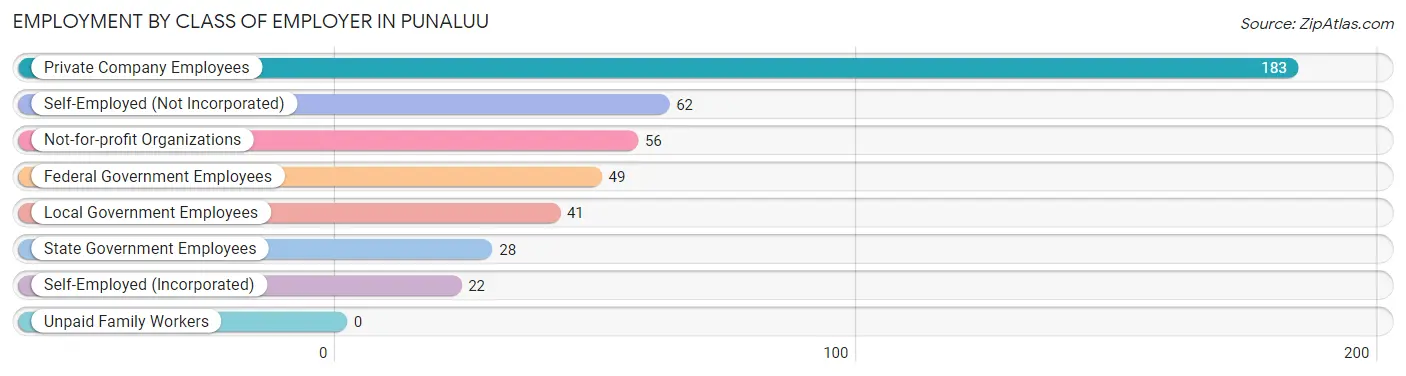
| Employer Class | # Employees | % Employees |
| Private Company Employees | 183 | 41.5% |
| Self-Employed (Incorporated) | 22 | 5.0% |
| Self-Employed (Not Incorporated) | 62 | 14.1% |
| Not-for-profit Organizations | 56 | 12.7% |
| Local Government Employees | 41 | 9.3% |
| State Government Employees | 28 | 6.4% |
| Federal Government Employees | 49 | 11.1% |
| Unpaid Family Workers | 0 | 0.0% |
| Total | 441 | 100.0% |
Employment Status by Age in Punaluu
According to the labor force statistics for Punaluu, out of the total population over 16 years of age (757), 60.9% or 461 individuals are in the labor force, with 4.4% or 20 of them unemployed. The age group with the highest labor force participation rate is 30 to 34 years, with 85.8% or 97 individuals in the labor force. Within the labor force, the 20 to 24 years age range has the highest percentage of unemployed individuals, with 25.9% or 7 of them being unemployed.
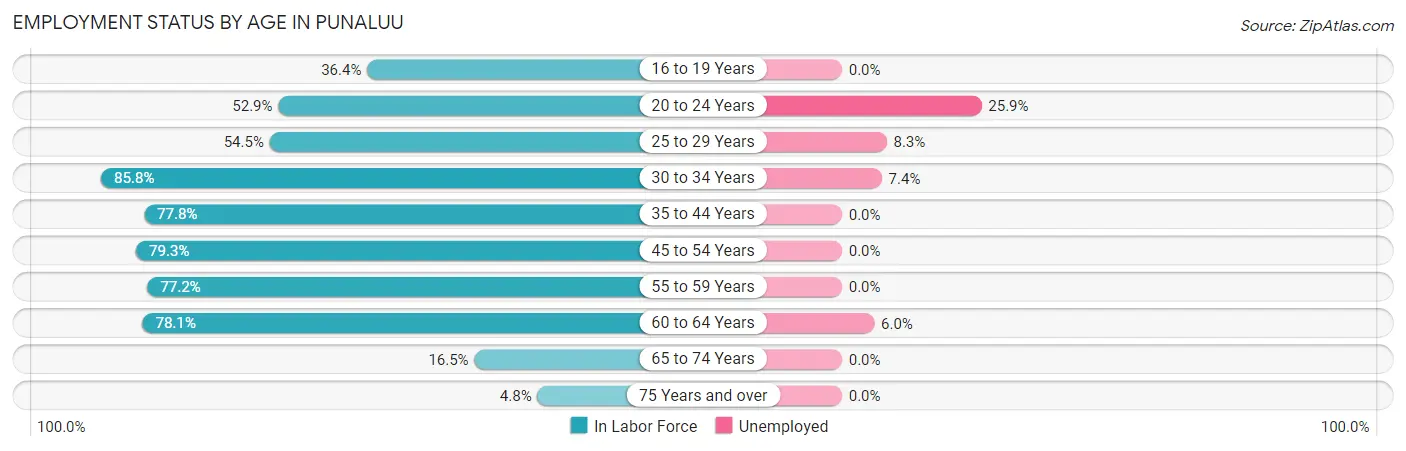
| Age Bracket | In Labor Force | Unemployed |
| 16 to 19 Years | 4 (36.4%) | 0 (0.0%) |
| 20 to 24 Years | 27 (52.9%) | 7 (25.9%) |
| 25 to 29 Years | 36 (54.5%) | 3 (8.3%) |
| 30 to 34 Years | 97 (85.8%) | 7 (7.4%) |
| 35 to 44 Years | 77 (77.8%) | 0 (0.0%) |
| 45 to 54 Years | 73 (79.3%) | 0 (0.0%) |
| 55 to 59 Years | 78 (77.2%) | 0 (0.0%) |
| 60 to 64 Years | 50 (78.1%) | 3 (6.0%) |
| 65 to 74 Years | 16 (16.5%) | 0 (0.0%) |
| 75 Years and over | 3 (4.8%) | 0 (0.0%) |
| Total | 461 (60.9%) | 20 (4.4%) |
Employment Status by Educational Attainment in Punaluu
According to labor force statistics for Punaluu, 76.8% of individuals (411) out of the total population between 25 and 64 years of age (535) are in the labor force, with 3.2% or 13 of them being unemployed. The group with the highest labor force participation rate are those with the educational attainment of bachelor's degree or higher, with 94.0% or 140 individuals in the labor force. Within the labor force, individuals with less than high school education have the highest percentage of unemployment, with 100.0% or 3 of them being unemployed.
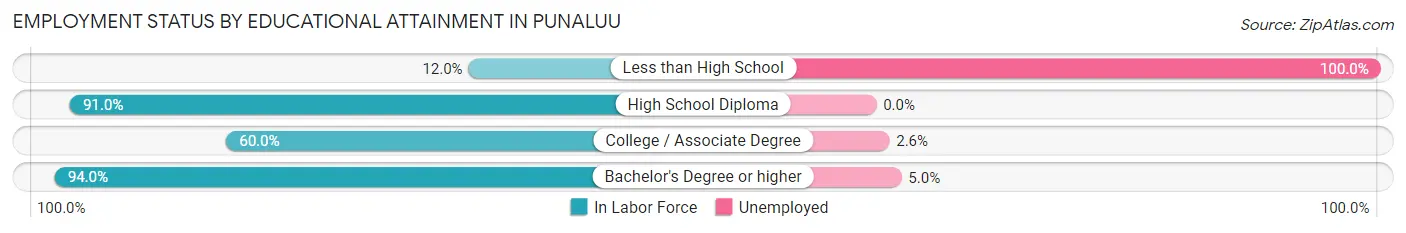
| Educational Attainment | In Labor Force | Unemployed |
| Less than High School | 3 (12.0%) | 25 (100.0%) |
| High School Diploma | 151 (91.0%) | 0 (0.0%) |
| College / Associate Degree | 117 (60.0%) | 5 (2.6%) |
| Bachelor's Degree or higher | 140 (94.0%) | 7 (5.0%) |
| Total | 411 (76.8%) | 17 (3.2%) |
Employment Occupations by Sex in Punaluu
Management, Business, Science and Arts Occupations
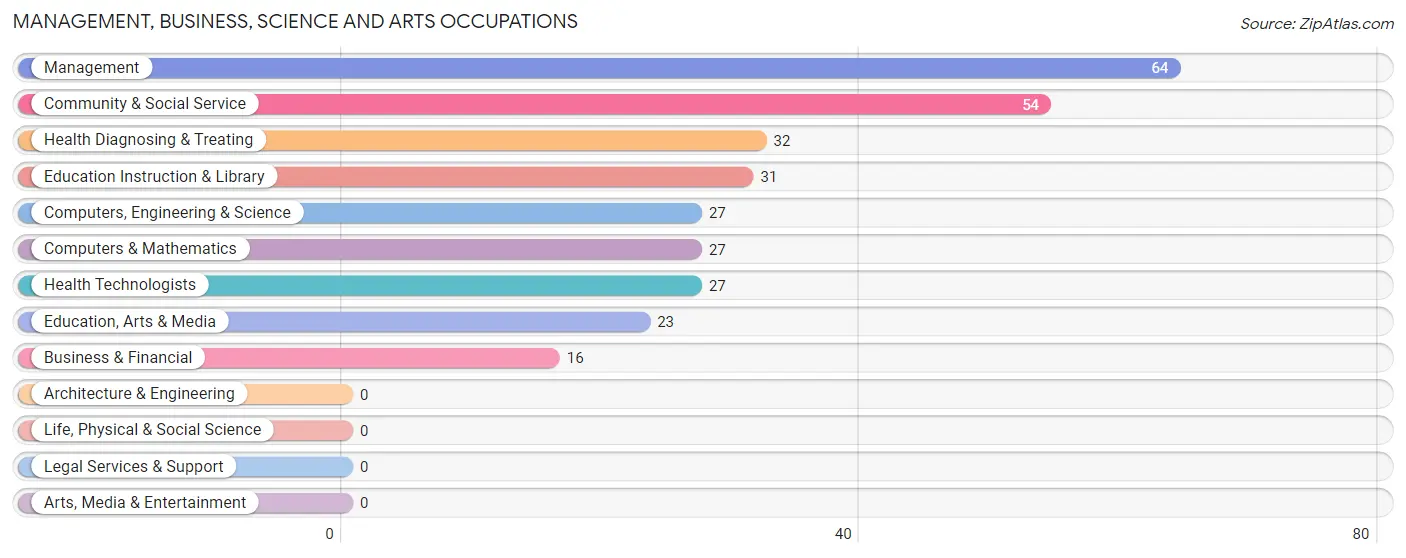
The most common Management, Business, Science and Arts occupations in Punaluu are Management (64 | 14.6%), Community & Social Service (54 | 12.3%), Health Diagnosing & Treating (32 | 7.3%), Education Instruction & Library (31 | 7.1%), and Computers, Engineering & Science (27 | 6.2%).
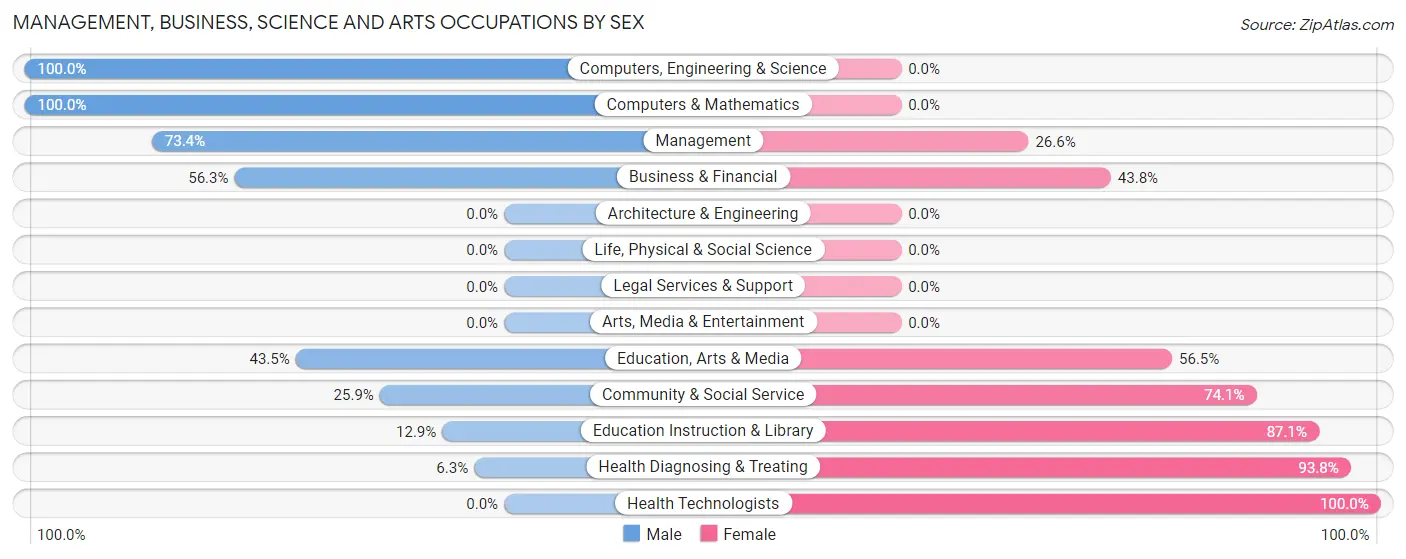
Management, Business, Science and Arts Occupations by Sex
Within the Management, Business, Science and Arts occupations in Punaluu, the most male-oriented occupations are Computers, Engineering & Science (100.0%), Computers & Mathematics (100.0%), and Management (73.4%), while the most female-oriented occupations are Health Technologists (100.0%), Health Diagnosing & Treating (93.8%), and Education Instruction & Library (87.1%).
| Occupation | Male | Female |
| Management | 47 (73.4%) | 17 (26.6%) |
| Business & Financial | 9 (56.2%) | 7 (43.8%) |
| Computers, Engineering & Science | 27 (100.0%) | 0 (0.0%) |
| Computers & Mathematics | 27 (100.0%) | 0 (0.0%) |
| Architecture & Engineering | 0 (0.0%) | 0 (0.0%) |
| Life, Physical & Social Science | 0 (0.0%) | 0 (0.0%) |
| Community & Social Service | 14 (25.9%) | 40 (74.1%) |
| Education, Arts & Media | 10 (43.5%) | 13 (56.5%) |
| Legal Services & Support | 0 (0.0%) | 0 (0.0%) |
| Education Instruction & Library | 4 (12.9%) | 27 (87.1%) |
| Arts, Media & Entertainment | 0 (0.0%) | 0 (0.0%) |
| Health Diagnosing & Treating | 2 (6.2%) | 30 (93.8%) |
| Health Technologists | 0 (0.0%) | 27 (100.0%) |
| Total (Category) | 99 (51.3%) | 94 (48.7%) |
| Total (Overall) | 274 (62.6%) | 164 (37.4%) |
Services Occupations
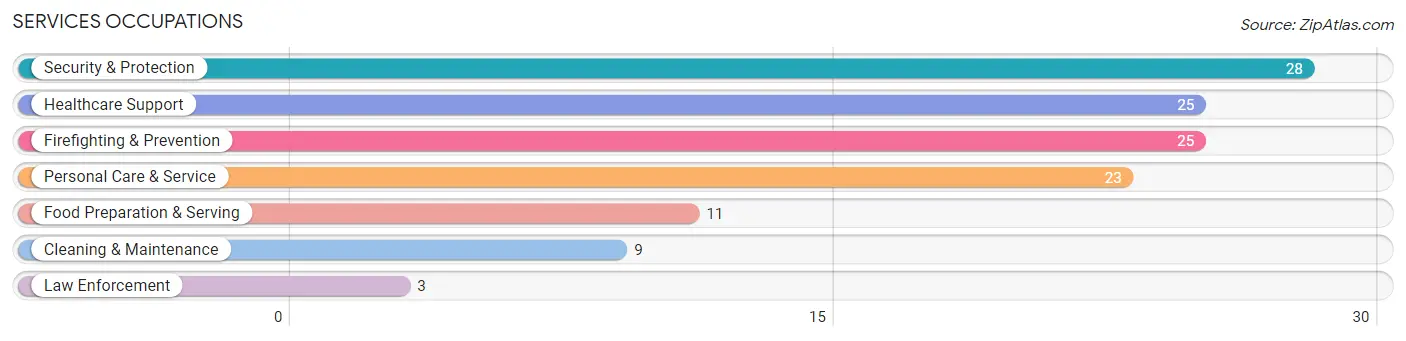
The most common Services occupations in Punaluu are Security & Protection (28 | 6.4%), Healthcare Support (25 | 5.7%), Firefighting & Prevention (25 | 5.7%), Personal Care & Service (23 | 5.2%), and Food Preparation & Serving (11 | 2.5%).
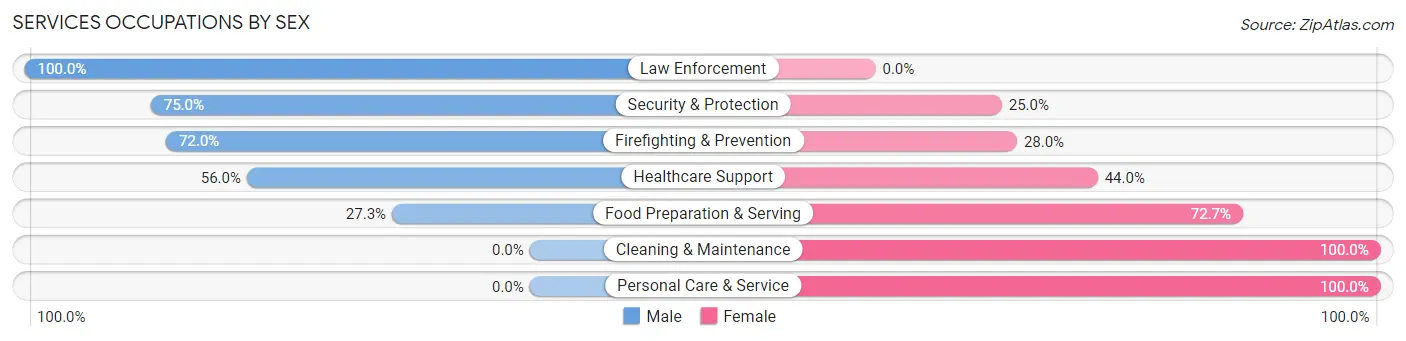
Services Occupations by Sex
Within the Services occupations in Punaluu, the most male-oriented occupations are Law Enforcement (100.0%), Security & Protection (75.0%), and Firefighting & Prevention (72.0%), while the most female-oriented occupations are Cleaning & Maintenance (100.0%), Personal Care & Service (100.0%), and Food Preparation & Serving (72.7%).
| Occupation | Male | Female |
| Healthcare Support | 14 (56.0%) | 11 (44.0%) |
| Security & Protection | 21 (75.0%) | 7 (25.0%) |
| Firefighting & Prevention | 18 (72.0%) | 7 (28.0%) |
| Law Enforcement | 3 (100.0%) | 0 (0.0%) |
| Food Preparation & Serving | 3 (27.3%) | 8 (72.7%) |
| Cleaning & Maintenance | 0 (0.0%) | 9 (100.0%) |
| Personal Care & Service | 0 (0.0%) | 23 (100.0%) |
| Total (Category) | 38 (39.6%) | 58 (60.4%) |
| Total (Overall) | 274 (62.6%) | 164 (37.4%) |
Sales and Office Occupations
The most common Sales and Office occupations in Punaluu are , and Sales & Related (18 | 4.1%).
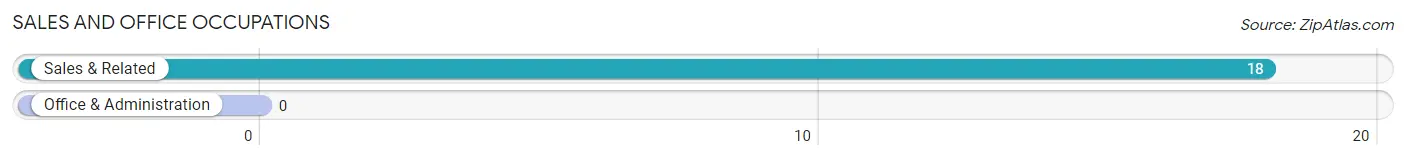
Sales and Office Occupations by Sex

| Occupation | Male | Female |
| Sales & Related | 11 (61.1%) | 7 (38.9%) |
| Office & Administration | 0 (0.0%) | 0 (0.0%) |
| Total (Category) | 11 (61.1%) | 7 (38.9%) |
| Total (Overall) | 274 (62.6%) | 164 (37.4%) |
Natural Resources, Construction and Maintenance Occupations
The most common Natural Resources, Construction and Maintenance occupations in Punaluu are Installation, Maintenance & Repair (38 | 8.7%), and Construction & Extraction (27 | 6.2%).
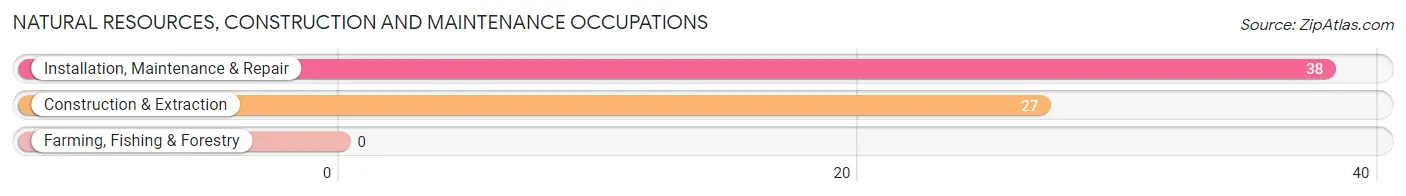
Natural Resources, Construction and Maintenance Occupations by Sex
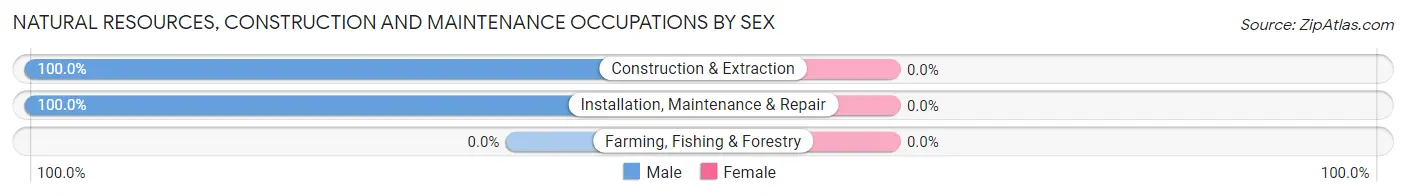
| Occupation | Male | Female |
| Farming, Fishing & Forestry | 0 (0.0%) | 0 (0.0%) |
| Construction & Extraction | 27 (100.0%) | 0 (0.0%) |
| Installation, Maintenance & Repair | 38 (100.0%) | 0 (0.0%) |
| Total (Category) | 65 (100.0%) | 0 (0.0%) |
| Total (Overall) | 274 (62.6%) | 164 (37.4%) |
Production, Transportation and Moving Occupations
The most common Production, Transportation and Moving occupations in Punaluu are Production (47 | 10.7%), and Transportation (19 | 4.3%).
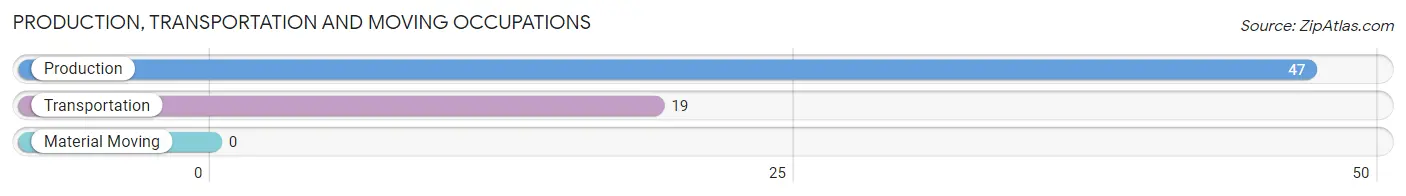
Production, Transportation and Moving Occupations by Sex
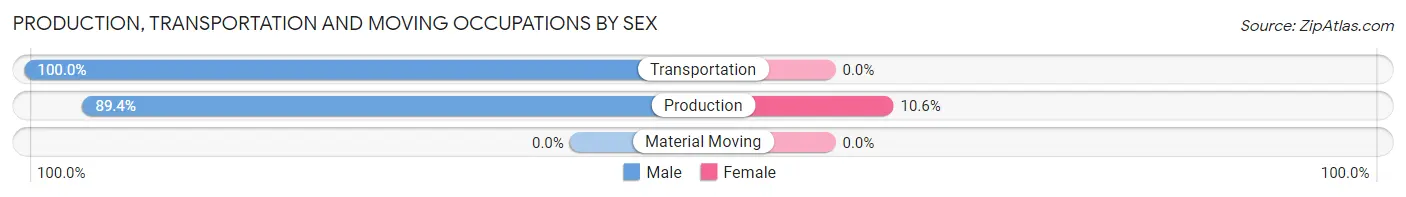
| Occupation | Male | Female |
| Production | 42 (89.4%) | 5 (10.6%) |
| Transportation | 19 (100.0%) | 0 (0.0%) |
| Material Moving | 0 (0.0%) | 0 (0.0%) |
| Total (Category) | 61 (92.4%) | 5 (7.6%) |
| Total (Overall) | 274 (62.6%) | 164 (37.4%) |
Employment Industries by Sex in Punaluu
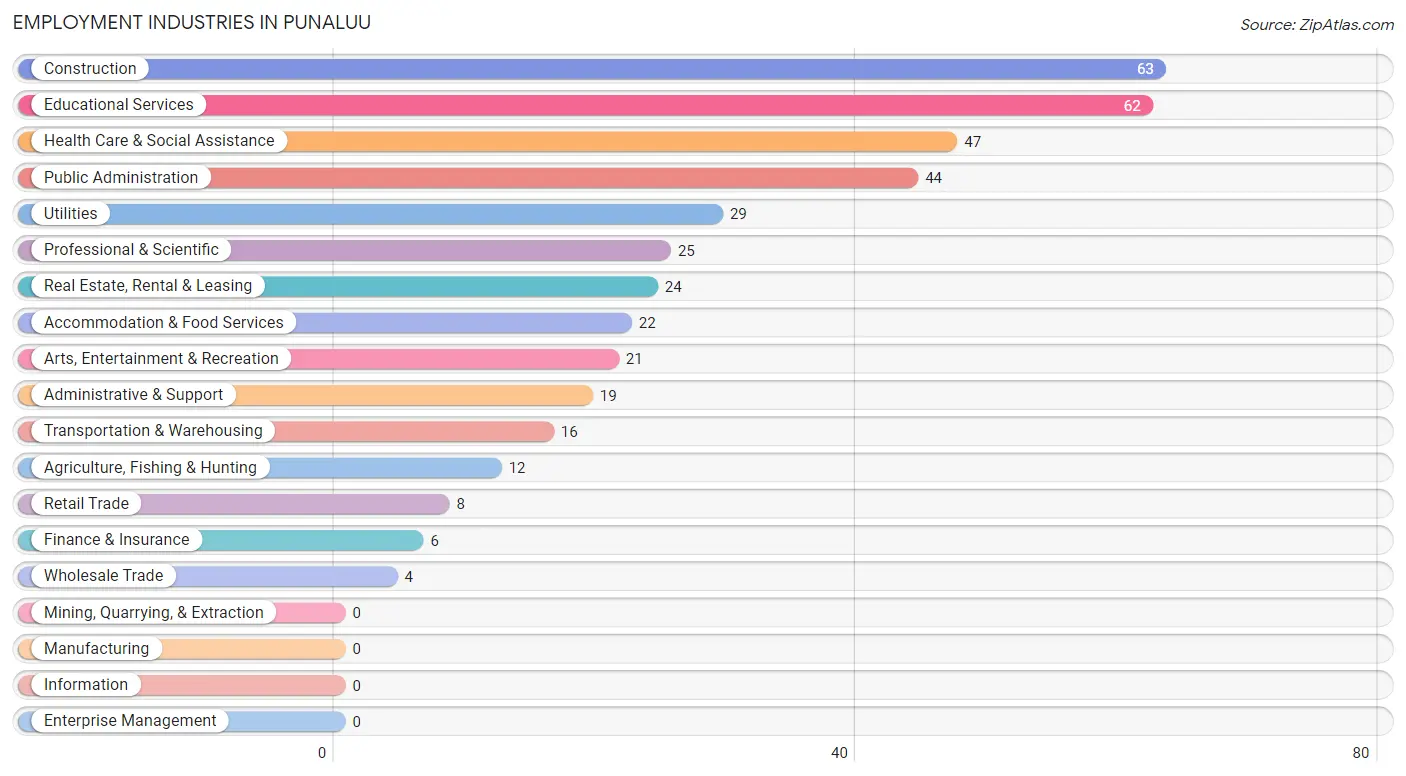
Employment Industries in Punaluu
The major employment industries in Punaluu include Construction (63 | 14.4%), Educational Services (62 | 14.2%), Health Care & Social Assistance (47 | 10.7%), Public Administration (44 | 10.1%), and Utilities (29 | 6.6%).
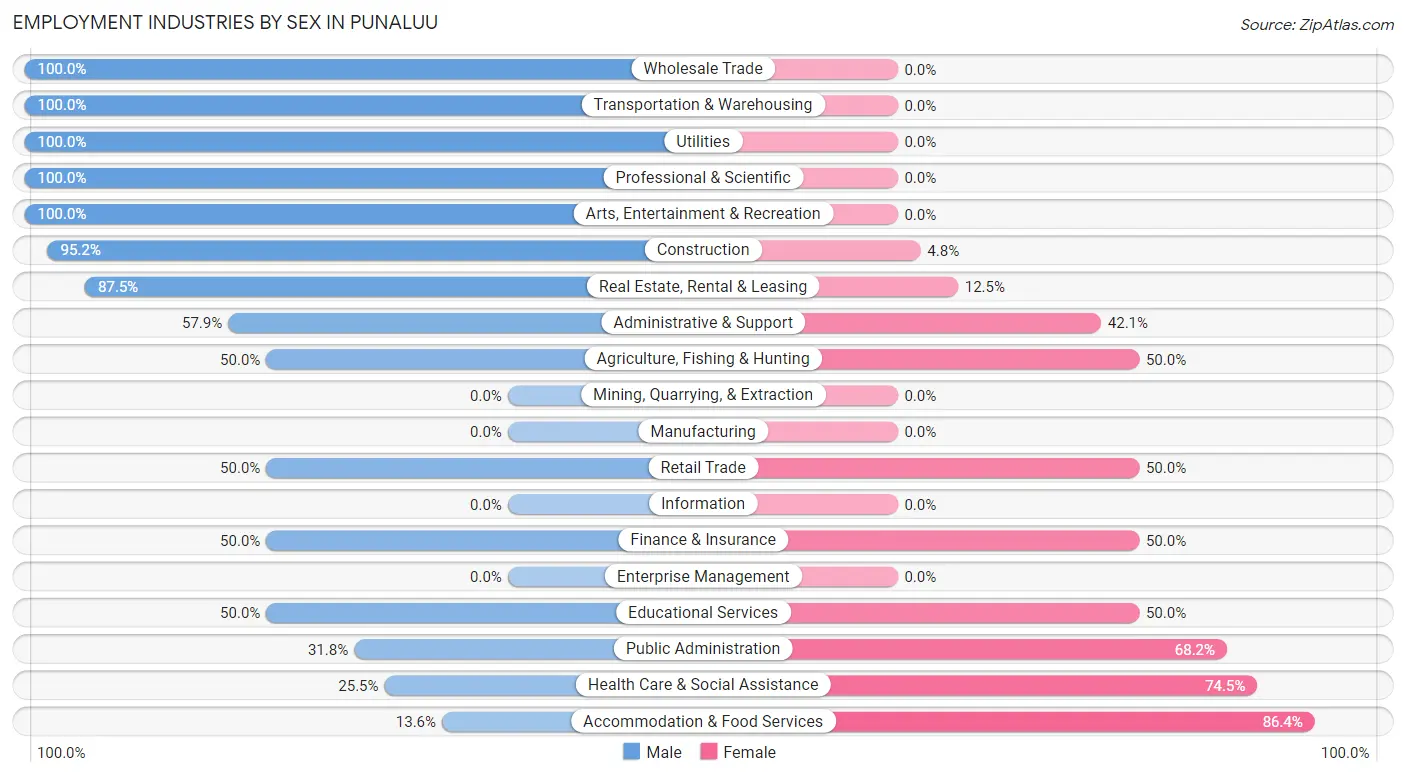
Employment Industries by Sex in Punaluu
The Punaluu industries that see more men than women are Wholesale Trade (100.0%), Transportation & Warehousing (100.0%), and Utilities (100.0%), whereas the industries that tend to have a higher number of women are Accommodation & Food Services (86.4%), Health Care & Social Assistance (74.5%), and Public Administration (68.2%).
| Industry | Male | Female |
| Agriculture, Fishing & Hunting | 6 (50.0%) | 6 (50.0%) |
| Mining, Quarrying, & Extraction | 0 (0.0%) | 0 (0.0%) |
| Construction | 60 (95.2%) | 3 (4.8%) |
| Manufacturing | 0 (0.0%) | 0 (0.0%) |
| Wholesale Trade | 4 (100.0%) | 0 (0.0%) |
| Retail Trade | 4 (50.0%) | 4 (50.0%) |
| Transportation & Warehousing | 16 (100.0%) | 0 (0.0%) |
| Utilities | 29 (100.0%) | 0 (0.0%) |
| Information | 0 (0.0%) | 0 (0.0%) |
| Finance & Insurance | 3 (50.0%) | 3 (50.0%) |
| Real Estate, Rental & Leasing | 21 (87.5%) | 3 (12.5%) |
| Professional & Scientific | 25 (100.0%) | 0 (0.0%) |
| Enterprise Management | 0 (0.0%) | 0 (0.0%) |
| Administrative & Support | 11 (57.9%) | 8 (42.1%) |
| Educational Services | 31 (50.0%) | 31 (50.0%) |
| Health Care & Social Assistance | 12 (25.5%) | 35 (74.5%) |
| Arts, Entertainment & Recreation | 21 (100.0%) | 0 (0.0%) |
| Accommodation & Food Services | 3 (13.6%) | 19 (86.4%) |
| Public Administration | 14 (31.8%) | 30 (68.2%) |
| Total | 274 (62.6%) | 164 (37.4%) |
Education in Punaluu
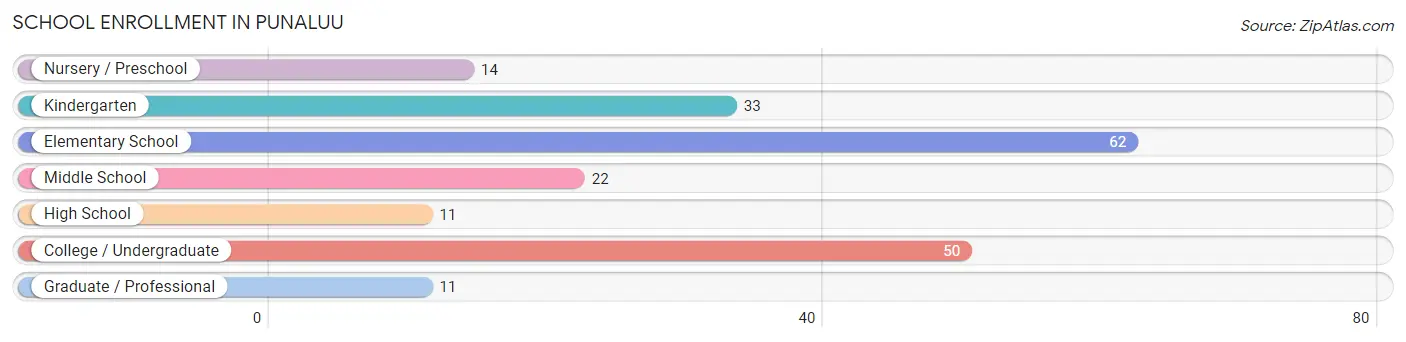
School Enrollment in Punaluu
The most common levels of schooling among the 203 students in Punaluu are elementary school (62 | 30.5%), college / undergraduate (50 | 24.6%), and kindergarten (33 | 16.3%).
| School Level | # Students | % Students |
| Nursery / Preschool | 14 | 6.9% |
| Kindergarten | 33 | 16.3% |
| Elementary School | 62 | 30.5% |
| Middle School | 22 | 10.8% |
| High School | 11 | 5.4% |
| College / Undergraduate | 50 | 24.6% |
| Graduate / Professional | 11 | 5.4% |
| Total | 203 | 100.0% |
School Enrollment by Age by Funding Source in Punaluu
Out of a total of 203 students who are enrolled in schools in Punaluu, 42 (20.7%) attend a private institution, while the remaining 161 (79.3%) are enrolled in public schools. The age group of 3 to 4 year olds has the highest likelihood of being enrolled in private schools, with 14 (70.0% in the age bracket) enrolled. Conversely, the age group of 15 to 17 year olds has the lowest likelihood of being enrolled in a private school, with 7 (100.0% in the age bracket) attending a public institution.
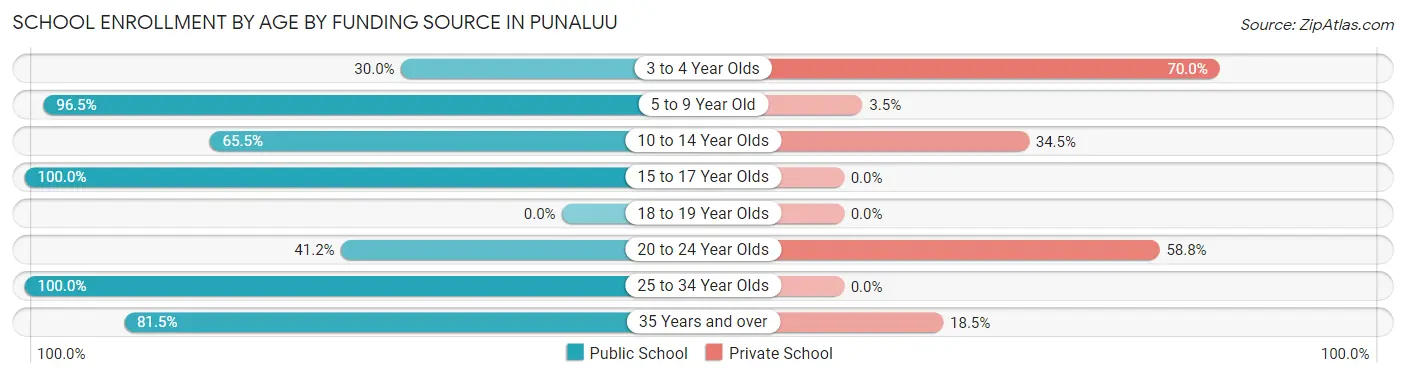
| Age Bracket | Public School | Private School |
| 3 to 4 Year Olds | 6 (30.0%) | 14 (70.0%) |
| 5 to 9 Year Old | 83 (96.5%) | 3 (3.5%) |
| 10 to 14 Year Olds | 19 (65.5%) | 10 (34.5%) |
| 15 to 17 Year Olds | 7 (100.0%) | 0 (0.0%) |
| 18 to 19 Year Olds | 0 (0.0%) | 0 (0.0%) |
| 20 to 24 Year Olds | 7 (41.2%) | 10 (58.8%) |
| 25 to 34 Year Olds | 17 (100.0%) | 0 (0.0%) |
| 35 Years and over | 22 (81.5%) | 5 (18.5%) |
| Total | 161 (79.3%) | 42 (20.7%) |
Educational Attainment by Field of Study in Punaluu
Arts & humanities (37 | 19.5%), business (29 | 15.3%), literature & languages (21 | 11.1%), science & technology (20 | 10.5%), and psychology (14 | 7.4%) are the most common fields of study among 190 individuals in Punaluu who have obtained a bachelor's degree or higher.
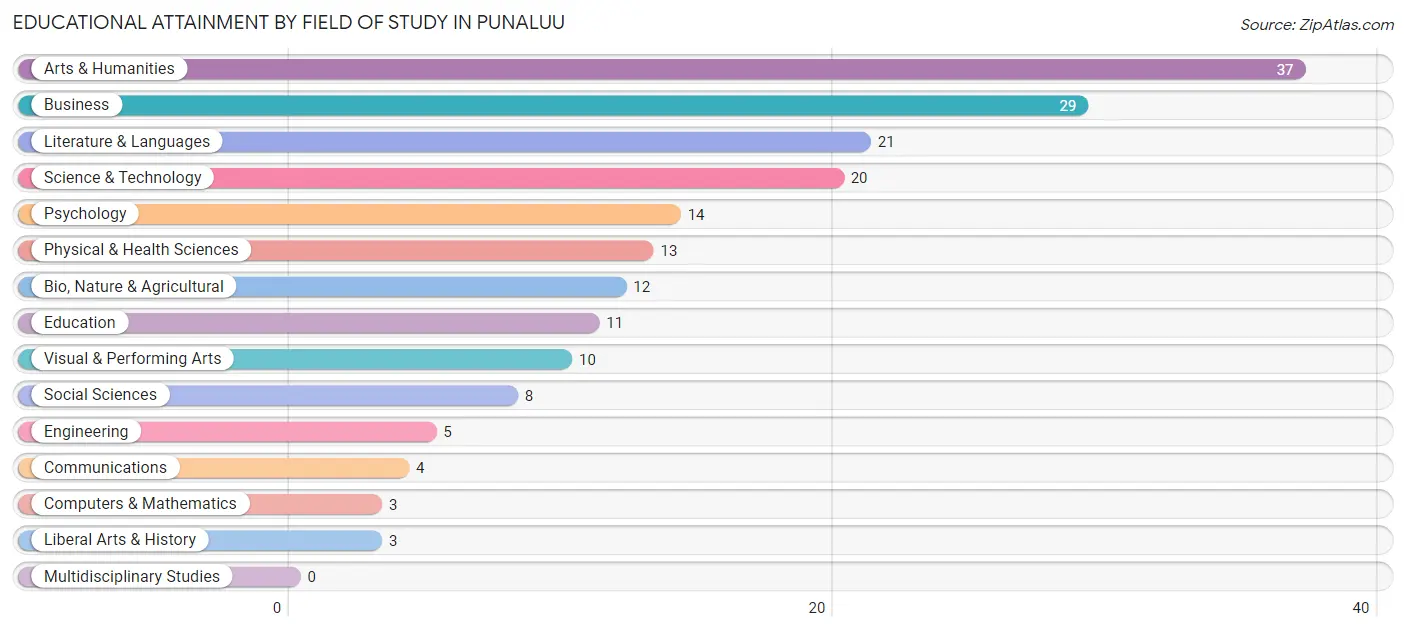
| Field of Study | # Graduates | % Graduates |
| Computers & Mathematics | 3 | 1.6% |
| Bio, Nature & Agricultural | 12 | 6.3% |
| Physical & Health Sciences | 13 | 6.8% |
| Psychology | 14 | 7.4% |
| Social Sciences | 8 | 4.2% |
| Engineering | 5 | 2.6% |
| Multidisciplinary Studies | 0 | 0.0% |
| Science & Technology | 20 | 10.5% |
| Business | 29 | 15.3% |
| Education | 11 | 5.8% |
| Literature & Languages | 21 | 11.1% |
| Liberal Arts & History | 3 | 1.6% |
| Visual & Performing Arts | 10 | 5.3% |
| Communications | 4 | 2.1% |
| Arts & Humanities | 37 | 19.5% |
| Total | 190 | 100.0% |
Transportation & Commute in Punaluu
Vehicle Availability by Sex in Punaluu
The most prevalent vehicle ownership categories in Punaluu are males with 2 vehicles (113, accounting for 41.7%) and females with 2 vehicles (66, making up 68.1%).
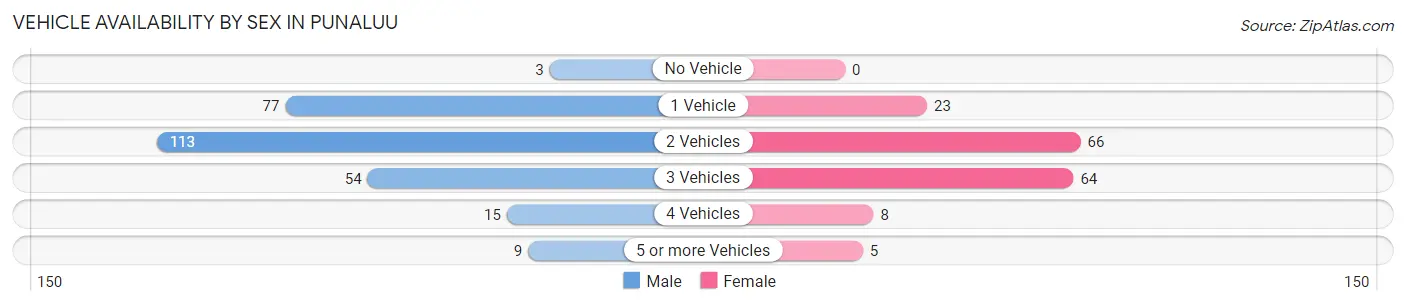
| Vehicles Available | Male | Female |
| No Vehicle | 3 (1.1%) | 0 (0.0%) |
| 1 Vehicle | 77 (28.4%) | 23 (13.9%) |
| 2 Vehicles | 113 (41.7%) | 66 (39.8%) |
| 3 Vehicles | 54 (19.9%) | 64 (38.6%) |
| 4 Vehicles | 15 (5.5%) | 8 (4.8%) |
| 5 or more Vehicles | 9 (3.3%) | 5 (3.0%) |
| Total | 271 (100.0%) | 166 (100.0%) |
Commute Time in Punaluu
The most frequently occuring commute durations in Punaluu are 60 to 89 minutes (104 commuters, 28.0%), 45 to 59 minutes (50 commuters, 13.4%), and 10 to 14 minutes (40 commuters, 10.7%).
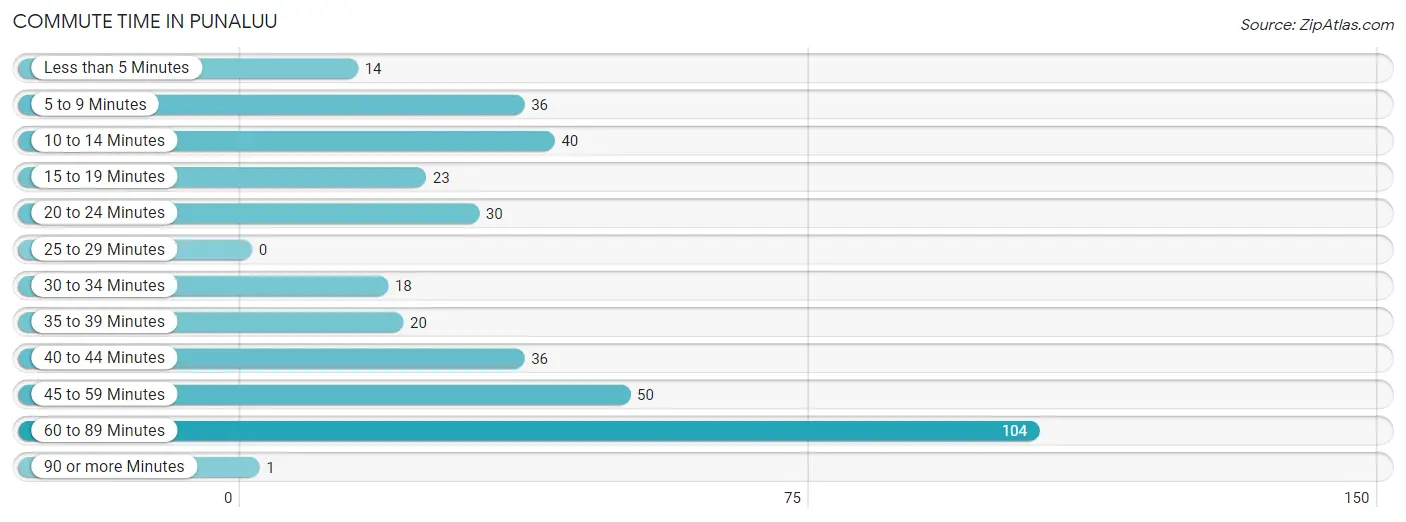
| Commute Time | # Commuters | % Commuters |
| Less than 5 Minutes | 14 | 3.8% |
| 5 to 9 Minutes | 36 | 9.7% |
| 10 to 14 Minutes | 40 | 10.7% |
| 15 to 19 Minutes | 23 | 6.2% |
| 20 to 24 Minutes | 30 | 8.1% |
| 25 to 29 Minutes | 0 | 0.0% |
| 30 to 34 Minutes | 18 | 4.8% |
| 35 to 39 Minutes | 20 | 5.4% |
| 40 to 44 Minutes | 36 | 9.7% |
| 45 to 59 Minutes | 50 | 13.4% |
| 60 to 89 Minutes | 104 | 28.0% |
| 90 or more Minutes | 1 | 0.3% |
Commute Time by Sex in Punaluu
The most common commute times in Punaluu are 60 to 89 minutes (63 commuters, 28.5%) for males and 60 to 89 minutes (41 commuters, 27.2%) for females.
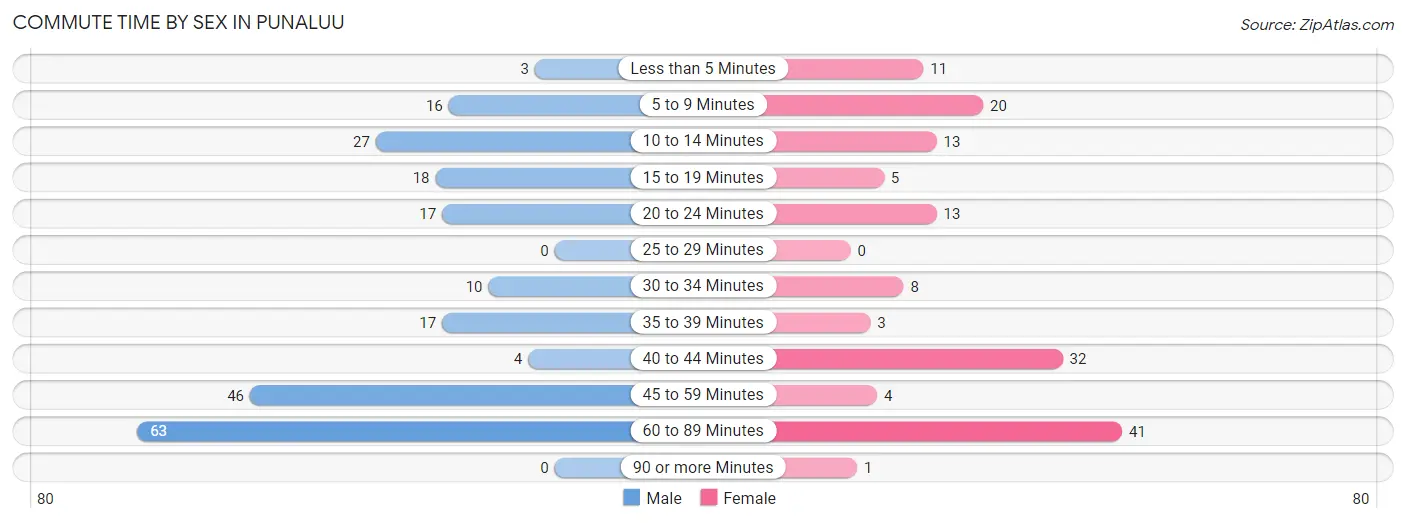
| Commute Time | Male | Female |
| Less than 5 Minutes | 3 (1.4%) | 11 (7.3%) |
| 5 to 9 Minutes | 16 (7.2%) | 20 (13.3%) |
| 10 to 14 Minutes | 27 (12.2%) | 13 (8.6%) |
| 15 to 19 Minutes | 18 (8.1%) | 5 (3.3%) |
| 20 to 24 Minutes | 17 (7.7%) | 13 (8.6%) |
| 25 to 29 Minutes | 0 (0.0%) | 0 (0.0%) |
| 30 to 34 Minutes | 10 (4.5%) | 8 (5.3%) |
| 35 to 39 Minutes | 17 (7.7%) | 3 (2.0%) |
| 40 to 44 Minutes | 4 (1.8%) | 32 (21.2%) |
| 45 to 59 Minutes | 46 (20.8%) | 4 (2.6%) |
| 60 to 89 Minutes | 63 (28.5%) | 41 (27.2%) |
| 90 or more Minutes | 0 (0.0%) | 1 (0.7%) |
Time of Departure to Work by Sex in Punaluu
The most frequent times of departure to work in Punaluu are 6:00 AM to 6:29 AM (102, 46.2%) for males and 5:00 AM to 5:29 AM (39, 25.8%) for females.
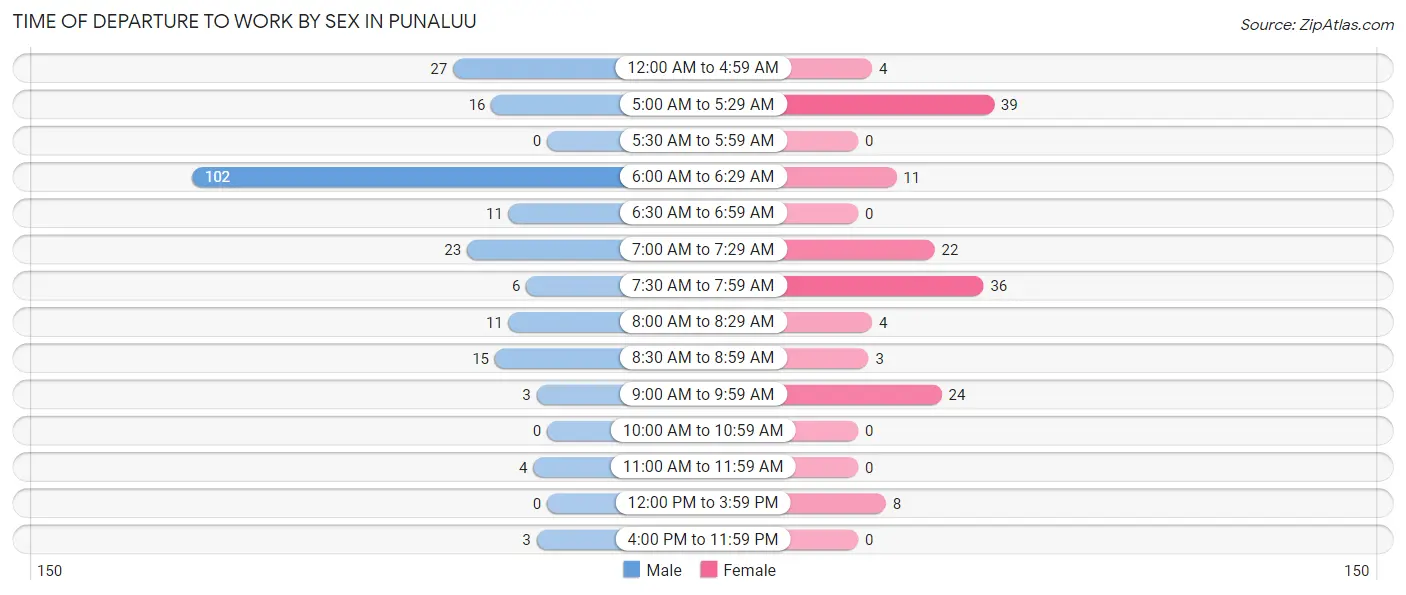
| Time of Departure | Male | Female |
| 12:00 AM to 4:59 AM | 27 (12.2%) | 4 (2.6%) |
| 5:00 AM to 5:29 AM | 16 (7.2%) | 39 (25.8%) |
| 5:30 AM to 5:59 AM | 0 (0.0%) | 0 (0.0%) |
| 6:00 AM to 6:29 AM | 102 (46.2%) | 11 (7.3%) |
| 6:30 AM to 6:59 AM | 11 (5.0%) | 0 (0.0%) |
| 7:00 AM to 7:29 AM | 23 (10.4%) | 22 (14.6%) |
| 7:30 AM to 7:59 AM | 6 (2.7%) | 36 (23.8%) |
| 8:00 AM to 8:29 AM | 11 (5.0%) | 4 (2.6%) |
| 8:30 AM to 8:59 AM | 15 (6.8%) | 3 (2.0%) |
| 9:00 AM to 9:59 AM | 3 (1.4%) | 24 (15.9%) |
| 10:00 AM to 10:59 AM | 0 (0.0%) | 0 (0.0%) |
| 11:00 AM to 11:59 AM | 4 (1.8%) | 0 (0.0%) |
| 12:00 PM to 3:59 PM | 0 (0.0%) | 8 (5.3%) |
| 4:00 PM to 11:59 PM | 3 (1.4%) | 0 (0.0%) |
| Total | 221 (100.0%) | 151 (100.0%) |
Housing Occupancy in Punaluu
Occupancy by Ownership in Punaluu
Of the total 338 dwellings in Punaluu, owner-occupied units account for 133 (39.4%), while renter-occupied units make up 205 (60.7%).
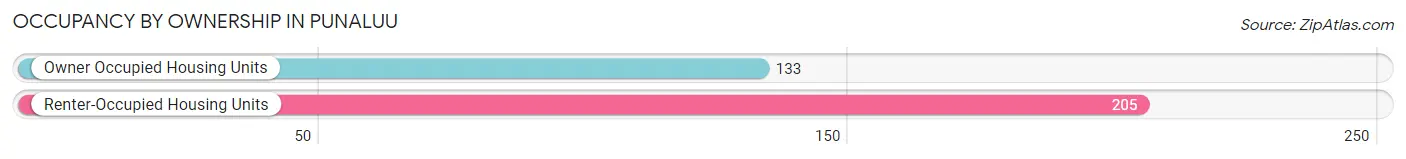
| Occupancy | # Housing Units | % Housing Units |
| Owner Occupied Housing Units | 133 | 39.4% |
| Renter-Occupied Housing Units | 205 | 60.7% |
| Total Occupied Housing Units | 338 | 100.0% |
Occupancy by Household Size in Punaluu
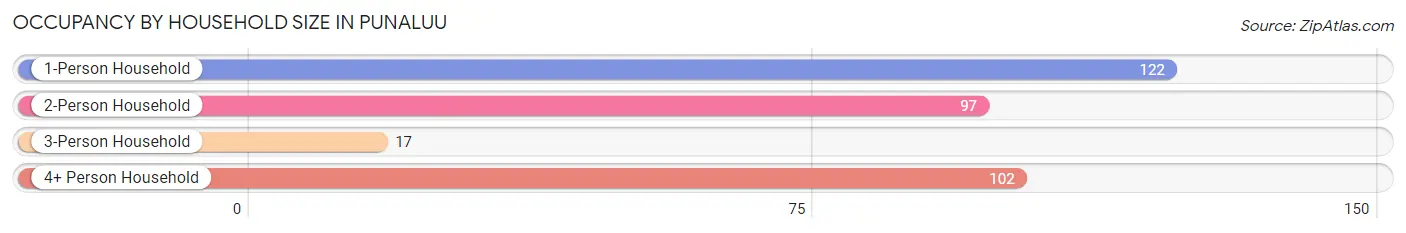
| Household Size | # Housing Units | % Housing Units |
| 1-Person Household | 122 | 36.1% |
| 2-Person Household | 97 | 28.7% |
| 3-Person Household | 17 | 5.0% |
| 4+ Person Household | 102 | 30.2% |
| Total Housing Units | 338 | 100.0% |
Occupancy by Ownership by Household Size in Punaluu
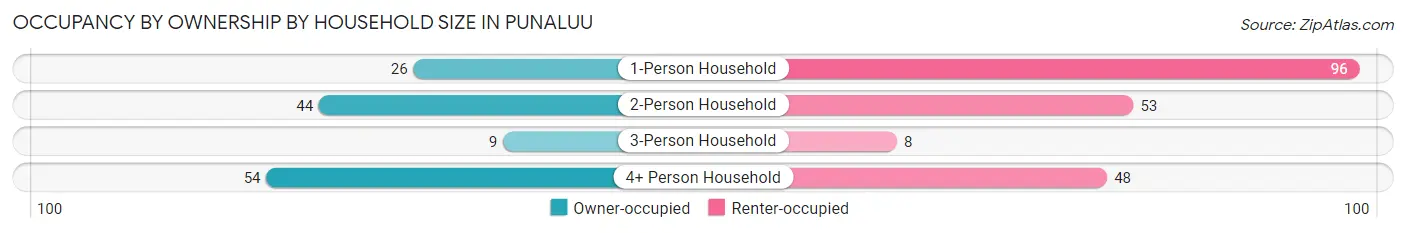
| Household Size | Owner-occupied | Renter-occupied |
| 1-Person Household | 26 (21.3%) | 96 (78.7%) |
| 2-Person Household | 44 (45.4%) | 53 (54.6%) |
| 3-Person Household | 9 (52.9%) | 8 (47.1%) |
| 4+ Person Household | 54 (52.9%) | 48 (47.1%) |
| Total Housing Units | 133 (39.4%) | 205 (60.7%) |
Occupancy by Educational Attainment in Punaluu
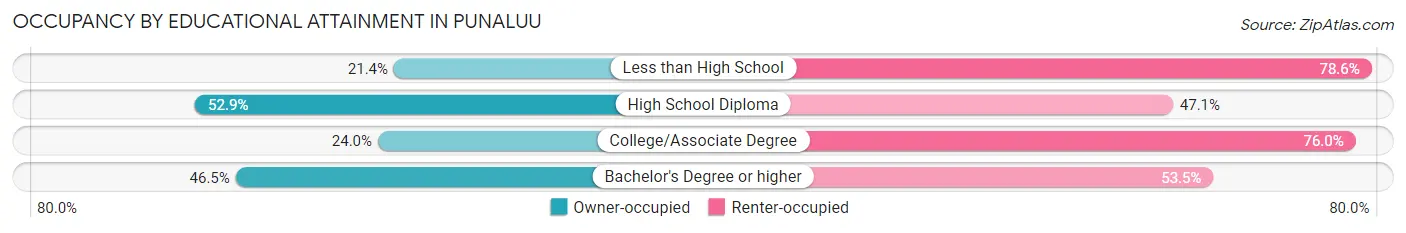
| Household Size | Owner-occupied | Renter-occupied |
| Less than High School | 3 (21.4%) | 11 (78.6%) |
| High School Diploma | 54 (52.9%) | 48 (47.1%) |
| College/Associate Degree | 29 (24.0%) | 92 (76.0%) |
| Bachelor's Degree or higher | 47 (46.5%) | 54 (53.5%) |
Occupancy by Age of Householder in Punaluu
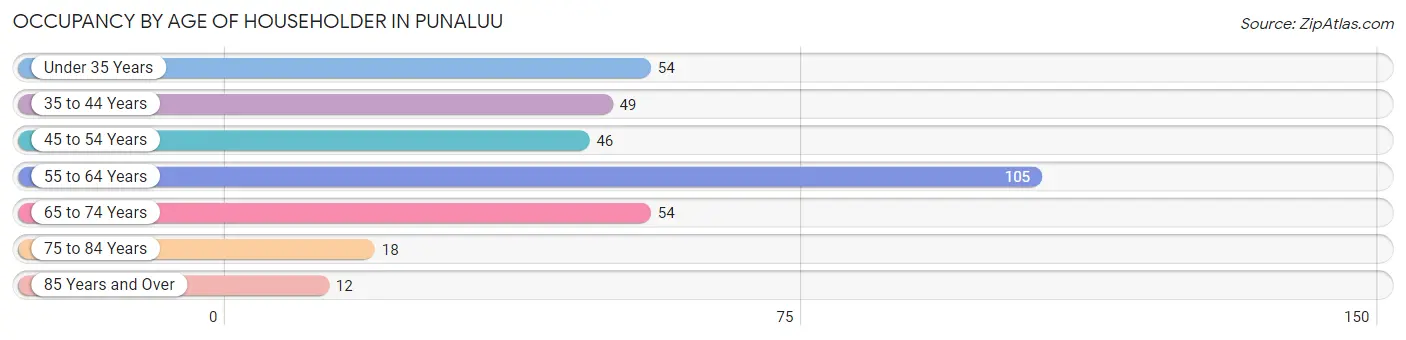
| Age Bracket | # Households | % Households |
| Under 35 Years | 54 | 16.0% |
| 35 to 44 Years | 49 | 14.5% |
| 45 to 54 Years | 46 | 13.6% |
| 55 to 64 Years | 105 | 31.1% |
| 65 to 74 Years | 54 | 16.0% |
| 75 to 84 Years | 18 | 5.3% |
| 85 Years and Over | 12 | 3.5% |
| Total | 338 | 100.0% |
Housing Finances in Punaluu
Median Income by Occupancy in Punaluu
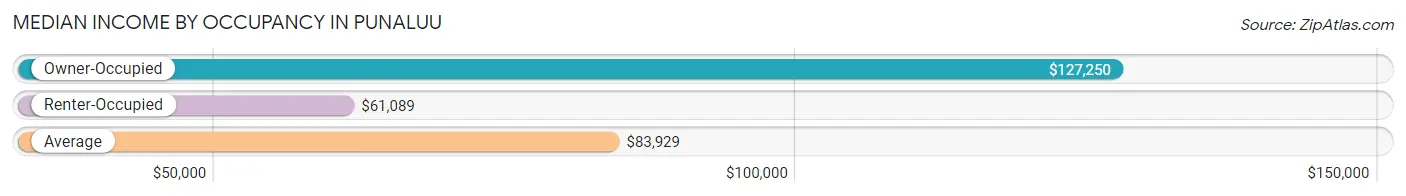
| Occupancy Type | # Households | Median Income |
| Owner-Occupied | 133 (39.4%) | $127,250 |
| Renter-Occupied | 205 (60.7%) | $61,089 |
| Average | 338 (100.0%) | $83,929 |
Occupancy by Householder Income Bracket in Punaluu
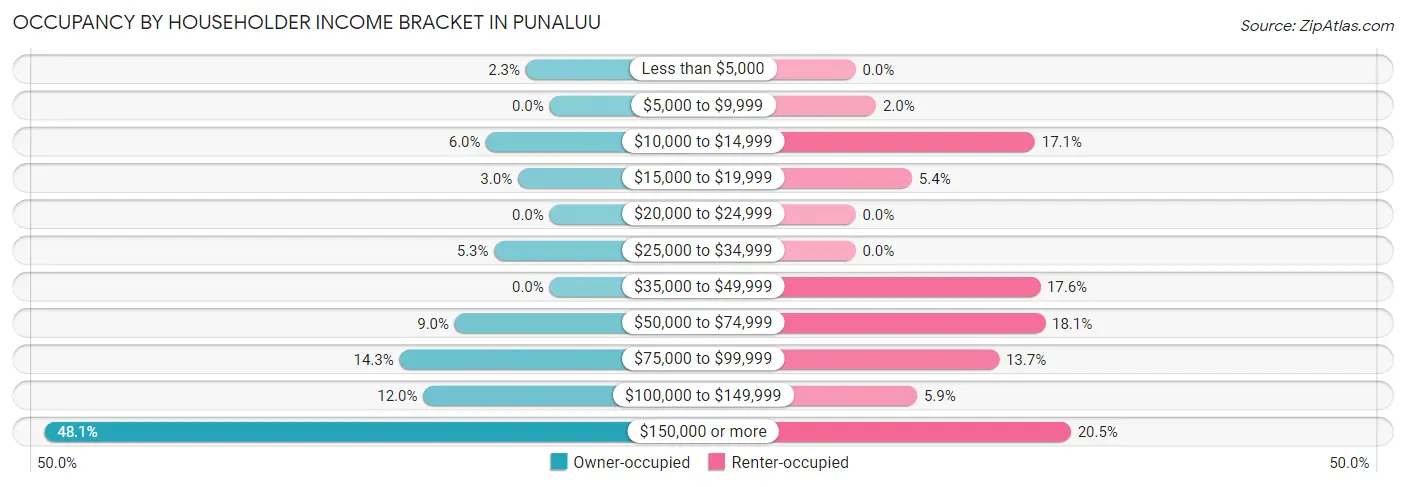
| Income Bracket | Owner-occupied | Renter-occupied |
| Less than $5,000 | 3 (2.3%) | 0 (0.0%) |
| $5,000 to $9,999 | 0 (0.0%) | 4 (1.9%) |
| $10,000 to $14,999 | 8 (6.0%) | 35 (17.1%) |
| $15,000 to $19,999 | 4 (3.0%) | 11 (5.4%) |
| $20,000 to $24,999 | 0 (0.0%) | 0 (0.0%) |
| $25,000 to $34,999 | 7 (5.3%) | 0 (0.0%) |
| $35,000 to $49,999 | 0 (0.0%) | 36 (17.6%) |
| $50,000 to $74,999 | 12 (9.0%) | 37 (18.0%) |
| $75,000 to $99,999 | 19 (14.3%) | 28 (13.7%) |
| $100,000 to $149,999 | 16 (12.0%) | 12 (5.9%) |
| $150,000 or more | 64 (48.1%) | 42 (20.5%) |
| Total | 133 (100.0%) | 205 (100.0%) |
Monthly Housing Cost Tiers in Punaluu

| Monthly Cost | Owner-occupied | Renter-occupied |
| Less than $300 | 0 (0.0%) | 4 (1.9%) |
| $300 to $499 | 5 (3.8%) | 0 (0.0%) |
| $500 to $799 | 17 (12.8%) | 3 (1.5%) |
| $800 to $999 | 7 (5.3%) | 3 (1.5%) |
| $1,000 to $1,499 | 20 (15.0%) | 40 (19.5%) |
| $1,500 to $1,999 | 11 (8.3%) | 65 (31.7%) |
| $2,000 to $2,499 | 11 (8.3%) | 56 (27.3%) |
| $2,500 to $2,999 | 7 (5.3%) | 5 (2.4%) |
| $3,000 or more | 55 (41.3%) | 26 (12.7%) |
| Total | 133 (100.0%) | 205 (100.0%) |
Physical Housing Characteristics in Punaluu
Housing Structures in Punaluu
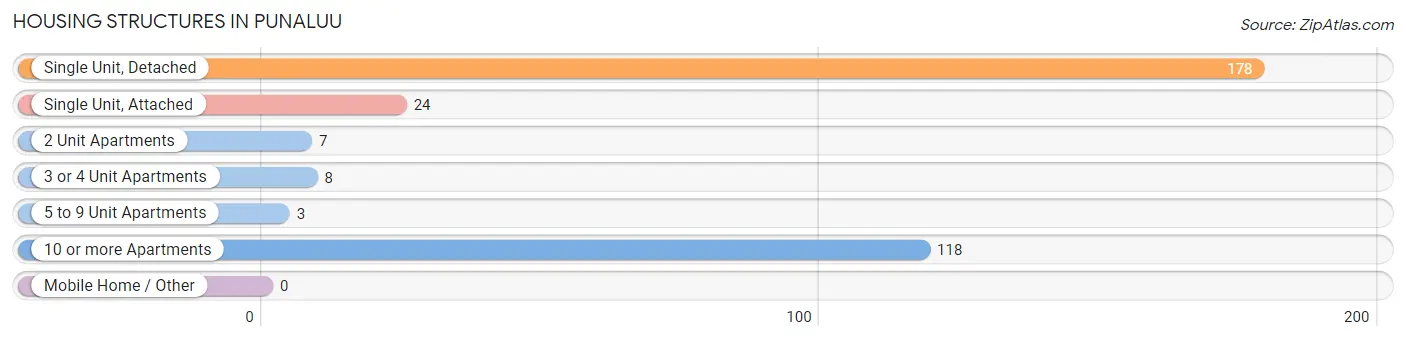
| Structure Type | # Housing Units | % Housing Units |
| Single Unit, Detached | 178 | 52.7% |
| Single Unit, Attached | 24 | 7.1% |
| 2 Unit Apartments | 7 | 2.1% |
| 3 or 4 Unit Apartments | 8 | 2.4% |
| 5 to 9 Unit Apartments | 3 | 0.9% |
| 10 or more Apartments | 118 | 34.9% |
| Mobile Home / Other | 0 | 0.0% |
| Total | 338 | 100.0% |
Housing Structures by Occupancy in Punaluu
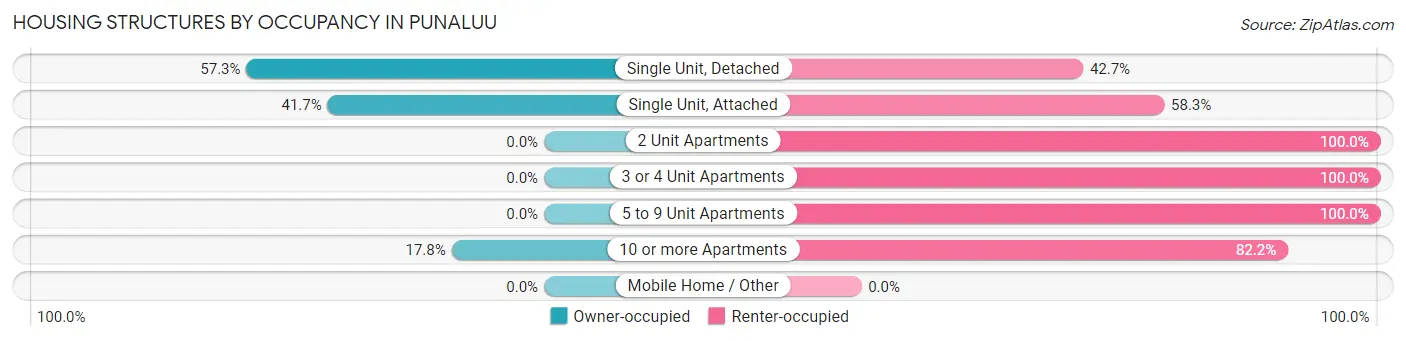
| Structure Type | Owner-occupied | Renter-occupied |
| Single Unit, Detached | 102 (57.3%) | 76 (42.7%) |
| Single Unit, Attached | 10 (41.7%) | 14 (58.3%) |
| 2 Unit Apartments | 0 (0.0%) | 7 (100.0%) |
| 3 or 4 Unit Apartments | 0 (0.0%) | 8 (100.0%) |
| 5 to 9 Unit Apartments | 0 (0.0%) | 3 (100.0%) |
| 10 or more Apartments | 21 (17.8%) | 97 (82.2%) |
| Mobile Home / Other | 0 (0.0%) | 0 (0.0%) |
| Total | 133 (39.4%) | 205 (60.7%) |
Housing Structures by Number of Rooms in Punaluu
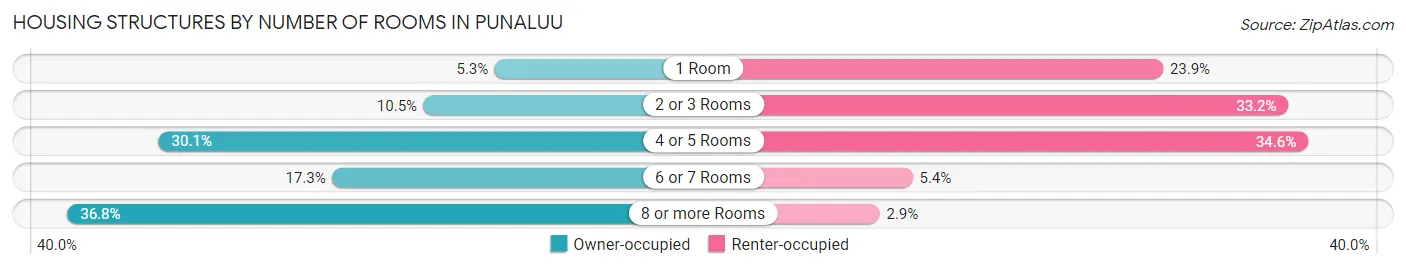
| Number of Rooms | Owner-occupied | Renter-occupied |
| 1 Room | 7 (5.3%) | 49 (23.9%) |
| 2 or 3 Rooms | 14 (10.5%) | 68 (33.2%) |
| 4 or 5 Rooms | 40 (30.1%) | 71 (34.6%) |
| 6 or 7 Rooms | 23 (17.3%) | 11 (5.4%) |
| 8 or more Rooms | 49 (36.8%) | 6 (2.9%) |
| Total | 133 (100.0%) | 205 (100.0%) |
Housing Structure by Heating Type in Punaluu
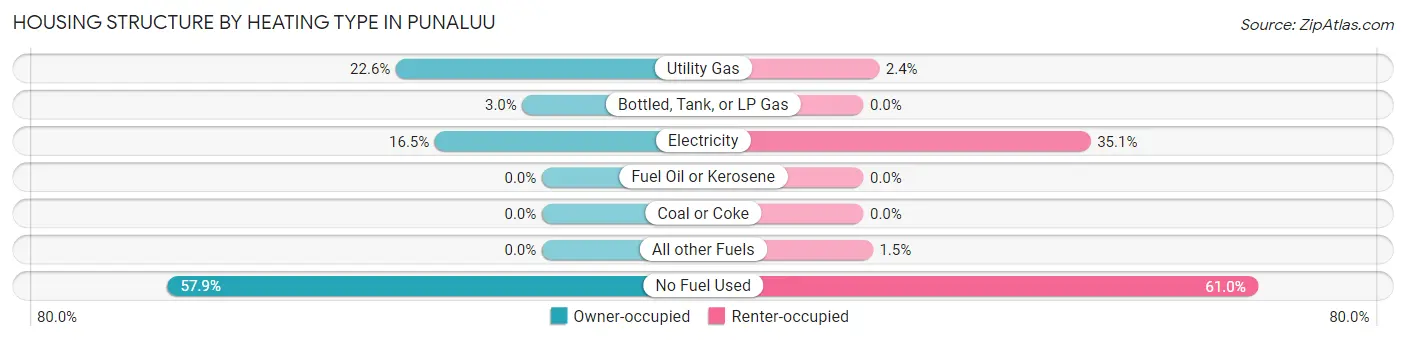
| Heating Type | Owner-occupied | Renter-occupied |
| Utility Gas | 30 (22.6%) | 5 (2.4%) |
| Bottled, Tank, or LP Gas | 4 (3.0%) | 0 (0.0%) |
| Electricity | 22 (16.5%) | 72 (35.1%) |
| Fuel Oil or Kerosene | 0 (0.0%) | 0 (0.0%) |
| Coal or Coke | 0 (0.0%) | 0 (0.0%) |
| All other Fuels | 0 (0.0%) | 3 (1.5%) |
| No Fuel Used | 77 (57.9%) | 125 (61.0%) |
| Total | 133 (100.0%) | 205 (100.0%) |
Household Vehicle Usage in Punaluu
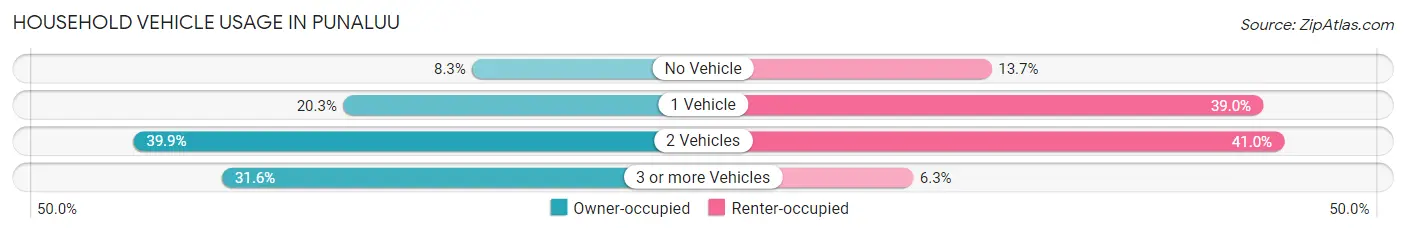
| Vehicles per Household | Owner-occupied | Renter-occupied |
| No Vehicle | 11 (8.3%) | 28 (13.7%) |
| 1 Vehicle | 27 (20.3%) | 80 (39.0%) |
| 2 Vehicles | 53 (39.9%) | 84 (41.0%) |
| 3 or more Vehicles | 42 (31.6%) | 13 (6.3%) |
| Total | 133 (100.0%) | 205 (100.0%) |
Real Estate & Mortgages in Punaluu
Real Estate and Mortgage Overview in Punaluu
| Characteristic | Without Mortgage | With Mortgage |
| Housing Units | 52 | 81 |
| Median Property Value | $678,600 | $690,600 |
| Median Household Income | $83,571 | $56 |
| Monthly Housing Costs | $925 | $55 |
| Real Estate Taxes | $2,150 | $0 |
Property Value by Mortgage Status in Punaluu
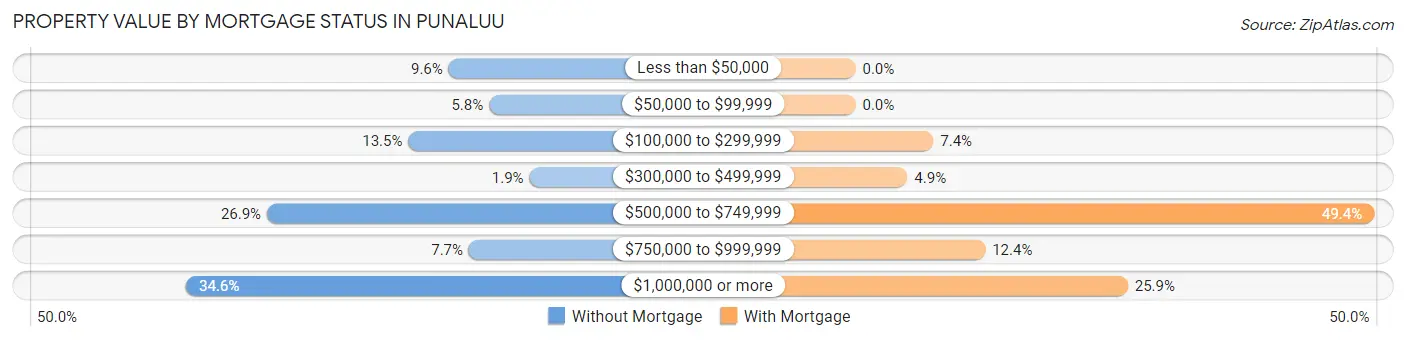
| Property Value | Without Mortgage | With Mortgage |
| Less than $50,000 | 5 (9.6%) | 0 (0.0%) |
| $50,000 to $99,999 | 3 (5.8%) | 0 (0.0%) |
| $100,000 to $299,999 | 7 (13.5%) | 6 (7.4%) |
| $300,000 to $499,999 | 1 (1.9%) | 4 (4.9%) |
| $500,000 to $749,999 | 14 (26.9%) | 40 (49.4%) |
| $750,000 to $999,999 | 4 (7.7%) | 10 (12.3%) |
| $1,000,000 or more | 18 (34.6%) | 21 (25.9%) |
| Total | 52 (100.0%) | 81 (100.0%) |
Household Income by Mortgage Status in Punaluu
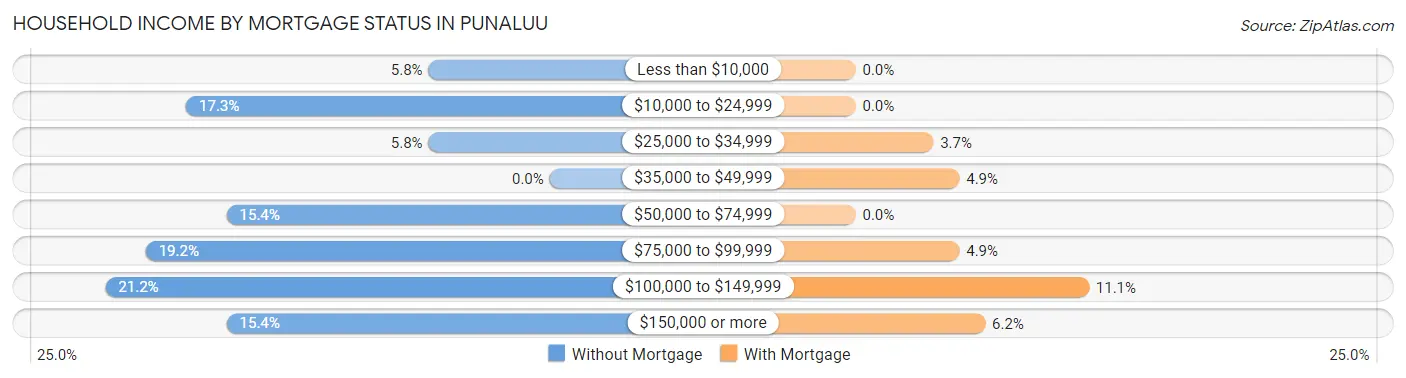
| Household Income | Without Mortgage | With Mortgage |
| Less than $10,000 | 3 (5.8%) | 0 (0.0%) |
| $10,000 to $24,999 | 9 (17.3%) | 0 (0.0%) |
| $25,000 to $34,999 | 3 (5.8%) | 3 (3.7%) |
| $35,000 to $49,999 | 0 (0.0%) | 4 (4.9%) |
| $50,000 to $74,999 | 8 (15.4%) | 0 (0.0%) |
| $75,000 to $99,999 | 10 (19.2%) | 4 (4.9%) |
| $100,000 to $149,999 | 11 (21.1%) | 9 (11.1%) |
| $150,000 or more | 8 (15.4%) | 5 (6.2%) |
| Total | 52 (100.0%) | 81 (100.0%) |
Property Value to Household Income Ratio in Punaluu
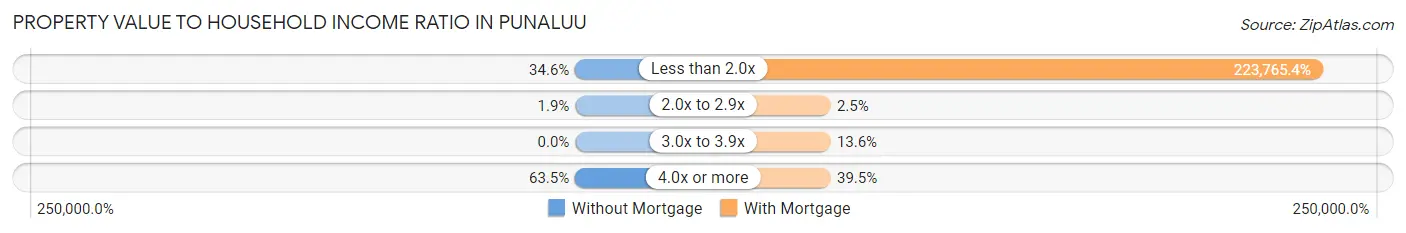
| Value-to-Income Ratio | Without Mortgage | With Mortgage |
| Less than 2.0x | 18 (34.6%) | 181,250 (223,765.4%) |
| 2.0x to 2.9x | 1 (1.9%) | 2 (2.5%) |
| 3.0x to 3.9x | 0 (0.0%) | 11 (13.6%) |
| 4.0x or more | 33 (63.5%) | 32 (39.5%) |
| Total | 52 (100.0%) | 81 (100.0%) |
Real Estate Taxes by Mortgage Status in Punaluu
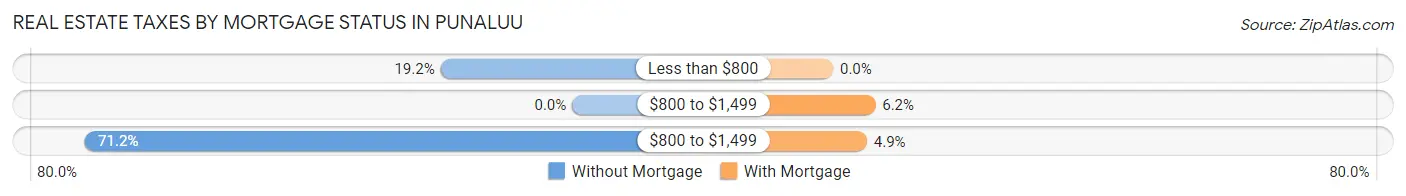
| Property Taxes | Without Mortgage | With Mortgage |
| Less than $800 | 10 (19.2%) | 0 (0.0%) |
| $800 to $1,499 | 0 (0.0%) | 5 (6.2%) |
| $800 to $1,499 | 37 (71.2%) | 4 (4.9%) |
| Total | 52 (100.0%) | 81 (100.0%) |
Health & Disability in Punaluu
Health Insurance Coverage by Age in Punaluu
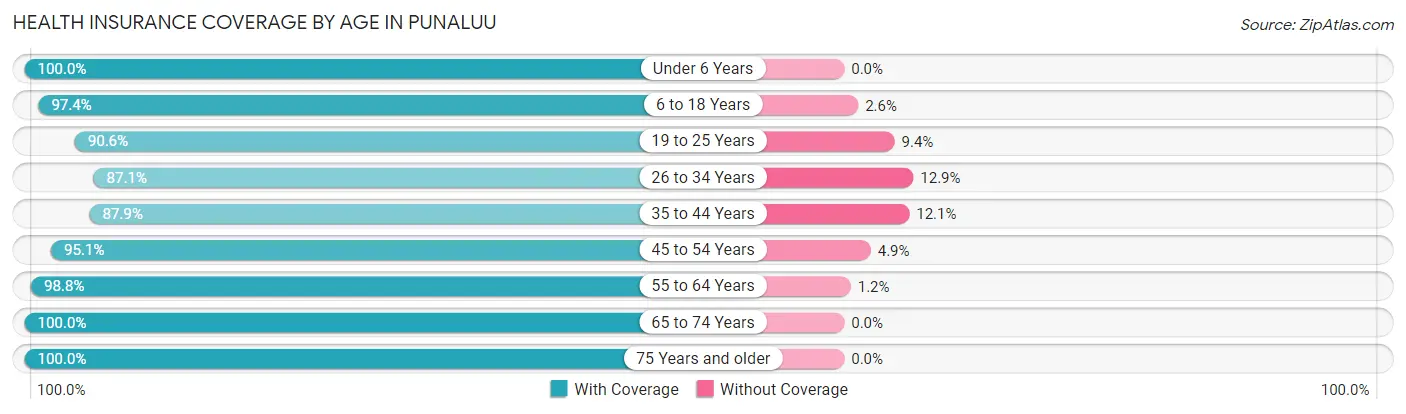
| Age Bracket | With Coverage | Without Coverage |
| Under 6 Years | 55 (100.0%) | 0 (0.0%) |
| 6 to 18 Years | 113 (97.4%) | 3 (2.6%) |
| 19 to 25 Years | 58 (90.6%) | 6 (9.4%) |
| 26 to 34 Years | 142 (87.1%) | 21 (12.9%) |
| 35 to 44 Years | 87 (87.9%) | 12 (12.1%) |
| 45 to 54 Years | 77 (95.1%) | 4 (4.9%) |
| 55 to 64 Years | 163 (98.8%) | 2 (1.2%) |
| 65 to 74 Years | 97 (100.0%) | 0 (0.0%) |
| 75 Years and older | 51 (100.0%) | 0 (0.0%) |
| Total | 843 (94.6%) | 48 (5.4%) |
Health Insurance Coverage by Citizenship Status in Punaluu
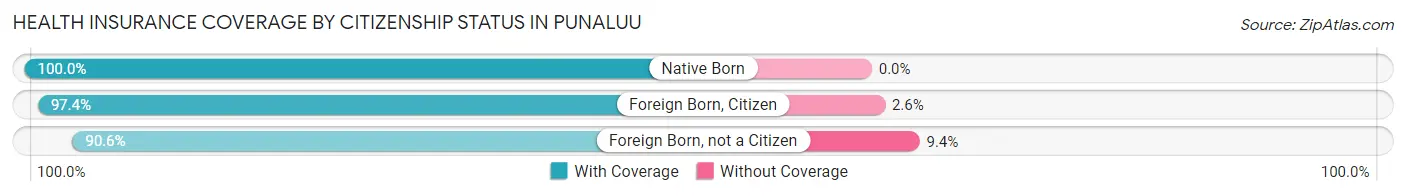
| Citizenship Status | With Coverage | Without Coverage |
| Native Born | 55 (100.0%) | 0 (0.0%) |
| Foreign Born, Citizen | 113 (97.4%) | 3 (2.6%) |
| Foreign Born, not a Citizen | 58 (90.6%) | 6 (9.4%) |
Health Insurance Coverage by Household Income in Punaluu
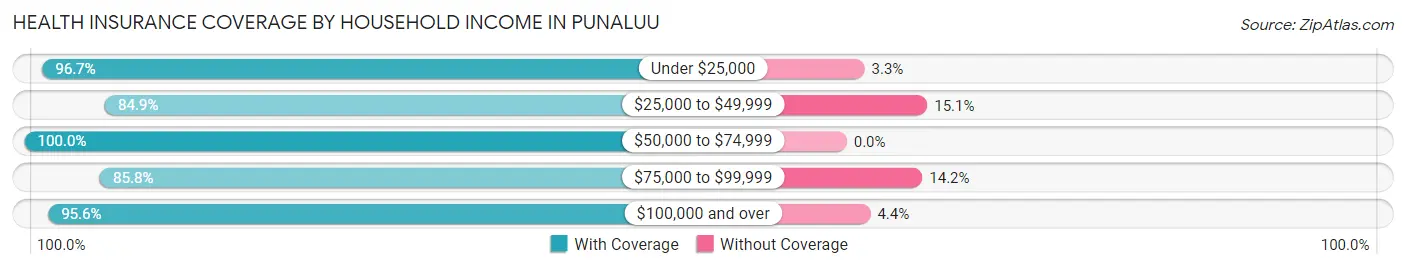
| Household Income | With Coverage | Without Coverage |
| Under $25,000 | 87 (96.7%) | 3 (3.3%) |
| $25,000 to $49,999 | 45 (84.9%) | 8 (15.1%) |
| $50,000 to $74,999 | 155 (100.0%) | 0 (0.0%) |
| $75,000 to $99,999 | 97 (85.8%) | 16 (14.2%) |
| $100,000 and over | 453 (95.6%) | 21 (4.4%) |
Public vs Private Health Insurance Coverage by Age in Punaluu
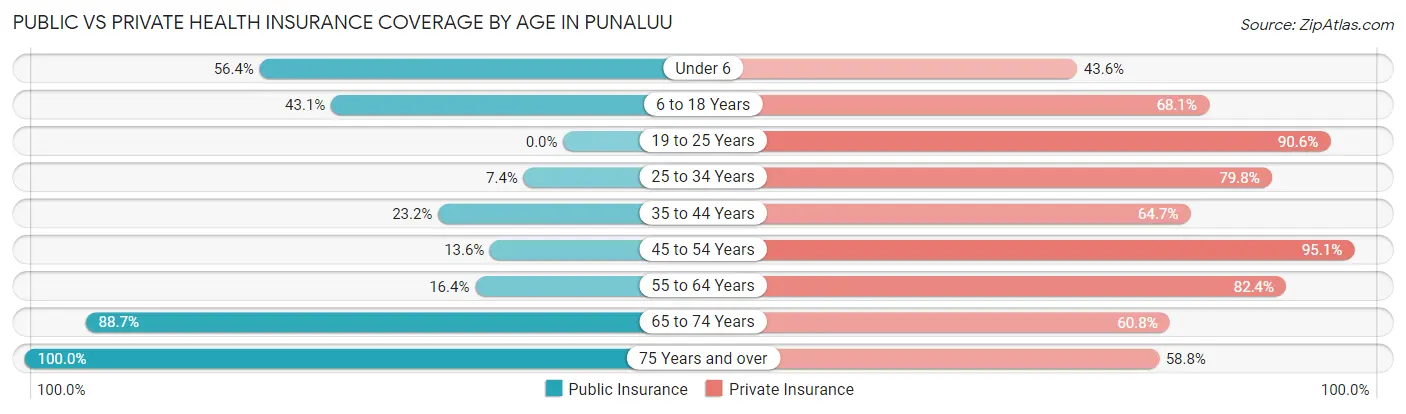
| Age Bracket | Public Insurance | Private Insurance |
| Under 6 | 31 (56.4%) | 24 (43.6%) |
| 6 to 18 Years | 50 (43.1%) | 79 (68.1%) |
| 19 to 25 Years | 0 (0.0%) | 58 (90.6%) |
| 25 to 34 Years | 12 (7.4%) | 130 (79.7%) |
| 35 to 44 Years | 23 (23.2%) | 64 (64.6%) |
| 45 to 54 Years | 11 (13.6%) | 77 (95.1%) |
| 55 to 64 Years | 27 (16.4%) | 136 (82.4%) |
| 65 to 74 Years | 86 (88.7%) | 59 (60.8%) |
| 75 Years and over | 51 (100.0%) | 30 (58.8%) |
| Total | 291 (32.7%) | 657 (73.7%) |
Disability Status by Sex by Age in Punaluu
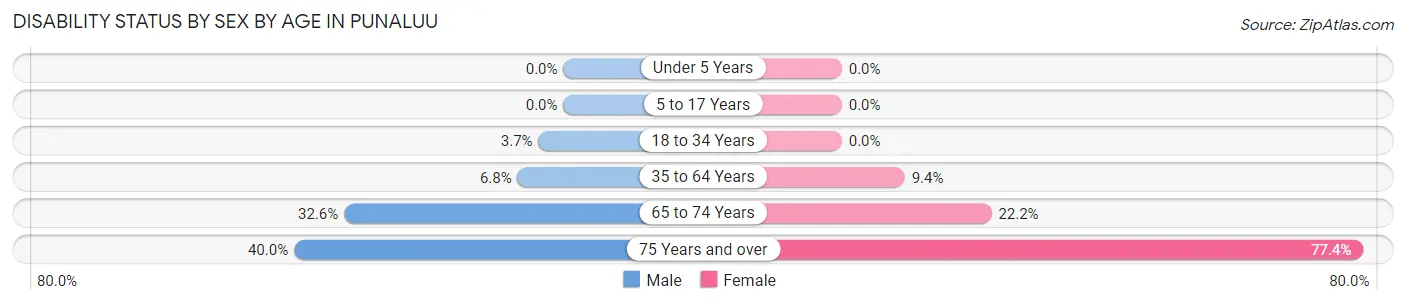
| Age Bracket | Male | Female |
| Under 5 Years | 0 (0.0%) | 0 (0.0%) |
| 5 to 17 Years | 0 (0.0%) | 0 (0.0%) |
| 18 to 34 Years | 4 (3.7%) | 0 (0.0%) |
| 35 to 64 Years | 14 (6.8%) | 13 (9.3%) |
| 65 to 74 Years | 14 (32.6%) | 12 (22.2%) |
| 75 Years and over | 8 (40.0%) | 24 (77.4%) |
Disability Class by Sex by Age in Punaluu
Disability Class: Hearing Difficulty
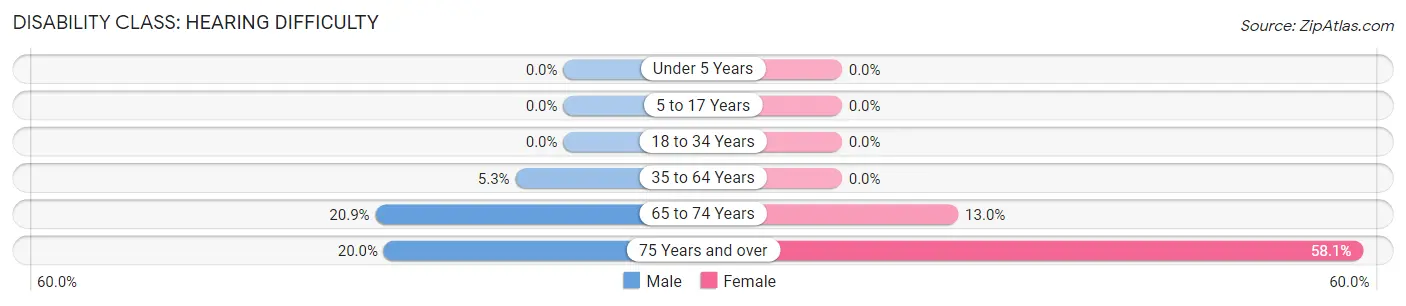
| Age Bracket | Male | Female |
| Under 5 Years | 0 (0.0%) | 0 (0.0%) |
| 5 to 17 Years | 0 (0.0%) | 0 (0.0%) |
| 18 to 34 Years | 0 (0.0%) | 0 (0.0%) |
| 35 to 64 Years | 11 (5.3%) | 0 (0.0%) |
| 65 to 74 Years | 9 (20.9%) | 7 (13.0%) |
| 75 Years and over | 4 (20.0%) | 18 (58.1%) |
Disability Class: Vision Difficulty
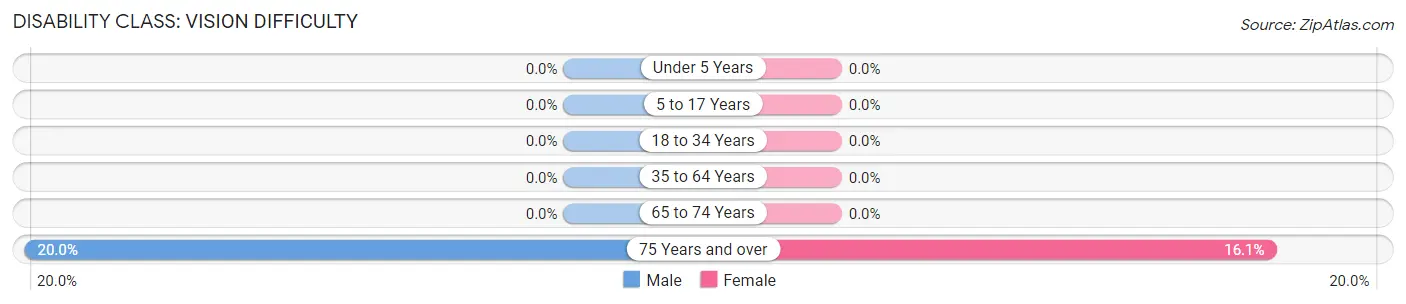
| Age Bracket | Male | Female |
| Under 5 Years | 0 (0.0%) | 0 (0.0%) |
| 5 to 17 Years | 0 (0.0%) | 0 (0.0%) |
| 18 to 34 Years | 0 (0.0%) | 0 (0.0%) |
| 35 to 64 Years | 0 (0.0%) | 0 (0.0%) |
| 65 to 74 Years | 0 (0.0%) | 0 (0.0%) |
| 75 Years and over | 4 (20.0%) | 5 (16.1%) |
Disability Class: Cognitive Difficulty
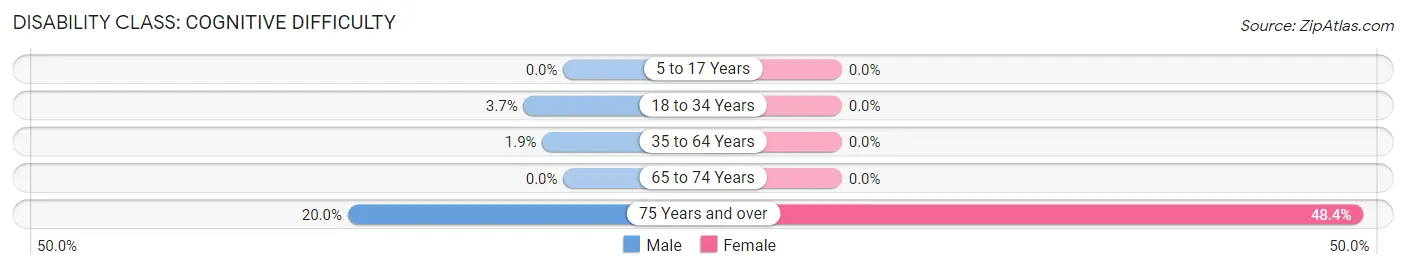
| Age Bracket | Male | Female |
| 5 to 17 Years | 0 (0.0%) | 0 (0.0%) |
| 18 to 34 Years | 4 (3.7%) | 0 (0.0%) |
| 35 to 64 Years | 4 (1.9%) | 0 (0.0%) |
| 65 to 74 Years | 0 (0.0%) | 0 (0.0%) |
| 75 Years and over | 4 (20.0%) | 15 (48.4%) |
Disability Class: Ambulatory Difficulty
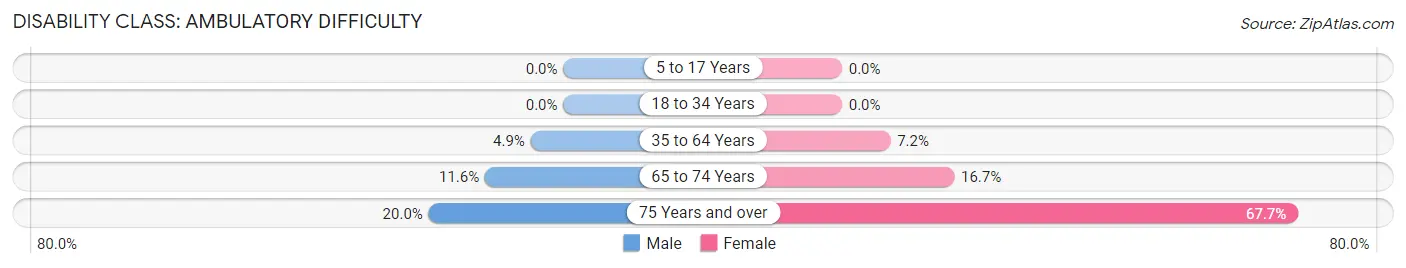
| Age Bracket | Male | Female |
| 5 to 17 Years | 0 (0.0%) | 0 (0.0%) |
| 18 to 34 Years | 0 (0.0%) | 0 (0.0%) |
| 35 to 64 Years | 10 (4.9%) | 10 (7.2%) |
| 65 to 74 Years | 5 (11.6%) | 9 (16.7%) |
| 75 Years and over | 4 (20.0%) | 21 (67.7%) |
Disability Class: Self-Care Difficulty
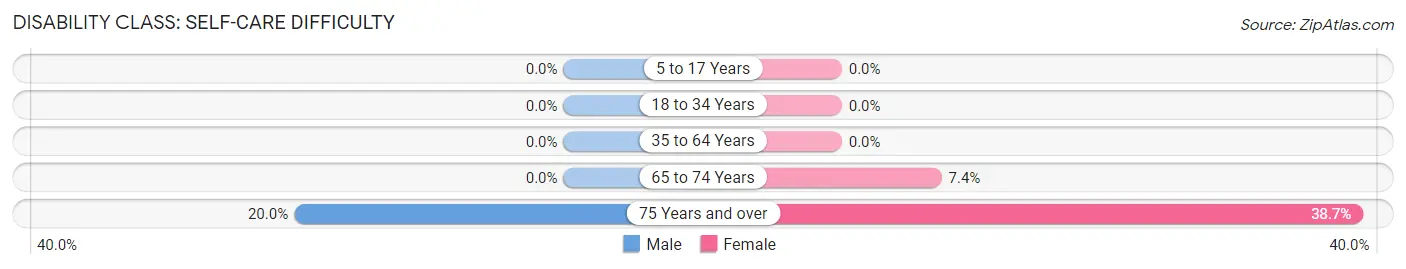
| Age Bracket | Male | Female |
| 5 to 17 Years | 0 (0.0%) | 0 (0.0%) |
| 18 to 34 Years | 0 (0.0%) | 0 (0.0%) |
| 35 to 64 Years | 0 (0.0%) | 0 (0.0%) |
| 65 to 74 Years | 0 (0.0%) | 4 (7.4%) |
| 75 Years and over | 4 (20.0%) | 12 (38.7%) |
Technology Access in Punaluu
Computing Device Access in Punaluu
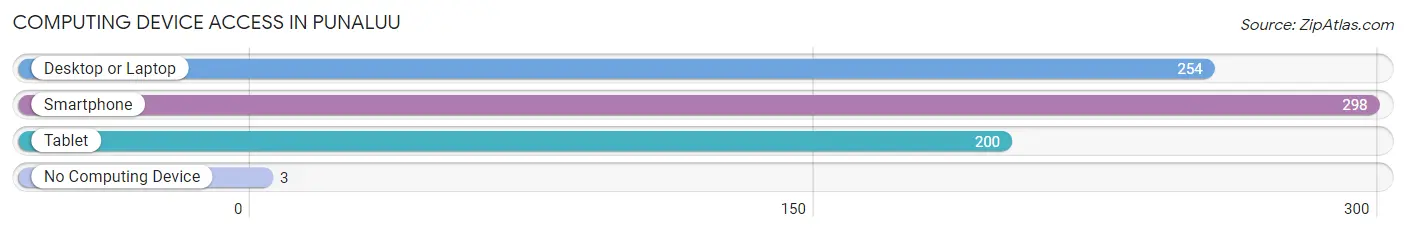
| Device Type | # Households | % Households |
| Desktop or Laptop | 254 | 75.1% |
| Smartphone | 298 | 88.2% |
| Tablet | 200 | 59.2% |
| No Computing Device | 3 | 0.9% |
| Total | 338 | 100.0% |
Internet Access in Punaluu
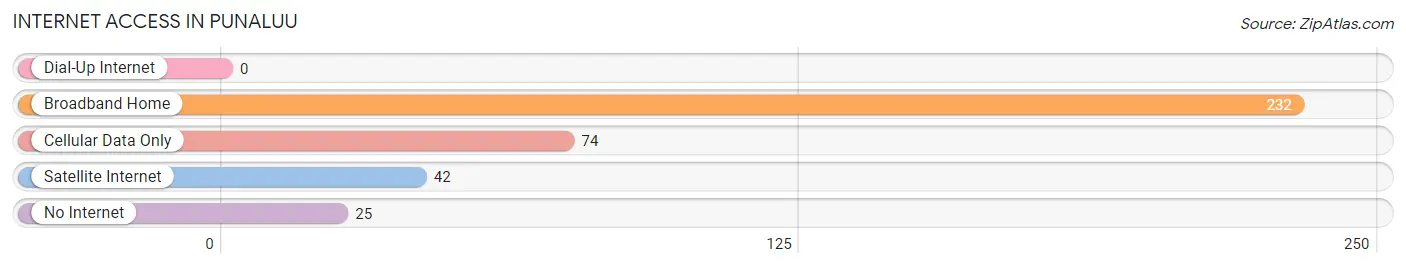
| Internet Type | # Households | % Households |
| Dial-Up Internet | 0 | 0.0% |
| Broadband Home | 232 | 68.6% |
| Cellular Data Only | 74 | 21.9% |
| Satellite Internet | 42 | 12.4% |
| No Internet | 25 | 7.4% |
| Total | 338 | 100.0% |
Punaluu Summary
Punaluu is a small unincorporated community located on the southeastern coast of the island of Oahu in the U.S. state of Hawaii. It is located in the Ko’olauloa District of the island and is part of the Honolulu Metropolitan Statistical Area. The community is situated on the shore of Punaluu Bay, which is a popular spot for swimming, snorkeling, and other water activities.
History
The area of Punaluu has been inhabited for centuries by the native Hawaiian people. The area was a popular fishing spot for the ancient Hawaiians, and the name Punaluu is derived from the Hawaiian words “puna” meaning “spring” and “luu” meaning “to dive”. The area was also a popular spot for surfing, and the ancient Hawaiians would often surf the waves of Punaluu Bay.
In the late 19th century, the area was developed by the Punaluu Sugar Company, which was established in 1887. The company built a sugar mill and a railroad line to transport the sugar cane to Honolulu. The company also built a number of homes for its workers, which still stand today.
In the early 20th century, the area was developed further by the Punaluu Land Company, which was established in 1909. The company built a number of homes and businesses in the area, and the community began to grow.
Geography
Punaluu is located on the southeastern coast of the island of Oahu in the U.S. state of Hawaii. It is situated on the shore of Punaluu Bay, which is a popular spot for swimming, snorkeling, and other water activities. The area is surrounded by lush tropical vegetation and is home to a variety of wildlife, including sea turtles, dolphins, and whales.
The climate in Punaluu is tropical and humid, with temperatures ranging from an average low of 65°F (18°C) in the winter to an average high of 85°F (29°C) in the summer. The area receives an average of about 20 inches (51 cm) of rain per year.
Economy
The economy of Punaluu is largely based on tourism and agriculture. The area is home to a number of resorts and hotels, as well as a number of small businesses. Agriculture is also an important part of the local economy, with the area being home to a number of farms and ranches.
Demographics
As of the 2010 census, the population of Punaluu was 1,845. The racial makeup of the community was 57.3% White, 0.7% African American, 0.3% Native American, 24.2% Asian, 0.2% Pacific Islander, and 17.5% from other races. The median household income in the area was $50,945, and the median age was 44.7 years.
Punaluu is a small but vibrant community that is home to a diverse population. The area is known for its beautiful beaches and lush tropical vegetation, and it is a popular spot for tourists and locals alike. The area is also home to a number of businesses and farms, making it an important part of the local economy.
Common Questions
What is Per Capita Income in Punaluu?
Per Capita income in Punaluu is $43,771.
What is the Median Family Income in Punaluu?
Median Family Income in Punaluu is $116,207.
What is the Median Household income in Punaluu?
Median Household Income in Punaluu is $83,929.
What is Income or Wage Gap in Punaluu?
Income or Wage Gap in Punaluu is 39.8%.
Women in Punaluu earn 60.2 cents for every dollar earned by a man.
What is Family Income Deficit in Punaluu?
Family Income Deficit in Punaluu is $13,660.
Families that are below poverty line in Punaluu earn $13,660 less on average than the poverty threshold level.
What is Inequality or Gini Index in Punaluu?
Inequality or Gini Index in Punaluu is 0.47.
What is the Total Population of Punaluu?
Total Population of Punaluu is 917.
What is the Total Male Population of Punaluu?
Total Male Population of Punaluu is 464.
What is the Total Female Population of Punaluu?
Total Female Population of Punaluu is 453.
What is the Ratio of Males per 100 Females in Punaluu?
There are 102.43 Males per 100 Females in Punaluu.
What is the Ratio of Females per 100 Males in Punaluu?
There are 97.63 Females per 100 Males in Punaluu.
What is the Median Population Age in Punaluu?
Median Population Age in Punaluu is 39.9 Years.
What is the Average Family Size in Punaluu
Average Family Size in Punaluu is 3.8 People.
What is the Average Household Size in Punaluu
Average Household Size in Punaluu is 2.6 People.
How Large is the Labor Force in Punaluu?
There are 461 People in the Labor Forcein in Punaluu.
What is the Percentage of People in the Labor Force in Punaluu?
60.9% of People are in the Labor Force in Punaluu.
What is the Unemployment Rate in Punaluu?
Unemployment Rate in Punaluu is 4.4%.