Landess, IN Map & Demographics
Landess Map
Landess Overview
$29,733
PER CAPITA INCOME
0.25
INEQUALITY / GINI INDEX
94
TOTAL POPULATION
34
MALE POPULATION
60
FEMALE POPULATION
56.67
MALES / 100 FEMALES
176.47
FEMALES / 100 MALES
47.5
MEDIAN AGE
2.6
AVG FAMILY SIZE
1.8
AVG HOUSEHOLD SIZE
66
LABOR FORCE [ PEOPLE ]
79.5%
PERCENT IN LABOR FORCE
Income in Landess
Income Overview in Landess
| Characteristic | Number | Measure |
| Per Capita Income | 94 | $29,733 |
| Median Family Income | 19 | $0 |
| Mean Family Income | 19 | $0 |
| Median Household Income | 53 | $0 |
| Mean Household Income | 53 | $51,302 |
| Income Deficit | 19 | $0 |
| Wage / Income Gap (%) | 94 | 0.00% |
| Wage / Income Gap ($) | 94 | 100.00¢ per $1 |
| Gini / Inequality Index | 94 | 0.25 |
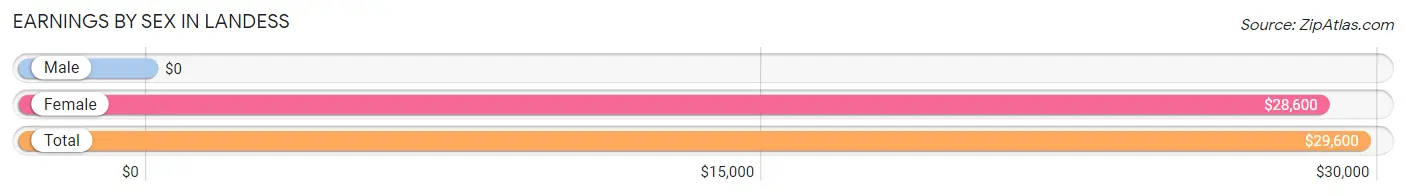
Earnings by Sex in Landess
| Sex | Number | Average Earnings |
| Male | 20 (30.3%) | $0 |
| Female | 46 (69.7%) | $28,600 |
| Total | 66 (100.0%) | $29,600 |
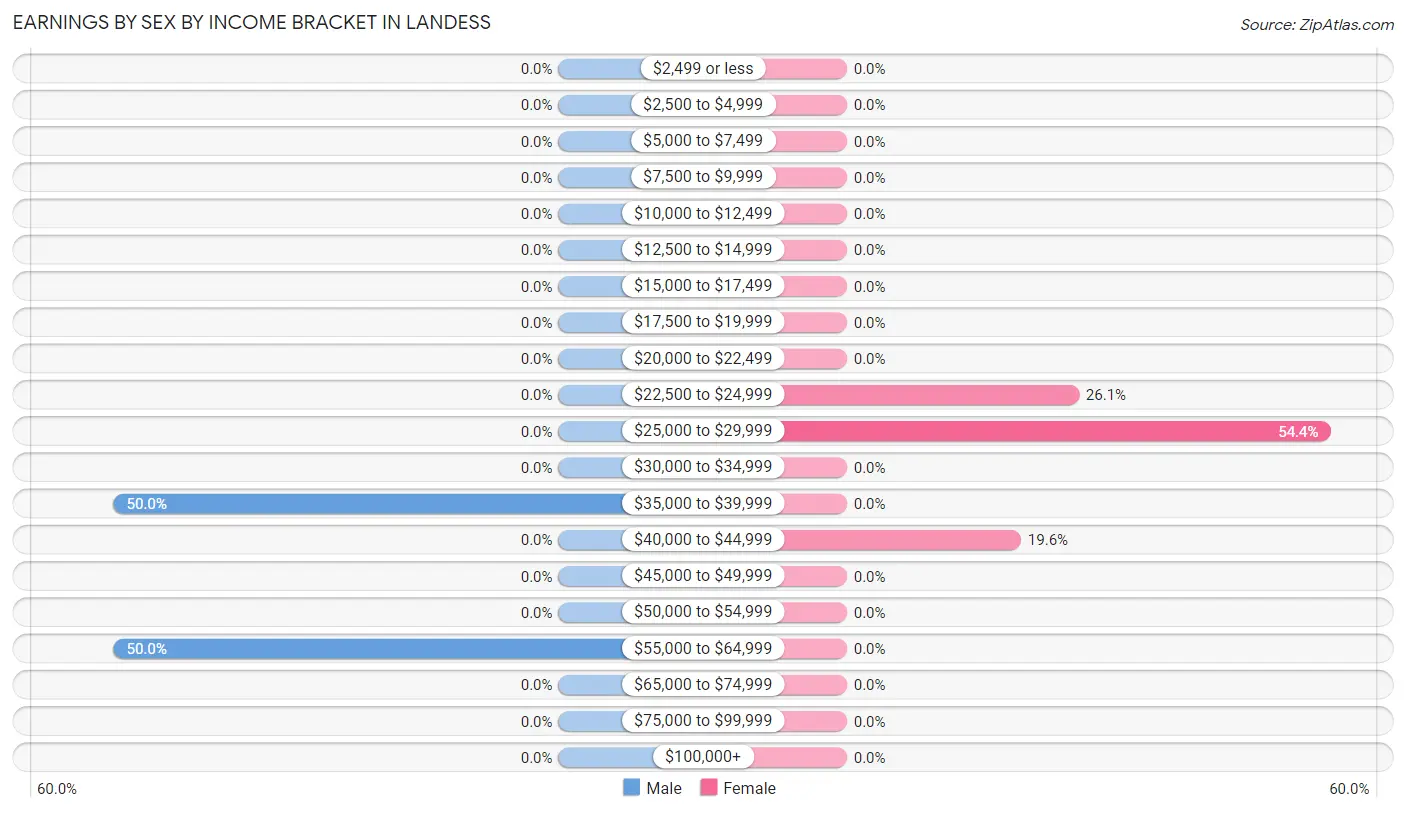
Earnings by Sex by Income Bracket in Landess
The most common earnings brackets in Landess are $35,000 to $39,999 for men (10 | 50.0%) and $25,000 to $29,999 for women (25 | 54.3%).
| Income | Male | Female |
| $2,499 or less | 0 (0.0%) | 0 (0.0%) |
| $2,500 to $4,999 | 0 (0.0%) | 0 (0.0%) |
| $5,000 to $7,499 | 0 (0.0%) | 0 (0.0%) |
| $7,500 to $9,999 | 0 (0.0%) | 0 (0.0%) |
| $10,000 to $12,499 | 0 (0.0%) | 0 (0.0%) |
| $12,500 to $14,999 | 0 (0.0%) | 0 (0.0%) |
| $15,000 to $17,499 | 0 (0.0%) | 0 (0.0%) |
| $17,500 to $19,999 | 0 (0.0%) | 0 (0.0%) |
| $20,000 to $22,499 | 0 (0.0%) | 0 (0.0%) |
| $22,500 to $24,999 | 0 (0.0%) | 12 (26.1%) |
| $25,000 to $29,999 | 0 (0.0%) | 25 (54.3%) |
| $30,000 to $34,999 | 0 (0.0%) | 0 (0.0%) |
| $35,000 to $39,999 | 10 (50.0%) | 0 (0.0%) |
| $40,000 to $44,999 | 0 (0.0%) | 9 (19.6%) |
| $45,000 to $49,999 | 0 (0.0%) | 0 (0.0%) |
| $50,000 to $54,999 | 0 (0.0%) | 0 (0.0%) |
| $55,000 to $64,999 | 10 (50.0%) | 0 (0.0%) |
| $65,000 to $74,999 | 0 (0.0%) | 0 (0.0%) |
| $75,000 to $99,999 | 0 (0.0%) | 0 (0.0%) |
| $100,000+ | 0 (0.0%) | 0 (0.0%) |
| Total | 20 (100.0%) | 46 (100.0%) |
Earnings by Sex by Educational Attainment in Landess
| Educational Attainment | Male Income | Female Income |
| Less than High School | - | - |
| High School Diploma | - | - |
| College or Associate's Degree | - | - |
| Bachelor's Degree | - | - |
| Graduate Degree | - | - |
| Total | - | - |
Family Income in Landess
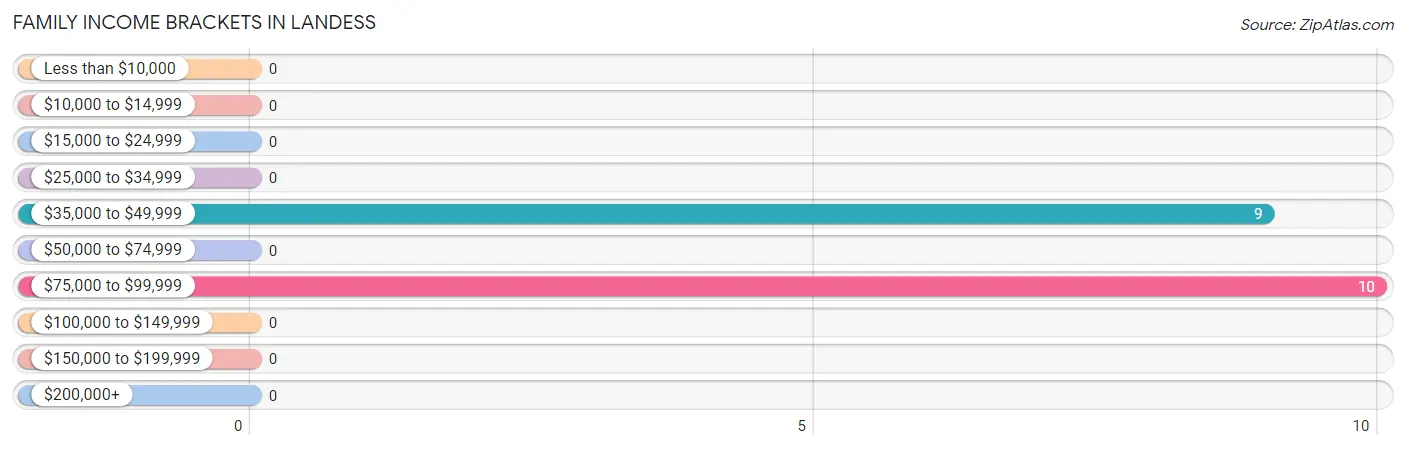
Family Income Brackets in Landess
According to the Landess family income data, there are 10 families falling into the $75,000 to $99,999 income range, which is the most common income bracket and makes up 52.6% of all families.
| Income Bracket | # Families | % Families |
| Less than $10,000 | 0 | 0.0% |
| $10,000 to $14,999 | 0 | 0.0% |
| $15,000 to $24,999 | 0 | 0.0% |
| $25,000 to $34,999 | 0 | 0.0% |
| $35,000 to $49,999 | 9 | 47.4% |
| $50,000 to $74,999 | 0 | 0.0% |
| $75,000 to $99,999 | 10 | 52.6% |
| $100,000 to $149,999 | 0 | 0.0% |
| $150,000 to $199,999 | 0 | 0.0% |
| $200,000+ | 0 | 0.0% |
Family Income by Famaliy Size in Landess
| Income Bracket | # Families | Median Income |
| 2-Person Families | 9 (47.4%) | $0 |
| 3-Person Families | 0 (0.0%) | $0 |
| 4-Person Families | 10 (52.6%) | $0 |
| 5-Person Families | 0 (0.0%) | $0 |
| 6-Person Families | 0 (0.0%) | $0 |
| 7+ Person Families | 0 (0.0%) | $0 |
| Total | 19 (100.0%) | $0 |
Family Income by Number of Earners in Landess
| Number of Earners | # Families | Median Income |
| No Earners | 9 (47.4%) | $0 |
| 1 Earner | 0 (0.0%) | $0 |
| 2 Earners | 10 (52.6%) | $0 |
| 3+ Earners | 0 (0.0%) | $0 |
| Total | 19 (100.0%) | $0 |
Household Income in Landess
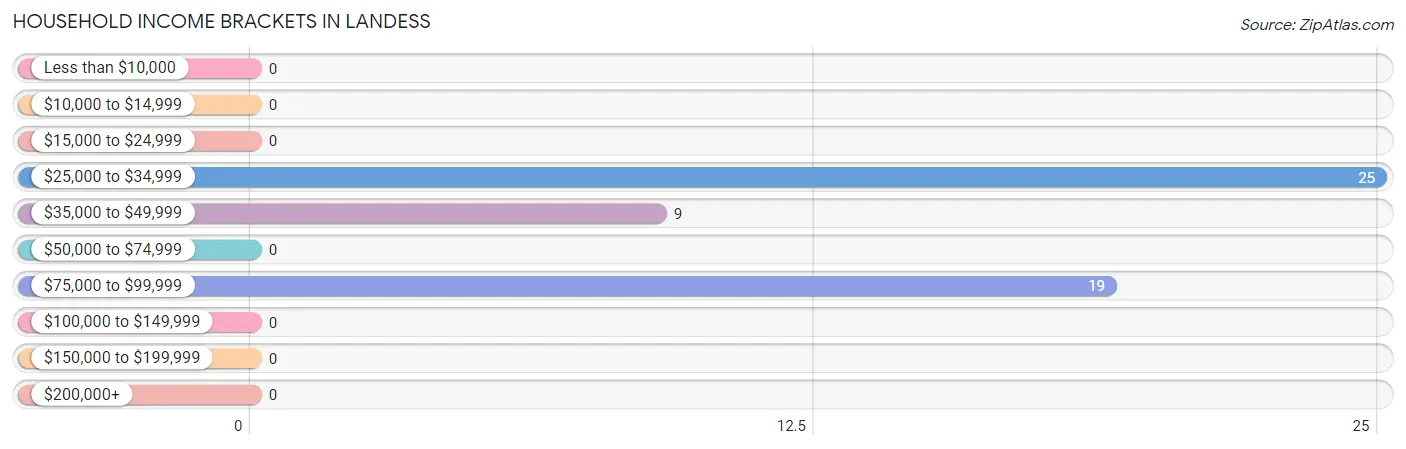
Household Income Brackets in Landess
With 25 households falling in the category, the $25,000 to $34,999 income range is the most frequent in Landess, accounting for 47.2% of all households.
| Income Bracket | # Households | % Households |
| Less than $10,000 | 0 | 0.0% |
| $10,000 to $14,999 | 0 | 0.0% |
| $15,000 to $24,999 | 0 | 0.0% |
| $25,000 to $34,999 | 25 | 47.2% |
| $35,000 to $49,999 | 9 | 17.0% |
| $50,000 to $74,999 | 0 | 0.0% |
| $75,000 to $99,999 | 19 | 35.8% |
| $100,000 to $149,999 | 0 | 0.0% |
| $150,000 to $199,999 | 0 | 0.0% |
| $200,000+ | 0 | 0.0% |
Household Income by Householder Age in Landess
| Income Bracket | # Households | Median Income |
| 15 to 24 Years | 0 (0.0%) | $0 |
| 25 to 44 Years | 19 (35.8%) | $0 |
| 45 to 64 Years | 25 (47.2%) | $0 |
| 65+ Years | 9 (17.0%) | $0 |
| Total | 53 (100.0%) | $0 |
Poverty in Landess
Income Below Poverty by Sex and Age in Landess
| Age Bracket | Male | Female |
| Under 5 Years | 0 (0.0%) | 0 (0.0%) |
| 5 Years | 0 (0.0%) | 0 (0.0%) |
| 6 to 11 Years | 0 (0.0%) | 0 (0.0%) |
| 12 to 14 Years | 0 (0.0%) | 0 (0.0%) |
| 15 Years | 0 (0.0%) | 0 (0.0%) |
| 16 and 17 Years | 0 (0.0%) | 0 (0.0%) |
| 18 to 24 Years | 0 (0.0%) | 0 (0.0%) |
| 25 to 34 Years | 0 (0.0%) | 0 (0.0%) |
| 35 to 44 Years | 0 (0.0%) | 0 (0.0%) |
| 45 to 54 Years | 0 (0.0%) | 0 (0.0%) |
| 55 to 64 Years | 0 (0.0%) | 0 (0.0%) |
| 65 to 74 Years | 0 (0.0%) | 0 (0.0%) |
| 75 Years and over | 0 (0.0%) | 0 (0.0%) |
| Total | 0 (0.0%) | 0 (0.0%) |
Income Above Poverty by Sex and Age in Landess
According to the poverty statistics in Landess, males aged under 5 years and females aged 6 to 11 years are the age groups that are most secure financially, with 100.0% of males and 100.0% of females in these age groups living above the poverty line.
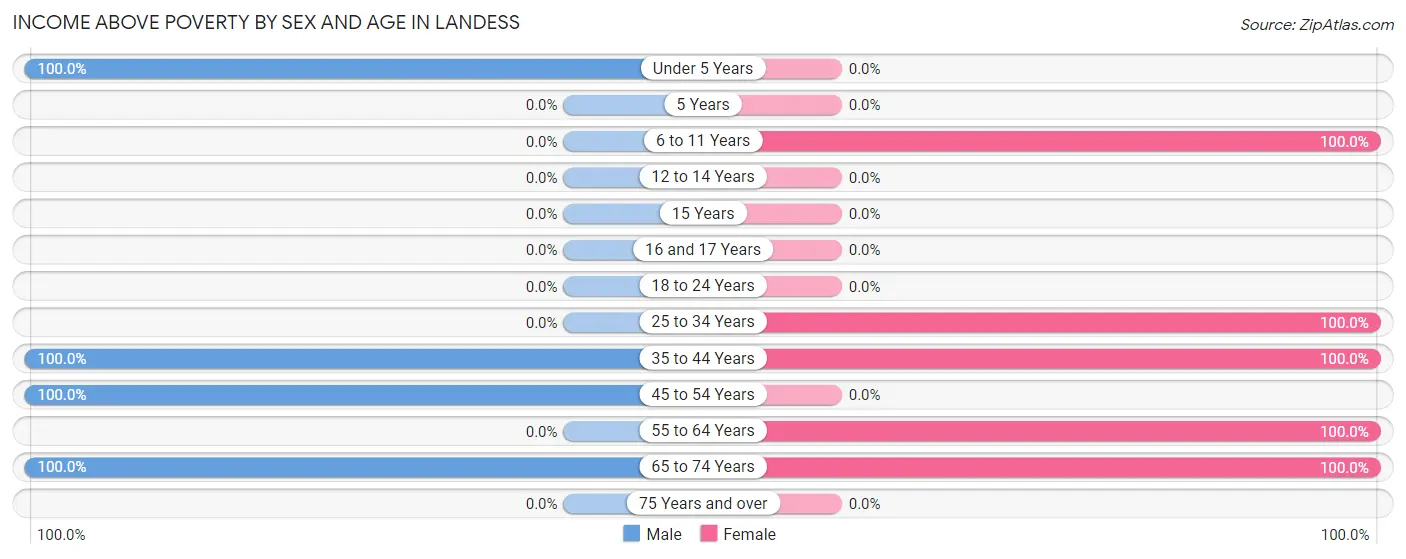
| Age Bracket | Male | Female |
| Under 5 Years | 5 (100.0%) | 0 (0.0%) |
| 5 Years | 0 (0.0%) | 0 (0.0%) |
| 6 to 11 Years | 0 (0.0%) | 6 (100.0%) |
| 12 to 14 Years | 0 (0.0%) | 0 (0.0%) |
| 15 Years | 0 (0.0%) | 0 (0.0%) |
| 16 and 17 Years | 0 (0.0%) | 0 (0.0%) |
| 18 to 24 Years | 0 (0.0%) | 0 (0.0%) |
| 25 to 34 Years | 0 (0.0%) | 12 (100.0%) |
| 35 to 44 Years | 10 (100.0%) | 9 (100.0%) |
| 45 to 54 Years | 10 (100.0%) | 0 (0.0%) |
| 55 to 64 Years | 0 (0.0%) | 25 (100.0%) |
| 65 to 74 Years | 9 (100.0%) | 8 (100.0%) |
| 75 Years and over | 0 (0.0%) | 0 (0.0%) |
| Total | 34 (100.0%) | 60 (100.0%) |
Income Below Poverty Among Married-Couple Families in Landess
| Children | Above Poverty | Below Poverty |
| No Children | 9 (100.0%) | 0 (0.0%) |
| 1 or 2 Children | 10 (100.0%) | 0 (0.0%) |
| 3 or 4 Children | 0 (0.0%) | 0 (0.0%) |
| 5 or more Children | 0 (0.0%) | 0 (0.0%) |
| Total | 19 (100.0%) | 0 (0.0%) |
Income Below Poverty Among Single-Parent Households in Landess
| Children | Single Father | Single Mother |
| No Children | 0 (0.0%) | 0 (0.0%) |
| 1 or 2 Children | 0 (0.0%) | 0 (0.0%) |
| 3 or 4 Children | 0 (0.0%) | 0 (0.0%) |
| 5 or more Children | 0 (0.0%) | 0 (0.0%) |
| Total | 0 (0.0%) | 0 (0.0%) |
Income Below Poverty Among Married-Couple vs Single-Parent Households in Landess
| Children | Married-Couple Families | Single-Parent Households |
| No Children | 0 (0.0%) | 0 (0.0%) |
| 1 or 2 Children | 0 (0.0%) | 0 (0.0%) |
| 3 or 4 Children | 0 (0.0%) | 0 (0.0%) |
| 5 or more Children | 0 (0.0%) | 0 (0.0%) |
| Total | 0 (0.0%) | 0 (0.0%) |
Race in Landess
The most populous races in Landess are White / Caucasian (94 | 100.0%), and Hispanic or Latino (23 | 24.5%).
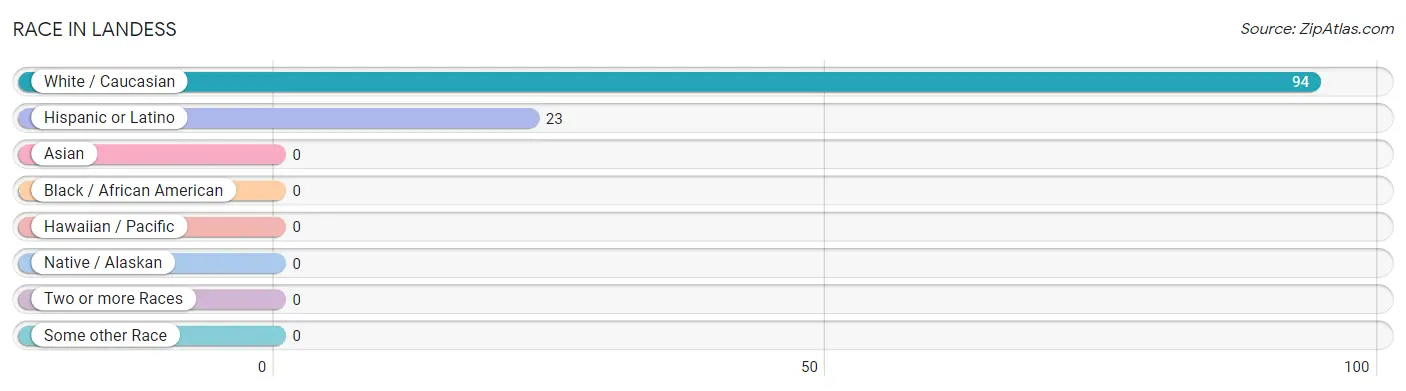
| Race | # Population | % Population |
| Asian | 0 | 0.0% |
| Black / African American | 0 | 0.0% |
| Hawaiian / Pacific | 0 | 0.0% |
| Hispanic or Latino | 23 | 24.5% |
| Native / Alaskan | 0 | 0.0% |
| White / Caucasian | 94 | 100.0% |
| Two or more Races | 0 | 0.0% |
| Some other Race | 0 | 0.0% |
| Total | 94 | 100.0% |
Ancestry in Landess
The most populous ancestries reported in Landess are English (35 | 37.2%), German (35 | 37.2%), Chilean (23 | 24.5%), South American (23 | 24.5%), and Irish (12 | 12.8%), together accounting for 136.2% of all Landess residents.
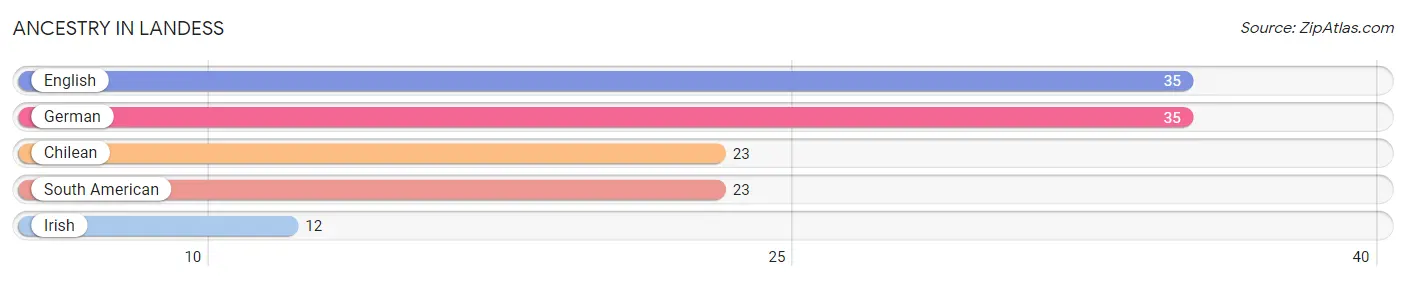
| Ancestry | # Population | % Population |
| Chilean | 23 | 24.5% |
| English | 35 | 37.2% |
| German | 35 | 37.2% |
| Irish | 12 | 12.8% |
| South American | 23 | 24.5% | View All 5 Rows |
Immigrants in Landess

| Immigration Origin | # Population | % Population | View All 0 Rows |
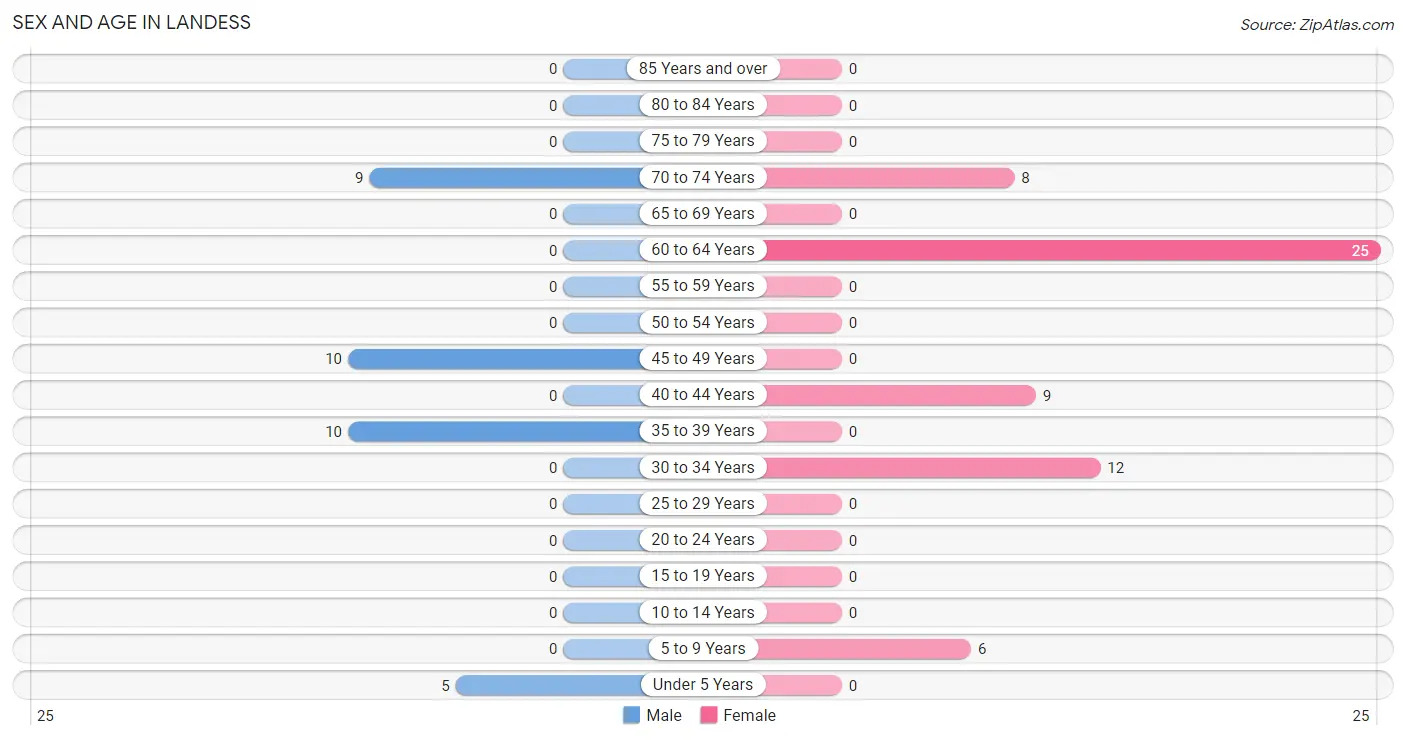
Sex and Age in Landess
Sex and Age in Landess
The most populous age groups in Landess are 35 to 39 Years (10 | 29.4%) for men and 60 to 64 Years (25 | 41.7%) for women.
| Age Bracket | Male | Female |
| Under 5 Years | 5 (14.7%) | 0 (0.0%) |
| 5 to 9 Years | 0 (0.0%) | 6 (10.0%) |
| 10 to 14 Years | 0 (0.0%) | 0 (0.0%) |
| 15 to 19 Years | 0 (0.0%) | 0 (0.0%) |
| 20 to 24 Years | 0 (0.0%) | 0 (0.0%) |
| 25 to 29 Years | 0 (0.0%) | 0 (0.0%) |
| 30 to 34 Years | 0 (0.0%) | 12 (20.0%) |
| 35 to 39 Years | 10 (29.4%) | 0 (0.0%) |
| 40 to 44 Years | 0 (0.0%) | 9 (15.0%) |
| 45 to 49 Years | 10 (29.4%) | 0 (0.0%) |
| 50 to 54 Years | 0 (0.0%) | 0 (0.0%) |
| 55 to 59 Years | 0 (0.0%) | 0 (0.0%) |
| 60 to 64 Years | 0 (0.0%) | 25 (41.7%) |
| 65 to 69 Years | 0 (0.0%) | 0 (0.0%) |
| 70 to 74 Years | 9 (26.5%) | 8 (13.3%) |
| 75 to 79 Years | 0 (0.0%) | 0 (0.0%) |
| 80 to 84 Years | 0 (0.0%) | 0 (0.0%) |
| 85 Years and over | 0 (0.0%) | 0 (0.0%) |
| Total | 34 (100.0%) | 60 (100.0%) |
Families and Households in Landess
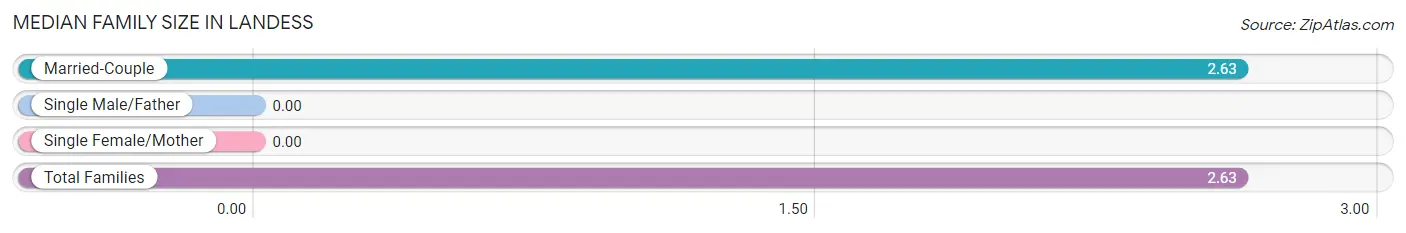
Median Family Size in Landess
| Family Type | # Families | Family Size |
| Married-Couple | 19 (100.0%) | 2.63 |
| Single Male/Father | 0 (0.0%) | - |
| Single Female/Mother | 0 (0.0%) | - |
| Total Families | 19 (100.0%) | 2.63 |
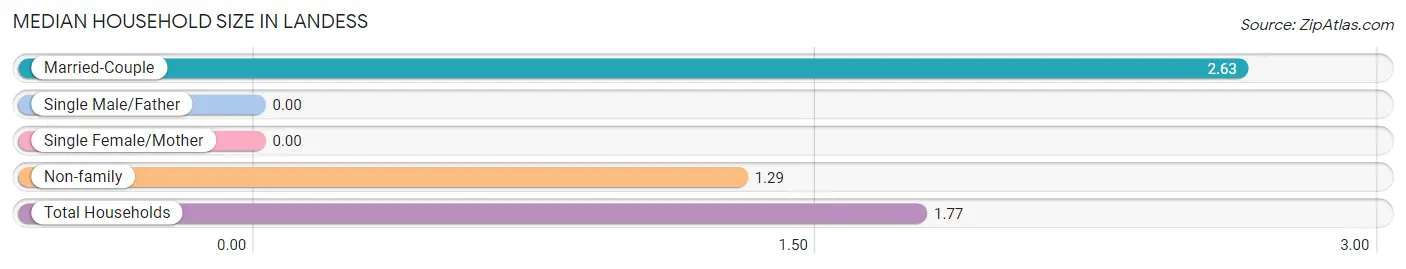
Median Household Size in Landess
| Household Type | # Households | Household Size |
| Married-Couple | 19 (35.8%) | 2.63 |
| Single Male/Father | 0 (0.0%) | - |
| Single Female/Mother | 0 (0.0%) | - |
| Non-family | 34 (64.1%) | 1.29 |
| Total Households | 53 (100.0%) | 1.77 |
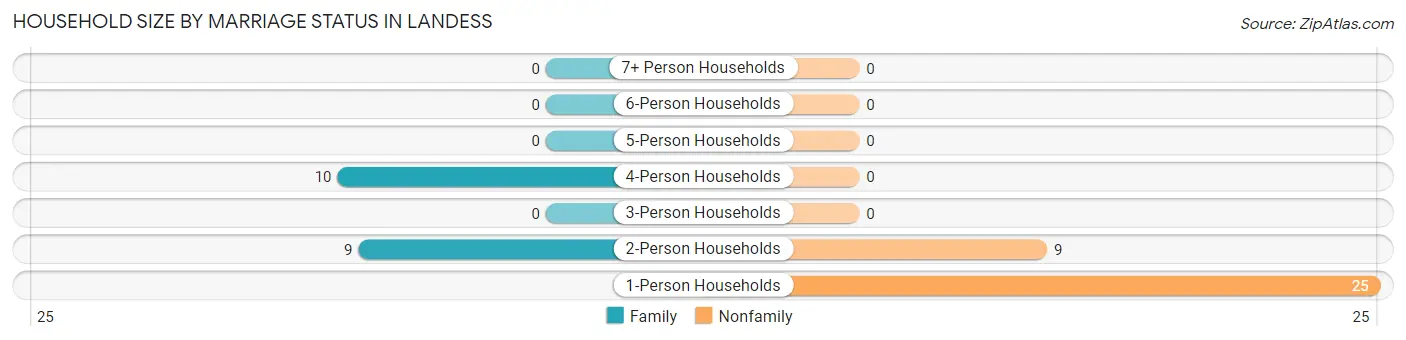
Household Size by Marriage Status in Landess
Out of a total of 53 households in Landess, 19 (35.8%) are family households, while 34 (64.1%) are nonfamily households. The most numerous type of family households are 4-person households, comprising 10, and the most common type of nonfamily households are 1-person households, comprising 25.
| Household Size | Family Households | Nonfamily Households |
| 1-Person Households | - | 25 (47.2%) |
| 2-Person Households | 9 (17.0%) | 9 (17.0%) |
| 3-Person Households | 0 (0.0%) | 0 (0.0%) |
| 4-Person Households | 10 (18.9%) | 0 (0.0%) |
| 5-Person Households | 0 (0.0%) | 0 (0.0%) |
| 6-Person Households | 0 (0.0%) | 0 (0.0%) |
| 7+ Person Households | 0 (0.0%) | 0 (0.0%) |
| Total | 19 (35.8%) | 34 (64.1%) |
Female Fertility in Landess
Fertility by Age in Landess
| Age Bracket | Women with Births | Births / 1,000 Women |
| 15 to 19 years | 0 (0.0%) | 0.0 |
| 20 to 34 years | 0 (0.0%) | 0.0 |
| 35 to 50 years | 0 (0.0%) | 0.0 |
| Total | 0 (0.0%) | 0.0 |
Fertility by Age by Marriage Status in Landess
| Age Bracket | Married | Unmarried |
| 15 to 19 years | 0 (0.0%) | 0 (0.0%) |
| 20 to 34 years | 0 (0.0%) | 0 (0.0%) |
| 35 to 50 years | 0 (0.0%) | 0 (0.0%) |
| Total | 0 (0.0%) | 0 (0.0%) |
Fertility by Education in Landess
| Educational Attainment | Women with Births | Births / 1,000 Women |
| Less than High School | 0 (0.0%) | 0.0 |
| High School Diploma | 0 (0.0%) | 0.0 |
| College or Associate's Degree | 0 (0.0%) | 0.0 |
| Bachelor's Degree | 0 (0.0%) | 0.0 |
| Graduate Degree | 0 (0.0%) | 0.0 |
| Total | 0 (0.0%) | 0.0 |
Fertility by Education by Marriage Status in Landess
| Educational Attainment | Married | Unmarried |
| Less than High School | 0 (0.0%) | 0 (0.0%) |
| High School Diploma | 0 (0.0%) | 0 (0.0%) |
| College or Associate's Degree | 0 (0.0%) | 0 (0.0%) |
| Bachelor's Degree | 0 (0.0%) | 0 (0.0%) |
| Graduate Degree | 0 (0.0%) | 0 (0.0%) |
| Total | 0 (0.0%) | 0 (0.0%) |
Employment Characteristics in Landess
Employment by Class of Employer in Landess
Among the 41 employed individuals in Landess, local government employees (22 | 53.7%), and private company employees (19 | 46.3%) make up the most common classes of employment.
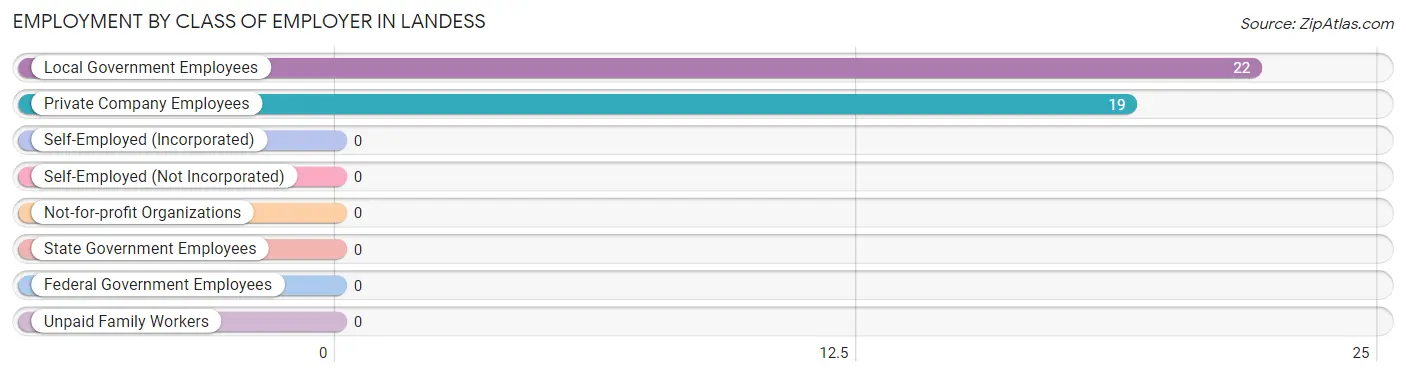
| Employer Class | # Employees | % Employees |
| Private Company Employees | 19 | 46.3% |
| Self-Employed (Incorporated) | 0 | 0.0% |
| Self-Employed (Not Incorporated) | 0 | 0.0% |
| Not-for-profit Organizations | 0 | 0.0% |
| Local Government Employees | 22 | 53.7% |
| State Government Employees | 0 | 0.0% |
| Federal Government Employees | 0 | 0.0% |
| Unpaid Family Workers | 0 | 0.0% |
| Total | 41 | 100.0% |
Employment Status by Age in Landess
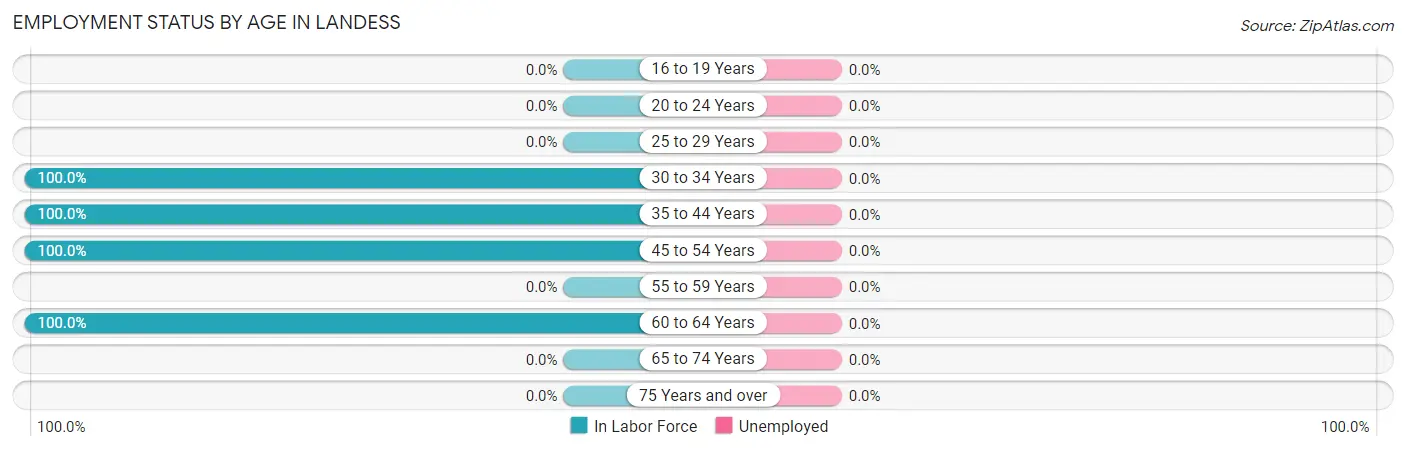
| Age Bracket | In Labor Force | Unemployed |
| 16 to 19 Years | 0 (0.0%) | 0 (0.0%) |
| 20 to 24 Years | 0 (0.0%) | 0 (0.0%) |
| 25 to 29 Years | 0 (0.0%) | 0 (0.0%) |
| 30 to 34 Years | 12 (100.0%) | 0 (0.0%) |
| 35 to 44 Years | 19 (100.0%) | 0 (0.0%) |
| 45 to 54 Years | 10 (100.0%) | 0 (0.0%) |
| 55 to 59 Years | 0 (0.0%) | 0 (0.0%) |
| 60 to 64 Years | 25 (100.0%) | 0 (0.0%) |
| 65 to 74 Years | 0 (0.0%) | 0 (0.0%) |
| 75 Years and over | 0 (0.0%) | 0 (0.0%) |
| Total | 66 (79.5%) | 0 (0.0%) |
Employment Status by Educational Attainment in Landess
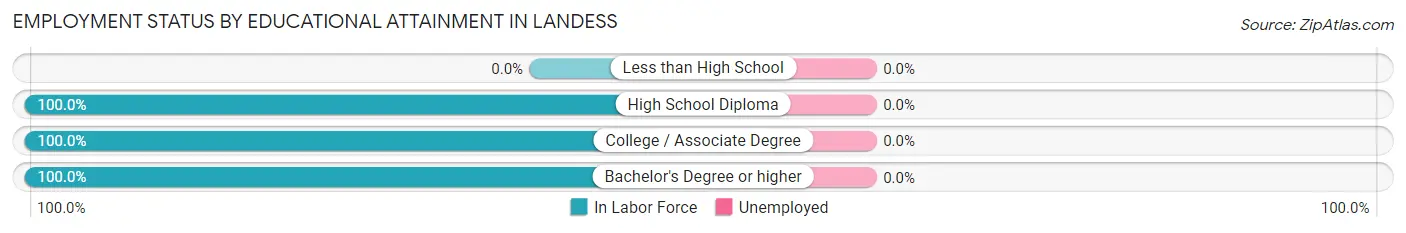
| Educational Attainment | In Labor Force | Unemployed |
| Less than High School | 0 (0.0%) | 0 (0.0%) |
| High School Diploma | 10 (100.0%) | 0 (0.0%) |
| College / Associate Degree | 34 (100.0%) | 0 (0.0%) |
| Bachelor's Degree or higher | 22 (100.0%) | 0 (0.0%) |
| Total | 66 (100.0%) | 0 (0.0%) |
Employment Occupations by Sex in Landess
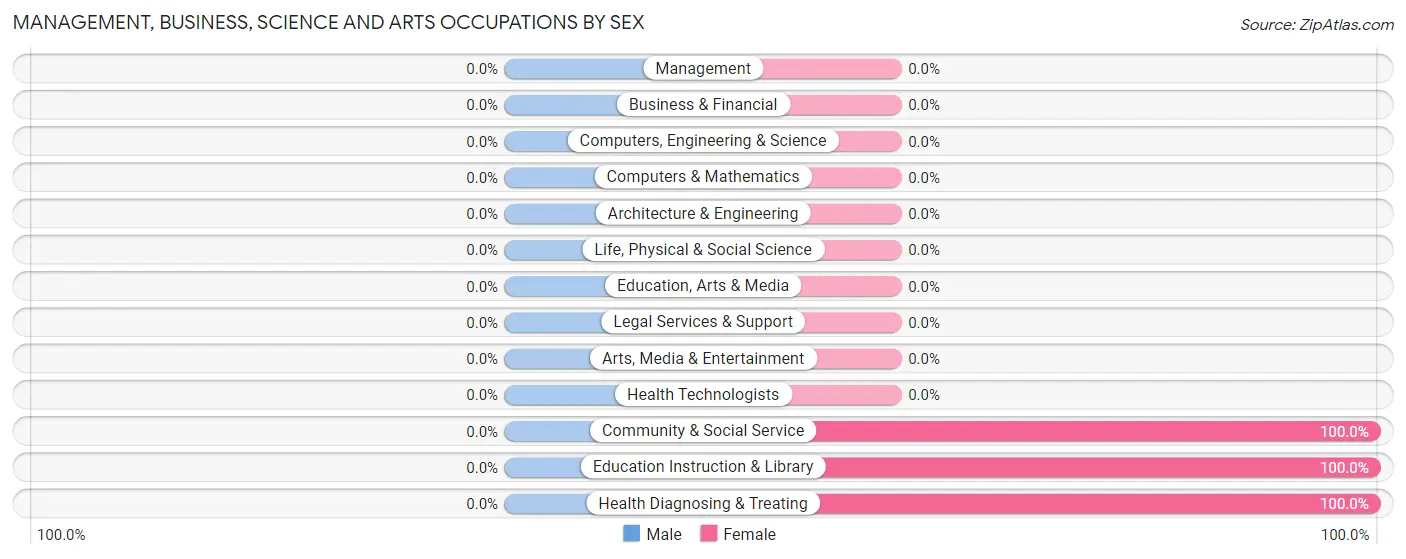
Management, Business, Science and Arts Occupations
The most common Management, Business, Science and Arts occupations in Landess are Health Diagnosing & Treating (25 | 37.9%), Community & Social Service (12 | 18.2%), and Education Instruction & Library (12 | 18.2%).
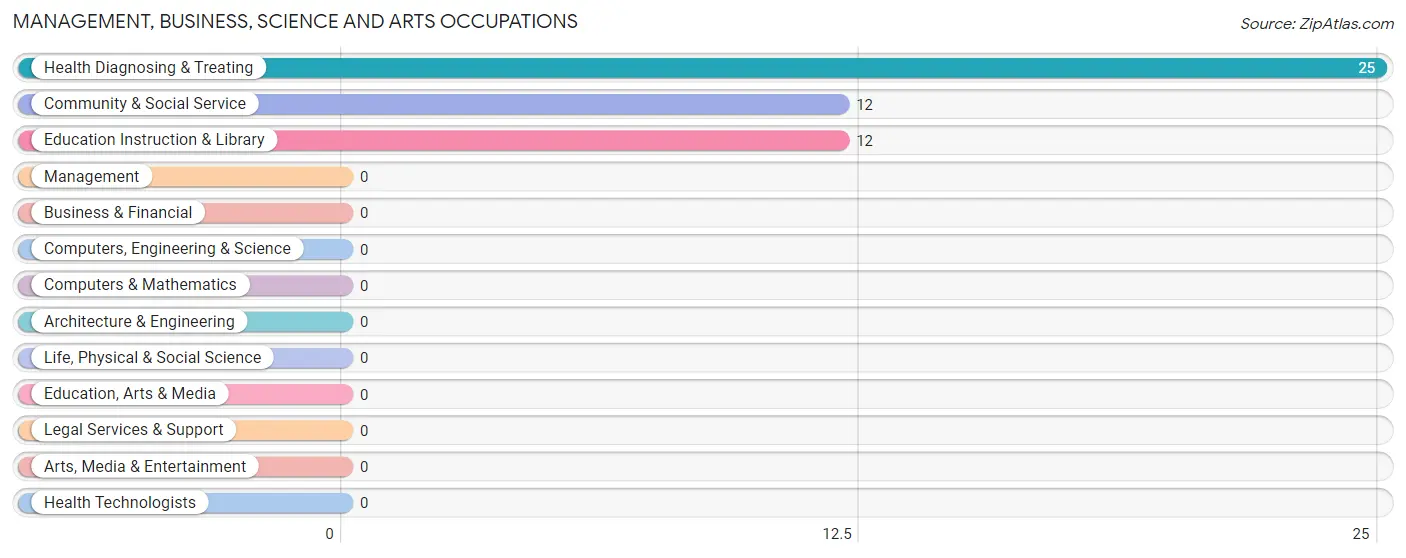
Management, Business, Science and Arts Occupations by Sex
| Occupation | Male | Female |
| Management | 0 (0.0%) | 0 (0.0%) |
| Business & Financial | 0 (0.0%) | 0 (0.0%) |
| Computers, Engineering & Science | 0 (0.0%) | 0 (0.0%) |
| Computers & Mathematics | 0 (0.0%) | 0 (0.0%) |
| Architecture & Engineering | 0 (0.0%) | 0 (0.0%) |
| Life, Physical & Social Science | 0 (0.0%) | 0 (0.0%) |
| Community & Social Service | 0 (0.0%) | 12 (100.0%) |
| Education, Arts & Media | 0 (0.0%) | 0 (0.0%) |
| Legal Services & Support | 0 (0.0%) | 0 (0.0%) |
| Education Instruction & Library | 0 (0.0%) | 12 (100.0%) |
| Arts, Media & Entertainment | 0 (0.0%) | 0 (0.0%) |
| Health Diagnosing & Treating | 0 (0.0%) | 25 (100.0%) |
| Health Technologists | 0 (0.0%) | 0 (0.0%) |
| Total (Category) | 0 (0.0%) | 37 (100.0%) |
| Total (Overall) | 20 (30.3%) | 46 (69.7%) |
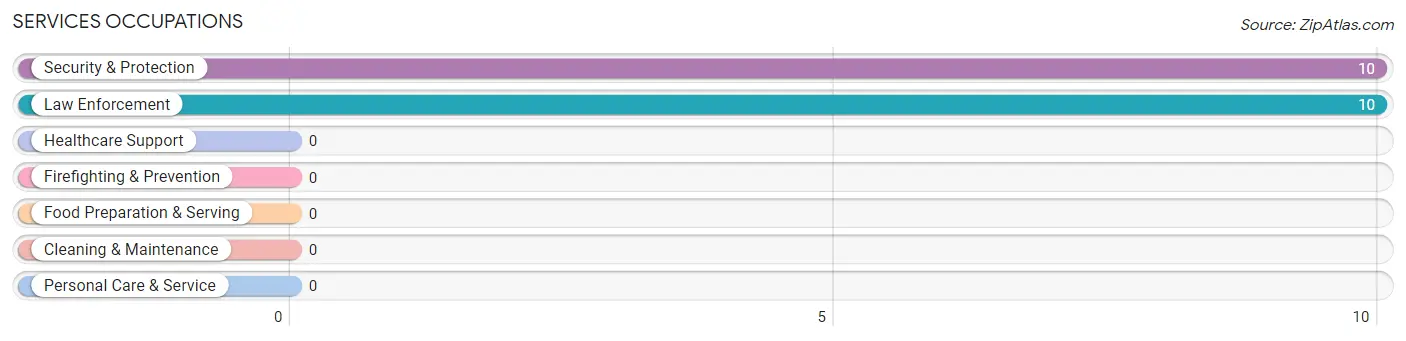
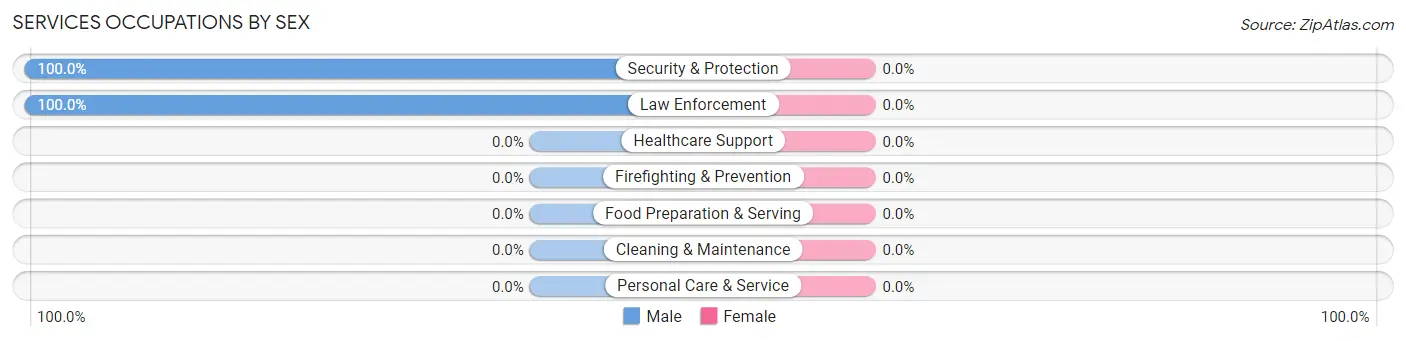
Services Occupations
The most common Services occupations in Landess are Security & Protection (10 | 15.1%), and Law Enforcement (10 | 15.1%).
Services Occupations by Sex
| Occupation | Male | Female |
| Healthcare Support | 0 (0.0%) | 0 (0.0%) |
| Security & Protection | 10 (100.0%) | 0 (0.0%) |
| Firefighting & Prevention | 0 (0.0%) | 0 (0.0%) |
| Law Enforcement | 10 (100.0%) | 0 (0.0%) |
| Food Preparation & Serving | 0 (0.0%) | 0 (0.0%) |
| Cleaning & Maintenance | 0 (0.0%) | 0 (0.0%) |
| Personal Care & Service | 0 (0.0%) | 0 (0.0%) |
| Total (Category) | 10 (100.0%) | 0 (0.0%) |
| Total (Overall) | 20 (30.3%) | 46 (69.7%) |
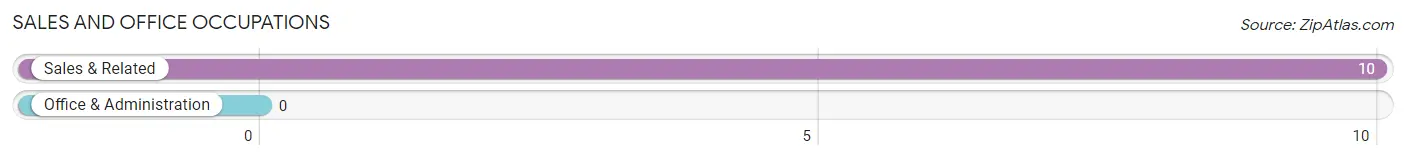
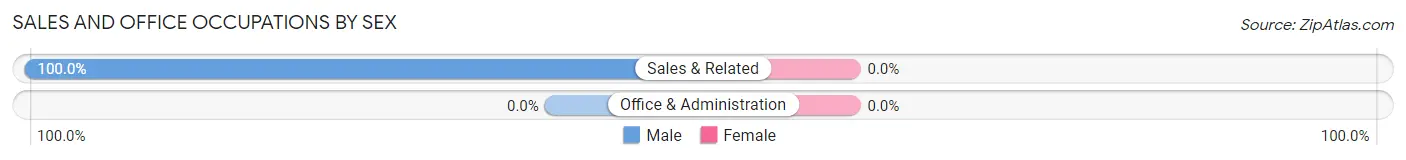
Sales and Office Occupations
The most common Sales and Office occupations in Landess are , and Sales & Related (10 | 15.1%).
Sales and Office Occupations by Sex
| Occupation | Male | Female |
| Sales & Related | 10 (100.0%) | 0 (0.0%) |
| Office & Administration | 0 (0.0%) | 0 (0.0%) |
| Total (Category) | 10 (100.0%) | 0 (0.0%) |
| Total (Overall) | 20 (30.3%) | 46 (69.7%) |
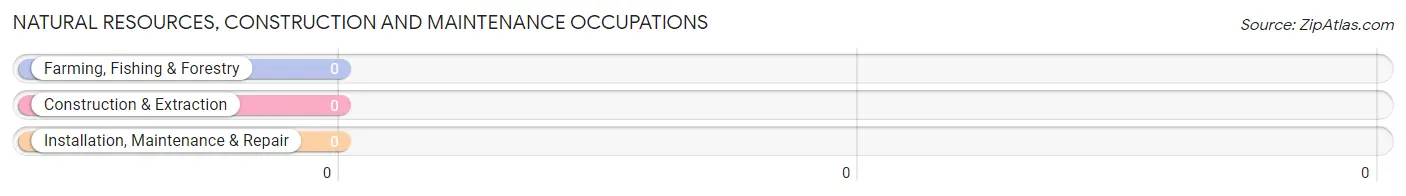
Natural Resources, Construction and Maintenance Occupations
Natural Resources, Construction and Maintenance Occupations by Sex
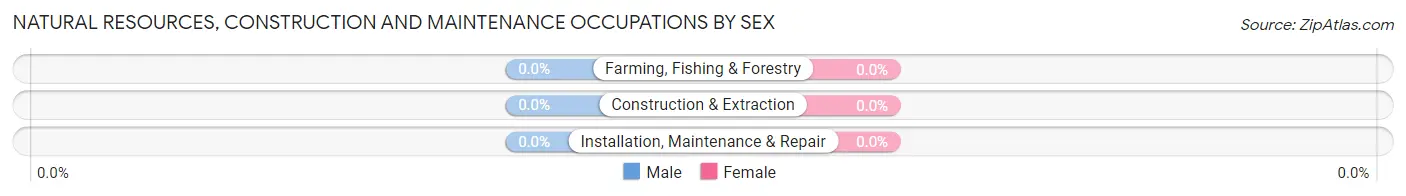
| Occupation | Male | Female |
| Farming, Fishing & Forestry | 0 (0.0%) | 0 (0.0%) |
| Construction & Extraction | 0 (0.0%) | 0 (0.0%) |
| Installation, Maintenance & Repair | 0 (0.0%) | 0 (0.0%) |
| Total (Category) | 0 (0.0%) | 0 (0.0%) |
| Total (Overall) | 20 (30.3%) | 46 (69.7%) |
Production, Transportation and Moving Occupations
The most common Production, Transportation and Moving occupations in Landess are , and Material Moving (9 | 13.6%).
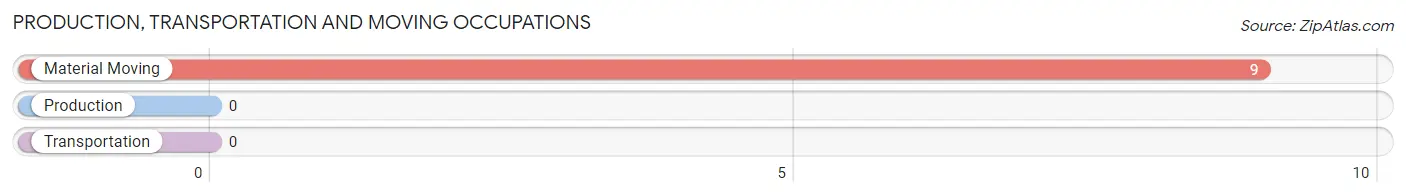
Production, Transportation and Moving Occupations by Sex
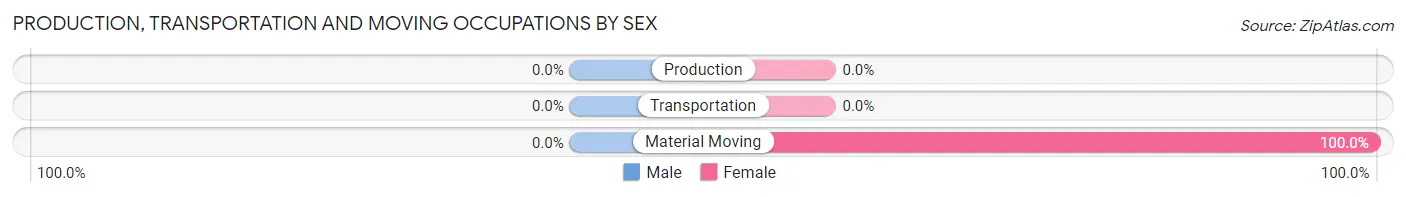
| Occupation | Male | Female |
| Production | 0 (0.0%) | 0 (0.0%) |
| Transportation | 0 (0.0%) | 0 (0.0%) |
| Material Moving | 0 (0.0%) | 9 (100.0%) |
| Total (Category) | 0 (0.0%) | 9 (100.0%) |
| Total (Overall) | 20 (30.3%) | 46 (69.7%) |
Employment Industries by Sex in Landess
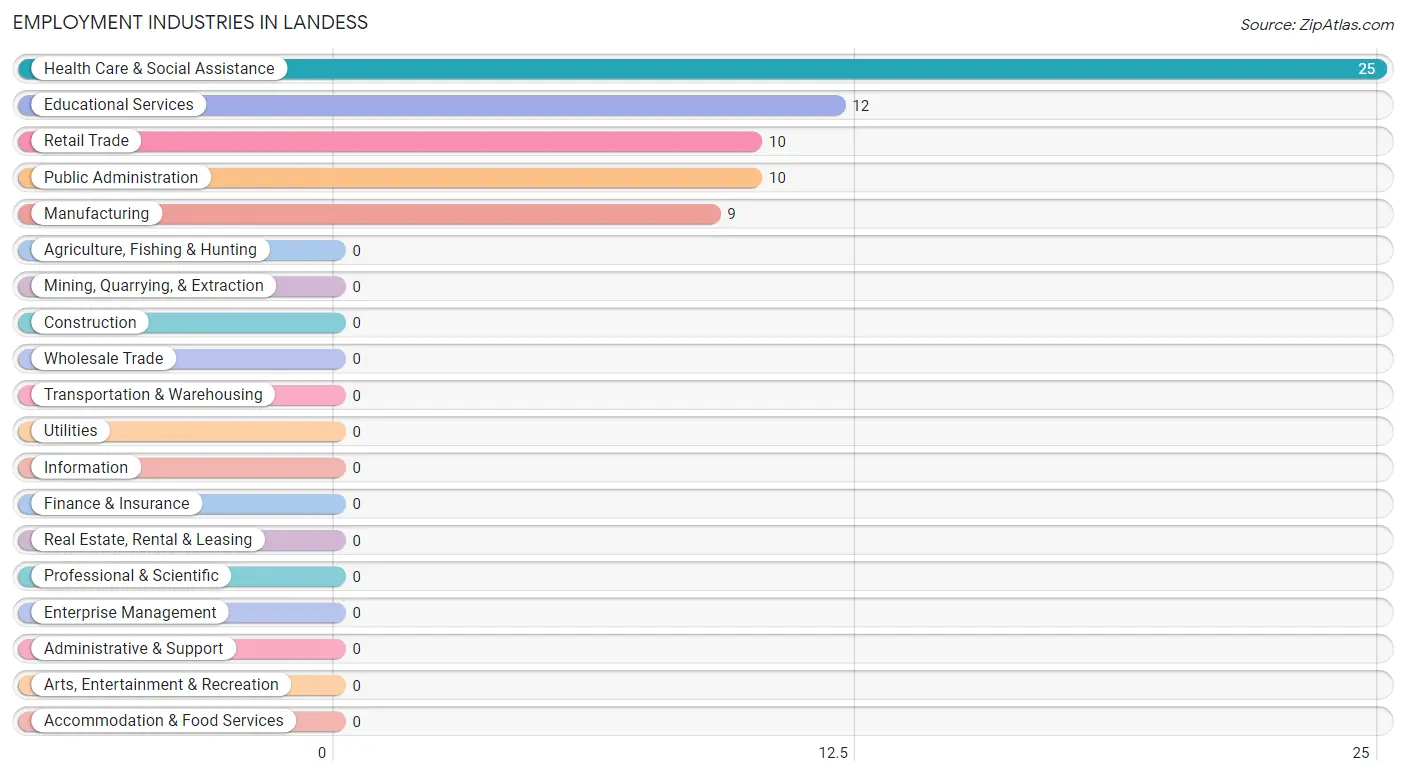
Employment Industries in Landess
The major employment industries in Landess include Health Care & Social Assistance (25 | 37.9%), Educational Services (12 | 18.2%), Retail Trade (10 | 15.1%), Public Administration (10 | 15.1%), and Manufacturing (9 | 13.6%).
Employment Industries by Sex in Landess
The Landess industries that see more men than women are Retail Trade (100.0%), and Public Administration (100.0%), whereas the industries that tend to have a higher number of women are Manufacturing (100.0%), Educational Services (100.0%), and Health Care & Social Assistance (100.0%).
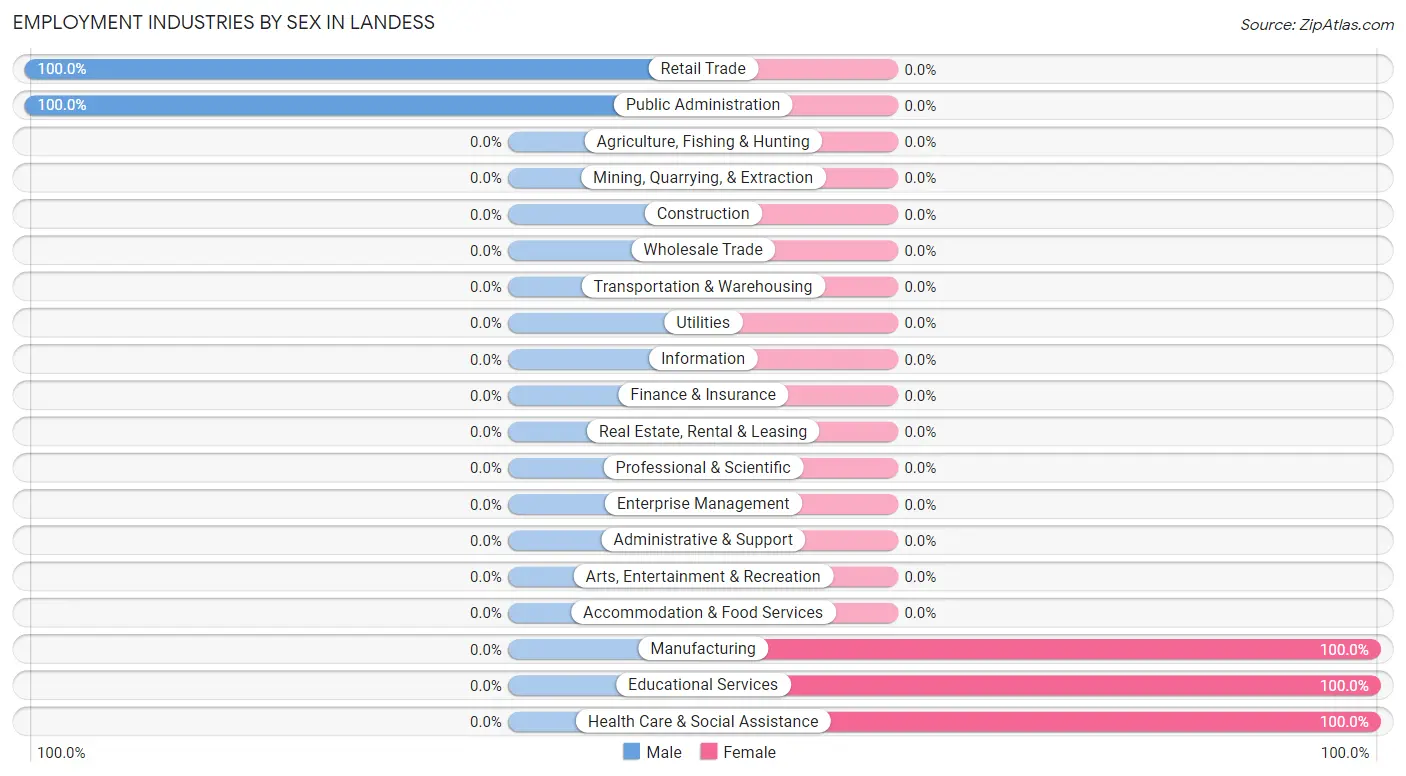
| Industry | Male | Female |
| Agriculture, Fishing & Hunting | 0 (0.0%) | 0 (0.0%) |
| Mining, Quarrying, & Extraction | 0 (0.0%) | 0 (0.0%) |
| Construction | 0 (0.0%) | 0 (0.0%) |
| Manufacturing | 0 (0.0%) | 9 (100.0%) |
| Wholesale Trade | 0 (0.0%) | 0 (0.0%) |
| Retail Trade | 10 (100.0%) | 0 (0.0%) |
| Transportation & Warehousing | 0 (0.0%) | 0 (0.0%) |
| Utilities | 0 (0.0%) | 0 (0.0%) |
| Information | 0 (0.0%) | 0 (0.0%) |
| Finance & Insurance | 0 (0.0%) | 0 (0.0%) |
| Real Estate, Rental & Leasing | 0 (0.0%) | 0 (0.0%) |
| Professional & Scientific | 0 (0.0%) | 0 (0.0%) |
| Enterprise Management | 0 (0.0%) | 0 (0.0%) |
| Administrative & Support | 0 (0.0%) | 0 (0.0%) |
| Educational Services | 0 (0.0%) | 12 (100.0%) |
| Health Care & Social Assistance | 0 (0.0%) | 25 (100.0%) |
| Arts, Entertainment & Recreation | 0 (0.0%) | 0 (0.0%) |
| Accommodation & Food Services | 0 (0.0%) | 0 (0.0%) |
| Public Administration | 10 (100.0%) | 0 (0.0%) |
| Total | 20 (30.3%) | 46 (69.7%) |
Education in Landess
School Enrollment in Landess
The most common levels of schooling among the 23 students in Landess are college / undergraduate (12 | 52.2%), elementary school (6 | 26.1%), and nursery / preschool (5 | 21.7%).
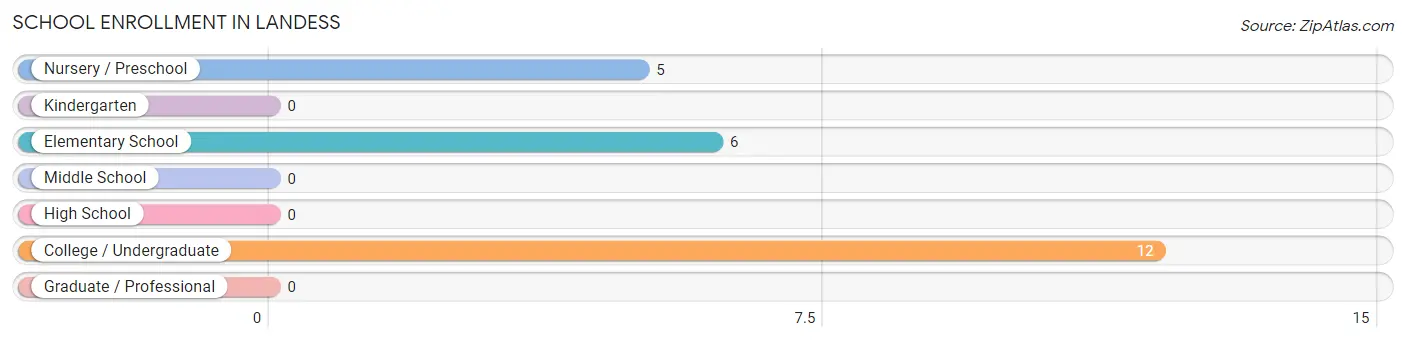
| School Level | # Students | % Students |
| Nursery / Preschool | 5 | 21.7% |
| Kindergarten | 0 | 0.0% |
| Elementary School | 6 | 26.1% |
| Middle School | 0 | 0.0% |
| High School | 0 | 0.0% |
| College / Undergraduate | 12 | 52.2% |
| Graduate / Professional | 0 | 0.0% |
| Total | 23 | 100.0% |
School Enrollment by Age by Funding Source in Landess
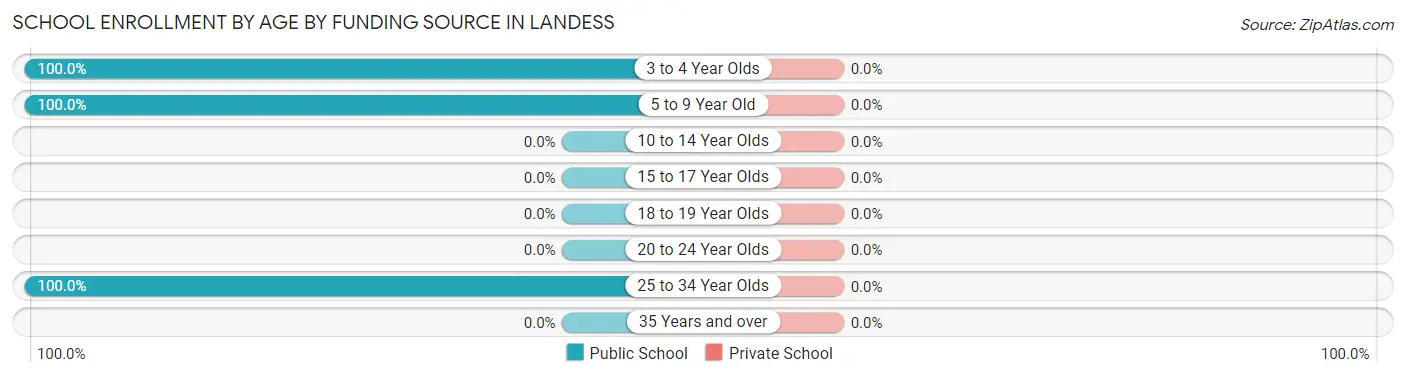
| Age Bracket | Public School | Private School |
| 3 to 4 Year Olds | 5 (100.0%) | 0 (0.0%) |
| 5 to 9 Year Old | 6 (100.0%) | 0 (0.0%) |
| 10 to 14 Year Olds | 0 (0.0%) | 0 (0.0%) |
| 15 to 17 Year Olds | 0 (0.0%) | 0 (0.0%) |
| 18 to 19 Year Olds | 0 (0.0%) | 0 (0.0%) |
| 20 to 24 Year Olds | 0 (0.0%) | 0 (0.0%) |
| 25 to 34 Year Olds | 12 (100.0%) | 0 (0.0%) |
| 35 Years and over | 0 (0.0%) | 0 (0.0%) |
| Total | 23 (100.0%) | 0 (0.0%) |
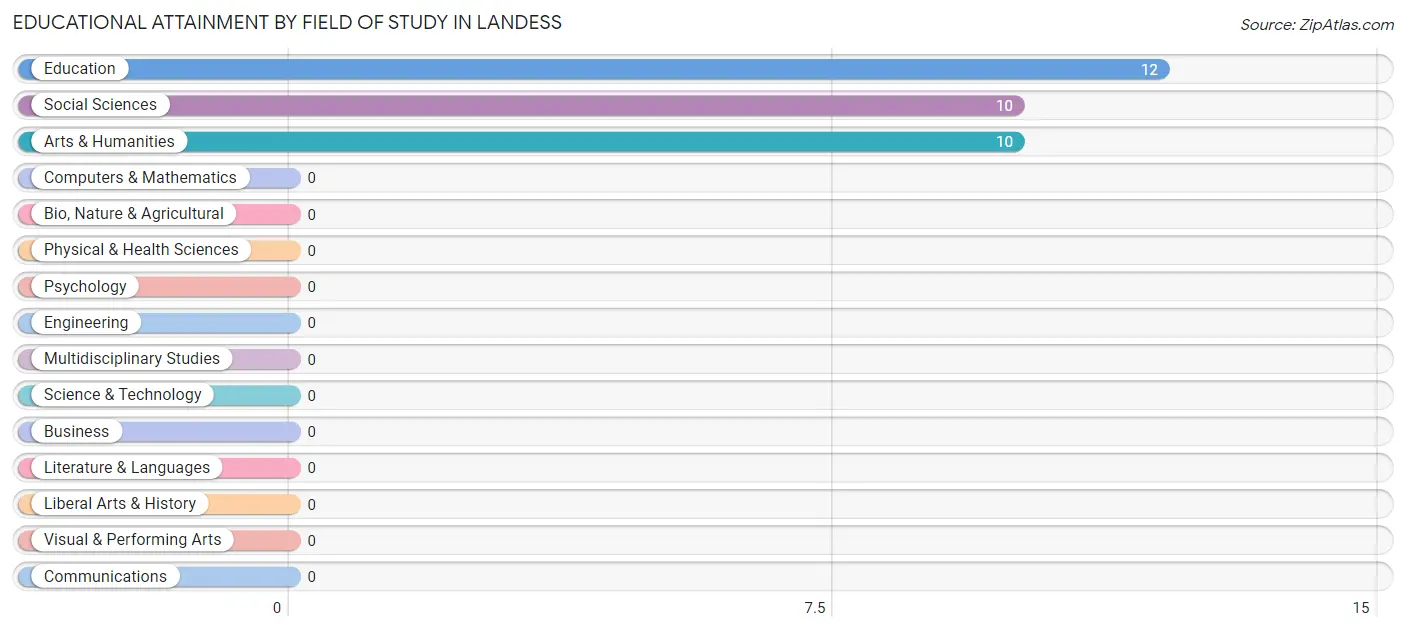
Educational Attainment by Field of Study in Landess
Education (12 | 37.5%), social sciences (10 | 31.2%), and arts & humanities (10 | 31.2%) are the most common fields of study among 32 individuals in Landess who have obtained a bachelor's degree or higher.
| Field of Study | # Graduates | % Graduates |
| Computers & Mathematics | 0 | 0.0% |
| Bio, Nature & Agricultural | 0 | 0.0% |
| Physical & Health Sciences | 0 | 0.0% |
| Psychology | 0 | 0.0% |
| Social Sciences | 10 | 31.2% |
| Engineering | 0 | 0.0% |
| Multidisciplinary Studies | 0 | 0.0% |
| Science & Technology | 0 | 0.0% |
| Business | 0 | 0.0% |
| Education | 12 | 37.5% |
| Literature & Languages | 0 | 0.0% |
| Liberal Arts & History | 0 | 0.0% |
| Visual & Performing Arts | 0 | 0.0% |
| Communications | 0 | 0.0% |
| Arts & Humanities | 10 | 31.2% |
| Total | 32 | 100.0% |
Transportation & Commute in Landess
Vehicle Availability by Sex in Landess
The most prevalent vehicle ownership categories in Landess are males with 2 vehicles (10, accounting for 50.0%) and females with 2 vehicles (12, making up 47.6%).
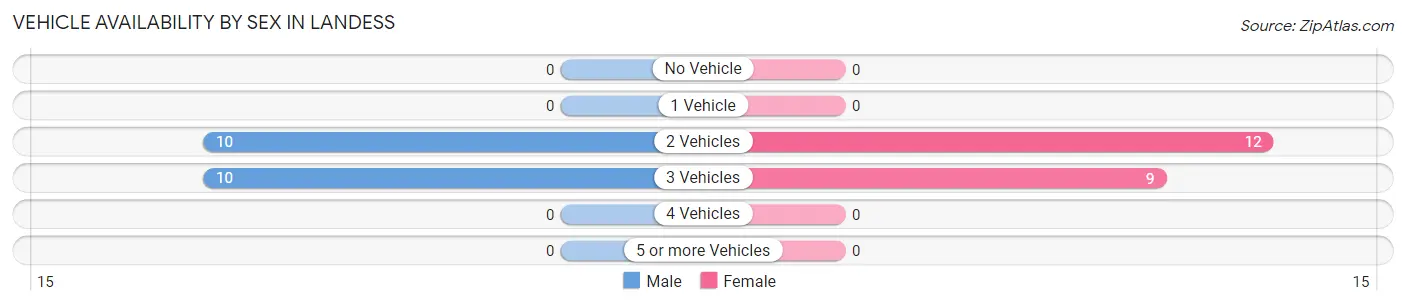
| Vehicles Available | Male | Female |
| No Vehicle | 0 (0.0%) | 0 (0.0%) |
| 1 Vehicle | 0 (0.0%) | 0 (0.0%) |
| 2 Vehicles | 10 (50.0%) | 12 (57.1%) |
| 3 Vehicles | 10 (50.0%) | 9 (42.9%) |
| 4 Vehicles | 0 (0.0%) | 0 (0.0%) |
| 5 or more Vehicles | 0 (0.0%) | 0 (0.0%) |
| Total | 20 (100.0%) | 21 (100.0%) |
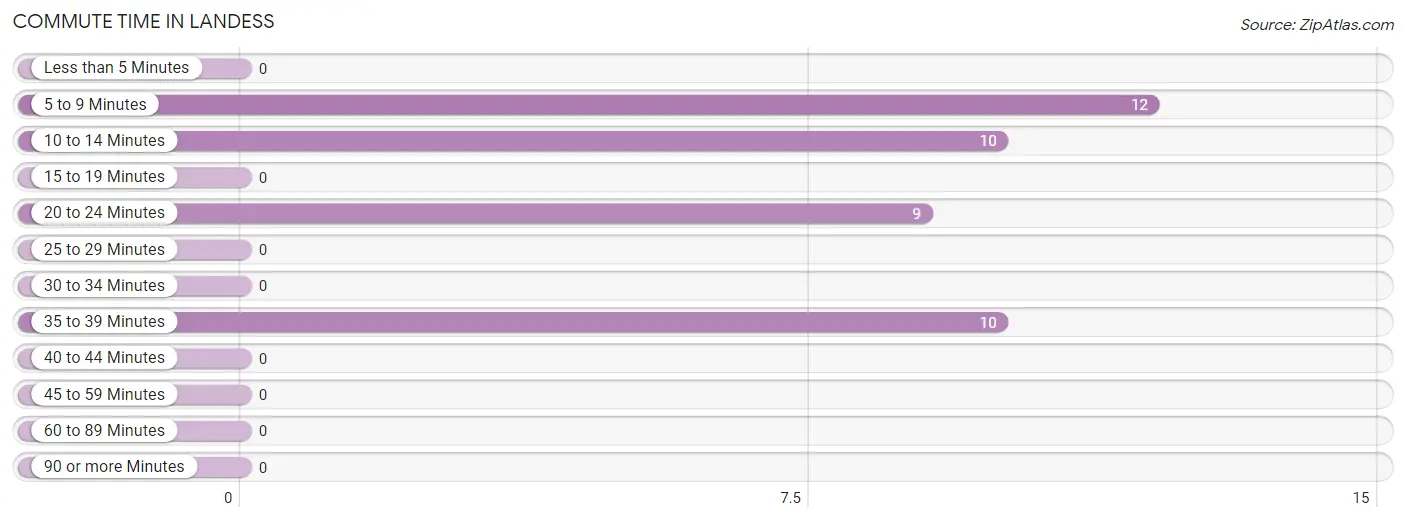
Commute Time in Landess
The most frequently occuring commute durations in Landess are 5 to 9 minutes (12 commuters, 29.3%), 10 to 14 minutes (10 commuters, 24.4%), and 35 to 39 minutes (10 commuters, 24.4%).
| Commute Time | # Commuters | % Commuters |
| Less than 5 Minutes | 0 | 0.0% |
| 5 to 9 Minutes | 12 | 29.3% |
| 10 to 14 Minutes | 10 | 24.4% |
| 15 to 19 Minutes | 0 | 0.0% |
| 20 to 24 Minutes | 9 | 22.0% |
| 25 to 29 Minutes | 0 | 0.0% |
| 30 to 34 Minutes | 0 | 0.0% |
| 35 to 39 Minutes | 10 | 24.4% |
| 40 to 44 Minutes | 0 | 0.0% |
| 45 to 59 Minutes | 0 | 0.0% |
| 60 to 89 Minutes | 0 | 0.0% |
| 90 or more Minutes | 0 | 0.0% |
Commute Time by Sex in Landess
The most common commute times in Landess are 10 to 14 minutes (10 commuters, 50.0%) for males and 5 to 9 minutes (12 commuters, 57.1%) for females.
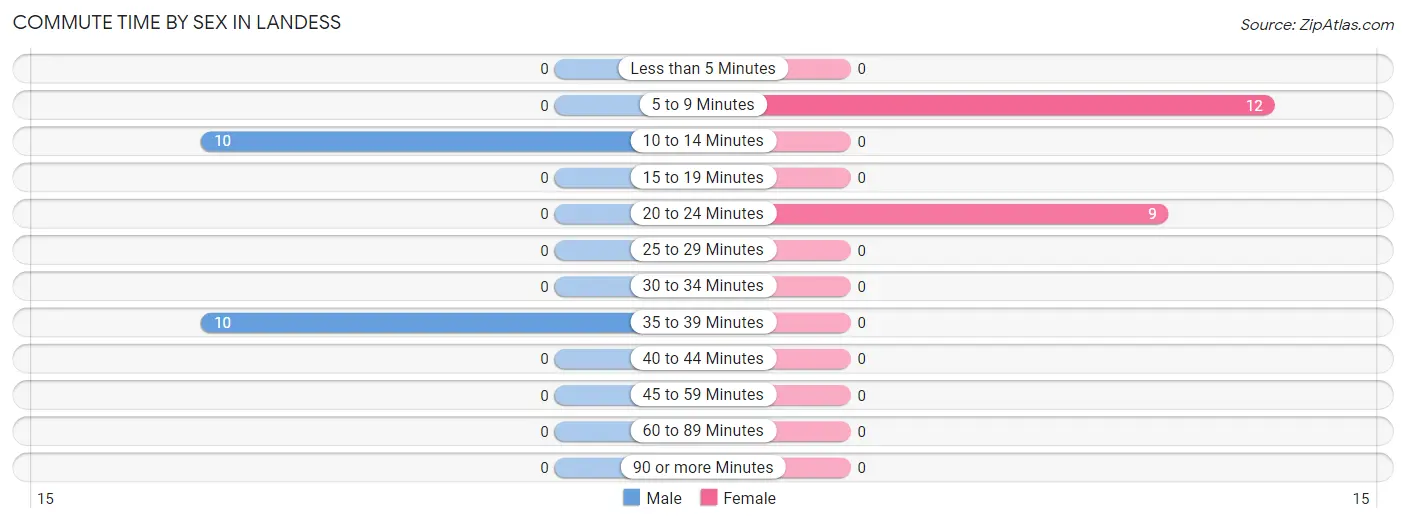
| Commute Time | Male | Female |
| Less than 5 Minutes | 0 (0.0%) | 0 (0.0%) |
| 5 to 9 Minutes | 0 (0.0%) | 12 (57.1%) |
| 10 to 14 Minutes | 10 (50.0%) | 0 (0.0%) |
| 15 to 19 Minutes | 0 (0.0%) | 0 (0.0%) |
| 20 to 24 Minutes | 0 (0.0%) | 9 (42.9%) |
| 25 to 29 Minutes | 0 (0.0%) | 0 (0.0%) |
| 30 to 34 Minutes | 0 (0.0%) | 0 (0.0%) |
| 35 to 39 Minutes | 10 (50.0%) | 0 (0.0%) |
| 40 to 44 Minutes | 0 (0.0%) | 0 (0.0%) |
| 45 to 59 Minutes | 0 (0.0%) | 0 (0.0%) |
| 60 to 89 Minutes | 0 (0.0%) | 0 (0.0%) |
| 90 or more Minutes | 0 (0.0%) | 0 (0.0%) |
Time of Departure to Work by Sex in Landess
The most frequent times of departure to work in Landess are 7:00 AM to 7:29 AM (10, 50.0%) for males and 7:00 AM to 7:29 AM (21, 100.0%) for females.
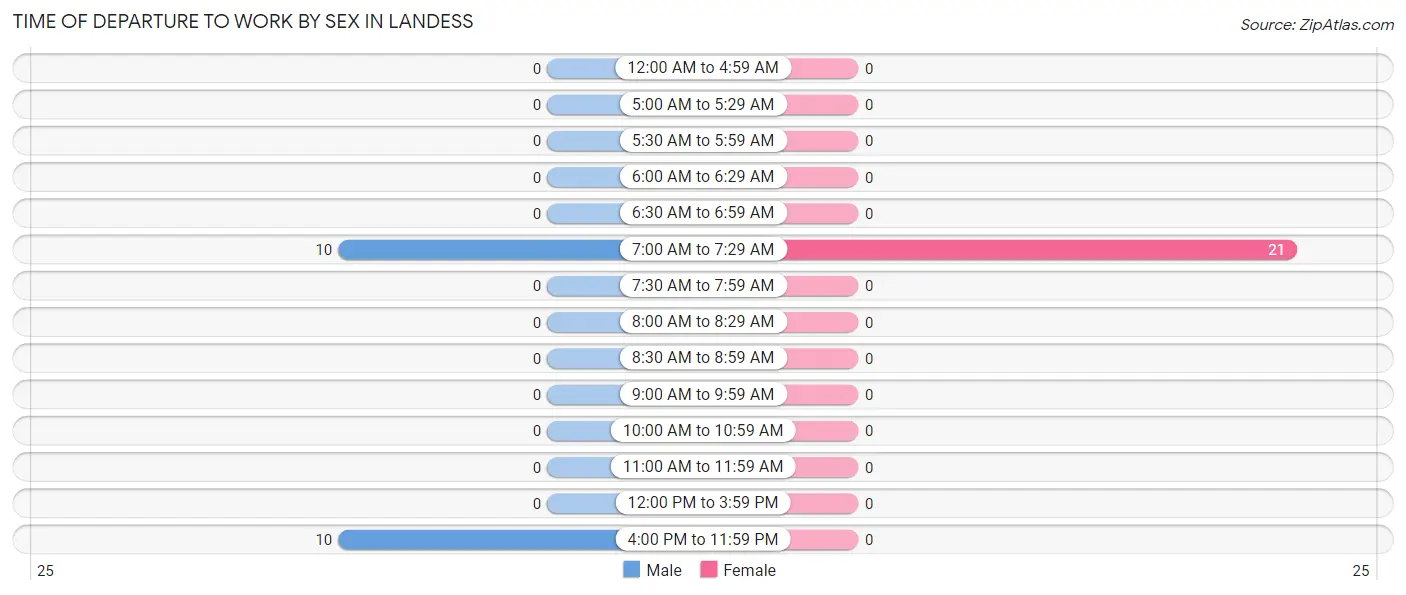
| Time of Departure | Male | Female |
| 12:00 AM to 4:59 AM | 0 (0.0%) | 0 (0.0%) |
| 5:00 AM to 5:29 AM | 0 (0.0%) | 0 (0.0%) |
| 5:30 AM to 5:59 AM | 0 (0.0%) | 0 (0.0%) |
| 6:00 AM to 6:29 AM | 0 (0.0%) | 0 (0.0%) |
| 6:30 AM to 6:59 AM | 0 (0.0%) | 0 (0.0%) |
| 7:00 AM to 7:29 AM | 10 (50.0%) | 21 (100.0%) |
| 7:30 AM to 7:59 AM | 0 (0.0%) | 0 (0.0%) |
| 8:00 AM to 8:29 AM | 0 (0.0%) | 0 (0.0%) |
| 8:30 AM to 8:59 AM | 0 (0.0%) | 0 (0.0%) |
| 9:00 AM to 9:59 AM | 0 (0.0%) | 0 (0.0%) |
| 10:00 AM to 10:59 AM | 0 (0.0%) | 0 (0.0%) |
| 11:00 AM to 11:59 AM | 0 (0.0%) | 0 (0.0%) |
| 12:00 PM to 3:59 PM | 0 (0.0%) | 0 (0.0%) |
| 4:00 PM to 11:59 PM | 10 (50.0%) | 0 (0.0%) |
| Total | 20 (100.0%) | 21 (100.0%) |
Housing Occupancy in Landess
Occupancy by Ownership in Landess
Of the total 53 dwellings in Landess, owner-occupied units account for 28 (52.8%), while renter-occupied units make up 25 (47.2%).
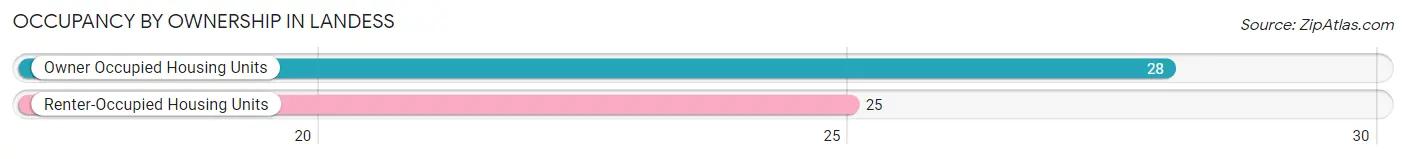
| Occupancy | # Housing Units | % Housing Units |
| Owner Occupied Housing Units | 28 | 52.8% |
| Renter-Occupied Housing Units | 25 | 47.2% |
| Total Occupied Housing Units | 53 | 100.0% |
Occupancy by Household Size in Landess
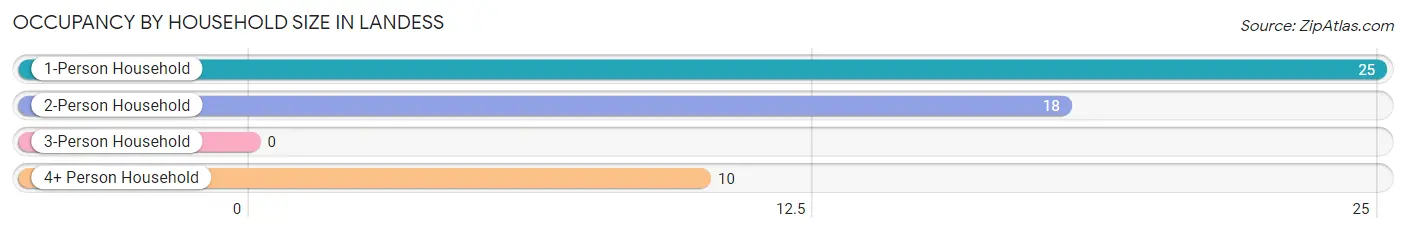
| Household Size | # Housing Units | % Housing Units |
| 1-Person Household | 25 | 47.2% |
| 2-Person Household | 18 | 34.0% |
| 3-Person Household | 0 | 0.0% |
| 4+ Person Household | 10 | 18.9% |
| Total Housing Units | 53 | 100.0% |
Occupancy by Ownership by Household Size in Landess
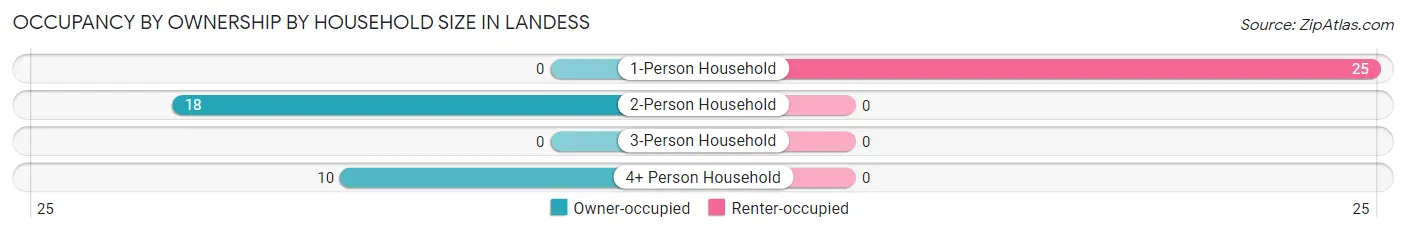
| Household Size | Owner-occupied | Renter-occupied |
| 1-Person Household | 0 (0.0%) | 25 (100.0%) |
| 2-Person Household | 18 (100.0%) | 0 (0.0%) |
| 3-Person Household | 0 (0.0%) | 0 (0.0%) |
| 4+ Person Household | 10 (100.0%) | 0 (0.0%) |
| Total Housing Units | 28 (52.8%) | 25 (47.2%) |
Occupancy by Educational Attainment in Landess
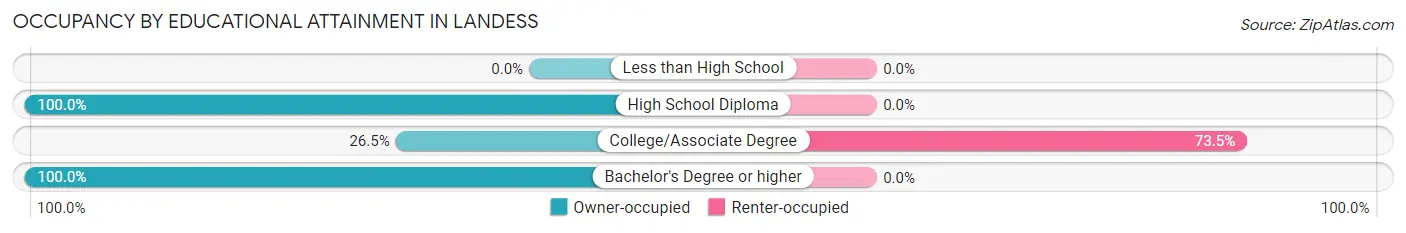
| Household Size | Owner-occupied | Renter-occupied |
| Less than High School | 0 (0.0%) | 0 (0.0%) |
| High School Diploma | 9 (100.0%) | 0 (0.0%) |
| College/Associate Degree | 9 (26.5%) | 25 (73.5%) |
| Bachelor's Degree or higher | 10 (100.0%) | 0 (0.0%) |
Occupancy by Age of Householder in Landess
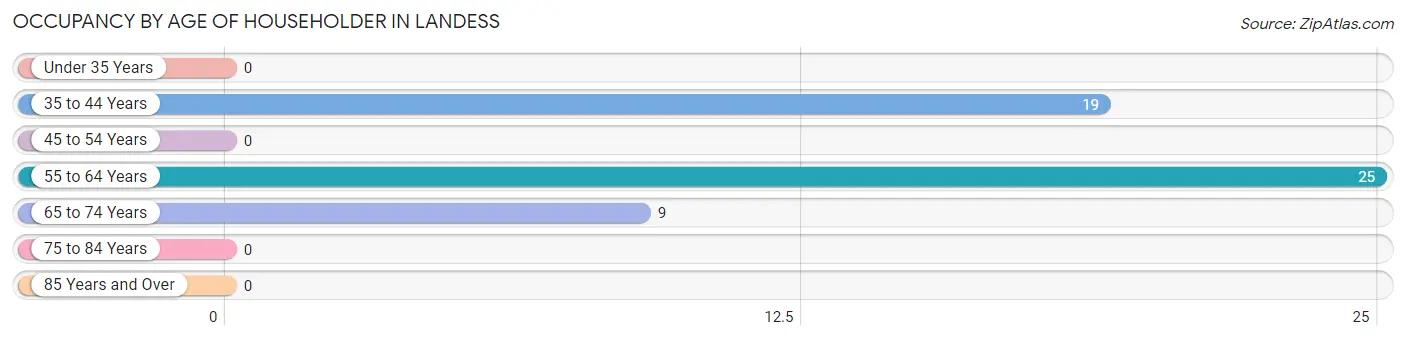
| Age Bracket | # Households | % Households |
| Under 35 Years | 0 | 0.0% |
| 35 to 44 Years | 19 | 35.8% |
| 45 to 54 Years | 0 | 0.0% |
| 55 to 64 Years | 25 | 47.2% |
| 65 to 74 Years | 9 | 17.0% |
| 75 to 84 Years | 0 | 0.0% |
| 85 Years and Over | 0 | 0.0% |
| Total | 53 | 100.0% |
Housing Finances in Landess
Median Income by Occupancy in Landess
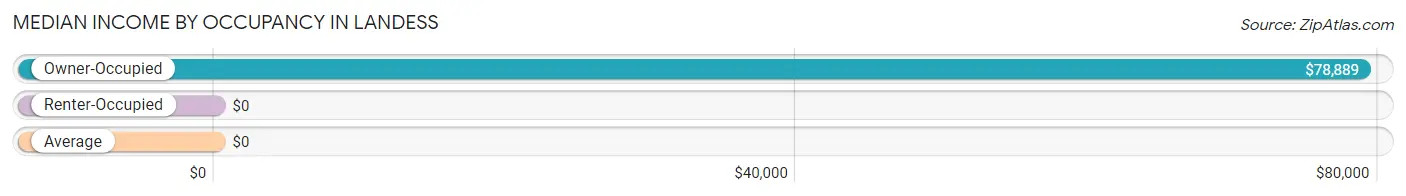
| Occupancy Type | # Households | Median Income |
| Owner-Occupied | 28 (52.8%) | $78,889 |
| Renter-Occupied | 25 (47.2%) | $0 |
| Average | 53 (100.0%) | $0 |
Occupancy by Householder Income Bracket in Landess
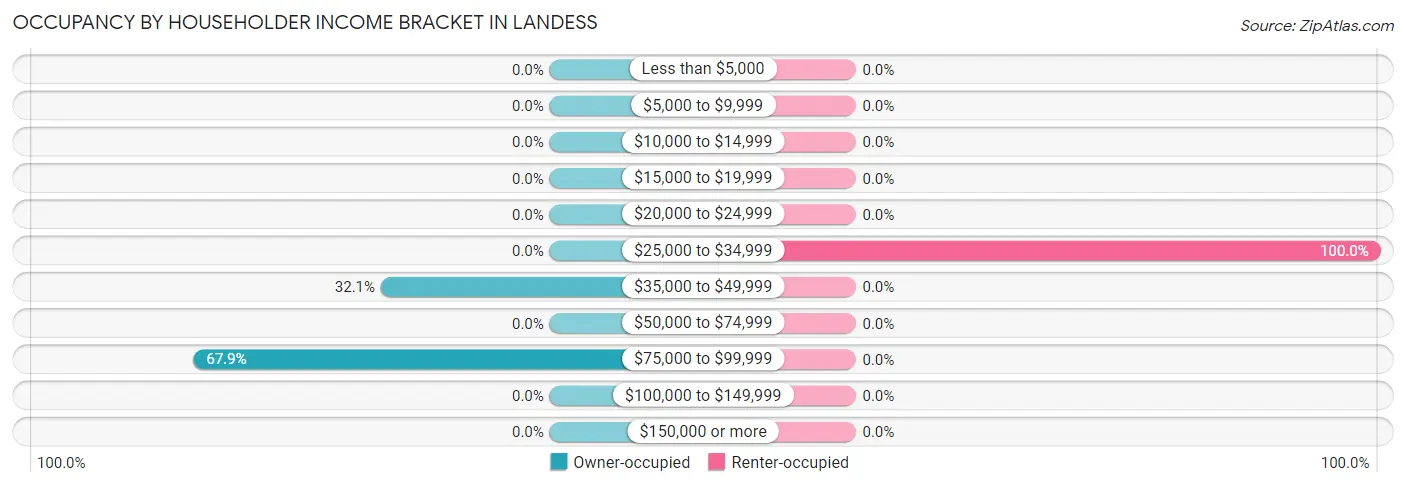
| Income Bracket | Owner-occupied | Renter-occupied |
| Less than $5,000 | 0 (0.0%) | 0 (0.0%) |
| $5,000 to $9,999 | 0 (0.0%) | 0 (0.0%) |
| $10,000 to $14,999 | 0 (0.0%) | 0 (0.0%) |
| $15,000 to $19,999 | 0 (0.0%) | 0 (0.0%) |
| $20,000 to $24,999 | 0 (0.0%) | 0 (0.0%) |
| $25,000 to $34,999 | 0 (0.0%) | 25 (100.0%) |
| $35,000 to $49,999 | 9 (32.1%) | 0 (0.0%) |
| $50,000 to $74,999 | 0 (0.0%) | 0 (0.0%) |
| $75,000 to $99,999 | 19 (67.9%) | 0 (0.0%) |
| $100,000 to $149,999 | 0 (0.0%) | 0 (0.0%) |
| $150,000 or more | 0 (0.0%) | 0 (0.0%) |
| Total | 28 (100.0%) | 25 (100.0%) |
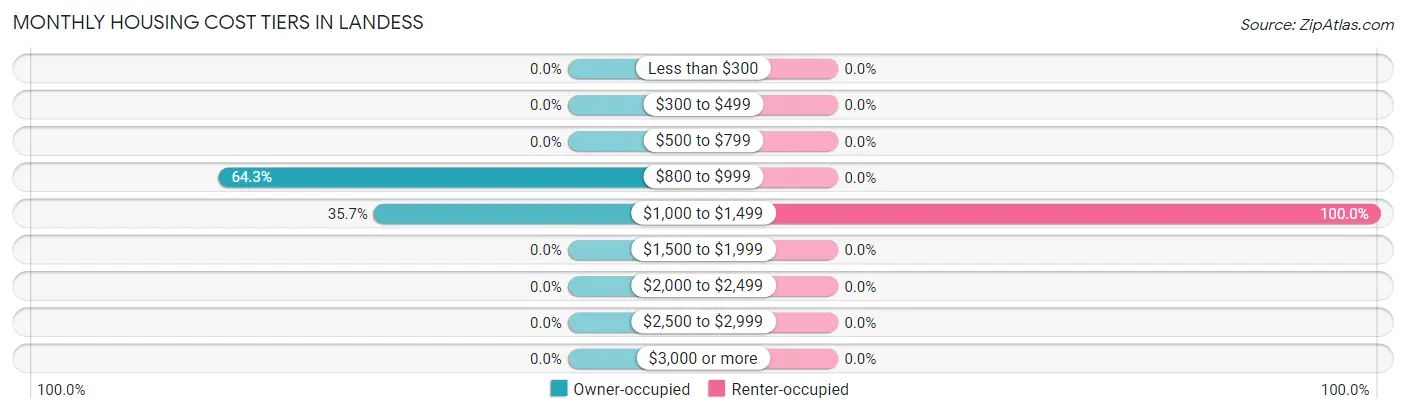
Monthly Housing Cost Tiers in Landess
| Monthly Cost | Owner-occupied | Renter-occupied |
| Less than $300 | 0 (0.0%) | 0 (0.0%) |
| $300 to $499 | 0 (0.0%) | 0 (0.0%) |
| $500 to $799 | 0 (0.0%) | 0 (0.0%) |
| $800 to $999 | 18 (64.3%) | 0 (0.0%) |
| $1,000 to $1,499 | 10 (35.7%) | 25 (100.0%) |
| $1,500 to $1,999 | 0 (0.0%) | 0 (0.0%) |
| $2,000 to $2,499 | 0 (0.0%) | 0 (0.0%) |
| $2,500 to $2,999 | 0 (0.0%) | 0 (0.0%) |
| $3,000 or more | 0 (0.0%) | 0 (0.0%) |
| Total | 28 (100.0%) | 25 (100.0%) |
Physical Housing Characteristics in Landess
Housing Structures in Landess
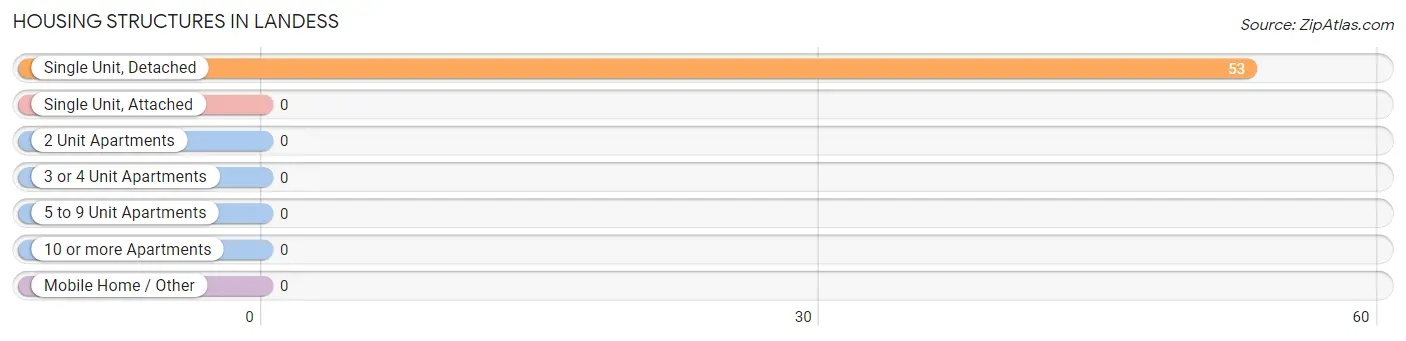
| Structure Type | # Housing Units | % Housing Units |
| Single Unit, Detached | 53 | 100.0% |
| Single Unit, Attached | 0 | 0.0% |
| 2 Unit Apartments | 0 | 0.0% |
| 3 or 4 Unit Apartments | 0 | 0.0% |
| 5 to 9 Unit Apartments | 0 | 0.0% |
| 10 or more Apartments | 0 | 0.0% |
| Mobile Home / Other | 0 | 0.0% |
| Total | 53 | 100.0% |
Housing Structures by Occupancy in Landess
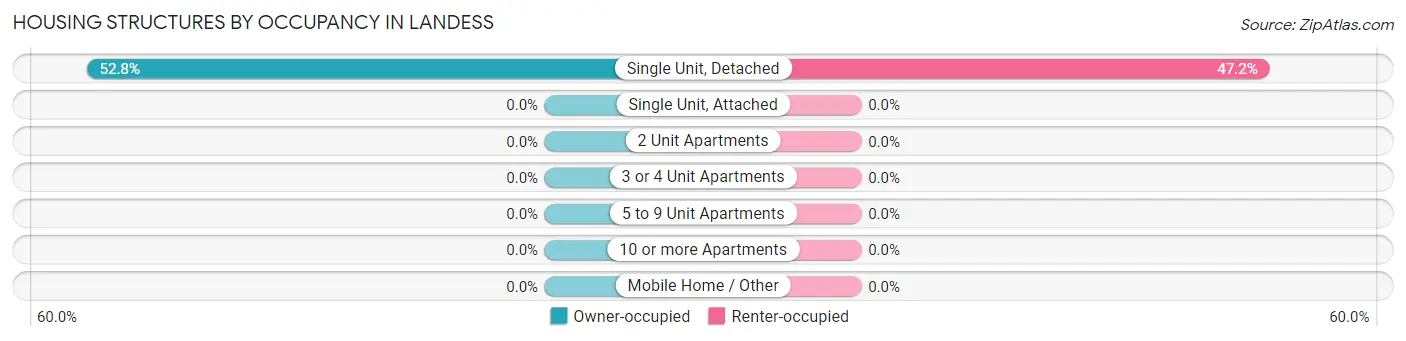
| Structure Type | Owner-occupied | Renter-occupied |
| Single Unit, Detached | 28 (52.8%) | 25 (47.2%) |
| Single Unit, Attached | 0 (0.0%) | 0 (0.0%) |
| 2 Unit Apartments | 0 (0.0%) | 0 (0.0%) |
| 3 or 4 Unit Apartments | 0 (0.0%) | 0 (0.0%) |
| 5 to 9 Unit Apartments | 0 (0.0%) | 0 (0.0%) |
| 10 or more Apartments | 0 (0.0%) | 0 (0.0%) |
| Mobile Home / Other | 0 (0.0%) | 0 (0.0%) |
| Total | 28 (52.8%) | 25 (47.2%) |
Housing Structures by Number of Rooms in Landess
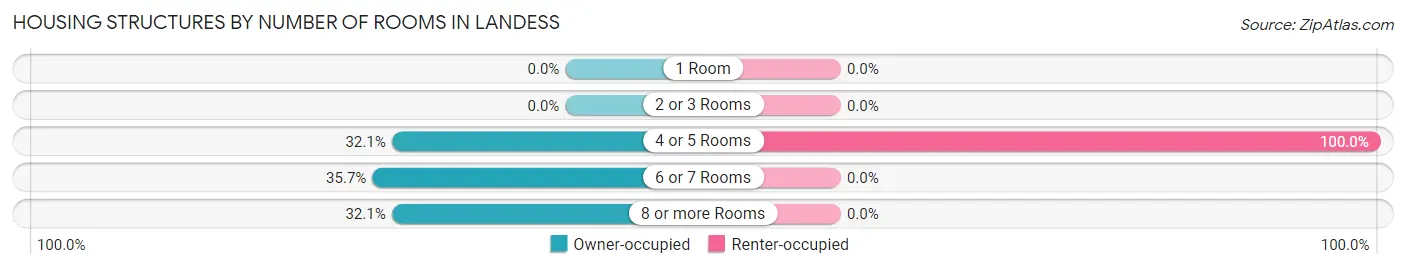
| Number of Rooms | Owner-occupied | Renter-occupied |
| 1 Room | 0 (0.0%) | 0 (0.0%) |
| 2 or 3 Rooms | 0 (0.0%) | 0 (0.0%) |
| 4 or 5 Rooms | 9 (32.1%) | 25 (100.0%) |
| 6 or 7 Rooms | 10 (35.7%) | 0 (0.0%) |
| 8 or more Rooms | 9 (32.1%) | 0 (0.0%) |
| Total | 28 (100.0%) | 25 (100.0%) |
Housing Structure by Heating Type in Landess
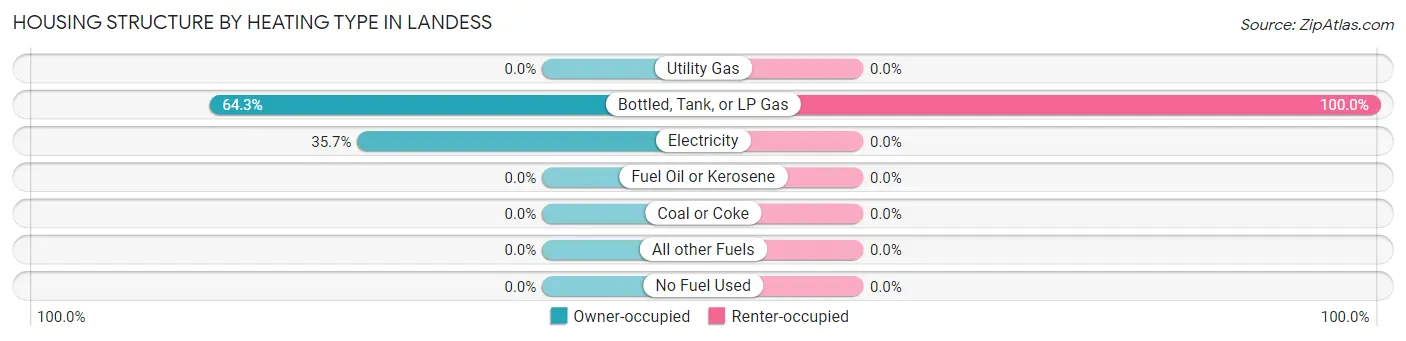
| Heating Type | Owner-occupied | Renter-occupied |
| Utility Gas | 0 (0.0%) | 0 (0.0%) |
| Bottled, Tank, or LP Gas | 18 (64.3%) | 25 (100.0%) |
| Electricity | 10 (35.7%) | 0 (0.0%) |
| Fuel Oil or Kerosene | 0 (0.0%) | 0 (0.0%) |
| Coal or Coke | 0 (0.0%) | 0 (0.0%) |
| All other Fuels | 0 (0.0%) | 0 (0.0%) |
| No Fuel Used | 0 (0.0%) | 0 (0.0%) |
| Total | 28 (100.0%) | 25 (100.0%) |
Household Vehicle Usage in Landess

| Vehicles per Household | Owner-occupied | Renter-occupied |
| No Vehicle | 0 (0.0%) | 0 (0.0%) |
| 1 Vehicle | 0 (0.0%) | 25 (100.0%) |
| 2 Vehicles | 19 (67.9%) | 0 (0.0%) |
| 3 or more Vehicles | 9 (32.1%) | 0 (0.0%) |
| Total | 28 (100.0%) | 25 (100.0%) |
Real Estate & Mortgages in Landess
Real Estate and Mortgage Overview in Landess
| Characteristic | Without Mortgage | With Mortgage |
| Housing Units | 0 | 28 |
| Median Property Value | - | - |
| Median Household Income | - | - |
| Monthly Housing Costs | - | - |
| Real Estate Taxes | - | - |
Property Value by Mortgage Status in Landess
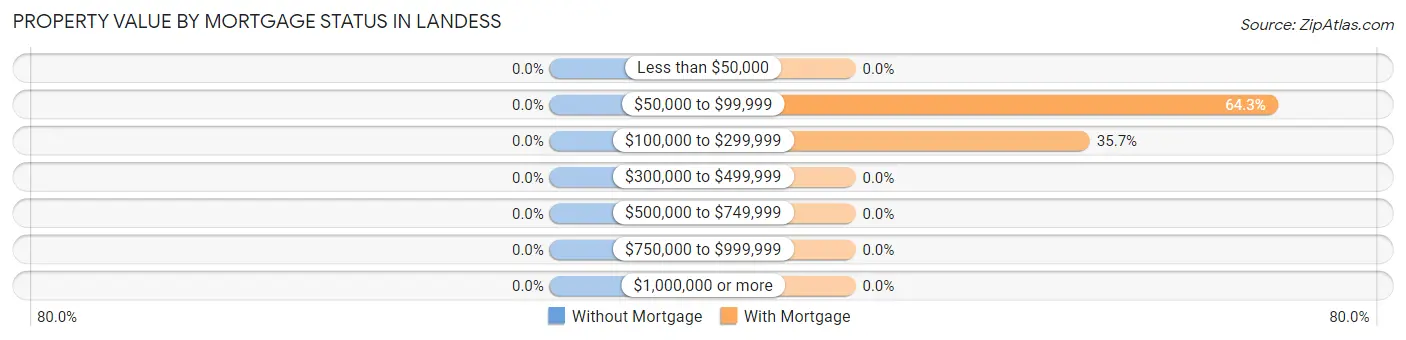
| Property Value | Without Mortgage | With Mortgage |
| Less than $50,000 | 0 (0.0%) | 0 (0.0%) |
| $50,000 to $99,999 | 0 (0.0%) | 18 (64.3%) |
| $100,000 to $299,999 | 0 (0.0%) | 10 (35.7%) |
| $300,000 to $499,999 | 0 (0.0%) | 0 (0.0%) |
| $500,000 to $749,999 | 0 (0.0%) | 0 (0.0%) |
| $750,000 to $999,999 | 0 (0.0%) | 0 (0.0%) |
| $1,000,000 or more | 0 (0.0%) | 0 (0.0%) |
| Total | 0 (0.0%) | 28 (100.0%) |
Household Income by Mortgage Status in Landess
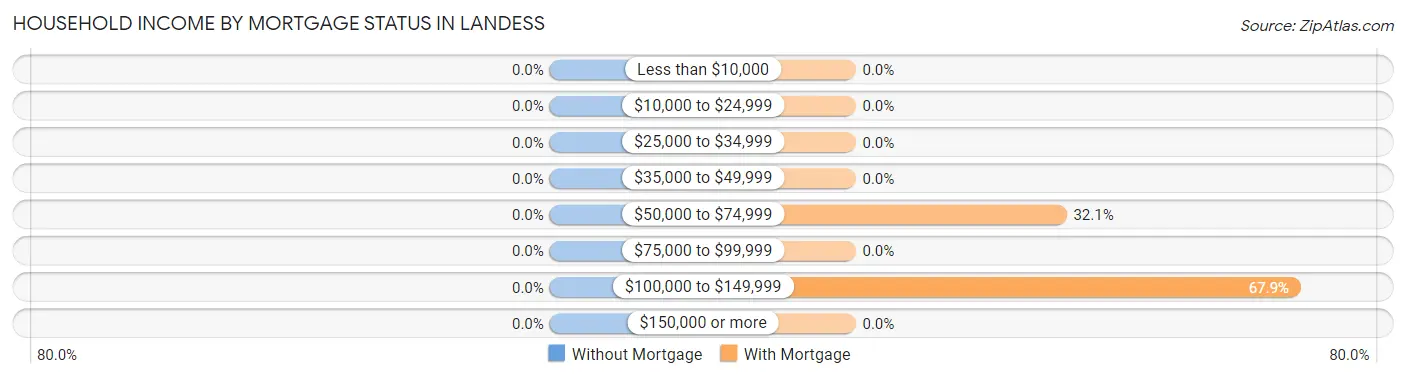
| Household Income | Without Mortgage | With Mortgage |
| Less than $10,000 | 0 (0.0%) | 0 (0.0%) |
| $10,000 to $24,999 | 0 (0.0%) | 0 (0.0%) |
| $25,000 to $34,999 | 0 (0.0%) | 0 (0.0%) |
| $35,000 to $49,999 | 0 (0.0%) | 0 (0.0%) |
| $50,000 to $74,999 | 0 (0.0%) | 9 (32.1%) |
| $75,000 to $99,999 | 0 (0.0%) | 0 (0.0%) |
| $100,000 to $149,999 | 0 (0.0%) | 19 (67.9%) |
| $150,000 or more | 0 (0.0%) | 0 (0.0%) |
| Total | 0 (0.0%) | 28 (100.0%) |
Property Value to Household Income Ratio in Landess

| Value-to-Income Ratio | Without Mortgage | With Mortgage |
| Less than 2.0x | 0 (0.0%) | 78,889 (281,746.4%) |
| 2.0x to 2.9x | 0 (0.0%) | 18 (64.3%) |
| 3.0x to 3.9x | 0 (0.0%) | 0 (0.0%) |
| 4.0x or more | 0 (0.0%) | 10 (35.7%) |
| Total | 0 (0.0%) | 28 (100.0%) |
Real Estate Taxes by Mortgage Status in Landess
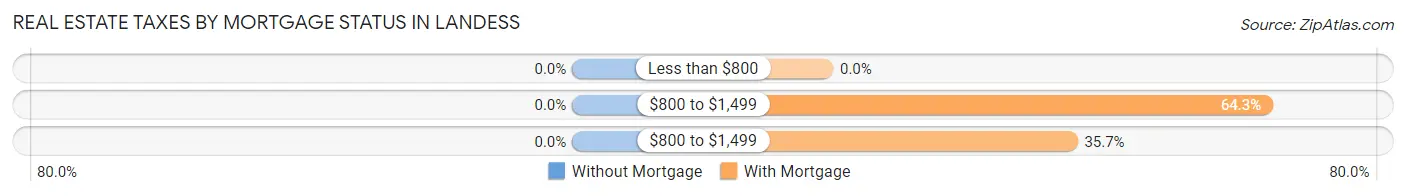
| Property Taxes | Without Mortgage | With Mortgage |
| Less than $800 | 0 (0.0%) | 0 (0.0%) |
| $800 to $1,499 | 0 (0.0%) | 18 (64.3%) |
| $800 to $1,499 | 0 (0.0%) | 10 (35.7%) |
| Total | 0 (0.0%) | 28 (100.0%) |
Health & Disability in Landess
Health Insurance Coverage by Age in Landess
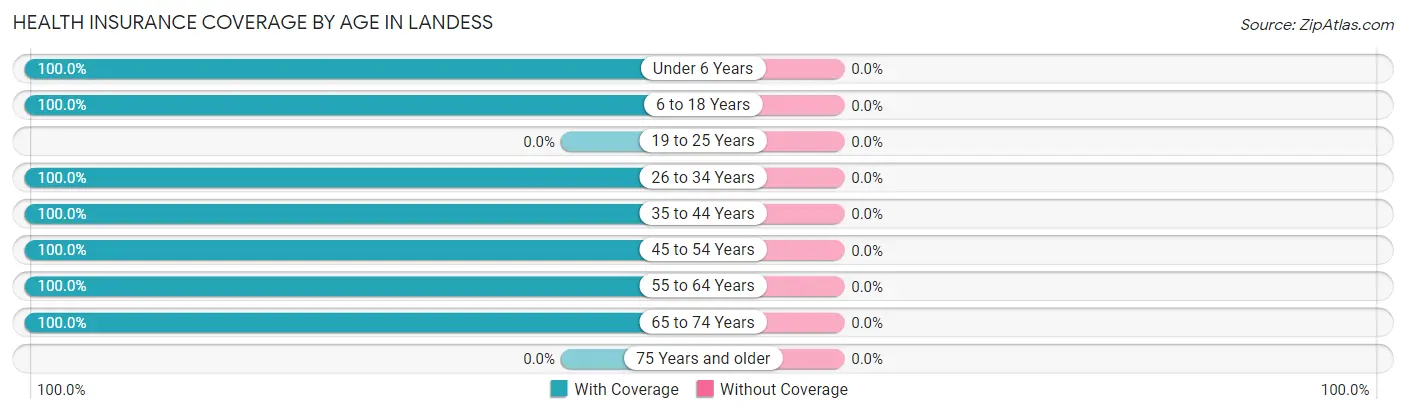
| Age Bracket | With Coverage | Without Coverage |
| Under 6 Years | 5 (100.0%) | 0 (0.0%) |
| 6 to 18 Years | 6 (100.0%) | 0 (0.0%) |
| 19 to 25 Years | 0 (0.0%) | 0 (0.0%) |
| 26 to 34 Years | 12 (100.0%) | 0 (0.0%) |
| 35 to 44 Years | 19 (100.0%) | 0 (0.0%) |
| 45 to 54 Years | 10 (100.0%) | 0 (0.0%) |
| 55 to 64 Years | 25 (100.0%) | 0 (0.0%) |
| 65 to 74 Years | 17 (100.0%) | 0 (0.0%) |
| 75 Years and older | 0 (0.0%) | 0 (0.0%) |
| Total | 94 (100.0%) | 0 (0.0%) |
Health Insurance Coverage by Citizenship Status in Landess
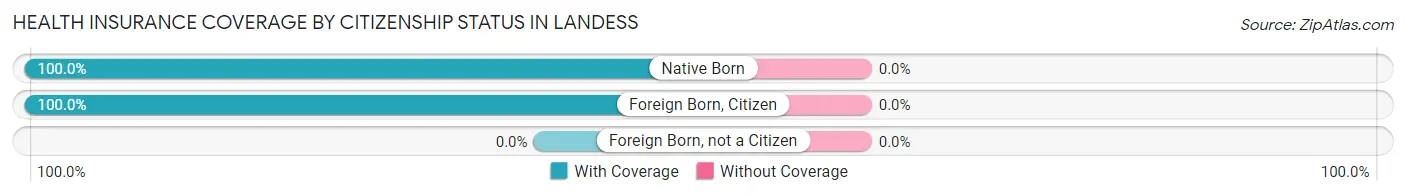
| Citizenship Status | With Coverage | Without Coverage |
| Native Born | 5 (100.0%) | 0 (0.0%) |
| Foreign Born, Citizen | 6 (100.0%) | 0 (0.0%) |
| Foreign Born, not a Citizen | 0 (0.0%) | 0 (0.0%) |
Health Insurance Coverage by Household Income in Landess
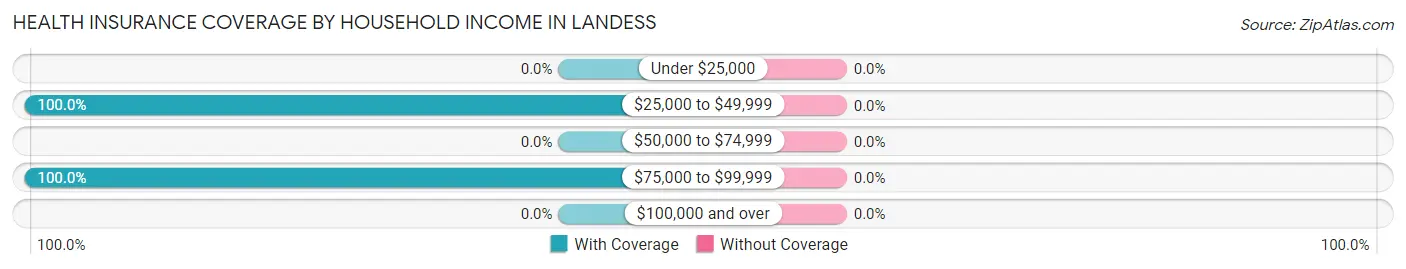
| Household Income | With Coverage | Without Coverage |
| Under $25,000 | 0 (0.0%) | 0 (0.0%) |
| $25,000 to $49,999 | 42 (100.0%) | 0 (0.0%) |
| $50,000 to $74,999 | 0 (0.0%) | 0 (0.0%) |
| $75,000 to $99,999 | 52 (100.0%) | 0 (0.0%) |
| $100,000 and over | 0 (0.0%) | 0 (0.0%) |
Public vs Private Health Insurance Coverage by Age in Landess
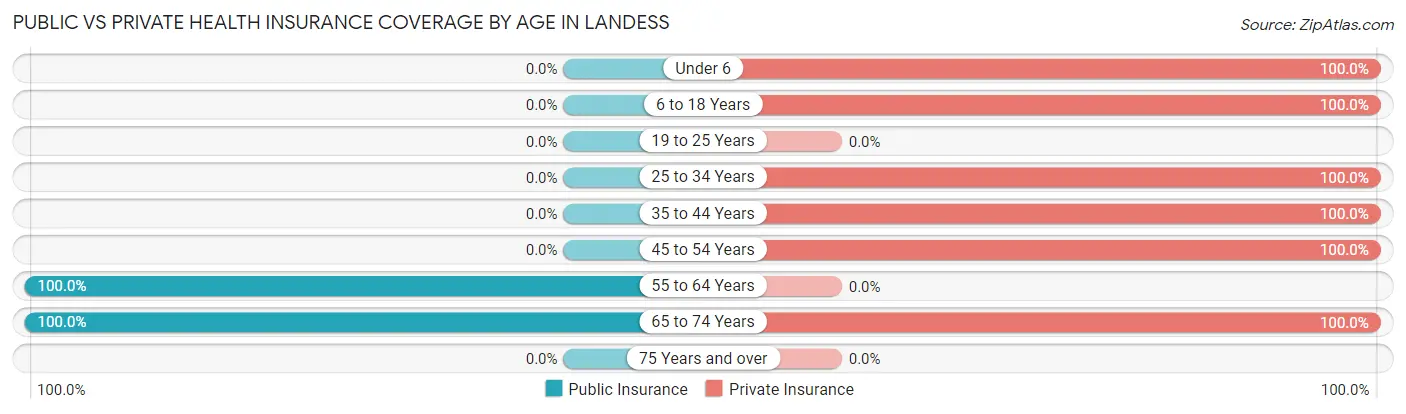
| Age Bracket | Public Insurance | Private Insurance |
| Under 6 | 0 (0.0%) | 5 (100.0%) |
| 6 to 18 Years | 0 (0.0%) | 6 (100.0%) |
| 19 to 25 Years | 0 (0.0%) | 0 (0.0%) |
| 25 to 34 Years | 0 (0.0%) | 12 (100.0%) |
| 35 to 44 Years | 0 (0.0%) | 19 (100.0%) |
| 45 to 54 Years | 0 (0.0%) | 10 (100.0%) |
| 55 to 64 Years | 25 (100.0%) | 0 (0.0%) |
| 65 to 74 Years | 17 (100.0%) | 17 (100.0%) |
| 75 Years and over | 0 (0.0%) | 0 (0.0%) |
| Total | 42 (44.7%) | 69 (73.4%) |
Disability Status by Sex by Age in Landess
| Age Bracket | Male | Female |
| Under 5 Years | 0 (0.0%) | 0 (0.0%) |
| 5 to 17 Years | 0 (0.0%) | 0 (0.0%) |
| 18 to 34 Years | 0 (0.0%) | 0 (0.0%) |
| 35 to 64 Years | 0 (0.0%) | 0 (0.0%) |
| 65 to 74 Years | 0 (0.0%) | 0 (0.0%) |
| 75 Years and over | 0 (0.0%) | 0 (0.0%) |
Disability Class by Sex by Age in Landess
Disability Class: Hearing Difficulty
| Age Bracket | Male | Female |
| Under 5 Years | 0 (0.0%) | 0 (0.0%) |
| 5 to 17 Years | 0 (0.0%) | 0 (0.0%) |
| 18 to 34 Years | 0 (0.0%) | 0 (0.0%) |
| 35 to 64 Years | 0 (0.0%) | 0 (0.0%) |
| 65 to 74 Years | 0 (0.0%) | 0 (0.0%) |
| 75 Years and over | 0 (0.0%) | 0 (0.0%) |
Disability Class: Vision Difficulty
| Age Bracket | Male | Female |
| Under 5 Years | 0 (0.0%) | 0 (0.0%) |
| 5 to 17 Years | 0 (0.0%) | 0 (0.0%) |
| 18 to 34 Years | 0 (0.0%) | 0 (0.0%) |
| 35 to 64 Years | 0 (0.0%) | 0 (0.0%) |
| 65 to 74 Years | 0 (0.0%) | 0 (0.0%) |
| 75 Years and over | 0 (0.0%) | 0 (0.0%) |
Disability Class: Cognitive Difficulty
| Age Bracket | Male | Female |
| 5 to 17 Years | 0 (0.0%) | 0 (0.0%) |
| 18 to 34 Years | 0 (0.0%) | 0 (0.0%) |
| 35 to 64 Years | 0 (0.0%) | 0 (0.0%) |
| 65 to 74 Years | 0 (0.0%) | 0 (0.0%) |
| 75 Years and over | 0 (0.0%) | 0 (0.0%) |
Disability Class: Ambulatory Difficulty
| Age Bracket | Male | Female |
| 5 to 17 Years | 0 (0.0%) | 0 (0.0%) |
| 18 to 34 Years | 0 (0.0%) | 0 (0.0%) |
| 35 to 64 Years | 0 (0.0%) | 0 (0.0%) |
| 65 to 74 Years | 0 (0.0%) | 0 (0.0%) |
| 75 Years and over | 0 (0.0%) | 0 (0.0%) |
Disability Class: Self-Care Difficulty
| Age Bracket | Male | Female |
| 5 to 17 Years | 0 (0.0%) | 0 (0.0%) |
| 18 to 34 Years | 0 (0.0%) | 0 (0.0%) |
| 35 to 64 Years | 0 (0.0%) | 0 (0.0%) |
| 65 to 74 Years | 0 (0.0%) | 0 (0.0%) |
| 75 Years and over | 0 (0.0%) | 0 (0.0%) |
Technology Access in Landess
Computing Device Access in Landess
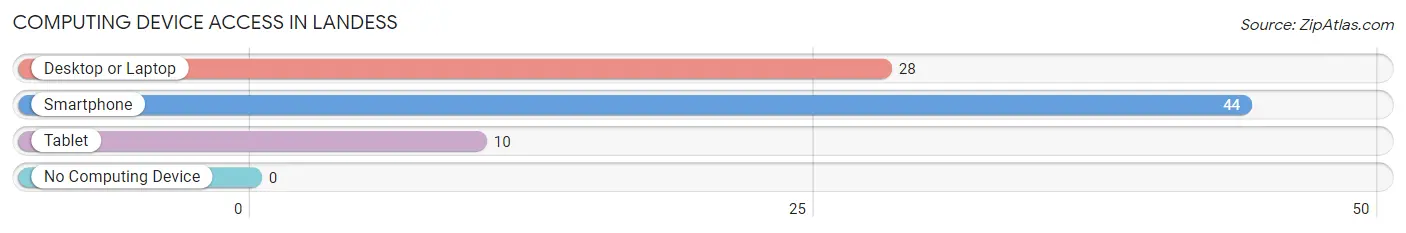
| Device Type | # Households | % Households |
| Desktop or Laptop | 28 | 52.8% |
| Smartphone | 44 | 83.0% |
| Tablet | 10 | 18.9% |
| No Computing Device | 0 | 0.0% |
| Total | 53 | 100.0% |
Internet Access in Landess
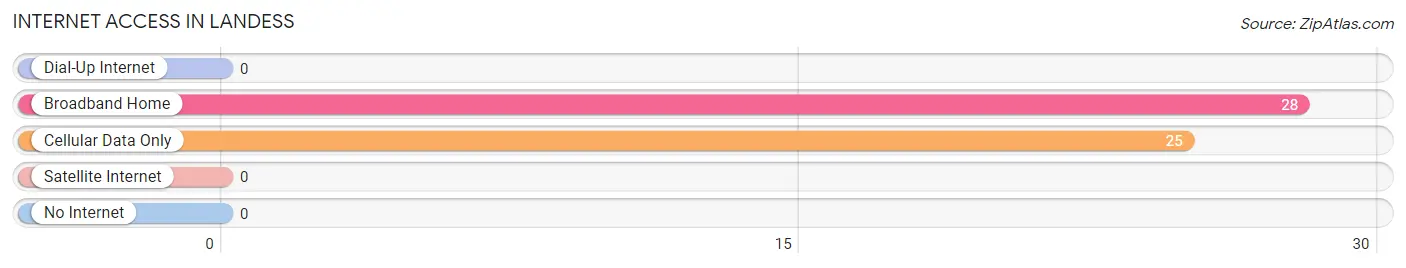
| Internet Type | # Households | % Households |
| Dial-Up Internet | 0 | 0.0% |
| Broadband Home | 28 | 52.8% |
| Cellular Data Only | 25 | 47.2% |
| Satellite Internet | 0 | 0.0% |
| No Internet | 0 | 0.0% |
| Total | 53 | 100.0% |
Landess Summary
INTRODUCTION
Indiana, also known as the Hoosier State, is located in the Midwestern region of the United States. It is the 38th largest state in the country and the 16th most populous. Indiana is bordered by Michigan to the north, Ohio to the east, Kentucky to the south, and Illinois to the west. The capital of Indiana is Indianapolis, which is also the largest city in the state.
HISTORY
Indiana was first inhabited by Native American tribes, including the Miami, Shawnee, and Potawatomi. The first Europeans to explore the area were French fur traders in the late 1600s. In 1763, the area became part of the British Empire after the French and Indian War. After the Revolutionary War, the area was ceded to the United States and became part of the Northwest Territory. In 1800, Indiana became a separate territory and in 1816 it was admitted to the Union as the 19th state.
During the 19th century, Indiana experienced rapid growth and development. The state was a major producer of agricultural products, such as corn, wheat, and livestock. The state also became a major industrial center, with the development of steel mills, automobile factories, and other industries.
In the 20th century, Indiana continued to experience economic growth and development. The state became a major center for the automotive industry, with the development of the Indianapolis Motor Speedway and the Indianapolis 500 race. The state also became a major center for the pharmaceutical industry, with the development of Eli Lilly and Company.
GEOGRAPHY
Indiana is located in the Midwestern region of the United States. It is bordered by Michigan to the north, Ohio to the east, Kentucky to the south, and Illinois to the west. The state has a total area of 36,418 square miles, making it the 38th largest state in the country.
The terrain of Indiana is mostly flat, with rolling hills in the south and central parts of the state. The highest point in the state is Hoosier Hill, which has an elevation of 1,257 feet. The state is divided into two distinct regions: the Central Lowlands and the Interior Low Plateaus. The Central Lowlands are located in the northern and central parts of the state and are characterized by flat plains and rolling hills. The Interior Low Plateaus are located in the southern part of the state and are characterized by rugged hills and deep valleys.
ECONOMY
Indiana has a diverse economy that is driven by manufacturing, agriculture, and services. The state is a major producer of agricultural products, such as corn, wheat, and livestock. The state is also a major producer of industrial products, such as steel, automobiles, and pharmaceuticals.
The state is home to several major corporations, including Eli Lilly and Company, Cummins, and Steel Dynamics. The state is also home to several major universities, including Indiana University, Purdue University, and the University of Notre Dame.
DEMOGRAPHICS
As of 2019, the population of Indiana was 6.7 million, making it the 16th most populous state in the country. The population is mostly concentrated in the cities of Indianapolis, Fort Wayne, and South Bend. The state has a population density of 181 people per square mile, making it the 25th most densely populated state in the country.
The racial makeup of Indiana is 87.2% White, 8.9% Black or African American, 1.3% Asian, 0.3% Native American, and 2.3% from two or more races. The largest ancestry groups in the state are German, Irish, English, and American.
The median household income in Indiana is $54,919, which is slightly lower than the national median of $60,293. The median home value in the state is $142,400, which is slightly higher than the national median of $184,700.
CONCLUSION
Indiana is a state located in the Midwestern region of the United States. It is the 38th largest state in the country and the 16th most populous. The state has a diverse economy that is driven by manufacturing, agriculture, and services. The population of Indiana is mostly concentrated in the cities of Indianapolis, Fort Wayne, and South Bend. The racial makeup of the state is 87.2% White, 8.9% Black or African American, 1.3% Asian, 0.3% Native American, and 2.3% from two or more races. The median household income in Indiana is $54,919, which is slightly lower than the national median.
Common Questions
What is Per Capita Income in Landess?
Per Capita income in Landess is $29,733.
What is Inequality or Gini Index in Landess?
Inequality or Gini Index in Landess is 0.25.
What is the Total Population of Landess?
Total Population of Landess is 94.
What is the Total Male Population of Landess?
Total Male Population of Landess is 34.
What is the Total Female Population of Landess?
Total Female Population of Landess is 60.
What is the Ratio of Males per 100 Females in Landess?
There are 56.67 Males per 100 Females in Landess.
What is the Ratio of Females per 100 Males in Landess?
There are 176.47 Females per 100 Males in Landess.
What is the Median Population Age in Landess?
Median Population Age in Landess is 47.5 Years.
What is the Average Family Size in Landess
Average Family Size in Landess is 2.6 People.
What is the Average Household Size in Landess
Average Household Size in Landess is 1.8 People.
How Large is the Labor Force in Landess?
There are 66 People in the Labor Forcein in Landess.
What is the Percentage of People in the Labor Force in Landess?
79.5% of People are in the Labor Force in Landess.