Miami Springs, FL Map & Demographics
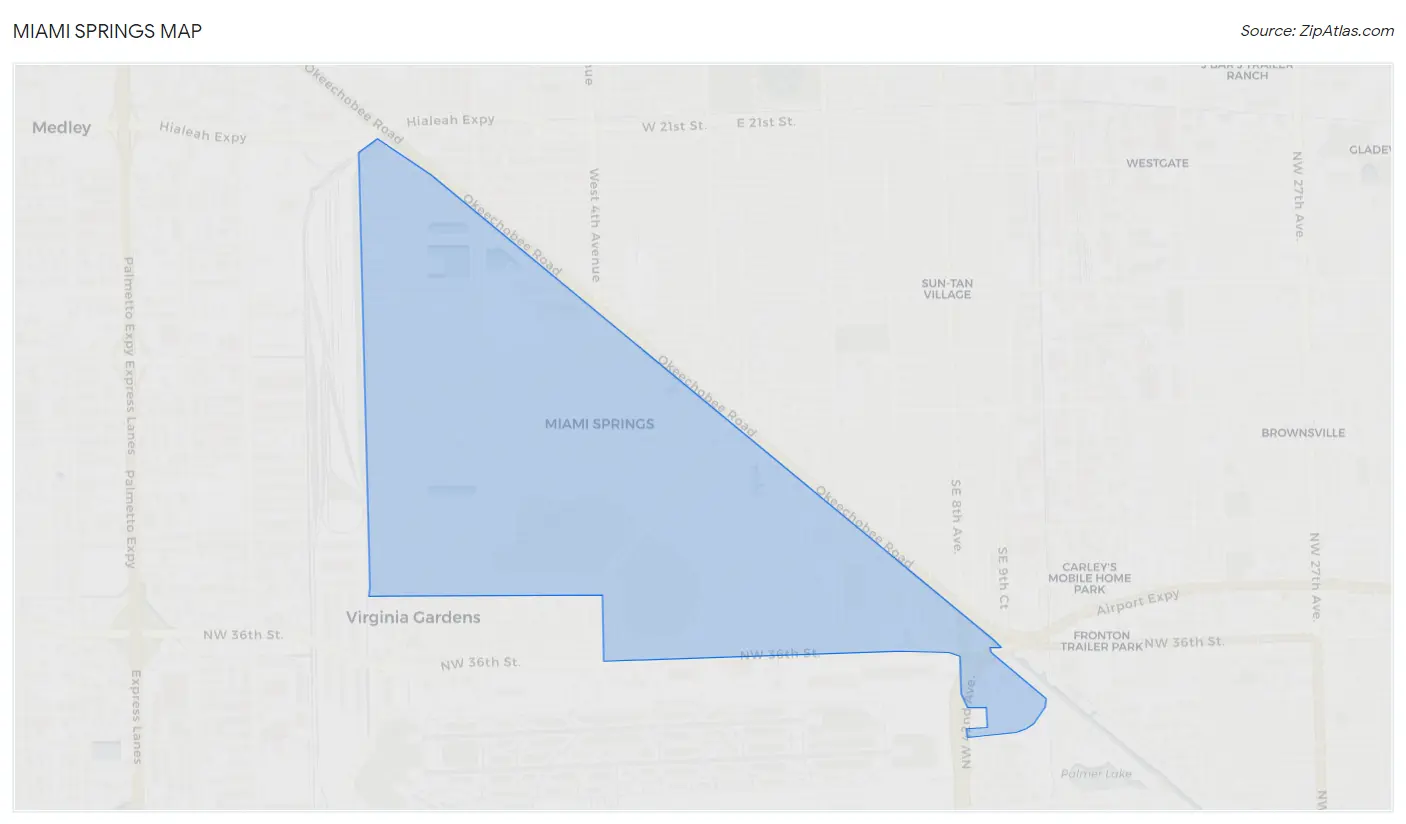
Miami Springs Map
Miami Springs Overview
$49,183
PER CAPITA INCOME
$104,632
AVG FAMILY INCOME
$88,196
AVG HOUSEHOLD INCOME
11.3%
WAGE / INCOME GAP [ % ]
88.7¢/ $1
WAGE / INCOME GAP [ $ ]
0.51
INEQUALITY / GINI INDEX
13,729
TOTAL POPULATION
6,154
MALE POPULATION
7,575
FEMALE POPULATION
81.24
MALES / 100 FEMALES
123.09
FEMALES / 100 MALES
44.5
MEDIAN AGE
3.1
AVG FAMILY SIZE
2.4
AVG HOUSEHOLD SIZE
7,615
LABOR FORCE [ PEOPLE ]
66.3%
PERCENT IN LABOR FORCE
1.3%
UNEMPLOYMENT RATE
Income in Miami Springs
Income Overview in Miami Springs
Per Capita Income in Miami Springs is $49,183, while median incomes of families and households are $104,632 and $88,196 respectively.
| Characteristic | Number | Measure |
| Per Capita Income | 13,729 | $49,183 |
| Median Family Income | 3,330 | $104,632 |
| Mean Family Income | 3,330 | $144,108 |
| Median Household Income | 5,490 | $88,196 |
| Mean Household Income | 5,490 | $119,369 |
| Income Deficit | 3,330 | $0 |
| Wage / Income Gap (%) | 13,729 | 11.26% |
| Wage / Income Gap ($) | 13,729 | 88.74¢ per $1 |
| Gini / Inequality Index | 13,729 | 0.51 |
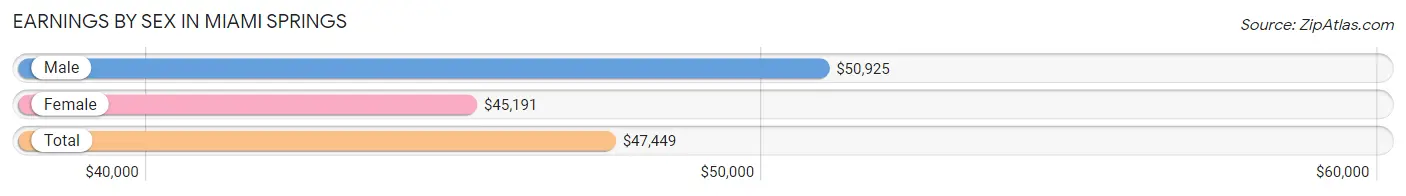
Earnings by Sex in Miami Springs
Average Earnings in Miami Springs are $47,449, $50,925 for men and $45,191 for women, a difference of 11.3%.
| Sex | Number | Average Earnings |
| Male | 4,019 (51.5%) | $50,925 |
| Female | 3,789 (48.5%) | $45,191 |
| Total | 7,808 (100.0%) | $47,449 |
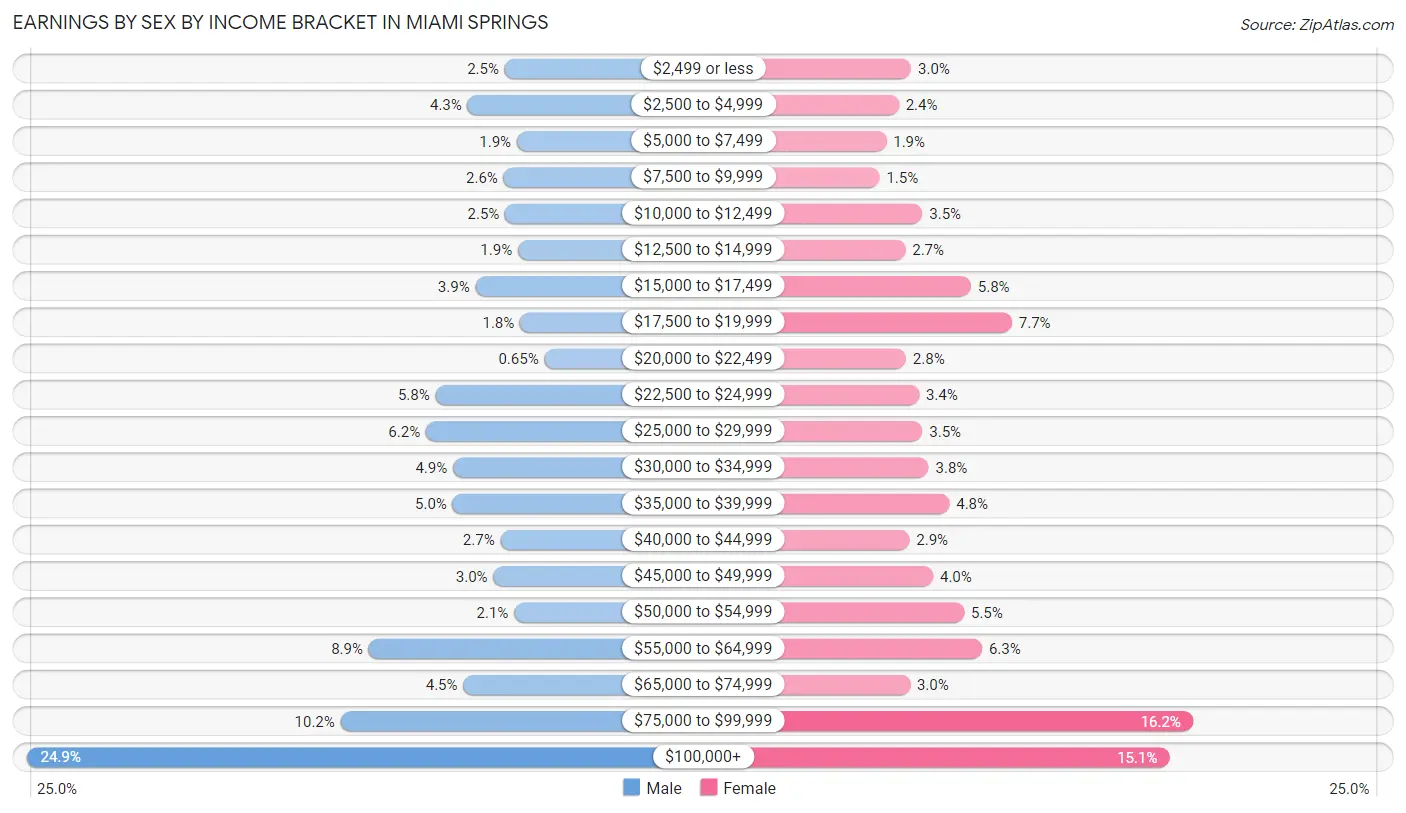
Earnings by Sex by Income Bracket in Miami Springs
The most common earnings brackets in Miami Springs are $100,000+ for men (999 | 24.9%) and $75,000 to $99,999 for women (614 | 16.2%).
| Income | Male | Female |
| $2,499 or less | 101 (2.5%) | 114 (3.0%) |
| $2,500 to $4,999 | 171 (4.3%) | 92 (2.4%) |
| $5,000 to $7,499 | 78 (1.9%) | 70 (1.8%) |
| $7,500 to $9,999 | 103 (2.6%) | 58 (1.5%) |
| $10,000 to $12,499 | 100 (2.5%) | 134 (3.5%) |
| $12,500 to $14,999 | 76 (1.9%) | 104 (2.7%) |
| $15,000 to $17,499 | 156 (3.9%) | 220 (5.8%) |
| $17,500 to $19,999 | 72 (1.8%) | 293 (7.7%) |
| $20,000 to $22,499 | 26 (0.6%) | 105 (2.8%) |
| $22,500 to $24,999 | 231 (5.8%) | 128 (3.4%) |
| $25,000 to $29,999 | 249 (6.2%) | 134 (3.5%) |
| $30,000 to $34,999 | 198 (4.9%) | 145 (3.8%) |
| $35,000 to $39,999 | 199 (5.0%) | 182 (4.8%) |
| $40,000 to $44,999 | 109 (2.7%) | 111 (2.9%) |
| $45,000 to $49,999 | 122 (3.0%) | 153 (4.0%) |
| $50,000 to $54,999 | 83 (2.1%) | 208 (5.5%) |
| $55,000 to $64,999 | 357 (8.9%) | 240 (6.3%) |
| $65,000 to $74,999 | 179 (4.4%) | 112 (3.0%) |
| $75,000 to $99,999 | 410 (10.2%) | 614 (16.2%) |
| $100,000+ | 999 (24.9%) | 572 (15.1%) |
| Total | 4,019 (100.0%) | 3,789 (100.0%) |
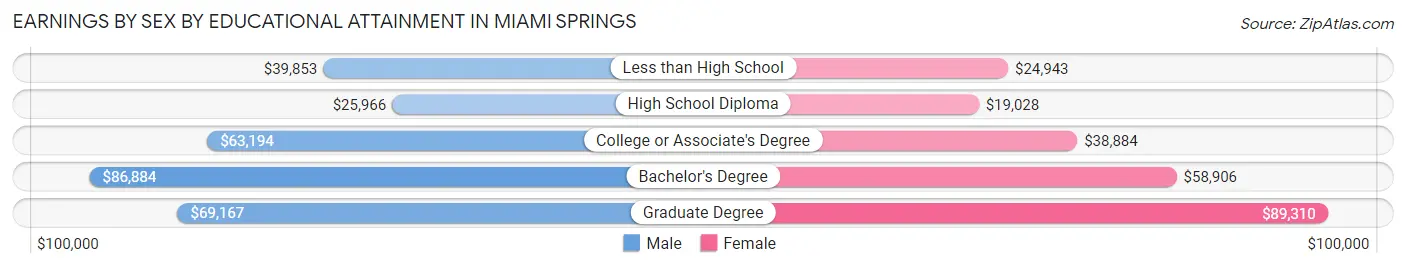
Earnings by Sex by Educational Attainment in Miami Springs
Average earnings in Miami Springs are $58,692 for men and $49,681 for women, a difference of 15.3%. Men with an educational attainment of bachelor's degree enjoy the highest average annual earnings of $86,884, while those with high school diploma education earn the least with $25,966. Women with an educational attainment of graduate degree earn the most with the average annual earnings of $89,310, while those with high school diploma education have the smallest earnings of $19,028.
| Educational Attainment | Male Income | Female Income |
| Less than High School | $39,853 | $24,943 |
| High School Diploma | $25,966 | $19,028 |
| College or Associate's Degree | $63,194 | $38,884 |
| Bachelor's Degree | $86,884 | $58,906 |
| Graduate Degree | $69,167 | $89,310 |
| Total | $58,692 | $49,681 |
Family Income in Miami Springs
Family Income Brackets in Miami Springs
According to the Miami Springs family income data, there are 799 families falling into the $100,000 to $149,999 income range, which is the most common income bracket and makes up 24.0% of all families. Conversely, the $10,000 to $14,999 income bracket is the least frequent group with only 53 families (1.6%) belonging to this category.
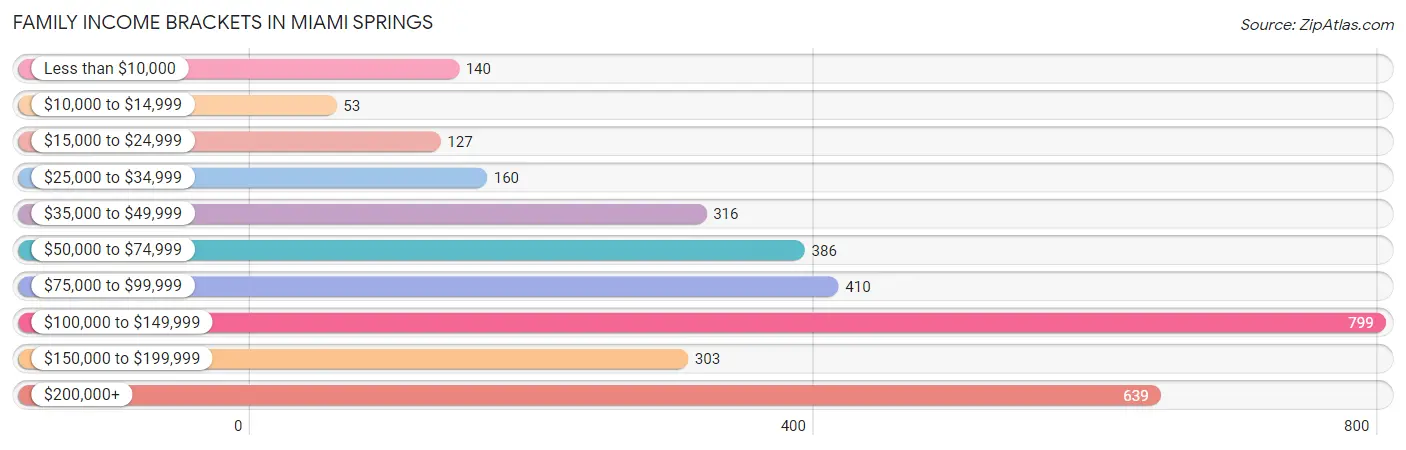
| Income Bracket | # Families | % Families |
| Less than $10,000 | 140 | 4.2% |
| $10,000 to $14,999 | 53 | 1.6% |
| $15,000 to $24,999 | 127 | 3.8% |
| $25,000 to $34,999 | 160 | 4.8% |
| $35,000 to $49,999 | 316 | 9.5% |
| $50,000 to $74,999 | 386 | 11.6% |
| $75,000 to $99,999 | 410 | 12.3% |
| $100,000 to $149,999 | 799 | 24.0% |
| $150,000 to $199,999 | 303 | 9.1% |
| $200,000+ | 639 | 19.2% |
Family Income by Famaliy Size in Miami Springs
4-person families (664 | 19.9%) account for the highest median family income in Miami Springs with $140,530 per family, while 3-person families (786 | 23.6%) have the highest median income of $36,356 per family member.
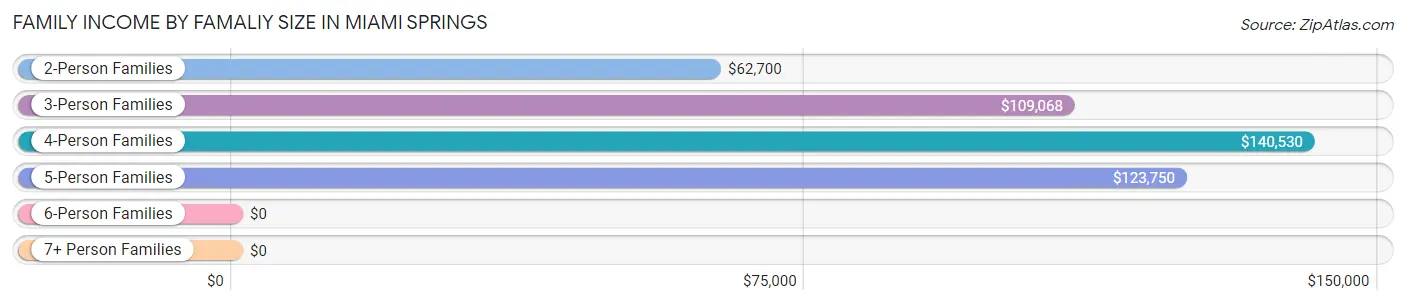
| Income Bracket | # Families | Median Income |
| 2-Person Families | 1,562 (46.9%) | $62,700 |
| 3-Person Families | 786 (23.6%) | $109,068 |
| 4-Person Families | 664 (19.9%) | $140,530 |
| 5-Person Families | 284 (8.5%) | $123,750 |
| 6-Person Families | 19 (0.6%) | $0 |
| 7+ Person Families | 15 (0.4%) | $0 |
| Total | 3,330 (100.0%) | $104,632 |
Family Income by Number of Earners in Miami Springs
The median family income in Miami Springs is $104,632, with families comprising 3+ earners (493) having the highest median family income of $146,375, while families with no earners (323) have the lowest median family income of $22,153, accounting for 14.8% and 9.7% of families, respectively.
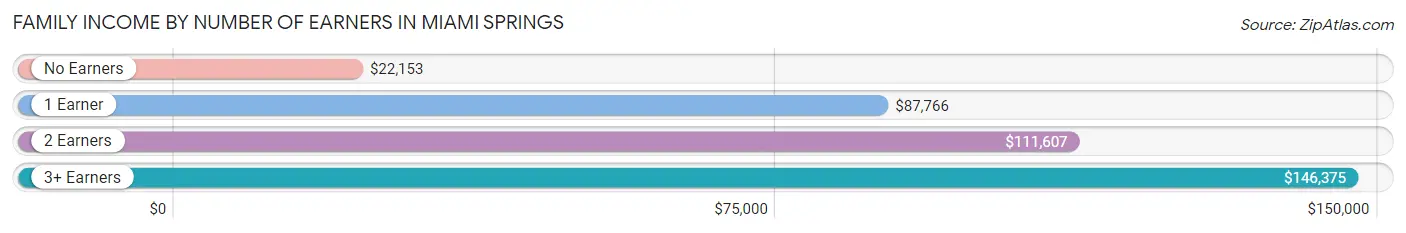
| Number of Earners | # Families | Median Income |
| No Earners | 323 (9.7%) | $22,153 |
| 1 Earner | 1,076 (32.3%) | $87,766 |
| 2 Earners | 1,438 (43.2%) | $111,607 |
| 3+ Earners | 493 (14.8%) | $146,375 |
| Total | 3,330 (100.0%) | $104,632 |
Household Income in Miami Springs
Household Income Brackets in Miami Springs
With 1,329 households falling in the category, the $100,000 to $149,999 income range is the most frequent in Miami Springs, accounting for 24.2% of all households. In contrast, only 165 households (3.0%) fall into the less than $10,000 income bracket, making it the least populous group.
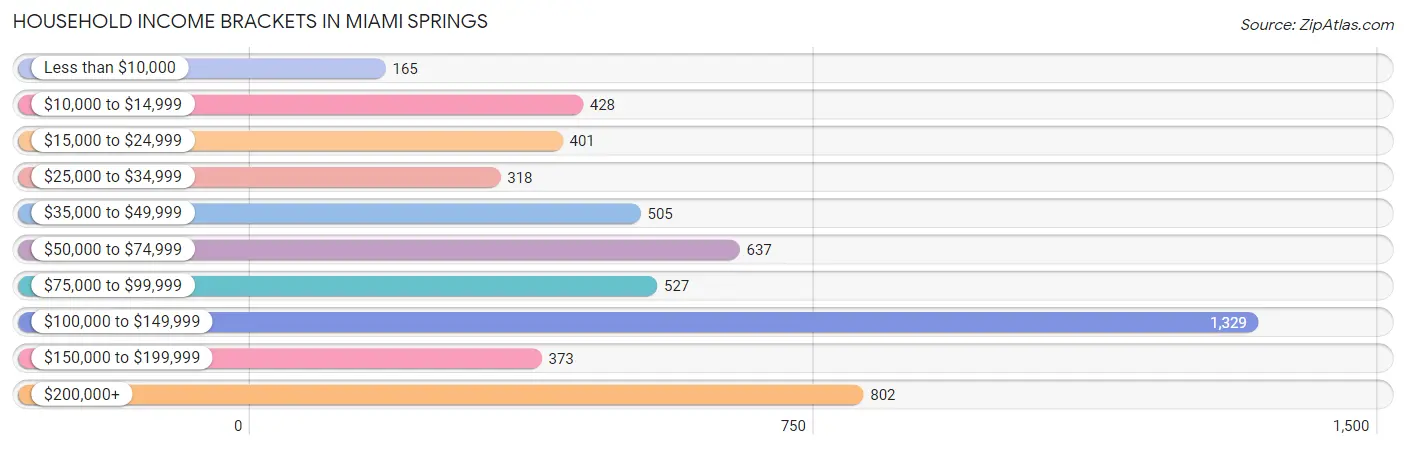
| Income Bracket | # Households | % Households |
| Less than $10,000 | 165 | 3.0% |
| $10,000 to $14,999 | 428 | 7.8% |
| $15,000 to $24,999 | 401 | 7.3% |
| $25,000 to $34,999 | 318 | 5.8% |
| $35,000 to $49,999 | 505 | 9.2% |
| $50,000 to $74,999 | 637 | 11.6% |
| $75,000 to $99,999 | 527 | 9.6% |
| $100,000 to $149,999 | 1,329 | 24.2% |
| $150,000 to $199,999 | 373 | 6.8% |
| $200,000+ | 802 | 14.6% |
Household Income by Householder Age in Miami Springs
The median household income in Miami Springs is $88,196, with the highest median household income of $112,888 found in the 25 to 44 years age bracket for the primary householder. A total of 1,694 households (30.9%) fall into this category. Meanwhile, the 15 to 24 years age bracket for the primary householder has the lowest median household income of $0, with 83 households (1.5%) in this group.
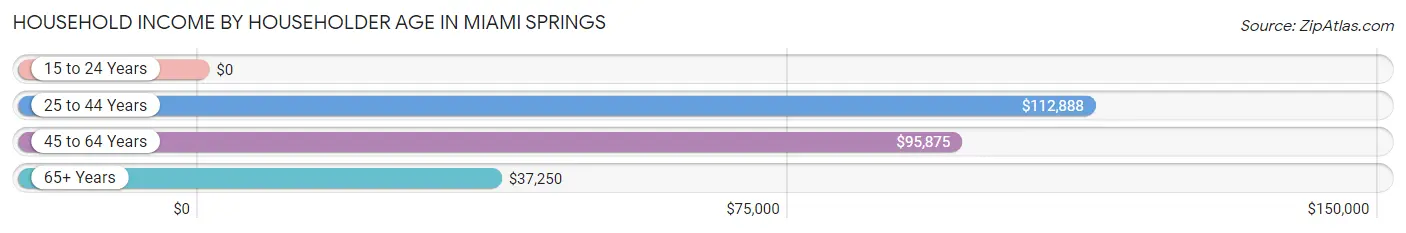
| Income Bracket | # Households | Median Income |
| 15 to 24 Years | 83 (1.5%) | $0 |
| 25 to 44 Years | 1,694 (30.9%) | $112,888 |
| 45 to 64 Years | 2,181 (39.7%) | $95,875 |
| 65+ Years | 1,532 (27.9%) | $37,250 |
| Total | 5,490 (100.0%) | $88,196 |
Poverty in Miami Springs
Income Below Poverty by Sex and Age in Miami Springs
With 8.6% poverty level for males and 14.2% for females among the residents of Miami Springs, 75 year old and over males and 75 year old and over females are the most vulnerable to poverty, with 157 males (45.2%) and 496 females (46.5%) in their respective age groups living below the poverty level.
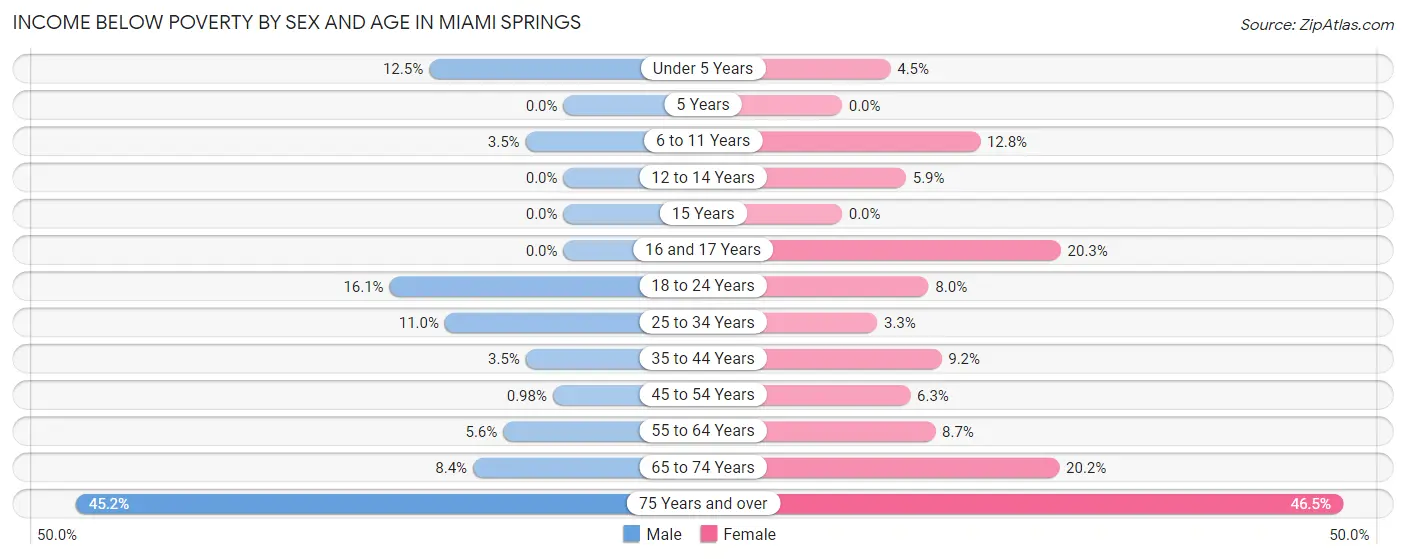
| Age Bracket | Male | Female |
| Under 5 Years | 46 (12.5%) | 27 (4.5%) |
| 5 Years | 0 (0.0%) | 0 (0.0%) |
| 6 to 11 Years | 10 (3.5%) | 40 (12.8%) |
| 12 to 14 Years | 0 (0.0%) | 13 (5.9%) |
| 15 Years | 0 (0.0%) | 0 (0.0%) |
| 16 and 17 Years | 0 (0.0%) | 13 (20.3%) |
| 18 to 24 Years | 113 (16.1%) | 39 (8.0%) |
| 25 to 34 Years | 54 (11.0%) | 20 (3.3%) |
| 35 to 44 Years | 39 (3.5%) | 107 (9.2%) |
| 45 to 54 Years | 9 (1.0%) | 61 (6.3%) |
| 55 to 64 Years | 57 (5.6%) | 84 (8.7%) |
| 65 to 74 Years | 39 (8.4%) | 146 (20.2%) |
| 75 Years and over | 157 (45.2%) | 496 (46.5%) |
| Total | 524 (8.6%) | 1,046 (14.2%) |
Income Above Poverty by Sex and Age in Miami Springs
According to the poverty statistics in Miami Springs, males aged 5 years and females aged 5 years are the age groups that are most secure financially, with 100.0% of males and 100.0% of females in these age groups living above the poverty line.
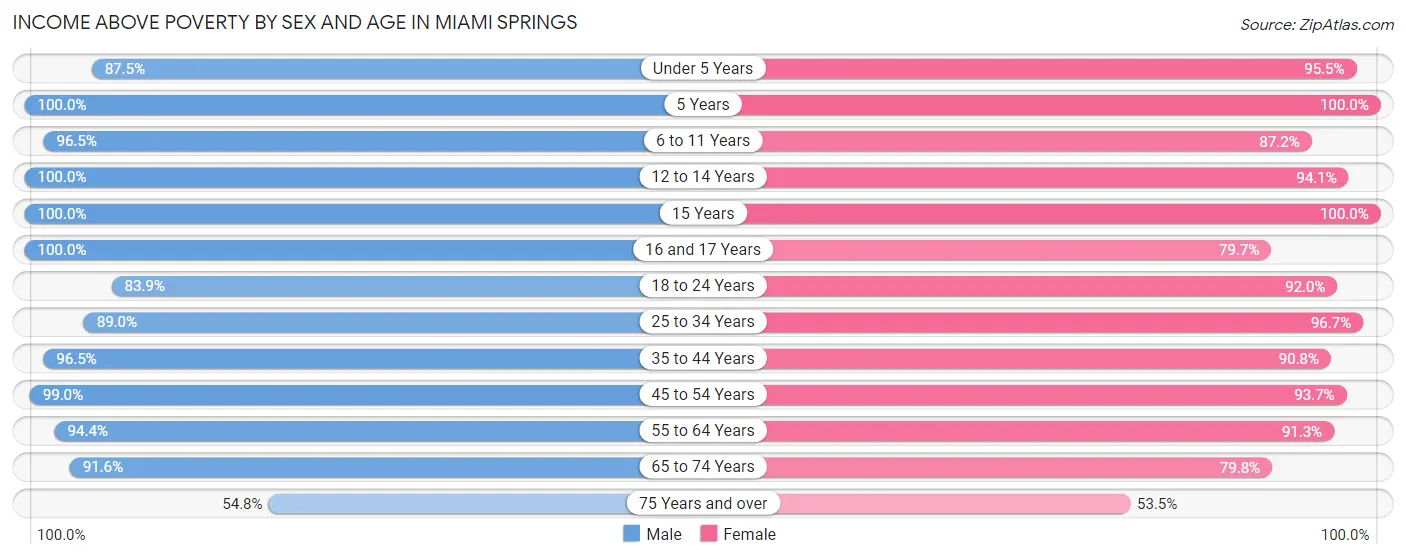
| Age Bracket | Male | Female |
| Under 5 Years | 323 (87.5%) | 573 (95.5%) |
| 5 Years | 54 (100.0%) | 123 (100.0%) |
| 6 to 11 Years | 274 (96.5%) | 272 (87.2%) |
| 12 to 14 Years | 177 (100.0%) | 206 (94.1%) |
| 15 Years | 35 (100.0%) | 70 (100.0%) |
| 16 and 17 Years | 112 (100.0%) | 51 (79.7%) |
| 18 to 24 Years | 587 (83.9%) | 446 (92.0%) |
| 25 to 34 Years | 437 (89.0%) | 592 (96.7%) |
| 35 to 44 Years | 1,074 (96.5%) | 1,052 (90.8%) |
| 45 to 54 Years | 909 (99.0%) | 901 (93.7%) |
| 55 to 64 Years | 962 (94.4%) | 886 (91.3%) |
| 65 to 74 Years | 426 (91.6%) | 578 (79.8%) |
| 75 Years and over | 190 (54.8%) | 571 (53.5%) |
| Total | 5,560 (91.4%) | 6,321 (85.8%) |
Income Below Poverty Among Married-Couple Families in Miami Springs
The poverty statistics for married-couple families in Miami Springs show that 5.1% or 118 of the total 2,294 families live below the poverty line. Families with no children have the highest poverty rate of 6.8%, comprising of 91 families. On the other hand, families with 3 or 4 children have the lowest poverty rate of 0.0%, which includes 0 families.
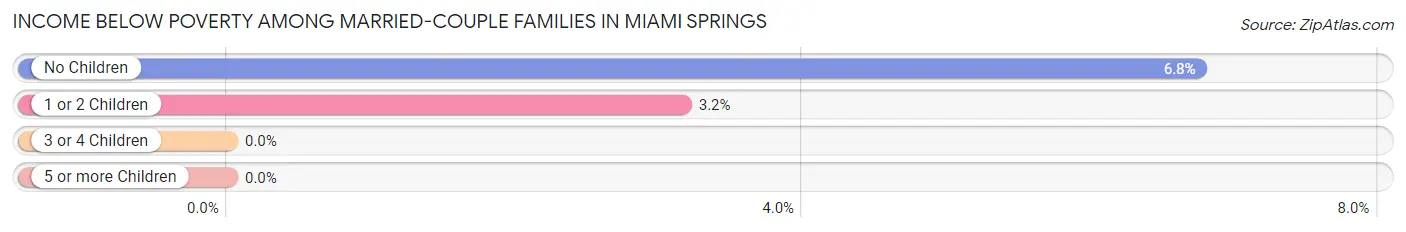
| Children | Above Poverty | Below Poverty |
| No Children | 1,258 (93.2%) | 91 (6.8%) |
| 1 or 2 Children | 828 (96.8%) | 27 (3.2%) |
| 3 or 4 Children | 90 (100.0%) | 0 (0.0%) |
| 5 or more Children | 0 (0.0%) | 0 (0.0%) |
| Total | 2,176 (94.9%) | 118 (5.1%) |
Income Below Poverty Among Single-Parent Households in Miami Springs
According to the poverty data in Miami Springs, 5.6% or 10 single-father households and 20.3% or 174 single-mother households are living below the poverty line. Among single-father households, those with 3 or 4 children have the highest poverty rate, with 10 households (100.0%) experiencing poverty. Likewise, among single-mother households, those with no children have the highest poverty rate, with 133 households (24.5%) falling below the poverty line.
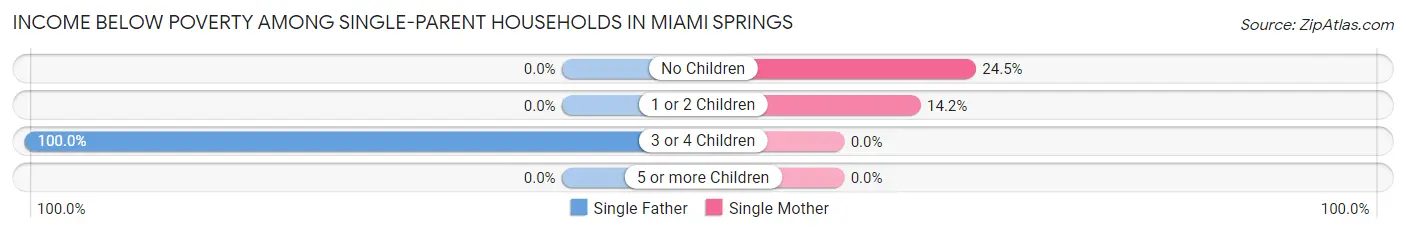
| Children | Single Father | Single Mother |
| No Children | 0 (0.0%) | 133 (24.5%) |
| 1 or 2 Children | 0 (0.0%) | 41 (14.2%) |
| 3 or 4 Children | 10 (100.0%) | 0 (0.0%) |
| 5 or more Children | 0 (0.0%) | 0 (0.0%) |
| Total | 10 (5.6%) | 174 (20.3%) |
Income Below Poverty Among Married-Couple vs Single-Parent Households in Miami Springs
The poverty data for Miami Springs shows that 118 of the married-couple family households (5.1%) and 184 of the single-parent households (17.8%) are living below the poverty level. Within the married-couple family households, those with no children have the highest poverty rate, with 91 households (6.8%) falling below the poverty line. Among the single-parent households, those with 3 or 4 children have the highest poverty rate, with 10 household (27.0%) living below poverty.
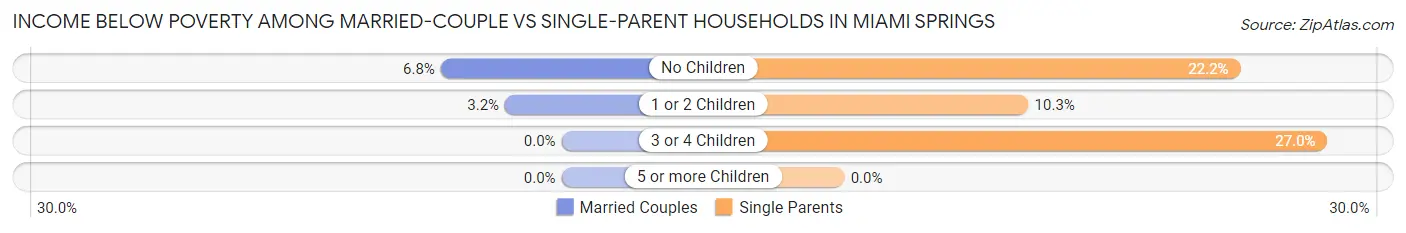
| Children | Married-Couple Families | Single-Parent Households |
| No Children | 91 (6.8%) | 133 (22.2%) |
| 1 or 2 Children | 27 (3.2%) | 41 (10.3%) |
| 3 or 4 Children | 0 (0.0%) | 10 (27.0%) |
| 5 or more Children | 0 (0.0%) | 0 (0.0%) |
| Total | 118 (5.1%) | 184 (17.8%) |
Race in Miami Springs
The most populous races in Miami Springs are Hispanic or Latino (10,777 | 78.5%), White / Caucasian (8,570 | 62.4%), and Two or more Races (3,933 | 28.6%).
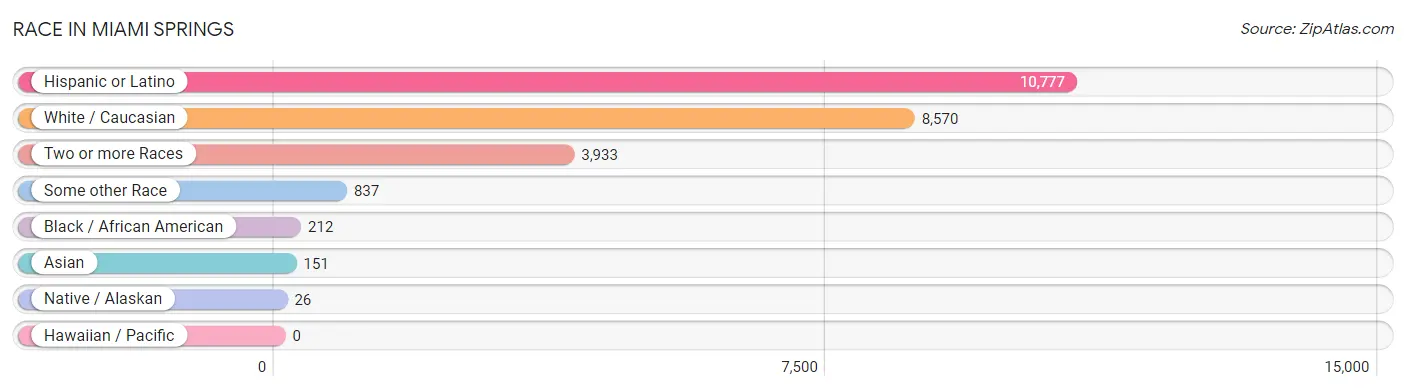
| Race | # Population | % Population |
| Asian | 151 | 1.1% |
| Black / African American | 212 | 1.5% |
| Hawaiian / Pacific | 0 | 0.0% |
| Hispanic or Latino | 10,777 | 78.5% |
| Native / Alaskan | 26 | 0.2% |
| White / Caucasian | 8,570 | 62.4% |
| Two or more Races | 3,933 | 28.6% |
| Some other Race | 837 | 6.1% |
| Total | 13,729 | 100.0% |
Ancestry in Miami Springs
The most populous ancestries reported in Miami Springs are Cuban (6,273 | 45.7%), South American (2,044 | 14.9%), American (1,213 | 8.8%), Central American (1,041 | 7.6%), and Colombian (742 | 5.4%), together accounting for 82.4% of all Miami Springs residents.
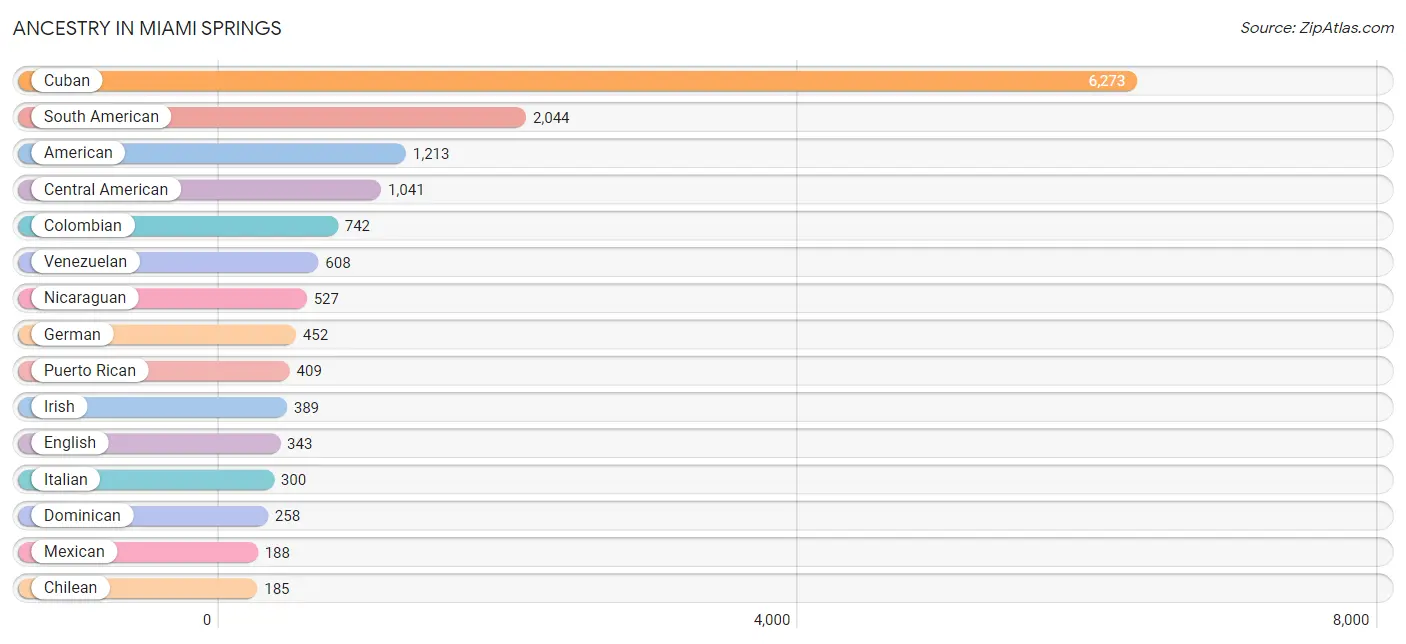
| Ancestry | # Population | % Population |
| African | 20 | 0.2% |
| American | 1,213 | 8.8% |
| Arab | 48 | 0.4% |
| Argentinean | 159 | 1.2% |
| Brazilian | 83 | 0.6% |
| British | 106 | 0.8% |
| Burmese | 41 | 0.3% |
| Central American | 1,041 | 7.6% |
| Cherokee | 6 | 0.0% |
| Chilean | 185 | 1.3% |
| Choctaw | 6 | 0.0% |
| Colombian | 742 | 5.4% |
| Costa Rican | 99 | 0.7% |
| Creek | 26 | 0.2% |
| Cuban | 6,273 | 45.7% |
| Czech | 10 | 0.1% |
| Danish | 28 | 0.2% |
| Dominican | 258 | 1.9% |
| Dutch | 42 | 0.3% |
| Ecuadorian | 169 | 1.2% |
| English | 343 | 2.5% |
| European | 86 | 0.6% |
| French | 83 | 0.6% |
| German | 452 | 3.3% |
| Greek | 53 | 0.4% |
| Guatemalan | 121 | 0.9% |
| Guyanese | 28 | 0.2% |
| Haitian | 54 | 0.4% |
| Honduran | 181 | 1.3% |
| Hungarian | 17 | 0.1% |
| Irish | 389 | 2.8% |
| Iroquois | 12 | 0.1% |
| Italian | 300 | 2.2% |
| Jamaican | 8 | 0.1% |
| Lebanese | 48 | 0.4% |
| Lithuanian | 26 | 0.2% |
| Malaysian | 116 | 0.8% |
| Mexican | 188 | 1.4% |
| Nicaraguan | 527 | 3.8% |
| Norwegian | 39 | 0.3% |
| Panamanian | 64 | 0.5% |
| Peruvian | 146 | 1.1% |
| Polish | 34 | 0.3% |
| Portuguese | 47 | 0.3% |
| Puerto Rican | 409 | 3.0% |
| Romanian | 18 | 0.1% |
| Russian | 70 | 0.5% |
| Salvadoran | 49 | 0.4% |
| Scandinavian | 9 | 0.1% |
| Scotch-Irish | 49 | 0.4% |
| Scottish | 69 | 0.5% |
| South American | 2,044 | 14.9% |
| Spaniard | 74 | 0.5% |
| Spanish | 16 | 0.1% |
| Subsaharan African | 70 | 0.5% |
| Swedish | 41 | 0.3% |
| Ukrainian | 9 | 0.1% |
| Uruguayan | 35 | 0.3% |
| Venezuelan | 608 | 4.4% |
| Welsh | 11 | 0.1% | View All 60 Rows |
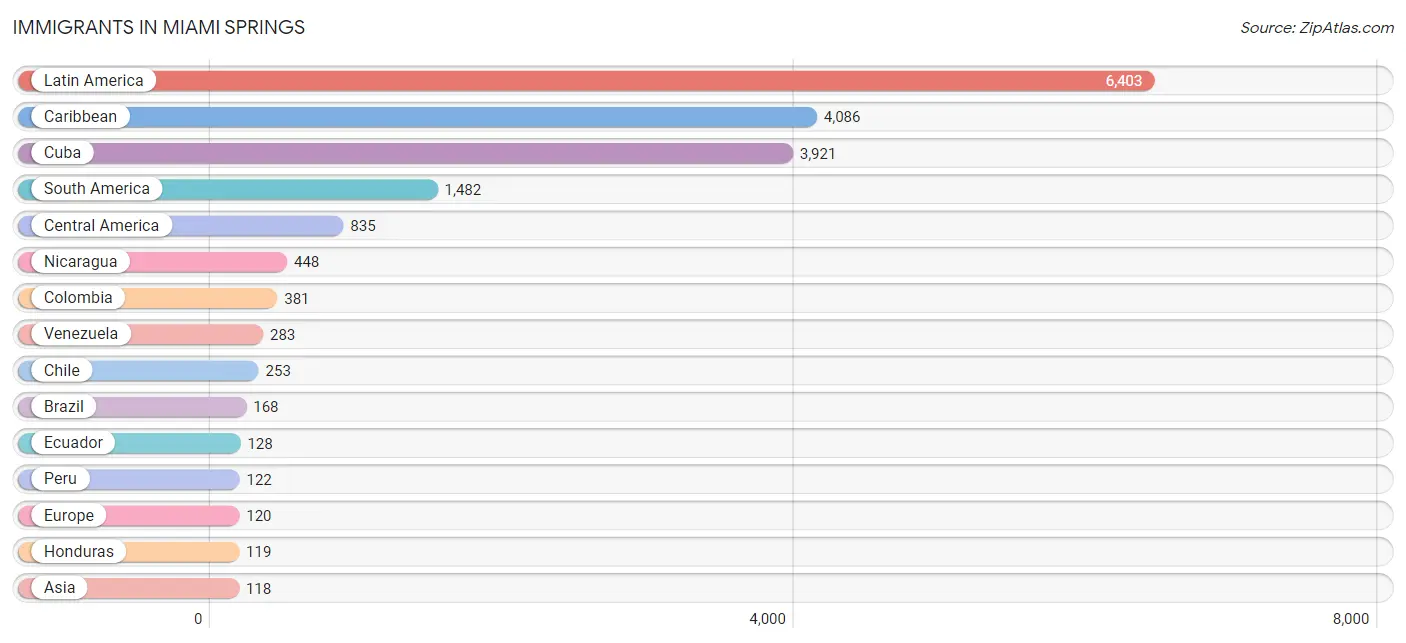
Immigrants in Miami Springs
The most numerous immigrant groups reported in Miami Springs came from Latin America (6,403 | 46.6%), Caribbean (4,086 | 29.8%), Cuba (3,921 | 28.6%), South America (1,482 | 10.8%), and Central America (835 | 6.1%), together accounting for 121.8% of all Miami Springs residents.
| Immigration Origin | # Population | % Population |
| Argentina | 112 | 0.8% |
| Asia | 118 | 0.9% |
| Bangladesh | 66 | 0.5% |
| Brazil | 168 | 1.2% |
| Canada | 6 | 0.0% |
| Caribbean | 4,086 | 29.8% |
| Central America | 835 | 6.1% |
| Chile | 253 | 1.8% |
| Colombia | 381 | 2.8% |
| Costa Rica | 76 | 0.5% |
| Cuba | 3,921 | 28.6% |
| Dominican Republic | 103 | 0.7% |
| Ecuador | 128 | 0.9% |
| El Salvador | 49 | 0.4% |
| England | 13 | 0.1% |
| Europe | 120 | 0.9% |
| France | 10 | 0.1% |
| Guatemala | 61 | 0.4% |
| Haiti | 53 | 0.4% |
| Honduras | 119 | 0.9% |
| India | 14 | 0.1% |
| Jamaica | 9 | 0.1% |
| Kazakhstan | 17 | 0.1% |
| Latin America | 6,403 | 46.6% |
| Mexico | 19 | 0.1% |
| Nicaragua | 448 | 3.3% |
| Northern Europe | 13 | 0.1% |
| Pakistan | 21 | 0.2% |
| Panama | 63 | 0.5% |
| Peru | 122 | 0.9% |
| South America | 1,482 | 10.8% |
| South Central Asia | 118 | 0.9% |
| Southern Europe | 97 | 0.7% |
| Spain | 97 | 0.7% |
| Uruguay | 35 | 0.3% |
| Venezuela | 283 | 2.1% |
| Western Europe | 10 | 0.1% | View All 37 Rows |
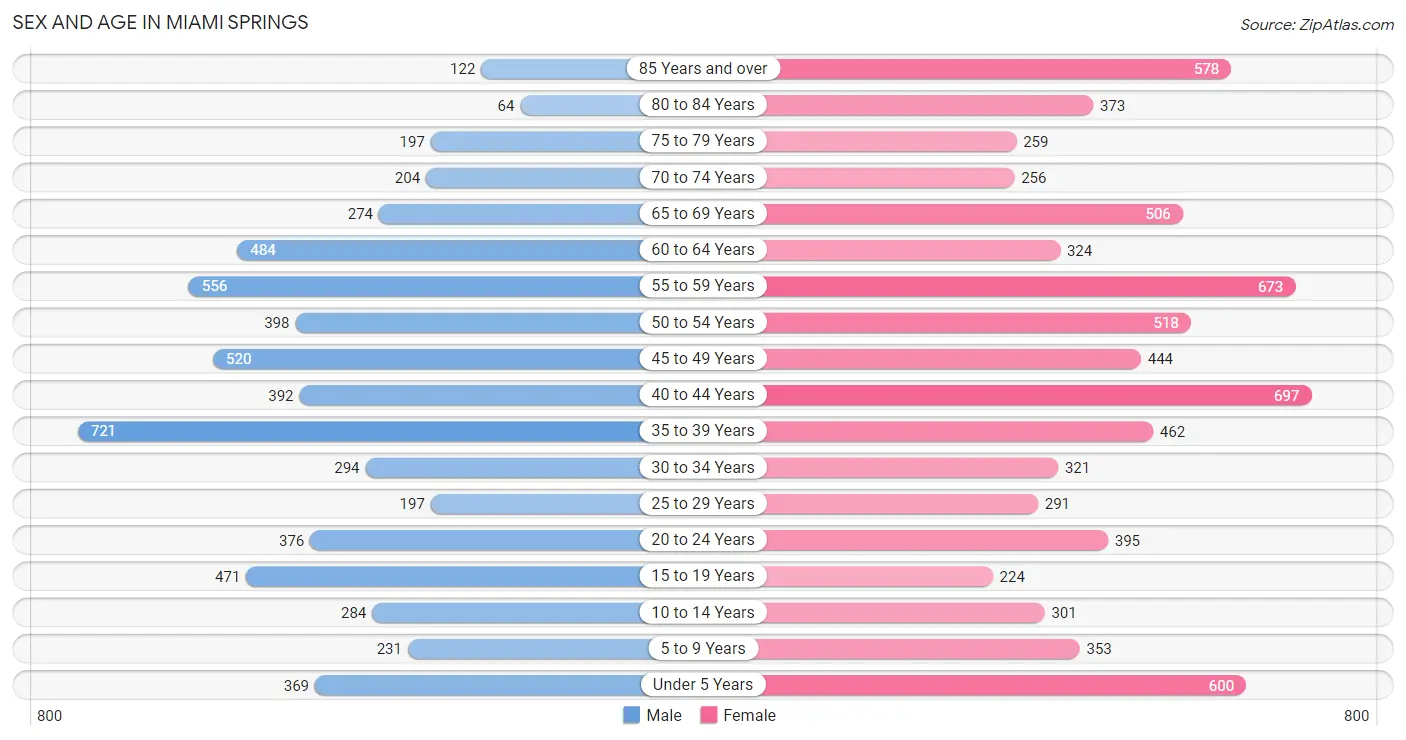
Sex and Age in Miami Springs
Sex and Age in Miami Springs
The most populous age groups in Miami Springs are 35 to 39 Years (721 | 11.7%) for men and 40 to 44 Years (697 | 9.2%) for women.
| Age Bracket | Male | Female |
| Under 5 Years | 369 (6.0%) | 600 (7.9%) |
| 5 to 9 Years | 231 (3.7%) | 353 (4.7%) |
| 10 to 14 Years | 284 (4.6%) | 301 (4.0%) |
| 15 to 19 Years | 471 (7.6%) | 224 (3.0%) |
| 20 to 24 Years | 376 (6.1%) | 395 (5.2%) |
| 25 to 29 Years | 197 (3.2%) | 291 (3.8%) |
| 30 to 34 Years | 294 (4.8%) | 321 (4.2%) |
| 35 to 39 Years | 721 (11.7%) | 462 (6.1%) |
| 40 to 44 Years | 392 (6.4%) | 697 (9.2%) |
| 45 to 49 Years | 520 (8.5%) | 444 (5.9%) |
| 50 to 54 Years | 398 (6.5%) | 518 (6.8%) |
| 55 to 59 Years | 556 (9.0%) | 673 (8.9%) |
| 60 to 64 Years | 484 (7.9%) | 324 (4.3%) |
| 65 to 69 Years | 274 (4.4%) | 506 (6.7%) |
| 70 to 74 Years | 204 (3.3%) | 256 (3.4%) |
| 75 to 79 Years | 197 (3.2%) | 259 (3.4%) |
| 80 to 84 Years | 64 (1.0%) | 373 (4.9%) |
| 85 Years and over | 122 (2.0%) | 578 (7.6%) |
| Total | 6,154 (100.0%) | 7,575 (100.0%) |
Families and Households in Miami Springs
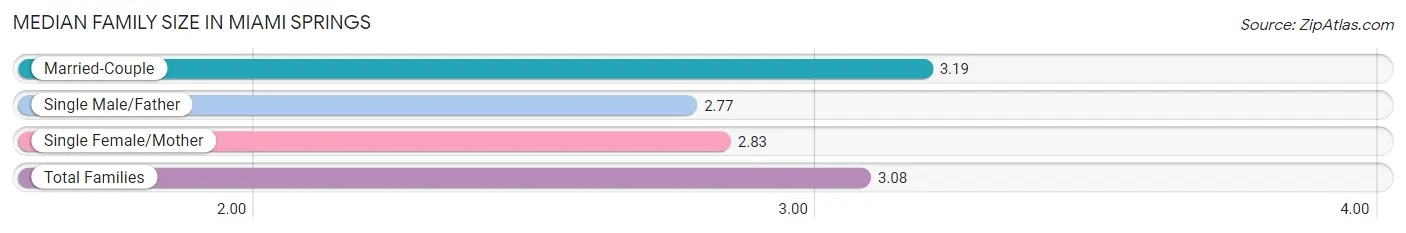
Median Family Size in Miami Springs
The median family size in Miami Springs is 3.08 persons per family, with married-couple families (2,294 | 68.9%) accounting for the largest median family size of 3.19 persons per family. On the other hand, single male/father families (179 | 5.4%) represent the smallest median family size with 2.77 persons per family.
| Family Type | # Families | Family Size |
| Married-Couple | 2,294 (68.9%) | 3.19 |
| Single Male/Father | 179 (5.4%) | 2.77 |
| Single Female/Mother | 857 (25.7%) | 2.83 |
| Total Families | 3,330 (100.0%) | 3.08 |
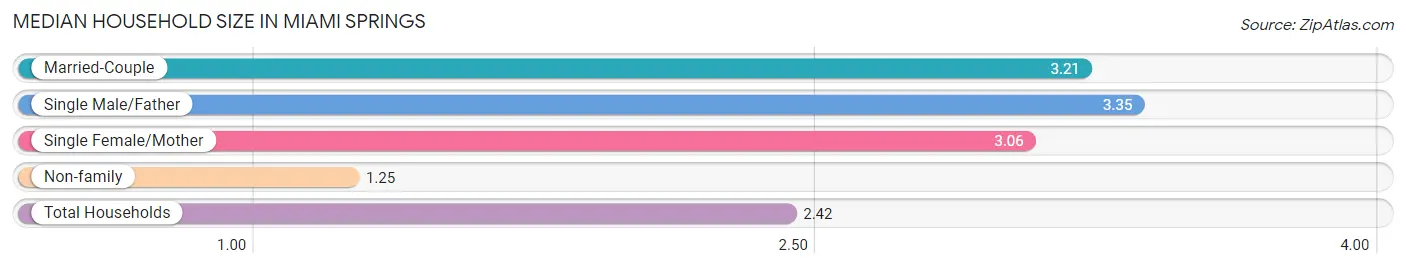
Median Household Size in Miami Springs
The median household size in Miami Springs is 2.42 persons per household, with single male/father households (179 | 3.3%) accounting for the largest median household size of 3.35 persons per household. non-family households (2,160 | 39.3%) represent the smallest median household size with 1.25 persons per household.
| Household Type | # Households | Household Size |
| Married-Couple | 2,294 (41.8%) | 3.21 |
| Single Male/Father | 179 (3.3%) | 3.35 |
| Single Female/Mother | 857 (15.6%) | 3.06 |
| Non-family | 2,160 (39.3%) | 1.25 |
| Total Households | 5,490 (100.0%) | 2.42 |
Household Size by Marriage Status in Miami Springs
Out of a total of 5,490 households in Miami Springs, 3,330 (60.7%) are family households, while 2,160 (39.3%) are nonfamily households. The most numerous type of family households are 2-person households, comprising 1,324, and the most common type of nonfamily households are 1-person households, comprising 1,732.
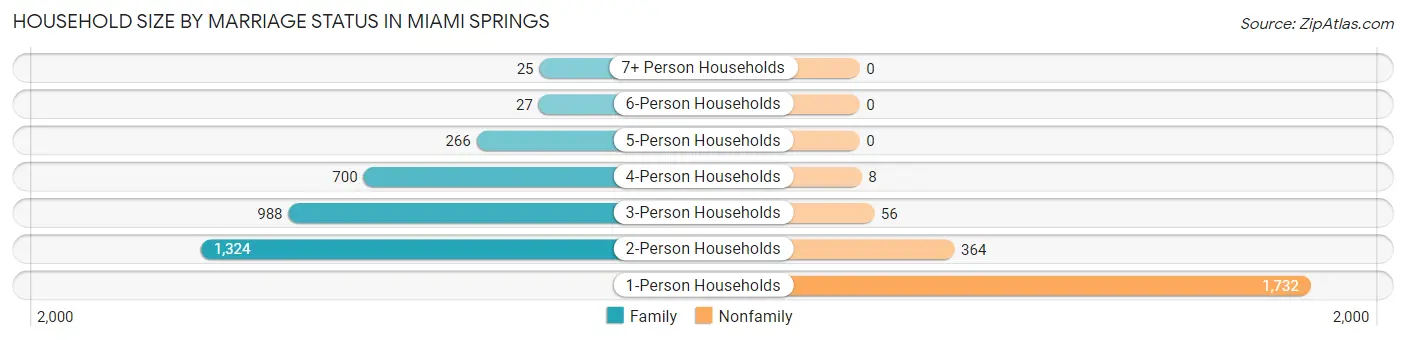
| Household Size | Family Households | Nonfamily Households |
| 1-Person Households | - | 1,732 (31.6%) |
| 2-Person Households | 1,324 (24.1%) | 364 (6.6%) |
| 3-Person Households | 988 (18.0%) | 56 (1.0%) |
| 4-Person Households | 700 (12.8%) | 8 (0.2%) |
| 5-Person Households | 266 (4.9%) | 0 (0.0%) |
| 6-Person Households | 27 (0.5%) | 0 (0.0%) |
| 7+ Person Households | 25 (0.5%) | 0 (0.0%) |
| Total | 3,330 (60.7%) | 2,160 (39.3%) |
Female Fertility in Miami Springs
Fertility by Age in Miami Springs
Average fertility rate in Miami Springs is 26.0 births per 1,000 women. Women in the age bracket of 20 to 34 years have the highest fertility rate with 75.0 births per 1,000 women. Women in the age bracket of 20 to 34 years acount for 100.0% of all women with births.
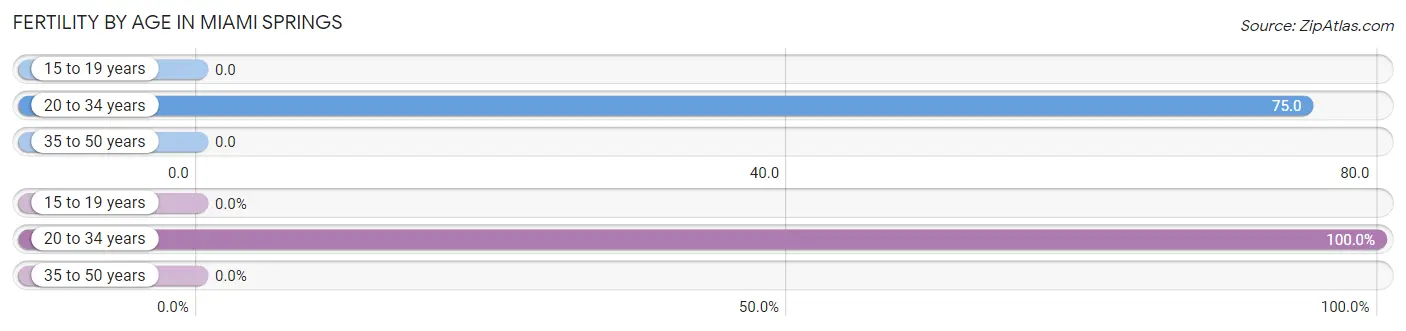
| Age Bracket | Women with Births | Births / 1,000 Women |
| 15 to 19 years | 0 (0.0%) | 0.0 |
| 20 to 34 years | 76 (100.0%) | 75.0 |
| 35 to 50 years | 0 (0.0%) | 0.0 |
| Total | 76 (100.0%) | 26.0 |
Fertility by Age by Marriage Status in Miami Springs
85.5% of women with births (76) in Miami Springs are married. The highest percentage of unmarried women with births falls into 20 to 34 years age bracket with 14.5% of them unmarried at the time of birth, while the lowest percentage of unmarried women with births belong to 20 to 34 years age bracket with 14.5% of them unmarried.
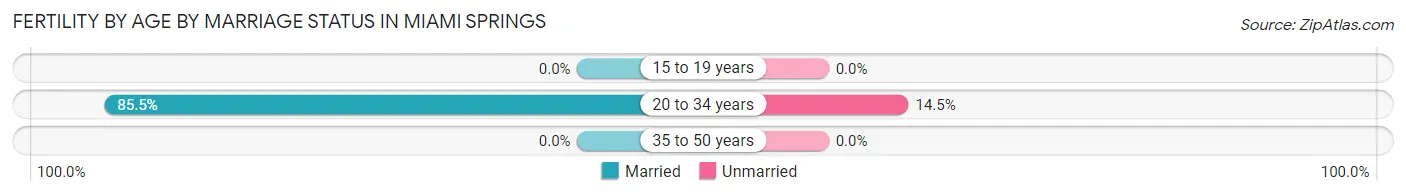
| Age Bracket | Married | Unmarried |
| 15 to 19 years | 0 (0.0%) | 0 (0.0%) |
| 20 to 34 years | 65 (85.5%) | 11 (14.5%) |
| 35 to 50 years | 0 (0.0%) | 0 (0.0%) |
| Total | 65 (85.5%) | 11 (14.5%) |
Fertility by Education in Miami Springs
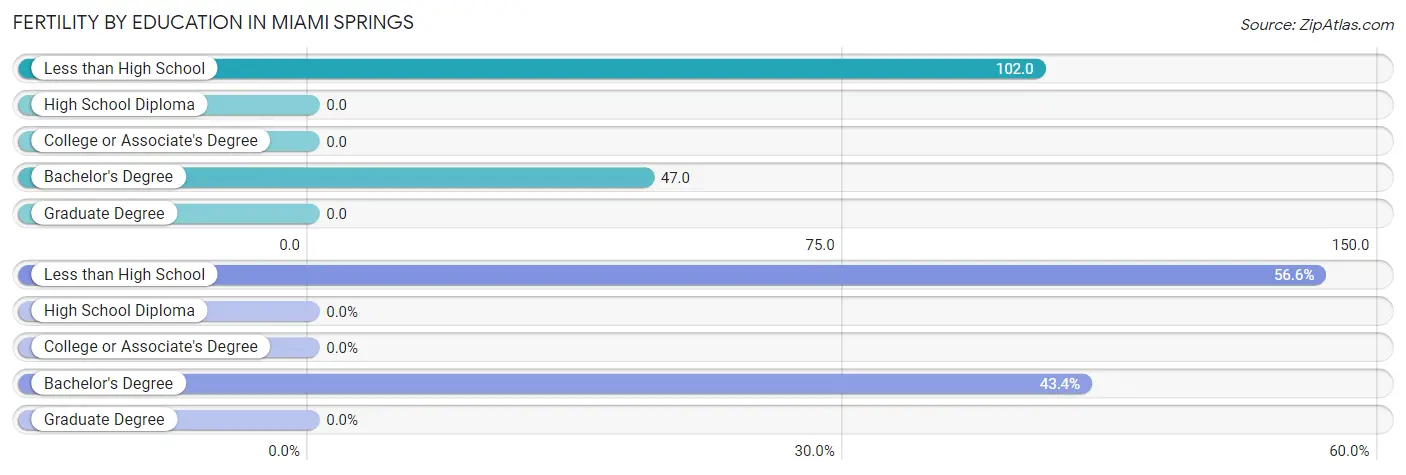
| Educational Attainment | Women with Births | Births / 1,000 Women |
| Less than High School | 43 (56.6%) | 102.0 |
| High School Diploma | 0 (0.0%) | 0.0 |
| College or Associate's Degree | 0 (0.0%) | 0.0 |
| Bachelor's Degree | 33 (43.4%) | 47.0 |
| Graduate Degree | 0 (0.0%) | 0.0 |
| Total | 76 (100.0%) | 26.0 |
Fertility by Education by Marriage Status in Miami Springs
14.5% of women with births in Miami Springs are unmarried. Women with the educational attainment of less than high school are most likely to be married with 100.0% of them married at childbirth, while women with the educational attainment of bachelor's degree are least likely to be married with 33.3% of them unmarried at childbirth.
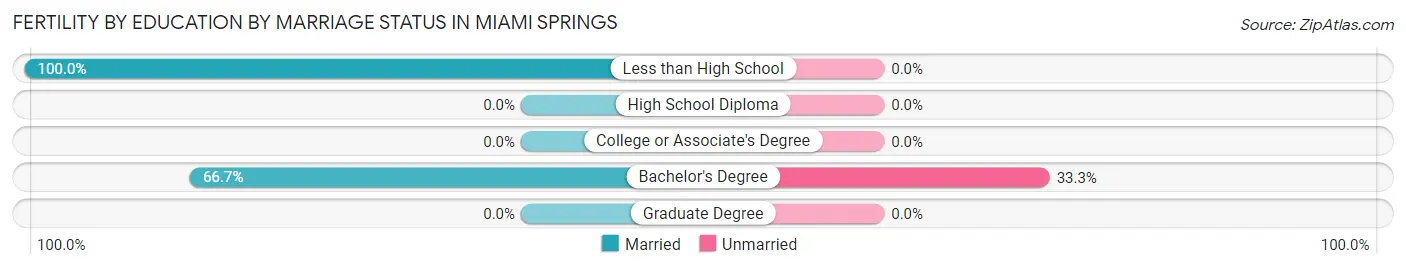
| Educational Attainment | Married | Unmarried |
| Less than High School | 43 (100.0%) | 0 (0.0%) |
| High School Diploma | 0 (0.0%) | 0 (0.0%) |
| College or Associate's Degree | 0 (0.0%) | 0 (0.0%) |
| Bachelor's Degree | 22 (66.7%) | 11 (33.3%) |
| Graduate Degree | 0 (0.0%) | 0 (0.0%) |
| Total | 65 (85.5%) | 11 (14.5%) |
Employment Characteristics in Miami Springs
Employment by Class of Employer in Miami Springs
Among the 7,483 employed individuals in Miami Springs, private company employees (5,068 | 67.7%), self-employed (not incorporated) (625 | 8.4%), and local government employees (485 | 6.5%) make up the most common classes of employment.
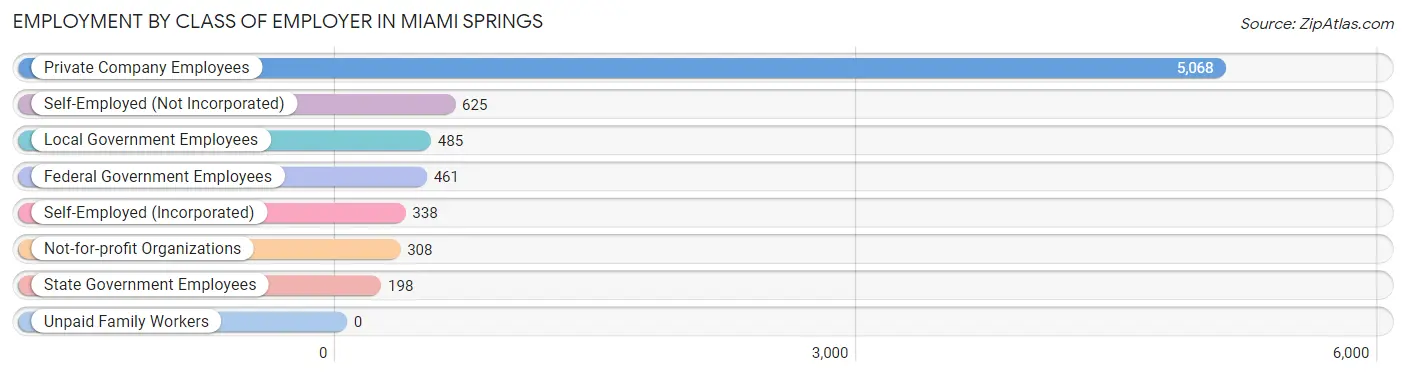
| Employer Class | # Employees | % Employees |
| Private Company Employees | 5,068 | 67.7% |
| Self-Employed (Incorporated) | 338 | 4.5% |
| Self-Employed (Not Incorporated) | 625 | 8.4% |
| Not-for-profit Organizations | 308 | 4.1% |
| Local Government Employees | 485 | 6.5% |
| State Government Employees | 198 | 2.6% |
| Federal Government Employees | 461 | 6.2% |
| Unpaid Family Workers | 0 | 0.0% |
| Total | 7,483 | 100.0% |
Employment Status by Age in Miami Springs
According to the labor force statistics for Miami Springs, out of the total population over 16 years of age (11,486), 66.3% or 7,615 individuals are in the labor force, with 1.3% or 99 of them unemployed. The age group with the highest labor force participation rate is 35 to 44 years, with 93.0% or 2,113 individuals in the labor force. Within the labor force, the 65 to 74 years age range has the highest percentage of unemployed individuals, with 4.9% or 18 of them being unemployed.
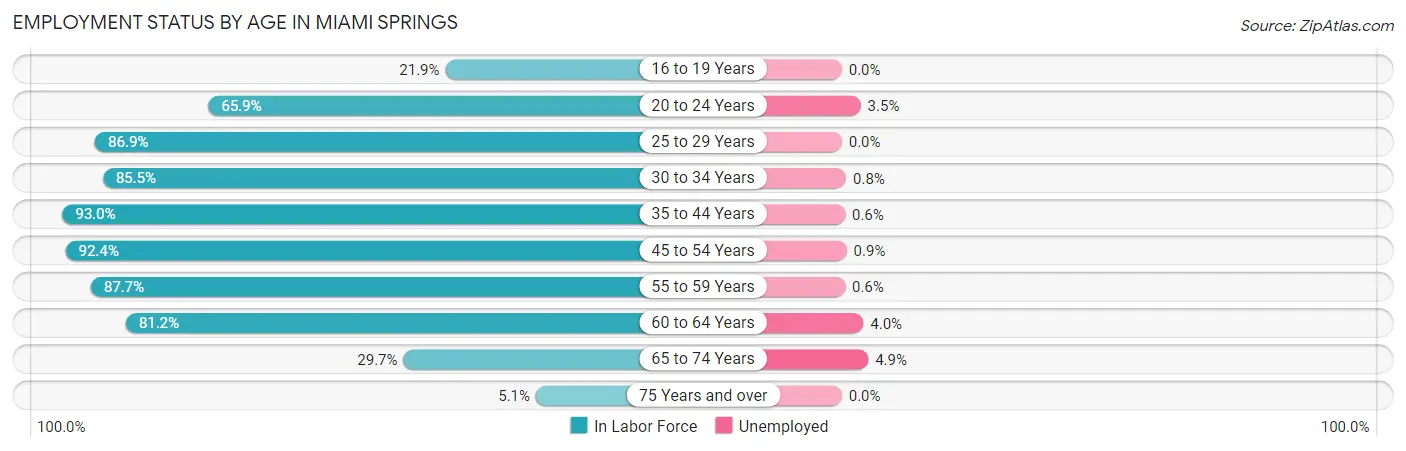
| Age Bracket | In Labor Force | Unemployed |
| 16 to 19 Years | 129 (21.9%) | 0 (0.0%) |
| 20 to 24 Years | 508 (65.9%) | 18 (3.5%) |
| 25 to 29 Years | 424 (86.9%) | 0 (0.0%) |
| 30 to 34 Years | 526 (85.5%) | 4 (0.8%) |
| 35 to 44 Years | 2,113 (93.0%) | 13 (0.6%) |
| 45 to 54 Years | 1,737 (92.4%) | 16 (0.9%) |
| 55 to 59 Years | 1,078 (87.7%) | 6 (0.6%) |
| 60 to 64 Years | 656 (81.2%) | 26 (4.0%) |
| 65 to 74 Years | 368 (29.7%) | 18 (4.9%) |
| 75 Years and over | 81 (5.1%) | 0 (0.0%) |
| Total | 7,615 (66.3%) | 99 (1.3%) |
Employment Status by Educational Attainment in Miami Springs
According to labor force statistics for Miami Springs, 89.6% of individuals (6,534) out of the total population between 25 and 64 years of age (7,292) are in the labor force, with 1.0% or 65 of them being unemployed. The group with the highest labor force participation rate are those with the educational attainment of bachelor's degree or higher, with 92.1% or 3,075 individuals in the labor force. Within the labor force, individuals with less than high school education have the highest percentage of unemployment, with 3.0% or 17 of them being unemployed.
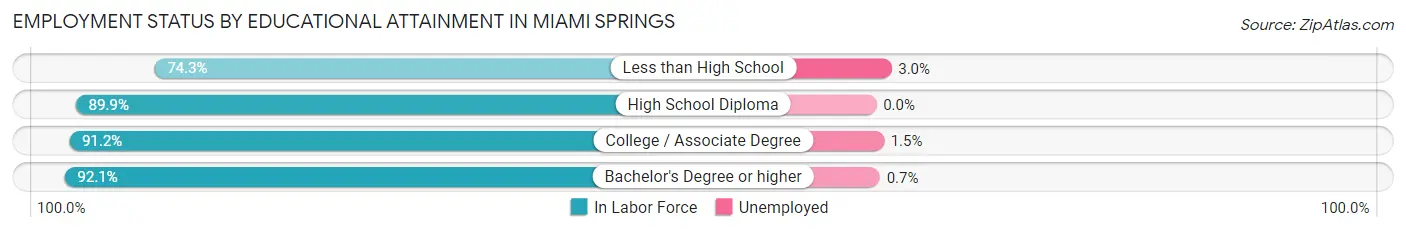
| Educational Attainment | In Labor Force | Unemployed |
| Less than High School | 576 (74.3%) | 23 (3.0%) |
| High School Diploma | 1,184 (89.9%) | 0 (0.0%) |
| College / Associate Degree | 1,697 (91.2%) | 28 (1.5%) |
| Bachelor's Degree or higher | 3,075 (92.1%) | 23 (0.7%) |
| Total | 6,534 (89.6%) | 73 (1.0%) |
Employment Occupations by Sex in Miami Springs
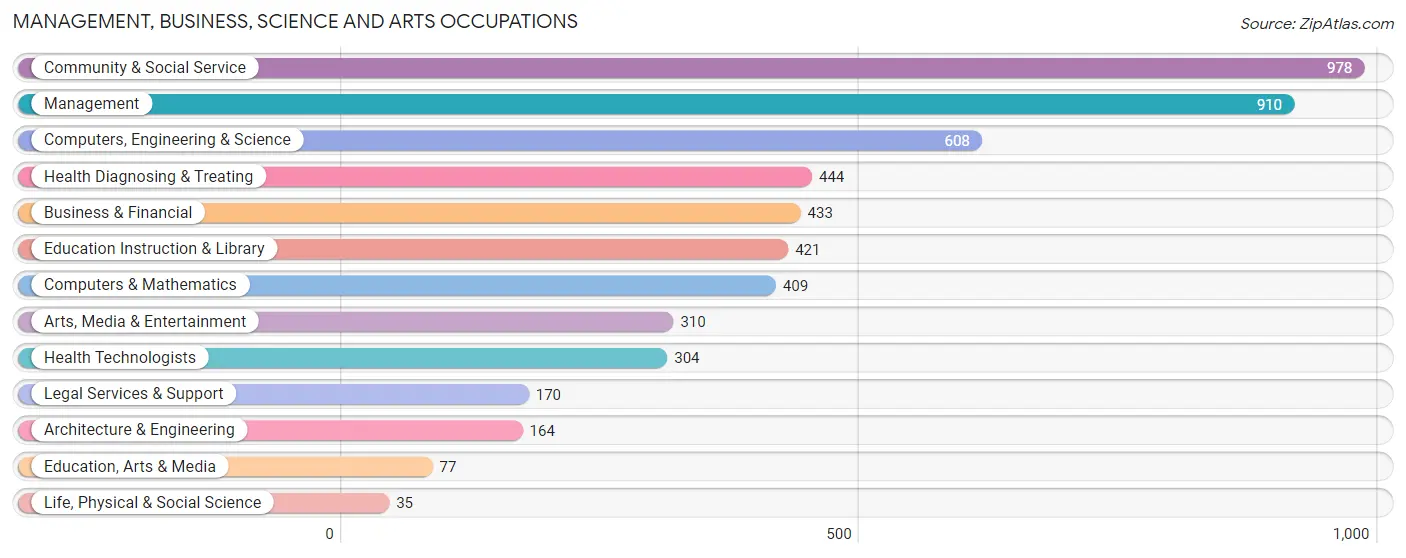
Management, Business, Science and Arts Occupations
The most common Management, Business, Science and Arts occupations in Miami Springs are Community & Social Service (978 | 13.0%), Management (910 | 12.1%), Computers, Engineering & Science (608 | 8.1%), Health Diagnosing & Treating (444 | 5.9%), and Business & Financial (433 | 5.8%).
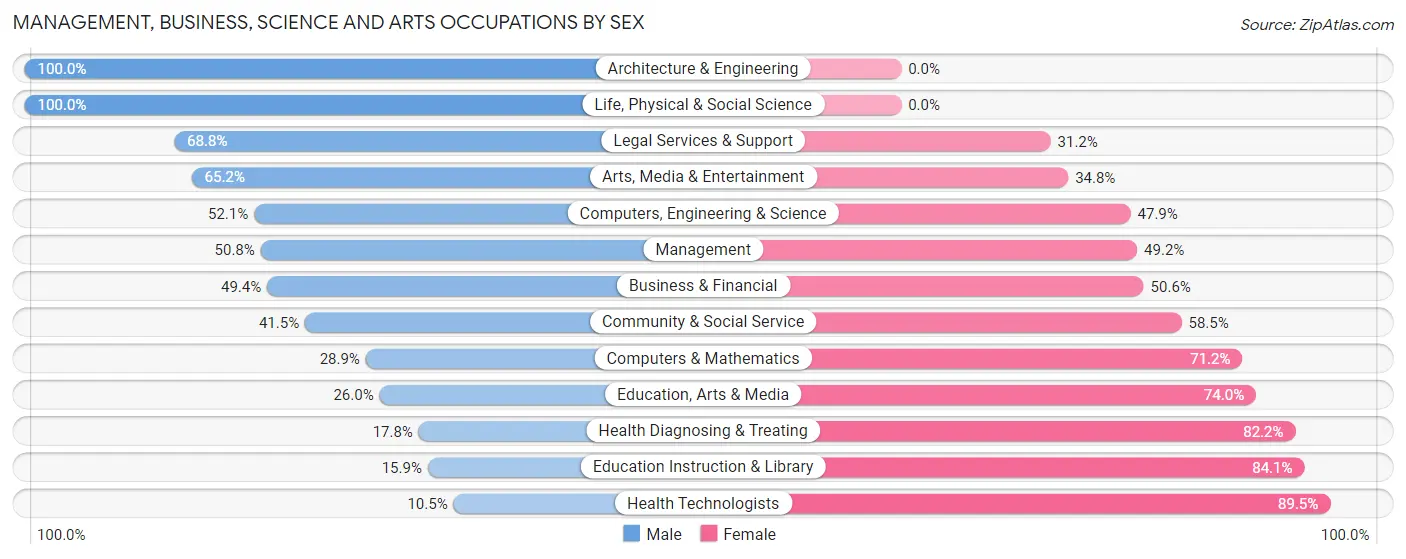
Management, Business, Science and Arts Occupations by Sex
Within the Management, Business, Science and Arts occupations in Miami Springs, the most male-oriented occupations are Architecture & Engineering (100.0%), Life, Physical & Social Science (100.0%), and Legal Services & Support (68.8%), while the most female-oriented occupations are Health Technologists (89.5%), Education Instruction & Library (84.1%), and Health Diagnosing & Treating (82.2%).
| Occupation | Male | Female |
| Management | 462 (50.8%) | 448 (49.2%) |
| Business & Financial | 214 (49.4%) | 219 (50.6%) |
| Computers, Engineering & Science | 317 (52.1%) | 291 (47.9%) |
| Computers & Mathematics | 118 (28.8%) | 291 (71.2%) |
| Architecture & Engineering | 164 (100.0%) | 0 (0.0%) |
| Life, Physical & Social Science | 35 (100.0%) | 0 (0.0%) |
| Community & Social Service | 406 (41.5%) | 572 (58.5%) |
| Education, Arts & Media | 20 (26.0%) | 57 (74.0%) |
| Legal Services & Support | 117 (68.8%) | 53 (31.2%) |
| Education Instruction & Library | 67 (15.9%) | 354 (84.1%) |
| Arts, Media & Entertainment | 202 (65.2%) | 108 (34.8%) |
| Health Diagnosing & Treating | 79 (17.8%) | 365 (82.2%) |
| Health Technologists | 32 (10.5%) | 272 (89.5%) |
| Total (Category) | 1,478 (43.8%) | 1,895 (56.2%) |
| Total (Overall) | 3,879 (51.6%) | 3,641 (48.4%) |
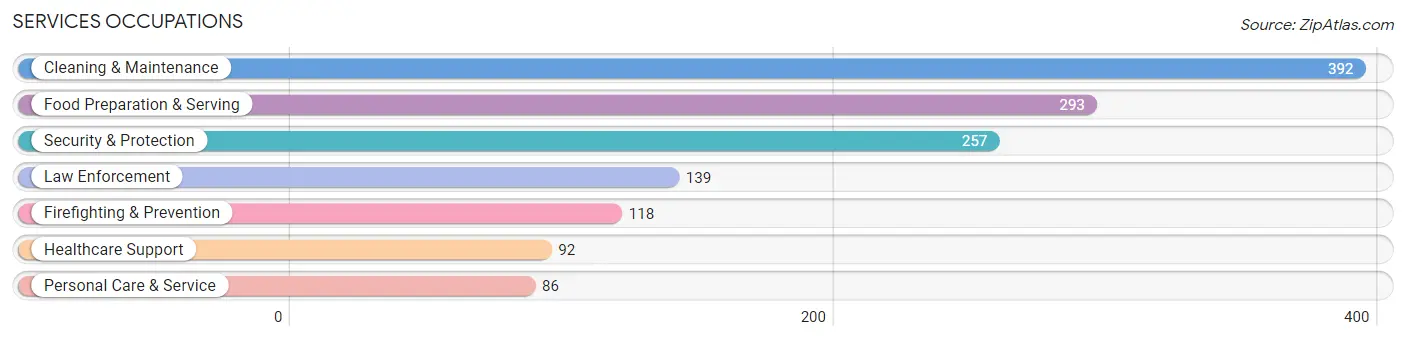
Services Occupations
The most common Services occupations in Miami Springs are Cleaning & Maintenance (392 | 5.2%), Food Preparation & Serving (293 | 3.9%), Security & Protection (257 | 3.4%), Law Enforcement (139 | 1.8%), and Firefighting & Prevention (118 | 1.6%).
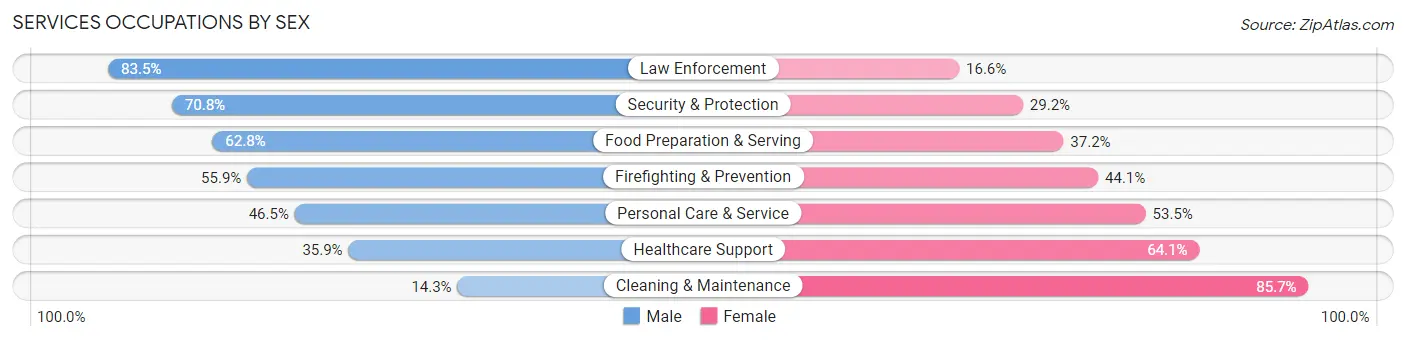
Services Occupations by Sex
Within the Services occupations in Miami Springs, the most male-oriented occupations are Law Enforcement (83.5%), Security & Protection (70.8%), and Food Preparation & Serving (62.8%), while the most female-oriented occupations are Cleaning & Maintenance (85.7%), Healthcare Support (64.1%), and Personal Care & Service (53.5%).
| Occupation | Male | Female |
| Healthcare Support | 33 (35.9%) | 59 (64.1%) |
| Security & Protection | 182 (70.8%) | 75 (29.2%) |
| Firefighting & Prevention | 66 (55.9%) | 52 (44.1%) |
| Law Enforcement | 116 (83.5%) | 23 (16.6%) |
| Food Preparation & Serving | 184 (62.8%) | 109 (37.2%) |
| Cleaning & Maintenance | 56 (14.3%) | 336 (85.7%) |
| Personal Care & Service | 40 (46.5%) | 46 (53.5%) |
| Total (Category) | 495 (44.2%) | 625 (55.8%) |
| Total (Overall) | 3,879 (51.6%) | 3,641 (48.4%) |
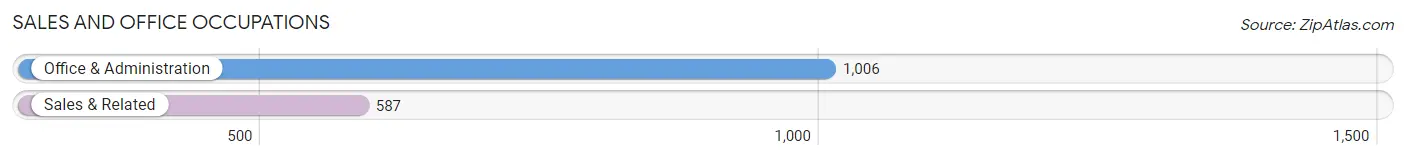
Sales and Office Occupations
The most common Sales and Office occupations in Miami Springs are Office & Administration (1,006 | 13.4%), and Sales & Related (587 | 7.8%).
Sales and Office Occupations by Sex
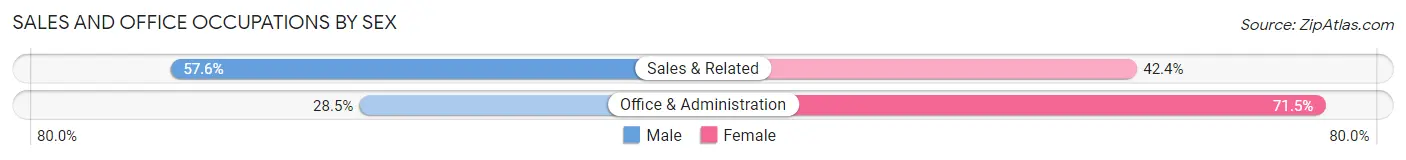
| Occupation | Male | Female |
| Sales & Related | 338 (57.6%) | 249 (42.4%) |
| Office & Administration | 287 (28.5%) | 719 (71.5%) |
| Total (Category) | 625 (39.2%) | 968 (60.8%) |
| Total (Overall) | 3,879 (51.6%) | 3,641 (48.4%) |
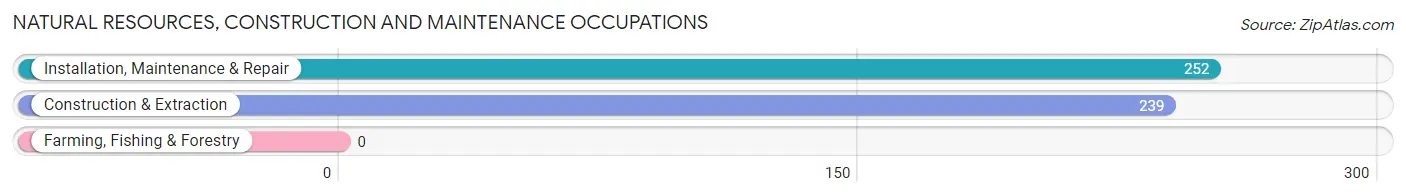
Natural Resources, Construction and Maintenance Occupations
The most common Natural Resources, Construction and Maintenance occupations in Miami Springs are Installation, Maintenance & Repair (252 | 3.4%), and Construction & Extraction (239 | 3.2%).
Natural Resources, Construction and Maintenance Occupations by Sex
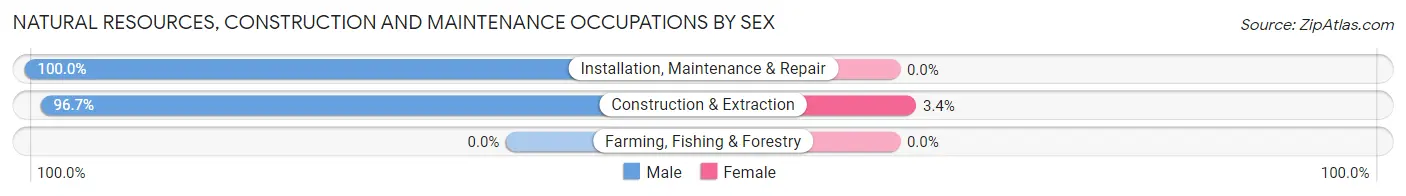
| Occupation | Male | Female |
| Farming, Fishing & Forestry | 0 (0.0%) | 0 (0.0%) |
| Construction & Extraction | 231 (96.7%) | 8 (3.4%) |
| Installation, Maintenance & Repair | 252 (100.0%) | 0 (0.0%) |
| Total (Category) | 483 (98.4%) | 8 (1.6%) |
| Total (Overall) | 3,879 (51.6%) | 3,641 (48.4%) |
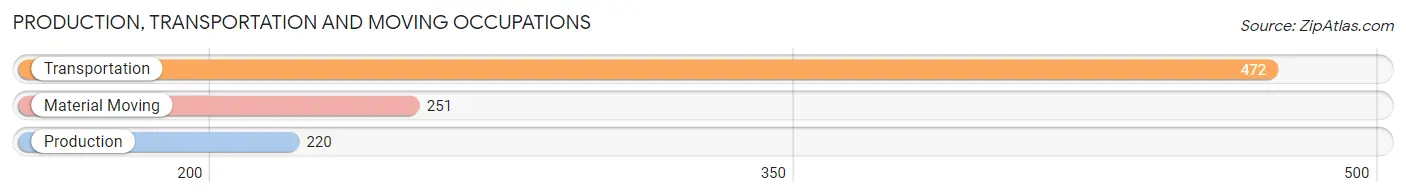
Production, Transportation and Moving Occupations
The most common Production, Transportation and Moving occupations in Miami Springs are Transportation (472 | 6.3%), Material Moving (251 | 3.3%), and Production (220 | 2.9%).
Production, Transportation and Moving Occupations by Sex
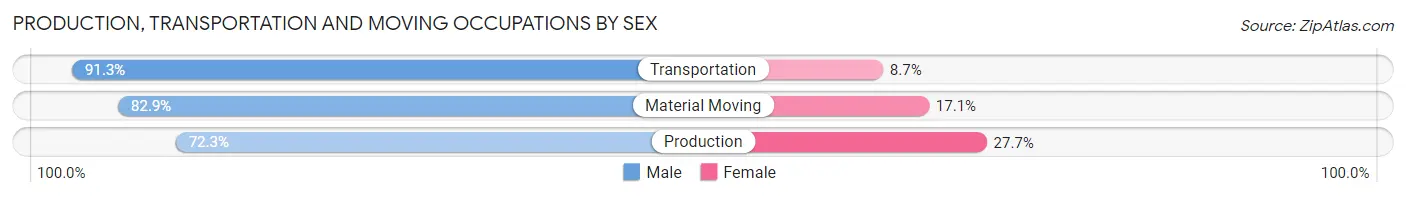
| Occupation | Male | Female |
| Production | 159 (72.3%) | 61 (27.7%) |
| Transportation | 431 (91.3%) | 41 (8.7%) |
| Material Moving | 208 (82.9%) | 43 (17.1%) |
| Total (Category) | 798 (84.6%) | 145 (15.4%) |
| Total (Overall) | 3,879 (51.6%) | 3,641 (48.4%) |
Employment Industries by Sex in Miami Springs
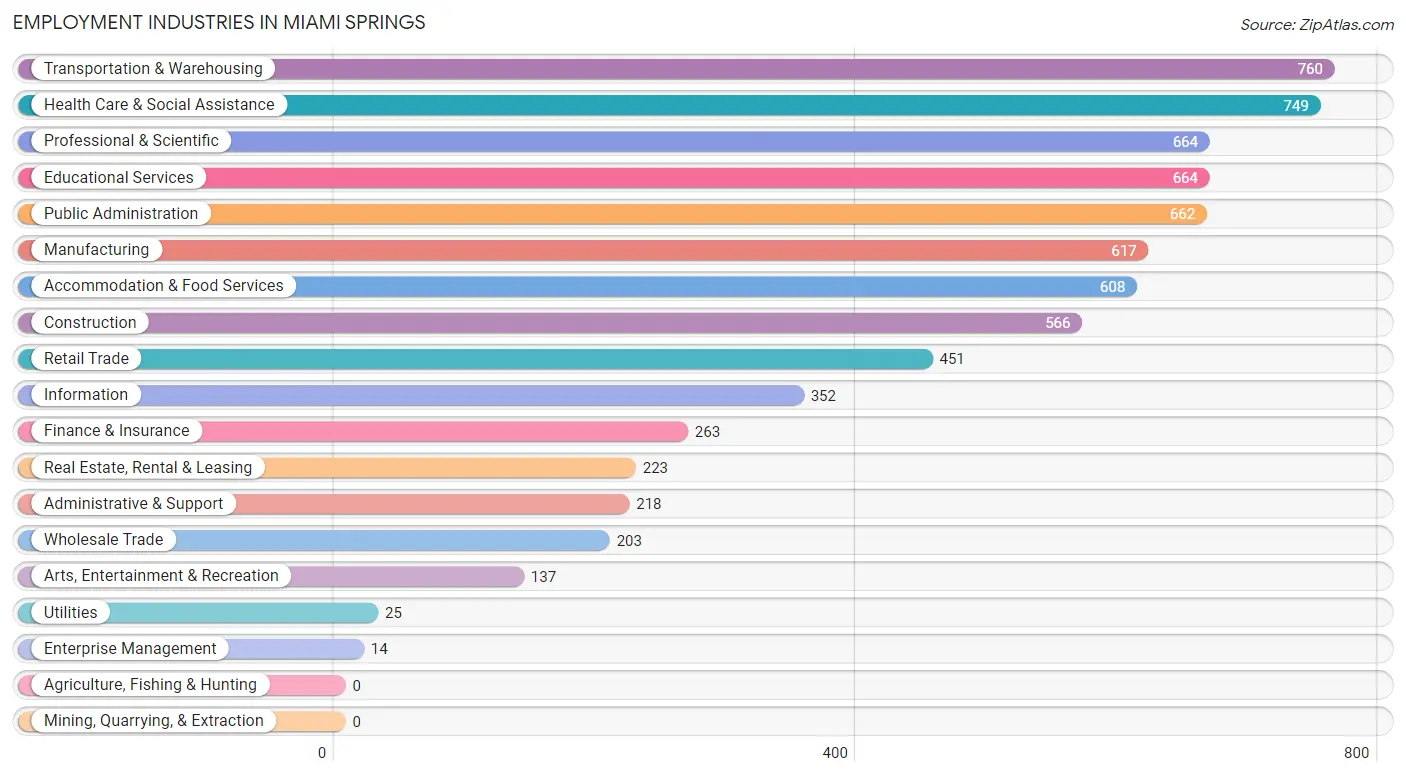
Employment Industries in Miami Springs
The major employment industries in Miami Springs include Transportation & Warehousing (760 | 10.1%), Health Care & Social Assistance (749 | 10.0%), Professional & Scientific (664 | 8.8%), Educational Services (664 | 8.8%), and Public Administration (662 | 8.8%).
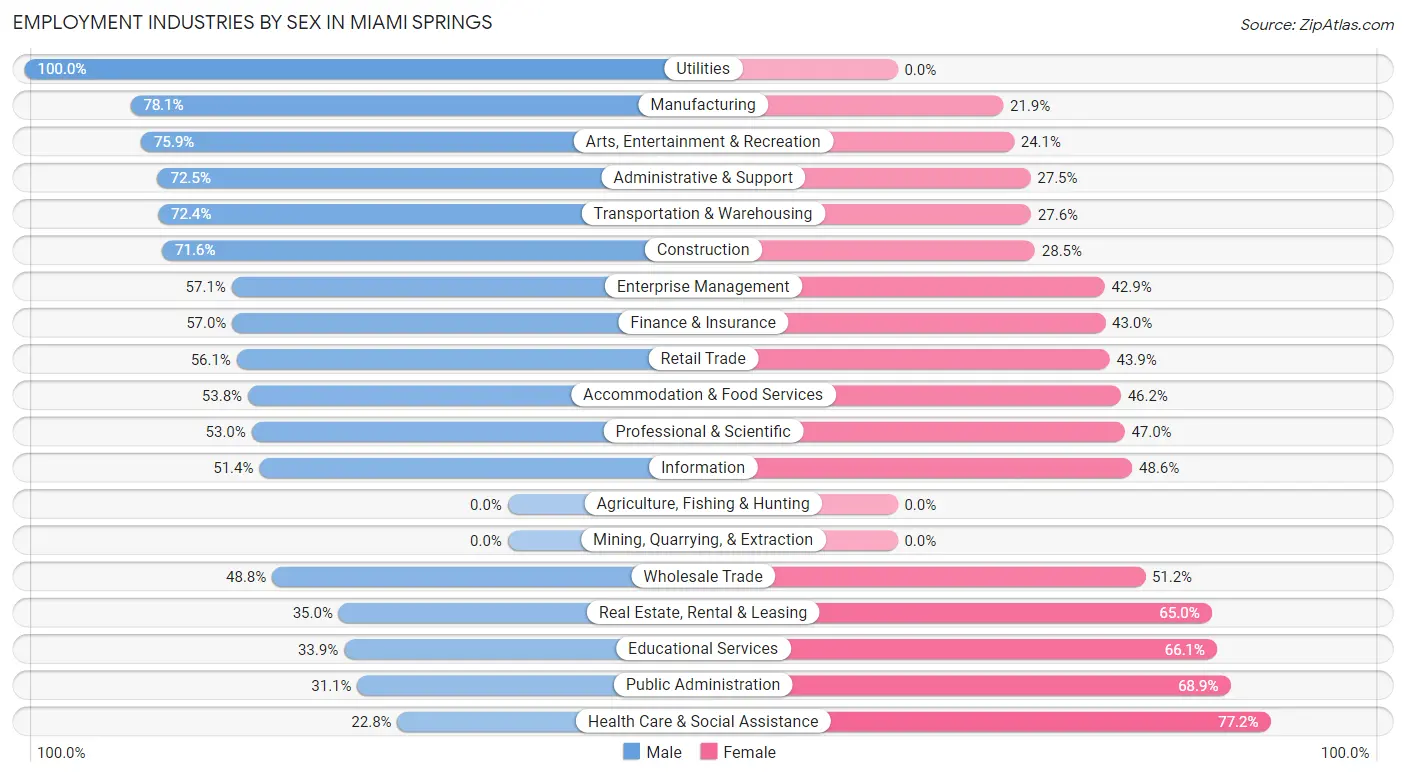
Employment Industries by Sex in Miami Springs
The Miami Springs industries that see more men than women are Utilities (100.0%), Manufacturing (78.1%), and Arts, Entertainment & Recreation (75.9%), whereas the industries that tend to have a higher number of women are Health Care & Social Assistance (77.2%), Public Administration (68.9%), and Educational Services (66.1%).
| Industry | Male | Female |
| Agriculture, Fishing & Hunting | 0 (0.0%) | 0 (0.0%) |
| Mining, Quarrying, & Extraction | 0 (0.0%) | 0 (0.0%) |
| Construction | 405 (71.6%) | 161 (28.4%) |
| Manufacturing | 482 (78.1%) | 135 (21.9%) |
| Wholesale Trade | 99 (48.8%) | 104 (51.2%) |
| Retail Trade | 253 (56.1%) | 198 (43.9%) |
| Transportation & Warehousing | 550 (72.4%) | 210 (27.6%) |
| Utilities | 25 (100.0%) | 0 (0.0%) |
| Information | 181 (51.4%) | 171 (48.6%) |
| Finance & Insurance | 150 (57.0%) | 113 (43.0%) |
| Real Estate, Rental & Leasing | 78 (35.0%) | 145 (65.0%) |
| Professional & Scientific | 352 (53.0%) | 312 (47.0%) |
| Enterprise Management | 8 (57.1%) | 6 (42.9%) |
| Administrative & Support | 158 (72.5%) | 60 (27.5%) |
| Educational Services | 225 (33.9%) | 439 (66.1%) |
| Health Care & Social Assistance | 171 (22.8%) | 578 (77.2%) |
| Arts, Entertainment & Recreation | 104 (75.9%) | 33 (24.1%) |
| Accommodation & Food Services | 327 (53.8%) | 281 (46.2%) |
| Public Administration | 206 (31.1%) | 456 (68.9%) |
| Total | 3,879 (51.6%) | 3,641 (48.4%) |
Education in Miami Springs
School Enrollment in Miami Springs
The most common levels of schooling among the 2,725 students in Miami Springs are college / undergraduate (758 | 27.8%), middle school (506 | 18.6%), and high school (451 | 16.6%).
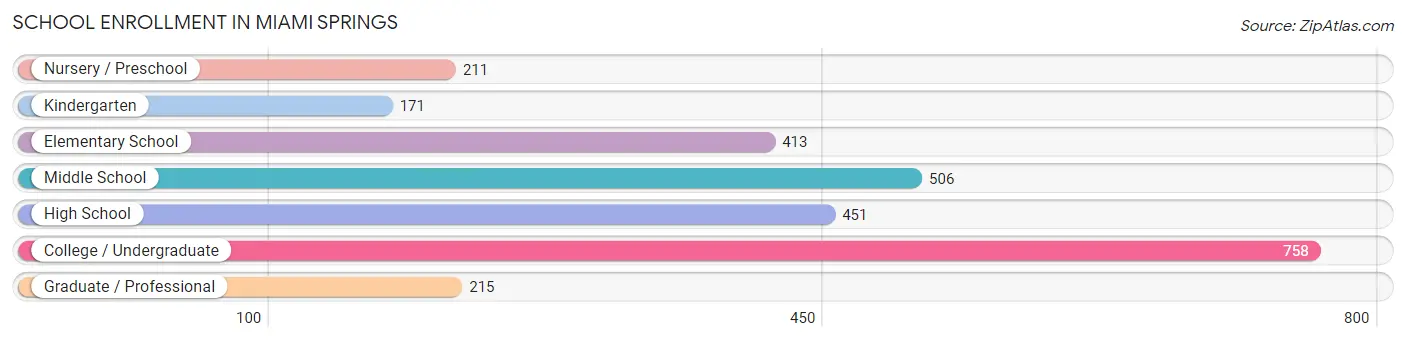
| School Level | # Students | % Students |
| Nursery / Preschool | 211 | 7.7% |
| Kindergarten | 171 | 6.3% |
| Elementary School | 413 | 15.2% |
| Middle School | 506 | 18.6% |
| High School | 451 | 16.6% |
| College / Undergraduate | 758 | 27.8% |
| Graduate / Professional | 215 | 7.9% |
| Total | 2,725 | 100.0% |
School Enrollment by Age by Funding Source in Miami Springs
Out of a total of 2,725 students who are enrolled in schools in Miami Springs, 1,003 (36.8%) attend a private institution, while the remaining 1,722 (63.2%) are enrolled in public schools. The age group of 35 years and over has the highest likelihood of being enrolled in private schools, with 96 (92.3% in the age bracket) enrolled. Conversely, the age group of 25 to 34 year olds has the lowest likelihood of being enrolled in a private school, with 110 (78.0% in the age bracket) attending a public institution.
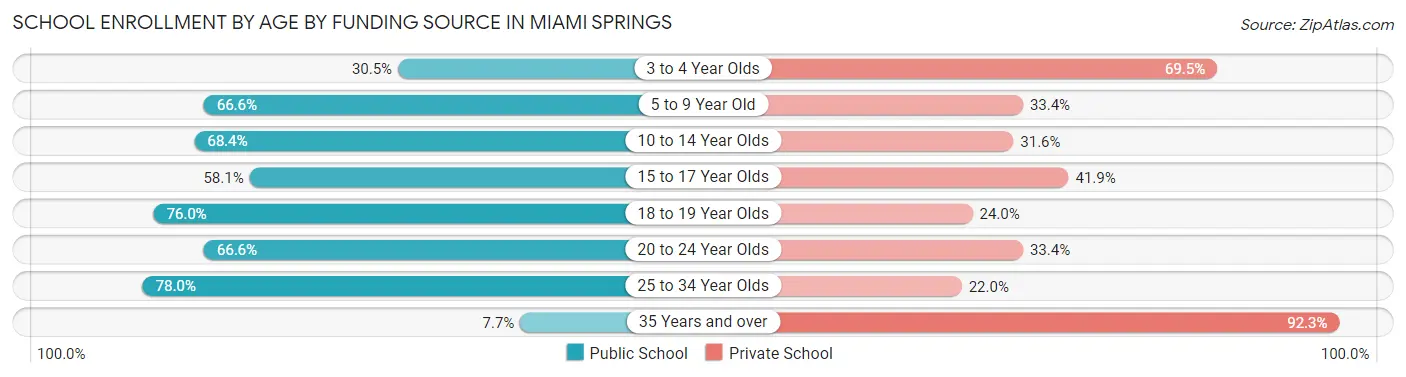
| Age Bracket | Public School | Private School |
| 3 to 4 Year Olds | 60 (30.5%) | 137 (69.5%) |
| 5 to 9 Year Old | 387 (66.6%) | 194 (33.4%) |
| 10 to 14 Year Olds | 396 (68.4%) | 183 (31.6%) |
| 15 to 17 Year Olds | 154 (58.1%) | 111 (41.9%) |
| 18 to 19 Year Olds | 288 (76.0%) | 91 (24.0%) |
| 20 to 24 Year Olds | 319 (66.6%) | 160 (33.4%) |
| 25 to 34 Year Olds | 110 (78.0%) | 31 (22.0%) |
| 35 Years and over | 8 (7.7%) | 96 (92.3%) |
| Total | 1,722 (63.2%) | 1,003 (36.8%) |
Educational Attainment by Field of Study in Miami Springs
Business (1,031 | 23.8%), science & technology (538 | 12.4%), education (422 | 9.8%), engineering (414 | 9.6%), and social sciences (413 | 9.6%) are the most common fields of study among 4,322 individuals in Miami Springs who have obtained a bachelor's degree or higher.
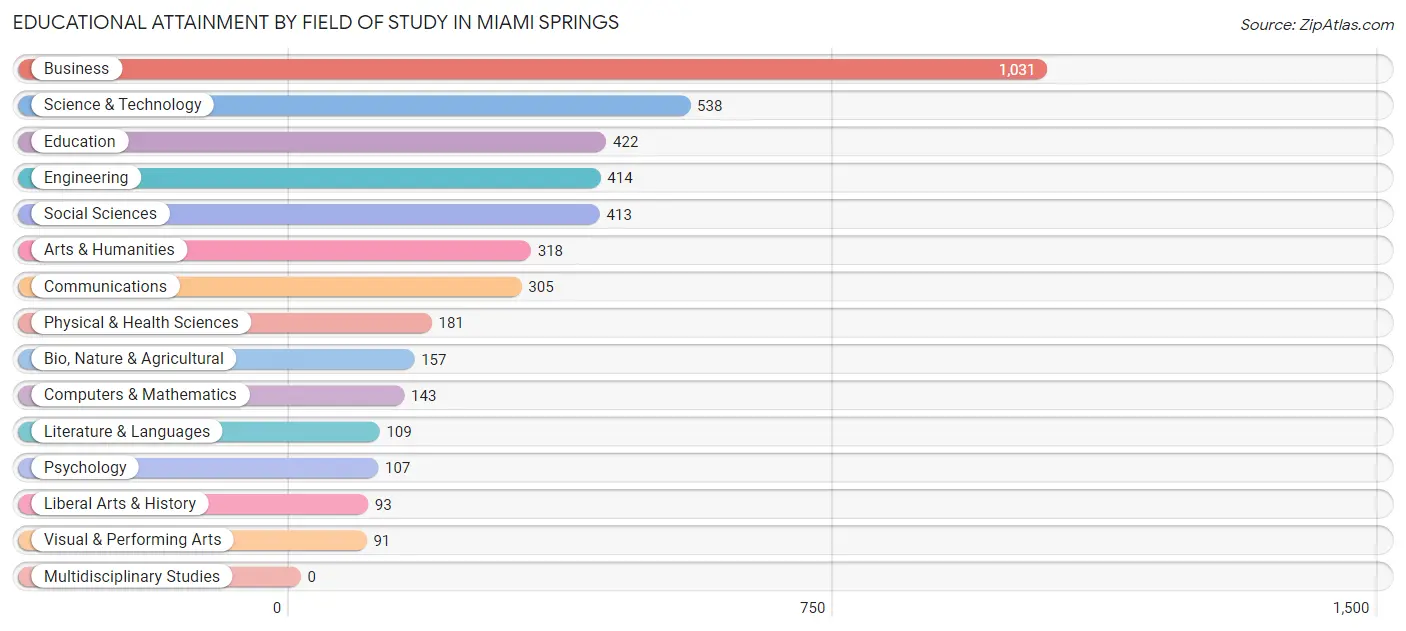
| Field of Study | # Graduates | % Graduates |
| Computers & Mathematics | 143 | 3.3% |
| Bio, Nature & Agricultural | 157 | 3.6% |
| Physical & Health Sciences | 181 | 4.2% |
| Psychology | 107 | 2.5% |
| Social Sciences | 413 | 9.6% |
| Engineering | 414 | 9.6% |
| Multidisciplinary Studies | 0 | 0.0% |
| Science & Technology | 538 | 12.4% |
| Business | 1,031 | 23.8% |
| Education | 422 | 9.8% |
| Literature & Languages | 109 | 2.5% |
| Liberal Arts & History | 93 | 2.1% |
| Visual & Performing Arts | 91 | 2.1% |
| Communications | 305 | 7.1% |
| Arts & Humanities | 318 | 7.4% |
| Total | 4,322 | 100.0% |
Transportation & Commute in Miami Springs
Vehicle Availability by Sex in Miami Springs
The most prevalent vehicle ownership categories in Miami Springs are males with 2 vehicles (1,621, accounting for 42.0%) and females with 2 vehicles (1,268, making up 44.8%).
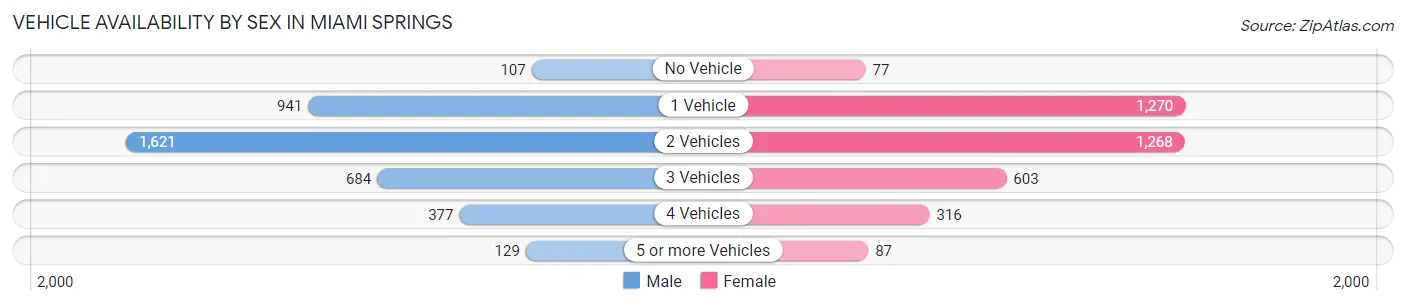
| Vehicles Available | Male | Female |
| No Vehicle | 107 (2.8%) | 77 (2.1%) |
| 1 Vehicle | 941 (24.4%) | 1,270 (35.1%) |
| 2 Vehicles | 1,621 (42.0%) | 1,268 (35.0%) |
| 3 Vehicles | 684 (17.7%) | 603 (16.7%) |
| 4 Vehicles | 377 (9.8%) | 316 (8.7%) |
| 5 or more Vehicles | 129 (3.3%) | 87 (2.4%) |
| Total | 3,859 (100.0%) | 3,621 (100.0%) |
Commute Time in Miami Springs
The most frequently occuring commute durations in Miami Springs are 20 to 24 minutes (1,021 commuters, 15.6%), 30 to 34 minutes (1,009 commuters, 15.5%), and 15 to 19 minutes (797 commuters, 12.2%).
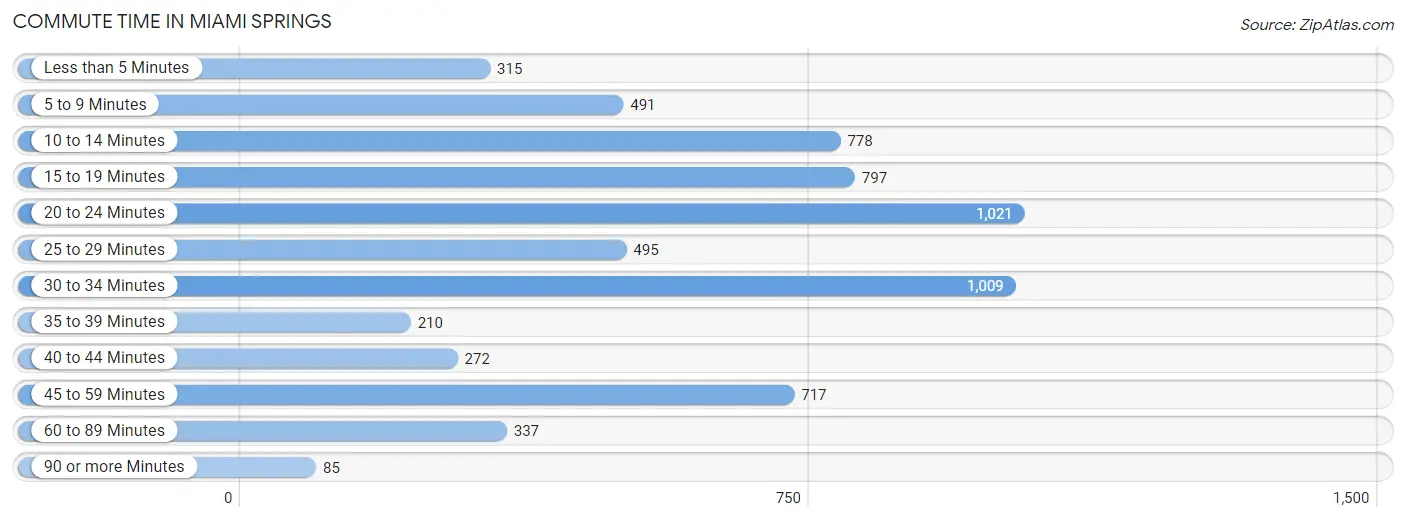
| Commute Time | # Commuters | % Commuters |
| Less than 5 Minutes | 315 | 4.8% |
| 5 to 9 Minutes | 491 | 7.5% |
| 10 to 14 Minutes | 778 | 11.9% |
| 15 to 19 Minutes | 797 | 12.2% |
| 20 to 24 Minutes | 1,021 | 15.6% |
| 25 to 29 Minutes | 495 | 7.6% |
| 30 to 34 Minutes | 1,009 | 15.5% |
| 35 to 39 Minutes | 210 | 3.2% |
| 40 to 44 Minutes | 272 | 4.2% |
| 45 to 59 Minutes | 717 | 11.0% |
| 60 to 89 Minutes | 337 | 5.2% |
| 90 or more Minutes | 85 | 1.3% |
Commute Time by Sex in Miami Springs
The most common commute times in Miami Springs are 20 to 24 minutes (615 commuters, 17.2%) for males and 30 to 34 minutes (460 commuters, 15.5%) for females.
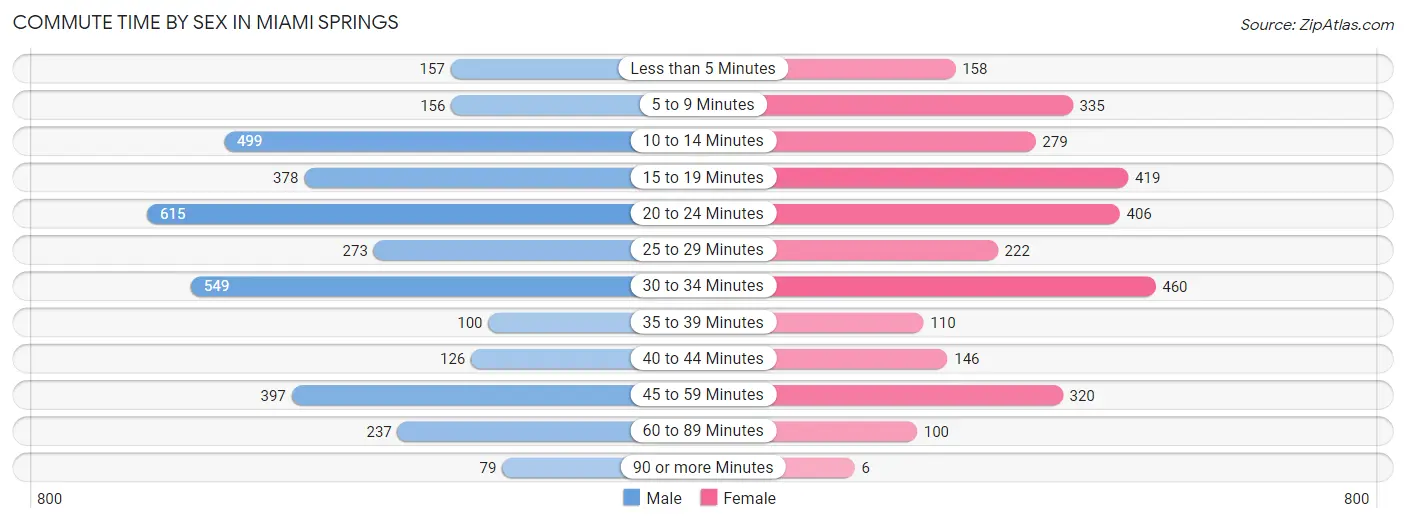
| Commute Time | Male | Female |
| Less than 5 Minutes | 157 (4.4%) | 158 (5.3%) |
| 5 to 9 Minutes | 156 (4.4%) | 335 (11.3%) |
| 10 to 14 Minutes | 499 (14.0%) | 279 (9.4%) |
| 15 to 19 Minutes | 378 (10.6%) | 419 (14.1%) |
| 20 to 24 Minutes | 615 (17.2%) | 406 (13.7%) |
| 25 to 29 Minutes | 273 (7.7%) | 222 (7.5%) |
| 30 to 34 Minutes | 549 (15.4%) | 460 (15.5%) |
| 35 to 39 Minutes | 100 (2.8%) | 110 (3.7%) |
| 40 to 44 Minutes | 126 (3.5%) | 146 (4.9%) |
| 45 to 59 Minutes | 397 (11.1%) | 320 (10.8%) |
| 60 to 89 Minutes | 237 (6.7%) | 100 (3.4%) |
| 90 or more Minutes | 79 (2.2%) | 6 (0.2%) |
Time of Departure to Work by Sex in Miami Springs
The most frequent times of departure to work in Miami Springs are 8:00 AM to 8:29 AM (589, 16.5%) for males and 8:00 AM to 8:29 AM (667, 22.5%) for females.
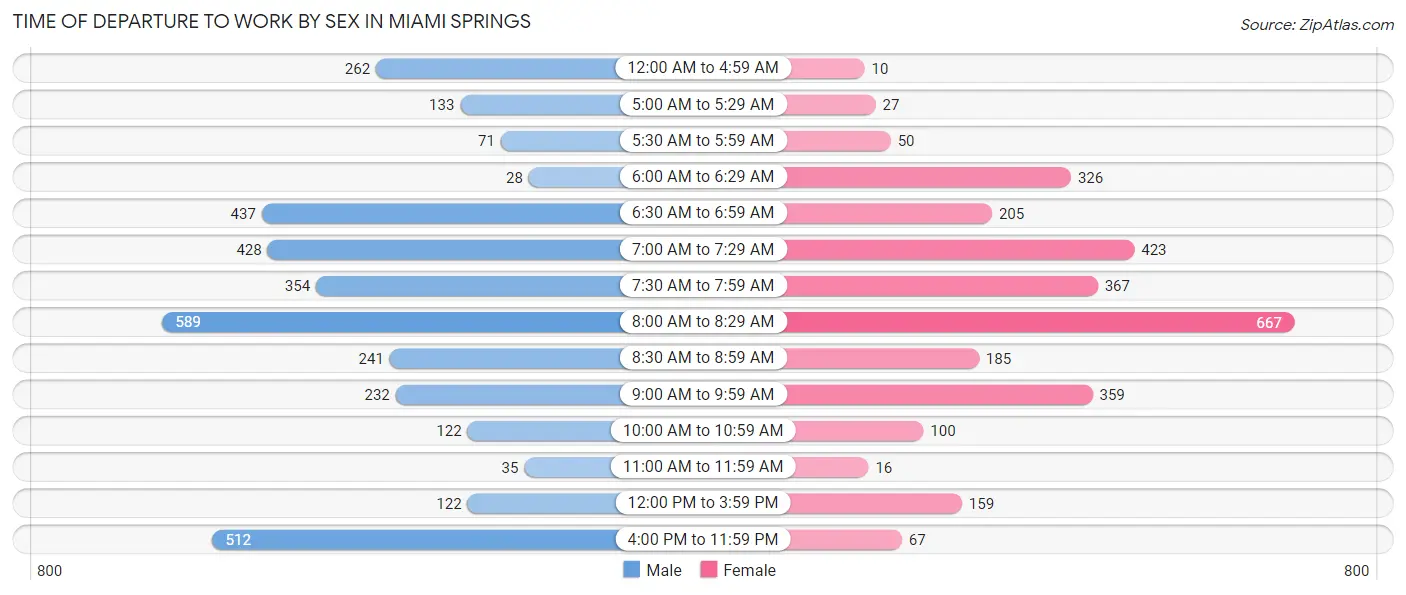
| Time of Departure | Male | Female |
| 12:00 AM to 4:59 AM | 262 (7.3%) | 10 (0.3%) |
| 5:00 AM to 5:29 AM | 133 (3.7%) | 27 (0.9%) |
| 5:30 AM to 5:59 AM | 71 (2.0%) | 50 (1.7%) |
| 6:00 AM to 6:29 AM | 28 (0.8%) | 326 (11.0%) |
| 6:30 AM to 6:59 AM | 437 (12.2%) | 205 (6.9%) |
| 7:00 AM to 7:29 AM | 428 (12.0%) | 423 (14.3%) |
| 7:30 AM to 7:59 AM | 354 (9.9%) | 367 (12.4%) |
| 8:00 AM to 8:29 AM | 589 (16.5%) | 667 (22.5%) |
| 8:30 AM to 8:59 AM | 241 (6.8%) | 185 (6.2%) |
| 9:00 AM to 9:59 AM | 232 (6.5%) | 359 (12.1%) |
| 10:00 AM to 10:59 AM | 122 (3.4%) | 100 (3.4%) |
| 11:00 AM to 11:59 AM | 35 (1.0%) | 16 (0.5%) |
| 12:00 PM to 3:59 PM | 122 (3.4%) | 159 (5.4%) |
| 4:00 PM to 11:59 PM | 512 (14.4%) | 67 (2.3%) |
| Total | 3,566 (100.0%) | 2,961 (100.0%) |
Housing Occupancy in Miami Springs
Occupancy by Ownership in Miami Springs
Of the total 5,490 dwellings in Miami Springs, owner-occupied units account for 3,446 (62.8%), while renter-occupied units make up 2,044 (37.2%).
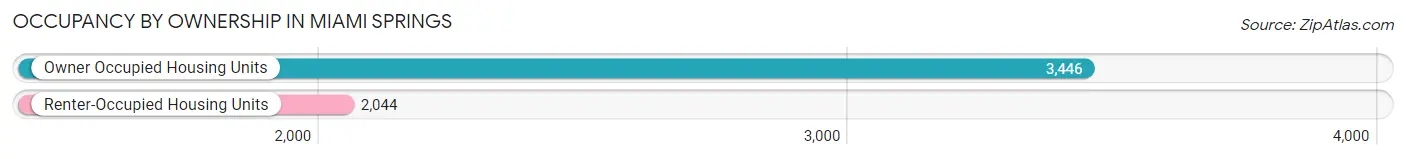
| Occupancy | # Housing Units | % Housing Units |
| Owner Occupied Housing Units | 3,446 | 62.8% |
| Renter-Occupied Housing Units | 2,044 | 37.2% |
| Total Occupied Housing Units | 5,490 | 100.0% |
Occupancy by Household Size in Miami Springs
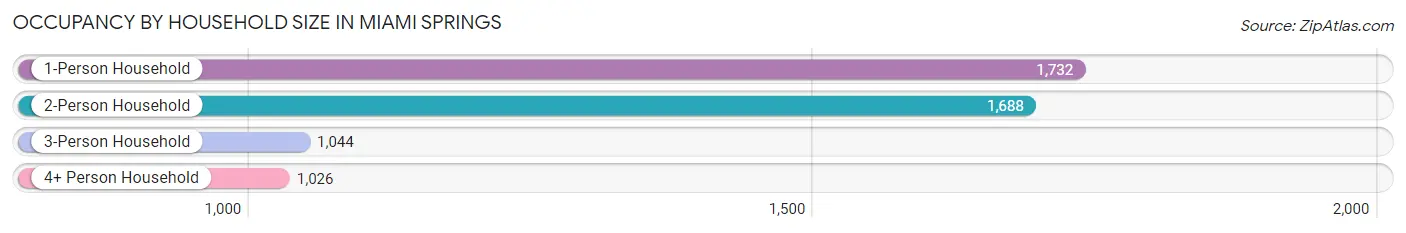
| Household Size | # Housing Units | % Housing Units |
| 1-Person Household | 1,732 | 31.6% |
| 2-Person Household | 1,688 | 30.7% |
| 3-Person Household | 1,044 | 19.0% |
| 4+ Person Household | 1,026 | 18.7% |
| Total Housing Units | 5,490 | 100.0% |
Occupancy by Ownership by Household Size in Miami Springs
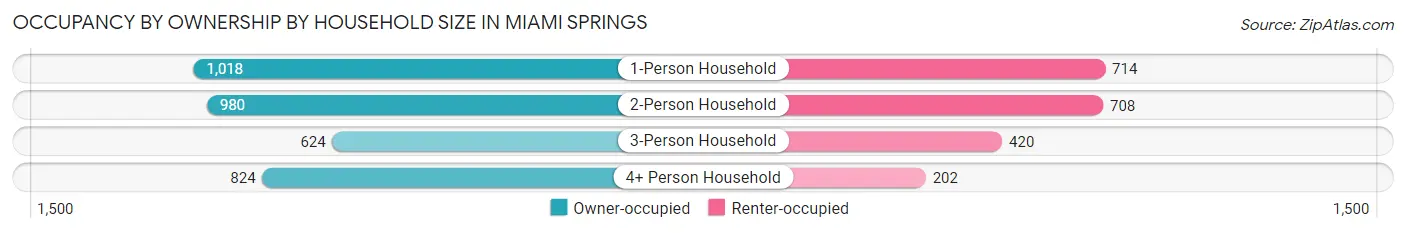
| Household Size | Owner-occupied | Renter-occupied |
| 1-Person Household | 1,018 (58.8%) | 714 (41.2%) |
| 2-Person Household | 980 (58.1%) | 708 (41.9%) |
| 3-Person Household | 624 (59.8%) | 420 (40.2%) |
| 4+ Person Household | 824 (80.3%) | 202 (19.7%) |
| Total Housing Units | 3,446 (62.8%) | 2,044 (37.2%) |
Occupancy by Educational Attainment in Miami Springs
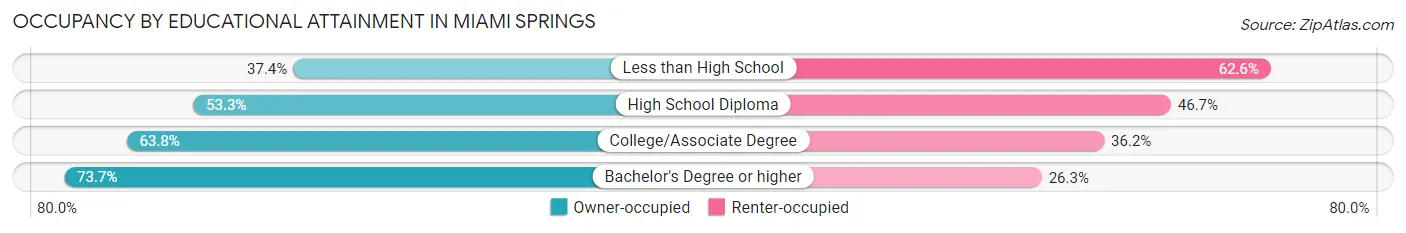
| Household Size | Owner-occupied | Renter-occupied |
| Less than High School | 254 (37.4%) | 425 (62.6%) |
| High School Diploma | 539 (53.3%) | 473 (46.7%) |
| College/Associate Degree | 957 (63.8%) | 542 (36.2%) |
| Bachelor's Degree or higher | 1,696 (73.7%) | 604 (26.3%) |
Occupancy by Age of Householder in Miami Springs
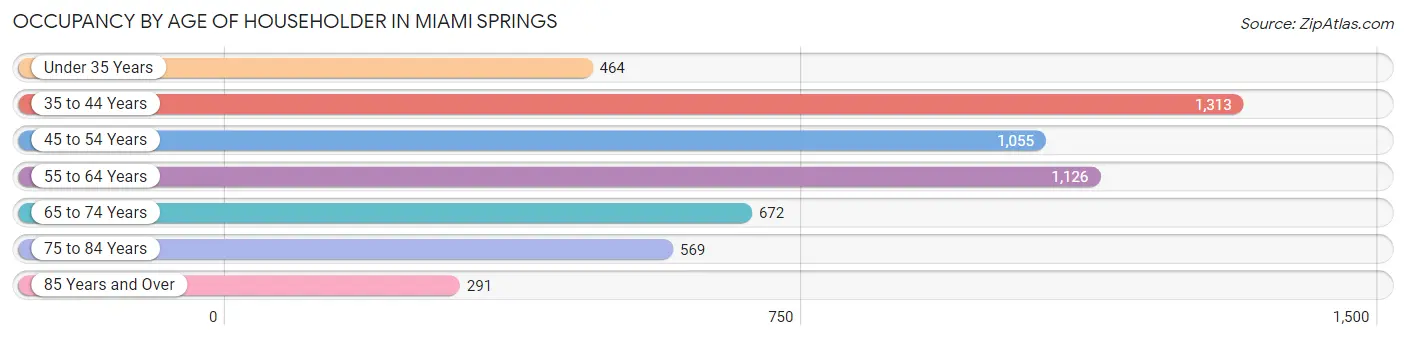
| Age Bracket | # Households | % Households |
| Under 35 Years | 464 | 8.5% |
| 35 to 44 Years | 1,313 | 23.9% |
| 45 to 54 Years | 1,055 | 19.2% |
| 55 to 64 Years | 1,126 | 20.5% |
| 65 to 74 Years | 672 | 12.2% |
| 75 to 84 Years | 569 | 10.4% |
| 85 Years and Over | 291 | 5.3% |
| Total | 5,490 | 100.0% |
Housing Finances in Miami Springs
Median Income by Occupancy in Miami Springs
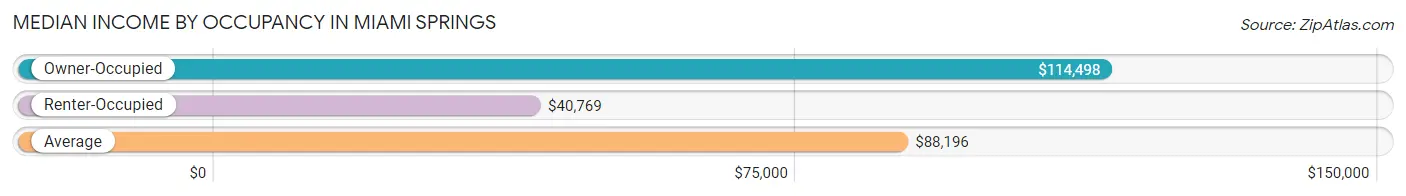
| Occupancy Type | # Households | Median Income |
| Owner-Occupied | 3,446 (62.8%) | $114,498 |
| Renter-Occupied | 2,044 (37.2%) | $40,769 |
| Average | 5,490 (100.0%) | $88,196 |
Occupancy by Householder Income Bracket in Miami Springs
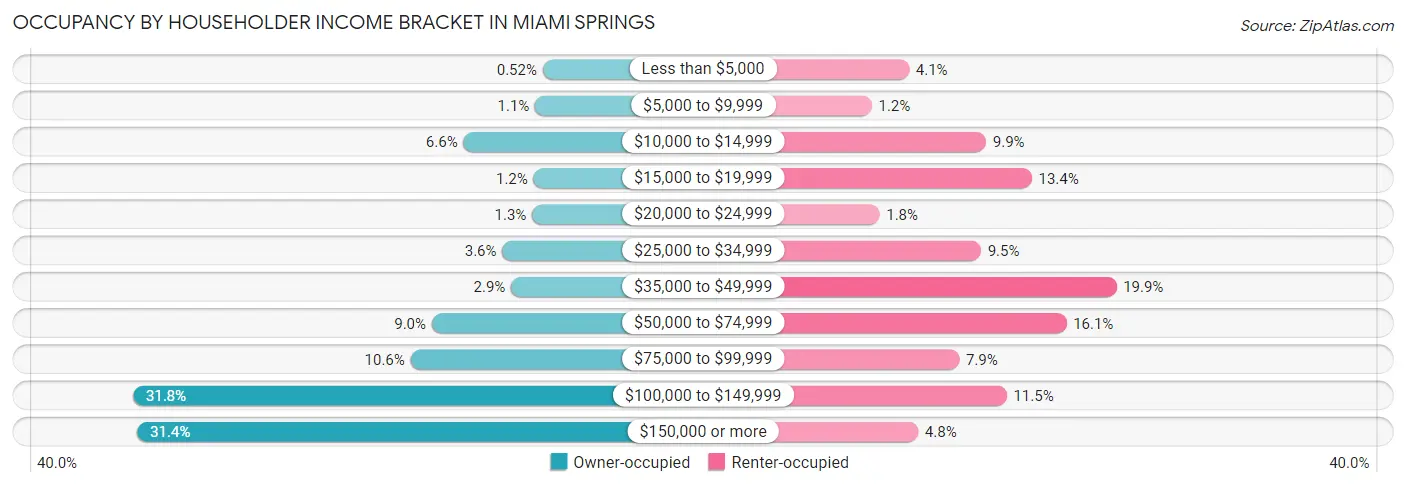
| Income Bracket | Owner-occupied | Renter-occupied |
| Less than $5,000 | 18 (0.5%) | 83 (4.1%) |
| $5,000 to $9,999 | 38 (1.1%) | 25 (1.2%) |
| $10,000 to $14,999 | 226 (6.6%) | 203 (9.9%) |
| $15,000 to $19,999 | 42 (1.2%) | 274 (13.4%) |
| $20,000 to $24,999 | 46 (1.3%) | 37 (1.8%) |
| $25,000 to $34,999 | 124 (3.6%) | 195 (9.5%) |
| $35,000 to $49,999 | 101 (2.9%) | 406 (19.9%) |
| $50,000 to $74,999 | 309 (9.0%) | 328 (16.1%) |
| $75,000 to $99,999 | 365 (10.6%) | 161 (7.9%) |
| $100,000 to $149,999 | 1,094 (31.8%) | 235 (11.5%) |
| $150,000 or more | 1,083 (31.4%) | 97 (4.8%) |
| Total | 3,446 (100.0%) | 2,044 (100.0%) |
Monthly Housing Cost Tiers in Miami Springs
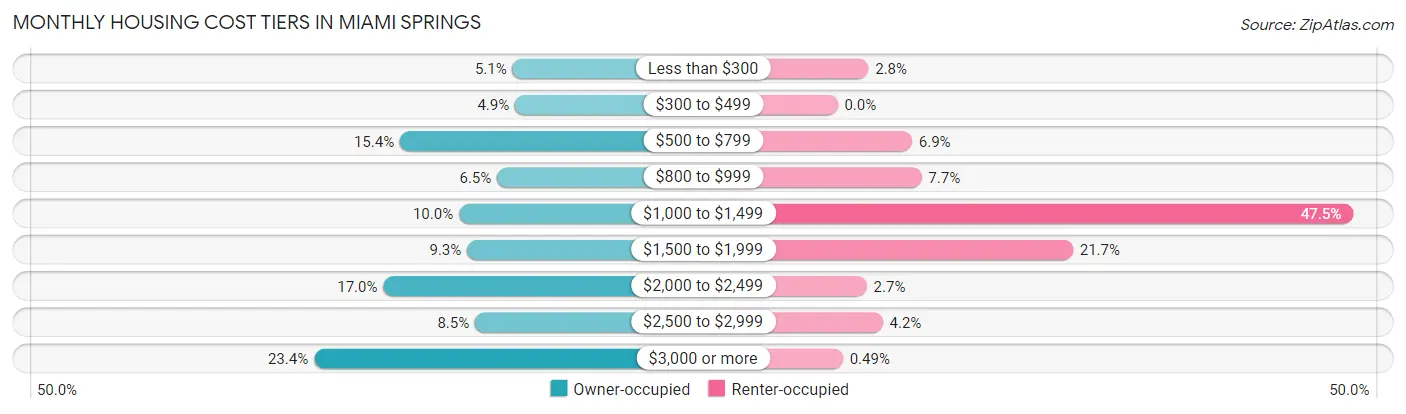
| Monthly Cost | Owner-occupied | Renter-occupied |
| Less than $300 | 175 (5.1%) | 58 (2.8%) |
| $300 to $499 | 167 (4.9%) | 0 (0.0%) |
| $500 to $799 | 532 (15.4%) | 140 (6.9%) |
| $800 to $999 | 224 (6.5%) | 158 (7.7%) |
| $1,000 to $1,499 | 345 (10.0%) | 970 (47.5%) |
| $1,500 to $1,999 | 319 (9.3%) | 443 (21.7%) |
| $2,000 to $2,499 | 585 (17.0%) | 55 (2.7%) |
| $2,500 to $2,999 | 294 (8.5%) | 85 (4.2%) |
| $3,000 or more | 805 (23.4%) | 10 (0.5%) |
| Total | 3,446 (100.0%) | 2,044 (100.0%) |
Physical Housing Characteristics in Miami Springs
Housing Structures in Miami Springs
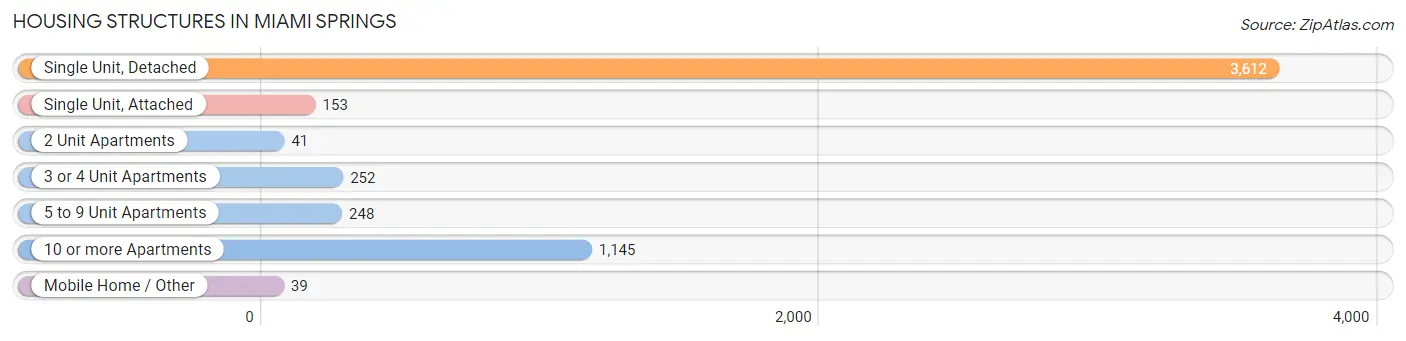
| Structure Type | # Housing Units | % Housing Units |
| Single Unit, Detached | 3,612 | 65.8% |
| Single Unit, Attached | 153 | 2.8% |
| 2 Unit Apartments | 41 | 0.7% |
| 3 or 4 Unit Apartments | 252 | 4.6% |
| 5 to 9 Unit Apartments | 248 | 4.5% |
| 10 or more Apartments | 1,145 | 20.9% |
| Mobile Home / Other | 39 | 0.7% |
| Total | 5,490 | 100.0% |
Housing Structures by Occupancy in Miami Springs
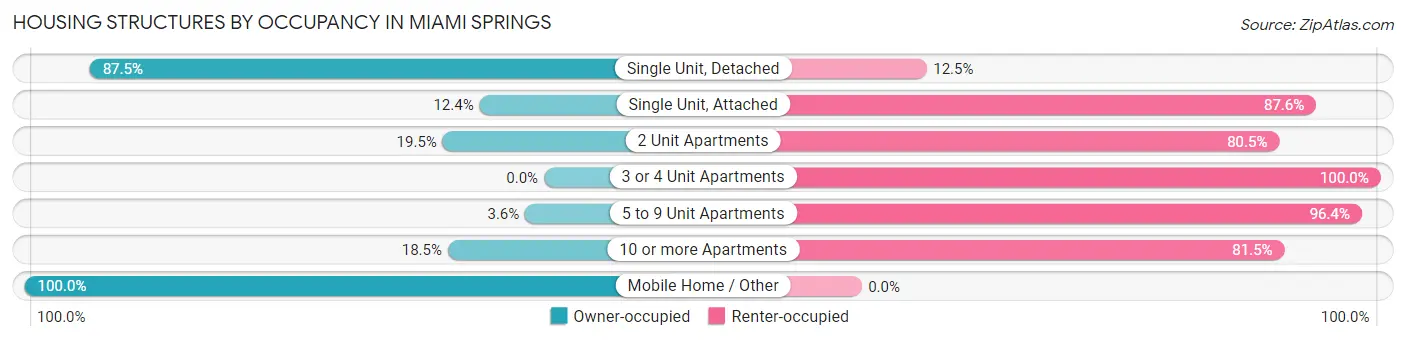
| Structure Type | Owner-occupied | Renter-occupied |
| Single Unit, Detached | 3,159 (87.5%) | 453 (12.5%) |
| Single Unit, Attached | 19 (12.4%) | 134 (87.6%) |
| 2 Unit Apartments | 8 (19.5%) | 33 (80.5%) |
| 3 or 4 Unit Apartments | 0 (0.0%) | 252 (100.0%) |
| 5 to 9 Unit Apartments | 9 (3.6%) | 239 (96.4%) |
| 10 or more Apartments | 212 (18.5%) | 933 (81.5%) |
| Mobile Home / Other | 39 (100.0%) | 0 (0.0%) |
| Total | 3,446 (62.8%) | 2,044 (37.2%) |
Housing Structures by Number of Rooms in Miami Springs
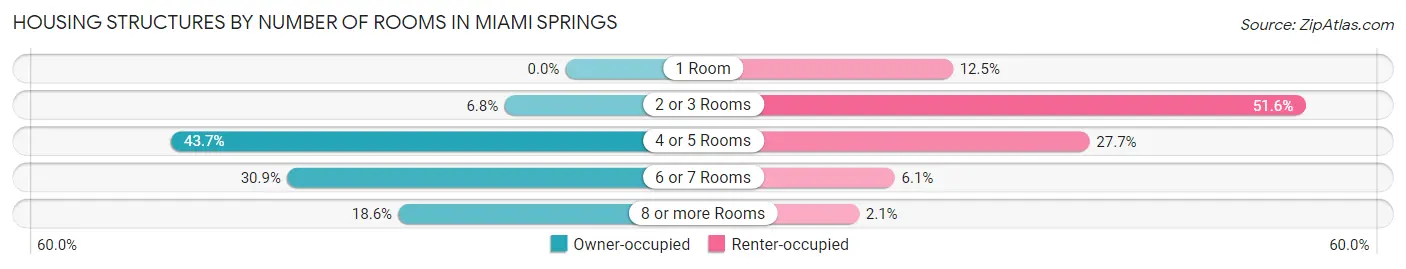
| Number of Rooms | Owner-occupied | Renter-occupied |
| 1 Room | 0 (0.0%) | 256 (12.5%) |
| 2 or 3 Rooms | 234 (6.8%) | 1,055 (51.6%) |
| 4 or 5 Rooms | 1,507 (43.7%) | 566 (27.7%) |
| 6 or 7 Rooms | 1,065 (30.9%) | 124 (6.1%) |
| 8 or more Rooms | 640 (18.6%) | 43 (2.1%) |
| Total | 3,446 (100.0%) | 2,044 (100.0%) |
Housing Structure by Heating Type in Miami Springs
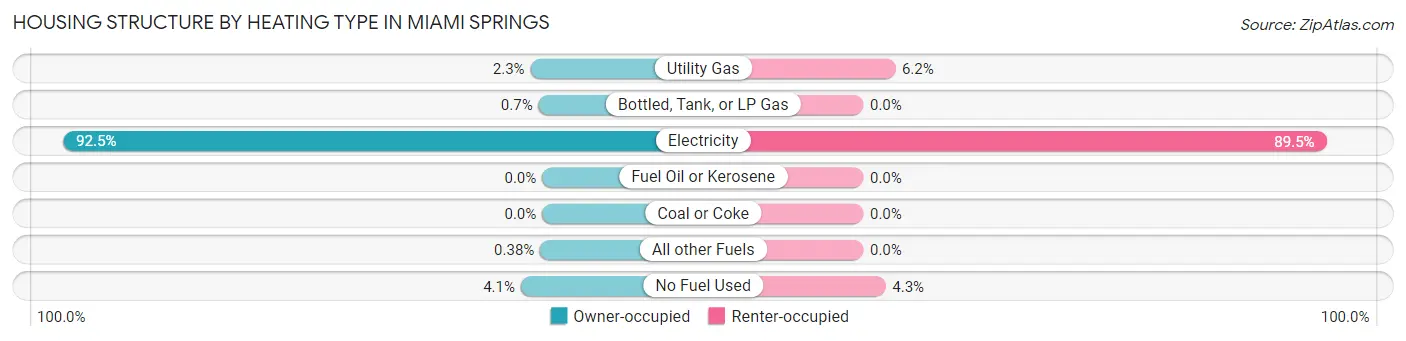
| Heating Type | Owner-occupied | Renter-occupied |
| Utility Gas | 78 (2.3%) | 126 (6.2%) |
| Bottled, Tank, or LP Gas | 24 (0.7%) | 0 (0.0%) |
| Electricity | 3,189 (92.5%) | 1,830 (89.5%) |
| Fuel Oil or Kerosene | 0 (0.0%) | 0 (0.0%) |
| Coal or Coke | 0 (0.0%) | 0 (0.0%) |
| All other Fuels | 13 (0.4%) | 0 (0.0%) |
| No Fuel Used | 142 (4.1%) | 88 (4.3%) |
| Total | 3,446 (100.0%) | 2,044 (100.0%) |
Household Vehicle Usage in Miami Springs
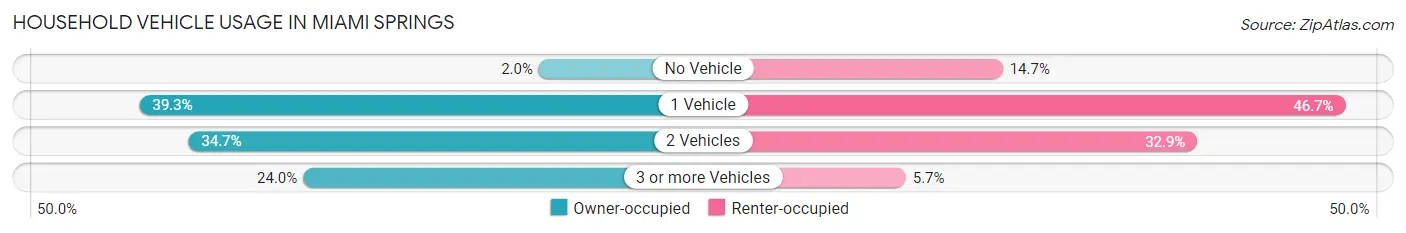
| Vehicles per Household | Owner-occupied | Renter-occupied |
| No Vehicle | 69 (2.0%) | 301 (14.7%) |
| 1 Vehicle | 1,354 (39.3%) | 955 (46.7%) |
| 2 Vehicles | 1,196 (34.7%) | 672 (32.9%) |
| 3 or more Vehicles | 827 (24.0%) | 116 (5.7%) |
| Total | 3,446 (100.0%) | 2,044 (100.0%) |
Real Estate & Mortgages in Miami Springs
Real Estate and Mortgage Overview in Miami Springs
| Characteristic | Without Mortgage | With Mortgage |
| Housing Units | 1,455 | 1,991 |
| Median Property Value | $457,800 | $493,800 |
| Median Household Income | $87,634 | $792 |
| Monthly Housing Costs | $654 | $805 |
| Real Estate Taxes | $4,006 | $81 |
Property Value by Mortgage Status in Miami Springs
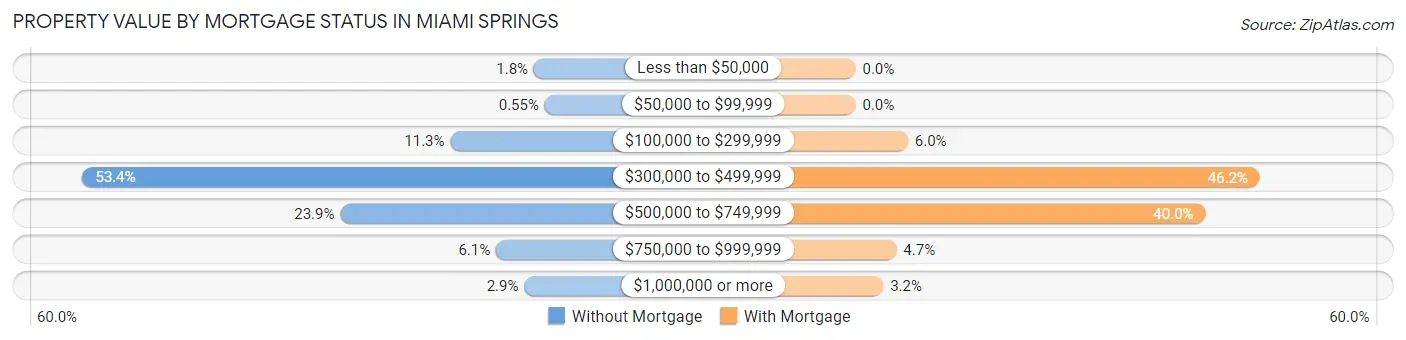
| Property Value | Without Mortgage | With Mortgage |
| Less than $50,000 | 26 (1.8%) | 0 (0.0%) |
| $50,000 to $99,999 | 8 (0.5%) | 0 (0.0%) |
| $100,000 to $299,999 | 165 (11.3%) | 119 (6.0%) |
| $300,000 to $499,999 | 777 (53.4%) | 920 (46.2%) |
| $500,000 to $749,999 | 348 (23.9%) | 796 (40.0%) |
| $750,000 to $999,999 | 89 (6.1%) | 93 (4.7%) |
| $1,000,000 or more | 42 (2.9%) | 63 (3.2%) |
| Total | 1,455 (100.0%) | 1,991 (100.0%) |
Household Income by Mortgage Status in Miami Springs
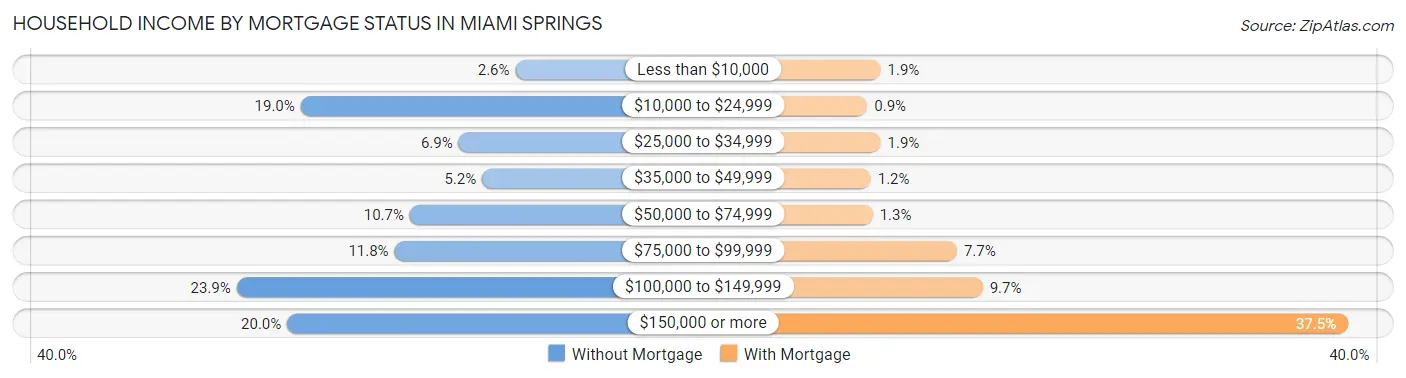
| Household Income | Without Mortgage | With Mortgage |
| Less than $10,000 | 38 (2.6%) | 38 (1.9%) |
| $10,000 to $24,999 | 276 (19.0%) | 18 (0.9%) |
| $25,000 to $34,999 | 101 (6.9%) | 38 (1.9%) |
| $35,000 to $49,999 | 75 (5.1%) | 23 (1.2%) |
| $50,000 to $74,999 | 155 (10.6%) | 26 (1.3%) |
| $75,000 to $99,999 | 172 (11.8%) | 154 (7.7%) |
| $100,000 to $149,999 | 347 (23.8%) | 193 (9.7%) |
| $150,000 or more | 291 (20.0%) | 747 (37.5%) |
| Total | 1,455 (100.0%) | 1,991 (100.0%) |
Property Value to Household Income Ratio in Miami Springs
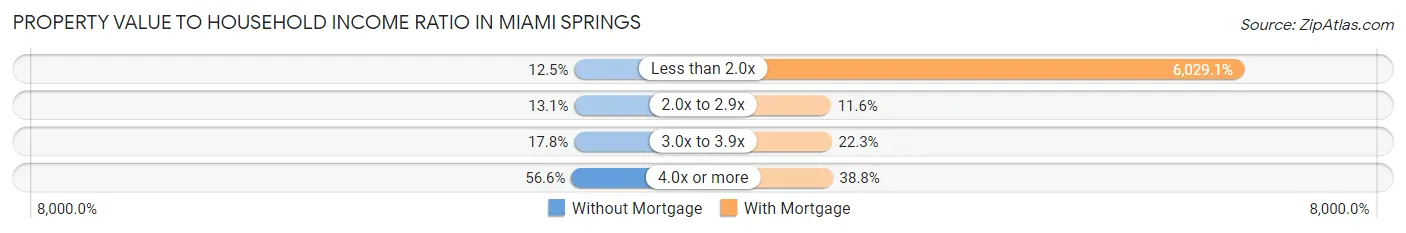
| Value-to-Income Ratio | Without Mortgage | With Mortgage |
| Less than 2.0x | 182 (12.5%) | 120,039 (6,029.1%) |
| 2.0x to 2.9x | 190 (13.1%) | 231 (11.6%) |
| 3.0x to 3.9x | 259 (17.8%) | 444 (22.3%) |
| 4.0x or more | 824 (56.6%) | 773 (38.8%) |
| Total | 1,455 (100.0%) | 1,991 (100.0%) |
Real Estate Taxes by Mortgage Status in Miami Springs
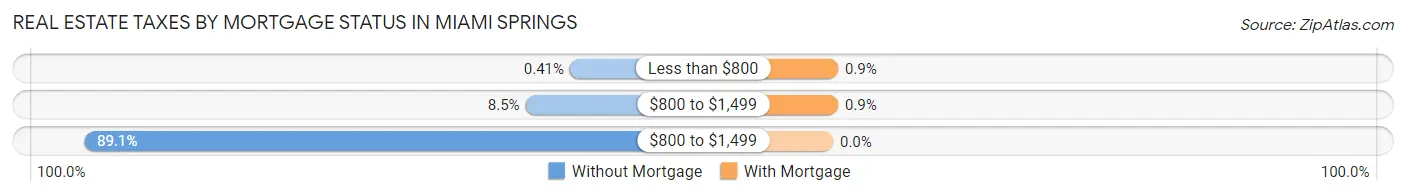
| Property Taxes | Without Mortgage | With Mortgage |
| Less than $800 | 6 (0.4%) | 18 (0.9%) |
| $800 to $1,499 | 124 (8.5%) | 18 (0.9%) |
| $800 to $1,499 | 1,297 (89.1%) | 0 (0.0%) |
| Total | 1,455 (100.0%) | 1,991 (100.0%) |
Health & Disability in Miami Springs
Health Insurance Coverage by Age in Miami Springs
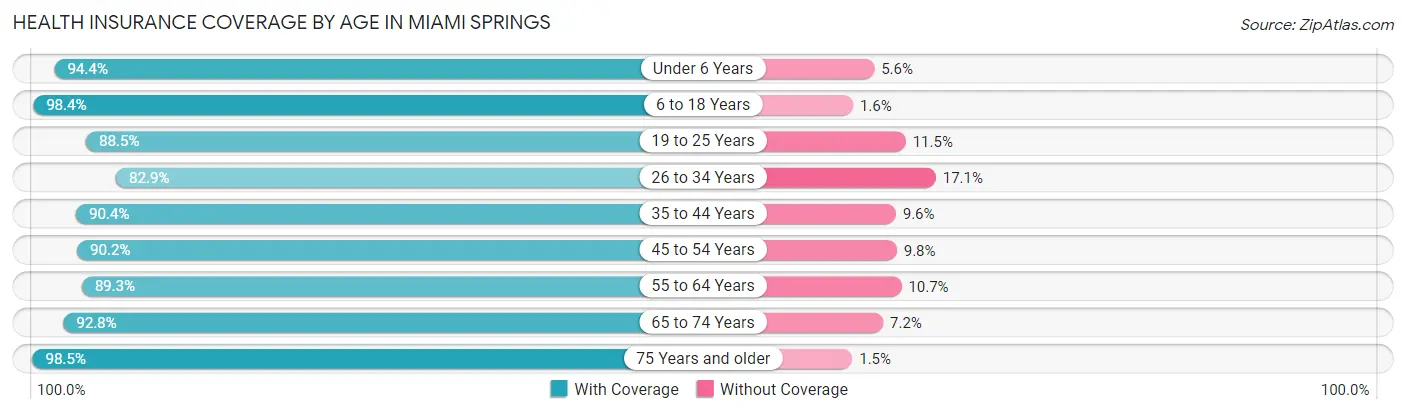
| Age Bracket | With Coverage | Without Coverage |
| Under 6 Years | 1,082 (94.4%) | 64 (5.6%) |
| 6 to 18 Years | 1,516 (98.4%) | 25 (1.6%) |
| 19 to 25 Years | 912 (88.5%) | 118 (11.5%) |
| 26 to 34 Years | 821 (82.9%) | 169 (17.1%) |
| 35 to 44 Years | 2,054 (90.4%) | 218 (9.6%) |
| 45 to 54 Years | 1,696 (90.2%) | 184 (9.8%) |
| 55 to 64 Years | 1,777 (89.3%) | 212 (10.7%) |
| 65 to 74 Years | 1,103 (92.8%) | 86 (7.2%) |
| 75 Years and older | 1,393 (98.5%) | 21 (1.5%) |
| Total | 12,354 (91.8%) | 1,097 (8.2%) |
Health Insurance Coverage by Citizenship Status in Miami Springs
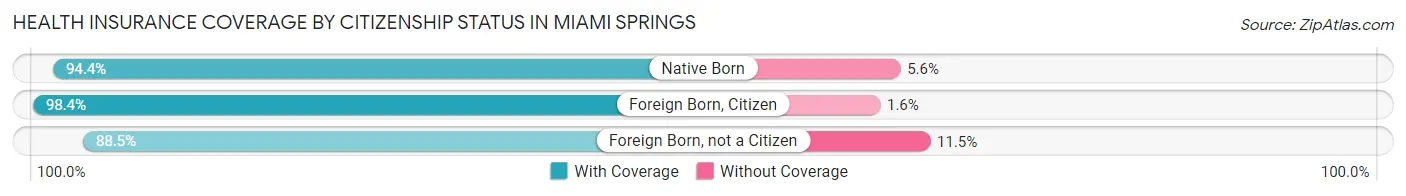
| Citizenship Status | With Coverage | Without Coverage |
| Native Born | 1,082 (94.4%) | 64 (5.6%) |
| Foreign Born, Citizen | 1,516 (98.4%) | 25 (1.6%) |
| Foreign Born, not a Citizen | 912 (88.5%) | 118 (11.5%) |
Health Insurance Coverage by Household Income in Miami Springs
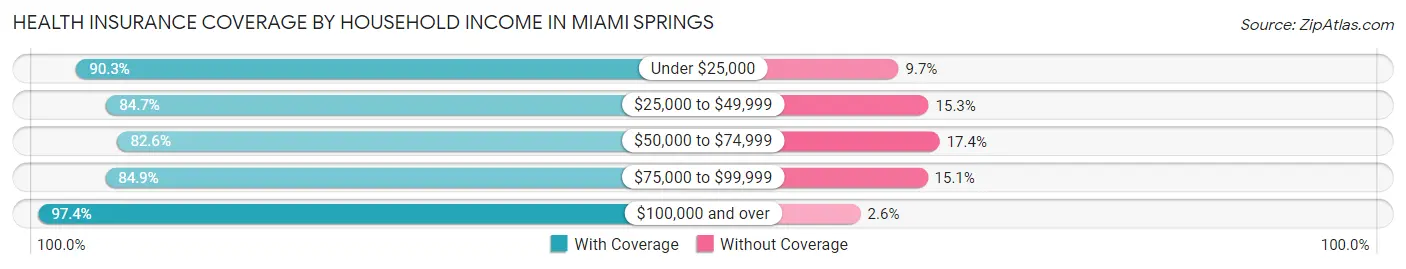
| Household Income | With Coverage | Without Coverage |
| Under $25,000 | 1,162 (90.3%) | 125 (9.7%) |
| $25,000 to $49,999 | 1,558 (84.7%) | 282 (15.3%) |
| $50,000 to $74,999 | 1,319 (82.6%) | 278 (17.4%) |
| $75,000 to $99,999 | 1,278 (84.9%) | 228 (15.1%) |
| $100,000 and over | 6,862 (97.4%) | 183 (2.6%) |
Public vs Private Health Insurance Coverage by Age in Miami Springs
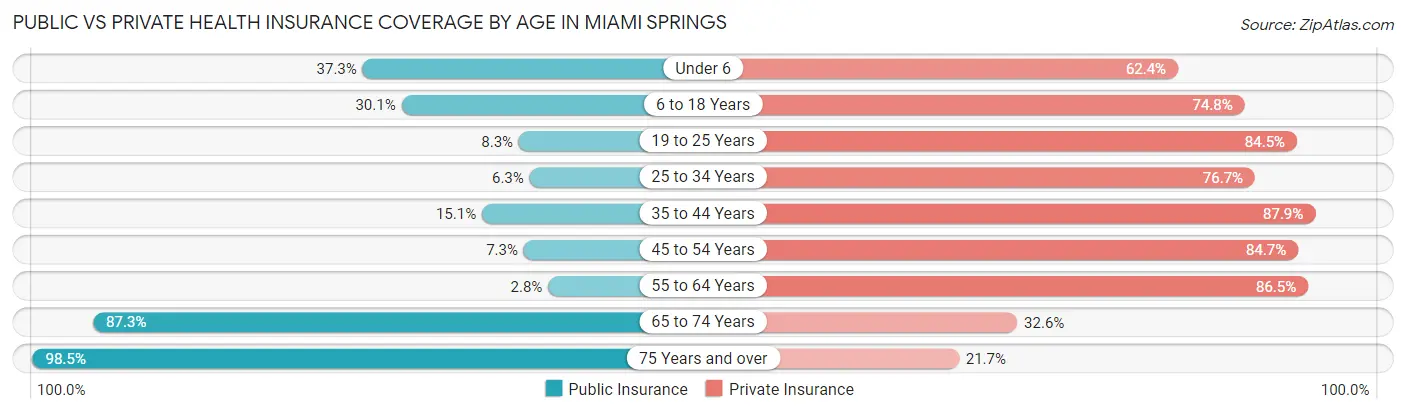
| Age Bracket | Public Insurance | Private Insurance |
| Under 6 | 427 (37.3%) | 715 (62.4%) |
| 6 to 18 Years | 463 (30.0%) | 1,152 (74.8%) |
| 19 to 25 Years | 85 (8.3%) | 870 (84.5%) |
| 25 to 34 Years | 62 (6.3%) | 759 (76.7%) |
| 35 to 44 Years | 343 (15.1%) | 1,996 (87.8%) |
| 45 to 54 Years | 138 (7.3%) | 1,592 (84.7%) |
| 55 to 64 Years | 56 (2.8%) | 1,721 (86.5%) |
| 65 to 74 Years | 1,038 (87.3%) | 387 (32.6%) |
| 75 Years and over | 1,393 (98.5%) | 307 (21.7%) |
| Total | 4,005 (29.8%) | 9,499 (70.6%) |
Disability Status by Sex by Age in Miami Springs
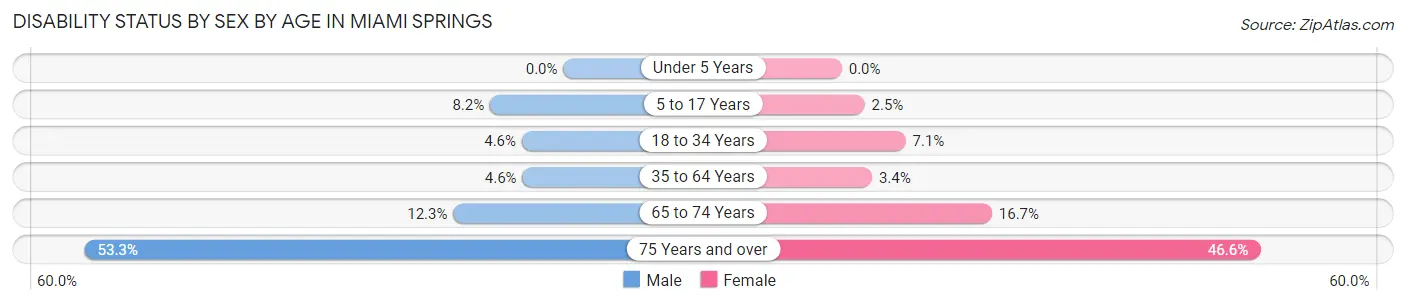
| Age Bracket | Male | Female |
| Under 5 Years | 0 (0.0%) | 0 (0.0%) |
| 5 to 17 Years | 54 (8.2%) | 20 (2.5%) |
| 18 to 34 Years | 55 (4.6%) | 78 (7.1%) |
| 35 to 64 Years | 139 (4.6%) | 104 (3.4%) |
| 65 to 74 Years | 57 (12.3%) | 121 (16.7%) |
| 75 Years and over | 185 (53.3%) | 497 (46.6%) |
Disability Class by Sex by Age in Miami Springs
Disability Class: Hearing Difficulty
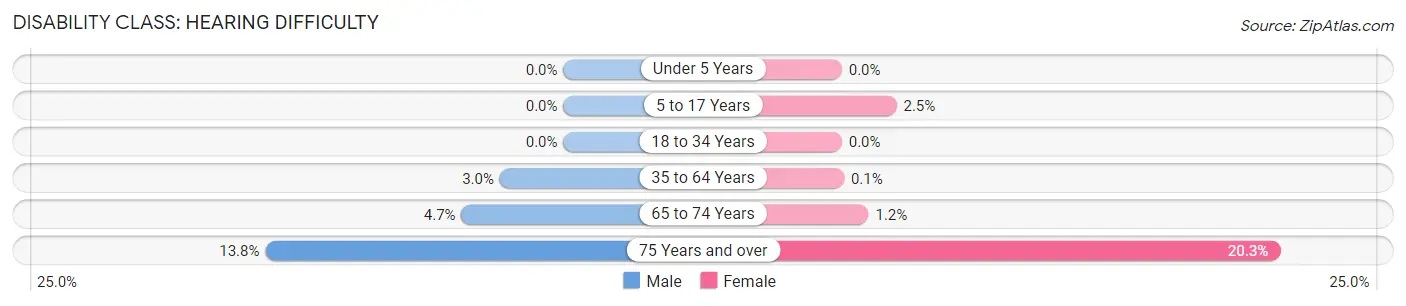
| Age Bracket | Male | Female |
| Under 5 Years | 0 (0.0%) | 0 (0.0%) |
| 5 to 17 Years | 0 (0.0%) | 20 (2.5%) |
| 18 to 34 Years | 0 (0.0%) | 0 (0.0%) |
| 35 to 64 Years | 90 (2.9%) | 3 (0.1%) |
| 65 to 74 Years | 22 (4.7%) | 9 (1.2%) |
| 75 Years and over | 48 (13.8%) | 217 (20.3%) |
Disability Class: Vision Difficulty
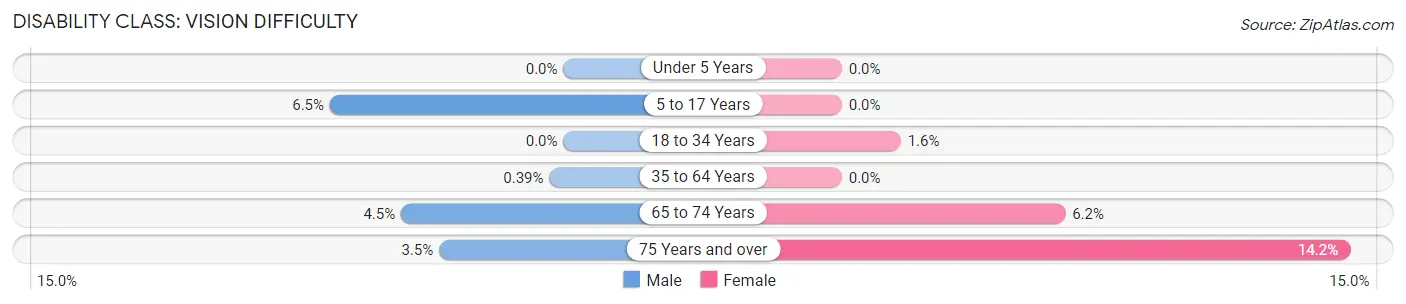
| Age Bracket | Male | Female |
| Under 5 Years | 0 (0.0%) | 0 (0.0%) |
| 5 to 17 Years | 43 (6.5%) | 0 (0.0%) |
| 18 to 34 Years | 0 (0.0%) | 18 (1.6%) |
| 35 to 64 Years | 12 (0.4%) | 0 (0.0%) |
| 65 to 74 Years | 21 (4.5%) | 45 (6.2%) |
| 75 Years and over | 12 (3.5%) | 151 (14.1%) |
Disability Class: Cognitive Difficulty
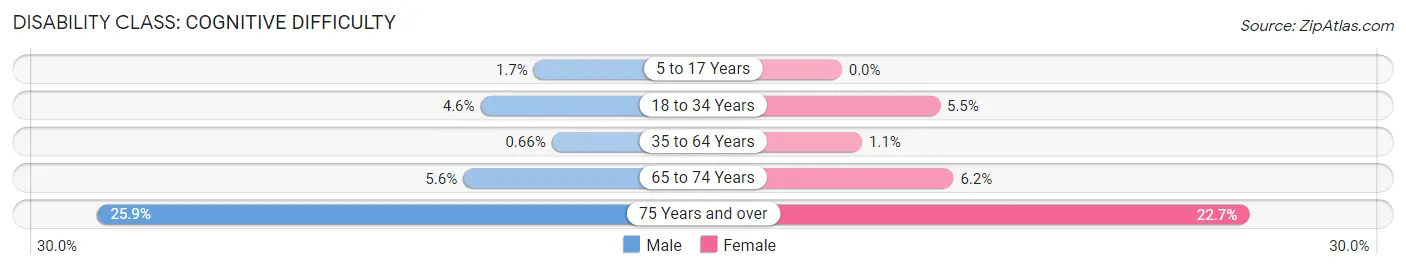
| Age Bracket | Male | Female |
| 5 to 17 Years | 11 (1.7%) | 0 (0.0%) |
| 18 to 34 Years | 55 (4.6%) | 60 (5.5%) |
| 35 to 64 Years | 20 (0.7%) | 35 (1.1%) |
| 65 to 74 Years | 26 (5.6%) | 45 (6.2%) |
| 75 Years and over | 90 (25.9%) | 242 (22.7%) |
Disability Class: Ambulatory Difficulty
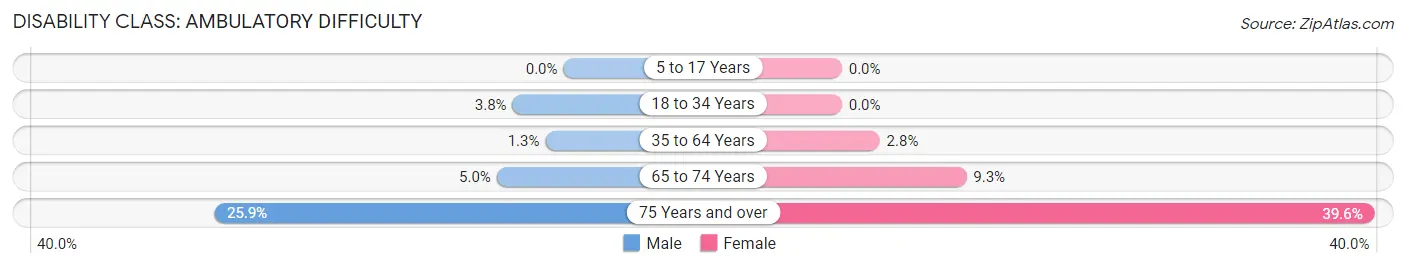
| Age Bracket | Male | Female |
| 5 to 17 Years | 0 (0.0%) | 0 (0.0%) |
| 18 to 34 Years | 45 (3.8%) | 0 (0.0%) |
| 35 to 64 Years | 41 (1.3%) | 87 (2.8%) |
| 65 to 74 Years | 23 (5.0%) | 67 (9.2%) |
| 75 Years and over | 90 (25.9%) | 422 (39.6%) |
Disability Class: Self-Care Difficulty
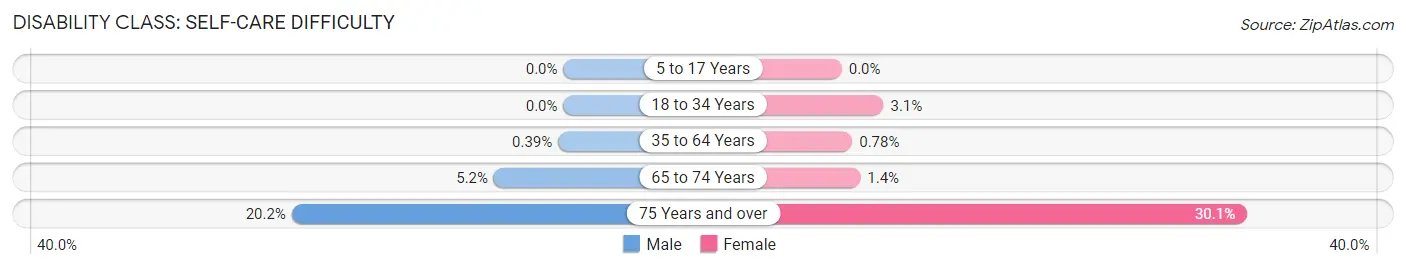
| Age Bracket | Male | Female |
| 5 to 17 Years | 0 (0.0%) | 0 (0.0%) |
| 18 to 34 Years | 0 (0.0%) | 34 (3.1%) |
| 35 to 64 Years | 12 (0.4%) | 24 (0.8%) |
| 65 to 74 Years | 24 (5.2%) | 10 (1.4%) |
| 75 Years and over | 70 (20.2%) | 321 (30.1%) |
Technology Access in Miami Springs
Computing Device Access in Miami Springs
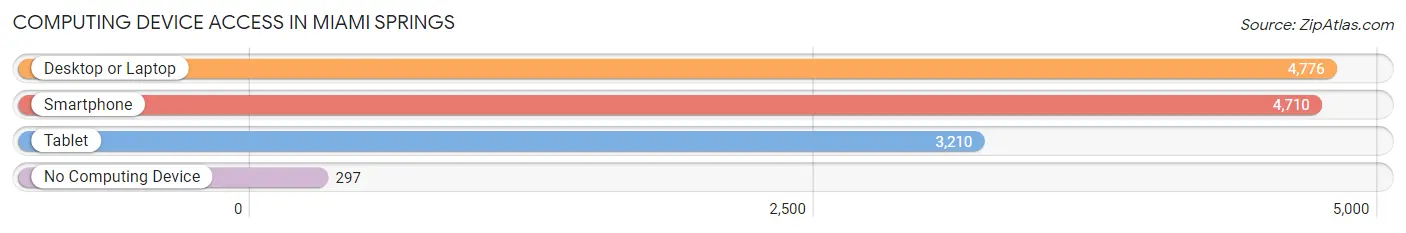
| Device Type | # Households | % Households |
| Desktop or Laptop | 4,776 | 87.0% |
| Smartphone | 4,710 | 85.8% |
| Tablet | 3,210 | 58.5% |
| No Computing Device | 297 | 5.4% |
| Total | 5,490 | 100.0% |
Internet Access in Miami Springs
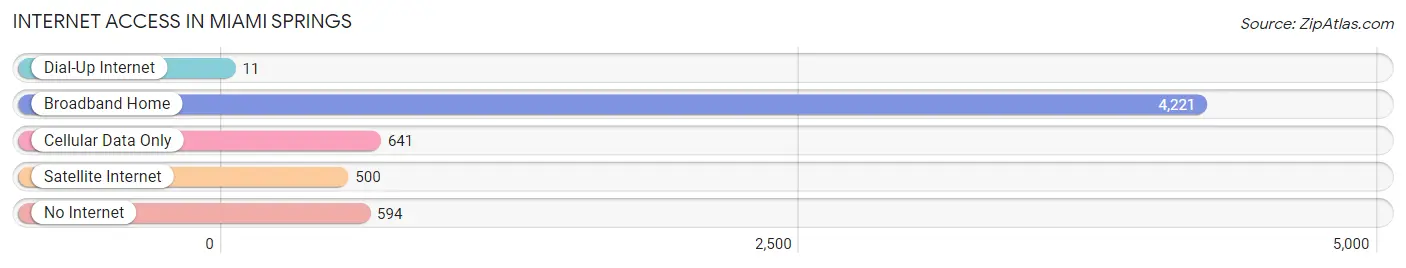
| Internet Type | # Households | % Households |
| Dial-Up Internet | 11 | 0.2% |
| Broadband Home | 4,221 | 76.9% |
| Cellular Data Only | 641 | 11.7% |
| Satellite Internet | 500 | 9.1% |
| No Internet | 594 | 10.8% |
| Total | 5,490 | 100.0% |
Miami Springs Summary
Miami Springs is a city located in Miami-Dade County, Florida, United States. It is located just northwest of Miami International Airport and is part of the Miami metropolitan area. The city was founded in 1926 by Glenn Hammond Curtiss, the aviation pioneer, and James Bright, an attorney. The city was originally named Country Club Estates, but was later changed to Miami Springs in 1926.
History
Miami Springs was founded in 1926 by Glenn Hammond Curtiss, the aviation pioneer, and James Bright, an attorney. The city was originally named Country Club Estates, but was later changed to Miami Springs in 1926. The city was designed by Curtiss and Bright to be a planned community, with a golf course, country club, and residential areas. The city was incorporated in 1926 and was the first city in Miami-Dade County to be incorporated.
In the 1930s, the city was home to the Miami Springs Country Club, which hosted the PGA Tour's Miami Open from 1932 to 1939. The city was also home to the Curtiss-Wright Aeronautical University, which trained pilots during World War II.
In the 1950s, the city was home to the Miami Springs Golf and Country Club, which hosted the PGA Tour's Miami Open from 1952 to 1959. The city was also home to the Miami Springs Raceway, which hosted NASCAR races from 1959 to 1965.
Geography
Miami Springs is located in Miami-Dade County, Florida, United States. It is located just northwest of Miami International Airport and is part of the Miami metropolitan area. The city is bordered by the cities of Hialeah, Miami, and Doral. The city has a total area of 4.2 square miles, of which 4.1 square miles is land and 0.1 square miles is water.
Economy
The economy of Miami Springs is largely based on tourism and hospitality. The city is home to several hotels, restaurants, and other businesses that cater to tourists and visitors. The city is also home to several corporate headquarters, including American Airlines, Ryder Systems, and Ryder Logistics.
Demographics
As of the 2010 census, the population of Miami Springs was 14,316. The racial makeup of the city was 65.2% White, 22.3% Hispanic or Latino, 8.2% African American, 0.7% Asian, 0.2% Native American, and 3.4% from other races. The median household income was $45,845 and the median family income was $50,945.
Conclusion
Miami Springs is a city located in Miami-Dade County, Florida, United States. It was founded in 1926 by Glenn Hammond Curtiss, the aviation pioneer, and James Bright, an attorney. The city was originally named Country Club Estates, but was later changed to Miami Springs in 1926. The city was designed to be a planned community, with a golf course, country club, and residential areas. The economy of Miami Springs is largely based on tourism and hospitality. As of the 2010 census, the population of Miami Springs was 14,316. The racial makeup of the city was 65.2% White, 22.3% Hispanic or Latino, 8.2% African American, 0.7% Asian, 0.2% Native American, and 3.4% from other races. The median household income was $45,845 and the median family income was $50,945. Miami Springs is a vibrant city with a rich history and a bright future.
Common Questions
What is Per Capita Income in Miami Springs?
Per Capita income in Miami Springs is $49,183.
What is the Median Family Income in Miami Springs?
Median Family Income in Miami Springs is $104,632.
What is the Median Household income in Miami Springs?
Median Household Income in Miami Springs is $88,196.
What is Income or Wage Gap in Miami Springs?
Income or Wage Gap in Miami Springs is 11.3%.
Women in Miami Springs earn 88.7 cents for every dollar earned by a man.
What is Inequality or Gini Index in Miami Springs?
Inequality or Gini Index in Miami Springs is 0.51.
What is the Total Population of Miami Springs?
Total Population of Miami Springs is 13,729.
What is the Total Male Population of Miami Springs?
Total Male Population of Miami Springs is 6,154.
What is the Total Female Population of Miami Springs?
Total Female Population of Miami Springs is 7,575.
What is the Ratio of Males per 100 Females in Miami Springs?
There are 81.24 Males per 100 Females in Miami Springs.
What is the Ratio of Females per 100 Males in Miami Springs?
There are 123.09 Females per 100 Males in Miami Springs.
What is the Median Population Age in Miami Springs?
Median Population Age in Miami Springs is 44.5 Years.
What is the Average Family Size in Miami Springs
Average Family Size in Miami Springs is 3.1 People.
What is the Average Household Size in Miami Springs
Average Household Size in Miami Springs is 2.4 People.
How Large is the Labor Force in Miami Springs?
There are 7,615 People in the Labor Forcein in Miami Springs.
What is the Percentage of People in the Labor Force in Miami Springs?
66.3% of People are in the Labor Force in Miami Springs.
What is the Unemployment Rate in Miami Springs?
Unemployment Rate in Miami Springs is 1.3%.