Westlake, TX Map & Demographics
Westlake Map
Westlake Overview
$184,242
PER CAPITA INCOME
$250,001
AVG FAMILY INCOME
$250,001
AVG HOUSEHOLD INCOME
0.54
INEQUALITY / GINI INDEX
1,300
TOTAL POPULATION
673
MALE POPULATION
627
FEMALE POPULATION
107.34
MALES / 100 FEMALES
93.16
FEMALES / 100 MALES
47.2
MEDIAN AGE
3.1
AVG FAMILY SIZE
3.0
AVG HOUSEHOLD SIZE
509
LABOR FORCE [ PEOPLE ]
50.4%
PERCENT IN LABOR FORCE
2.4%
UNEMPLOYMENT RATE
Income in Westlake
Income Overview in Westlake
Per Capita Income in Westlake is $184,242, while median incomes of families and households are $250,001 and $250,001 respectively.
| Characteristic | Number | Measure |
| Per Capita Income | 1,300 | $184,242 |
| Median Family Income | 400 | $250,001 |
| Mean Family Income | 400 | $568,937 |
| Median Household Income | 435 | $250,001 |
| Mean Household Income | 435 | $543,825 |
| Income Deficit | 400 | $0 |
| Wage / Income Gap (%) | 1,300 | 0.00% |
| Wage / Income Gap ($) | 1,300 | 100.00¢ per $1 |
| Gini / Inequality Index | 1,300 | 0.54 |
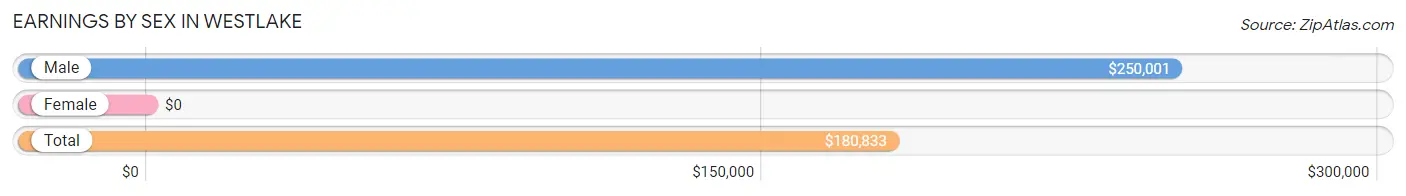
Earnings by Sex in Westlake
| Sex | Number | Average Earnings |
| Male | 351 (64.0%) | $250,001 |
| Female | 197 (35.9%) | $0 |
| Total | 548 (100.0%) | $180,833 |
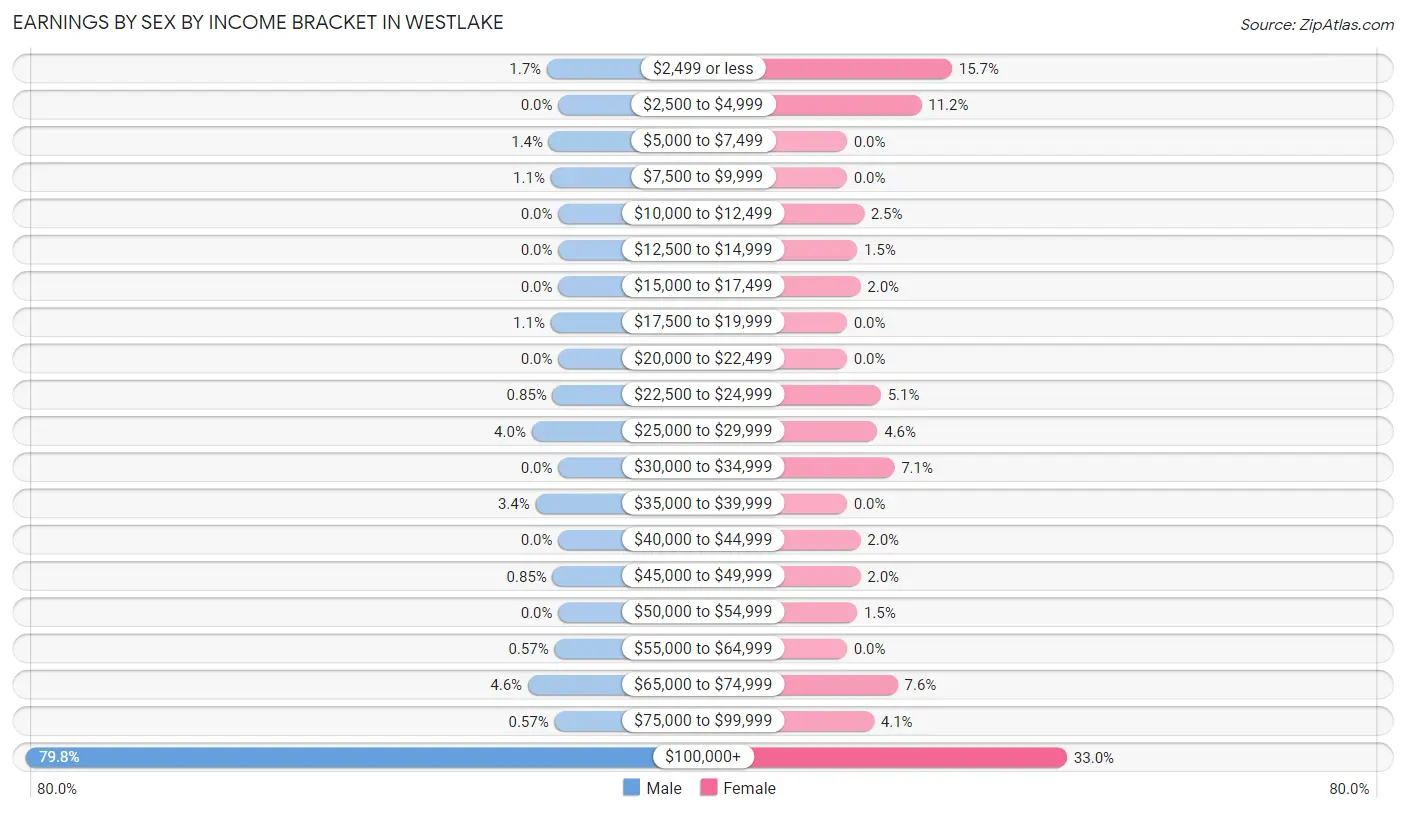
Earnings by Sex by Income Bracket in Westlake
The most common earnings brackets in Westlake are $100,000+ for men (280 | 79.8%) and $100,000+ for women (65 | 33.0%).
| Income | Male | Female |
| $2,499 or less | 6 (1.7%) | 31 (15.7%) |
| $2,500 to $4,999 | 0 (0.0%) | 22 (11.2%) |
| $5,000 to $7,499 | 5 (1.4%) | 0 (0.0%) |
| $7,500 to $9,999 | 4 (1.1%) | 0 (0.0%) |
| $10,000 to $12,499 | 0 (0.0%) | 5 (2.5%) |
| $12,500 to $14,999 | 0 (0.0%) | 3 (1.5%) |
| $15,000 to $17,499 | 0 (0.0%) | 4 (2.0%) |
| $17,500 to $19,999 | 4 (1.1%) | 0 (0.0%) |
| $20,000 to $22,499 | 0 (0.0%) | 0 (0.0%) |
| $22,500 to $24,999 | 3 (0.9%) | 10 (5.1%) |
| $25,000 to $29,999 | 14 (4.0%) | 9 (4.6%) |
| $30,000 to $34,999 | 0 (0.0%) | 14 (7.1%) |
| $35,000 to $39,999 | 12 (3.4%) | 0 (0.0%) |
| $40,000 to $44,999 | 0 (0.0%) | 4 (2.0%) |
| $45,000 to $49,999 | 3 (0.9%) | 4 (2.0%) |
| $50,000 to $54,999 | 0 (0.0%) | 3 (1.5%) |
| $55,000 to $64,999 | 2 (0.6%) | 0 (0.0%) |
| $65,000 to $74,999 | 16 (4.6%) | 15 (7.6%) |
| $75,000 to $99,999 | 2 (0.6%) | 8 (4.1%) |
| $100,000+ | 280 (79.8%) | 65 (33.0%) |
| Total | 351 (100.0%) | 197 (100.0%) |
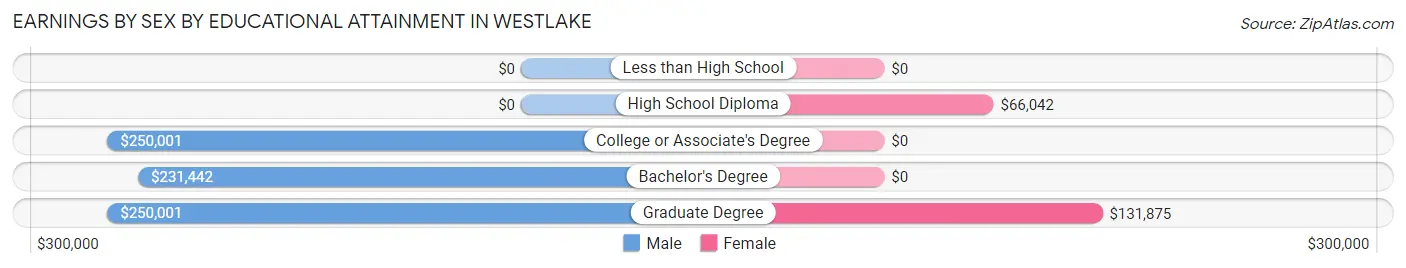
Earnings by Sex by Educational Attainment in Westlake
| Educational Attainment | Male Income | Female Income |
| Less than High School | - | - |
| High School Diploma | - | - |
| College or Associate's Degree | $250,001 | $0 |
| Bachelor's Degree | $231,442 | $0 |
| Graduate Degree | $250,001 | $131,875 |
| Total | $250,001 | $0 |
Family Income in Westlake
Family Income Brackets in Westlake
According to the Westlake family income data, there are 258 families falling into the $200,000+ income range, which is the most common income bracket and makes up 64.5% of all families. Conversely, the $35,000 to $49,999 income bracket is the least frequent group with only 2 families (0.5%) belonging to this category.
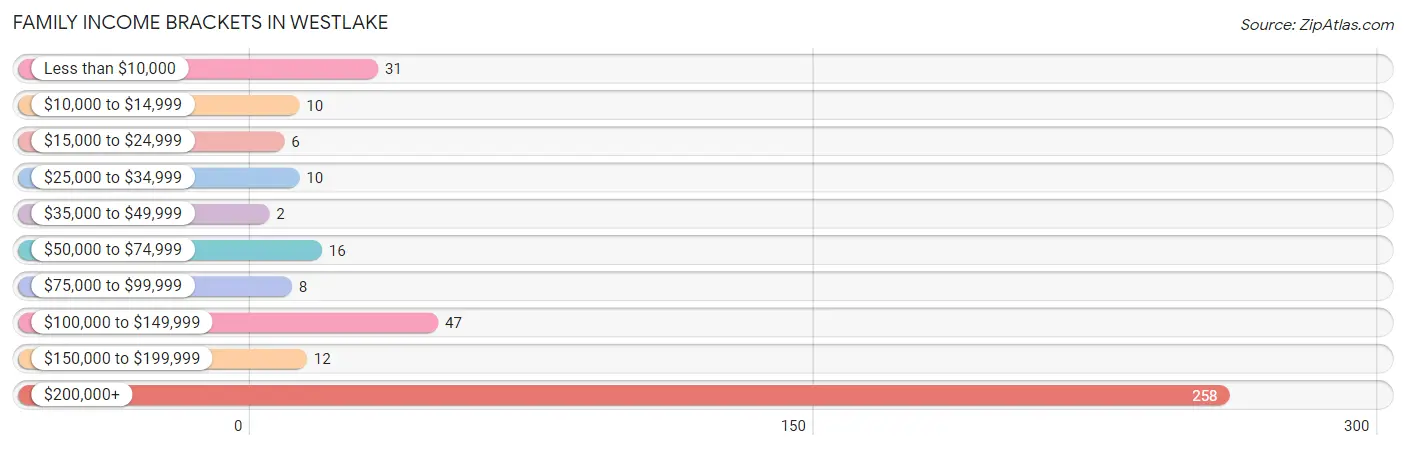
| Income Bracket | # Families | % Families |
| Less than $10,000 | 31 | 7.8% |
| $10,000 to $14,999 | 10 | 2.5% |
| $15,000 to $24,999 | 6 | 1.5% |
| $25,000 to $34,999 | 10 | 2.5% |
| $35,000 to $49,999 | 2 | 0.5% |
| $50,000 to $74,999 | 16 | 4.0% |
| $75,000 to $99,999 | 8 | 2.0% |
| $100,000 to $149,999 | 47 | 11.8% |
| $150,000 to $199,999 | 12 | 3.0% |
| $200,000+ | 258 | 64.5% |
Family Income by Famaliy Size in Westlake
3-person families (55 | 13.8%) account for the highest median family income in Westlake with $250,001 per family, while 2-person families (203 | 50.7%) have the highest median income of $104,219 per family member.
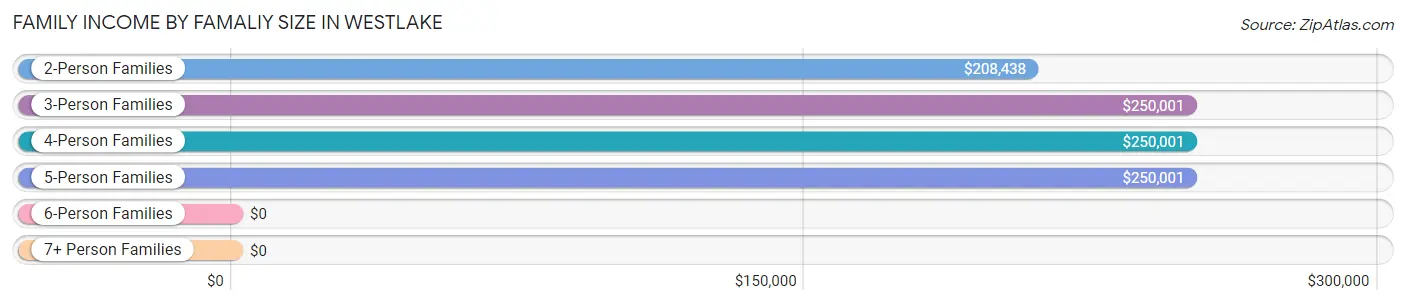
| Income Bracket | # Families | Median Income |
| 2-Person Families | 203 (50.7%) | $208,438 |
| 3-Person Families | 55 (13.8%) | $250,001 |
| 4-Person Families | 84 (21.0%) | $250,001 |
| 5-Person Families | 42 (10.5%) | $250,001 |
| 6-Person Families | 9 (2.2%) | $0 |
| 7+ Person Families | 7 (1.8%) | $0 |
| Total | 400 (100.0%) | $250,001 |
Family Income by Number of Earners in Westlake
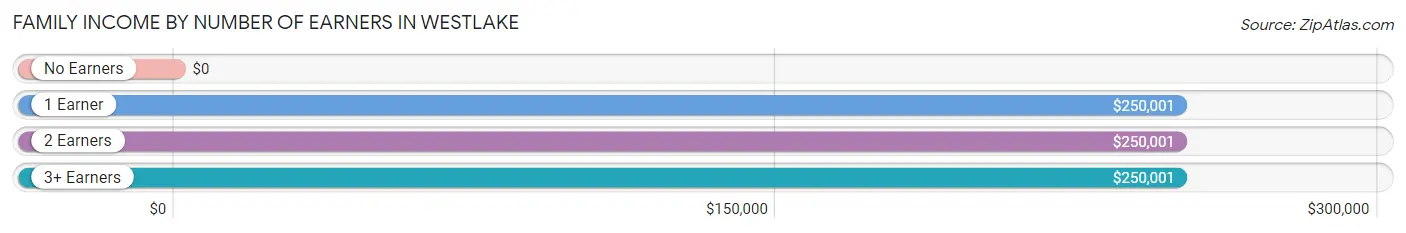
| Number of Earners | # Families | Median Income |
| No Earners | 78 (19.5%) | $0 |
| 1 Earner | 166 (41.5%) | $250,001 |
| 2 Earners | 139 (34.7%) | $250,001 |
| 3+ Earners | 17 (4.3%) | $250,001 |
| Total | 400 (100.0%) | $250,001 |
Household Income in Westlake
Household Income Brackets in Westlake
With 276 households falling in the category, the $200,000+ income range is the most frequent in Westlake, accounting for 63.4% of all households. In contrast, only 6 households (1.4%) fall into the $15,000 to $24,999 income bracket, making it the least populous group.
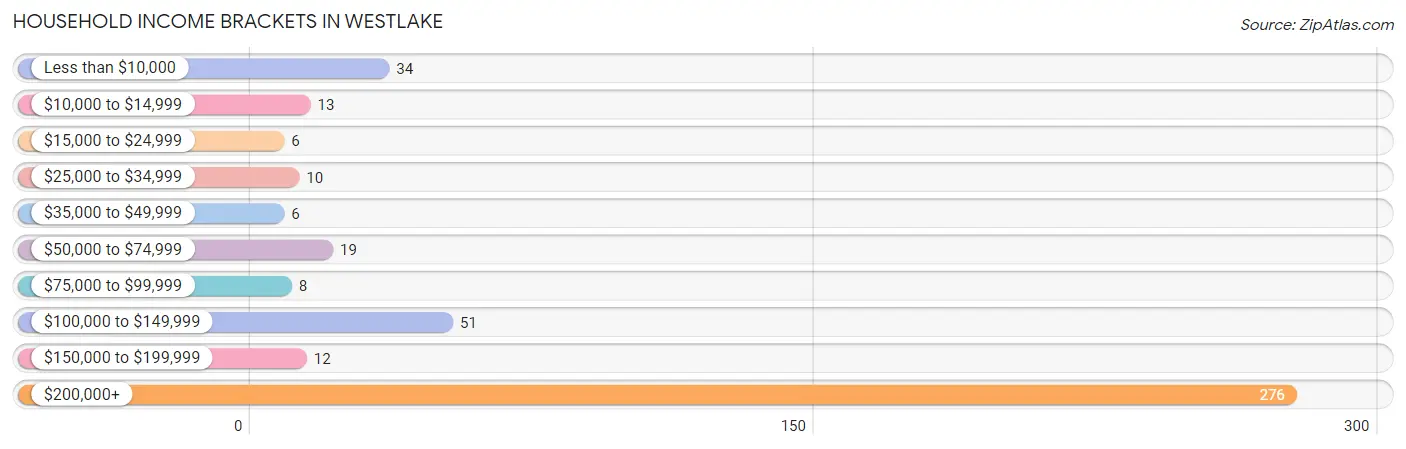
| Income Bracket | # Households | % Households |
| Less than $10,000 | 34 | 7.8% |
| $10,000 to $14,999 | 13 | 3.0% |
| $15,000 to $24,999 | 6 | 1.4% |
| $25,000 to $34,999 | 10 | 2.3% |
| $35,000 to $49,999 | 6 | 1.4% |
| $50,000 to $74,999 | 19 | 4.4% |
| $75,000 to $99,999 | 8 | 1.8% |
| $100,000 to $149,999 | 51 | 11.7% |
| $150,000 to $199,999 | 12 | 2.8% |
| $200,000+ | 276 | 63.4% |
Household Income by Householder Age in Westlake
The median household income in Westlake is $250,001, with the highest median household income of $250,001 found in the 45 to 64 years age bracket for the primary householder. A total of 306 households (70.3%) fall into this category.
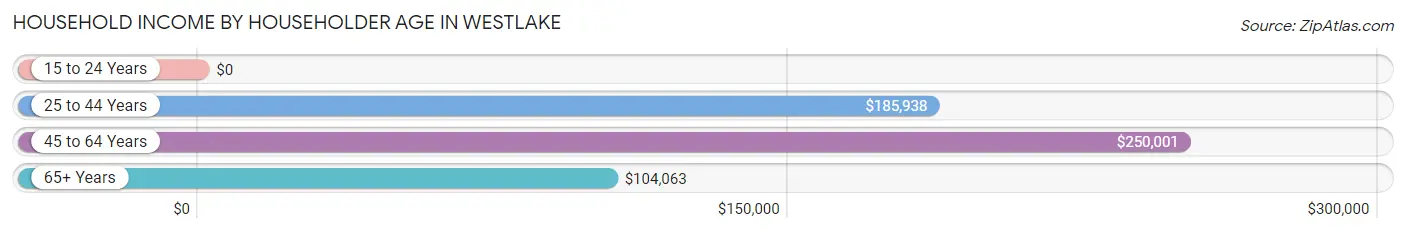
| Income Bracket | # Households | Median Income |
| 15 to 24 Years | 0 (0.0%) | $0 |
| 25 to 44 Years | 80 (18.4%) | $185,938 |
| 45 to 64 Years | 306 (70.3%) | $250,001 |
| 65+ Years | 49 (11.3%) | $104,063 |
| Total | 435 (100.0%) | $250,001 |
Poverty in Westlake
Income Below Poverty by Sex and Age in Westlake
With 10.2% poverty level for males and 9.6% for females among the residents of Westlake, 18 to 24 year old males and 16 and 17 year old females are the most vulnerable to poverty, with 12 males (36.4%) and 5 females (45.5%) in their respective age groups living below the poverty level.
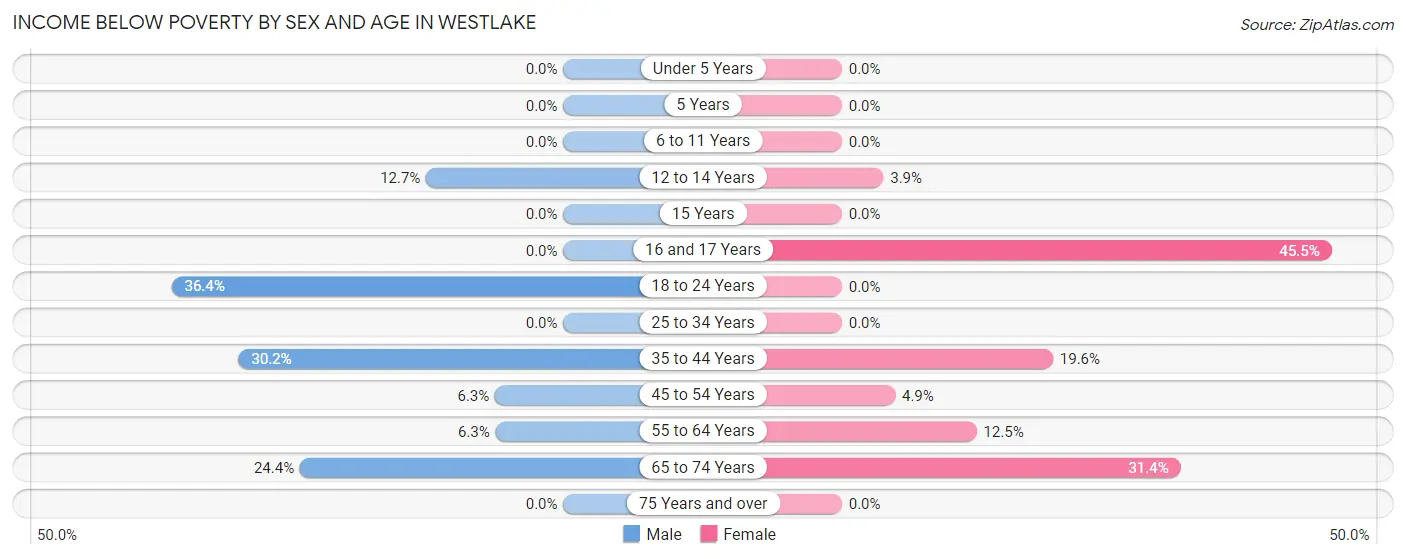
| Age Bracket | Male | Female |
| Under 5 Years | 0 (0.0%) | 0 (0.0%) |
| 5 Years | 0 (0.0%) | 0 (0.0%) |
| 6 to 11 Years | 0 (0.0%) | 0 (0.0%) |
| 12 to 14 Years | 7 (12.7%) | 1 (3.8%) |
| 15 Years | 0 (0.0%) | 0 (0.0%) |
| 16 and 17 Years | 0 (0.0%) | 5 (45.5%) |
| 18 to 24 Years | 12 (36.4%) | 0 (0.0%) |
| 25 to 34 Years | 0 (0.0%) | 0 (0.0%) |
| 35 to 44 Years | 19 (30.2%) | 19 (19.6%) |
| 45 to 54 Years | 10 (6.3%) | 8 (4.9%) |
| 55 to 64 Years | 10 (6.3%) | 16 (12.5%) |
| 65 to 74 Years | 11 (24.4%) | 11 (31.4%) |
| 75 Years and over | 0 (0.0%) | 0 (0.0%) |
| Total | 69 (10.2%) | 60 (9.6%) |
Income Above Poverty by Sex and Age in Westlake
According to the poverty statistics in Westlake, males aged under 5 years and females aged under 5 years are the age groups that are most secure financially, with 100.0% of males and 100.0% of females in these age groups living above the poverty line.
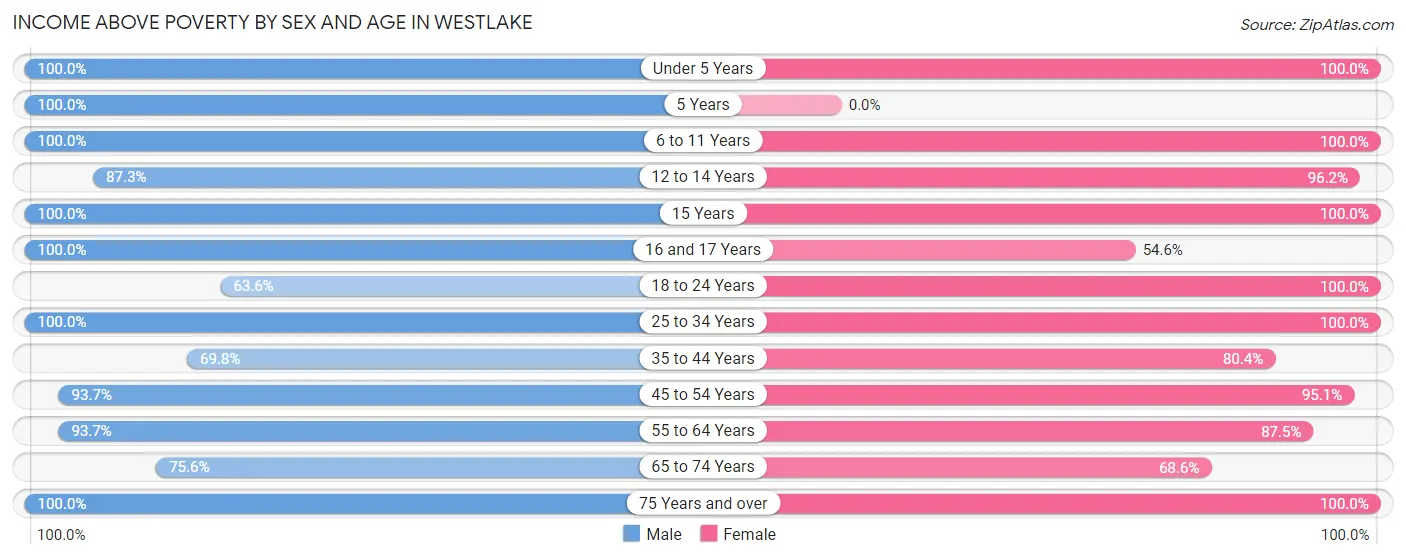
| Age Bracket | Male | Female |
| Under 5 Years | 23 (100.0%) | 18 (100.0%) |
| 5 Years | 3 (100.0%) | 0 (0.0%) |
| 6 to 11 Years | 48 (100.0%) | 90 (100.0%) |
| 12 to 14 Years | 48 (87.3%) | 25 (96.2%) |
| 15 Years | 15 (100.0%) | 13 (100.0%) |
| 16 and 17 Years | 39 (100.0%) | 6 (54.5%) |
| 18 to 24 Years | 21 (63.6%) | 23 (100.0%) |
| 25 to 34 Years | 7 (100.0%) | 3 (100.0%) |
| 35 to 44 Years | 44 (69.8%) | 78 (80.4%) |
| 45 to 54 Years | 148 (93.7%) | 154 (95.1%) |
| 55 to 64 Years | 149 (93.7%) | 112 (87.5%) |
| 65 to 74 Years | 34 (75.6%) | 24 (68.6%) |
| 75 Years and over | 25 (100.0%) | 21 (100.0%) |
| Total | 604 (89.7%) | 567 (90.4%) |
Income Below Poverty Among Married-Couple Families in Westlake
The poverty statistics for married-couple families in Westlake show that 10.0% or 39 of the total 392 families live below the poverty line. Families with no children have the highest poverty rate of 14.1%, comprising of 32 families. On the other hand, families with 3 or 4 children have the lowest poverty rate of 0.0%, which includes 0 families.
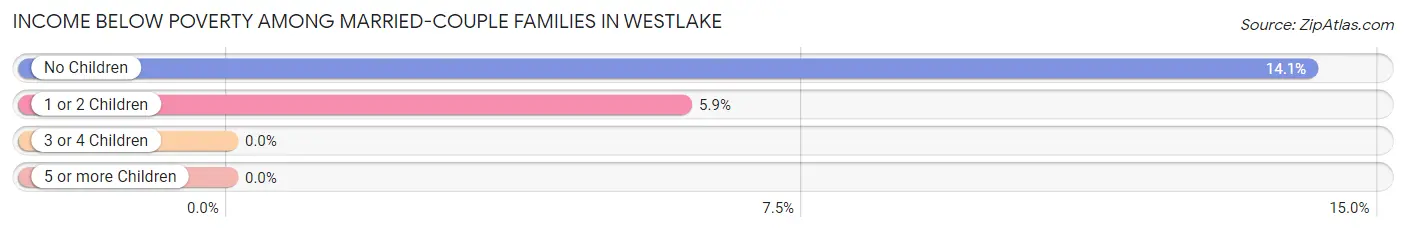
| Children | Above Poverty | Below Poverty |
| No Children | 195 (85.9%) | 32 (14.1%) |
| 1 or 2 Children | 111 (94.1%) | 7 (5.9%) |
| 3 or 4 Children | 47 (100.0%) | 0 (0.0%) |
| 5 or more Children | 0 (0.0%) | 0 (0.0%) |
| Total | 353 (90.0%) | 39 (10.0%) |
Income Below Poverty Among Single-Parent Households in Westlake
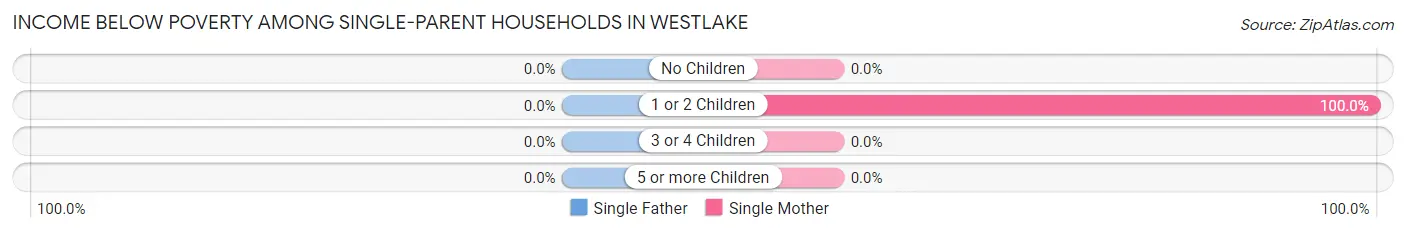
| Children | Single Father | Single Mother |
| No Children | 0 (0.0%) | 0 (0.0%) |
| 1 or 2 Children | 0 (0.0%) | 5 (100.0%) |
| 3 or 4 Children | 0 (0.0%) | 0 (0.0%) |
| 5 or more Children | 0 (0.0%) | 0 (0.0%) |
| Total | 0 (0.0%) | 5 (100.0%) |
Income Below Poverty Among Married-Couple vs Single-Parent Households in Westlake
The poverty data for Westlake shows that 39 of the married-couple family households (10.0%) and 5 of the single-parent households (62.5%) are living below the poverty level. Within the married-couple family households, those with no children have the highest poverty rate, with 32 households (14.1%) falling below the poverty line. Among the single-parent households, those with 1 or 2 children have the highest poverty rate, with 5 household (62.5%) living below poverty.
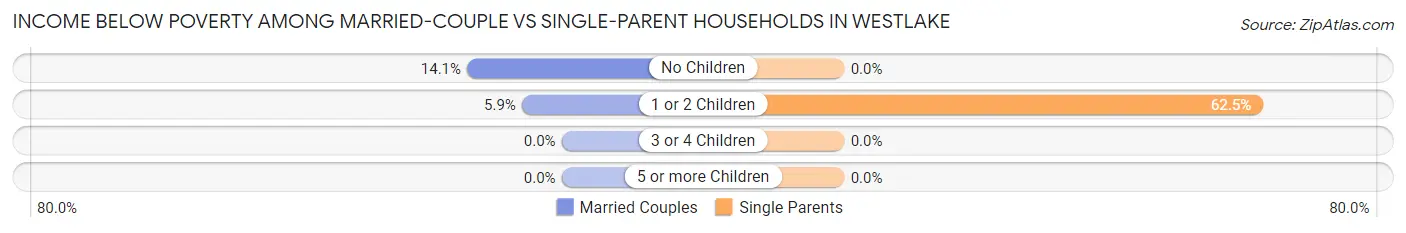
| Children | Married-Couple Families | Single-Parent Households |
| No Children | 32 (14.1%) | 0 (0.0%) |
| 1 or 2 Children | 7 (5.9%) | 5 (62.5%) |
| 3 or 4 Children | 0 (0.0%) | 0 (0.0%) |
| 5 or more Children | 0 (0.0%) | 0 (0.0%) |
| Total | 39 (10.0%) | 5 (62.5%) |
Race in Westlake
The most populous races in Westlake are White / Caucasian (1,019 | 78.4%), Asian (154 | 11.8%), and Hispanic or Latino (116 | 8.9%).
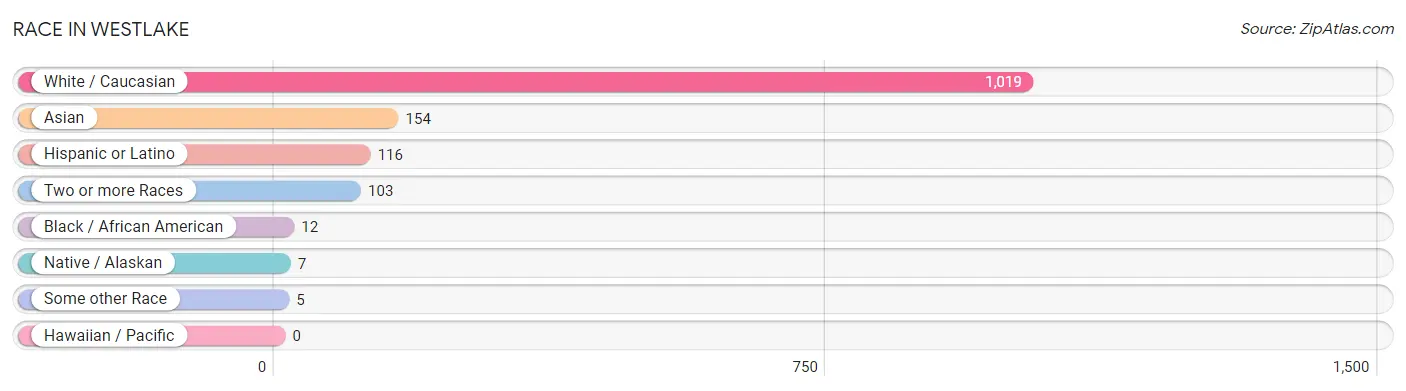
| Race | # Population | % Population |
| Asian | 154 | 11.8% |
| Black / African American | 12 | 0.9% |
| Hawaiian / Pacific | 0 | 0.0% |
| Hispanic or Latino | 116 | 8.9% |
| Native / Alaskan | 7 | 0.5% |
| White / Caucasian | 1,019 | 78.4% |
| Two or more Races | 103 | 7.9% |
| Some other Race | 5 | 0.4% |
| Total | 1,300 | 100.0% |
Ancestry in Westlake
The most populous ancestries reported in Westlake are English (158 | 12.1%), German (125 | 9.6%), Irish (106 | 8.2%), Thai (85 | 6.5%), and Mexican (78 | 6.0%), together accounting for 42.5% of all Westlake residents.
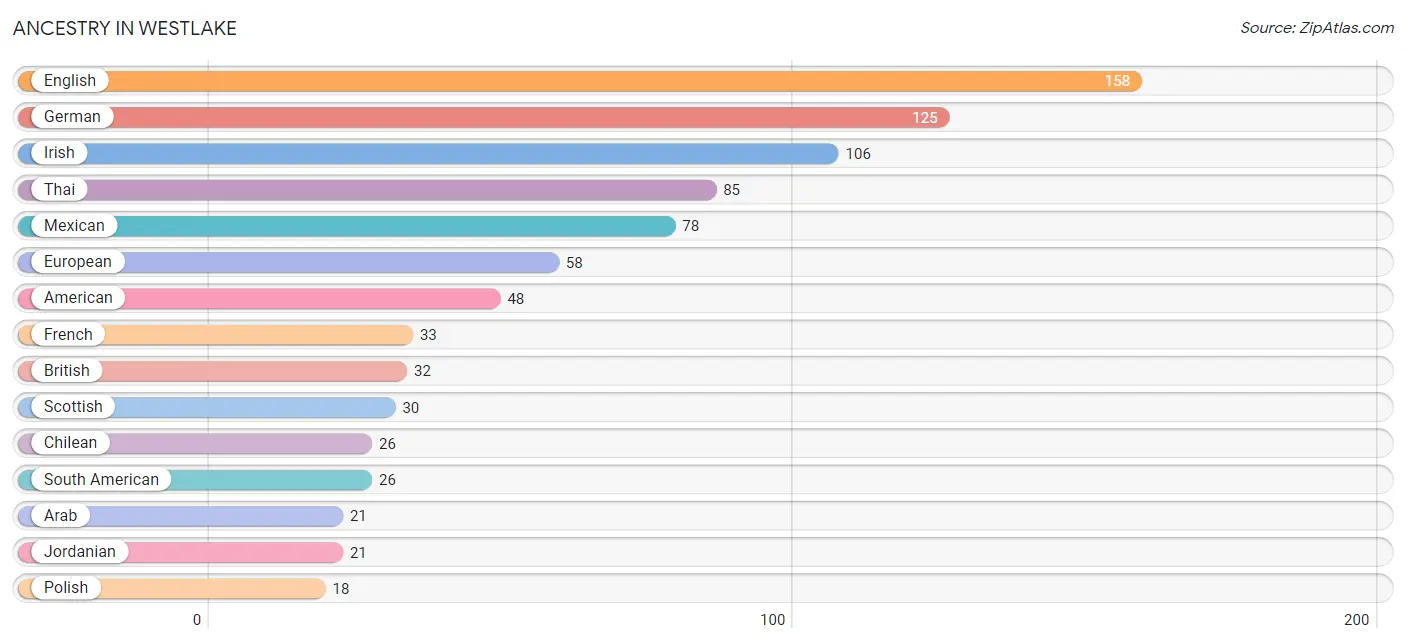
| Ancestry | # Population | % Population |
| American | 48 | 3.7% |
| Arab | 21 | 1.6% |
| British | 32 | 2.5% |
| Cape Verdean | 8 | 0.6% |
| Central American | 7 | 0.5% |
| Chilean | 26 | 2.0% |
| Czech | 17 | 1.3% |
| Dutch | 7 | 0.5% |
| Eastern European | 3 | 0.2% |
| English | 158 | 12.1% |
| European | 58 | 4.5% |
| French | 33 | 2.5% |
| French Canadian | 7 | 0.5% |
| German | 125 | 9.6% |
| Honduran | 7 | 0.5% |
| Indian (Asian) | 10 | 0.8% |
| Irish | 106 | 8.2% |
| Italian | 9 | 0.7% |
| Jordanian | 21 | 1.6% |
| Malaysian | 16 | 1.2% |
| Mexican | 78 | 6.0% |
| New Zealander | 2 | 0.2% |
| Northern European | 8 | 0.6% |
| Norwegian | 17 | 1.3% |
| Polish | 18 | 1.4% |
| Potawatomi | 7 | 0.5% |
| Russian | 2 | 0.2% |
| Scandinavian | 8 | 0.6% |
| Scotch-Irish | 3 | 0.2% |
| Scottish | 30 | 2.3% |
| Slovene | 3 | 0.2% |
| South American | 26 | 2.0% |
| Subsaharan African | 8 | 0.6% |
| Swedish | 8 | 0.6% |
| Thai | 85 | 6.5% |
| Ukrainian | 4 | 0.3% | View All 36 Rows |
Immigrants in Westlake
The most numerous immigrant groups reported in Westlake came from Asia (136 | 10.5%), South Central Asia (67 | 5.1%), South Eastern Asia (44 | 3.4%), India (38 | 2.9%), and Europe (33 | 2.5%), together accounting for 24.4% of all Westlake residents.
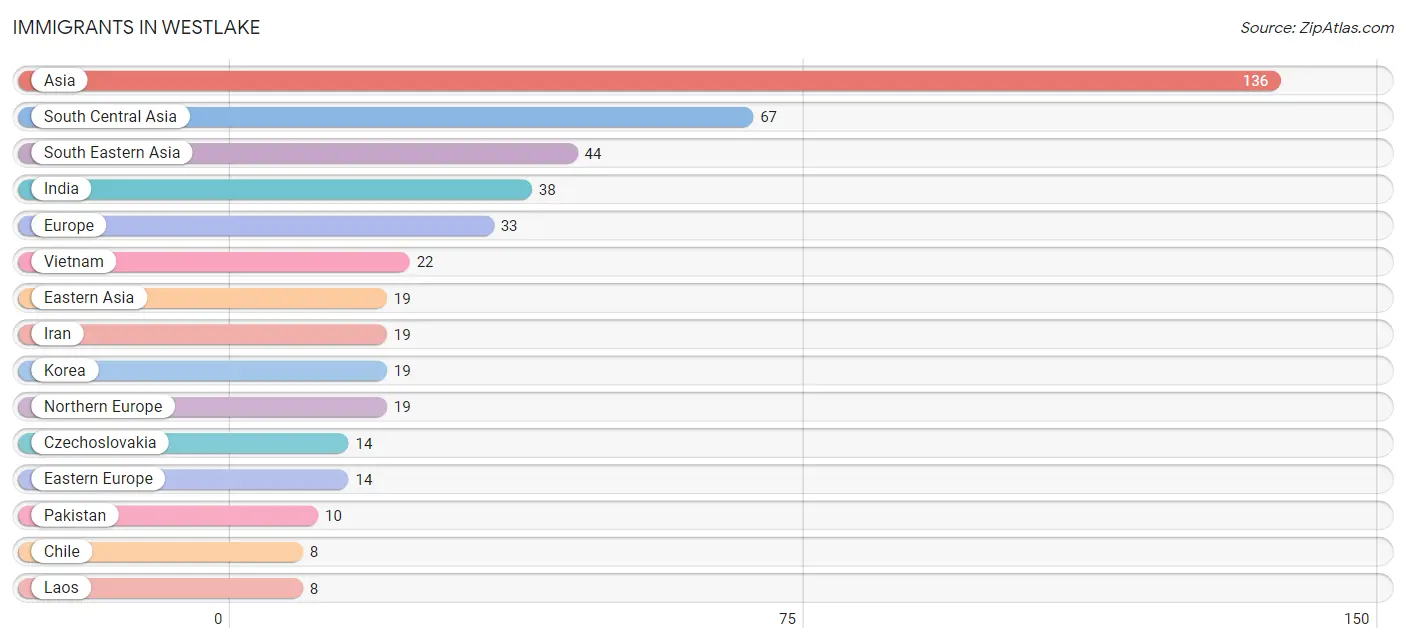
| Immigration Origin | # Population | % Population |
| Asia | 136 | 10.5% |
| Canada | 7 | 0.5% |
| Chile | 8 | 0.6% |
| Czechoslovakia | 14 | 1.1% |
| Eastern Asia | 19 | 1.5% |
| Eastern Europe | 14 | 1.1% |
| England | 3 | 0.2% |
| Europe | 33 | 2.5% |
| India | 38 | 2.9% |
| Iran | 19 | 1.5% |
| Korea | 19 | 1.5% |
| Laos | 8 | 0.6% |
| Latin America | 8 | 0.6% |
| Northern Europe | 19 | 1.5% |
| Oceania | 2 | 0.2% |
| Pakistan | 10 | 0.8% |
| Saudi Arabia | 6 | 0.5% |
| South America | 8 | 0.6% |
| South Central Asia | 67 | 5.1% |
| South Eastern Asia | 44 | 3.4% |
| Sweden | 2 | 0.2% |
| Vietnam | 22 | 1.7% |
| Western Asia | 6 | 0.5% | View All 23 Rows |
Sex and Age in Westlake
Sex and Age in Westlake
The most populous age groups in Westlake are 45 to 49 Years (98 | 14.6%) for men and 45 to 49 Years (91 | 14.5%) for women.
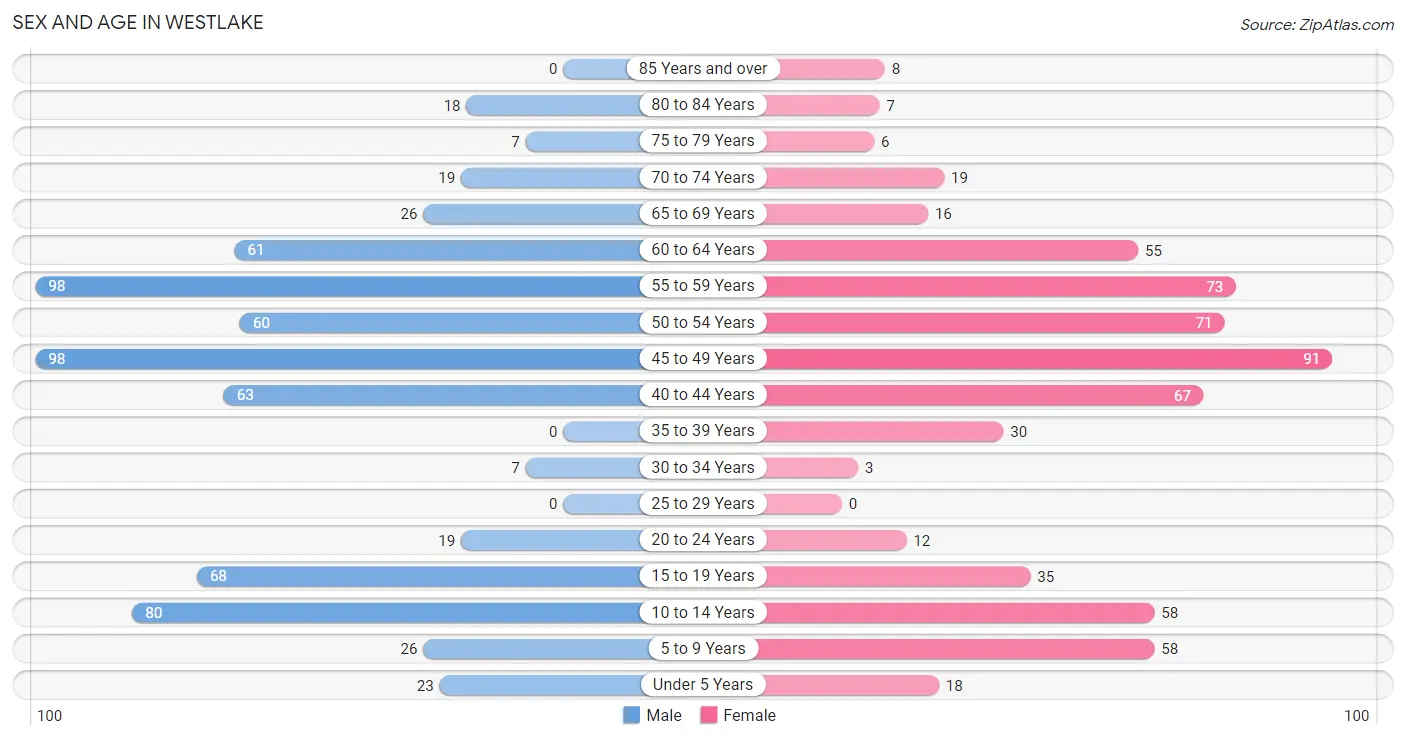
| Age Bracket | Male | Female |
| Under 5 Years | 23 (3.4%) | 18 (2.9%) |
| 5 to 9 Years | 26 (3.9%) | 58 (9.2%) |
| 10 to 14 Years | 80 (11.9%) | 58 (9.2%) |
| 15 to 19 Years | 68 (10.1%) | 35 (5.6%) |
| 20 to 24 Years | 19 (2.8%) | 12 (1.9%) |
| 25 to 29 Years | 0 (0.0%) | 0 (0.0%) |
| 30 to 34 Years | 7 (1.0%) | 3 (0.5%) |
| 35 to 39 Years | 0 (0.0%) | 30 (4.8%) |
| 40 to 44 Years | 63 (9.4%) | 67 (10.7%) |
| 45 to 49 Years | 98 (14.6%) | 91 (14.5%) |
| 50 to 54 Years | 60 (8.9%) | 71 (11.3%) |
| 55 to 59 Years | 98 (14.6%) | 73 (11.6%) |
| 60 to 64 Years | 61 (9.1%) | 55 (8.8%) |
| 65 to 69 Years | 26 (3.9%) | 16 (2.5%) |
| 70 to 74 Years | 19 (2.8%) | 19 (3.0%) |
| 75 to 79 Years | 7 (1.0%) | 6 (1.0%) |
| 80 to 84 Years | 18 (2.7%) | 7 (1.1%) |
| 85 Years and over | 0 (0.0%) | 8 (1.3%) |
| Total | 673 (100.0%) | 627 (100.0%) |
Families and Households in Westlake
Median Family Size in Westlake
The median family size in Westlake is 3.12 persons per family, with single female/mother families (5 | 1.3%) accounting for the largest median family size of 3.2 persons per family. On the other hand, single male/father families (3 | 0.7%) represent the smallest median family size with 2.67 persons per family.
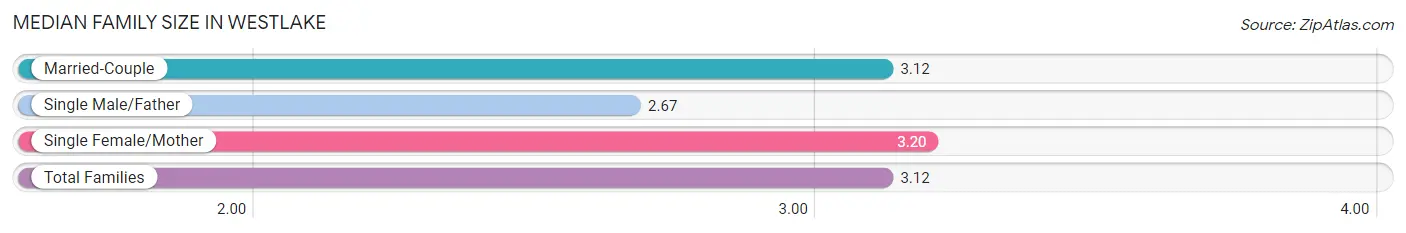
| Family Type | # Families | Family Size |
| Married-Couple | 392 (98.0%) | 3.12 |
| Single Male/Father | 3 (0.7%) | 2.67 |
| Single Female/Mother | 5 (1.3%) | 3.20 |
| Total Families | 400 (100.0%) | 3.12 |
Median Household Size in Westlake
The median household size in Westlake is 2.99 persons per household, with single female/mother households (5 | 1.1%) accounting for the largest median household size of 3.2 persons per household. non-family households (35 | 8.1%) represent the smallest median household size with 1.46 persons per household.
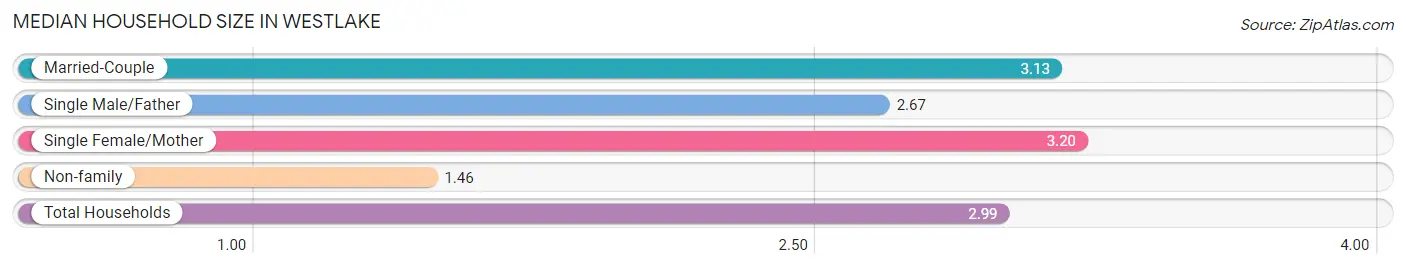
| Household Type | # Households | Household Size |
| Married-Couple | 392 (90.1%) | 3.13 |
| Single Male/Father | 3 (0.7%) | 2.67 |
| Single Female/Mother | 5 (1.1%) | 3.20 |
| Non-family | 35 (8.1%) | 1.46 |
| Total Households | 435 (100.0%) | 2.99 |
Household Size by Marriage Status in Westlake
Out of a total of 435 households in Westlake, 400 (91.9%) are family households, while 35 (8.1%) are nonfamily households. The most numerous type of family households are 2-person households, comprising 203, and the most common type of nonfamily households are 1-person households, comprising 21.
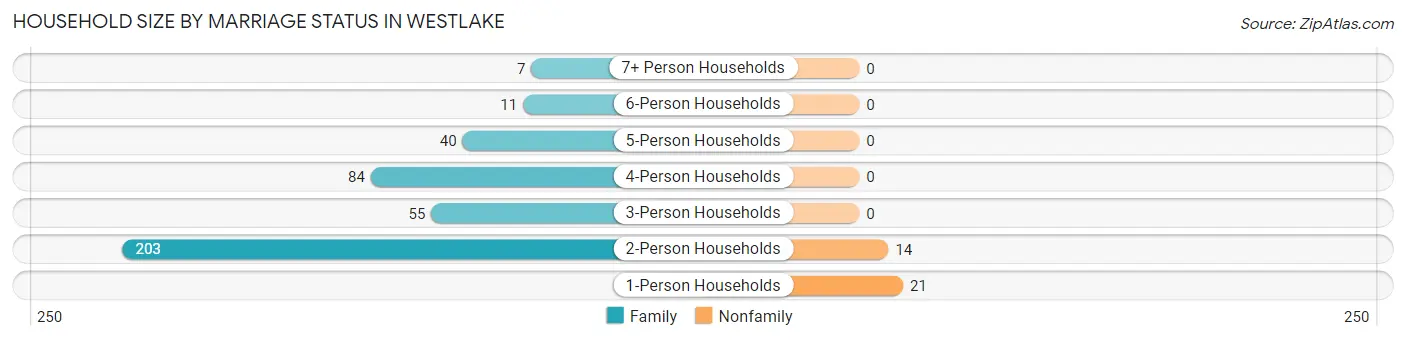
| Household Size | Family Households | Nonfamily Households |
| 1-Person Households | - | 21 (4.8%) |
| 2-Person Households | 203 (46.7%) | 14 (3.2%) |
| 3-Person Households | 55 (12.6%) | 0 (0.0%) |
| 4-Person Households | 84 (19.3%) | 0 (0.0%) |
| 5-Person Households | 40 (9.2%) | 0 (0.0%) |
| 6-Person Households | 11 (2.5%) | 0 (0.0%) |
| 7+ Person Households | 7 (1.6%) | 0 (0.0%) |
| Total | 400 (91.9%) | 35 (8.1%) |
Female Fertility in Westlake
Fertility by Age in Westlake
Average fertility rate in Westlake is 12.0 births per 1,000 women. Women in the age bracket of 20 to 34 years have the highest fertility rate with 200.0 births per 1,000 women. Women in the age bracket of 20 to 34 years acount for 100.0% of all women with births.
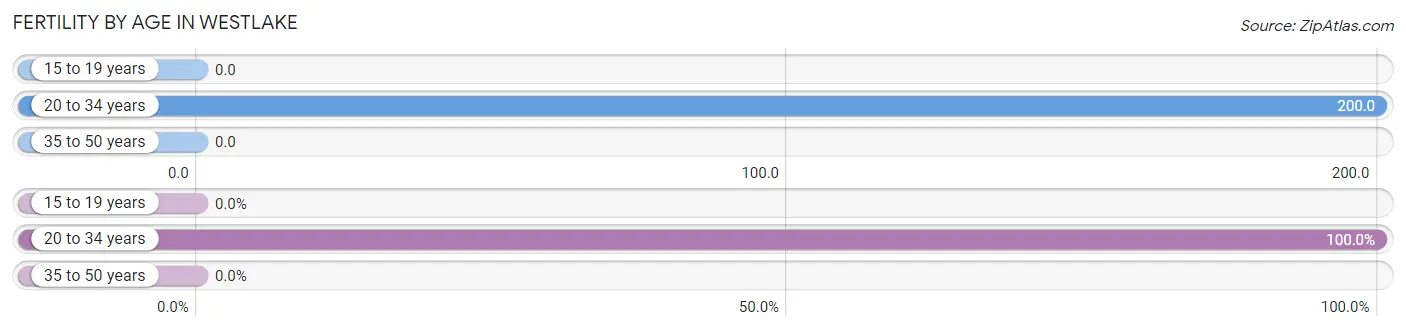
| Age Bracket | Women with Births | Births / 1,000 Women |
| 15 to 19 years | 0 (0.0%) | 0.0 |
| 20 to 34 years | 3 (100.0%) | 200.0 |
| 35 to 50 years | 0 (0.0%) | 0.0 |
| Total | 3 (100.0%) | 12.0 |
Fertility by Age by Marriage Status in Westlake
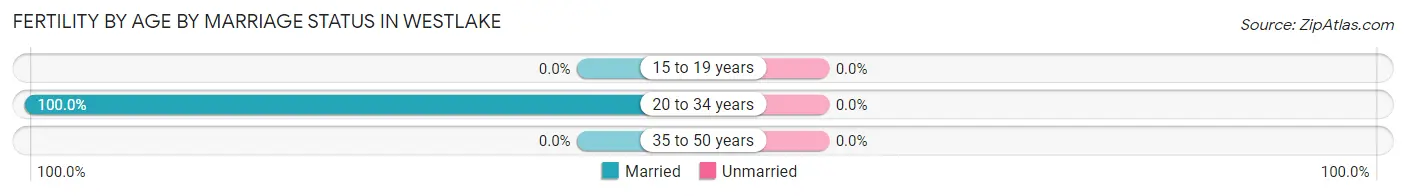
| Age Bracket | Married | Unmarried |
| 15 to 19 years | 0 (0.0%) | 0 (0.0%) |
| 20 to 34 years | 3 (100.0%) | 0 (0.0%) |
| 35 to 50 years | 0 (0.0%) | 0 (0.0%) |
| Total | 3 (100.0%) | 0 (0.0%) |
Fertility by Education in Westlake
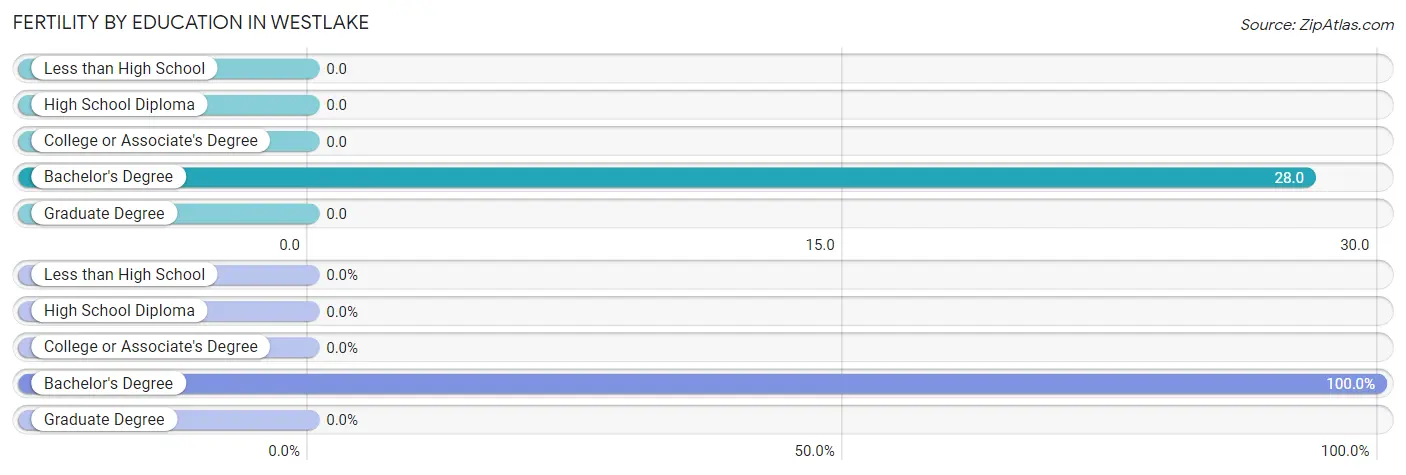
| Educational Attainment | Women with Births | Births / 1,000 Women |
| Less than High School | 0 (0.0%) | 0.0 |
| High School Diploma | 0 (0.0%) | 0.0 |
| College or Associate's Degree | 0 (0.0%) | 0.0 |
| Bachelor's Degree | 3 (100.0%) | 28.0 |
| Graduate Degree | 0 (0.0%) | 0.0 |
| Total | 3 (100.0%) | 12.0 |
Fertility by Education by Marriage Status in Westlake
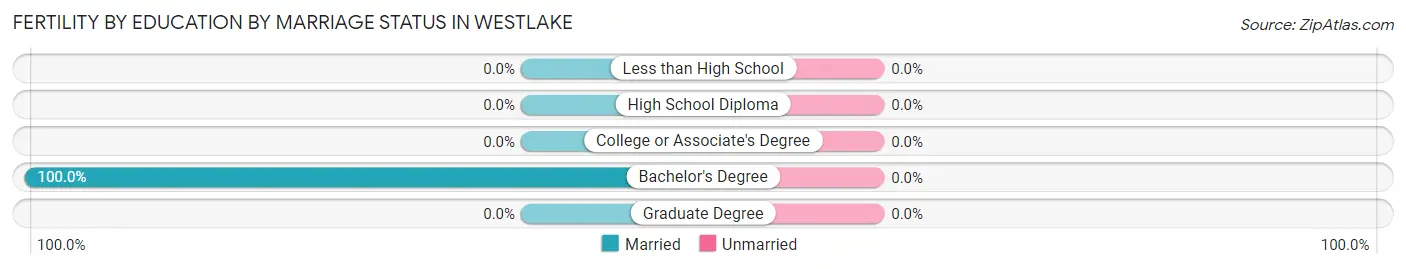
| Educational Attainment | Married | Unmarried |
| Less than High School | 0 (0.0%) | 0 (0.0%) |
| High School Diploma | 0 (0.0%) | 0 (0.0%) |
| College or Associate's Degree | 0 (0.0%) | 0 (0.0%) |
| Bachelor's Degree | 3 (100.0%) | 0 (0.0%) |
| Graduate Degree | 0 (0.0%) | 0 (0.0%) |
| Total | 3 (100.0%) | 0 (0.0%) |
Employment Characteristics in Westlake
Employment by Class of Employer in Westlake
Among the 494 employed individuals in Westlake, private company employees (291 | 58.9%), self-employed (incorporated) (134 | 27.1%), and self-employed (not incorporated) (27 | 5.5%) make up the most common classes of employment.
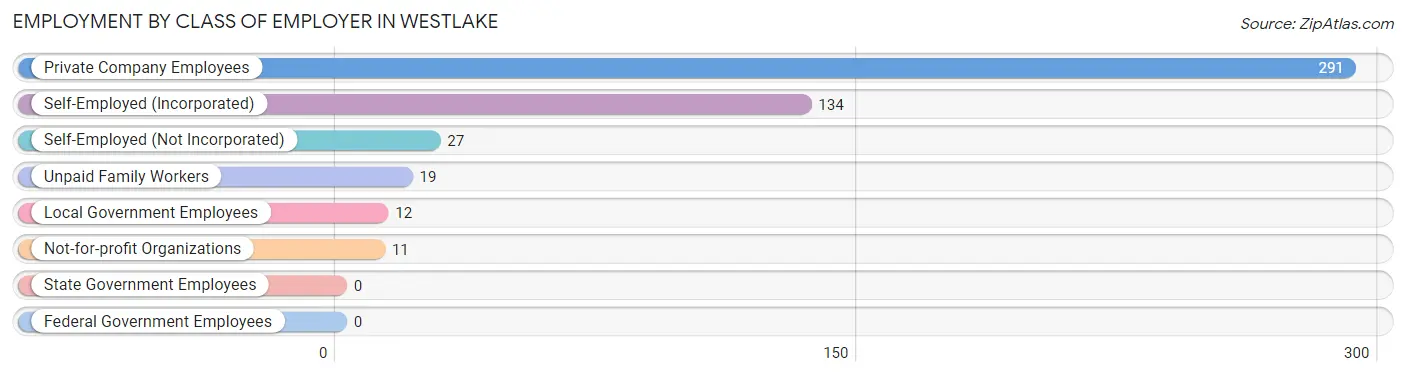
| Employer Class | # Employees | % Employees |
| Private Company Employees | 291 | 58.9% |
| Self-Employed (Incorporated) | 134 | 27.1% |
| Self-Employed (Not Incorporated) | 27 | 5.5% |
| Not-for-profit Organizations | 11 | 2.2% |
| Local Government Employees | 12 | 2.4% |
| State Government Employees | 0 | 0.0% |
| Federal Government Employees | 0 | 0.0% |
| Unpaid Family Workers | 19 | 3.8% |
| Total | 494 | 100.0% |
Employment Status by Age in Westlake
According to the labor force statistics for Westlake, out of the total population over 16 years of age (1,009), 50.4% or 509 individuals are in the labor force, with 2.4% or 12 of them unemployed. The age group with the highest labor force participation rate is 30 to 34 years, with 100.0% or 10 individuals in the labor force. Within the labor force, the 20 to 24 years age range has the highest percentage of unemployed individuals, with 25.0% or 5 of them being unemployed.
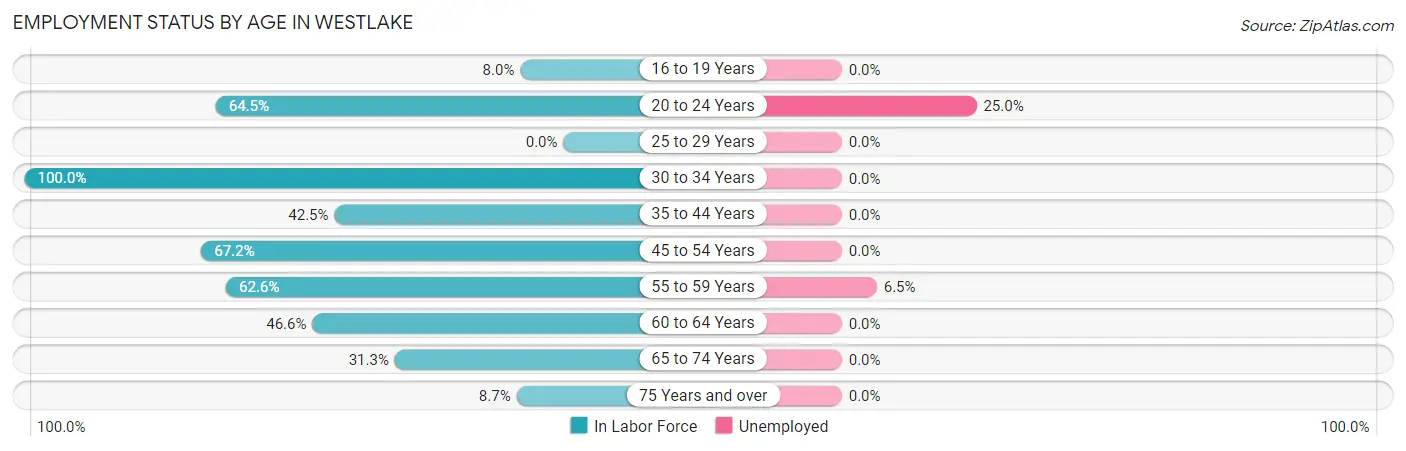
| Age Bracket | In Labor Force | Unemployed |
| 16 to 19 Years | 6 (8.0%) | 0 (0.0%) |
| 20 to 24 Years | 20 (64.5%) | 5 (25.0%) |
| 25 to 29 Years | 0 (0.0%) | 0 (0.0%) |
| 30 to 34 Years | 10 (100.0%) | 0 (0.0%) |
| 35 to 44 Years | 68 (42.5%) | 0 (0.0%) |
| 45 to 54 Years | 215 (67.2%) | 0 (0.0%) |
| 55 to 59 Years | 107 (62.6%) | 7 (6.5%) |
| 60 to 64 Years | 54 (46.6%) | 0 (0.0%) |
| 65 to 74 Years | 25 (31.3%) | 0 (0.0%) |
| 75 Years and over | 4 (8.7%) | 0 (0.0%) |
| Total | 509 (50.4%) | 12 (2.4%) |
Employment Status by Educational Attainment in Westlake
According to labor force statistics for Westlake, 58.4% of individuals (454) out of the total population between 25 and 64 years of age (777) are in the labor force, with 1.5% or 7 of them being unemployed. The group with the highest labor force participation rate are those with the educational attainment of college / associate degree, with 67.0% or 77 individuals in the labor force. Within the labor force, individuals with high school diploma education have the highest percentage of unemployment, with 50.0% or 7 of them being unemployed.
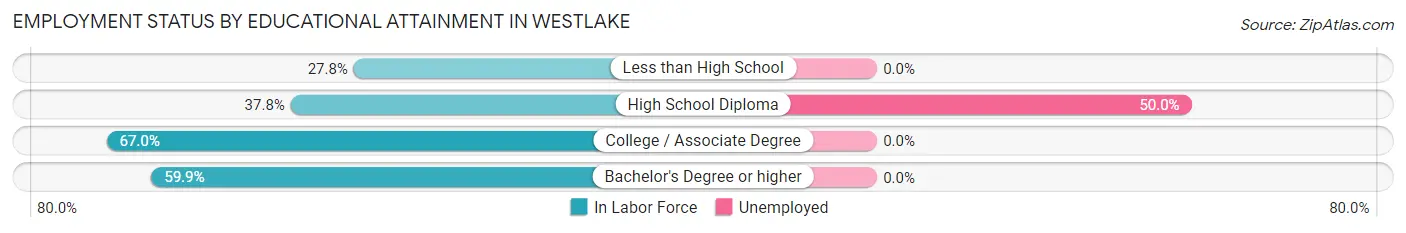
| Educational Attainment | In Labor Force | Unemployed |
| Less than High School | 10 (27.8%) | 0 (0.0%) |
| High School Diploma | 14 (37.8%) | 18 (50.0%) |
| College / Associate Degree | 77 (67.0%) | 0 (0.0%) |
| Bachelor's Degree or higher | 353 (59.9%) | 0 (0.0%) |
| Total | 454 (58.4%) | 12 (1.5%) |
Employment Occupations by Sex in Westlake
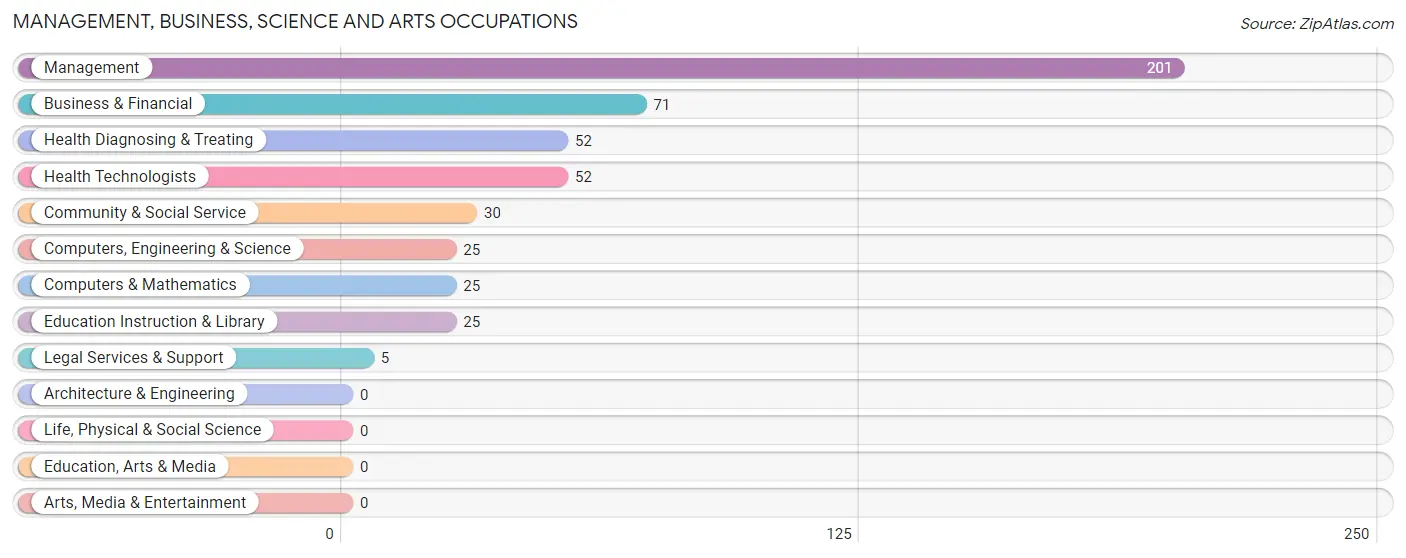
Management, Business, Science and Arts Occupations
The most common Management, Business, Science and Arts occupations in Westlake are Management (201 | 40.4%), Business & Financial (71 | 14.3%), Health Diagnosing & Treating (52 | 10.5%), Health Technologists (52 | 10.5%), and Community & Social Service (30 | 6.0%).
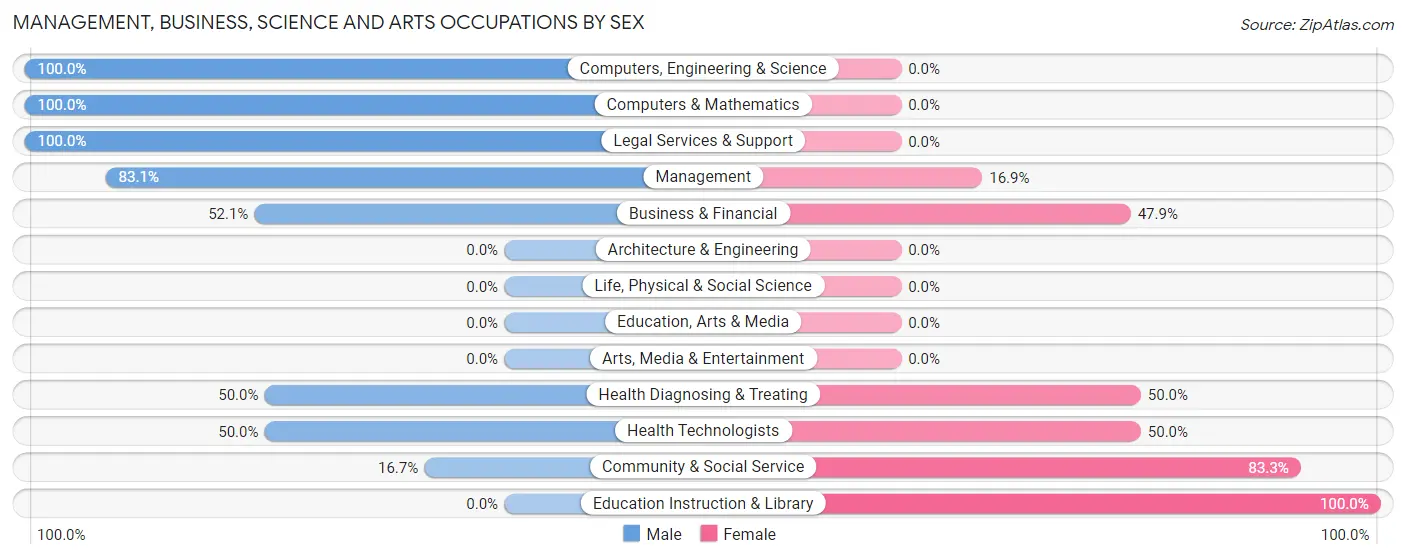
Management, Business, Science and Arts Occupations by Sex
Within the Management, Business, Science and Arts occupations in Westlake, the most male-oriented occupations are Computers, Engineering & Science (100.0%), Computers & Mathematics (100.0%), and Legal Services & Support (100.0%), while the most female-oriented occupations are Education Instruction & Library (100.0%), Community & Social Service (83.3%), and Health Diagnosing & Treating (50.0%).
| Occupation | Male | Female |
| Management | 167 (83.1%) | 34 (16.9%) |
| Business & Financial | 37 (52.1%) | 34 (47.9%) |
| Computers, Engineering & Science | 25 (100.0%) | 0 (0.0%) |
| Computers & Mathematics | 25 (100.0%) | 0 (0.0%) |
| Architecture & Engineering | 0 (0.0%) | 0 (0.0%) |
| Life, Physical & Social Science | 0 (0.0%) | 0 (0.0%) |
| Community & Social Service | 5 (16.7%) | 25 (83.3%) |
| Education, Arts & Media | 0 (0.0%) | 0 (0.0%) |
| Legal Services & Support | 5 (100.0%) | 0 (0.0%) |
| Education Instruction & Library | 0 (0.0%) | 25 (100.0%) |
| Arts, Media & Entertainment | 0 (0.0%) | 0 (0.0%) |
| Health Diagnosing & Treating | 26 (50.0%) | 26 (50.0%) |
| Health Technologists | 26 (50.0%) | 26 (50.0%) |
| Total (Category) | 260 (68.6%) | 119 (31.4%) |
| Total (Overall) | 331 (66.6%) | 166 (33.4%) |
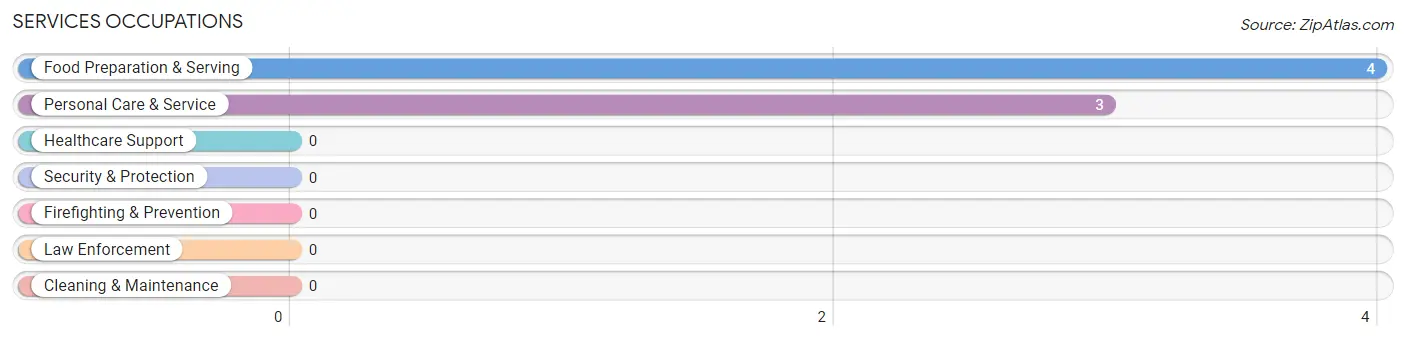
Services Occupations
The most common Services occupations in Westlake are Food Preparation & Serving (4 | 0.8%), and Personal Care & Service (3 | 0.6%).
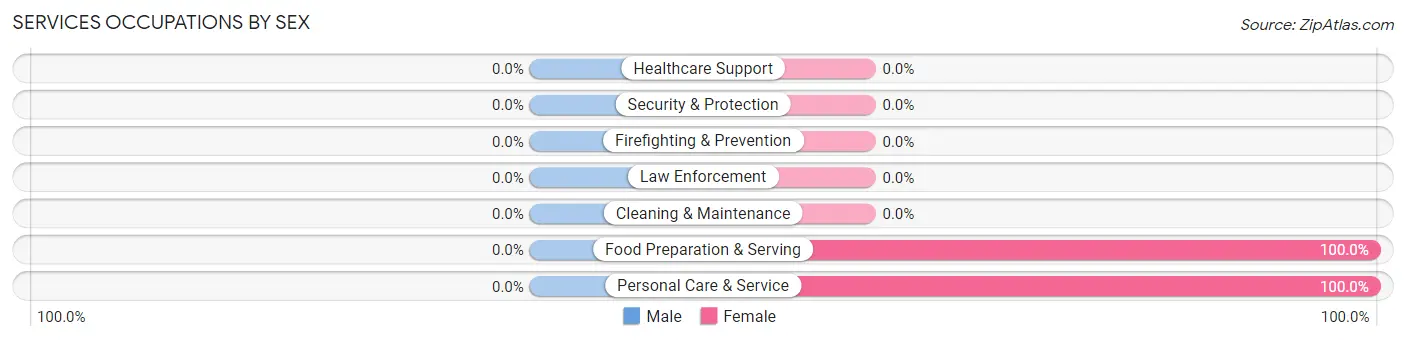
Services Occupations by Sex
| Occupation | Male | Female |
| Healthcare Support | 0 (0.0%) | 0 (0.0%) |
| Security & Protection | 0 (0.0%) | 0 (0.0%) |
| Firefighting & Prevention | 0 (0.0%) | 0 (0.0%) |
| Law Enforcement | 0 (0.0%) | 0 (0.0%) |
| Food Preparation & Serving | 0 (0.0%) | 4 (100.0%) |
| Cleaning & Maintenance | 0 (0.0%) | 0 (0.0%) |
| Personal Care & Service | 0 (0.0%) | 3 (100.0%) |
| Total (Category) | 0 (0.0%) | 7 (100.0%) |
| Total (Overall) | 331 (66.6%) | 166 (33.4%) |
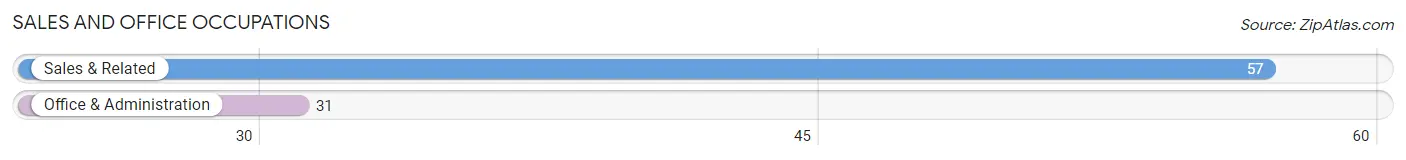
Sales and Office Occupations
The most common Sales and Office occupations in Westlake are Sales & Related (57 | 11.5%), and Office & Administration (31 | 6.2%).
Sales and Office Occupations by Sex
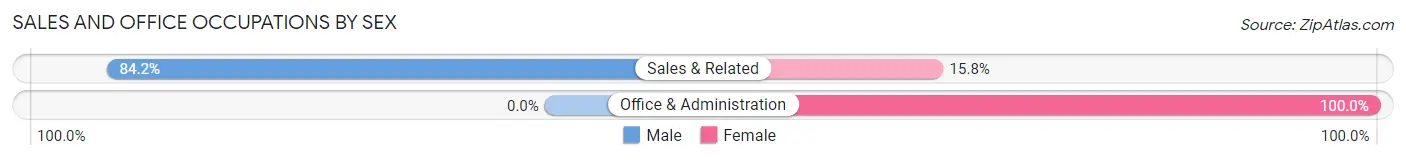
| Occupation | Male | Female |
| Sales & Related | 48 (84.2%) | 9 (15.8%) |
| Office & Administration | 0 (0.0%) | 31 (100.0%) |
| Total (Category) | 48 (54.5%) | 40 (45.5%) |
| Total (Overall) | 331 (66.6%) | 166 (33.4%) |
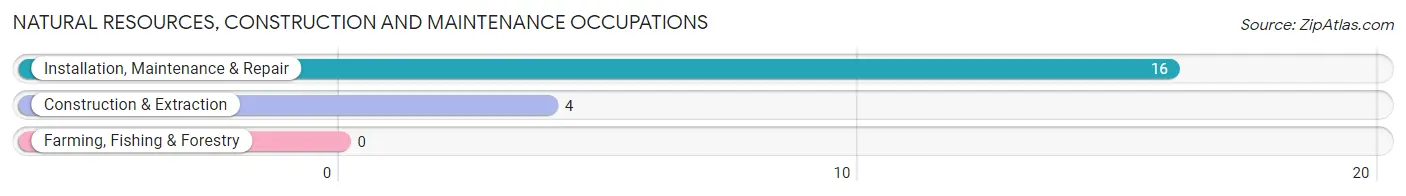
Natural Resources, Construction and Maintenance Occupations
The most common Natural Resources, Construction and Maintenance occupations in Westlake are Installation, Maintenance & Repair (16 | 3.2%), and Construction & Extraction (4 | 0.8%).
Natural Resources, Construction and Maintenance Occupations by Sex
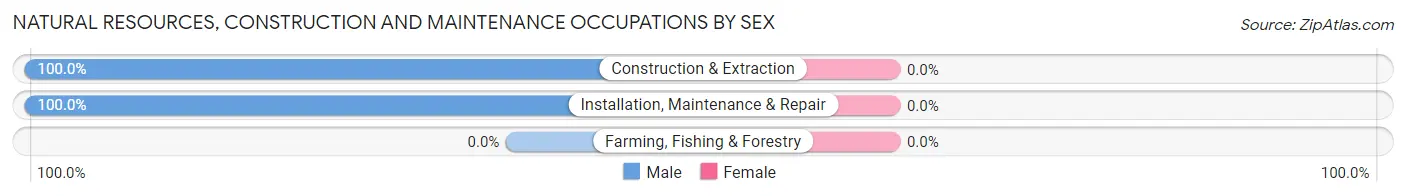
| Occupation | Male | Female |
| Farming, Fishing & Forestry | 0 (0.0%) | 0 (0.0%) |
| Construction & Extraction | 4 (100.0%) | 0 (0.0%) |
| Installation, Maintenance & Repair | 16 (100.0%) | 0 (0.0%) |
| Total (Category) | 20 (100.0%) | 0 (0.0%) |
| Total (Overall) | 331 (66.6%) | 166 (33.4%) |
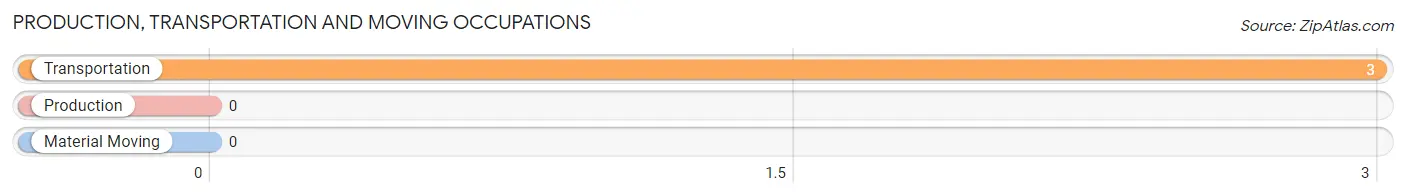
Production, Transportation and Moving Occupations
The most common Production, Transportation and Moving occupations in Westlake are , and Transportation (3 | 0.6%).
Production, Transportation and Moving Occupations by Sex
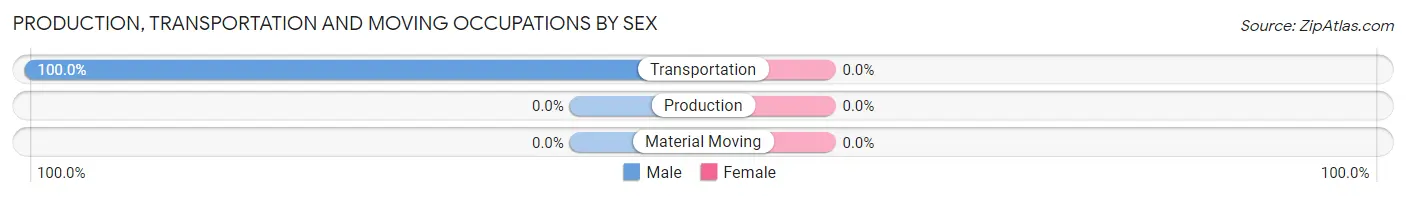
| Occupation | Male | Female |
| Production | 0 (0.0%) | 0 (0.0%) |
| Transportation | 3 (100.0%) | 0 (0.0%) |
| Material Moving | 0 (0.0%) | 0 (0.0%) |
| Total (Category) | 3 (100.0%) | 0 (0.0%) |
| Total (Overall) | 331 (66.6%) | 166 (33.4%) |
Employment Industries by Sex in Westlake
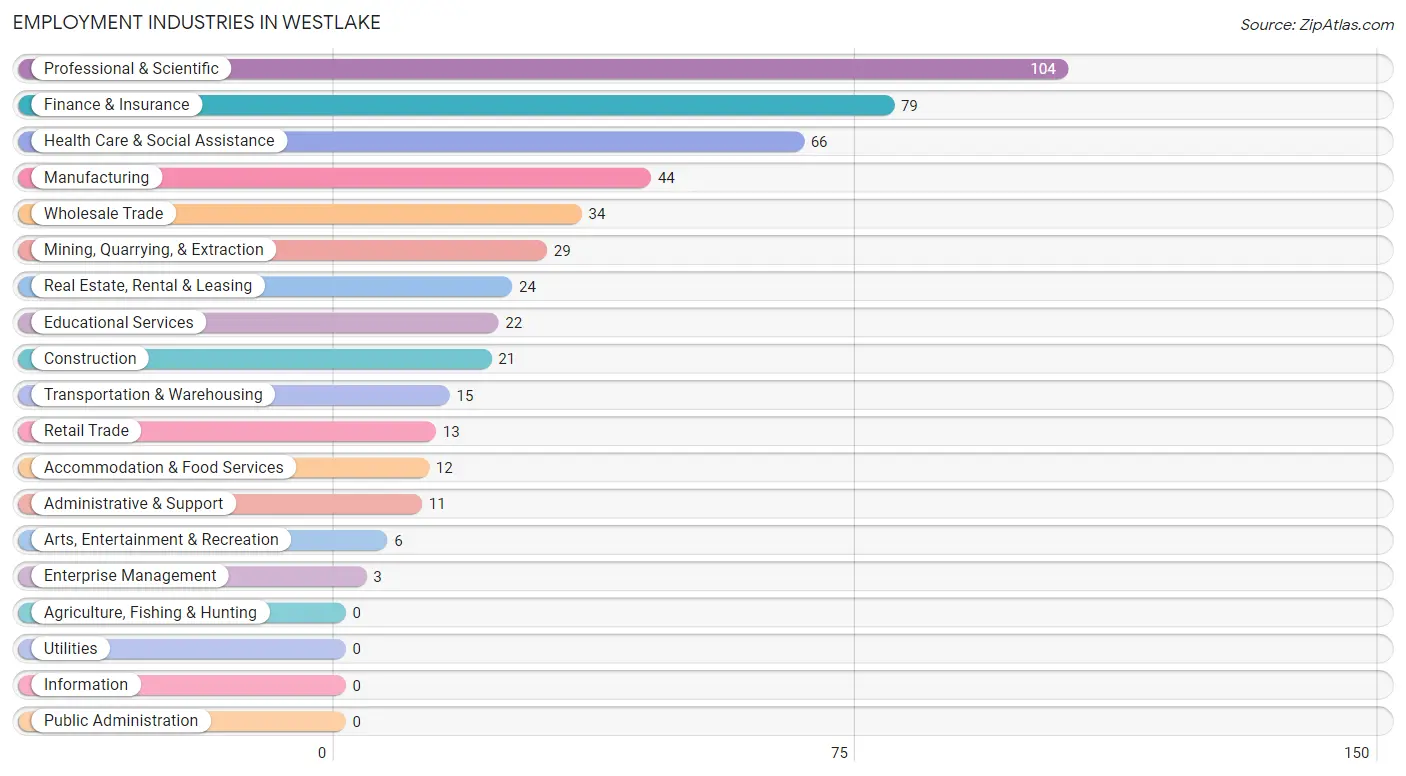
Employment Industries in Westlake
The major employment industries in Westlake include Professional & Scientific (104 | 20.9%), Finance & Insurance (79 | 15.9%), Health Care & Social Assistance (66 | 13.3%), Manufacturing (44 | 8.8%), and Wholesale Trade (34 | 6.8%).
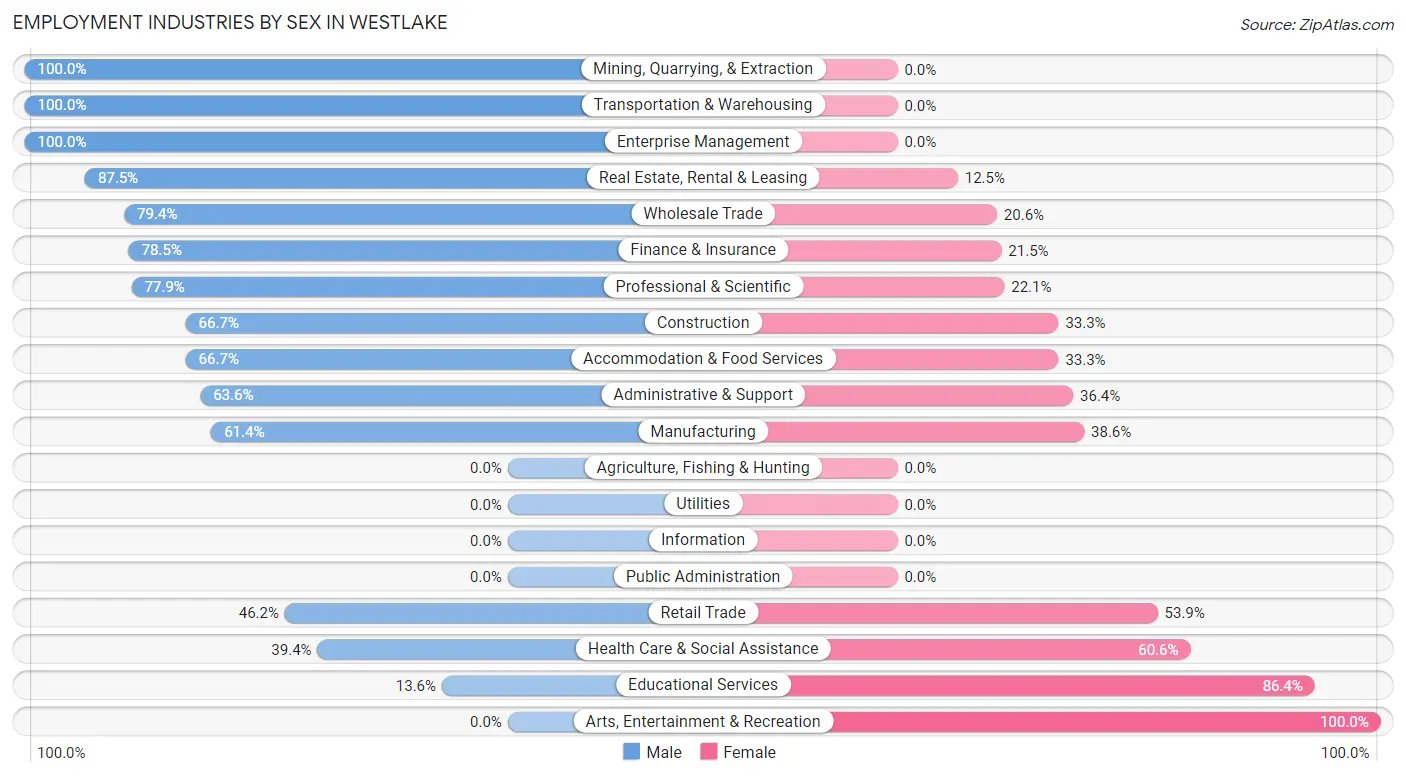
Employment Industries by Sex in Westlake
The Westlake industries that see more men than women are Mining, Quarrying, & Extraction (100.0%), Transportation & Warehousing (100.0%), and Enterprise Management (100.0%), whereas the industries that tend to have a higher number of women are Arts, Entertainment & Recreation (100.0%), Educational Services (86.4%), and Health Care & Social Assistance (60.6%).
| Industry | Male | Female |
| Agriculture, Fishing & Hunting | 0 (0.0%) | 0 (0.0%) |
| Mining, Quarrying, & Extraction | 29 (100.0%) | 0 (0.0%) |
| Construction | 14 (66.7%) | 7 (33.3%) |
| Manufacturing | 27 (61.4%) | 17 (38.6%) |
| Wholesale Trade | 27 (79.4%) | 7 (20.6%) |
| Retail Trade | 6 (46.2%) | 7 (53.8%) |
| Transportation & Warehousing | 15 (100.0%) | 0 (0.0%) |
| Utilities | 0 (0.0%) | 0 (0.0%) |
| Information | 0 (0.0%) | 0 (0.0%) |
| Finance & Insurance | 62 (78.5%) | 17 (21.5%) |
| Real Estate, Rental & Leasing | 21 (87.5%) | 3 (12.5%) |
| Professional & Scientific | 81 (77.9%) | 23 (22.1%) |
| Enterprise Management | 3 (100.0%) | 0 (0.0%) |
| Administrative & Support | 7 (63.6%) | 4 (36.4%) |
| Educational Services | 3 (13.6%) | 19 (86.4%) |
| Health Care & Social Assistance | 26 (39.4%) | 40 (60.6%) |
| Arts, Entertainment & Recreation | 0 (0.0%) | 6 (100.0%) |
| Accommodation & Food Services | 8 (66.7%) | 4 (33.3%) |
| Public Administration | 0 (0.0%) | 0 (0.0%) |
| Total | 331 (66.6%) | 166 (33.4%) |
Education in Westlake
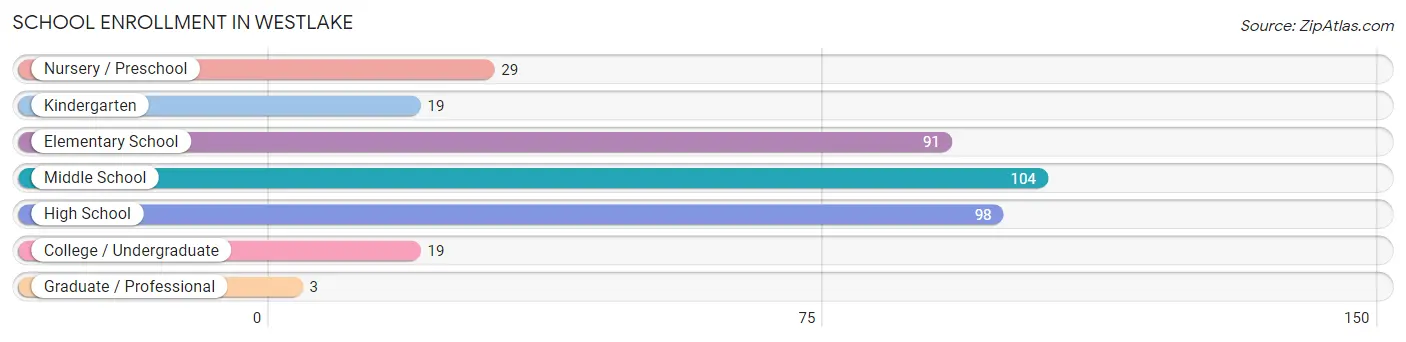
School Enrollment in Westlake
The most common levels of schooling among the 363 students in Westlake are middle school (104 | 28.6%), high school (98 | 27.0%), and elementary school (91 | 25.1%).
| School Level | # Students | % Students |
| Nursery / Preschool | 29 | 8.0% |
| Kindergarten | 19 | 5.2% |
| Elementary School | 91 | 25.1% |
| Middle School | 104 | 28.6% |
| High School | 98 | 27.0% |
| College / Undergraduate | 19 | 5.2% |
| Graduate / Professional | 3 | 0.8% |
| Total | 363 | 100.0% |
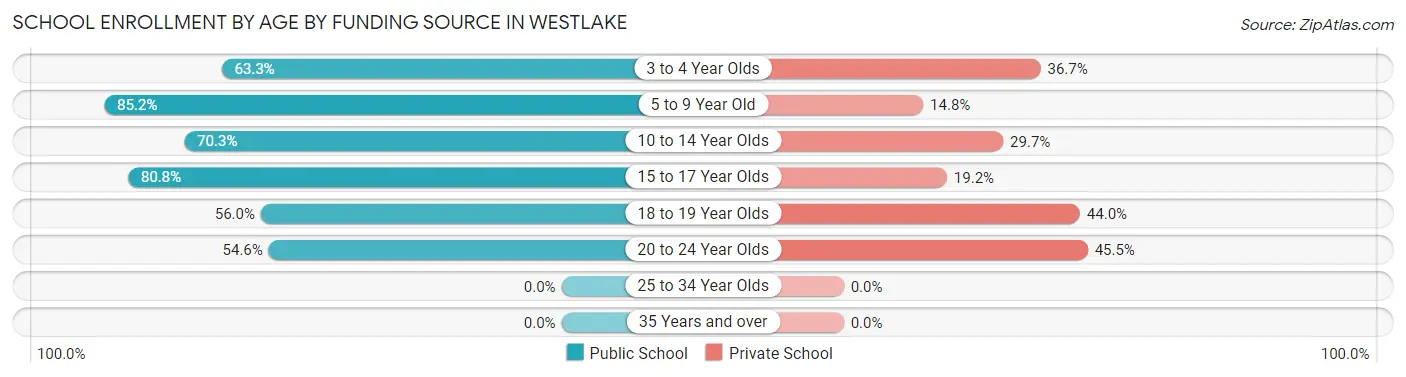
School Enrollment by Age by Funding Source in Westlake
Out of a total of 363 students who are enrolled in schools in Westlake, 95 (26.2%) attend a private institution, while the remaining 268 (73.8%) are enrolled in public schools. The age group of 20 to 24 year olds has the highest likelihood of being enrolled in private schools, with 5 (45.5% in the age bracket) enrolled. Conversely, the age group of 5 to 9 year old has the lowest likelihood of being enrolled in a private school, with 69 (85.2% in the age bracket) attending a public institution.
| Age Bracket | Public School | Private School |
| 3 to 4 Year Olds | 19 (63.3%) | 11 (36.7%) |
| 5 to 9 Year Old | 69 (85.2%) | 12 (14.8%) |
| 10 to 14 Year Olds | 97 (70.3%) | 41 (29.7%) |
| 15 to 17 Year Olds | 63 (80.8%) | 15 (19.2%) |
| 18 to 19 Year Olds | 14 (56.0%) | 11 (44.0%) |
| 20 to 24 Year Olds | 6 (54.5%) | 5 (45.5%) |
| 25 to 34 Year Olds | 0 (0.0%) | 0 (0.0%) |
| 35 Years and over | 0 (0.0%) | 0 (0.0%) |
| Total | 268 (73.8%) | 95 (26.2%) |
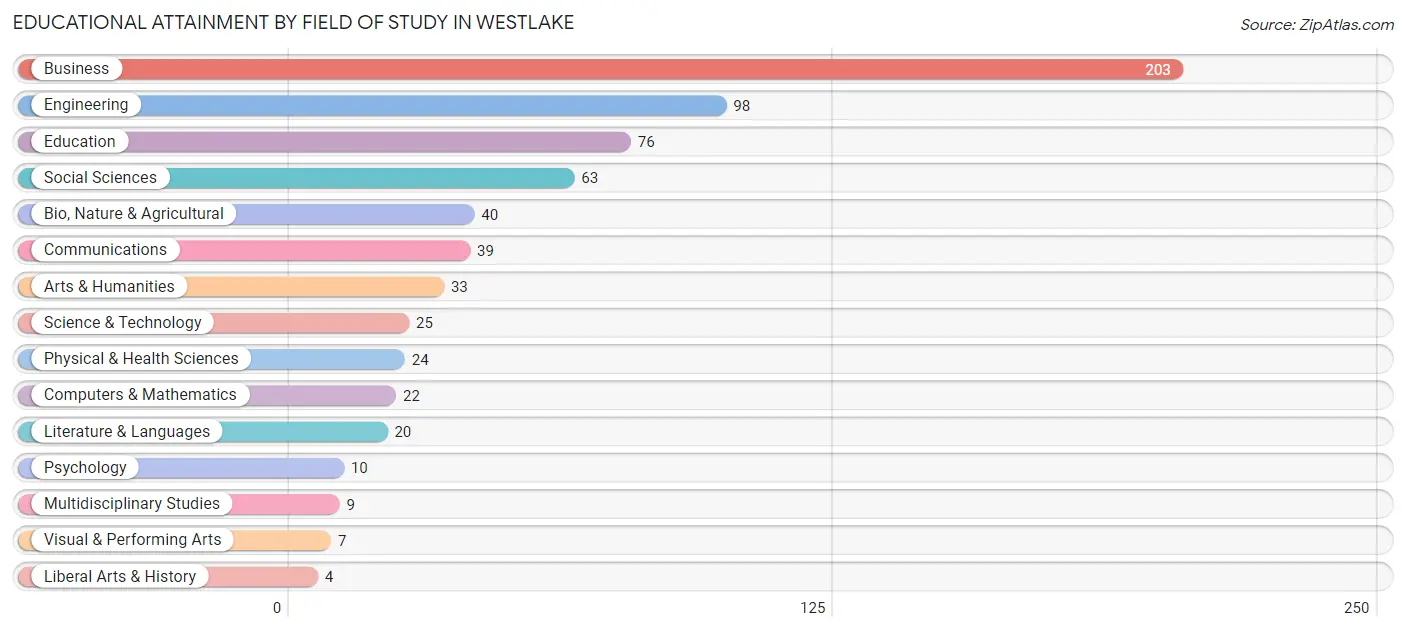
Educational Attainment by Field of Study in Westlake
Business (203 | 30.2%), engineering (98 | 14.6%), education (76 | 11.3%), social sciences (63 | 9.4%), and bio, nature & agricultural (40 | 5.9%) are the most common fields of study among 673 individuals in Westlake who have obtained a bachelor's degree or higher.
| Field of Study | # Graduates | % Graduates |
| Computers & Mathematics | 22 | 3.3% |
| Bio, Nature & Agricultural | 40 | 5.9% |
| Physical & Health Sciences | 24 | 3.6% |
| Psychology | 10 | 1.5% |
| Social Sciences | 63 | 9.4% |
| Engineering | 98 | 14.6% |
| Multidisciplinary Studies | 9 | 1.3% |
| Science & Technology | 25 | 3.7% |
| Business | 203 | 30.2% |
| Education | 76 | 11.3% |
| Literature & Languages | 20 | 3.0% |
| Liberal Arts & History | 4 | 0.6% |
| Visual & Performing Arts | 7 | 1.0% |
| Communications | 39 | 5.8% |
| Arts & Humanities | 33 | 4.9% |
| Total | 673 | 100.0% |
Transportation & Commute in Westlake
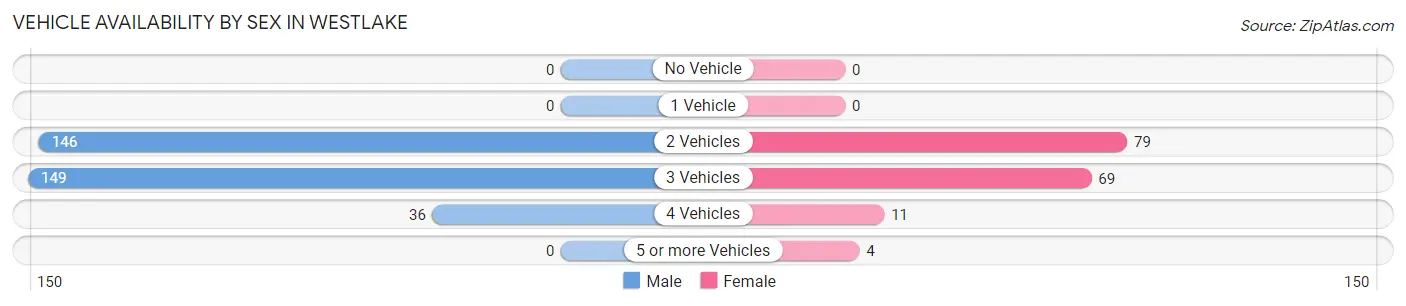
Vehicle Availability by Sex in Westlake
The most prevalent vehicle ownership categories in Westlake are males with 3 vehicles (149, accounting for 45.0%) and females with 3 vehicles (69, making up 91.4%).
| Vehicles Available | Male | Female |
| No Vehicle | 0 (0.0%) | 0 (0.0%) |
| 1 Vehicle | 0 (0.0%) | 0 (0.0%) |
| 2 Vehicles | 146 (44.1%) | 79 (48.5%) |
| 3 Vehicles | 149 (45.0%) | 69 (42.3%) |
| 4 Vehicles | 36 (10.9%) | 11 (6.8%) |
| 5 or more Vehicles | 0 (0.0%) | 4 (2.5%) |
| Total | 331 (100.0%) | 163 (100.0%) |
Commute Time in Westlake
The most frequently occuring commute durations in Westlake are 30 to 34 minutes (67 commuters, 23.5%), 20 to 24 minutes (47 commuters, 16.5%), and 45 to 59 minutes (47 commuters, 16.5%).
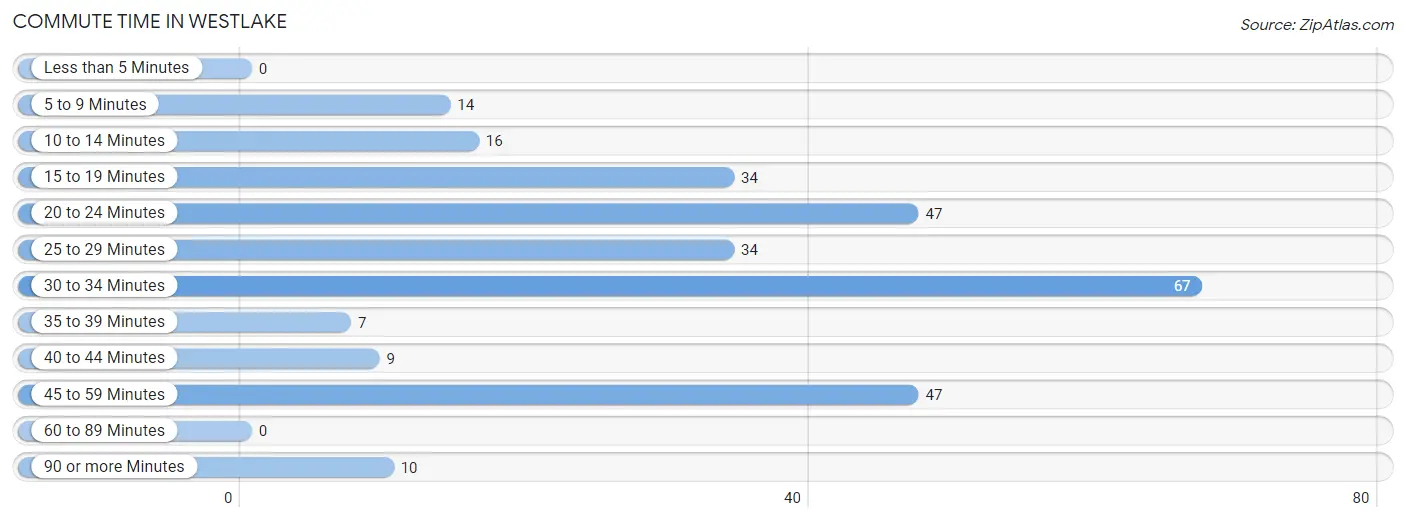
| Commute Time | # Commuters | % Commuters |
| Less than 5 Minutes | 0 | 0.0% |
| 5 to 9 Minutes | 14 | 4.9% |
| 10 to 14 Minutes | 16 | 5.6% |
| 15 to 19 Minutes | 34 | 11.9% |
| 20 to 24 Minutes | 47 | 16.5% |
| 25 to 29 Minutes | 34 | 11.9% |
| 30 to 34 Minutes | 67 | 23.5% |
| 35 to 39 Minutes | 7 | 2.5% |
| 40 to 44 Minutes | 9 | 3.2% |
| 45 to 59 Minutes | 47 | 16.5% |
| 60 to 89 Minutes | 0 | 0.0% |
| 90 or more Minutes | 10 | 3.5% |
Commute Time by Sex in Westlake
The most common commute times in Westlake are 30 to 34 minutes (54 commuters, 26.1%) for males and 15 to 19 minutes (16 commuters, 20.5%) for females.
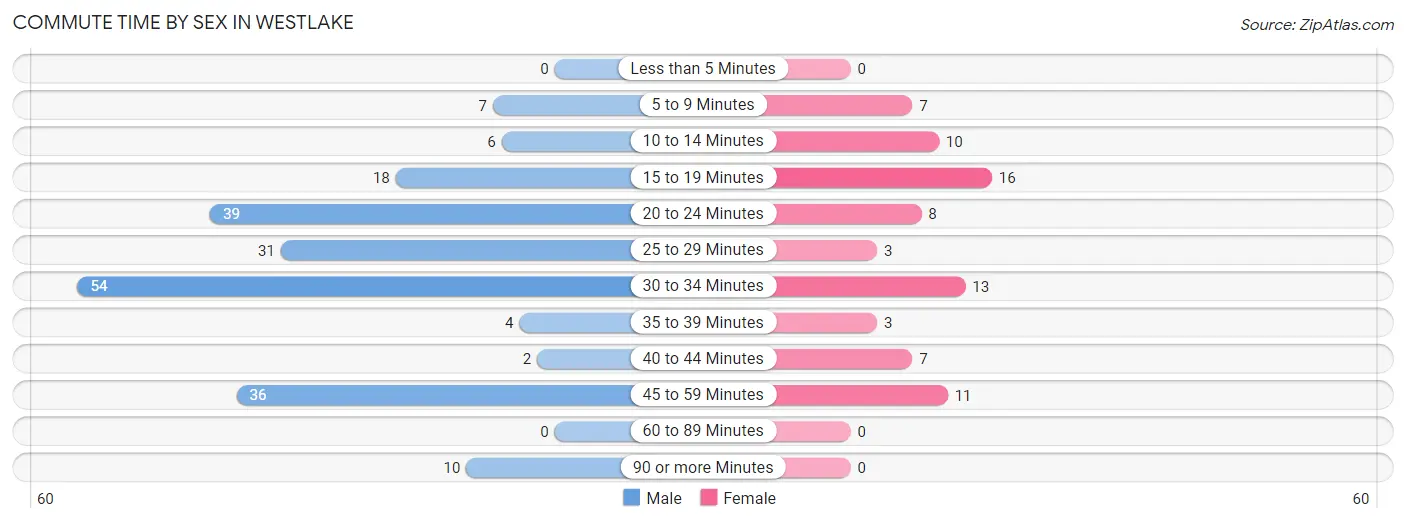
| Commute Time | Male | Female |
| Less than 5 Minutes | 0 (0.0%) | 0 (0.0%) |
| 5 to 9 Minutes | 7 (3.4%) | 7 (9.0%) |
| 10 to 14 Minutes | 6 (2.9%) | 10 (12.8%) |
| 15 to 19 Minutes | 18 (8.7%) | 16 (20.5%) |
| 20 to 24 Minutes | 39 (18.8%) | 8 (10.3%) |
| 25 to 29 Minutes | 31 (15.0%) | 3 (3.8%) |
| 30 to 34 Minutes | 54 (26.1%) | 13 (16.7%) |
| 35 to 39 Minutes | 4 (1.9%) | 3 (3.8%) |
| 40 to 44 Minutes | 2 (1.0%) | 7 (9.0%) |
| 45 to 59 Minutes | 36 (17.4%) | 11 (14.1%) |
| 60 to 89 Minutes | 0 (0.0%) | 0 (0.0%) |
| 90 or more Minutes | 10 (4.8%) | 0 (0.0%) |
Time of Departure to Work by Sex in Westlake
The most frequent times of departure to work in Westlake are 7:30 AM to 7:59 AM (55, 26.6%) for males and 7:00 AM to 7:29 AM (15, 19.2%) for females.
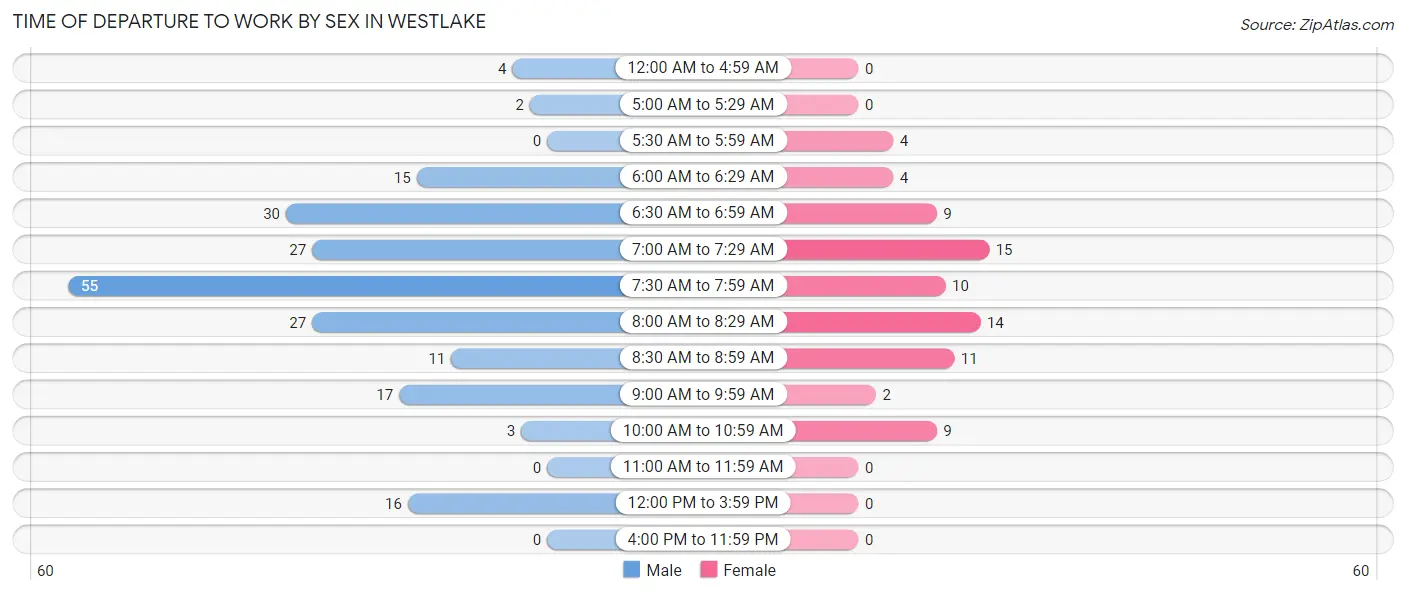
| Time of Departure | Male | Female |
| 12:00 AM to 4:59 AM | 4 (1.9%) | 0 (0.0%) |
| 5:00 AM to 5:29 AM | 2 (1.0%) | 0 (0.0%) |
| 5:30 AM to 5:59 AM | 0 (0.0%) | 4 (5.1%) |
| 6:00 AM to 6:29 AM | 15 (7.2%) | 4 (5.1%) |
| 6:30 AM to 6:59 AM | 30 (14.5%) | 9 (11.5%) |
| 7:00 AM to 7:29 AM | 27 (13.0%) | 15 (19.2%) |
| 7:30 AM to 7:59 AM | 55 (26.6%) | 10 (12.8%) |
| 8:00 AM to 8:29 AM | 27 (13.0%) | 14 (17.9%) |
| 8:30 AM to 8:59 AM | 11 (5.3%) | 11 (14.1%) |
| 9:00 AM to 9:59 AM | 17 (8.2%) | 2 (2.6%) |
| 10:00 AM to 10:59 AM | 3 (1.5%) | 9 (11.5%) |
| 11:00 AM to 11:59 AM | 0 (0.0%) | 0 (0.0%) |
| 12:00 PM to 3:59 PM | 16 (7.7%) | 0 (0.0%) |
| 4:00 PM to 11:59 PM | 0 (0.0%) | 0 (0.0%) |
| Total | 207 (100.0%) | 78 (100.0%) |
Housing Occupancy in Westlake
Occupancy by Ownership in Westlake
Of the total 435 dwellings in Westlake, owner-occupied units account for 424 (97.5%), while renter-occupied units make up 11 (2.5%).
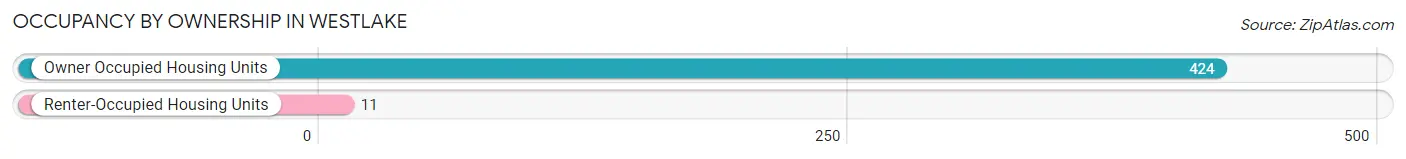
| Occupancy | # Housing Units | % Housing Units |
| Owner Occupied Housing Units | 424 | 97.5% |
| Renter-Occupied Housing Units | 11 | 2.5% |
| Total Occupied Housing Units | 435 | 100.0% |
Occupancy by Household Size in Westlake
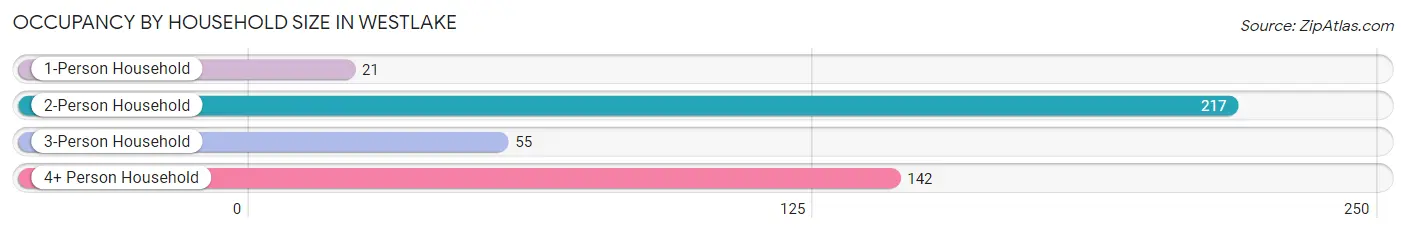
| Household Size | # Housing Units | % Housing Units |
| 1-Person Household | 21 | 4.8% |
| 2-Person Household | 217 | 49.9% |
| 3-Person Household | 55 | 12.6% |
| 4+ Person Household | 142 | 32.6% |
| Total Housing Units | 435 | 100.0% |
Occupancy by Ownership by Household Size in Westlake
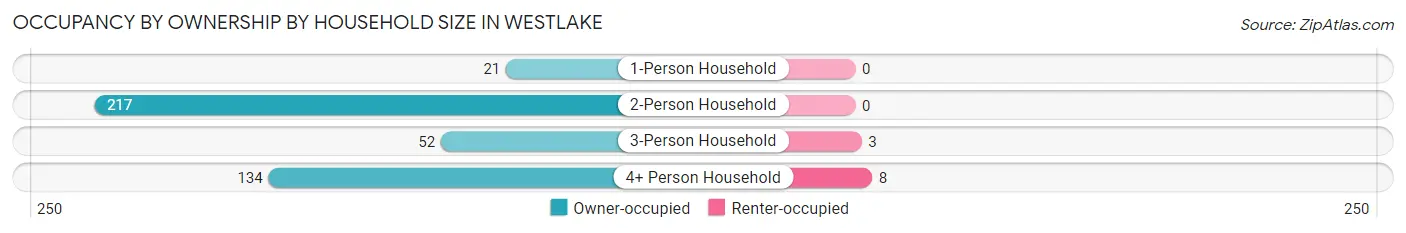
| Household Size | Owner-occupied | Renter-occupied |
| 1-Person Household | 21 (100.0%) | 0 (0.0%) |
| 2-Person Household | 217 (100.0%) | 0 (0.0%) |
| 3-Person Household | 52 (94.6%) | 3 (5.4%) |
| 4+ Person Household | 134 (94.4%) | 8 (5.6%) |
| Total Housing Units | 424 (97.5%) | 11 (2.5%) |
Occupancy by Educational Attainment in Westlake
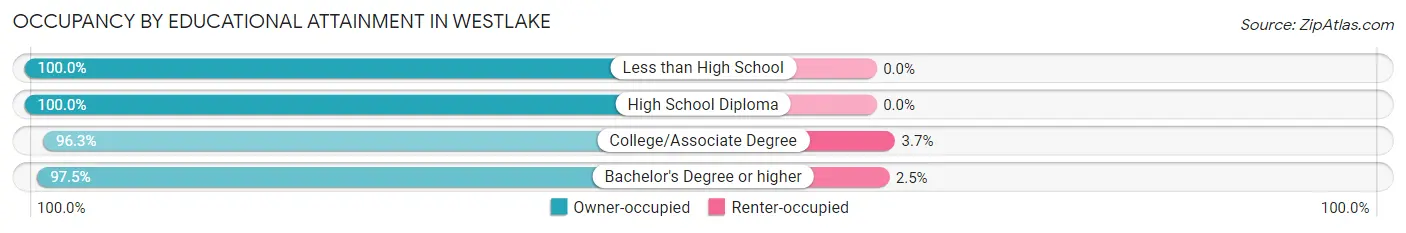
| Household Size | Owner-occupied | Renter-occupied |
| Less than High School | 26 (100.0%) | 0 (0.0%) |
| High School Diploma | 8 (100.0%) | 0 (0.0%) |
| College/Associate Degree | 79 (96.3%) | 3 (3.7%) |
| Bachelor's Degree or higher | 311 (97.5%) | 8 (2.5%) |
Occupancy by Age of Householder in Westlake
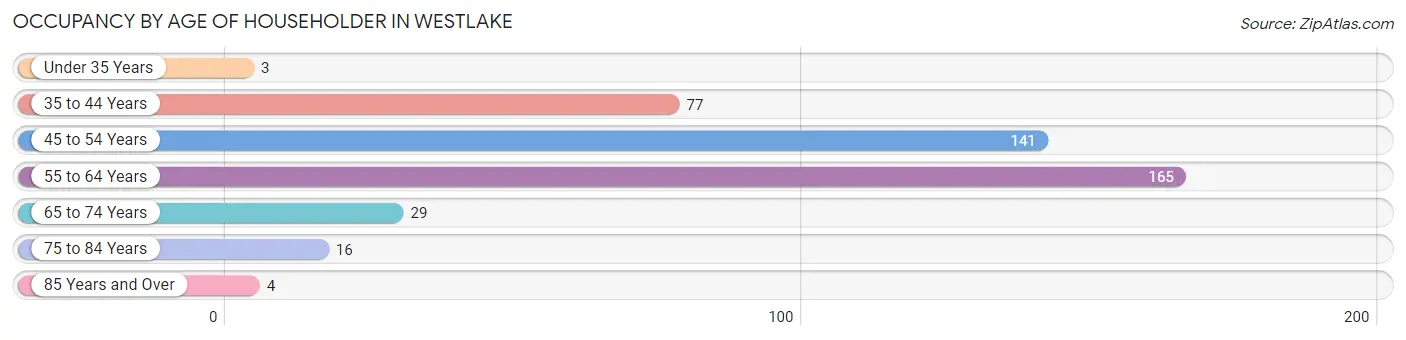
| Age Bracket | # Households | % Households |
| Under 35 Years | 3 | 0.7% |
| 35 to 44 Years | 77 | 17.7% |
| 45 to 54 Years | 141 | 32.4% |
| 55 to 64 Years | 165 | 37.9% |
| 65 to 74 Years | 29 | 6.7% |
| 75 to 84 Years | 16 | 3.7% |
| 85 Years and Over | 4 | 0.9% |
| Total | 435 | 100.0% |
Housing Finances in Westlake
Median Income by Occupancy in Westlake
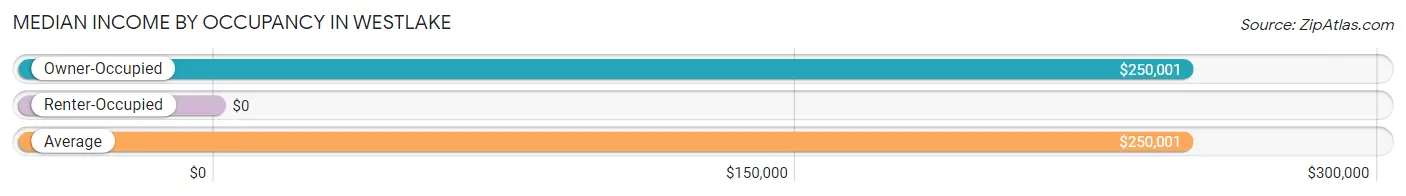
| Occupancy Type | # Households | Median Income |
| Owner-Occupied | 424 (97.5%) | $250,001 |
| Renter-Occupied | 11 (2.5%) | $0 |
| Average | 435 (100.0%) | $250,001 |
Occupancy by Householder Income Bracket in Westlake
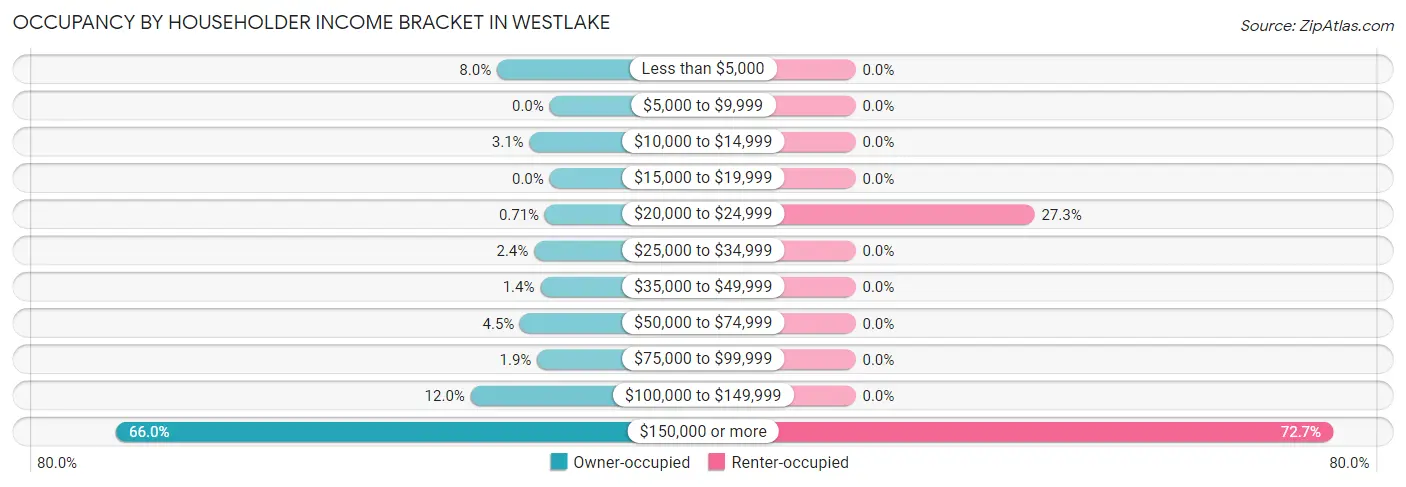
| Income Bracket | Owner-occupied | Renter-occupied |
| Less than $5,000 | 34 (8.0%) | 0 (0.0%) |
| $5,000 to $9,999 | 0 (0.0%) | 0 (0.0%) |
| $10,000 to $14,999 | 13 (3.1%) | 0 (0.0%) |
| $15,000 to $19,999 | 0 (0.0%) | 0 (0.0%) |
| $20,000 to $24,999 | 3 (0.7%) | 3 (27.3%) |
| $25,000 to $34,999 | 10 (2.4%) | 0 (0.0%) |
| $35,000 to $49,999 | 6 (1.4%) | 0 (0.0%) |
| $50,000 to $74,999 | 19 (4.5%) | 0 (0.0%) |
| $75,000 to $99,999 | 8 (1.9%) | 0 (0.0%) |
| $100,000 to $149,999 | 51 (12.0%) | 0 (0.0%) |
| $150,000 or more | 280 (66.0%) | 8 (72.7%) |
| Total | 424 (100.0%) | 11 (100.0%) |
Monthly Housing Cost Tiers in Westlake
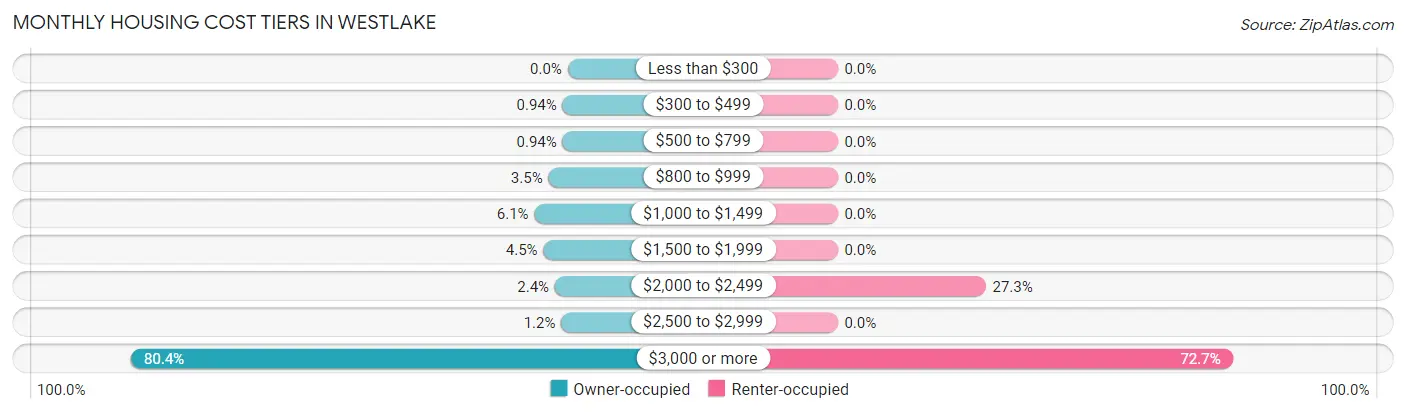
| Monthly Cost | Owner-occupied | Renter-occupied |
| Less than $300 | 0 (0.0%) | 0 (0.0%) |
| $300 to $499 | 4 (0.9%) | 0 (0.0%) |
| $500 to $799 | 4 (0.9%) | 0 (0.0%) |
| $800 to $999 | 15 (3.5%) | 0 (0.0%) |
| $1,000 to $1,499 | 26 (6.1%) | 0 (0.0%) |
| $1,500 to $1,999 | 19 (4.5%) | 0 (0.0%) |
| $2,000 to $2,499 | 10 (2.4%) | 3 (27.3%) |
| $2,500 to $2,999 | 5 (1.2%) | 0 (0.0%) |
| $3,000 or more | 341 (80.4%) | 8 (72.7%) |
| Total | 424 (100.0%) | 11 (100.0%) |
Physical Housing Characteristics in Westlake
Housing Structures in Westlake
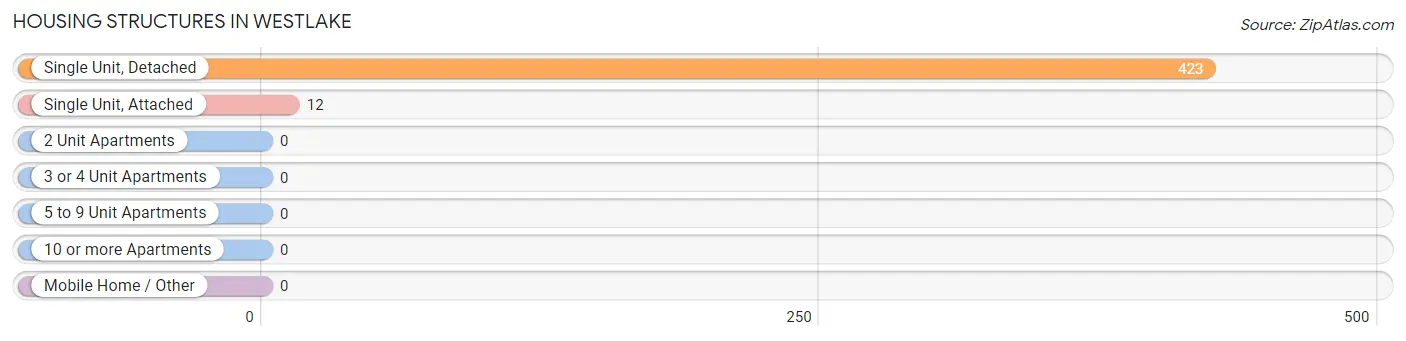
| Structure Type | # Housing Units | % Housing Units |
| Single Unit, Detached | 423 | 97.2% |
| Single Unit, Attached | 12 | 2.8% |
| 2 Unit Apartments | 0 | 0.0% |
| 3 or 4 Unit Apartments | 0 | 0.0% |
| 5 to 9 Unit Apartments | 0 | 0.0% |
| 10 or more Apartments | 0 | 0.0% |
| Mobile Home / Other | 0 | 0.0% |
| Total | 435 | 100.0% |
Housing Structures by Occupancy in Westlake
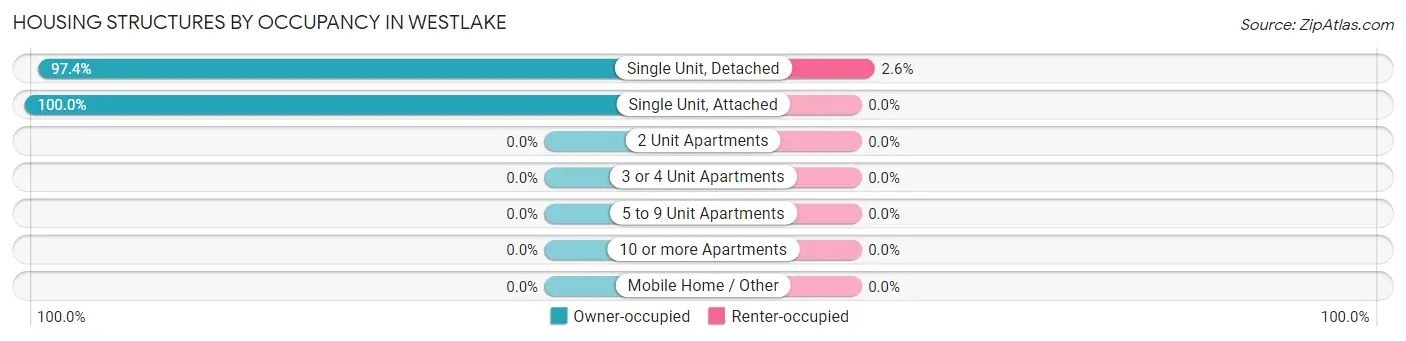
| Structure Type | Owner-occupied | Renter-occupied |
| Single Unit, Detached | 412 (97.4%) | 11 (2.6%) |
| Single Unit, Attached | 12 (100.0%) | 0 (0.0%) |
| 2 Unit Apartments | 0 (0.0%) | 0 (0.0%) |
| 3 or 4 Unit Apartments | 0 (0.0%) | 0 (0.0%) |
| 5 to 9 Unit Apartments | 0 (0.0%) | 0 (0.0%) |
| 10 or more Apartments | 0 (0.0%) | 0 (0.0%) |
| Mobile Home / Other | 0 (0.0%) | 0 (0.0%) |
| Total | 424 (97.5%) | 11 (2.5%) |
Housing Structures by Number of Rooms in Westlake
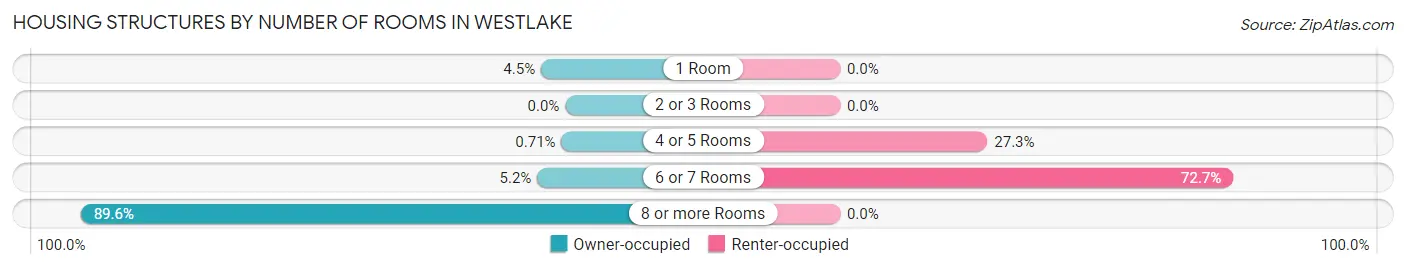
| Number of Rooms | Owner-occupied | Renter-occupied |
| 1 Room | 19 (4.5%) | 0 (0.0%) |
| 2 or 3 Rooms | 0 (0.0%) | 0 (0.0%) |
| 4 or 5 Rooms | 3 (0.7%) | 3 (27.3%) |
| 6 or 7 Rooms | 22 (5.2%) | 8 (72.7%) |
| 8 or more Rooms | 380 (89.6%) | 0 (0.0%) |
| Total | 424 (100.0%) | 11 (100.0%) |
Housing Structure by Heating Type in Westlake
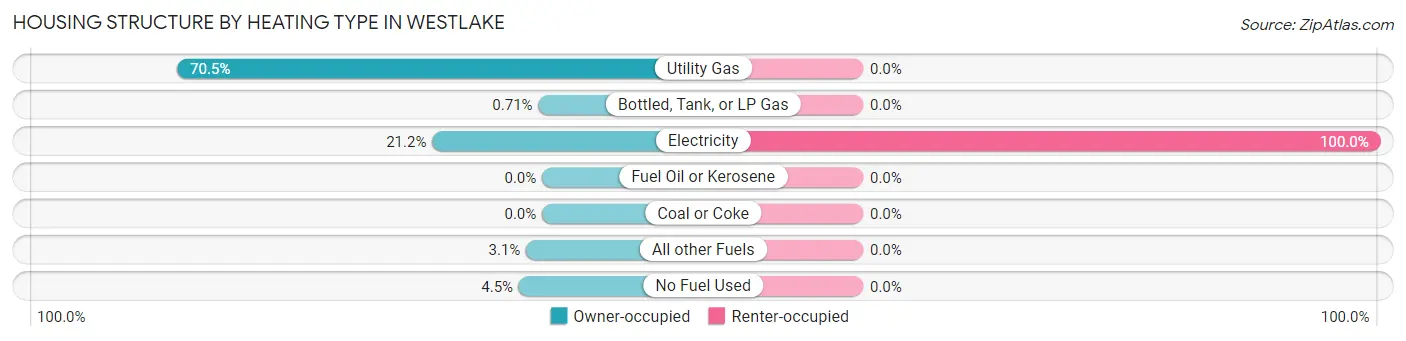
| Heating Type | Owner-occupied | Renter-occupied |
| Utility Gas | 299 (70.5%) | 0 (0.0%) |
| Bottled, Tank, or LP Gas | 3 (0.7%) | 0 (0.0%) |
| Electricity | 90 (21.2%) | 11 (100.0%) |
| Fuel Oil or Kerosene | 0 (0.0%) | 0 (0.0%) |
| Coal or Coke | 0 (0.0%) | 0 (0.0%) |
| All other Fuels | 13 (3.1%) | 0 (0.0%) |
| No Fuel Used | 19 (4.5%) | 0 (0.0%) |
| Total | 424 (100.0%) | 11 (100.0%) |
Household Vehicle Usage in Westlake
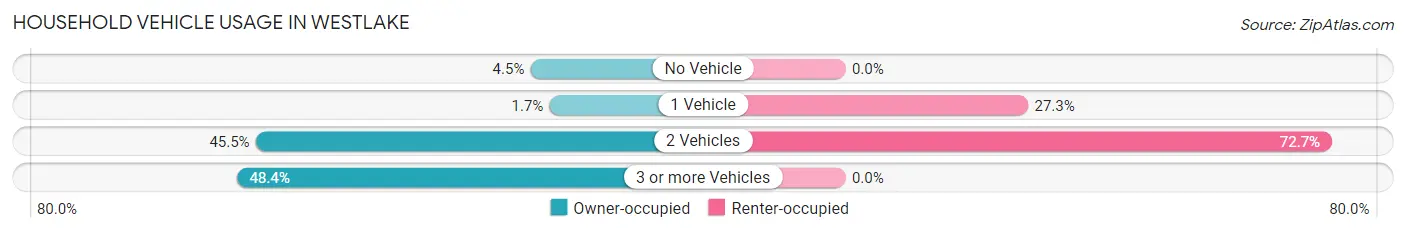
| Vehicles per Household | Owner-occupied | Renter-occupied |
| No Vehicle | 19 (4.5%) | 0 (0.0%) |
| 1 Vehicle | 7 (1.7%) | 3 (27.3%) |
| 2 Vehicles | 193 (45.5%) | 8 (72.7%) |
| 3 or more Vehicles | 205 (48.3%) | 0 (0.0%) |
| Total | 424 (100.0%) | 11 (100.0%) |
Real Estate & Mortgages in Westlake
Real Estate and Mortgage Overview in Westlake
| Characteristic | Without Mortgage | With Mortgage |
| Housing Units | 191 | 233 |
| Median Property Value | $2,000,001 | $2,000,001 |
| Median Household Income | $250,001 | $160 |
| Monthly Housing Costs | $1,501 | $207 |
| Real Estate Taxes | $10,001 | $19 |
Property Value by Mortgage Status in Westlake
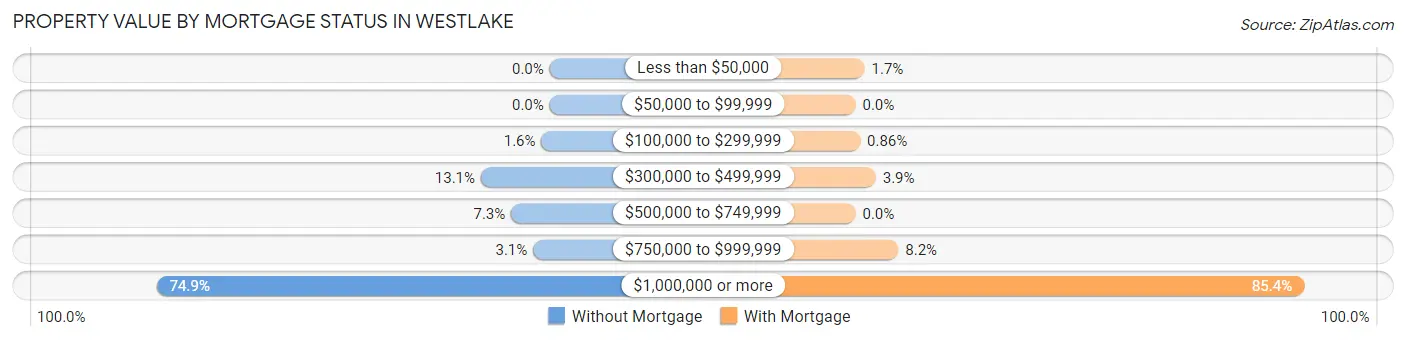
| Property Value | Without Mortgage | With Mortgage |
| Less than $50,000 | 0 (0.0%) | 4 (1.7%) |
| $50,000 to $99,999 | 0 (0.0%) | 0 (0.0%) |
| $100,000 to $299,999 | 3 (1.6%) | 2 (0.9%) |
| $300,000 to $499,999 | 25 (13.1%) | 9 (3.9%) |
| $500,000 to $749,999 | 14 (7.3%) | 0 (0.0%) |
| $750,000 to $999,999 | 6 (3.1%) | 19 (8.2%) |
| $1,000,000 or more | 143 (74.9%) | 199 (85.4%) |
| Total | 191 (100.0%) | 233 (100.0%) |
Household Income by Mortgage Status in Westlake
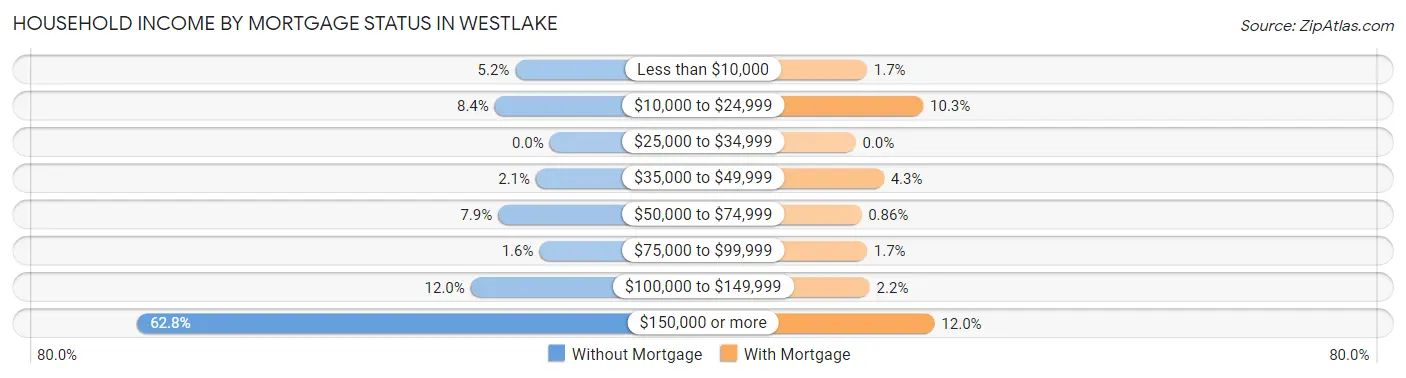
| Household Income | Without Mortgage | With Mortgage |
| Less than $10,000 | 10 (5.2%) | 4 (1.7%) |
| $10,000 to $24,999 | 16 (8.4%) | 24 (10.3%) |
| $25,000 to $34,999 | 0 (0.0%) | 0 (0.0%) |
| $35,000 to $49,999 | 4 (2.1%) | 10 (4.3%) |
| $50,000 to $74,999 | 15 (7.9%) | 2 (0.9%) |
| $75,000 to $99,999 | 3 (1.6%) | 4 (1.7%) |
| $100,000 to $149,999 | 23 (12.0%) | 5 (2.1%) |
| $150,000 or more | 120 (62.8%) | 28 (12.0%) |
| Total | 191 (100.0%) | 233 (100.0%) |
Property Value to Household Income Ratio in Westlake
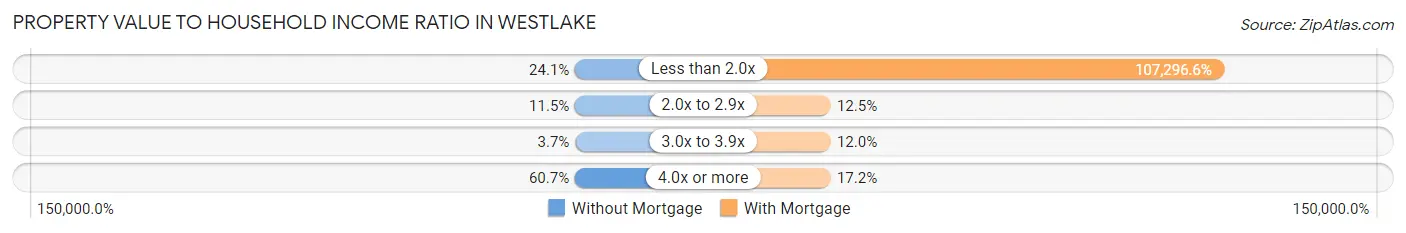
| Value-to-Income Ratio | Without Mortgage | With Mortgage |
| Less than 2.0x | 46 (24.1%) | 250,001 (107,296.6%) |
| 2.0x to 2.9x | 22 (11.5%) | 29 (12.4%) |
| 3.0x to 3.9x | 7 (3.7%) | 28 (12.0%) |
| 4.0x or more | 116 (60.7%) | 40 (17.2%) |
| Total | 191 (100.0%) | 233 (100.0%) |
Real Estate Taxes by Mortgage Status in Westlake
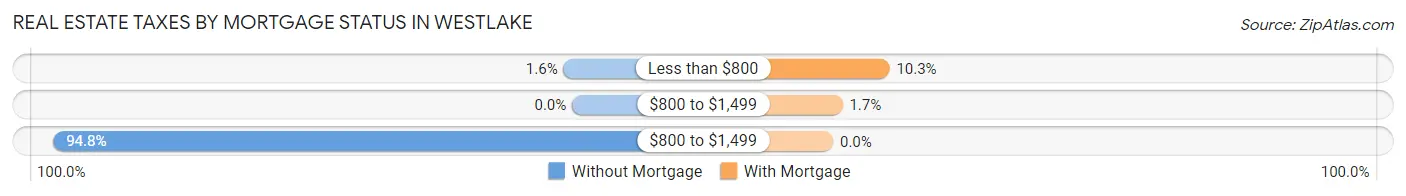
| Property Taxes | Without Mortgage | With Mortgage |
| Less than $800 | 3 (1.6%) | 24 (10.3%) |
| $800 to $1,499 | 0 (0.0%) | 4 (1.7%) |
| $800 to $1,499 | 181 (94.8%) | 0 (0.0%) |
| Total | 191 (100.0%) | 233 (100.0%) |
Health & Disability in Westlake
Health Insurance Coverage by Age in Westlake
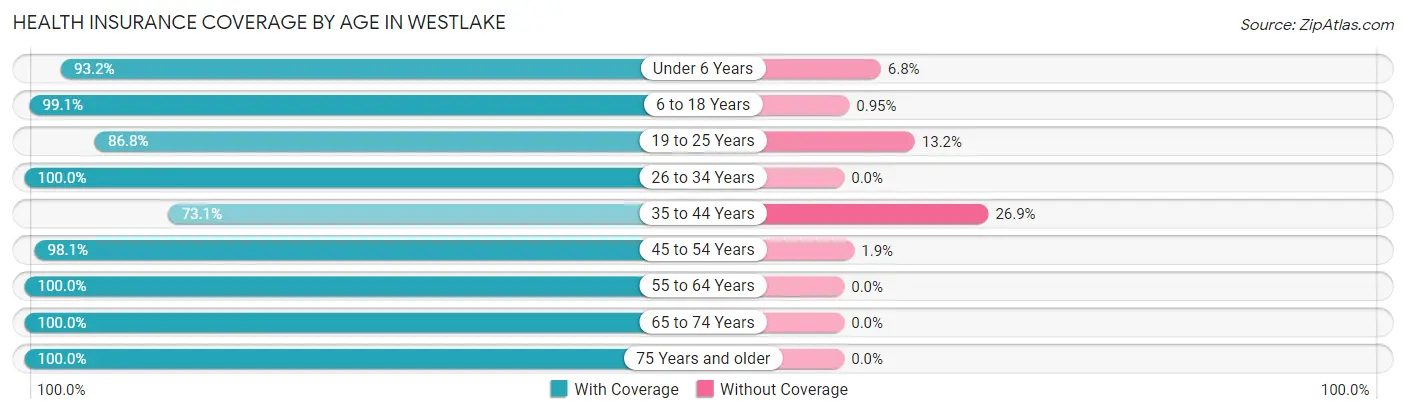
| Age Bracket | With Coverage | Without Coverage |
| Under 6 Years | 41 (93.2%) | 3 (6.8%) |
| 6 to 18 Years | 312 (99.1%) | 3 (0.9%) |
| 19 to 25 Years | 33 (86.8%) | 5 (13.2%) |
| 26 to 34 Years | 10 (100.0%) | 0 (0.0%) |
| 35 to 44 Years | 117 (73.1%) | 43 (26.9%) |
| 45 to 54 Years | 314 (98.1%) | 6 (1.9%) |
| 55 to 64 Years | 287 (100.0%) | 0 (0.0%) |
| 65 to 74 Years | 80 (100.0%) | 0 (0.0%) |
| 75 Years and older | 46 (100.0%) | 0 (0.0%) |
| Total | 1,240 (95.4%) | 60 (4.6%) |
Health Insurance Coverage by Citizenship Status in Westlake
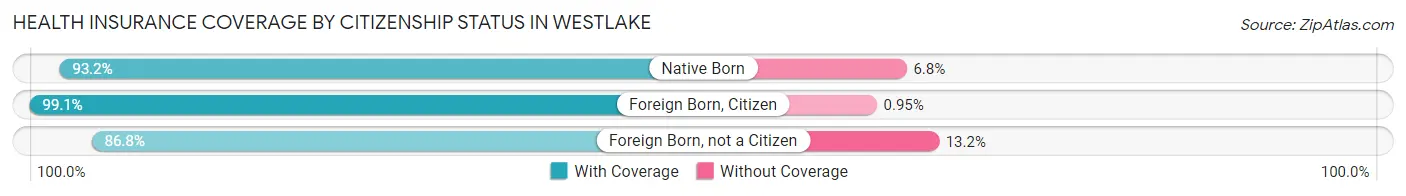
| Citizenship Status | With Coverage | Without Coverage |
| Native Born | 41 (93.2%) | 3 (6.8%) |
| Foreign Born, Citizen | 312 (99.1%) | 3 (0.9%) |
| Foreign Born, not a Citizen | 33 (86.8%) | 5 (13.2%) |
Health Insurance Coverage by Household Income in Westlake
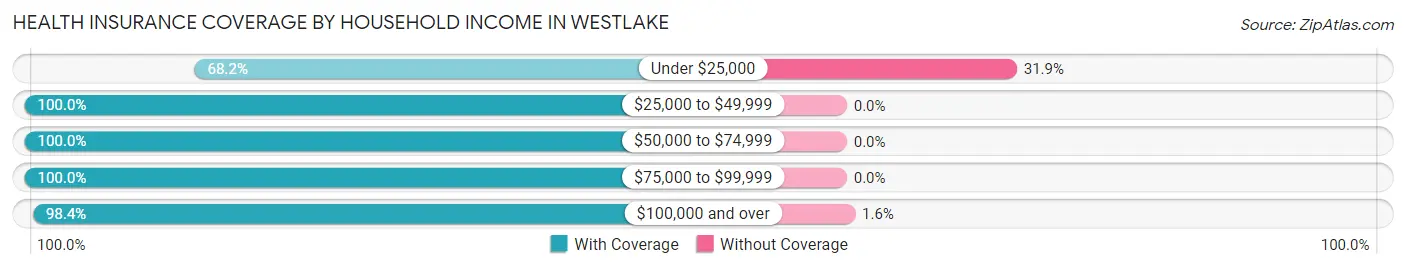
| Household Income | With Coverage | Without Coverage |
| Under $25,000 | 92 (68.1%) | 43 (31.9%) |
| $25,000 to $49,999 | 28 (100.0%) | 0 (0.0%) |
| $50,000 to $74,999 | 34 (100.0%) | 0 (0.0%) |
| $75,000 to $99,999 | 13 (100.0%) | 0 (0.0%) |
| $100,000 and over | 1,073 (98.4%) | 17 (1.6%) |
Public vs Private Health Insurance Coverage by Age in Westlake
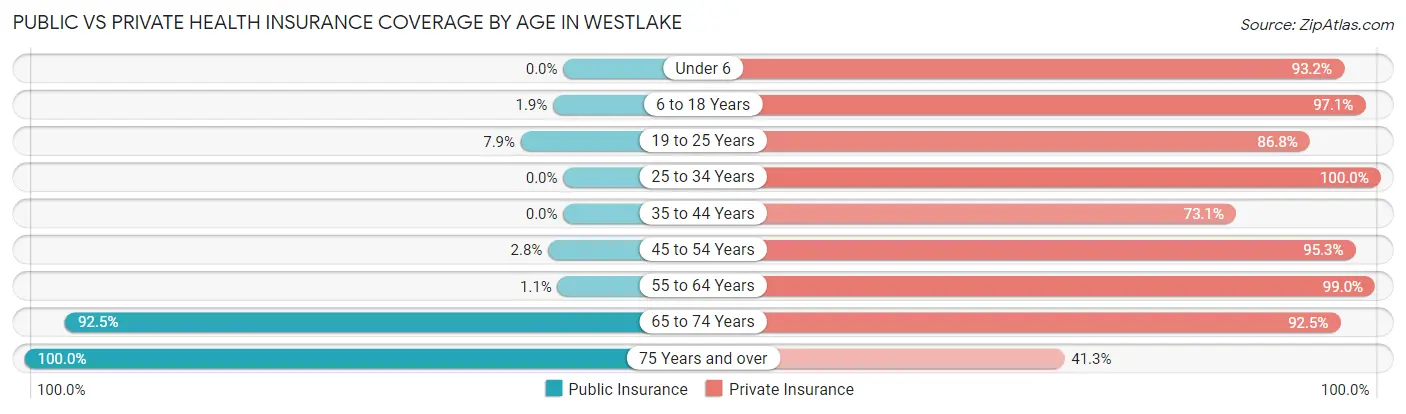
| Age Bracket | Public Insurance | Private Insurance |
| Under 6 | 0 (0.0%) | 41 (93.2%) |
| 6 to 18 Years | 6 (1.9%) | 306 (97.1%) |
| 19 to 25 Years | 3 (7.9%) | 33 (86.8%) |
| 25 to 34 Years | 0 (0.0%) | 10 (100.0%) |
| 35 to 44 Years | 0 (0.0%) | 117 (73.1%) |
| 45 to 54 Years | 9 (2.8%) | 305 (95.3%) |
| 55 to 64 Years | 3 (1.1%) | 284 (99.0%) |
| 65 to 74 Years | 74 (92.5%) | 74 (92.5%) |
| 75 Years and over | 46 (100.0%) | 19 (41.3%) |
| Total | 141 (10.8%) | 1,189 (91.5%) |
Disability Status by Sex by Age in Westlake
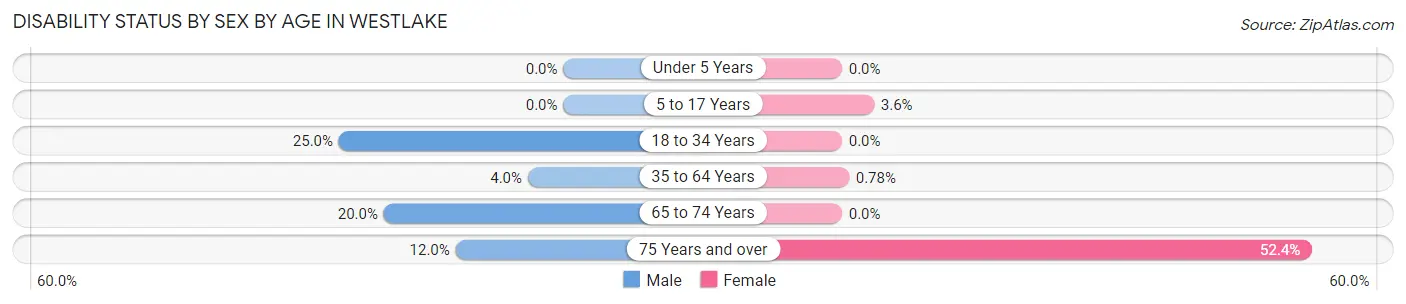
| Age Bracket | Male | Female |
| Under 5 Years | 0 (0.0%) | 0 (0.0%) |
| 5 to 17 Years | 0 (0.0%) | 5 (3.6%) |
| 18 to 34 Years | 10 (25.0%) | 0 (0.0%) |
| 35 to 64 Years | 15 (4.0%) | 3 (0.8%) |
| 65 to 74 Years | 9 (20.0%) | 0 (0.0%) |
| 75 Years and over | 3 (12.0%) | 11 (52.4%) |
Disability Class by Sex by Age in Westlake
Disability Class: Hearing Difficulty
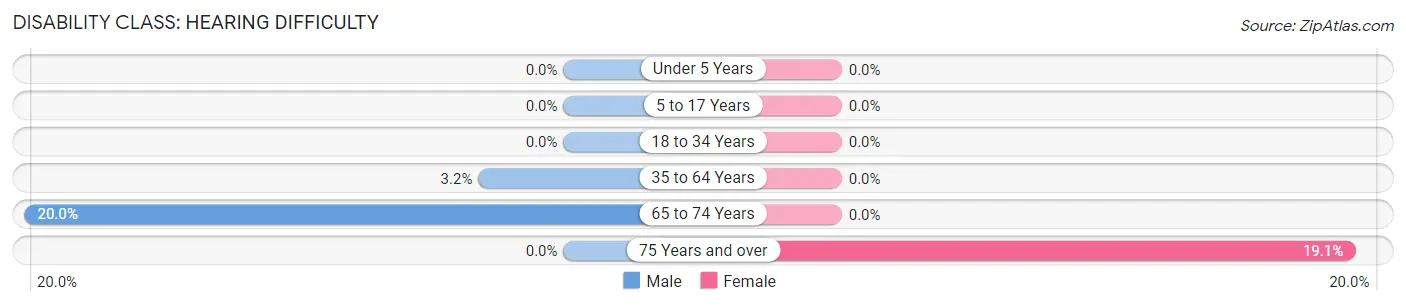
| Age Bracket | Male | Female |
| Under 5 Years | 0 (0.0%) | 0 (0.0%) |
| 5 to 17 Years | 0 (0.0%) | 0 (0.0%) |
| 18 to 34 Years | 0 (0.0%) | 0 (0.0%) |
| 35 to 64 Years | 12 (3.2%) | 0 (0.0%) |
| 65 to 74 Years | 9 (20.0%) | 0 (0.0%) |
| 75 Years and over | 0 (0.0%) | 4 (19.1%) |
Disability Class: Vision Difficulty
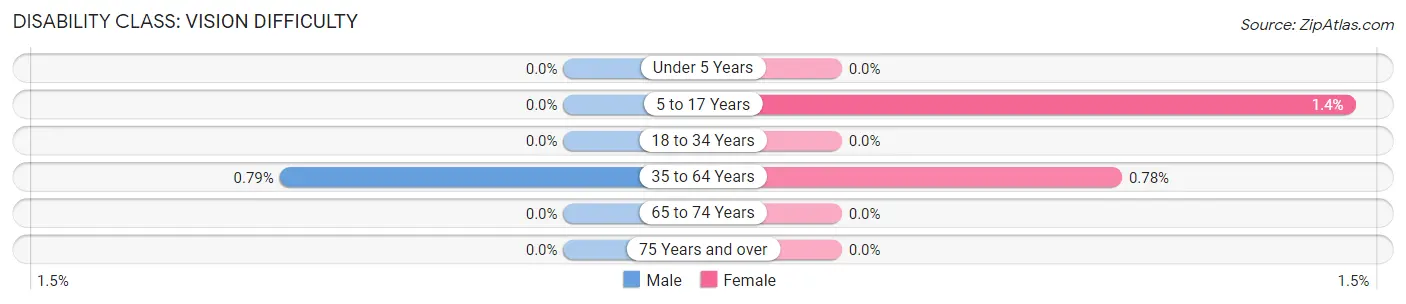
| Age Bracket | Male | Female |
| Under 5 Years | 0 (0.0%) | 0 (0.0%) |
| 5 to 17 Years | 0 (0.0%) | 2 (1.4%) |
| 18 to 34 Years | 0 (0.0%) | 0 (0.0%) |
| 35 to 64 Years | 3 (0.8%) | 3 (0.8%) |
| 65 to 74 Years | 0 (0.0%) | 0 (0.0%) |
| 75 Years and over | 0 (0.0%) | 0 (0.0%) |
Disability Class: Cognitive Difficulty
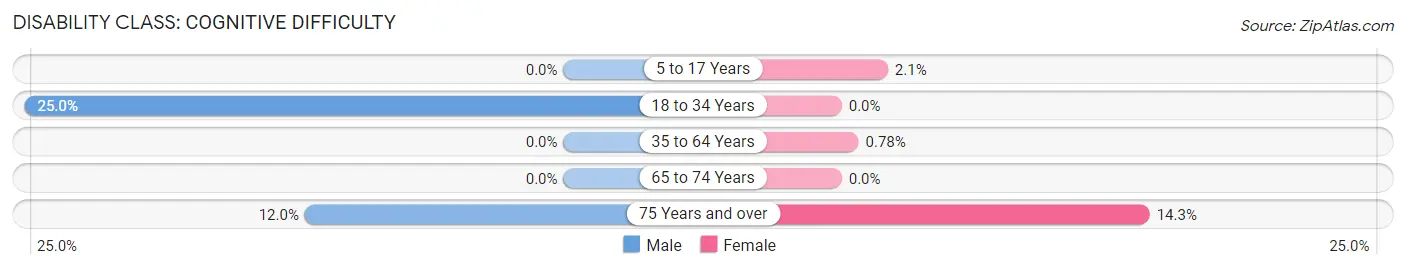
| Age Bracket | Male | Female |
| 5 to 17 Years | 0 (0.0%) | 3 (2.1%) |
| 18 to 34 Years | 10 (25.0%) | 0 (0.0%) |
| 35 to 64 Years | 0 (0.0%) | 3 (0.8%) |
| 65 to 74 Years | 0 (0.0%) | 0 (0.0%) |
| 75 Years and over | 3 (12.0%) | 3 (14.3%) |
Disability Class: Ambulatory Difficulty
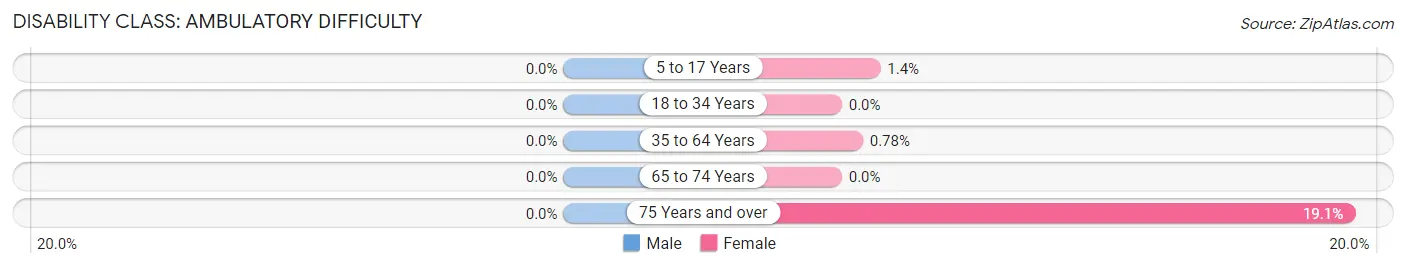
| Age Bracket | Male | Female |
| 5 to 17 Years | 0 (0.0%) | 2 (1.4%) |
| 18 to 34 Years | 0 (0.0%) | 0 (0.0%) |
| 35 to 64 Years | 0 (0.0%) | 3 (0.8%) |
| 65 to 74 Years | 0 (0.0%) | 0 (0.0%) |
| 75 Years and over | 0 (0.0%) | 4 (19.1%) |
Disability Class: Self-Care Difficulty
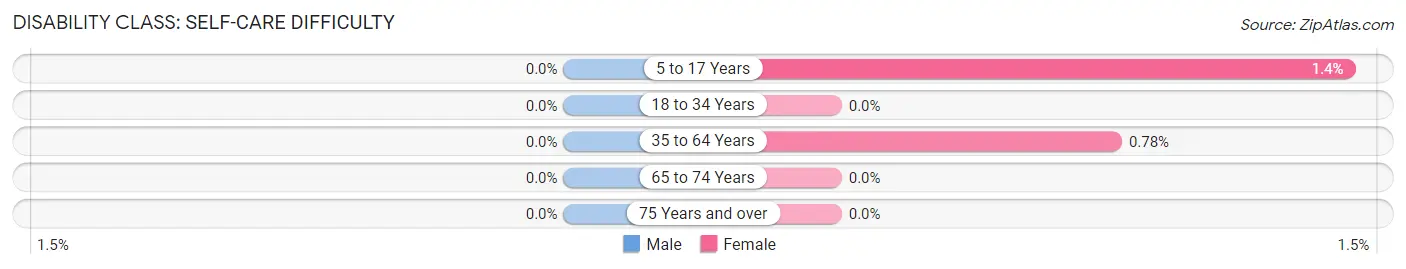
| Age Bracket | Male | Female |
| 5 to 17 Years | 0 (0.0%) | 2 (1.4%) |
| 18 to 34 Years | 0 (0.0%) | 0 (0.0%) |
| 35 to 64 Years | 0 (0.0%) | 3 (0.8%) |
| 65 to 74 Years | 0 (0.0%) | 0 (0.0%) |
| 75 Years and over | 0 (0.0%) | 0 (0.0%) |
Technology Access in Westlake
Computing Device Access in Westlake
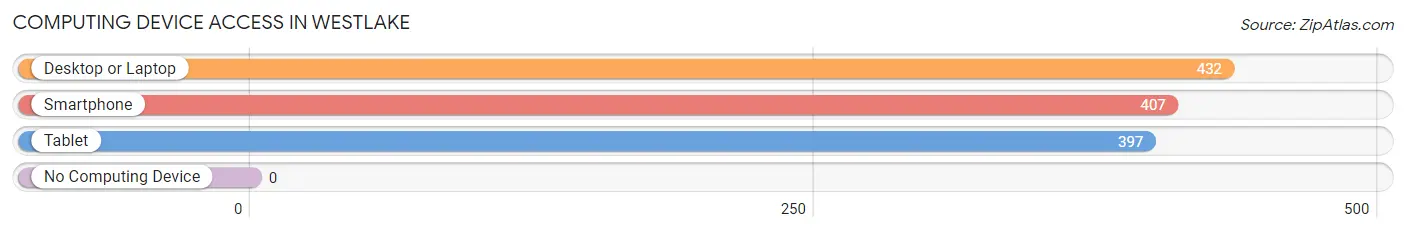
| Device Type | # Households | % Households |
| Desktop or Laptop | 432 | 99.3% |
| Smartphone | 407 | 93.6% |
| Tablet | 397 | 91.3% |
| No Computing Device | 0 | 0.0% |
| Total | 435 | 100.0% |
Internet Access in Westlake
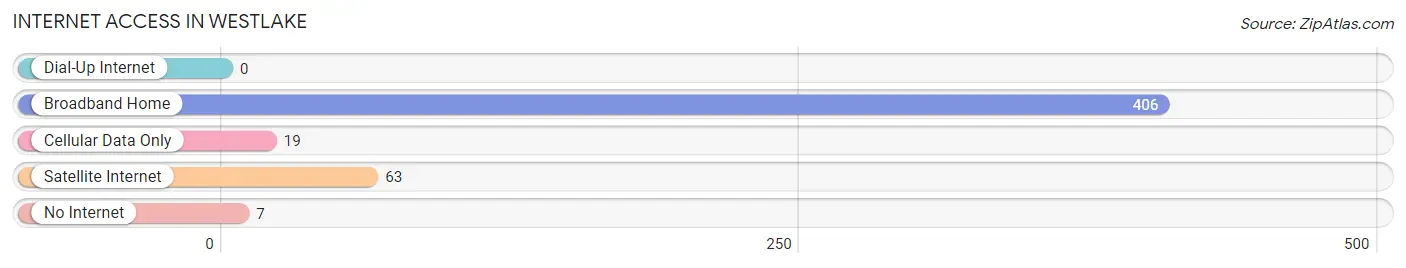
| Internet Type | # Households | % Households |
| Dial-Up Internet | 0 | 0.0% |
| Broadband Home | 406 | 93.3% |
| Cellular Data Only | 19 | 4.4% |
| Satellite Internet | 63 | 14.5% |
| No Internet | 7 | 1.6% |
| Total | 435 | 100.0% |
Westlake Summary
Westlake, Texas is a small town located in the heart of the Dallas-Fort Worth Metroplex. It is situated in Denton and Tarrant counties, and is part of the larger Westlake-Southlake area. The town was founded in the late 1800s and has since grown to become a vibrant and diverse community.
History
Westlake was founded in 1881 by a group of settlers from the nearby town of Grapevine. The settlers were looking for a place to settle and farm, and they chose the area that is now Westlake. The town was originally called Westlake Station, and it was the first stop on the Texas and Pacific Railway. The town was officially incorporated in 1956, and the population has grown steadily since then.
Geography
Westlake is located in the heart of the Dallas-Fort Worth Metroplex. It is situated in Denton and Tarrant counties, and is part of the larger Westlake-Southlake area. The town is bordered by the cities of Southlake, Grapevine, and Keller. The town is located on the western edge of the Dallas-Fort Worth Metroplex, and is just a short drive from downtown Dallas.
The town is situated on rolling hills and is surrounded by lush green fields and wooded areas. The town is home to several parks, including Westlake Park, which features a playground, picnic areas, and a walking trail. The town is also home to several golf courses, including the Westlake Golf Course and the Westlake Country Club.
Economy
Westlake is home to a thriving economy. The town is home to several large corporations, including the headquarters of the American Airlines Group, the world’s largest airline. The town is also home to several other large companies, including the headquarters of the Dr Pepper Snapple Group, the world’s largest beverage company.
The town is also home to several small businesses, including restaurants, retail stores, and professional services. The town is also home to several educational institutions, including the University of Texas at Dallas and the University of North Texas.
Demographics
As of the 2010 census, the population of Westlake was 8,845. The population is predominantly white, with a small percentage of African Americans, Hispanics, and Asians. The median household income is $117,000, and the median home value is $400,000.
Westlake is a vibrant and diverse community. The town is home to a variety of cultures and lifestyles, and is a great place to live, work, and play. The town is home to several parks, golf courses, and other recreational activities, and is a great place to raise a family.
Common Questions
What is Per Capita Income in Westlake?
Per Capita income in Westlake is $184,242.
What is the Median Family Income in Westlake?
Median Family Income in Westlake is $250,001.
What is the Median Household income in Westlake?
Median Household Income in Westlake is $250,001.
What is Inequality or Gini Index in Westlake?
Inequality or Gini Index in Westlake is 0.54.
What is the Total Population of Westlake?
Total Population of Westlake is 1,300.
What is the Total Male Population of Westlake?
Total Male Population of Westlake is 673.
What is the Total Female Population of Westlake?
Total Female Population of Westlake is 627.
What is the Ratio of Males per 100 Females in Westlake?
There are 107.34 Males per 100 Females in Westlake.
What is the Ratio of Females per 100 Males in Westlake?
There are 93.16 Females per 100 Males in Westlake.
What is the Median Population Age in Westlake?
Median Population Age in Westlake is 47.2 Years.
What is the Average Family Size in Westlake
Average Family Size in Westlake is 3.1 People.
What is the Average Household Size in Westlake
Average Household Size in Westlake is 3.0 People.
How Large is the Labor Force in Westlake?
There are 509 People in the Labor Forcein in Westlake.
What is the Percentage of People in the Labor Force in Westlake?
50.4% of People are in the Labor Force in Westlake.
What is the Unemployment Rate in Westlake?
Unemployment Rate in Westlake is 2.4%.