Altona, CO Map & Demographics
Altona Map
Altona Overview
$163,096
PER CAPITA INCOME
$250,001
AVG FAMILY INCOME
$250,001
AVG HOUSEHOLD INCOME
0.47
INEQUALITY / GINI INDEX
531
TOTAL POPULATION
272
MALE POPULATION
259
FEMALE POPULATION
105.02
MALES / 100 FEMALES
95.22
FEMALES / 100 MALES
60.8
MEDIAN AGE
2.6
AVG FAMILY SIZE
2.2
AVG HOUSEHOLD SIZE
322
LABOR FORCE [ PEOPLE ]
70.9%
PERCENT IN LABOR FORCE
Income in Altona
Income Overview in Altona
Per Capita Income in Altona is $163,096, while median incomes of families and households are $250,001 and $250,001 respectively.
| Characteristic | Number | Measure |
| Per Capita Income | 531 | $163,096 |
| Median Family Income | 158 | $250,001 |
| Mean Family Income | 158 | $476,037 |
| Median Household Income | 244 | $250,001 |
| Mean Household Income | 244 | $373,432 |
| Income Deficit | 158 | $0 |
| Wage / Income Gap (%) | 531 | 0.00% |
| Wage / Income Gap ($) | 531 | 100.00¢ per $1 |
| Gini / Inequality Index | 531 | 0.47 |
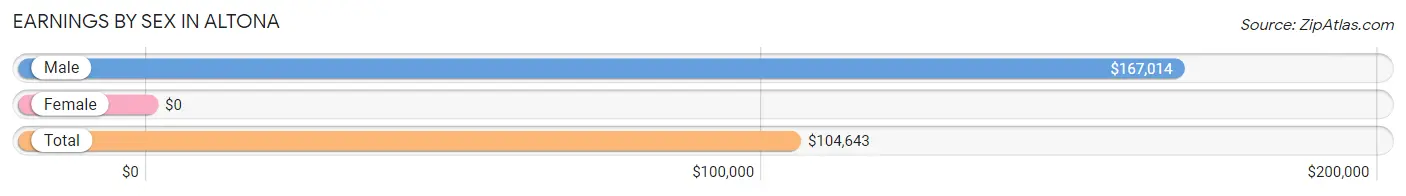
Earnings by Sex in Altona
| Sex | Number | Average Earnings |
| Male | 189 (54.3%) | $167,014 |
| Female | 159 (45.7%) | $0 |
| Total | 348 (100.0%) | $104,643 |
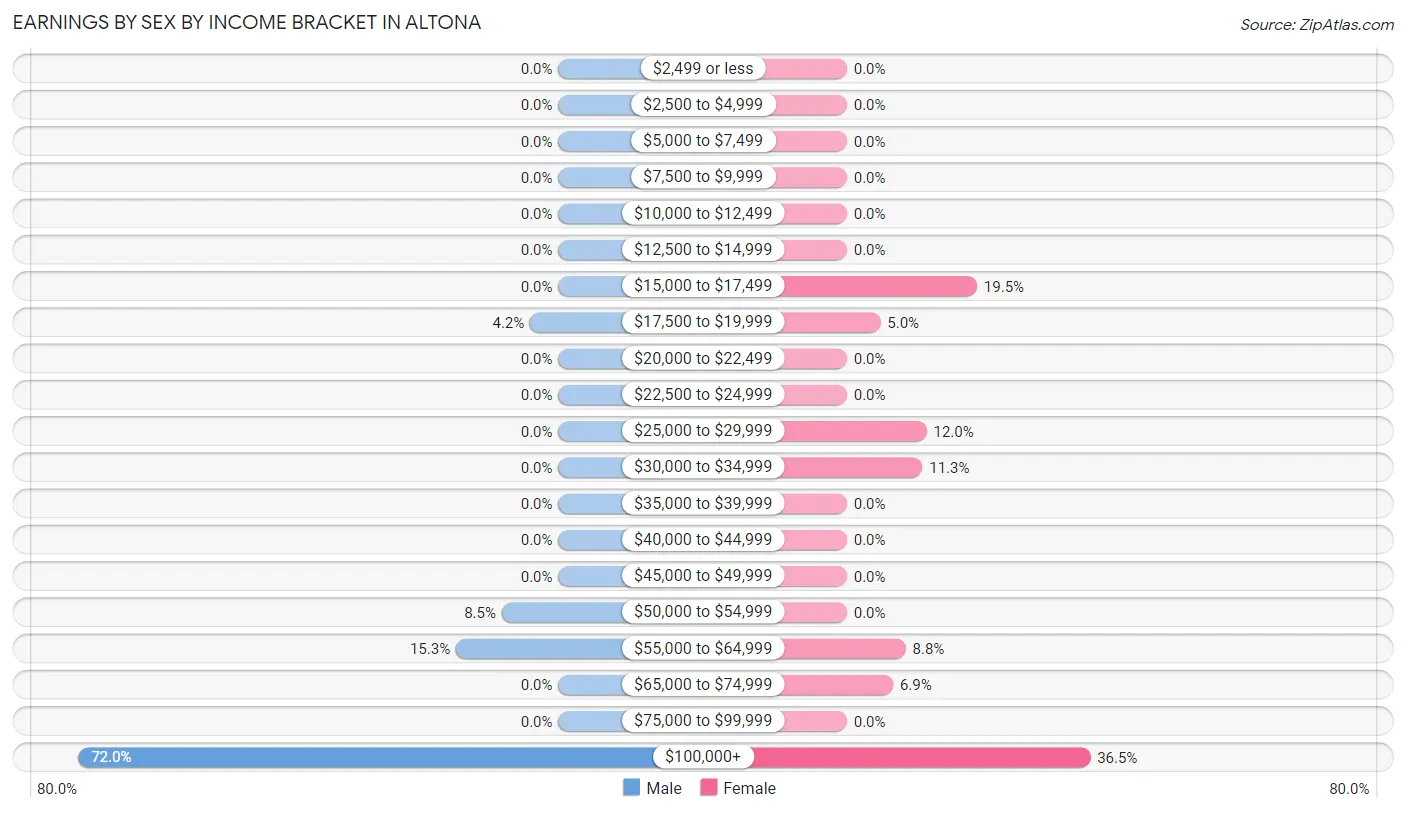
Earnings by Sex by Income Bracket in Altona
The most common earnings brackets in Altona are $100,000+ for men (136 | 72.0%) and $100,000+ for women (58 | 36.5%).
| Income | Male | Female |
| $2,499 or less | 0 (0.0%) | 0 (0.0%) |
| $2,500 to $4,999 | 0 (0.0%) | 0 (0.0%) |
| $5,000 to $7,499 | 0 (0.0%) | 0 (0.0%) |
| $7,500 to $9,999 | 0 (0.0%) | 0 (0.0%) |
| $10,000 to $12,499 | 0 (0.0%) | 0 (0.0%) |
| $12,500 to $14,999 | 0 (0.0%) | 0 (0.0%) |
| $15,000 to $17,499 | 0 (0.0%) | 31 (19.5%) |
| $17,500 to $19,999 | 8 (4.2%) | 8 (5.0%) |
| $20,000 to $22,499 | 0 (0.0%) | 0 (0.0%) |
| $22,500 to $24,999 | 0 (0.0%) | 0 (0.0%) |
| $25,000 to $29,999 | 0 (0.0%) | 19 (11.9%) |
| $30,000 to $34,999 | 0 (0.0%) | 18 (11.3%) |
| $35,000 to $39,999 | 0 (0.0%) | 0 (0.0%) |
| $40,000 to $44,999 | 0 (0.0%) | 0 (0.0%) |
| $45,000 to $49,999 | 0 (0.0%) | 0 (0.0%) |
| $50,000 to $54,999 | 16 (8.5%) | 0 (0.0%) |
| $55,000 to $64,999 | 29 (15.3%) | 14 (8.8%) |
| $65,000 to $74,999 | 0 (0.0%) | 11 (6.9%) |
| $75,000 to $99,999 | 0 (0.0%) | 0 (0.0%) |
| $100,000+ | 136 (72.0%) | 58 (36.5%) |
| Total | 189 (100.0%) | 159 (100.0%) |
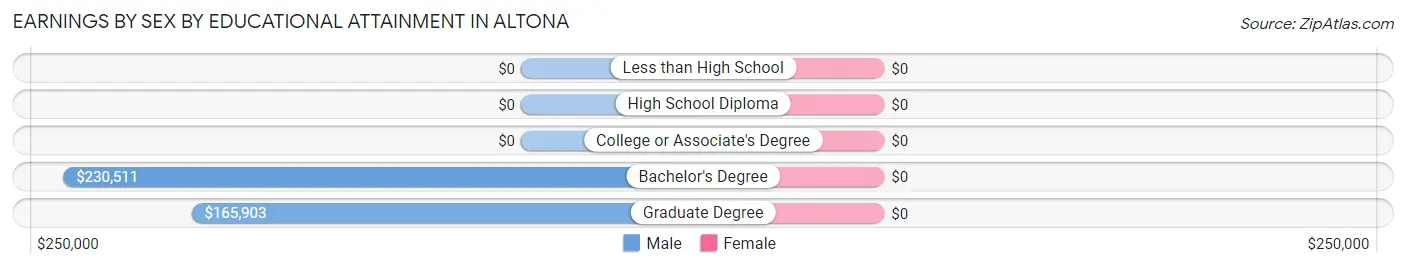
Earnings by Sex by Educational Attainment in Altona
| Educational Attainment | Male Income | Female Income |
| Less than High School | - | - |
| High School Diploma | - | - |
| College or Associate's Degree | - | - |
| Bachelor's Degree | $230,511 | $0 |
| Graduate Degree | $165,903 | $0 |
| Total | $167,014 | $0 |
Family Income in Altona
Family Income Brackets in Altona
According to the Altona family income data, there are 115 families falling into the $200,000+ income range, which is the most common income bracket and makes up 72.8% of all families.
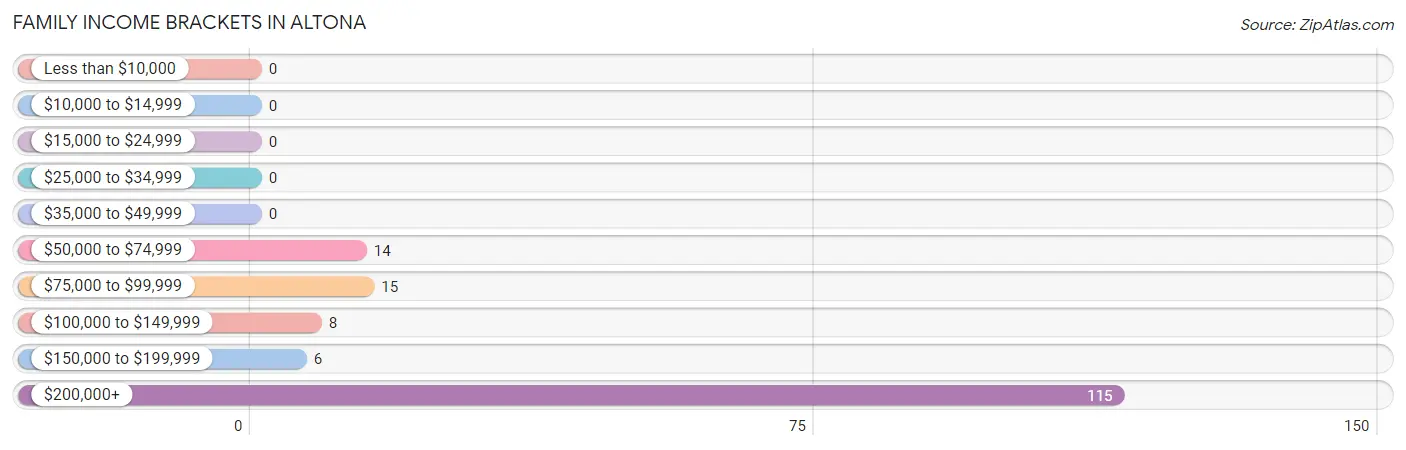
| Income Bracket | # Families | % Families |
| Less than $10,000 | 0 | 0.0% |
| $10,000 to $14,999 | 0 | 0.0% |
| $15,000 to $24,999 | 0 | 0.0% |
| $25,000 to $34,999 | 0 | 0.0% |
| $35,000 to $49,999 | 0 | 0.0% |
| $50,000 to $74,999 | 14 | 8.9% |
| $75,000 to $99,999 | 15 | 9.5% |
| $100,000 to $149,999 | 8 | 5.1% |
| $150,000 to $199,999 | 6 | 3.8% |
| $200,000+ | 115 | 72.8% |
Family Income by Famaliy Size in Altona
2-person families (117 | 74.1%) account for the highest median family income in Altona with $250,001 per family, while 2-person families (117 | 74.1%) have the highest median income of $125,000 per family member.
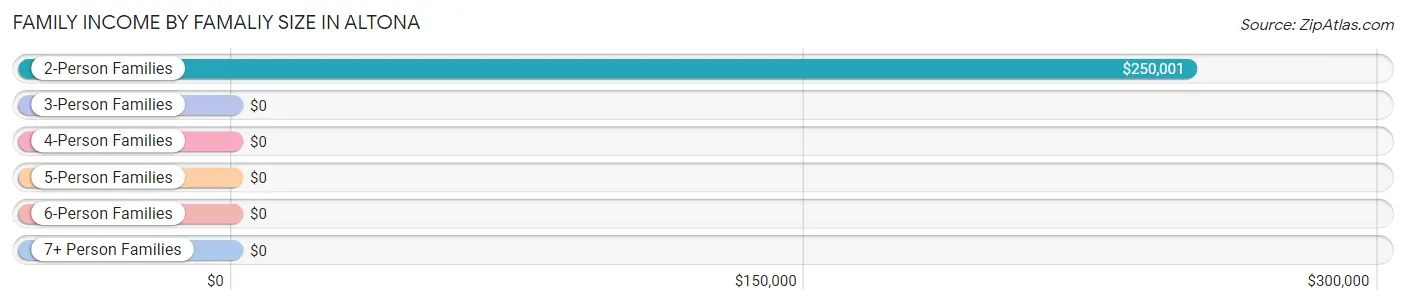
| Income Bracket | # Families | Median Income |
| 2-Person Families | 117 (74.1%) | $250,001 |
| 3-Person Families | 0 (0.0%) | $0 |
| 4-Person Families | 22 (13.9%) | $0 |
| 5-Person Families | 19 (12.0%) | $0 |
| 6-Person Families | 0 (0.0%) | $0 |
| 7+ Person Families | 0 (0.0%) | $0 |
| Total | 158 (100.0%) | $250,001 |
Family Income by Number of Earners in Altona
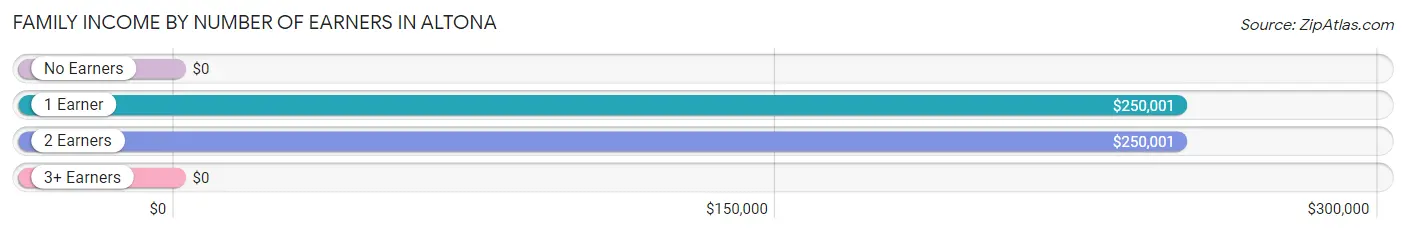
| Number of Earners | # Families | Median Income |
| No Earners | 7 (4.4%) | $0 |
| 1 Earner | 59 (37.3%) | $250,001 |
| 2 Earners | 92 (58.2%) | $250,001 |
| 3+ Earners | 0 (0.0%) | $0 |
| Total | 158 (100.0%) | $250,001 |
Household Income in Altona
Household Income Brackets in Altona
With 143 households falling in the category, the $200,000+ income range is the most frequent in Altona, accounting for 58.6% of all households.
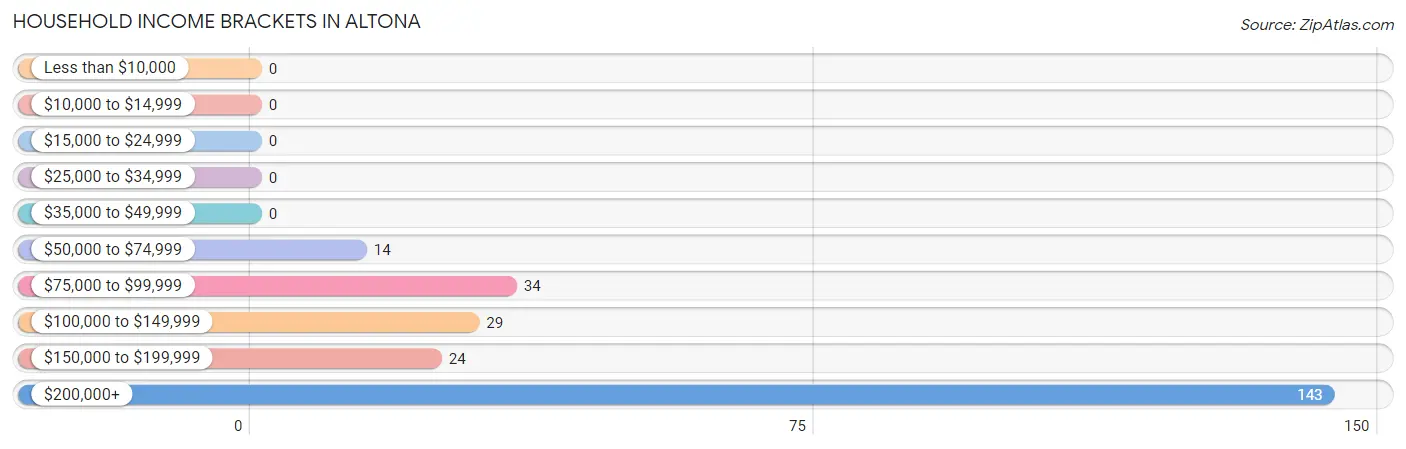
| Income Bracket | # Households | % Households |
| Less than $10,000 | 0 | 0.0% |
| $10,000 to $14,999 | 0 | 0.0% |
| $15,000 to $24,999 | 0 | 0.0% |
| $25,000 to $34,999 | 0 | 0.0% |
| $35,000 to $49,999 | 0 | 0.0% |
| $50,000 to $74,999 | 14 | 5.7% |
| $75,000 to $99,999 | 34 | 13.9% |
| $100,000 to $149,999 | 29 | 11.9% |
| $150,000 to $199,999 | 24 | 9.8% |
| $200,000+ | 143 | 58.6% |
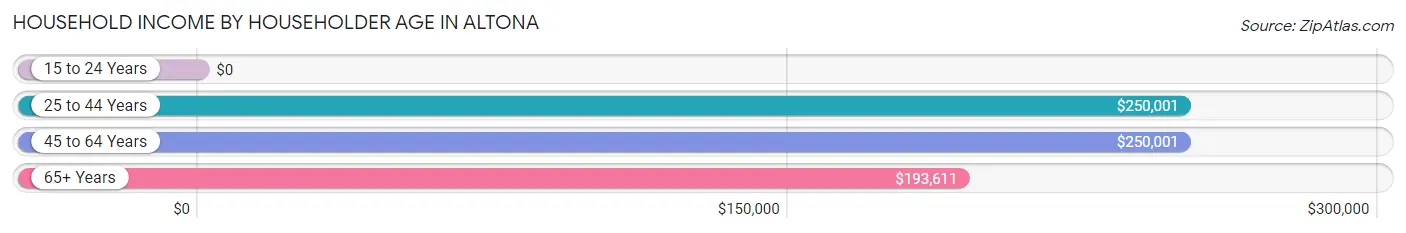
Household Income by Householder Age in Altona
The median household income in Altona is $250,001, with the highest median household income of $250,001 found in the 25 to 44 years age bracket for the primary householder. A total of 35 households (14.3%) fall into this category.
| Income Bracket | # Households | Median Income |
| 15 to 24 Years | 0 (0.0%) | $0 |
| 25 to 44 Years | 35 (14.3%) | $250,001 |
| 45 to 64 Years | 93 (38.1%) | $250,001 |
| 65+ Years | 116 (47.5%) | $193,611 |
| Total | 244 (100.0%) | $250,001 |
Poverty in Altona
Income Below Poverty by Sex and Age in Altona
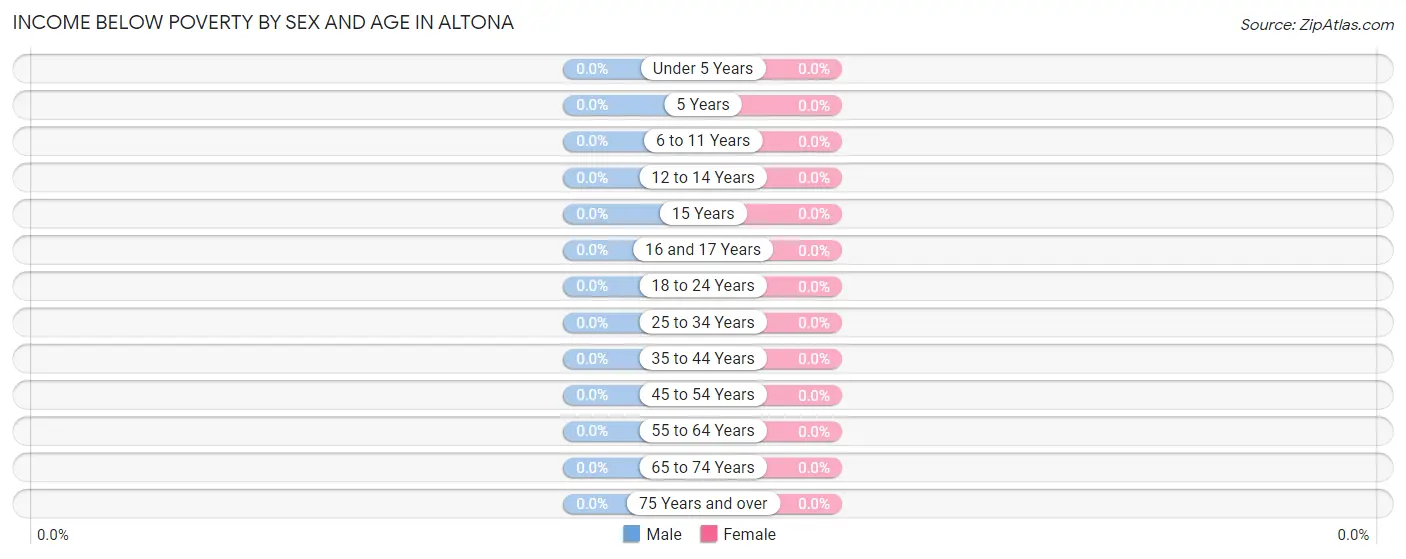
| Age Bracket | Male | Female |
| Under 5 Years | 0 (0.0%) | 0 (0.0%) |
| 5 Years | 0 (0.0%) | 0 (0.0%) |
| 6 to 11 Years | 0 (0.0%) | 0 (0.0%) |
| 12 to 14 Years | 0 (0.0%) | 0 (0.0%) |
| 15 Years | 0 (0.0%) | 0 (0.0%) |
| 16 and 17 Years | 0 (0.0%) | 0 (0.0%) |
| 18 to 24 Years | 0 (0.0%) | 0 (0.0%) |
| 25 to 34 Years | 0 (0.0%) | 0 (0.0%) |
| 35 to 44 Years | 0 (0.0%) | 0 (0.0%) |
| 45 to 54 Years | 0 (0.0%) | 0 (0.0%) |
| 55 to 64 Years | 0 (0.0%) | 0 (0.0%) |
| 65 to 74 Years | 0 (0.0%) | 0 (0.0%) |
| 75 Years and over | 0 (0.0%) | 0 (0.0%) |
| Total | 0 (0.0%) | 0 (0.0%) |
Income Above Poverty by Sex and Age in Altona
According to the poverty statistics in Altona, males aged 6 to 11 years and females aged 12 to 14 years are the age groups that are most secure financially, with 100.0% of males and 100.0% of females in these age groups living above the poverty line.
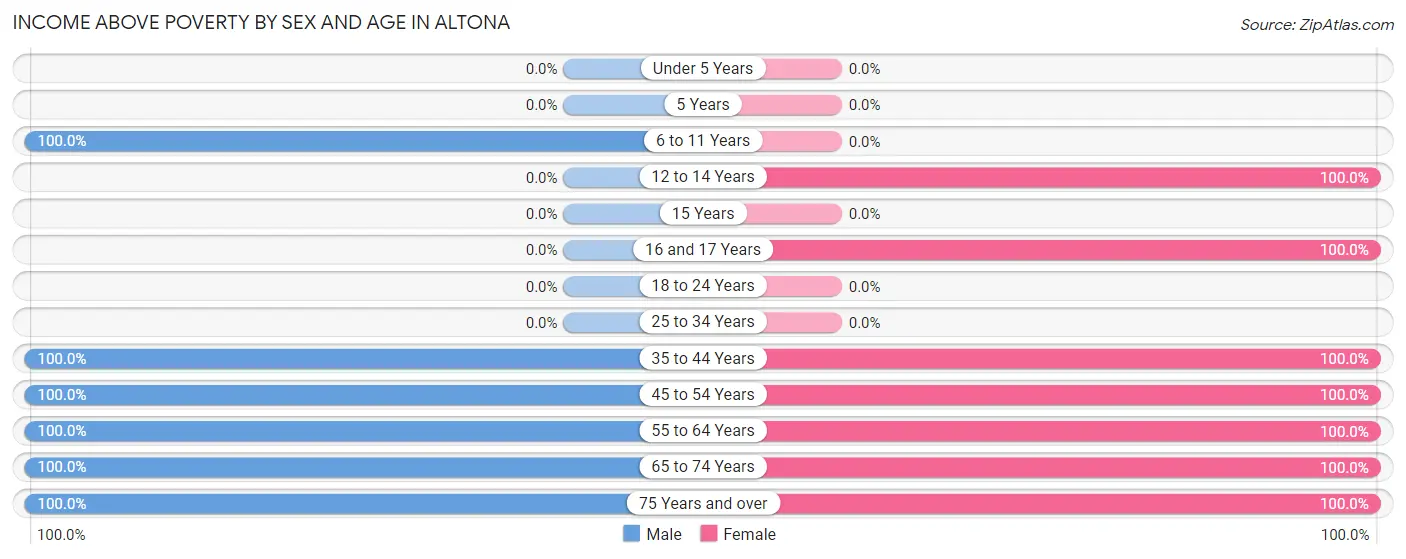
| Age Bracket | Male | Female |
| Under 5 Years | 0 (0.0%) | 0 (0.0%) |
| 5 Years | 0 (0.0%) | 0 (0.0%) |
| 6 to 11 Years | 40 (100.0%) | 0 (0.0%) |
| 12 to 14 Years | 0 (0.0%) | 37 (100.0%) |
| 15 Years | 0 (0.0%) | 0 (0.0%) |
| 16 and 17 Years | 0 (0.0%) | 22 (100.0%) |
| 18 to 24 Years | 0 (0.0%) | 0 (0.0%) |
| 25 to 34 Years | 0 (0.0%) | 0 (0.0%) |
| 35 to 44 Years | 37 (100.0%) | 37 (100.0%) |
| 45 to 54 Years | 34 (100.0%) | 19 (100.0%) |
| 55 to 64 Years | 61 (100.0%) | 43 (100.0%) |
| 65 to 74 Years | 58 (100.0%) | 94 (100.0%) |
| 75 Years and over | 42 (100.0%) | 7 (100.0%) |
| Total | 272 (100.0%) | 259 (100.0%) |
Income Below Poverty Among Married-Couple Families in Altona
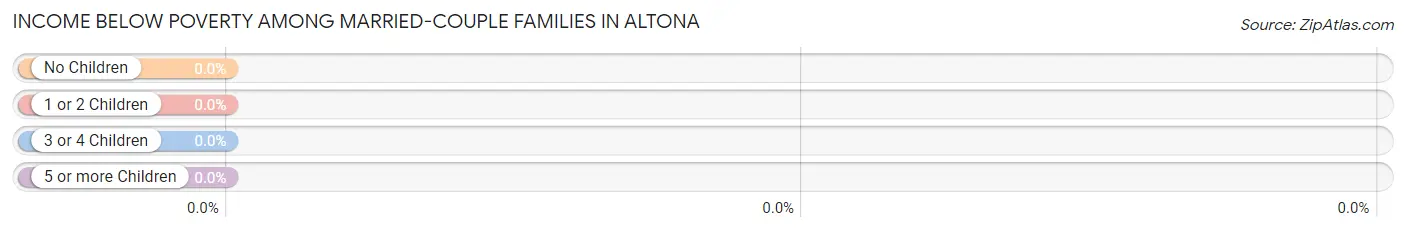
| Children | Above Poverty | Below Poverty |
| No Children | 103 (100.0%) | 0 (0.0%) |
| 1 or 2 Children | 22 (100.0%) | 0 (0.0%) |
| 3 or 4 Children | 19 (100.0%) | 0 (0.0%) |
| 5 or more Children | 0 (0.0%) | 0 (0.0%) |
| Total | 144 (100.0%) | 0 (0.0%) |
Income Below Poverty Among Single-Parent Households in Altona
| Children | Single Father | Single Mother |
| No Children | 0 (0.0%) | 0 (0.0%) |
| 1 or 2 Children | 0 (0.0%) | 0 (0.0%) |
| 3 or 4 Children | 0 (0.0%) | 0 (0.0%) |
| 5 or more Children | 0 (0.0%) | 0 (0.0%) |
| Total | 0 (0.0%) | 0 (0.0%) |
Income Below Poverty Among Married-Couple vs Single-Parent Households in Altona
| Children | Married-Couple Families | Single-Parent Households |
| No Children | 0 (0.0%) | 0 (0.0%) |
| 1 or 2 Children | 0 (0.0%) | 0 (0.0%) |
| 3 or 4 Children | 0 (0.0%) | 0 (0.0%) |
| 5 or more Children | 0 (0.0%) | 0 (0.0%) |
| Total | 0 (0.0%) | 0 (0.0%) |
Race in Altona
The most populous races in Altona are White / Caucasian (522 | 98.3%), Hispanic or Latino (28 | 5.3%), and Two or more Races (9 | 1.7%).
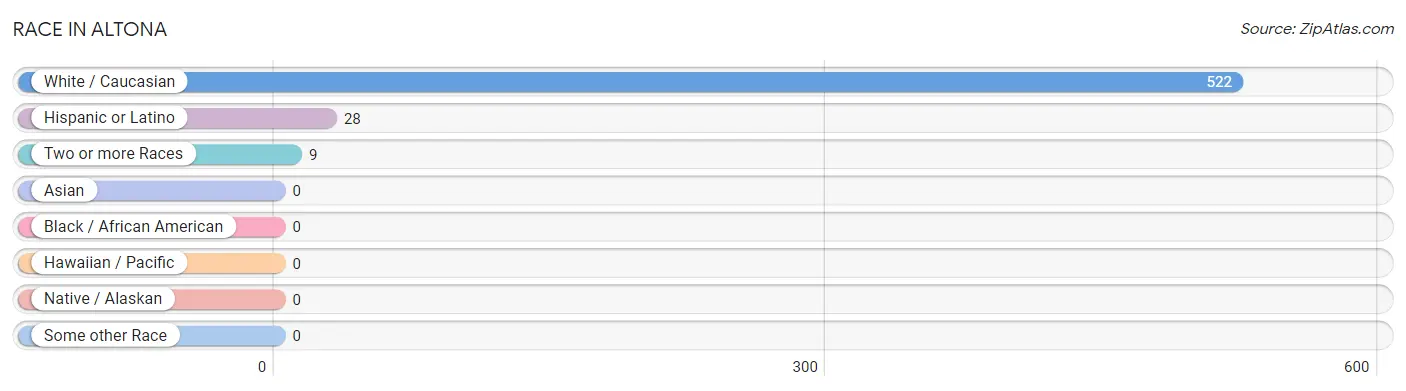
| Race | # Population | % Population |
| Asian | 0 | 0.0% |
| Black / African American | 0 | 0.0% |
| Hawaiian / Pacific | 0 | 0.0% |
| Hispanic or Latino | 28 | 5.3% |
| Native / Alaskan | 0 | 0.0% |
| White / Caucasian | 522 | 98.3% |
| Two or more Races | 9 | 1.7% |
| Some other Race | 0 | 0.0% |
| Total | 531 | 100.0% |
Ancestry in Altona
The most populous ancestries reported in Altona are German (97 | 18.3%), Arab (83 | 15.6%), Lebanese (83 | 15.6%), Italian (75 | 14.1%), and English (61 | 11.5%), together accounting for 75.1% of all Altona residents.
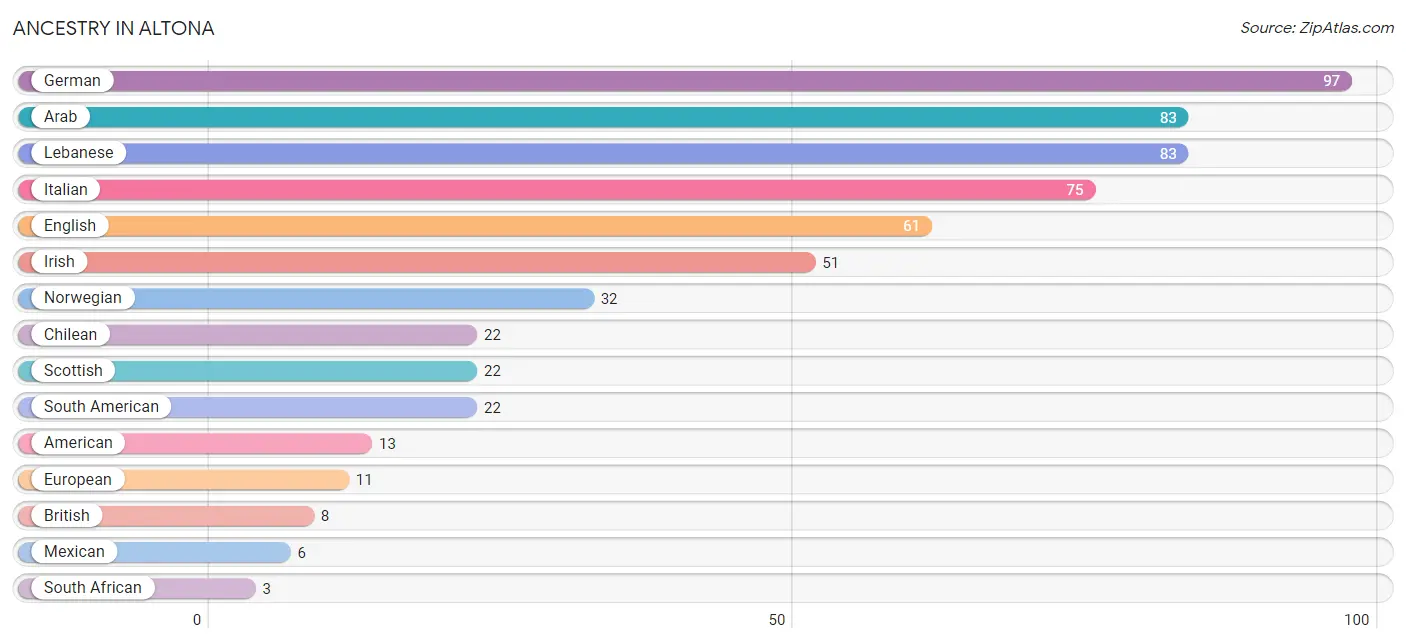
| Ancestry | # Population | % Population |
| American | 13 | 2.5% |
| Arab | 83 | 15.6% |
| British | 8 | 1.5% |
| Chilean | 22 | 4.1% |
| English | 61 | 11.5% |
| European | 11 | 2.1% |
| German | 97 | 18.3% |
| Irish | 51 | 9.6% |
| Italian | 75 | 14.1% |
| Lebanese | 83 | 15.6% |
| Mexican | 6 | 1.1% |
| Norwegian | 32 | 6.0% |
| Scottish | 22 | 4.1% |
| South African | 3 | 0.6% |
| South American | 22 | 4.1% |
| Subsaharan African | 3 | 0.6% | View All 16 Rows |
Immigrants in Altona
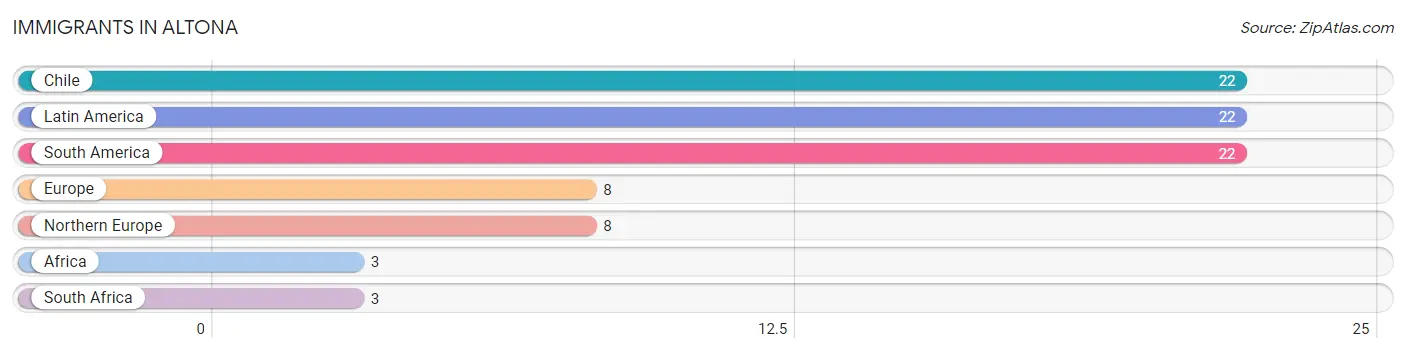
The most numerous immigrant groups reported in Altona came from Chile (22 | 4.1%), Latin America (22 | 4.1%), South America (22 | 4.1%), Europe (8 | 1.5%), and Northern Europe (8 | 1.5%), together accounting for 15.4% of all Altona residents.
| Immigration Origin | # Population | % Population |
| Africa | 3 | 0.6% |
| Chile | 22 | 4.1% |
| Europe | 8 | 1.5% |
| Latin America | 22 | 4.1% |
| Northern Europe | 8 | 1.5% |
| South Africa | 3 | 0.6% |
| South America | 22 | 4.1% | View All 7 Rows |
Sex and Age in Altona
Sex and Age in Altona
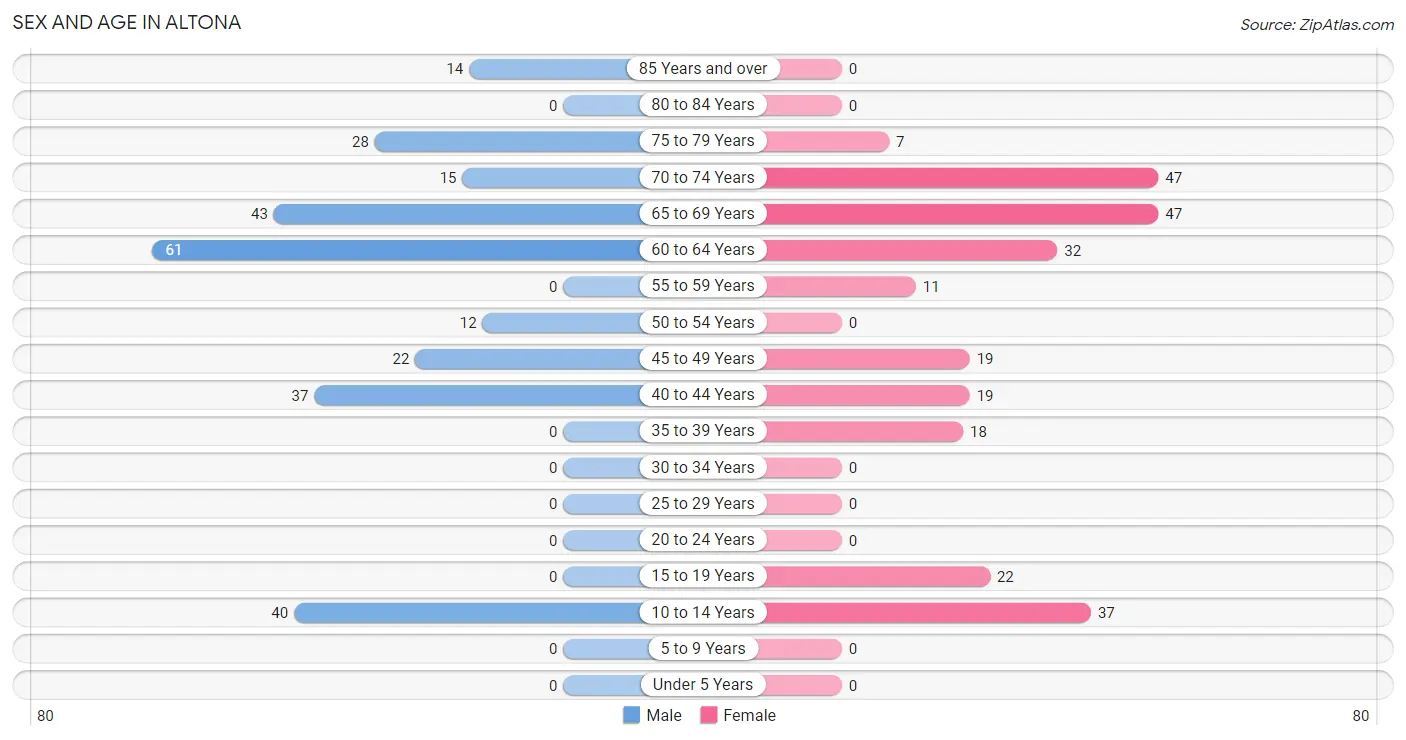
The most populous age groups in Altona are 60 to 64 Years (61 | 22.4%) for men and 65 to 69 Years (47 | 18.1%) for women.
| Age Bracket | Male | Female |
| Under 5 Years | 0 (0.0%) | 0 (0.0%) |
| 5 to 9 Years | 0 (0.0%) | 0 (0.0%) |
| 10 to 14 Years | 40 (14.7%) | 37 (14.3%) |
| 15 to 19 Years | 0 (0.0%) | 22 (8.5%) |
| 20 to 24 Years | 0 (0.0%) | 0 (0.0%) |
| 25 to 29 Years | 0 (0.0%) | 0 (0.0%) |
| 30 to 34 Years | 0 (0.0%) | 0 (0.0%) |
| 35 to 39 Years | 0 (0.0%) | 18 (7.0%) |
| 40 to 44 Years | 37 (13.6%) | 19 (7.3%) |
| 45 to 49 Years | 22 (8.1%) | 19 (7.3%) |
| 50 to 54 Years | 12 (4.4%) | 0 (0.0%) |
| 55 to 59 Years | 0 (0.0%) | 11 (4.3%) |
| 60 to 64 Years | 61 (22.4%) | 32 (12.4%) |
| 65 to 69 Years | 43 (15.8%) | 47 (18.1%) |
| 70 to 74 Years | 15 (5.5%) | 47 (18.1%) |
| 75 to 79 Years | 28 (10.3%) | 7 (2.7%) |
| 80 to 84 Years | 0 (0.0%) | 0 (0.0%) |
| 85 Years and over | 14 (5.1%) | 0 (0.0%) |
| Total | 272 (100.0%) | 259 (100.0%) |
Families and Households in Altona
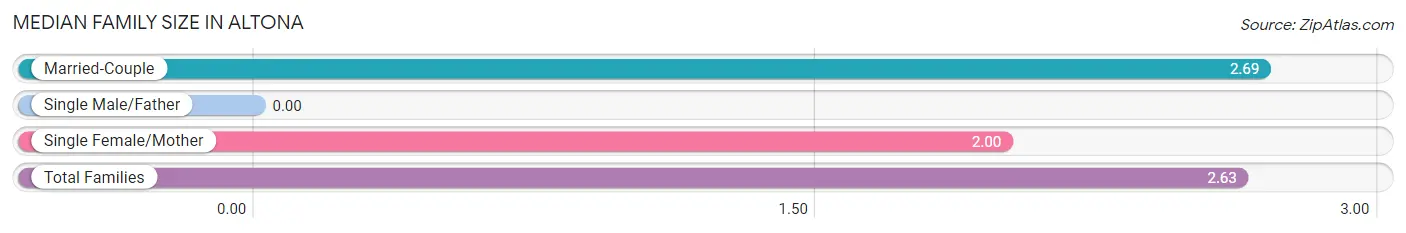
Median Family Size in Altona
| Family Type | # Families | Family Size |
| Married-Couple | 144 (91.1%) | 2.69 |
| Single Male/Father | 0 (0.0%) | - |
| Single Female/Mother | 14 (8.9%) | 2.00 |
| Total Families | 158 (100.0%) | 2.63 |
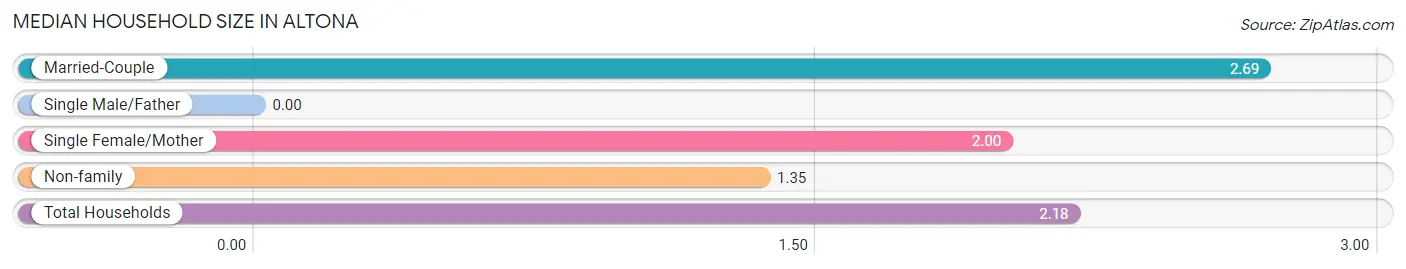
Median Household Size in Altona
| Household Type | # Households | Household Size |
| Married-Couple | 144 (59.0%) | 2.69 |
| Single Male/Father | 0 (0.0%) | - |
| Single Female/Mother | 14 (5.7%) | 2.00 |
| Non-family | 86 (35.2%) | 1.35 |
| Total Households | 244 (100.0%) | 2.18 |
Household Size by Marriage Status in Altona
Out of a total of 244 households in Altona, 158 (64.7%) are family households, while 86 (35.2%) are nonfamily households. The most numerous type of family households are 2-person households, comprising 117, and the most common type of nonfamily households are 1-person households, comprising 50.
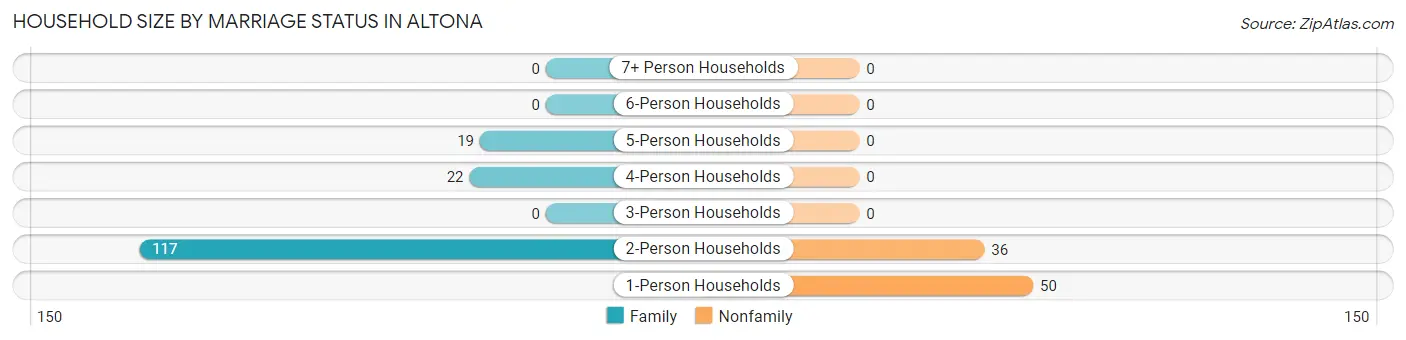
| Household Size | Family Households | Nonfamily Households |
| 1-Person Households | - | 50 (20.5%) |
| 2-Person Households | 117 (47.9%) | 36 (14.7%) |
| 3-Person Households | 0 (0.0%) | 0 (0.0%) |
| 4-Person Households | 22 (9.0%) | 0 (0.0%) |
| 5-Person Households | 19 (7.8%) | 0 (0.0%) |
| 6-Person Households | 0 (0.0%) | 0 (0.0%) |
| 7+ Person Households | 0 (0.0%) | 0 (0.0%) |
| Total | 158 (64.7%) | 86 (35.2%) |
Female Fertility in Altona
Fertility by Age in Altona
| Age Bracket | Women with Births | Births / 1,000 Women |
| 15 to 19 years | 0 (0.0%) | 0.0 |
| 20 to 34 years | 0 (0.0%) | 0.0 |
| 35 to 50 years | 0 (0.0%) | 0.0 |
| Total | 0 (0.0%) | 0.0 |
Fertility by Age by Marriage Status in Altona
| Age Bracket | Married | Unmarried |
| 15 to 19 years | 0 (0.0%) | 0 (0.0%) |
| 20 to 34 years | 0 (0.0%) | 0 (0.0%) |
| 35 to 50 years | 0 (0.0%) | 0 (0.0%) |
| Total | 0 (0.0%) | 0 (0.0%) |
Fertility by Education in Altona
| Educational Attainment | Women with Births | Births / 1,000 Women |
| Less than High School | 0 (0.0%) | 0.0 |
| High School Diploma | 0 (0.0%) | 0.0 |
| College or Associate's Degree | 0 (0.0%) | 0.0 |
| Bachelor's Degree | 0 (0.0%) | 0.0 |
| Graduate Degree | 0 (0.0%) | 0.0 |
| Total | 0 (0.0%) | 0.0 |
Fertility by Education by Marriage Status in Altona
| Educational Attainment | Married | Unmarried |
| Less than High School | 0 (0.0%) | 0 (0.0%) |
| High School Diploma | 0 (0.0%) | 0 (0.0%) |
| College or Associate's Degree | 0 (0.0%) | 0 (0.0%) |
| Bachelor's Degree | 0 (0.0%) | 0 (0.0%) |
| Graduate Degree | 0 (0.0%) | 0 (0.0%) |
| Total | 0 (0.0%) | 0 (0.0%) |
Employment Characteristics in Altona
Employment by Class of Employer in Altona
Among the 322 employed individuals in Altona, private company employees (154 | 47.8%), self-employed (incorporated) (110 | 34.2%), and self-employed (not incorporated) (58 | 18.0%) make up the most common classes of employment.
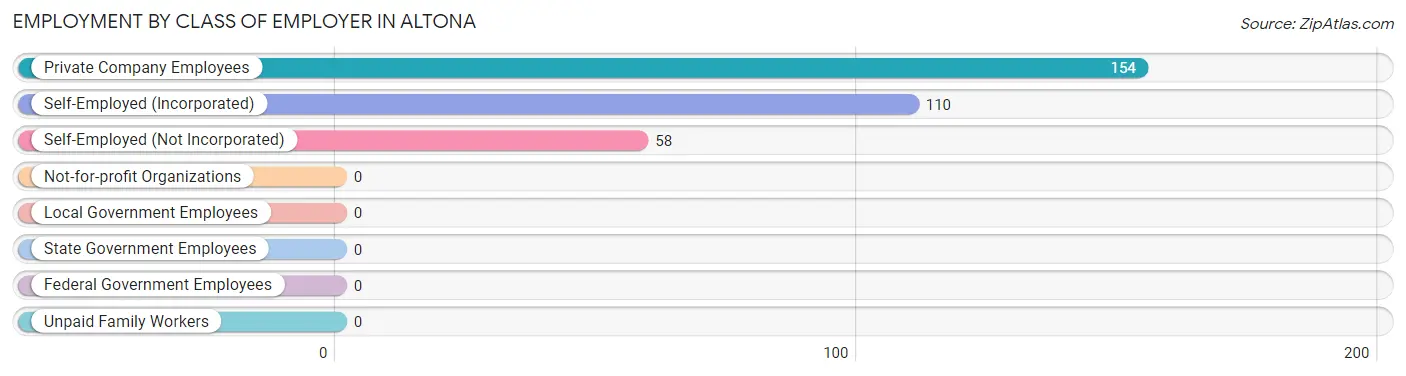
| Employer Class | # Employees | % Employees |
| Private Company Employees | 154 | 47.8% |
| Self-Employed (Incorporated) | 110 | 34.2% |
| Self-Employed (Not Incorporated) | 58 | 18.0% |
| Not-for-profit Organizations | 0 | 0.0% |
| Local Government Employees | 0 | 0.0% |
| State Government Employees | 0 | 0.0% |
| Federal Government Employees | 0 | 0.0% |
| Unpaid Family Workers | 0 | 0.0% |
| Total | 322 | 100.0% |
Employment Status by Age in Altona
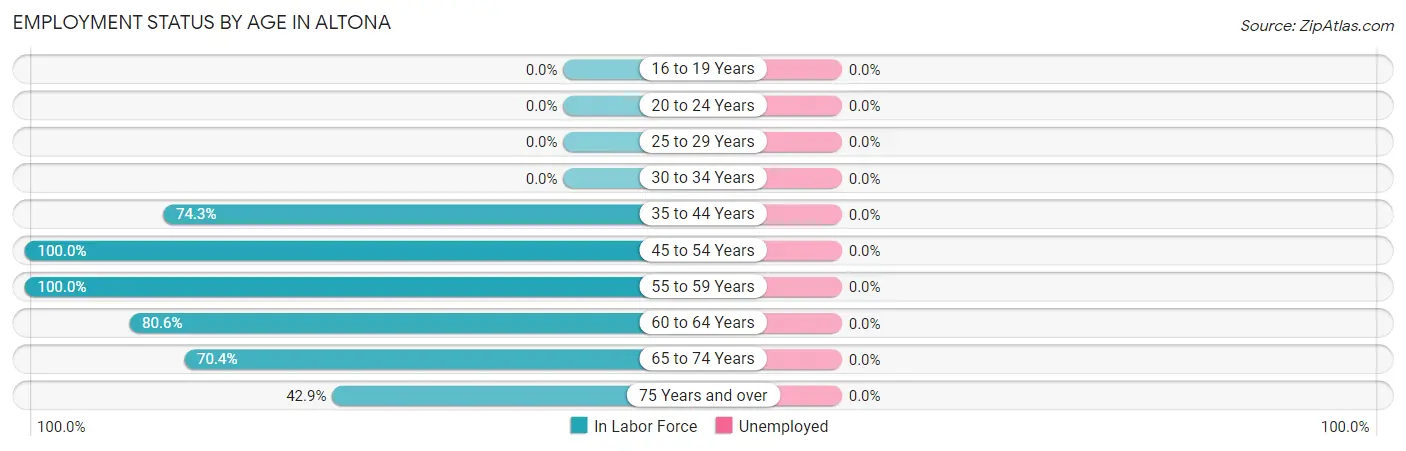
| Age Bracket | In Labor Force | Unemployed |
| 16 to 19 Years | 0 (0.0%) | 0 (0.0%) |
| 20 to 24 Years | 0 (0.0%) | 0 (0.0%) |
| 25 to 29 Years | 0 (0.0%) | 0 (0.0%) |
| 30 to 34 Years | 0 (0.0%) | 0 (0.0%) |
| 35 to 44 Years | 55 (74.3%) | 0 (0.0%) |
| 45 to 54 Years | 53 (100.0%) | 0 (0.0%) |
| 55 to 59 Years | 11 (100.0%) | 0 (0.0%) |
| 60 to 64 Years | 75 (80.6%) | 0 (0.0%) |
| 65 to 74 Years | 107 (70.4%) | 0 (0.0%) |
| 75 Years and over | 21 (42.9%) | 0 (0.0%) |
| Total | 322 (70.9%) | 0 (0.0%) |
Employment Status by Educational Attainment in Altona
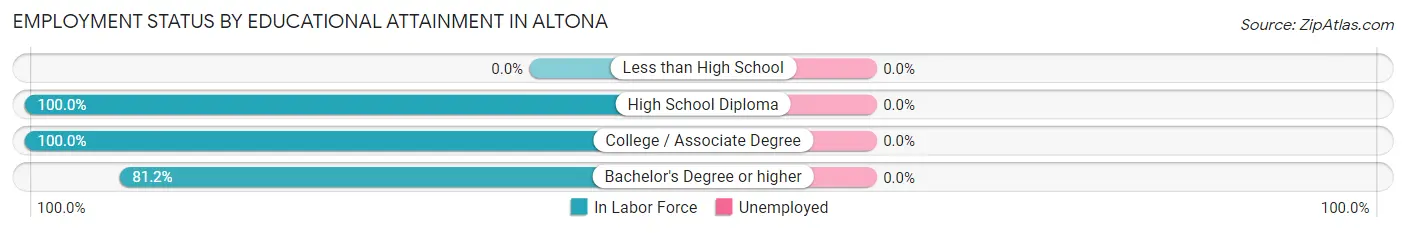
| Educational Attainment | In Labor Force | Unemployed |
| Less than High School | 0 (0.0%) | 0 (0.0%) |
| High School Diploma | 6 (100.0%) | 0 (0.0%) |
| College / Associate Degree | 28 (100.0%) | 0 (0.0%) |
| Bachelor's Degree or higher | 160 (81.2%) | 0 (0.0%) |
| Total | 194 (84.0%) | 0 (0.0%) |
Employment Occupations by Sex in Altona
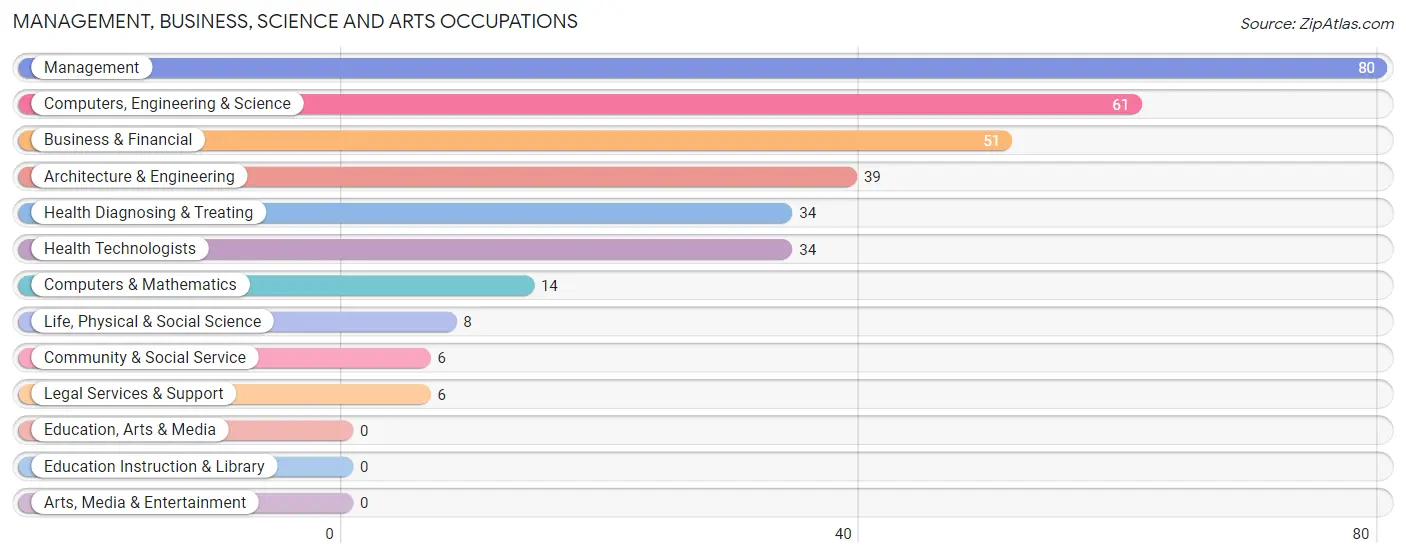
Management, Business, Science and Arts Occupations
The most common Management, Business, Science and Arts occupations in Altona are Management (80 | 24.8%), Computers, Engineering & Science (61 | 18.9%), Business & Financial (51 | 15.8%), Architecture & Engineering (39 | 12.1%), and Health Diagnosing & Treating (34 | 10.6%).
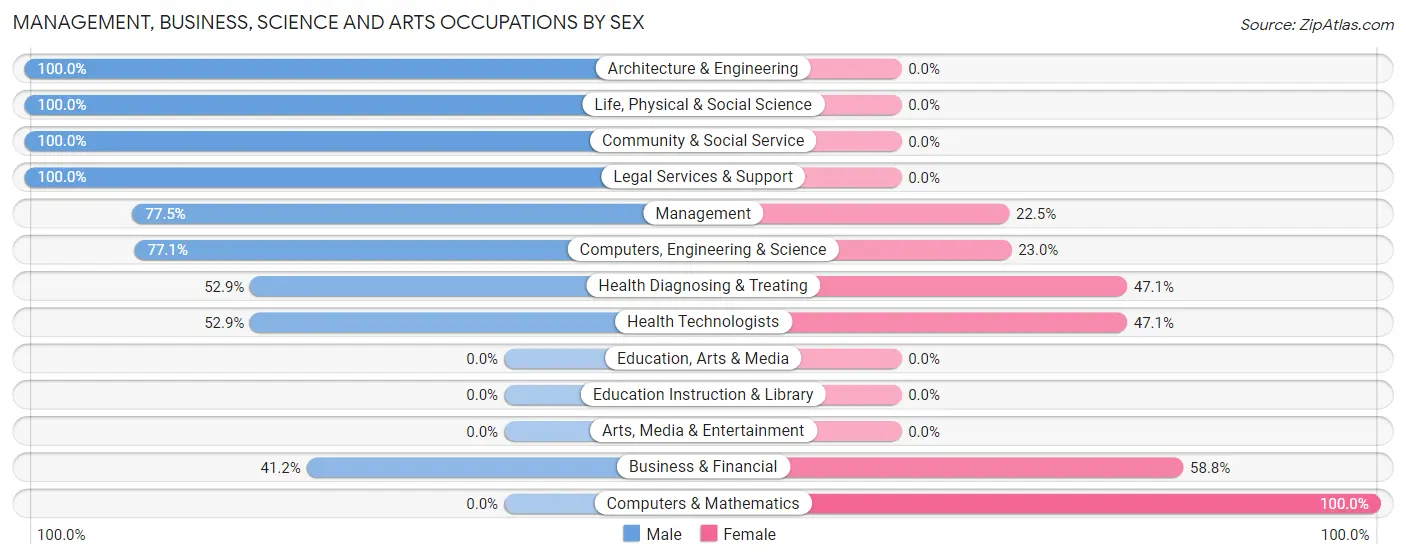
Management, Business, Science and Arts Occupations by Sex
Within the Management, Business, Science and Arts occupations in Altona, the most male-oriented occupations are Architecture & Engineering (100.0%), Life, Physical & Social Science (100.0%), and Community & Social Service (100.0%), while the most female-oriented occupations are Computers & Mathematics (100.0%), Business & Financial (58.8%), and Health Diagnosing & Treating (47.1%).
| Occupation | Male | Female |
| Management | 62 (77.5%) | 18 (22.5%) |
| Business & Financial | 21 (41.2%) | 30 (58.8%) |
| Computers, Engineering & Science | 47 (77.0%) | 14 (23.0%) |
| Computers & Mathematics | 0 (0.0%) | 14 (100.0%) |
| Architecture & Engineering | 39 (100.0%) | 0 (0.0%) |
| Life, Physical & Social Science | 8 (100.0%) | 0 (0.0%) |
| Community & Social Service | 6 (100.0%) | 0 (0.0%) |
| Education, Arts & Media | 0 (0.0%) | 0 (0.0%) |
| Legal Services & Support | 6 (100.0%) | 0 (0.0%) |
| Education Instruction & Library | 0 (0.0%) | 0 (0.0%) |
| Arts, Media & Entertainment | 0 (0.0%) | 0 (0.0%) |
| Health Diagnosing & Treating | 18 (52.9%) | 16 (47.1%) |
| Health Technologists | 18 (52.9%) | 16 (47.1%) |
| Total (Category) | 154 (66.4%) | 78 (33.6%) |
| Total (Overall) | 182 (56.5%) | 140 (43.5%) |
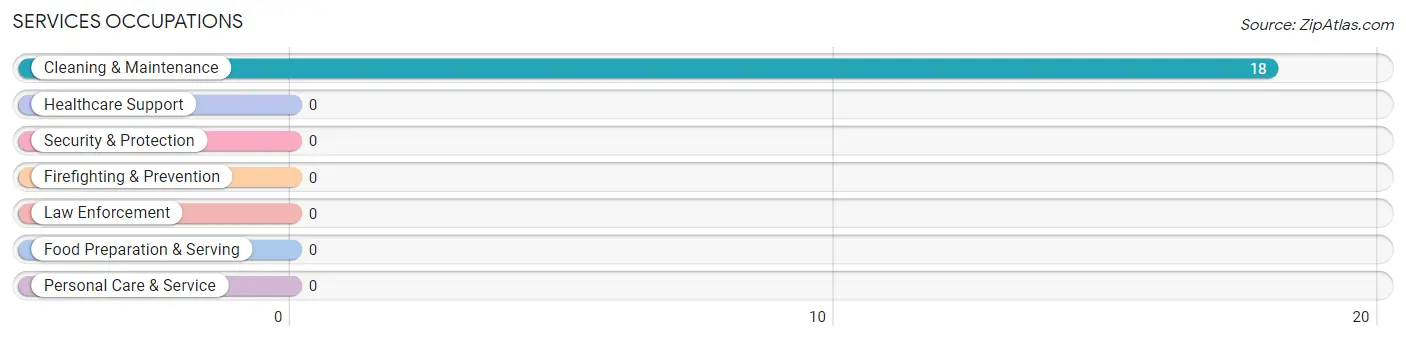
Services Occupations
The most common Services occupations in Altona are , and Cleaning & Maintenance (18 | 5.6%).
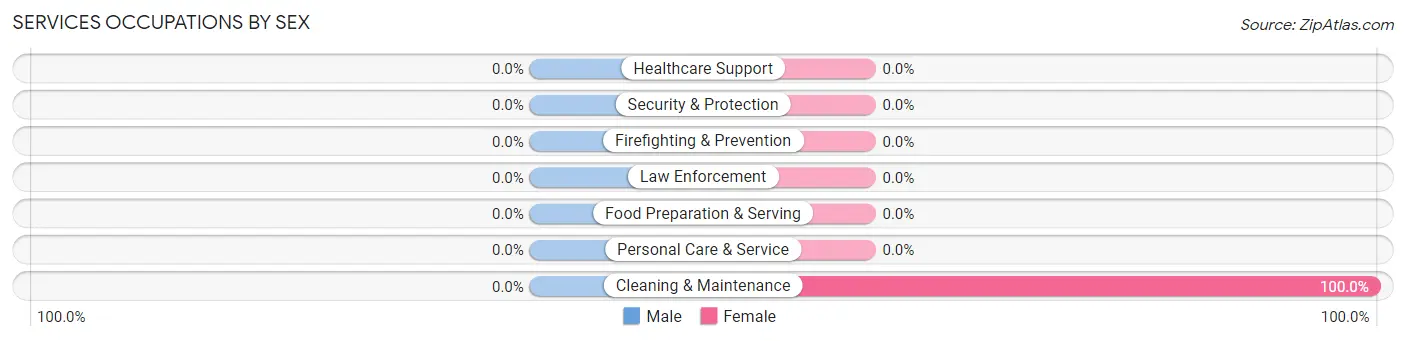
Services Occupations by Sex
| Occupation | Male | Female |
| Healthcare Support | 0 (0.0%) | 0 (0.0%) |
| Security & Protection | 0 (0.0%) | 0 (0.0%) |
| Firefighting & Prevention | 0 (0.0%) | 0 (0.0%) |
| Law Enforcement | 0 (0.0%) | 0 (0.0%) |
| Food Preparation & Serving | 0 (0.0%) | 0 (0.0%) |
| Cleaning & Maintenance | 0 (0.0%) | 18 (100.0%) |
| Personal Care & Service | 0 (0.0%) | 0 (0.0%) |
| Total (Category) | 0 (0.0%) | 18 (100.0%) |
| Total (Overall) | 182 (56.5%) | 140 (43.5%) |
Sales and Office Occupations
The most common Sales and Office occupations in Altona are Sales & Related (33 | 10.2%), and Office & Administration (29 | 9.0%).

Sales and Office Occupations by Sex
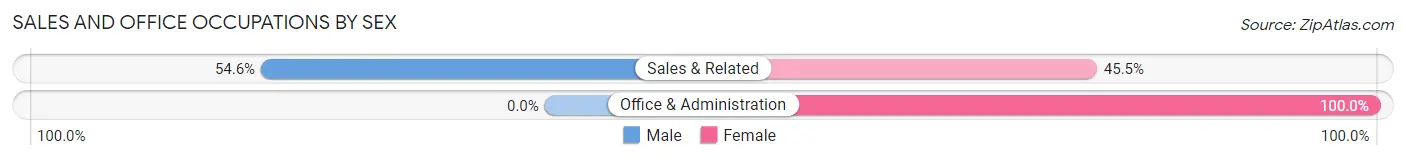
| Occupation | Male | Female |
| Sales & Related | 18 (54.5%) | 15 (45.5%) |
| Office & Administration | 0 (0.0%) | 29 (100.0%) |
| Total (Category) | 18 (29.0%) | 44 (71.0%) |
| Total (Overall) | 182 (56.5%) | 140 (43.5%) |
Natural Resources, Construction and Maintenance Occupations
The most common Natural Resources, Construction and Maintenance occupations in Altona are , and Construction & Extraction (10 | 3.1%).
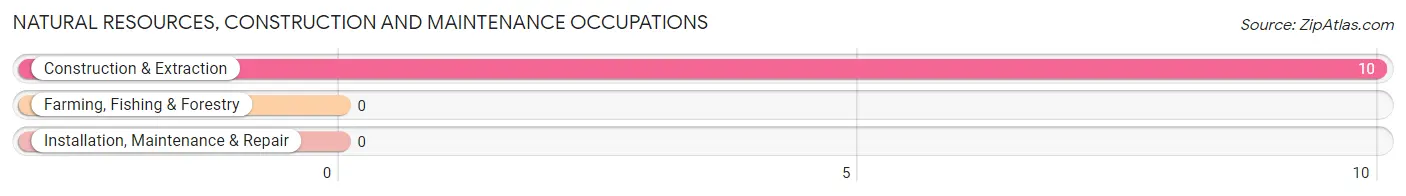
Natural Resources, Construction and Maintenance Occupations by Sex
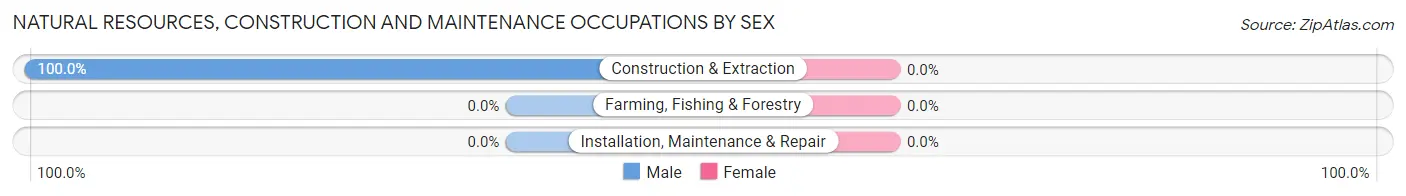
| Occupation | Male | Female |
| Farming, Fishing & Forestry | 0 (0.0%) | 0 (0.0%) |
| Construction & Extraction | 10 (100.0%) | 0 (0.0%) |
| Installation, Maintenance & Repair | 0 (0.0%) | 0 (0.0%) |
| Total (Category) | 10 (100.0%) | 0 (0.0%) |
| Total (Overall) | 182 (56.5%) | 140 (43.5%) |
Production, Transportation and Moving Occupations
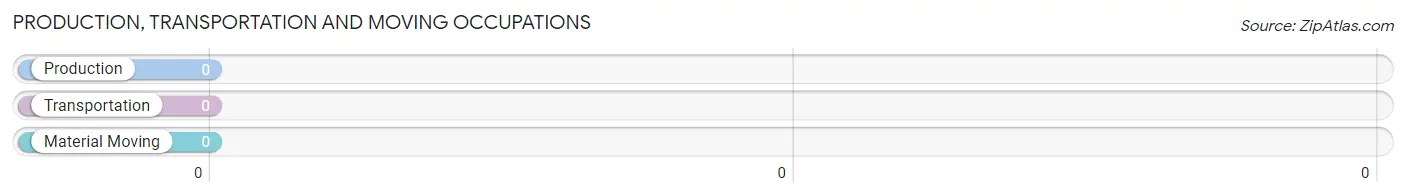
Production, Transportation and Moving Occupations by Sex
| Occupation | Male | Female |
| Production | 0 (0.0%) | 0 (0.0%) |
| Transportation | 0 (0.0%) | 0 (0.0%) |
| Material Moving | 0 (0.0%) | 0 (0.0%) |
| Total (Category) | 0 (0.0%) | 0 (0.0%) |
| Total (Overall) | 182 (56.5%) | 140 (43.5%) |
Employment Industries by Sex in Altona
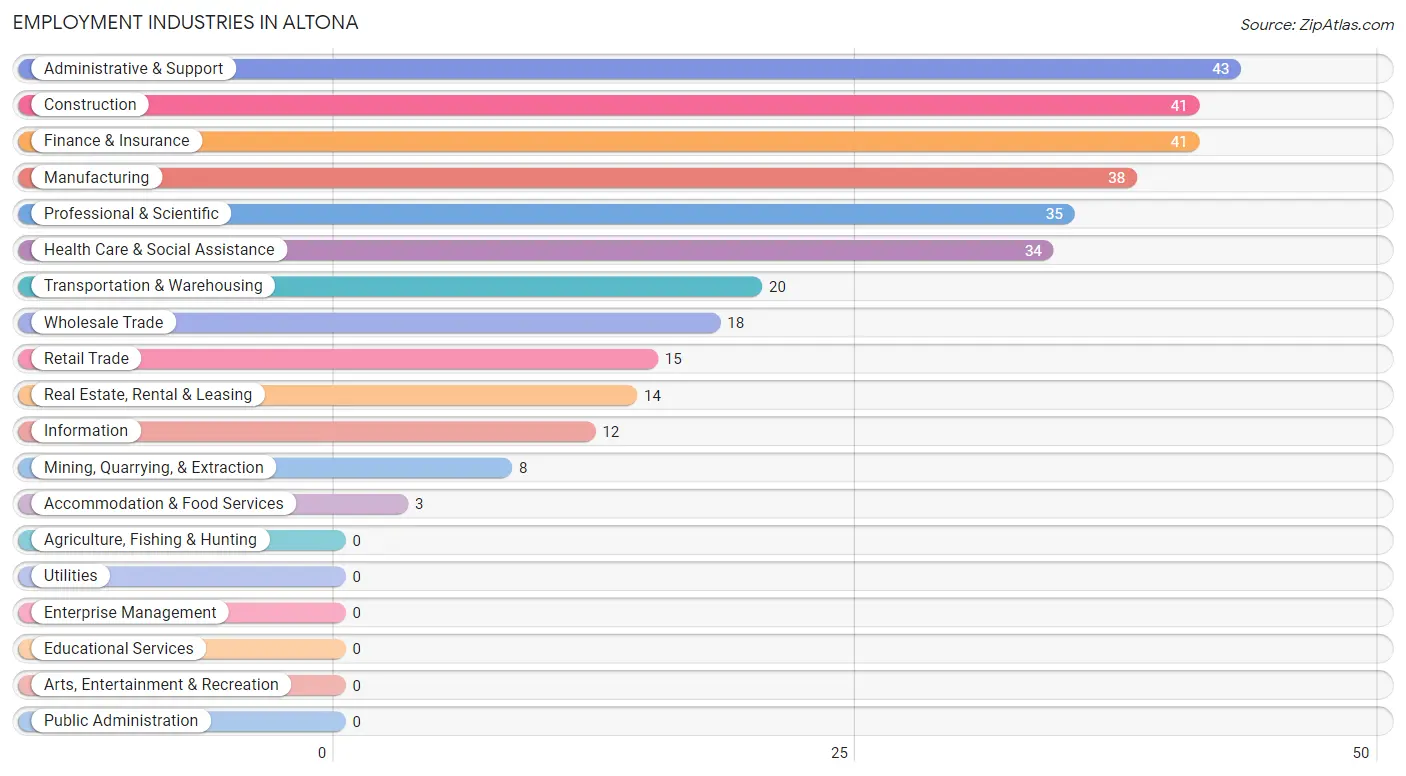
Employment Industries in Altona
The major employment industries in Altona include Administrative & Support (43 | 13.4%), Construction (41 | 12.7%), Finance & Insurance (41 | 12.7%), Manufacturing (38 | 11.8%), and Professional & Scientific (35 | 10.9%).
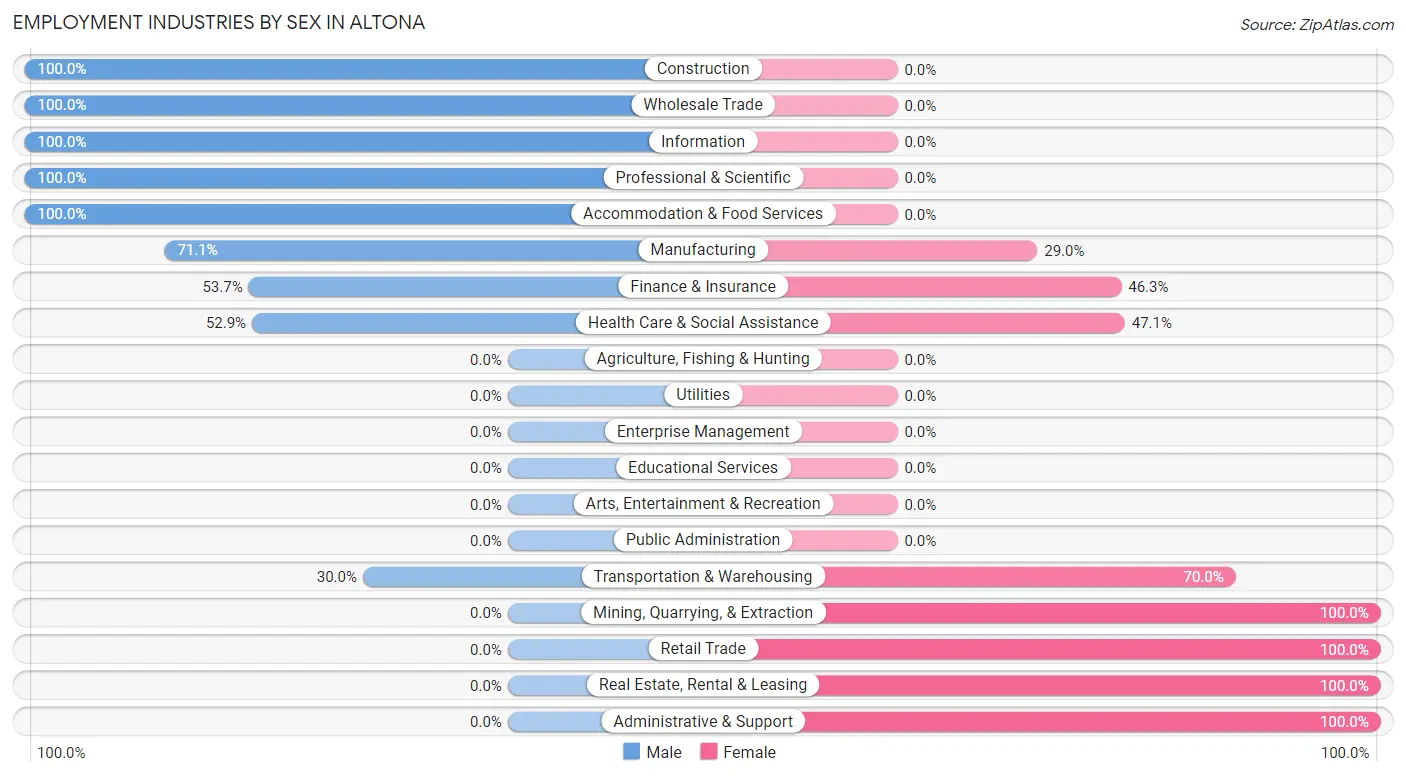
Employment Industries by Sex in Altona
The Altona industries that see more men than women are Construction (100.0%), Wholesale Trade (100.0%), and Information (100.0%), whereas the industries that tend to have a higher number of women are Mining, Quarrying, & Extraction (100.0%), Retail Trade (100.0%), and Real Estate, Rental & Leasing (100.0%).
| Industry | Male | Female |
| Agriculture, Fishing & Hunting | 0 (0.0%) | 0 (0.0%) |
| Mining, Quarrying, & Extraction | 0 (0.0%) | 8 (100.0%) |
| Construction | 41 (100.0%) | 0 (0.0%) |
| Manufacturing | 27 (71.1%) | 11 (28.9%) |
| Wholesale Trade | 18 (100.0%) | 0 (0.0%) |
| Retail Trade | 0 (0.0%) | 15 (100.0%) |
| Transportation & Warehousing | 6 (30.0%) | 14 (70.0%) |
| Utilities | 0 (0.0%) | 0 (0.0%) |
| Information | 12 (100.0%) | 0 (0.0%) |
| Finance & Insurance | 22 (53.7%) | 19 (46.3%) |
| Real Estate, Rental & Leasing | 0 (0.0%) | 14 (100.0%) |
| Professional & Scientific | 35 (100.0%) | 0 (0.0%) |
| Enterprise Management | 0 (0.0%) | 0 (0.0%) |
| Administrative & Support | 0 (0.0%) | 43 (100.0%) |
| Educational Services | 0 (0.0%) | 0 (0.0%) |
| Health Care & Social Assistance | 18 (52.9%) | 16 (47.1%) |
| Arts, Entertainment & Recreation | 0 (0.0%) | 0 (0.0%) |
| Accommodation & Food Services | 3 (100.0%) | 0 (0.0%) |
| Public Administration | 0 (0.0%) | 0 (0.0%) |
| Total | 182 (56.5%) | 140 (43.5%) |
Education in Altona
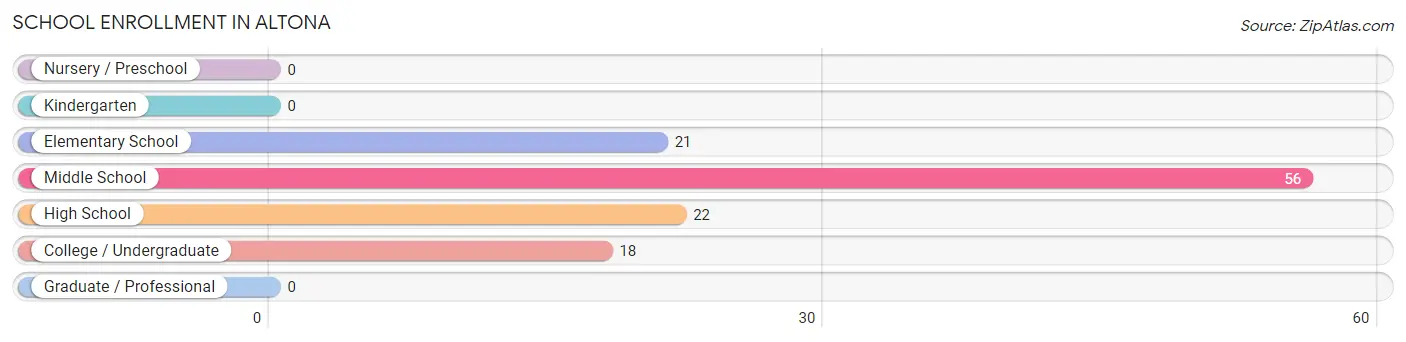
School Enrollment in Altona
The most common levels of schooling among the 117 students in Altona are middle school (56 | 47.9%), high school (22 | 18.8%), and elementary school (21 | 17.9%).
| School Level | # Students | % Students |
| Nursery / Preschool | 0 | 0.0% |
| Kindergarten | 0 | 0.0% |
| Elementary School | 21 | 17.9% |
| Middle School | 56 | 47.9% |
| High School | 22 | 18.8% |
| College / Undergraduate | 18 | 15.4% |
| Graduate / Professional | 0 | 0.0% |
| Total | 117 | 100.0% |
School Enrollment by Age by Funding Source in Altona
Out of a total of 117 students who are enrolled in schools in Altona, 98 (83.8%) attend a private institution, while the remaining 19 (16.2%) are enrolled in public schools. The age group of 15 to 17 year olds has the highest likelihood of being enrolled in private schools, with 22 (100.0% in the age bracket) enrolled. Conversely, the age group of 10 to 14 year olds has the lowest likelihood of being enrolled in a private school, with 19 (24.7% in the age bracket) attending a public institution.
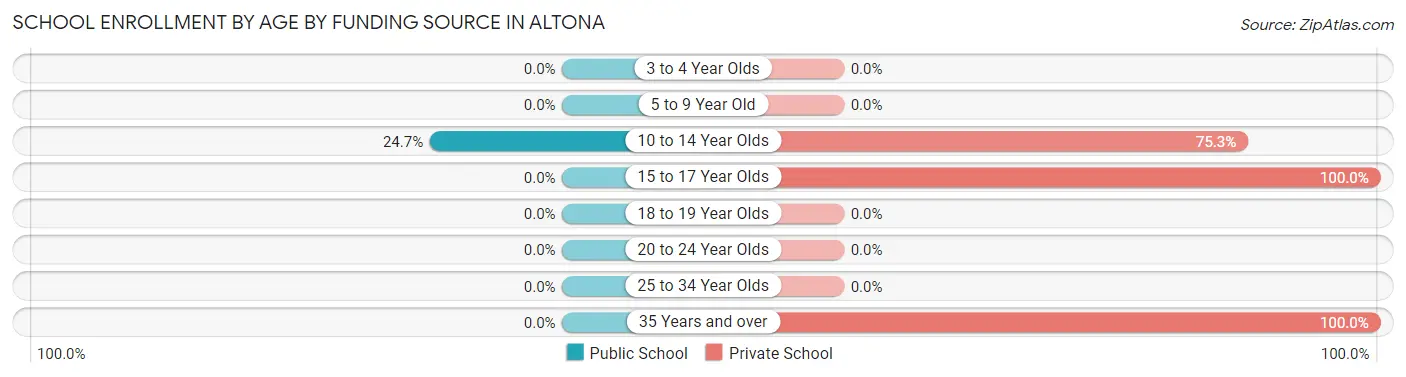
| Age Bracket | Public School | Private School |
| 3 to 4 Year Olds | 0 (0.0%) | 0 (0.0%) |
| 5 to 9 Year Old | 0 (0.0%) | 0 (0.0%) |
| 10 to 14 Year Olds | 19 (24.7%) | 58 (75.3%) |
| 15 to 17 Year Olds | 0 (0.0%) | 22 (100.0%) |
| 18 to 19 Year Olds | 0 (0.0%) | 0 (0.0%) |
| 20 to 24 Year Olds | 0 (0.0%) | 0 (0.0%) |
| 25 to 34 Year Olds | 0 (0.0%) | 0 (0.0%) |
| 35 Years and over | 0 (0.0%) | 18 (100.0%) |
| Total | 19 (16.2%) | 98 (83.8%) |
Educational Attainment by Field of Study in Altona
Business (88 | 27.3%), visual & performing arts (52 | 16.2%), engineering (40 | 12.4%), computers & mathematics (29 | 9.0%), and physical & health sciences (26 | 8.1%) are the most common fields of study among 322 individuals in Altona who have obtained a bachelor's degree or higher.
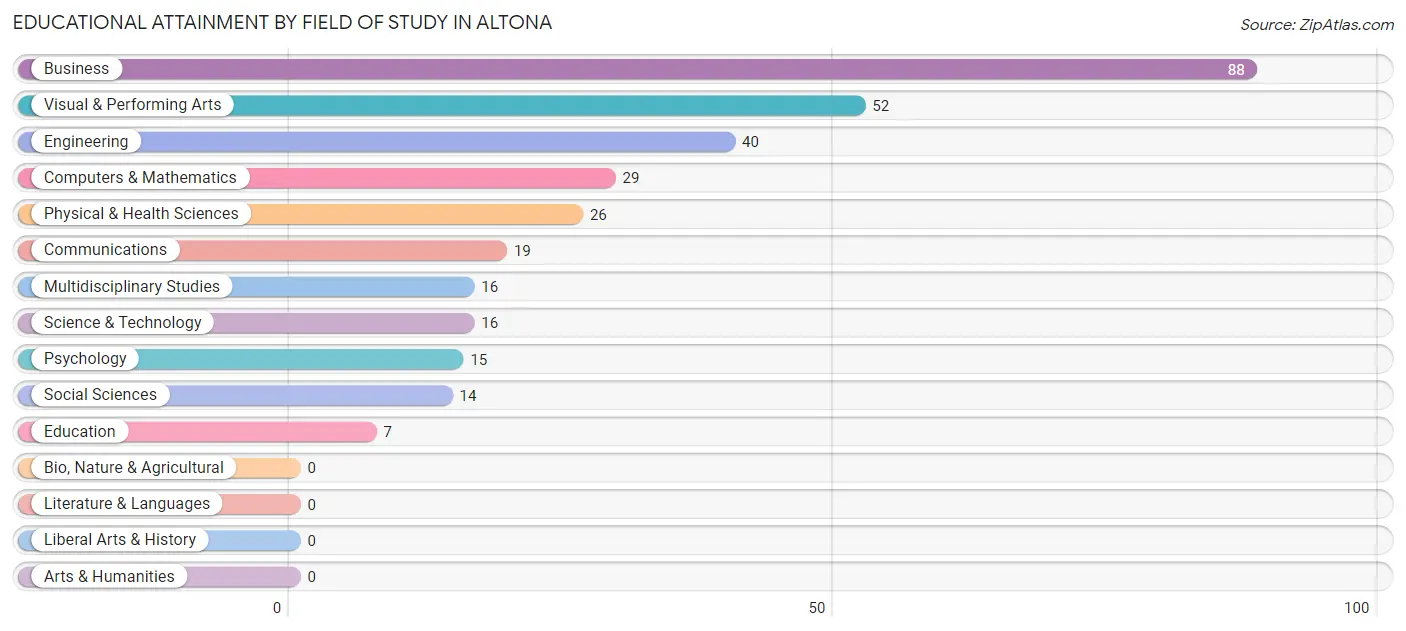
| Field of Study | # Graduates | % Graduates |
| Computers & Mathematics | 29 | 9.0% |
| Bio, Nature & Agricultural | 0 | 0.0% |
| Physical & Health Sciences | 26 | 8.1% |
| Psychology | 15 | 4.7% |
| Social Sciences | 14 | 4.3% |
| Engineering | 40 | 12.4% |
| Multidisciplinary Studies | 16 | 5.0% |
| Science & Technology | 16 | 5.0% |
| Business | 88 | 27.3% |
| Education | 7 | 2.2% |
| Literature & Languages | 0 | 0.0% |
| Liberal Arts & History | 0 | 0.0% |
| Visual & Performing Arts | 52 | 16.2% |
| Communications | 19 | 5.9% |
| Arts & Humanities | 0 | 0.0% |
| Total | 322 | 100.0% |
Transportation & Commute in Altona
Vehicle Availability by Sex in Altona
The most prevalent vehicle ownership categories in Altona are males with 3 vehicles (125, accounting for 68.7%) and females with 3 vehicles (104, making up 89.3%).
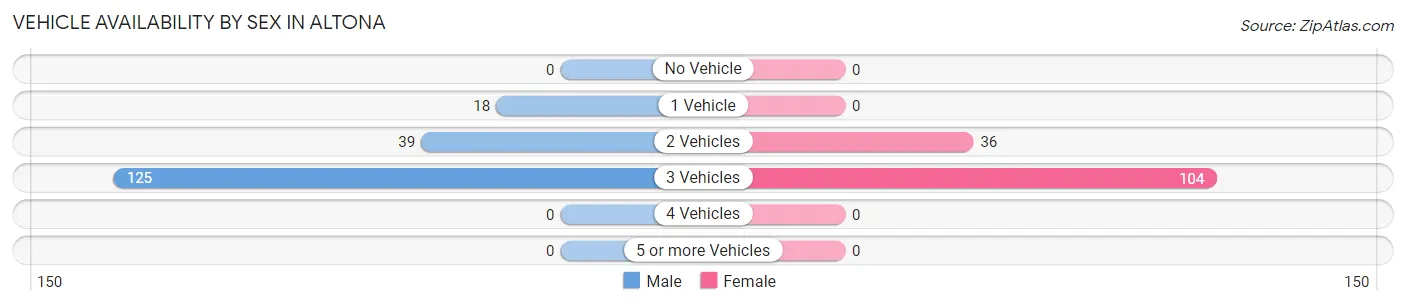
| Vehicles Available | Male | Female |
| No Vehicle | 0 (0.0%) | 0 (0.0%) |
| 1 Vehicle | 18 (9.9%) | 0 (0.0%) |
| 2 Vehicles | 39 (21.4%) | 36 (25.7%) |
| 3 Vehicles | 125 (68.7%) | 104 (74.3%) |
| 4 Vehicles | 0 (0.0%) | 0 (0.0%) |
| 5 or more Vehicles | 0 (0.0%) | 0 (0.0%) |
| Total | 182 (100.0%) | 140 (100.0%) |
Commute Time in Altona
The most frequently occuring commute durations in Altona are 15 to 19 minutes (124 commuters, 56.4%), 20 to 24 minutes (96 commuters, 43.6%), and less than 5 minutes (0 commuters, 0.0%).
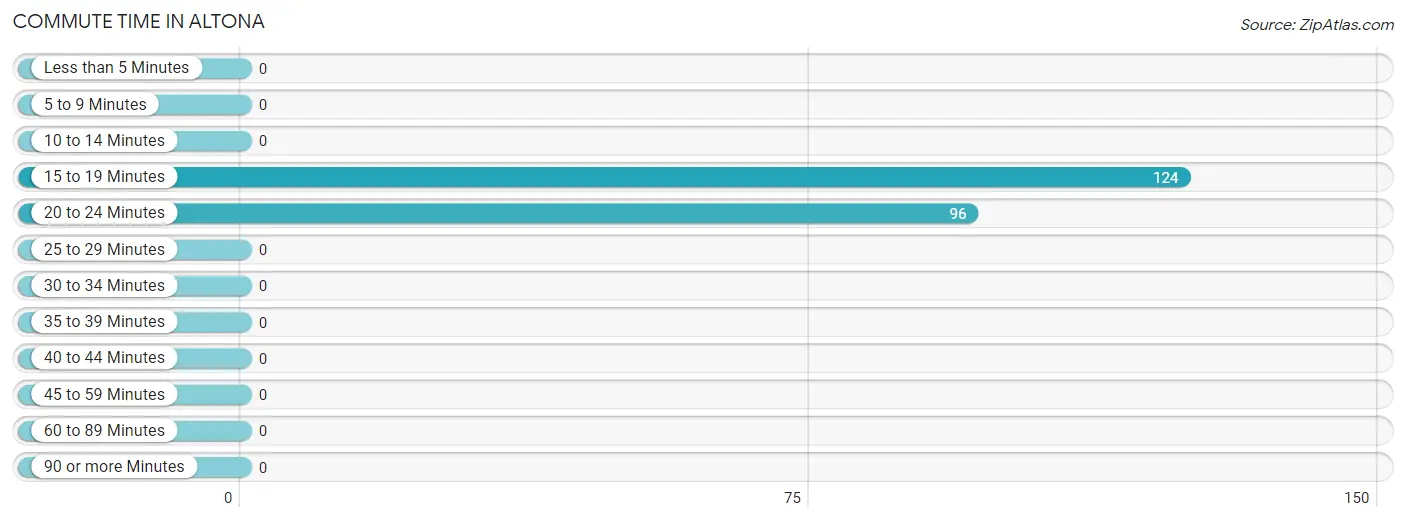
| Commute Time | # Commuters | % Commuters |
| Less than 5 Minutes | 0 | 0.0% |
| 5 to 9 Minutes | 0 | 0.0% |
| 10 to 14 Minutes | 0 | 0.0% |
| 15 to 19 Minutes | 124 | 56.4% |
| 20 to 24 Minutes | 96 | 43.6% |
| 25 to 29 Minutes | 0 | 0.0% |
| 30 to 34 Minutes | 0 | 0.0% |
| 35 to 39 Minutes | 0 | 0.0% |
| 40 to 44 Minutes | 0 | 0.0% |
| 45 to 59 Minutes | 0 | 0.0% |
| 60 to 89 Minutes | 0 | 0.0% |
| 90 or more Minutes | 0 | 0.0% |
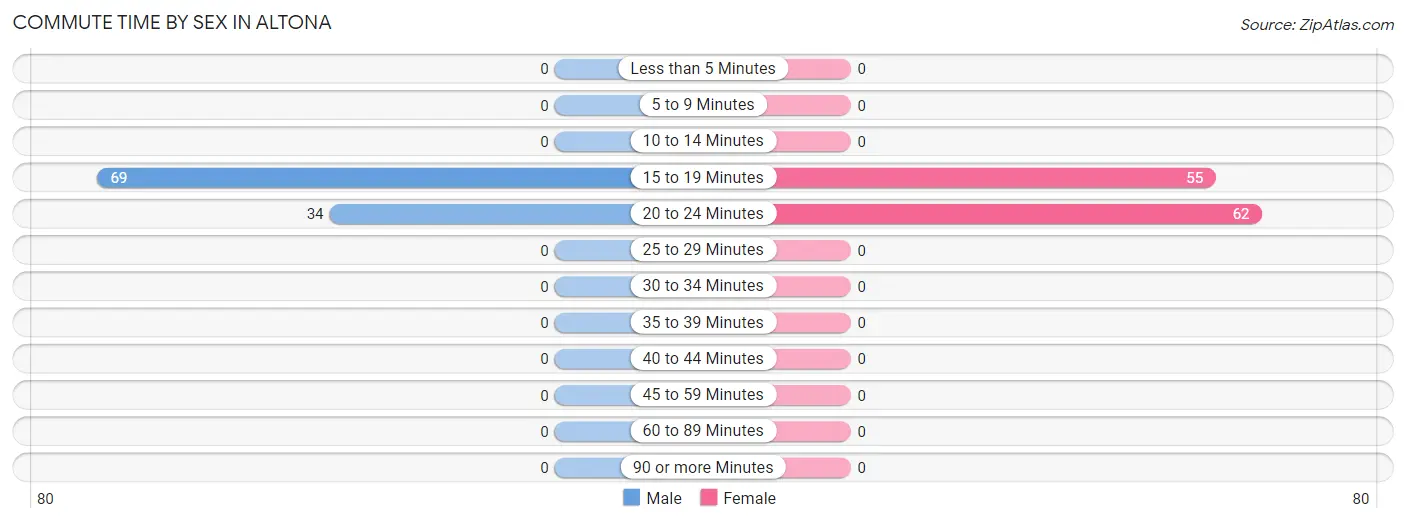
Commute Time by Sex in Altona
The most common commute times in Altona are 15 to 19 minutes (69 commuters, 67.0%) for males and 20 to 24 minutes (62 commuters, 53.0%) for females.
| Commute Time | Male | Female |
| Less than 5 Minutes | 0 (0.0%) | 0 (0.0%) |
| 5 to 9 Minutes | 0 (0.0%) | 0 (0.0%) |
| 10 to 14 Minutes | 0 (0.0%) | 0 (0.0%) |
| 15 to 19 Minutes | 69 (67.0%) | 55 (47.0%) |
| 20 to 24 Minutes | 34 (33.0%) | 62 (53.0%) |
| 25 to 29 Minutes | 0 (0.0%) | 0 (0.0%) |
| 30 to 34 Minutes | 0 (0.0%) | 0 (0.0%) |
| 35 to 39 Minutes | 0 (0.0%) | 0 (0.0%) |
| 40 to 44 Minutes | 0 (0.0%) | 0 (0.0%) |
| 45 to 59 Minutes | 0 (0.0%) | 0 (0.0%) |
| 60 to 89 Minutes | 0 (0.0%) | 0 (0.0%) |
| 90 or more Minutes | 0 (0.0%) | 0 (0.0%) |
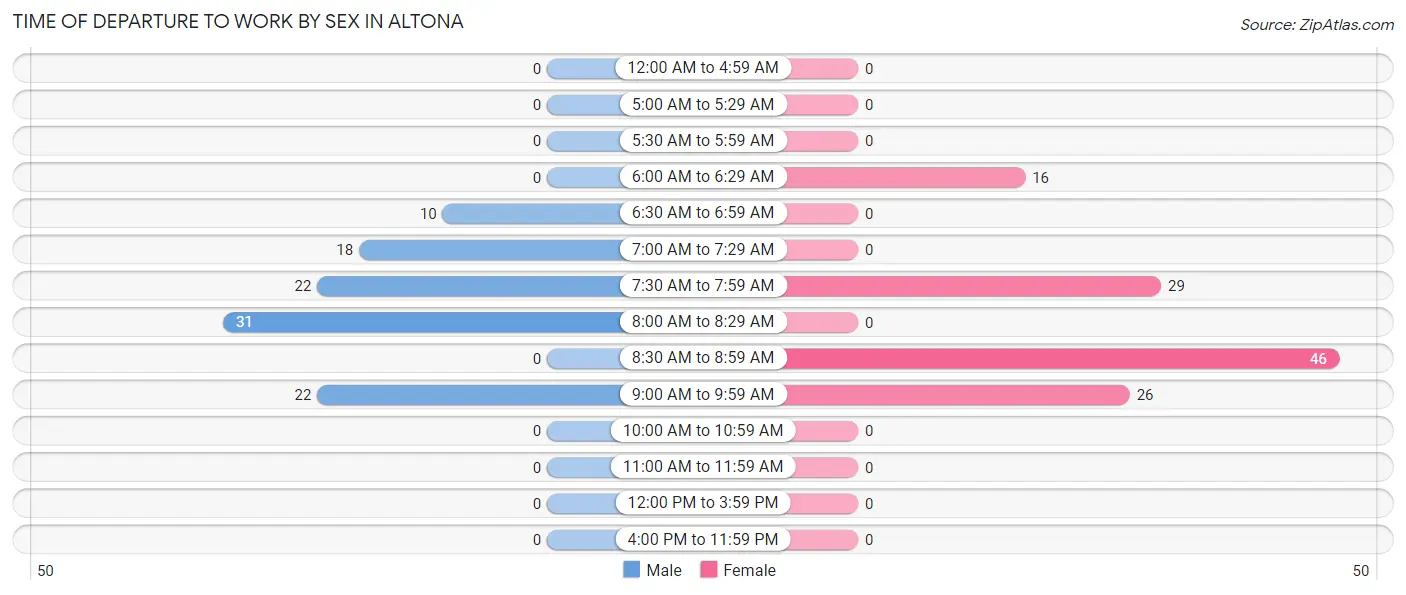
Time of Departure to Work by Sex in Altona
The most frequent times of departure to work in Altona are 8:00 AM to 8:29 AM (31, 30.1%) for males and 8:30 AM to 8:59 AM (46, 39.3%) for females.
| Time of Departure | Male | Female |
| 12:00 AM to 4:59 AM | 0 (0.0%) | 0 (0.0%) |
| 5:00 AM to 5:29 AM | 0 (0.0%) | 0 (0.0%) |
| 5:30 AM to 5:59 AM | 0 (0.0%) | 0 (0.0%) |
| 6:00 AM to 6:29 AM | 0 (0.0%) | 16 (13.7%) |
| 6:30 AM to 6:59 AM | 10 (9.7%) | 0 (0.0%) |
| 7:00 AM to 7:29 AM | 18 (17.5%) | 0 (0.0%) |
| 7:30 AM to 7:59 AM | 22 (21.4%) | 29 (24.8%) |
| 8:00 AM to 8:29 AM | 31 (30.1%) | 0 (0.0%) |
| 8:30 AM to 8:59 AM | 0 (0.0%) | 46 (39.3%) |
| 9:00 AM to 9:59 AM | 22 (21.4%) | 26 (22.2%) |
| 10:00 AM to 10:59 AM | 0 (0.0%) | 0 (0.0%) |
| 11:00 AM to 11:59 AM | 0 (0.0%) | 0 (0.0%) |
| 12:00 PM to 3:59 PM | 0 (0.0%) | 0 (0.0%) |
| 4:00 PM to 11:59 PM | 0 (0.0%) | 0 (0.0%) |
| Total | 103 (100.0%) | 117 (100.0%) |
Housing Occupancy in Altona
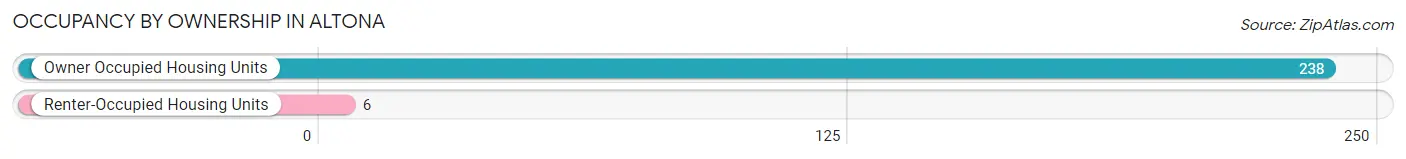
Occupancy by Ownership in Altona
Of the total 244 dwellings in Altona, owner-occupied units account for 238 (97.5%), while renter-occupied units make up 6 (2.5%).
| Occupancy | # Housing Units | % Housing Units |
| Owner Occupied Housing Units | 238 | 97.5% |
| Renter-Occupied Housing Units | 6 | 2.5% |
| Total Occupied Housing Units | 244 | 100.0% |
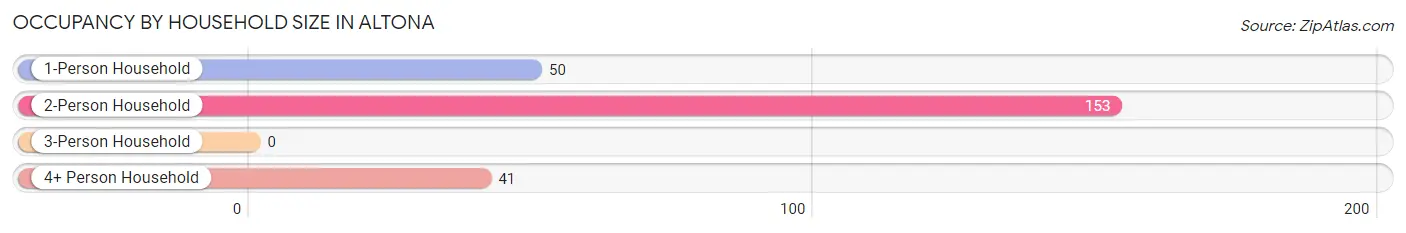
Occupancy by Household Size in Altona
| Household Size | # Housing Units | % Housing Units |
| 1-Person Household | 50 | 20.5% |
| 2-Person Household | 153 | 62.7% |
| 3-Person Household | 0 | 0.0% |
| 4+ Person Household | 41 | 16.8% |
| Total Housing Units | 244 | 100.0% |
Occupancy by Ownership by Household Size in Altona
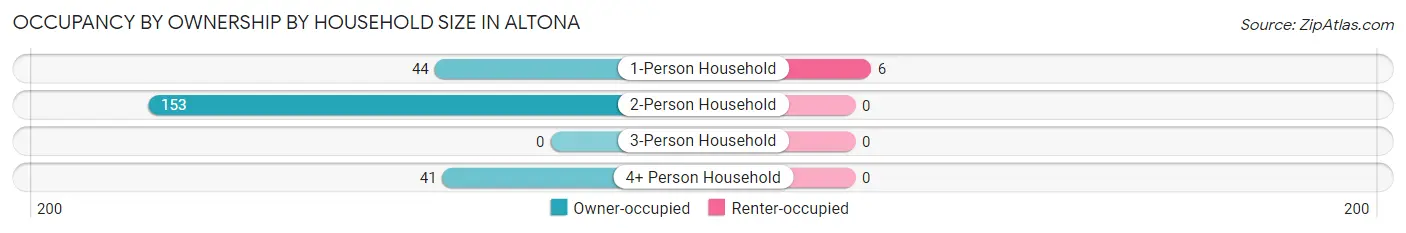
| Household Size | Owner-occupied | Renter-occupied |
| 1-Person Household | 44 (88.0%) | 6 (12.0%) |
| 2-Person Household | 153 (100.0%) | 0 (0.0%) |
| 3-Person Household | 0 (0.0%) | 0 (0.0%) |
| 4+ Person Household | 41 (100.0%) | 0 (0.0%) |
| Total Housing Units | 238 (97.5%) | 6 (2.5%) |
Occupancy by Educational Attainment in Altona
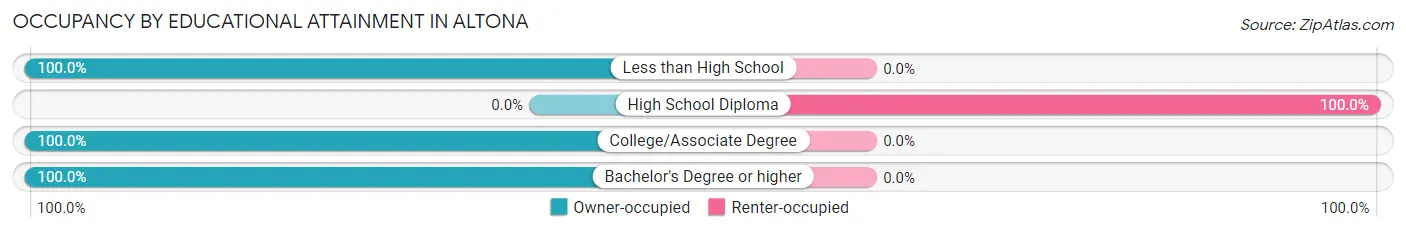
| Household Size | Owner-occupied | Renter-occupied |
| Less than High School | 8 (100.0%) | 0 (0.0%) |
| High School Diploma | 0 (0.0%) | 6 (100.0%) |
| College/Associate Degree | 49 (100.0%) | 0 (0.0%) |
| Bachelor's Degree or higher | 181 (100.0%) | 0 (0.0%) |
Occupancy by Age of Householder in Altona
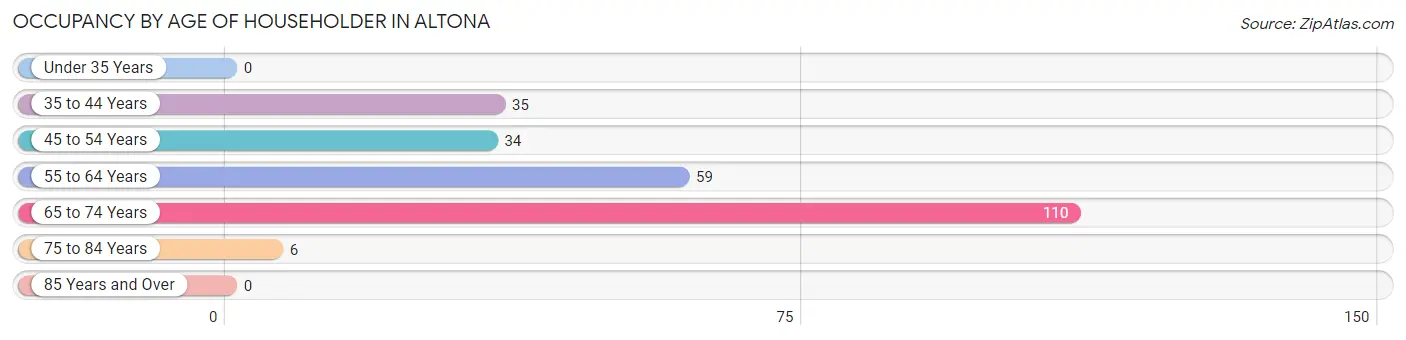
| Age Bracket | # Households | % Households |
| Under 35 Years | 0 | 0.0% |
| 35 to 44 Years | 35 | 14.3% |
| 45 to 54 Years | 34 | 13.9% |
| 55 to 64 Years | 59 | 24.2% |
| 65 to 74 Years | 110 | 45.1% |
| 75 to 84 Years | 6 | 2.5% |
| 85 Years and Over | 0 | 0.0% |
| Total | 244 | 100.0% |
Housing Finances in Altona
Median Income by Occupancy in Altona
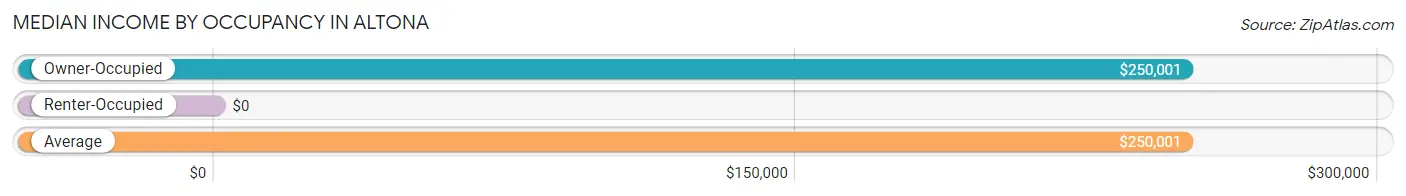
| Occupancy Type | # Households | Median Income |
| Owner-Occupied | 238 (97.5%) | $250,001 |
| Renter-Occupied | 6 (2.5%) | $0 |
| Average | 244 (100.0%) | $250,001 |
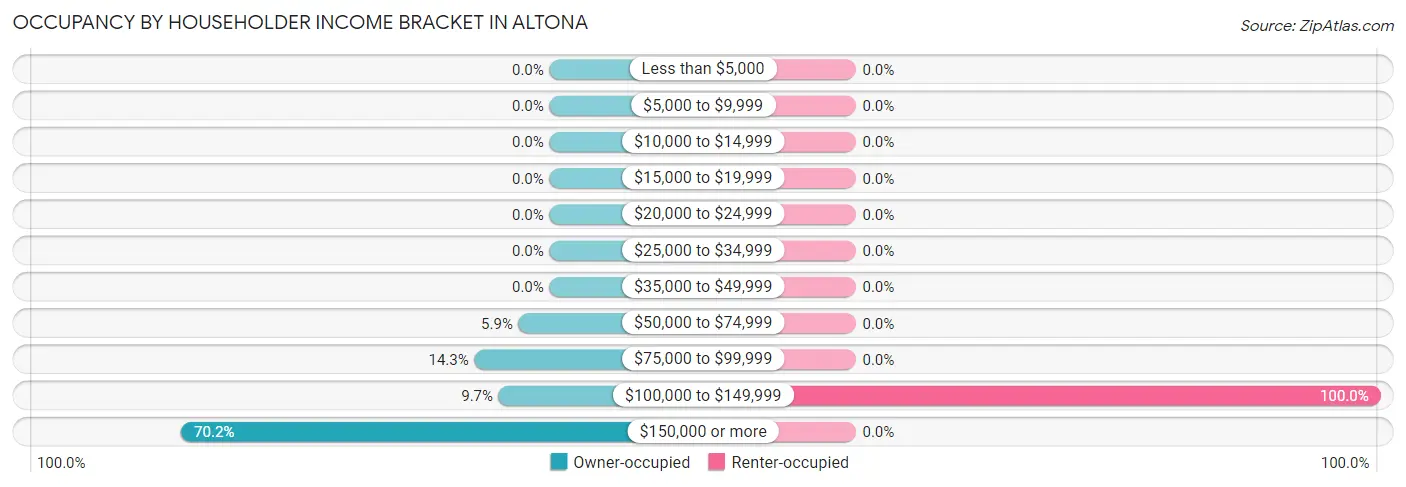
Occupancy by Householder Income Bracket in Altona
| Income Bracket | Owner-occupied | Renter-occupied |
| Less than $5,000 | 0 (0.0%) | 0 (0.0%) |
| $5,000 to $9,999 | 0 (0.0%) | 0 (0.0%) |
| $10,000 to $14,999 | 0 (0.0%) | 0 (0.0%) |
| $15,000 to $19,999 | 0 (0.0%) | 0 (0.0%) |
| $20,000 to $24,999 | 0 (0.0%) | 0 (0.0%) |
| $25,000 to $34,999 | 0 (0.0%) | 0 (0.0%) |
| $35,000 to $49,999 | 0 (0.0%) | 0 (0.0%) |
| $50,000 to $74,999 | 14 (5.9%) | 0 (0.0%) |
| $75,000 to $99,999 | 34 (14.3%) | 0 (0.0%) |
| $100,000 to $149,999 | 23 (9.7%) | 6 (100.0%) |
| $150,000 or more | 167 (70.2%) | 0 (0.0%) |
| Total | 238 (100.0%) | 6 (100.0%) |
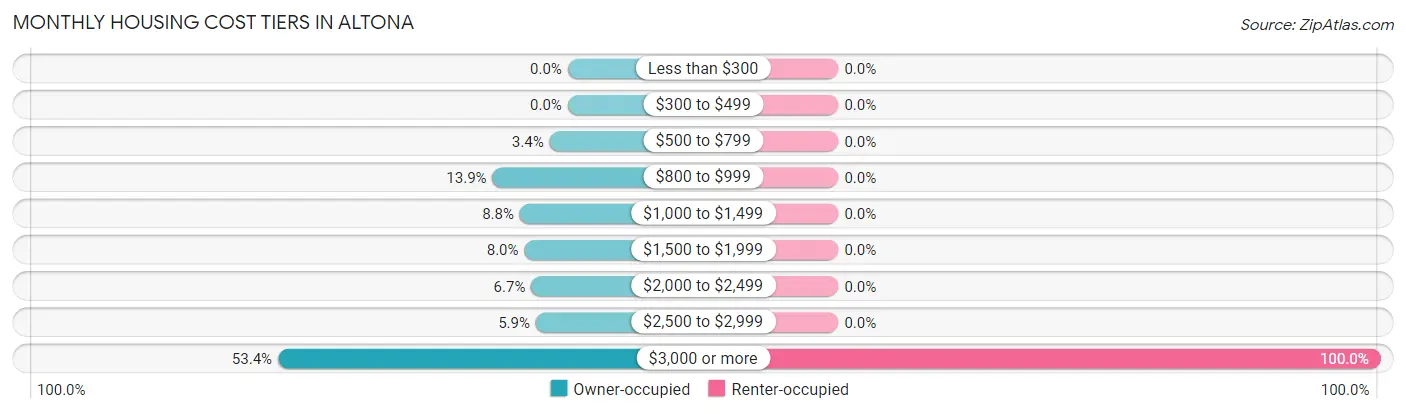
Monthly Housing Cost Tiers in Altona
| Monthly Cost | Owner-occupied | Renter-occupied |
| Less than $300 | 0 (0.0%) | 0 (0.0%) |
| $300 to $499 | 0 (0.0%) | 0 (0.0%) |
| $500 to $799 | 8 (3.4%) | 0 (0.0%) |
| $800 to $999 | 33 (13.9%) | 0 (0.0%) |
| $1,000 to $1,499 | 21 (8.8%) | 0 (0.0%) |
| $1,500 to $1,999 | 19 (8.0%) | 0 (0.0%) |
| $2,000 to $2,499 | 16 (6.7%) | 0 (0.0%) |
| $2,500 to $2,999 | 14 (5.9%) | 0 (0.0%) |
| $3,000 or more | 127 (53.4%) | 6 (100.0%) |
| Total | 238 (100.0%) | 6 (100.0%) |
Physical Housing Characteristics in Altona
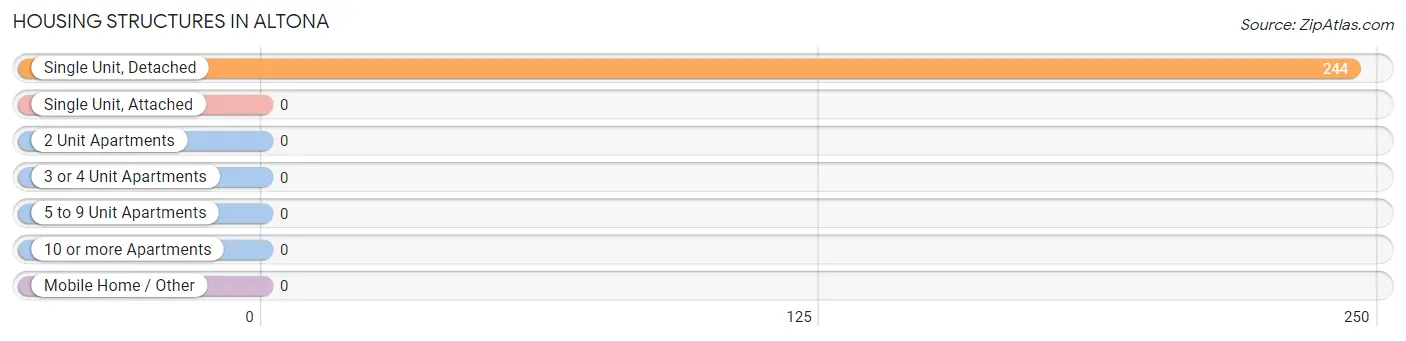
Housing Structures in Altona
| Structure Type | # Housing Units | % Housing Units |
| Single Unit, Detached | 244 | 100.0% |
| Single Unit, Attached | 0 | 0.0% |
| 2 Unit Apartments | 0 | 0.0% |
| 3 or 4 Unit Apartments | 0 | 0.0% |
| 5 to 9 Unit Apartments | 0 | 0.0% |
| 10 or more Apartments | 0 | 0.0% |
| Mobile Home / Other | 0 | 0.0% |
| Total | 244 | 100.0% |
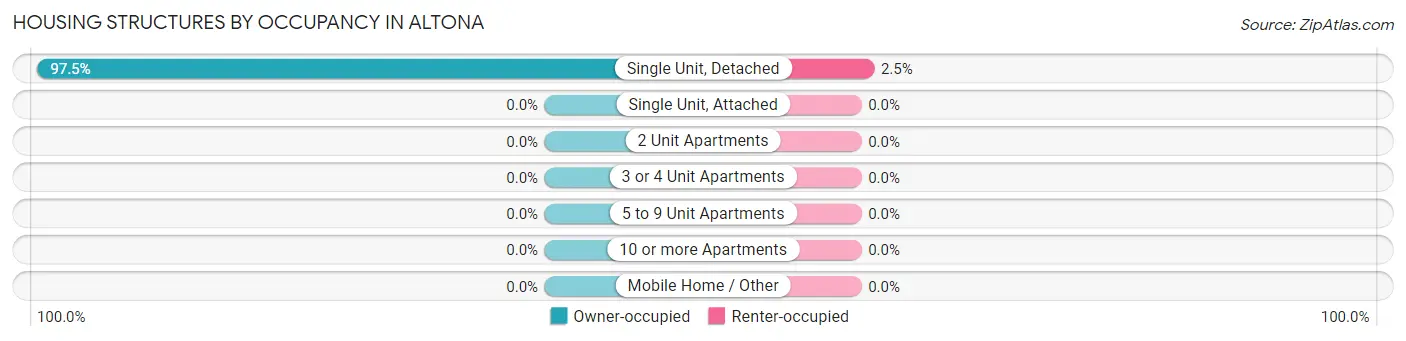
Housing Structures by Occupancy in Altona
| Structure Type | Owner-occupied | Renter-occupied |
| Single Unit, Detached | 238 (97.5%) | 6 (2.5%) |
| Single Unit, Attached | 0 (0.0%) | 0 (0.0%) |
| 2 Unit Apartments | 0 (0.0%) | 0 (0.0%) |
| 3 or 4 Unit Apartments | 0 (0.0%) | 0 (0.0%) |
| 5 to 9 Unit Apartments | 0 (0.0%) | 0 (0.0%) |
| 10 or more Apartments | 0 (0.0%) | 0 (0.0%) |
| Mobile Home / Other | 0 (0.0%) | 0 (0.0%) |
| Total | 238 (97.5%) | 6 (2.5%) |
Housing Structures by Number of Rooms in Altona
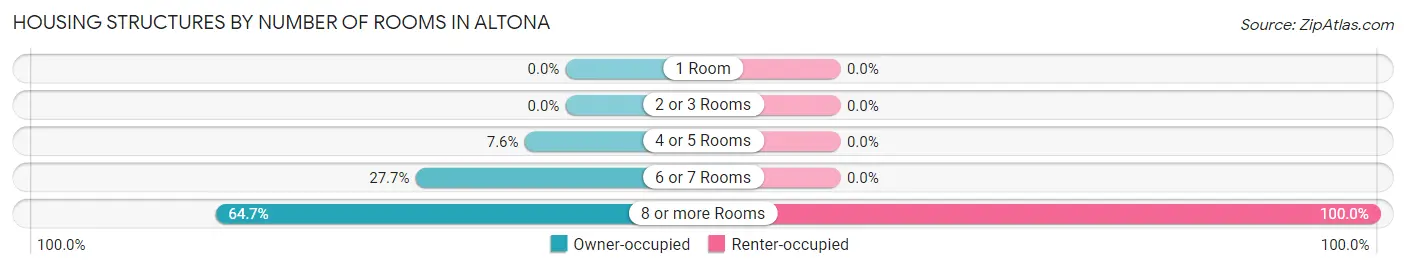
| Number of Rooms | Owner-occupied | Renter-occupied |
| 1 Room | 0 (0.0%) | 0 (0.0%) |
| 2 or 3 Rooms | 0 (0.0%) | 0 (0.0%) |
| 4 or 5 Rooms | 18 (7.6%) | 0 (0.0%) |
| 6 or 7 Rooms | 66 (27.7%) | 0 (0.0%) |
| 8 or more Rooms | 154 (64.7%) | 6 (100.0%) |
| Total | 238 (100.0%) | 6 (100.0%) |
Housing Structure by Heating Type in Altona
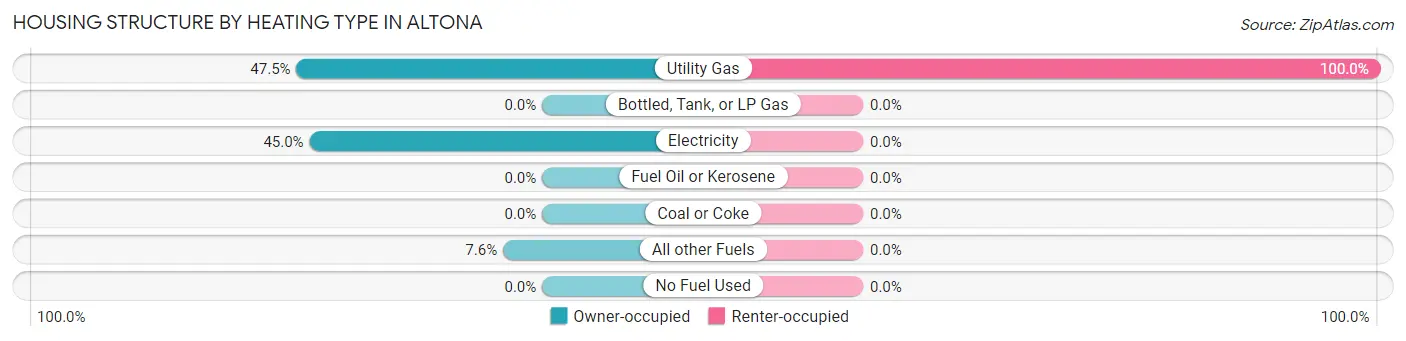
| Heating Type | Owner-occupied | Renter-occupied |
| Utility Gas | 113 (47.5%) | 6 (100.0%) |
| Bottled, Tank, or LP Gas | 0 (0.0%) | 0 (0.0%) |
| Electricity | 107 (45.0%) | 0 (0.0%) |
| Fuel Oil or Kerosene | 0 (0.0%) | 0 (0.0%) |
| Coal or Coke | 0 (0.0%) | 0 (0.0%) |
| All other Fuels | 18 (7.6%) | 0 (0.0%) |
| No Fuel Used | 0 (0.0%) | 0 (0.0%) |
| Total | 238 (100.0%) | 6 (100.0%) |
Household Vehicle Usage in Altona
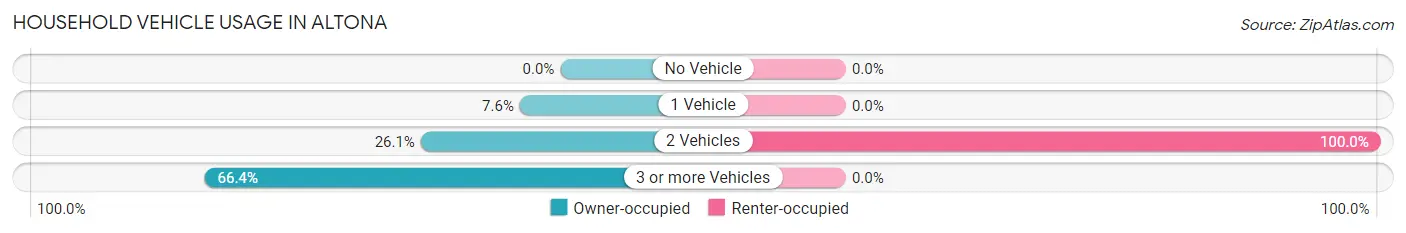
| Vehicles per Household | Owner-occupied | Renter-occupied |
| No Vehicle | 0 (0.0%) | 0 (0.0%) |
| 1 Vehicle | 18 (7.6%) | 0 (0.0%) |
| 2 Vehicles | 62 (26.1%) | 6 (100.0%) |
| 3 or more Vehicles | 158 (66.4%) | 0 (0.0%) |
| Total | 238 (100.0%) | 6 (100.0%) |
Real Estate & Mortgages in Altona
Real Estate and Mortgage Overview in Altona
| Characteristic | Without Mortgage | With Mortgage |
| Housing Units | 92 | 146 |
| Median Property Value | $794,600 | $1,218,800 |
| Median Household Income | $139,063 | $124 |
| Monthly Housing Costs | $1,071 | $127 |
| Real Estate Taxes | $8,393 | $0 |
Property Value by Mortgage Status in Altona
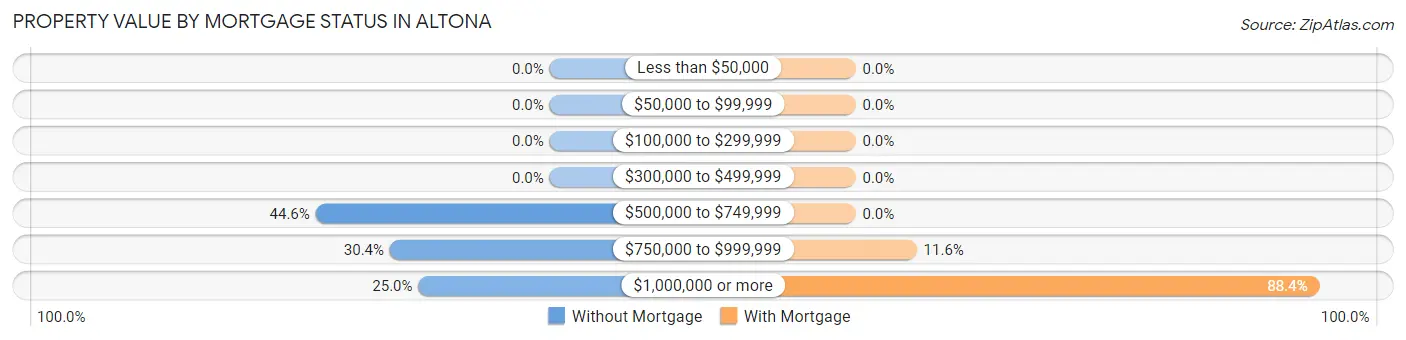
| Property Value | Without Mortgage | With Mortgage |
| Less than $50,000 | 0 (0.0%) | 0 (0.0%) |
| $50,000 to $99,999 | 0 (0.0%) | 0 (0.0%) |
| $100,000 to $299,999 | 0 (0.0%) | 0 (0.0%) |
| $300,000 to $499,999 | 0 (0.0%) | 0 (0.0%) |
| $500,000 to $749,999 | 41 (44.6%) | 0 (0.0%) |
| $750,000 to $999,999 | 28 (30.4%) | 17 (11.6%) |
| $1,000,000 or more | 23 (25.0%) | 129 (88.4%) |
| Total | 92 (100.0%) | 146 (100.0%) |
Household Income by Mortgage Status in Altona
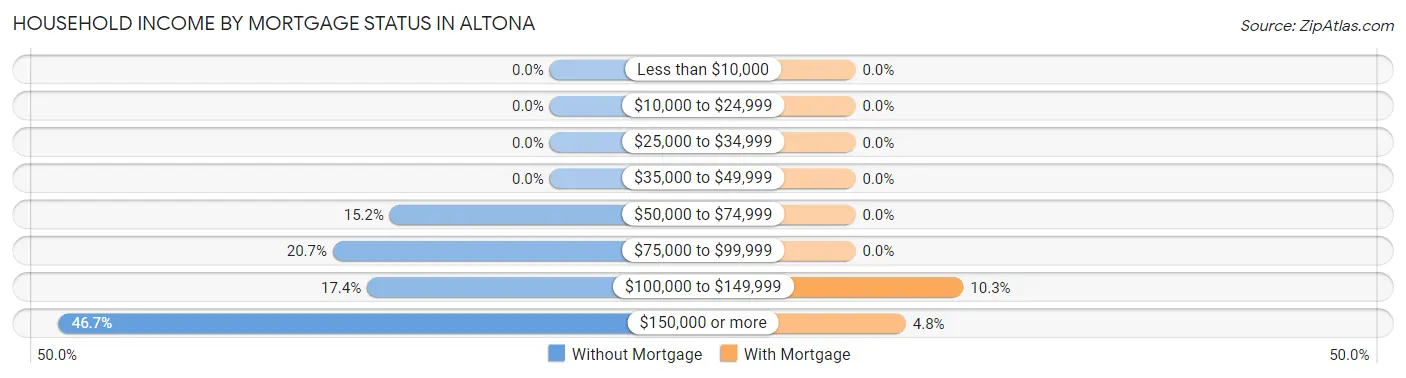
| Household Income | Without Mortgage | With Mortgage |
| Less than $10,000 | 0 (0.0%) | 0 (0.0%) |
| $10,000 to $24,999 | 0 (0.0%) | 0 (0.0%) |
| $25,000 to $34,999 | 0 (0.0%) | 0 (0.0%) |
| $35,000 to $49,999 | 0 (0.0%) | 0 (0.0%) |
| $50,000 to $74,999 | 14 (15.2%) | 0 (0.0%) |
| $75,000 to $99,999 | 19 (20.6%) | 0 (0.0%) |
| $100,000 to $149,999 | 16 (17.4%) | 15 (10.3%) |
| $150,000 or more | 43 (46.7%) | 7 (4.8%) |
| Total | 92 (100.0%) | 146 (100.0%) |
Property Value to Household Income Ratio in Altona
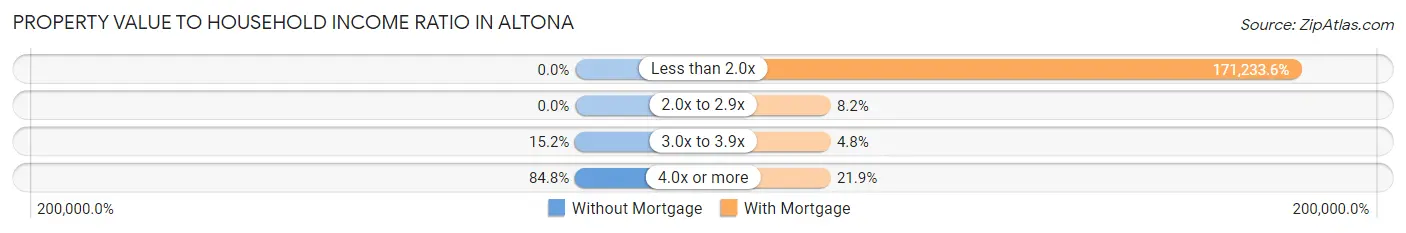
| Value-to-Income Ratio | Without Mortgage | With Mortgage |
| Less than 2.0x | 0 (0.0%) | 250,001 (171,233.6%) |
| 2.0x to 2.9x | 0 (0.0%) | 12 (8.2%) |
| 3.0x to 3.9x | 14 (15.2%) | 7 (4.8%) |
| 4.0x or more | 78 (84.8%) | 32 (21.9%) |
| Total | 92 (100.0%) | 146 (100.0%) |
Real Estate Taxes by Mortgage Status in Altona
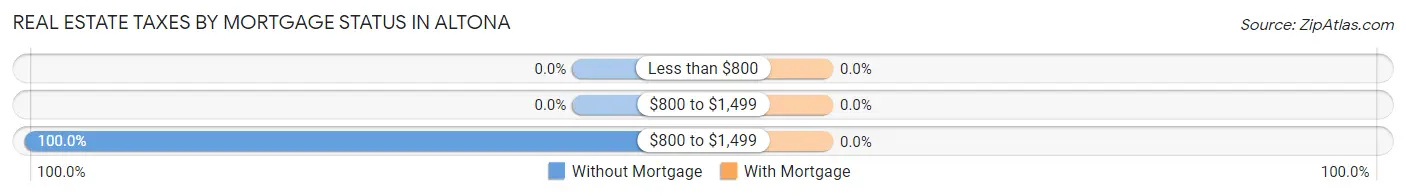
| Property Taxes | Without Mortgage | With Mortgage |
| Less than $800 | 0 (0.0%) | 0 (0.0%) |
| $800 to $1,499 | 0 (0.0%) | 0 (0.0%) |
| $800 to $1,499 | 92 (100.0%) | 0 (0.0%) |
| Total | 92 (100.0%) | 146 (100.0%) |
Health & Disability in Altona
Health Insurance Coverage by Age in Altona
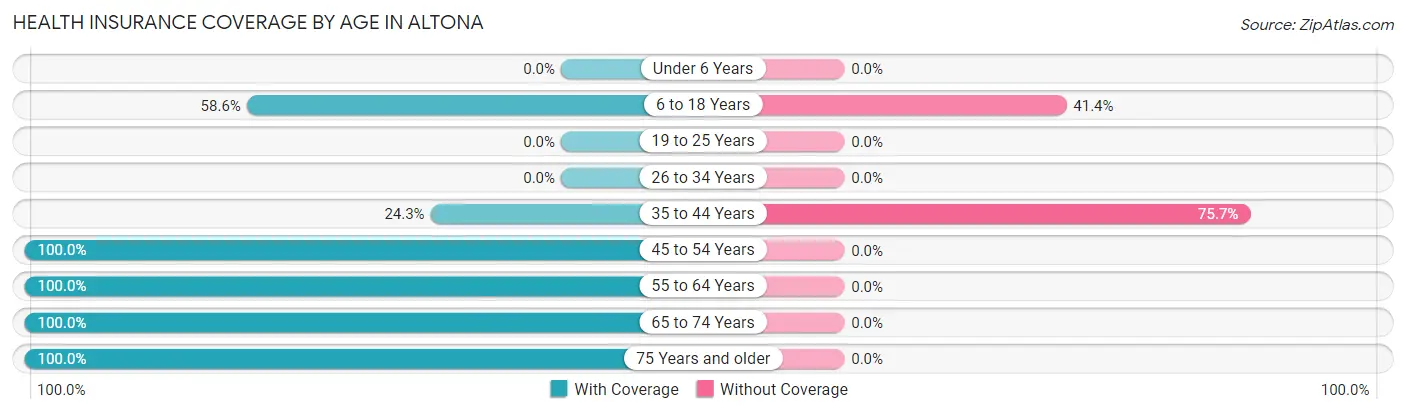
| Age Bracket | With Coverage | Without Coverage |
| Under 6 Years | 0 (0.0%) | 0 (0.0%) |
| 6 to 18 Years | 58 (58.6%) | 41 (41.4%) |
| 19 to 25 Years | 0 (0.0%) | 0 (0.0%) |
| 26 to 34 Years | 0 (0.0%) | 0 (0.0%) |
| 35 to 44 Years | 18 (24.3%) | 56 (75.7%) |
| 45 to 54 Years | 53 (100.0%) | 0 (0.0%) |
| 55 to 64 Years | 104 (100.0%) | 0 (0.0%) |
| 65 to 74 Years | 152 (100.0%) | 0 (0.0%) |
| 75 Years and older | 49 (100.0%) | 0 (0.0%) |
| Total | 434 (81.7%) | 97 (18.3%) |
Health Insurance Coverage by Citizenship Status in Altona
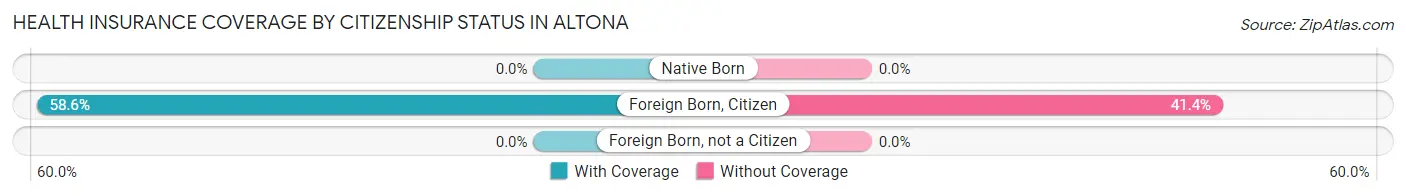
| Citizenship Status | With Coverage | Without Coverage |
| Native Born | 0 (0.0%) | 0 (0.0%) |
| Foreign Born, Citizen | 58 (58.6%) | 41 (41.4%) |
| Foreign Born, not a Citizen | 0 (0.0%) | 0 (0.0%) |
Health Insurance Coverage by Household Income in Altona
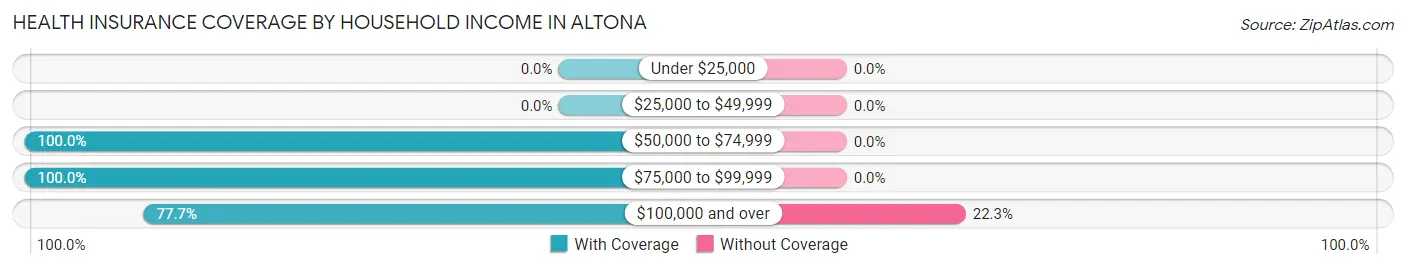
| Household Income | With Coverage | Without Coverage |
| Under $25,000 | 0 (0.0%) | 0 (0.0%) |
| $25,000 to $49,999 | 0 (0.0%) | 0 (0.0%) |
| $50,000 to $74,999 | 28 (100.0%) | 0 (0.0%) |
| $75,000 to $99,999 | 68 (100.0%) | 0 (0.0%) |
| $100,000 and over | 338 (77.7%) | 97 (22.3%) |
Public vs Private Health Insurance Coverage by Age in Altona
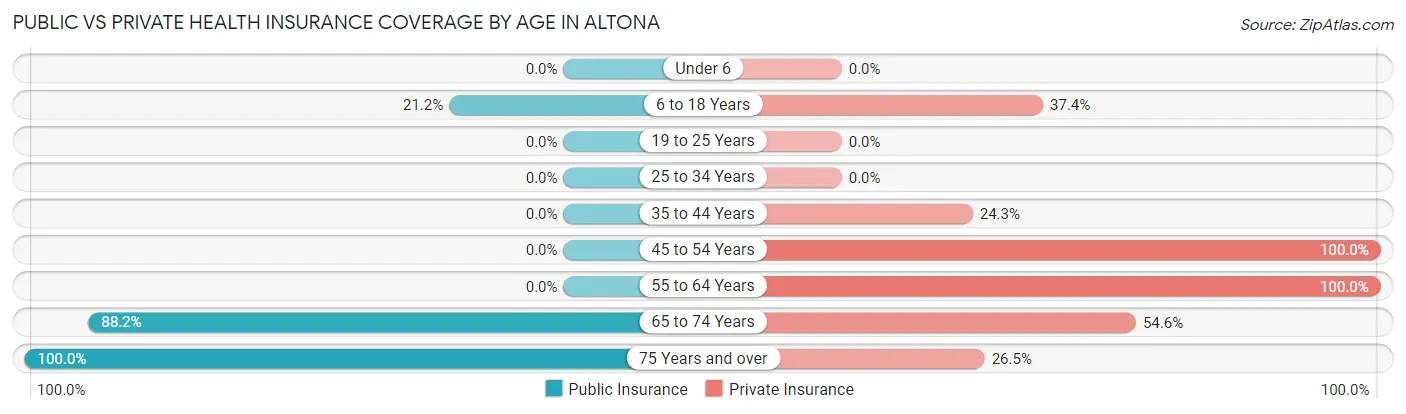
| Age Bracket | Public Insurance | Private Insurance |
| Under 6 | 0 (0.0%) | 0 (0.0%) |
| 6 to 18 Years | 21 (21.2%) | 37 (37.4%) |
| 19 to 25 Years | 0 (0.0%) | 0 (0.0%) |
| 25 to 34 Years | 0 (0.0%) | 0 (0.0%) |
| 35 to 44 Years | 0 (0.0%) | 18 (24.3%) |
| 45 to 54 Years | 0 (0.0%) | 53 (100.0%) |
| 55 to 64 Years | 0 (0.0%) | 104 (100.0%) |
| 65 to 74 Years | 134 (88.2%) | 83 (54.6%) |
| 75 Years and over | 49 (100.0%) | 13 (26.5%) |
| Total | 204 (38.4%) | 308 (58.0%) |
Disability Status by Sex by Age in Altona
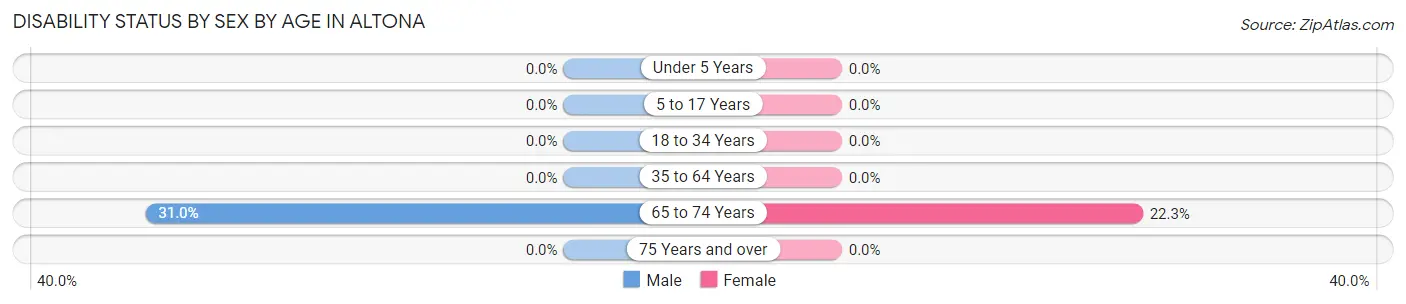
| Age Bracket | Male | Female |
| Under 5 Years | 0 (0.0%) | 0 (0.0%) |
| 5 to 17 Years | 0 (0.0%) | 0 (0.0%) |
| 18 to 34 Years | 0 (0.0%) | 0 (0.0%) |
| 35 to 64 Years | 0 (0.0%) | 0 (0.0%) |
| 65 to 74 Years | 18 (31.0%) | 21 (22.3%) |
| 75 Years and over | 0 (0.0%) | 0 (0.0%) |
Disability Class by Sex by Age in Altona
Disability Class: Hearing Difficulty
| Age Bracket | Male | Female |
| Under 5 Years | 0 (0.0%) | 0 (0.0%) |
| 5 to 17 Years | 0 (0.0%) | 0 (0.0%) |
| 18 to 34 Years | 0 (0.0%) | 0 (0.0%) |
| 35 to 64 Years | 0 (0.0%) | 0 (0.0%) |
| 65 to 74 Years | 0 (0.0%) | 0 (0.0%) |
| 75 Years and over | 0 (0.0%) | 0 (0.0%) |
Disability Class: Vision Difficulty
| Age Bracket | Male | Female |
| Under 5 Years | 0 (0.0%) | 0 (0.0%) |
| 5 to 17 Years | 0 (0.0%) | 0 (0.0%) |
| 18 to 34 Years | 0 (0.0%) | 0 (0.0%) |
| 35 to 64 Years | 0 (0.0%) | 0 (0.0%) |
| 65 to 74 Years | 0 (0.0%) | 0 (0.0%) |
| 75 Years and over | 0 (0.0%) | 0 (0.0%) |
Disability Class: Cognitive Difficulty
| Age Bracket | Male | Female |
| 5 to 17 Years | 0 (0.0%) | 0 (0.0%) |
| 18 to 34 Years | 0 (0.0%) | 0 (0.0%) |
| 35 to 64 Years | 0 (0.0%) | 0 (0.0%) |
| 65 to 74 Years | 0 (0.0%) | 0 (0.0%) |
| 75 Years and over | 0 (0.0%) | 0 (0.0%) |
Disability Class: Ambulatory Difficulty
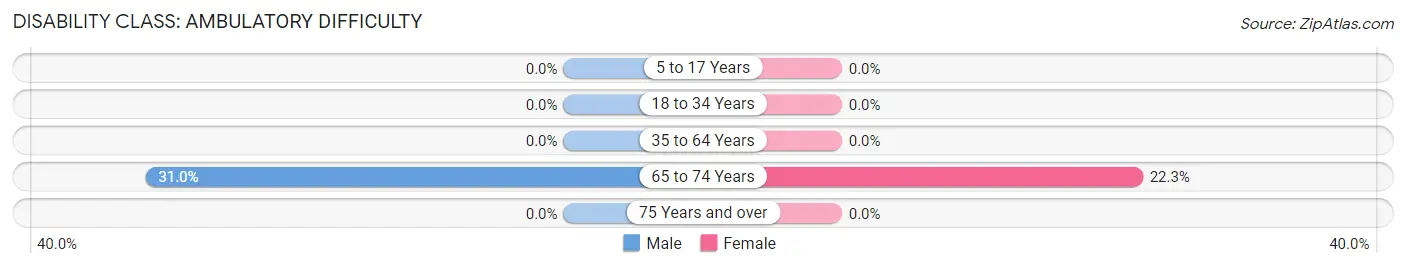
| Age Bracket | Male | Female |
| 5 to 17 Years | 0 (0.0%) | 0 (0.0%) |
| 18 to 34 Years | 0 (0.0%) | 0 (0.0%) |
| 35 to 64 Years | 0 (0.0%) | 0 (0.0%) |
| 65 to 74 Years | 18 (31.0%) | 21 (22.3%) |
| 75 Years and over | 0 (0.0%) | 0 (0.0%) |
Disability Class: Self-Care Difficulty
| Age Bracket | Male | Female |
| 5 to 17 Years | 0 (0.0%) | 0 (0.0%) |
| 18 to 34 Years | 0 (0.0%) | 0 (0.0%) |
| 35 to 64 Years | 0 (0.0%) | 0 (0.0%) |
| 65 to 74 Years | 0 (0.0%) | 0 (0.0%) |
| 75 Years and over | 0 (0.0%) | 0 (0.0%) |
Technology Access in Altona
Computing Device Access in Altona
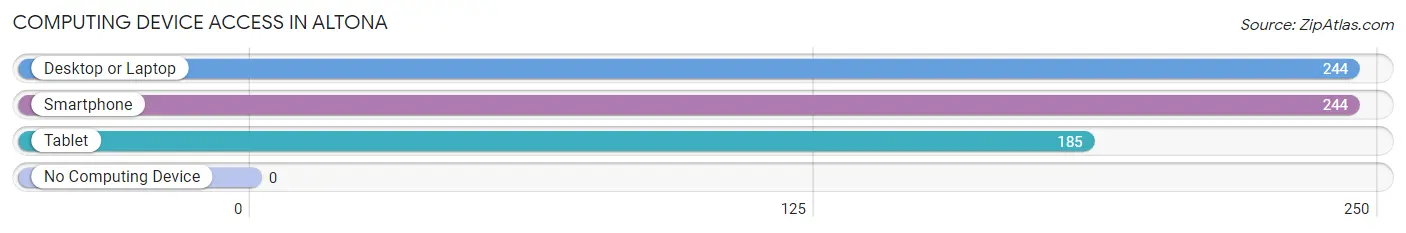
| Device Type | # Households | % Households |
| Desktop or Laptop | 244 | 100.0% |
| Smartphone | 244 | 100.0% |
| Tablet | 185 | 75.8% |
| No Computing Device | 0 | 0.0% |
| Total | 244 | 100.0% |
Internet Access in Altona
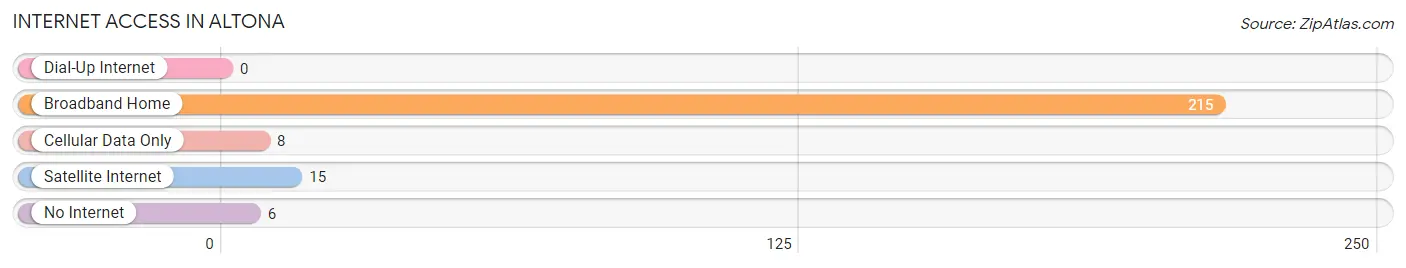
| Internet Type | # Households | % Households |
| Dial-Up Internet | 0 | 0.0% |
| Broadband Home | 215 | 88.1% |
| Cellular Data Only | 8 | 3.3% |
| Satellite Internet | 15 | 6.1% |
| No Internet | 6 | 2.5% |
| Total | 244 | 100.0% |
Altona Summary
Altona is a small town located in the state of Colorado, United States. It is situated in the San Luis Valley, in the south-central part of the state. The town is located at an elevation of 7,845 feet (2,392 m) and has a population of approximately 1,000 people.
History
Altona was founded in 1881 by a group of German immigrants who had come to the area in search of a better life. The town was named after Altona, Germany, the hometown of one of the original settlers. The town quickly grew and by the early 1900s, it had become a thriving agricultural community. The town was home to a variety of businesses, including a general store, a blacksmith shop, a hotel, and a saloon.
Geography
Altona is located in the San Luis Valley, in the south-central part of Colorado. The town is situated at an elevation of 7,845 feet (2,392 m). The area is characterized by its dry climate and high altitude. The town is surrounded by mountains, including the Sangre de Cristo Mountains to the east and the San Juan Mountains to the west.
Economy
Altona’s economy is largely based on agriculture. The town is home to several farms and ranches, which produce a variety of crops, including potatoes, alfalfa, and hay. The town is also home to a number of small businesses, including a general store, a gas station, and a restaurant.
Demographics
As of the 2010 census, Altona had a population of 1,000 people. The town is predominantly white, with approximately 95% of the population identifying as such. The remaining 5% of the population is made up of Hispanic or Latino individuals. The median household income in Altona is $37,500, and the median age is 44.
Conclusion
Altona is a small town located in the San Luis Valley of Colorado. The town was founded in 1881 by a group of German immigrants and has since grown into a thriving agricultural community. The town is characterized by its dry climate and high altitude, and its economy is largely based on agriculture. Altona has a population of 1,000 people, with the majority of the population identifying as white. The median household income in Altona is $37,500, and the median age is 44.
Common Questions
What is Per Capita Income in Altona?
Per Capita income in Altona is $163,096.
What is the Median Family Income in Altona?
Median Family Income in Altona is $250,001.
What is the Median Household income in Altona?
Median Household Income in Altona is $250,001.
What is Inequality or Gini Index in Altona?
Inequality or Gini Index in Altona is 0.47.
What is the Total Population of Altona?
Total Population of Altona is 531.
What is the Total Male Population of Altona?
Total Male Population of Altona is 272.
What is the Total Female Population of Altona?
Total Female Population of Altona is 259.
What is the Ratio of Males per 100 Females in Altona?
There are 105.02 Males per 100 Females in Altona.
What is the Ratio of Females per 100 Males in Altona?
There are 95.22 Females per 100 Males in Altona.
What is the Median Population Age in Altona?
Median Population Age in Altona is 60.8 Years.
What is the Average Family Size in Altona
Average Family Size in Altona is 2.6 People.
What is the Average Household Size in Altona
Average Household Size in Altona is 2.2 People.
How Large is the Labor Force in Altona?
There are 322 People in the Labor Forcein in Altona.
What is the Percentage of People in the Labor Force in Altona?
70.9% of People are in the Labor Force in Altona.