Nampa, ID Map & Demographics
Nampa Map
Nampa Overview
$28,030
PER CAPITA INCOME
$77,621
AVG FAMILY INCOME
$67,346
AVG HOUSEHOLD INCOME
30.8%
WAGE / INCOME GAP [ % ]
69.2¢/ $1
WAGE / INCOME GAP [ $ ]
$10,128
FAMILY INCOME DEFICIT
0.37
INEQUALITY / GINI INDEX
102,598
TOTAL POPULATION
51,219
MALE POPULATION
51,379
FEMALE POPULATION
99.69
MALES / 100 FEMALES
100.31
FEMALES / 100 MALES
33.5
MEDIAN AGE
3.2
AVG FAMILY SIZE
2.8
AVG HOUSEHOLD SIZE
51,476
LABOR FORCE [ PEOPLE ]
64.8%
PERCENT IN LABOR FORCE
3.0%
UNEMPLOYMENT RATE
Nampa Area Codes
Income in Nampa
Income Overview in Nampa
Per Capita Income in Nampa is $28,030, while median incomes of families and households are $77,621 and $67,346 respectively.
| Characteristic | Number | Measure |
| Per Capita Income | 102,598 | $28,030 |
| Median Family Income | 25,413 | $77,621 |
| Mean Family Income | 25,413 | $87,214 |
| Median Household Income | 35,791 | $67,346 |
| Mean Household Income | 35,791 | $78,744 |
| Income Deficit | 25,413 | $10,128 |
| Wage / Income Gap (%) | 102,598 | 30.80% |
| Wage / Income Gap ($) | 102,598 | 69.20¢ per $1 |
| Gini / Inequality Index | 102,598 | 0.37 |
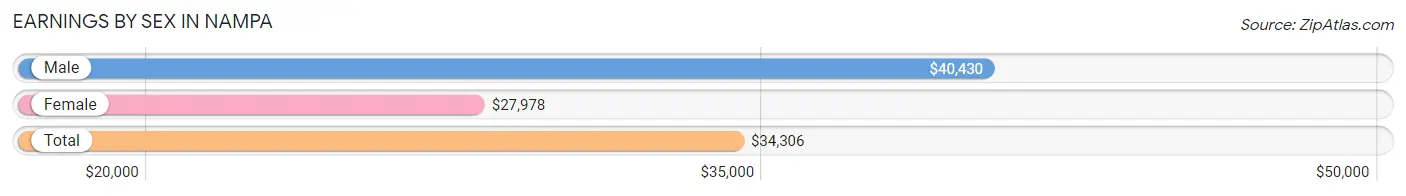
Earnings by Sex in Nampa
Average Earnings in Nampa are $34,306, $40,430 for men and $27,978 for women, a difference of 30.8%.
| Sex | Number | Average Earnings |
| Male | 29,636 (53.2%) | $40,430 |
| Female | 26,048 (46.8%) | $27,978 |
| Total | 55,684 (100.0%) | $34,306 |
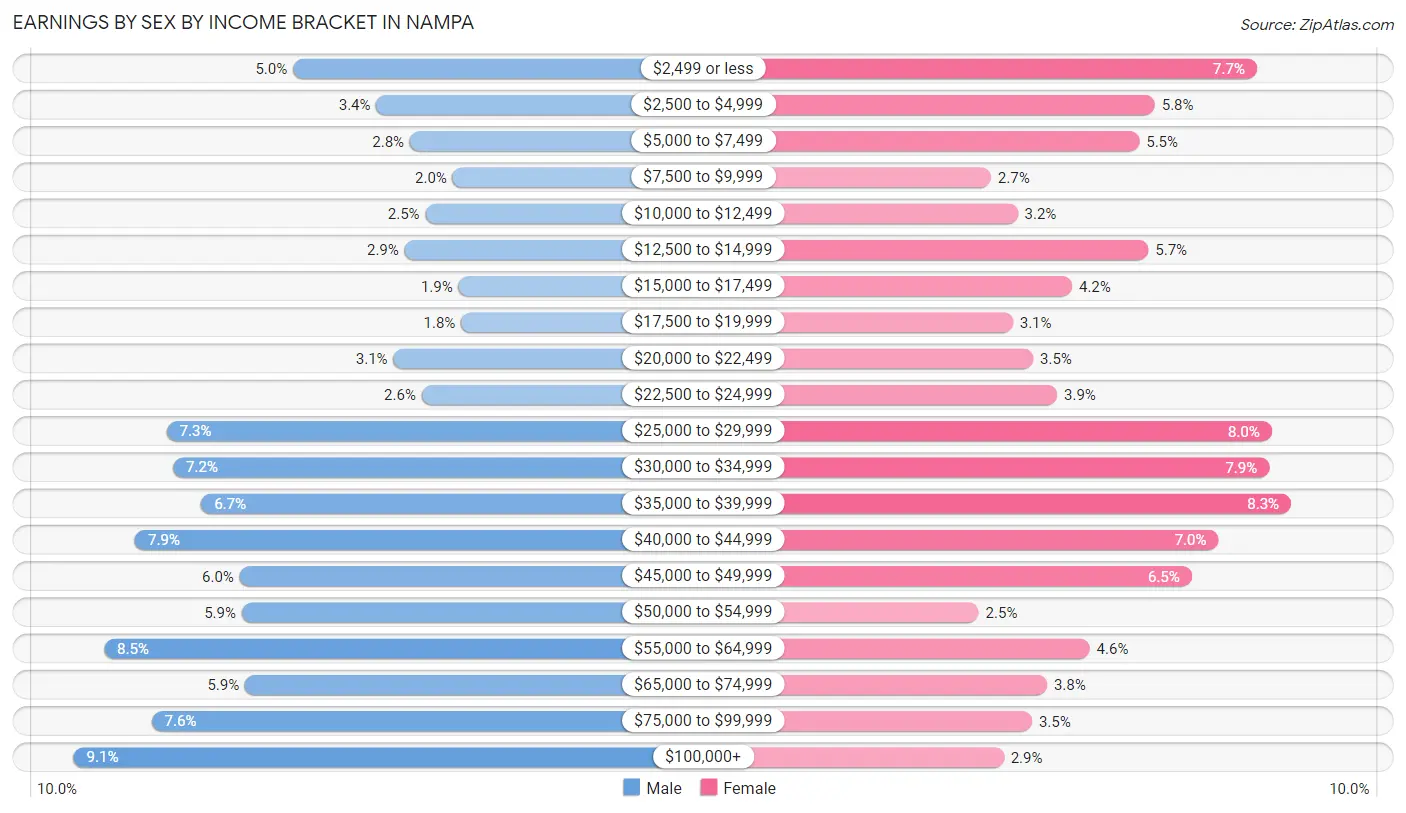
Earnings by Sex by Income Bracket in Nampa
The most common earnings brackets in Nampa are $100,000+ for men (2,691 | 9.1%) and $35,000 to $39,999 for women (2,166 | 8.3%).
| Income | Male | Female |
| $2,499 or less | 1,472 (5.0%) | 2,001 (7.7%) |
| $2,500 to $4,999 | 1,011 (3.4%) | 1,504 (5.8%) |
| $5,000 to $7,499 | 824 (2.8%) | 1,428 (5.5%) |
| $7,500 to $9,999 | 587 (2.0%) | 702 (2.7%) |
| $10,000 to $12,499 | 738 (2.5%) | 833 (3.2%) |
| $12,500 to $14,999 | 854 (2.9%) | 1,471 (5.7%) |
| $15,000 to $17,499 | 554 (1.9%) | 1,099 (4.2%) |
| $17,500 to $19,999 | 539 (1.8%) | 809 (3.1%) |
| $20,000 to $22,499 | 915 (3.1%) | 908 (3.5%) |
| $22,500 to $24,999 | 759 (2.6%) | 1,025 (3.9%) |
| $25,000 to $29,999 | 2,174 (7.3%) | 2,073 (8.0%) |
| $30,000 to $34,999 | 2,139 (7.2%) | 2,061 (7.9%) |
| $35,000 to $39,999 | 1,983 (6.7%) | 2,166 (8.3%) |
| $40,000 to $44,999 | 2,351 (7.9%) | 1,814 (7.0%) |
| $45,000 to $49,999 | 1,769 (6.0%) | 1,682 (6.5%) |
| $50,000 to $54,999 | 1,758 (5.9%) | 643 (2.5%) |
| $55,000 to $64,999 | 2,522 (8.5%) | 1,185 (4.5%) |
| $65,000 to $74,999 | 1,739 (5.9%) | 976 (3.7%) |
| $75,000 to $99,999 | 2,257 (7.6%) | 903 (3.5%) |
| $100,000+ | 2,691 (9.1%) | 765 (2.9%) |
| Total | 29,636 (100.0%) | 26,048 (100.0%) |
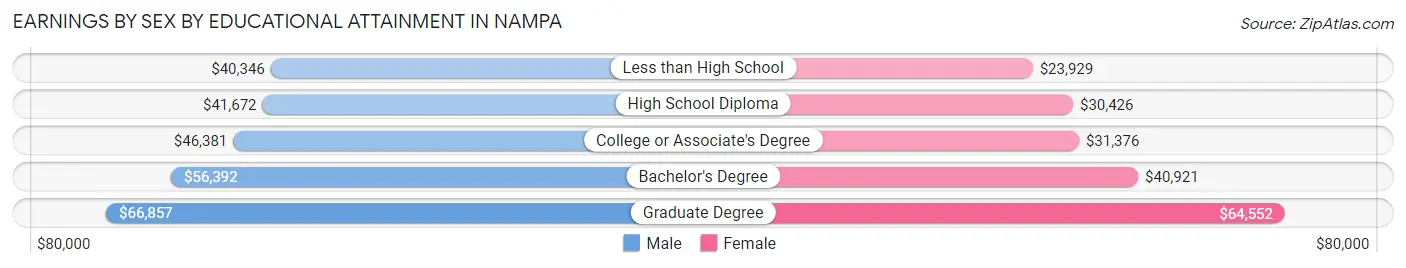
Earnings by Sex by Educational Attainment in Nampa
Average earnings in Nampa are $46,194 for men and $33,080 for women, a difference of 28.4%. Men with an educational attainment of graduate degree enjoy the highest average annual earnings of $66,857, while those with less than high school education earn the least with $40,346. Women with an educational attainment of graduate degree earn the most with the average annual earnings of $64,552, while those with less than high school education have the smallest earnings of $23,929.
| Educational Attainment | Male Income | Female Income |
| Less than High School | $40,346 | $23,929 |
| High School Diploma | $41,672 | $30,426 |
| College or Associate's Degree | $46,381 | $31,376 |
| Bachelor's Degree | $56,392 | $40,921 |
| Graduate Degree | $66,857 | $64,552 |
| Total | $46,194 | $33,080 |
Family Income in Nampa
Family Income Brackets in Nampa
According to the Nampa family income data, there are 5,438 families falling into the $100,000 to $149,999 income range, which is the most common income bracket and makes up 21.4% of all families. Conversely, the $10,000 to $14,999 income bracket is the least frequent group with only 381 families (1.5%) belonging to this category.
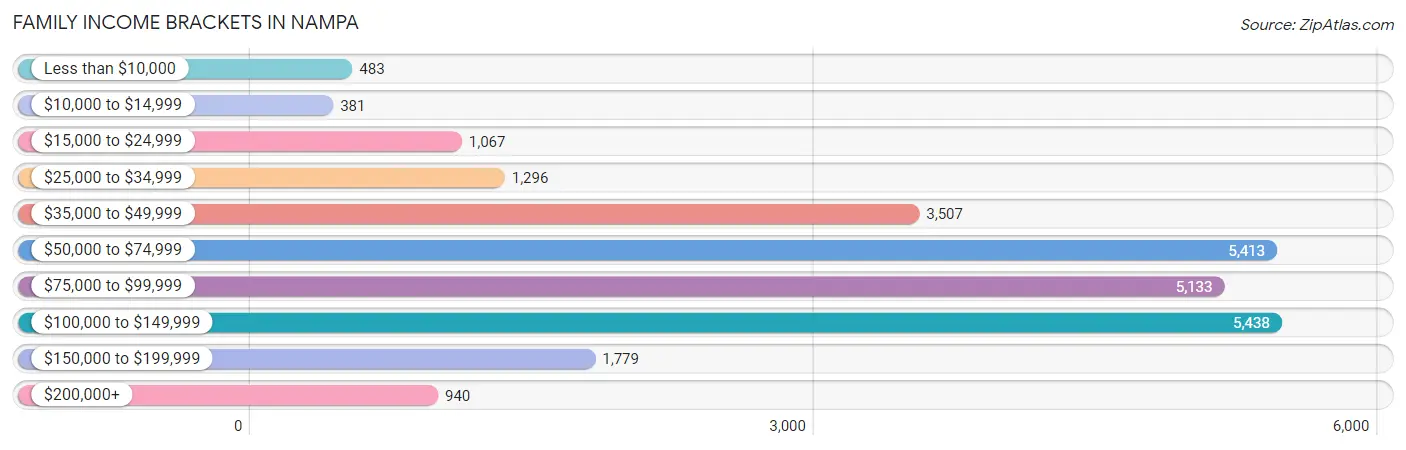
| Income Bracket | # Families | % Families |
| Less than $10,000 | 483 | 1.9% |
| $10,000 to $14,999 | 381 | 1.5% |
| $15,000 to $24,999 | 1,067 | 4.2% |
| $25,000 to $34,999 | 1,296 | 5.1% |
| $35,000 to $49,999 | 3,507 | 13.8% |
| $50,000 to $74,999 | 5,413 | 21.3% |
| $75,000 to $99,999 | 5,133 | 20.2% |
| $100,000 to $149,999 | 5,438 | 21.4% |
| $150,000 to $199,999 | 1,779 | 7.0% |
| $200,000+ | 940 | 3.7% |
Family Income by Famaliy Size in Nampa
5-person families (2,245 | 8.8%) account for the highest median family income in Nampa with $101,262 per family, while 2-person families (10,832 | 42.6%) have the highest median income of $33,432 per family member.
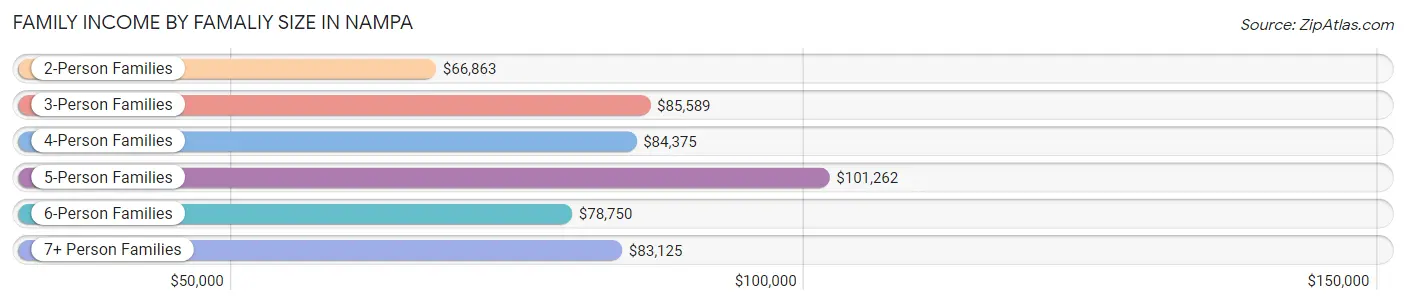
| Income Bracket | # Families | Median Income |
| 2-Person Families | 10,832 (42.6%) | $66,863 |
| 3-Person Families | 5,435 (21.4%) | $85,589 |
| 4-Person Families | 5,261 (20.7%) | $84,375 |
| 5-Person Families | 2,245 (8.8%) | $101,262 |
| 6-Person Families | 1,083 (4.3%) | $78,750 |
| 7+ Person Families | 557 (2.2%) | $83,125 |
| Total | 25,413 (100.0%) | $77,621 |
Family Income by Number of Earners in Nampa
The median family income in Nampa is $77,621, with families comprising 3+ earners (3,450) having the highest median family income of $108,723, while families with 1 earner (7,449) have the lowest median family income of $52,676, accounting for 13.6% and 29.3% of families, respectively.
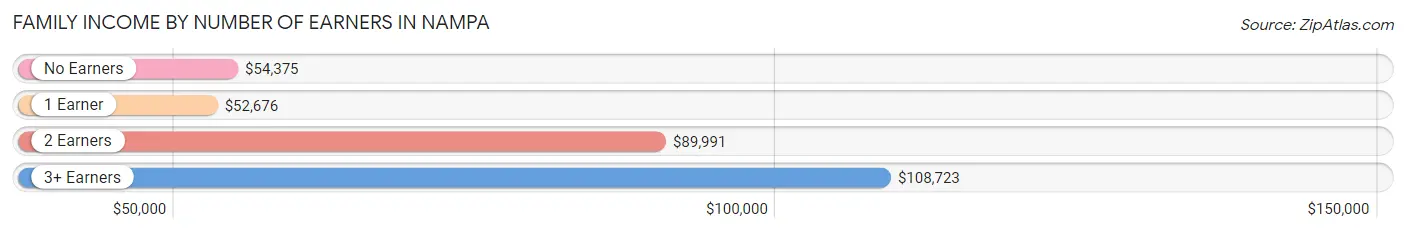
| Number of Earners | # Families | Median Income |
| No Earners | 3,076 (12.1%) | $54,375 |
| 1 Earner | 7,449 (29.3%) | $52,676 |
| 2 Earners | 11,438 (45.0%) | $89,991 |
| 3+ Earners | 3,450 (13.6%) | $108,723 |
| Total | 25,413 (100.0%) | $77,621 |
Household Income in Nampa
Household Income Brackets in Nampa
With 7,838 households falling in the category, the $50,000 to $74,999 income range is the most frequent in Nampa, accounting for 21.9% of all households. In contrast, only 1,038 households (2.9%) fall into the less than $10,000 income bracket, making it the least populous group.
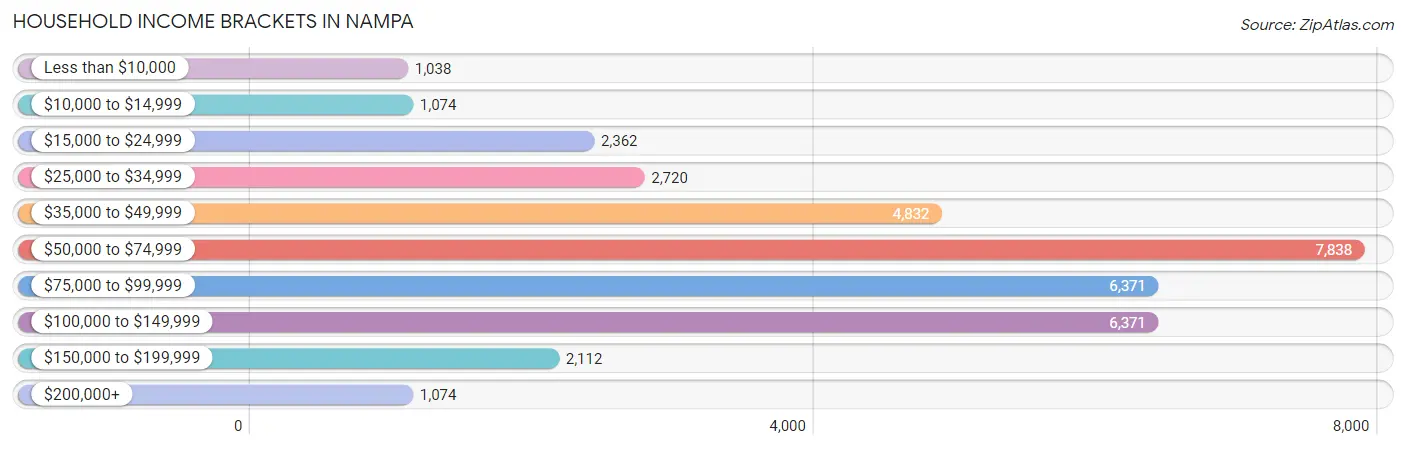
| Income Bracket | # Households | % Households |
| Less than $10,000 | 1,038 | 2.9% |
| $10,000 to $14,999 | 1,074 | 3.0% |
| $15,000 to $24,999 | 2,362 | 6.6% |
| $25,000 to $34,999 | 2,720 | 7.6% |
| $35,000 to $49,999 | 4,832 | 13.5% |
| $50,000 to $74,999 | 7,838 | 21.9% |
| $75,000 to $99,999 | 6,371 | 17.8% |
| $100,000 to $149,999 | 6,371 | 17.8% |
| $150,000 to $199,999 | 2,112 | 5.9% |
| $200,000+ | 1,074 | 3.0% |
Household Income by Householder Age in Nampa
The median household income in Nampa is $67,346, with the highest median household income of $74,050 found in the 45 to 64 years age bracket for the primary householder. A total of 11,791 households (32.9%) fall into this category. Meanwhile, the 65+ years age bracket for the primary householder has the lowest median household income of $54,532, with 8,646 households (24.2%) in this group.
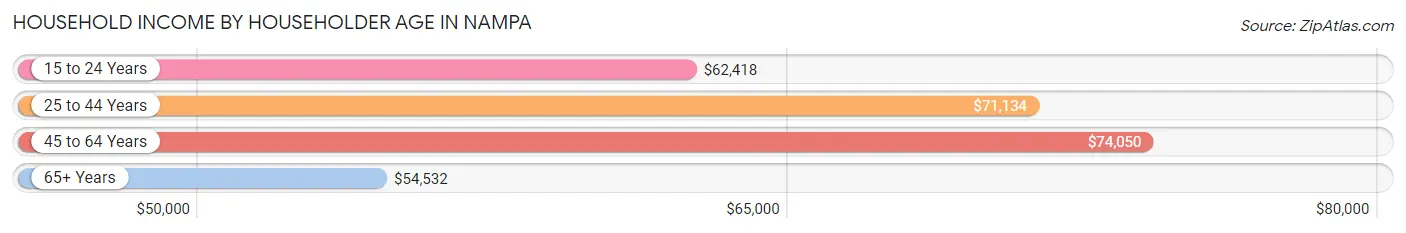
| Income Bracket | # Households | Median Income |
| 15 to 24 Years | 1,973 (5.5%) | $62,418 |
| 25 to 44 Years | 13,381 (37.4%) | $71,134 |
| 45 to 64 Years | 11,791 (32.9%) | $74,050 |
| 65+ Years | 8,646 (24.2%) | $54,532 |
| Total | 35,791 (100.0%) | $67,346 |
Poverty in Nampa
Income Below Poverty by Sex and Age in Nampa
With 9.2% poverty level for males and 12.6% for females among the residents of Nampa, 12 to 14 year old males and 15 year old females are the most vulnerable to poverty, with 277 males (14.0%) and 115 females (22.7%) in their respective age groups living below the poverty level.
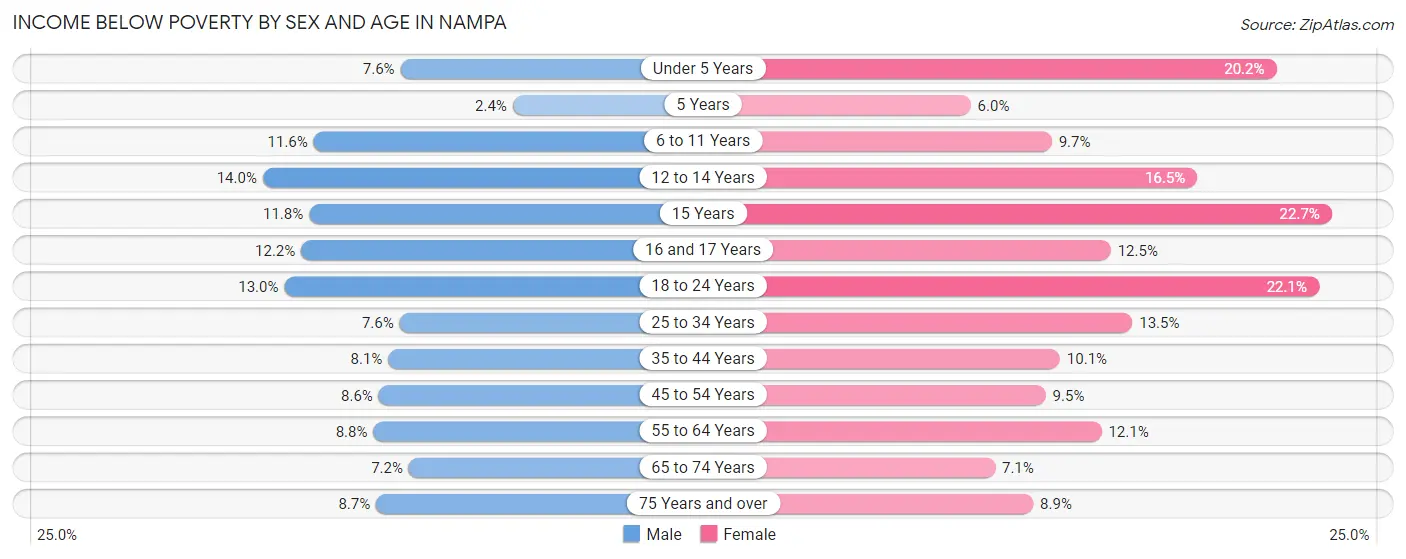
| Age Bracket | Male | Female |
| Under 5 Years | 262 (7.6%) | 662 (20.2%) |
| 5 Years | 20 (2.4%) | 55 (6.0%) |
| 6 to 11 Years | 534 (11.6%) | 401 (9.7%) |
| 12 to 14 Years | 277 (14.0%) | 326 (16.5%) |
| 15 Years | 111 (11.8%) | 115 (22.7%) |
| 16 and 17 Years | 132 (12.2%) | 181 (12.5%) |
| 18 to 24 Years | 717 (13.0%) | 1,050 (22.1%) |
| 25 to 34 Years | 626 (7.6%) | 1,063 (13.5%) |
| 35 to 44 Years | 518 (8.1%) | 690 (10.1%) |
| 45 to 54 Years | 497 (8.6%) | 532 (9.5%) |
| 55 to 64 Years | 417 (8.8%) | 586 (12.0%) |
| 65 to 74 Years | 293 (7.2%) | 336 (7.1%) |
| 75 Years and over | 196 (8.7%) | 269 (8.9%) |
| Total | 4,600 (9.2%) | 6,266 (12.6%) |
Income Above Poverty by Sex and Age in Nampa
According to the poverty statistics in Nampa, males aged 5 years and females aged 5 years are the age groups that are most secure financially, with 97.7% of males and 94.0% of females in these age groups living above the poverty line.
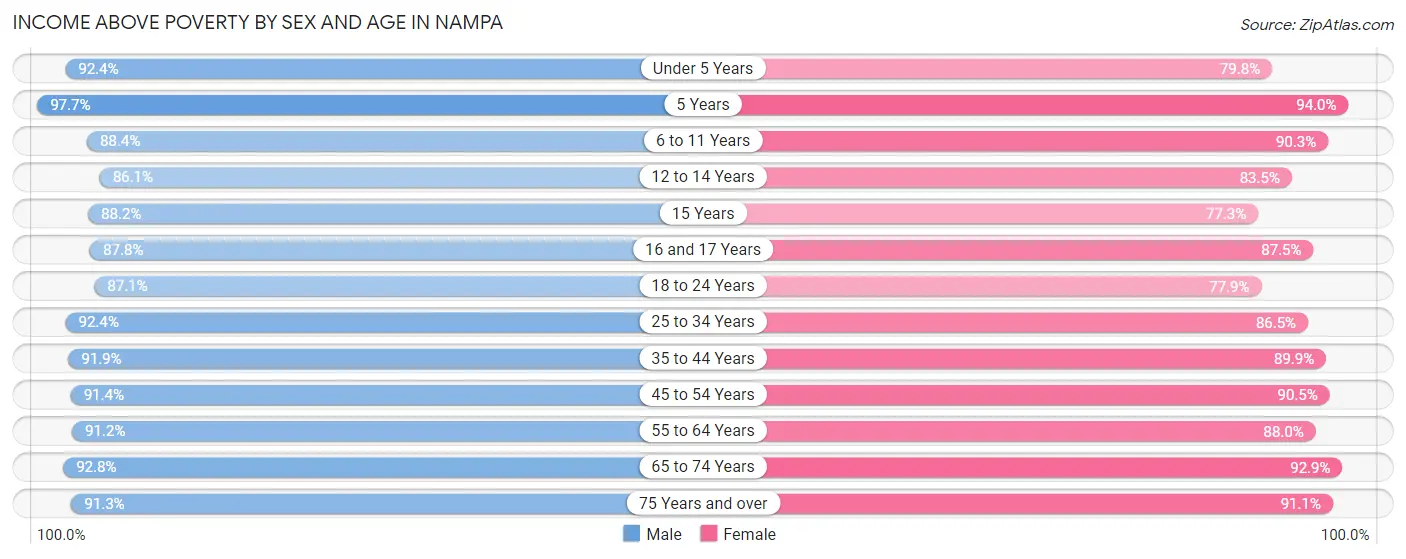
| Age Bracket | Male | Female |
| Under 5 Years | 3,203 (92.4%) | 2,621 (79.8%) |
| 5 Years | 830 (97.7%) | 864 (94.0%) |
| 6 to 11 Years | 4,075 (88.4%) | 3,718 (90.3%) |
| 12 to 14 Years | 1,708 (86.1%) | 1,651 (83.5%) |
| 15 Years | 830 (88.2%) | 391 (77.3%) |
| 16 and 17 Years | 953 (87.8%) | 1,269 (87.5%) |
| 18 to 24 Years | 4,820 (87.1%) | 3,695 (77.9%) |
| 25 to 34 Years | 7,616 (92.4%) | 6,825 (86.5%) |
| 35 to 44 Years | 5,855 (91.9%) | 6,127 (89.9%) |
| 45 to 54 Years | 5,302 (91.4%) | 5,093 (90.5%) |
| 55 to 64 Years | 4,310 (91.2%) | 4,278 (87.9%) |
| 65 to 74 Years | 3,791 (92.8%) | 4,390 (92.9%) |
| 75 Years and over | 2,059 (91.3%) | 2,759 (91.1%) |
| Total | 45,352 (90.8%) | 43,681 (87.5%) |
Income Below Poverty Among Married-Couple Families in Nampa
The poverty statistics for married-couple families in Nampa show that 4.9% or 911 of the total 18,586 families live below the poverty line. Families with 5 or more children have the highest poverty rate of 22.2%, comprising of 56 families. On the other hand, families with no children have the lowest poverty rate of 3.1%, which includes 293 families.
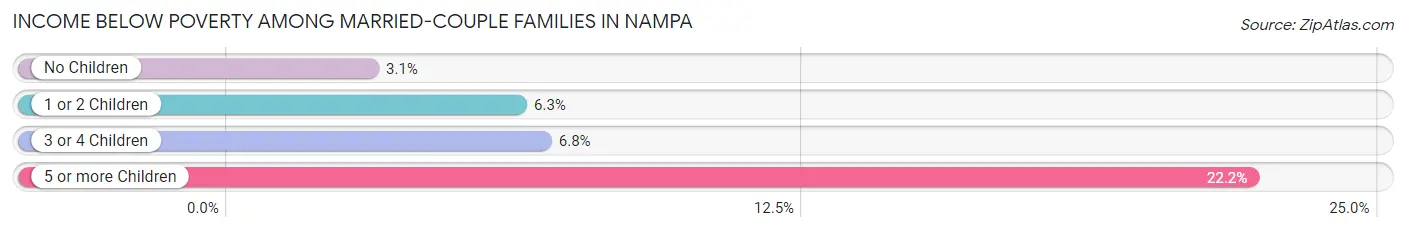
| Children | Above Poverty | Below Poverty |
| No Children | 9,251 (96.9%) | 293 (3.1%) |
| 1 or 2 Children | 6,632 (93.7%) | 445 (6.3%) |
| 3 or 4 Children | 1,596 (93.2%) | 117 (6.8%) |
| 5 or more Children | 196 (77.8%) | 56 (22.2%) |
| Total | 17,675 (95.1%) | 911 (4.9%) |
Income Below Poverty Among Single-Parent Households in Nampa
According to the poverty data in Nampa, 3.0% or 74 single-father households and 18.6% or 809 single-mother households are living below the poverty line. Among single-father households, those with 1 or 2 children have the highest poverty rate, with 43 households (3.3%) experiencing poverty. Likewise, among single-mother households, those with 5 or more children have the highest poverty rate, with 57 households (98.3%) falling below the poverty line.
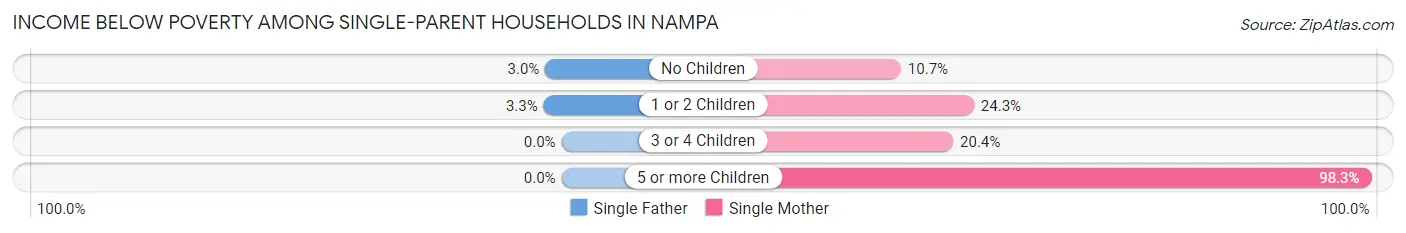
| Children | Single Father | Single Mother |
| No Children | 31 (3.0%) | 204 (10.7%) |
| 1 or 2 Children | 43 (3.3%) | 411 (24.3%) |
| 3 or 4 Children | 0 (0.0%) | 137 (20.4%) |
| 5 or more Children | 0 (0.0%) | 57 (98.3%) |
| Total | 74 (3.0%) | 809 (18.6%) |
Income Below Poverty Among Married-Couple vs Single-Parent Households in Nampa
The poverty data for Nampa shows that 911 of the married-couple family households (4.9%) and 883 of the single-parent households (12.9%) are living below the poverty level. Within the married-couple family households, those with 5 or more children have the highest poverty rate, with 56 households (22.2%) falling below the poverty line. Among the single-parent households, those with 5 or more children have the highest poverty rate, with 57 household (72.2%) living below poverty.
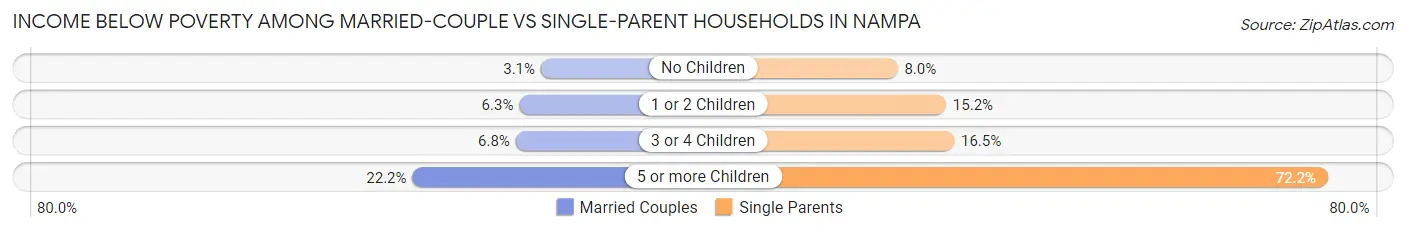
| Children | Married-Couple Families | Single-Parent Households |
| No Children | 293 (3.1%) | 235 (8.0%) |
| 1 or 2 Children | 445 (6.3%) | 454 (15.2%) |
| 3 or 4 Children | 117 (6.8%) | 137 (16.5%) |
| 5 or more Children | 56 (22.2%) | 57 (72.2%) |
| Total | 911 (4.9%) | 883 (12.9%) |
Race in Nampa
The most populous races in Nampa are White / Caucasian (78,803 | 76.8%), Hispanic or Latino (25,929 | 25.3%), and Some other Race (10,867 | 10.6%).
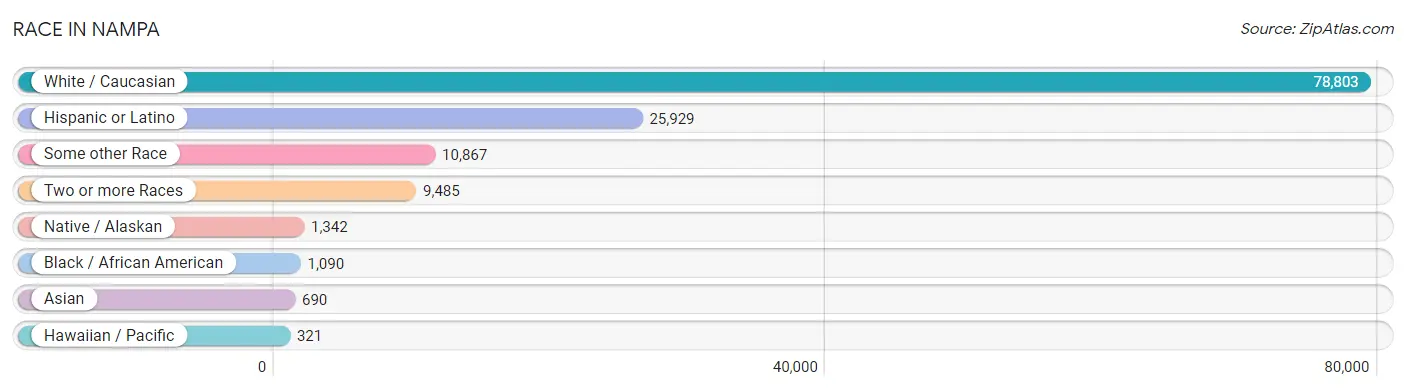
| Race | # Population | % Population |
| Asian | 690 | 0.7% |
| Black / African American | 1,090 | 1.1% |
| Hawaiian / Pacific | 321 | 0.3% |
| Hispanic or Latino | 25,929 | 25.3% |
| Native / Alaskan | 1,342 | 1.3% |
| White / Caucasian | 78,803 | 76.8% |
| Two or more Races | 9,485 | 9.2% |
| Some other Race | 10,867 | 10.6% |
| Total | 102,598 | 100.0% |
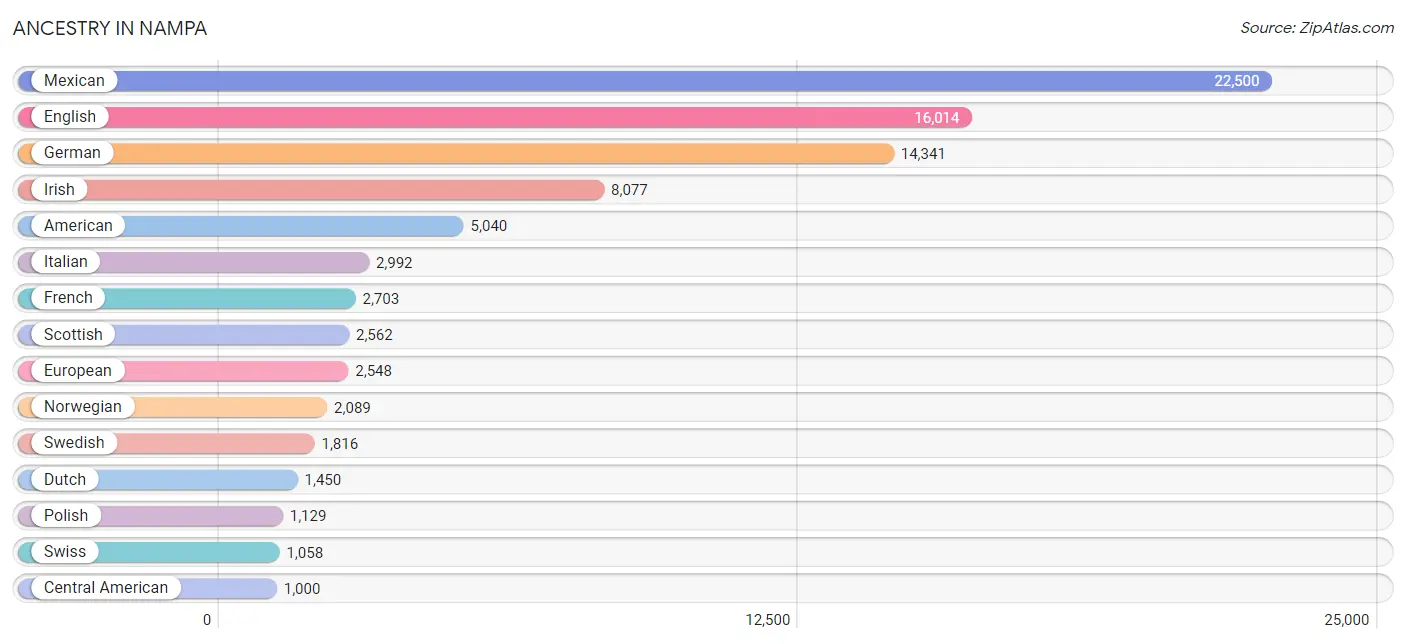
Ancestry in Nampa
The most populous ancestries reported in Nampa are Mexican (22,500 | 21.9%), English (16,014 | 15.6%), German (14,341 | 14.0%), Irish (8,077 | 7.9%), and American (5,040 | 4.9%), together accounting for 64.3% of all Nampa residents.
| Ancestry | # Population | % Population |
| African | 37 | 0.0% |
| American | 5,040 | 4.9% |
| Apache | 38 | 0.0% |
| Arab | 107 | 0.1% |
| Argentinean | 12 | 0.0% |
| Armenian | 34 | 0.0% |
| Austrian | 103 | 0.1% |
| Basque | 154 | 0.2% |
| Belgian | 68 | 0.1% |
| Bhutanese | 215 | 0.2% |
| Blackfeet | 114 | 0.1% |
| Bolivian | 22 | 0.0% |
| Brazilian | 177 | 0.2% |
| British | 334 | 0.3% |
| Burmese | 75 | 0.1% |
| Canadian | 176 | 0.2% |
| Central American | 1,000 | 1.0% |
| Cherokee | 296 | 0.3% |
| Chickasaw | 19 | 0.0% |
| Chinese | 55 | 0.1% |
| Chippewa | 11 | 0.0% |
| Choctaw | 101 | 0.1% |
| Colombian | 258 | 0.3% |
| Costa Rican | 23 | 0.0% |
| Creek | 14 | 0.0% |
| Croatian | 90 | 0.1% |
| Cuban | 70 | 0.1% |
| Czech | 225 | 0.2% |
| Czechoslovakian | 49 | 0.1% |
| Danish | 892 | 0.9% |
| Dominican | 18 | 0.0% |
| Dutch | 1,450 | 1.4% |
| Eastern European | 64 | 0.1% |
| English | 16,014 | 15.6% |
| European | 2,548 | 2.5% |
| Finnish | 156 | 0.2% |
| French | 2,703 | 2.6% |
| French Canadian | 382 | 0.4% |
| German | 14,341 | 14.0% |
| Greek | 475 | 0.5% |
| Guamanian / Chamorro | 36 | 0.0% |
| Guatemalan | 256 | 0.3% |
| Haitian | 29 | 0.0% |
| Honduran | 183 | 0.2% |
| Hungarian | 226 | 0.2% |
| Icelander | 25 | 0.0% |
| Indian (Asian) | 199 | 0.2% |
| Iranian | 18 | 0.0% |
| Irish | 8,077 | 7.9% |
| Italian | 2,992 | 2.9% |
| Japanese | 13 | 0.0% |
| Korean | 587 | 0.6% |
| Lithuanian | 37 | 0.0% |
| Luxembourger | 48 | 0.1% |
| Malaysian | 140 | 0.1% |
| Mexican | 22,500 | 21.9% |
| Mexican American Indian | 462 | 0.4% |
| Mongolian | 6 | 0.0% |
| Moroccan | 7 | 0.0% |
| Native Hawaiian | 383 | 0.4% |
| Navajo | 296 | 0.3% |
| New Zealander | 32 | 0.0% |
| Nigerian | 182 | 0.2% |
| Northern European | 206 | 0.2% |
| Norwegian | 2,089 | 2.0% |
| Osage | 37 | 0.0% |
| Pakistani | 148 | 0.1% |
| Pennsylvania German | 13 | 0.0% |
| Peruvian | 114 | 0.1% |
| Polish | 1,129 | 1.1% |
| Portuguese | 504 | 0.5% |
| Pueblo | 9 | 0.0% |
| Puerto Rican | 960 | 0.9% |
| Romanian | 55 | 0.1% |
| Russian | 399 | 0.4% |
| Salvadoran | 538 | 0.5% |
| Samoan | 21 | 0.0% |
| Scandinavian | 404 | 0.4% |
| Scotch-Irish | 701 | 0.7% |
| Scottish | 2,562 | 2.5% |
| Serbian | 5 | 0.0% |
| Shoshone | 5 | 0.0% |
| Sioux | 101 | 0.1% |
| Slovak | 38 | 0.0% |
| Slovene | 47 | 0.1% |
| South African | 4 | 0.0% |
| South American | 640 | 0.6% |
| South American Indian | 43 | 0.0% |
| Spaniard | 189 | 0.2% |
| Spanish | 83 | 0.1% |
| Spanish American | 55 | 0.1% |
| Spanish American Indian | 65 | 0.1% |
| Sri Lankan | 213 | 0.2% |
| Subsaharan African | 248 | 0.2% |
| Swedish | 1,816 | 1.8% |
| Swiss | 1,058 | 1.0% |
| Thai | 48 | 0.1% |
| Tongan | 32 | 0.0% |
| Ukrainian | 553 | 0.5% |
| Uruguayan | 9 | 0.0% |
| Venezuelan | 225 | 0.2% |
| Welsh | 887 | 0.9% |
| West Indian | 18 | 0.0% |
| Yaqui | 5 | 0.0% |
| Yugoslavian | 68 | 0.1% | View All 105 Rows |
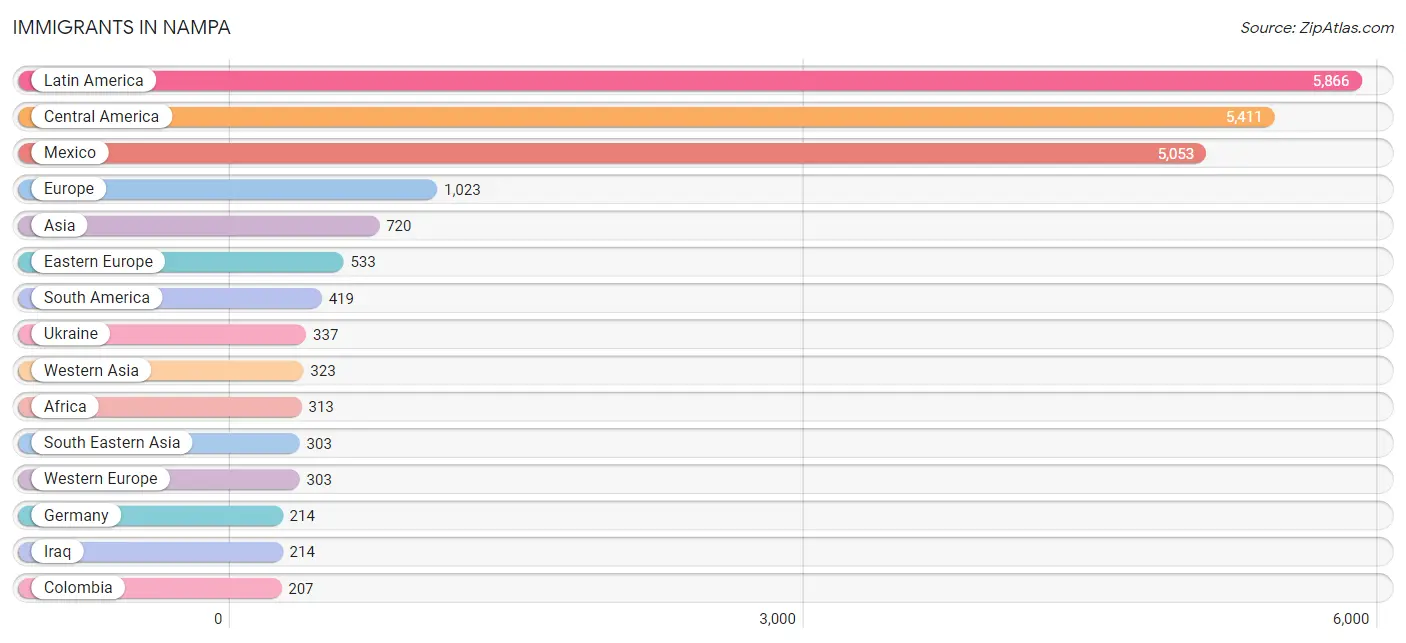
Immigrants in Nampa
The most numerous immigrant groups reported in Nampa came from Latin America (5,866 | 5.7%), Central America (5,411 | 5.3%), Mexico (5,053 | 4.9%), Europe (1,023 | 1.0%), and Asia (720 | 0.7%), together accounting for 17.6% of all Nampa residents.
| Immigration Origin | # Population | % Population |
| Africa | 313 | 0.3% |
| Asia | 720 | 0.7% |
| Azores | 9 | 0.0% |
| Bolivia | 22 | 0.0% |
| Bosnia and Herzegovina | 11 | 0.0% |
| Brazil | 76 | 0.1% |
| Canada | 59 | 0.1% |
| Caribbean | 36 | 0.0% |
| Central America | 5,411 | 5.3% |
| China | 26 | 0.0% |
| Colombia | 207 | 0.2% |
| Congo | 15 | 0.0% |
| Costa Rica | 63 | 0.1% |
| Dominican Republic | 36 | 0.0% |
| Eastern Africa | 62 | 0.1% |
| Eastern Asia | 45 | 0.0% |
| Eastern Europe | 533 | 0.5% |
| El Salvador | 94 | 0.1% |
| England | 114 | 0.1% |
| Ethiopia | 62 | 0.1% |
| Europe | 1,023 | 1.0% |
| France | 71 | 0.1% |
| Germany | 214 | 0.2% |
| Guatemala | 116 | 0.1% |
| Honduras | 85 | 0.1% |
| Hungary | 43 | 0.0% |
| Indonesia | 17 | 0.0% |
| Iraq | 214 | 0.2% |
| Italy | 12 | 0.0% |
| Japan | 9 | 0.0% |
| Korea | 10 | 0.0% |
| Laos | 27 | 0.0% |
| Latin America | 5,866 | 5.7% |
| Latvia | 13 | 0.0% |
| Mexico | 5,053 | 4.9% |
| Middle Africa | 40 | 0.0% |
| Morocco | 7 | 0.0% |
| Netherlands | 13 | 0.0% |
| Nigeria | 102 | 0.1% |
| Northern Africa | 14 | 0.0% |
| Northern Europe | 157 | 0.2% |
| Norway | 24 | 0.0% |
| Oceania | 13 | 0.0% |
| Peru | 70 | 0.1% |
| Philippines | 66 | 0.1% |
| Portugal | 9 | 0.0% |
| Romania | 28 | 0.0% |
| Russia | 101 | 0.1% |
| Saudi Arabia | 9 | 0.0% |
| Sierra Leone | 23 | 0.0% |
| South America | 419 | 0.4% |
| South Central Asia | 49 | 0.1% |
| South Eastern Asia | 303 | 0.3% |
| Southern Europe | 30 | 0.0% |
| Spain | 9 | 0.0% |
| Sudan | 7 | 0.0% |
| Switzerland | 5 | 0.0% |
| Syria | 100 | 0.1% |
| Taiwan | 3 | 0.0% |
| Thailand | 10 | 0.0% |
| Ukraine | 337 | 0.3% |
| Uruguay | 9 | 0.0% |
| Uzbekistan | 49 | 0.1% |
| Venezuela | 35 | 0.0% |
| Vietnam | 171 | 0.2% |
| Western Africa | 125 | 0.1% |
| Western Asia | 323 | 0.3% |
| Western Europe | 303 | 0.3% |
| Zaire | 25 | 0.0% | View All 69 Rows |
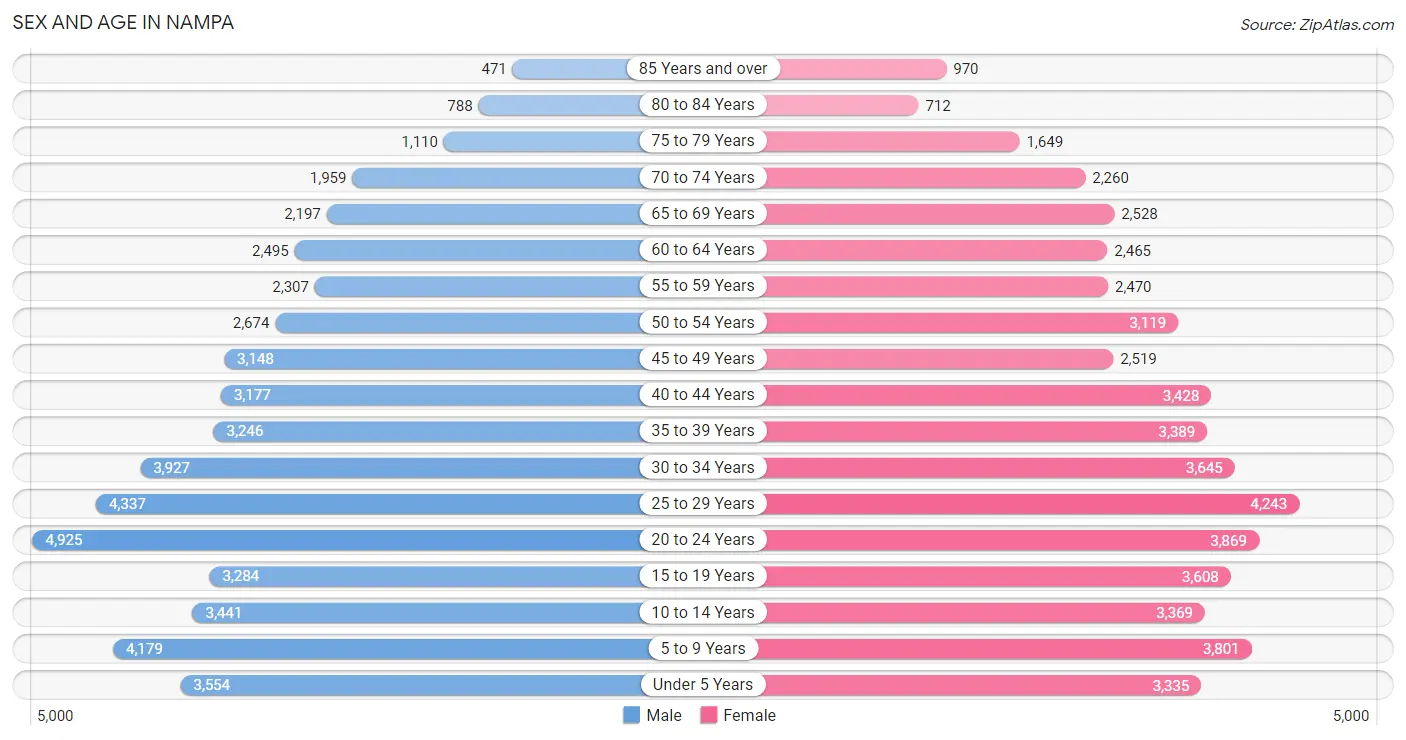
Sex and Age in Nampa
Sex and Age in Nampa
The most populous age groups in Nampa are 20 to 24 Years (4,925 | 9.6%) for men and 25 to 29 Years (4,243 | 8.3%) for women.
| Age Bracket | Male | Female |
| Under 5 Years | 3,554 (6.9%) | 3,335 (6.5%) |
| 5 to 9 Years | 4,179 (8.2%) | 3,801 (7.4%) |
| 10 to 14 Years | 3,441 (6.7%) | 3,369 (6.6%) |
| 15 to 19 Years | 3,284 (6.4%) | 3,608 (7.0%) |
| 20 to 24 Years | 4,925 (9.6%) | 3,869 (7.5%) |
| 25 to 29 Years | 4,337 (8.5%) | 4,243 (8.3%) |
| 30 to 34 Years | 3,927 (7.7%) | 3,645 (7.1%) |
| 35 to 39 Years | 3,246 (6.3%) | 3,389 (6.6%) |
| 40 to 44 Years | 3,177 (6.2%) | 3,428 (6.7%) |
| 45 to 49 Years | 3,148 (6.1%) | 2,519 (4.9%) |
| 50 to 54 Years | 2,674 (5.2%) | 3,119 (6.1%) |
| 55 to 59 Years | 2,307 (4.5%) | 2,470 (4.8%) |
| 60 to 64 Years | 2,495 (4.9%) | 2,465 (4.8%) |
| 65 to 69 Years | 2,197 (4.3%) | 2,528 (4.9%) |
| 70 to 74 Years | 1,959 (3.8%) | 2,260 (4.4%) |
| 75 to 79 Years | 1,110 (2.2%) | 1,649 (3.2%) |
| 80 to 84 Years | 788 (1.5%) | 712 (1.4%) |
| 85 Years and over | 471 (0.9%) | 970 (1.9%) |
| Total | 51,219 (100.0%) | 51,379 (100.0%) |
Families and Households in Nampa
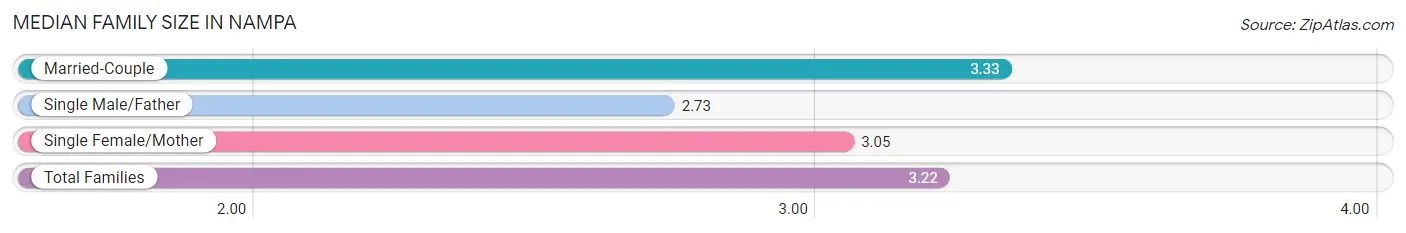
Median Family Size in Nampa
The median family size in Nampa is 3.22 persons per family, with married-couple families (18,586 | 73.1%) accounting for the largest median family size of 3.33 persons per family. On the other hand, single male/father families (2,489 | 9.8%) represent the smallest median family size with 2.73 persons per family.
| Family Type | # Families | Family Size |
| Married-Couple | 18,586 (73.1%) | 3.33 |
| Single Male/Father | 2,489 (9.8%) | 2.73 |
| Single Female/Mother | 4,338 (17.1%) | 3.05 |
| Total Families | 25,413 (100.0%) | 3.22 |
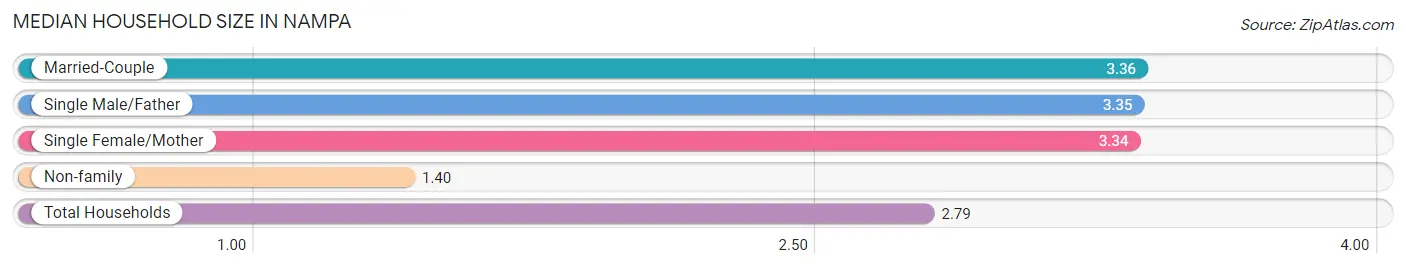
Median Household Size in Nampa
The median household size in Nampa is 2.79 persons per household, with married-couple households (18,586 | 51.9%) accounting for the largest median household size of 3.36 persons per household. non-family households (10,378 | 29.0%) represent the smallest median household size with 1.40 persons per household.
| Household Type | # Households | Household Size |
| Married-Couple | 18,586 (51.9%) | 3.36 |
| Single Male/Father | 2,489 (7.0%) | 3.35 |
| Single Female/Mother | 4,338 (12.1%) | 3.34 |
| Non-family | 10,378 (29.0%) | 1.40 |
| Total Households | 35,791 (100.0%) | 2.79 |
Household Size by Marriage Status in Nampa
Out of a total of 35,791 households in Nampa, 25,413 (71.0%) are family households, while 10,378 (29.0%) are nonfamily households. The most numerous type of family households are 2-person households, comprising 9,794, and the most common type of nonfamily households are 1-person households, comprising 7,385.
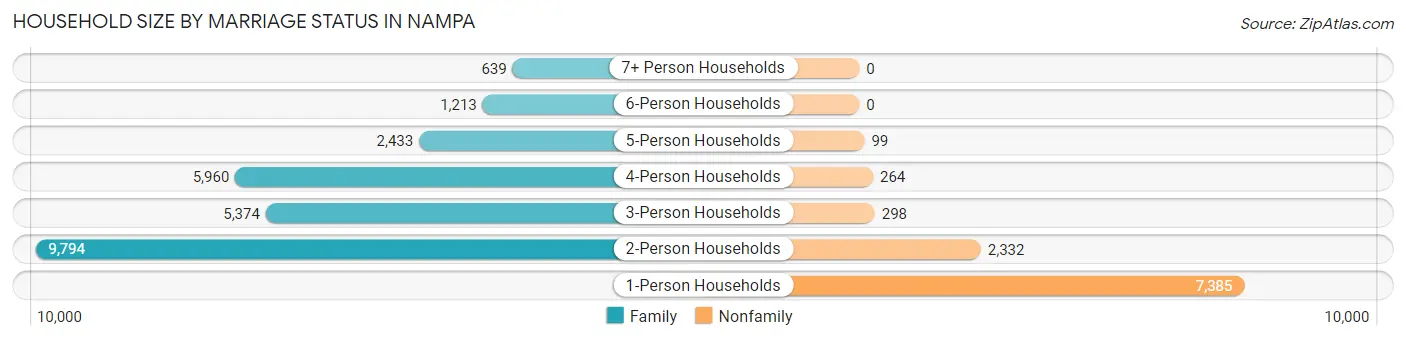
| Household Size | Family Households | Nonfamily Households |
| 1-Person Households | - | 7,385 (20.6%) |
| 2-Person Households | 9,794 (27.4%) | 2,332 (6.5%) |
| 3-Person Households | 5,374 (15.0%) | 298 (0.8%) |
| 4-Person Households | 5,960 (16.7%) | 264 (0.7%) |
| 5-Person Households | 2,433 (6.8%) | 99 (0.3%) |
| 6-Person Households | 1,213 (3.4%) | 0 (0.0%) |
| 7+ Person Households | 639 (1.8%) | 0 (0.0%) |
| Total | 25,413 (71.0%) | 10,378 (29.0%) |
Female Fertility in Nampa
Fertility by Age in Nampa
Average fertility rate in Nampa is 40.0 births per 1,000 women. Women in the age bracket of 20 to 34 years have the highest fertility rate with 68.0 births per 1,000 women. Women in the age bracket of 20 to 34 years acount for 79.6% of all women with births.
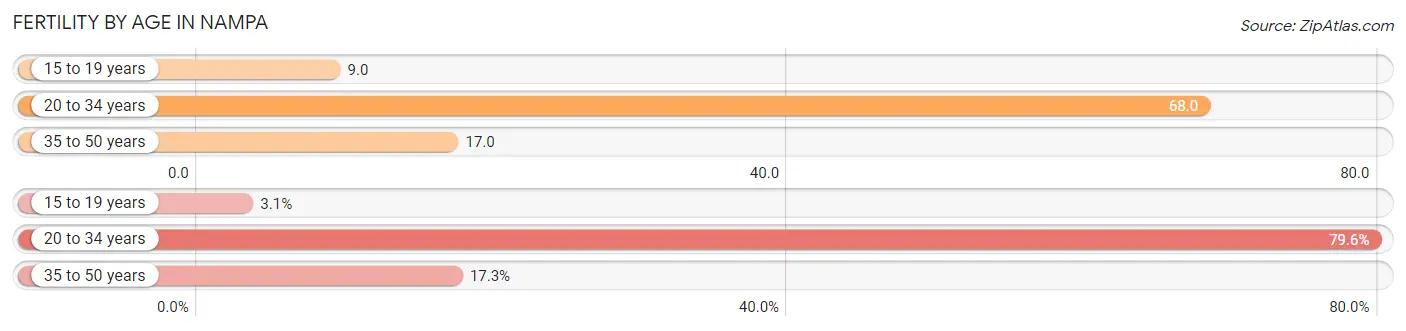
| Age Bracket | Women with Births | Births / 1,000 Women |
| 15 to 19 years | 31 (3.1%) | 9.0 |
| 20 to 34 years | 801 (79.6%) | 68.0 |
| 35 to 50 years | 174 (17.3%) | 17.0 |
| Total | 1,006 (100.0%) | 40.0 |
Fertility by Age by Marriage Status in Nampa
71.8% of women with births (1,006) in Nampa are married. The highest percentage of unmarried women with births falls into 20 to 34 years age bracket with 33.1% of them unmarried at the time of birth, while the lowest percentage of unmarried women with births belong to 35 to 50 years age bracket with 5.7% of them unmarried.
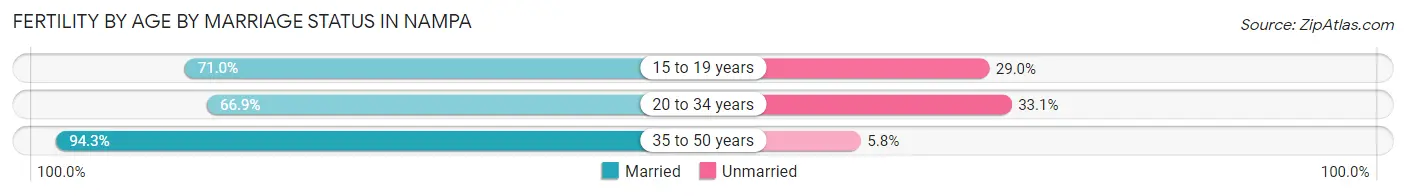
| Age Bracket | Married | Unmarried |
| 15 to 19 years | 22 (71.0%) | 9 (29.0%) |
| 20 to 34 years | 536 (66.9%) | 265 (33.1%) |
| 35 to 50 years | 164 (94.3%) | 10 (5.8%) |
| Total | 722 (71.8%) | 284 (28.2%) |
Fertility by Education in Nampa
Average fertility rate in Nampa is 40.0 births per 1,000 women. Women with the education attainment of high school diploma have the highest fertility rate of 51.0 births per 1,000 women, while women with the education attainment of graduate degree have the lowest fertility at 10.0 births per 1,000 women. Women with the education attainment of high school diploma represent 35.5% of all women with births.
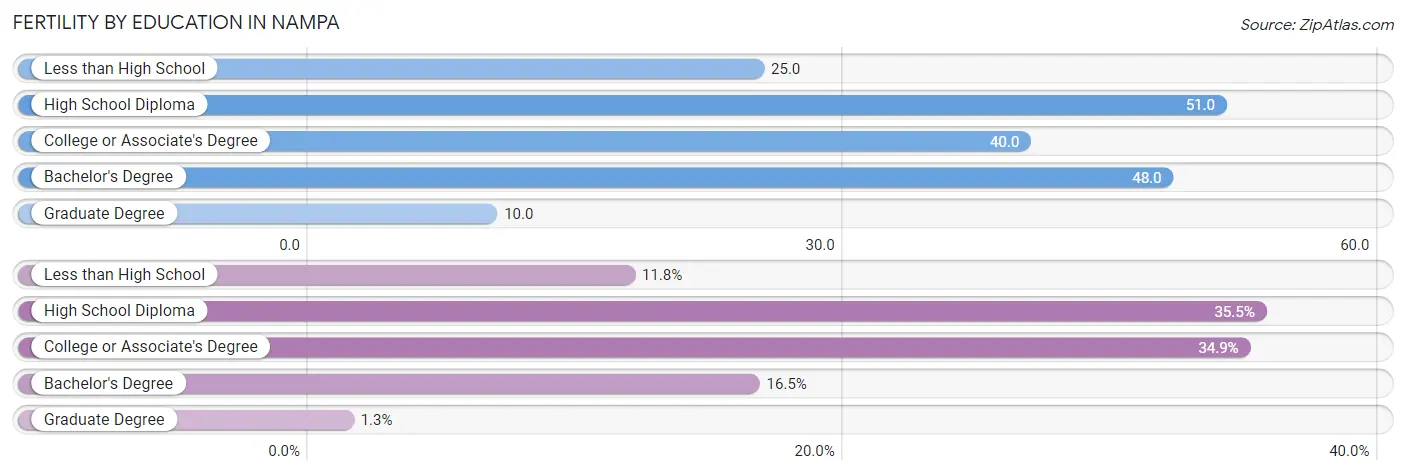
| Educational Attainment | Women with Births | Births / 1,000 Women |
| Less than High School | 119 (11.8%) | 25.0 |
| High School Diploma | 357 (35.5%) | 51.0 |
| College or Associate's Degree | 351 (34.9%) | 40.0 |
| Bachelor's Degree | 166 (16.5%) | 48.0 |
| Graduate Degree | 13 (1.3%) | 10.0 |
| Total | 1,006 (100.0%) | 40.0 |
Fertility by Education by Marriage Status in Nampa
28.2% of women with births in Nampa are unmarried. Women with the educational attainment of bachelor's degree are most likely to be married with 100.0% of them married at childbirth, while women with the educational attainment of high school diploma are least likely to be married with 47.3% of them unmarried at childbirth.
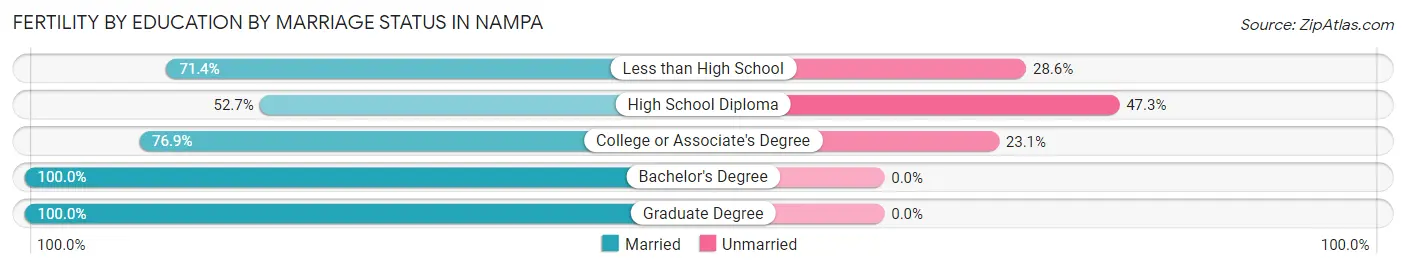
| Educational Attainment | Married | Unmarried |
| Less than High School | 85 (71.4%) | 34 (28.6%) |
| High School Diploma | 188 (52.7%) | 169 (47.3%) |
| College or Associate's Degree | 270 (76.9%) | 81 (23.1%) |
| Bachelor's Degree | 166 (100.0%) | 0 (0.0%) |
| Graduate Degree | 13 (100.0%) | 0 (0.0%) |
| Total | 722 (71.8%) | 284 (28.2%) |
Employment Characteristics in Nampa
Employment by Class of Employer in Nampa
Among the 49,359 employed individuals in Nampa, private company employees (33,883 | 68.6%), not-for-profit organizations (4,235 | 8.6%), and self-employed (not incorporated) (3,220 | 6.5%) make up the most common classes of employment.
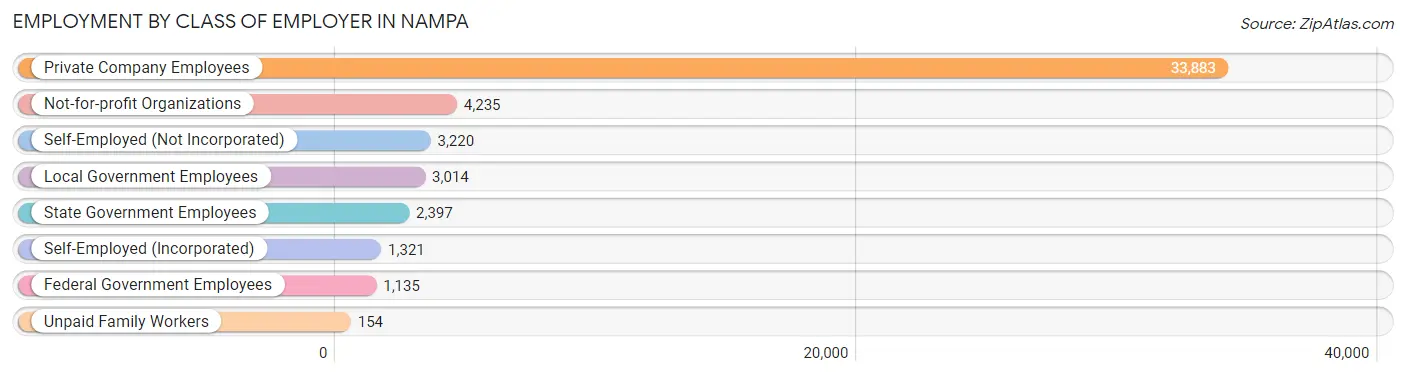
| Employer Class | # Employees | % Employees |
| Private Company Employees | 33,883 | 68.6% |
| Self-Employed (Incorporated) | 1,321 | 2.7% |
| Self-Employed (Not Incorporated) | 3,220 | 6.5% |
| Not-for-profit Organizations | 4,235 | 8.6% |
| Local Government Employees | 3,014 | 6.1% |
| State Government Employees | 2,397 | 4.9% |
| Federal Government Employees | 1,135 | 2.3% |
| Unpaid Family Workers | 154 | 0.3% |
| Total | 49,359 | 100.0% |
Employment Status by Age in Nampa
According to the labor force statistics for Nampa, out of the total population over 16 years of age (79,438), 64.8% or 51,476 individuals are in the labor force, with 3.0% or 1,544 of them unemployed. The age group with the highest labor force participation rate is 35 to 44 years, with 84.8% or 11,228 individuals in the labor force. Within the labor force, the 16 to 19 years age range has the highest percentage of unemployed individuals, with 15.9% or 378 of them being unemployed.
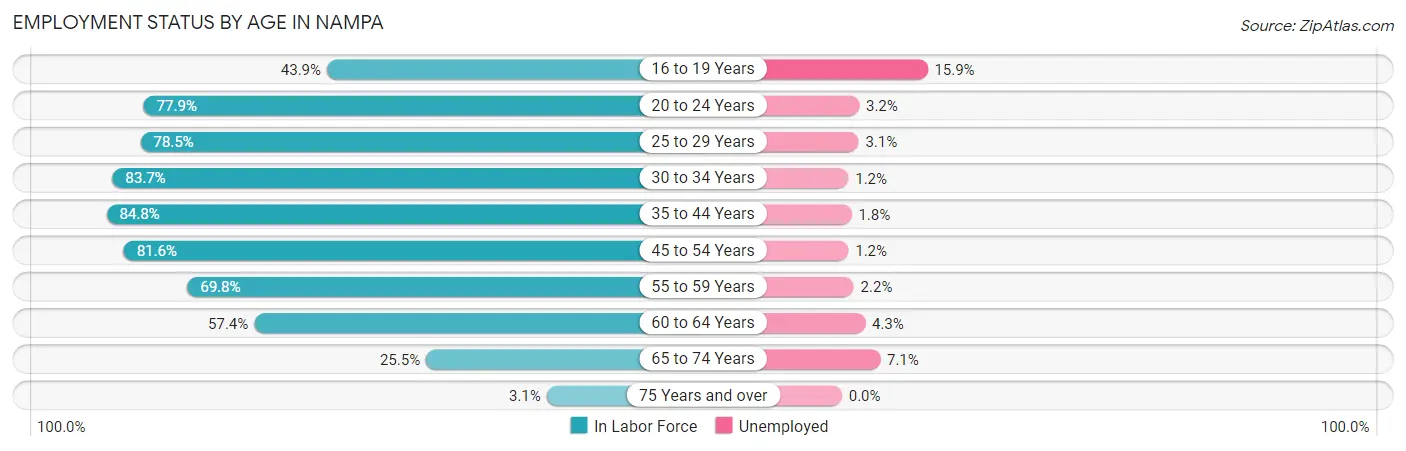
| Age Bracket | In Labor Force | Unemployed |
| 16 to 19 Years | 2,375 (43.9%) | 378 (15.9%) |
| 20 to 24 Years | 6,851 (77.9%) | 219 (3.2%) |
| 25 to 29 Years | 6,735 (78.5%) | 209 (3.1%) |
| 30 to 34 Years | 6,338 (83.7%) | 76 (1.2%) |
| 35 to 44 Years | 11,228 (84.8%) | 202 (1.8%) |
| 45 to 54 Years | 9,351 (81.6%) | 112 (1.2%) |
| 55 to 59 Years | 3,334 (69.8%) | 73 (2.2%) |
| 60 to 64 Years | 2,847 (57.4%) | 122 (4.3%) |
| 65 to 74 Years | 2,281 (25.5%) | 162 (7.1%) |
| 75 Years and over | 177 (3.1%) | 0 (0.0%) |
| Total | 51,476 (64.8%) | 1,544 (3.0%) |
Employment Status by Educational Attainment in Nampa
According to labor force statistics for Nampa, 78.7% of individuals (39,814) out of the total population between 25 and 64 years of age (50,589) are in the labor force, with 2.0% or 796 of them being unemployed. The group with the highest labor force participation rate are those with the educational attainment of bachelor's degree or higher, with 85.7% or 9,532 individuals in the labor force. Within the labor force, individuals with college / associate degree education have the highest percentage of unemployment, with 3.2% or 464 of them being unemployed.
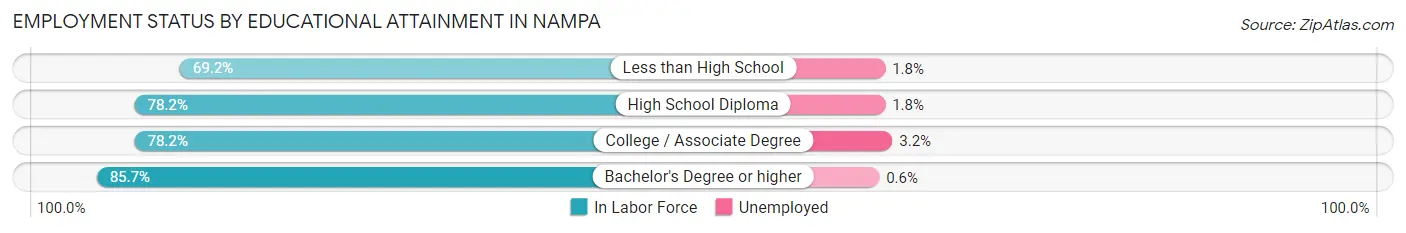
| Educational Attainment | In Labor Force | Unemployed |
| Less than High School | 4,347 (69.2%) | 113 (1.8%) |
| High School Diploma | 11,464 (78.2%) | 264 (1.8%) |
| College / Associate Degree | 14,487 (78.2%) | 593 (3.2%) |
| Bachelor's Degree or higher | 9,532 (85.7%) | 67 (0.6%) |
| Total | 39,814 (78.7%) | 1,012 (2.0%) |
Employment Occupations by Sex in Nampa
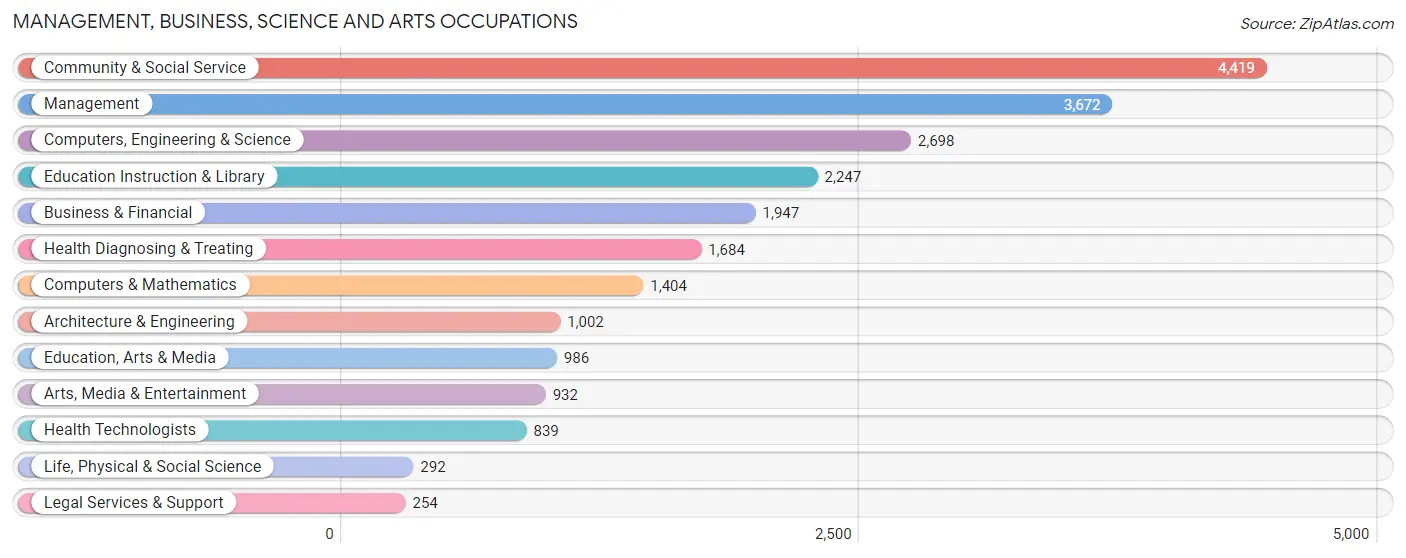
Management, Business, Science and Arts Occupations
The most common Management, Business, Science and Arts occupations in Nampa are Community & Social Service (4,419 | 8.9%), Management (3,672 | 7.4%), Computers, Engineering & Science (2,698 | 5.4%), Education Instruction & Library (2,247 | 4.5%), and Business & Financial (1,947 | 3.9%).
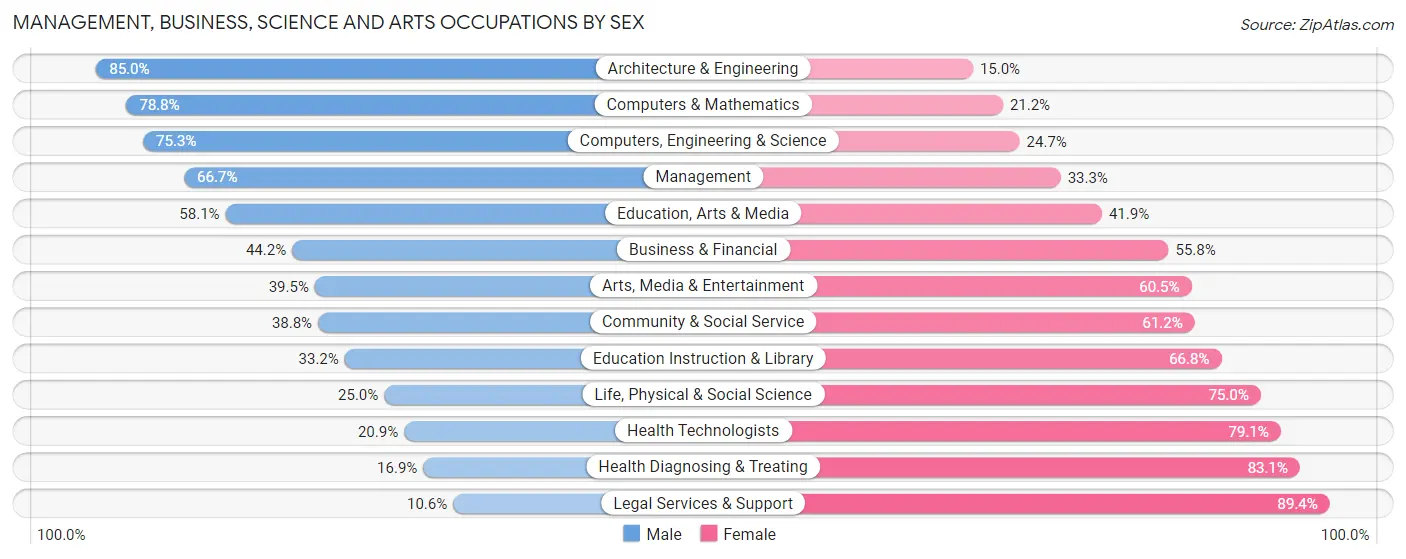
Management, Business, Science and Arts Occupations by Sex
Within the Management, Business, Science and Arts occupations in Nampa, the most male-oriented occupations are Architecture & Engineering (85.0%), Computers & Mathematics (78.8%), and Computers, Engineering & Science (75.3%), while the most female-oriented occupations are Legal Services & Support (89.4%), Health Diagnosing & Treating (83.1%), and Health Technologists (79.1%).
| Occupation | Male | Female |
| Management | 2,450 (66.7%) | 1,222 (33.3%) |
| Business & Financial | 861 (44.2%) | 1,086 (55.8%) |
| Computers, Engineering & Science | 2,031 (75.3%) | 667 (24.7%) |
| Computers & Mathematics | 1,106 (78.8%) | 298 (21.2%) |
| Architecture & Engineering | 852 (85.0%) | 150 (15.0%) |
| Life, Physical & Social Science | 73 (25.0%) | 219 (75.0%) |
| Community & Social Service | 1,715 (38.8%) | 2,704 (61.2%) |
| Education, Arts & Media | 573 (58.1%) | 413 (41.9%) |
| Legal Services & Support | 27 (10.6%) | 227 (89.4%) |
| Education Instruction & Library | 747 (33.2%) | 1,500 (66.8%) |
| Arts, Media & Entertainment | 368 (39.5%) | 564 (60.5%) |
| Health Diagnosing & Treating | 284 (16.9%) | 1,400 (83.1%) |
| Health Technologists | 175 (20.9%) | 664 (79.1%) |
| Total (Category) | 7,341 (50.9%) | 7,079 (49.1%) |
| Total (Overall) | 26,899 (53.9%) | 22,982 (46.1%) |
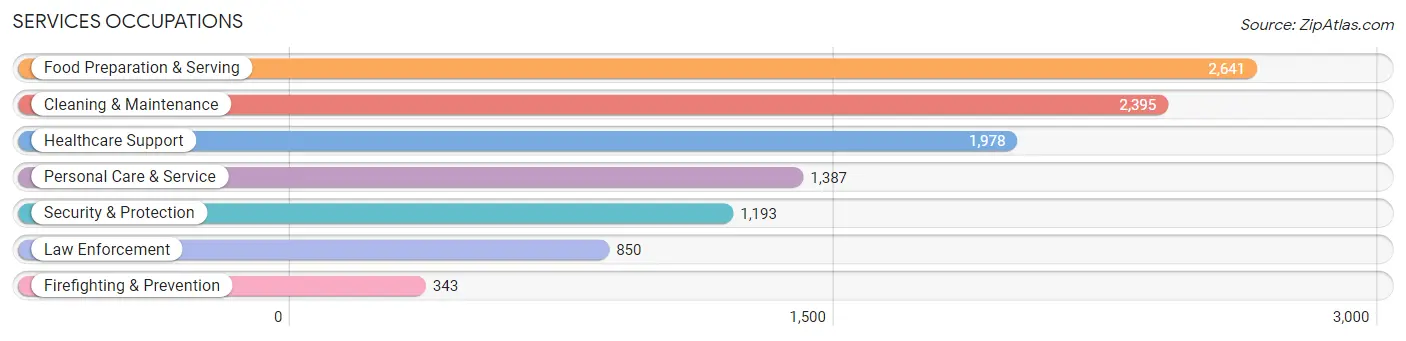
Services Occupations
The most common Services occupations in Nampa are Food Preparation & Serving (2,641 | 5.3%), Cleaning & Maintenance (2,395 | 4.8%), Healthcare Support (1,978 | 4.0%), Personal Care & Service (1,387 | 2.8%), and Security & Protection (1,193 | 2.4%).
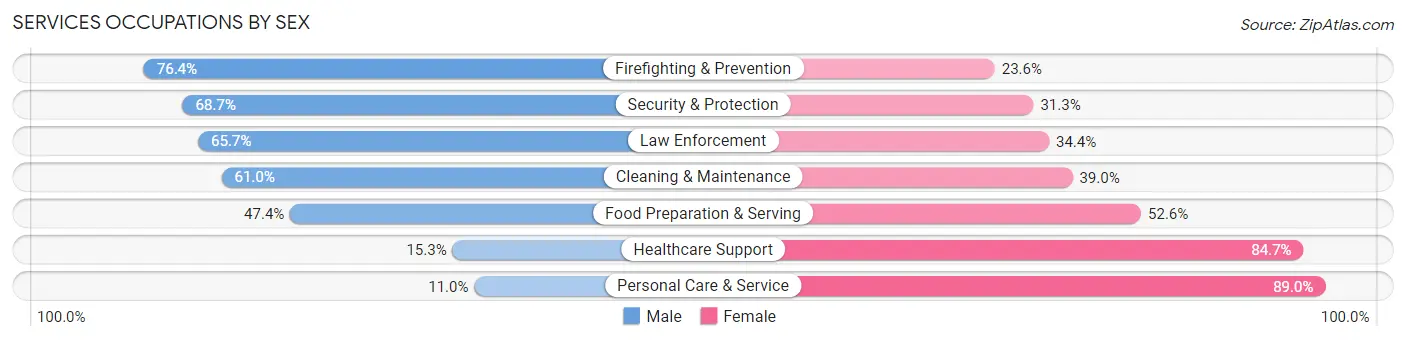
Services Occupations by Sex
Within the Services occupations in Nampa, the most male-oriented occupations are Firefighting & Prevention (76.4%), Security & Protection (68.7%), and Law Enforcement (65.6%), while the most female-oriented occupations are Personal Care & Service (89.0%), Healthcare Support (84.7%), and Food Preparation & Serving (52.6%).
| Occupation | Male | Female |
| Healthcare Support | 302 (15.3%) | 1,676 (84.7%) |
| Security & Protection | 820 (68.7%) | 373 (31.3%) |
| Firefighting & Prevention | 262 (76.4%) | 81 (23.6%) |
| Law Enforcement | 558 (65.6%) | 292 (34.4%) |
| Food Preparation & Serving | 1,252 (47.4%) | 1,389 (52.6%) |
| Cleaning & Maintenance | 1,461 (61.0%) | 934 (39.0%) |
| Personal Care & Service | 152 (11.0%) | 1,235 (89.0%) |
| Total (Category) | 3,987 (41.6%) | 5,607 (58.4%) |
| Total (Overall) | 26,899 (53.9%) | 22,982 (46.1%) |
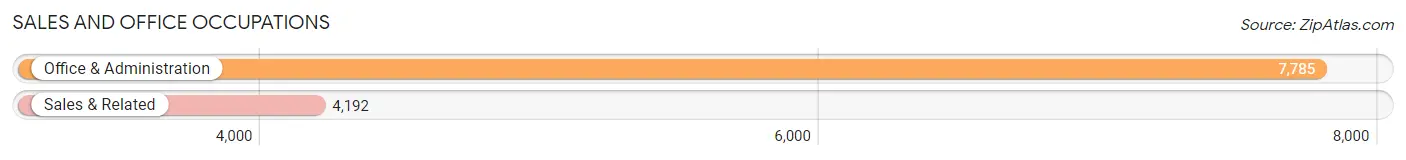
Sales and Office Occupations
The most common Sales and Office occupations in Nampa are Office & Administration (7,785 | 15.6%), and Sales & Related (4,192 | 8.4%).
Sales and Office Occupations by Sex
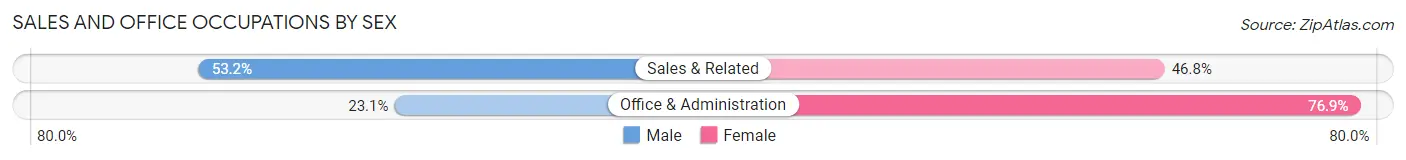
| Occupation | Male | Female |
| Sales & Related | 2,230 (53.2%) | 1,962 (46.8%) |
| Office & Administration | 1,800 (23.1%) | 5,985 (76.9%) |
| Total (Category) | 4,030 (33.7%) | 7,947 (66.3%) |
| Total (Overall) | 26,899 (53.9%) | 22,982 (46.1%) |
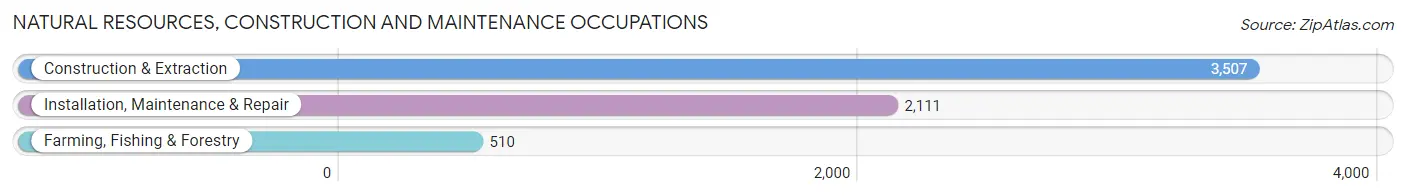
Natural Resources, Construction and Maintenance Occupations
The most common Natural Resources, Construction and Maintenance occupations in Nampa are Construction & Extraction (3,507 | 7.0%), Installation, Maintenance & Repair (2,111 | 4.2%), and Farming, Fishing & Forestry (510 | 1.0%).
Natural Resources, Construction and Maintenance Occupations by Sex
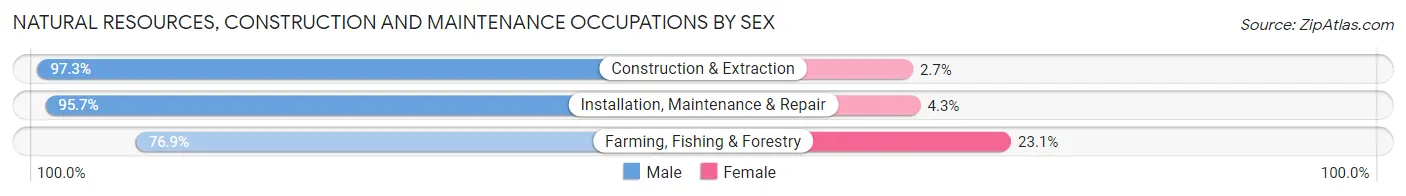
| Occupation | Male | Female |
| Farming, Fishing & Forestry | 392 (76.9%) | 118 (23.1%) |
| Construction & Extraction | 3,412 (97.3%) | 95 (2.7%) |
| Installation, Maintenance & Repair | 2,020 (95.7%) | 91 (4.3%) |
| Total (Category) | 5,824 (95.0%) | 304 (5.0%) |
| Total (Overall) | 26,899 (53.9%) | 22,982 (46.1%) |
Production, Transportation and Moving Occupations
The most common Production, Transportation and Moving occupations in Nampa are Production (2,872 | 5.8%), Material Moving (2,789 | 5.6%), and Transportation (2,101 | 4.2%).
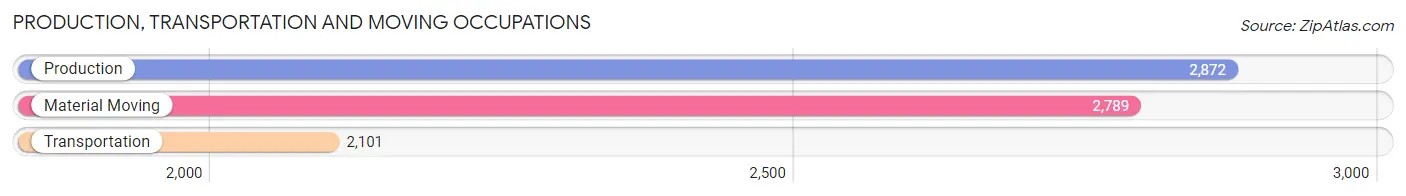
Production, Transportation and Moving Occupations by Sex
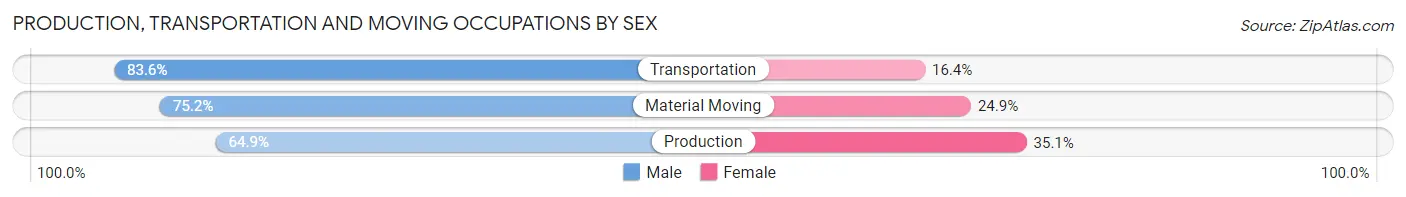
| Occupation | Male | Female |
| Production | 1,865 (64.9%) | 1,007 (35.1%) |
| Transportation | 1,756 (83.6%) | 345 (16.4%) |
| Material Moving | 2,096 (75.1%) | 693 (24.8%) |
| Total (Category) | 5,717 (73.7%) | 2,045 (26.4%) |
| Total (Overall) | 26,899 (53.9%) | 22,982 (46.1%) |
Employment Industries by Sex in Nampa
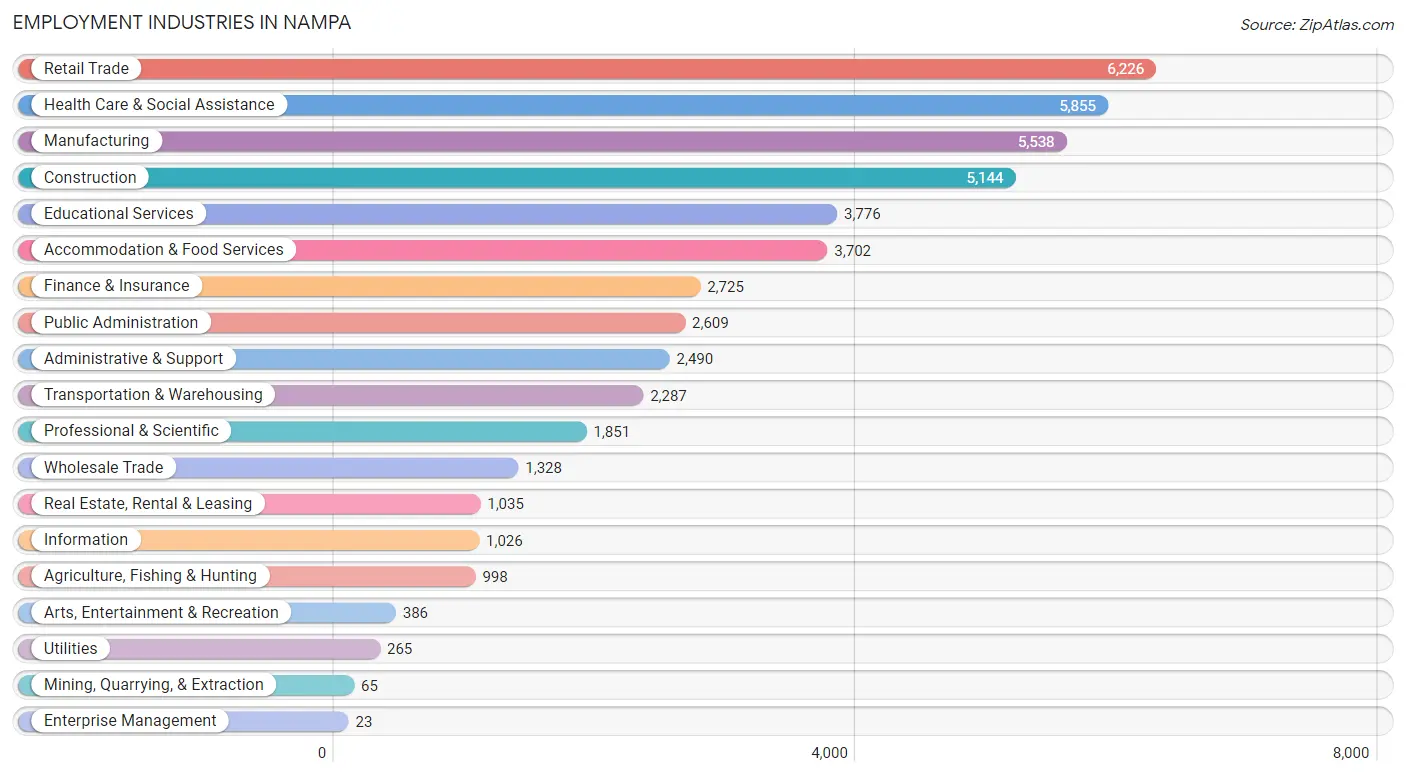
Employment Industries in Nampa
The major employment industries in Nampa include Retail Trade (6,226 | 12.5%), Health Care & Social Assistance (5,855 | 11.7%), Manufacturing (5,538 | 11.1%), Construction (5,144 | 10.3%), and Educational Services (3,776 | 7.6%).
Employment Industries by Sex in Nampa
The Nampa industries that see more men than women are Construction (87.8%), Mining, Quarrying, & Extraction (86.2%), and Agriculture, Fishing & Hunting (76.3%), whereas the industries that tend to have a higher number of women are Enterprise Management (100.0%), Health Care & Social Assistance (83.9%), and Finance & Insurance (66.1%).
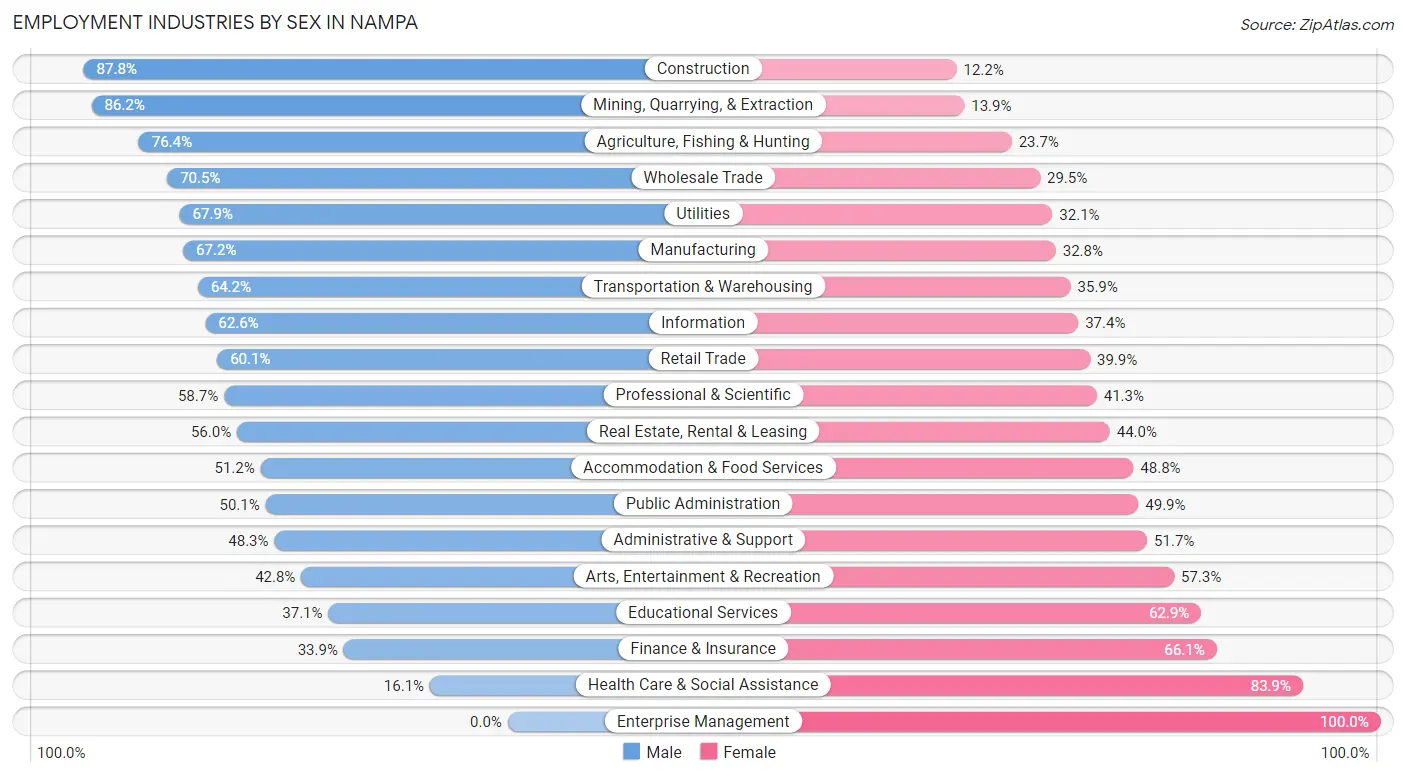
| Industry | Male | Female |
| Agriculture, Fishing & Hunting | 762 (76.3%) | 236 (23.6%) |
| Mining, Quarrying, & Extraction | 56 (86.2%) | 9 (13.9%) |
| Construction | 4,515 (87.8%) | 629 (12.2%) |
| Manufacturing | 3,722 (67.2%) | 1,816 (32.8%) |
| Wholesale Trade | 936 (70.5%) | 392 (29.5%) |
| Retail Trade | 3,744 (60.1%) | 2,482 (39.9%) |
| Transportation & Warehousing | 1,467 (64.1%) | 820 (35.8%) |
| Utilities | 180 (67.9%) | 85 (32.1%) |
| Information | 642 (62.6%) | 384 (37.4%) |
| Finance & Insurance | 925 (33.9%) | 1,800 (66.1%) |
| Real Estate, Rental & Leasing | 580 (56.0%) | 455 (44.0%) |
| Professional & Scientific | 1,087 (58.7%) | 764 (41.3%) |
| Enterprise Management | 0 (0.0%) | 23 (100.0%) |
| Administrative & Support | 1,203 (48.3%) | 1,287 (51.7%) |
| Educational Services | 1,402 (37.1%) | 2,374 (62.9%) |
| Health Care & Social Assistance | 943 (16.1%) | 4,912 (83.9%) |
| Arts, Entertainment & Recreation | 165 (42.7%) | 221 (57.3%) |
| Accommodation & Food Services | 1,894 (51.2%) | 1,808 (48.8%) |
| Public Administration | 1,308 (50.1%) | 1,301 (49.9%) |
| Total | 26,899 (53.9%) | 22,982 (46.1%) |
Education in Nampa
School Enrollment in Nampa
The most common levels of schooling among the 26,291 students in Nampa are elementary school (6,039 | 23.0%), middle school (5,469 | 20.8%), and high school (5,404 | 20.5%).
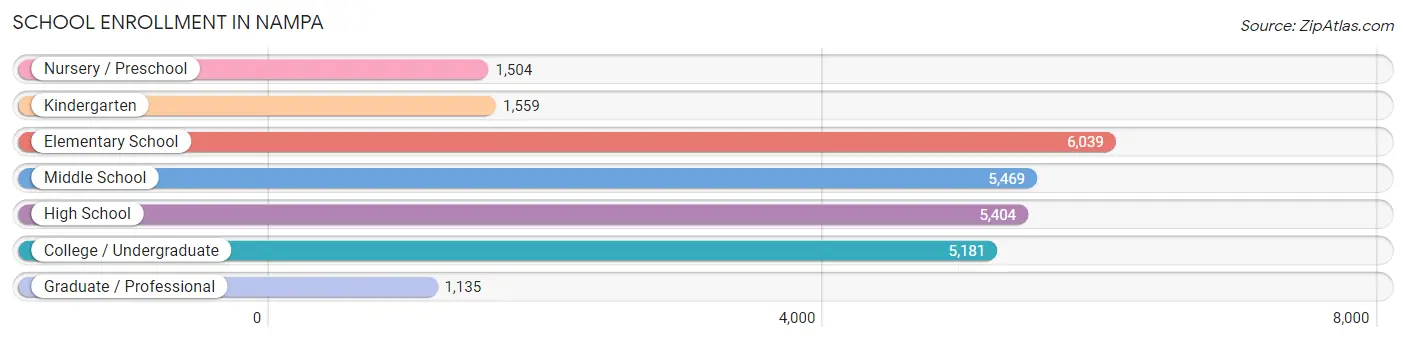
| School Level | # Students | % Students |
| Nursery / Preschool | 1,504 | 5.7% |
| Kindergarten | 1,559 | 5.9% |
| Elementary School | 6,039 | 23.0% |
| Middle School | 5,469 | 20.8% |
| High School | 5,404 | 20.5% |
| College / Undergraduate | 5,181 | 19.7% |
| Graduate / Professional | 1,135 | 4.3% |
| Total | 26,291 | 100.0% |
School Enrollment by Age by Funding Source in Nampa
Out of a total of 26,291 students who are enrolled in schools in Nampa, 4,969 (18.9%) attend a private institution, while the remaining 21,322 (81.1%) are enrolled in public schools. The age group of 3 to 4 year olds has the highest likelihood of being enrolled in private schools, with 685 (66.3% in the age bracket) enrolled. Conversely, the age group of 10 to 14 year olds has the lowest likelihood of being enrolled in a private school, with 6,338 (93.6% in the age bracket) attending a public institution.
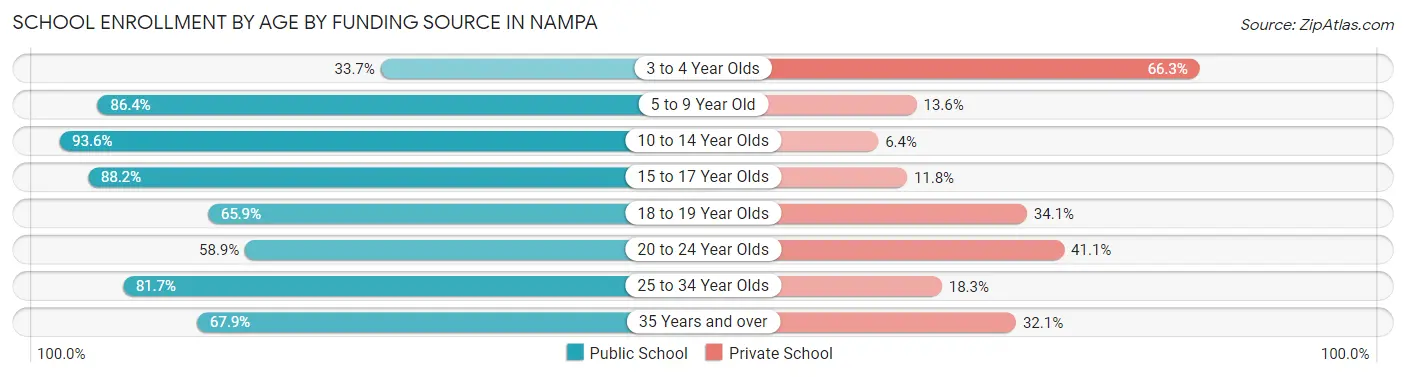
| Age Bracket | Public School | Private School |
| 3 to 4 Year Olds | 348 (33.7%) | 685 (66.3%) |
| 5 to 9 Year Old | 6,170 (86.4%) | 969 (13.6%) |
| 10 to 14 Year Olds | 6,338 (93.6%) | 436 (6.4%) |
| 15 to 17 Year Olds | 3,546 (88.2%) | 474 (11.8%) |
| 18 to 19 Year Olds | 1,127 (65.9%) | 584 (34.1%) |
| 20 to 24 Year Olds | 1,518 (58.9%) | 1,058 (41.1%) |
| 25 to 34 Year Olds | 1,314 (81.7%) | 294 (18.3%) |
| 35 Years and over | 971 (67.9%) | 459 (32.1%) |
| Total | 21,322 (81.1%) | 4,969 (18.9%) |
Educational Attainment by Field of Study in Nampa
Business (2,707 | 17.9%), education (2,430 | 16.1%), science & technology (1,669 | 11.0%), arts & humanities (1,305 | 8.6%), and engineering (1,120 | 7.4%) are the most common fields of study among 15,120 individuals in Nampa who have obtained a bachelor's degree or higher.
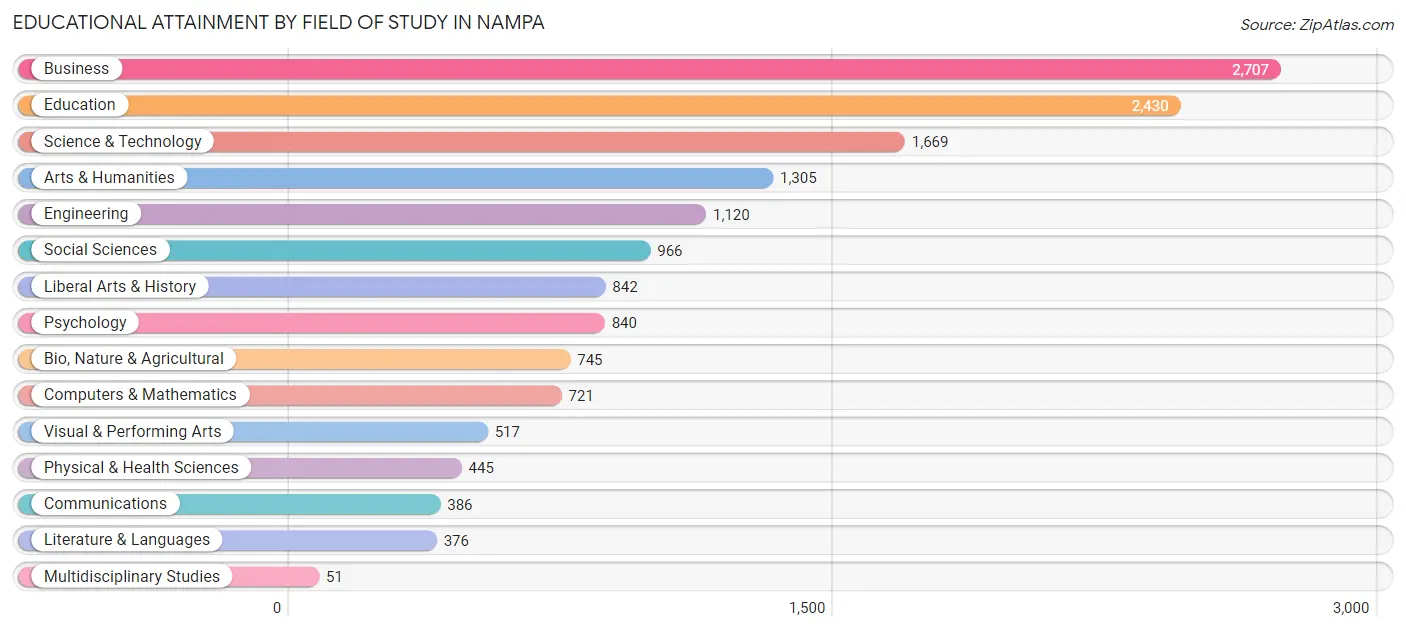
| Field of Study | # Graduates | % Graduates |
| Computers & Mathematics | 721 | 4.8% |
| Bio, Nature & Agricultural | 745 | 4.9% |
| Physical & Health Sciences | 445 | 2.9% |
| Psychology | 840 | 5.6% |
| Social Sciences | 966 | 6.4% |
| Engineering | 1,120 | 7.4% |
| Multidisciplinary Studies | 51 | 0.3% |
| Science & Technology | 1,669 | 11.0% |
| Business | 2,707 | 17.9% |
| Education | 2,430 | 16.1% |
| Literature & Languages | 376 | 2.5% |
| Liberal Arts & History | 842 | 5.6% |
| Visual & Performing Arts | 517 | 3.4% |
| Communications | 386 | 2.5% |
| Arts & Humanities | 1,305 | 8.6% |
| Total | 15,120 | 100.0% |
Transportation & Commute in Nampa
Vehicle Availability by Sex in Nampa
The most prevalent vehicle ownership categories in Nampa are males with 2 vehicles (10,624, accounting for 40.2%) and females with 2 vehicles (8,622, making up 47.6%).
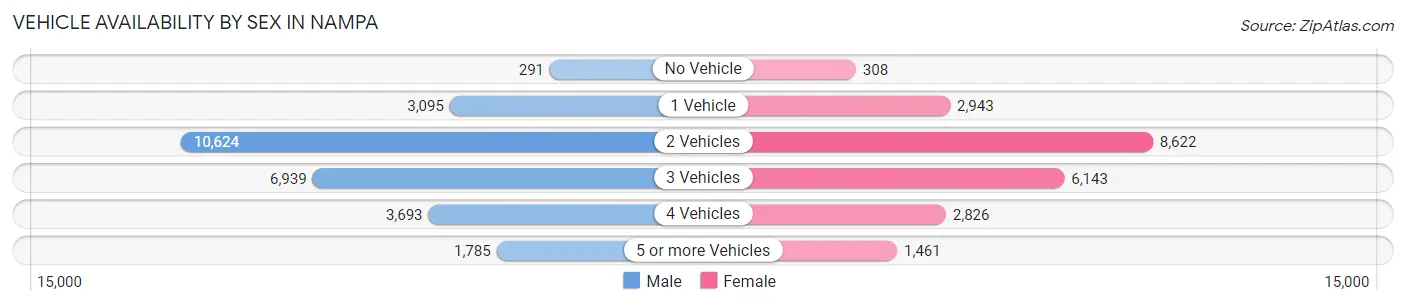
| Vehicles Available | Male | Female |
| No Vehicle | 291 (1.1%) | 308 (1.4%) |
| 1 Vehicle | 3,095 (11.7%) | 2,943 (13.2%) |
| 2 Vehicles | 10,624 (40.2%) | 8,622 (38.7%) |
| 3 Vehicles | 6,939 (26.3%) | 6,143 (27.5%) |
| 4 Vehicles | 3,693 (14.0%) | 2,826 (12.7%) |
| 5 or more Vehicles | 1,785 (6.8%) | 1,461 (6.6%) |
| Total | 26,427 (100.0%) | 22,303 (100.0%) |
Commute Time in Nampa
The most frequently occuring commute durations in Nampa are 30 to 34 minutes (7,487 commuters, 16.7%), 15 to 19 minutes (6,394 commuters, 14.2%), and 20 to 24 minutes (6,276 commuters, 14.0%).
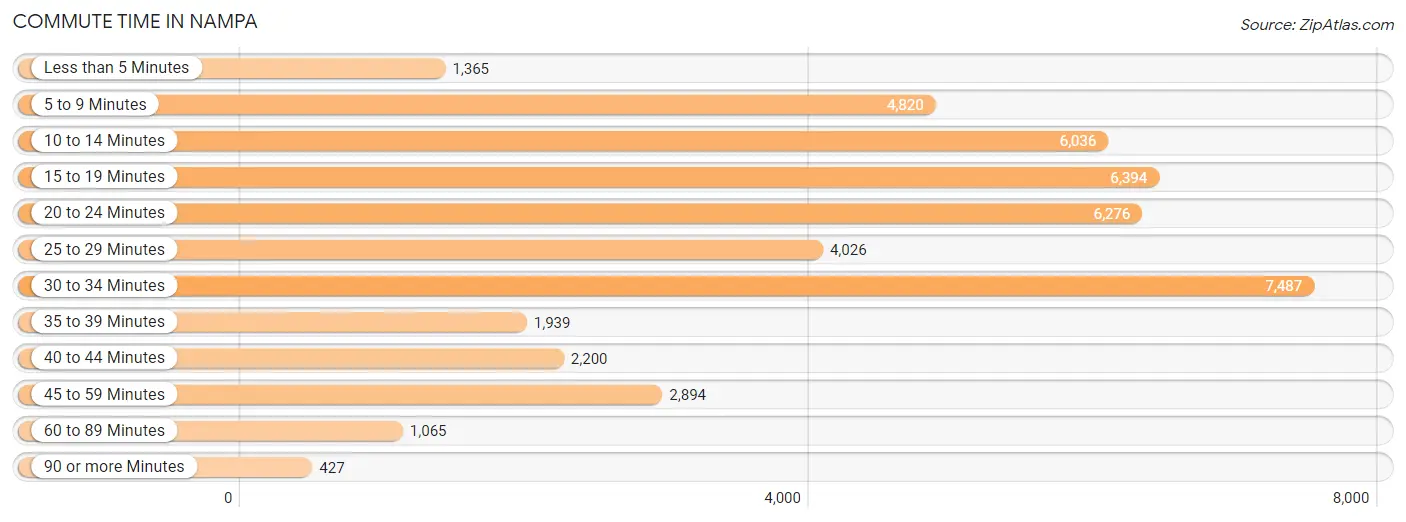
| Commute Time | # Commuters | % Commuters |
| Less than 5 Minutes | 1,365 | 3.0% |
| 5 to 9 Minutes | 4,820 | 10.7% |
| 10 to 14 Minutes | 6,036 | 13.4% |
| 15 to 19 Minutes | 6,394 | 14.2% |
| 20 to 24 Minutes | 6,276 | 14.0% |
| 25 to 29 Minutes | 4,026 | 9.0% |
| 30 to 34 Minutes | 7,487 | 16.7% |
| 35 to 39 Minutes | 1,939 | 4.3% |
| 40 to 44 Minutes | 2,200 | 4.9% |
| 45 to 59 Minutes | 2,894 | 6.4% |
| 60 to 89 Minutes | 1,065 | 2.4% |
| 90 or more Minutes | 427 | 0.9% |
Commute Time by Sex in Nampa
The most common commute times in Nampa are 30 to 34 minutes (4,344 commuters, 17.6%) for males and 30 to 34 minutes (3,143 commuters, 15.5%) for females.
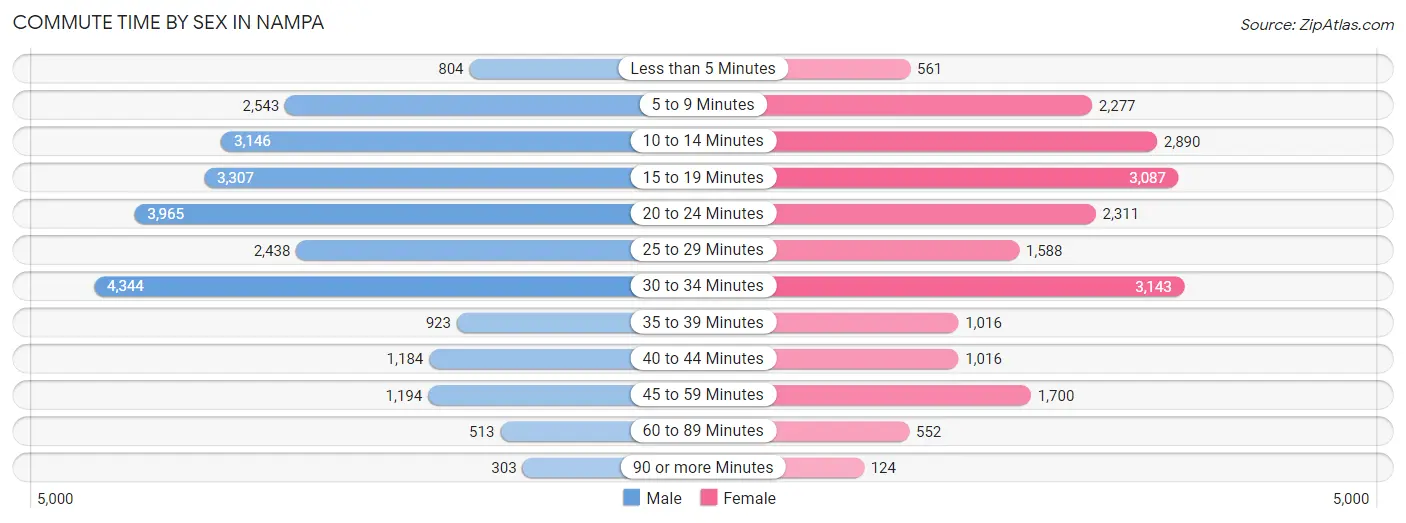
| Commute Time | Male | Female |
| Less than 5 Minutes | 804 (3.3%) | 561 (2.8%) |
| 5 to 9 Minutes | 2,543 (10.3%) | 2,277 (11.2%) |
| 10 to 14 Minutes | 3,146 (12.8%) | 2,890 (14.3%) |
| 15 to 19 Minutes | 3,307 (13.4%) | 3,087 (15.2%) |
| 20 to 24 Minutes | 3,965 (16.1%) | 2,311 (11.4%) |
| 25 to 29 Minutes | 2,438 (9.9%) | 1,588 (7.8%) |
| 30 to 34 Minutes | 4,344 (17.6%) | 3,143 (15.5%) |
| 35 to 39 Minutes | 923 (3.7%) | 1,016 (5.0%) |
| 40 to 44 Minutes | 1,184 (4.8%) | 1,016 (5.0%) |
| 45 to 59 Minutes | 1,194 (4.8%) | 1,700 (8.4%) |
| 60 to 89 Minutes | 513 (2.1%) | 552 (2.7%) |
| 90 or more Minutes | 303 (1.2%) | 124 (0.6%) |
Time of Departure to Work by Sex in Nampa
The most frequent times of departure to work in Nampa are 7:00 AM to 7:29 AM (3,620, 14.7%) for males and 7:00 AM to 7:29 AM (3,515, 17.3%) for females.
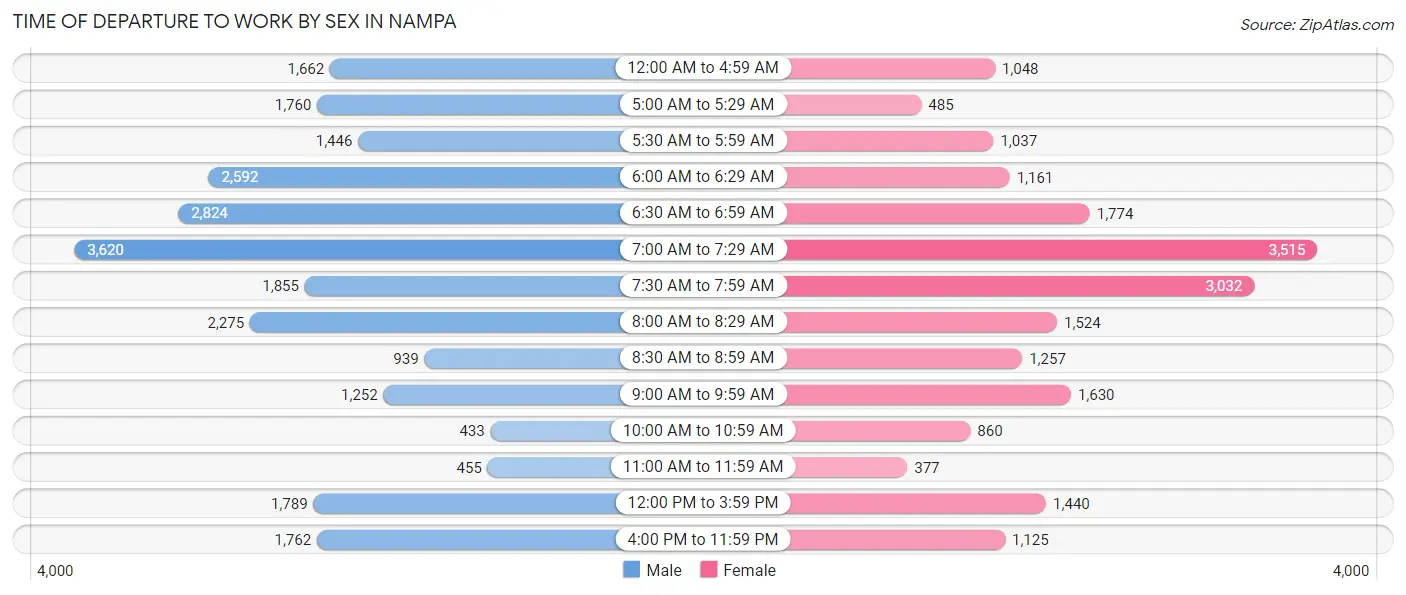
| Time of Departure | Male | Female |
| 12:00 AM to 4:59 AM | 1,662 (6.7%) | 1,048 (5.2%) |
| 5:00 AM to 5:29 AM | 1,760 (7.1%) | 485 (2.4%) |
| 5:30 AM to 5:59 AM | 1,446 (5.9%) | 1,037 (5.1%) |
| 6:00 AM to 6:29 AM | 2,592 (10.5%) | 1,161 (5.7%) |
| 6:30 AM to 6:59 AM | 2,824 (11.5%) | 1,774 (8.7%) |
| 7:00 AM to 7:29 AM | 3,620 (14.7%) | 3,515 (17.3%) |
| 7:30 AM to 7:59 AM | 1,855 (7.5%) | 3,032 (15.0%) |
| 8:00 AM to 8:29 AM | 2,275 (9.2%) | 1,524 (7.5%) |
| 8:30 AM to 8:59 AM | 939 (3.8%) | 1,257 (6.2%) |
| 9:00 AM to 9:59 AM | 1,252 (5.1%) | 1,630 (8.0%) |
| 10:00 AM to 10:59 AM | 433 (1.8%) | 860 (4.2%) |
| 11:00 AM to 11:59 AM | 455 (1.8%) | 377 (1.9%) |
| 12:00 PM to 3:59 PM | 1,789 (7.2%) | 1,440 (7.1%) |
| 4:00 PM to 11:59 PM | 1,762 (7.1%) | 1,125 (5.6%) |
| Total | 24,664 (100.0%) | 20,265 (100.0%) |
Housing Occupancy in Nampa
Occupancy by Ownership in Nampa
Of the total 35,791 dwellings in Nampa, owner-occupied units account for 25,378 (70.9%), while renter-occupied units make up 10,413 (29.1%).
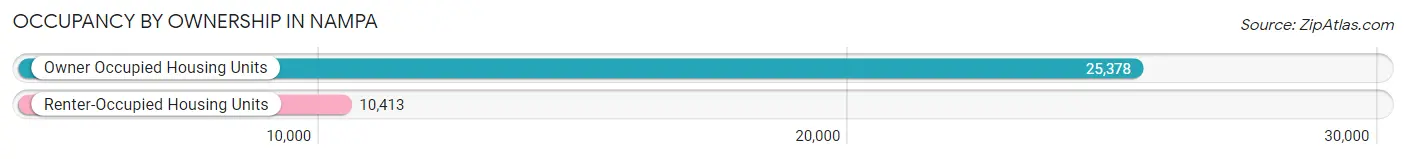
| Occupancy | # Housing Units | % Housing Units |
| Owner Occupied Housing Units | 25,378 | 70.9% |
| Renter-Occupied Housing Units | 10,413 | 29.1% |
| Total Occupied Housing Units | 35,791 | 100.0% |
Occupancy by Household Size in Nampa
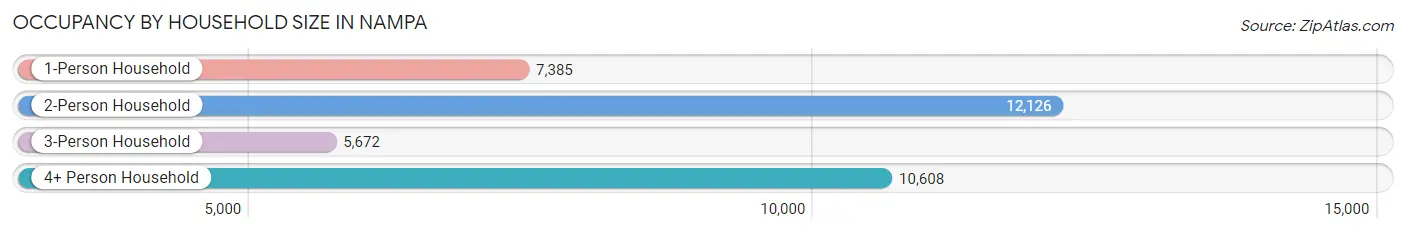
| Household Size | # Housing Units | % Housing Units |
| 1-Person Household | 7,385 | 20.6% |
| 2-Person Household | 12,126 | 33.9% |
| 3-Person Household | 5,672 | 15.9% |
| 4+ Person Household | 10,608 | 29.6% |
| Total Housing Units | 35,791 | 100.0% |
Occupancy by Ownership by Household Size in Nampa
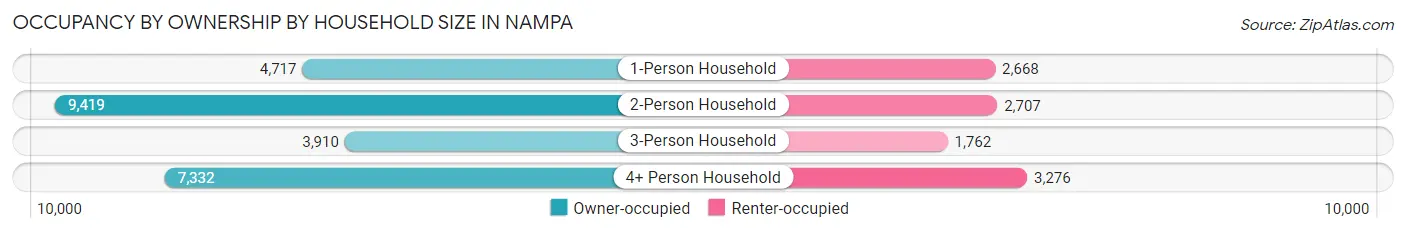
| Household Size | Owner-occupied | Renter-occupied |
| 1-Person Household | 4,717 (63.9%) | 2,668 (36.1%) |
| 2-Person Household | 9,419 (77.7%) | 2,707 (22.3%) |
| 3-Person Household | 3,910 (68.9%) | 1,762 (31.1%) |
| 4+ Person Household | 7,332 (69.1%) | 3,276 (30.9%) |
| Total Housing Units | 25,378 (70.9%) | 10,413 (29.1%) |
Occupancy by Educational Attainment in Nampa
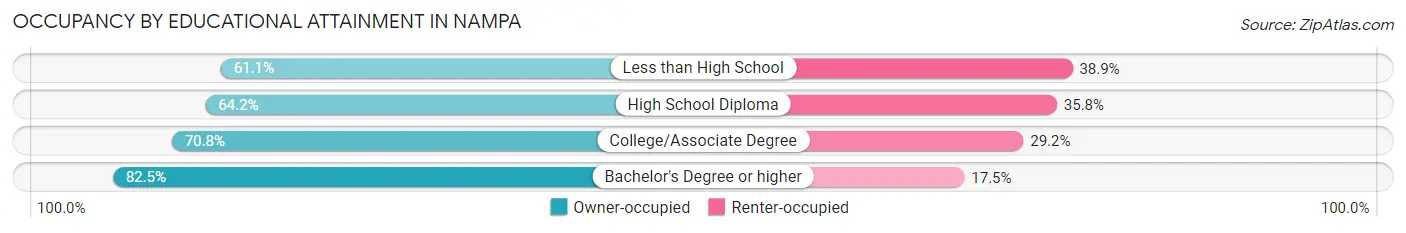
| Household Size | Owner-occupied | Renter-occupied |
| Less than High School | 2,273 (61.1%) | 1,448 (38.9%) |
| High School Diploma | 6,190 (64.2%) | 3,454 (35.8%) |
| College/Associate Degree | 9,641 (70.8%) | 3,970 (29.2%) |
| Bachelor's Degree or higher | 7,274 (82.5%) | 1,541 (17.5%) |
Occupancy by Age of Householder in Nampa
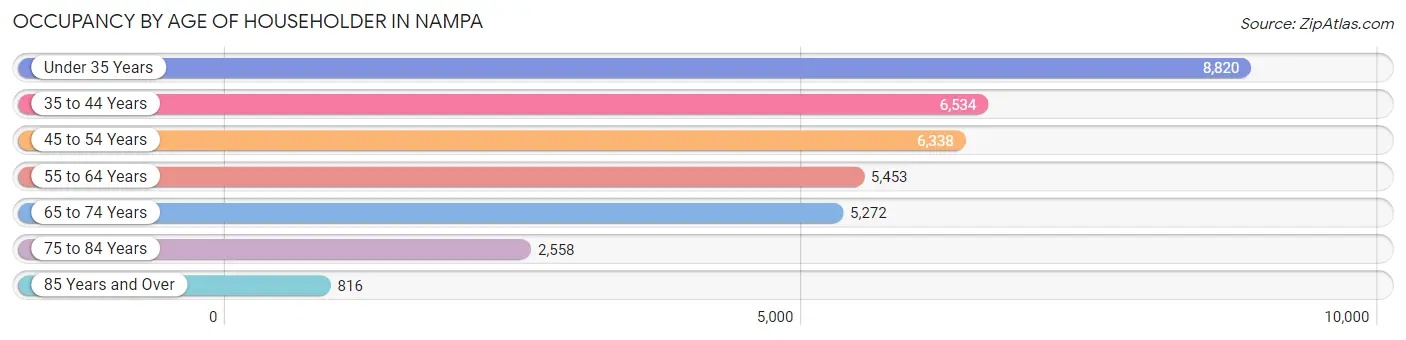
| Age Bracket | # Households | % Households |
| Under 35 Years | 8,820 | 24.6% |
| 35 to 44 Years | 6,534 | 18.3% |
| 45 to 54 Years | 6,338 | 17.7% |
| 55 to 64 Years | 5,453 | 15.2% |
| 65 to 74 Years | 5,272 | 14.7% |
| 75 to 84 Years | 2,558 | 7.1% |
| 85 Years and Over | 816 | 2.3% |
| Total | 35,791 | 100.0% |
Housing Finances in Nampa
Median Income by Occupancy in Nampa
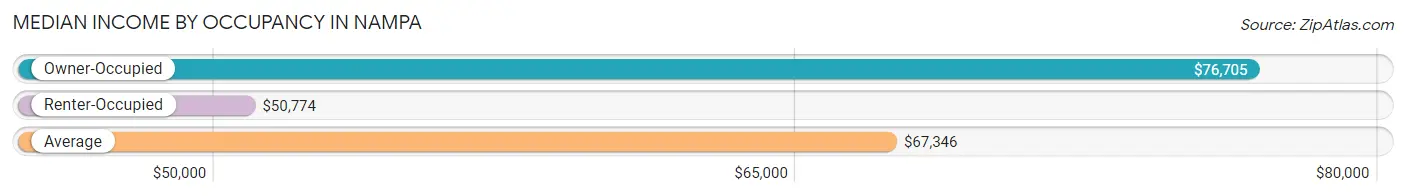
| Occupancy Type | # Households | Median Income |
| Owner-Occupied | 25,378 (70.9%) | $76,705 |
| Renter-Occupied | 10,413 (29.1%) | $50,774 |
| Average | 35,791 (100.0%) | $67,346 |
Occupancy by Householder Income Bracket in Nampa
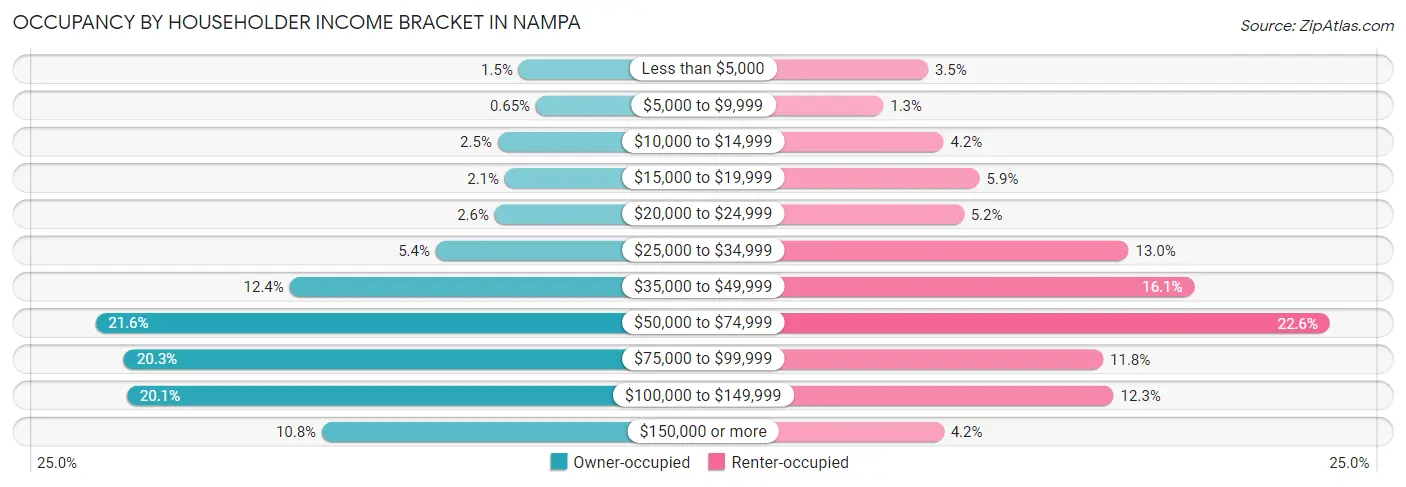
| Income Bracket | Owner-occupied | Renter-occupied |
| Less than $5,000 | 373 (1.5%) | 359 (3.5%) |
| $5,000 to $9,999 | 166 (0.6%) | 137 (1.3%) |
| $10,000 to $14,999 | 628 (2.5%) | 436 (4.2%) |
| $15,000 to $19,999 | 540 (2.1%) | 615 (5.9%) |
| $20,000 to $24,999 | 663 (2.6%) | 536 (5.1%) |
| $25,000 to $34,999 | 1,376 (5.4%) | 1,354 (13.0%) |
| $35,000 to $49,999 | 3,142 (12.4%) | 1,680 (16.1%) |
| $50,000 to $74,999 | 5,488 (21.6%) | 2,351 (22.6%) |
| $75,000 to $99,999 | 5,143 (20.3%) | 1,228 (11.8%) |
| $100,000 to $149,999 | 5,108 (20.1%) | 1,280 (12.3%) |
| $150,000 or more | 2,751 (10.8%) | 437 (4.2%) |
| Total | 25,378 (100.0%) | 10,413 (100.0%) |
Monthly Housing Cost Tiers in Nampa
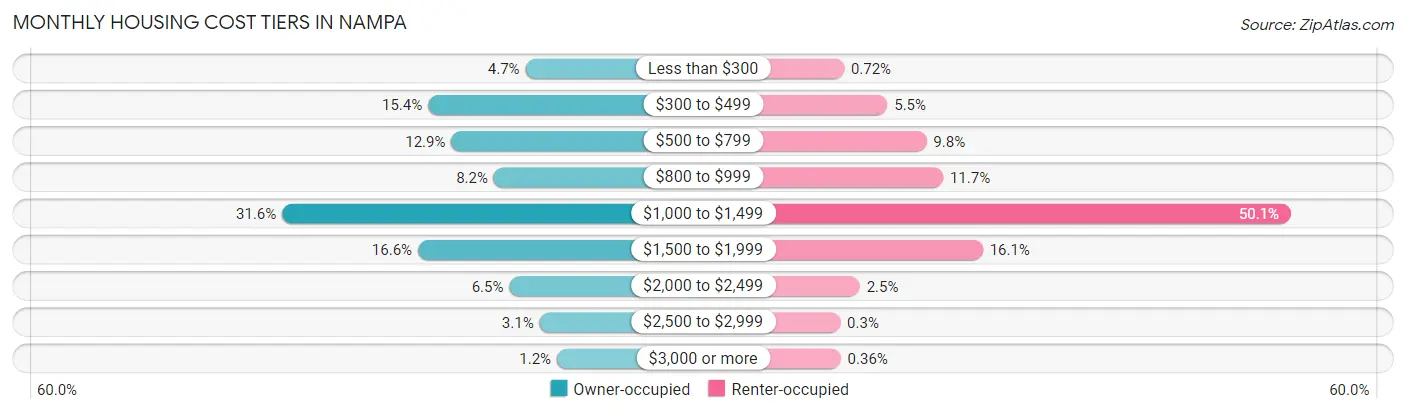
| Monthly Cost | Owner-occupied | Renter-occupied |
| Less than $300 | 1,185 (4.7%) | 75 (0.7%) |
| $300 to $499 | 3,917 (15.4%) | 574 (5.5%) |
| $500 to $799 | 3,263 (12.9%) | 1,024 (9.8%) |
| $800 to $999 | 2,074 (8.2%) | 1,214 (11.7%) |
| $1,000 to $1,499 | 8,008 (31.6%) | 5,217 (50.1%) |
| $1,500 to $1,999 | 4,199 (16.6%) | 1,671 (16.1%) |
| $2,000 to $2,499 | 1,637 (6.5%) | 256 (2.5%) |
| $2,500 to $2,999 | 793 (3.1%) | 31 (0.3%) |
| $3,000 or more | 302 (1.2%) | 37 (0.4%) |
| Total | 25,378 (100.0%) | 10,413 (100.0%) |
Physical Housing Characteristics in Nampa
Housing Structures in Nampa
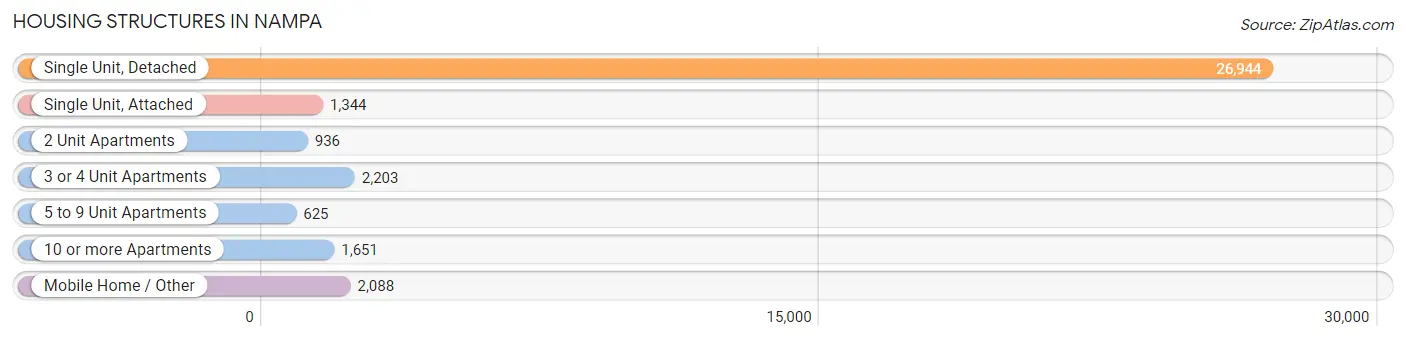
| Structure Type | # Housing Units | % Housing Units |
| Single Unit, Detached | 26,944 | 75.3% |
| Single Unit, Attached | 1,344 | 3.8% |
| 2 Unit Apartments | 936 | 2.6% |
| 3 or 4 Unit Apartments | 2,203 | 6.2% |
| 5 to 9 Unit Apartments | 625 | 1.8% |
| 10 or more Apartments | 1,651 | 4.6% |
| Mobile Home / Other | 2,088 | 5.8% |
| Total | 35,791 | 100.0% |
Housing Structures by Occupancy in Nampa
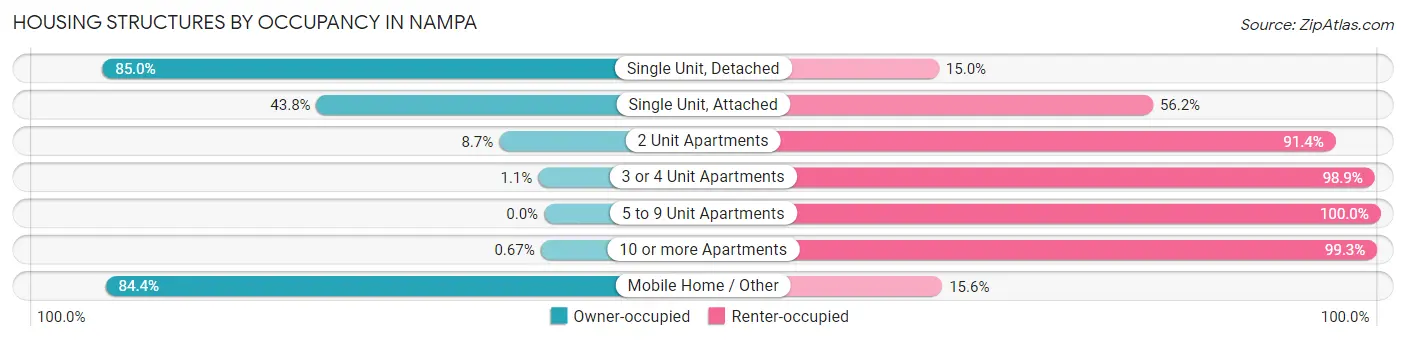
| Structure Type | Owner-occupied | Renter-occupied |
| Single Unit, Detached | 22,910 (85.0%) | 4,034 (15.0%) |
| Single Unit, Attached | 589 (43.8%) | 755 (56.2%) |
| 2 Unit Apartments | 81 (8.6%) | 855 (91.3%) |
| 3 or 4 Unit Apartments | 25 (1.1%) | 2,178 (98.9%) |
| 5 to 9 Unit Apartments | 0 (0.0%) | 625 (100.0%) |
| 10 or more Apartments | 11 (0.7%) | 1,640 (99.3%) |
| Mobile Home / Other | 1,762 (84.4%) | 326 (15.6%) |
| Total | 25,378 (70.9%) | 10,413 (29.1%) |
Housing Structures by Number of Rooms in Nampa
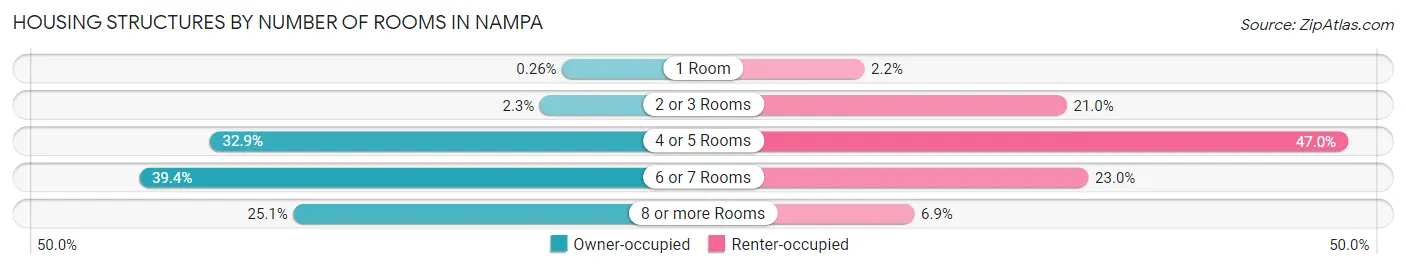
| Number of Rooms | Owner-occupied | Renter-occupied |
| 1 Room | 66 (0.3%) | 233 (2.2%) |
| 2 or 3 Rooms | 588 (2.3%) | 2,183 (21.0%) |
| 4 or 5 Rooms | 8,345 (32.9%) | 4,892 (47.0%) |
| 6 or 7 Rooms | 10,004 (39.4%) | 2,391 (23.0%) |
| 8 or more Rooms | 6,375 (25.1%) | 714 (6.9%) |
| Total | 25,378 (100.0%) | 10,413 (100.0%) |
Housing Structure by Heating Type in Nampa
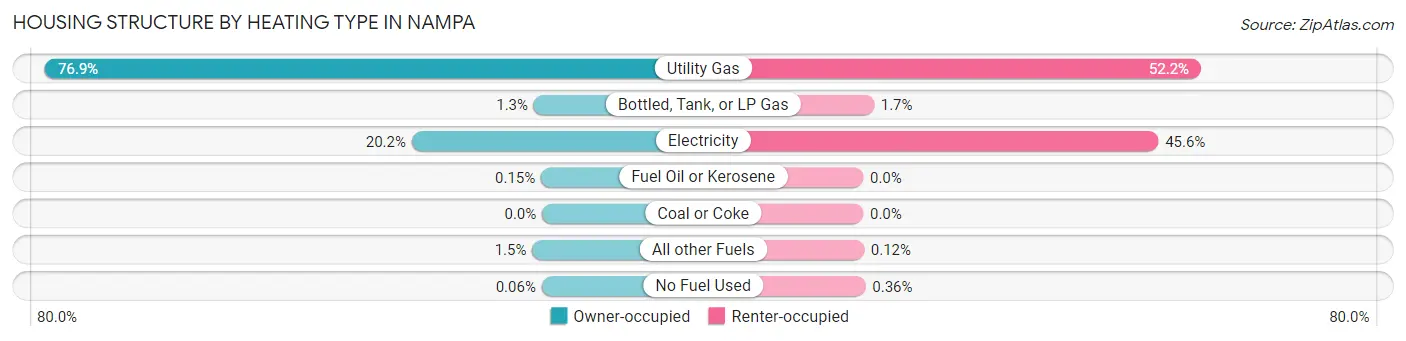
| Heating Type | Owner-occupied | Renter-occupied |
| Utility Gas | 19,502 (76.8%) | 5,439 (52.2%) |
| Bottled, Tank, or LP Gas | 323 (1.3%) | 173 (1.7%) |
| Electricity | 5,114 (20.2%) | 4,751 (45.6%) |
| Fuel Oil or Kerosene | 38 (0.2%) | 0 (0.0%) |
| Coal or Coke | 0 (0.0%) | 0 (0.0%) |
| All other Fuels | 386 (1.5%) | 13 (0.1%) |
| No Fuel Used | 15 (0.1%) | 37 (0.4%) |
| Total | 25,378 (100.0%) | 10,413 (100.0%) |
Household Vehicle Usage in Nampa
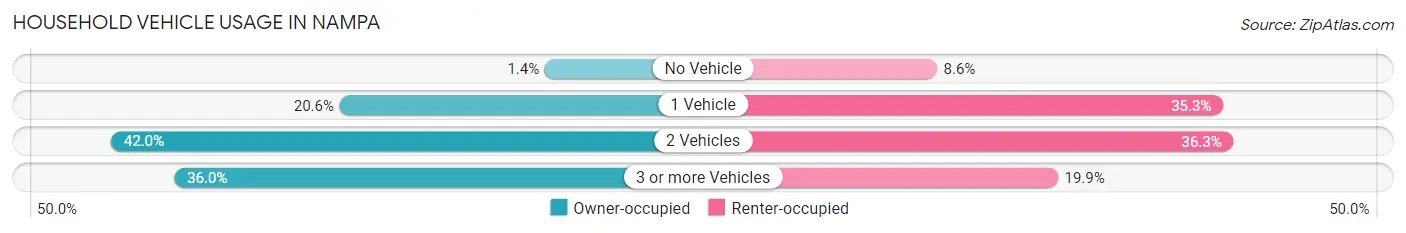
| Vehicles per Household | Owner-occupied | Renter-occupied |
| No Vehicle | 361 (1.4%) | 891 (8.6%) |
| 1 Vehicle | 5,224 (20.6%) | 3,677 (35.3%) |
| 2 Vehicles | 10,646 (41.9%) | 3,778 (36.3%) |
| 3 or more Vehicles | 9,147 (36.0%) | 2,067 (19.9%) |
| Total | 25,378 (100.0%) | 10,413 (100.0%) |
Real Estate & Mortgages in Nampa
Real Estate and Mortgage Overview in Nampa
| Characteristic | Without Mortgage | With Mortgage |
| Housing Units | 6,756 | 18,622 |
| Median Property Value | $252,000 | $299,800 |
| Median Household Income | $56,815 | $2,326 |
| Monthly Housing Costs | $431 | $290 |
| Real Estate Taxes | $1,752 | $622 |
Property Value by Mortgage Status in Nampa
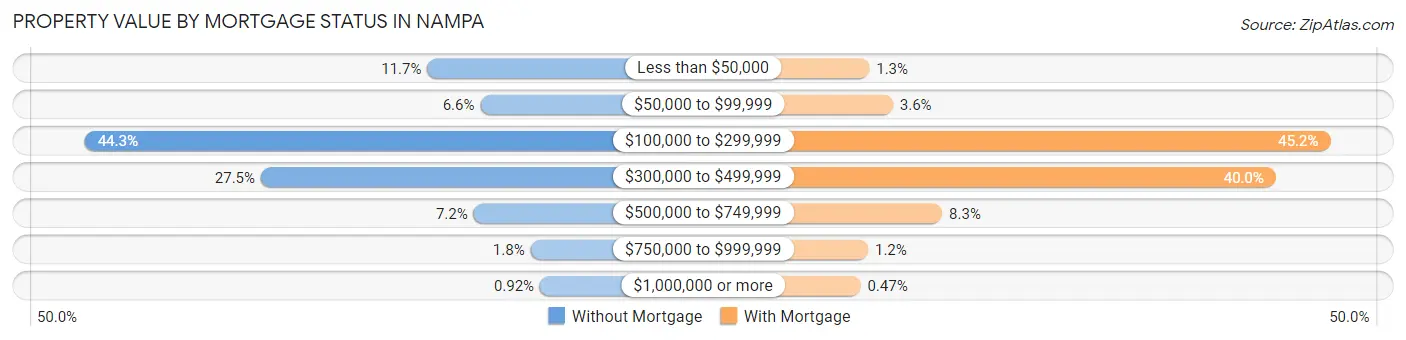
| Property Value | Without Mortgage | With Mortgage |
| Less than $50,000 | 787 (11.7%) | 244 (1.3%) |
| $50,000 to $99,999 | 446 (6.6%) | 662 (3.5%) |
| $100,000 to $299,999 | 2,991 (44.3%) | 8,419 (45.2%) |
| $300,000 to $499,999 | 1,858 (27.5%) | 7,452 (40.0%) |
| $500,000 to $749,999 | 489 (7.2%) | 1,537 (8.3%) |
| $750,000 to $999,999 | 123 (1.8%) | 221 (1.2%) |
| $1,000,000 or more | 62 (0.9%) | 87 (0.5%) |
| Total | 6,756 (100.0%) | 18,622 (100.0%) |
Household Income by Mortgage Status in Nampa
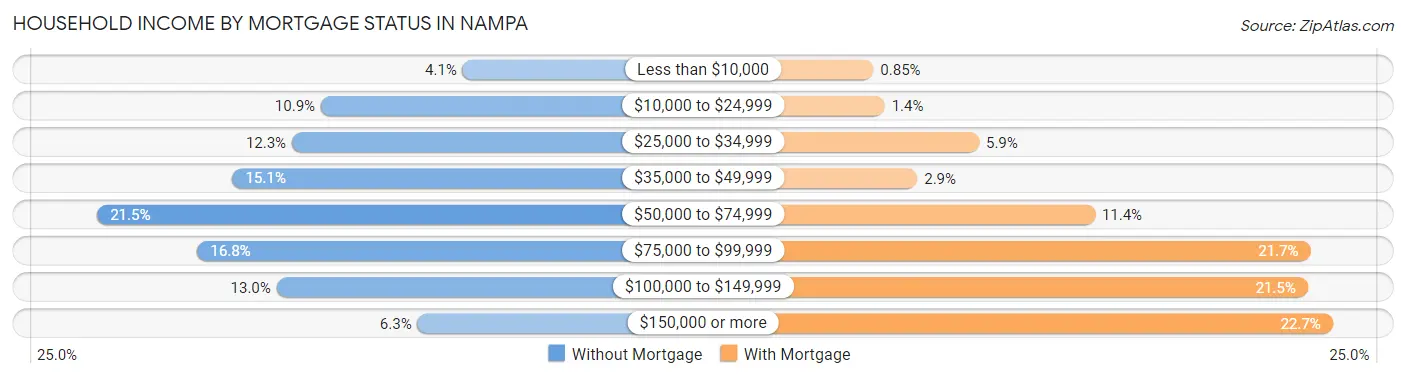
| Household Income | Without Mortgage | With Mortgage |
| Less than $10,000 | 280 (4.1%) | 159 (0.9%) |
| $10,000 to $24,999 | 736 (10.9%) | 259 (1.4%) |
| $25,000 to $34,999 | 829 (12.3%) | 1,095 (5.9%) |
| $35,000 to $49,999 | 1,020 (15.1%) | 547 (2.9%) |
| $50,000 to $74,999 | 1,455 (21.5%) | 2,122 (11.4%) |
| $75,000 to $99,999 | 1,133 (16.8%) | 4,033 (21.7%) |
| $100,000 to $149,999 | 878 (13.0%) | 4,010 (21.5%) |
| $150,000 or more | 425 (6.3%) | 4,230 (22.7%) |
| Total | 6,756 (100.0%) | 18,622 (100.0%) |
Property Value to Household Income Ratio in Nampa
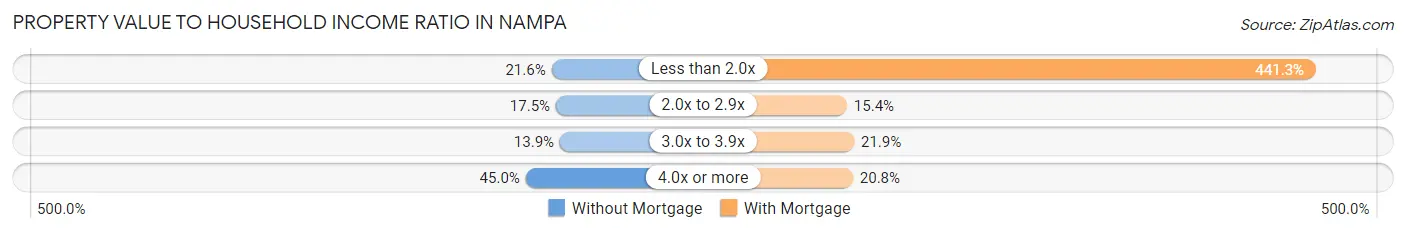
| Value-to-Income Ratio | Without Mortgage | With Mortgage |
| Less than 2.0x | 1,456 (21.5%) | 82,179 (441.3%) |
| 2.0x to 2.9x | 1,184 (17.5%) | 2,875 (15.4%) |
| 3.0x to 3.9x | 939 (13.9%) | 4,073 (21.9%) |
| 4.0x or more | 3,041 (45.0%) | 3,877 (20.8%) |
| Total | 6,756 (100.0%) | 18,622 (100.0%) |
Real Estate Taxes by Mortgage Status in Nampa
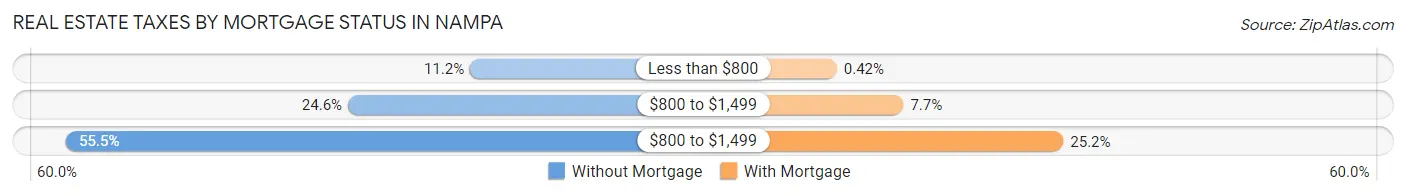
| Property Taxes | Without Mortgage | With Mortgage |
| Less than $800 | 755 (11.2%) | 79 (0.4%) |
| $800 to $1,499 | 1,660 (24.6%) | 1,438 (7.7%) |
| $800 to $1,499 | 3,747 (55.5%) | 4,701 (25.2%) |
| Total | 6,756 (100.0%) | 18,622 (100.0%) |
Health & Disability in Nampa
Health Insurance Coverage by Age in Nampa
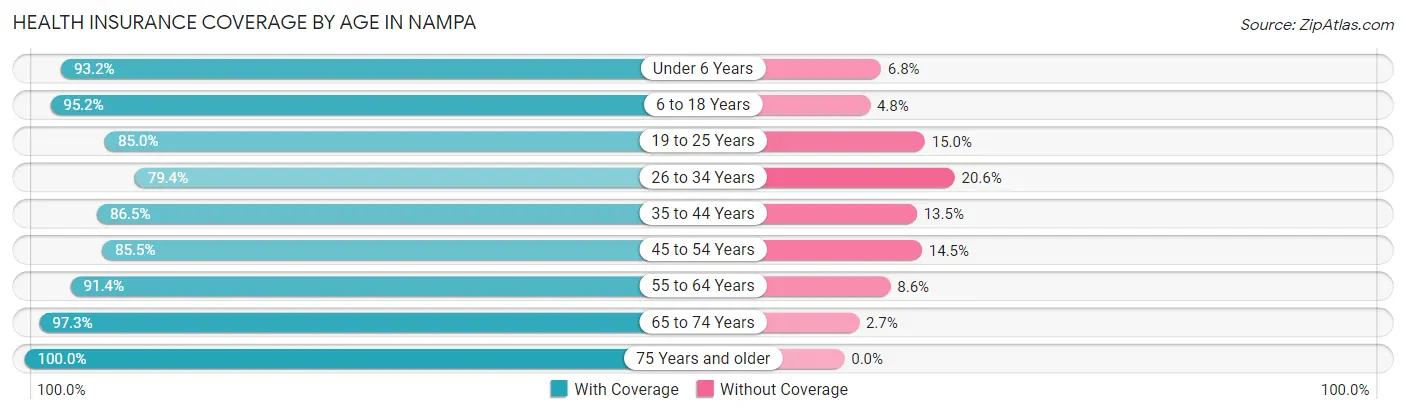
| Age Bracket | With Coverage | Without Coverage |
| Under 6 Years | 8,145 (93.2%) | 596 (6.8%) |
| 6 to 18 Years | 17,458 (95.2%) | 879 (4.8%) |
| 19 to 25 Years | 10,220 (85.0%) | 1,807 (15.0%) |
| 26 to 34 Years | 11,305 (79.4%) | 2,926 (20.6%) |
| 35 to 44 Years | 11,408 (86.5%) | 1,782 (13.5%) |
| 45 to 54 Years | 9,762 (85.5%) | 1,650 (14.5%) |
| 55 to 64 Years | 8,767 (91.4%) | 824 (8.6%) |
| 65 to 74 Years | 8,569 (97.3%) | 241 (2.7%) |
| 75 Years and older | 5,283 (100.0%) | 0 (0.0%) |
| Total | 90,917 (89.5%) | 10,705 (10.5%) |
Health Insurance Coverage by Citizenship Status in Nampa
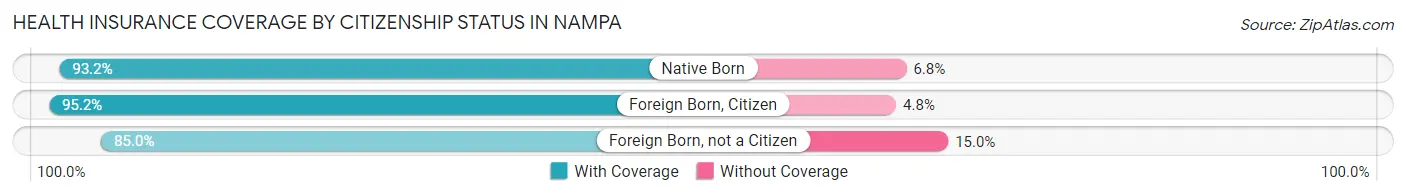
| Citizenship Status | With Coverage | Without Coverage |
| Native Born | 8,145 (93.2%) | 596 (6.8%) |
| Foreign Born, Citizen | 17,458 (95.2%) | 879 (4.8%) |
| Foreign Born, not a Citizen | 10,220 (85.0%) | 1,807 (15.0%) |
Health Insurance Coverage by Household Income in Nampa
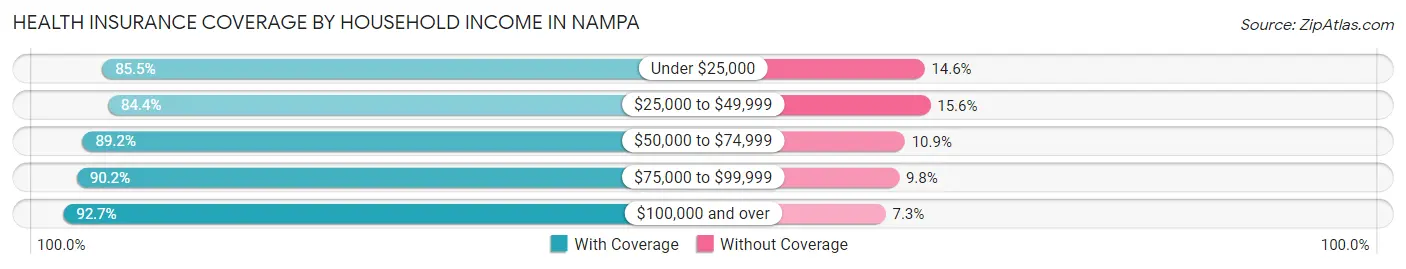
| Household Income | With Coverage | Without Coverage |
| Under $25,000 | 7,018 (85.5%) | 1,195 (14.5%) |
| $25,000 to $49,999 | 14,263 (84.4%) | 2,644 (15.6%) |
| $50,000 to $74,999 | 19,612 (89.1%) | 2,387 (10.8%) |
| $75,000 to $99,999 | 16,657 (90.2%) | 1,805 (9.8%) |
| $100,000 and over | 31,590 (92.7%) | 2,474 (7.3%) |
Public vs Private Health Insurance Coverage by Age in Nampa
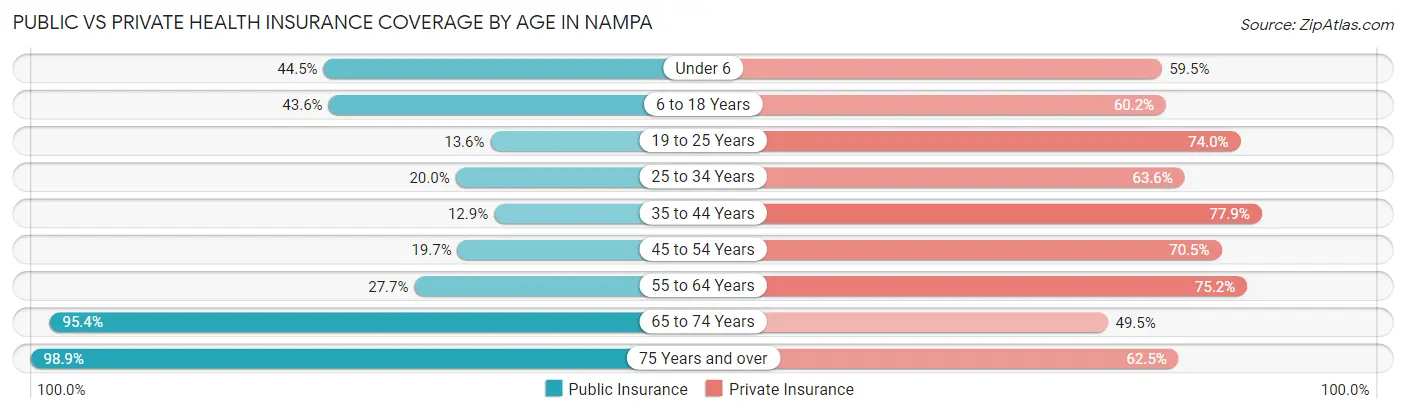
| Age Bracket | Public Insurance | Private Insurance |
| Under 6 | 3,893 (44.5%) | 5,199 (59.5%) |
| 6 to 18 Years | 7,996 (43.6%) | 11,031 (60.2%) |
| 19 to 25 Years | 1,631 (13.6%) | 8,898 (74.0%) |
| 25 to 34 Years | 2,849 (20.0%) | 9,055 (63.6%) |
| 35 to 44 Years | 1,698 (12.9%) | 10,276 (77.9%) |
| 45 to 54 Years | 2,243 (19.7%) | 8,040 (70.5%) |
| 55 to 64 Years | 2,654 (27.7%) | 7,215 (75.2%) |
| 65 to 74 Years | 8,401 (95.4%) | 4,362 (49.5%) |
| 75 Years and over | 5,224 (98.9%) | 3,303 (62.5%) |
| Total | 36,589 (36.0%) | 67,379 (66.3%) |
Disability Status by Sex by Age in Nampa
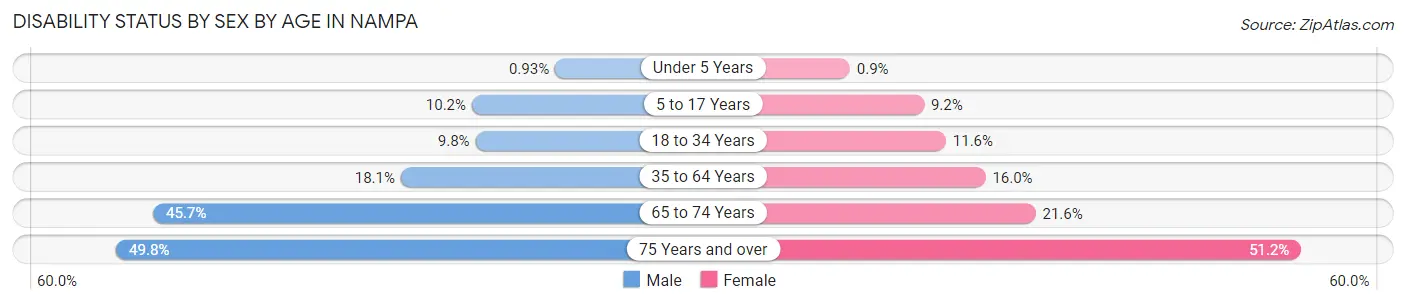
| Age Bracket | Male | Female |
| Under 5 Years | 33 (0.9%) | 30 (0.9%) |
| 5 to 17 Years | 982 (10.2%) | 838 (9.1%) |
| 18 to 34 Years | 1,402 (9.8%) | 1,545 (11.6%) |
| 35 to 64 Years | 3,056 (18.1%) | 2,769 (16.0%) |
| 65 to 74 Years | 1,866 (45.7%) | 1,020 (21.6%) |
| 75 Years and over | 1,123 (49.8%) | 1,549 (51.2%) |
Disability Class by Sex by Age in Nampa
Disability Class: Hearing Difficulty
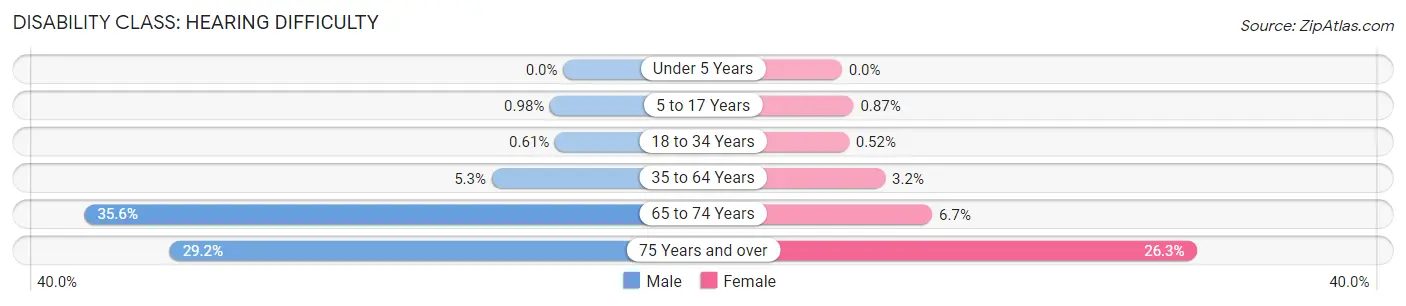
| Age Bracket | Male | Female |
| Under 5 Years | 0 (0.0%) | 0 (0.0%) |
| 5 to 17 Years | 94 (1.0%) | 80 (0.9%) |
| 18 to 34 Years | 87 (0.6%) | 69 (0.5%) |
| 35 to 64 Years | 897 (5.3%) | 558 (3.2%) |
| 65 to 74 Years | 1,452 (35.5%) | 317 (6.7%) |
| 75 Years and over | 659 (29.2%) | 797 (26.3%) |
Disability Class: Vision Difficulty
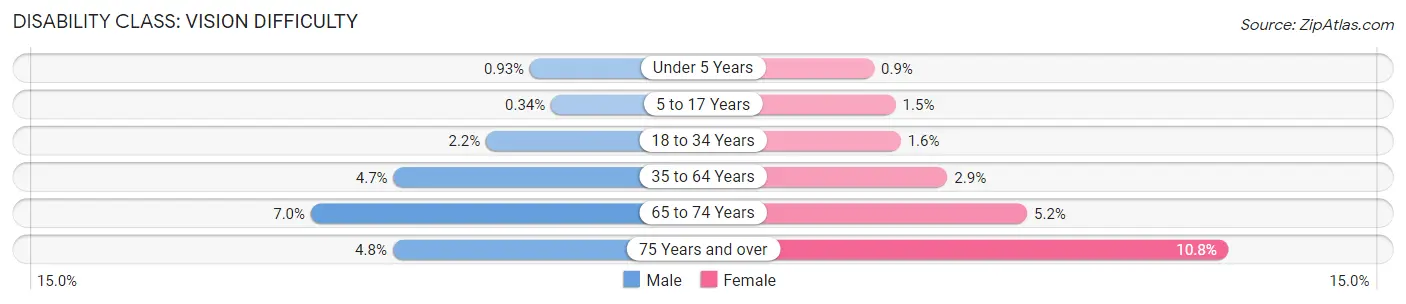
| Age Bracket | Male | Female |
| Under 5 Years | 33 (0.9%) | 30 (0.9%) |
| 5 to 17 Years | 33 (0.3%) | 137 (1.5%) |
| 18 to 34 Years | 308 (2.1%) | 219 (1.6%) |
| 35 to 64 Years | 798 (4.7%) | 509 (2.9%) |
| 65 to 74 Years | 287 (7.0%) | 244 (5.2%) |
| 75 Years and over | 107 (4.8%) | 326 (10.8%) |
Disability Class: Cognitive Difficulty
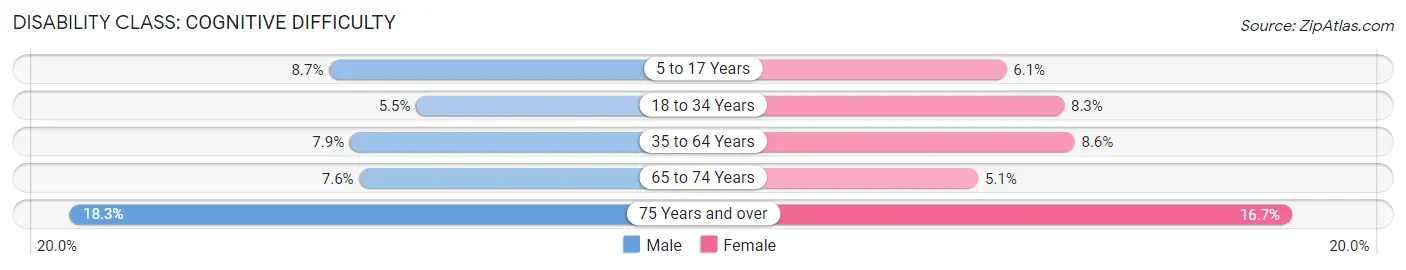
| Age Bracket | Male | Female |
| 5 to 17 Years | 837 (8.7%) | 560 (6.1%) |
| 18 to 34 Years | 782 (5.5%) | 1,099 (8.3%) |
| 35 to 64 Years | 1,337 (7.9%) | 1,495 (8.6%) |
| 65 to 74 Years | 309 (7.6%) | 239 (5.1%) |
| 75 Years and over | 413 (18.3%) | 506 (16.7%) |
Disability Class: Ambulatory Difficulty
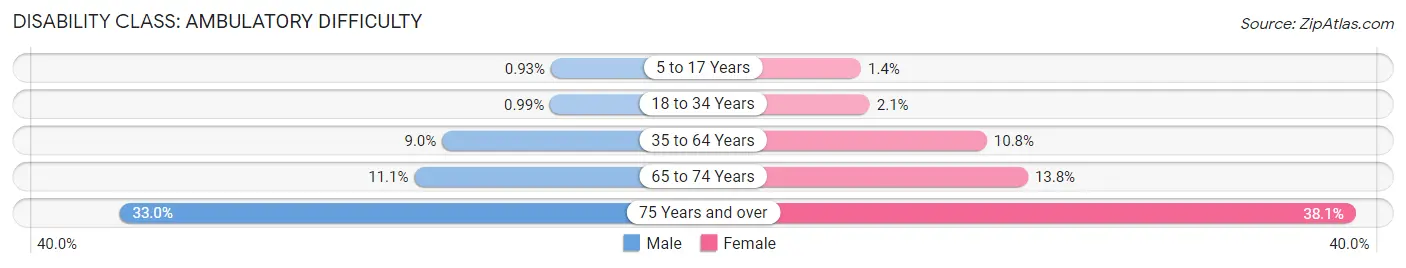
| Age Bracket | Male | Female |
| 5 to 17 Years | 90 (0.9%) | 131 (1.4%) |
| 18 to 34 Years | 142 (1.0%) | 277 (2.1%) |
| 35 to 64 Years | 1,519 (9.0%) | 1,863 (10.8%) |
| 65 to 74 Years | 452 (11.1%) | 653 (13.8%) |
| 75 Years and over | 743 (33.0%) | 1,155 (38.1%) |
Disability Class: Self-Care Difficulty
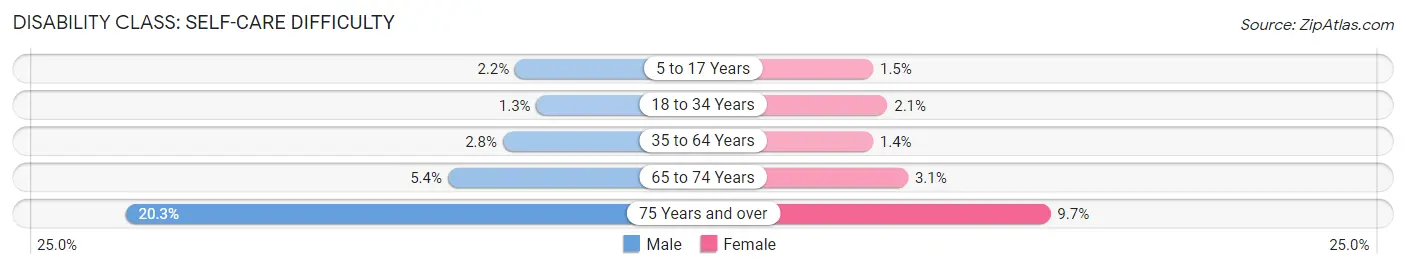
| Age Bracket | Male | Female |
| 5 to 17 Years | 216 (2.2%) | 133 (1.5%) |
| 18 to 34 Years | 179 (1.3%) | 281 (2.1%) |
| 35 to 64 Years | 474 (2.8%) | 250 (1.4%) |
| 65 to 74 Years | 219 (5.4%) | 145 (3.1%) |
| 75 Years and over | 458 (20.3%) | 293 (9.7%) |
Technology Access in Nampa
Computing Device Access in Nampa
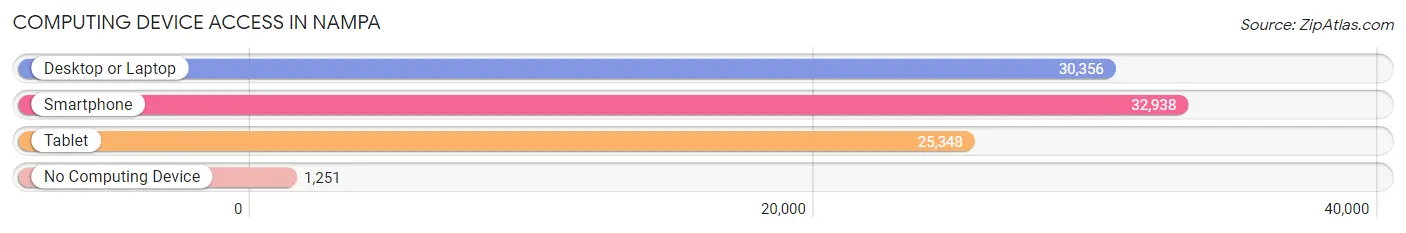
| Device Type | # Households | % Households |
| Desktop or Laptop | 30,356 | 84.8% |
| Smartphone | 32,938 | 92.0% |
| Tablet | 25,348 | 70.8% |
| No Computing Device | 1,251 | 3.5% |
| Total | 35,791 | 100.0% |
Internet Access in Nampa
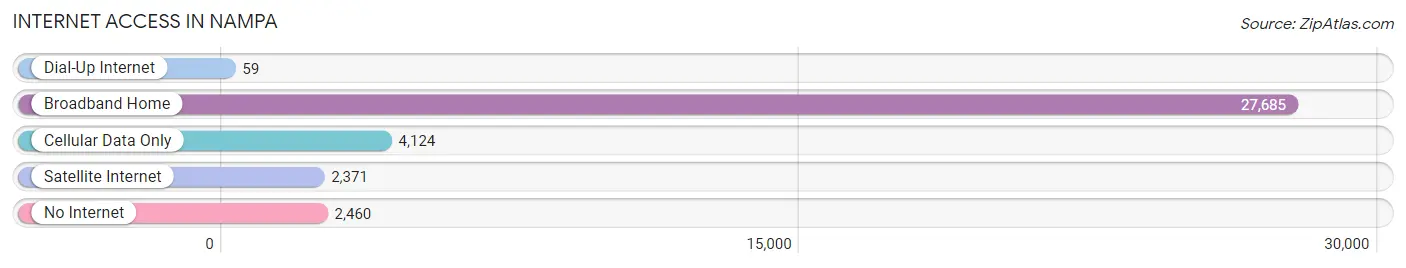
| Internet Type | # Households | % Households |
| Dial-Up Internet | 59 | 0.2% |
| Broadband Home | 27,685 | 77.3% |
| Cellular Data Only | 4,124 | 11.5% |
| Satellite Internet | 2,371 | 6.6% |
| No Internet | 2,460 | 6.9% |
| Total | 35,791 | 100.0% |
Nampa Summary
Nampa, Idaho is a city located in Canyon County, Idaho, United States. It is the second largest city in the state, with a population of 91,382 as of the 2010 census. The city is located about 20 miles west of Boise, the state capital.
History
Nampa was founded in 1885 by Alexander and William Duffes, two brothers who had recently moved to the area from Wisconsin. The brothers named the city after a Shoshone word meaning “foot of the mountain”. The city was incorporated in 1890 and quickly grew to become an important agricultural center in the region.
In the early 1900s, Nampa was a major stop on the Oregon Short Line Railroad, which connected the city to the rest of the country. This allowed the city to become a major shipping hub for the region, and it soon became known as the “Hay Capital of the World”.
In the 1950s, Nampa began to experience a population boom as people moved to the city from other parts of the country. This growth was fueled by the construction of the nearby Idaho National Laboratory, which brought many new jobs to the area.
Geography
Nampa is located in the Treasure Valley region of Idaho, which is part of the larger Columbia Plateau. The city is situated on the Snake River, which flows through the city and provides a source of irrigation for the surrounding agricultural lands.
The city is surrounded by several mountain ranges, including the Owyhee Mountains to the south, the Boise Mountains to the east, and the Seven Devils Mountains to the north. The city is also located near several large reservoirs, including Lake Lowell and Lake Cascade.
Economy
Nampa’s economy is largely based on agriculture, with the city being the largest producer of hay in the world. Other major industries in the city include food processing, manufacturing, and technology.
The city is also home to several large companies, including J.R. Simplot Company, which is one of the largest potato processors in the world. Other major employers in the city include the Idaho National Laboratory, the Idaho Department of Corrections, and the Nampa School District.
Demographics
As of the 2010 census, the population of Nampa was 91,382. The city has a diverse population, with the largest ethnic groups being White (77.3%), Hispanic or Latino (14.2%), and Native American (2.2%).
The median household income in Nampa is $45,837, and the median home value is $164,400. The city has a poverty rate of 16.2%, which is slightly higher than the national average.
Nampa is served by the Nampa School District, which includes 11 elementary schools, four middle schools, and two high schools. The city is also home to several higher education institutions, including Northwest Nazarene University and College of Western Idaho.
Common Questions
What is Per Capita Income in Nampa?
Per Capita income in Nampa is $28,030.
What is the Median Family Income in Nampa?
Median Family Income in Nampa is $77,621.
What is the Median Household income in Nampa?
Median Household Income in Nampa is $67,346.
What is Income or Wage Gap in Nampa?
Income or Wage Gap in Nampa is 30.8%.
Women in Nampa earn 69.2 cents for every dollar earned by a man.
What is Family Income Deficit in Nampa?
Family Income Deficit in Nampa is $10,128.
Families that are below poverty line in Nampa earn $10,128 less on average than the poverty threshold level.
What is Inequality or Gini Index in Nampa?
Inequality or Gini Index in Nampa is 0.37.
What is the Total Population of Nampa?
Total Population of Nampa is 102,598.
What is the Total Male Population of Nampa?
Total Male Population of Nampa is 51,219.
What is the Total Female Population of Nampa?
Total Female Population of Nampa is 51,379.
What is the Ratio of Males per 100 Females in Nampa?
There are 99.69 Males per 100 Females in Nampa.
What is the Ratio of Females per 100 Males in Nampa?
There are 100.31 Females per 100 Males in Nampa.
What is the Median Population Age in Nampa?
Median Population Age in Nampa is 33.5 Years.
What is the Average Family Size in Nampa
Average Family Size in Nampa is 3.2 People.
What is the Average Household Size in Nampa
Average Household Size in Nampa is 2.8 People.
How Large is the Labor Force in Nampa?
There are 51,476 People in the Labor Forcein in Nampa.
What is the Percentage of People in the Labor Force in Nampa?
64.8% of People are in the Labor Force in Nampa.
What is the Unemployment Rate in Nampa?
Unemployment Rate in Nampa is 3.0%.