Bryan, TX Map & Demographics
Bryan Map
Bryan Overview
$28,756
PER CAPITA INCOME
$70,012
AVG FAMILY INCOME
$55,234
AVG HOUSEHOLD INCOME
24.8%
WAGE / INCOME GAP [ % ]
75.2¢/ $1
WAGE / INCOME GAP [ $ ]
$11,557
FAMILY INCOME DEFICIT
0.47
INEQUALITY / GINI INDEX
84,820
TOTAL POPULATION
42,572
MALE POPULATION
42,248
FEMALE POPULATION
100.77
MALES / 100 FEMALES
99.24
FEMALES / 100 MALES
30.8
MEDIAN AGE
3.4
AVG FAMILY SIZE
2.6
AVG HOUSEHOLD SIZE
41,816
LABOR FORCE [ PEOPLE ]
62.9%
PERCENT IN LABOR FORCE
4.9%
UNEMPLOYMENT RATE
Bryan Area Codes
Income in Bryan
Income Overview in Bryan
Per Capita Income in Bryan is $28,756, while median incomes of families and households are $70,012 and $55,234 respectively.
| Characteristic | Number | Measure |
| Per Capita Income | 84,820 | $28,756 |
| Median Family Income | 17,931 | $70,012 |
| Mean Family Income | 17,931 | $89,559 |
| Median Household Income | 31,238 | $55,234 |
| Mean Household Income | 31,238 | $73,359 |
| Income Deficit | 17,931 | $11,557 |
| Wage / Income Gap (%) | 84,820 | 24.81% |
| Wage / Income Gap ($) | 84,820 | 75.19¢ per $1 |
| Gini / Inequality Index | 84,820 | 0.47 |
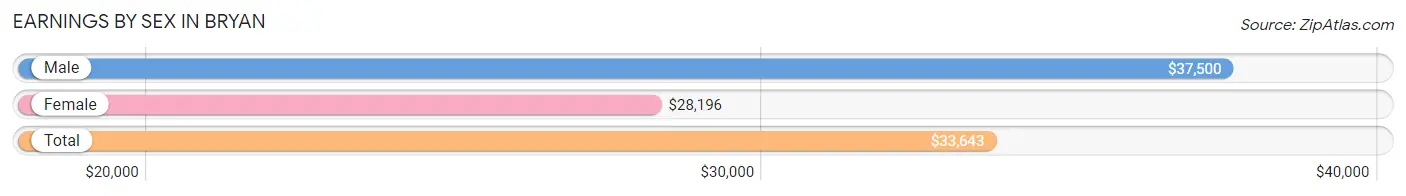
Earnings by Sex in Bryan
Average Earnings in Bryan are $33,643, $37,500 for men and $28,196 for women, a difference of 24.8%.
| Sex | Number | Average Earnings |
| Male | 23,910 (52.9%) | $37,500 |
| Female | 21,326 (47.1%) | $28,196 |
| Total | 45,236 (100.0%) | $33,643 |
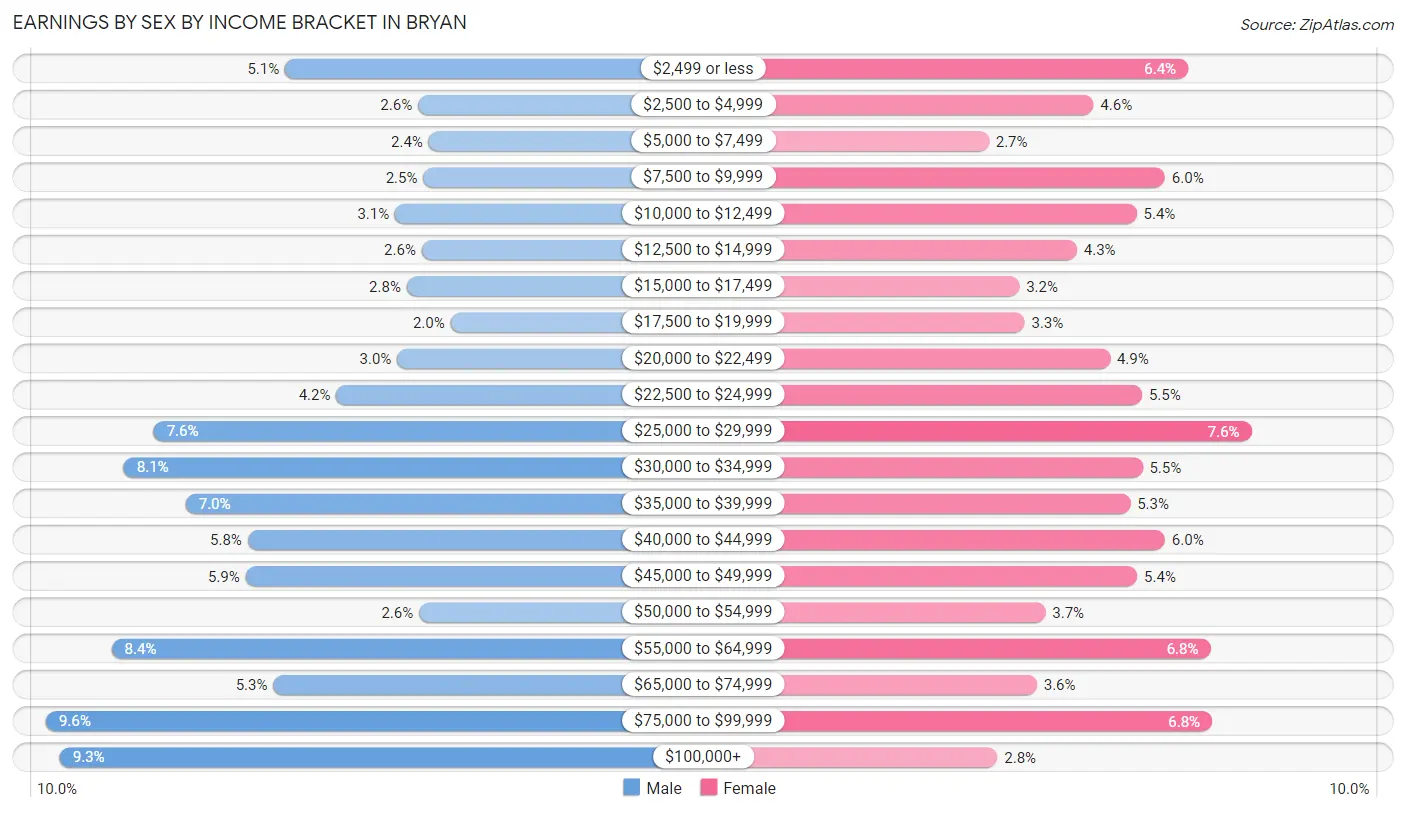
Earnings by Sex by Income Bracket in Bryan
The most common earnings brackets in Bryan are $75,000 to $99,999 for men (2,296 | 9.6%) and $25,000 to $29,999 for women (1,616 | 7.6%).
| Income | Male | Female |
| $2,499 or less | 1,223 (5.1%) | 1,362 (6.4%) |
| $2,500 to $4,999 | 628 (2.6%) | 986 (4.6%) |
| $5,000 to $7,499 | 581 (2.4%) | 568 (2.7%) |
| $7,500 to $9,999 | 606 (2.5%) | 1,272 (6.0%) |
| $10,000 to $12,499 | 732 (3.1%) | 1,159 (5.4%) |
| $12,500 to $14,999 | 611 (2.6%) | 920 (4.3%) |
| $15,000 to $17,499 | 679 (2.8%) | 688 (3.2%) |
| $17,500 to $19,999 | 483 (2.0%) | 710 (3.3%) |
| $20,000 to $22,499 | 721 (3.0%) | 1,052 (4.9%) |
| $22,500 to $24,999 | 994 (4.2%) | 1,180 (5.5%) |
| $25,000 to $29,999 | 1,812 (7.6%) | 1,616 (7.6%) |
| $30,000 to $34,999 | 1,947 (8.1%) | 1,181 (5.5%) |
| $35,000 to $39,999 | 1,670 (7.0%) | 1,132 (5.3%) |
| $40,000 to $44,999 | 1,391 (5.8%) | 1,272 (6.0%) |
| $45,000 to $49,999 | 1,402 (5.9%) | 1,161 (5.4%) |
| $50,000 to $54,999 | 623 (2.6%) | 794 (3.7%) |
| $55,000 to $64,999 | 2,001 (8.4%) | 1,453 (6.8%) |
| $65,000 to $74,999 | 1,277 (5.3%) | 760 (3.6%) |
| $75,000 to $99,999 | 2,296 (9.6%) | 1,458 (6.8%) |
| $100,000+ | 2,233 (9.3%) | 602 (2.8%) |
| Total | 23,910 (100.0%) | 21,326 (100.0%) |
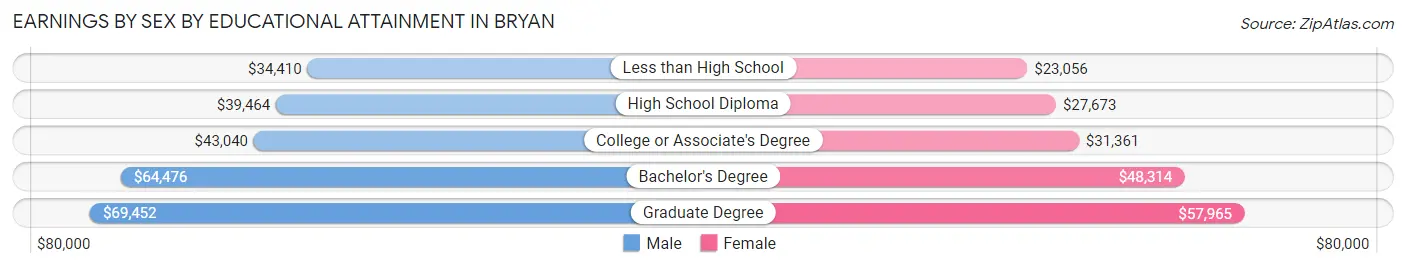
Earnings by Sex by Educational Attainment in Bryan
Average earnings in Bryan are $44,857 for men and $34,786 for women, a difference of 22.5%. Men with an educational attainment of graduate degree enjoy the highest average annual earnings of $69,452, while those with less than high school education earn the least with $34,410. Women with an educational attainment of graduate degree earn the most with the average annual earnings of $57,965, while those with less than high school education have the smallest earnings of $23,056.
| Educational Attainment | Male Income | Female Income |
| Less than High School | $34,410 | $23,056 |
| High School Diploma | $39,464 | $27,673 |
| College or Associate's Degree | $43,040 | $31,361 |
| Bachelor's Degree | $64,476 | $48,314 |
| Graduate Degree | $69,452 | $57,965 |
| Total | $44,857 | $34,786 |
Family Income in Bryan
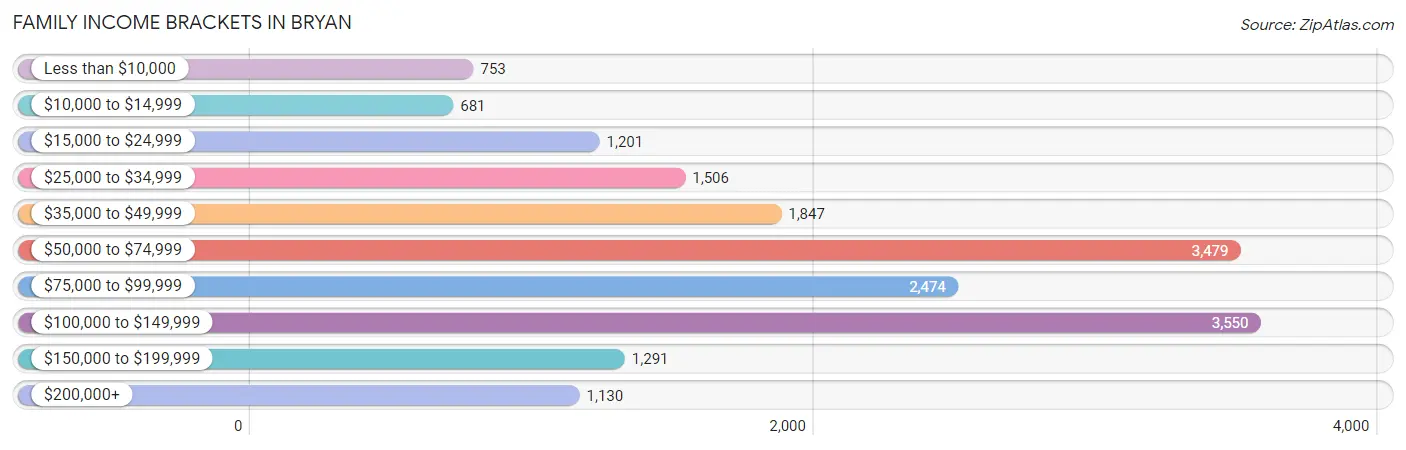
Family Income Brackets in Bryan
According to the Bryan family income data, there are 3,550 families falling into the $100,000 to $149,999 income range, which is the most common income bracket and makes up 19.8% of all families. Conversely, the $10,000 to $14,999 income bracket is the least frequent group with only 681 families (3.8%) belonging to this category.
| Income Bracket | # Families | % Families |
| Less than $10,000 | 753 | 4.2% |
| $10,000 to $14,999 | 681 | 3.8% |
| $15,000 to $24,999 | 1,201 | 6.7% |
| $25,000 to $34,999 | 1,506 | 8.4% |
| $35,000 to $49,999 | 1,847 | 10.3% |
| $50,000 to $74,999 | 3,479 | 19.4% |
| $75,000 to $99,999 | 2,474 | 13.8% |
| $100,000 to $149,999 | 3,550 | 19.8% |
| $150,000 to $199,999 | 1,291 | 7.2% |
| $200,000+ | 1,130 | 6.3% |
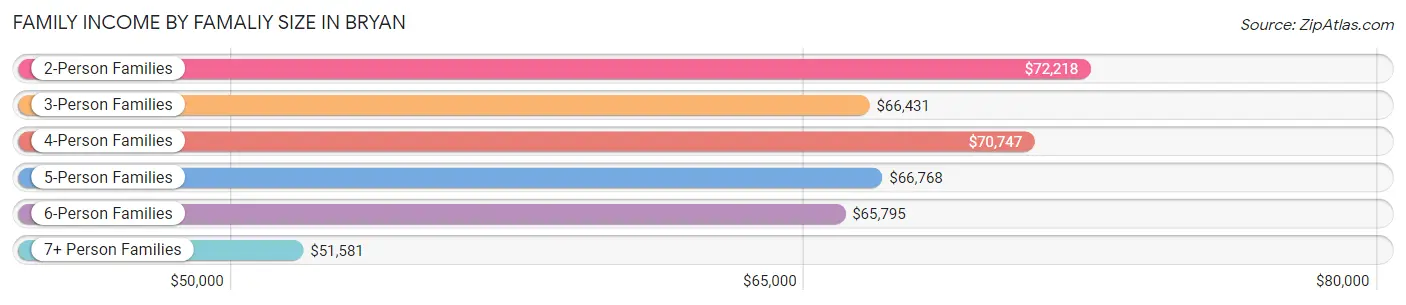
Family Income by Famaliy Size in Bryan
2-person families (7,998 | 44.6%) account for the highest median family income in Bryan with $72,218 per family, while 2-person families (7,998 | 44.6%) have the highest median income of $36,109 per family member.
| Income Bracket | # Families | Median Income |
| 2-Person Families | 7,998 (44.6%) | $72,218 |
| 3-Person Families | 3,392 (18.9%) | $66,431 |
| 4-Person Families | 3,143 (17.5%) | $70,747 |
| 5-Person Families | 2,062 (11.5%) | $66,768 |
| 6-Person Families | 827 (4.6%) | $65,795 |
| 7+ Person Families | 509 (2.8%) | $51,581 |
| Total | 17,931 (100.0%) | $70,012 |
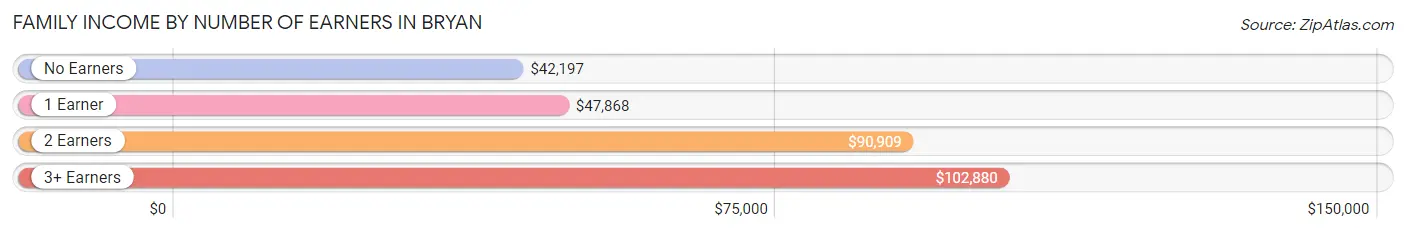
Family Income by Number of Earners in Bryan
The median family income in Bryan is $70,012, with families comprising 3+ earners (2,056) having the highest median family income of $102,880, while families with no earners (2,269) have the lowest median family income of $42,197, accounting for 11.5% and 12.7% of families, respectively.
| Number of Earners | # Families | Median Income |
| No Earners | 2,269 (12.7%) | $42,197 |
| 1 Earner | 6,410 (35.7%) | $47,868 |
| 2 Earners | 7,196 (40.1%) | $90,909 |
| 3+ Earners | 2,056 (11.5%) | $102,880 |
| Total | 17,931 (100.0%) | $70,012 |
Household Income in Bryan
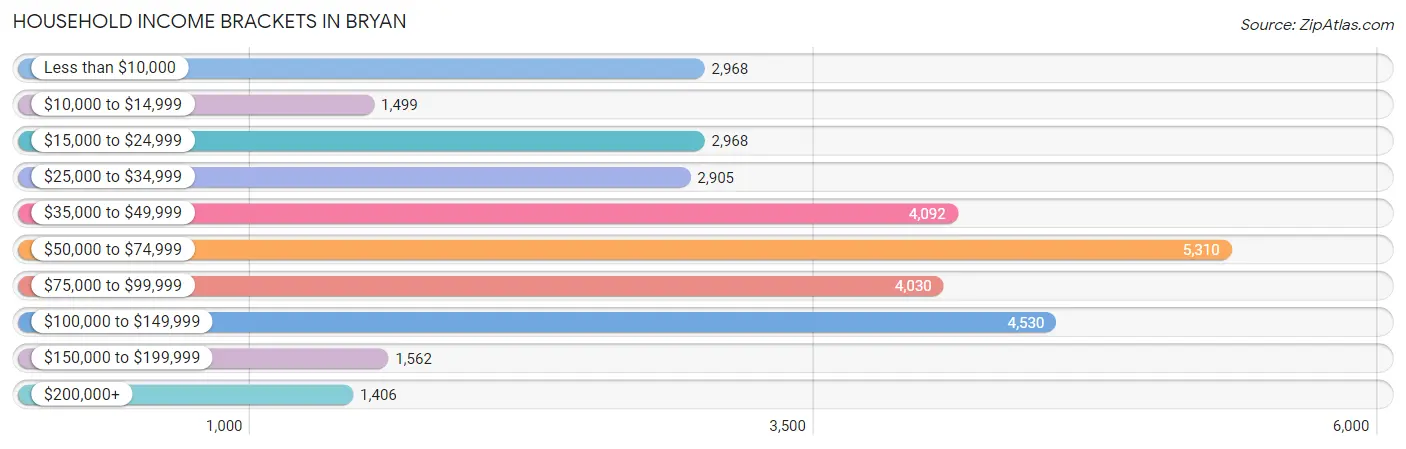
Household Income Brackets in Bryan
With 5,310 households falling in the category, the $50,000 to $74,999 income range is the most frequent in Bryan, accounting for 17.0% of all households. In contrast, only 1,406 households (4.5%) fall into the $200,000+ income bracket, making it the least populous group.
| Income Bracket | # Households | % Households |
| Less than $10,000 | 2,968 | 9.5% |
| $10,000 to $14,999 | 1,499 | 4.8% |
| $15,000 to $24,999 | 2,968 | 9.5% |
| $25,000 to $34,999 | 2,905 | 9.3% |
| $35,000 to $49,999 | 4,092 | 13.1% |
| $50,000 to $74,999 | 5,310 | 17.0% |
| $75,000 to $99,999 | 4,030 | 12.9% |
| $100,000 to $149,999 | 4,530 | 14.5% |
| $150,000 to $199,999 | 1,562 | 5.0% |
| $200,000+ | 1,406 | 4.5% |
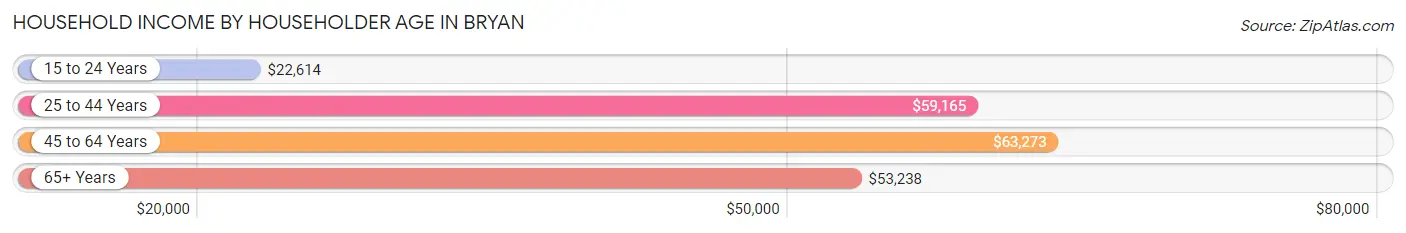
Household Income by Householder Age in Bryan
The median household income in Bryan is $55,234, with the highest median household income of $63,273 found in the 45 to 64 years age bracket for the primary householder. A total of 9,348 households (29.9%) fall into this category. Meanwhile, the 15 to 24 years age bracket for the primary householder has the lowest median household income of $22,614, with 3,699 households (11.8%) in this group.
| Income Bracket | # Households | Median Income |
| 15 to 24 Years | 3,699 (11.8%) | $22,614 |
| 25 to 44 Years | 12,219 (39.1%) | $59,165 |
| 45 to 64 Years | 9,348 (29.9%) | $63,273 |
| 65+ Years | 5,972 (19.1%) | $53,238 |
| Total | 31,238 (100.0%) | $55,234 |
Poverty in Bryan
Income Below Poverty by Sex and Age in Bryan
With 21.4% poverty level for males and 27.7% for females among the residents of Bryan, 18 to 24 year old males and 18 to 24 year old females are the most vulnerable to poverty, with 2,624 males (44.6%) and 3,146 females (49.8%) in their respective age groups living below the poverty level.
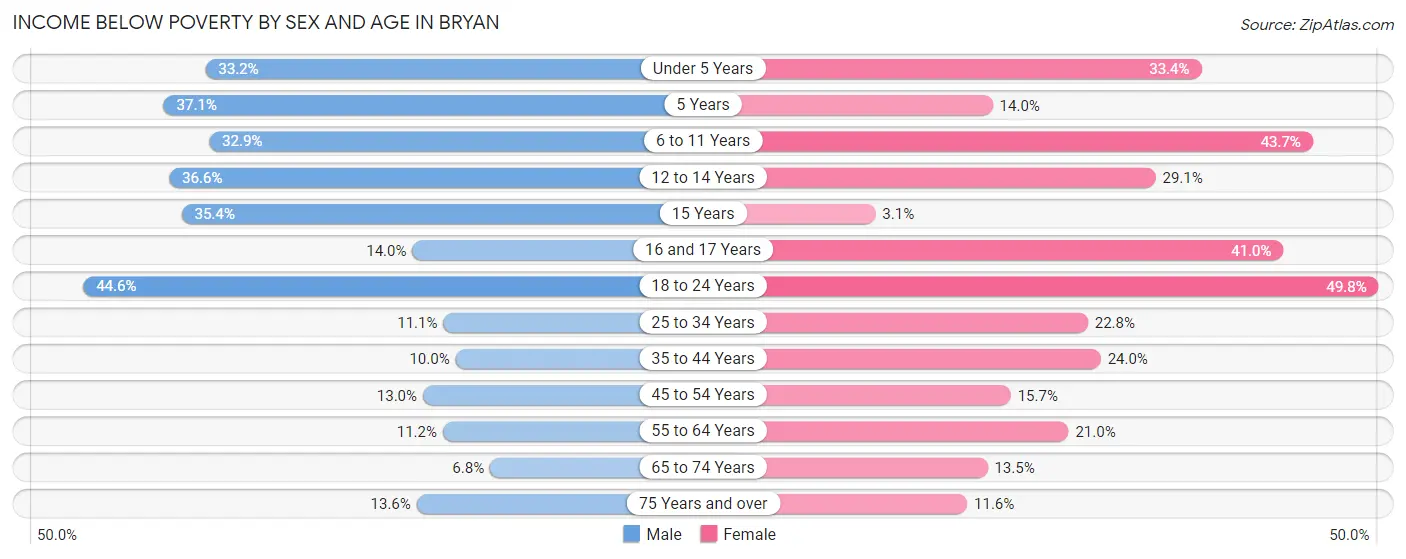
| Age Bracket | Male | Female |
| Under 5 Years | 1,032 (33.2%) | 894 (33.4%) |
| 5 Years | 168 (37.1%) | 91 (14.0%) |
| 6 to 11 Years | 1,195 (32.9%) | 1,480 (43.7%) |
| 12 to 14 Years | 652 (36.6%) | 458 (29.1%) |
| 15 Years | 169 (35.4%) | 16 (3.1%) |
| 16 and 17 Years | 121 (14.0%) | 418 (41.0%) |
| 18 to 24 Years | 2,624 (44.6%) | 3,146 (49.8%) |
| 25 to 34 Years | 803 (11.1%) | 1,482 (22.8%) |
| 35 to 44 Years | 490 (10.0%) | 1,220 (24.0%) |
| 45 to 54 Years | 543 (13.0%) | 601 (15.7%) |
| 55 to 64 Years | 380 (11.2%) | 896 (21.0%) |
| 65 to 74 Years | 173 (6.8%) | 382 (13.5%) |
| 75 Years and over | 206 (13.6%) | 279 (11.6%) |
| Total | 8,556 (21.4%) | 11,363 (27.7%) |
Income Above Poverty by Sex and Age in Bryan
According to the poverty statistics in Bryan, males aged 65 to 74 years and females aged 15 years are the age groups that are most secure financially, with 93.2% of males and 96.9% of females in these age groups living above the poverty line.
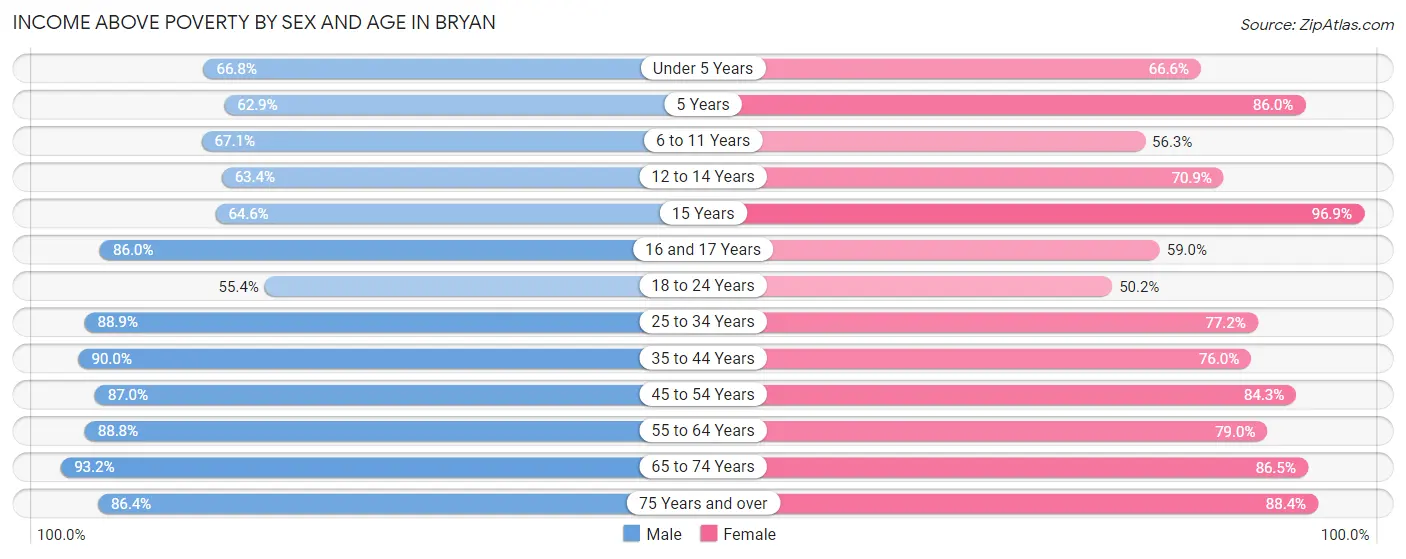
| Age Bracket | Male | Female |
| Under 5 Years | 2,075 (66.8%) | 1,786 (66.6%) |
| 5 Years | 285 (62.9%) | 559 (86.0%) |
| 6 to 11 Years | 2,441 (67.1%) | 1,907 (56.3%) |
| 12 to 14 Years | 1,130 (63.4%) | 1,115 (70.9%) |
| 15 Years | 308 (64.6%) | 497 (96.9%) |
| 16 and 17 Years | 742 (86.0%) | 602 (59.0%) |
| 18 to 24 Years | 3,265 (55.4%) | 3,170 (50.2%) |
| 25 to 34 Years | 6,403 (88.9%) | 5,010 (77.2%) |
| 35 to 44 Years | 4,403 (90.0%) | 3,856 (76.0%) |
| 45 to 54 Years | 3,621 (87.0%) | 3,231 (84.3%) |
| 55 to 64 Years | 3,016 (88.8%) | 3,362 (79.0%) |
| 65 to 74 Years | 2,369 (93.2%) | 2,443 (86.5%) |
| 75 Years and over | 1,306 (86.4%) | 2,119 (88.4%) |
| Total | 31,364 (78.6%) | 29,657 (72.3%) |
Income Below Poverty Among Married-Couple Families in Bryan
The poverty statistics for married-couple families in Bryan show that 8.3% or 961 of the total 11,586 families live below the poverty line. Families with 5 or more children have the highest poverty rate of 40.3%, comprising of 100 families. On the other hand, families with no children have the lowest poverty rate of 3.1%, which includes 201 families.
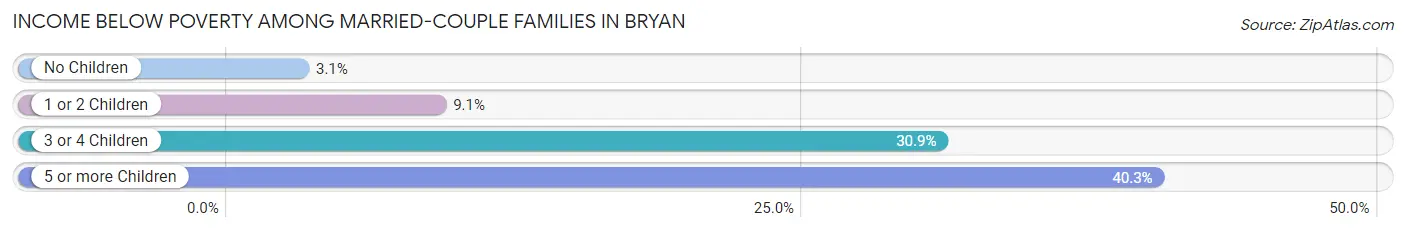
| Children | Above Poverty | Below Poverty |
| No Children | 6,304 (96.9%) | 201 (3.1%) |
| 1 or 2 Children | 3,471 (90.9%) | 346 (9.1%) |
| 3 or 4 Children | 702 (69.1%) | 314 (30.9%) |
| 5 or more Children | 148 (59.7%) | 100 (40.3%) |
| Total | 10,625 (91.7%) | 961 (8.3%) |
Income Below Poverty Among Single-Parent Households in Bryan
According to the poverty data in Bryan, 13.9% or 223 single-father households and 36.2% or 1,718 single-mother households are living below the poverty line. Among single-father households, those with 3 or 4 children have the highest poverty rate, with 42 households (32.6%) experiencing poverty. Likewise, among single-mother households, those with 5 or more children have the highest poverty rate, with 97 households (93.3%) falling below the poverty line.
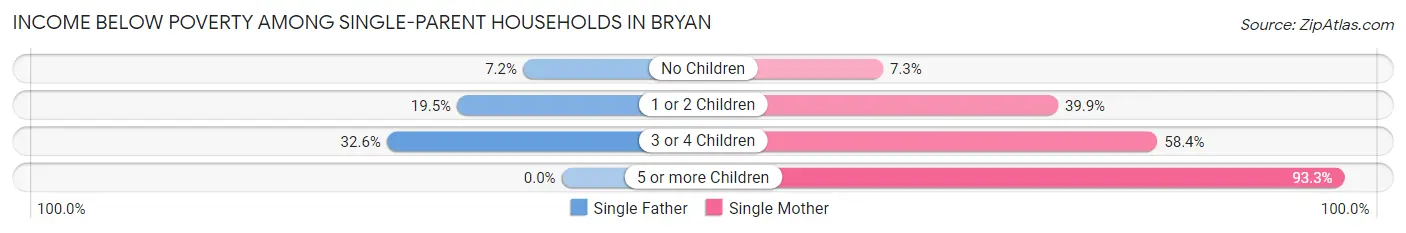
| Children | Single Father | Single Mother |
| No Children | 53 (7.2%) | 91 (7.3%) |
| 1 or 2 Children | 128 (19.5%) | 979 (39.9%) |
| 3 or 4 Children | 42 (32.6%) | 551 (58.4%) |
| 5 or more Children | 0 (0.0%) | 97 (93.3%) |
| Total | 223 (13.9%) | 1,718 (36.2%) |
Income Below Poverty Among Married-Couple vs Single-Parent Households in Bryan
The poverty data for Bryan shows that 961 of the married-couple family households (8.3%) and 1,941 of the single-parent households (30.6%) are living below the poverty level. Within the married-couple family households, those with 5 or more children have the highest poverty rate, with 100 households (40.3%) falling below the poverty line. Among the single-parent households, those with 3 or 4 children have the highest poverty rate, with 593 household (55.3%) living below poverty.
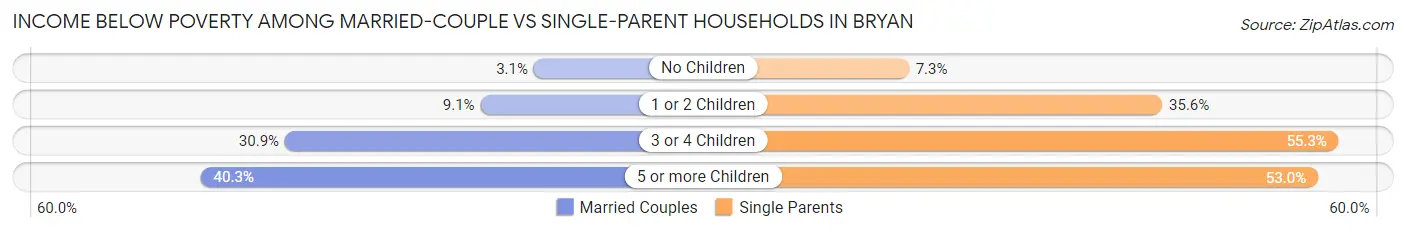
| Children | Married-Couple Families | Single-Parent Households |
| No Children | 201 (3.1%) | 144 (7.3%) |
| 1 or 2 Children | 346 (9.1%) | 1,107 (35.6%) |
| 3 or 4 Children | 314 (30.9%) | 593 (55.3%) |
| 5 or more Children | 100 (40.3%) | 97 (53.0%) |
| Total | 961 (8.3%) | 1,941 (30.6%) |
Race in Bryan
The most populous races in Bryan are White / Caucasian (56,112 | 66.1%), Hispanic or Latino (34,377 | 40.5%), and Black / African American (14,623 | 17.2%).
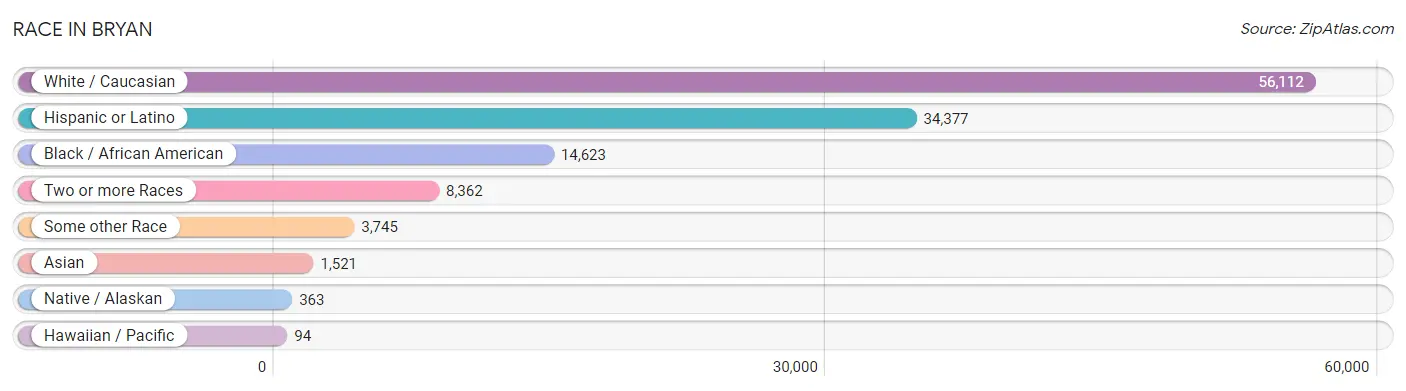
| Race | # Population | % Population |
| Asian | 1,521 | 1.8% |
| Black / African American | 14,623 | 17.2% |
| Hawaiian / Pacific | 94 | 0.1% |
| Hispanic or Latino | 34,377 | 40.5% |
| Native / Alaskan | 363 | 0.4% |
| White / Caucasian | 56,112 | 66.1% |
| Two or more Races | 8,362 | 9.9% |
| Some other Race | 3,745 | 4.4% |
| Total | 84,820 | 100.0% |
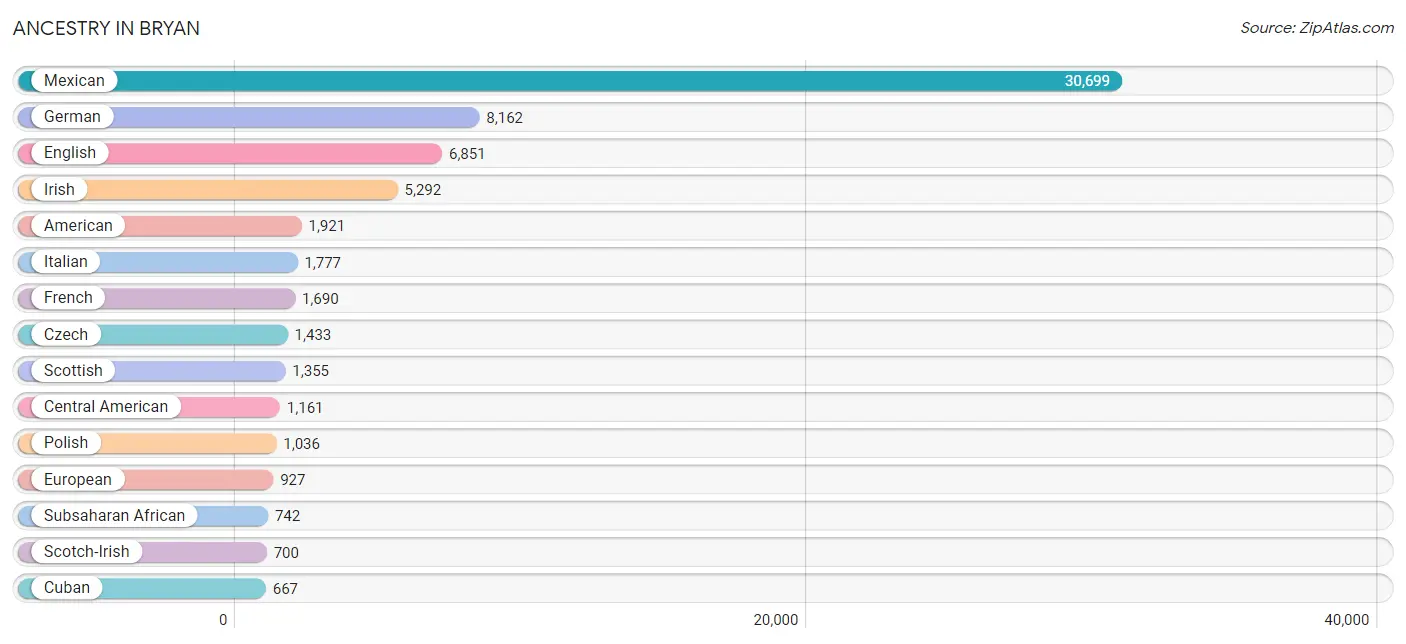
Ancestry in Bryan
The most populous ancestries reported in Bryan are Mexican (30,699 | 36.2%), German (8,162 | 9.6%), English (6,851 | 8.1%), Irish (5,292 | 6.2%), and American (1,921 | 2.3%), together accounting for 62.4% of all Bryan residents.
| Ancestry | # Population | % Population |
| African | 305 | 0.4% |
| Alaskan Athabascan | 7 | 0.0% |
| Albanian | 62 | 0.1% |
| American | 1,921 | 2.3% |
| Arab | 102 | 0.1% |
| Argentinean | 137 | 0.2% |
| Armenian | 43 | 0.1% |
| Australian | 63 | 0.1% |
| Austrian | 68 | 0.1% |
| Belgian | 10 | 0.0% |
| Bhutanese | 167 | 0.2% |
| Blackfeet | 1 | 0.0% |
| Brazilian | 71 | 0.1% |
| British | 395 | 0.5% |
| British West Indian | 15 | 0.0% |
| Burmese | 368 | 0.4% |
| Cajun | 46 | 0.1% |
| Canadian | 17 | 0.0% |
| Celtic | 31 | 0.0% |
| Central American | 1,161 | 1.4% |
| Central American Indian | 10 | 0.0% |
| Cherokee | 136 | 0.2% |
| Chickasaw | 30 | 0.0% |
| Chilean | 4 | 0.0% |
| Choctaw | 101 | 0.1% |
| Colombian | 58 | 0.1% |
| Comanche | 83 | 0.1% |
| Costa Rican | 106 | 0.1% |
| Cuban | 667 | 0.8% |
| Czech | 1,433 | 1.7% |
| Czechoslovakian | 96 | 0.1% |
| Danish | 195 | 0.2% |
| Dominican | 16 | 0.0% |
| Dutch | 421 | 0.5% |
| Eastern European | 35 | 0.0% |
| Egyptian | 14 | 0.0% |
| English | 6,851 | 8.1% |
| European | 927 | 1.1% |
| Filipino | 4 | 0.0% |
| Finnish | 35 | 0.0% |
| French | 1,690 | 2.0% |
| French Canadian | 144 | 0.2% |
| German | 8,162 | 9.6% |
| Greek | 185 | 0.2% |
| Guamanian / Chamorro | 105 | 0.1% |
| Guatemalan | 408 | 0.5% |
| Guyanese | 42 | 0.1% |
| Honduran | 277 | 0.3% |
| Hungarian | 64 | 0.1% |
| Indian (Asian) | 116 | 0.1% |
| Irish | 5,292 | 6.2% |
| Israeli | 12 | 0.0% |
| Italian | 1,777 | 2.1% |
| Jamaican | 45 | 0.1% |
| Japanese | 189 | 0.2% |
| Korean | 310 | 0.4% |
| Lebanese | 69 | 0.1% |
| Lithuanian | 82 | 0.1% |
| Malaysian | 33 | 0.0% |
| Mexican | 30,699 | 36.2% |
| Mexican American Indian | 203 | 0.2% |
| Mongolian | 53 | 0.1% |
| Native Hawaiian | 19 | 0.0% |
| New Zealander | 3 | 0.0% |
| Nigerian | 328 | 0.4% |
| Northern European | 58 | 0.1% |
| Norwegian | 338 | 0.4% |
| Ottawa | 17 | 0.0% |
| Pakistani | 25 | 0.0% |
| Palestinian | 9 | 0.0% |
| Panamanian | 66 | 0.1% |
| Peruvian | 30 | 0.0% |
| Polish | 1,036 | 1.2% |
| Portuguese | 29 | 0.0% |
| Potawatomi | 6 | 0.0% |
| Puerto Rican | 397 | 0.5% |
| Romanian | 13 | 0.0% |
| Russian | 123 | 0.2% |
| Salvadoran | 304 | 0.4% |
| Samoan | 13 | 0.0% |
| Scandinavian | 467 | 0.5% |
| Scotch-Irish | 700 | 0.8% |
| Scottish | 1,355 | 1.6% |
| Sioux | 13 | 0.0% |
| South African | 15 | 0.0% |
| South American | 246 | 0.3% |
| Spaniard | 216 | 0.3% |
| Spanish | 95 | 0.1% |
| Sri Lankan | 134 | 0.2% |
| Subsaharan African | 742 | 0.9% |
| Sudanese | 38 | 0.0% |
| Swedish | 447 | 0.5% |
| Swiss | 101 | 0.1% |
| Thai | 590 | 0.7% |
| Trinidadian and Tobagonian | 24 | 0.0% |
| Turkish | 20 | 0.0% |
| Ukrainian | 76 | 0.1% |
| Venezuelan | 17 | 0.0% |
| Welsh | 401 | 0.5% |
| Yugoslavian | 15 | 0.0% | View All 100 Rows |
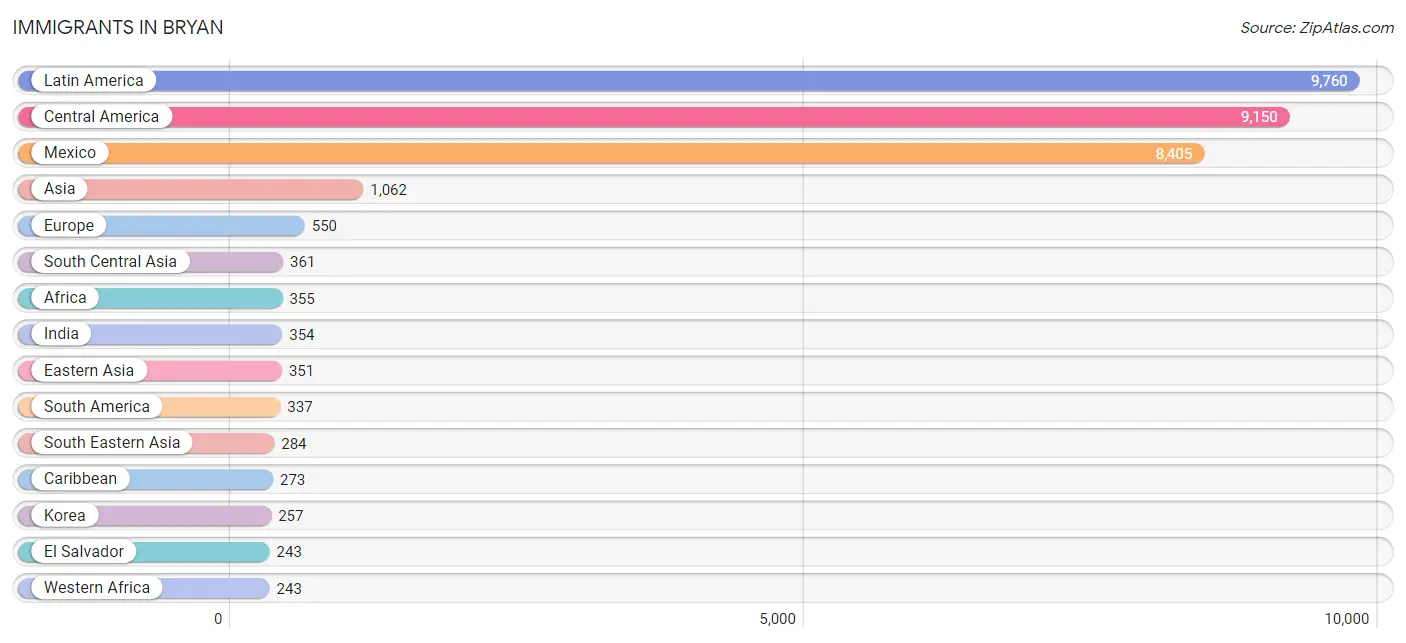
Immigrants in Bryan
The most numerous immigrant groups reported in Bryan came from Latin America (9,760 | 11.5%), Central America (9,150 | 10.8%), Mexico (8,405 | 9.9%), Asia (1,062 | 1.3%), and Europe (550 | 0.6%), together accounting for 34.1% of all Bryan residents.
| Immigration Origin | # Population | % Population |
| Africa | 355 | 0.4% |
| Argentina | 99 | 0.1% |
| Asia | 1,062 | 1.3% |
| Australia | 75 | 0.1% |
| Austria | 13 | 0.0% |
| Bosnia and Herzegovina | 30 | 0.0% |
| Brazil | 11 | 0.0% |
| Cabo Verde | 24 | 0.0% |
| Canada | 32 | 0.0% |
| Caribbean | 273 | 0.3% |
| Central America | 9,150 | 10.8% |
| Chile | 4 | 0.0% |
| China | 51 | 0.1% |
| Colombia | 110 | 0.1% |
| Costa Rica | 94 | 0.1% |
| Cuba | 119 | 0.1% |
| Czechoslovakia | 19 | 0.0% |
| Denmark | 54 | 0.1% |
| Dominican Republic | 16 | 0.0% |
| Eastern Africa | 50 | 0.1% |
| Eastern Asia | 351 | 0.4% |
| Eastern Europe | 83 | 0.1% |
| Ecuador | 13 | 0.0% |
| Egypt | 14 | 0.0% |
| El Salvador | 243 | 0.3% |
| England | 52 | 0.1% |
| Europe | 550 | 0.6% |
| France | 35 | 0.0% |
| Germany | 112 | 0.1% |
| Ghana | 19 | 0.0% |
| Greece | 9 | 0.0% |
| Guatemala | 156 | 0.2% |
| Guyana | 42 | 0.1% |
| Honduras | 148 | 0.2% |
| Hong Kong | 4 | 0.0% |
| India | 354 | 0.4% |
| Italy | 13 | 0.0% |
| Japan | 43 | 0.1% |
| Korea | 257 | 0.3% |
| Kuwait | 9 | 0.0% |
| Latin America | 9,760 | 11.5% |
| Malaysia | 53 | 0.1% |
| Mexico | 8,405 | 9.9% |
| Nicaragua | 55 | 0.1% |
| Nigeria | 190 | 0.2% |
| Northern Africa | 14 | 0.0% |
| Northern Europe | 201 | 0.2% |
| Oceania | 145 | 0.2% |
| Pakistan | 7 | 0.0% |
| Panama | 49 | 0.1% |
| Peru | 18 | 0.0% |
| Philippines | 118 | 0.1% |
| Poland | 34 | 0.0% |
| Saudi Arabia | 10 | 0.0% |
| Scotland | 64 | 0.1% |
| South Africa | 27 | 0.0% |
| South America | 337 | 0.4% |
| South Central Asia | 361 | 0.4% |
| South Eastern Asia | 284 | 0.3% |
| Southern Europe | 106 | 0.1% |
| Spain | 84 | 0.1% |
| Syria | 25 | 0.0% |
| Thailand | 17 | 0.0% |
| Trinidad and Tobago | 24 | 0.0% |
| Turkey | 22 | 0.0% |
| Venezuela | 17 | 0.0% |
| Vietnam | 96 | 0.1% |
| Western Africa | 243 | 0.3% |
| Western Asia | 66 | 0.1% |
| Western Europe | 160 | 0.2% | View All 70 Rows |
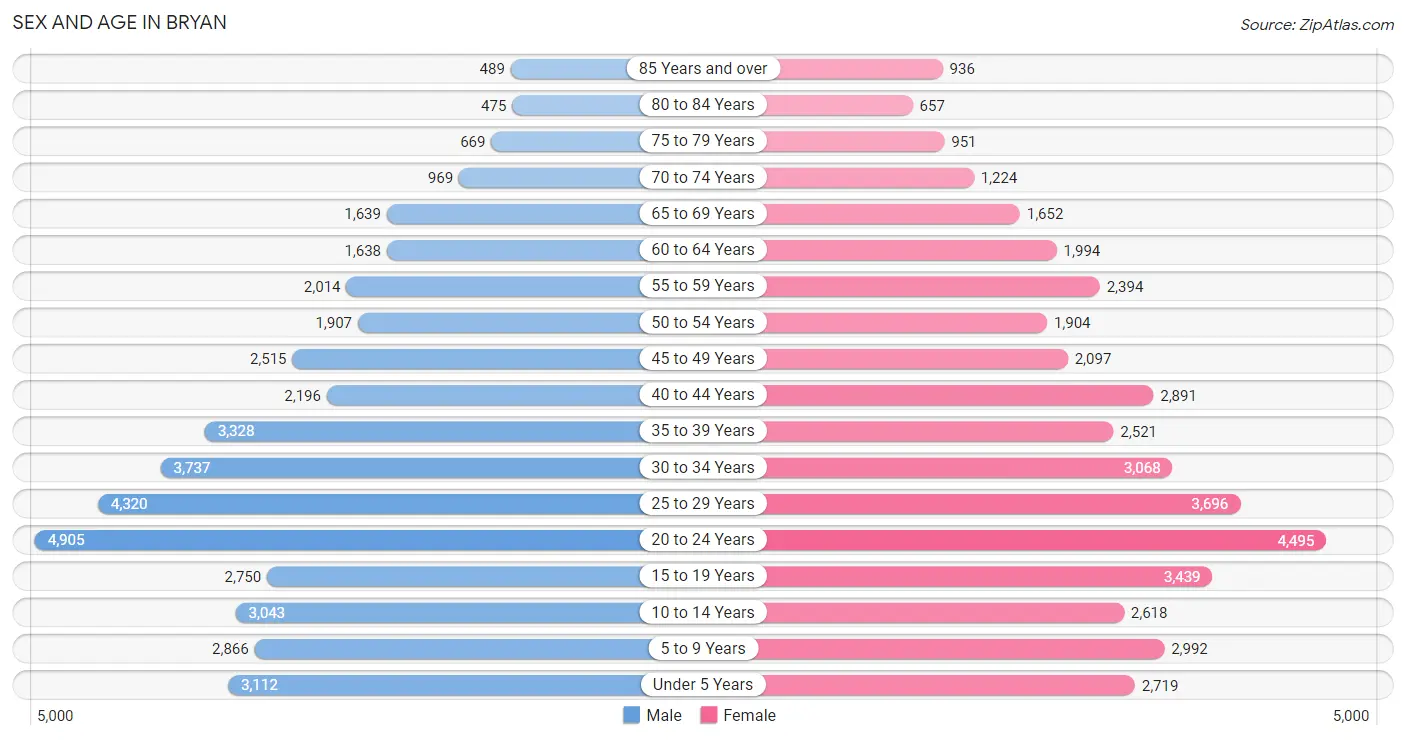
Sex and Age in Bryan
Sex and Age in Bryan
The most populous age groups in Bryan are 20 to 24 Years (4,905 | 11.5%) for men and 20 to 24 Years (4,495 | 10.6%) for women.
| Age Bracket | Male | Female |
| Under 5 Years | 3,112 (7.3%) | 2,719 (6.4%) |
| 5 to 9 Years | 2,866 (6.7%) | 2,992 (7.1%) |
| 10 to 14 Years | 3,043 (7.1%) | 2,618 (6.2%) |
| 15 to 19 Years | 2,750 (6.5%) | 3,439 (8.1%) |
| 20 to 24 Years | 4,905 (11.5%) | 4,495 (10.6%) |
| 25 to 29 Years | 4,320 (10.2%) | 3,696 (8.7%) |
| 30 to 34 Years | 3,737 (8.8%) | 3,068 (7.3%) |
| 35 to 39 Years | 3,328 (7.8%) | 2,521 (6.0%) |
| 40 to 44 Years | 2,196 (5.2%) | 2,891 (6.8%) |
| 45 to 49 Years | 2,515 (5.9%) | 2,097 (5.0%) |
| 50 to 54 Years | 1,907 (4.5%) | 1,904 (4.5%) |
| 55 to 59 Years | 2,014 (4.7%) | 2,394 (5.7%) |
| 60 to 64 Years | 1,638 (3.8%) | 1,994 (4.7%) |
| 65 to 69 Years | 1,639 (3.8%) | 1,652 (3.9%) |
| 70 to 74 Years | 969 (2.3%) | 1,224 (2.9%) |
| 75 to 79 Years | 669 (1.6%) | 951 (2.2%) |
| 80 to 84 Years | 475 (1.1%) | 657 (1.6%) |
| 85 Years and over | 489 (1.1%) | 936 (2.2%) |
| Total | 42,572 (100.0%) | 42,248 (100.0%) |
Families and Households in Bryan
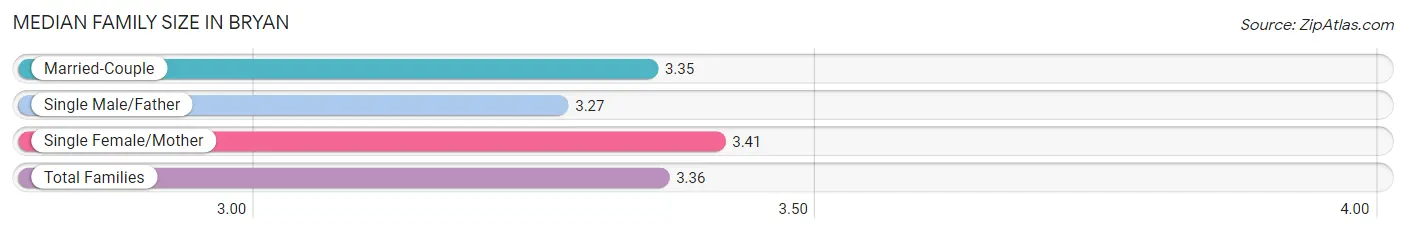
Median Family Size in Bryan
The median family size in Bryan is 3.36 persons per family, with single female/mother families (4,744 | 26.5%) accounting for the largest median family size of 3.41 persons per family. On the other hand, single male/father families (1,601 | 8.9%) represent the smallest median family size with 3.27 persons per family.
| Family Type | # Families | Family Size |
| Married-Couple | 11,586 (64.6%) | 3.35 |
| Single Male/Father | 1,601 (8.9%) | 3.27 |
| Single Female/Mother | 4,744 (26.5%) | 3.41 |
| Total Families | 17,931 (100.0%) | 3.36 |
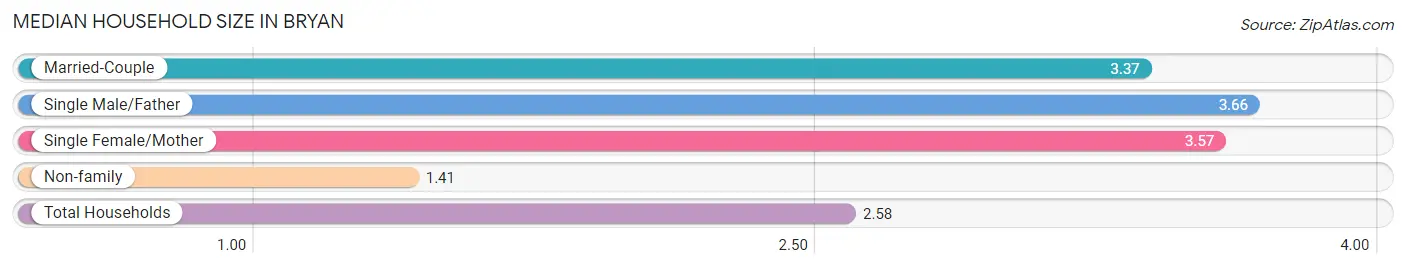
Median Household Size in Bryan
The median household size in Bryan is 2.58 persons per household, with single male/father households (1,601 | 5.1%) accounting for the largest median household size of 3.66 persons per household. non-family households (13,307 | 42.6%) represent the smallest median household size with 1.41 persons per household.
| Household Type | # Households | Household Size |
| Married-Couple | 11,586 (37.1%) | 3.37 |
| Single Male/Father | 1,601 (5.1%) | 3.66 |
| Single Female/Mother | 4,744 (15.2%) | 3.57 |
| Non-family | 13,307 (42.6%) | 1.41 |
| Total Households | 31,238 (100.0%) | 2.58 |
Household Size by Marriage Status in Bryan
Out of a total of 31,238 households in Bryan, 17,931 (57.4%) are family households, while 13,307 (42.6%) are nonfamily households. The most numerous type of family households are 2-person households, comprising 7,551, and the most common type of nonfamily households are 1-person households, comprising 10,130.
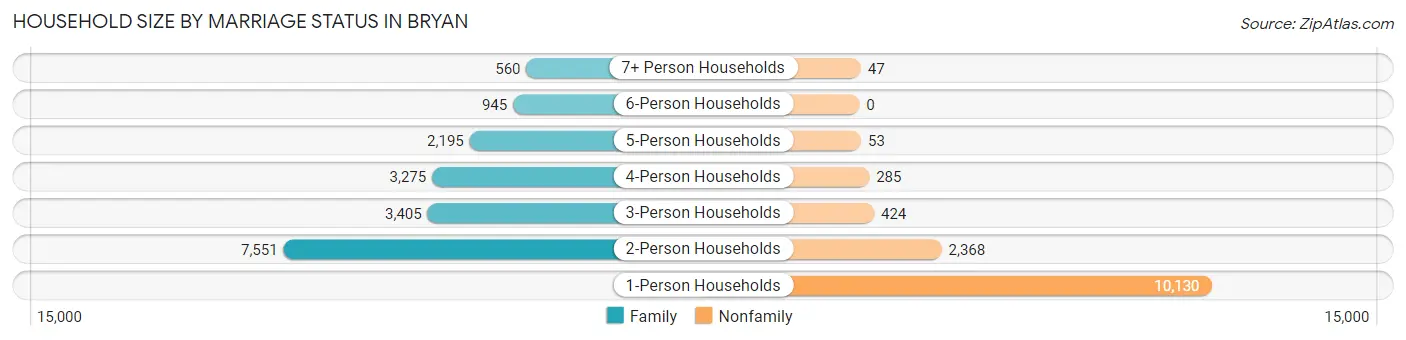
| Household Size | Family Households | Nonfamily Households |
| 1-Person Households | - | 10,130 (32.4%) |
| 2-Person Households | 7,551 (24.2%) | 2,368 (7.6%) |
| 3-Person Households | 3,405 (10.9%) | 424 (1.4%) |
| 4-Person Households | 3,275 (10.5%) | 285 (0.9%) |
| 5-Person Households | 2,195 (7.0%) | 53 (0.2%) |
| 6-Person Households | 945 (3.0%) | 0 (0.0%) |
| 7+ Person Households | 560 (1.8%) | 47 (0.2%) |
| Total | 17,931 (57.4%) | 13,307 (42.6%) |
Female Fertility in Bryan
Fertility by Age in Bryan
Average fertility rate in Bryan is 61.0 births per 1,000 women. Women in the age bracket of 20 to 34 years have the highest fertility rate with 82.0 births per 1,000 women. Women in the age bracket of 20 to 34 years acount for 66.2% of all women with births.
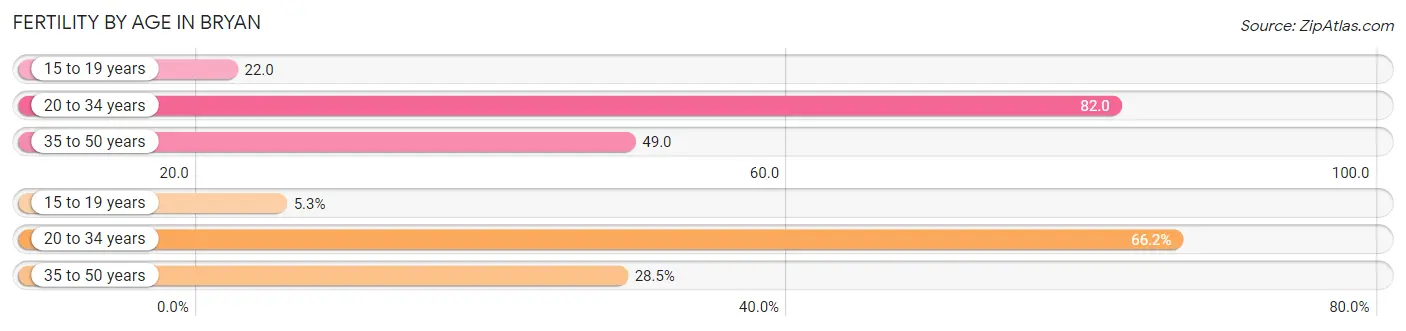
| Age Bracket | Women with Births | Births / 1,000 Women |
| 15 to 19 years | 74 (5.3%) | 22.0 |
| 20 to 34 years | 918 (66.2%) | 82.0 |
| 35 to 50 years | 395 (28.5%) | 49.0 |
| Total | 1,387 (100.0%) | 61.0 |
Fertility by Age by Marriage Status in Bryan
65.8% of women with births (1,387) in Bryan are married. The highest percentage of unmarried women with births falls into 20 to 34 years age bracket with 43.7% of them unmarried at the time of birth, while the lowest percentage of unmarried women with births belong to 35 to 50 years age bracket with 12.9% of them unmarried.
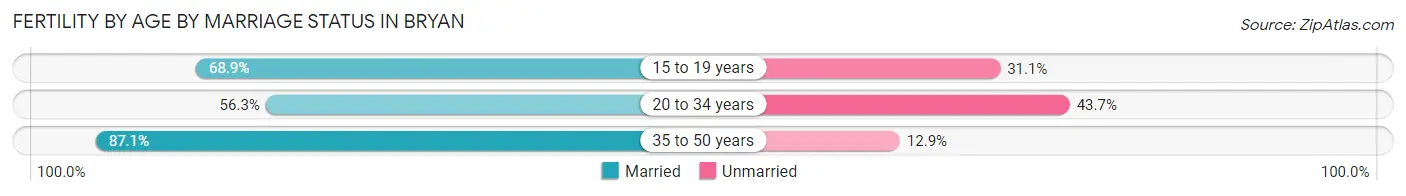
| Age Bracket | Married | Unmarried |
| 15 to 19 years | 51 (68.9%) | 23 (31.1%) |
| 20 to 34 years | 517 (56.3%) | 401 (43.7%) |
| 35 to 50 years | 344 (87.1%) | 51 (12.9%) |
| Total | 913 (65.8%) | 474 (34.2%) |
Fertility by Education in Bryan
Average fertility rate in Bryan is 61.0 births per 1,000 women. Women with the education attainment of high school diploma have the highest fertility rate of 89.0 births per 1,000 women, while women with the education attainment of bachelor's degree have the lowest fertility at 26.0 births per 1,000 women. Women with the education attainment of college or associate's degree represent 33.9% of all women with births.
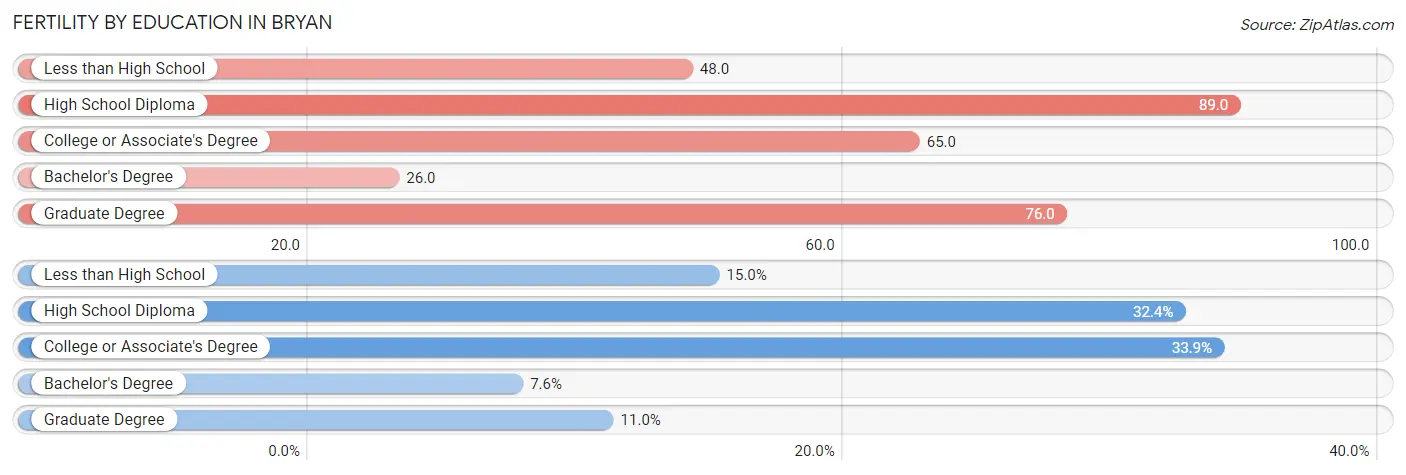
| Educational Attainment | Women with Births | Births / 1,000 Women |
| Less than High School | 208 (15.0%) | 48.0 |
| High School Diploma | 450 (32.4%) | 89.0 |
| College or Associate's Degree | 470 (33.9%) | 65.0 |
| Bachelor's Degree | 106 (7.6%) | 26.0 |
| Graduate Degree | 153 (11.0%) | 76.0 |
| Total | 1,387 (100.0%) | 61.0 |
Fertility by Education by Marriage Status in Bryan
34.2% of women with births in Bryan are unmarried. Women with the educational attainment of graduate degree are most likely to be married with 100.0% of them married at childbirth, while women with the educational attainment of college or associate's degree are least likely to be married with 49.1% of them unmarried at childbirth.
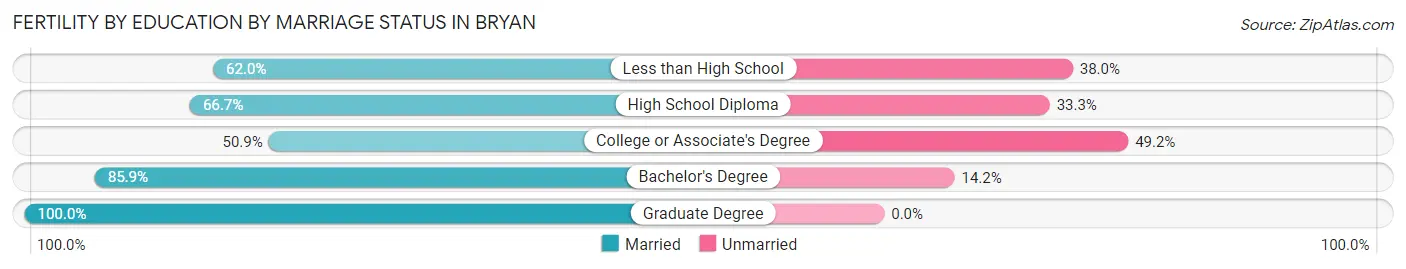
| Educational Attainment | Married | Unmarried |
| Less than High School | 129 (62.0%) | 79 (38.0%) |
| High School Diploma | 300 (66.7%) | 150 (33.3%) |
| College or Associate's Degree | 239 (50.8%) | 231 (49.1%) |
| Bachelor's Degree | 91 (85.9%) | 15 (14.1%) |
| Graduate Degree | 153 (100.0%) | 0 (0.0%) |
| Total | 913 (65.8%) | 474 (34.2%) |
Employment Characteristics in Bryan
Employment by Class of Employer in Bryan
Among the 39,021 employed individuals in Bryan, private company employees (25,240 | 64.7%), state government employees (4,657 | 11.9%), and local government employees (2,438 | 6.2%) make up the most common classes of employment.
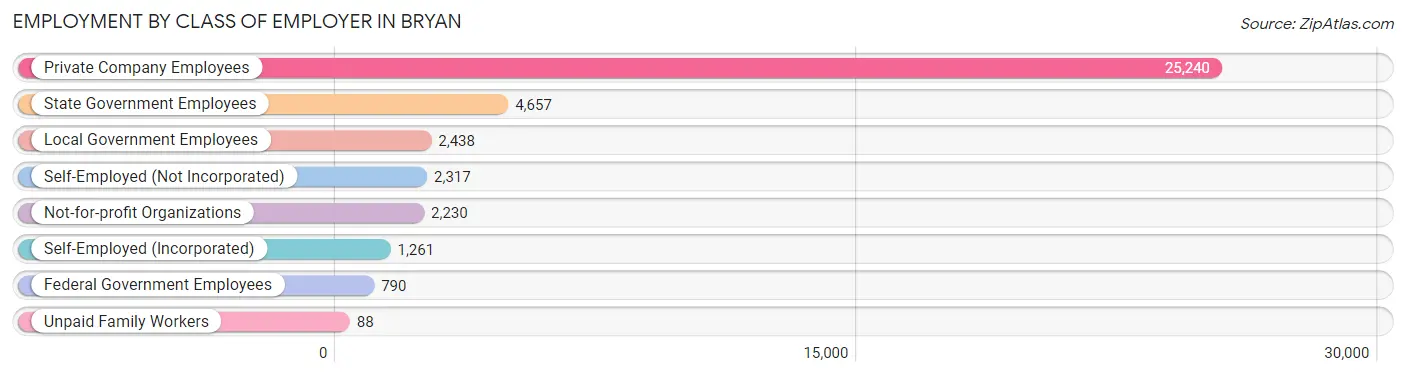
| Employer Class | # Employees | % Employees |
| Private Company Employees | 25,240 | 64.7% |
| Self-Employed (Incorporated) | 1,261 | 3.2% |
| Self-Employed (Not Incorporated) | 2,317 | 5.9% |
| Not-for-profit Organizations | 2,230 | 5.7% |
| Local Government Employees | 2,438 | 6.2% |
| State Government Employees | 4,657 | 11.9% |
| Federal Government Employees | 790 | 2.0% |
| Unpaid Family Workers | 88 | 0.2% |
| Total | 39,021 | 100.0% |
Employment Status by Age in Bryan
According to the labor force statistics for Bryan, out of the total population over 16 years of age (66,480), 62.9% or 41,816 individuals are in the labor force, with 4.9% or 2,049 of them unemployed. The age group with the highest labor force participation rate is 30 to 34 years, with 80.7% or 5,492 individuals in the labor force. Within the labor force, the 75 years and over age range has the highest percentage of unemployed individuals, with 16.6% or 34 of them being unemployed.
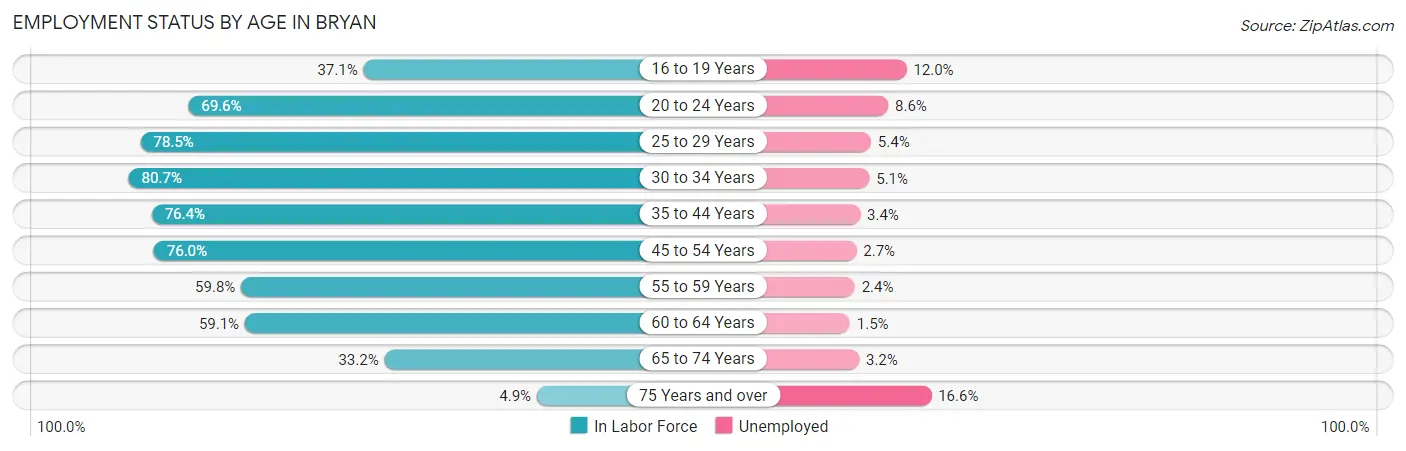
| Age Bracket | In Labor Force | Unemployed |
| 16 to 19 Years | 1,929 (37.1%) | 231 (12.0%) |
| 20 to 24 Years | 6,542 (69.6%) | 563 (8.6%) |
| 25 to 29 Years | 6,293 (78.5%) | 340 (5.4%) |
| 30 to 34 Years | 5,492 (80.7%) | 280 (5.1%) |
| 35 to 44 Years | 8,355 (76.4%) | 284 (3.4%) |
| 45 to 54 Years | 6,401 (76.0%) | 173 (2.7%) |
| 55 to 59 Years | 2,636 (59.8%) | 63 (2.4%) |
| 60 to 64 Years | 2,147 (59.1%) | 32 (1.5%) |
| 65 to 74 Years | 1,821 (33.2%) | 58 (3.2%) |
| 75 Years and over | 205 (4.9%) | 34 (16.6%) |
| Total | 41,816 (62.9%) | 2,049 (4.9%) |
Employment Status by Educational Attainment in Bryan
According to labor force statistics for Bryan, 74.2% of individuals (31,327) out of the total population between 25 and 64 years of age (42,220) are in the labor force, with 3.7% or 1,159 of them being unemployed. The group with the highest labor force participation rate are those with the educational attainment of bachelor's degree or higher, with 87.0% or 10,347 individuals in the labor force. Within the labor force, individuals with high school diploma education have the highest percentage of unemployment, with 6.0% or 511 of them being unemployed.
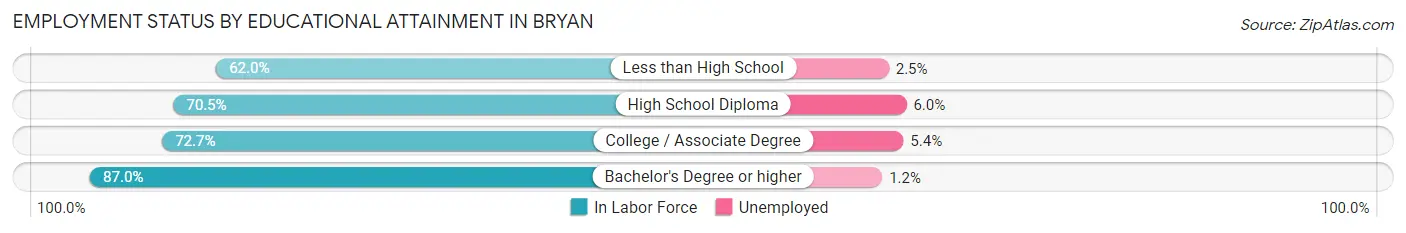
| Educational Attainment | In Labor Force | Unemployed |
| Less than High School | 4,634 (62.0%) | 187 (2.5%) |
| High School Diploma | 8,509 (70.5%) | 724 (6.0%) |
| College / Associate Degree | 7,839 (72.7%) | 582 (5.4%) |
| Bachelor's Degree or higher | 10,347 (87.0%) | 143 (1.2%) |
| Total | 31,327 (74.2%) | 1,562 (3.7%) |
Employment Occupations by Sex in Bryan
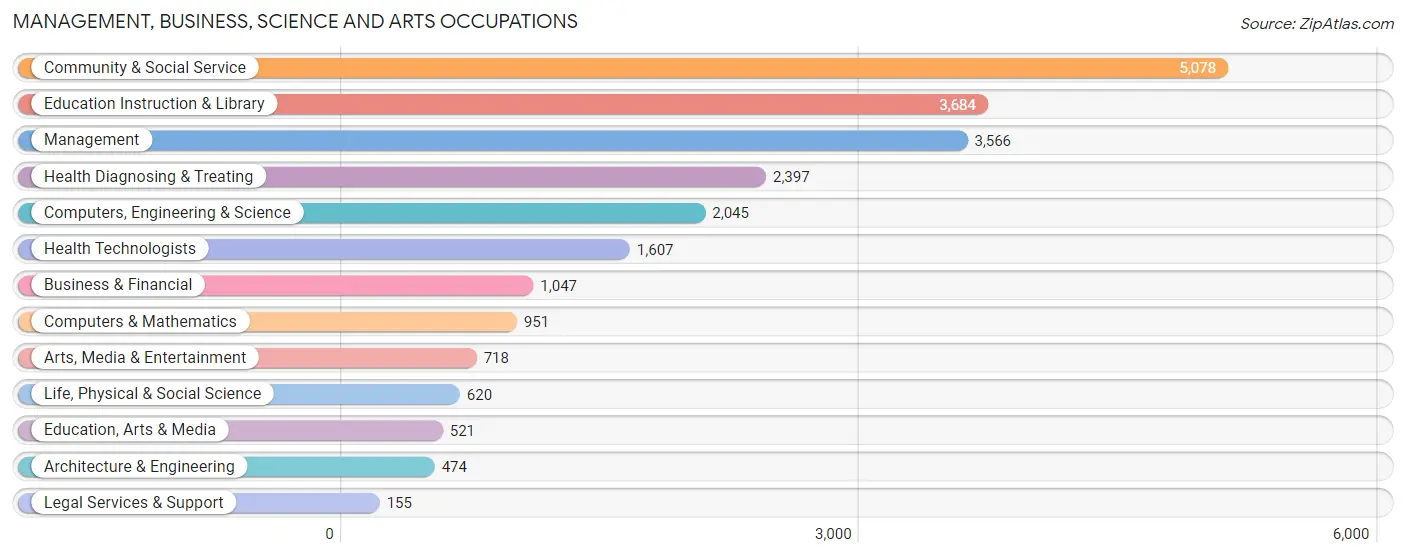
Management, Business, Science and Arts Occupations
The most common Management, Business, Science and Arts occupations in Bryan are Community & Social Service (5,078 | 12.8%), Education Instruction & Library (3,684 | 9.3%), Management (3,566 | 9.0%), Health Diagnosing & Treating (2,397 | 6.0%), and Computers, Engineering & Science (2,045 | 5.2%).
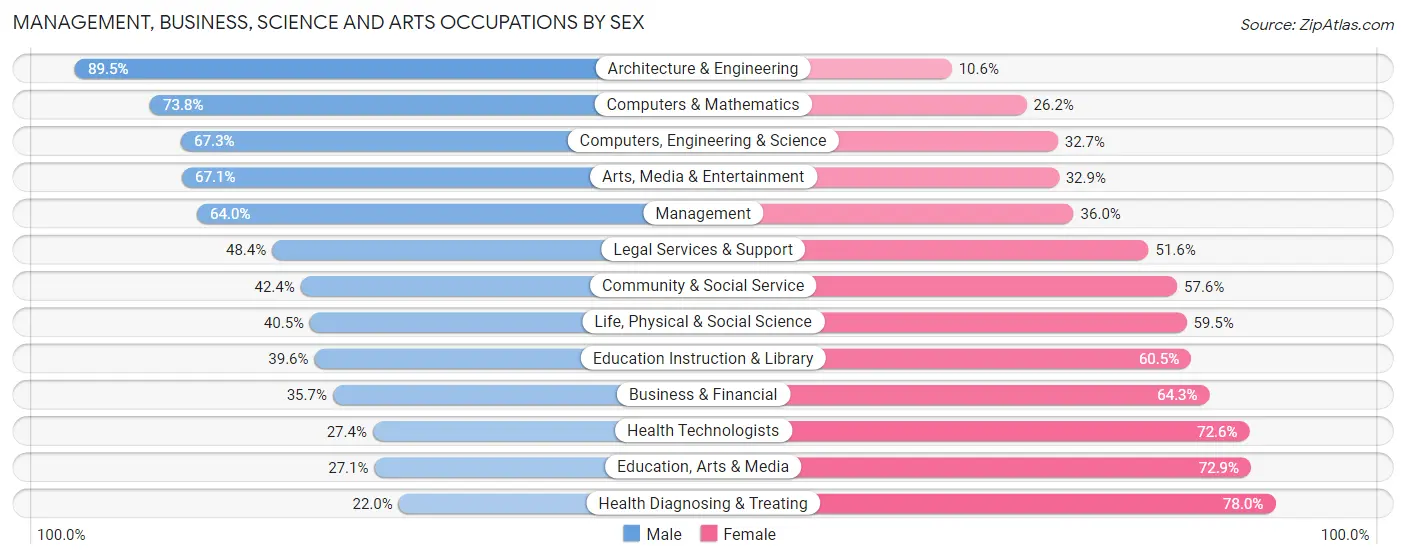
Management, Business, Science and Arts Occupations by Sex
Within the Management, Business, Science and Arts occupations in Bryan, the most male-oriented occupations are Architecture & Engineering (89.4%), Computers & Mathematics (73.8%), and Computers, Engineering & Science (67.3%), while the most female-oriented occupations are Health Diagnosing & Treating (78.0%), Education, Arts & Media (72.9%), and Health Technologists (72.6%).
| Occupation | Male | Female |
| Management | 2,283 (64.0%) | 1,283 (36.0%) |
| Business & Financial | 374 (35.7%) | 673 (64.3%) |
| Computers, Engineering & Science | 1,377 (67.3%) | 668 (32.7%) |
| Computers & Mathematics | 702 (73.8%) | 249 (26.2%) |
| Architecture & Engineering | 424 (89.4%) | 50 (10.5%) |
| Life, Physical & Social Science | 251 (40.5%) | 369 (59.5%) |
| Community & Social Service | 2,155 (42.4%) | 2,923 (57.6%) |
| Education, Arts & Media | 141 (27.1%) | 380 (72.9%) |
| Legal Services & Support | 75 (48.4%) | 80 (51.6%) |
| Education Instruction & Library | 1,457 (39.6%) | 2,227 (60.5%) |
| Arts, Media & Entertainment | 482 (67.1%) | 236 (32.9%) |
| Health Diagnosing & Treating | 527 (22.0%) | 1,870 (78.0%) |
| Health Technologists | 440 (27.4%) | 1,167 (72.6%) |
| Total (Category) | 6,716 (47.5%) | 7,417 (52.5%) |
| Total (Overall) | 20,925 (52.8%) | 18,737 (47.2%) |
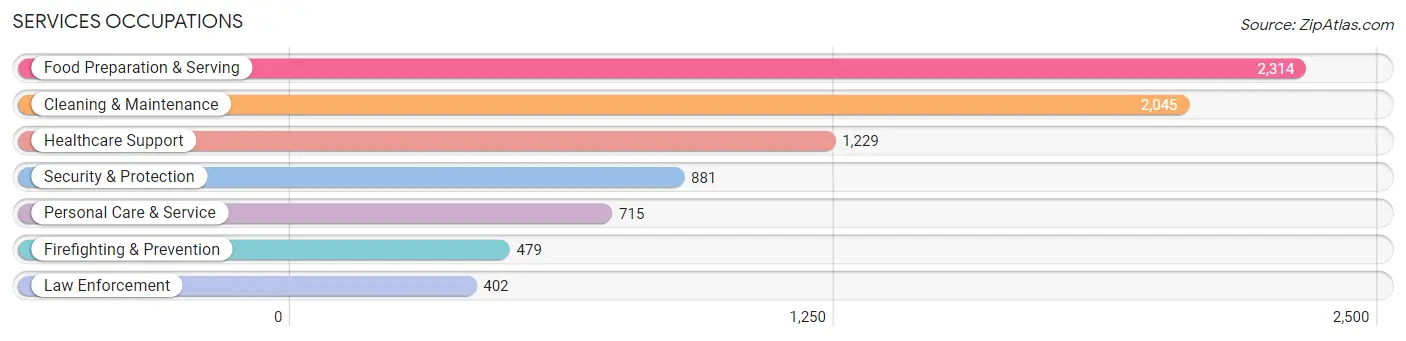
Services Occupations
The most common Services occupations in Bryan are Food Preparation & Serving (2,314 | 5.8%), Cleaning & Maintenance (2,045 | 5.2%), Healthcare Support (1,229 | 3.1%), Security & Protection (881 | 2.2%), and Personal Care & Service (715 | 1.8%).
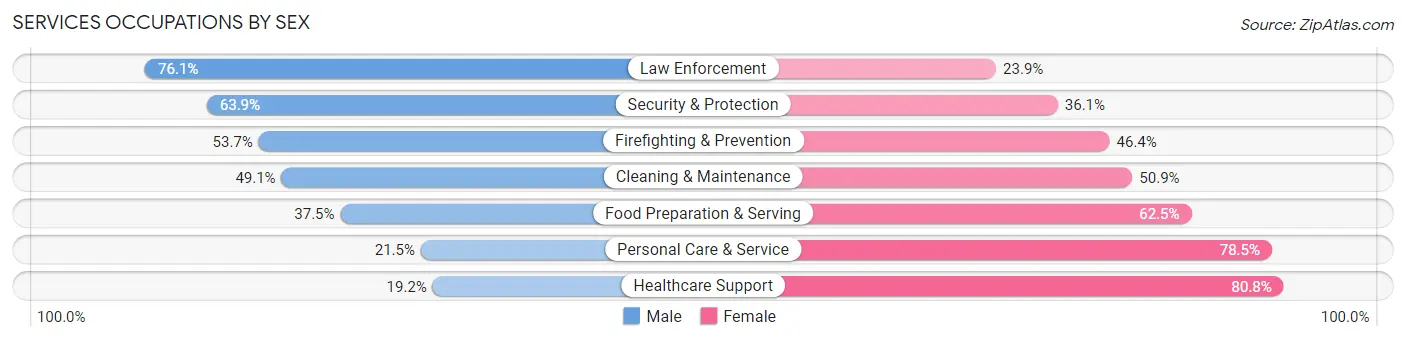
Services Occupations by Sex
Within the Services occupations in Bryan, the most male-oriented occupations are Law Enforcement (76.1%), Security & Protection (63.9%), and Firefighting & Prevention (53.6%), while the most female-oriented occupations are Healthcare Support (80.8%), Personal Care & Service (78.5%), and Food Preparation & Serving (62.5%).
| Occupation | Male | Female |
| Healthcare Support | 236 (19.2%) | 993 (80.8%) |
| Security & Protection | 563 (63.9%) | 318 (36.1%) |
| Firefighting & Prevention | 257 (53.6%) | 222 (46.4%) |
| Law Enforcement | 306 (76.1%) | 96 (23.9%) |
| Food Preparation & Serving | 867 (37.5%) | 1,447 (62.5%) |
| Cleaning & Maintenance | 1,005 (49.1%) | 1,040 (50.9%) |
| Personal Care & Service | 154 (21.5%) | 561 (78.5%) |
| Total (Category) | 2,825 (39.3%) | 4,359 (60.7%) |
| Total (Overall) | 20,925 (52.8%) | 18,737 (47.2%) |
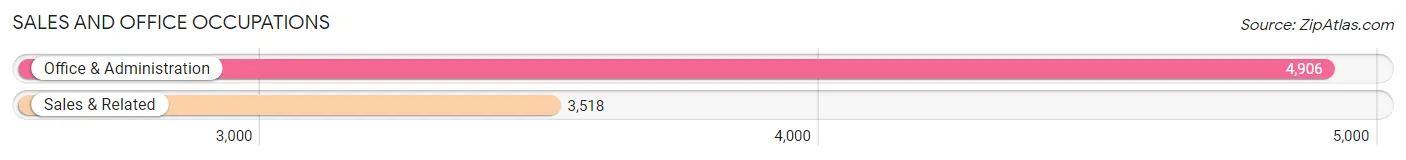
Sales and Office Occupations
The most common Sales and Office occupations in Bryan are Office & Administration (4,906 | 12.4%), and Sales & Related (3,518 | 8.9%).
Sales and Office Occupations by Sex
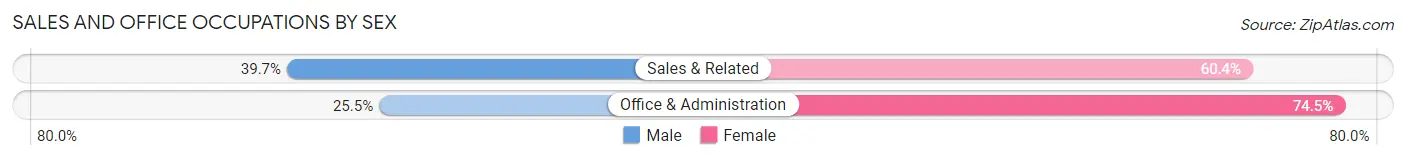
| Occupation | Male | Female |
| Sales & Related | 1,395 (39.7%) | 2,123 (60.4%) |
| Office & Administration | 1,250 (25.5%) | 3,656 (74.5%) |
| Total (Category) | 2,645 (31.4%) | 5,779 (68.6%) |
| Total (Overall) | 20,925 (52.8%) | 18,737 (47.2%) |
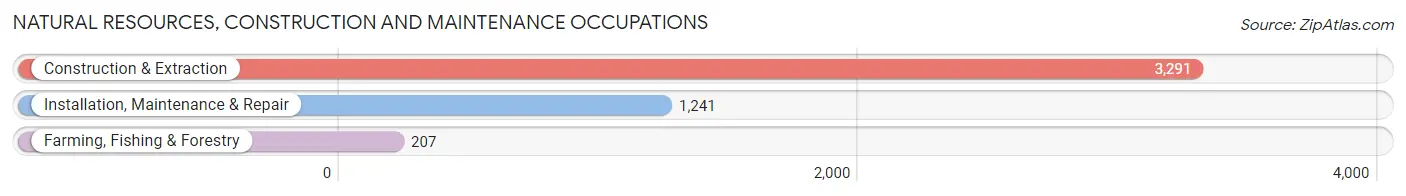
Natural Resources, Construction and Maintenance Occupations
The most common Natural Resources, Construction and Maintenance occupations in Bryan are Construction & Extraction (3,291 | 8.3%), Installation, Maintenance & Repair (1,241 | 3.1%), and Farming, Fishing & Forestry (207 | 0.5%).
Natural Resources, Construction and Maintenance Occupations by Sex
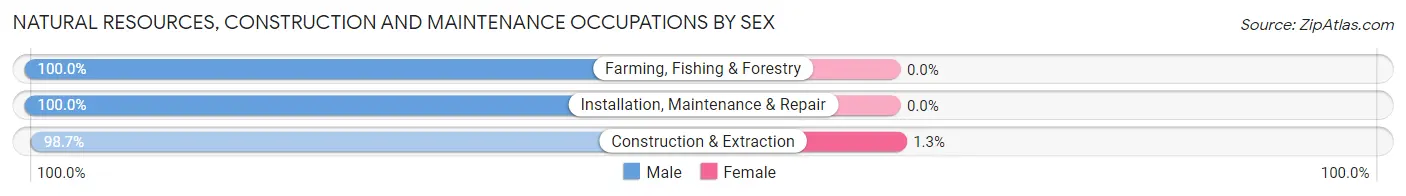
| Occupation | Male | Female |
| Farming, Fishing & Forestry | 207 (100.0%) | 0 (0.0%) |
| Construction & Extraction | 3,248 (98.7%) | 43 (1.3%) |
| Installation, Maintenance & Repair | 1,241 (100.0%) | 0 (0.0%) |
| Total (Category) | 4,696 (99.1%) | 43 (0.9%) |
| Total (Overall) | 20,925 (52.8%) | 18,737 (47.2%) |
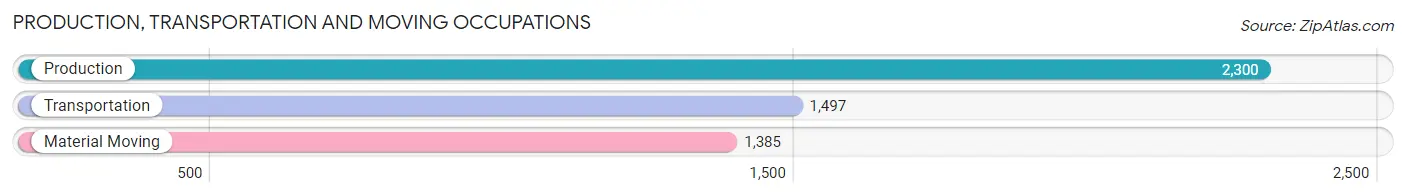
Production, Transportation and Moving Occupations
The most common Production, Transportation and Moving occupations in Bryan are Production (2,300 | 5.8%), Transportation (1,497 | 3.8%), and Material Moving (1,385 | 3.5%).
Production, Transportation and Moving Occupations by Sex
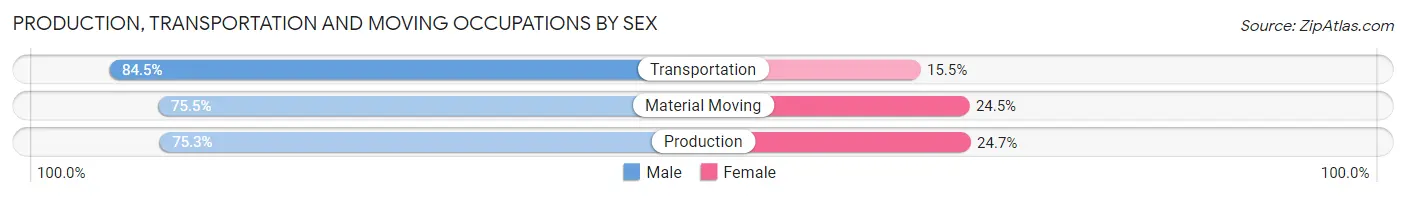
| Occupation | Male | Female |
| Production | 1,732 (75.3%) | 568 (24.7%) |
| Transportation | 1,265 (84.5%) | 232 (15.5%) |
| Material Moving | 1,046 (75.5%) | 339 (24.5%) |
| Total (Category) | 4,043 (78.0%) | 1,139 (22.0%) |
| Total (Overall) | 20,925 (52.8%) | 18,737 (47.2%) |
Employment Industries by Sex in Bryan
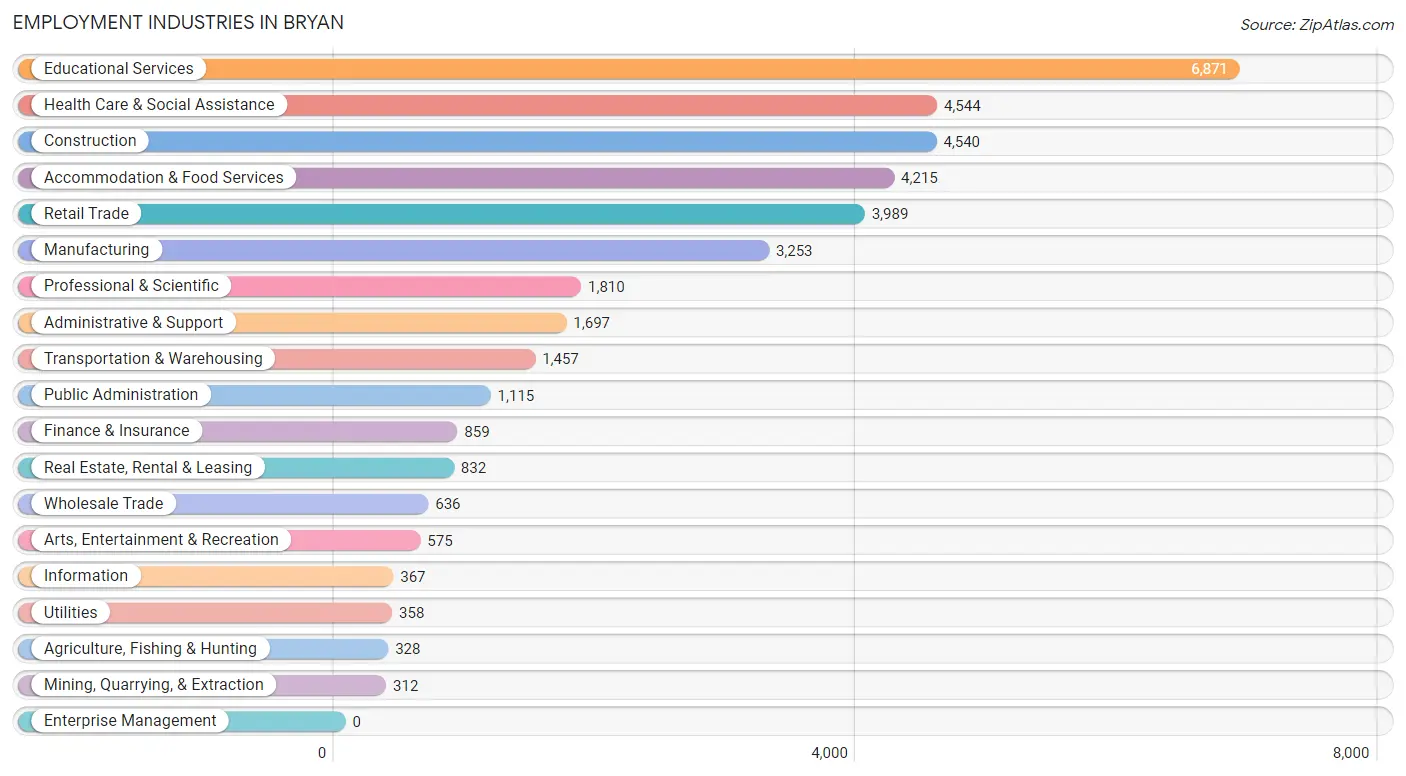
Employment Industries in Bryan
The major employment industries in Bryan include Educational Services (6,871 | 17.3%), Health Care & Social Assistance (4,544 | 11.5%), Construction (4,540 | 11.5%), Accommodation & Food Services (4,215 | 10.6%), and Retail Trade (3,989 | 10.1%).
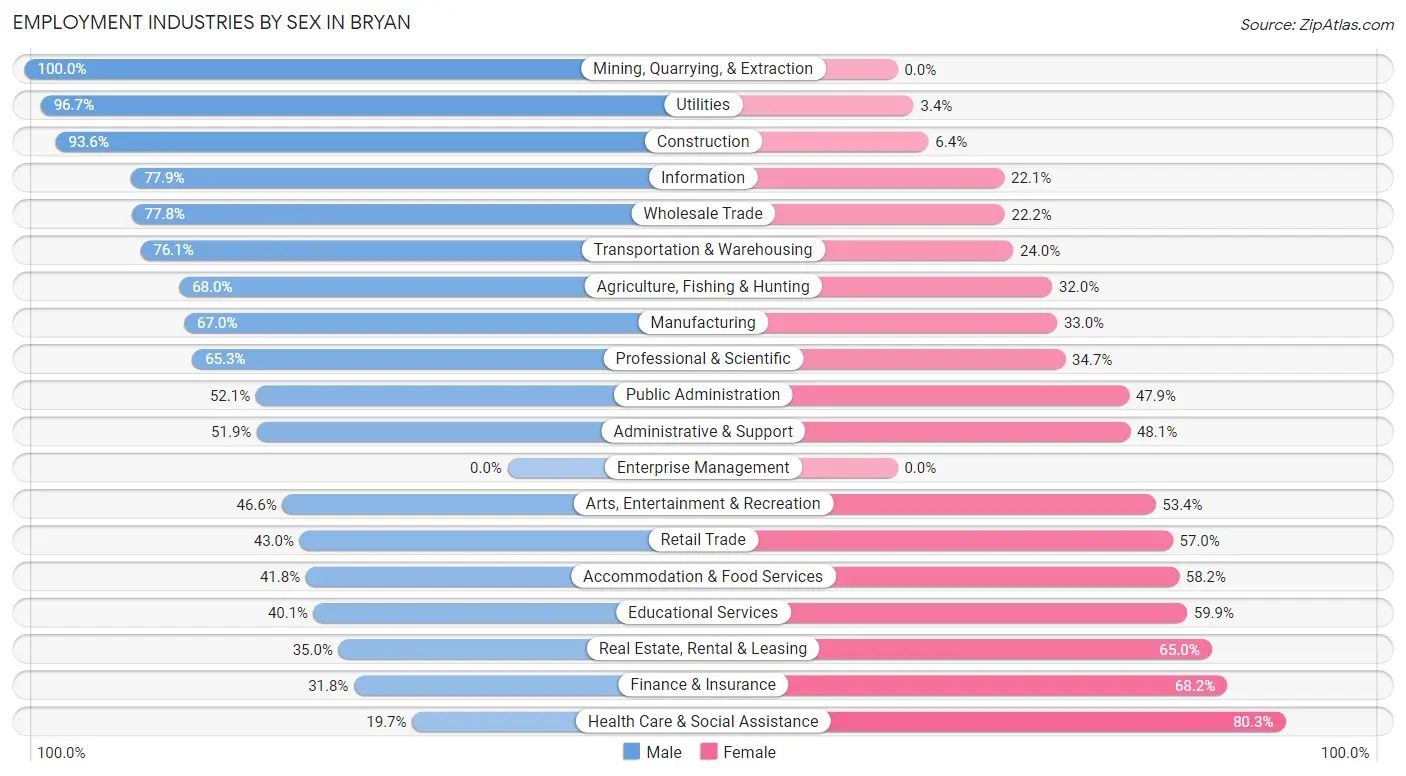
Employment Industries by Sex in Bryan
The Bryan industries that see more men than women are Mining, Quarrying, & Extraction (100.0%), Utilities (96.7%), and Construction (93.6%), whereas the industries that tend to have a higher number of women are Health Care & Social Assistance (80.3%), Finance & Insurance (68.2%), and Real Estate, Rental & Leasing (65.0%).
| Industry | Male | Female |
| Agriculture, Fishing & Hunting | 223 (68.0%) | 105 (32.0%) |
| Mining, Quarrying, & Extraction | 312 (100.0%) | 0 (0.0%) |
| Construction | 4,249 (93.6%) | 291 (6.4%) |
| Manufacturing | 2,179 (67.0%) | 1,074 (33.0%) |
| Wholesale Trade | 495 (77.8%) | 141 (22.2%) |
| Retail Trade | 1,717 (43.0%) | 2,272 (57.0%) |
| Transportation & Warehousing | 1,108 (76.0%) | 349 (23.9%) |
| Utilities | 346 (96.7%) | 12 (3.4%) |
| Information | 286 (77.9%) | 81 (22.1%) |
| Finance & Insurance | 273 (31.8%) | 586 (68.2%) |
| Real Estate, Rental & Leasing | 291 (35.0%) | 541 (65.0%) |
| Professional & Scientific | 1,182 (65.3%) | 628 (34.7%) |
| Enterprise Management | 0 (0.0%) | 0 (0.0%) |
| Administrative & Support | 880 (51.9%) | 817 (48.1%) |
| Educational Services | 2,756 (40.1%) | 4,115 (59.9%) |
| Health Care & Social Assistance | 897 (19.7%) | 3,647 (80.3%) |
| Arts, Entertainment & Recreation | 268 (46.6%) | 307 (53.4%) |
| Accommodation & Food Services | 1,760 (41.8%) | 2,455 (58.2%) |
| Public Administration | 581 (52.1%) | 534 (47.9%) |
| Total | 20,925 (52.8%) | 18,737 (47.2%) |
Education in Bryan
School Enrollment in Bryan
The most common levels of schooling among the 24,787 students in Bryan are college / undergraduate (6,821 | 27.5%), elementary school (4,620 | 18.6%), and middle school (4,433 | 17.9%).
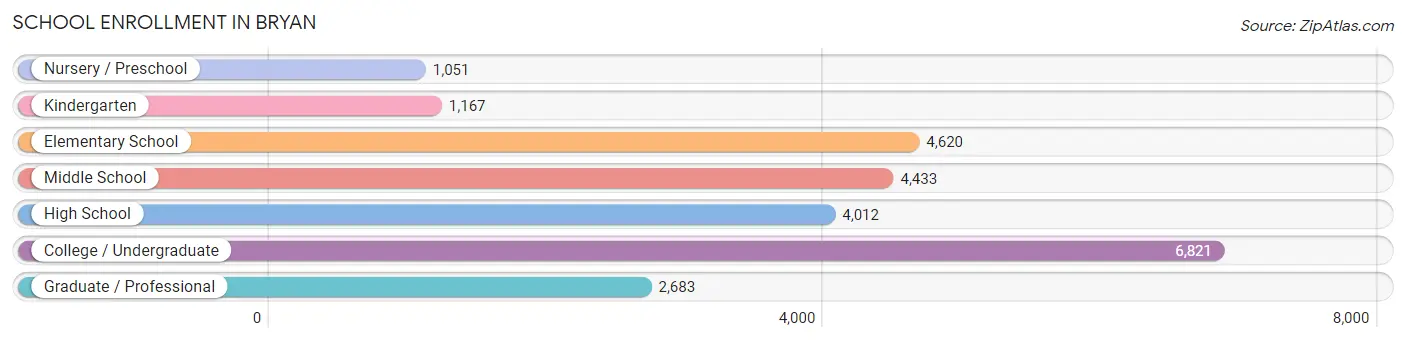
| School Level | # Students | % Students |
| Nursery / Preschool | 1,051 | 4.2% |
| Kindergarten | 1,167 | 4.7% |
| Elementary School | 4,620 | 18.6% |
| Middle School | 4,433 | 17.9% |
| High School | 4,012 | 16.2% |
| College / Undergraduate | 6,821 | 27.5% |
| Graduate / Professional | 2,683 | 10.8% |
| Total | 24,787 | 100.0% |
School Enrollment by Age by Funding Source in Bryan
Out of a total of 24,787 students who are enrolled in schools in Bryan, 1,710 (6.9%) attend a private institution, while the remaining 23,077 (93.1%) are enrolled in public schools. The age group of 3 to 4 year olds has the highest likelihood of being enrolled in private schools, with 327 (38.3% in the age bracket) enrolled. Conversely, the age group of 20 to 24 year olds has the lowest likelihood of being enrolled in a private school, with 5,096 (97.6% in the age bracket) attending a public institution.
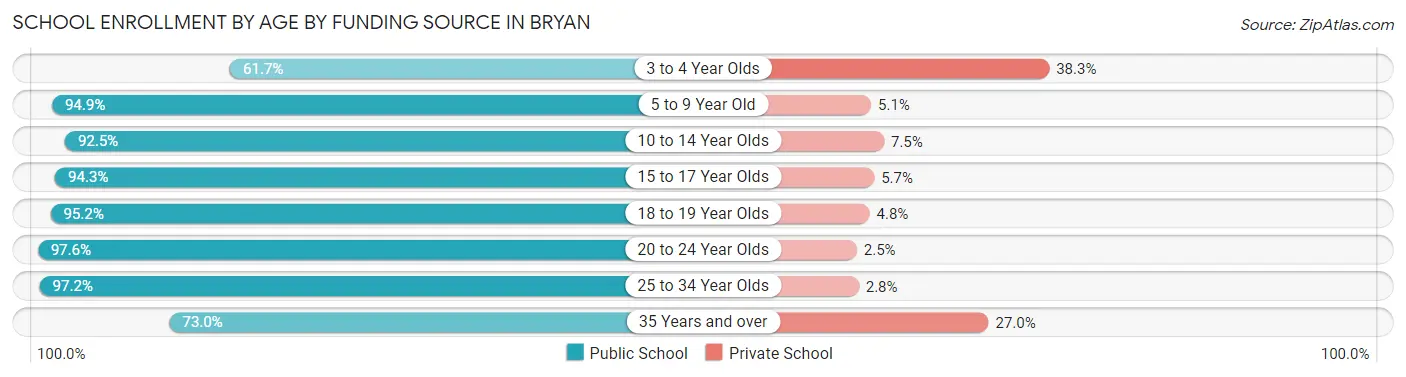
| Age Bracket | Public School | Private School |
| 3 to 4 Year Olds | 527 (61.7%) | 327 (38.3%) |
| 5 to 9 Year Old | 5,091 (94.9%) | 274 (5.1%) |
| 10 to 14 Year Olds | 5,007 (92.5%) | 407 (7.5%) |
| 15 to 17 Year Olds | 2,503 (94.3%) | 151 (5.7%) |
| 18 to 19 Year Olds | 1,873 (95.2%) | 95 (4.8%) |
| 20 to 24 Year Olds | 5,096 (97.6%) | 128 (2.5%) |
| 25 to 34 Year Olds | 2,318 (97.2%) | 67 (2.8%) |
| 35 Years and over | 674 (73.0%) | 249 (27.0%) |
| Total | 23,077 (93.1%) | 1,710 (6.9%) |
Educational Attainment by Field of Study in Bryan
Bio, nature & agricultural (2,493 | 15.1%), education (2,307 | 14.0%), business (2,279 | 13.8%), science & technology (1,453 | 8.8%), and engineering (1,358 | 8.3%) are the most common fields of study among 16,465 individuals in Bryan who have obtained a bachelor's degree or higher.
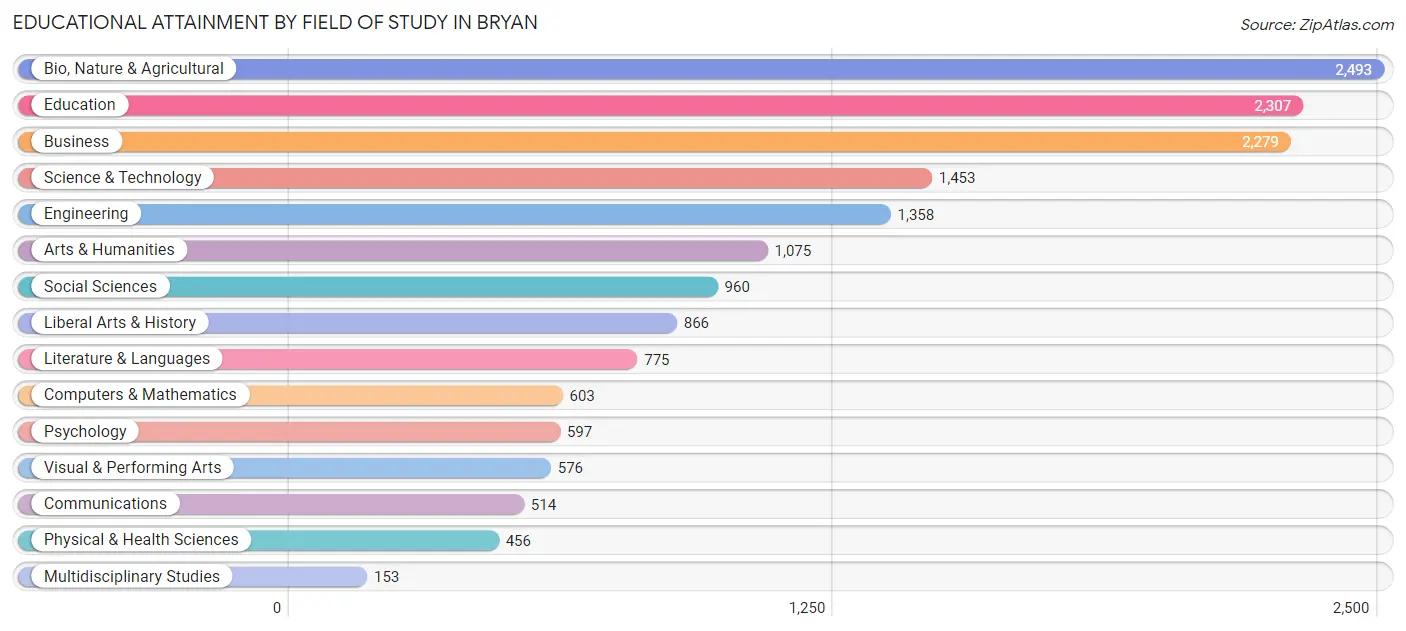
| Field of Study | # Graduates | % Graduates |
| Computers & Mathematics | 603 | 3.7% |
| Bio, Nature & Agricultural | 2,493 | 15.1% |
| Physical & Health Sciences | 456 | 2.8% |
| Psychology | 597 | 3.6% |
| Social Sciences | 960 | 5.8% |
| Engineering | 1,358 | 8.3% |
| Multidisciplinary Studies | 153 | 0.9% |
| Science & Technology | 1,453 | 8.8% |
| Business | 2,279 | 13.8% |
| Education | 2,307 | 14.0% |
| Literature & Languages | 775 | 4.7% |
| Liberal Arts & History | 866 | 5.3% |
| Visual & Performing Arts | 576 | 3.5% |
| Communications | 514 | 3.1% |
| Arts & Humanities | 1,075 | 6.5% |
| Total | 16,465 | 100.0% |
Transportation & Commute in Bryan
Vehicle Availability by Sex in Bryan
The most prevalent vehicle ownership categories in Bryan are males with 2 vehicles (9,237, accounting for 44.8%) and females with 2 vehicles (7,398, making up 50.5%).
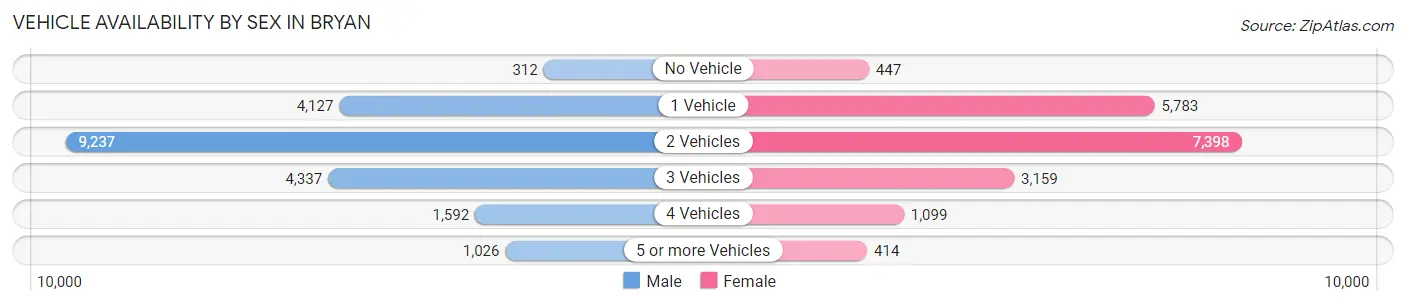
| Vehicles Available | Male | Female |
| No Vehicle | 312 (1.5%) | 447 (2.4%) |
| 1 Vehicle | 4,127 (20.0%) | 5,783 (31.6%) |
| 2 Vehicles | 9,237 (44.8%) | 7,398 (40.4%) |
| 3 Vehicles | 4,337 (21.0%) | 3,159 (17.3%) |
| 4 Vehicles | 1,592 (7.7%) | 1,099 (6.0%) |
| 5 or more Vehicles | 1,026 (5.0%) | 414 (2.3%) |
| Total | 20,631 (100.0%) | 18,300 (100.0%) |
Commute Time in Bryan
The most frequently occuring commute durations in Bryan are 15 to 19 minutes (11,723 commuters, 31.5%), 10 to 14 minutes (9,132 commuters, 24.6%), and 20 to 24 minutes (4,791 commuters, 12.9%).
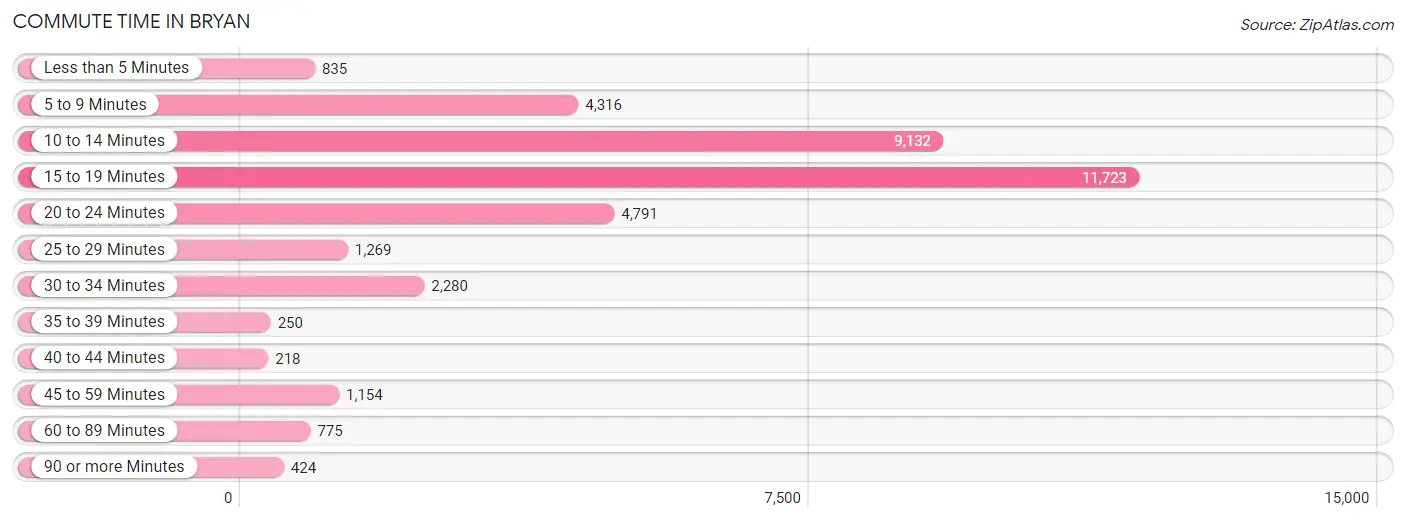
| Commute Time | # Commuters | % Commuters |
| Less than 5 Minutes | 835 | 2.2% |
| 5 to 9 Minutes | 4,316 | 11.6% |
| 10 to 14 Minutes | 9,132 | 24.6% |
| 15 to 19 Minutes | 11,723 | 31.5% |
| 20 to 24 Minutes | 4,791 | 12.9% |
| 25 to 29 Minutes | 1,269 | 3.4% |
| 30 to 34 Minutes | 2,280 | 6.1% |
| 35 to 39 Minutes | 250 | 0.7% |
| 40 to 44 Minutes | 218 | 0.6% |
| 45 to 59 Minutes | 1,154 | 3.1% |
| 60 to 89 Minutes | 775 | 2.1% |
| 90 or more Minutes | 424 | 1.1% |
Commute Time by Sex in Bryan
The most common commute times in Bryan are 15 to 19 minutes (5,997 commuters, 30.3%) for males and 15 to 19 minutes (5,726 commuters, 32.9%) for females.
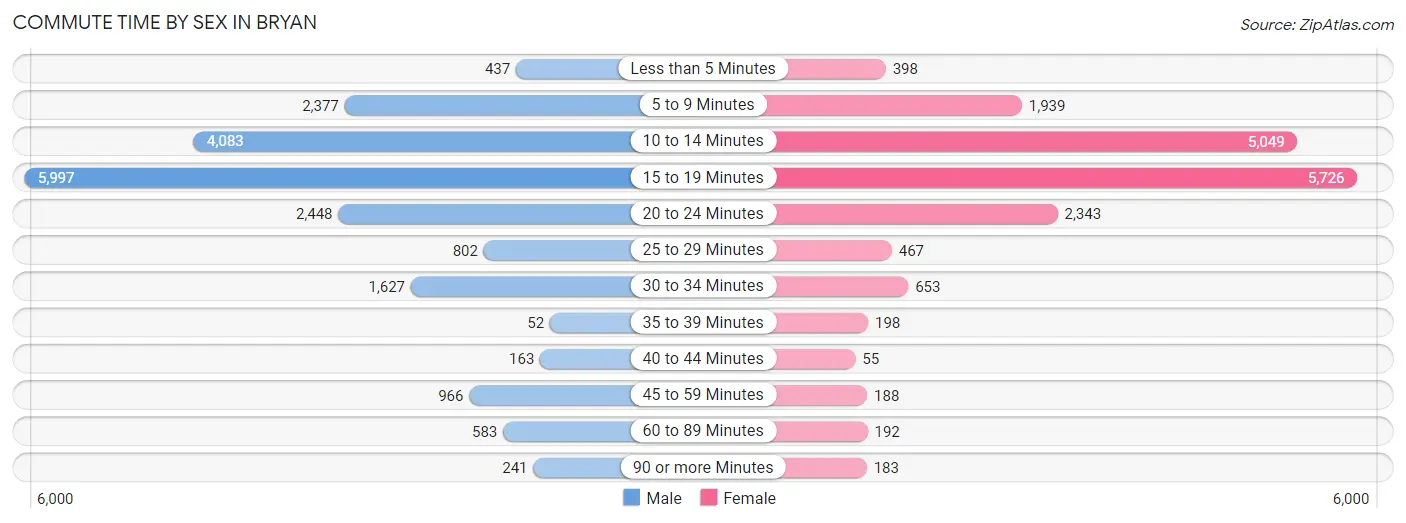
| Commute Time | Male | Female |
| Less than 5 Minutes | 437 (2.2%) | 398 (2.3%) |
| 5 to 9 Minutes | 2,377 (12.0%) | 1,939 (11.2%) |
| 10 to 14 Minutes | 4,083 (20.6%) | 5,049 (29.0%) |
| 15 to 19 Minutes | 5,997 (30.3%) | 5,726 (32.9%) |
| 20 to 24 Minutes | 2,448 (12.4%) | 2,343 (13.5%) |
| 25 to 29 Minutes | 802 (4.1%) | 467 (2.7%) |
| 30 to 34 Minutes | 1,627 (8.2%) | 653 (3.7%) |
| 35 to 39 Minutes | 52 (0.3%) | 198 (1.1%) |
| 40 to 44 Minutes | 163 (0.8%) | 55 (0.3%) |
| 45 to 59 Minutes | 966 (4.9%) | 188 (1.1%) |
| 60 to 89 Minutes | 583 (2.9%) | 192 (1.1%) |
| 90 or more Minutes | 241 (1.2%) | 183 (1.1%) |
Time of Departure to Work by Sex in Bryan
The most frequent times of departure to work in Bryan are 7:30 AM to 7:59 AM (3,399, 17.2%) for males and 7:30 AM to 7:59 AM (3,193, 18.4%) for females.
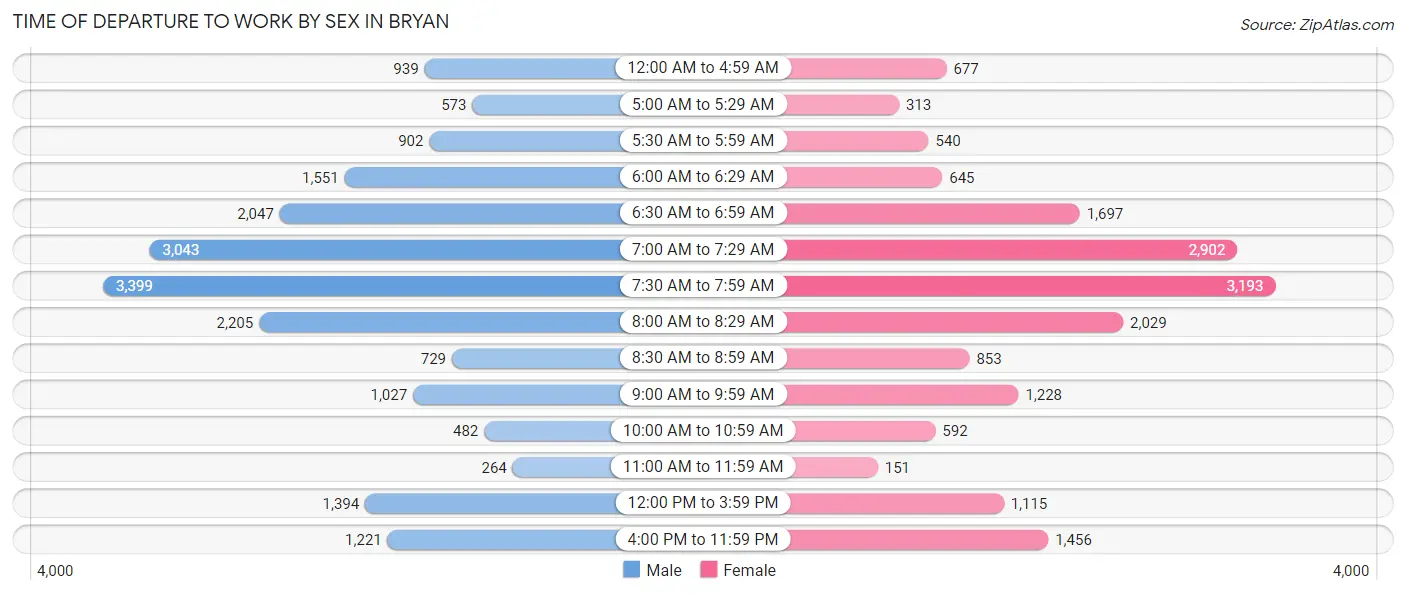
| Time of Departure | Male | Female |
| 12:00 AM to 4:59 AM | 939 (4.8%) | 677 (3.9%) |
| 5:00 AM to 5:29 AM | 573 (2.9%) | 313 (1.8%) |
| 5:30 AM to 5:59 AM | 902 (4.6%) | 540 (3.1%) |
| 6:00 AM to 6:29 AM | 1,551 (7.8%) | 645 (3.7%) |
| 6:30 AM to 6:59 AM | 2,047 (10.3%) | 1,697 (9.8%) |
| 7:00 AM to 7:29 AM | 3,043 (15.4%) | 2,902 (16.7%) |
| 7:30 AM to 7:59 AM | 3,399 (17.2%) | 3,193 (18.4%) |
| 8:00 AM to 8:29 AM | 2,205 (11.2%) | 2,029 (11.7%) |
| 8:30 AM to 8:59 AM | 729 (3.7%) | 853 (4.9%) |
| 9:00 AM to 9:59 AM | 1,027 (5.2%) | 1,228 (7.1%) |
| 10:00 AM to 10:59 AM | 482 (2.4%) | 592 (3.4%) |
| 11:00 AM to 11:59 AM | 264 (1.3%) | 151 (0.9%) |
| 12:00 PM to 3:59 PM | 1,394 (7.0%) | 1,115 (6.4%) |
| 4:00 PM to 11:59 PM | 1,221 (6.2%) | 1,456 (8.4%) |
| Total | 19,776 (100.0%) | 17,391 (100.0%) |
Housing Occupancy in Bryan
Occupancy by Ownership in Bryan
Of the total 31,238 dwellings in Bryan, owner-occupied units account for 15,397 (49.3%), while renter-occupied units make up 15,841 (50.7%).
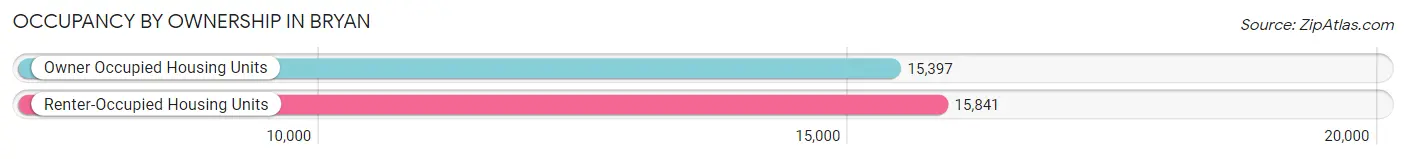
| Occupancy | # Housing Units | % Housing Units |
| Owner Occupied Housing Units | 15,397 | 49.3% |
| Renter-Occupied Housing Units | 15,841 | 50.7% |
| Total Occupied Housing Units | 31,238 | 100.0% |
Occupancy by Household Size in Bryan
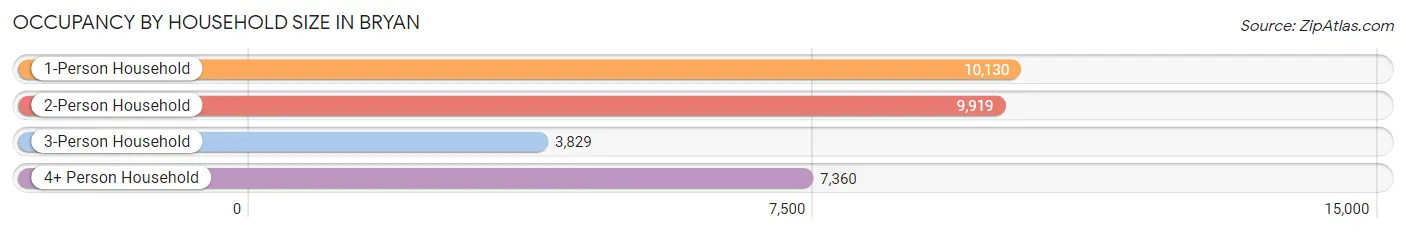
| Household Size | # Housing Units | % Housing Units |
| 1-Person Household | 10,130 | 32.4% |
| 2-Person Household | 9,919 | 31.8% |
| 3-Person Household | 3,829 | 12.3% |
| 4+ Person Household | 7,360 | 23.6% |
| Total Housing Units | 31,238 | 100.0% |
Occupancy by Ownership by Household Size in Bryan
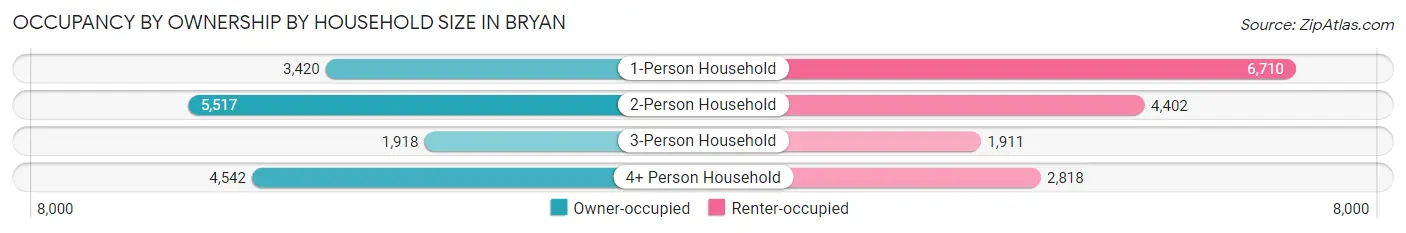
| Household Size | Owner-occupied | Renter-occupied |
| 1-Person Household | 3,420 (33.8%) | 6,710 (66.2%) |
| 2-Person Household | 5,517 (55.6%) | 4,402 (44.4%) |
| 3-Person Household | 1,918 (50.1%) | 1,911 (49.9%) |
| 4+ Person Household | 4,542 (61.7%) | 2,818 (38.3%) |
| Total Housing Units | 15,397 (49.3%) | 15,841 (50.7%) |
Occupancy by Educational Attainment in Bryan
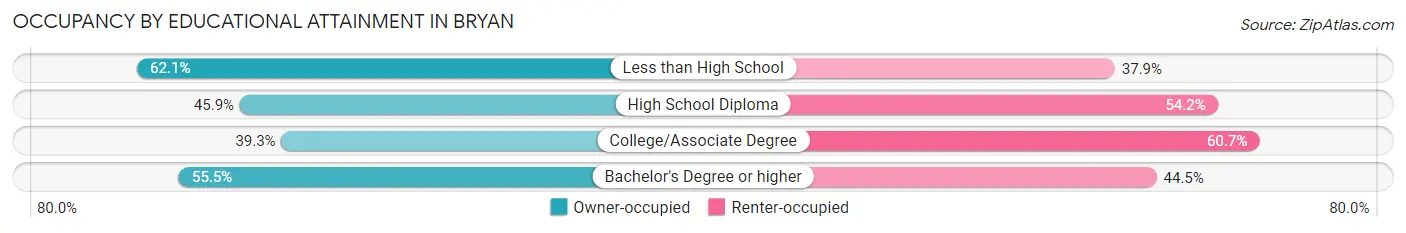
| Household Size | Owner-occupied | Renter-occupied |
| Less than High School | 2,611 (62.1%) | 1,591 (37.9%) |
| High School Diploma | 3,275 (45.9%) | 3,868 (54.1%) |
| College/Associate Degree | 3,705 (39.3%) | 5,731 (60.7%) |
| Bachelor's Degree or higher | 5,806 (55.5%) | 4,651 (44.5%) |
Occupancy by Age of Householder in Bryan
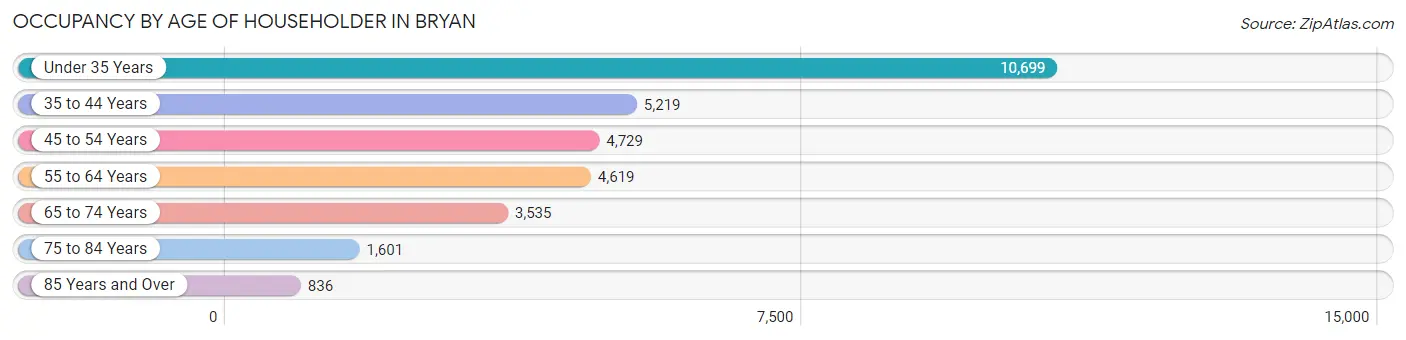
| Age Bracket | # Households | % Households |
| Under 35 Years | 10,699 | 34.3% |
| 35 to 44 Years | 5,219 | 16.7% |
| 45 to 54 Years | 4,729 | 15.1% |
| 55 to 64 Years | 4,619 | 14.8% |
| 65 to 74 Years | 3,535 | 11.3% |
| 75 to 84 Years | 1,601 | 5.1% |
| 85 Years and Over | 836 | 2.7% |
| Total | 31,238 | 100.0% |
Housing Finances in Bryan
Median Income by Occupancy in Bryan
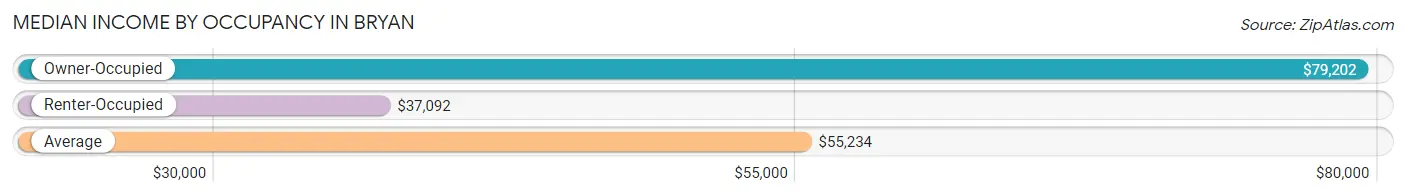
| Occupancy Type | # Households | Median Income |
| Owner-Occupied | 15,397 (49.3%) | $79,202 |
| Renter-Occupied | 15,841 (50.7%) | $37,092 |
| Average | 31,238 (100.0%) | $55,234 |
Occupancy by Householder Income Bracket in Bryan
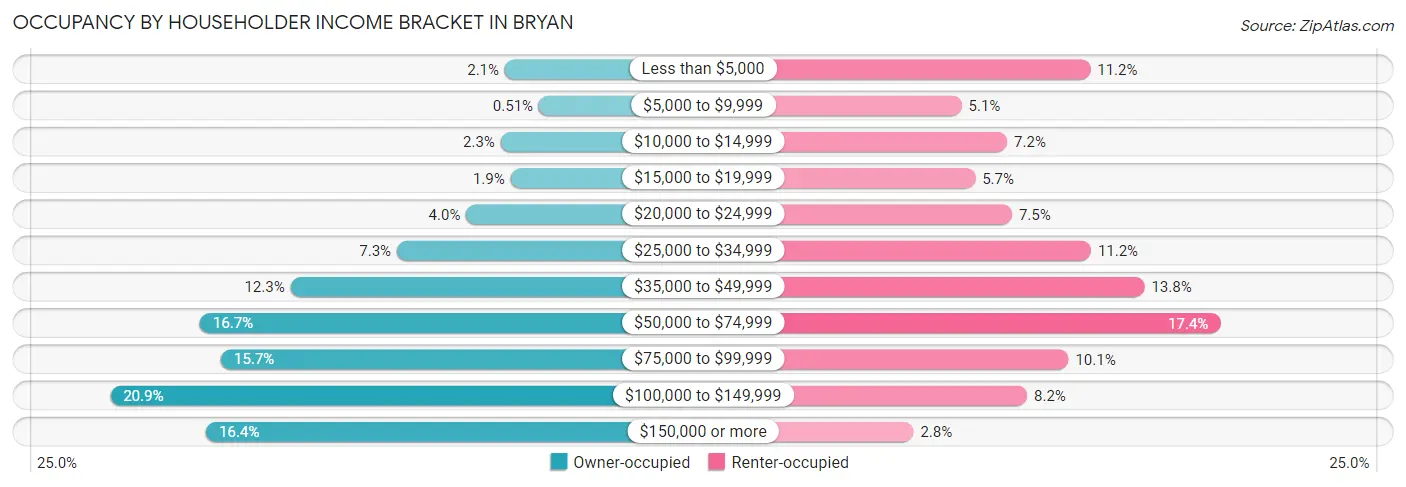
| Income Bracket | Owner-occupied | Renter-occupied |
| Less than $5,000 | 328 (2.1%) | 1,771 (11.2%) |
| $5,000 to $9,999 | 79 (0.5%) | 800 (5.1%) |
| $10,000 to $14,999 | 359 (2.3%) | 1,144 (7.2%) |
| $15,000 to $19,999 | 287 (1.9%) | 903 (5.7%) |
| $20,000 to $24,999 | 612 (4.0%) | 1,180 (7.4%) |
| $25,000 to $34,999 | 1,119 (7.3%) | 1,776 (11.2%) |
| $35,000 to $49,999 | 1,900 (12.3%) | 2,180 (13.8%) |
| $50,000 to $74,999 | 2,563 (16.7%) | 2,750 (17.4%) |
| $75,000 to $99,999 | 2,410 (15.7%) | 1,606 (10.1%) |
| $100,000 to $149,999 | 3,221 (20.9%) | 1,294 (8.2%) |
| $150,000 or more | 2,519 (16.4%) | 437 (2.8%) |
| Total | 15,397 (100.0%) | 15,841 (100.0%) |
Monthly Housing Cost Tiers in Bryan
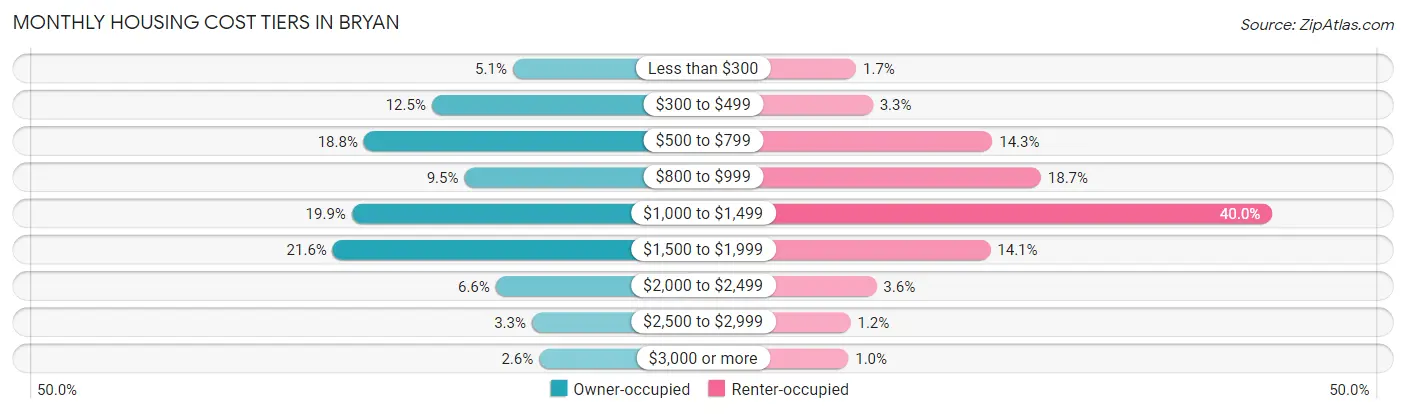
| Monthly Cost | Owner-occupied | Renter-occupied |
| Less than $300 | 779 (5.1%) | 272 (1.7%) |
| $300 to $499 | 1,928 (12.5%) | 515 (3.3%) |
| $500 to $799 | 2,891 (18.8%) | 2,259 (14.3%) |
| $800 to $999 | 1,466 (9.5%) | 2,967 (18.7%) |
| $1,000 to $1,499 | 3,062 (19.9%) | 6,340 (40.0%) |
| $1,500 to $1,999 | 3,332 (21.6%) | 2,230 (14.1%) |
| $2,000 to $2,499 | 1,023 (6.6%) | 568 (3.6%) |
| $2,500 to $2,999 | 510 (3.3%) | 191 (1.2%) |
| $3,000 or more | 406 (2.6%) | 158 (1.0%) |
| Total | 15,397 (100.0%) | 15,841 (100.0%) |
Physical Housing Characteristics in Bryan
Housing Structures in Bryan
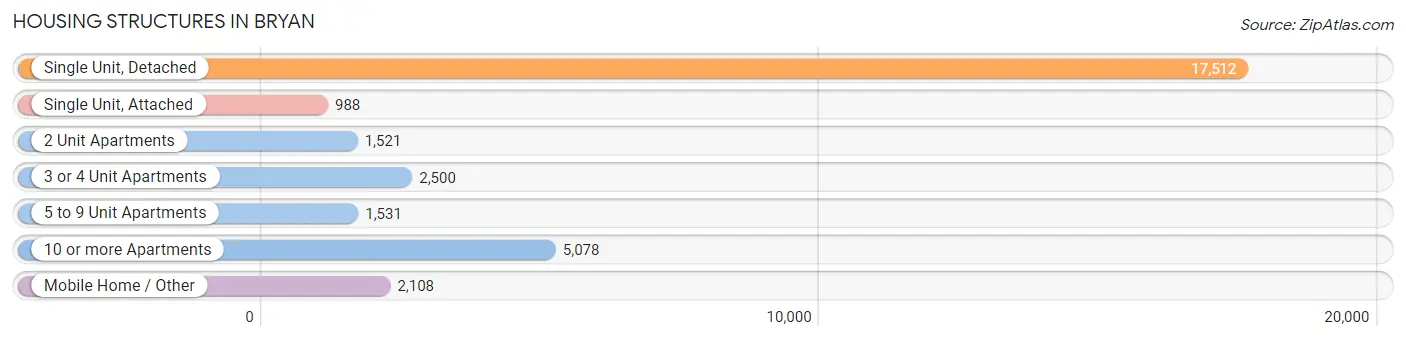
| Structure Type | # Housing Units | % Housing Units |
| Single Unit, Detached | 17,512 | 56.1% |
| Single Unit, Attached | 988 | 3.2% |
| 2 Unit Apartments | 1,521 | 4.9% |
| 3 or 4 Unit Apartments | 2,500 | 8.0% |
| 5 to 9 Unit Apartments | 1,531 | 4.9% |
| 10 or more Apartments | 5,078 | 16.3% |
| Mobile Home / Other | 2,108 | 6.8% |
| Total | 31,238 | 100.0% |
Housing Structures by Occupancy in Bryan
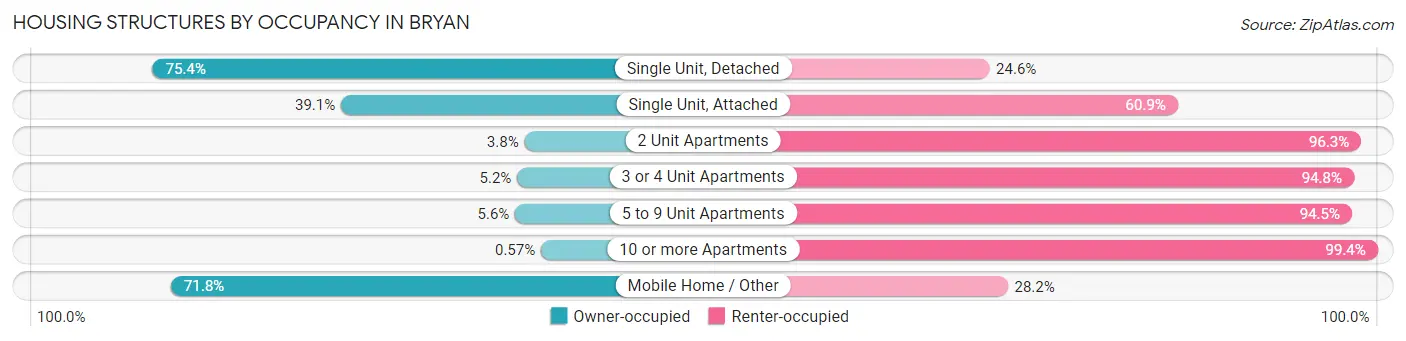
| Structure Type | Owner-occupied | Renter-occupied |
| Single Unit, Detached | 13,197 (75.4%) | 4,315 (24.6%) |
| Single Unit, Attached | 386 (39.1%) | 602 (60.9%) |
| 2 Unit Apartments | 57 (3.7%) | 1,464 (96.3%) |
| 3 or 4 Unit Apartments | 129 (5.2%) | 2,371 (94.8%) |
| 5 to 9 Unit Apartments | 85 (5.6%) | 1,446 (94.5%) |
| 10 or more Apartments | 29 (0.6%) | 5,049 (99.4%) |
| Mobile Home / Other | 1,514 (71.8%) | 594 (28.2%) |
| Total | 15,397 (49.3%) | 15,841 (50.7%) |
Housing Structures by Number of Rooms in Bryan
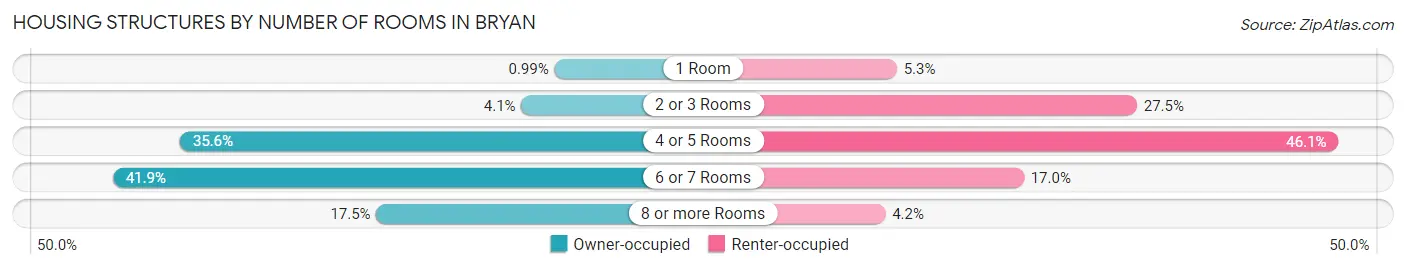
| Number of Rooms | Owner-occupied | Renter-occupied |
| 1 Room | 153 (1.0%) | 832 (5.2%) |
| 2 or 3 Rooms | 623 (4.1%) | 4,350 (27.5%) |
| 4 or 5 Rooms | 5,488 (35.6%) | 7,302 (46.1%) |
| 6 or 7 Rooms | 6,444 (41.8%) | 2,693 (17.0%) |
| 8 or more Rooms | 2,689 (17.5%) | 664 (4.2%) |
| Total | 15,397 (100.0%) | 15,841 (100.0%) |
Housing Structure by Heating Type in Bryan
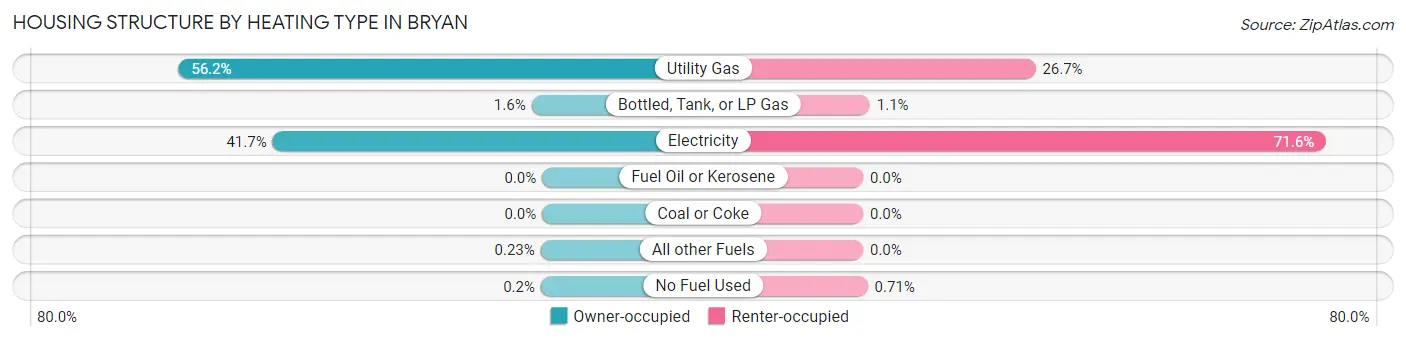
| Heating Type | Owner-occupied | Renter-occupied |
| Utility Gas | 8,660 (56.2%) | 4,221 (26.7%) |
| Bottled, Tank, or LP Gas | 253 (1.6%) | 167 (1.1%) |
| Electricity | 6,418 (41.7%) | 11,340 (71.6%) |
| Fuel Oil or Kerosene | 0 (0.0%) | 0 (0.0%) |
| Coal or Coke | 0 (0.0%) | 0 (0.0%) |
| All other Fuels | 35 (0.2%) | 0 (0.0%) |
| No Fuel Used | 31 (0.2%) | 113 (0.7%) |
| Total | 15,397 (100.0%) | 15,841 (100.0%) |
Household Vehicle Usage in Bryan
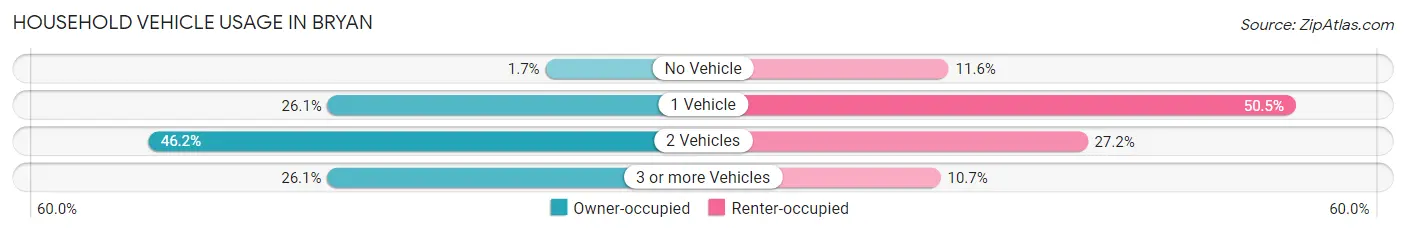
| Vehicles per Household | Owner-occupied | Renter-occupied |
| No Vehicle | 255 (1.7%) | 1,841 (11.6%) |
| 1 Vehicle | 4,011 (26.1%) | 7,999 (50.5%) |
| 2 Vehicles | 7,114 (46.2%) | 4,304 (27.2%) |
| 3 or more Vehicles | 4,017 (26.1%) | 1,697 (10.7%) |
| Total | 15,397 (100.0%) | 15,841 (100.0%) |
Real Estate & Mortgages in Bryan
Real Estate and Mortgage Overview in Bryan
| Characteristic | Without Mortgage | With Mortgage |
| Housing Units | 6,752 | 8,645 |
| Median Property Value | $177,000 | $207,500 |
| Median Household Income | $64,186 | $1,571 |
| Monthly Housing Costs | $602 | $363 |
| Real Estate Taxes | $2,703 | $478 |
Property Value by Mortgage Status in Bryan
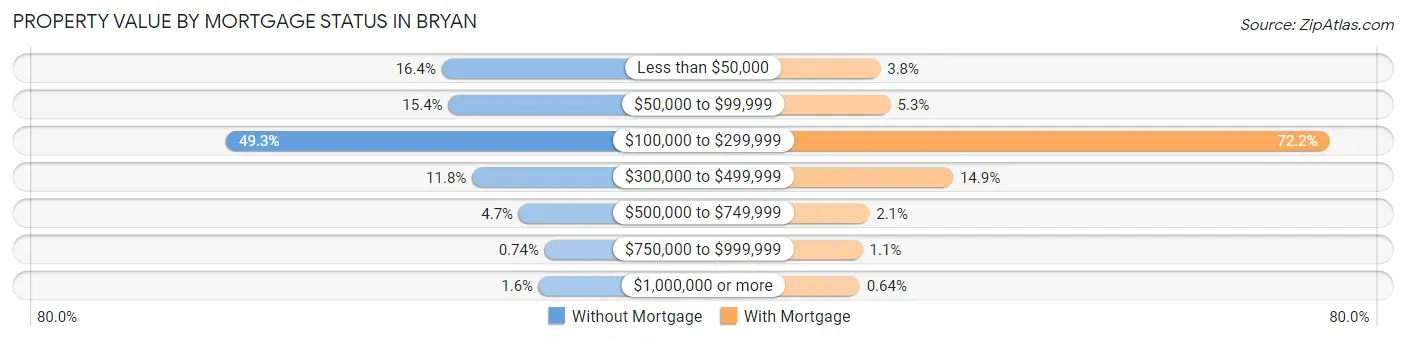
| Property Value | Without Mortgage | With Mortgage |
| Less than $50,000 | 1,110 (16.4%) | 326 (3.8%) |
| $50,000 to $99,999 | 1,041 (15.4%) | 462 (5.3%) |
| $100,000 to $299,999 | 3,329 (49.3%) | 6,244 (72.2%) |
| $300,000 to $499,999 | 797 (11.8%) | 1,284 (14.8%) |
| $500,000 to $749,999 | 315 (4.7%) | 181 (2.1%) |
| $750,000 to $999,999 | 50 (0.7%) | 93 (1.1%) |
| $1,000,000 or more | 110 (1.6%) | 55 (0.6%) |
| Total | 6,752 (100.0%) | 8,645 (100.0%) |
Household Income by Mortgage Status in Bryan
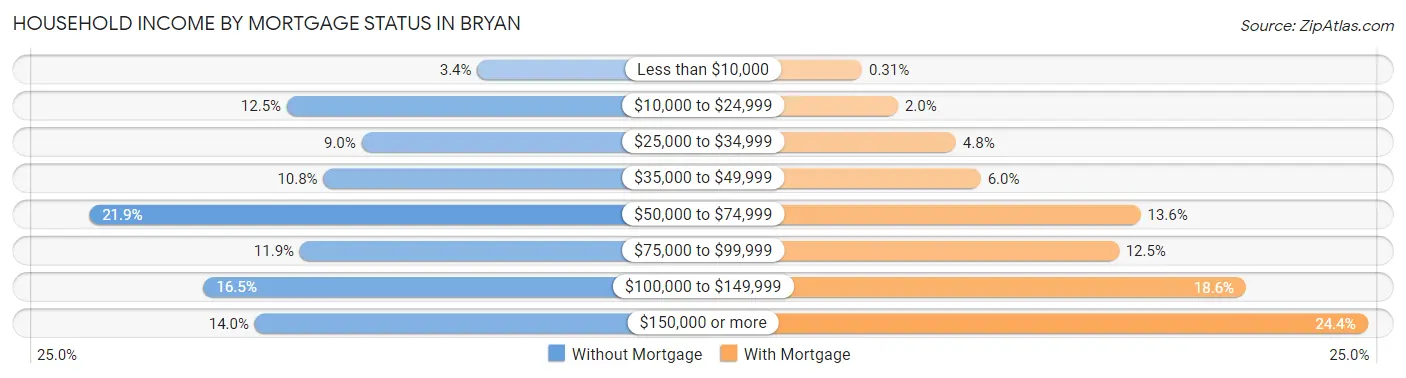
| Household Income | Without Mortgage | With Mortgage |
| Less than $10,000 | 232 (3.4%) | 27 (0.3%) |
| $10,000 to $24,999 | 845 (12.5%) | 175 (2.0%) |
| $25,000 to $34,999 | 604 (8.9%) | 413 (4.8%) |
| $35,000 to $49,999 | 727 (10.8%) | 515 (6.0%) |
| $50,000 to $74,999 | 1,480 (21.9%) | 1,173 (13.6%) |
| $75,000 to $99,999 | 803 (11.9%) | 1,083 (12.5%) |
| $100,000 to $149,999 | 1,113 (16.5%) | 1,607 (18.6%) |
| $150,000 or more | 948 (14.0%) | 2,108 (24.4%) |
| Total | 6,752 (100.0%) | 8,645 (100.0%) |
Property Value to Household Income Ratio in Bryan
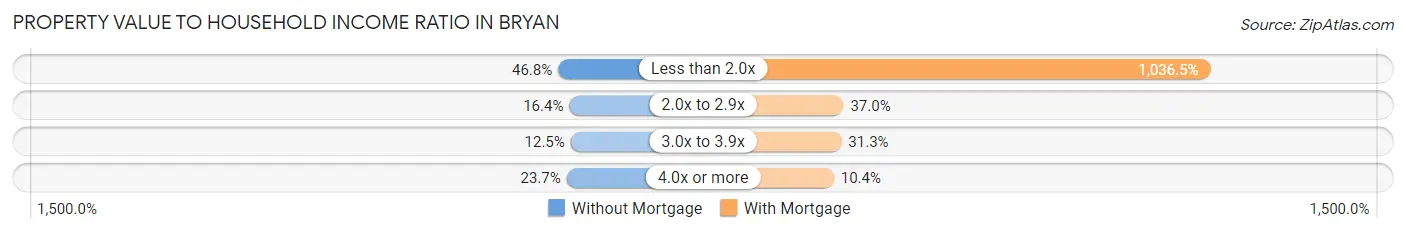
| Value-to-Income Ratio | Without Mortgage | With Mortgage |
| Less than 2.0x | 3,162 (46.8%) | 89,602 (1,036.5%) |
| 2.0x to 2.9x | 1,105 (16.4%) | 3,199 (37.0%) |
| 3.0x to 3.9x | 845 (12.5%) | 2,703 (31.3%) |
| 4.0x or more | 1,597 (23.6%) | 902 (10.4%) |
| Total | 6,752 (100.0%) | 8,645 (100.0%) |
Real Estate Taxes by Mortgage Status in Bryan
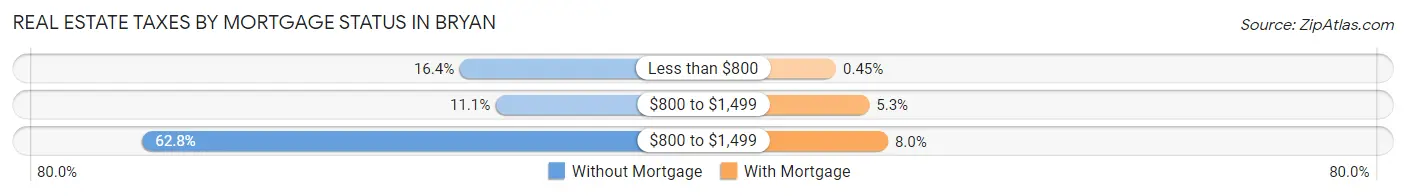
| Property Taxes | Without Mortgage | With Mortgage |
| Less than $800 | 1,106 (16.4%) | 39 (0.4%) |
| $800 to $1,499 | 750 (11.1%) | 458 (5.3%) |
| $800 to $1,499 | 4,239 (62.8%) | 693 (8.0%) |
| Total | 6,752 (100.0%) | 8,645 (100.0%) |
Health & Disability in Bryan
Health Insurance Coverage by Age in Bryan
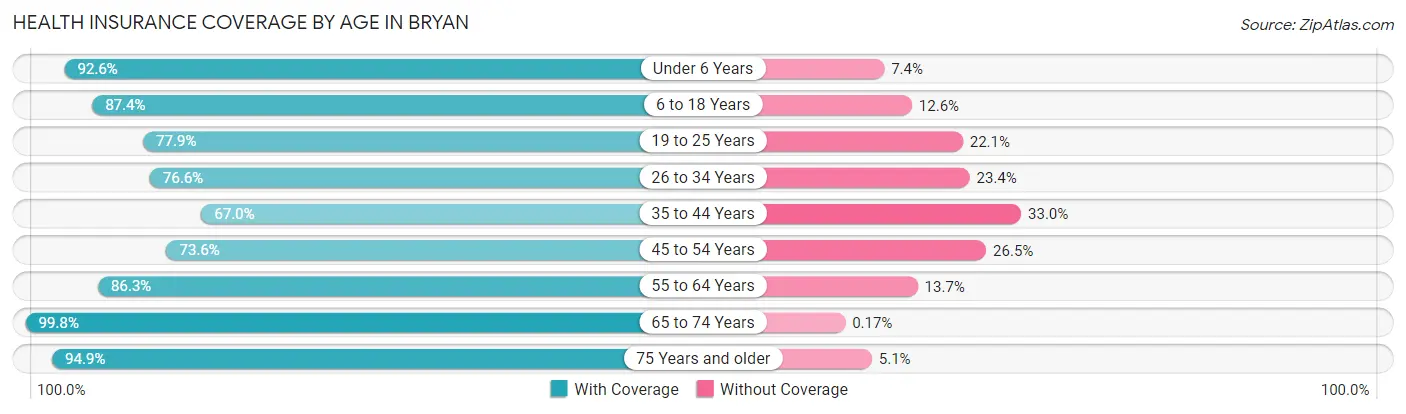
| Age Bracket | With Coverage | Without Coverage |
| Under 6 Years | 6,418 (92.6%) | 516 (7.4%) |
| 6 to 18 Years | 12,817 (87.4%) | 1,849 (12.6%) |
| 19 to 25 Years | 9,788 (77.9%) | 2,775 (22.1%) |
| 26 to 34 Years | 9,103 (76.6%) | 2,776 (23.4%) |
| 35 to 44 Years | 6,682 (67.0%) | 3,287 (33.0%) |
| 45 to 54 Years | 5,881 (73.6%) | 2,115 (26.5%) |
| 55 to 64 Years | 6,607 (86.3%) | 1,047 (13.7%) |
| 65 to 74 Years | 5,358 (99.8%) | 9 (0.2%) |
| 75 Years and older | 3,709 (94.9%) | 201 (5.1%) |
| Total | 66,363 (82.0%) | 14,575 (18.0%) |
Health Insurance Coverage by Citizenship Status in Bryan
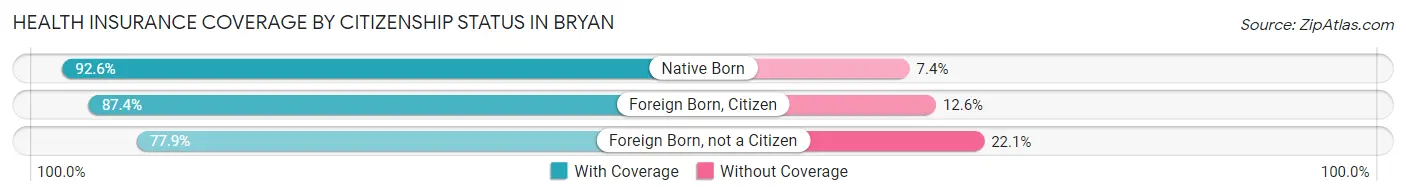
| Citizenship Status | With Coverage | Without Coverage |
| Native Born | 6,418 (92.6%) | 516 (7.4%) |
| Foreign Born, Citizen | 12,817 (87.4%) | 1,849 (12.6%) |
| Foreign Born, not a Citizen | 9,788 (77.9%) | 2,775 (22.1%) |
Health Insurance Coverage by Household Income in Bryan
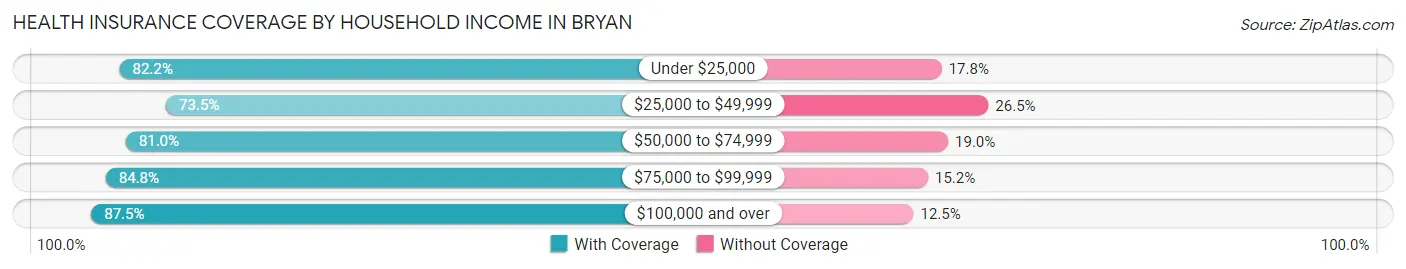
| Household Income | With Coverage | Without Coverage |
| Under $25,000 | 12,392 (82.2%) | 2,681 (17.8%) |
| $25,000 to $49,999 | 11,609 (73.5%) | 4,193 (26.5%) |
| $50,000 to $74,999 | 12,096 (81.0%) | 2,833 (19.0%) |
| $75,000 to $99,999 | 9,445 (84.8%) | 1,696 (15.2%) |
| $100,000 and over | 20,603 (87.5%) | 2,943 (12.5%) |
Public vs Private Health Insurance Coverage by Age in Bryan
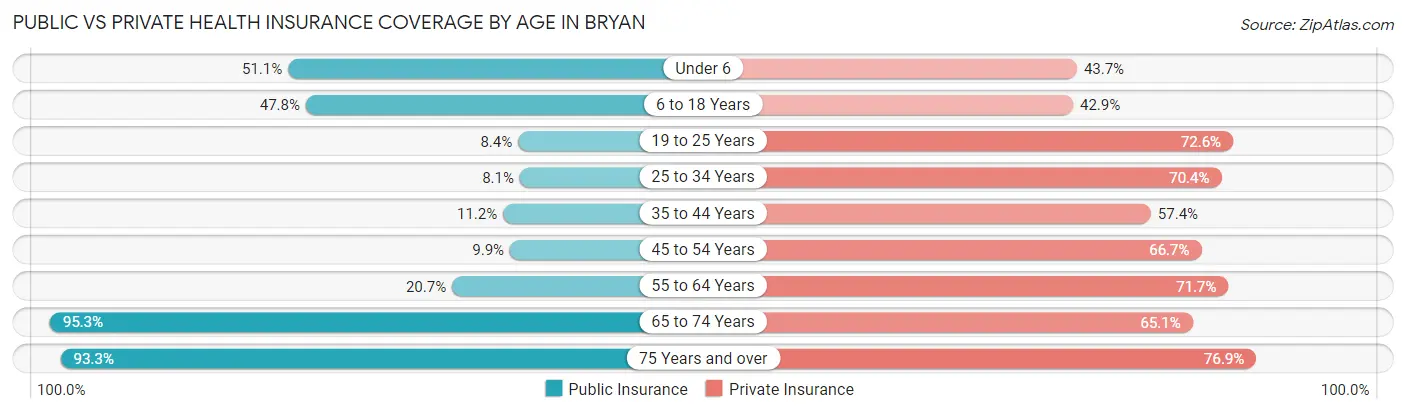
| Age Bracket | Public Insurance | Private Insurance |
| Under 6 | 3,543 (51.1%) | 3,027 (43.6%) |
| 6 to 18 Years | 7,010 (47.8%) | 6,294 (42.9%) |
| 19 to 25 Years | 1,055 (8.4%) | 9,121 (72.6%) |
| 25 to 34 Years | 961 (8.1%) | 8,366 (70.4%) |
| 35 to 44 Years | 1,116 (11.2%) | 5,720 (57.4%) |
| 45 to 54 Years | 793 (9.9%) | 5,336 (66.7%) |
| 55 to 64 Years | 1,582 (20.7%) | 5,491 (71.7%) |
| 65 to 74 Years | 5,116 (95.3%) | 3,494 (65.1%) |
| 75 Years and over | 3,649 (93.3%) | 3,007 (76.9%) |
| Total | 24,825 (30.7%) | 49,856 (61.6%) |
Disability Status by Sex by Age in Bryan
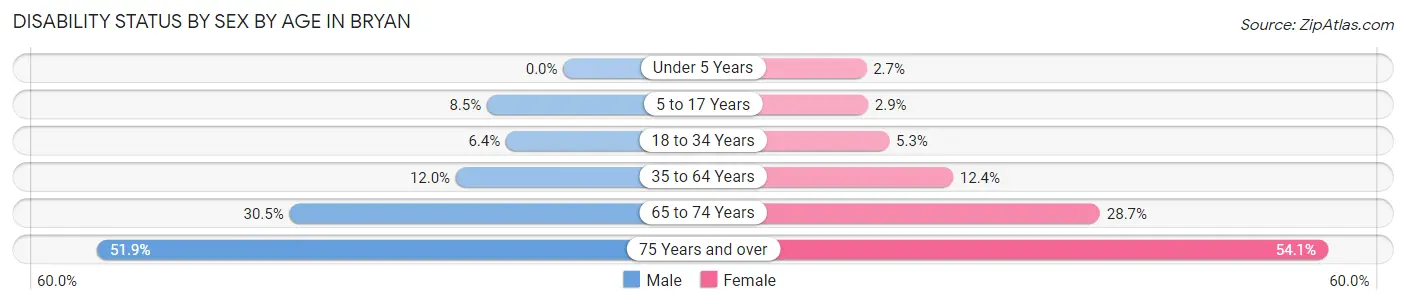
| Age Bracket | Male | Female |
| Under 5 Years | 0 (0.0%) | 74 (2.7%) |
| 5 to 17 Years | 616 (8.5%) | 207 (2.9%) |
| 18 to 34 Years | 833 (6.4%) | 672 (5.3%) |
| 35 to 64 Years | 1,490 (12.0%) | 1,629 (12.4%) |
| 65 to 74 Years | 775 (30.5%) | 812 (28.7%) |
| 75 Years and over | 785 (51.9%) | 1,298 (54.1%) |
Disability Class by Sex by Age in Bryan
Disability Class: Hearing Difficulty
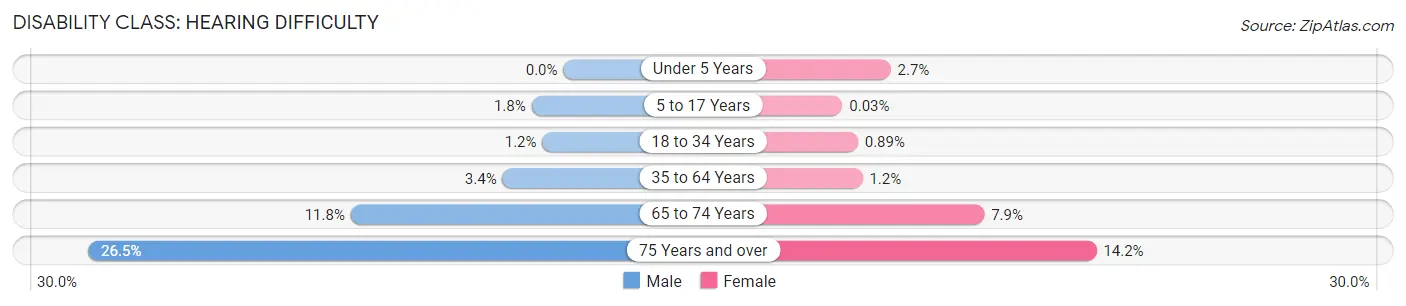
| Age Bracket | Male | Female |
| Under 5 Years | 0 (0.0%) | 74 (2.7%) |
| 5 to 17 Years | 128 (1.8%) | 2 (0.0%) |
| 18 to 34 Years | 153 (1.2%) | 113 (0.9%) |
| 35 to 64 Years | 422 (3.4%) | 151 (1.1%) |
| 65 to 74 Years | 301 (11.8%) | 224 (7.9%) |
| 75 Years and over | 400 (26.5%) | 340 (14.2%) |
Disability Class: Vision Difficulty
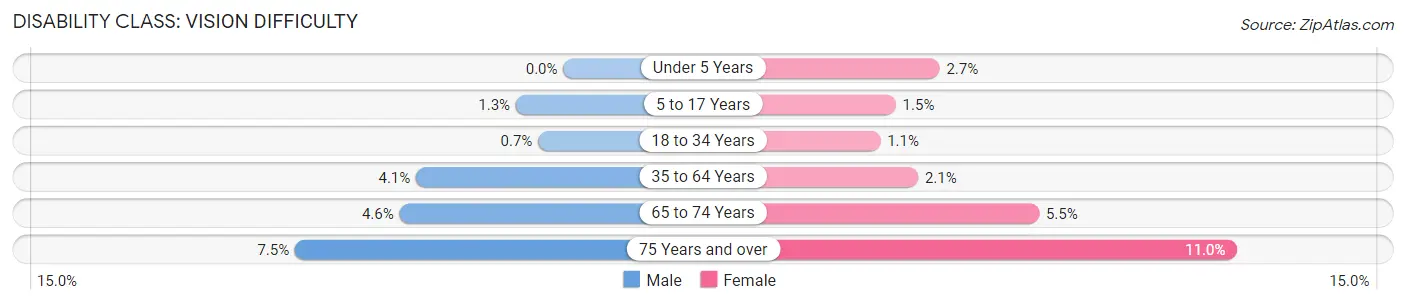
| Age Bracket | Male | Female |
| Under 5 Years | 0 (0.0%) | 74 (2.7%) |
| 5 to 17 Years | 96 (1.3%) | 107 (1.5%) |
| 18 to 34 Years | 91 (0.7%) | 137 (1.1%) |
| 35 to 64 Years | 510 (4.1%) | 279 (2.1%) |
| 65 to 74 Years | 116 (4.6%) | 155 (5.5%) |
| 75 Years and over | 113 (7.5%) | 264 (11.0%) |
Disability Class: Cognitive Difficulty
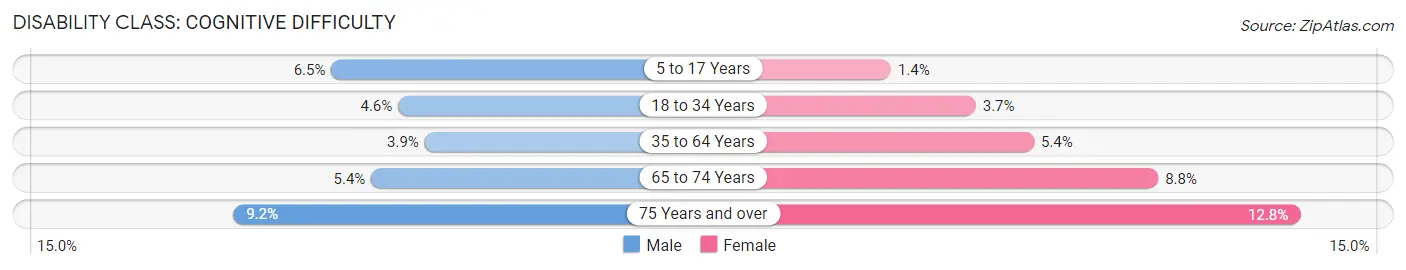
| Age Bracket | Male | Female |
| 5 to 17 Years | 468 (6.5%) | 98 (1.4%) |
| 18 to 34 Years | 601 (4.6%) | 476 (3.7%) |
| 35 to 64 Years | 481 (3.9%) | 705 (5.3%) |
| 65 to 74 Years | 136 (5.3%) | 249 (8.8%) |
| 75 Years and over | 139 (9.2%) | 306 (12.8%) |
Disability Class: Ambulatory Difficulty
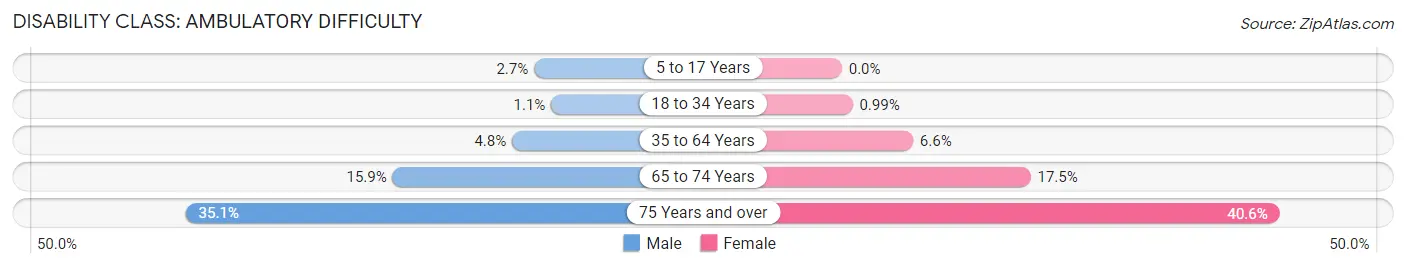
| Age Bracket | Male | Female |
| 5 to 17 Years | 197 (2.7%) | 0 (0.0%) |
| 18 to 34 Years | 147 (1.1%) | 126 (1.0%) |
| 35 to 64 Years | 593 (4.8%) | 869 (6.6%) |
| 65 to 74 Years | 403 (15.9%) | 495 (17.5%) |
| 75 Years and over | 530 (35.0%) | 974 (40.6%) |
Disability Class: Self-Care Difficulty
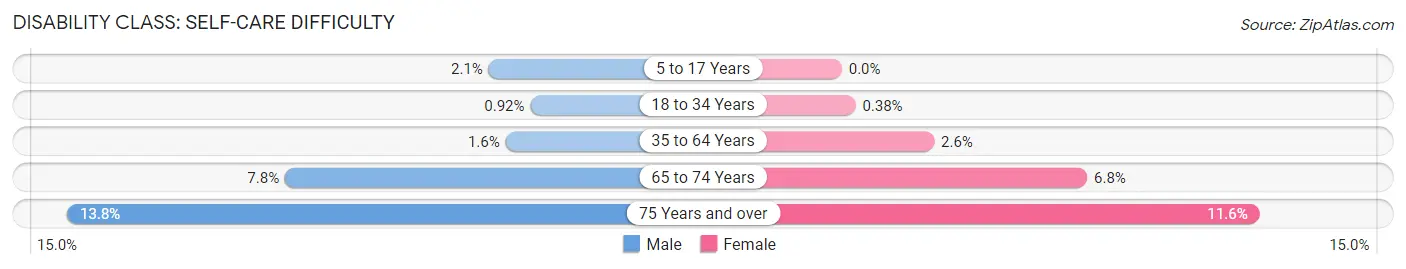
| Age Bracket | Male | Female |
| 5 to 17 Years | 151 (2.1%) | 0 (0.0%) |
| 18 to 34 Years | 120 (0.9%) | 48 (0.4%) |
| 35 to 64 Years | 200 (1.6%) | 339 (2.6%) |
| 65 to 74 Years | 197 (7.7%) | 193 (6.8%) |
| 75 Years and over | 209 (13.8%) | 279 (11.6%) |
Technology Access in Bryan
Computing Device Access in Bryan
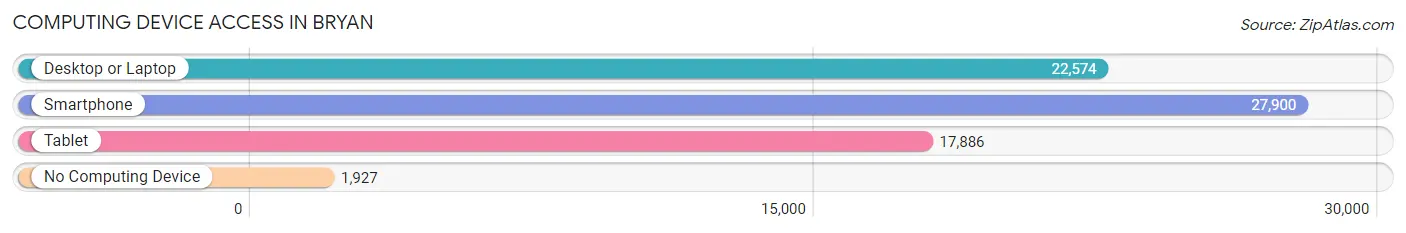
| Device Type | # Households | % Households |
| Desktop or Laptop | 22,574 | 72.3% |
| Smartphone | 27,900 | 89.3% |
| Tablet | 17,886 | 57.3% |
| No Computing Device | 1,927 | 6.2% |
| Total | 31,238 | 100.0% |
Internet Access in Bryan
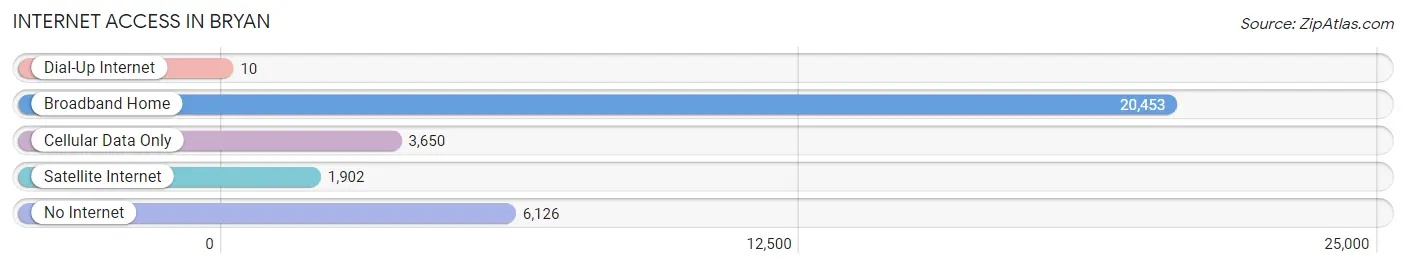
| Internet Type | # Households | % Households |
| Dial-Up Internet | 10 | 0.0% |
| Broadband Home | 20,453 | 65.5% |
| Cellular Data Only | 3,650 | 11.7% |
| Satellite Internet | 1,902 | 6.1% |
| No Internet | 6,126 | 19.6% |
| Total | 31,238 | 100.0% |
Bryan Summary
Bryan, Texas is a city located in Brazos County, Texas, United States. It is the county seat of Brazos County and is located in the heart of the Brazos Valley. The city is situated in the center of the county, approximately equidistant from Austin, Houston, and College Station. As of the 2010 census, the city had a population of 76,201.
History
The area around Bryan was first settled in 1821 by Moses Austin Bryan, a nephew of Stephen F. Austin. The city was named after him and was incorporated in 1871. The city was originally a farming community, but it began to grow rapidly in the late 19th century due to the arrival of the Houston and Texas Central Railway. The city was a major cotton producer and was home to several cotton gins.
In the early 20th century, the city began to diversify its economy and began to attract new industries. The city was home to the first cotton mill in Texas, which opened in 1906. The city also became a major center for the oil and gas industry, and the city's population grew rapidly.
Geography
Bryan is located in the Brazos Valley, which is located in the southeastern part of Texas. The city is situated in the center of Brazos County, approximately equidistant from Austin, Houston, and College Station. The city is located at the intersection of State Highway 6 and State Highway 21. The city is located at an elevation of approximately 300 feet above sea level.
The city has a total area of 33.3 square miles, of which 33.2 square miles is land and 0.1 square miles is water. The city is located in a humid subtropical climate zone, with hot summers and mild winters.
Economy
Bryan's economy is largely based on the oil and gas industry, as well as agriculture. The city is home to several oil and gas companies, including Chevron, ExxonMobil, and Shell. The city is also home to several agricultural companies, including Cargill, Tyson Foods, and Pilgrim's Pride.
The city is also home to several manufacturing companies, including Texas Instruments, 3M, and Dow Chemical. The city is also home to several educational institutions, including Texas A&M University, Blinn College, and the Bryan Independent School District.
Demographics
As of the 2010 census, the city had a population of 76,201. The racial makeup of the city was 68.2% White, 17.3% African American, 0.7% Native American, 2.3% Asian, 0.1% Pacific Islander, 8.2% from other races, and 3.4% from two or more races. Hispanic or Latino of any race were 20.7% of the population.
The median income for a household in the city was $41,945, and the median income for a family was $50,919. The per capita income for the city was $20,945. About 15.2% of families and 19.2% of the population were below the poverty line, including 25.3% of those under age 18 and 11.2% of those age 65 or over.
Common Questions
What is Per Capita Income in Bryan?
Per Capita income in Bryan is $28,756.
What is the Median Family Income in Bryan?
Median Family Income in Bryan is $70,012.
What is the Median Household income in Bryan?
Median Household Income in Bryan is $55,234.
What is Income or Wage Gap in Bryan?
Income or Wage Gap in Bryan is 24.8%.
Women in Bryan earn 75.2 cents for every dollar earned by a man.
What is Family Income Deficit in Bryan?
Family Income Deficit in Bryan is $11,557.
Families that are below poverty line in Bryan earn $11,557 less on average than the poverty threshold level.
What is Inequality or Gini Index in Bryan?
Inequality or Gini Index in Bryan is 0.47.
What is the Total Population of Bryan?
Total Population of Bryan is 84,820.
What is the Total Male Population of Bryan?
Total Male Population of Bryan is 42,572.
What is the Total Female Population of Bryan?
Total Female Population of Bryan is 42,248.
What is the Ratio of Males per 100 Females in Bryan?
There are 100.77 Males per 100 Females in Bryan.
What is the Ratio of Females per 100 Males in Bryan?
There are 99.24 Females per 100 Males in Bryan.
What is the Median Population Age in Bryan?
Median Population Age in Bryan is 30.8 Years.
What is the Average Family Size in Bryan
Average Family Size in Bryan is 3.4 People.
What is the Average Household Size in Bryan
Average Household Size in Bryan is 2.6 People.
How Large is the Labor Force in Bryan?
There are 41,816 People in the Labor Forcein in Bryan.
What is the Percentage of People in the Labor Force in Bryan?
62.9% of People are in the Labor Force in Bryan.
What is the Unemployment Rate in Bryan?
Unemployment Rate in Bryan is 4.9%.