Raytown, MO Map & Demographics
Raytown Map
Raytown Overview
$33,081
PER CAPITA INCOME
$79,514
AVG FAMILY INCOME
$64,542
AVG HOUSEHOLD INCOME
16.3%
WAGE / INCOME GAP [ % ]
83.7¢/ $1
WAGE / INCOME GAP [ $ ]
$11,375
FAMILY INCOME DEFICIT
0.37
INEQUALITY / GINI INDEX
29,772
TOTAL POPULATION
14,729
MALE POPULATION
15,043
FEMALE POPULATION
97.91
MALES / 100 FEMALES
102.13
FEMALES / 100 MALES
41.4
MEDIAN AGE
3.0
AVG FAMILY SIZE
2.3
AVG HOUSEHOLD SIZE
16,627
LABOR FORCE [ PEOPLE ]
69.3%
PERCENT IN LABOR FORCE
5.2%
UNEMPLOYMENT RATE
Raytown Area Codes
Income in Raytown
Income Overview in Raytown
Per Capita Income in Raytown is $33,081, while median incomes of families and households are $79,514 and $64,542 respectively.
| Characteristic | Number | Measure |
| Per Capita Income | 29,772 | $33,081 |
| Median Family Income | 7,225 | $79,514 |
| Mean Family Income | 7,225 | $88,244 |
| Median Household Income | 12,561 | $64,542 |
| Mean Household Income | 12,561 | $75,451 |
| Income Deficit | 7,225 | $11,375 |
| Wage / Income Gap (%) | 29,772 | 16.26% |
| Wage / Income Gap ($) | 29,772 | 83.74¢ per $1 |
| Gini / Inequality Index | 29,772 | 0.37 |
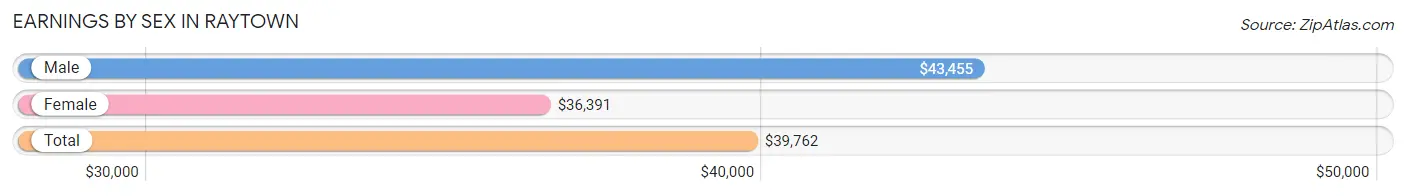
Earnings by Sex in Raytown
Average Earnings in Raytown are $39,762, $43,455 for men and $36,391 for women, a difference of 16.3%.
| Sex | Number | Average Earnings |
| Male | 9,063 (53.6%) | $43,455 |
| Female | 7,859 (46.4%) | $36,391 |
| Total | 16,922 (100.0%) | $39,762 |
Earnings by Sex by Income Bracket in Raytown
The most common earnings brackets in Raytown are $65,000 to $74,999 for men (951 | 10.5%) and $30,000 to $34,999 for women (1,033 | 13.1%).
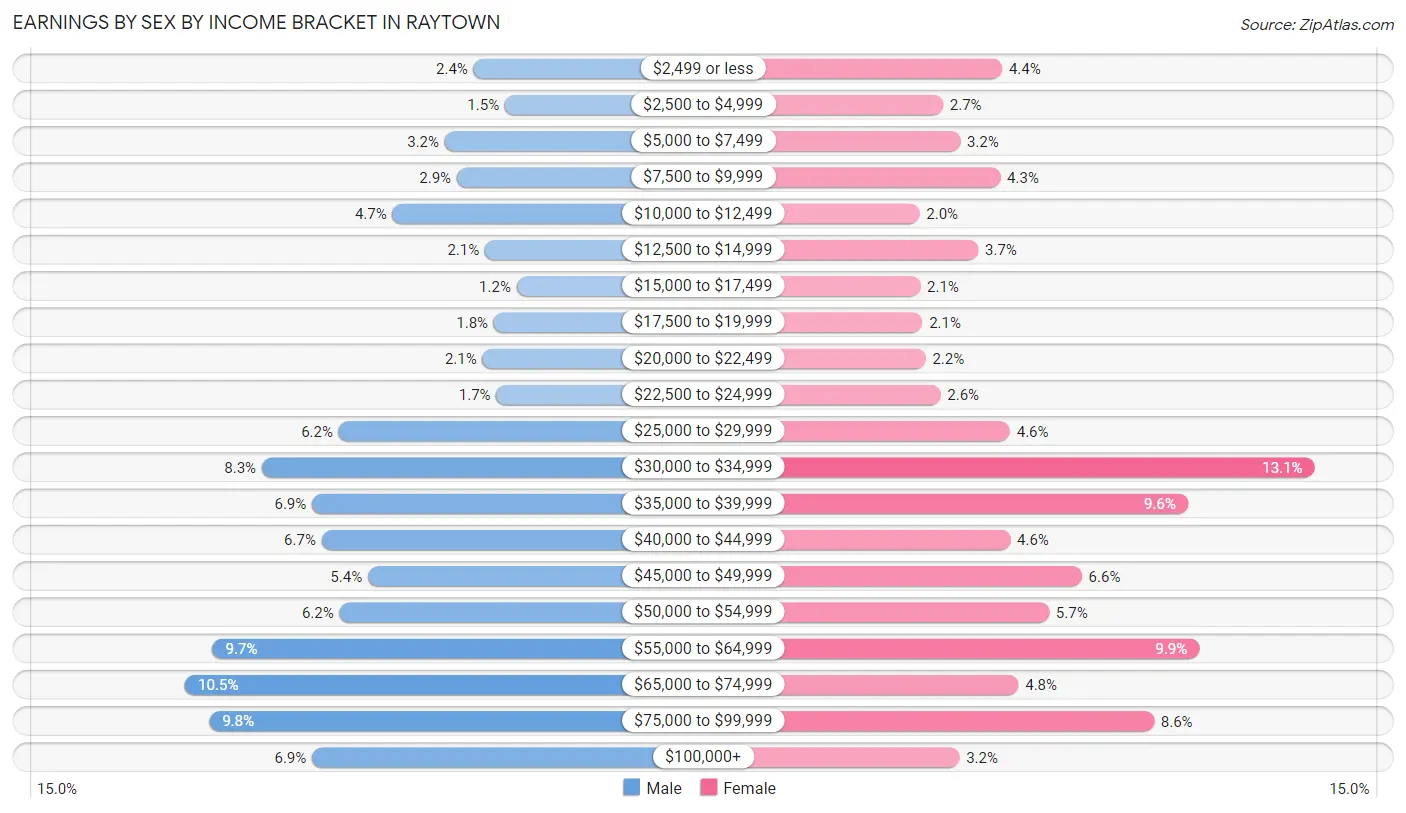
| Income | Male | Female |
| $2,499 or less | 216 (2.4%) | 343 (4.4%) |
| $2,500 to $4,999 | 136 (1.5%) | 212 (2.7%) |
| $5,000 to $7,499 | 289 (3.2%) | 250 (3.2%) |
| $7,500 to $9,999 | 258 (2.9%) | 339 (4.3%) |
| $10,000 to $12,499 | 422 (4.7%) | 160 (2.0%) |
| $12,500 to $14,999 | 187 (2.1%) | 290 (3.7%) |
| $15,000 to $17,499 | 106 (1.2%) | 162 (2.1%) |
| $17,500 to $19,999 | 164 (1.8%) | 167 (2.1%) |
| $20,000 to $22,499 | 193 (2.1%) | 174 (2.2%) |
| $22,500 to $24,999 | 158 (1.7%) | 207 (2.6%) |
| $25,000 to $29,999 | 559 (6.2%) | 360 (4.6%) |
| $30,000 to $34,999 | 755 (8.3%) | 1,033 (13.1%) |
| $35,000 to $39,999 | 627 (6.9%) | 753 (9.6%) |
| $40,000 to $44,999 | 603 (6.7%) | 361 (4.6%) |
| $45,000 to $49,999 | 485 (5.3%) | 519 (6.6%) |
| $50,000 to $54,999 | 557 (6.1%) | 446 (5.7%) |
| $55,000 to $64,999 | 881 (9.7%) | 778 (9.9%) |
| $65,000 to $74,999 | 951 (10.5%) | 379 (4.8%) |
| $75,000 to $99,999 | 889 (9.8%) | 678 (8.6%) |
| $100,000+ | 627 (6.9%) | 248 (3.2%) |
| Total | 9,063 (100.0%) | 7,859 (100.0%) |
Earnings by Sex by Educational Attainment in Raytown
Average earnings in Raytown are $48,130 for men and $38,843 for women, a difference of 19.3%. Men with an educational attainment of graduate degree enjoy the highest average annual earnings of $57,182, while those with high school diploma education earn the least with $38,503. Women with an educational attainment of bachelor's degree earn the most with the average annual earnings of $59,643, while those with less than high school education have the smallest earnings of $32,935.
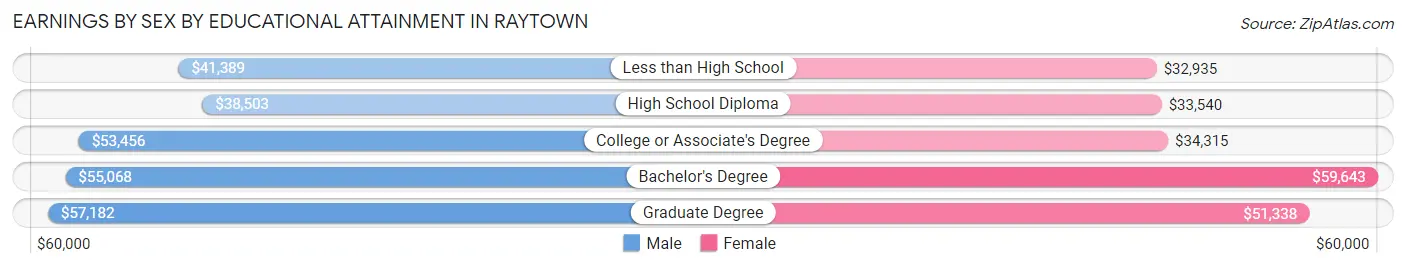
| Educational Attainment | Male Income | Female Income |
| Less than High School | $41,389 | $32,935 |
| High School Diploma | $38,503 | $33,540 |
| College or Associate's Degree | $53,456 | $34,315 |
| Bachelor's Degree | $55,068 | $59,643 |
| Graduate Degree | $57,182 | $51,338 |
| Total | $48,130 | $38,843 |
Family Income in Raytown
Family Income Brackets in Raytown
According to the Raytown family income data, there are 1,662 families falling into the $50,000 to $74,999 income range, which is the most common income bracket and makes up 23.0% of all families. Conversely, the $10,000 to $14,999 income bracket is the least frequent group with only 43 families (0.6%) belonging to this category.
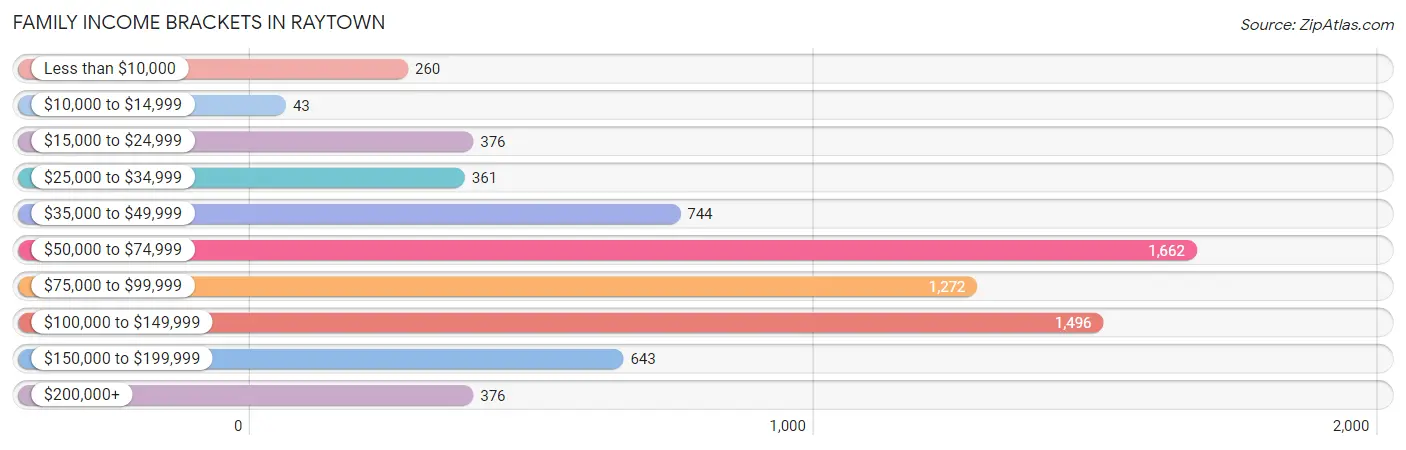
| Income Bracket | # Families | % Families |
| Less than $10,000 | 260 | 3.6% |
| $10,000 to $14,999 | 43 | 0.6% |
| $15,000 to $24,999 | 376 | 5.2% |
| $25,000 to $34,999 | 361 | 5.0% |
| $35,000 to $49,999 | 744 | 10.3% |
| $50,000 to $74,999 | 1,662 | 23.0% |
| $75,000 to $99,999 | 1,272 | 17.6% |
| $100,000 to $149,999 | 1,496 | 20.7% |
| $150,000 to $199,999 | 643 | 8.9% |
| $200,000+ | 376 | 5.2% |
Family Income by Famaliy Size in Raytown
7+ person families (62 | 0.9%) account for the highest median family income in Raytown with $154,667 per family, while 2-person families (3,477 | 48.1%) have the highest median income of $36,486 per family member.
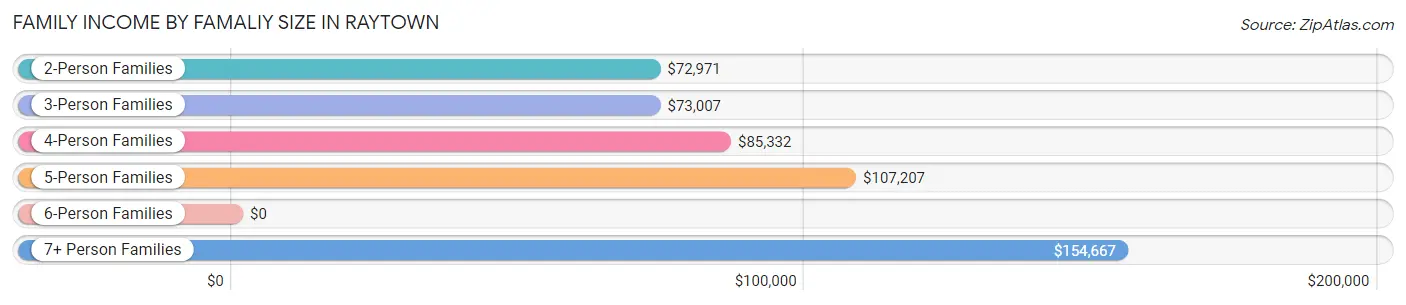
| Income Bracket | # Families | Median Income |
| 2-Person Families | 3,477 (48.1%) | $72,971 |
| 3-Person Families | 1,711 (23.7%) | $73,007 |
| 4-Person Families | 1,427 (19.8%) | $85,332 |
| 5-Person Families | 483 (6.7%) | $107,207 |
| 6-Person Families | 65 (0.9%) | $0 |
| 7+ Person Families | 62 (0.9%) | $154,667 |
| Total | 7,225 (100.0%) | $79,514 |
Family Income by Number of Earners in Raytown
The median family income in Raytown is $79,514, with families comprising 3+ earners (790) having the highest median family income of $141,679, while families with no earners (1,151) have the lowest median family income of $47,067, accounting for 10.9% and 15.9% of families, respectively.
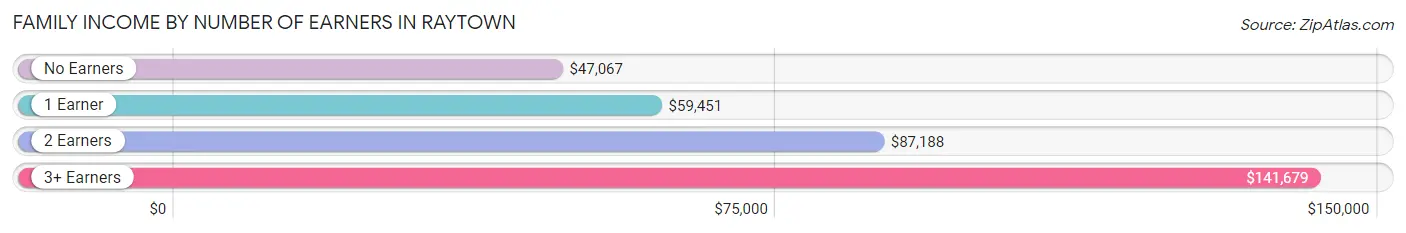
| Number of Earners | # Families | Median Income |
| No Earners | 1,151 (15.9%) | $47,067 |
| 1 Earner | 2,279 (31.5%) | $59,451 |
| 2 Earners | 3,005 (41.6%) | $87,188 |
| 3+ Earners | 790 (10.9%) | $141,679 |
| Total | 7,225 (100.0%) | $79,514 |
Household Income in Raytown
Household Income Brackets in Raytown
With 3,090 households falling in the category, the $50,000 to $74,999 income range is the most frequent in Raytown, accounting for 24.6% of all households. In contrast, only 239 households (1.9%) fall into the $10,000 to $14,999 income bracket, making it the least populous group.
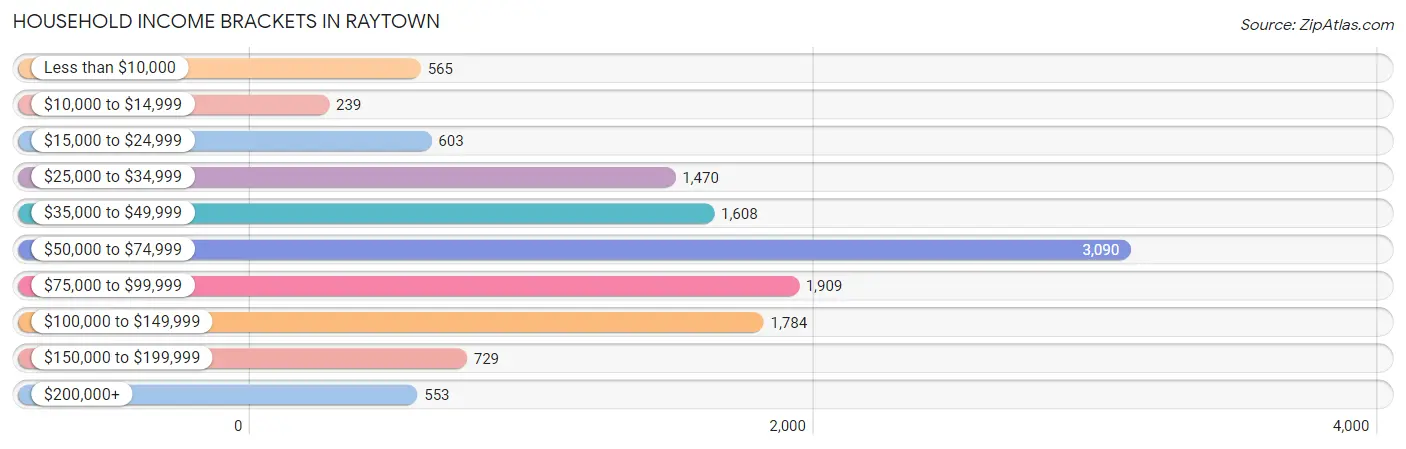
| Income Bracket | # Households | % Households |
| Less than $10,000 | 565 | 4.5% |
| $10,000 to $14,999 | 239 | 1.9% |
| $15,000 to $24,999 | 603 | 4.8% |
| $25,000 to $34,999 | 1,470 | 11.7% |
| $35,000 to $49,999 | 1,608 | 12.8% |
| $50,000 to $74,999 | 3,090 | 24.6% |
| $75,000 to $99,999 | 1,909 | 15.2% |
| $100,000 to $149,999 | 1,784 | 14.2% |
| $150,000 to $199,999 | 729 | 5.8% |
| $200,000+ | 553 | 4.4% |
Household Income by Householder Age in Raytown
The median household income in Raytown is $64,542, with the highest median household income of $71,393 found in the 45 to 64 years age bracket for the primary householder. A total of 4,912 households (39.1%) fall into this category. Meanwhile, the 65+ years age bracket for the primary householder has the lowest median household income of $57,191, with 3,031 households (24.1%) in this group.
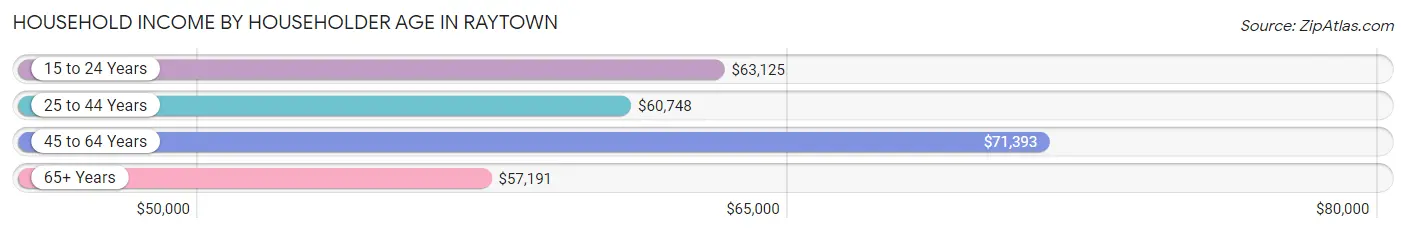
| Income Bracket | # Households | Median Income |
| 15 to 24 Years | 306 (2.4%) | $63,125 |
| 25 to 44 Years | 4,312 (34.3%) | $60,748 |
| 45 to 64 Years | 4,912 (39.1%) | $71,393 |
| 65+ Years | 3,031 (24.1%) | $57,191 |
| Total | 12,561 (100.0%) | $64,542 |
Poverty in Raytown
Income Below Poverty by Sex and Age in Raytown
With 7.9% poverty level for males and 13.8% for females among the residents of Raytown, 12 to 14 year old males and 15 year old females are the most vulnerable to poverty, with 149 males (22.1%) and 193 females (66.3%) in their respective age groups living below the poverty level.
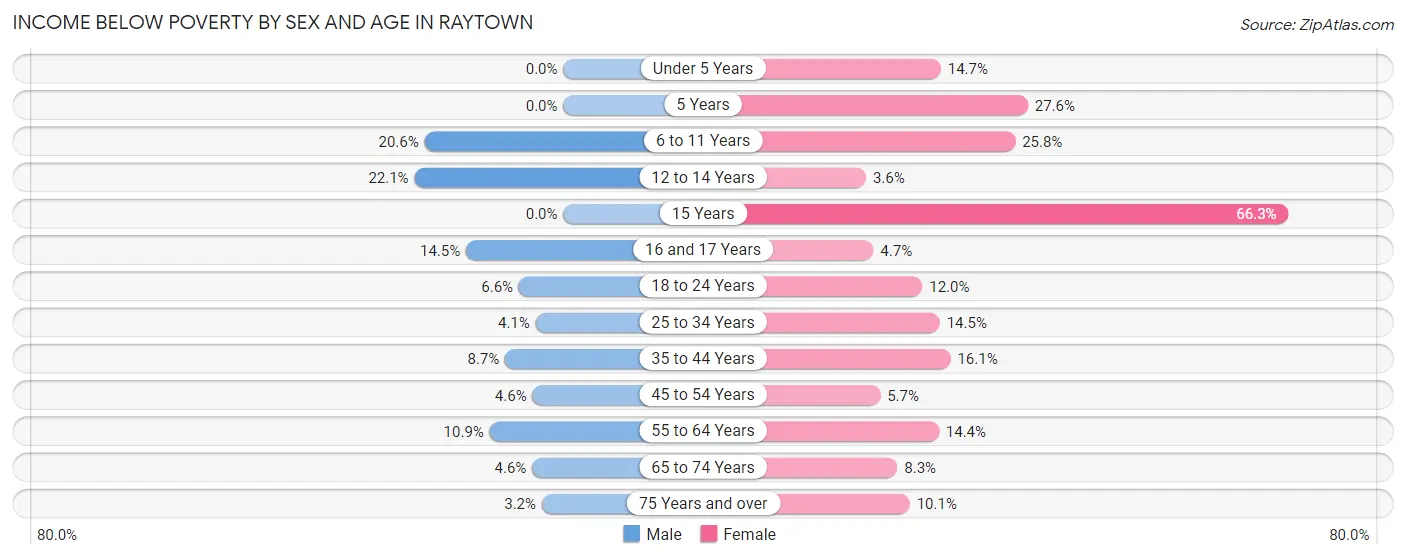
| Age Bracket | Male | Female |
| Under 5 Years | 0 (0.0%) | 152 (14.7%) |
| 5 Years | 0 (0.0%) | 87 (27.6%) |
| 6 to 11 Years | 195 (20.6%) | 275 (25.8%) |
| 12 to 14 Years | 149 (22.1%) | 18 (3.6%) |
| 15 Years | 0 (0.0%) | 193 (66.3%) |
| 16 and 17 Years | 37 (14.4%) | 10 (4.7%) |
| 18 to 24 Years | 93 (6.6%) | 110 (12.0%) |
| 25 to 34 Years | 85 (4.1%) | 279 (14.5%) |
| 35 to 44 Years | 163 (8.6%) | 279 (16.1%) |
| 45 to 54 Years | 81 (4.6%) | 125 (5.7%) |
| 55 to 64 Years | 240 (10.9%) | 273 (14.4%) |
| 65 to 74 Years | 65 (4.6%) | 120 (8.3%) |
| 75 Years and over | 32 (3.2%) | 127 (10.1%) |
| Total | 1,140 (7.9%) | 2,048 (13.8%) |
Income Above Poverty by Sex and Age in Raytown
According to the poverty statistics in Raytown, males aged under 5 years and females aged 12 to 14 years are the age groups that are most secure financially, with 100.0% of males and 96.4% of females in these age groups living above the poverty line.
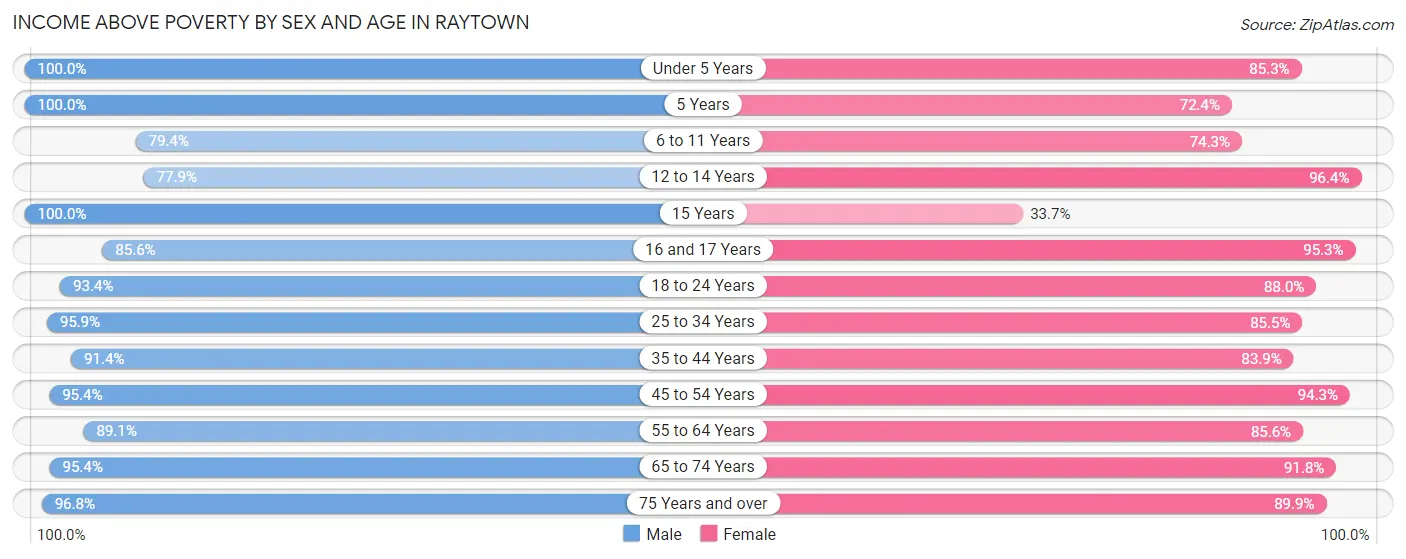
| Age Bracket | Male | Female |
| Under 5 Years | 598 (100.0%) | 882 (85.3%) |
| 5 Years | 153 (100.0%) | 228 (72.4%) |
| 6 to 11 Years | 751 (79.4%) | 793 (74.3%) |
| 12 to 14 Years | 525 (77.9%) | 484 (96.4%) |
| 15 Years | 108 (100.0%) | 98 (33.7%) |
| 16 and 17 Years | 219 (85.6%) | 203 (95.3%) |
| 18 to 24 Years | 1,316 (93.4%) | 810 (88.0%) |
| 25 to 34 Years | 1,976 (95.9%) | 1,640 (85.5%) |
| 35 to 44 Years | 1,722 (91.3%) | 1,450 (83.9%) |
| 45 to 54 Years | 1,686 (95.4%) | 2,069 (94.3%) |
| 55 to 64 Years | 1,954 (89.1%) | 1,622 (85.6%) |
| 65 to 74 Years | 1,340 (95.4%) | 1,335 (91.7%) |
| 75 Years and over | 971 (96.8%) | 1,132 (89.9%) |
| Total | 13,319 (92.1%) | 12,746 (86.2%) |
Income Below Poverty Among Married-Couple Families in Raytown
The poverty statistics for married-couple families in Raytown show that 3.5% or 157 of the total 4,417 families live below the poverty line. Families with 3 or 4 children have the highest poverty rate of 7.7%, comprising of 19 families. On the other hand, families with 5 or more children have the lowest poverty rate of 0.0%, which includes 0 families.
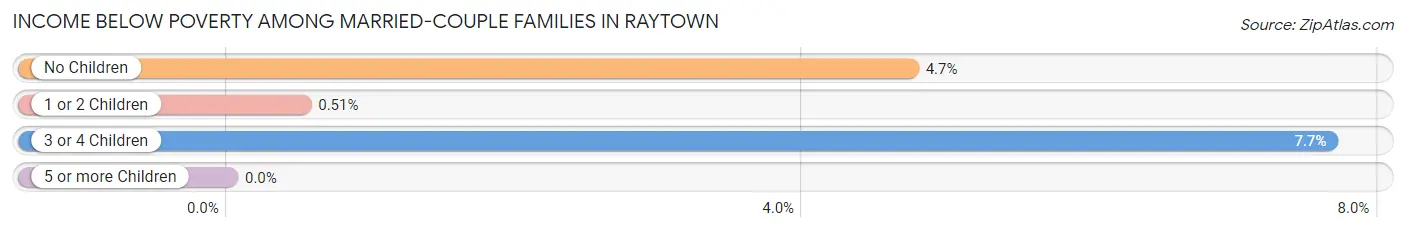
| Children | Above Poverty | Below Poverty |
| No Children | 2,631 (95.3%) | 131 (4.7%) |
| 1 or 2 Children | 1,365 (99.5%) | 7 (0.5%) |
| 3 or 4 Children | 229 (92.3%) | 19 (7.7%) |
| 5 or more Children | 35 (100.0%) | 0 (0.0%) |
| Total | 4,260 (96.5%) | 157 (3.5%) |
Income Below Poverty Among Single-Parent Households in Raytown
According to the poverty data in Raytown, 10.2% or 59 single-father households and 19.7% or 438 single-mother households are living below the poverty line. Among single-father households, those with 3 or 4 children have the highest poverty rate, with 16 households (42.1%) experiencing poverty. Likewise, among single-mother households, those with 3 or 4 children have the highest poverty rate, with 229 households (60.0%) falling below the poverty line.
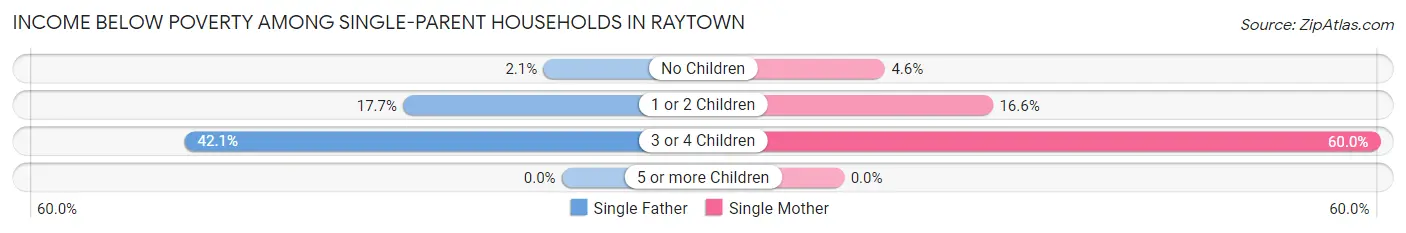
| Children | Single Father | Single Mother |
| No Children | 7 (2.1%) | 37 (4.6%) |
| 1 or 2 Children | 36 (17.7%) | 172 (16.6%) |
| 3 or 4 Children | 16 (42.1%) | 229 (60.0%) |
| 5 or more Children | 0 (0.0%) | 0 (0.0%) |
| Total | 59 (10.2%) | 438 (19.7%) |
Income Below Poverty Among Married-Couple vs Single-Parent Households in Raytown
The poverty data for Raytown shows that 157 of the married-couple family households (3.5%) and 497 of the single-parent households (17.7%) are living below the poverty level. Within the married-couple family households, those with 3 or 4 children have the highest poverty rate, with 19 households (7.7%) falling below the poverty line. Among the single-parent households, those with 3 or 4 children have the highest poverty rate, with 245 household (58.3%) living below poverty.
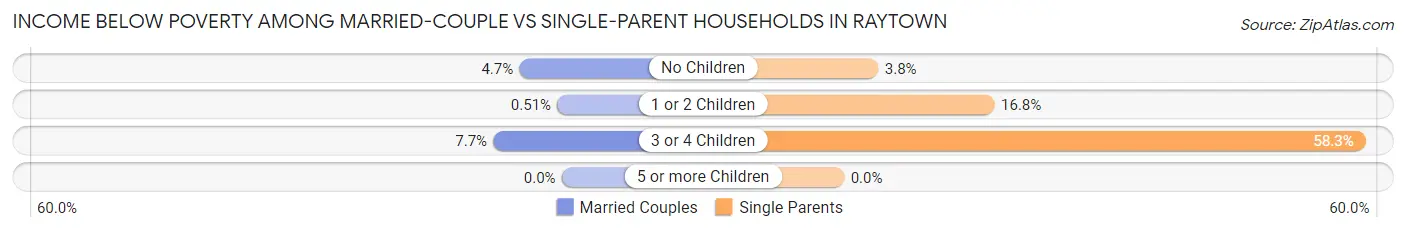
| Children | Married-Couple Families | Single-Parent Households |
| No Children | 131 (4.7%) | 44 (3.8%) |
| 1 or 2 Children | 7 (0.5%) | 208 (16.8%) |
| 3 or 4 Children | 19 (7.7%) | 245 (58.3%) |
| 5 or more Children | 0 (0.0%) | 0 (0.0%) |
| Total | 157 (3.5%) | 497 (17.7%) |
Race in Raytown
The most populous races in Raytown are White / Caucasian (14,750 | 49.5%), Black / African American (11,726 | 39.4%), and Hispanic or Latino (2,265 | 7.6%).
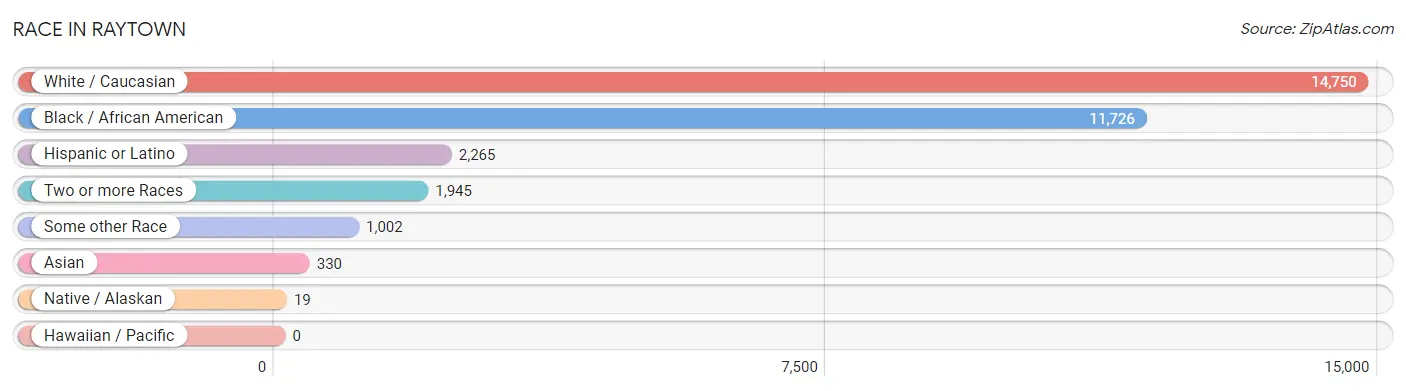
| Race | # Population | % Population |
| Asian | 330 | 1.1% |
| Black / African American | 11,726 | 39.4% |
| Hawaiian / Pacific | 0 | 0.0% |
| Hispanic or Latino | 2,265 | 7.6% |
| Native / Alaskan | 19 | 0.1% |
| White / Caucasian | 14,750 | 49.5% |
| Two or more Races | 1,945 | 6.5% |
| Some other Race | 1,002 | 3.4% |
| Total | 29,772 | 100.0% |
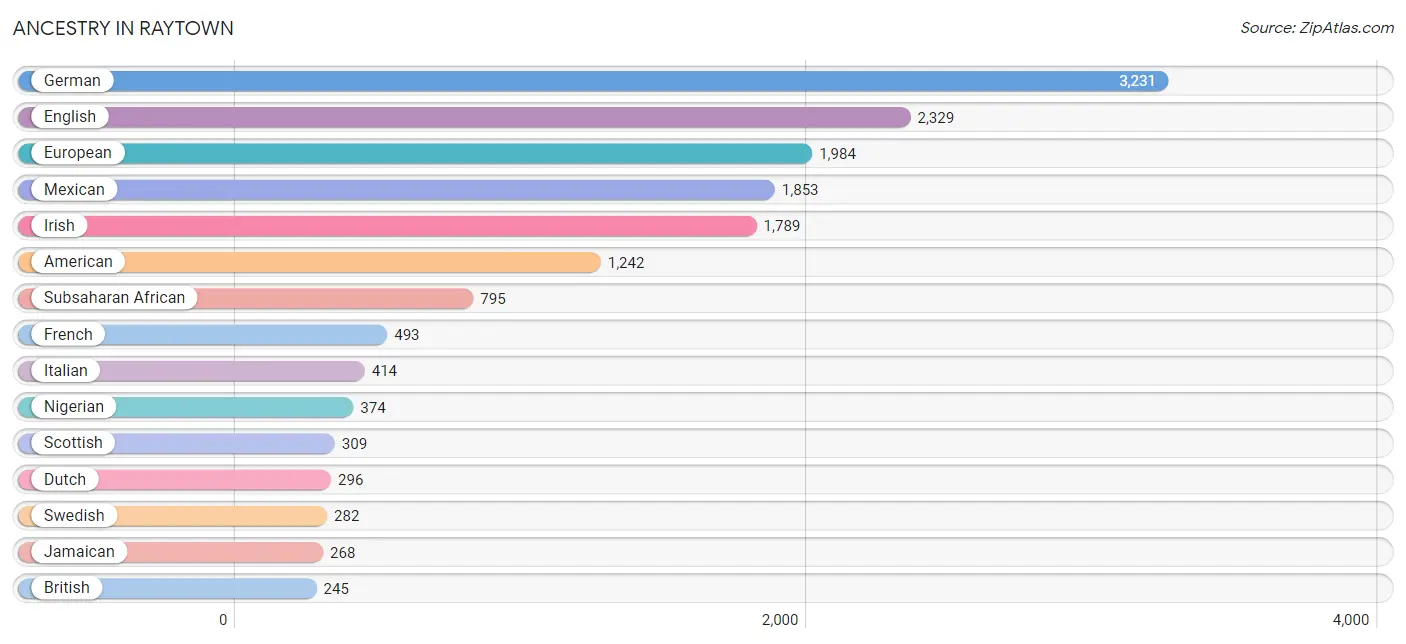
Ancestry in Raytown
The most populous ancestries reported in Raytown are German (3,231 | 10.8%), English (2,329 | 7.8%), European (1,984 | 6.7%), Mexican (1,853 | 6.2%), and Irish (1,789 | 6.0%), together accounting for 37.6% of all Raytown residents.
| Ancestry | # Population | % Population |
| African | 211 | 0.7% |
| American | 1,242 | 4.2% |
| Australian | 7 | 0.0% |
| Austrian | 11 | 0.0% |
| Bahamian | 8 | 0.0% |
| Belgian | 50 | 0.2% |
| Bhutanese | 21 | 0.1% |
| Blackfeet | 63 | 0.2% |
| Brazilian | 11 | 0.0% |
| British | 245 | 0.8% |
| Burmese | 44 | 0.2% |
| Canadian | 29 | 0.1% |
| Central American | 222 | 0.7% |
| Cherokee | 85 | 0.3% |
| Chippewa | 4 | 0.0% |
| Comanche | 6 | 0.0% |
| Creek | 13 | 0.0% |
| Croatian | 31 | 0.1% |
| Czech | 9 | 0.0% |
| Danish | 17 | 0.1% |
| Dominican | 38 | 0.1% |
| Dutch | 296 | 1.0% |
| Eastern European | 16 | 0.1% |
| Ecuadorian | 29 | 0.1% |
| English | 2,329 | 7.8% |
| European | 1,984 | 6.7% |
| French | 493 | 1.7% |
| French Canadian | 17 | 0.1% |
| German | 3,231 | 10.8% |
| Greek | 69 | 0.2% |
| Honduran | 212 | 0.7% |
| Hungarian | 9 | 0.0% |
| Indian (Asian) | 64 | 0.2% |
| Irish | 1,789 | 6.0% |
| Israeli | 4 | 0.0% |
| Italian | 414 | 1.4% |
| Jamaican | 268 | 0.9% |
| Kenyan | 42 | 0.1% |
| Korean | 196 | 0.7% |
| Lithuanian | 21 | 0.1% |
| Mexican | 1,853 | 6.2% |
| Mongolian | 16 | 0.1% |
| Nigerian | 374 | 1.3% |
| Northern European | 2 | 0.0% |
| Norwegian | 122 | 0.4% |
| Pakistani | 23 | 0.1% |
| Polish | 176 | 0.6% |
| Portuguese | 3 | 0.0% |
| Pueblo | 6 | 0.0% |
| Puerto Rican | 54 | 0.2% |
| Romanian | 17 | 0.1% |
| Russian | 55 | 0.2% |
| Salvadoran | 10 | 0.0% |
| Scandinavian | 218 | 0.7% |
| Scotch-Irish | 213 | 0.7% |
| Scottish | 309 | 1.0% |
| Sioux | 20 | 0.1% |
| Slovak | 26 | 0.1% |
| South American | 29 | 0.1% |
| Spaniard | 26 | 0.1% |
| Spanish | 42 | 0.1% |
| Sri Lankan | 8 | 0.0% |
| Subsaharan African | 795 | 2.7% |
| Sudanese | 35 | 0.1% |
| Swedish | 282 | 0.9% |
| Swiss | 19 | 0.1% |
| Thai | 73 | 0.3% |
| Ukrainian | 10 | 0.0% |
| Welsh | 143 | 0.5% |
| West Indian | 6 | 0.0% | View All 70 Rows |
Immigrants in Raytown
The most numerous immigrant groups reported in Raytown came from Latin America (781 | 2.6%), Central America (519 | 1.7%), Africa (396 | 1.3%), Mexico (309 | 1.0%), and Caribbean (252 | 0.9%), together accounting for 7.6% of all Raytown residents.
| Immigration Origin | # Population | % Population |
| Africa | 396 | 1.3% |
| Asia | 140 | 0.5% |
| Canada | 6 | 0.0% |
| Caribbean | 252 | 0.9% |
| Central America | 519 | 1.7% |
| China | 44 | 0.2% |
| Czechoslovakia | 13 | 0.0% |
| Dominican Republic | 38 | 0.1% |
| Eastern Africa | 35 | 0.1% |
| Eastern Asia | 44 | 0.2% |
| Eastern Europe | 13 | 0.0% |
| Ecuador | 10 | 0.0% |
| El Salvador | 10 | 0.0% |
| Europe | 139 | 0.5% |
| Germany | 38 | 0.1% |
| Honduras | 200 | 0.7% |
| Hong Kong | 30 | 0.1% |
| India | 33 | 0.1% |
| Italy | 64 | 0.2% |
| Jamaica | 208 | 0.7% |
| Latin America | 781 | 2.6% |
| Malaysia | 7 | 0.0% |
| Mexico | 309 | 1.0% |
| Micronesia | 95 | 0.3% |
| Middle Africa | 149 | 0.5% |
| Nigeria | 207 | 0.7% |
| Northern Europe | 24 | 0.1% |
| Oceania | 95 | 0.3% |
| Pakistan | 18 | 0.1% |
| Philippines | 29 | 0.1% |
| South America | 10 | 0.0% |
| South Central Asia | 51 | 0.2% |
| South Eastern Asia | 42 | 0.1% |
| Southern Europe | 64 | 0.2% |
| Taiwan | 14 | 0.1% |
| Thailand | 6 | 0.0% |
| West Indies | 6 | 0.0% |
| Western Africa | 207 | 0.7% |
| Western Asia | 3 | 0.0% |
| Western Europe | 38 | 0.1% |
| Zaire | 149 | 0.5% | View All 41 Rows |
Sex and Age in Raytown
Sex and Age in Raytown
The most populous age groups in Raytown are 25 to 29 Years (1,330 | 9.0%) for men and 45 to 49 Years (1,288 | 8.6%) for women.
| Age Bracket | Male | Female |
| Under 5 Years | 630 (4.3%) | 1,091 (7.2%) |
| 5 to 9 Years | 732 (5.0%) | 1,009 (6.7%) |
| 10 to 14 Years | 1,041 (7.1%) | 877 (5.8%) |
| 15 to 19 Years | 804 (5.5%) | 846 (5.6%) |
| 20 to 24 Years | 971 (6.6%) | 580 (3.9%) |
| 25 to 29 Years | 1,330 (9.0%) | 823 (5.5%) |
| 30 to 34 Years | 762 (5.2%) | 1,096 (7.3%) |
| 35 to 39 Years | 1,030 (7.0%) | 666 (4.4%) |
| 40 to 44 Years | 855 (5.8%) | 1,063 (7.1%) |
| 45 to 49 Years | 789 (5.4%) | 1,288 (8.6%) |
| 50 to 54 Years | 985 (6.7%) | 915 (6.1%) |
| 55 to 59 Years | 1,198 (8.1%) | 921 (6.1%) |
| 60 to 64 Years | 1,039 (7.0%) | 1,000 (6.7%) |
| 65 to 69 Years | 851 (5.8%) | 856 (5.7%) |
| 70 to 74 Years | 623 (4.2%) | 644 (4.3%) |
| 75 to 79 Years | 476 (3.2%) | 668 (4.4%) |
| 80 to 84 Years | 496 (3.4%) | 278 (1.8%) |
| 85 Years and over | 117 (0.8%) | 422 (2.8%) |
| Total | 14,729 (100.0%) | 15,043 (100.0%) |
Families and Households in Raytown
Median Family Size in Raytown
The median family size in Raytown is 3.05 persons per family, with single female/mother families (2,228 | 30.8%) accounting for the largest median family size of 3.18 persons per family. On the other hand, single male/father families (580 | 8.0%) represent the smallest median family size with 2.49 persons per family.
| Family Type | # Families | Family Size |
| Married-Couple | 4,417 (61.1%) | 3.07 |
| Single Male/Father | 580 (8.0%) | 2.49 |
| Single Female/Mother | 2,228 (30.8%) | 3.18 |
| Total Families | 7,225 (100.0%) | 3.05 |
Median Household Size in Raytown
The median household size in Raytown is 2.33 persons per household, with single female/mother households (2,228 | 17.7%) accounting for the largest median household size of 3.36 persons per household. non-family households (5,336 | 42.5%) represent the smallest median household size with 1.23 persons per household.
| Household Type | # Households | Household Size |
| Married-Couple | 4,417 (35.2%) | 3.08 |
| Single Male/Father | 580 (4.6%) | 2.91 |
| Single Female/Mother | 2,228 (17.7%) | 3.36 |
| Non-family | 5,336 (42.5%) | 1.23 |
| Total Households | 12,561 (100.0%) | 2.33 |
Household Size by Marriage Status in Raytown
Out of a total of 12,561 households in Raytown, 7,225 (57.5%) are family households, while 5,336 (42.5%) are nonfamily households. The most numerous type of family households are 2-person households, comprising 3,213, and the most common type of nonfamily households are 1-person households, comprising 4,320.
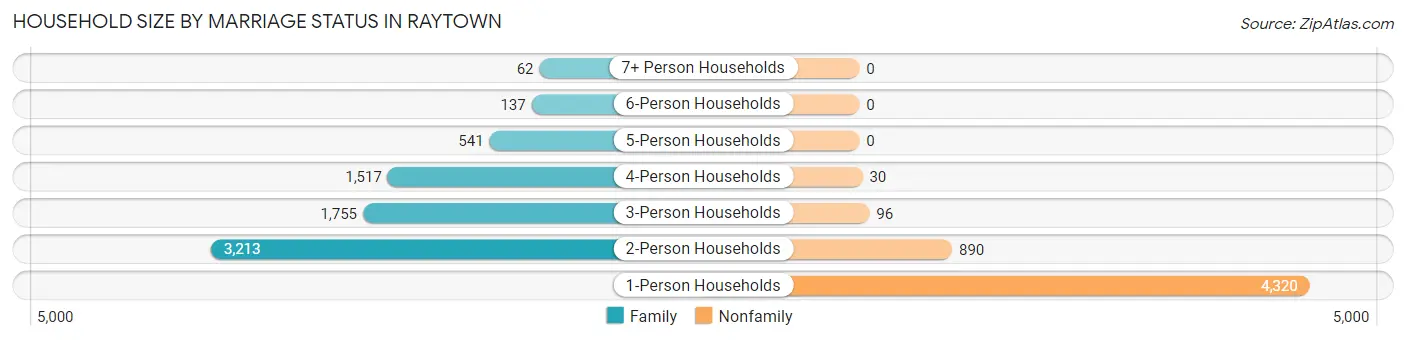
| Household Size | Family Households | Nonfamily Households |
| 1-Person Households | - | 4,320 (34.4%) |
| 2-Person Households | 3,213 (25.6%) | 890 (7.1%) |
| 3-Person Households | 1,755 (14.0%) | 96 (0.8%) |
| 4-Person Households | 1,517 (12.1%) | 30 (0.2%) |
| 5-Person Households | 541 (4.3%) | 0 (0.0%) |
| 6-Person Households | 137 (1.1%) | 0 (0.0%) |
| 7+ Person Households | 62 (0.5%) | 0 (0.0%) |
| Total | 7,225 (57.5%) | 5,336 (42.5%) |
Female Fertility in Raytown
Fertility by Age in Raytown
Average fertility rate in Raytown is 59.0 births per 1,000 women. Women in the age bracket of 20 to 34 years have the highest fertility rate with 125.0 births per 1,000 women. Women in the age bracket of 20 to 34 years acount for 80.0% of all women with births.
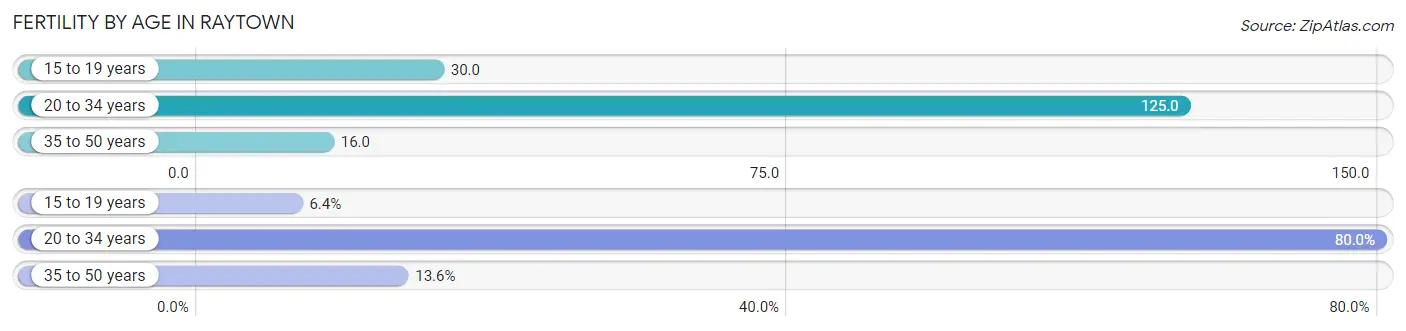
| Age Bracket | Women with Births | Births / 1,000 Women |
| 15 to 19 years | 25 (6.4%) | 30.0 |
| 20 to 34 years | 312 (80.0%) | 125.0 |
| 35 to 50 years | 53 (13.6%) | 16.0 |
| Total | 390 (100.0%) | 59.0 |
Fertility by Age by Marriage Status in Raytown
78.2% of women with births (390) in Raytown are married. The highest percentage of unmarried women with births falls into 35 to 50 years age bracket with 30.2% of them unmarried at the time of birth, while the lowest percentage of unmarried women with births belong to 15 to 19 years age bracket with 4.0% of them unmarried.
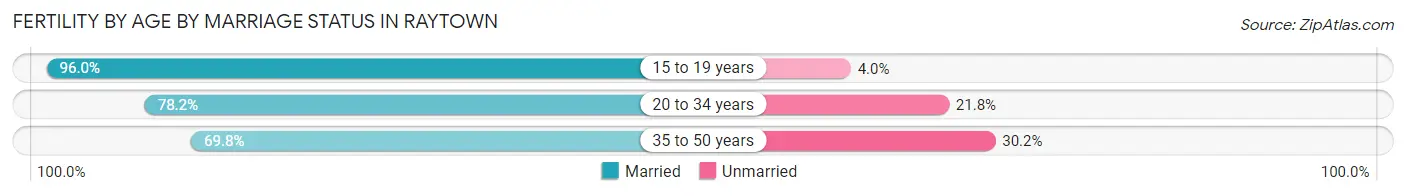
| Age Bracket | Married | Unmarried |
| 15 to 19 years | 24 (96.0%) | 1 (4.0%) |
| 20 to 34 years | 244 (78.2%) | 68 (21.8%) |
| 35 to 50 years | 37 (69.8%) | 16 (30.2%) |
| Total | 305 (78.2%) | 85 (21.8%) |
Fertility by Education in Raytown
Average fertility rate in Raytown is 59.0 births per 1,000 women. Women with the education attainment of graduate degree have the highest fertility rate of 82.0 births per 1,000 women, while women with the education attainment of less than high school have the lowest fertility at 18.0 births per 1,000 women. Women with the education attainment of college or associate's degree represent 39.7% of all women with births.
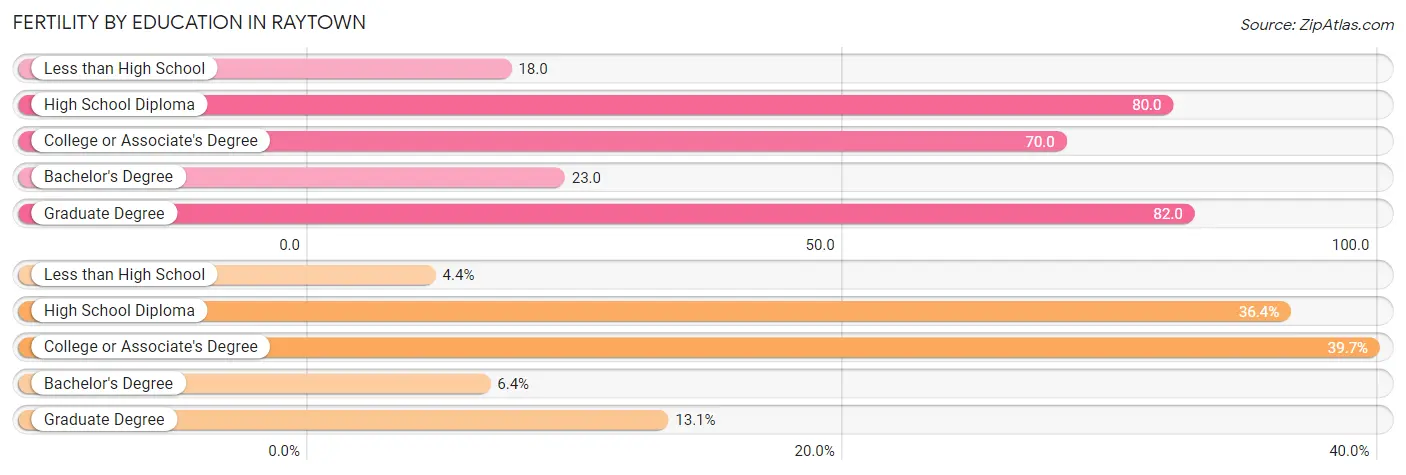
| Educational Attainment | Women with Births | Births / 1,000 Women |
| Less than High School | 17 (4.4%) | 18.0 |
| High School Diploma | 142 (36.4%) | 80.0 |
| College or Associate's Degree | 155 (39.7%) | 70.0 |
| Bachelor's Degree | 25 (6.4%) | 23.0 |
| Graduate Degree | 51 (13.1%) | 82.0 |
| Total | 390 (100.0%) | 59.0 |
Fertility by Education by Marriage Status in Raytown
21.8% of women with births in Raytown are unmarried. Women with the educational attainment of graduate degree are most likely to be married with 100.0% of them married at childbirth, while women with the educational attainment of less than high school are least likely to be married with 100.0% of them unmarried at childbirth.
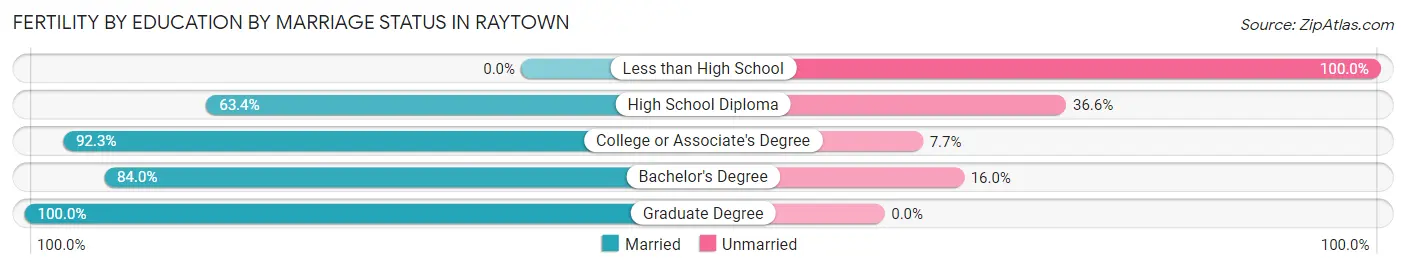
| Educational Attainment | Married | Unmarried |
| Less than High School | 0 (0.0%) | 17 (100.0%) |
| High School Diploma | 90 (63.4%) | 52 (36.6%) |
| College or Associate's Degree | 143 (92.3%) | 12 (7.7%) |
| Bachelor's Degree | 21 (84.0%) | 4 (16.0%) |
| Graduate Degree | 51 (100.0%) | 0 (0.0%) |
| Total | 305 (78.2%) | 85 (21.8%) |
Employment Characteristics in Raytown
Employment by Class of Employer in Raytown
Among the 15,386 employed individuals in Raytown, private company employees (11,510 | 74.8%), not-for-profit organizations (1,152 | 7.5%), and federal government employees (726 | 4.7%) make up the most common classes of employment.
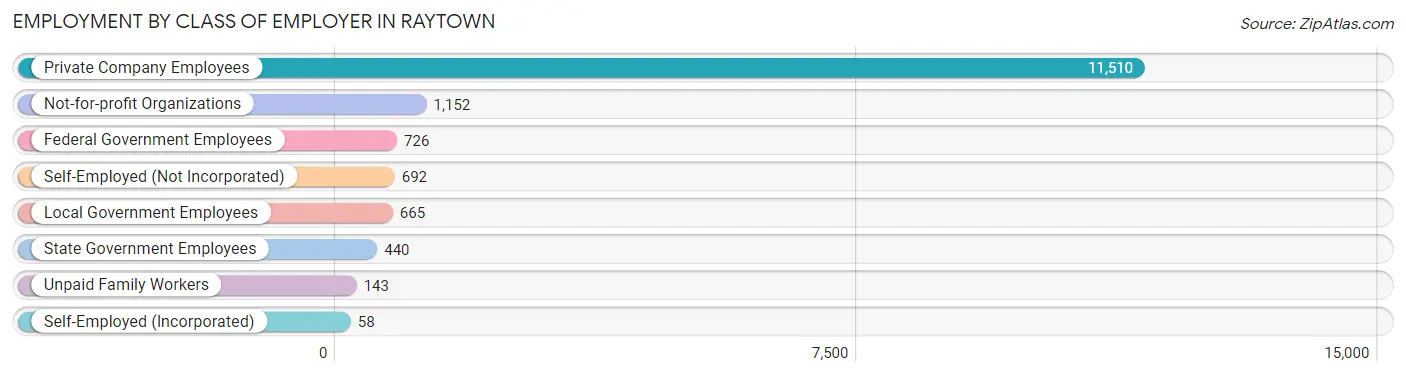
| Employer Class | # Employees | % Employees |
| Private Company Employees | 11,510 | 74.8% |
| Self-Employed (Incorporated) | 58 | 0.4% |
| Self-Employed (Not Incorporated) | 692 | 4.5% |
| Not-for-profit Organizations | 1,152 | 7.5% |
| Local Government Employees | 665 | 4.3% |
| State Government Employees | 440 | 2.9% |
| Federal Government Employees | 726 | 4.7% |
| Unpaid Family Workers | 143 | 0.9% |
| Total | 15,386 | 100.0% |
Employment Status by Age in Raytown
According to the labor force statistics for Raytown, out of the total population over 16 years of age (23,993), 69.3% or 16,627 individuals are in the labor force, with 5.2% or 865 of them unemployed. The age group with the highest labor force participation rate is 45 to 54 years, with 92.0% or 3,659 individuals in the labor force. Within the labor force, the 16 to 19 years age range has the highest percentage of unemployed individuals, with 14.8% or 112 of them being unemployed.
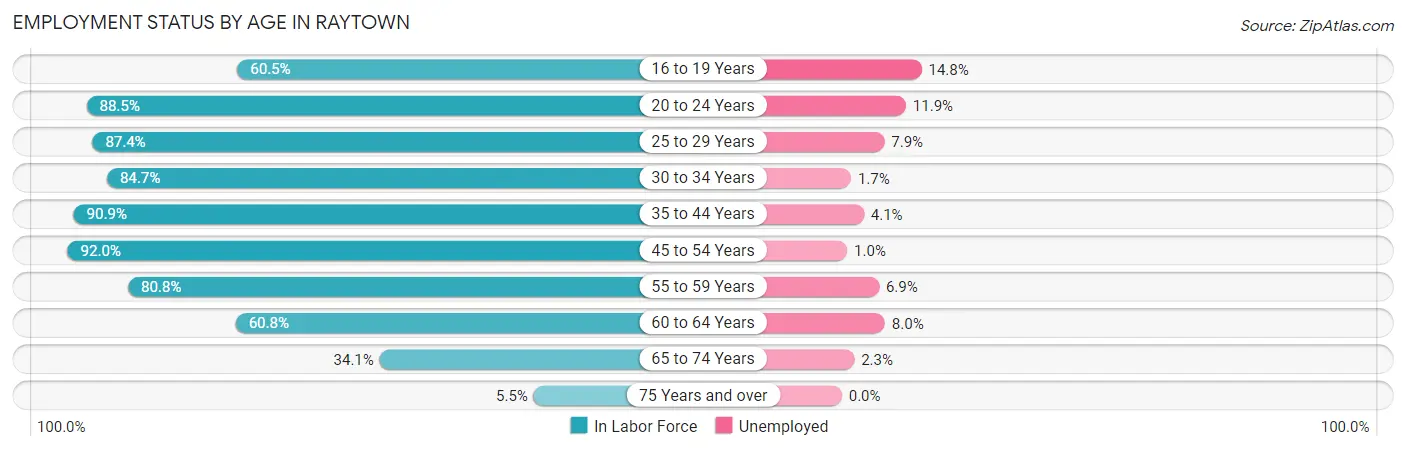
| Age Bracket | In Labor Force | Unemployed |
| 16 to 19 Years | 757 (60.5%) | 112 (14.8%) |
| 20 to 24 Years | 1,373 (88.5%) | 163 (11.9%) |
| 25 to 29 Years | 1,882 (87.4%) | 149 (7.9%) |
| 30 to 34 Years | 1,574 (84.7%) | 27 (1.7%) |
| 35 to 44 Years | 3,285 (90.9%) | 135 (4.1%) |
| 45 to 54 Years | 3,659 (92.0%) | 37 (1.0%) |
| 55 to 59 Years | 1,712 (80.8%) | 118 (6.9%) |
| 60 to 64 Years | 1,240 (60.8%) | 99 (8.0%) |
| 65 to 74 Years | 1,014 (34.1%) | 23 (2.3%) |
| 75 Years and over | 135 (5.5%) | 0 (0.0%) |
| Total | 16,627 (69.3%) | 865 (5.2%) |
Employment Status by Educational Attainment in Raytown
According to labor force statistics for Raytown, 84.7% of individuals (13,349) out of the total population between 25 and 64 years of age (15,760) are in the labor force, with 4.2% or 561 of them being unemployed. The group with the highest labor force participation rate are those with the educational attainment of bachelor's degree or higher, with 90.8% or 3,477 individuals in the labor force. Within the labor force, individuals with high school diploma education have the highest percentage of unemployment, with 8.8% or 363 of them being unemployed.
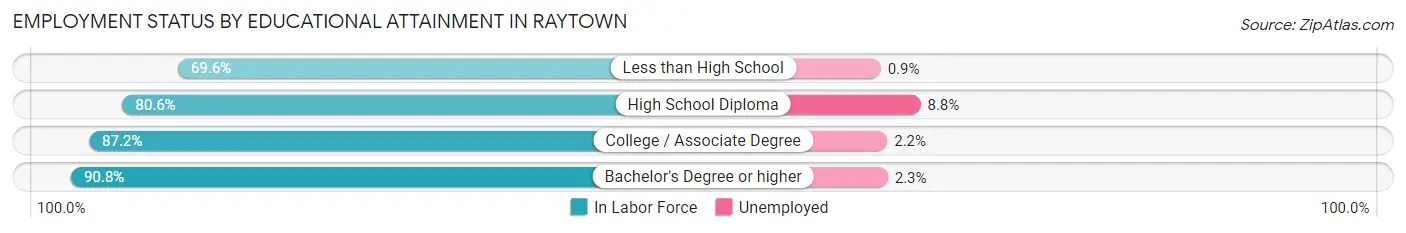
| Educational Attainment | In Labor Force | Unemployed |
| Less than High School | 768 (69.6%) | 10 (0.9%) |
| High School Diploma | 4,130 (80.6%) | 451 (8.8%) |
| College / Associate Degree | 4,974 (87.2%) | 125 (2.2%) |
| Bachelor's Degree or higher | 3,477 (90.8%) | 88 (2.3%) |
| Total | 13,349 (84.7%) | 662 (4.2%) |
Employment Occupations by Sex in Raytown
Management, Business, Science and Arts Occupations
The most common Management, Business, Science and Arts occupations in Raytown are Management (1,371 | 8.7%), Community & Social Service (1,369 | 8.7%), Business & Financial (984 | 6.2%), Health Diagnosing & Treating (699 | 4.4%), and Computers, Engineering & Science (599 | 3.8%).

Management, Business, Science and Arts Occupations by Sex
Within the Management, Business, Science and Arts occupations in Raytown, the most male-oriented occupations are Architecture & Engineering (96.4%), Computers, Engineering & Science (80.8%), and Computers & Mathematics (80.0%), while the most female-oriented occupations are Education Instruction & Library (91.0%), Health Technologists (86.1%), and Health Diagnosing & Treating (83.0%).
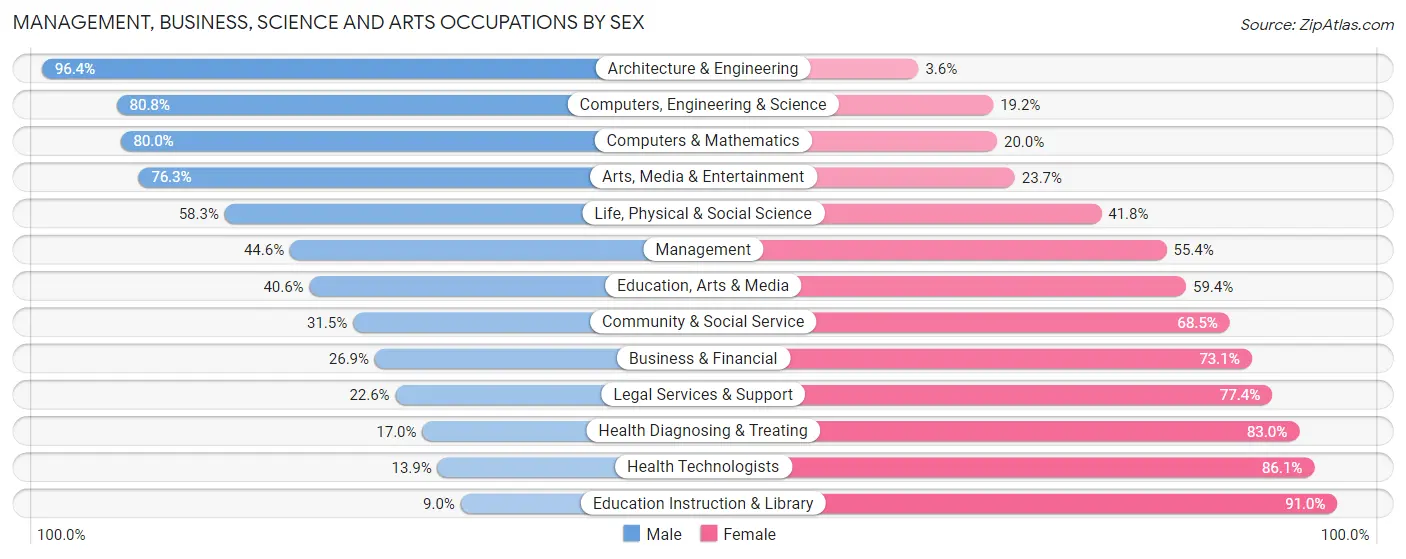
| Occupation | Male | Female |
| Management | 612 (44.6%) | 759 (55.4%) |
| Business & Financial | 265 (26.9%) | 719 (73.1%) |
| Computers, Engineering & Science | 484 (80.8%) | 115 (19.2%) |
| Computers & Mathematics | 264 (80.0%) | 66 (20.0%) |
| Architecture & Engineering | 160 (96.4%) | 6 (3.6%) |
| Life, Physical & Social Science | 60 (58.3%) | 43 (41.7%) |
| Community & Social Service | 431 (31.5%) | 938 (68.5%) |
| Education, Arts & Media | 112 (40.6%) | 164 (59.4%) |
| Legal Services & Support | 60 (22.6%) | 205 (77.4%) |
| Education Instruction & Library | 50 (9.0%) | 504 (91.0%) |
| Arts, Media & Entertainment | 209 (76.3%) | 65 (23.7%) |
| Health Diagnosing & Treating | 119 (17.0%) | 580 (83.0%) |
| Health Technologists | 61 (13.9%) | 379 (86.1%) |
| Total (Category) | 1,911 (38.1%) | 3,111 (62.0%) |
| Total (Overall) | 8,424 (53.5%) | 7,322 (46.5%) |
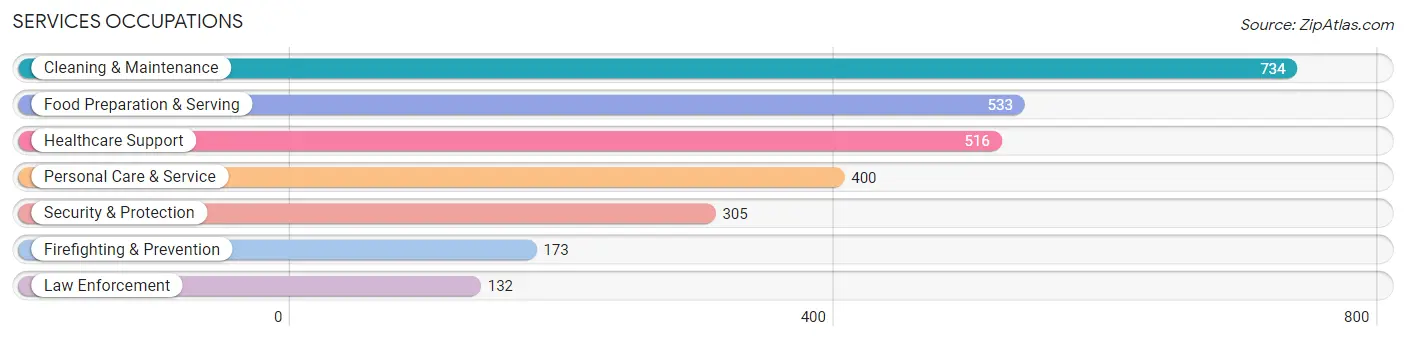
Services Occupations
The most common Services occupations in Raytown are Cleaning & Maintenance (734 | 4.7%), Food Preparation & Serving (533 | 3.4%), Healthcare Support (516 | 3.3%), Personal Care & Service (400 | 2.5%), and Security & Protection (305 | 1.9%).
Services Occupations by Sex
Within the Services occupations in Raytown, the most male-oriented occupations are Law Enforcement (85.6%), Security & Protection (76.4%), and Firefighting & Prevention (69.4%), while the most female-oriented occupations are Healthcare Support (74.8%), Personal Care & Service (66.0%), and Cleaning & Maintenance (52.7%).
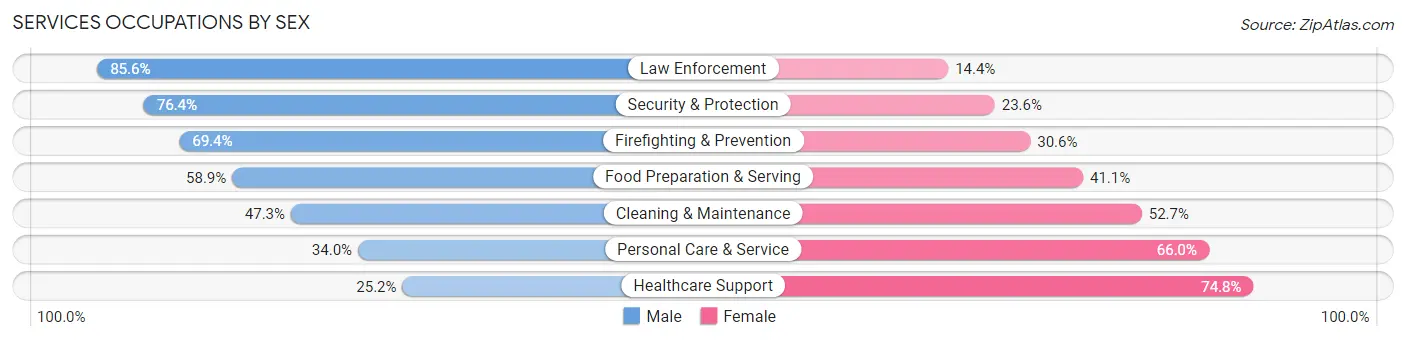
| Occupation | Male | Female |
| Healthcare Support | 130 (25.2%) | 386 (74.8%) |
| Security & Protection | 233 (76.4%) | 72 (23.6%) |
| Firefighting & Prevention | 120 (69.4%) | 53 (30.6%) |
| Law Enforcement | 113 (85.6%) | 19 (14.4%) |
| Food Preparation & Serving | 314 (58.9%) | 219 (41.1%) |
| Cleaning & Maintenance | 347 (47.3%) | 387 (52.7%) |
| Personal Care & Service | 136 (34.0%) | 264 (66.0%) |
| Total (Category) | 1,160 (46.6%) | 1,328 (53.4%) |
| Total (Overall) | 8,424 (53.5%) | 7,322 (46.5%) |
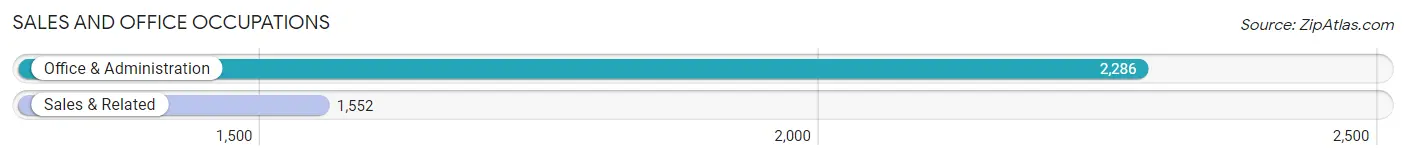
Sales and Office Occupations
The most common Sales and Office occupations in Raytown are Office & Administration (2,286 | 14.5%), and Sales & Related (1,552 | 9.9%).
Sales and Office Occupations by Sex
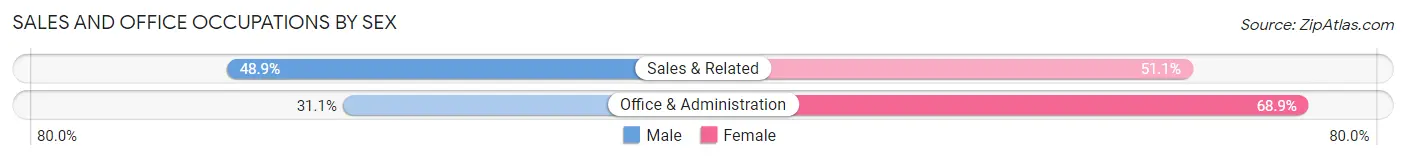
| Occupation | Male | Female |
| Sales & Related | 759 (48.9%) | 793 (51.1%) |
| Office & Administration | 710 (31.1%) | 1,576 (68.9%) |
| Total (Category) | 1,469 (38.3%) | 2,369 (61.7%) |
| Total (Overall) | 8,424 (53.5%) | 7,322 (46.5%) |
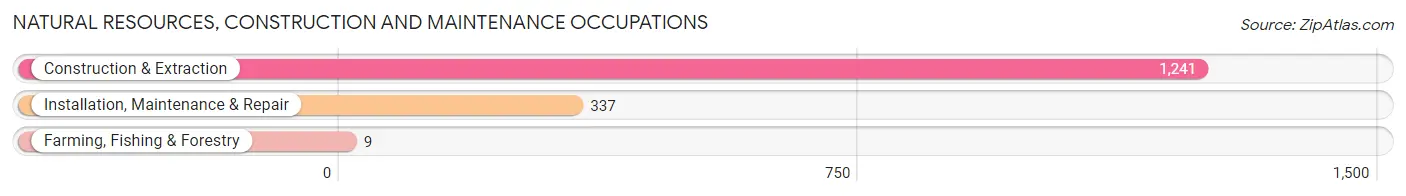
Natural Resources, Construction and Maintenance Occupations
The most common Natural Resources, Construction and Maintenance occupations in Raytown are Construction & Extraction (1,241 | 7.9%), Installation, Maintenance & Repair (337 | 2.1%), and Farming, Fishing & Forestry (9 | 0.1%).
Natural Resources, Construction and Maintenance Occupations by Sex
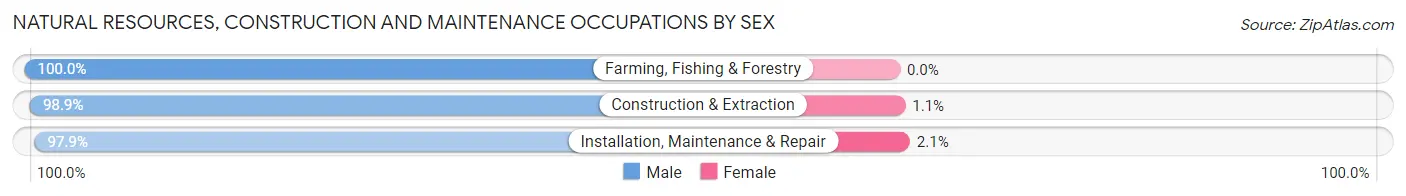
| Occupation | Male | Female |
| Farming, Fishing & Forestry | 9 (100.0%) | 0 (0.0%) |
| Construction & Extraction | 1,227 (98.9%) | 14 (1.1%) |
| Installation, Maintenance & Repair | 330 (97.9%) | 7 (2.1%) |
| Total (Category) | 1,566 (98.7%) | 21 (1.3%) |
| Total (Overall) | 8,424 (53.5%) | 7,322 (46.5%) |
Production, Transportation and Moving Occupations
The most common Production, Transportation and Moving occupations in Raytown are Material Moving (979 | 6.2%), Production (922 | 5.9%), and Transportation (910 | 5.8%).
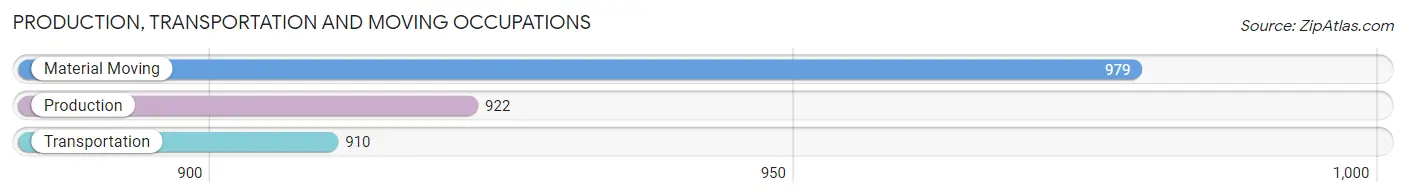
Production, Transportation and Moving Occupations by Sex
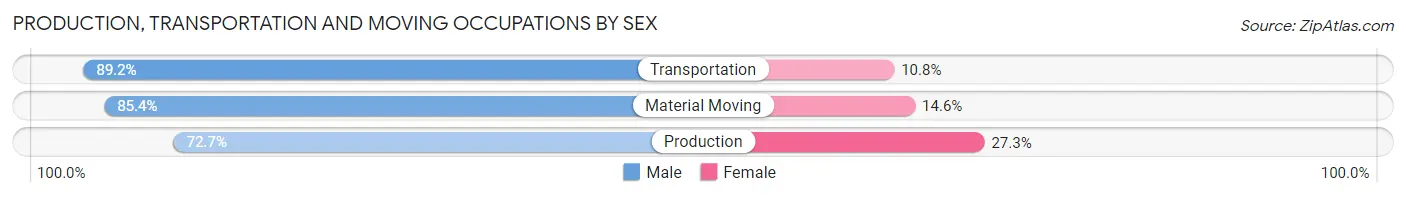
| Occupation | Male | Female |
| Production | 670 (72.7%) | 252 (27.3%) |
| Transportation | 812 (89.2%) | 98 (10.8%) |
| Material Moving | 836 (85.4%) | 143 (14.6%) |
| Total (Category) | 2,318 (82.5%) | 493 (17.5%) |
| Total (Overall) | 8,424 (53.5%) | 7,322 (46.5%) |
Employment Industries by Sex in Raytown
Employment Industries in Raytown
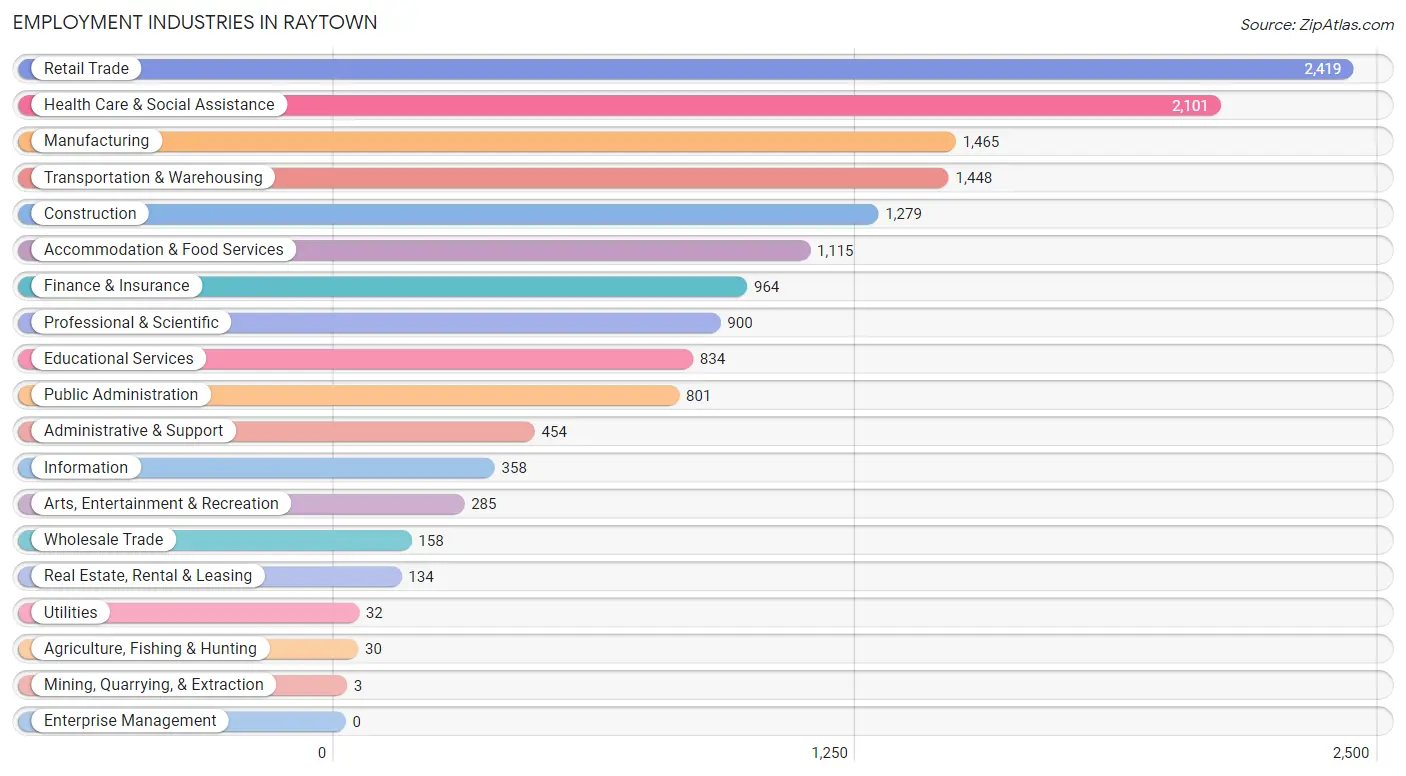
The major employment industries in Raytown include Retail Trade (2,419 | 15.4%), Health Care & Social Assistance (2,101 | 13.3%), Manufacturing (1,465 | 9.3%), Transportation & Warehousing (1,448 | 9.2%), and Construction (1,279 | 8.1%).
Employment Industries by Sex in Raytown
The Raytown industries that see more men than women are Agriculture, Fishing & Hunting (100.0%), Utilities (100.0%), and Construction (96.6%), whereas the industries that tend to have a higher number of women are Mining, Quarrying, & Extraction (100.0%), Real Estate, Rental & Leasing (86.6%), and Health Care & Social Assistance (80.5%).
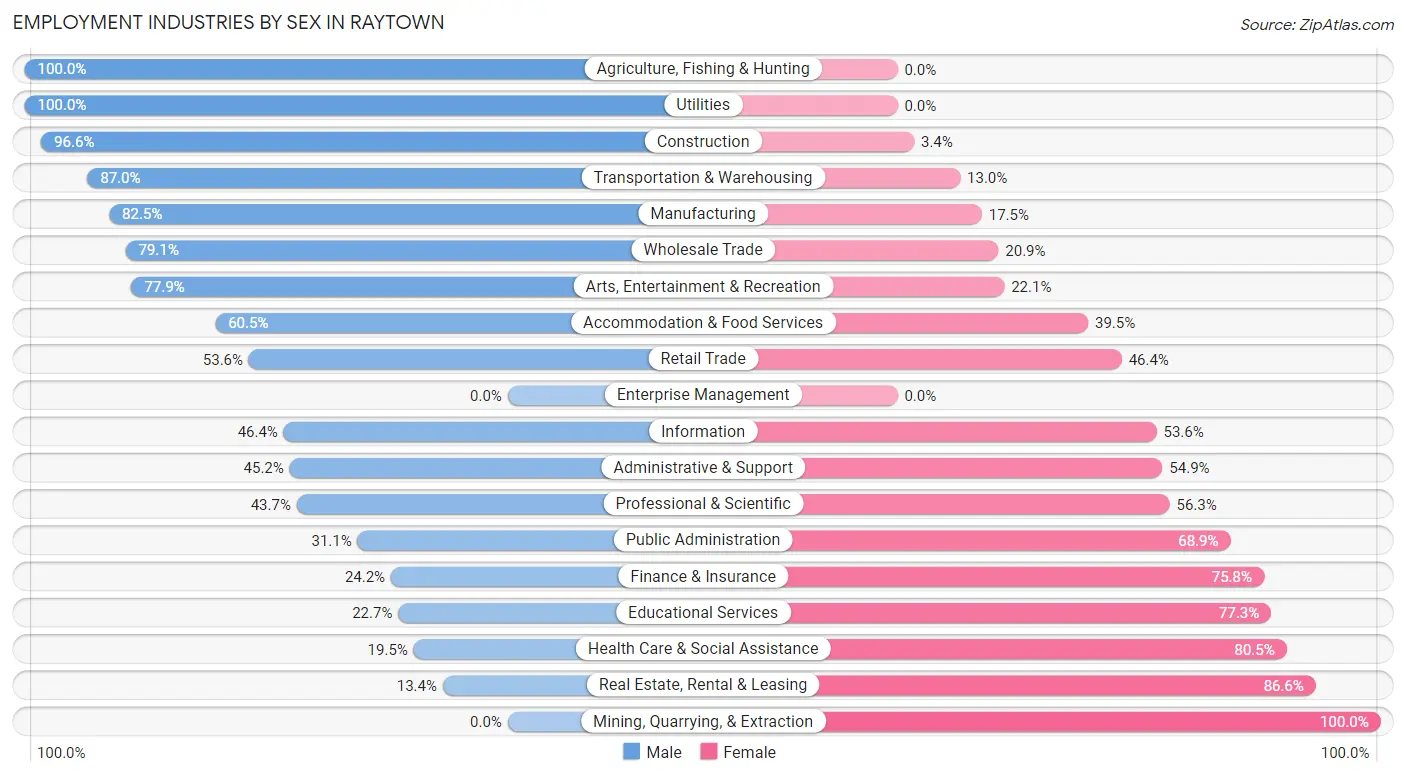
| Industry | Male | Female |
| Agriculture, Fishing & Hunting | 30 (100.0%) | 0 (0.0%) |
| Mining, Quarrying, & Extraction | 0 (0.0%) | 3 (100.0%) |
| Construction | 1,235 (96.6%) | 44 (3.4%) |
| Manufacturing | 1,209 (82.5%) | 256 (17.5%) |
| Wholesale Trade | 125 (79.1%) | 33 (20.9%) |
| Retail Trade | 1,296 (53.6%) | 1,123 (46.4%) |
| Transportation & Warehousing | 1,260 (87.0%) | 188 (13.0%) |
| Utilities | 32 (100.0%) | 0 (0.0%) |
| Information | 166 (46.4%) | 192 (53.6%) |
| Finance & Insurance | 233 (24.2%) | 731 (75.8%) |
| Real Estate, Rental & Leasing | 18 (13.4%) | 116 (86.6%) |
| Professional & Scientific | 393 (43.7%) | 507 (56.3%) |
| Enterprise Management | 0 (0.0%) | 0 (0.0%) |
| Administrative & Support | 205 (45.2%) | 249 (54.8%) |
| Educational Services | 189 (22.7%) | 645 (77.3%) |
| Health Care & Social Assistance | 409 (19.5%) | 1,692 (80.5%) |
| Arts, Entertainment & Recreation | 222 (77.9%) | 63 (22.1%) |
| Accommodation & Food Services | 675 (60.5%) | 440 (39.5%) |
| Public Administration | 249 (31.1%) | 552 (68.9%) |
| Total | 8,424 (53.5%) | 7,322 (46.5%) |
Education in Raytown
School Enrollment in Raytown
The most common levels of schooling among the 6,241 students in Raytown are middle school (1,746 | 28.0%), elementary school (1,305 | 20.9%), and high school (1,122 | 18.0%).
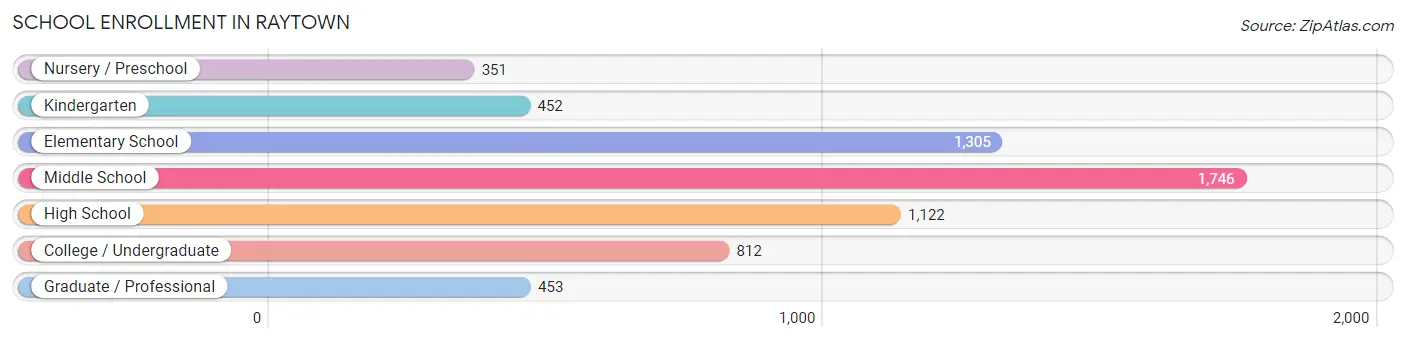
| School Level | # Students | % Students |
| Nursery / Preschool | 351 | 5.6% |
| Kindergarten | 452 | 7.2% |
| Elementary School | 1,305 | 20.9% |
| Middle School | 1,746 | 28.0% |
| High School | 1,122 | 18.0% |
| College / Undergraduate | 812 | 13.0% |
| Graduate / Professional | 453 | 7.3% |
| Total | 6,241 | 100.0% |
School Enrollment by Age by Funding Source in Raytown
Out of a total of 6,241 students who are enrolled in schools in Raytown, 724 (11.6%) attend a private institution, while the remaining 5,517 (88.4%) are enrolled in public schools. The age group of 18 to 19 year olds has the highest likelihood of being enrolled in private schools, with 131 (30.5% in the age bracket) enrolled. Conversely, the age group of 5 to 9 year old has the lowest likelihood of being enrolled in a private school, with 1,644 (96.3% in the age bracket) attending a public institution.
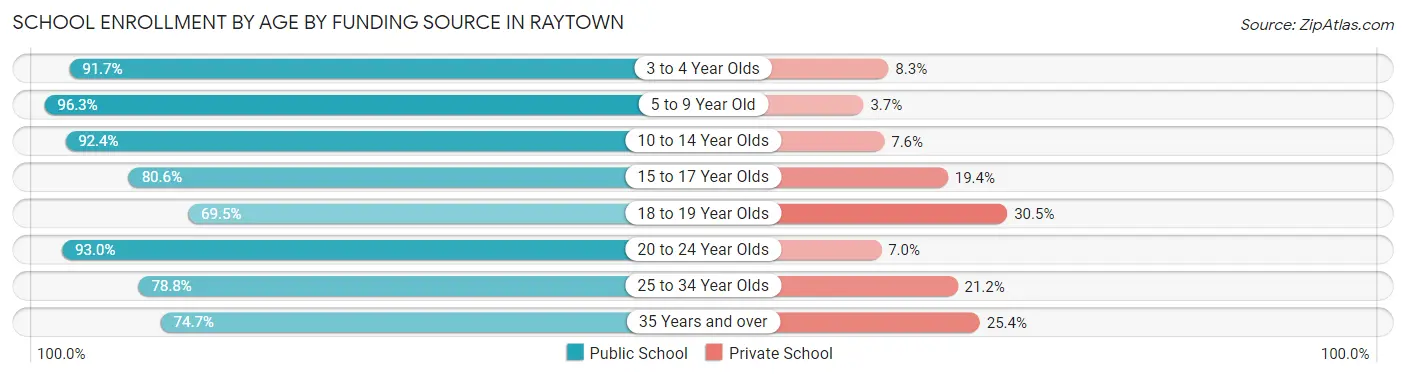
| Age Bracket | Public School | Private School |
| 3 to 4 Year Olds | 253 (91.7%) | 23 (8.3%) |
| 5 to 9 Year Old | 1,644 (96.3%) | 63 (3.7%) |
| 10 to 14 Year Olds | 1,745 (92.4%) | 143 (7.6%) |
| 15 to 17 Year Olds | 702 (80.6%) | 169 (19.4%) |
| 18 to 19 Year Olds | 299 (69.5%) | 131 (30.5%) |
| 20 to 24 Year Olds | 266 (93.0%) | 20 (7.0%) |
| 25 to 34 Year Olds | 390 (78.8%) | 105 (21.2%) |
| 35 Years and over | 215 (74.7%) | 73 (25.4%) |
| Total | 5,517 (88.4%) | 724 (11.6%) |
Educational Attainment by Field of Study in Raytown
Business (1,050 | 20.3%), education (628 | 12.1%), science & technology (500 | 9.7%), liberal arts & history (400 | 7.7%), and communications (368 | 7.1%) are the most common fields of study among 5,180 individuals in Raytown who have obtained a bachelor's degree or higher.
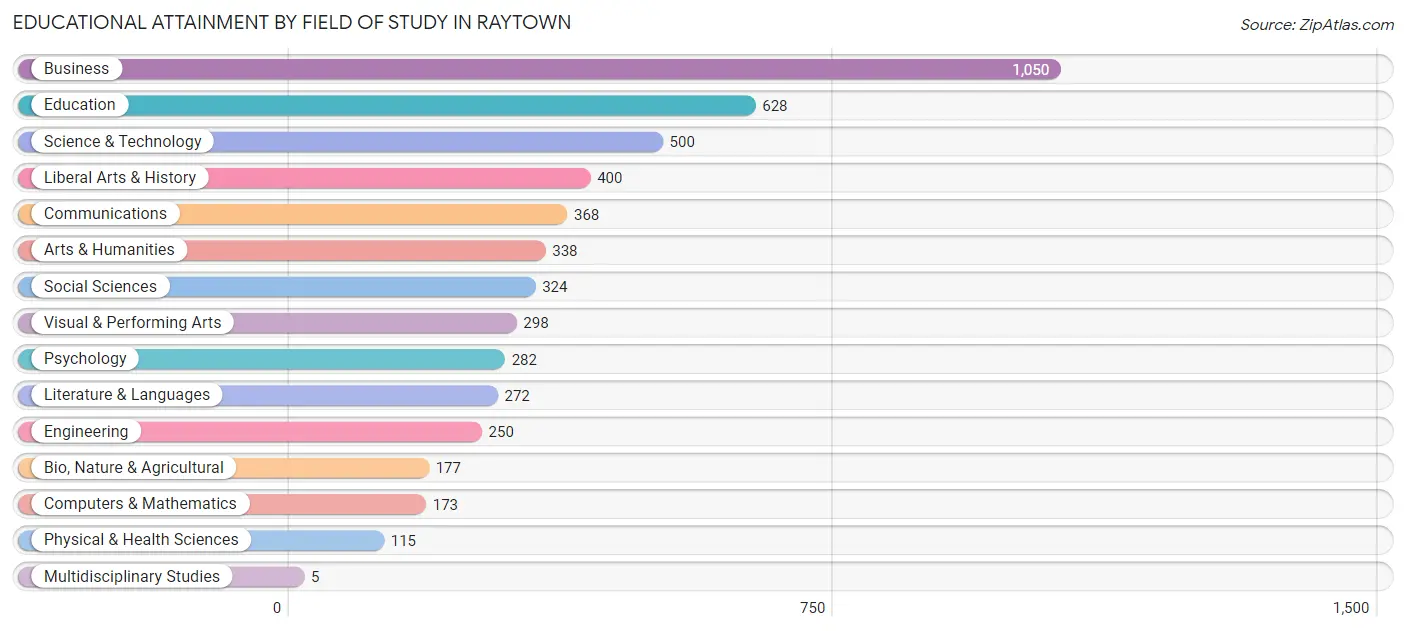
| Field of Study | # Graduates | % Graduates |
| Computers & Mathematics | 173 | 3.3% |
| Bio, Nature & Agricultural | 177 | 3.4% |
| Physical & Health Sciences | 115 | 2.2% |
| Psychology | 282 | 5.4% |
| Social Sciences | 324 | 6.2% |
| Engineering | 250 | 4.8% |
| Multidisciplinary Studies | 5 | 0.1% |
| Science & Technology | 500 | 9.7% |
| Business | 1,050 | 20.3% |
| Education | 628 | 12.1% |
| Literature & Languages | 272 | 5.2% |
| Liberal Arts & History | 400 | 7.7% |
| Visual & Performing Arts | 298 | 5.8% |
| Communications | 368 | 7.1% |
| Arts & Humanities | 338 | 6.5% |
| Total | 5,180 | 100.0% |
Transportation & Commute in Raytown
Vehicle Availability by Sex in Raytown
The most prevalent vehicle ownership categories in Raytown are males with 2 vehicles (3,910, accounting for 47.6%) and females with 2 vehicles (3,114, making up 54.6%).
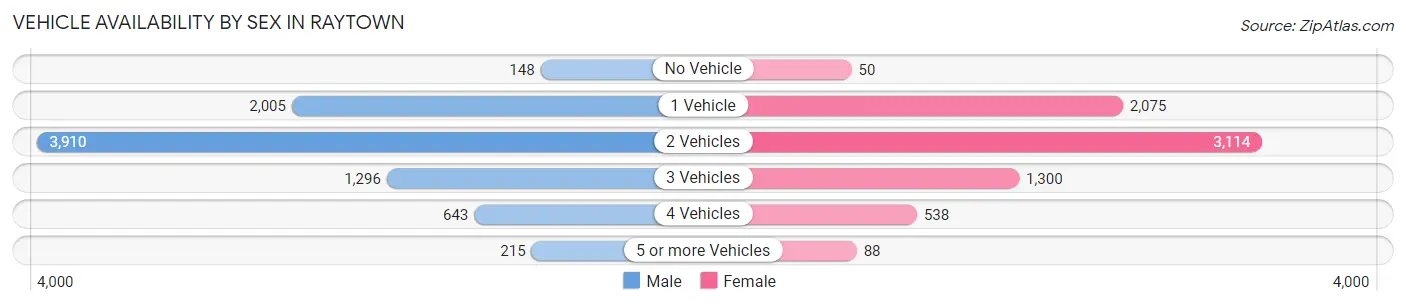
| Vehicles Available | Male | Female |
| No Vehicle | 148 (1.8%) | 50 (0.7%) |
| 1 Vehicle | 2,005 (24.4%) | 2,075 (29.0%) |
| 2 Vehicles | 3,910 (47.6%) | 3,114 (43.5%) |
| 3 Vehicles | 1,296 (15.8%) | 1,300 (18.1%) |
| 4 Vehicles | 643 (7.8%) | 538 (7.5%) |
| 5 or more Vehicles | 215 (2.6%) | 88 (1.2%) |
| Total | 8,217 (100.0%) | 7,165 (100.0%) |
Commute Time in Raytown
The most frequently occuring commute durations in Raytown are 20 to 24 minutes (3,438 commuters, 24.4%), 30 to 34 minutes (3,169 commuters, 22.5%), and 15 to 19 minutes (2,125 commuters, 15.1%).
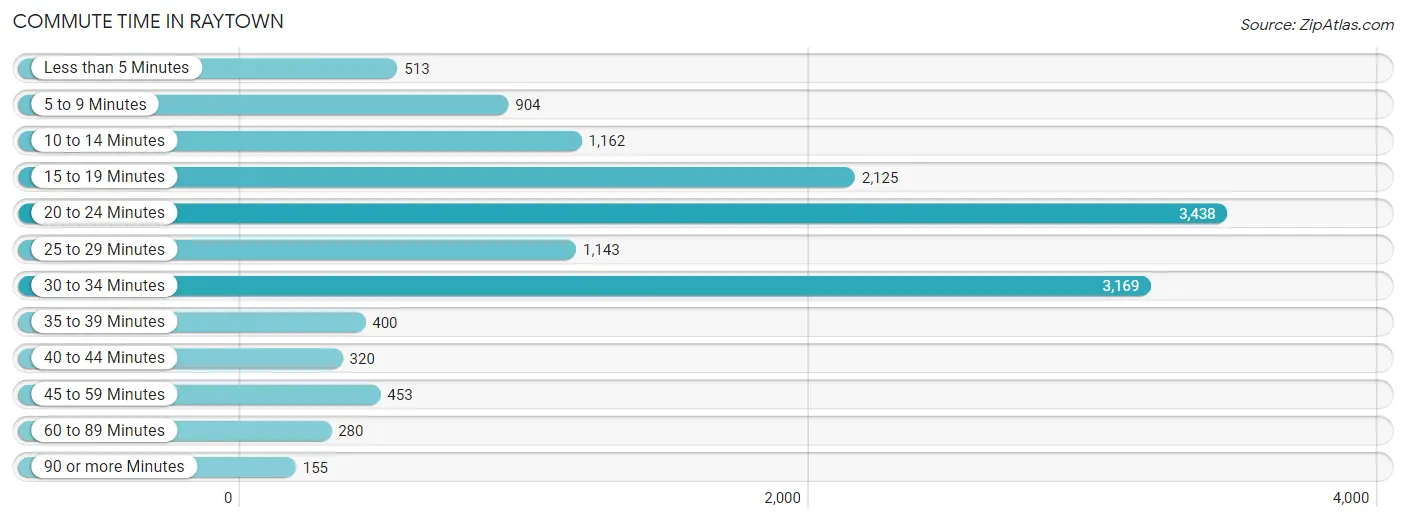
| Commute Time | # Commuters | % Commuters |
| Less than 5 Minutes | 513 | 3.6% |
| 5 to 9 Minutes | 904 | 6.4% |
| 10 to 14 Minutes | 1,162 | 8.3% |
| 15 to 19 Minutes | 2,125 | 15.1% |
| 20 to 24 Minutes | 3,438 | 24.4% |
| 25 to 29 Minutes | 1,143 | 8.1% |
| 30 to 34 Minutes | 3,169 | 22.5% |
| 35 to 39 Minutes | 400 | 2.8% |
| 40 to 44 Minutes | 320 | 2.3% |
| 45 to 59 Minutes | 453 | 3.2% |
| 60 to 89 Minutes | 280 | 2.0% |
| 90 or more Minutes | 155 | 1.1% |
Commute Time by Sex in Raytown
The most common commute times in Raytown are 20 to 24 minutes (2,185 commuters, 29.0%) for males and 30 to 34 minutes (1,427 commuters, 21.8%) for females.
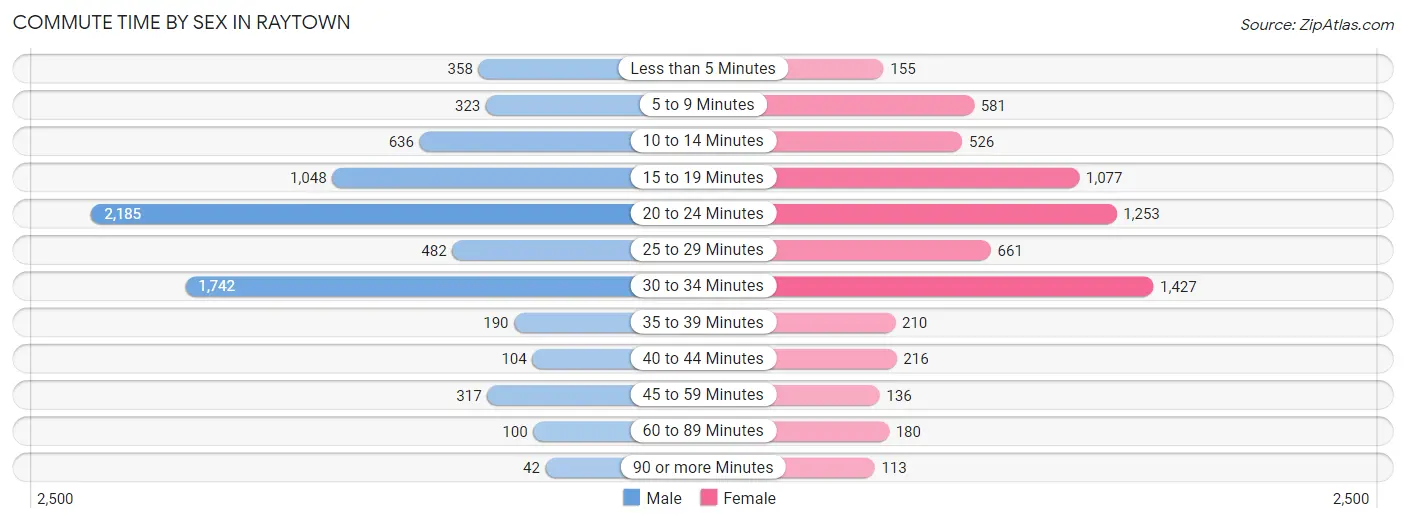
| Commute Time | Male | Female |
| Less than 5 Minutes | 358 (4.8%) | 155 (2.4%) |
| 5 to 9 Minutes | 323 (4.3%) | 581 (8.9%) |
| 10 to 14 Minutes | 636 (8.5%) | 526 (8.1%) |
| 15 to 19 Minutes | 1,048 (13.9%) | 1,077 (16.5%) |
| 20 to 24 Minutes | 2,185 (29.0%) | 1,253 (19.2%) |
| 25 to 29 Minutes | 482 (6.4%) | 661 (10.1%) |
| 30 to 34 Minutes | 1,742 (23.1%) | 1,427 (21.8%) |
| 35 to 39 Minutes | 190 (2.5%) | 210 (3.2%) |
| 40 to 44 Minutes | 104 (1.4%) | 216 (3.3%) |
| 45 to 59 Minutes | 317 (4.2%) | 136 (2.1%) |
| 60 to 89 Minutes | 100 (1.3%) | 180 (2.8%) |
| 90 or more Minutes | 42 (0.6%) | 113 (1.7%) |
Time of Departure to Work by Sex in Raytown
The most frequent times of departure to work in Raytown are 7:00 AM to 7:29 AM (1,248, 16.6%) for males and 7:30 AM to 7:59 AM (1,056, 16.2%) for females.
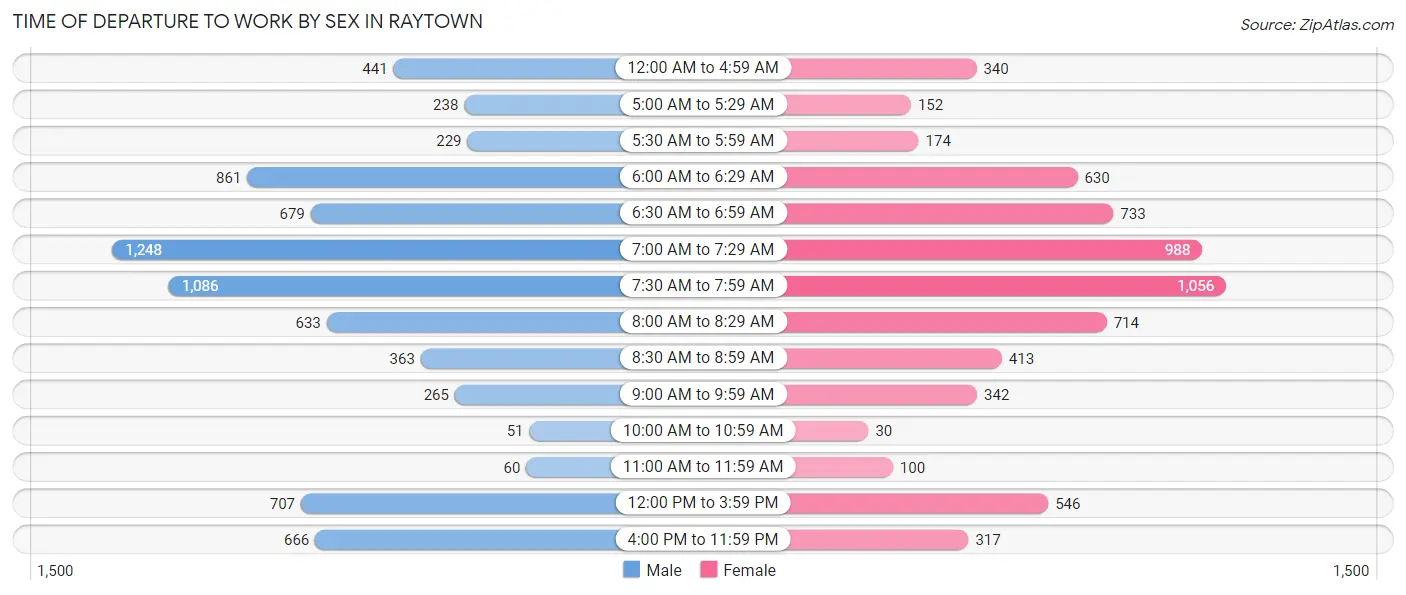
| Time of Departure | Male | Female |
| 12:00 AM to 4:59 AM | 441 (5.9%) | 340 (5.2%) |
| 5:00 AM to 5:29 AM | 238 (3.2%) | 152 (2.3%) |
| 5:30 AM to 5:59 AM | 229 (3.0%) | 174 (2.7%) |
| 6:00 AM to 6:29 AM | 861 (11.4%) | 630 (9.6%) |
| 6:30 AM to 6:59 AM | 679 (9.0%) | 733 (11.2%) |
| 7:00 AM to 7:29 AM | 1,248 (16.6%) | 988 (15.1%) |
| 7:30 AM to 7:59 AM | 1,086 (14.4%) | 1,056 (16.2%) |
| 8:00 AM to 8:29 AM | 633 (8.4%) | 714 (10.9%) |
| 8:30 AM to 8:59 AM | 363 (4.8%) | 413 (6.3%) |
| 9:00 AM to 9:59 AM | 265 (3.5%) | 342 (5.2%) |
| 10:00 AM to 10:59 AM | 51 (0.7%) | 30 (0.5%) |
| 11:00 AM to 11:59 AM | 60 (0.8%) | 100 (1.5%) |
| 12:00 PM to 3:59 PM | 707 (9.4%) | 546 (8.4%) |
| 4:00 PM to 11:59 PM | 666 (8.8%) | 317 (4.9%) |
| Total | 7,527 (100.0%) | 6,535 (100.0%) |
Housing Occupancy in Raytown
Occupancy by Ownership in Raytown
Of the total 12,561 dwellings in Raytown, owner-occupied units account for 8,053 (64.1%), while renter-occupied units make up 4,508 (35.9%).
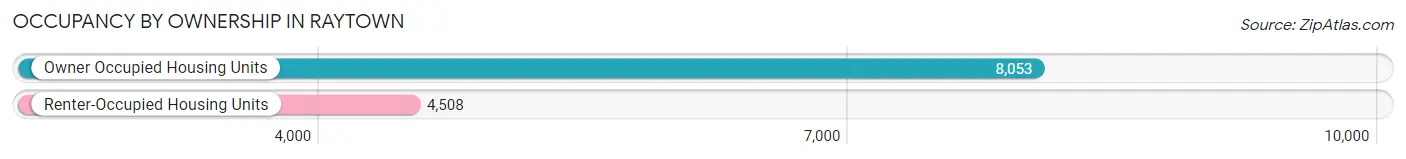
| Occupancy | # Housing Units | % Housing Units |
| Owner Occupied Housing Units | 8,053 | 64.1% |
| Renter-Occupied Housing Units | 4,508 | 35.9% |
| Total Occupied Housing Units | 12,561 | 100.0% |
Occupancy by Household Size in Raytown
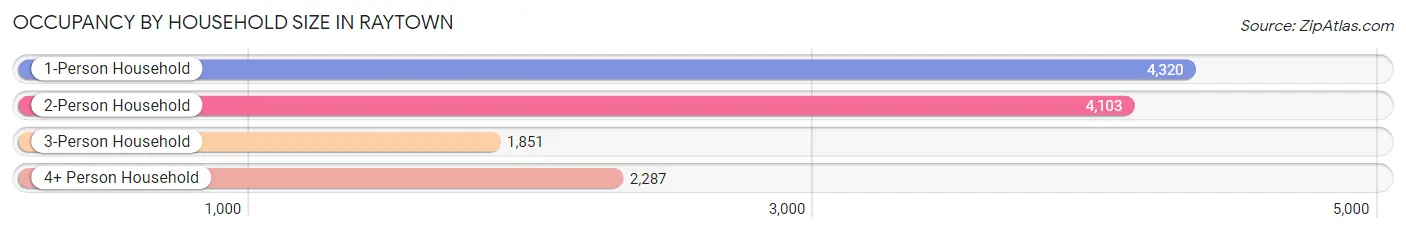
| Household Size | # Housing Units | % Housing Units |
| 1-Person Household | 4,320 | 34.4% |
| 2-Person Household | 4,103 | 32.7% |
| 3-Person Household | 1,851 | 14.7% |
| 4+ Person Household | 2,287 | 18.2% |
| Total Housing Units | 12,561 | 100.0% |
Occupancy by Ownership by Household Size in Raytown
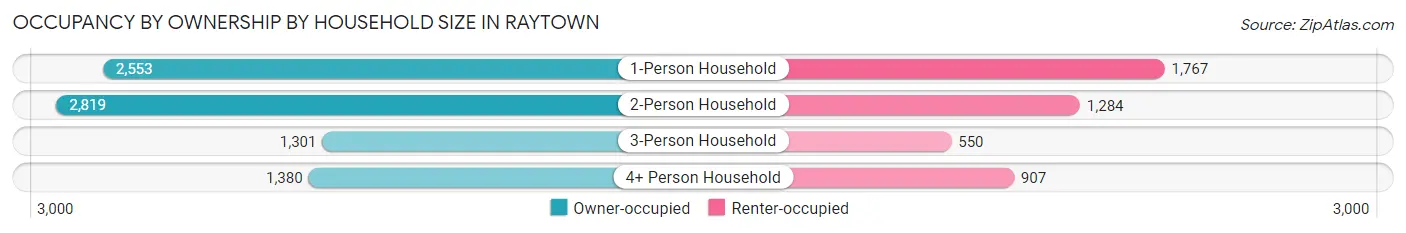
| Household Size | Owner-occupied | Renter-occupied |
| 1-Person Household | 2,553 (59.1%) | 1,767 (40.9%) |
| 2-Person Household | 2,819 (68.7%) | 1,284 (31.3%) |
| 3-Person Household | 1,301 (70.3%) | 550 (29.7%) |
| 4+ Person Household | 1,380 (60.3%) | 907 (39.7%) |
| Total Housing Units | 8,053 (64.1%) | 4,508 (35.9%) |
Occupancy by Educational Attainment in Raytown
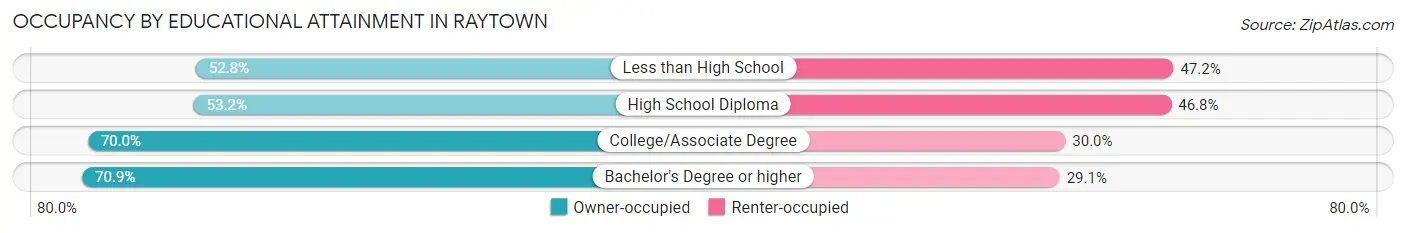
| Household Size | Owner-occupied | Renter-occupied |
| Less than High School | 428 (52.8%) | 382 (47.2%) |
| High School Diploma | 1,992 (53.2%) | 1,753 (46.8%) |
| College/Associate Degree | 3,296 (70.0%) | 1,413 (30.0%) |
| Bachelor's Degree or higher | 2,337 (70.9%) | 960 (29.1%) |
Occupancy by Age of Householder in Raytown
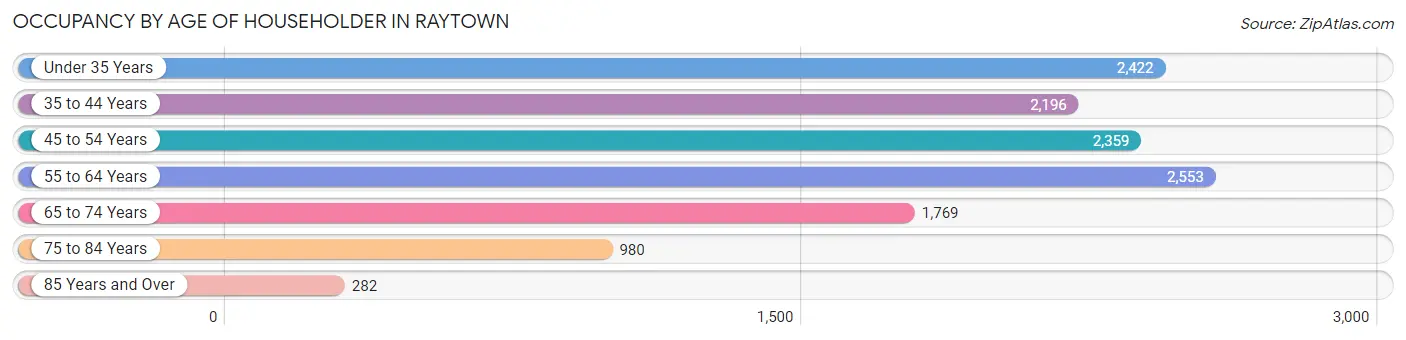
| Age Bracket | # Households | % Households |
| Under 35 Years | 2,422 | 19.3% |
| 35 to 44 Years | 2,196 | 17.5% |
| 45 to 54 Years | 2,359 | 18.8% |
| 55 to 64 Years | 2,553 | 20.3% |
| 65 to 74 Years | 1,769 | 14.1% |
| 75 to 84 Years | 980 | 7.8% |
| 85 Years and Over | 282 | 2.2% |
| Total | 12,561 | 100.0% |
Housing Finances in Raytown
Median Income by Occupancy in Raytown
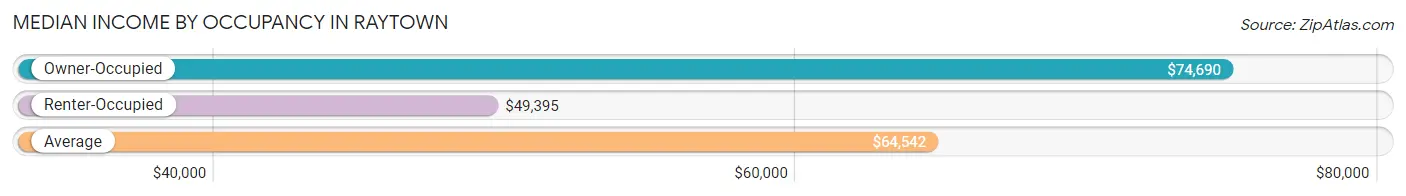
| Occupancy Type | # Households | Median Income |
| Owner-Occupied | 8,053 (64.1%) | $74,690 |
| Renter-Occupied | 4,508 (35.9%) | $49,395 |
| Average | 12,561 (100.0%) | $64,542 |
Occupancy by Householder Income Bracket in Raytown
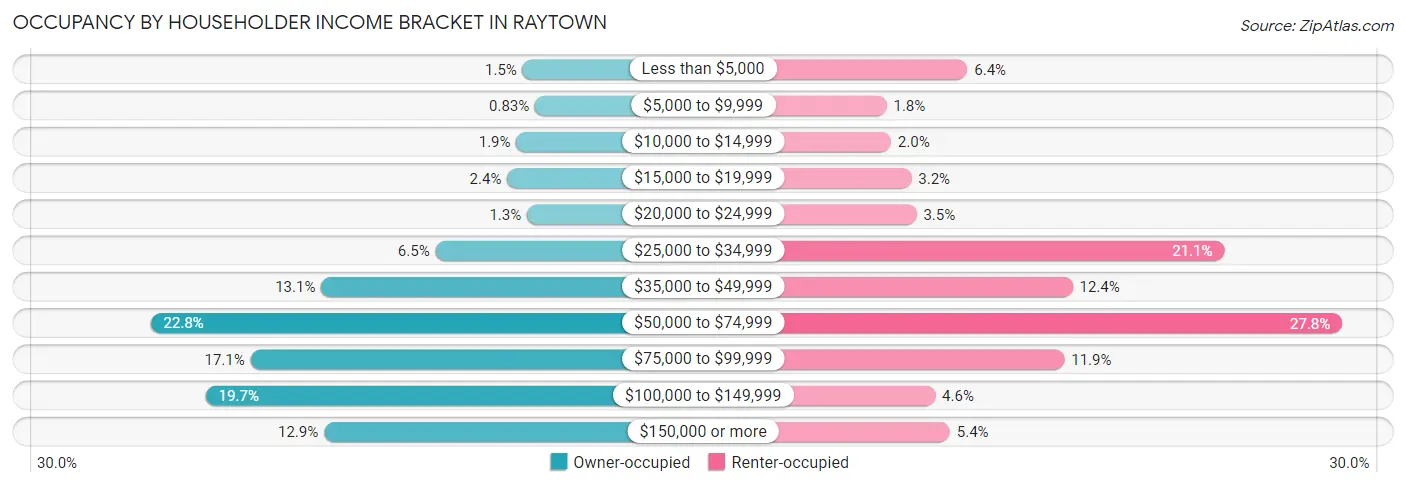
| Income Bracket | Owner-occupied | Renter-occupied |
| Less than $5,000 | 124 (1.5%) | 288 (6.4%) |
| $5,000 to $9,999 | 67 (0.8%) | 80 (1.8%) |
| $10,000 to $14,999 | 153 (1.9%) | 91 (2.0%) |
| $15,000 to $19,999 | 195 (2.4%) | 144 (3.2%) |
| $20,000 to $24,999 | 104 (1.3%) | 157 (3.5%) |
| $25,000 to $34,999 | 525 (6.5%) | 950 (21.1%) |
| $35,000 to $49,999 | 1,051 (13.1%) | 559 (12.4%) |
| $50,000 to $74,999 | 1,837 (22.8%) | 1,253 (27.8%) |
| $75,000 to $99,999 | 1,376 (17.1%) | 538 (11.9%) |
| $100,000 to $149,999 | 1,583 (19.7%) | 205 (4.5%) |
| $150,000 or more | 1,038 (12.9%) | 243 (5.4%) |
| Total | 8,053 (100.0%) | 4,508 (100.0%) |
Monthly Housing Cost Tiers in Raytown
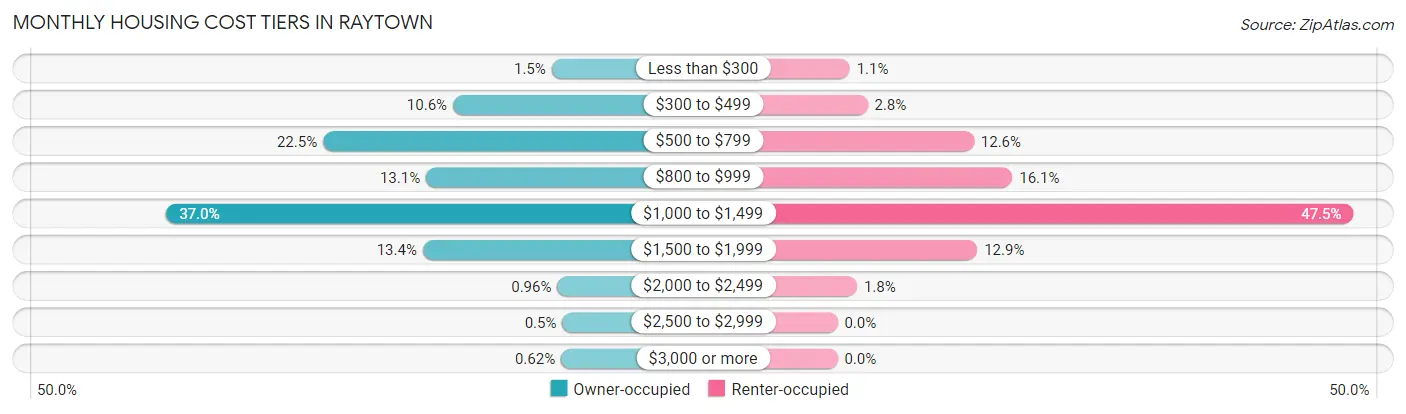
| Monthly Cost | Owner-occupied | Renter-occupied |
| Less than $300 | 119 (1.5%) | 51 (1.1%) |
| $300 to $499 | 851 (10.6%) | 125 (2.8%) |
| $500 to $799 | 1,814 (22.5%) | 566 (12.6%) |
| $800 to $999 | 1,051 (13.1%) | 726 (16.1%) |
| $1,000 to $1,499 | 2,976 (37.0%) | 2,141 (47.5%) |
| $1,500 to $1,999 | 1,075 (13.4%) | 580 (12.9%) |
| $2,000 to $2,499 | 77 (1.0%) | 81 (1.8%) |
| $2,500 to $2,999 | 40 (0.5%) | 0 (0.0%) |
| $3,000 or more | 50 (0.6%) | 0 (0.0%) |
| Total | 8,053 (100.0%) | 4,508 (100.0%) |
Physical Housing Characteristics in Raytown
Housing Structures in Raytown
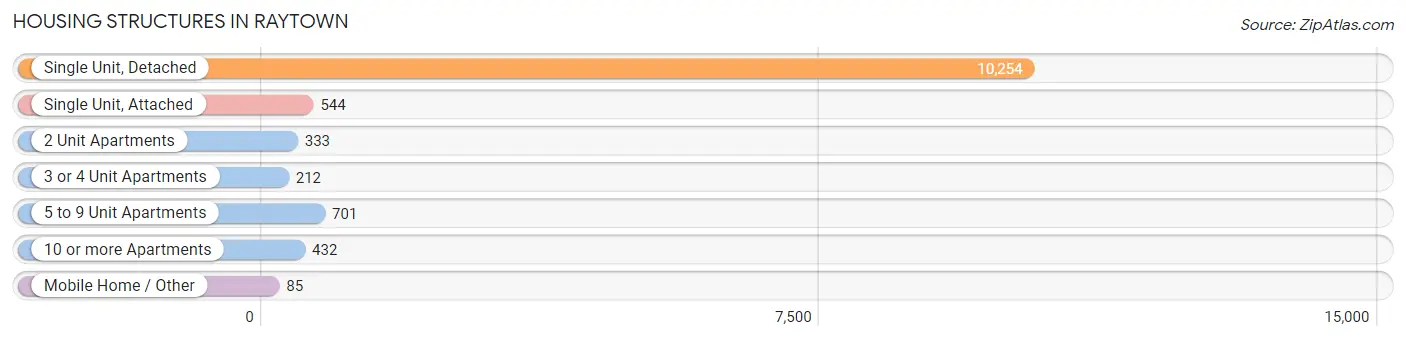
| Structure Type | # Housing Units | % Housing Units |
| Single Unit, Detached | 10,254 | 81.6% |
| Single Unit, Attached | 544 | 4.3% |
| 2 Unit Apartments | 333 | 2.6% |
| 3 or 4 Unit Apartments | 212 | 1.7% |
| 5 to 9 Unit Apartments | 701 | 5.6% |
| 10 or more Apartments | 432 | 3.4% |
| Mobile Home / Other | 85 | 0.7% |
| Total | 12,561 | 100.0% |
Housing Structures by Occupancy in Raytown
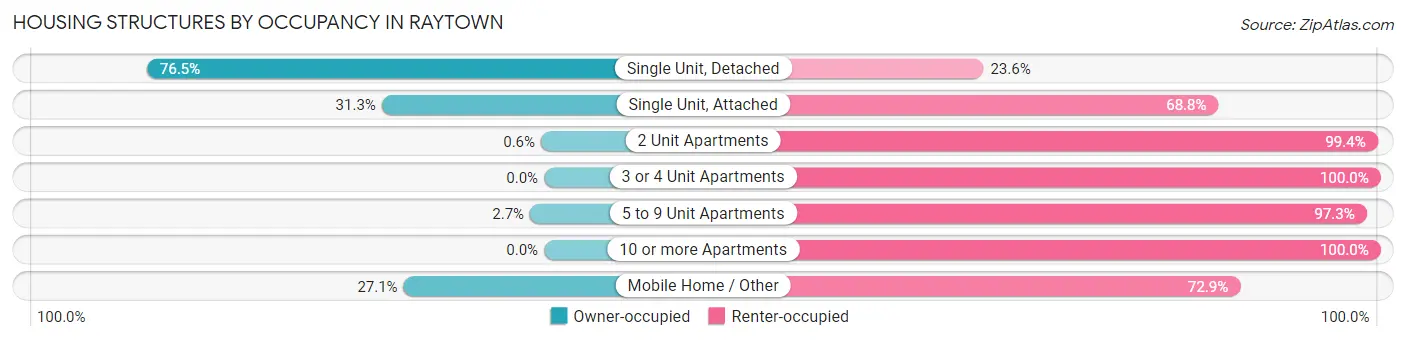
| Structure Type | Owner-occupied | Renter-occupied |
| Single Unit, Detached | 7,839 (76.4%) | 2,415 (23.5%) |
| Single Unit, Attached | 170 (31.2%) | 374 (68.8%) |
| 2 Unit Apartments | 2 (0.6%) | 331 (99.4%) |
| 3 or 4 Unit Apartments | 0 (0.0%) | 212 (100.0%) |
| 5 to 9 Unit Apartments | 19 (2.7%) | 682 (97.3%) |
| 10 or more Apartments | 0 (0.0%) | 432 (100.0%) |
| Mobile Home / Other | 23 (27.1%) | 62 (72.9%) |
| Total | 8,053 (64.1%) | 4,508 (35.9%) |
Housing Structures by Number of Rooms in Raytown
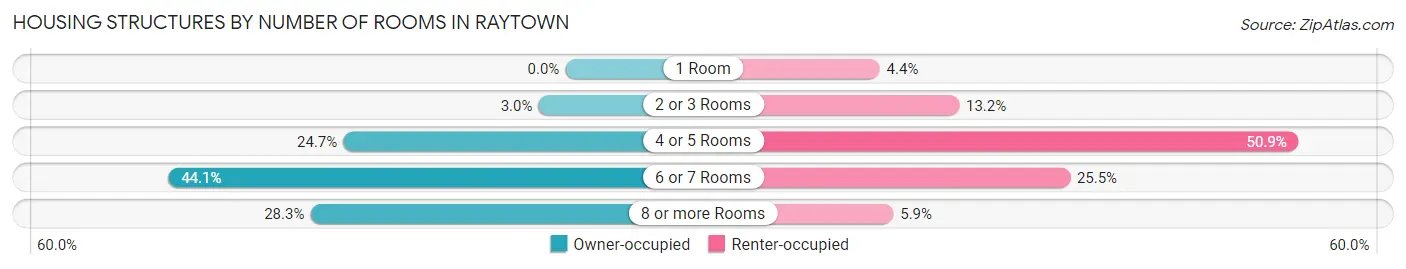
| Number of Rooms | Owner-occupied | Renter-occupied |
| 1 Room | 0 (0.0%) | 199 (4.4%) |
| 2 or 3 Rooms | 241 (3.0%) | 596 (13.2%) |
| 4 or 5 Rooms | 1,985 (24.6%) | 2,295 (50.9%) |
| 6 or 7 Rooms | 3,548 (44.1%) | 1,151 (25.5%) |
| 8 or more Rooms | 2,279 (28.3%) | 267 (5.9%) |
| Total | 8,053 (100.0%) | 4,508 (100.0%) |
Housing Structure by Heating Type in Raytown
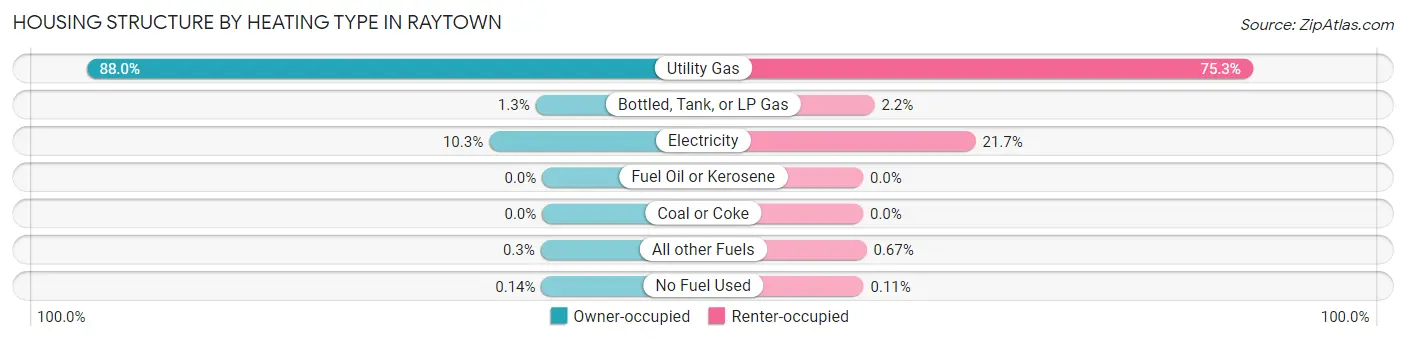
| Heating Type | Owner-occupied | Renter-occupied |
| Utility Gas | 7,089 (88.0%) | 3,393 (75.3%) |
| Bottled, Tank, or LP Gas | 103 (1.3%) | 100 (2.2%) |
| Electricity | 826 (10.3%) | 980 (21.7%) |
| Fuel Oil or Kerosene | 0 (0.0%) | 0 (0.0%) |
| Coal or Coke | 0 (0.0%) | 0 (0.0%) |
| All other Fuels | 24 (0.3%) | 30 (0.7%) |
| No Fuel Used | 11 (0.1%) | 5 (0.1%) |
| Total | 8,053 (100.0%) | 4,508 (100.0%) |
Household Vehicle Usage in Raytown
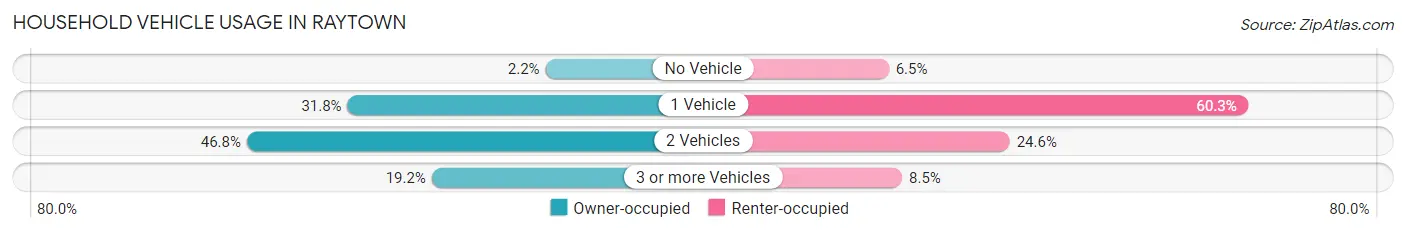
| Vehicles per Household | Owner-occupied | Renter-occupied |
| No Vehicle | 178 (2.2%) | 295 (6.5%) |
| 1 Vehicle | 2,559 (31.8%) | 2,718 (60.3%) |
| 2 Vehicles | 3,770 (46.8%) | 1,110 (24.6%) |
| 3 or more Vehicles | 1,546 (19.2%) | 385 (8.5%) |
| Total | 8,053 (100.0%) | 4,508 (100.0%) |
Real Estate & Mortgages in Raytown
Real Estate and Mortgage Overview in Raytown
| Characteristic | Without Mortgage | With Mortgage |
| Housing Units | 2,514 | 5,539 |
| Median Property Value | $157,600 | $154,300 |
| Median Household Income | $61,401 | $666 |
| Monthly Housing Costs | $562 | $50 |
| Real Estate Taxes | $2,085 | $169 |
Property Value by Mortgage Status in Raytown
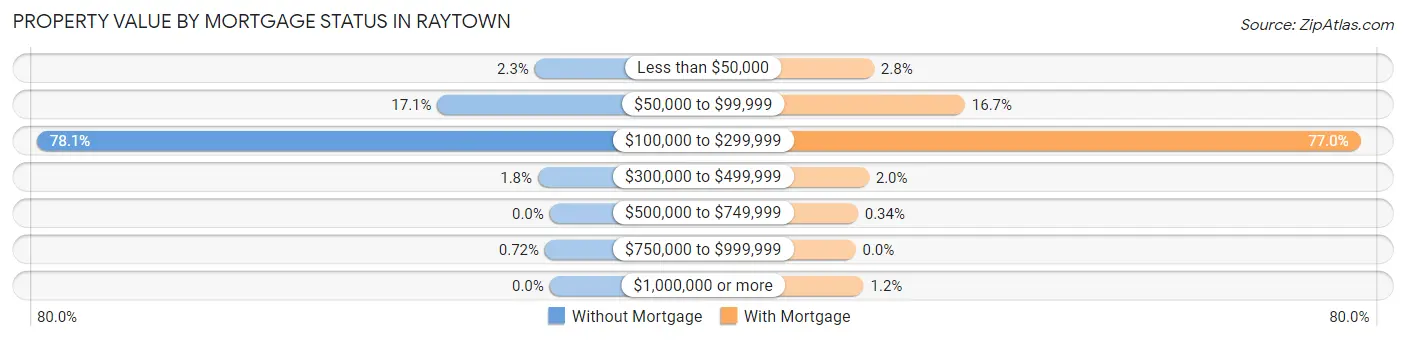
| Property Value | Without Mortgage | With Mortgage |
| Less than $50,000 | 57 (2.3%) | 155 (2.8%) |
| $50,000 to $99,999 | 430 (17.1%) | 923 (16.7%) |
| $100,000 to $299,999 | 1,964 (78.1%) | 4,262 (76.9%) |
| $300,000 to $499,999 | 45 (1.8%) | 112 (2.0%) |
| $500,000 to $749,999 | 0 (0.0%) | 19 (0.3%) |
| $750,000 to $999,999 | 18 (0.7%) | 0 (0.0%) |
| $1,000,000 or more | 0 (0.0%) | 68 (1.2%) |
| Total | 2,514 (100.0%) | 5,539 (100.0%) |
Household Income by Mortgage Status in Raytown
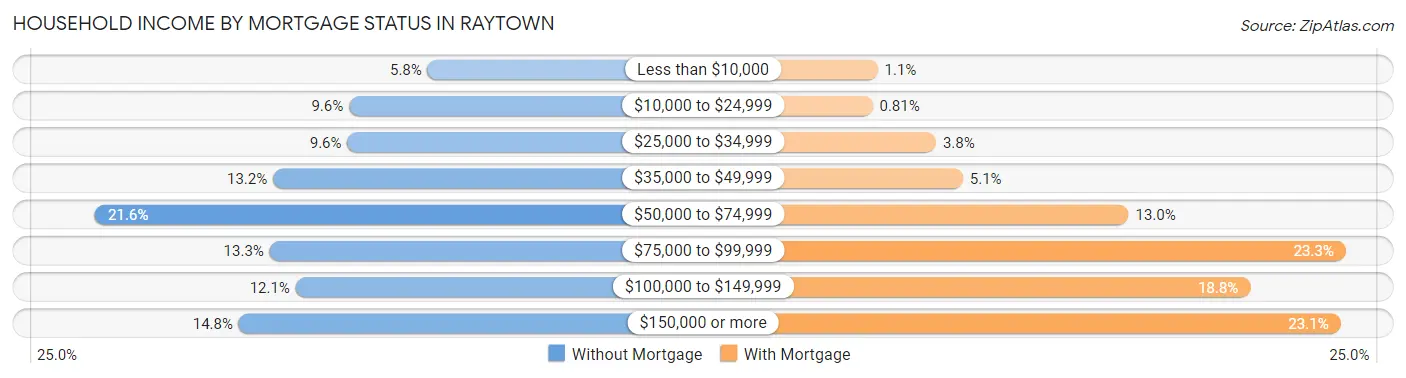
| Household Income | Without Mortgage | With Mortgage |
| Less than $10,000 | 146 (5.8%) | 58 (1.1%) |
| $10,000 to $24,999 | 240 (9.6%) | 45 (0.8%) |
| $25,000 to $34,999 | 242 (9.6%) | 212 (3.8%) |
| $35,000 to $49,999 | 331 (13.2%) | 283 (5.1%) |
| $50,000 to $74,999 | 544 (21.6%) | 720 (13.0%) |
| $75,000 to $99,999 | 335 (13.3%) | 1,293 (23.3%) |
| $100,000 to $149,999 | 304 (12.1%) | 1,041 (18.8%) |
| $150,000 or more | 372 (14.8%) | 1,279 (23.1%) |
| Total | 2,514 (100.0%) | 5,539 (100.0%) |
Property Value to Household Income Ratio in Raytown
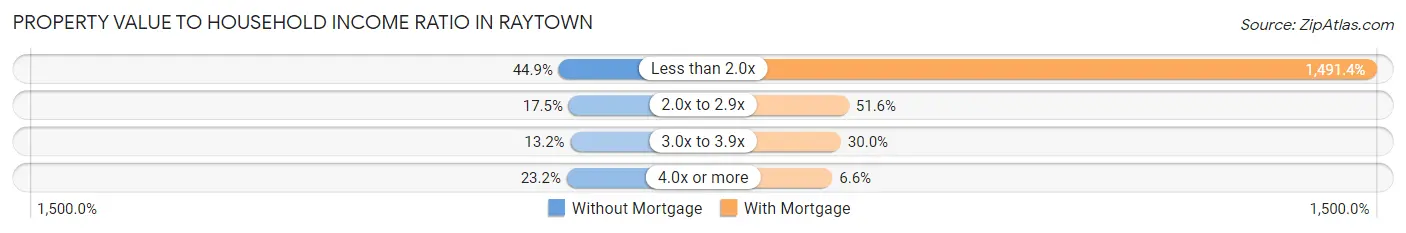
| Value-to-Income Ratio | Without Mortgage | With Mortgage |
| Less than 2.0x | 1,129 (44.9%) | 82,610 (1,491.4%) |
| 2.0x to 2.9x | 441 (17.5%) | 2,860 (51.6%) |
| 3.0x to 3.9x | 331 (13.2%) | 1,659 (29.9%) |
| 4.0x or more | 583 (23.2%) | 367 (6.6%) |
| Total | 2,514 (100.0%) | 5,539 (100.0%) |
Real Estate Taxes by Mortgage Status in Raytown
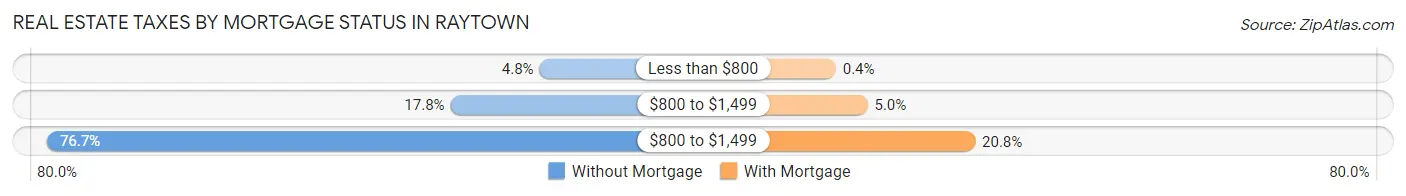
| Property Taxes | Without Mortgage | With Mortgage |
| Less than $800 | 120 (4.8%) | 22 (0.4%) |
| $800 to $1,499 | 447 (17.8%) | 279 (5.0%) |
| $800 to $1,499 | 1,929 (76.7%) | 1,150 (20.8%) |
| Total | 2,514 (100.0%) | 5,539 (100.0%) |
Health & Disability in Raytown
Health Insurance Coverage by Age in Raytown
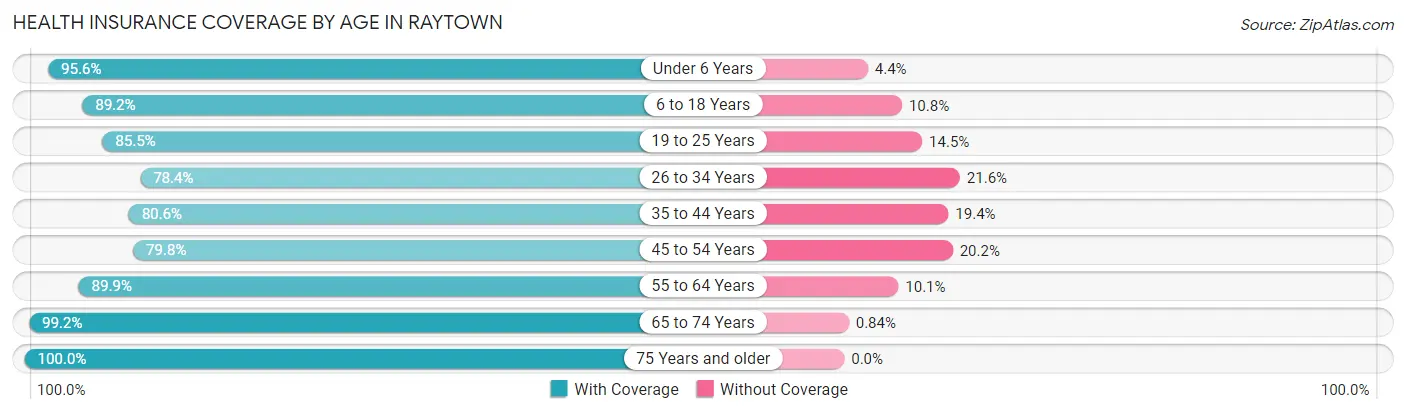
| Age Bracket | With Coverage | Without Coverage |
| Under 6 Years | 2,093 (95.6%) | 96 (4.4%) |
| 6 to 18 Years | 3,922 (89.2%) | 473 (10.8%) |
| 19 to 25 Years | 2,113 (85.5%) | 359 (14.5%) |
| 26 to 34 Years | 2,729 (78.4%) | 750 (21.6%) |
| 35 to 44 Years | 2,912 (80.6%) | 702 (19.4%) |
| 45 to 54 Years | 3,160 (79.8%) | 801 (20.2%) |
| 55 to 64 Years | 3,677 (89.9%) | 412 (10.1%) |
| 65 to 74 Years | 2,836 (99.2%) | 24 (0.8%) |
| 75 Years and older | 2,262 (100.0%) | 0 (0.0%) |
| Total | 25,704 (87.7%) | 3,617 (12.3%) |
Health Insurance Coverage by Citizenship Status in Raytown
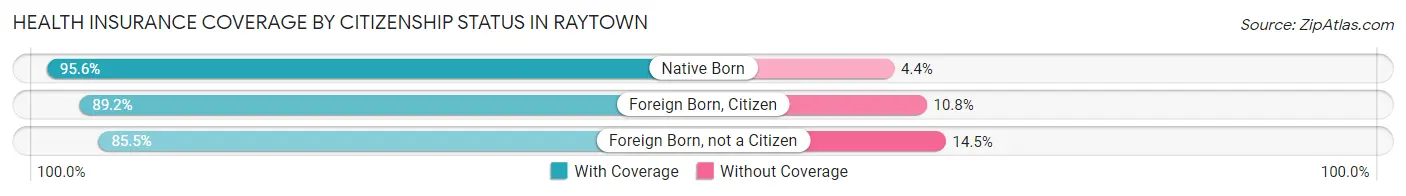
| Citizenship Status | With Coverage | Without Coverage |
| Native Born | 2,093 (95.6%) | 96 (4.4%) |
| Foreign Born, Citizen | 3,922 (89.2%) | 473 (10.8%) |
| Foreign Born, not a Citizen | 2,113 (85.5%) | 359 (14.5%) |
Health Insurance Coverage by Household Income in Raytown
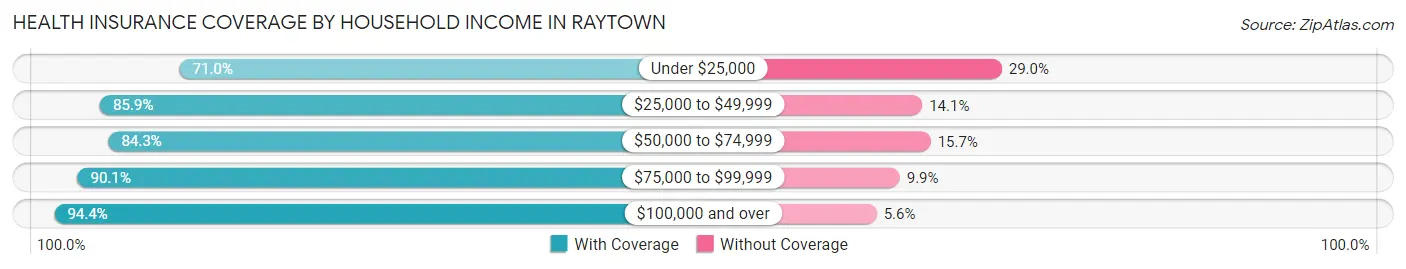
| Household Income | With Coverage | Without Coverage |
| Under $25,000 | 1,940 (71.0%) | 794 (29.0%) |
| $25,000 to $49,999 | 4,528 (85.9%) | 745 (14.1%) |
| $50,000 to $74,999 | 5,655 (84.3%) | 1,055 (15.7%) |
| $75,000 to $99,999 | 4,182 (90.1%) | 461 (9.9%) |
| $100,000 and over | 9,371 (94.4%) | 556 (5.6%) |
Public vs Private Health Insurance Coverage by Age in Raytown
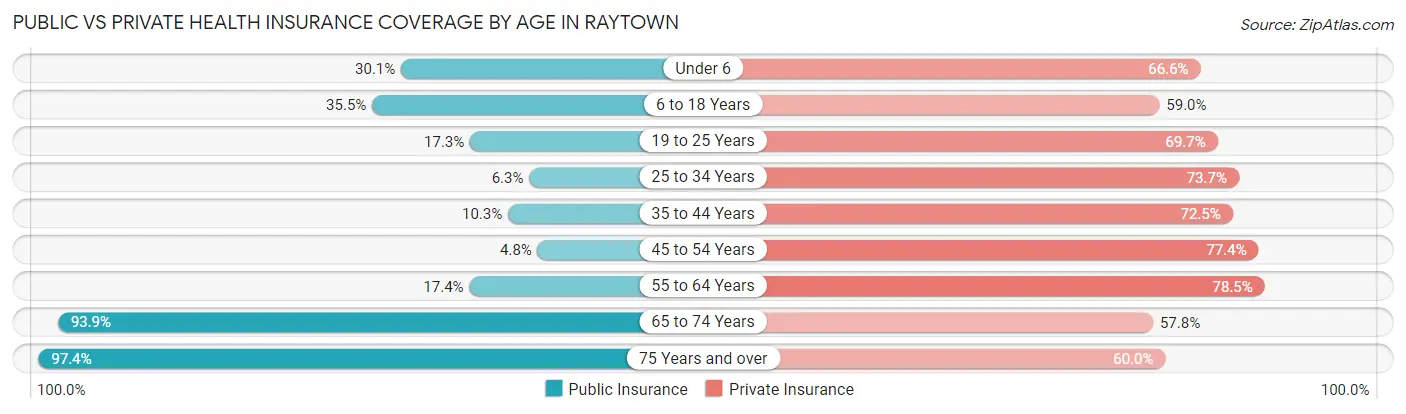
| Age Bracket | Public Insurance | Private Insurance |
| Under 6 | 659 (30.1%) | 1,457 (66.6%) |
| 6 to 18 Years | 1,560 (35.5%) | 2,591 (59.0%) |
| 19 to 25 Years | 428 (17.3%) | 1,724 (69.7%) |
| 25 to 34 Years | 220 (6.3%) | 2,563 (73.7%) |
| 35 to 44 Years | 371 (10.3%) | 2,621 (72.5%) |
| 45 to 54 Years | 189 (4.8%) | 3,064 (77.3%) |
| 55 to 64 Years | 713 (17.4%) | 3,209 (78.5%) |
| 65 to 74 Years | 2,684 (93.9%) | 1,652 (57.8%) |
| 75 Years and over | 2,204 (97.4%) | 1,358 (60.0%) |
| Total | 9,028 (30.8%) | 20,239 (69.0%) |
Disability Status by Sex by Age in Raytown
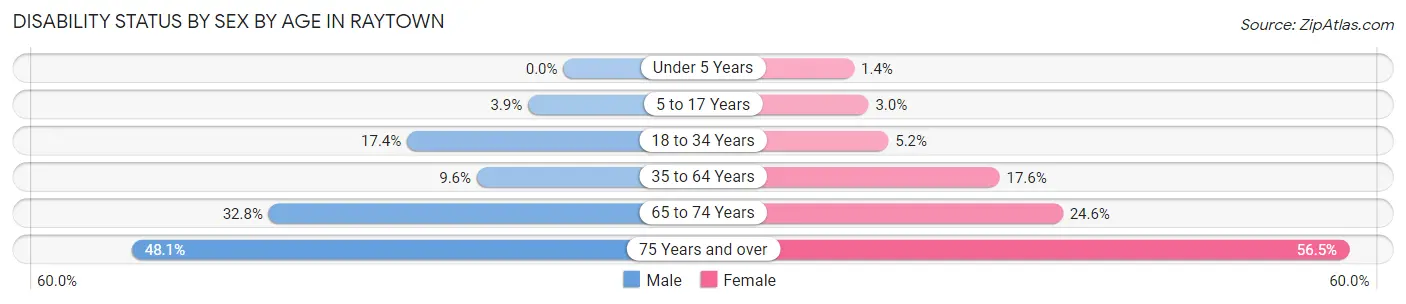
| Age Bracket | Male | Female |
| Under 5 Years | 0 (0.0%) | 15 (1.4%) |
| 5 to 17 Years | 84 (3.9%) | 71 (3.0%) |
| 18 to 34 Years | 600 (17.4%) | 147 (5.2%) |
| 35 to 64 Years | 563 (9.6%) | 1,022 (17.6%) |
| 65 to 74 Years | 461 (32.8%) | 358 (24.6%) |
| 75 Years and over | 482 (48.1%) | 711 (56.5%) |
Disability Class by Sex by Age in Raytown
Disability Class: Hearing Difficulty
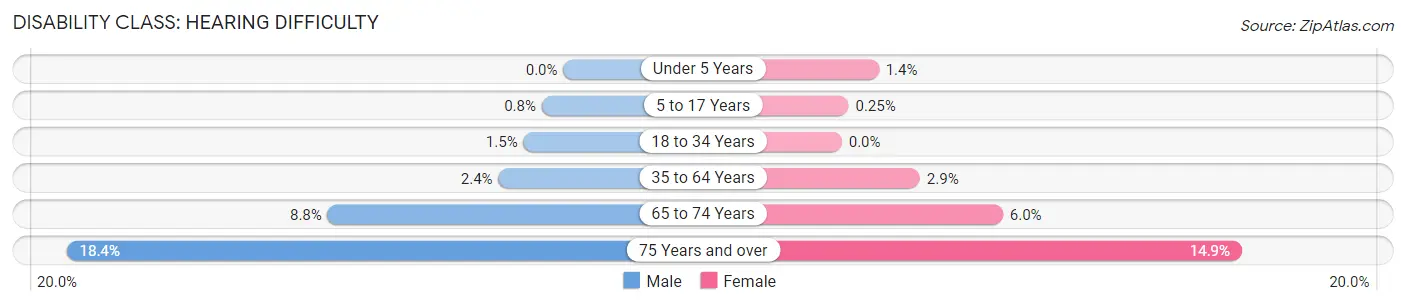
| Age Bracket | Male | Female |
| Under 5 Years | 0 (0.0%) | 15 (1.4%) |
| 5 to 17 Years | 17 (0.8%) | 6 (0.3%) |
| 18 to 34 Years | 51 (1.5%) | 0 (0.0%) |
| 35 to 64 Years | 141 (2.4%) | 169 (2.9%) |
| 65 to 74 Years | 123 (8.7%) | 87 (6.0%) |
| 75 Years and over | 185 (18.4%) | 187 (14.8%) |
Disability Class: Vision Difficulty
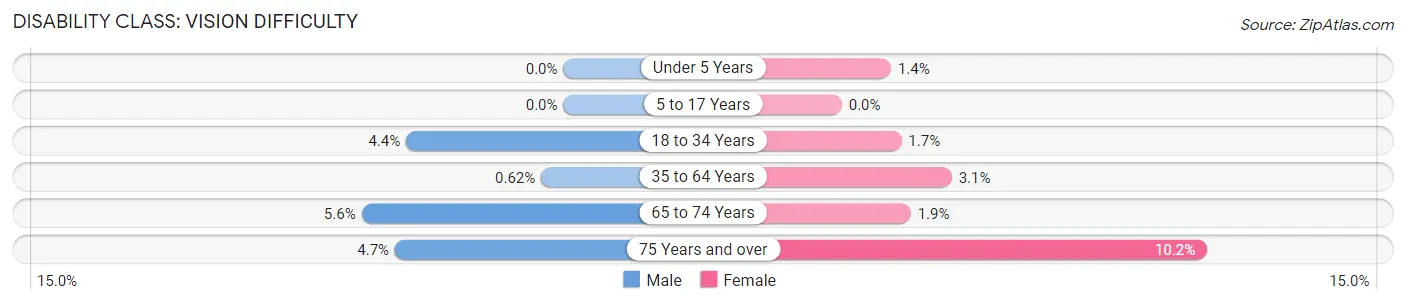
| Age Bracket | Male | Female |
| Under 5 Years | 0 (0.0%) | 15 (1.4%) |
| 5 to 17 Years | 0 (0.0%) | 0 (0.0%) |
| 18 to 34 Years | 151 (4.4%) | 47 (1.7%) |
| 35 to 64 Years | 36 (0.6%) | 178 (3.1%) |
| 65 to 74 Years | 79 (5.6%) | 28 (1.9%) |
| 75 Years and over | 47 (4.7%) | 128 (10.2%) |
Disability Class: Cognitive Difficulty
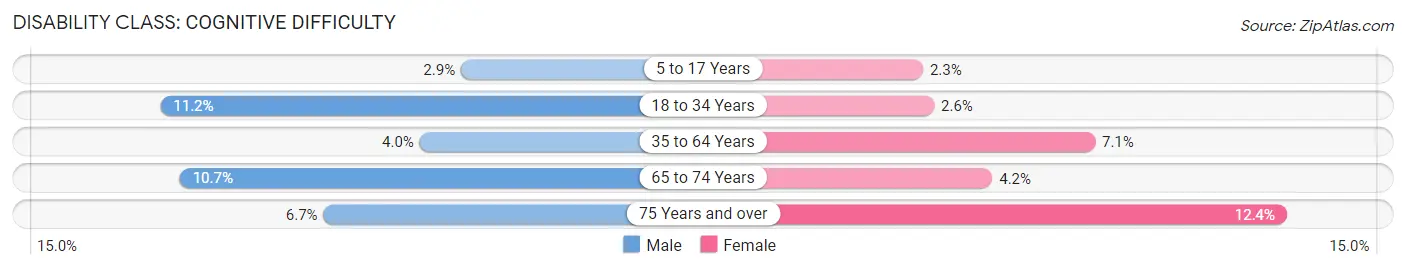
| Age Bracket | Male | Female |
| 5 to 17 Years | 61 (2.9%) | 54 (2.3%) |
| 18 to 34 Years | 387 (11.2%) | 73 (2.6%) |
| 35 to 64 Years | 234 (4.0%) | 410 (7.0%) |
| 65 to 74 Years | 150 (10.7%) | 61 (4.2%) |
| 75 Years and over | 67 (6.7%) | 156 (12.4%) |
Disability Class: Ambulatory Difficulty
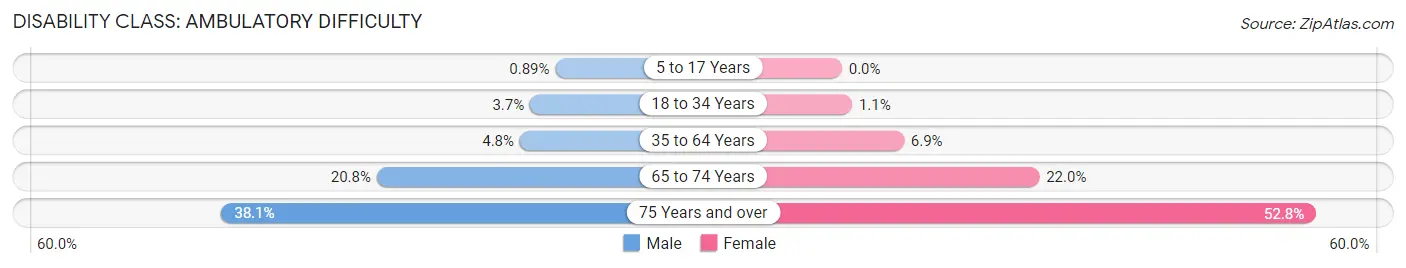
| Age Bracket | Male | Female |
| 5 to 17 Years | 19 (0.9%) | 0 (0.0%) |
| 18 to 34 Years | 128 (3.7%) | 32 (1.1%) |
| 35 to 64 Years | 283 (4.8%) | 402 (6.9%) |
| 65 to 74 Years | 292 (20.8%) | 320 (22.0%) |
| 75 Years and over | 382 (38.1%) | 665 (52.8%) |
Disability Class: Self-Care Difficulty
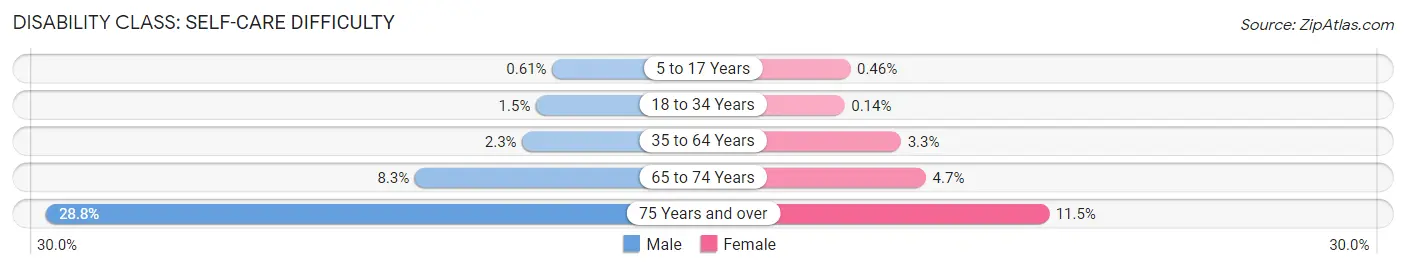
| Age Bracket | Male | Female |
| 5 to 17 Years | 13 (0.6%) | 11 (0.5%) |
| 18 to 34 Years | 52 (1.5%) | 4 (0.1%) |
| 35 to 64 Years | 133 (2.3%) | 191 (3.3%) |
| 65 to 74 Years | 116 (8.3%) | 68 (4.7%) |
| 75 Years and over | 289 (28.8%) | 145 (11.5%) |
Technology Access in Raytown
Computing Device Access in Raytown
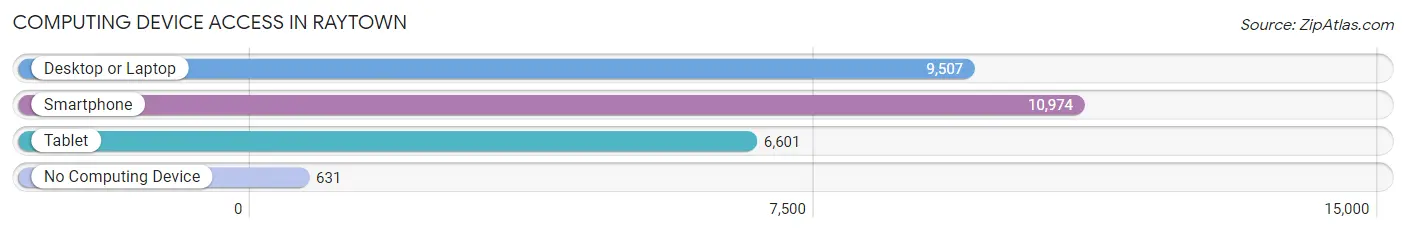
| Device Type | # Households | % Households |
| Desktop or Laptop | 9,507 | 75.7% |
| Smartphone | 10,974 | 87.4% |
| Tablet | 6,601 | 52.5% |
| No Computing Device | 631 | 5.0% |
| Total | 12,561 | 100.0% |
Internet Access in Raytown
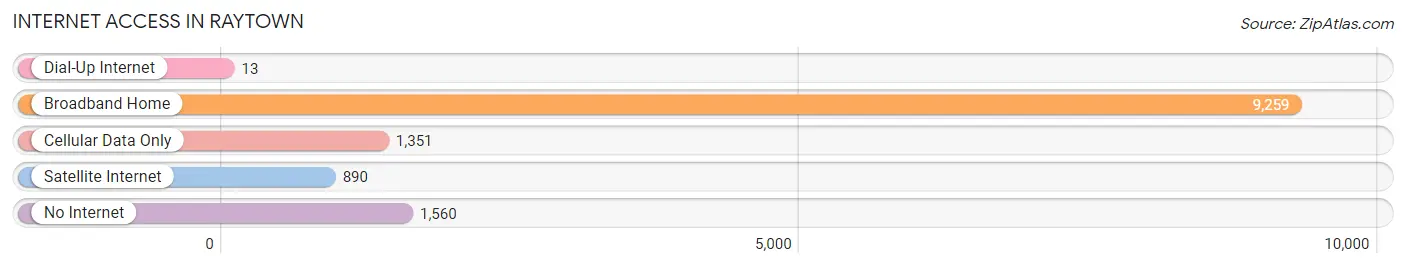
| Internet Type | # Households | % Households |
| Dial-Up Internet | 13 | 0.1% |
| Broadband Home | 9,259 | 73.7% |
| Cellular Data Only | 1,351 | 10.8% |
| Satellite Internet | 890 | 7.1% |
| No Internet | 1,560 | 12.4% |
| Total | 12,561 | 100.0% |
Raytown Summary
History
The area now known as Raytown, Missouri was first settled in the early 1800s by a group of settlers from Kentucky. The area was originally known as “Ray’s Town” after the first settler, John Ray. The town was officially incorporated in 1908 and was named after Ray.
Raytown was a small farming community until the 1950s when it began to experience rapid growth due to its proximity to Kansas City. The population of Raytown grew from 1,000 in 1950 to over 30,000 by the year 2000.
The city has a rich history of civil rights activism. In the 1950s, Raytown was the site of several protests against segregation in the local schools. In the 1960s, Raytown was the site of a major civil rights march led by Dr. Martin Luther King Jr.
Geography
Raytown is located in Jackson County, Missouri, just south of Kansas City. The city is situated on the Missouri River and is bordered by the cities of Grandview, Lee’s Summit, and Independence.
The city has a total area of 16.2 square miles, of which 15.9 square miles is land and 0.3 square miles is water. The city is located at an elevation of 890 feet above sea level.
Economy
Raytown’s economy is largely based on retail and services. The city is home to several large retail stores, including Walmart, Target, and Home Depot. The city also has a number of restaurants, banks, and other businesses.
The city is also home to several large employers, including the University of Missouri-Kansas City, the Kansas City Chiefs, and the Kansas City Royals.
Demographics
As of the 2010 census, the population of Raytown was 29,526. The racial makeup of the city was 79.2% White, 14.3% African American, 0.5% Native American, 1.7% Asian, 0.1% Pacific Islander, 1.7% from other races, and 2.5% from two or more races. Hispanic or Latino of any race were 4.3% of the population.
The median income for a household in Raytown was $45,945, and the median income for a family was $54,945. The per capita income for the city was $22,845. About 8.3% of families and 10.7% of the population were below the poverty line, including 15.2% of those under age 18 and 6.2% of those age 65 or over.
Common Questions
What is Per Capita Income in Raytown?
Per Capita income in Raytown is $33,081.
What is the Median Family Income in Raytown?
Median Family Income in Raytown is $79,514.
What is the Median Household income in Raytown?
Median Household Income in Raytown is $64,542.
What is Income or Wage Gap in Raytown?
Income or Wage Gap in Raytown is 16.3%.
Women in Raytown earn 83.7 cents for every dollar earned by a man.
What is Family Income Deficit in Raytown?
Family Income Deficit in Raytown is $11,375.
Families that are below poverty line in Raytown earn $11,375 less on average than the poverty threshold level.
What is Inequality or Gini Index in Raytown?
Inequality or Gini Index in Raytown is 0.37.
What is the Total Population of Raytown?
Total Population of Raytown is 29,772.
What is the Total Male Population of Raytown?
Total Male Population of Raytown is 14,729.
What is the Total Female Population of Raytown?
Total Female Population of Raytown is 15,043.
What is the Ratio of Males per 100 Females in Raytown?
There are 97.91 Males per 100 Females in Raytown.
What is the Ratio of Females per 100 Males in Raytown?
There are 102.13 Females per 100 Males in Raytown.
What is the Median Population Age in Raytown?
Median Population Age in Raytown is 41.4 Years.
What is the Average Family Size in Raytown
Average Family Size in Raytown is 3.0 People.
What is the Average Household Size in Raytown
Average Household Size in Raytown is 2.3 People.
How Large is the Labor Force in Raytown?
There are 16,627 People in the Labor Forcein in Raytown.
What is the Percentage of People in the Labor Force in Raytown?
69.3% of People are in the Labor Force in Raytown.
What is the Unemployment Rate in Raytown?
Unemployment Rate in Raytown is 5.2%.