Duncan, OK Map & Demographics
Duncan Map
Duncan Overview
$30,634
PER CAPITA INCOME
$67,341
AVG FAMILY INCOME
$55,162
AVG HOUSEHOLD INCOME
37.1%
WAGE / INCOME GAP [ % ]
62.9¢/ $1
WAGE / INCOME GAP [ $ ]
$12,882
FAMILY INCOME DEFICIT
0.47
INEQUALITY / GINI INDEX
22,759
TOTAL POPULATION
10,996
MALE POPULATION
11,763
FEMALE POPULATION
93.48
MALES / 100 FEMALES
106.98
FEMALES / 100 MALES
39.7
MEDIAN AGE
3.0
AVG FAMILY SIZE
2.4
AVG HOUSEHOLD SIZE
10,057
LABOR FORCE [ PEOPLE ]
55.0%
PERCENT IN LABOR FORCE
5.2%
UNEMPLOYMENT RATE
Duncan Zip Codes
Duncan Area Codes
Income in Duncan
Income Overview in Duncan
Per Capita Income in Duncan is $30,634, while median incomes of families and households are $67,341 and $55,162 respectively.
| Characteristic | Number | Measure |
| Per Capita Income | 22,759 | $30,634 |
| Median Family Income | 5,914 | $67,341 |
| Mean Family Income | 5,914 | $85,311 |
| Median Household Income | 9,231 | $55,162 |
| Mean Household Income | 9,231 | $72,567 |
| Income Deficit | 5,914 | $12,882 |
| Wage / Income Gap (%) | 22,759 | 37.07% |
| Wage / Income Gap ($) | 22,759 | 62.93¢ per $1 |
| Gini / Inequality Index | 22,759 | 0.47 |
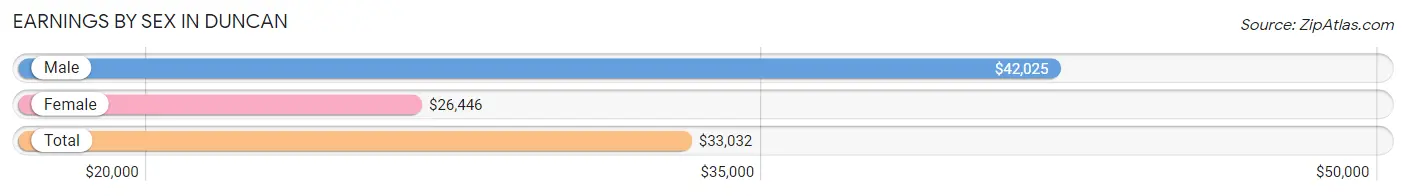
Earnings by Sex in Duncan
Average Earnings in Duncan are $33,032, $42,025 for men and $26,446 for women, a difference of 37.1%.
| Sex | Number | Average Earnings |
| Male | 5,679 (54.2%) | $42,025 |
| Female | 4,792 (45.8%) | $26,446 |
| Total | 10,471 (100.0%) | $33,032 |
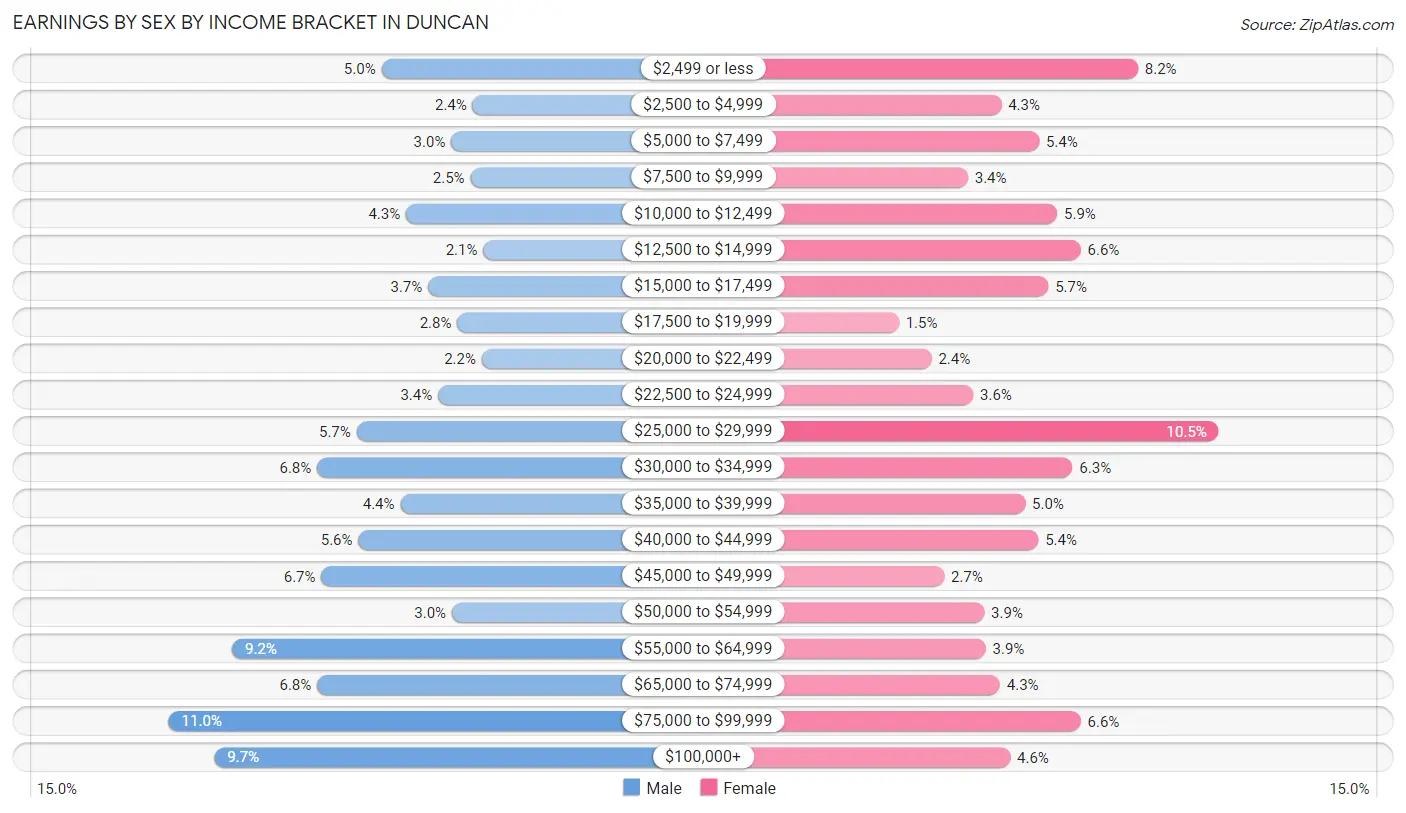
Earnings by Sex by Income Bracket in Duncan
The most common earnings brackets in Duncan are $75,000 to $99,999 for men (622 | 11.0%) and $25,000 to $29,999 for women (501 | 10.4%).
| Income | Male | Female |
| $2,499 or less | 282 (5.0%) | 392 (8.2%) |
| $2,500 to $4,999 | 137 (2.4%) | 208 (4.3%) |
| $5,000 to $7,499 | 171 (3.0%) | 259 (5.4%) |
| $7,500 to $9,999 | 140 (2.5%) | 163 (3.4%) |
| $10,000 to $12,499 | 243 (4.3%) | 283 (5.9%) |
| $12,500 to $14,999 | 120 (2.1%) | 315 (6.6%) |
| $15,000 to $17,499 | 208 (3.7%) | 271 (5.7%) |
| $17,500 to $19,999 | 161 (2.8%) | 70 (1.5%) |
| $20,000 to $22,499 | 122 (2.1%) | 114 (2.4%) |
| $22,500 to $24,999 | 192 (3.4%) | 170 (3.5%) |
| $25,000 to $29,999 | 322 (5.7%) | 501 (10.4%) |
| $30,000 to $34,999 | 385 (6.8%) | 304 (6.3%) |
| $35,000 to $39,999 | 252 (4.4%) | 240 (5.0%) |
| $40,000 to $44,999 | 319 (5.6%) | 258 (5.4%) |
| $45,000 to $49,999 | 378 (6.7%) | 131 (2.7%) |
| $50,000 to $54,999 | 170 (3.0%) | 185 (3.9%) |
| $55,000 to $64,999 | 521 (9.2%) | 187 (3.9%) |
| $65,000 to $74,999 | 385 (6.8%) | 206 (4.3%) |
| $75,000 to $99,999 | 622 (11.0%) | 315 (6.6%) |
| $100,000+ | 549 (9.7%) | 220 (4.6%) |
| Total | 5,679 (100.0%) | 4,792 (100.0%) |
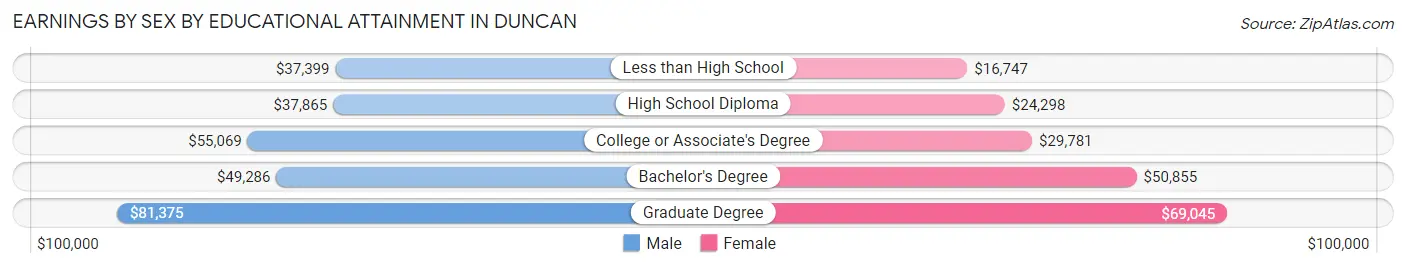
Earnings by Sex by Educational Attainment in Duncan
Average earnings in Duncan are $45,000 for men and $29,790 for women, a difference of 33.8%. Men with an educational attainment of graduate degree enjoy the highest average annual earnings of $81,375, while those with less than high school education earn the least with $37,399. Women with an educational attainment of graduate degree earn the most with the average annual earnings of $69,045, while those with less than high school education have the smallest earnings of $16,747.
| Educational Attainment | Male Income | Female Income |
| Less than High School | $37,399 | $16,747 |
| High School Diploma | $37,865 | $24,298 |
| College or Associate's Degree | $55,069 | $29,781 |
| Bachelor's Degree | $49,286 | $50,855 |
| Graduate Degree | $81,375 | $69,045 |
| Total | $45,000 | $29,790 |
Family Income in Duncan
Family Income Brackets in Duncan
According to the Duncan family income data, there are 1,230 families falling into the $50,000 to $74,999 income range, which is the most common income bracket and makes up 20.8% of all families. Conversely, the $10,000 to $14,999 income bracket is the least frequent group with only 148 families (2.5%) belonging to this category.
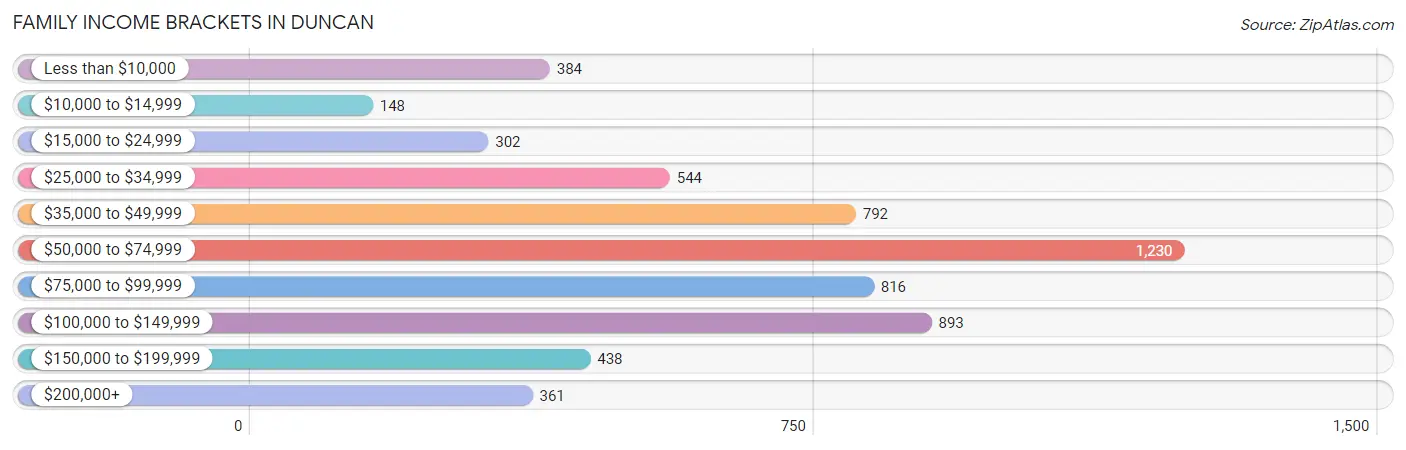
| Income Bracket | # Families | % Families |
| Less than $10,000 | 384 | 6.5% |
| $10,000 to $14,999 | 148 | 2.5% |
| $15,000 to $24,999 | 302 | 5.1% |
| $25,000 to $34,999 | 544 | 9.2% |
| $35,000 to $49,999 | 792 | 13.4% |
| $50,000 to $74,999 | 1,230 | 20.8% |
| $75,000 to $99,999 | 816 | 13.8% |
| $100,000 to $149,999 | 893 | 15.1% |
| $150,000 to $199,999 | 438 | 7.4% |
| $200,000+ | 361 | 6.1% |
Family Income by Famaliy Size in Duncan
7+ person families (55 | 0.9%) account for the highest median family income in Duncan with $89,648 per family, while 2-person families (3,046 | 51.5%) have the highest median income of $34,780 per family member.
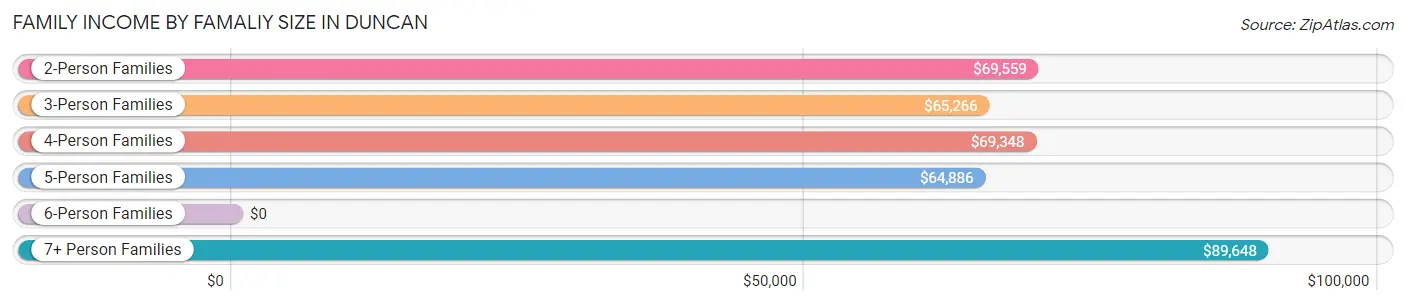
| Income Bracket | # Families | Median Income |
| 2-Person Families | 3,046 (51.5%) | $69,559 |
| 3-Person Families | 1,197 (20.2%) | $65,266 |
| 4-Person Families | 1,068 (18.1%) | $69,348 |
| 5-Person Families | 440 (7.4%) | $64,886 |
| 6-Person Families | 108 (1.8%) | $0 |
| 7+ Person Families | 55 (0.9%) | $89,648 |
| Total | 5,914 (100.0%) | $67,341 |
Family Income by Number of Earners in Duncan
The median family income in Duncan is $67,341, with families comprising 3+ earners (367) having the highest median family income of $138,856, while families with no earners (1,161) have the lowest median family income of $45,844, accounting for 6.2% and 19.6% of families, respectively.
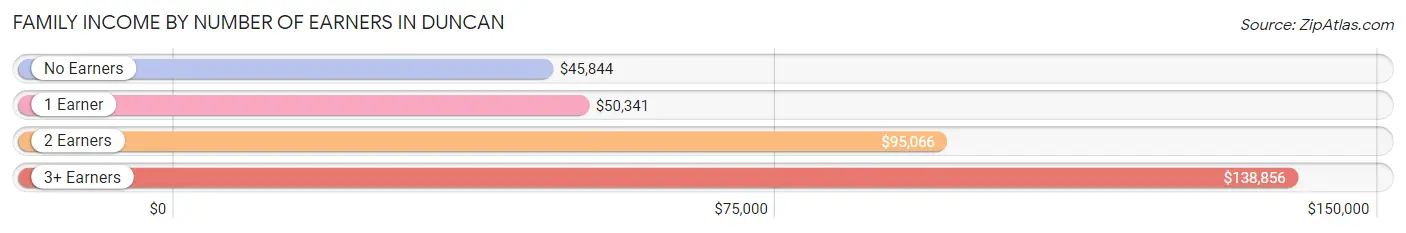
| Number of Earners | # Families | Median Income |
| No Earners | 1,161 (19.6%) | $45,844 |
| 1 Earner | 2,388 (40.4%) | $50,341 |
| 2 Earners | 1,998 (33.8%) | $95,066 |
| 3+ Earners | 367 (6.2%) | $138,856 |
| Total | 5,914 (100.0%) | $67,341 |
Household Income in Duncan
Household Income Brackets in Duncan
With 1,662 households falling in the category, the $50,000 to $74,999 income range is the most frequent in Duncan, accounting for 18.0% of all households. In contrast, only 406 households (4.4%) fall into the $200,000+ income bracket, making it the least populous group.
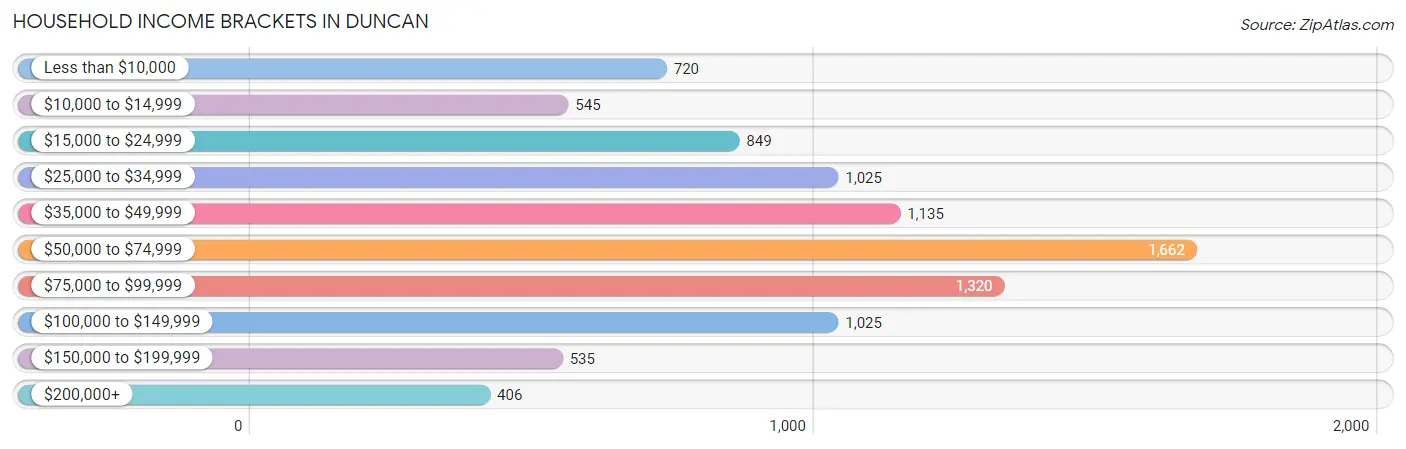
| Income Bracket | # Households | % Households |
| Less than $10,000 | 720 | 7.8% |
| $10,000 to $14,999 | 545 | 5.9% |
| $15,000 to $24,999 | 849 | 9.2% |
| $25,000 to $34,999 | 1,025 | 11.1% |
| $35,000 to $49,999 | 1,135 | 12.3% |
| $50,000 to $74,999 | 1,662 | 18.0% |
| $75,000 to $99,999 | 1,320 | 14.3% |
| $100,000 to $149,999 | 1,025 | 11.1% |
| $150,000 to $199,999 | 535 | 5.8% |
| $200,000+ | 406 | 4.4% |
Household Income by Householder Age in Duncan
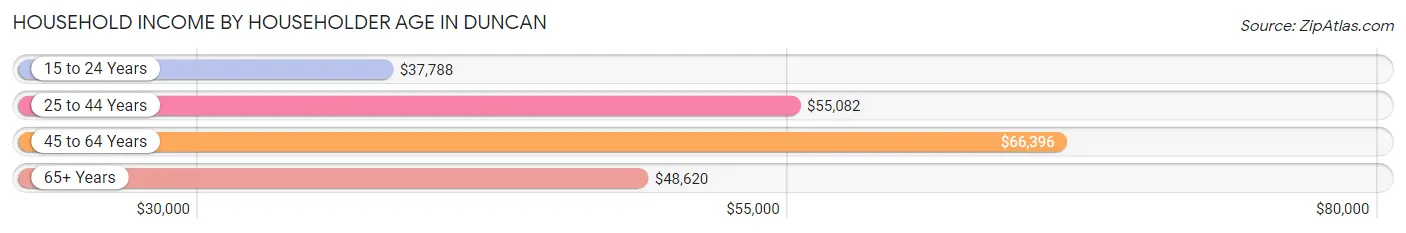
The median household income in Duncan is $55,162, with the highest median household income of $66,396 found in the 45 to 64 years age bracket for the primary householder. A total of 3,089 households (33.5%) fall into this category. Meanwhile, the 15 to 24 years age bracket for the primary householder has the lowest median household income of $37,788, with 399 households (4.3%) in this group.
| Income Bracket | # Households | Median Income |
| 15 to 24 Years | 399 (4.3%) | $37,788 |
| 25 to 44 Years | 2,706 (29.3%) | $55,082 |
| 45 to 64 Years | 3,089 (33.5%) | $66,396 |
| 65+ Years | 3,037 (32.9%) | $48,620 |
| Total | 9,231 (100.0%) | $55,162 |
Poverty in Duncan
Income Below Poverty by Sex and Age in Duncan
With 16.4% poverty level for males and 21.7% for females among the residents of Duncan, 5 year old males and under 5 year old females are the most vulnerable to poverty, with 83 males (43.9%) and 247 females (37.2%) in their respective age groups living below the poverty level.
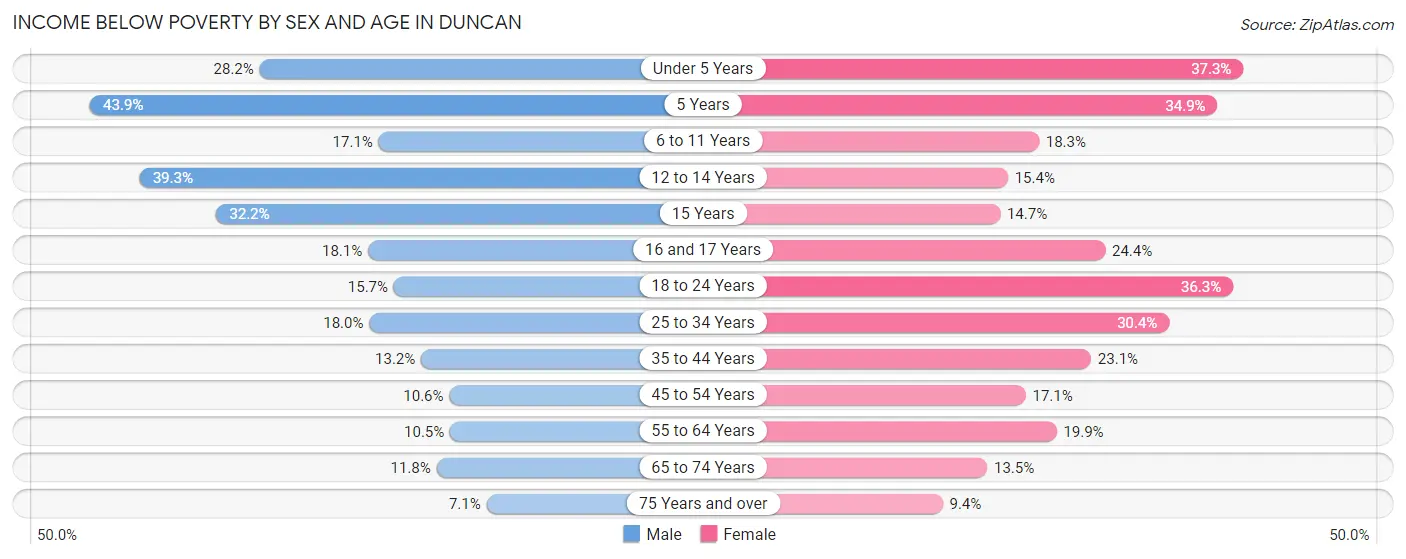
| Age Bracket | Male | Female |
| Under 5 Years | 188 (28.2%) | 247 (37.2%) |
| 5 Years | 83 (43.9%) | 61 (34.9%) |
| 6 to 11 Years | 108 (17.1%) | 151 (18.3%) |
| 12 to 14 Years | 215 (39.3%) | 67 (15.4%) |
| 15 Years | 57 (32.2%) | 16 (14.7%) |
| 16 and 17 Years | 62 (18.1%) | 54 (24.4%) |
| 18 to 24 Years | 152 (15.7%) | 358 (36.3%) |
| 25 to 34 Years | 265 (18.0%) | 428 (30.4%) |
| 35 to 44 Years | 166 (13.2%) | 316 (23.1%) |
| 45 to 54 Years | 145 (10.6%) | 220 (17.1%) |
| 55 to 64 Years | 143 (10.5%) | 284 (19.9%) |
| 65 to 74 Years | 127 (11.8%) | 214 (13.5%) |
| 75 Years and over | 45 (7.1%) | 102 (9.3%) |
| Total | 1,756 (16.4%) | 2,518 (21.7%) |
Income Above Poverty by Sex and Age in Duncan
According to the poverty statistics in Duncan, males aged 75 years and over and females aged 75 years and over are the age groups that are most secure financially, with 92.9% of males and 90.6% of females in these age groups living above the poverty line.
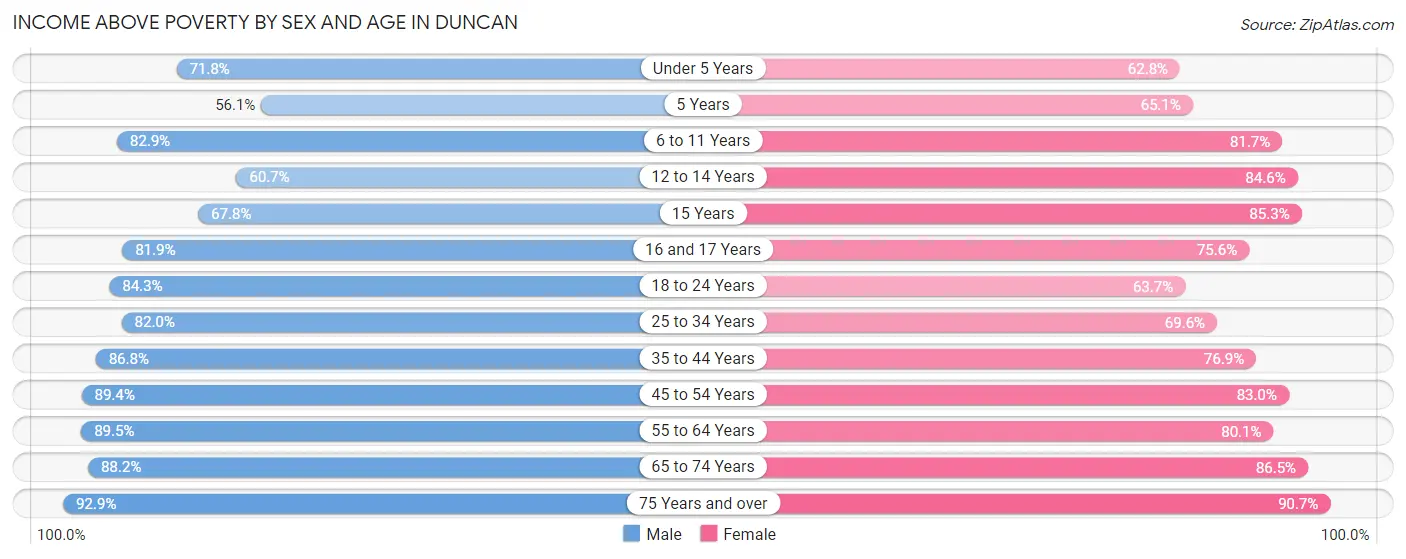
| Age Bracket | Male | Female |
| Under 5 Years | 479 (71.8%) | 416 (62.7%) |
| 5 Years | 106 (56.1%) | 114 (65.1%) |
| 6 to 11 Years | 522 (82.9%) | 675 (81.7%) |
| 12 to 14 Years | 332 (60.7%) | 368 (84.6%) |
| 15 Years | 120 (67.8%) | 93 (85.3%) |
| 16 and 17 Years | 280 (81.9%) | 167 (75.6%) |
| 18 to 24 Years | 814 (84.3%) | 628 (63.7%) |
| 25 to 34 Years | 1,206 (82.0%) | 981 (69.6%) |
| 35 to 44 Years | 1,092 (86.8%) | 1,051 (76.9%) |
| 45 to 54 Years | 1,226 (89.4%) | 1,070 (83.0%) |
| 55 to 64 Years | 1,217 (89.5%) | 1,142 (80.1%) |
| 65 to 74 Years | 952 (88.2%) | 1,374 (86.5%) |
| 75 Years and over | 586 (92.9%) | 989 (90.6%) |
| Total | 8,932 (83.6%) | 9,068 (78.3%) |
Income Below Poverty Among Married-Couple Families in Duncan
The poverty statistics for married-couple families in Duncan show that 8.2% or 356 of the total 4,343 families live below the poverty line. Families with 3 or 4 children have the highest poverty rate of 23.9%, comprising of 90 families. On the other hand, families with 5 or more children have the lowest poverty rate of 0.0%, which includes 0 families.
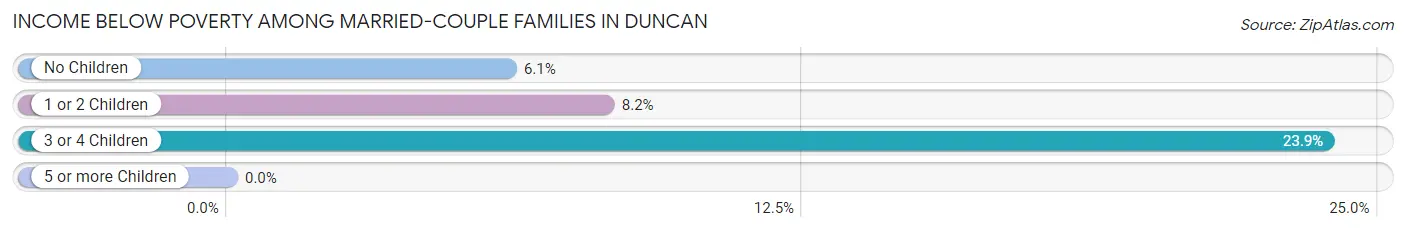
| Children | Above Poverty | Below Poverty |
| No Children | 2,492 (93.9%) | 161 (6.1%) |
| 1 or 2 Children | 1,176 (91.8%) | 105 (8.2%) |
| 3 or 4 Children | 287 (76.1%) | 90 (23.9%) |
| 5 or more Children | 32 (100.0%) | 0 (0.0%) |
| Total | 3,987 (91.8%) | 356 (8.2%) |
Income Below Poverty Among Single-Parent Households in Duncan
According to the poverty data in Duncan, 13.4% or 47 single-father households and 33.0% or 403 single-mother households are living below the poverty line. Among single-father households, those with no children have the highest poverty rate, with 28 households (21.4%) experiencing poverty. Likewise, among single-mother households, those with 5 or more children have the highest poverty rate, with 6 households (100.0%) falling below the poverty line.
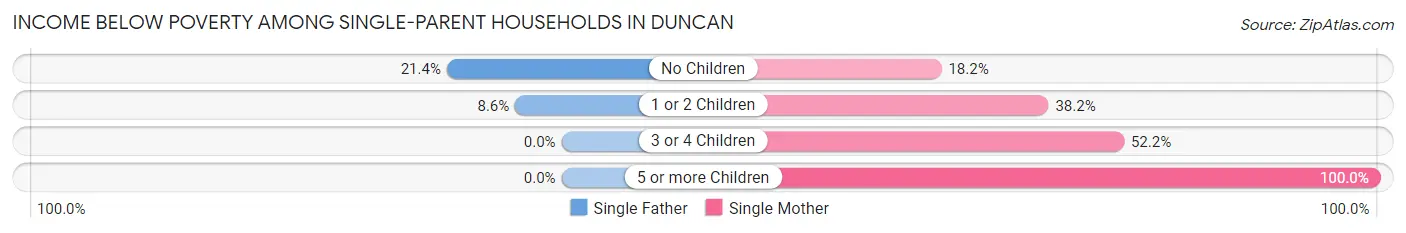
| Children | Single Father | Single Mother |
| No Children | 28 (21.4%) | 78 (18.2%) |
| 1 or 2 Children | 19 (8.6%) | 248 (38.2%) |
| 3 or 4 Children | 0 (0.0%) | 71 (52.2%) |
| 5 or more Children | 0 (0.0%) | 6 (100.0%) |
| Total | 47 (13.4%) | 403 (33.0%) |
Income Below Poverty Among Married-Couple vs Single-Parent Households in Duncan
The poverty data for Duncan shows that 356 of the married-couple family households (8.2%) and 450 of the single-parent households (28.6%) are living below the poverty level. Within the married-couple family households, those with 3 or 4 children have the highest poverty rate, with 90 households (23.9%) falling below the poverty line. Among the single-parent households, those with 5 or more children have the highest poverty rate, with 6 household (100.0%) living below poverty.
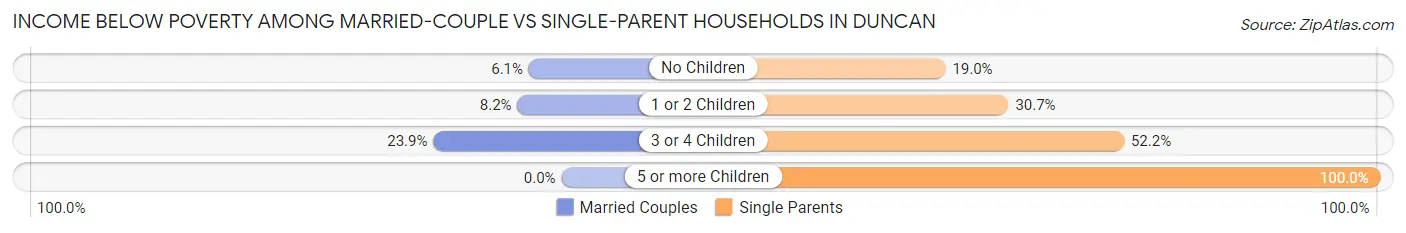
| Children | Married-Couple Families | Single-Parent Households |
| No Children | 161 (6.1%) | 106 (19.0%) |
| 1 or 2 Children | 105 (8.2%) | 267 (30.7%) |
| 3 or 4 Children | 90 (23.9%) | 71 (52.2%) |
| 5 or more Children | 0 (0.0%) | 6 (100.0%) |
| Total | 356 (8.2%) | 450 (28.6%) |
Race in Duncan
The most populous races in Duncan are White / Caucasian (17,778 | 78.1%), Hispanic or Latino (2,524 | 11.1%), and Two or more Races (2,354 | 10.3%).
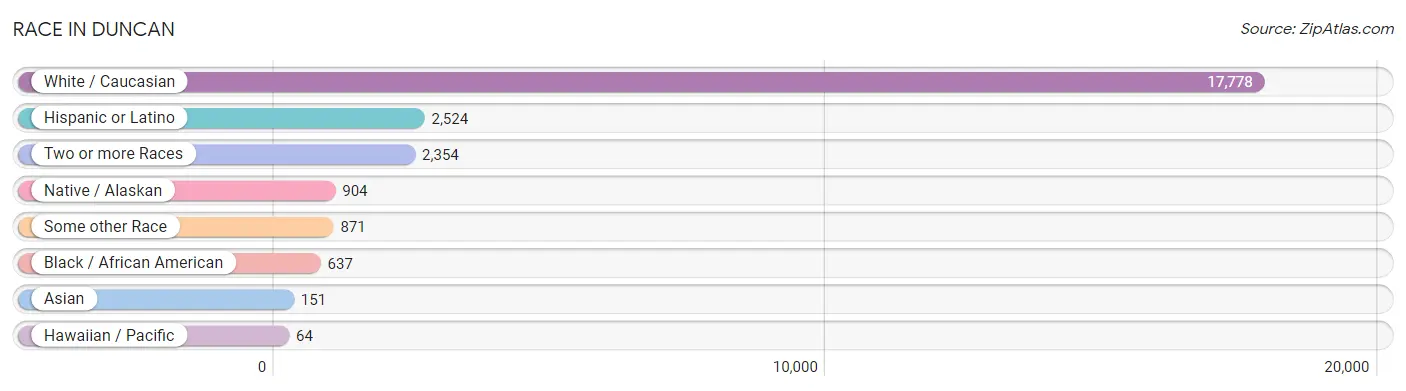
| Race | # Population | % Population |
| Asian | 151 | 0.7% |
| Black / African American | 637 | 2.8% |
| Hawaiian / Pacific | 64 | 0.3% |
| Hispanic or Latino | 2,524 | 11.1% |
| Native / Alaskan | 904 | 4.0% |
| White / Caucasian | 17,778 | 78.1% |
| Two or more Races | 2,354 | 10.3% |
| Some other Race | 871 | 3.8% |
| Total | 22,759 | 100.0% |
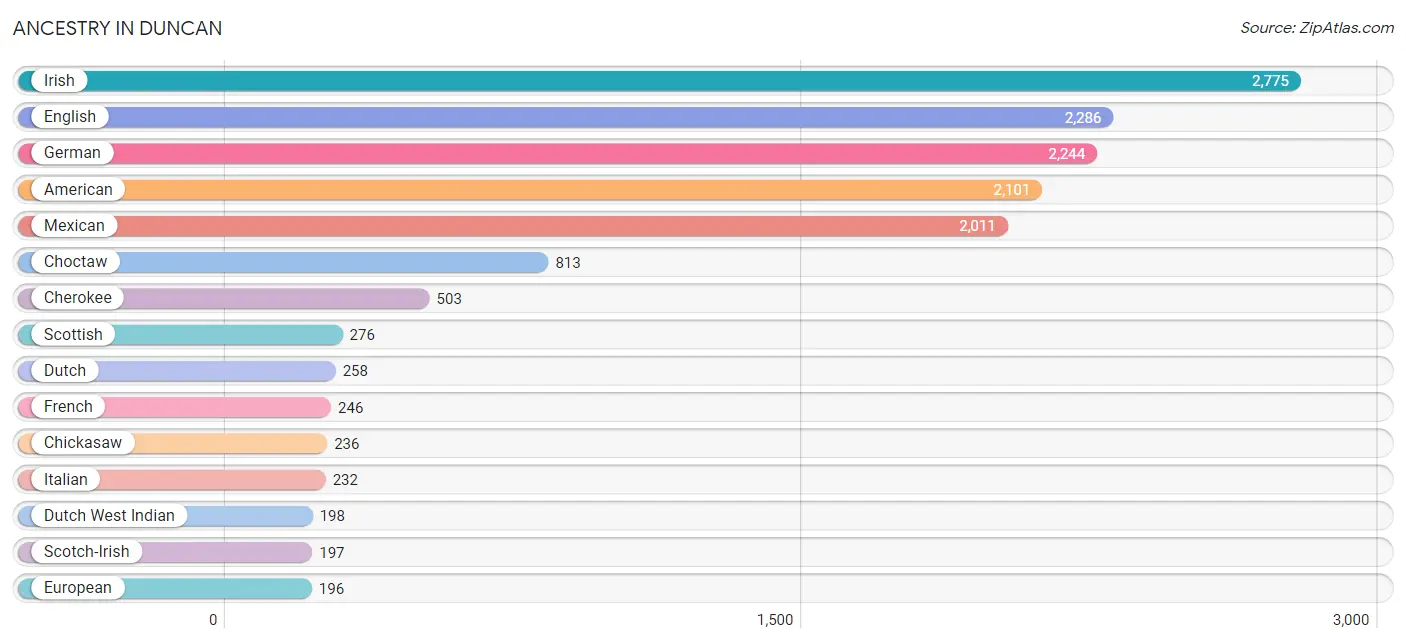
Ancestry in Duncan
The most populous ancestries reported in Duncan are Irish (2,775 | 12.2%), English (2,286 | 10.0%), German (2,244 | 9.9%), American (2,101 | 9.2%), and Mexican (2,011 | 8.8%), together accounting for 50.2% of all Duncan residents.
| Ancestry | # Population | % Population |
| African | 61 | 0.3% |
| Albanian | 83 | 0.4% |
| American | 2,101 | 9.2% |
| Apache | 4 | 0.0% |
| Arab | 15 | 0.1% |
| Belgian | 12 | 0.1% |
| Belizean | 13 | 0.1% |
| Bhutanese | 16 | 0.1% |
| British | 111 | 0.5% |
| Burmese | 13 | 0.1% |
| Cajun | 19 | 0.1% |
| Central American | 98 | 0.4% |
| Cherokee | 503 | 2.2% |
| Cheyenne | 8 | 0.0% |
| Chickasaw | 236 | 1.0% |
| Choctaw | 813 | 3.6% |
| Comanche | 106 | 0.5% |
| Creek | 23 | 0.1% |
| Cuban | 20 | 0.1% |
| Czech | 18 | 0.1% |
| Dominican | 112 | 0.5% |
| Dutch | 258 | 1.1% |
| Dutch West Indian | 198 | 0.9% |
| Eastern European | 35 | 0.2% |
| English | 2,286 | 10.0% |
| European | 196 | 0.9% |
| Finnish | 1 | 0.0% |
| French | 246 | 1.1% |
| German | 2,244 | 9.9% |
| Greek | 41 | 0.2% |
| Honduran | 52 | 0.2% |
| Hopi | 53 | 0.2% |
| Hungarian | 103 | 0.4% |
| Irish | 2,775 | 12.2% |
| Iroquois | 68 | 0.3% |
| Israeli | 39 | 0.2% |
| Italian | 232 | 1.0% |
| Jamaican | 12 | 0.1% |
| Kiowa | 22 | 0.1% |
| Korean | 18 | 0.1% |
| Menominee | 4 | 0.0% |
| Mexican | 2,011 | 8.8% |
| Navajo | 35 | 0.2% |
| Nicaraguan | 14 | 0.1% |
| Northern European | 45 | 0.2% |
| Norwegian | 163 | 0.7% |
| Osage | 2 | 0.0% |
| Palestinian | 15 | 0.1% |
| Polish | 91 | 0.4% |
| Portuguese | 18 | 0.1% |
| Potawatomi | 56 | 0.3% |
| Puerto Rican | 141 | 0.6% |
| Romanian | 16 | 0.1% |
| Russian | 41 | 0.2% |
| Salvadoran | 32 | 0.1% |
| Samoan | 41 | 0.2% |
| Scandinavian | 40 | 0.2% |
| Scotch-Irish | 197 | 0.9% |
| Scottish | 276 | 1.2% |
| Sioux | 38 | 0.2% |
| Slovak | 8 | 0.0% |
| South African | 13 | 0.1% |
| Spaniard | 50 | 0.2% |
| Spanish | 26 | 0.1% |
| Sri Lankan | 63 | 0.3% |
| Subsaharan African | 74 | 0.3% |
| Swedish | 54 | 0.2% |
| Thai | 74 | 0.3% |
| Welsh | 177 | 0.8% | View All 69 Rows |
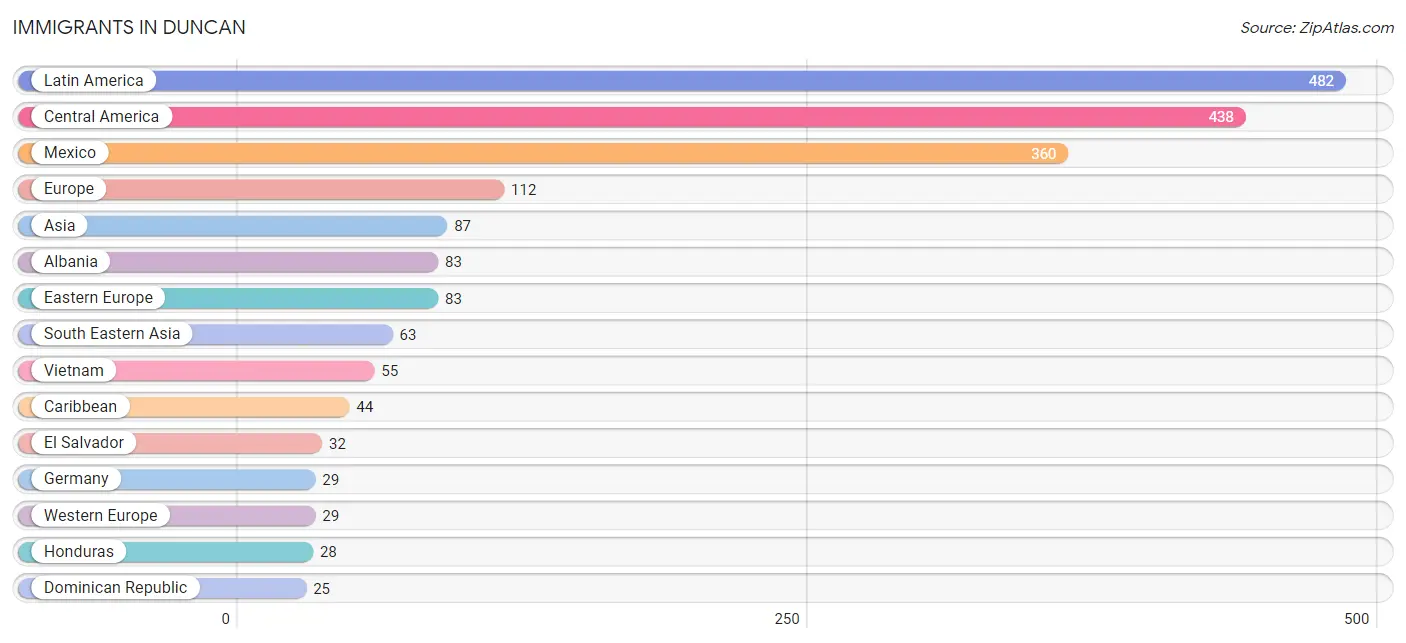
Immigrants in Duncan
The most numerous immigrant groups reported in Duncan came from Latin America (482 | 2.1%), Central America (438 | 1.9%), Mexico (360 | 1.6%), Europe (112 | 0.5%), and Asia (87 | 0.4%), together accounting for 6.5% of all Duncan residents.
| Immigration Origin | # Population | % Population |
| Africa | 13 | 0.1% |
| Albania | 83 | 0.4% |
| Asia | 87 | 0.4% |
| Canada | 19 | 0.1% |
| Caribbean | 44 | 0.2% |
| Central America | 438 | 1.9% |
| Cuba | 19 | 0.1% |
| Dominican Republic | 25 | 0.1% |
| Eastern Asia | 3 | 0.0% |
| Eastern Europe | 83 | 0.4% |
| El Salvador | 32 | 0.1% |
| Europe | 112 | 0.5% |
| Germany | 29 | 0.1% |
| Guatemala | 18 | 0.1% |
| Honduras | 28 | 0.1% |
| India | 21 | 0.1% |
| Korea | 3 | 0.0% |
| Latin America | 482 | 2.1% |
| Mexico | 360 | 1.6% |
| Oceania | 8 | 0.0% |
| Philippines | 8 | 0.0% |
| South Africa | 13 | 0.1% |
| South Central Asia | 21 | 0.1% |
| South Eastern Asia | 63 | 0.3% |
| Vietnam | 55 | 0.2% |
| Western Europe | 29 | 0.1% | View All 26 Rows |
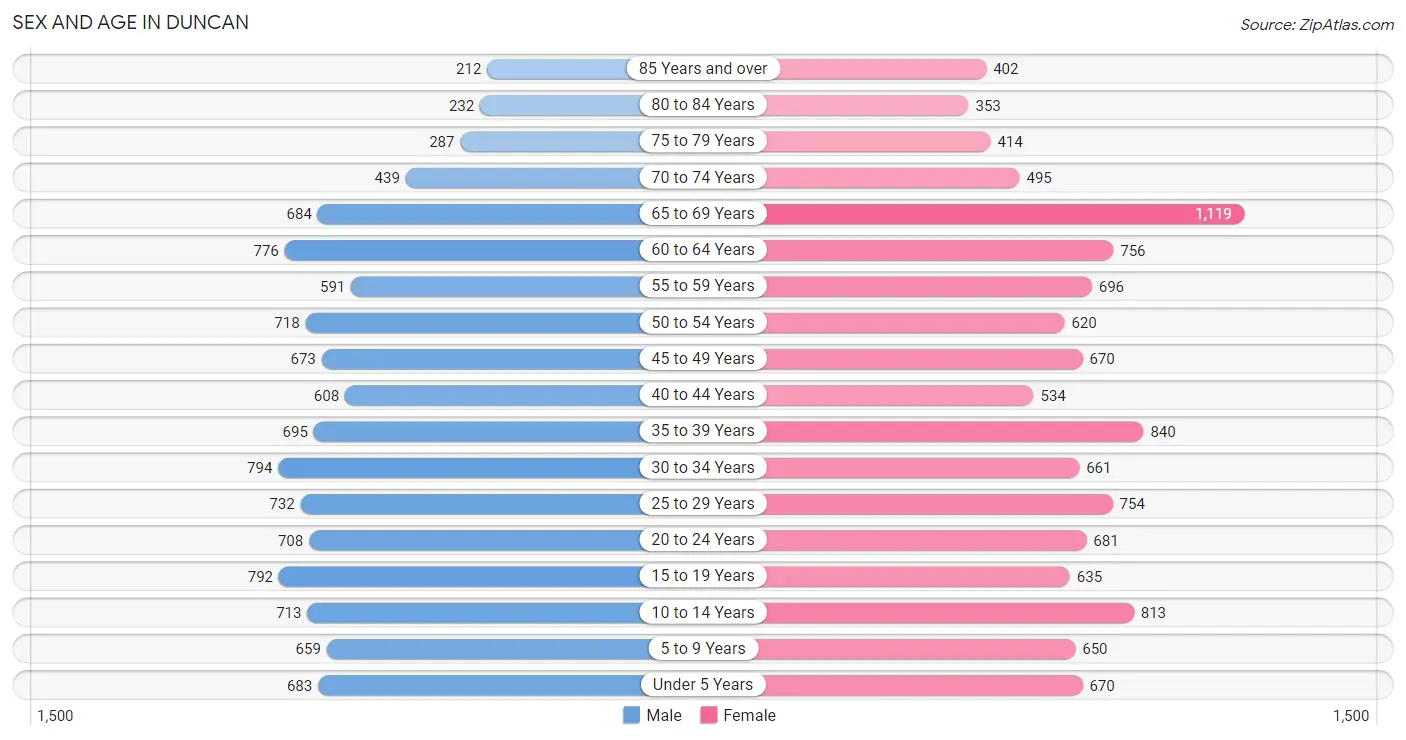
Sex and Age in Duncan
Sex and Age in Duncan
The most populous age groups in Duncan are 30 to 34 Years (794 | 7.2%) for men and 65 to 69 Years (1,119 | 9.5%) for women.
| Age Bracket | Male | Female |
| Under 5 Years | 683 (6.2%) | 670 (5.7%) |
| 5 to 9 Years | 659 (6.0%) | 650 (5.5%) |
| 10 to 14 Years | 713 (6.5%) | 813 (6.9%) |
| 15 to 19 Years | 792 (7.2%) | 635 (5.4%) |
| 20 to 24 Years | 708 (6.4%) | 681 (5.8%) |
| 25 to 29 Years | 732 (6.7%) | 754 (6.4%) |
| 30 to 34 Years | 794 (7.2%) | 661 (5.6%) |
| 35 to 39 Years | 695 (6.3%) | 840 (7.1%) |
| 40 to 44 Years | 608 (5.5%) | 534 (4.5%) |
| 45 to 49 Years | 673 (6.1%) | 670 (5.7%) |
| 50 to 54 Years | 718 (6.5%) | 620 (5.3%) |
| 55 to 59 Years | 591 (5.4%) | 696 (5.9%) |
| 60 to 64 Years | 776 (7.1%) | 756 (6.4%) |
| 65 to 69 Years | 684 (6.2%) | 1,119 (9.5%) |
| 70 to 74 Years | 439 (4.0%) | 495 (4.2%) |
| 75 to 79 Years | 287 (2.6%) | 414 (3.5%) |
| 80 to 84 Years | 232 (2.1%) | 353 (3.0%) |
| 85 Years and over | 212 (1.9%) | 402 (3.4%) |
| Total | 10,996 (100.0%) | 11,763 (100.0%) |
Families and Households in Duncan
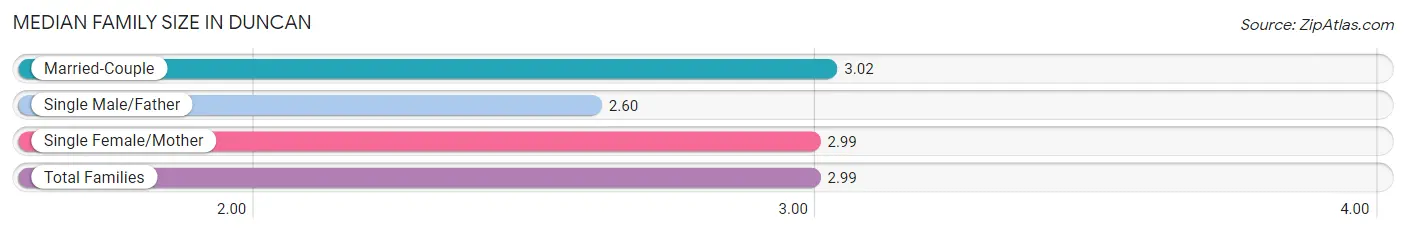
Median Family Size in Duncan
The median family size in Duncan is 2.99 persons per family, with married-couple families (4,343 | 73.4%) accounting for the largest median family size of 3.02 persons per family. On the other hand, single male/father families (351 | 5.9%) represent the smallest median family size with 2.60 persons per family.
| Family Type | # Families | Family Size |
| Married-Couple | 4,343 (73.4%) | 3.02 |
| Single Male/Father | 351 (5.9%) | 2.60 |
| Single Female/Mother | 1,220 (20.6%) | 2.99 |
| Total Families | 5,914 (100.0%) | 2.99 |
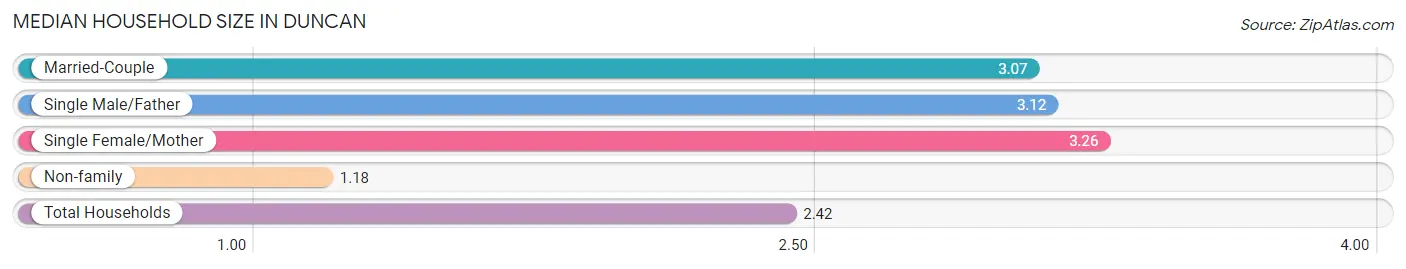
Median Household Size in Duncan
The median household size in Duncan is 2.42 persons per household, with single female/mother households (1,220 | 13.2%) accounting for the largest median household size of 3.26 persons per household. non-family households (3,317 | 35.9%) represent the smallest median household size with 1.18 persons per household.
| Household Type | # Households | Household Size |
| Married-Couple | 4,343 (47.0%) | 3.07 |
| Single Male/Father | 351 (3.8%) | 3.12 |
| Single Female/Mother | 1,220 (13.2%) | 3.26 |
| Non-family | 3,317 (35.9%) | 1.18 |
| Total Households | 9,231 (100.0%) | 2.42 |
Household Size by Marriage Status in Duncan
Out of a total of 9,231 households in Duncan, 5,914 (64.1%) are family households, while 3,317 (35.9%) are nonfamily households. The most numerous type of family households are 2-person households, comprising 2,836, and the most common type of nonfamily households are 1-person households, comprising 2,874.
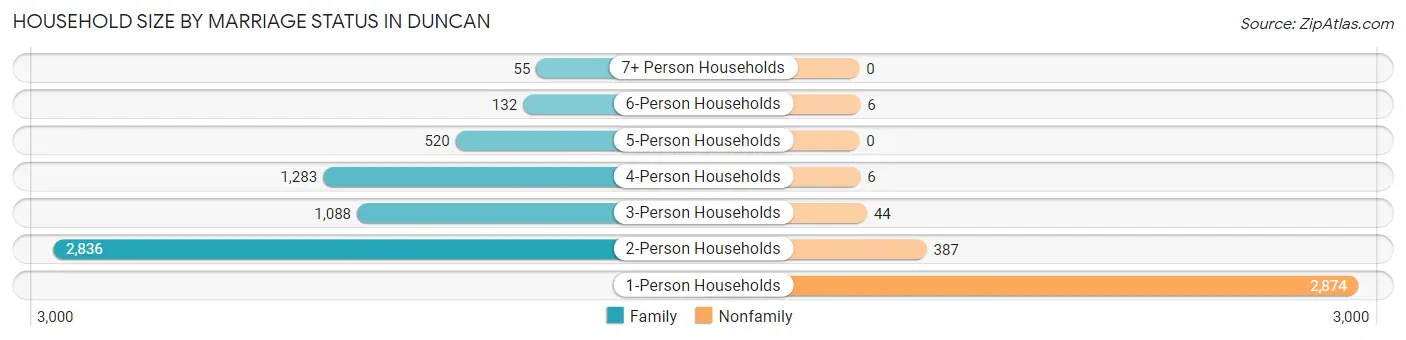
| Household Size | Family Households | Nonfamily Households |
| 1-Person Households | - | 2,874 (31.1%) |
| 2-Person Households | 2,836 (30.7%) | 387 (4.2%) |
| 3-Person Households | 1,088 (11.8%) | 44 (0.5%) |
| 4-Person Households | 1,283 (13.9%) | 6 (0.1%) |
| 5-Person Households | 520 (5.6%) | 0 (0.0%) |
| 6-Person Households | 132 (1.4%) | 6 (0.1%) |
| 7+ Person Households | 55 (0.6%) | 0 (0.0%) |
| Total | 5,914 (64.1%) | 3,317 (35.9%) |
Female Fertility in Duncan
Fertility by Age in Duncan
Average fertility rate in Duncan is 75.0 births per 1,000 women. Women in the age bracket of 20 to 34 years have the highest fertility rate with 109.0 births per 1,000 women. Women in the age bracket of 20 to 34 years acount for 62.0% of all women with births.
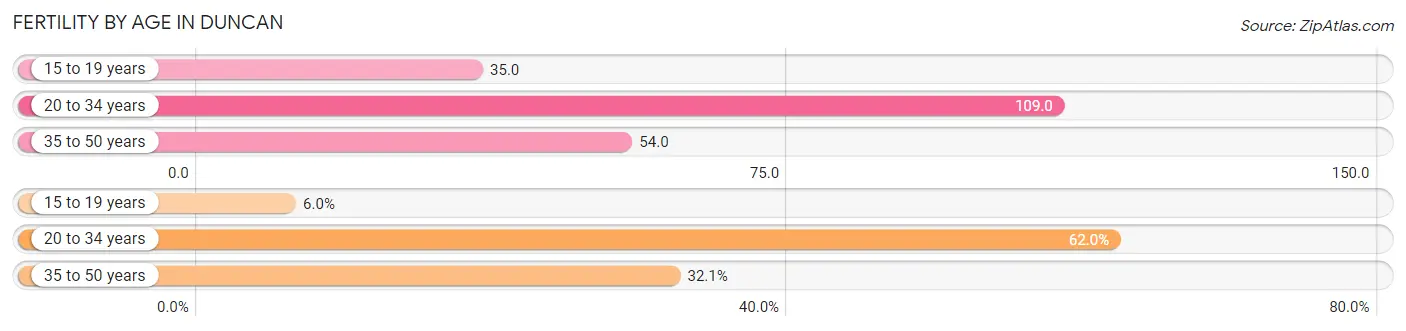
| Age Bracket | Women with Births | Births / 1,000 Women |
| 15 to 19 years | 22 (6.0%) | 35.0 |
| 20 to 34 years | 228 (62.0%) | 109.0 |
| 35 to 50 years | 118 (32.1%) | 54.0 |
| Total | 368 (100.0%) | 75.0 |
Fertility by Age by Marriage Status in Duncan
59.0% of women with births (368) in Duncan are married. The highest percentage of unmarried women with births falls into 15 to 19 years age bracket with 63.6% of them unmarried at the time of birth, while the lowest percentage of unmarried women with births belong to 35 to 50 years age bracket with 29.7% of them unmarried.
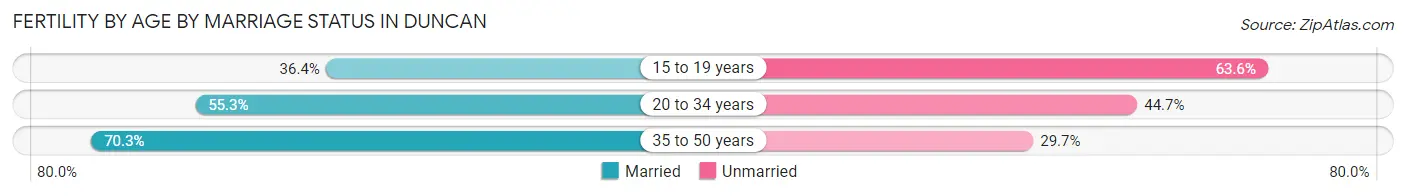
| Age Bracket | Married | Unmarried |
| 15 to 19 years | 8 (36.4%) | 14 (63.6%) |
| 20 to 34 years | 126 (55.3%) | 102 (44.7%) |
| 35 to 50 years | 83 (70.3%) | 35 (29.7%) |
| Total | 217 (59.0%) | 151 (41.0%) |
Fertility by Education in Duncan
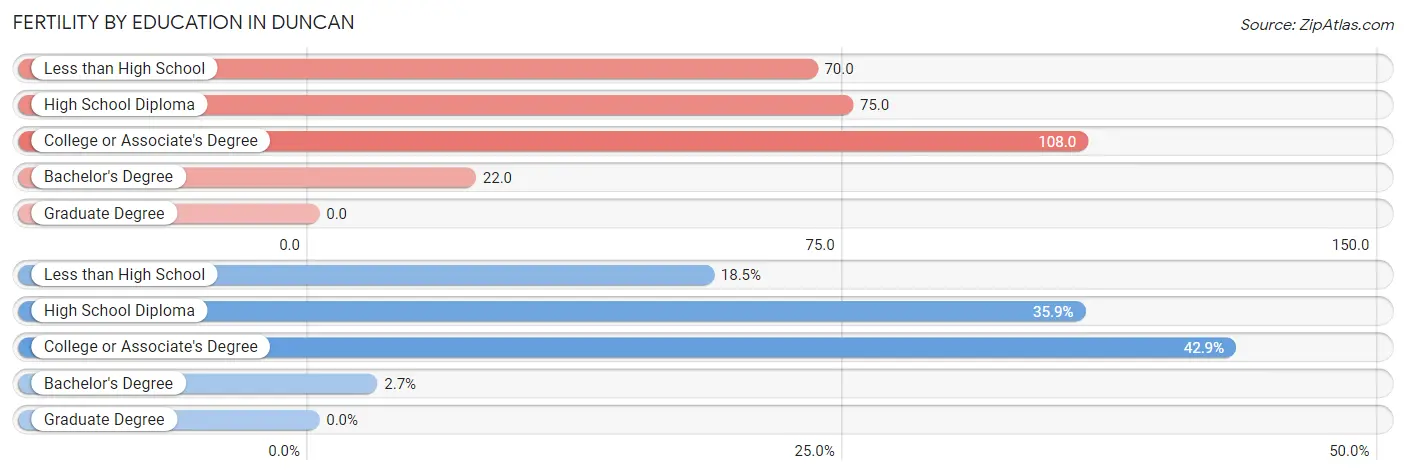
| Educational Attainment | Women with Births | Births / 1,000 Women |
| Less than High School | 68 (18.5%) | 70.0 |
| High School Diploma | 132 (35.9%) | 75.0 |
| College or Associate's Degree | 158 (42.9%) | 108.0 |
| Bachelor's Degree | 10 (2.7%) | 22.0 |
| Graduate Degree | 0 (0.0%) | 0.0 |
| Total | 368 (100.0%) | 75.0 |
Fertility by Education by Marriage Status in Duncan
41.0% of women with births in Duncan are unmarried. Women with the educational attainment of college or associate's degree are most likely to be married with 69.6% of them married at childbirth, while women with the educational attainment of bachelor's degree are least likely to be married with 100.0% of them unmarried at childbirth.
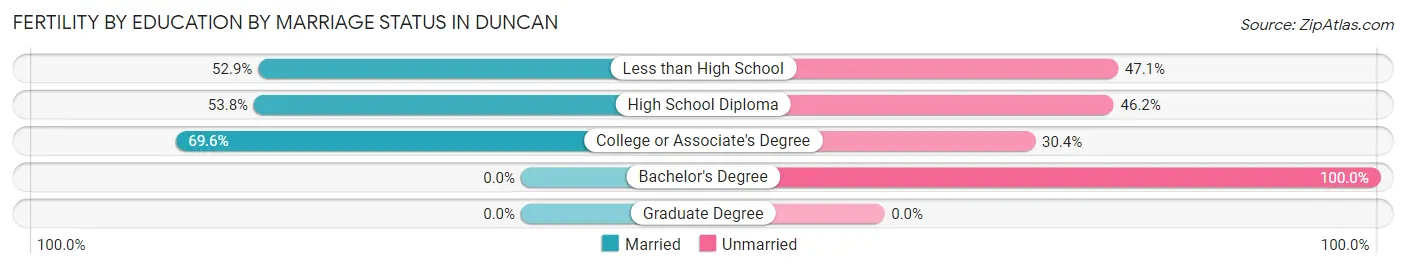
| Educational Attainment | Married | Unmarried |
| Less than High School | 36 (52.9%) | 32 (47.1%) |
| High School Diploma | 71 (53.8%) | 61 (46.2%) |
| College or Associate's Degree | 110 (69.6%) | 48 (30.4%) |
| Bachelor's Degree | 0 (0.0%) | 10 (100.0%) |
| Graduate Degree | 0 (0.0%) | 0 (0.0%) |
| Total | 217 (59.0%) | 151 (41.0%) |
Employment Characteristics in Duncan
Employment by Class of Employer in Duncan
Among the 9,341 employed individuals in Duncan, private company employees (6,741 | 72.2%), not-for-profit organizations (745 | 8.0%), and self-employed (not incorporated) (625 | 6.7%) make up the most common classes of employment.
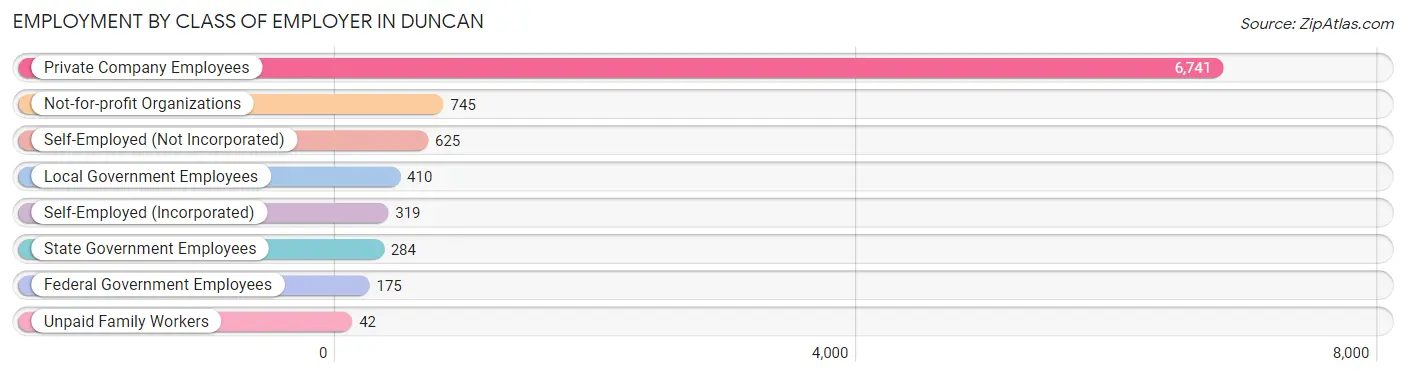
| Employer Class | # Employees | % Employees |
| Private Company Employees | 6,741 | 72.2% |
| Self-Employed (Incorporated) | 319 | 3.4% |
| Self-Employed (Not Incorporated) | 625 | 6.7% |
| Not-for-profit Organizations | 745 | 8.0% |
| Local Government Employees | 410 | 4.4% |
| State Government Employees | 284 | 3.0% |
| Federal Government Employees | 175 | 1.9% |
| Unpaid Family Workers | 42 | 0.4% |
| Total | 9,341 | 100.0% |
Employment Status by Age in Duncan
According to the labor force statistics for Duncan, out of the total population over 16 years of age (18,285), 55.0% or 10,057 individuals are in the labor force, with 5.2% or 523 of them unemployed. The age group with the highest labor force participation rate is 30 to 34 years, with 80.8% or 1,176 individuals in the labor force. Within the labor force, the 16 to 19 years age range has the highest percentage of unemployed individuals, with 17.9% or 69 of them being unemployed.
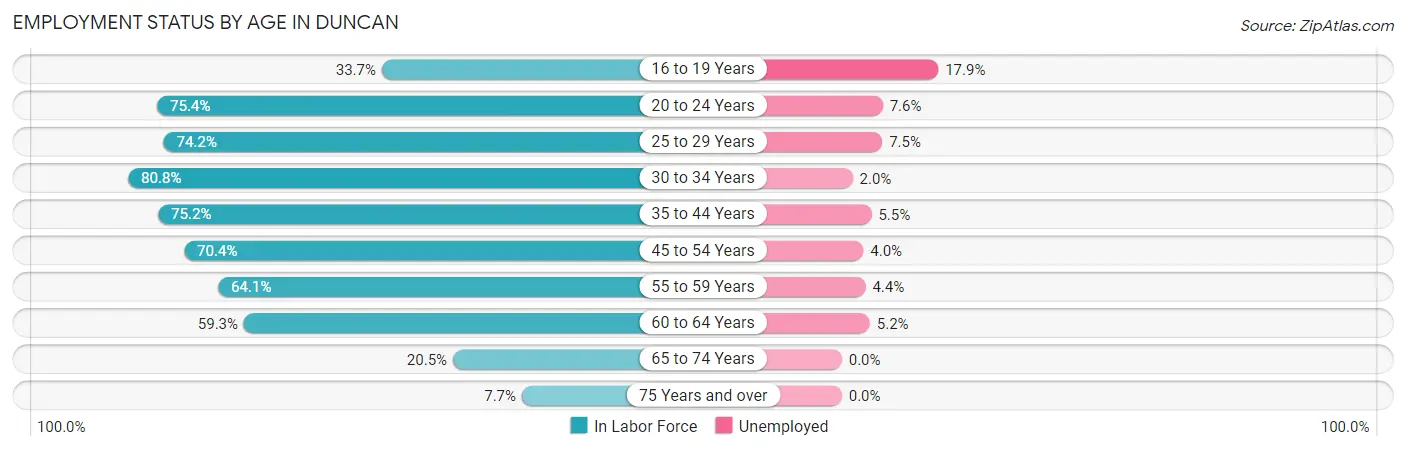
| Age Bracket | In Labor Force | Unemployed |
| 16 to 19 Years | 385 (33.7%) | 69 (17.9%) |
| 20 to 24 Years | 1,047 (75.4%) | 80 (7.6%) |
| 25 to 29 Years | 1,103 (74.2%) | 83 (7.5%) |
| 30 to 34 Years | 1,176 (80.8%) | 24 (2.0%) |
| 35 to 44 Years | 2,013 (75.2%) | 111 (5.5%) |
| 45 to 54 Years | 1,887 (70.4%) | 75 (4.0%) |
| 55 to 59 Years | 825 (64.1%) | 36 (4.4%) |
| 60 to 64 Years | 908 (59.3%) | 47 (5.2%) |
| 65 to 74 Years | 561 (20.5%) | 0 (0.0%) |
| 75 Years and over | 146 (7.7%) | 0 (0.0%) |
| Total | 10,057 (55.0%) | 523 (5.2%) |
Employment Status by Educational Attainment in Duncan
According to labor force statistics for Duncan, 71.1% of individuals (7,905) out of the total population between 25 and 64 years of age (11,118) are in the labor force, with 4.7% or 372 of them being unemployed. The group with the highest labor force participation rate are those with the educational attainment of bachelor's degree or higher, with 83.5% or 1,643 individuals in the labor force. Within the labor force, individuals with less than high school education have the highest percentage of unemployment, with 9.6% or 92 of them being unemployed.
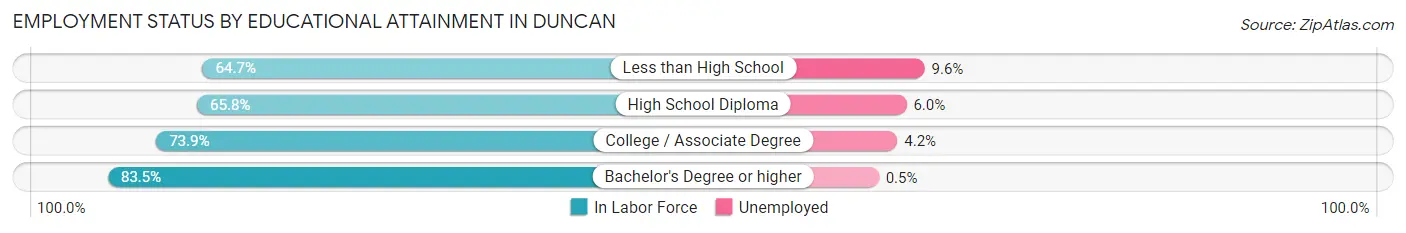
| Educational Attainment | In Labor Force | Unemployed |
| Less than High School | 956 (64.7%) | 142 (9.6%) |
| High School Diploma | 2,905 (65.8%) | 265 (6.0%) |
| College / Associate Degree | 2,407 (73.9%) | 137 (4.2%) |
| Bachelor's Degree or higher | 1,643 (83.5%) | 10 (0.5%) |
| Total | 7,905 (71.1%) | 523 (4.7%) |
Employment Occupations by Sex in Duncan
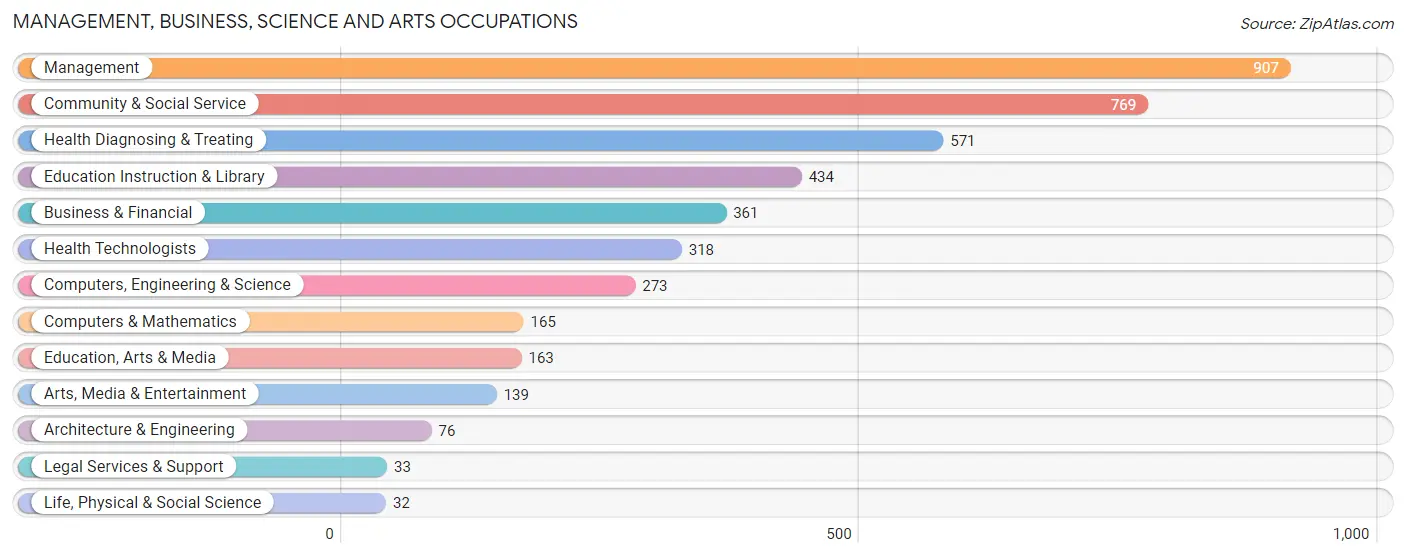
Management, Business, Science and Arts Occupations
The most common Management, Business, Science and Arts occupations in Duncan are Management (907 | 9.5%), Community & Social Service (769 | 8.1%), Health Diagnosing & Treating (571 | 6.0%), Education Instruction & Library (434 | 4.6%), and Business & Financial (361 | 3.8%).
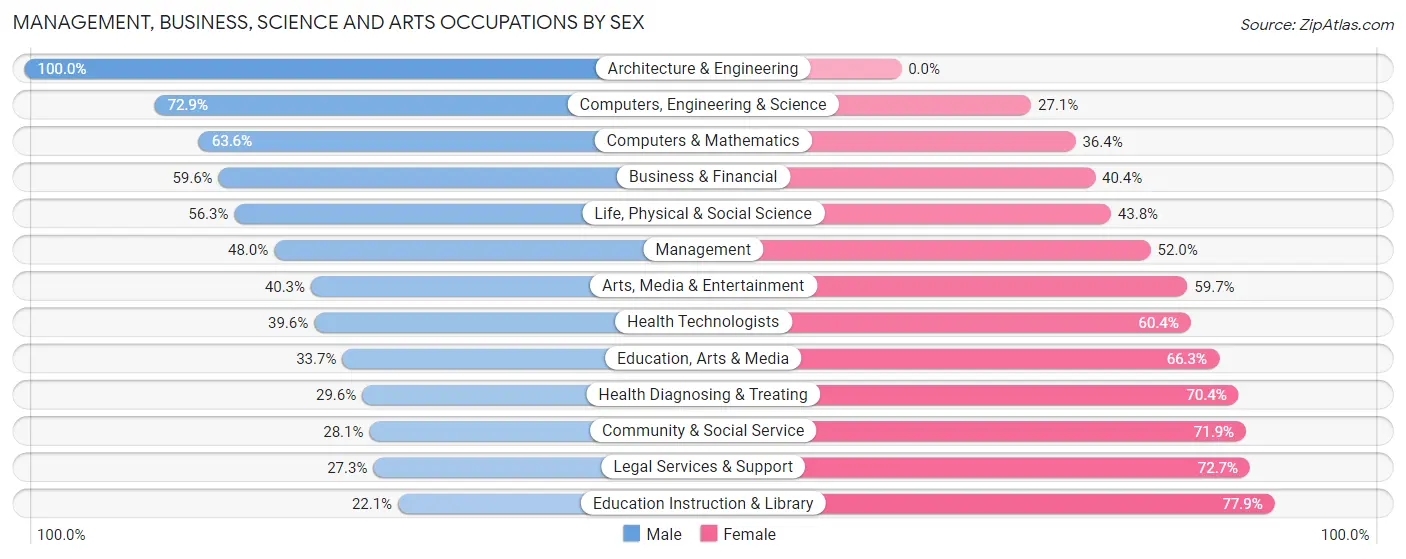
Management, Business, Science and Arts Occupations by Sex
Within the Management, Business, Science and Arts occupations in Duncan, the most male-oriented occupations are Architecture & Engineering (100.0%), Computers, Engineering & Science (72.9%), and Computers & Mathematics (63.6%), while the most female-oriented occupations are Education Instruction & Library (77.9%), Legal Services & Support (72.7%), and Community & Social Service (71.9%).
| Occupation | Male | Female |
| Management | 435 (48.0%) | 472 (52.0%) |
| Business & Financial | 215 (59.6%) | 146 (40.4%) |
| Computers, Engineering & Science | 199 (72.9%) | 74 (27.1%) |
| Computers & Mathematics | 105 (63.6%) | 60 (36.4%) |
| Architecture & Engineering | 76 (100.0%) | 0 (0.0%) |
| Life, Physical & Social Science | 18 (56.2%) | 14 (43.8%) |
| Community & Social Service | 216 (28.1%) | 553 (71.9%) |
| Education, Arts & Media | 55 (33.7%) | 108 (66.3%) |
| Legal Services & Support | 9 (27.3%) | 24 (72.7%) |
| Education Instruction & Library | 96 (22.1%) | 338 (77.9%) |
| Arts, Media & Entertainment | 56 (40.3%) | 83 (59.7%) |
| Health Diagnosing & Treating | 169 (29.6%) | 402 (70.4%) |
| Health Technologists | 126 (39.6%) | 192 (60.4%) |
| Total (Category) | 1,234 (42.8%) | 1,647 (57.2%) |
| Total (Overall) | 5,238 (55.0%) | 4,287 (45.0%) |
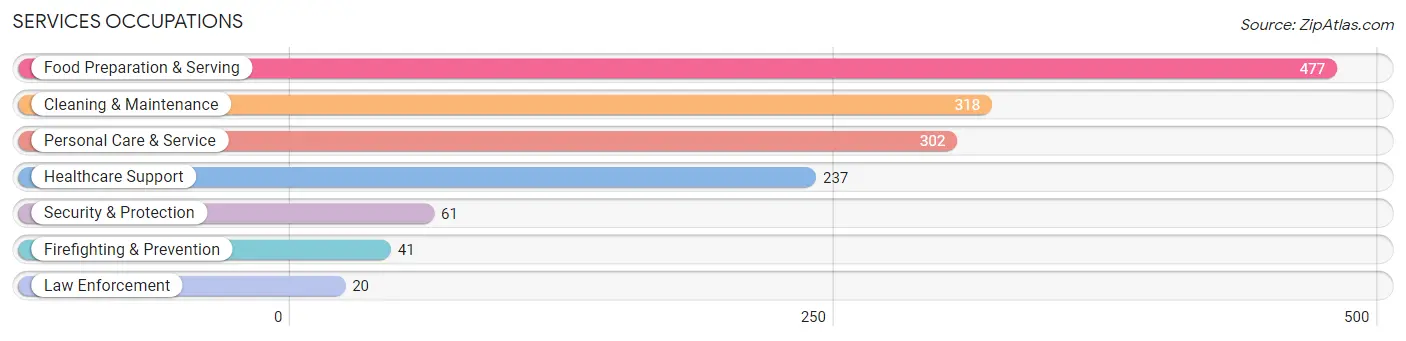
Services Occupations
The most common Services occupations in Duncan are Food Preparation & Serving (477 | 5.0%), Cleaning & Maintenance (318 | 3.3%), Personal Care & Service (302 | 3.2%), Healthcare Support (237 | 2.5%), and Security & Protection (61 | 0.6%).
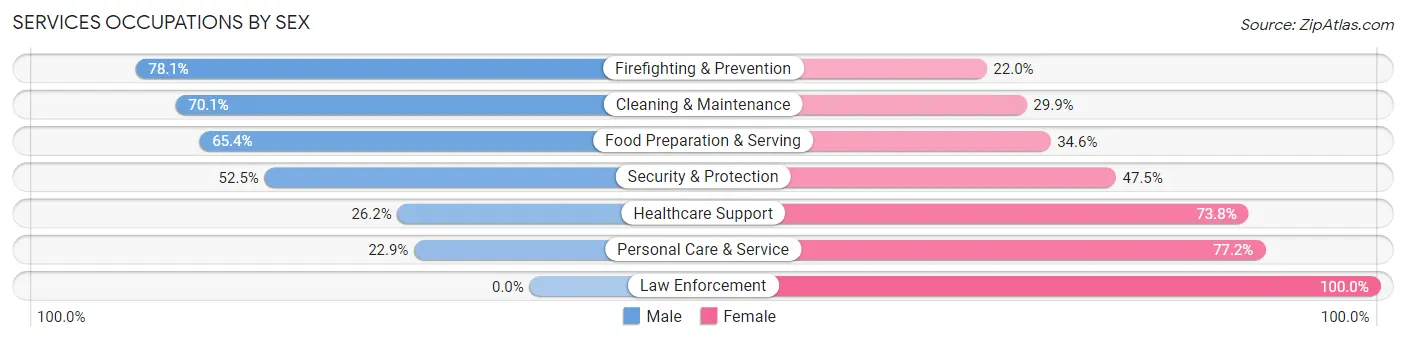
Services Occupations by Sex
Within the Services occupations in Duncan, the most male-oriented occupations are Firefighting & Prevention (78.0%), Cleaning & Maintenance (70.1%), and Food Preparation & Serving (65.4%), while the most female-oriented occupations are Law Enforcement (100.0%), Personal Care & Service (77.1%), and Healthcare Support (73.8%).
| Occupation | Male | Female |
| Healthcare Support | 62 (26.2%) | 175 (73.8%) |
| Security & Protection | 32 (52.5%) | 29 (47.5%) |
| Firefighting & Prevention | 32 (78.0%) | 9 (22.0%) |
| Law Enforcement | 0 (0.0%) | 20 (100.0%) |
| Food Preparation & Serving | 312 (65.4%) | 165 (34.6%) |
| Cleaning & Maintenance | 223 (70.1%) | 95 (29.9%) |
| Personal Care & Service | 69 (22.9%) | 233 (77.1%) |
| Total (Category) | 698 (50.0%) | 697 (50.0%) |
| Total (Overall) | 5,238 (55.0%) | 4,287 (45.0%) |
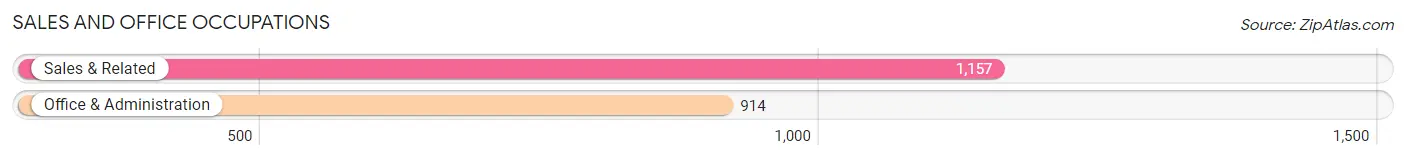
Sales and Office Occupations
The most common Sales and Office occupations in Duncan are Sales & Related (1,157 | 12.1%), and Office & Administration (914 | 9.6%).
Sales and Office Occupations by Sex
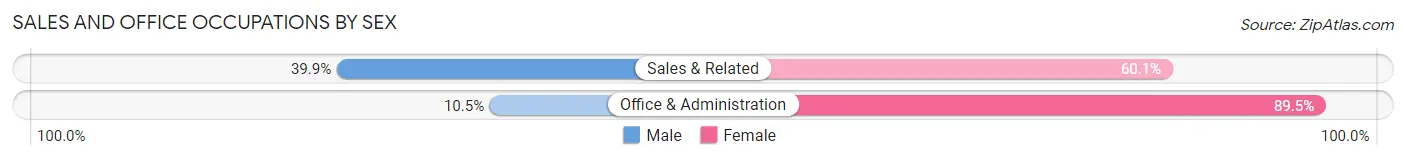
| Occupation | Male | Female |
| Sales & Related | 462 (39.9%) | 695 (60.1%) |
| Office & Administration | 96 (10.5%) | 818 (89.5%) |
| Total (Category) | 558 (26.9%) | 1,513 (73.1%) |
| Total (Overall) | 5,238 (55.0%) | 4,287 (45.0%) |
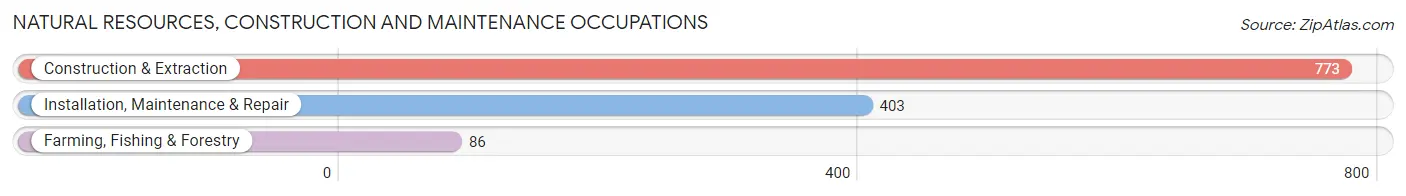
Natural Resources, Construction and Maintenance Occupations
The most common Natural Resources, Construction and Maintenance occupations in Duncan are Construction & Extraction (773 | 8.1%), Installation, Maintenance & Repair (403 | 4.2%), and Farming, Fishing & Forestry (86 | 0.9%).
Natural Resources, Construction and Maintenance Occupations by Sex
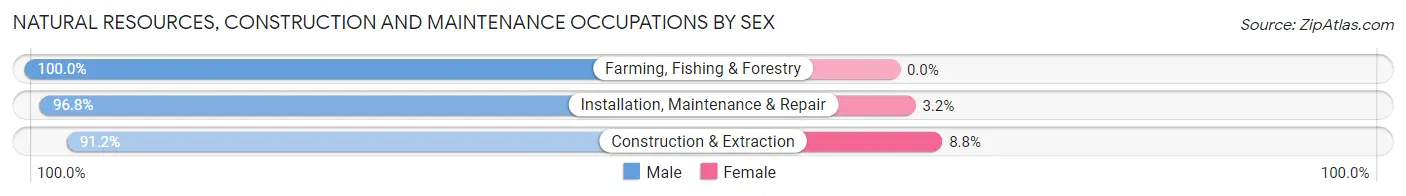
| Occupation | Male | Female |
| Farming, Fishing & Forestry | 86 (100.0%) | 0 (0.0%) |
| Construction & Extraction | 705 (91.2%) | 68 (8.8%) |
| Installation, Maintenance & Repair | 390 (96.8%) | 13 (3.2%) |
| Total (Category) | 1,181 (93.6%) | 81 (6.4%) |
| Total (Overall) | 5,238 (55.0%) | 4,287 (45.0%) |
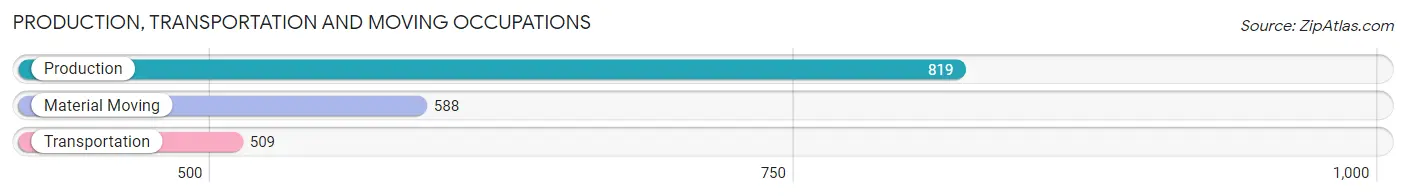
Production, Transportation and Moving Occupations
The most common Production, Transportation and Moving occupations in Duncan are Production (819 | 8.6%), Material Moving (588 | 6.2%), and Transportation (509 | 5.3%).
Production, Transportation and Moving Occupations by Sex
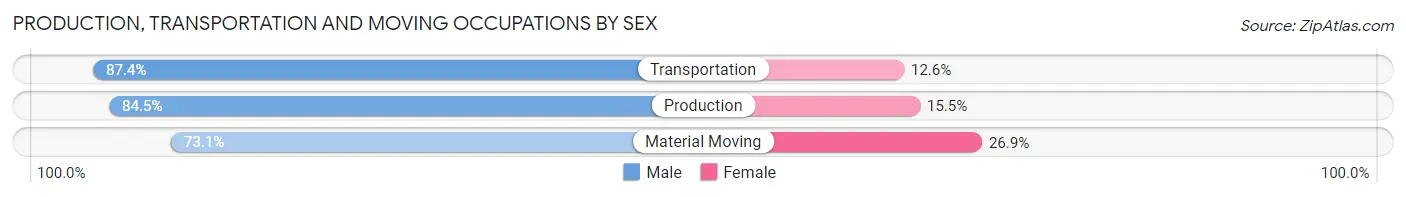
| Occupation | Male | Female |
| Production | 692 (84.5%) | 127 (15.5%) |
| Transportation | 445 (87.4%) | 64 (12.6%) |
| Material Moving | 430 (73.1%) | 158 (26.9%) |
| Total (Category) | 1,567 (81.8%) | 349 (18.2%) |
| Total (Overall) | 5,238 (55.0%) | 4,287 (45.0%) |
Employment Industries by Sex in Duncan
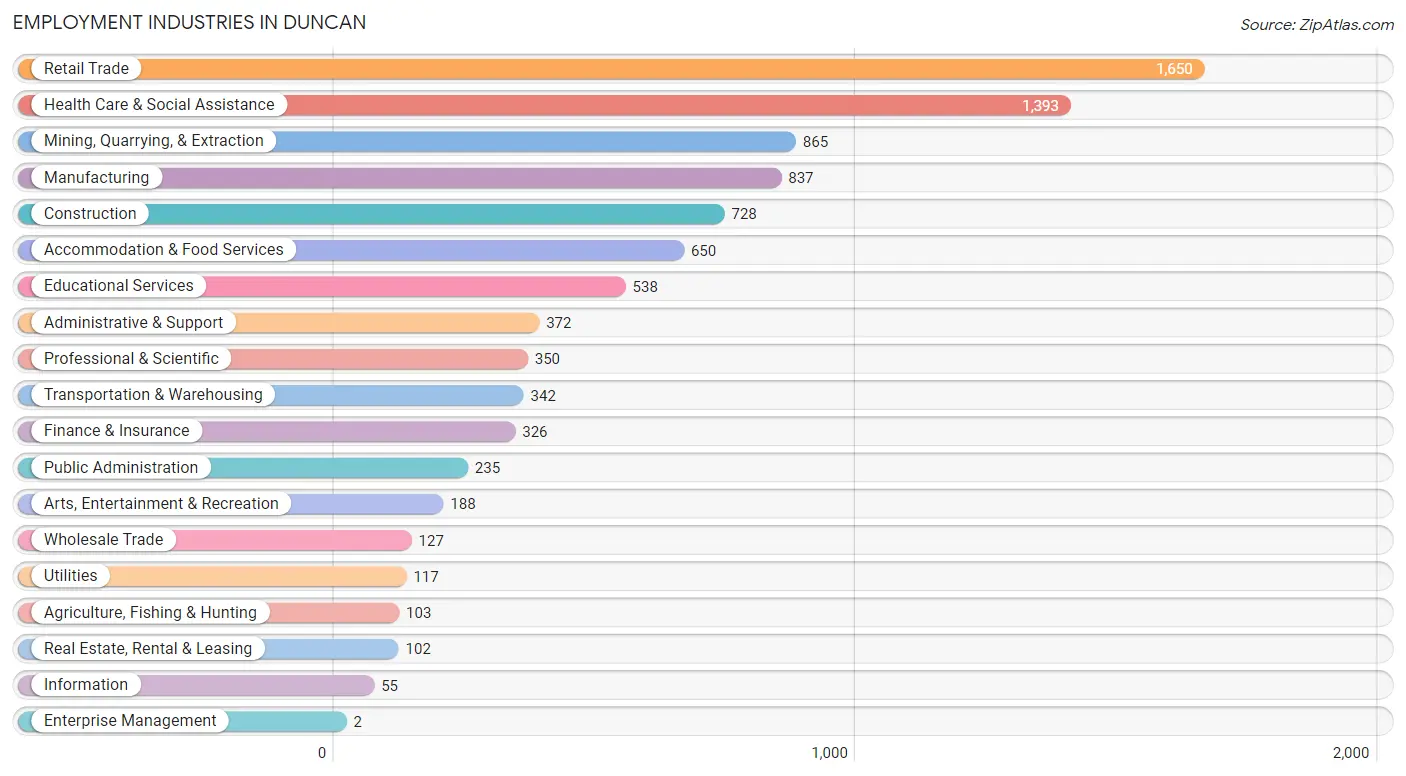
Employment Industries in Duncan
The major employment industries in Duncan include Retail Trade (1,650 | 17.3%), Health Care & Social Assistance (1,393 | 14.6%), Mining, Quarrying, & Extraction (865 | 9.1%), Manufacturing (837 | 8.8%), and Construction (728 | 7.6%).
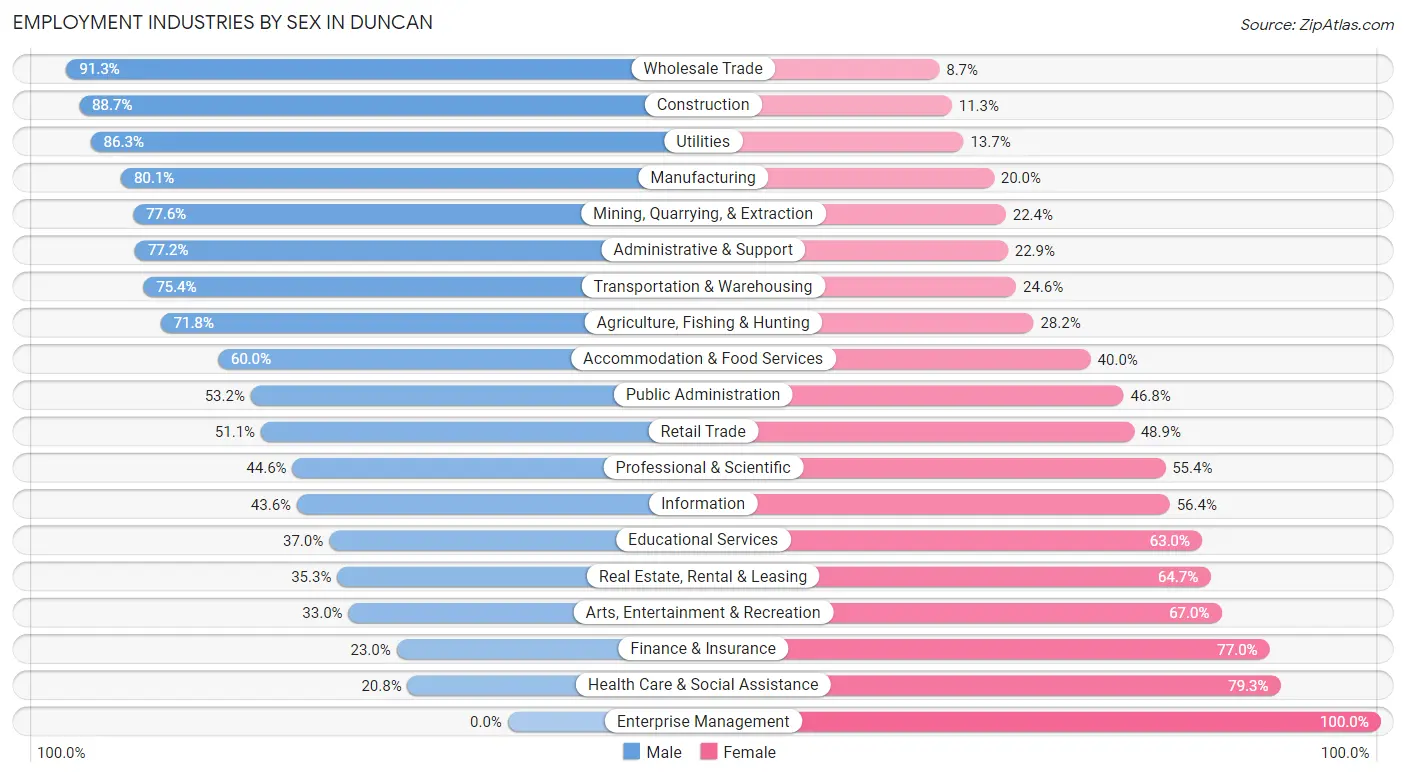
Employment Industries by Sex in Duncan
The Duncan industries that see more men than women are Wholesale Trade (91.3%), Construction (88.7%), and Utilities (86.3%), whereas the industries that tend to have a higher number of women are Enterprise Management (100.0%), Health Care & Social Assistance (79.2%), and Finance & Insurance (77.0%).
| Industry | Male | Female |
| Agriculture, Fishing & Hunting | 74 (71.8%) | 29 (28.2%) |
| Mining, Quarrying, & Extraction | 671 (77.6%) | 194 (22.4%) |
| Construction | 646 (88.7%) | 82 (11.3%) |
| Manufacturing | 670 (80.0%) | 167 (20.0%) |
| Wholesale Trade | 116 (91.3%) | 11 (8.7%) |
| Retail Trade | 843 (51.1%) | 807 (48.9%) |
| Transportation & Warehousing | 258 (75.4%) | 84 (24.6%) |
| Utilities | 101 (86.3%) | 16 (13.7%) |
| Information | 24 (43.6%) | 31 (56.4%) |
| Finance & Insurance | 75 (23.0%) | 251 (77.0%) |
| Real Estate, Rental & Leasing | 36 (35.3%) | 66 (64.7%) |
| Professional & Scientific | 156 (44.6%) | 194 (55.4%) |
| Enterprise Management | 0 (0.0%) | 2 (100.0%) |
| Administrative & Support | 287 (77.1%) | 85 (22.9%) |
| Educational Services | 199 (37.0%) | 339 (63.0%) |
| Health Care & Social Assistance | 289 (20.7%) | 1,104 (79.2%) |
| Arts, Entertainment & Recreation | 62 (33.0%) | 126 (67.0%) |
| Accommodation & Food Services | 390 (60.0%) | 260 (40.0%) |
| Public Administration | 125 (53.2%) | 110 (46.8%) |
| Total | 5,238 (55.0%) | 4,287 (45.0%) |
Education in Duncan
School Enrollment in Duncan
The most common levels of schooling among the 4,791 students in Duncan are high school (1,356 | 28.3%), middle school (1,106 | 23.1%), and elementary school (1,063 | 22.2%).
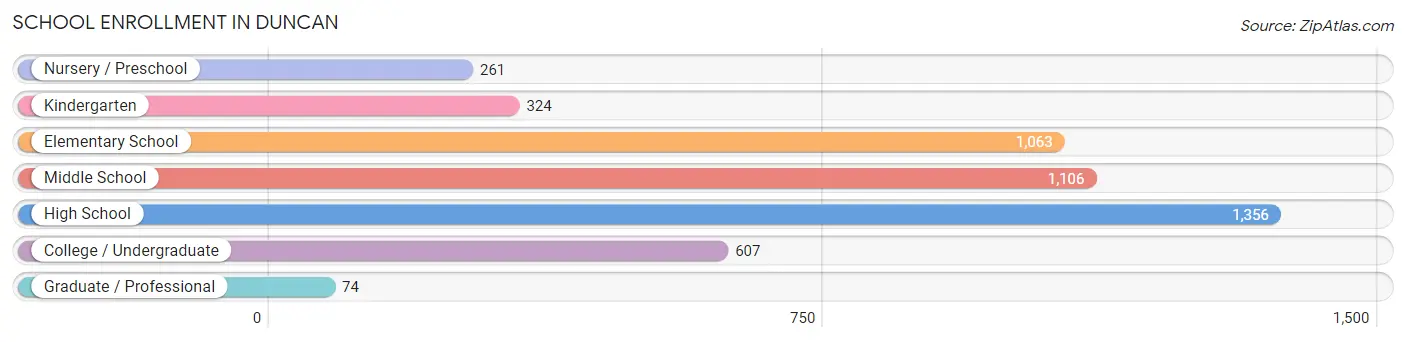
| School Level | # Students | % Students |
| Nursery / Preschool | 261 | 5.4% |
| Kindergarten | 324 | 6.8% |
| Elementary School | 1,063 | 22.2% |
| Middle School | 1,106 | 23.1% |
| High School | 1,356 | 28.3% |
| College / Undergraduate | 607 | 12.7% |
| Graduate / Professional | 74 | 1.5% |
| Total | 4,791 | 100.0% |
School Enrollment by Age by Funding Source in Duncan
Out of a total of 4,791 students who are enrolled in schools in Duncan, 345 (7.2%) attend a private institution, while the remaining 4,446 (92.8%) are enrolled in public schools. The age group of 35 years and over has the highest likelihood of being enrolled in private schools, with 31 (15.7% in the age bracket) enrolled. Conversely, the age group of 3 to 4 year olds has the lowest likelihood of being enrolled in a private school, with 211 (100.0% in the age bracket) attending a public institution.
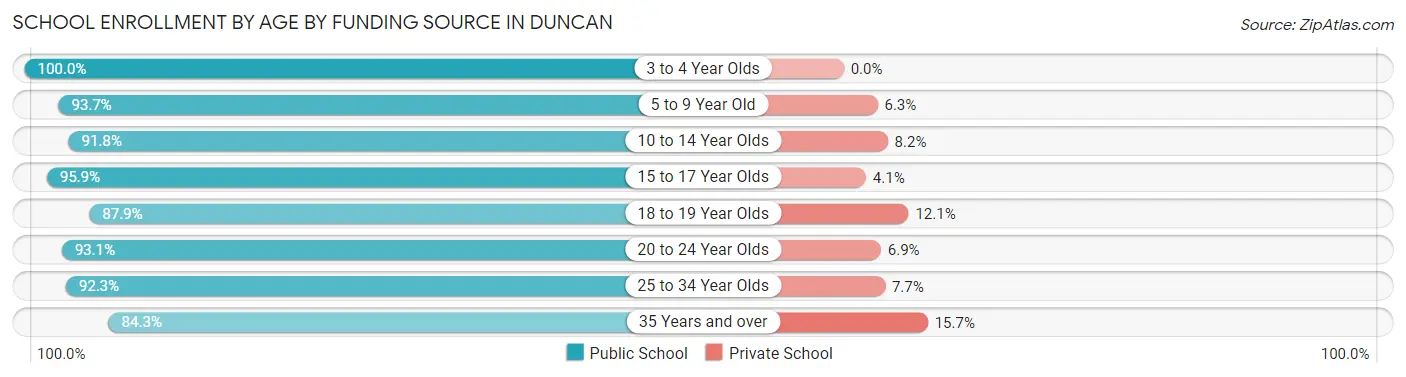
| Age Bracket | Public School | Private School |
| 3 to 4 Year Olds | 211 (100.0%) | 0 (0.0%) |
| 5 to 9 Year Old | 1,158 (93.7%) | 78 (6.3%) |
| 10 to 14 Year Olds | 1,346 (91.8%) | 120 (8.2%) |
| 15 to 17 Year Olds | 810 (95.9%) | 35 (4.1%) |
| 18 to 19 Year Olds | 357 (87.9%) | 49 (12.1%) |
| 20 to 24 Year Olds | 242 (93.1%) | 18 (6.9%) |
| 25 to 34 Year Olds | 156 (92.3%) | 13 (7.7%) |
| 35 Years and over | 167 (84.3%) | 31 (15.7%) |
| Total | 4,446 (92.8%) | 345 (7.2%) |
Educational Attainment by Field of Study in Duncan
Business (707 | 22.1%), education (700 | 21.8%), science & technology (421 | 13.1%), bio, nature & agricultural (158 | 4.9%), and psychology (158 | 4.9%) are the most common fields of study among 3,205 individuals in Duncan who have obtained a bachelor's degree or higher.
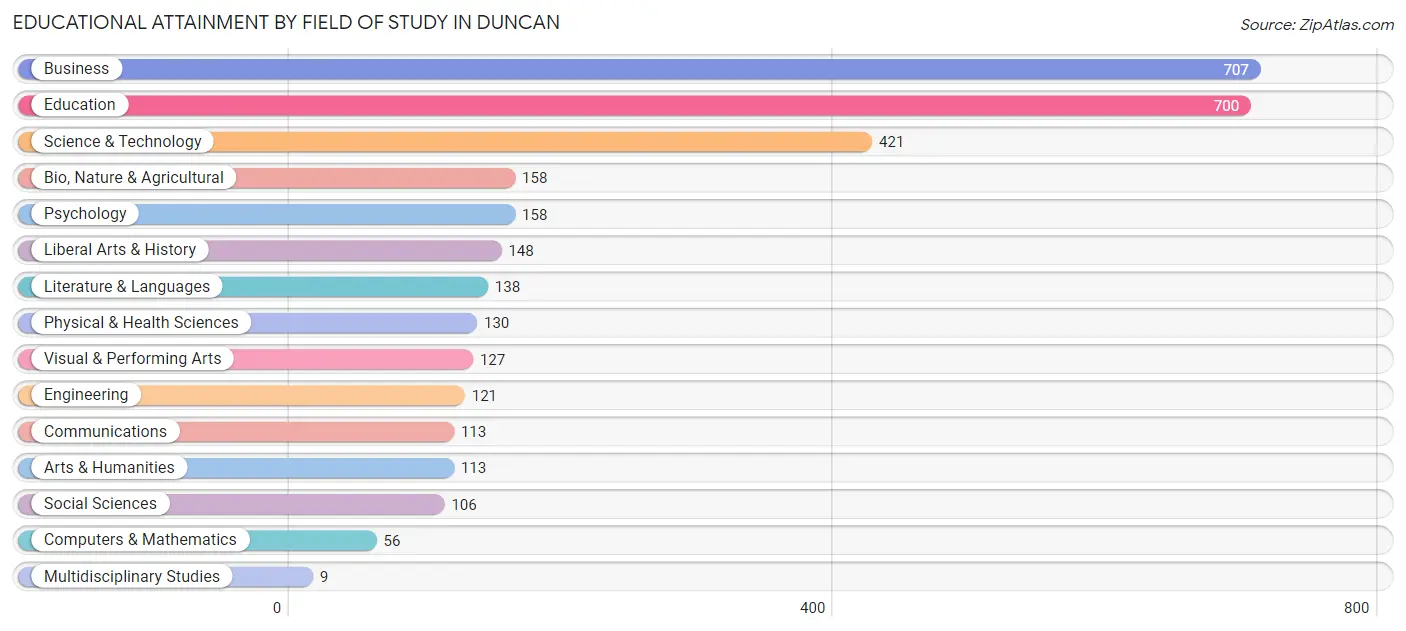
| Field of Study | # Graduates | % Graduates |
| Computers & Mathematics | 56 | 1.8% |
| Bio, Nature & Agricultural | 158 | 4.9% |
| Physical & Health Sciences | 130 | 4.1% |
| Psychology | 158 | 4.9% |
| Social Sciences | 106 | 3.3% |
| Engineering | 121 | 3.8% |
| Multidisciplinary Studies | 9 | 0.3% |
| Science & Technology | 421 | 13.1% |
| Business | 707 | 22.1% |
| Education | 700 | 21.8% |
| Literature & Languages | 138 | 4.3% |
| Liberal Arts & History | 148 | 4.6% |
| Visual & Performing Arts | 127 | 4.0% |
| Communications | 113 | 3.5% |
| Arts & Humanities | 113 | 3.5% |
| Total | 3,205 | 100.0% |
Transportation & Commute in Duncan
Vehicle Availability by Sex in Duncan
The most prevalent vehicle ownership categories in Duncan are males with 2 vehicles (2,110, accounting for 41.0%) and females with 2 vehicles (1,717, making up 50.5%).
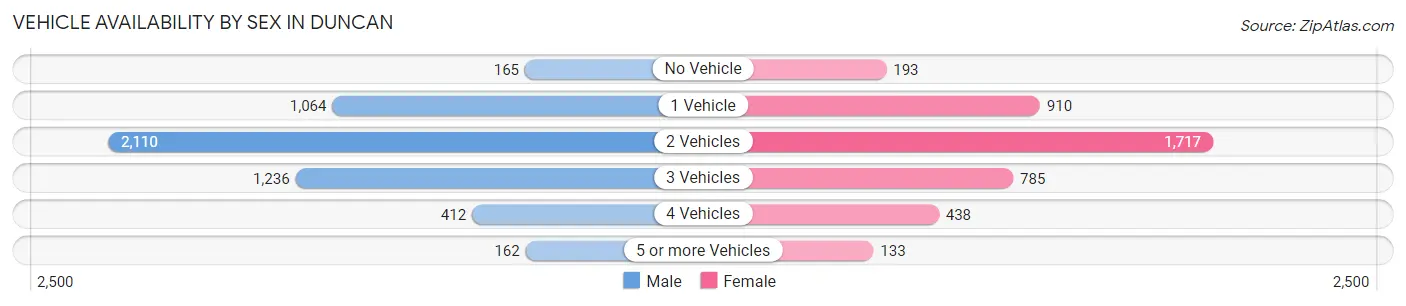
| Vehicles Available | Male | Female |
| No Vehicle | 165 (3.2%) | 193 (4.6%) |
| 1 Vehicle | 1,064 (20.7%) | 910 (21.8%) |
| 2 Vehicles | 2,110 (41.0%) | 1,717 (41.1%) |
| 3 Vehicles | 1,236 (24.0%) | 785 (18.8%) |
| 4 Vehicles | 412 (8.0%) | 438 (10.5%) |
| 5 or more Vehicles | 162 (3.2%) | 133 (3.2%) |
| Total | 5,149 (100.0%) | 4,176 (100.0%) |
Commute Time in Duncan
The most frequently occuring commute durations in Duncan are 10 to 14 minutes (2,444 commuters, 27.1%), 5 to 9 minutes (2,242 commuters, 24.8%), and 15 to 19 minutes (1,416 commuters, 15.7%).
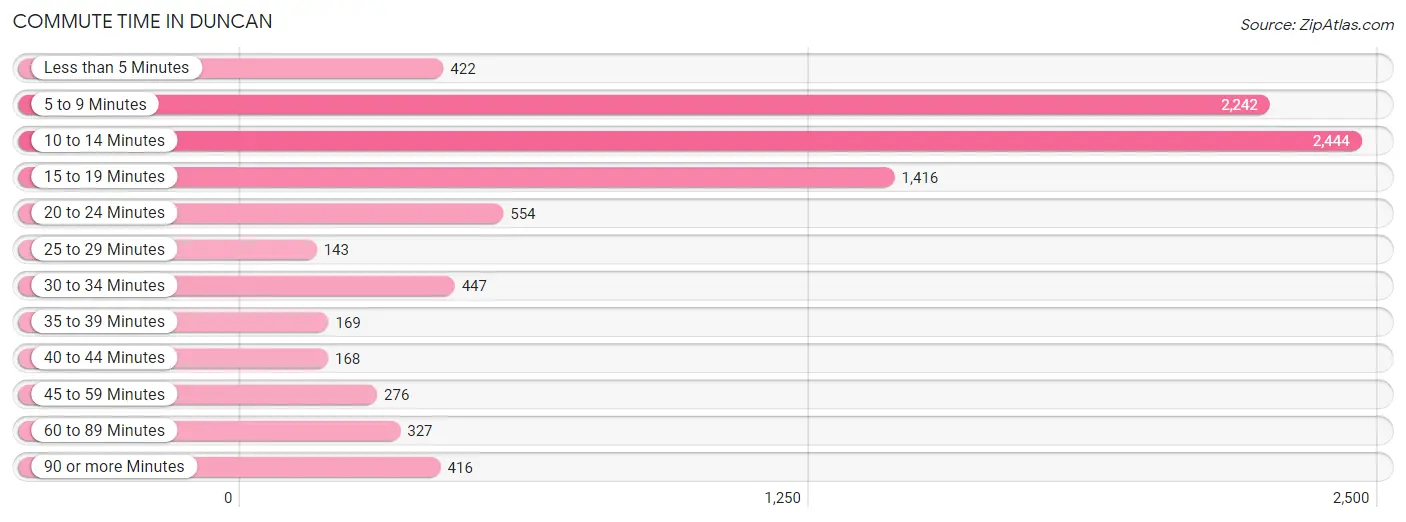
| Commute Time | # Commuters | % Commuters |
| Less than 5 Minutes | 422 | 4.7% |
| 5 to 9 Minutes | 2,242 | 24.8% |
| 10 to 14 Minutes | 2,444 | 27.1% |
| 15 to 19 Minutes | 1,416 | 15.7% |
| 20 to 24 Minutes | 554 | 6.1% |
| 25 to 29 Minutes | 143 | 1.6% |
| 30 to 34 Minutes | 447 | 5.0% |
| 35 to 39 Minutes | 169 | 1.9% |
| 40 to 44 Minutes | 168 | 1.9% |
| 45 to 59 Minutes | 276 | 3.1% |
| 60 to 89 Minutes | 327 | 3.6% |
| 90 or more Minutes | 416 | 4.6% |
Commute Time by Sex in Duncan
The most common commute times in Duncan are 10 to 14 minutes (1,231 commuters, 24.6%) for males and 5 to 9 minutes (1,305 commuters, 32.5%) for females.
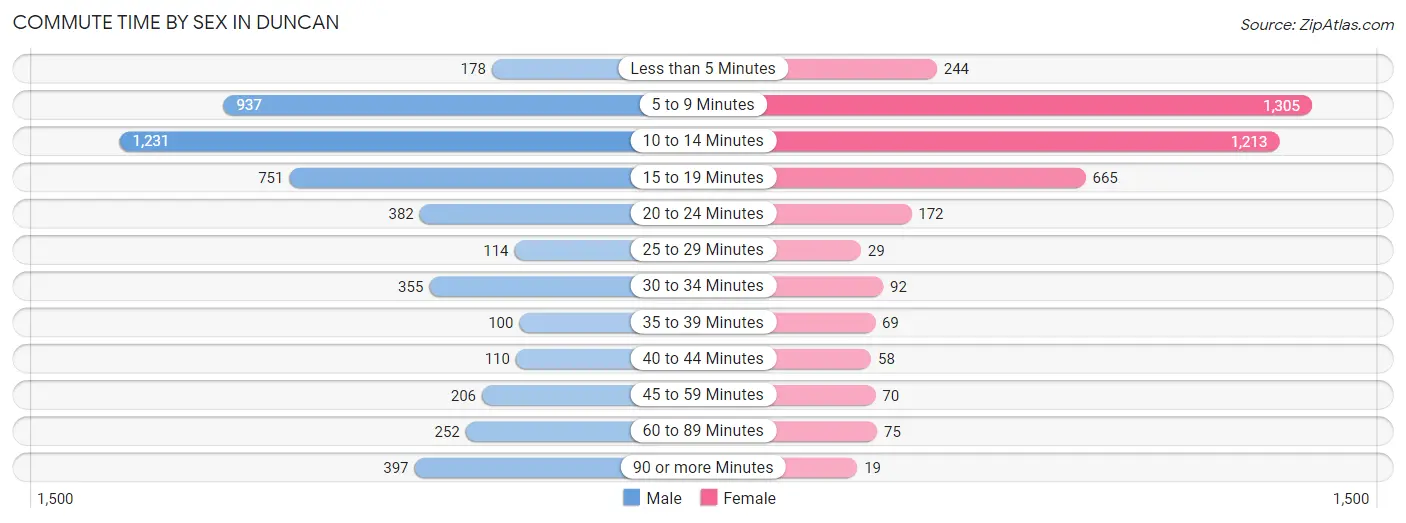
| Commute Time | Male | Female |
| Less than 5 Minutes | 178 (3.5%) | 244 (6.1%) |
| 5 to 9 Minutes | 937 (18.7%) | 1,305 (32.5%) |
| 10 to 14 Minutes | 1,231 (24.6%) | 1,213 (30.2%) |
| 15 to 19 Minutes | 751 (15.0%) | 665 (16.6%) |
| 20 to 24 Minutes | 382 (7.6%) | 172 (4.3%) |
| 25 to 29 Minutes | 114 (2.3%) | 29 (0.7%) |
| 30 to 34 Minutes | 355 (7.1%) | 92 (2.3%) |
| 35 to 39 Minutes | 100 (2.0%) | 69 (1.7%) |
| 40 to 44 Minutes | 110 (2.2%) | 58 (1.5%) |
| 45 to 59 Minutes | 206 (4.1%) | 70 (1.8%) |
| 60 to 89 Minutes | 252 (5.0%) | 75 (1.9%) |
| 90 or more Minutes | 397 (7.9%) | 19 (0.5%) |
Time of Departure to Work by Sex in Duncan
The most frequent times of departure to work in Duncan are 7:30 AM to 7:59 AM (774, 15.4%) for males and 7:30 AM to 7:59 AM (996, 24.8%) for females.
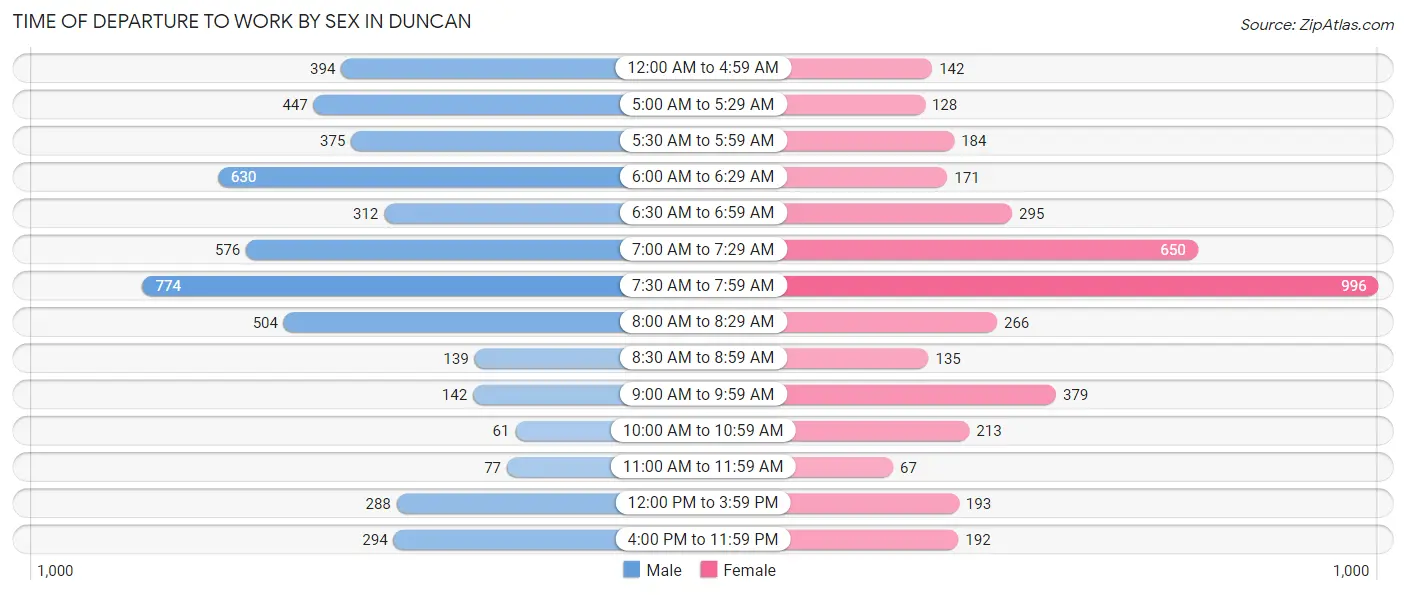
| Time of Departure | Male | Female |
| 12:00 AM to 4:59 AM | 394 (7.9%) | 142 (3.5%) |
| 5:00 AM to 5:29 AM | 447 (8.9%) | 128 (3.2%) |
| 5:30 AM to 5:59 AM | 375 (7.5%) | 184 (4.6%) |
| 6:00 AM to 6:29 AM | 630 (12.6%) | 171 (4.3%) |
| 6:30 AM to 6:59 AM | 312 (6.2%) | 295 (7.3%) |
| 7:00 AM to 7:29 AM | 576 (11.5%) | 650 (16.2%) |
| 7:30 AM to 7:59 AM | 774 (15.4%) | 996 (24.8%) |
| 8:00 AM to 8:29 AM | 504 (10.1%) | 266 (6.6%) |
| 8:30 AM to 8:59 AM | 139 (2.8%) | 135 (3.4%) |
| 9:00 AM to 9:59 AM | 142 (2.8%) | 379 (9.5%) |
| 10:00 AM to 10:59 AM | 61 (1.2%) | 213 (5.3%) |
| 11:00 AM to 11:59 AM | 77 (1.5%) | 67 (1.7%) |
| 12:00 PM to 3:59 PM | 288 (5.8%) | 193 (4.8%) |
| 4:00 PM to 11:59 PM | 294 (5.9%) | 192 (4.8%) |
| Total | 5,013 (100.0%) | 4,011 (100.0%) |
Housing Occupancy in Duncan
Occupancy by Ownership in Duncan
Of the total 9,231 dwellings in Duncan, owner-occupied units account for 6,246 (67.7%), while renter-occupied units make up 2,985 (32.3%).
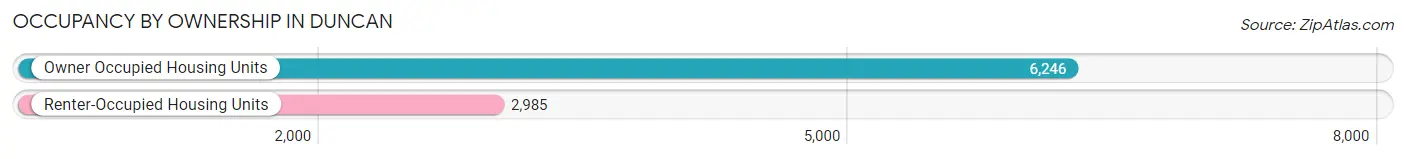
| Occupancy | # Housing Units | % Housing Units |
| Owner Occupied Housing Units | 6,246 | 67.7% |
| Renter-Occupied Housing Units | 2,985 | 32.3% |
| Total Occupied Housing Units | 9,231 | 100.0% |
Occupancy by Household Size in Duncan
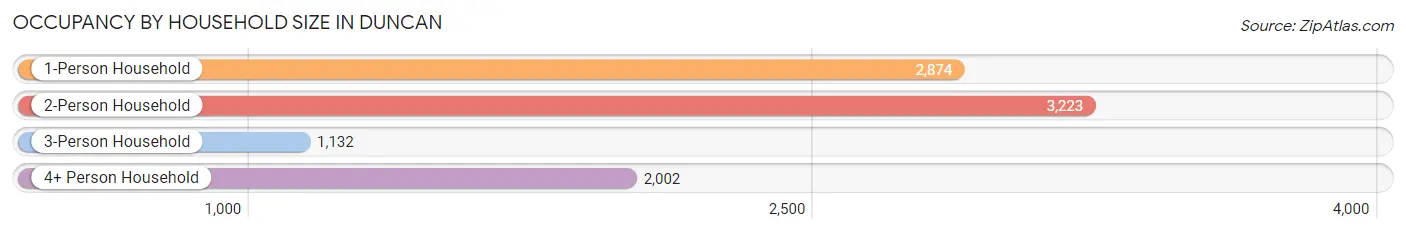
| Household Size | # Housing Units | % Housing Units |
| 1-Person Household | 2,874 | 31.1% |
| 2-Person Household | 3,223 | 34.9% |
| 3-Person Household | 1,132 | 12.3% |
| 4+ Person Household | 2,002 | 21.7% |
| Total Housing Units | 9,231 | 100.0% |
Occupancy by Ownership by Household Size in Duncan
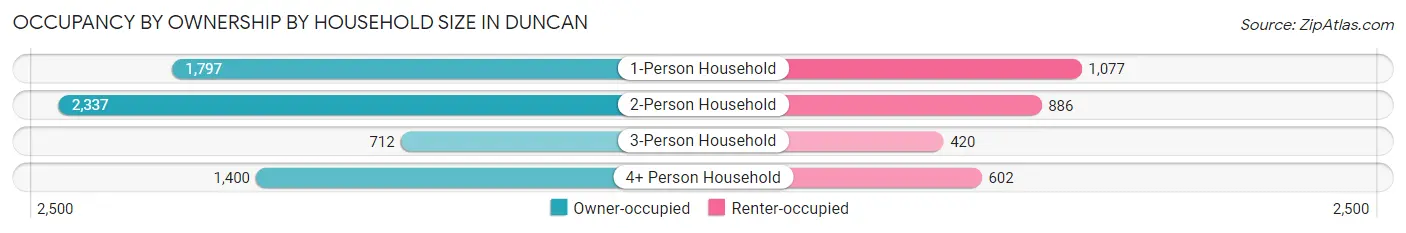
| Household Size | Owner-occupied | Renter-occupied |
| 1-Person Household | 1,797 (62.5%) | 1,077 (37.5%) |
| 2-Person Household | 2,337 (72.5%) | 886 (27.5%) |
| 3-Person Household | 712 (62.9%) | 420 (37.1%) |
| 4+ Person Household | 1,400 (69.9%) | 602 (30.1%) |
| Total Housing Units | 6,246 (67.7%) | 2,985 (32.3%) |
Occupancy by Educational Attainment in Duncan
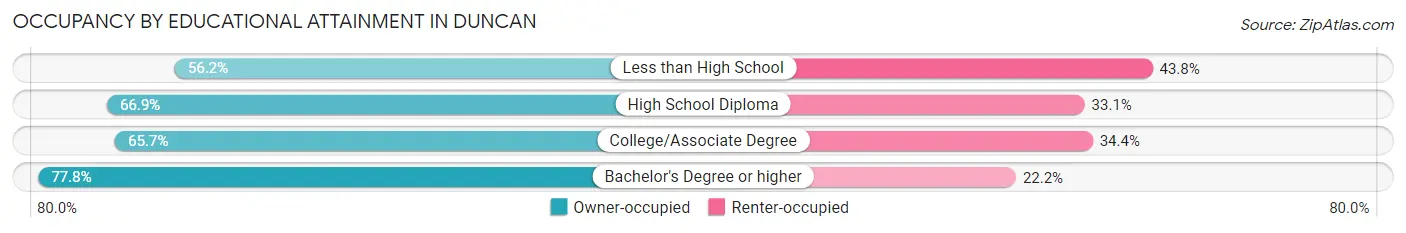
| Household Size | Owner-occupied | Renter-occupied |
| Less than High School | 615 (56.2%) | 480 (43.8%) |
| High School Diploma | 2,277 (66.9%) | 1,125 (33.1%) |
| College/Associate Degree | 1,781 (65.6%) | 932 (34.4%) |
| Bachelor's Degree or higher | 1,573 (77.8%) | 448 (22.2%) |
Occupancy by Age of Householder in Duncan
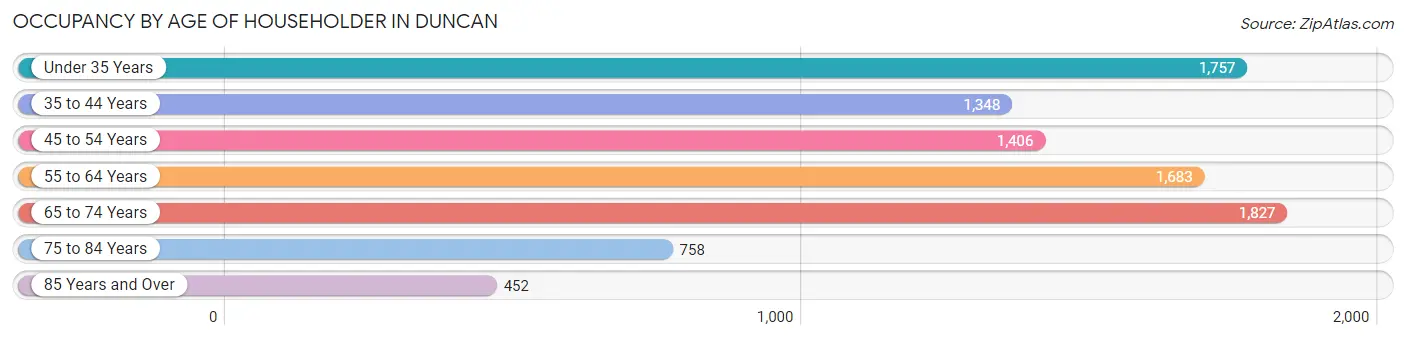
| Age Bracket | # Households | % Households |
| Under 35 Years | 1,757 | 19.0% |
| 35 to 44 Years | 1,348 | 14.6% |
| 45 to 54 Years | 1,406 | 15.2% |
| 55 to 64 Years | 1,683 | 18.2% |
| 65 to 74 Years | 1,827 | 19.8% |
| 75 to 84 Years | 758 | 8.2% |
| 85 Years and Over | 452 | 4.9% |
| Total | 9,231 | 100.0% |
Housing Finances in Duncan
Median Income by Occupancy in Duncan
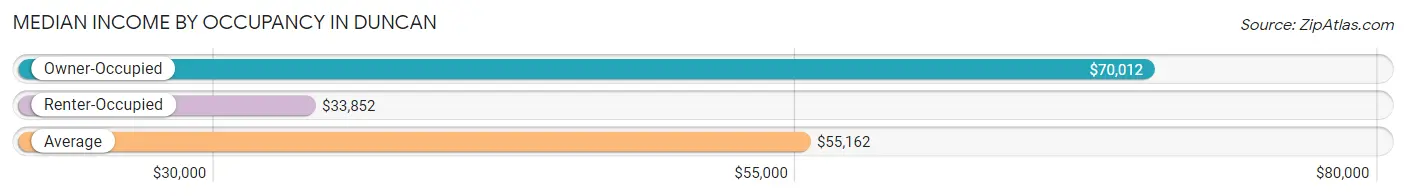
| Occupancy Type | # Households | Median Income |
| Owner-Occupied | 6,246 (67.7%) | $70,012 |
| Renter-Occupied | 2,985 (32.3%) | $33,852 |
| Average | 9,231 (100.0%) | $55,162 |
Occupancy by Householder Income Bracket in Duncan
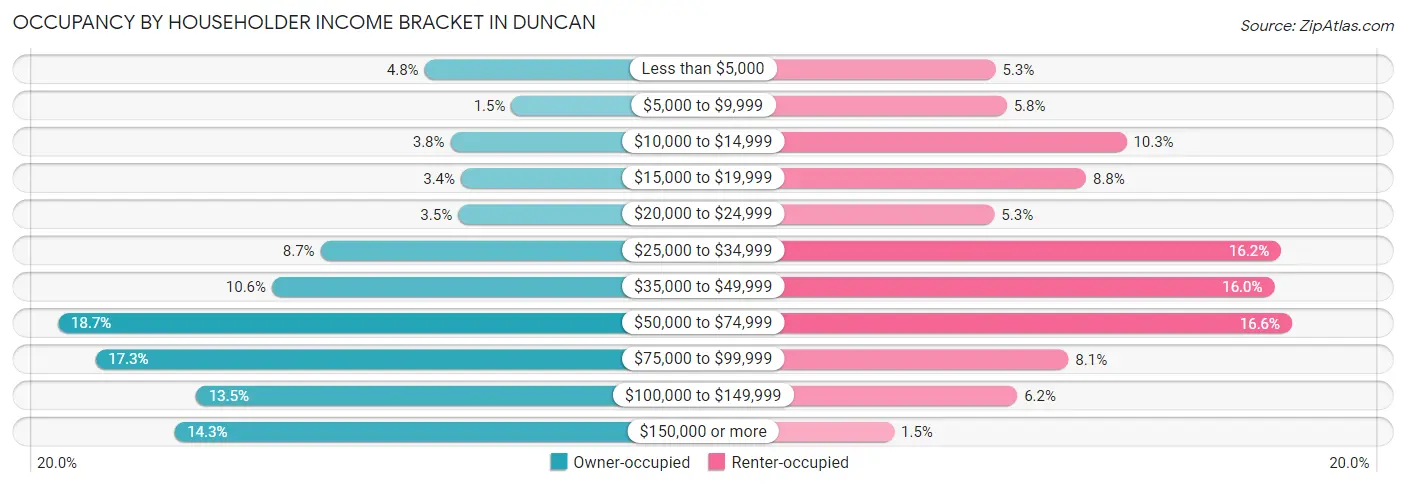
| Income Bracket | Owner-occupied | Renter-occupied |
| Less than $5,000 | 298 (4.8%) | 159 (5.3%) |
| $5,000 to $9,999 | 91 (1.5%) | 172 (5.8%) |
| $10,000 to $14,999 | 236 (3.8%) | 308 (10.3%) |
| $15,000 to $19,999 | 211 (3.4%) | 262 (8.8%) |
| $20,000 to $24,999 | 218 (3.5%) | 158 (5.3%) |
| $25,000 to $34,999 | 545 (8.7%) | 484 (16.2%) |
| $35,000 to $49,999 | 661 (10.6%) | 476 (16.0%) |
| $50,000 to $74,999 | 1,170 (18.7%) | 496 (16.6%) |
| $75,000 to $99,999 | 1,081 (17.3%) | 242 (8.1%) |
| $100,000 to $149,999 | 842 (13.5%) | 184 (6.2%) |
| $150,000 or more | 893 (14.3%) | 44 (1.5%) |
| Total | 6,246 (100.0%) | 2,985 (100.0%) |
Monthly Housing Cost Tiers in Duncan
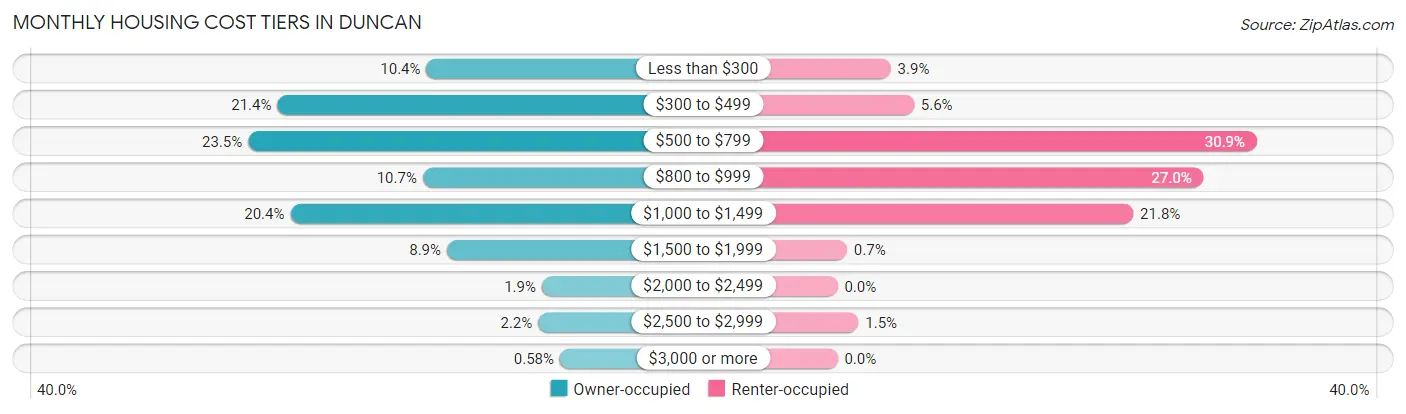
| Monthly Cost | Owner-occupied | Renter-occupied |
| Less than $300 | 650 (10.4%) | 117 (3.9%) |
| $300 to $499 | 1,336 (21.4%) | 168 (5.6%) |
| $500 to $799 | 1,470 (23.5%) | 922 (30.9%) |
| $800 to $999 | 667 (10.7%) | 805 (27.0%) |
| $1,000 to $1,499 | 1,276 (20.4%) | 650 (21.8%) |
| $1,500 to $1,999 | 556 (8.9%) | 21 (0.7%) |
| $2,000 to $2,499 | 119 (1.9%) | 0 (0.0%) |
| $2,500 to $2,999 | 136 (2.2%) | 46 (1.5%) |
| $3,000 or more | 36 (0.6%) | 0 (0.0%) |
| Total | 6,246 (100.0%) | 2,985 (100.0%) |
Physical Housing Characteristics in Duncan
Housing Structures in Duncan
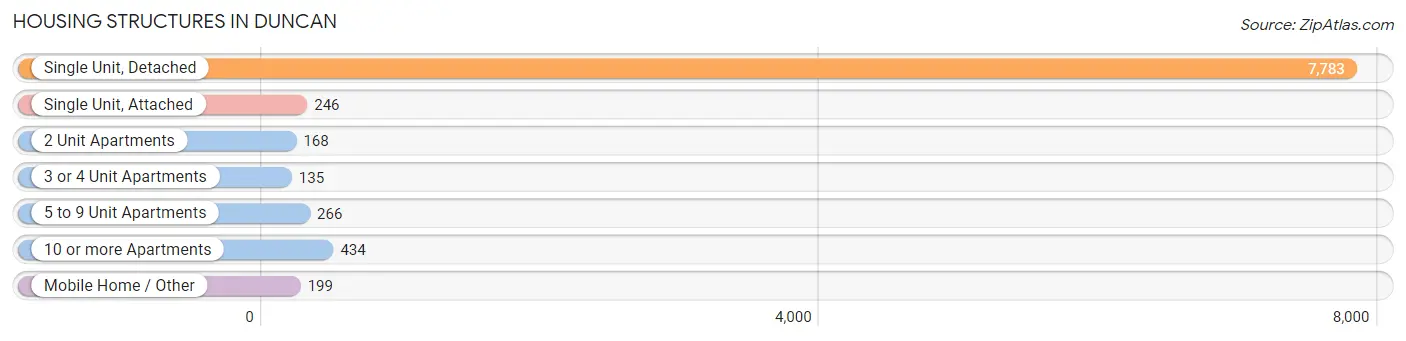
| Structure Type | # Housing Units | % Housing Units |
| Single Unit, Detached | 7,783 | 84.3% |
| Single Unit, Attached | 246 | 2.7% |
| 2 Unit Apartments | 168 | 1.8% |
| 3 or 4 Unit Apartments | 135 | 1.5% |
| 5 to 9 Unit Apartments | 266 | 2.9% |
| 10 or more Apartments | 434 | 4.7% |
| Mobile Home / Other | 199 | 2.2% |
| Total | 9,231 | 100.0% |
Housing Structures by Occupancy in Duncan
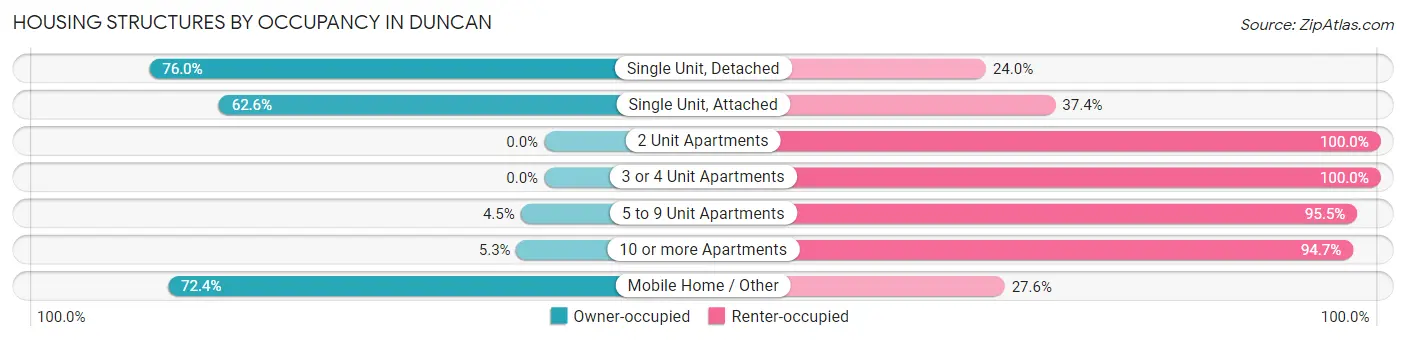
| Structure Type | Owner-occupied | Renter-occupied |
| Single Unit, Detached | 5,913 (76.0%) | 1,870 (24.0%) |
| Single Unit, Attached | 154 (62.6%) | 92 (37.4%) |
| 2 Unit Apartments | 0 (0.0%) | 168 (100.0%) |
| 3 or 4 Unit Apartments | 0 (0.0%) | 135 (100.0%) |
| 5 to 9 Unit Apartments | 12 (4.5%) | 254 (95.5%) |
| 10 or more Apartments | 23 (5.3%) | 411 (94.7%) |
| Mobile Home / Other | 144 (72.4%) | 55 (27.6%) |
| Total | 6,246 (67.7%) | 2,985 (32.3%) |
Housing Structures by Number of Rooms in Duncan
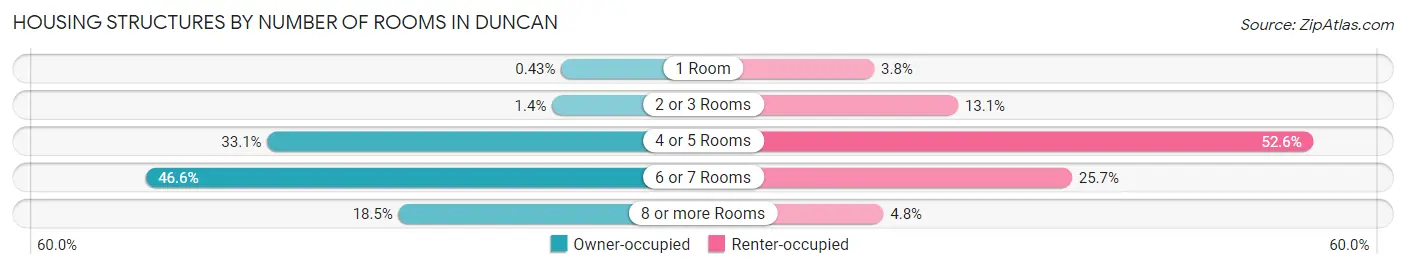
| Number of Rooms | Owner-occupied | Renter-occupied |
| 1 Room | 27 (0.4%) | 113 (3.8%) |
| 2 or 3 Rooms | 90 (1.4%) | 391 (13.1%) |
| 4 or 5 Rooms | 2,064 (33.1%) | 1,569 (52.6%) |
| 6 or 7 Rooms | 2,911 (46.6%) | 768 (25.7%) |
| 8 or more Rooms | 1,154 (18.5%) | 144 (4.8%) |
| Total | 6,246 (100.0%) | 2,985 (100.0%) |
Housing Structure by Heating Type in Duncan
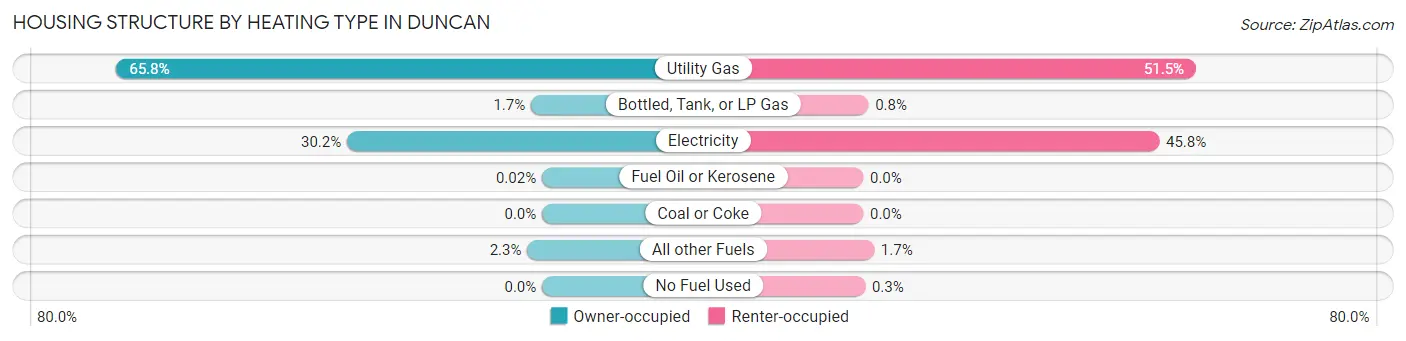
| Heating Type | Owner-occupied | Renter-occupied |
| Utility Gas | 4,111 (65.8%) | 1,536 (51.5%) |
| Bottled, Tank, or LP Gas | 107 (1.7%) | 24 (0.8%) |
| Electricity | 1,884 (30.2%) | 1,366 (45.8%) |
| Fuel Oil or Kerosene | 1 (0.0%) | 0 (0.0%) |
| Coal or Coke | 0 (0.0%) | 0 (0.0%) |
| All other Fuels | 143 (2.3%) | 50 (1.7%) |
| No Fuel Used | 0 (0.0%) | 9 (0.3%) |
| Total | 6,246 (100.0%) | 2,985 (100.0%) |
Household Vehicle Usage in Duncan
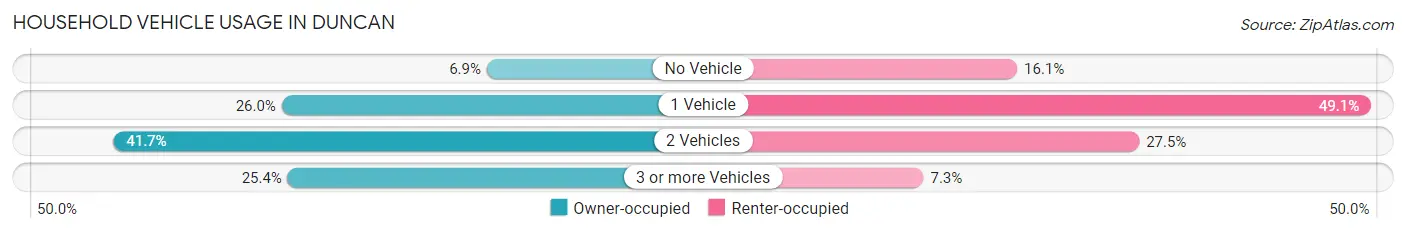
| Vehicles per Household | Owner-occupied | Renter-occupied |
| No Vehicle | 428 (6.9%) | 480 (16.1%) |
| 1 Vehicle | 1,624 (26.0%) | 1,466 (49.1%) |
| 2 Vehicles | 2,605 (41.7%) | 820 (27.5%) |
| 3 or more Vehicles | 1,589 (25.4%) | 219 (7.3%) |
| Total | 6,246 (100.0%) | 2,985 (100.0%) |
Real Estate & Mortgages in Duncan
Real Estate and Mortgage Overview in Duncan
| Characteristic | Without Mortgage | With Mortgage |
| Housing Units | 3,290 | 2,956 |
| Median Property Value | $107,200 | $138,800 |
| Median Household Income | $58,086 | $572 |
| Monthly Housing Costs | $442 | $36 |
| Real Estate Taxes | $795 | $298 |
Property Value by Mortgage Status in Duncan
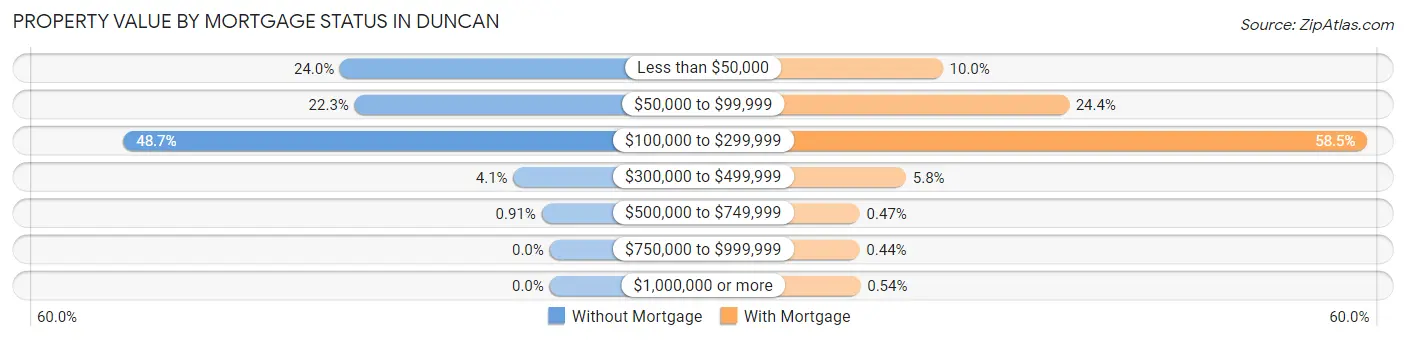
| Property Value | Without Mortgage | With Mortgage |
| Less than $50,000 | 788 (23.9%) | 294 (10.0%) |
| $50,000 to $99,999 | 733 (22.3%) | 720 (24.4%) |
| $100,000 to $299,999 | 1,603 (48.7%) | 1,729 (58.5%) |
| $300,000 to $499,999 | 136 (4.1%) | 170 (5.8%) |
| $500,000 to $749,999 | 30 (0.9%) | 14 (0.5%) |
| $750,000 to $999,999 | 0 (0.0%) | 13 (0.4%) |
| $1,000,000 or more | 0 (0.0%) | 16 (0.5%) |
| Total | 3,290 (100.0%) | 2,956 (100.0%) |
Household Income by Mortgage Status in Duncan
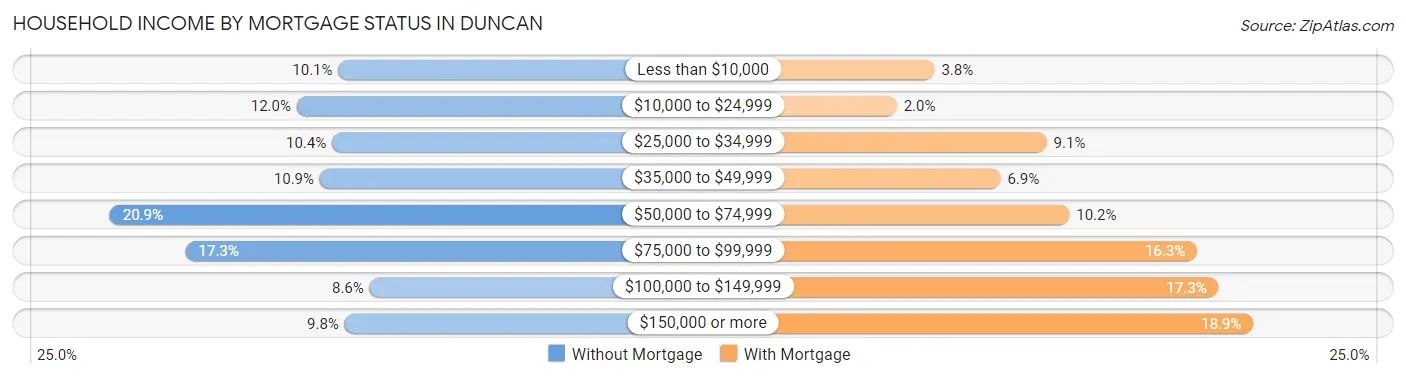
| Household Income | Without Mortgage | With Mortgage |
| Less than $10,000 | 331 (10.1%) | 111 (3.8%) |
| $10,000 to $24,999 | 396 (12.0%) | 58 (2.0%) |
| $25,000 to $34,999 | 341 (10.4%) | 269 (9.1%) |
| $35,000 to $49,999 | 360 (10.9%) | 204 (6.9%) |
| $50,000 to $74,999 | 689 (20.9%) | 301 (10.2%) |
| $75,000 to $99,999 | 570 (17.3%) | 481 (16.3%) |
| $100,000 to $149,999 | 282 (8.6%) | 511 (17.3%) |
| $150,000 or more | 321 (9.8%) | 560 (18.9%) |
| Total | 3,290 (100.0%) | 2,956 (100.0%) |
Property Value to Household Income Ratio in Duncan
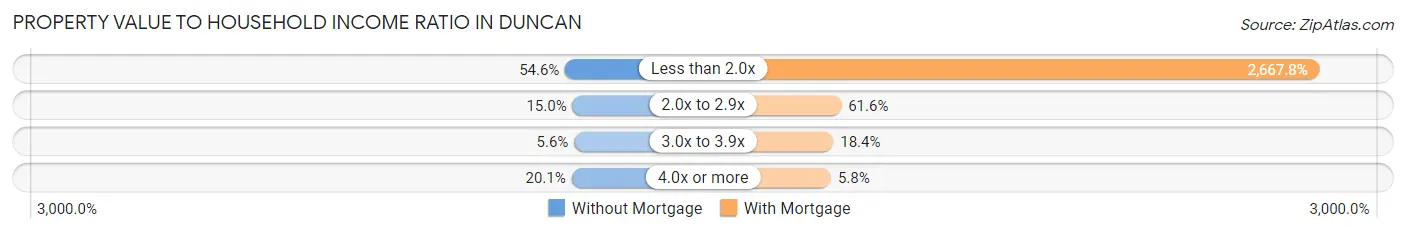
| Value-to-Income Ratio | Without Mortgage | With Mortgage |
| Less than 2.0x | 1,796 (54.6%) | 78,859 (2,667.8%) |
| 2.0x to 2.9x | 492 (14.9%) | 1,821 (61.6%) |
| 3.0x to 3.9x | 183 (5.6%) | 543 (18.4%) |
| 4.0x or more | 660 (20.1%) | 172 (5.8%) |
| Total | 3,290 (100.0%) | 2,956 (100.0%) |
Real Estate Taxes by Mortgage Status in Duncan
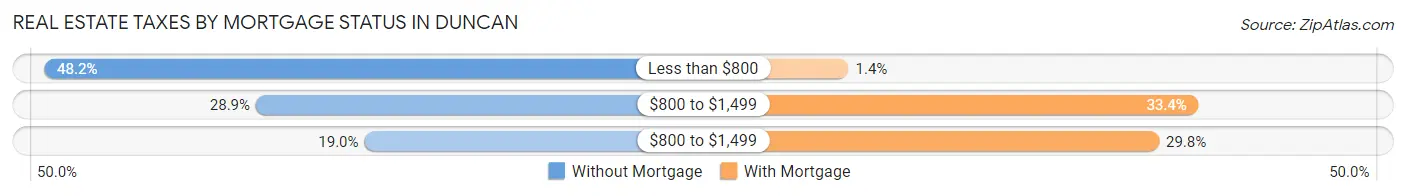
| Property Taxes | Without Mortgage | With Mortgage |
| Less than $800 | 1,586 (48.2%) | 42 (1.4%) |
| $800 to $1,499 | 950 (28.9%) | 987 (33.4%) |
| $800 to $1,499 | 624 (19.0%) | 880 (29.8%) |
| Total | 3,290 (100.0%) | 2,956 (100.0%) |
Health & Disability in Duncan
Health Insurance Coverage by Age in Duncan
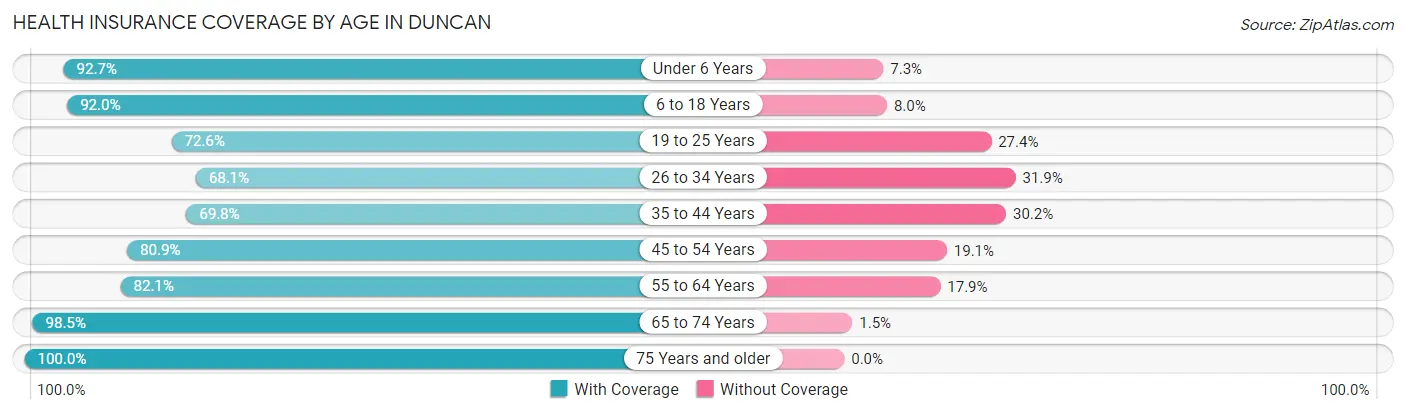
| Age Bracket | With Coverage | Without Coverage |
| Under 6 Years | 1,592 (92.7%) | 125 (7.3%) |
| 6 to 18 Years | 3,328 (92.0%) | 288 (8.0%) |
| 19 to 25 Years | 1,359 (72.6%) | 513 (27.4%) |
| 26 to 34 Years | 1,813 (68.1%) | 851 (31.9%) |
| 35 to 44 Years | 1,833 (69.8%) | 792 (30.2%) |
| 45 to 54 Years | 2,152 (80.9%) | 509 (19.1%) |
| 55 to 64 Years | 2,287 (82.1%) | 499 (17.9%) |
| 65 to 74 Years | 2,627 (98.5%) | 40 (1.5%) |
| 75 Years and older | 1,722 (100.0%) | 0 (0.0%) |
| Total | 18,713 (83.8%) | 3,617 (16.2%) |
Health Insurance Coverage by Citizenship Status in Duncan
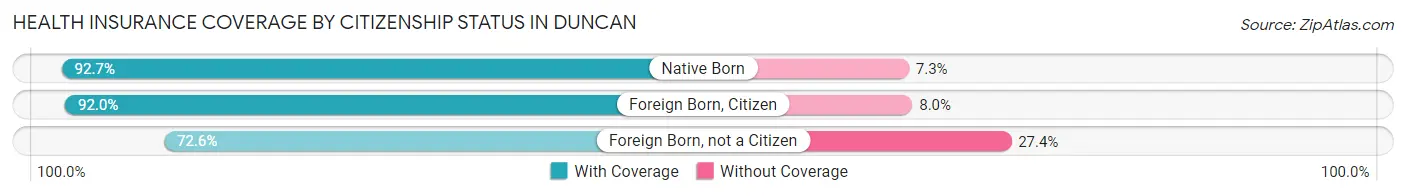
| Citizenship Status | With Coverage | Without Coverage |
| Native Born | 1,592 (92.7%) | 125 (7.3%) |
| Foreign Born, Citizen | 3,328 (92.0%) | 288 (8.0%) |
| Foreign Born, not a Citizen | 1,359 (72.6%) | 513 (27.4%) |
Health Insurance Coverage by Household Income in Duncan
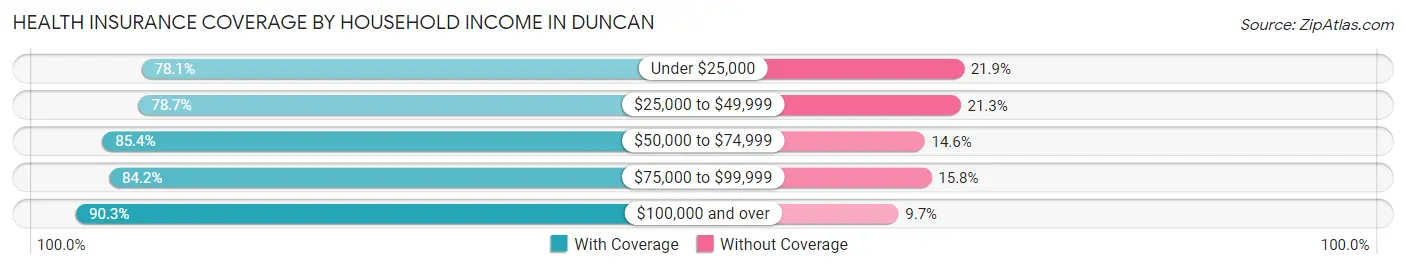
| Household Income | With Coverage | Without Coverage |
| Under $25,000 | 3,098 (78.1%) | 869 (21.9%) |
| $25,000 to $49,999 | 3,937 (78.7%) | 1,066 (21.3%) |
| $50,000 to $74,999 | 3,394 (85.4%) | 579 (14.6%) |
| $75,000 to $99,999 | 2,705 (84.2%) | 509 (15.8%) |
| $100,000 and over | 5,545 (90.3%) | 593 (9.7%) |
Public vs Private Health Insurance Coverage by Age in Duncan
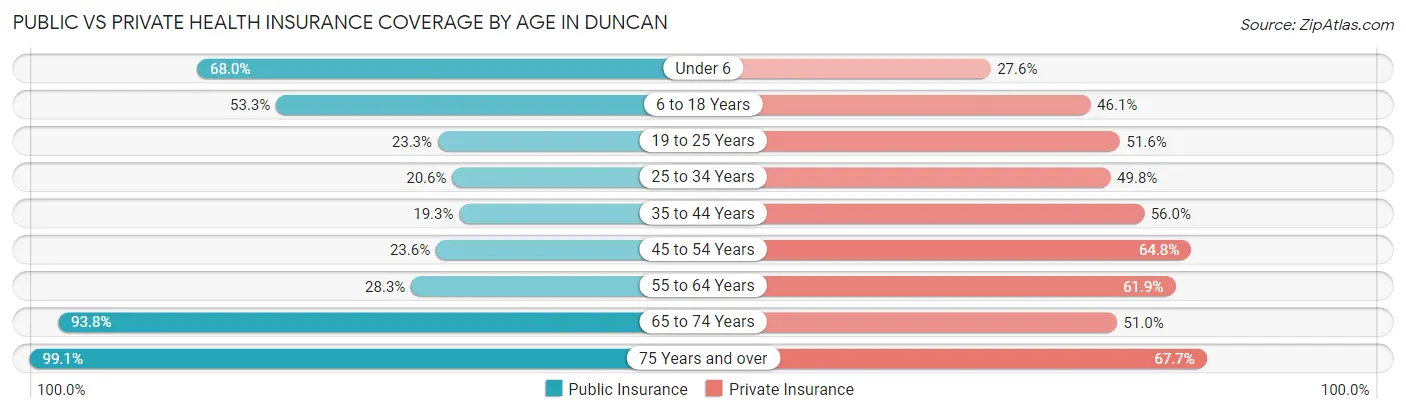
| Age Bracket | Public Insurance | Private Insurance |
| Under 6 | 1,167 (68.0%) | 473 (27.6%) |
| 6 to 18 Years | 1,928 (53.3%) | 1,667 (46.1%) |
| 19 to 25 Years | 436 (23.3%) | 965 (51.5%) |
| 25 to 34 Years | 549 (20.6%) | 1,327 (49.8%) |
| 35 to 44 Years | 507 (19.3%) | 1,471 (56.0%) |
| 45 to 54 Years | 629 (23.6%) | 1,725 (64.8%) |
| 55 to 64 Years | 787 (28.2%) | 1,724 (61.9%) |
| 65 to 74 Years | 2,501 (93.8%) | 1,360 (51.0%) |
| 75 Years and over | 1,706 (99.1%) | 1,166 (67.7%) |
| Total | 10,210 (45.7%) | 11,878 (53.2%) |
Disability Status by Sex by Age in Duncan
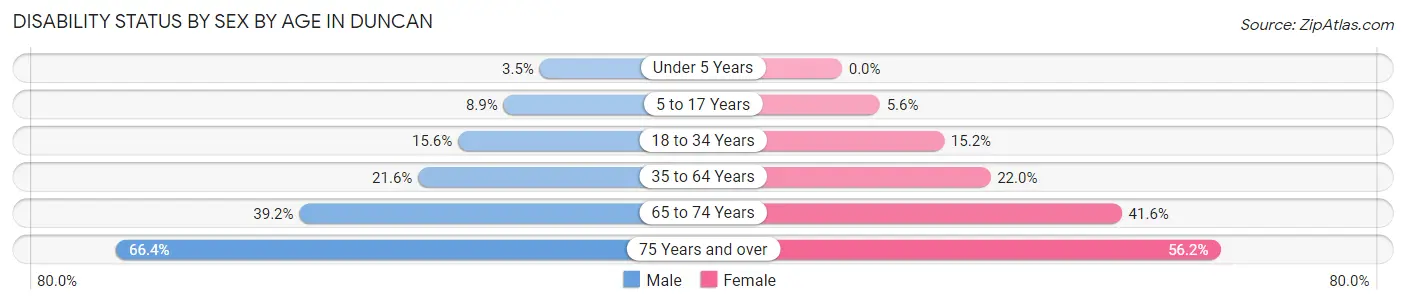
| Age Bracket | Male | Female |
| Under 5 Years | 24 (3.5%) | 0 (0.0%) |
| 5 to 17 Years | 168 (8.9%) | 101 (5.6%) |
| 18 to 34 Years | 381 (15.6%) | 363 (15.2%) |
| 35 to 64 Years | 860 (21.6%) | 900 (22.0%) |
| 65 to 74 Years | 423 (39.2%) | 660 (41.6%) |
| 75 Years and over | 419 (66.4%) | 613 (56.2%) |
Disability Class by Sex by Age in Duncan
Disability Class: Hearing Difficulty
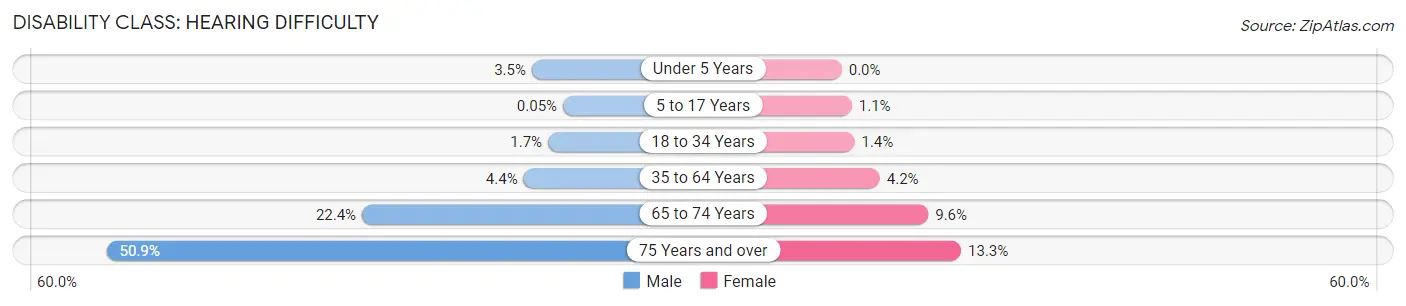
| Age Bracket | Male | Female |
| Under 5 Years | 24 (3.5%) | 0 (0.0%) |
| 5 to 17 Years | 1 (0.1%) | 20 (1.1%) |
| 18 to 34 Years | 42 (1.7%) | 34 (1.4%) |
| 35 to 64 Years | 177 (4.4%) | 173 (4.2%) |
| 65 to 74 Years | 242 (22.4%) | 153 (9.6%) |
| 75 Years and over | 321 (50.9%) | 145 (13.3%) |
Disability Class: Vision Difficulty
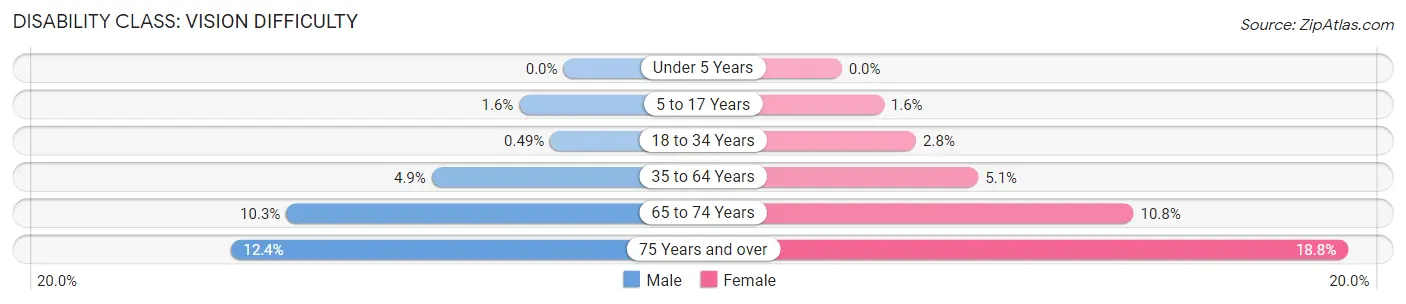
| Age Bracket | Male | Female |
| Under 5 Years | 0 (0.0%) | 0 (0.0%) |
| 5 to 17 Years | 31 (1.6%) | 28 (1.6%) |
| 18 to 34 Years | 12 (0.5%) | 66 (2.8%) |
| 35 to 64 Years | 195 (4.9%) | 207 (5.1%) |
| 65 to 74 Years | 111 (10.3%) | 172 (10.8%) |
| 75 Years and over | 78 (12.4%) | 205 (18.8%) |
Disability Class: Cognitive Difficulty
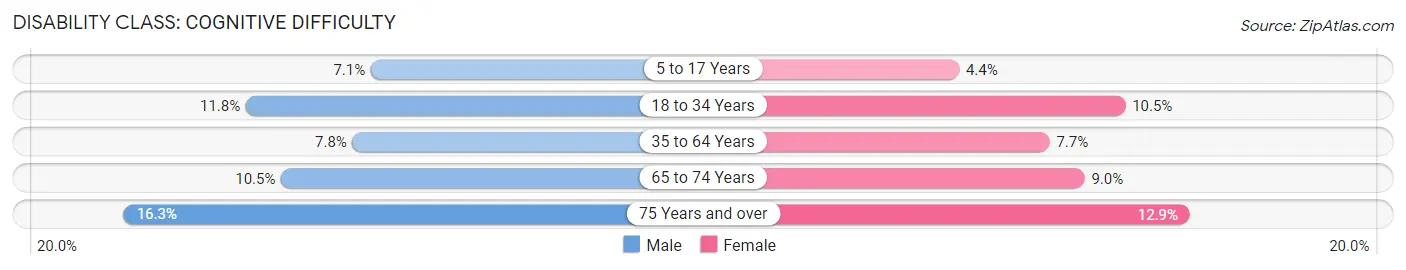
| Age Bracket | Male | Female |
| 5 to 17 Years | 135 (7.1%) | 78 (4.3%) |
| 18 to 34 Years | 287 (11.8%) | 252 (10.5%) |
| 35 to 64 Years | 312 (7.8%) | 315 (7.7%) |
| 65 to 74 Years | 113 (10.5%) | 143 (9.0%) |
| 75 Years and over | 103 (16.3%) | 141 (12.9%) |
Disability Class: Ambulatory Difficulty
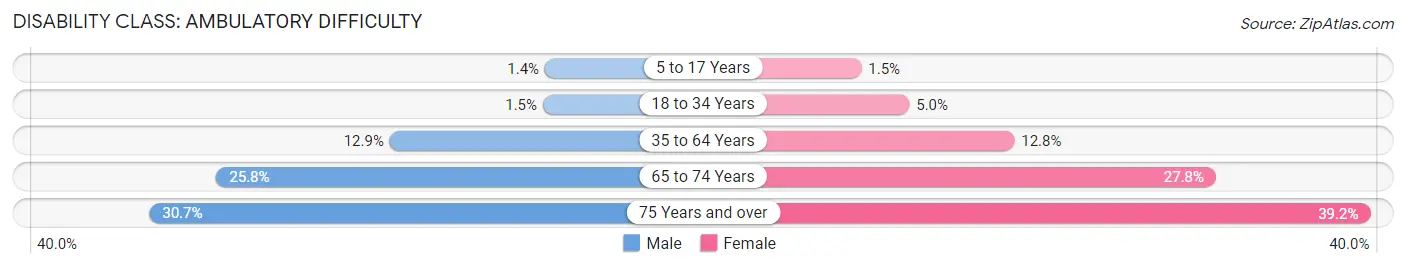
| Age Bracket | Male | Female |
| 5 to 17 Years | 26 (1.4%) | 26 (1.5%) |
| 18 to 34 Years | 37 (1.5%) | 120 (5.0%) |
| 35 to 64 Years | 514 (12.9%) | 523 (12.8%) |
| 65 to 74 Years | 278 (25.8%) | 441 (27.8%) |
| 75 Years and over | 194 (30.7%) | 428 (39.2%) |
Disability Class: Self-Care Difficulty
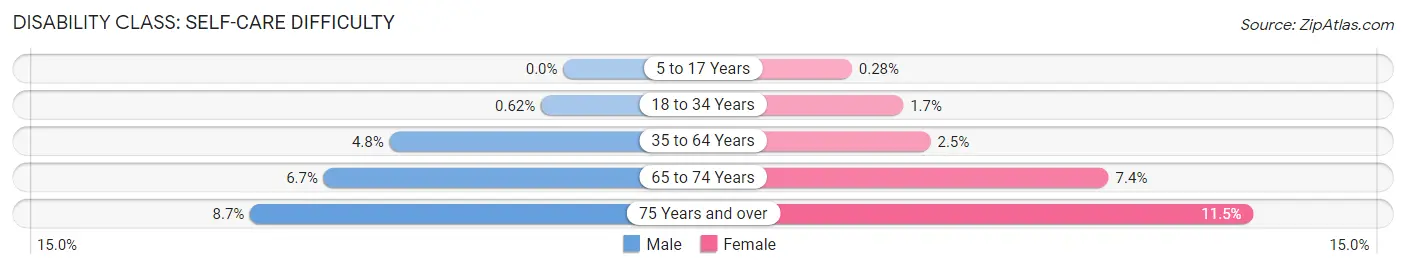
| Age Bracket | Male | Female |
| 5 to 17 Years | 0 (0.0%) | 5 (0.3%) |
| 18 to 34 Years | 15 (0.6%) | 41 (1.7%) |
| 35 to 64 Years | 193 (4.8%) | 101 (2.5%) |
| 65 to 74 Years | 72 (6.7%) | 118 (7.4%) |
| 75 Years and over | 55 (8.7%) | 125 (11.5%) |
Technology Access in Duncan
Computing Device Access in Duncan
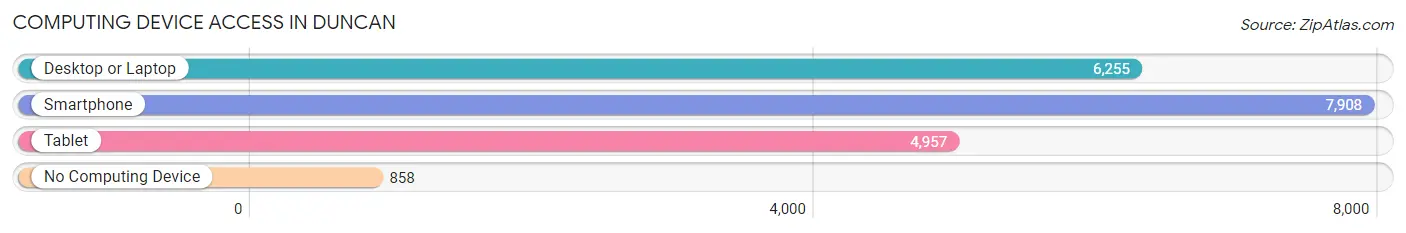
| Device Type | # Households | % Households |
| Desktop or Laptop | 6,255 | 67.8% |
| Smartphone | 7,908 | 85.7% |
| Tablet | 4,957 | 53.7% |
| No Computing Device | 858 | 9.3% |
| Total | 9,231 | 100.0% |
Internet Access in Duncan
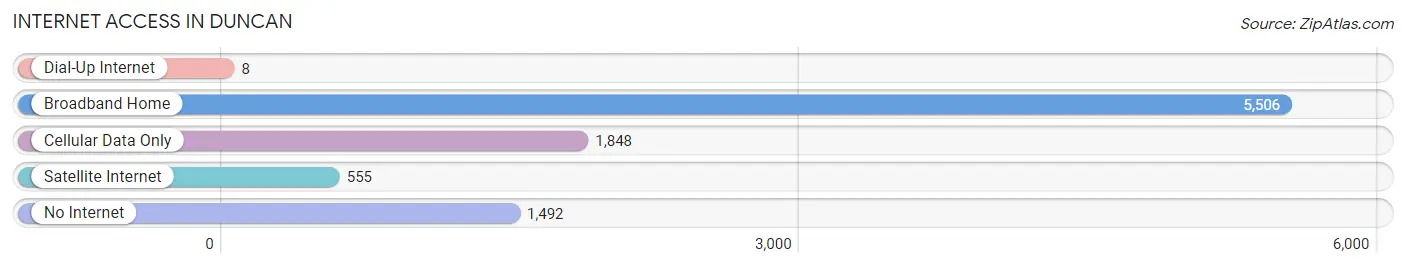
| Internet Type | # Households | % Households |
| Dial-Up Internet | 8 | 0.1% |
| Broadband Home | 5,506 | 59.7% |
| Cellular Data Only | 1,848 | 20.0% |
| Satellite Internet | 555 | 6.0% |
| No Internet | 1,492 | 16.2% |
| Total | 9,231 | 100.0% |
Duncan Summary
Duncan is a city located in Stephens County, Oklahoma, United States. It is the county seat of Stephens County and is located in the foothills of the Arbuckle Mountains. The population was 23,431 at the 2010 census, making it the largest city in Stephens County.
History
The area that is now Duncan was originally part of the Chickasaw Nation. The first settlers arrived in the area in 1892, and the town was officially founded in 1892. The town was named after William Duncan, a Chickasaw rancher who owned the land where the town was built.
In 1895, the first post office was established in Duncan. The town was incorporated in 1901, and the first mayor was elected in 1902.
In the early 1900s, Duncan was a major center for the oil and gas industry. The first oil well was drilled in the area in 1904, and by the 1920s, Duncan was the largest oil-producing city in Oklahoma.
In the 1930s, Duncan was the site of a major dust bowl. The dust storms caused extensive damage to the city and its economy.
In the 1950s, Duncan began to diversify its economy. The city became a major center for manufacturing, and the city's population began to grow.
Geography
Duncan is located in the foothills of the Arbuckle Mountains in south-central Oklahoma. The city is situated at the intersection of U.S. Highway 81 and State Highway 7.
The city has a total area of 24.2 square miles, of which 24.1 square miles is land and 0.1 square miles is water.
Economy
Duncan's economy is largely based on manufacturing, agriculture, and oil and gas production. The city is home to several major manufacturing companies, including Halliburton, Goodyear, and Tyson Foods.
Agriculture is also an important part of the local economy. The city is home to several large farms, and the surrounding area is known for its production of wheat, cotton, and other crops.
Oil and gas production is also an important part of the local economy. The city is home to several major oil and gas companies, including Devon Energy, Chesapeake Energy, and Continental Resources.
Demographics
As of the 2010 census, there were 23,431 people, 8,945 households, and 6,072 families residing in the city. The population density was 971.2 people per square mile. There were 9,945 housing units at an average density of 409.7 per square mile.
The racial makeup of the city was 79.2% White, 8.2% African American, 5.3% Native American, 0.7% Asian, 0.1% Pacific Islander, 3.2% from other races, and 3.3% from two or more races. Hispanic or Latino of any race were 8.2% of the population.
There were 8,945 households, out of which 32.2% had children under the age of 18 living with them, 48.2% were married couples living together, 14.3% had a female householder with no husband present, and 32.7% were non-families. 28.2% of all households were made up of individuals, and 11.7% had someone living alone who was 65 years of age or older. The average household size was 2.50 and the average family size was 3.06.
In the city, the population was spread out, with 25.9% under the age of 18, 9.2% from 18 to 24, 27.2% from 25 to 44, 22.2% from 45 to 64, and 15.5% who were 65 years of age or older. The median age was 36 years. For every 100 females, there were 93.2 males. For every 100 females age 18 and over, there were 89.3 males.
The median income for a household in the city was $32,917, and the median income for a family was $40,945. Males had a median income of $31,945 versus $22,917 for females. The per capita income for the city was $17,890. About 11.7% of families and 14.7% of the population were below the poverty line, including 19.2% of those under age 18 and 11.2% of those age 65 or over.
Common Questions
What is Per Capita Income in Duncan?
Per Capita income in Duncan is $30,634.
What is the Median Family Income in Duncan?
Median Family Income in Duncan is $67,341.
What is the Median Household income in Duncan?
Median Household Income in Duncan is $55,162.
What is Income or Wage Gap in Duncan?
Income or Wage Gap in Duncan is 37.1%.
Women in Duncan earn 62.9 cents for every dollar earned by a man.
What is Family Income Deficit in Duncan?
Family Income Deficit in Duncan is $12,882.
Families that are below poverty line in Duncan earn $12,882 less on average than the poverty threshold level.
What is Inequality or Gini Index in Duncan?
Inequality or Gini Index in Duncan is 0.47.
What is the Total Population of Duncan?
Total Population of Duncan is 22,759.
What is the Total Male Population of Duncan?
Total Male Population of Duncan is 10,996.
What is the Total Female Population of Duncan?
Total Female Population of Duncan is 11,763.
What is the Ratio of Males per 100 Females in Duncan?
There are 93.48 Males per 100 Females in Duncan.
What is the Ratio of Females per 100 Males in Duncan?
There are 106.98 Females per 100 Males in Duncan.
What is the Median Population Age in Duncan?
Median Population Age in Duncan is 39.7 Years.
What is the Average Family Size in Duncan
Average Family Size in Duncan is 3.0 People.
What is the Average Household Size in Duncan
Average Household Size in Duncan is 2.4 People.
How Large is the Labor Force in Duncan?
There are 10,057 People in the Labor Forcein in Duncan.
What is the Percentage of People in the Labor Force in Duncan?
55.0% of People are in the Labor Force in Duncan.
What is the Unemployment Rate in Duncan?
Unemployment Rate in Duncan is 5.2%.