Cullman, AL Map & Demographics
Cullman Map
Cullman Overview
$34,010
PER CAPITA INCOME
$86,089
AVG FAMILY INCOME
$59,982
AVG HOUSEHOLD INCOME
42.2%
WAGE / INCOME GAP [ % ]
57.8¢/ $1
WAGE / INCOME GAP [ $ ]
0.48
INEQUALITY / GINI INDEX
18,434
TOTAL POPULATION
8,883
MALE POPULATION
9,551
FEMALE POPULATION
93.01
MALES / 100 FEMALES
107.52
FEMALES / 100 MALES
42.0
MEDIAN AGE
2.9
AVG FAMILY SIZE
2.3
AVG HOUSEHOLD SIZE
8,844
LABOR FORCE [ PEOPLE ]
58.6%
PERCENT IN LABOR FORCE
2.6%
UNEMPLOYMENT RATE
Cullman Area Codes
Income in Cullman
Income Overview in Cullman
Per Capita Income in Cullman is $34,010, while median incomes of families and households are $86,089 and $59,982 respectively.
| Characteristic | Number | Measure |
| Per Capita Income | 18,434 | $34,010 |
| Median Family Income | 4,847 | $86,089 |
| Mean Family Income | 4,847 | $106,373 |
| Median Household Income | 7,725 | $59,982 |
| Mean Household Income | 7,725 | $80,268 |
| Income Deficit | 4,847 | $0 |
| Wage / Income Gap (%) | 18,434 | 42.19% |
| Wage / Income Gap ($) | 18,434 | 57.81¢ per $1 |
| Gini / Inequality Index | 18,434 | 0.48 |
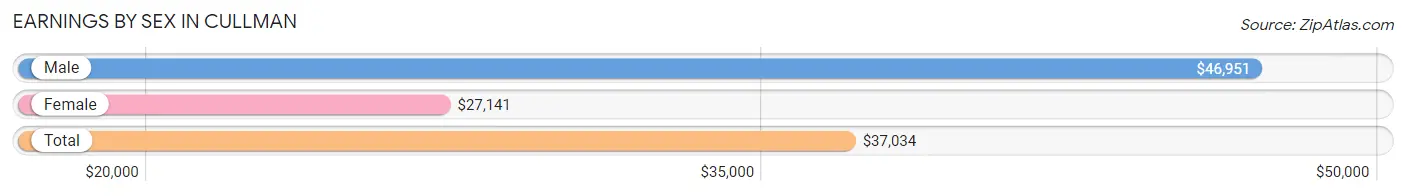
Earnings by Sex in Cullman
Average Earnings in Cullman are $37,034, $46,951 for men and $27,141 for women, a difference of 42.2%.
| Sex | Number | Average Earnings |
| Male | 5,078 (54.2%) | $46,951 |
| Female | 4,283 (45.8%) | $27,141 |
| Total | 9,361 (100.0%) | $37,034 |
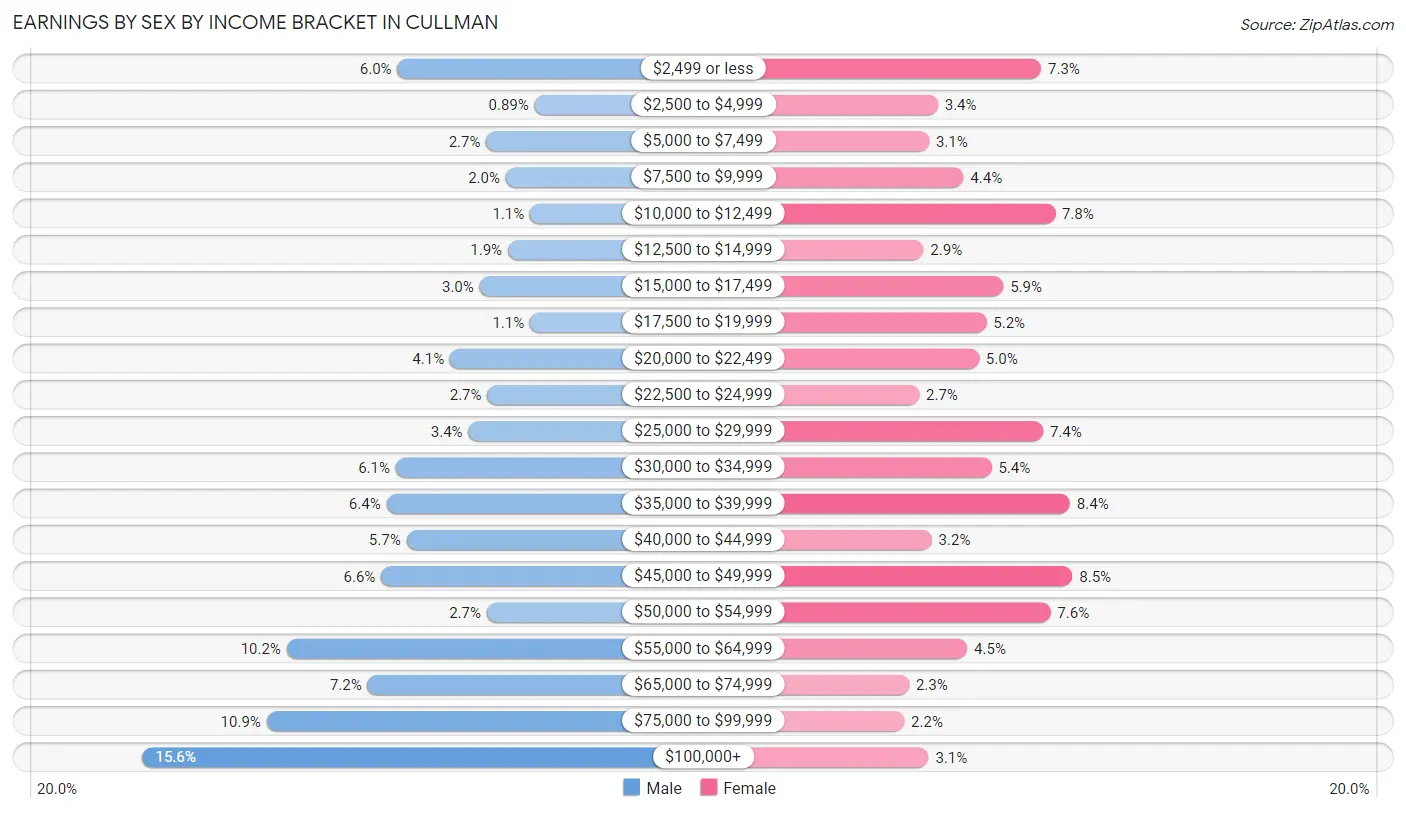
Earnings by Sex by Income Bracket in Cullman
The most common earnings brackets in Cullman are $100,000+ for men (791 | 15.6%) and $45,000 to $49,999 for women (362 | 8.5%).
| Income | Male | Female |
| $2,499 or less | 306 (6.0%) | 312 (7.3%) |
| $2,500 to $4,999 | 45 (0.9%) | 146 (3.4%) |
| $5,000 to $7,499 | 137 (2.7%) | 132 (3.1%) |
| $7,500 to $9,999 | 100 (2.0%) | 187 (4.4%) |
| $10,000 to $12,499 | 54 (1.1%) | 334 (7.8%) |
| $12,500 to $14,999 | 96 (1.9%) | 123 (2.9%) |
| $15,000 to $17,499 | 150 (2.9%) | 251 (5.9%) |
| $17,500 to $19,999 | 54 (1.1%) | 224 (5.2%) |
| $20,000 to $22,499 | 206 (4.1%) | 212 (5.0%) |
| $22,500 to $24,999 | 135 (2.7%) | 116 (2.7%) |
| $25,000 to $29,999 | 171 (3.4%) | 315 (7.3%) |
| $30,000 to $34,999 | 309 (6.1%) | 232 (5.4%) |
| $35,000 to $39,999 | 327 (6.4%) | 358 (8.4%) |
| $40,000 to $44,999 | 289 (5.7%) | 136 (3.2%) |
| $45,000 to $49,999 | 337 (6.6%) | 362 (8.5%) |
| $50,000 to $54,999 | 136 (2.7%) | 327 (7.6%) |
| $55,000 to $64,999 | 517 (10.2%) | 193 (4.5%) |
| $65,000 to $74,999 | 363 (7.1%) | 100 (2.3%) |
| $75,000 to $99,999 | 555 (10.9%) | 92 (2.1%) |
| $100,000+ | 791 (15.6%) | 131 (3.1%) |
| Total | 5,078 (100.0%) | 4,283 (100.0%) |
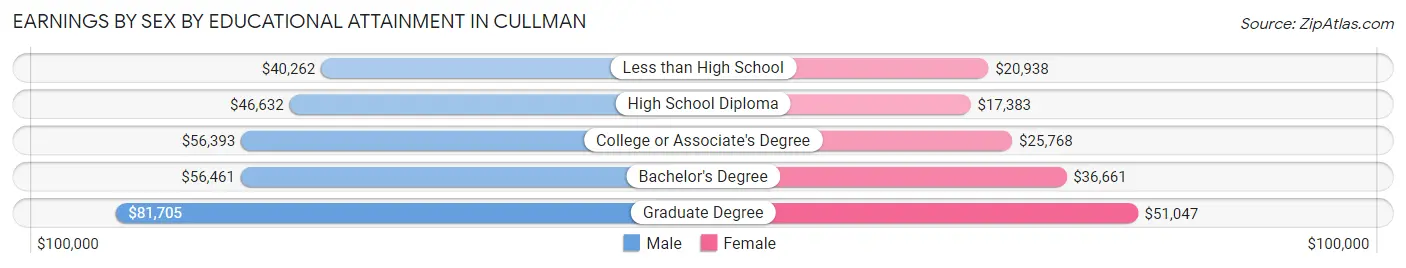
Earnings by Sex by Educational Attainment in Cullman
Average earnings in Cullman are $55,502 for men and $29,729 for women, a difference of 46.4%. Men with an educational attainment of graduate degree enjoy the highest average annual earnings of $81,705, while those with less than high school education earn the least with $40,262. Women with an educational attainment of graduate degree earn the most with the average annual earnings of $51,047, while those with high school diploma education have the smallest earnings of $17,383.
| Educational Attainment | Male Income | Female Income |
| Less than High School | $40,262 | $20,938 |
| High School Diploma | $46,632 | $17,383 |
| College or Associate's Degree | $56,393 | $25,768 |
| Bachelor's Degree | $56,461 | $36,661 |
| Graduate Degree | $81,705 | $51,047 |
| Total | $55,502 | $29,729 |
Family Income in Cullman
Family Income Brackets in Cullman
According to the Cullman family income data, there are 998 families falling into the $75,000 to $99,999 income range, which is the most common income bracket and makes up 20.6% of all families. Conversely, the $10,000 to $14,999 income bracket is the least frequent group with only 102 families (2.1%) belonging to this category.
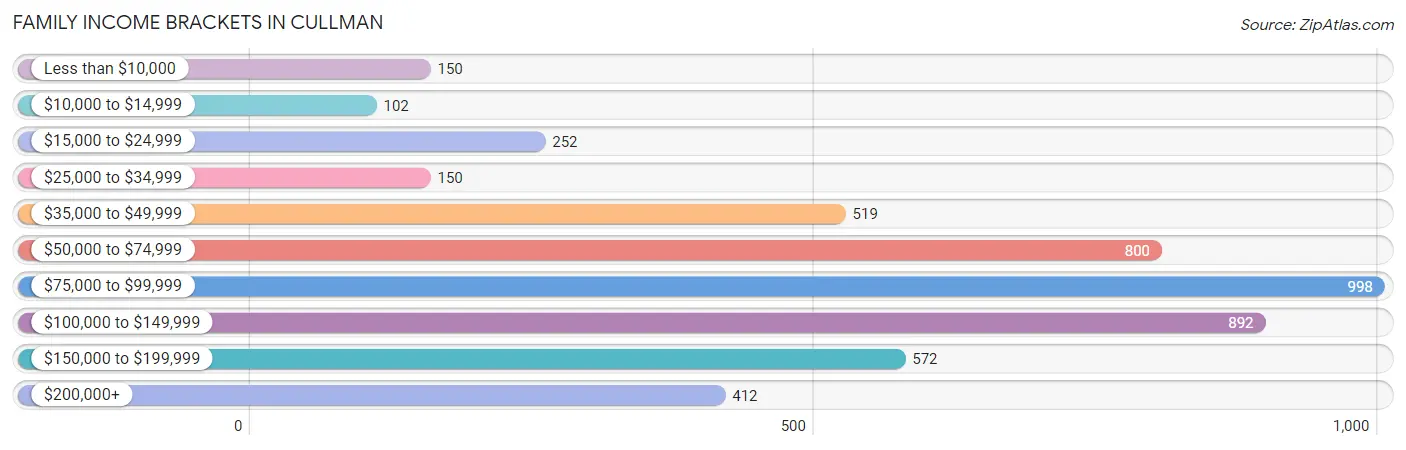
| Income Bracket | # Families | % Families |
| Less than $10,000 | 150 | 3.1% |
| $10,000 to $14,999 | 102 | 2.1% |
| $15,000 to $24,999 | 252 | 5.2% |
| $25,000 to $34,999 | 150 | 3.1% |
| $35,000 to $49,999 | 519 | 10.7% |
| $50,000 to $74,999 | 800 | 16.5% |
| $75,000 to $99,999 | 998 | 20.6% |
| $100,000 to $149,999 | 892 | 18.4% |
| $150,000 to $199,999 | 572 | 11.8% |
| $200,000+ | 412 | 8.5% |
Family Income by Famaliy Size in Cullman
4-person families (603 | 12.4%) account for the highest median family income in Cullman with $145,231 per family, while 4-person families (603 | 12.4%) have the highest median income of $36,308 per family member.
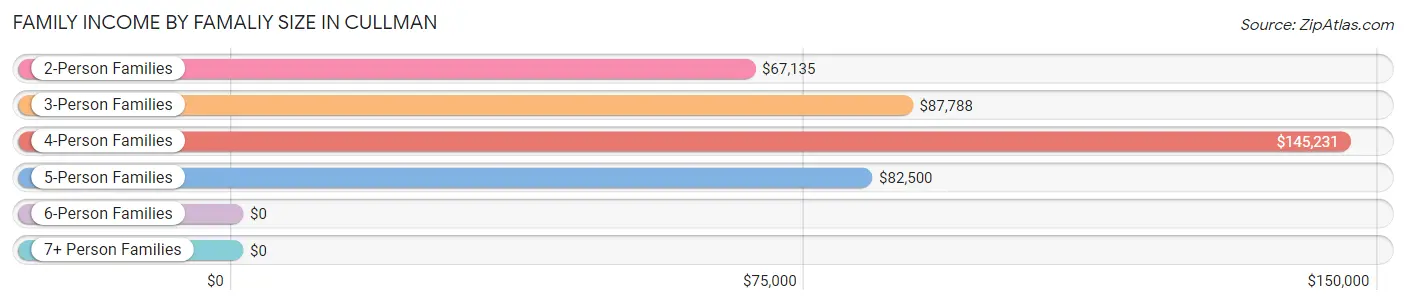
| Income Bracket | # Families | Median Income |
| 2-Person Families | 2,527 (52.1%) | $67,135 |
| 3-Person Families | 1,307 (27.0%) | $87,788 |
| 4-Person Families | 603 (12.4%) | $145,231 |
| 5-Person Families | 294 (6.1%) | $82,500 |
| 6-Person Families | 65 (1.3%) | $0 |
| 7+ Person Families | 51 (1.1%) | $0 |
| Total | 4,847 (100.0%) | $86,089 |
Family Income by Number of Earners in Cullman
The median family income in Cullman is $86,089, with families comprising 3+ earners (497) having the highest median family income of $150,762, while families with no earners (848) have the lowest median family income of $51,324, accounting for 10.2% and 17.5% of families, respectively.
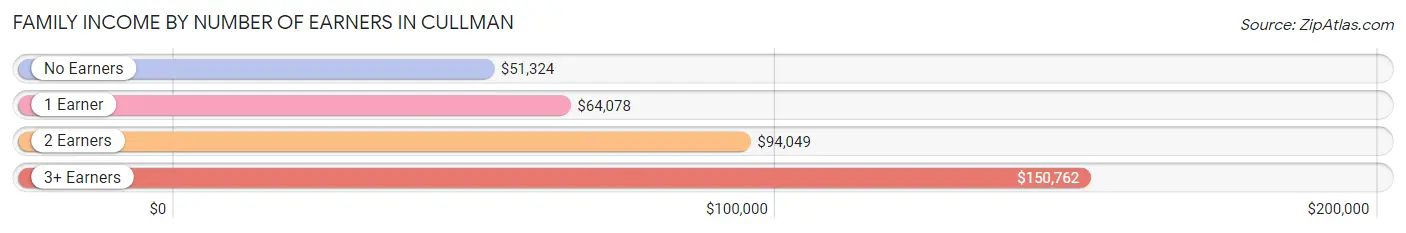
| Number of Earners | # Families | Median Income |
| No Earners | 848 (17.5%) | $51,324 |
| 1 Earner | 1,521 (31.4%) | $64,078 |
| 2 Earners | 1,981 (40.9%) | $94,049 |
| 3+ Earners | 497 (10.2%) | $150,762 |
| Total | 4,847 (100.0%) | $86,089 |
Household Income in Cullman
Household Income Brackets in Cullman
With 1,236 households falling in the category, the $50,000 to $74,999 income range is the most frequent in Cullman, accounting for 16.0% of all households. In contrast, only 394 households (5.1%) fall into the $10,000 to $14,999 income bracket, making it the least populous group.
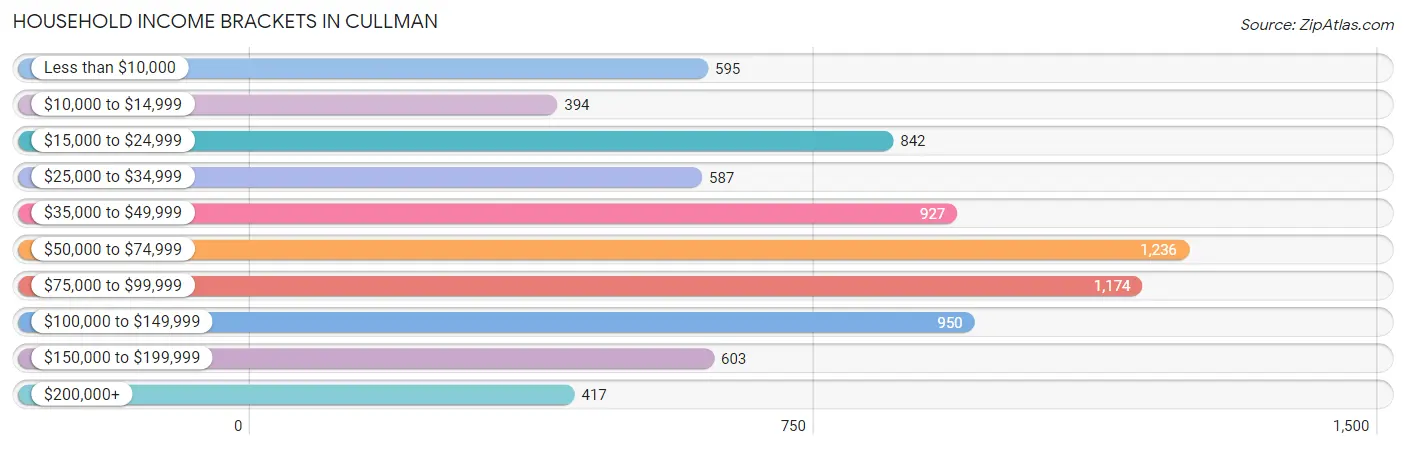
| Income Bracket | # Households | % Households |
| Less than $10,000 | 595 | 7.7% |
| $10,000 to $14,999 | 394 | 5.1% |
| $15,000 to $24,999 | 842 | 10.9% |
| $25,000 to $34,999 | 587 | 7.6% |
| $35,000 to $49,999 | 927 | 12.0% |
| $50,000 to $74,999 | 1,236 | 16.0% |
| $75,000 to $99,999 | 1,174 | 15.2% |
| $100,000 to $149,999 | 950 | 12.3% |
| $150,000 to $199,999 | 603 | 7.8% |
| $200,000+ | 417 | 5.4% |
Household Income by Householder Age in Cullman
The median household income in Cullman is $59,982, with the highest median household income of $75,625 found in the 25 to 44 years age bracket for the primary householder. A total of 2,412 households (31.2%) fall into this category. Meanwhile, the 65+ years age bracket for the primary householder has the lowest median household income of $38,952, with 2,365 households (30.6%) in this group.
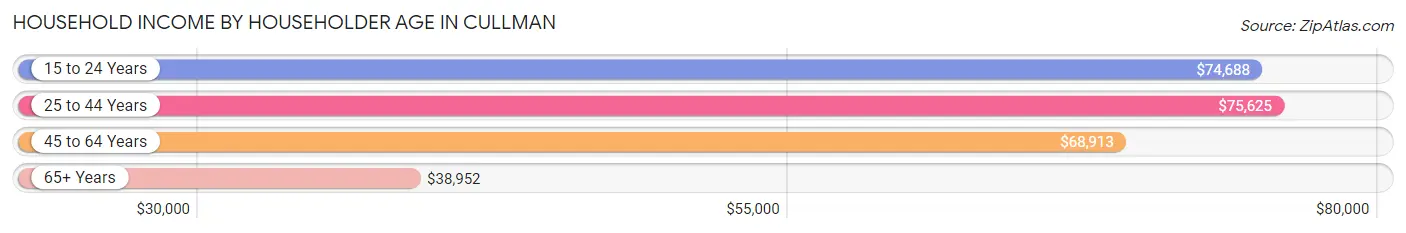
| Income Bracket | # Households | Median Income |
| 15 to 24 Years | 232 (3.0%) | $74,688 |
| 25 to 44 Years | 2,412 (31.2%) | $75,625 |
| 45 to 64 Years | 2,716 (35.2%) | $68,913 |
| 65+ Years | 2,365 (30.6%) | $38,952 |
| Total | 7,725 (100.0%) | $59,982 |
Poverty in Cullman
Income Below Poverty by Sex and Age in Cullman
With 12.9% poverty level for males and 14.6% for females among the residents of Cullman, 5 year old males and 45 to 54 year old females are the most vulnerable to poverty, with 90 males (72.6%) and 457 females (31.5%) in their respective age groups living below the poverty level.
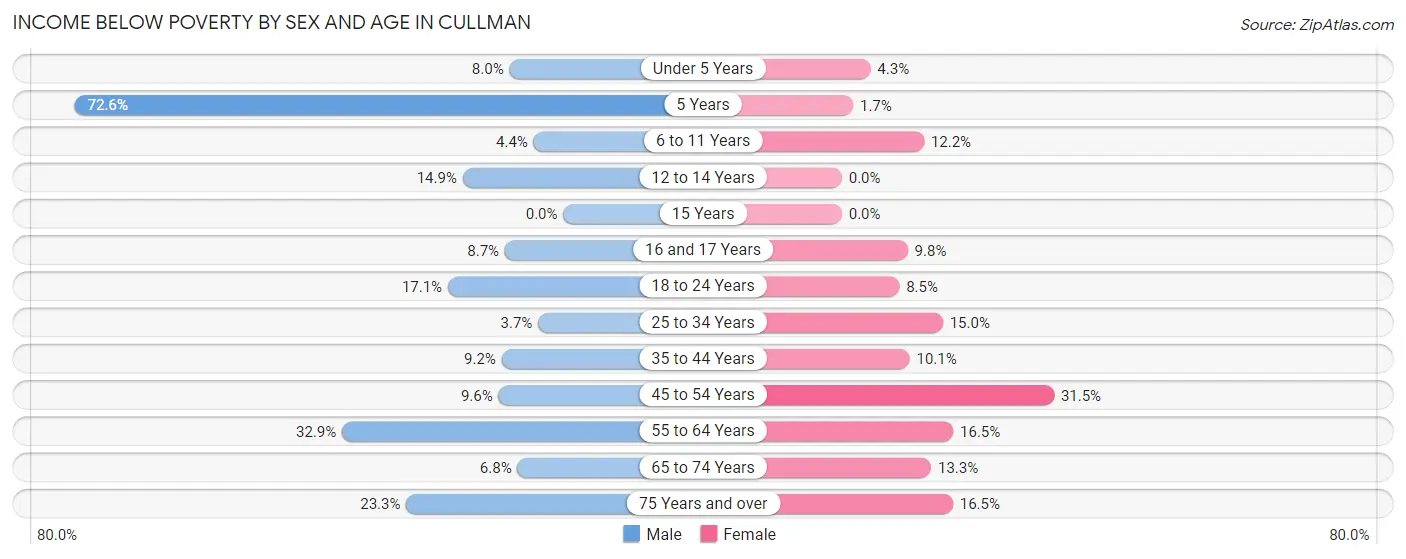
| Age Bracket | Male | Female |
| Under 5 Years | 36 (8.0%) | 13 (4.3%) |
| 5 Years | 90 (72.6%) | 6 (1.7%) |
| 6 to 11 Years | 27 (4.4%) | 71 (12.2%) |
| 12 to 14 Years | 36 (14.9%) | 0 (0.0%) |
| 15 Years | 0 (0.0%) | 0 (0.0%) |
| 16 and 17 Years | 19 (8.7%) | 27 (9.8%) |
| 18 to 24 Years | 139 (17.1%) | 59 (8.5%) |
| 25 to 34 Years | 41 (3.7%) | 145 (15.0%) |
| 35 to 44 Years | 103 (9.2%) | 119 (10.1%) |
| 45 to 54 Years | 131 (9.6%) | 457 (31.5%) |
| 55 to 64 Years | 317 (32.9%) | 141 (16.5%) |
| 65 to 74 Years | 62 (6.8%) | 151 (13.3%) |
| 75 Years and over | 97 (23.3%) | 173 (16.5%) |
| Total | 1,098 (12.9%) | 1,362 (14.6%) |
Income Above Poverty by Sex and Age in Cullman
According to the poverty statistics in Cullman, males aged 15 years and females aged 12 to 14 years are the age groups that are most secure financially, with 100.0% of males and 100.0% of females in these age groups living above the poverty line.
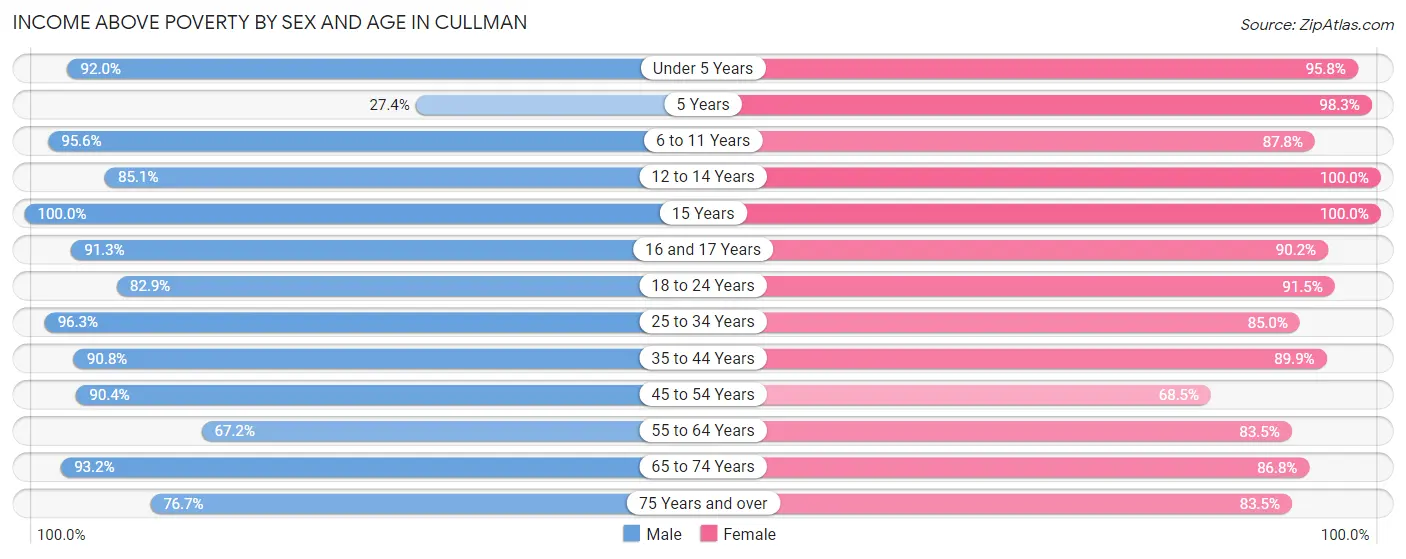
| Age Bracket | Male | Female |
| Under 5 Years | 414 (92.0%) | 293 (95.8%) |
| 5 Years | 34 (27.4%) | 354 (98.3%) |
| 6 to 11 Years | 586 (95.6%) | 511 (87.8%) |
| 12 to 14 Years | 205 (85.1%) | 321 (100.0%) |
| 15 Years | 176 (100.0%) | 148 (100.0%) |
| 16 and 17 Years | 200 (91.3%) | 249 (90.2%) |
| 18 to 24 Years | 672 (82.9%) | 633 (91.5%) |
| 25 to 34 Years | 1,056 (96.3%) | 822 (85.0%) |
| 35 to 44 Years | 1,021 (90.8%) | 1,064 (89.9%) |
| 45 to 54 Years | 1,231 (90.4%) | 994 (68.5%) |
| 55 to 64 Years | 648 (67.1%) | 712 (83.5%) |
| 65 to 74 Years | 849 (93.2%) | 989 (86.8%) |
| 75 Years and over | 319 (76.7%) | 877 (83.5%) |
| Total | 7,411 (87.1%) | 7,967 (85.4%) |
Income Below Poverty Among Married-Couple Families in Cullman
The poverty statistics for married-couple families in Cullman show that 2.3% or 82 of the total 3,589 families live below the poverty line. Families with 1 or 2 children have the highest poverty rate of 3.1%, comprising of 42 families. On the other hand, families with 3 or 4 children have the lowest poverty rate of 0.0%, which includes 0 families.
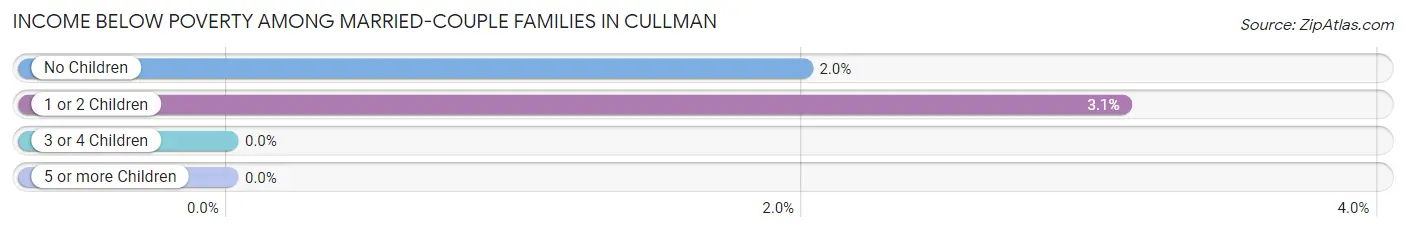
| Children | Above Poverty | Below Poverty |
| No Children | 1,958 (98.0%) | 40 (2.0%) |
| 1 or 2 Children | 1,310 (96.9%) | 42 (3.1%) |
| 3 or 4 Children | 188 (100.0%) | 0 (0.0%) |
| 5 or more Children | 51 (100.0%) | 0 (0.0%) |
| Total | 3,507 (97.7%) | 82 (2.3%) |
Income Below Poverty Among Single-Parent Households in Cullman
According to the poverty data in Cullman, 15.5% or 61 single-father households and 27.4% or 237 single-mother households are living below the poverty line. Among single-father households, those with no children have the highest poverty rate, with 25 households (22.9%) experiencing poverty. Likewise, among single-mother households, those with 1 or 2 children have the highest poverty rate, with 190 households (32.0%) falling below the poverty line.
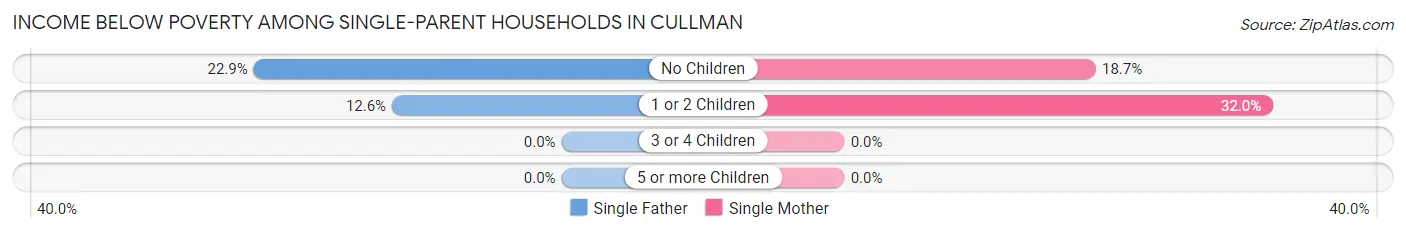
| Children | Single Father | Single Mother |
| No Children | 25 (22.9%) | 47 (18.7%) |
| 1 or 2 Children | 36 (12.6%) | 190 (32.0%) |
| 3 or 4 Children | 0 (0.0%) | 0 (0.0%) |
| 5 or more Children | 0 (0.0%) | 0 (0.0%) |
| Total | 61 (15.5%) | 237 (27.4%) |
Income Below Poverty Among Married-Couple vs Single-Parent Households in Cullman
The poverty data for Cullman shows that 82 of the married-couple family households (2.3%) and 298 of the single-parent households (23.7%) are living below the poverty level. Within the married-couple family households, those with 1 or 2 children have the highest poverty rate, with 42 households (3.1%) falling below the poverty line. Among the single-parent households, those with 1 or 2 children have the highest poverty rate, with 226 household (25.7%) living below poverty.
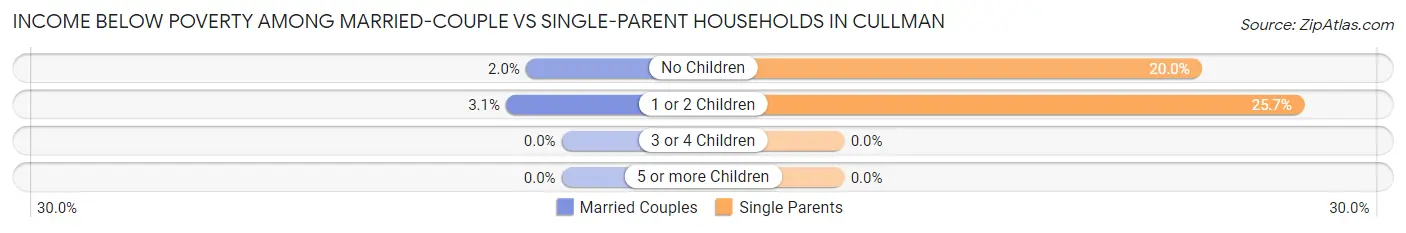
| Children | Married-Couple Families | Single-Parent Households |
| No Children | 40 (2.0%) | 72 (20.0%) |
| 1 or 2 Children | 42 (3.1%) | 226 (25.7%) |
| 3 or 4 Children | 0 (0.0%) | 0 (0.0%) |
| 5 or more Children | 0 (0.0%) | 0 (0.0%) |
| Total | 82 (2.3%) | 298 (23.7%) |
Race in Cullman
The most populous races in Cullman are White / Caucasian (17,001 | 92.2%), Two or more Races (831 | 4.5%), and Hispanic or Latino (473 | 2.6%).
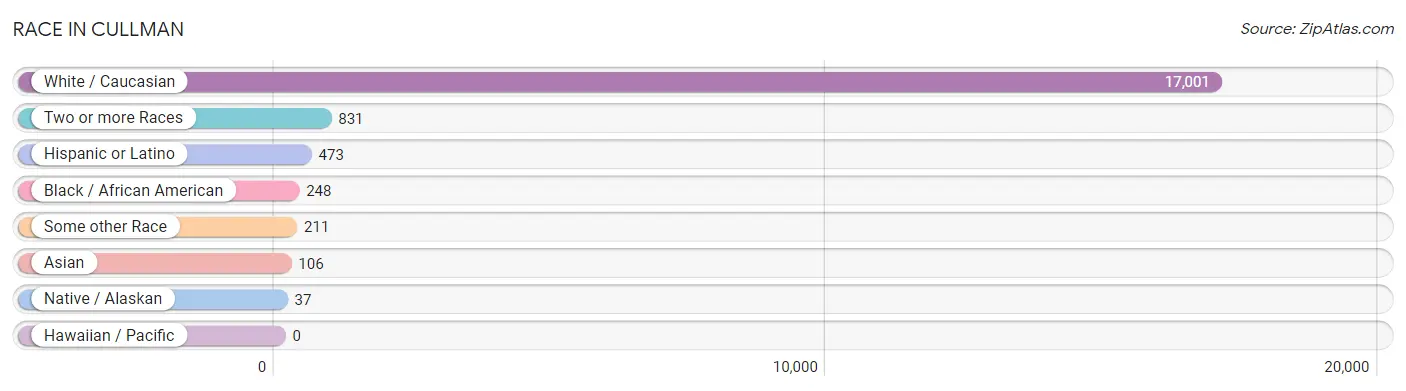
| Race | # Population | % Population |
| Asian | 106 | 0.6% |
| Black / African American | 248 | 1.3% |
| Hawaiian / Pacific | 0 | 0.0% |
| Hispanic or Latino | 473 | 2.6% |
| Native / Alaskan | 37 | 0.2% |
| White / Caucasian | 17,001 | 92.2% |
| Two or more Races | 831 | 4.5% |
| Some other Race | 211 | 1.1% |
| Total | 18,434 | 100.0% |
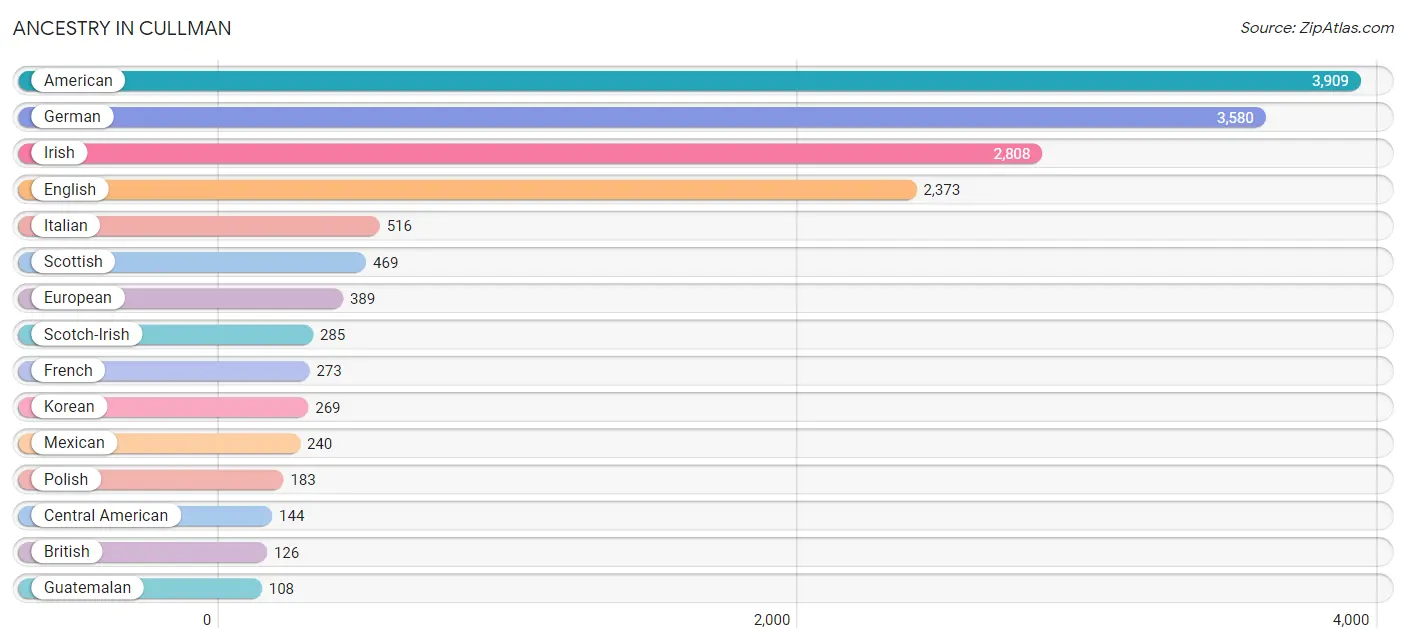
Ancestry in Cullman
The most populous ancestries reported in Cullman are American (3,909 | 21.2%), German (3,580 | 19.4%), Irish (2,808 | 15.2%), English (2,373 | 12.9%), and Italian (516 | 2.8%), together accounting for 71.5% of all Cullman residents.
| Ancestry | # Population | % Population |
| African | 22 | 0.1% |
| American | 3,909 | 21.2% |
| Argentinean | 31 | 0.2% |
| Bhutanese | 51 | 0.3% |
| British | 126 | 0.7% |
| Cajun | 20 | 0.1% |
| Canadian | 9 | 0.1% |
| Celtic | 53 | 0.3% |
| Central American | 144 | 0.8% |
| Cherokee | 51 | 0.3% |
| Colombian | 7 | 0.0% |
| Creek | 1 | 0.0% |
| Danish | 19 | 0.1% |
| Dominican | 27 | 0.2% |
| Dutch | 55 | 0.3% |
| Ecuadorian | 4 | 0.0% |
| English | 2,373 | 12.9% |
| European | 389 | 2.1% |
| Filipino | 27 | 0.2% |
| French | 273 | 1.5% |
| French Canadian | 16 | 0.1% |
| German | 3,580 | 19.4% |
| Guatemalan | 108 | 0.6% |
| Hungarian | 6 | 0.0% |
| Indian (Asian) | 48 | 0.3% |
| Indonesian | 39 | 0.2% |
| Irish | 2,808 | 15.2% |
| Italian | 516 | 2.8% |
| Korean | 269 | 1.5% |
| Lithuanian | 8 | 0.0% |
| Mexican | 240 | 1.3% |
| Mexican American Indian | 91 | 0.5% |
| Native Hawaiian | 48 | 0.3% |
| Nicaraguan | 36 | 0.2% |
| Northern European | 15 | 0.1% |
| Norwegian | 96 | 0.5% |
| Polish | 183 | 1.0% |
| Romanian | 20 | 0.1% |
| Russian | 45 | 0.2% |
| Scandinavian | 29 | 0.2% |
| Scotch-Irish | 285 | 1.5% |
| Scottish | 469 | 2.5% |
| Slovak | 9 | 0.1% |
| Slovene | 9 | 0.1% |
| South American | 42 | 0.2% |
| Spaniard | 8 | 0.0% |
| Spanish | 12 | 0.1% |
| Sri Lankan | 30 | 0.2% |
| Subsaharan African | 22 | 0.1% |
| Swedish | 9 | 0.1% |
| Welsh | 102 | 0.5% | View All 51 Rows |
Immigrants in Cullman
The most numerous immigrant groups reported in Cullman came from Latin America (325 | 1.8%), Central America (298 | 1.6%), Mexico (154 | 0.8%), Asia (134 | 0.7%), and South Eastern Asia (131 | 0.7%), together accounting for 5.7% of all Cullman residents.
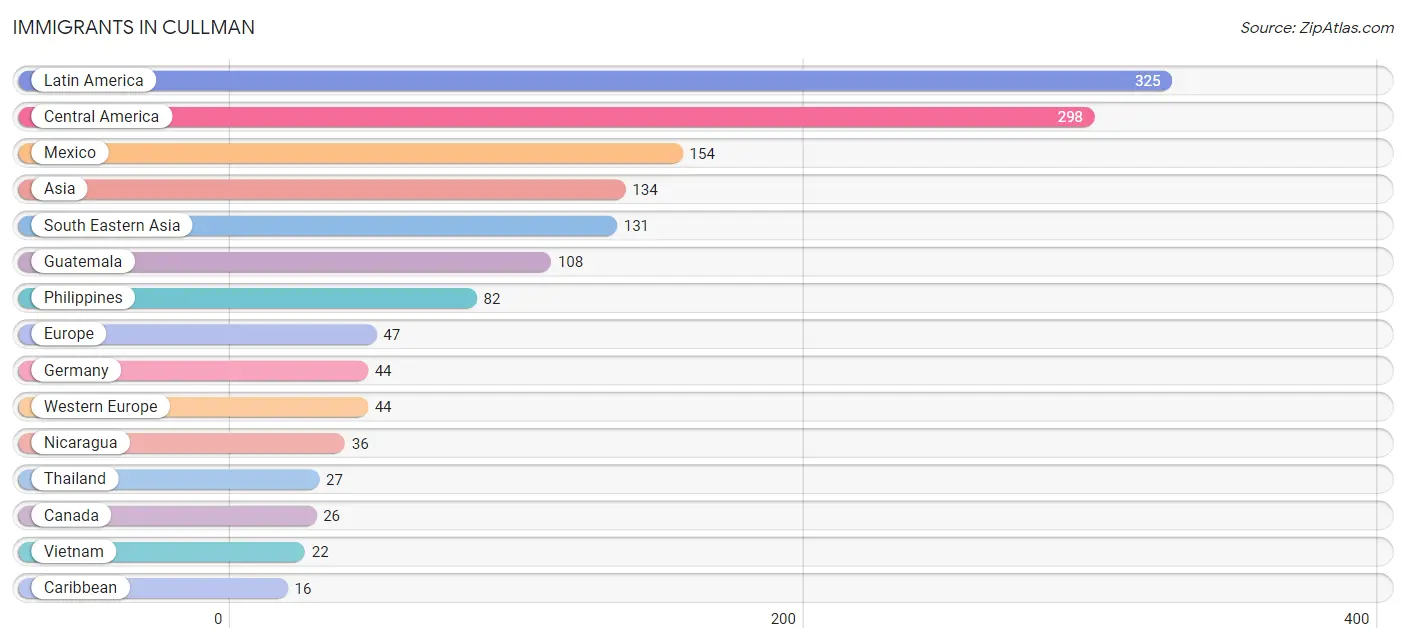
| Immigration Origin | # Population | % Population |
| Asia | 134 | 0.7% |
| Canada | 26 | 0.1% |
| Caribbean | 16 | 0.1% |
| Central America | 298 | 1.6% |
| Colombia | 7 | 0.0% |
| Dominican Republic | 16 | 0.1% |
| Eastern Asia | 3 | 0.0% |
| Eastern Europe | 3 | 0.0% |
| Ecuador | 4 | 0.0% |
| Europe | 47 | 0.3% |
| Germany | 44 | 0.2% |
| Guatemala | 108 | 0.6% |
| Japan | 3 | 0.0% |
| Latin America | 325 | 1.8% |
| Mexico | 154 | 0.8% |
| Nicaragua | 36 | 0.2% |
| Philippines | 82 | 0.4% |
| Russia | 3 | 0.0% |
| South America | 11 | 0.1% |
| South Eastern Asia | 131 | 0.7% |
| Thailand | 27 | 0.2% |
| Vietnam | 22 | 0.1% |
| Western Europe | 44 | 0.2% | View All 23 Rows |
Sex and Age in Cullman
Sex and Age in Cullman
The most populous age groups in Cullman are 45 to 49 Years (794 | 8.9%) for men and 50 to 54 Years (931 | 9.8%) for women.
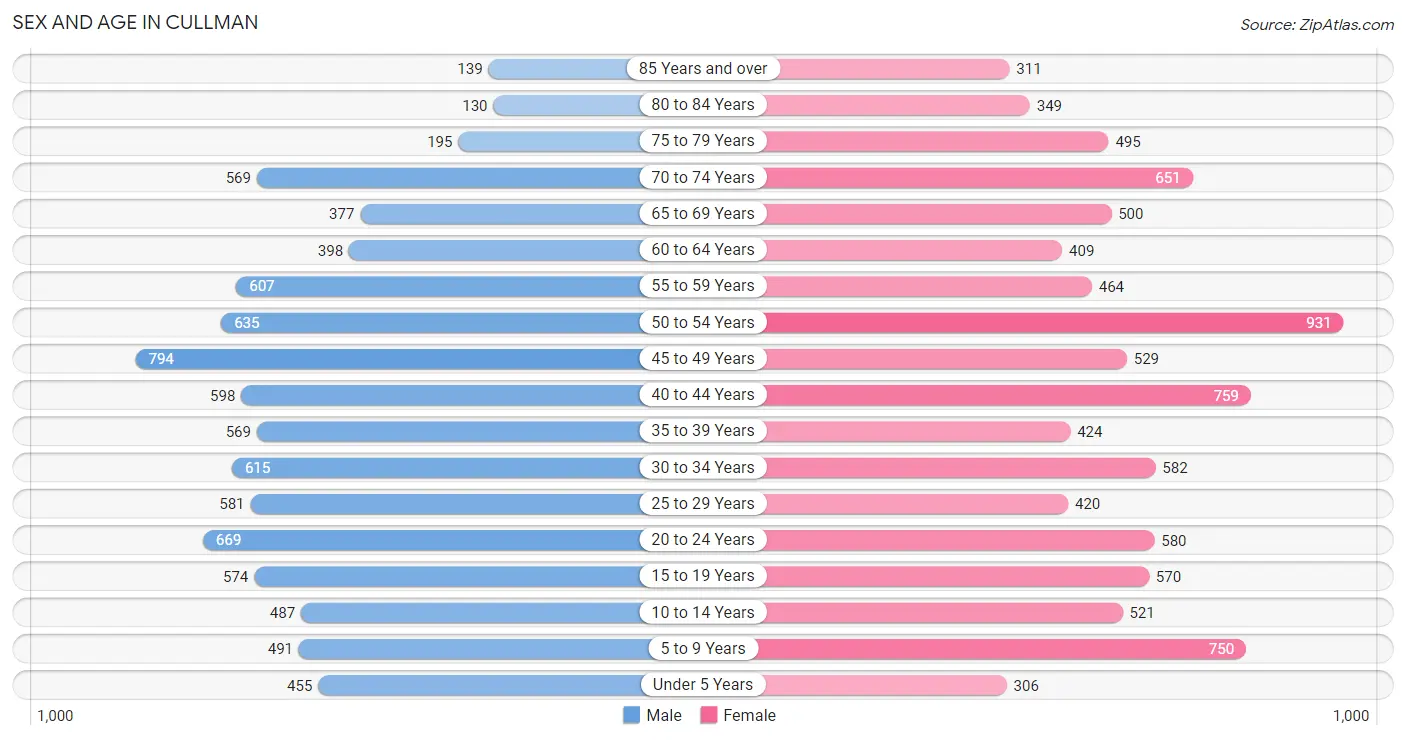
| Age Bracket | Male | Female |
| Under 5 Years | 455 (5.1%) | 306 (3.2%) |
| 5 to 9 Years | 491 (5.5%) | 750 (7.9%) |
| 10 to 14 Years | 487 (5.5%) | 521 (5.4%) |
| 15 to 19 Years | 574 (6.5%) | 570 (6.0%) |
| 20 to 24 Years | 669 (7.5%) | 580 (6.1%) |
| 25 to 29 Years | 581 (6.5%) | 420 (4.4%) |
| 30 to 34 Years | 615 (6.9%) | 582 (6.1%) |
| 35 to 39 Years | 569 (6.4%) | 424 (4.4%) |
| 40 to 44 Years | 598 (6.7%) | 759 (8.0%) |
| 45 to 49 Years | 794 (8.9%) | 529 (5.5%) |
| 50 to 54 Years | 635 (7.1%) | 931 (9.8%) |
| 55 to 59 Years | 607 (6.8%) | 464 (4.9%) |
| 60 to 64 Years | 398 (4.5%) | 409 (4.3%) |
| 65 to 69 Years | 377 (4.2%) | 500 (5.2%) |
| 70 to 74 Years | 569 (6.4%) | 651 (6.8%) |
| 75 to 79 Years | 195 (2.2%) | 495 (5.2%) |
| 80 to 84 Years | 130 (1.5%) | 349 (3.6%) |
| 85 Years and over | 139 (1.6%) | 311 (3.3%) |
| Total | 8,883 (100.0%) | 9,551 (100.0%) |
Families and Households in Cullman
Median Family Size in Cullman
The median family size in Cullman is 2.86 persons per family, with married-couple families (3,589 | 74.1%) accounting for the largest median family size of 3 persons per family. On the other hand, single male/father families (394 | 8.1%) represent the smallest median family size with 2.25 persons per family.
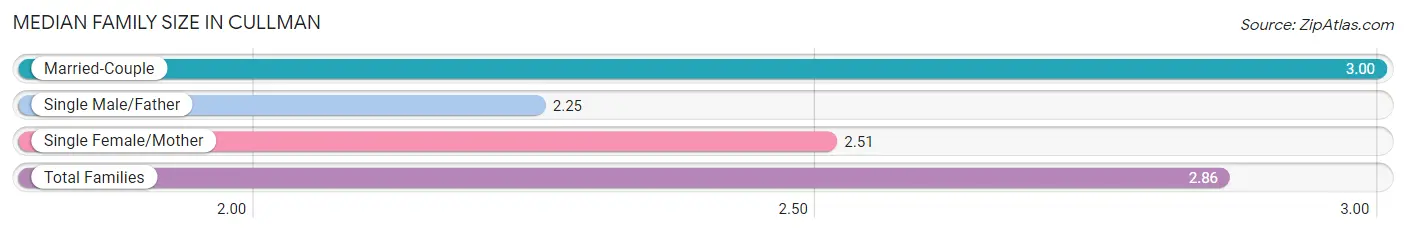
| Family Type | # Families | Family Size |
| Married-Couple | 3,589 (74.1%) | 3.00 |
| Single Male/Father | 394 (8.1%) | 2.25 |
| Single Female/Mother | 864 (17.8%) | 2.51 |
| Total Families | 4,847 (100.0%) | 2.86 |
Median Household Size in Cullman
The median household size in Cullman is 2.29 persons per household, with married-couple households (3,589 | 46.5%) accounting for the largest median household size of 3.05 persons per household. non-family households (2,878 | 37.3%) represent the smallest median household size with 1.23 persons per household.
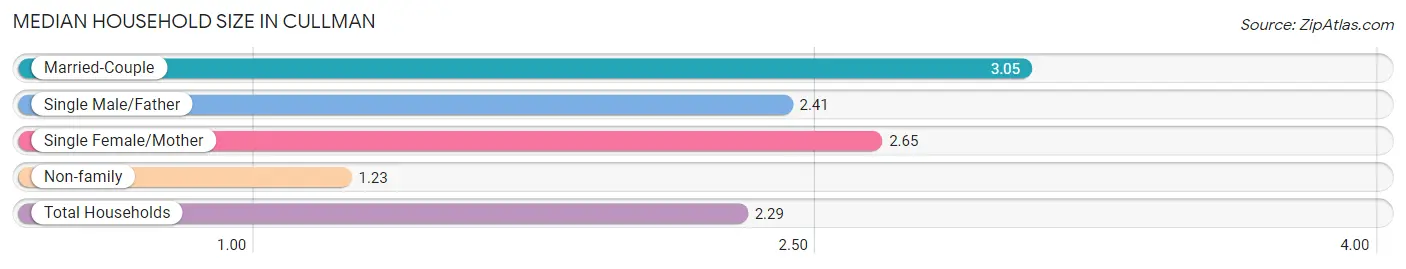
| Household Type | # Households | Household Size |
| Married-Couple | 3,589 (46.5%) | 3.05 |
| Single Male/Father | 394 (5.1%) | 2.41 |
| Single Female/Mother | 864 (11.2%) | 2.65 |
| Non-family | 2,878 (37.3%) | 1.23 |
| Total Households | 7,725 (100.0%) | 2.29 |
Household Size by Marriage Status in Cullman
Out of a total of 7,725 households in Cullman, 4,847 (62.7%) are family households, while 2,878 (37.3%) are nonfamily households. The most numerous type of family households are 2-person households, comprising 2,444, and the most common type of nonfamily households are 1-person households, comprising 2,604.
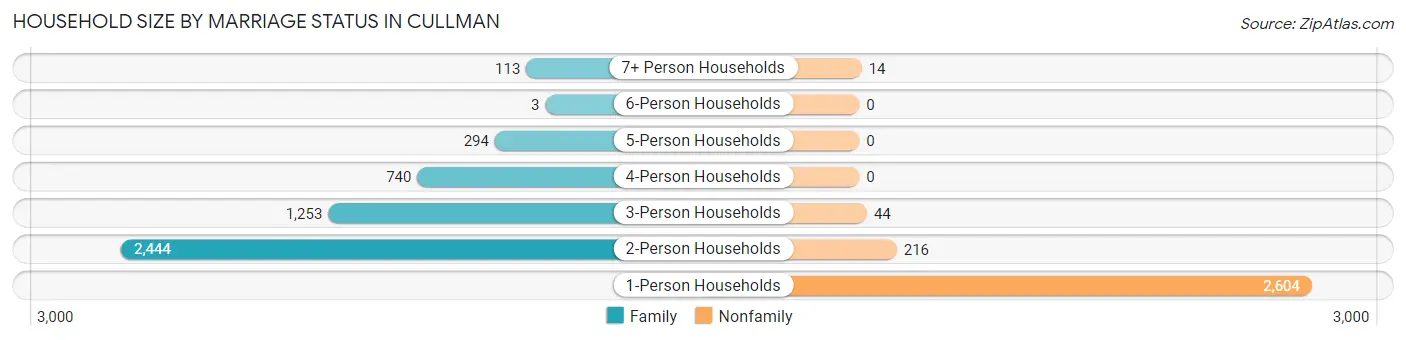
| Household Size | Family Households | Nonfamily Households |
| 1-Person Households | - | 2,604 (33.7%) |
| 2-Person Households | 2,444 (31.6%) | 216 (2.8%) |
| 3-Person Households | 1,253 (16.2%) | 44 (0.6%) |
| 4-Person Households | 740 (9.6%) | 0 (0.0%) |
| 5-Person Households | 294 (3.8%) | 0 (0.0%) |
| 6-Person Households | 3 (0.0%) | 0 (0.0%) |
| 7+ Person Households | 113 (1.5%) | 14 (0.2%) |
| Total | 4,847 (62.7%) | 2,878 (37.3%) |
Female Fertility in Cullman
Fertility by Age in Cullman
Average fertility rate in Cullman is 38.0 births per 1,000 women. Women in the age bracket of 20 to 34 years have the highest fertility rate with 92.0 births per 1,000 women. Women in the age bracket of 20 to 34 years acount for 93.6% of all women with births.
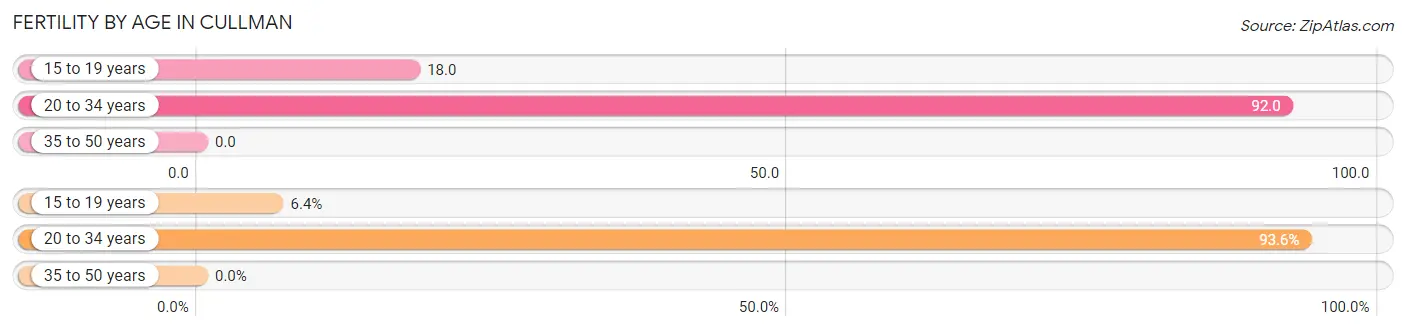
| Age Bracket | Women with Births | Births / 1,000 Women |
| 15 to 19 years | 10 (6.4%) | 18.0 |
| 20 to 34 years | 146 (93.6%) | 92.0 |
| 35 to 50 years | 0 (0.0%) | 0.0 |
| Total | 156 (100.0%) | 38.0 |
Fertility by Age by Marriage Status in Cullman
80.8% of women with births (156) in Cullman are married. The highest percentage of unmarried women with births falls into 15 to 19 years age bracket with 20.0% of them unmarried at the time of birth, while the lowest percentage of unmarried women with births belong to 20 to 34 years age bracket with 19.2% of them unmarried.
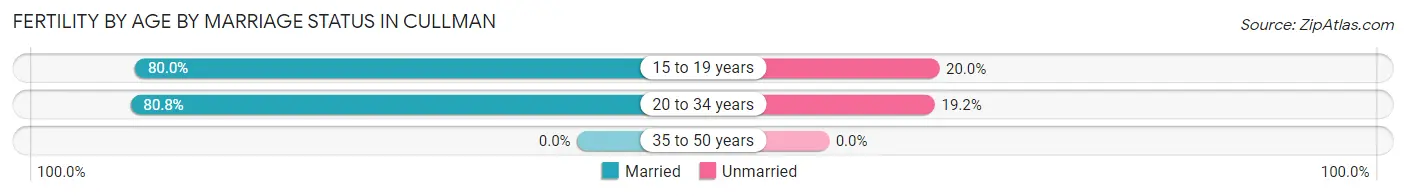
| Age Bracket | Married | Unmarried |
| 15 to 19 years | 8 (80.0%) | 2 (20.0%) |
| 20 to 34 years | 118 (80.8%) | 28 (19.2%) |
| 35 to 50 years | 0 (0.0%) | 0 (0.0%) |
| Total | 126 (80.8%) | 30 (19.2%) |
Fertility by Education in Cullman
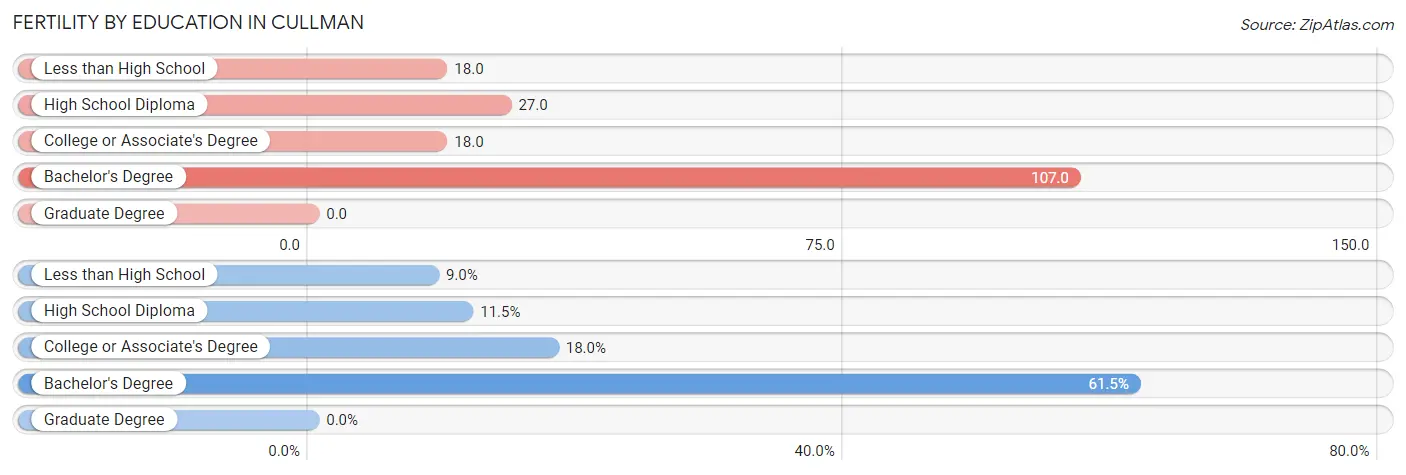
| Educational Attainment | Women with Births | Births / 1,000 Women |
| Less than High School | 14 (9.0%) | 18.0 |
| High School Diploma | 18 (11.5%) | 27.0 |
| College or Associate's Degree | 28 (17.9%) | 18.0 |
| Bachelor's Degree | 96 (61.5%) | 107.0 |
| Graduate Degree | 0 (0.0%) | 0.0 |
| Total | 156 (100.0%) | 38.0 |
Fertility by Education by Marriage Status in Cullman
19.2% of women with births in Cullman are unmarried. Women with the educational attainment of bachelor's degree are most likely to be married with 100.0% of them married at childbirth, while women with the educational attainment of less than high school are least likely to be married with 100.0% of them unmarried at childbirth.
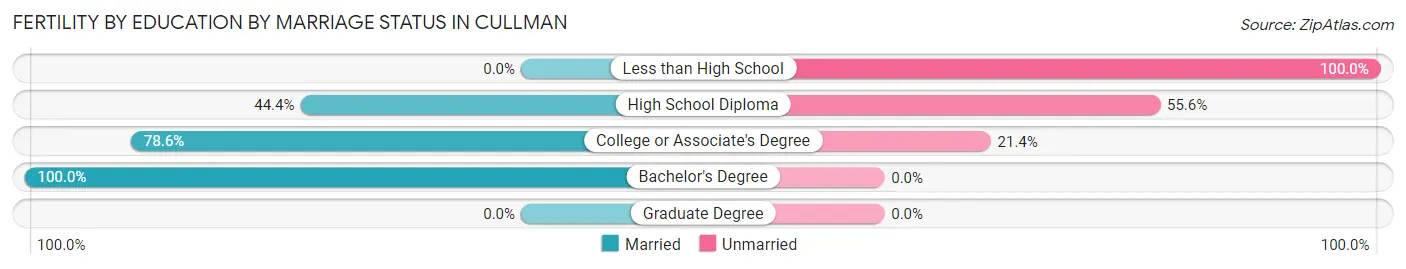
| Educational Attainment | Married | Unmarried |
| Less than High School | 0 (0.0%) | 14 (100.0%) |
| High School Diploma | 8 (44.4%) | 10 (55.6%) |
| College or Associate's Degree | 22 (78.6%) | 6 (21.4%) |
| Bachelor's Degree | 96 (100.0%) | 0 (0.0%) |
| Graduate Degree | 0 (0.0%) | 0 (0.0%) |
| Total | 126 (80.8%) | 30 (19.2%) |
Employment Characteristics in Cullman
Employment by Class of Employer in Cullman
Among the 8,438 employed individuals in Cullman, private company employees (5,484 | 65.0%), not-for-profit organizations (1,008 | 11.9%), and self-employed (not incorporated) (556 | 6.6%) make up the most common classes of employment.
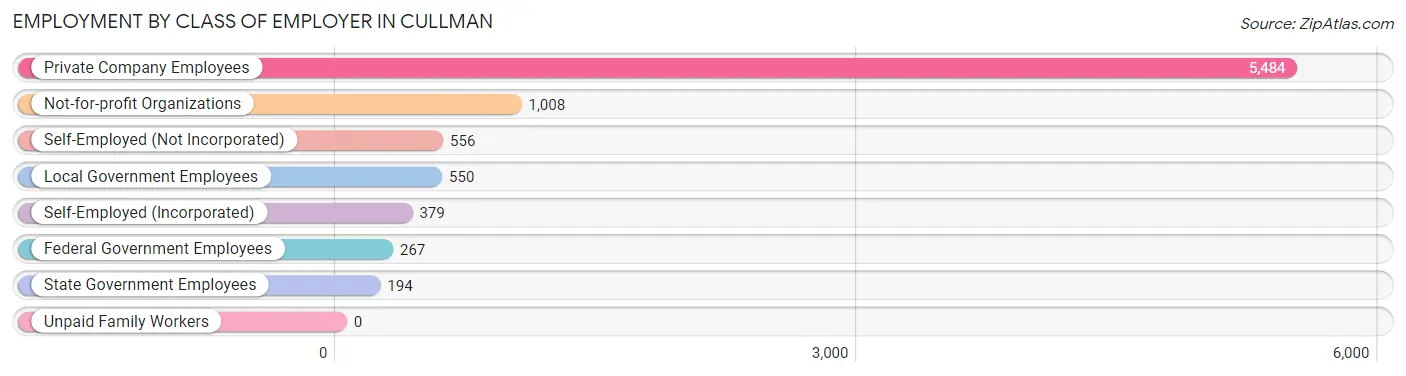
| Employer Class | # Employees | % Employees |
| Private Company Employees | 5,484 | 65.0% |
| Self-Employed (Incorporated) | 379 | 4.5% |
| Self-Employed (Not Incorporated) | 556 | 6.6% |
| Not-for-profit Organizations | 1,008 | 11.9% |
| Local Government Employees | 550 | 6.5% |
| State Government Employees | 194 | 2.3% |
| Federal Government Employees | 267 | 3.2% |
| Unpaid Family Workers | 0 | 0.0% |
| Total | 8,438 | 100.0% |
Employment Status by Age in Cullman
According to the labor force statistics for Cullman, out of the total population over 16 years of age (15,092), 58.6% or 8,844 individuals are in the labor force, with 2.6% or 230 of them unemployed. The age group with the highest labor force participation rate is 35 to 44 years, with 86.9% or 2,042 individuals in the labor force. Within the labor force, the 16 to 19 years age range has the highest percentage of unemployed individuals, with 21.1% or 80 of them being unemployed.
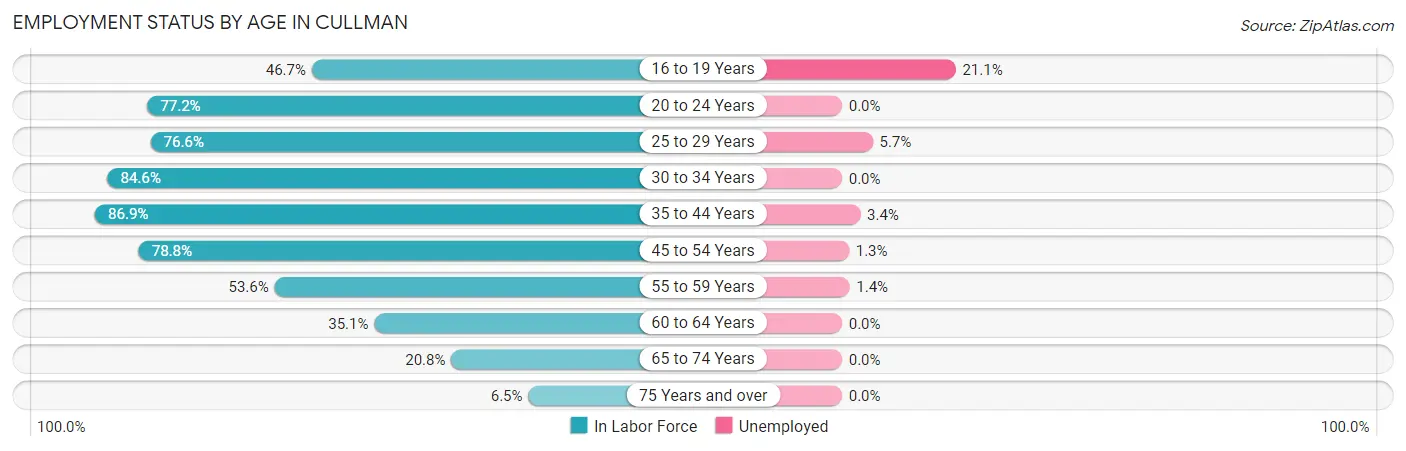
| Age Bracket | In Labor Force | Unemployed |
| 16 to 19 Years | 379 (46.7%) | 80 (21.1%) |
| 20 to 24 Years | 964 (77.2%) | 0 (0.0%) |
| 25 to 29 Years | 767 (76.6%) | 44 (5.7%) |
| 30 to 34 Years | 1,013 (84.6%) | 0 (0.0%) |
| 35 to 44 Years | 2,042 (86.9%) | 69 (3.4%) |
| 45 to 54 Years | 2,277 (78.8%) | 30 (1.3%) |
| 55 to 59 Years | 574 (53.6%) | 8 (1.4%) |
| 60 to 64 Years | 283 (35.1%) | 0 (0.0%) |
| 65 to 74 Years | 436 (20.8%) | 0 (0.0%) |
| 75 Years and over | 105 (6.5%) | 0 (0.0%) |
| Total | 8,844 (58.6%) | 230 (2.6%) |
Employment Status by Educational Attainment in Cullman
According to labor force statistics for Cullman, 74.7% of individuals (6,958) out of the total population between 25 and 64 years of age (9,315) are in the labor force, with 2.2% or 153 of them being unemployed. The group with the highest labor force participation rate are those with the educational attainment of bachelor's degree or higher, with 82.7% or 2,428 individuals in the labor force. Within the labor force, individuals with high school diploma education have the highest percentage of unemployment, with 5.8% or 88 of them being unemployed.
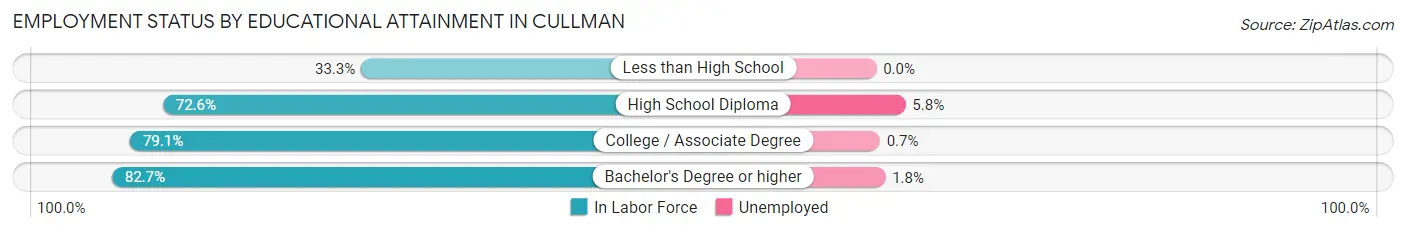
| Educational Attainment | In Labor Force | Unemployed |
| Less than High School | 280 (33.3%) | 0 (0.0%) |
| High School Diploma | 1,509 (72.6%) | 121 (5.8%) |
| College / Associate Degree | 2,736 (79.1%) | 24 (0.7%) |
| Bachelor's Degree or higher | 2,428 (82.7%) | 53 (1.8%) |
| Total | 6,958 (74.7%) | 205 (2.2%) |
Employment Occupations by Sex in Cullman
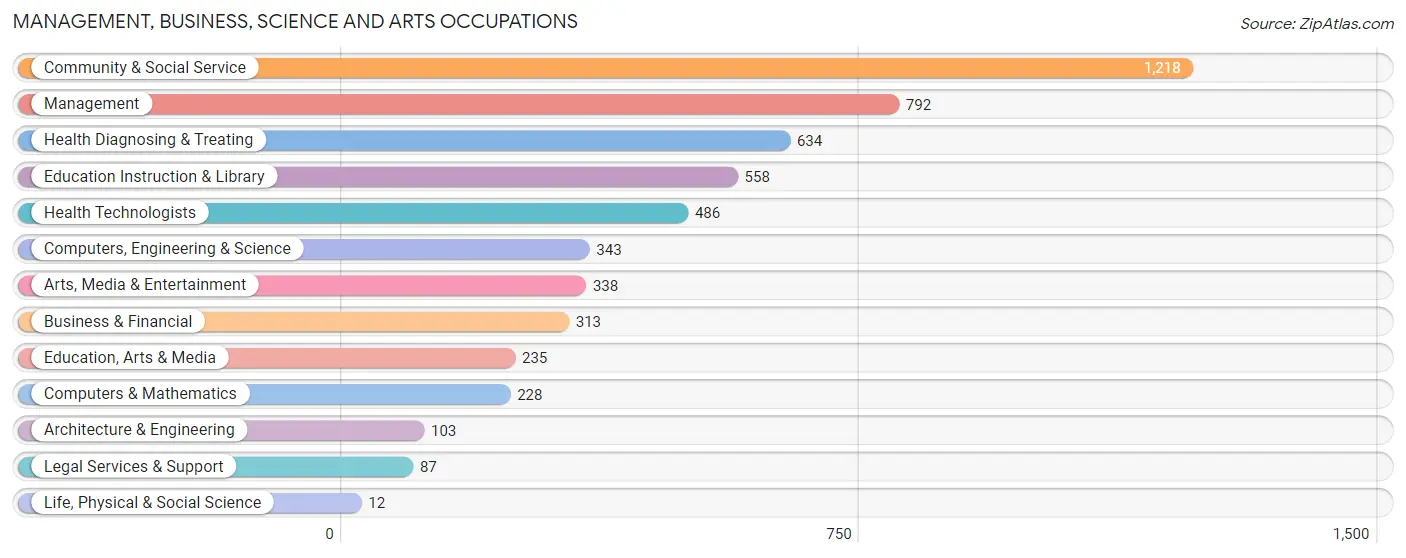
Management, Business, Science and Arts Occupations
The most common Management, Business, Science and Arts occupations in Cullman are Community & Social Service (1,218 | 14.1%), Management (792 | 9.2%), Health Diagnosing & Treating (634 | 7.4%), Education Instruction & Library (558 | 6.5%), and Health Technologists (486 | 5.6%).
Management, Business, Science and Arts Occupations by Sex
Within the Management, Business, Science and Arts occupations in Cullman, the most male-oriented occupations are Life, Physical & Social Science (100.0%), Legal Services & Support (85.1%), and Architecture & Engineering (80.6%), while the most female-oriented occupations are Education Instruction & Library (84.1%), Health Diagnosing & Treating (66.4%), and Community & Social Service (56.8%).
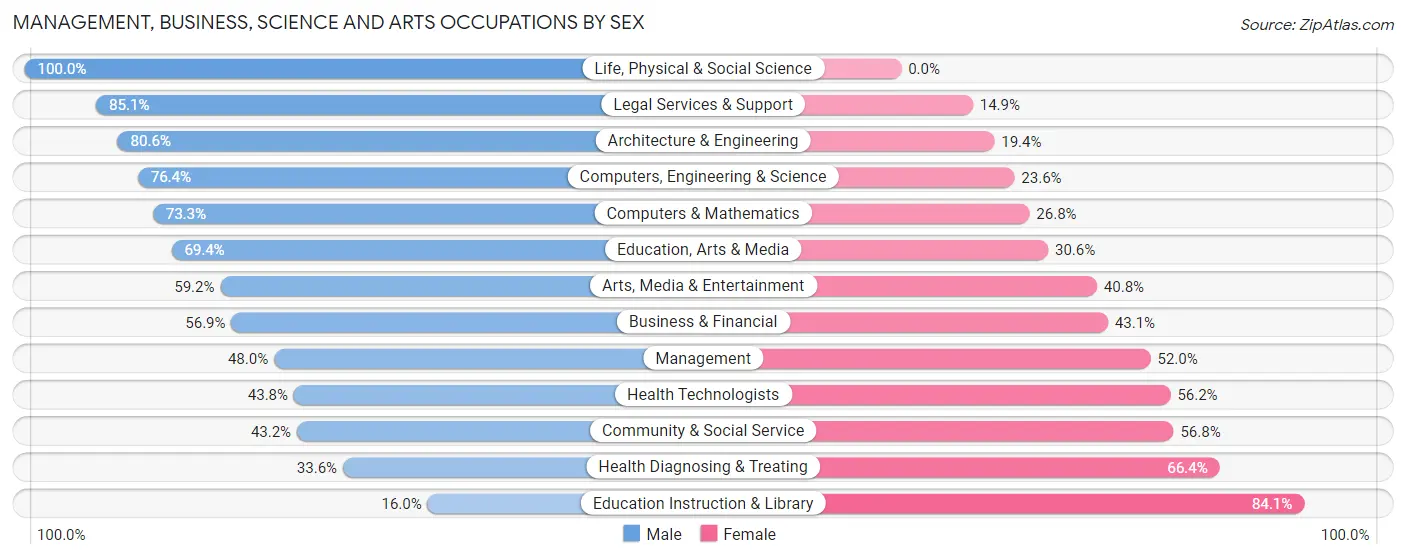
| Occupation | Male | Female |
| Management | 380 (48.0%) | 412 (52.0%) |
| Business & Financial | 178 (56.9%) | 135 (43.1%) |
| Computers, Engineering & Science | 262 (76.4%) | 81 (23.6%) |
| Computers & Mathematics | 167 (73.3%) | 61 (26.8%) |
| Architecture & Engineering | 83 (80.6%) | 20 (19.4%) |
| Life, Physical & Social Science | 12 (100.0%) | 0 (0.0%) |
| Community & Social Service | 526 (43.2%) | 692 (56.8%) |
| Education, Arts & Media | 163 (69.4%) | 72 (30.6%) |
| Legal Services & Support | 74 (85.1%) | 13 (14.9%) |
| Education Instruction & Library | 89 (16.0%) | 469 (84.1%) |
| Arts, Media & Entertainment | 200 (59.2%) | 138 (40.8%) |
| Health Diagnosing & Treating | 213 (33.6%) | 421 (66.4%) |
| Health Technologists | 213 (43.8%) | 273 (56.2%) |
| Total (Category) | 1,559 (47.2%) | 1,741 (52.8%) |
| Total (Overall) | 4,552 (52.9%) | 4,058 (47.1%) |
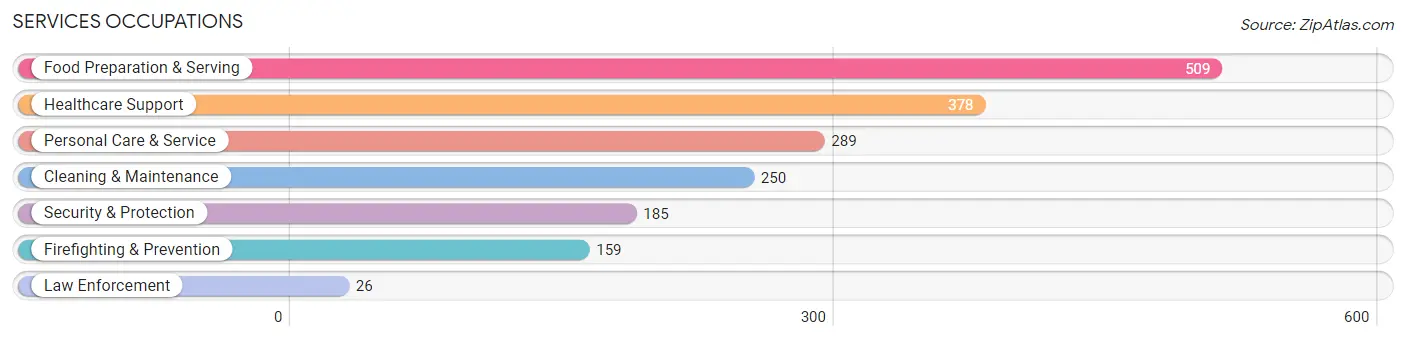
Services Occupations
The most common Services occupations in Cullman are Food Preparation & Serving (509 | 5.9%), Healthcare Support (378 | 4.4%), Personal Care & Service (289 | 3.4%), Cleaning & Maintenance (250 | 2.9%), and Security & Protection (185 | 2.1%).
Services Occupations by Sex
Within the Services occupations in Cullman, the most male-oriented occupations are Cleaning & Maintenance (85.6%), Firefighting & Prevention (73.6%), and Security & Protection (72.4%), while the most female-oriented occupations are Healthcare Support (87.0%), Personal Care & Service (74.4%), and Food Preparation & Serving (54.4%).
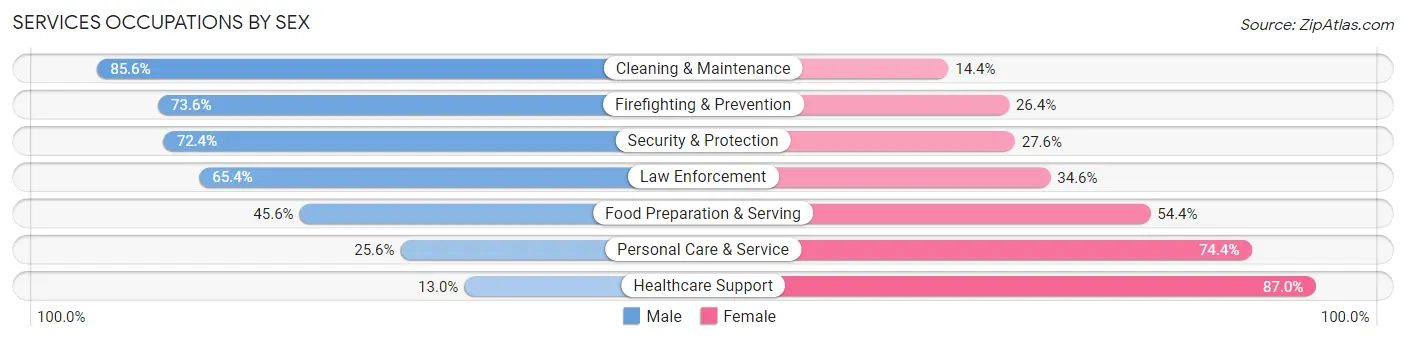
| Occupation | Male | Female |
| Healthcare Support | 49 (13.0%) | 329 (87.0%) |
| Security & Protection | 134 (72.4%) | 51 (27.6%) |
| Firefighting & Prevention | 117 (73.6%) | 42 (26.4%) |
| Law Enforcement | 17 (65.4%) | 9 (34.6%) |
| Food Preparation & Serving | 232 (45.6%) | 277 (54.4%) |
| Cleaning & Maintenance | 214 (85.6%) | 36 (14.4%) |
| Personal Care & Service | 74 (25.6%) | 215 (74.4%) |
| Total (Category) | 703 (43.6%) | 908 (56.4%) |
| Total (Overall) | 4,552 (52.9%) | 4,058 (47.1%) |
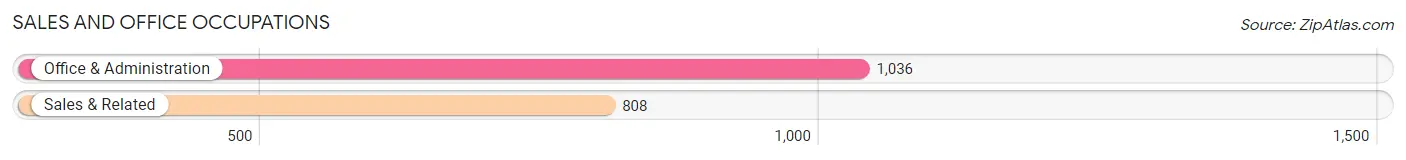
Sales and Office Occupations
The most common Sales and Office occupations in Cullman are Office & Administration (1,036 | 12.0%), and Sales & Related (808 | 9.4%).
Sales and Office Occupations by Sex
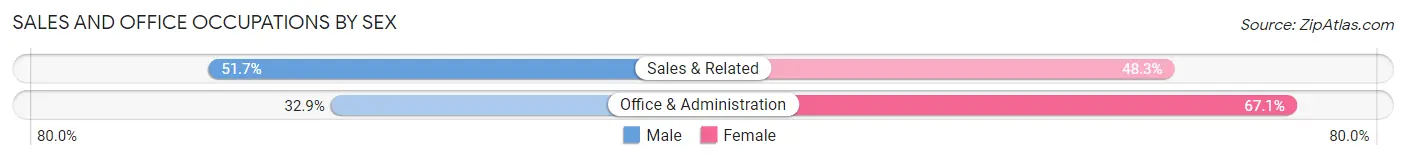
| Occupation | Male | Female |
| Sales & Related | 418 (51.7%) | 390 (48.3%) |
| Office & Administration | 341 (32.9%) | 695 (67.1%) |
| Total (Category) | 759 (41.2%) | 1,085 (58.8%) |
| Total (Overall) | 4,552 (52.9%) | 4,058 (47.1%) |
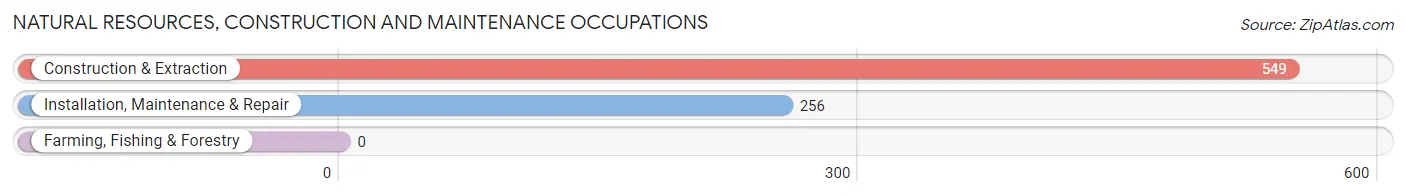
Natural Resources, Construction and Maintenance Occupations
The most common Natural Resources, Construction and Maintenance occupations in Cullman are Construction & Extraction (549 | 6.4%), and Installation, Maintenance & Repair (256 | 3.0%).
Natural Resources, Construction and Maintenance Occupations by Sex
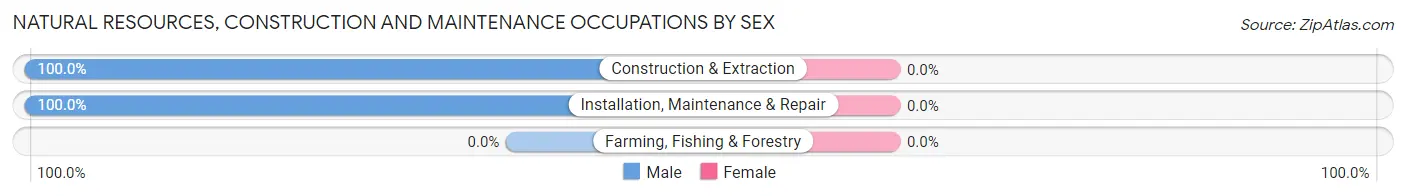
| Occupation | Male | Female |
| Farming, Fishing & Forestry | 0 (0.0%) | 0 (0.0%) |
| Construction & Extraction | 549 (100.0%) | 0 (0.0%) |
| Installation, Maintenance & Repair | 256 (100.0%) | 0 (0.0%) |
| Total (Category) | 805 (100.0%) | 0 (0.0%) |
| Total (Overall) | 4,552 (52.9%) | 4,058 (47.1%) |
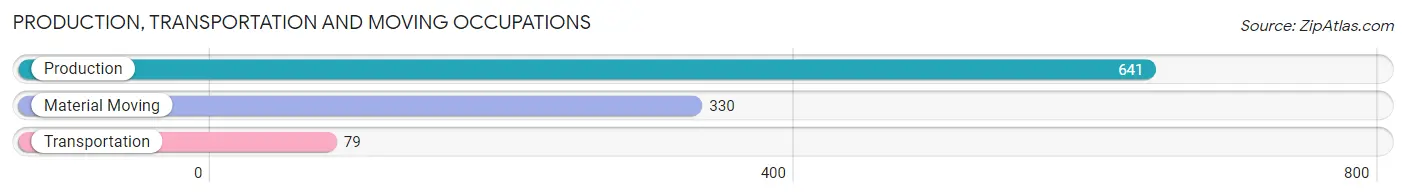
Production, Transportation and Moving Occupations
The most common Production, Transportation and Moving occupations in Cullman are Production (641 | 7.4%), Material Moving (330 | 3.8%), and Transportation (79 | 0.9%).
Production, Transportation and Moving Occupations by Sex
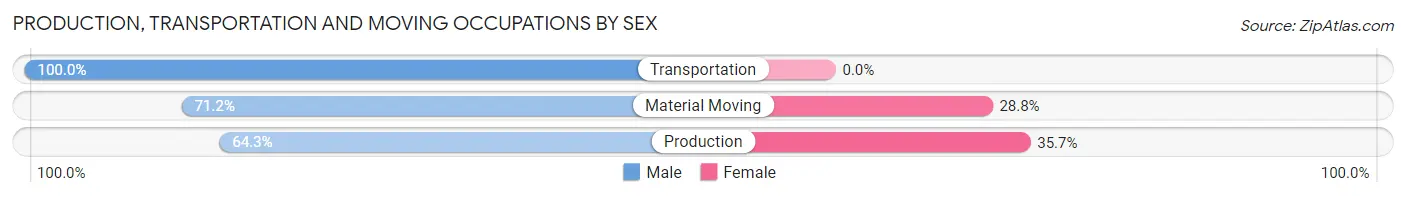
| Occupation | Male | Female |
| Production | 412 (64.3%) | 229 (35.7%) |
| Transportation | 79 (100.0%) | 0 (0.0%) |
| Material Moving | 235 (71.2%) | 95 (28.8%) |
| Total (Category) | 726 (69.1%) | 324 (30.9%) |
| Total (Overall) | 4,552 (52.9%) | 4,058 (47.1%) |
Employment Industries by Sex in Cullman
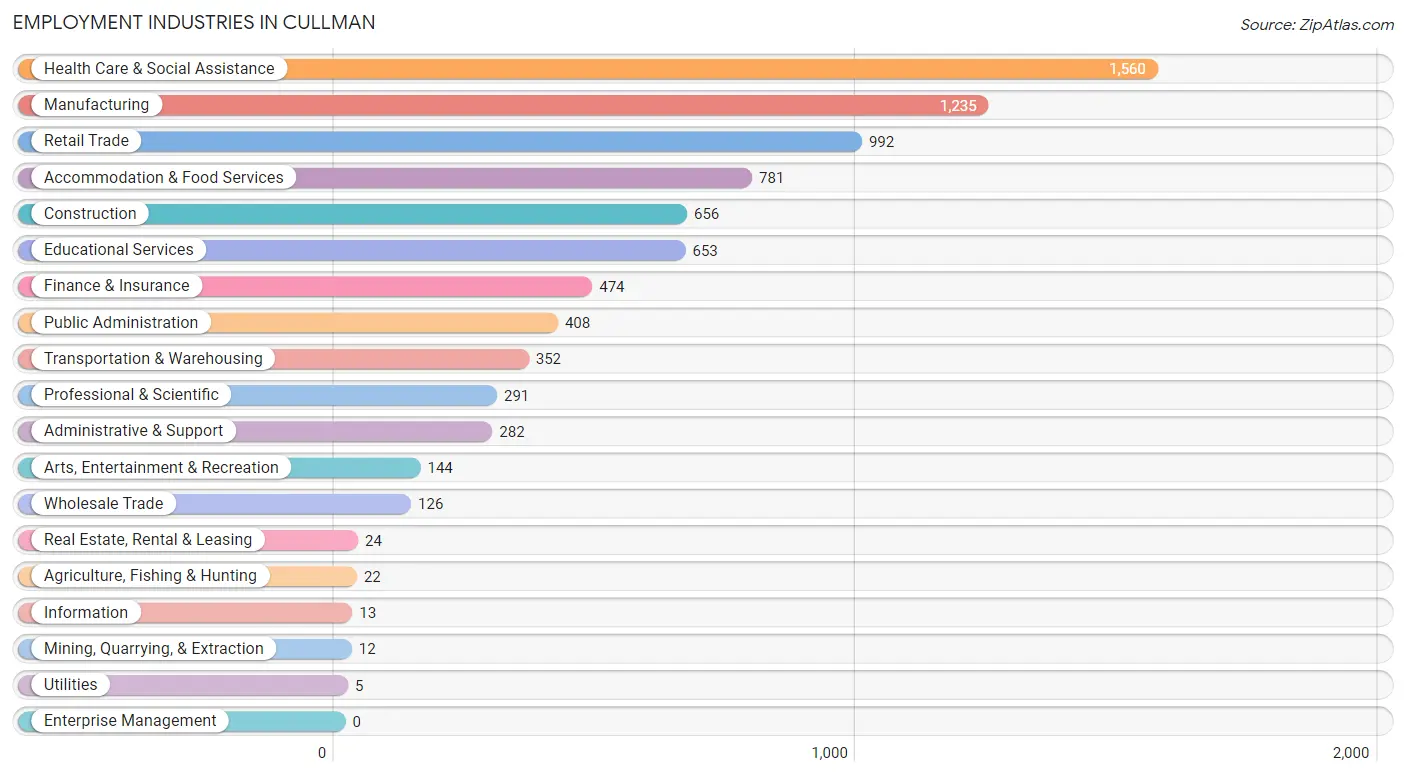
Employment Industries in Cullman
The major employment industries in Cullman include Health Care & Social Assistance (1,560 | 18.1%), Manufacturing (1,235 | 14.3%), Retail Trade (992 | 11.5%), Accommodation & Food Services (781 | 9.1%), and Construction (656 | 7.6%).
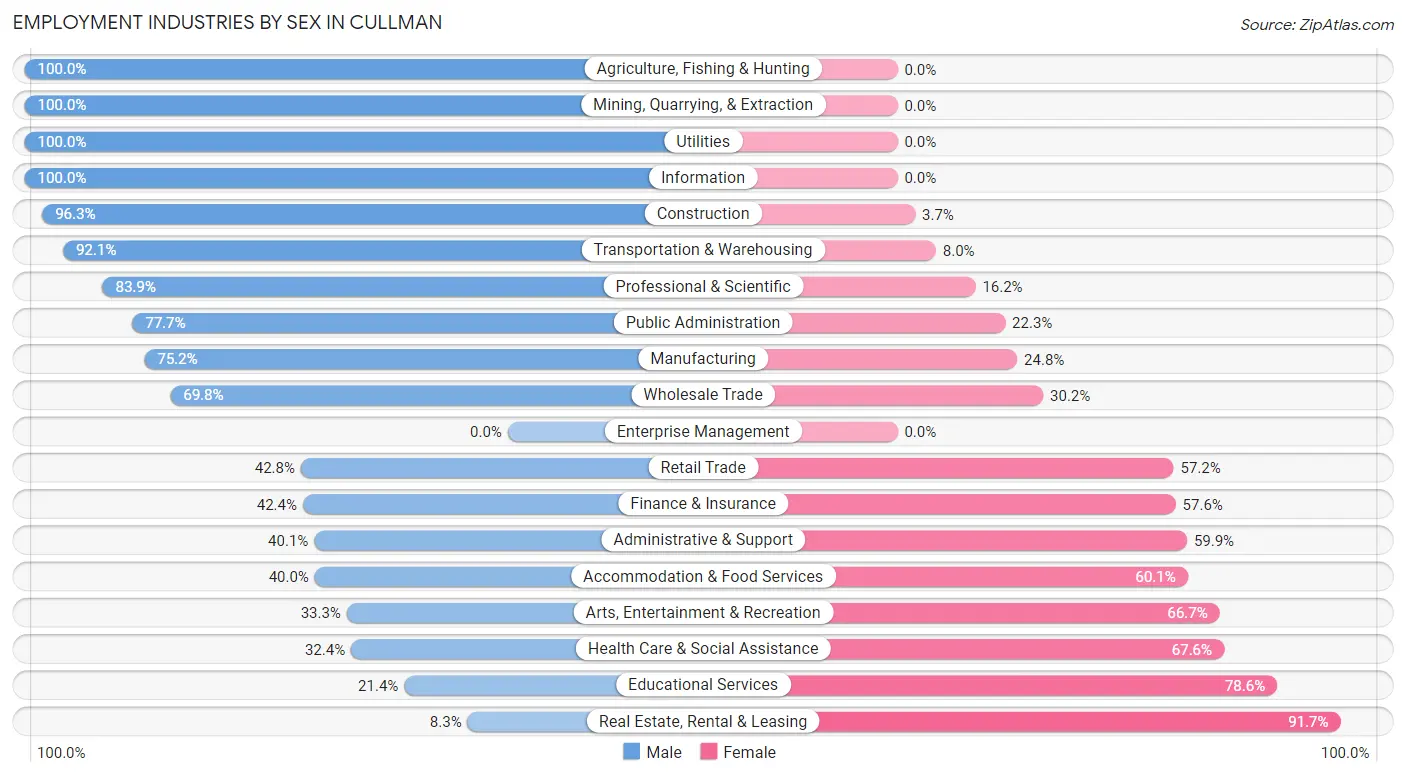
Employment Industries by Sex in Cullman
The Cullman industries that see more men than women are Agriculture, Fishing & Hunting (100.0%), Mining, Quarrying, & Extraction (100.0%), and Utilities (100.0%), whereas the industries that tend to have a higher number of women are Real Estate, Rental & Leasing (91.7%), Educational Services (78.6%), and Health Care & Social Assistance (67.6%).
| Industry | Male | Female |
| Agriculture, Fishing & Hunting | 22 (100.0%) | 0 (0.0%) |
| Mining, Quarrying, & Extraction | 12 (100.0%) | 0 (0.0%) |
| Construction | 632 (96.3%) | 24 (3.7%) |
| Manufacturing | 929 (75.2%) | 306 (24.8%) |
| Wholesale Trade | 88 (69.8%) | 38 (30.2%) |
| Retail Trade | 425 (42.8%) | 567 (57.2%) |
| Transportation & Warehousing | 324 (92.0%) | 28 (8.0%) |
| Utilities | 5 (100.0%) | 0 (0.0%) |
| Information | 13 (100.0%) | 0 (0.0%) |
| Finance & Insurance | 201 (42.4%) | 273 (57.6%) |
| Real Estate, Rental & Leasing | 2 (8.3%) | 22 (91.7%) |
| Professional & Scientific | 244 (83.9%) | 47 (16.2%) |
| Enterprise Management | 0 (0.0%) | 0 (0.0%) |
| Administrative & Support | 113 (40.1%) | 169 (59.9%) |
| Educational Services | 140 (21.4%) | 513 (78.6%) |
| Health Care & Social Assistance | 506 (32.4%) | 1,054 (67.6%) |
| Arts, Entertainment & Recreation | 48 (33.3%) | 96 (66.7%) |
| Accommodation & Food Services | 312 (40.0%) | 469 (60.1%) |
| Public Administration | 317 (77.7%) | 91 (22.3%) |
| Total | 4,552 (52.9%) | 4,058 (47.1%) |
Education in Cullman
School Enrollment in Cullman
The most common levels of schooling among the 4,375 students in Cullman are high school (1,057 | 24.2%), elementary school (873 | 20.0%), and college / undergraduate (795 | 18.2%).
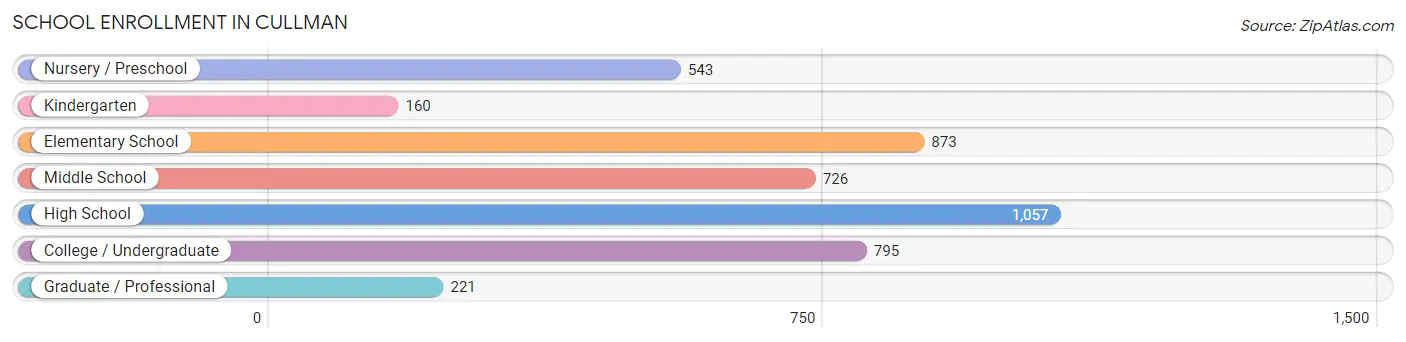
| School Level | # Students | % Students |
| Nursery / Preschool | 543 | 12.4% |
| Kindergarten | 160 | 3.7% |
| Elementary School | 873 | 20.0% |
| Middle School | 726 | 16.6% |
| High School | 1,057 | 24.2% |
| College / Undergraduate | 795 | 18.2% |
| Graduate / Professional | 221 | 5.1% |
| Total | 4,375 | 100.0% |
School Enrollment by Age by Funding Source in Cullman
Out of a total of 4,375 students who are enrolled in schools in Cullman, 844 (19.3%) attend a private institution, while the remaining 3,531 (80.7%) are enrolled in public schools. The age group of 5 to 9 year old has the highest likelihood of being enrolled in private schools, with 398 (32.8% in the age bracket) enrolled. Conversely, the age group of 35 years and over has the lowest likelihood of being enrolled in a private school, with 112 (91.1% in the age bracket) attending a public institution.
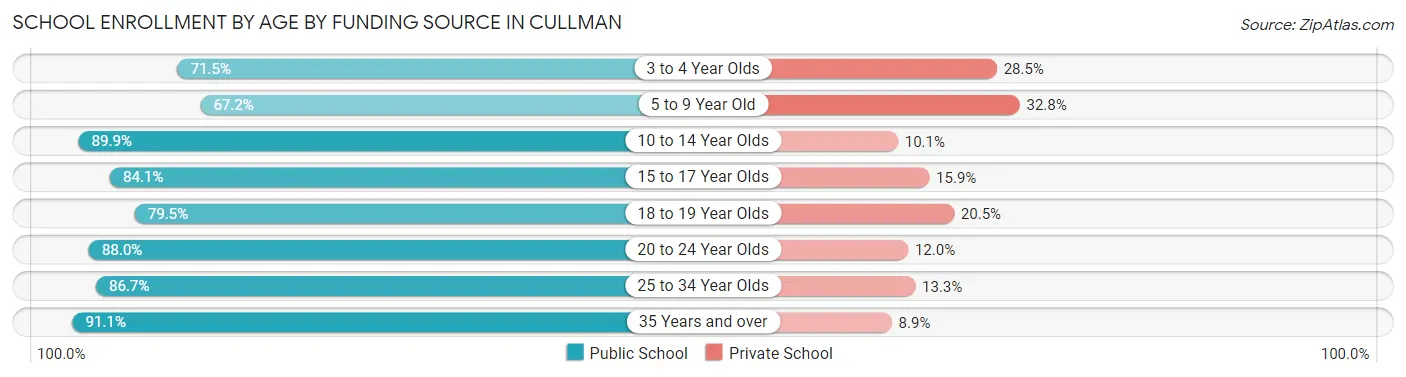
| Age Bracket | Public School | Private School |
| 3 to 4 Year Olds | 153 (71.5%) | 61 (28.5%) |
| 5 to 9 Year Old | 817 (67.2%) | 398 (32.8%) |
| 10 to 14 Year Olds | 874 (89.9%) | 98 (10.1%) |
| 15 to 17 Year Olds | 697 (84.1%) | 132 (15.9%) |
| 18 to 19 Year Olds | 151 (79.5%) | 39 (20.5%) |
| 20 to 24 Year Olds | 448 (88.0%) | 61 (12.0%) |
| 25 to 34 Year Olds | 280 (86.7%) | 43 (13.3%) |
| 35 Years and over | 112 (91.1%) | 11 (8.9%) |
| Total | 3,531 (80.7%) | 844 (19.3%) |
Educational Attainment by Field of Study in Cullman
Education (1,304 | 29.1%), business (921 | 20.6%), liberal arts & history (474 | 10.6%), science & technology (462 | 10.3%), and arts & humanities (227 | 5.1%) are the most common fields of study among 4,477 individuals in Cullman who have obtained a bachelor's degree or higher.
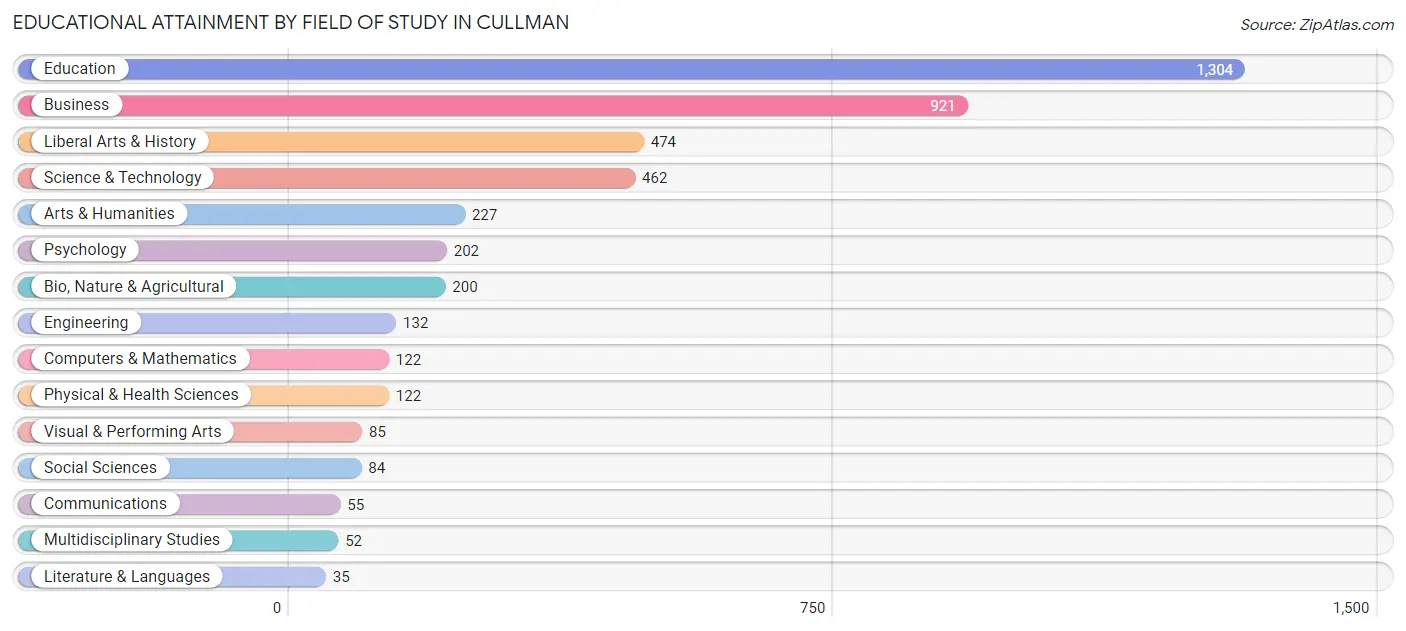
| Field of Study | # Graduates | % Graduates |
| Computers & Mathematics | 122 | 2.7% |
| Bio, Nature & Agricultural | 200 | 4.5% |
| Physical & Health Sciences | 122 | 2.7% |
| Psychology | 202 | 4.5% |
| Social Sciences | 84 | 1.9% |
| Engineering | 132 | 2.9% |
| Multidisciplinary Studies | 52 | 1.2% |
| Science & Technology | 462 | 10.3% |
| Business | 921 | 20.6% |
| Education | 1,304 | 29.1% |
| Literature & Languages | 35 | 0.8% |
| Liberal Arts & History | 474 | 10.6% |
| Visual & Performing Arts | 85 | 1.9% |
| Communications | 55 | 1.2% |
| Arts & Humanities | 227 | 5.1% |
| Total | 4,477 | 100.0% |
Transportation & Commute in Cullman
Vehicle Availability by Sex in Cullman
The most prevalent vehicle ownership categories in Cullman are males with 2 vehicles (2,030, accounting for 44.8%) and females with 2 vehicles (1,664, making up 52.0%).
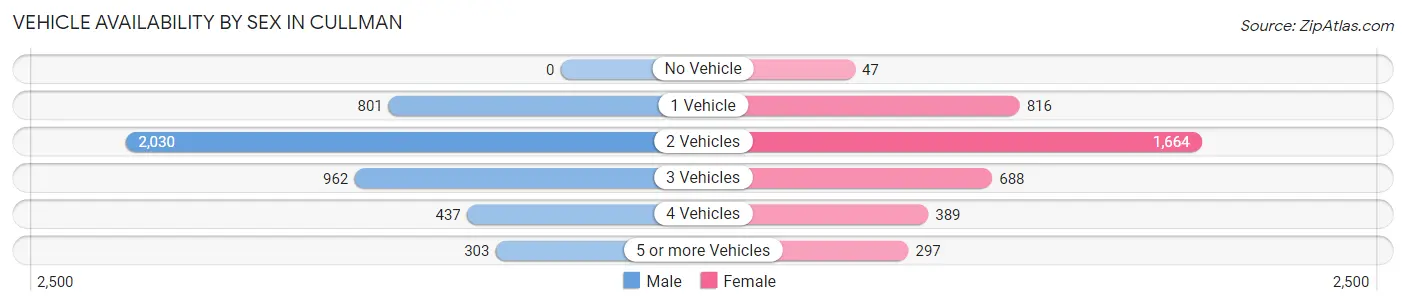
| Vehicles Available | Male | Female |
| No Vehicle | 0 (0.0%) | 47 (1.2%) |
| 1 Vehicle | 801 (17.7%) | 816 (20.9%) |
| 2 Vehicles | 2,030 (44.8%) | 1,664 (42.7%) |
| 3 Vehicles | 962 (21.2%) | 688 (17.6%) |
| 4 Vehicles | 437 (9.6%) | 389 (10.0%) |
| 5 or more Vehicles | 303 (6.7%) | 297 (7.6%) |
| Total | 4,533 (100.0%) | 3,901 (100.0%) |
Commute Time in Cullman
The most frequently occuring commute durations in Cullman are 5 to 9 minutes (2,355 commuters, 28.8%), 10 to 14 minutes (1,530 commuters, 18.7%), and 60 to 89 minutes (861 commuters, 10.5%).
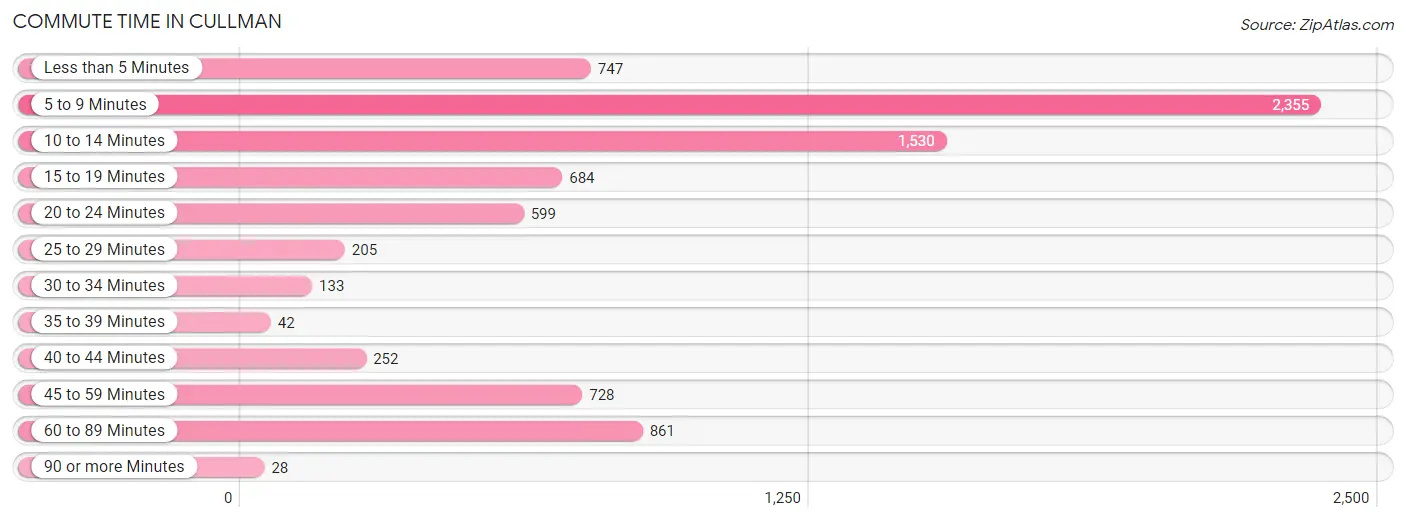
| Commute Time | # Commuters | % Commuters |
| Less than 5 Minutes | 747 | 9.1% |
| 5 to 9 Minutes | 2,355 | 28.8% |
| 10 to 14 Minutes | 1,530 | 18.7% |
| 15 to 19 Minutes | 684 | 8.4% |
| 20 to 24 Minutes | 599 | 7.3% |
| 25 to 29 Minutes | 205 | 2.5% |
| 30 to 34 Minutes | 133 | 1.6% |
| 35 to 39 Minutes | 42 | 0.5% |
| 40 to 44 Minutes | 252 | 3.1% |
| 45 to 59 Minutes | 728 | 8.9% |
| 60 to 89 Minutes | 861 | 10.5% |
| 90 or more Minutes | 28 | 0.3% |
Commute Time by Sex in Cullman
The most common commute times in Cullman are 5 to 9 minutes (1,068 commuters, 24.1%) for males and 5 to 9 minutes (1,287 commuters, 34.4%) for females.
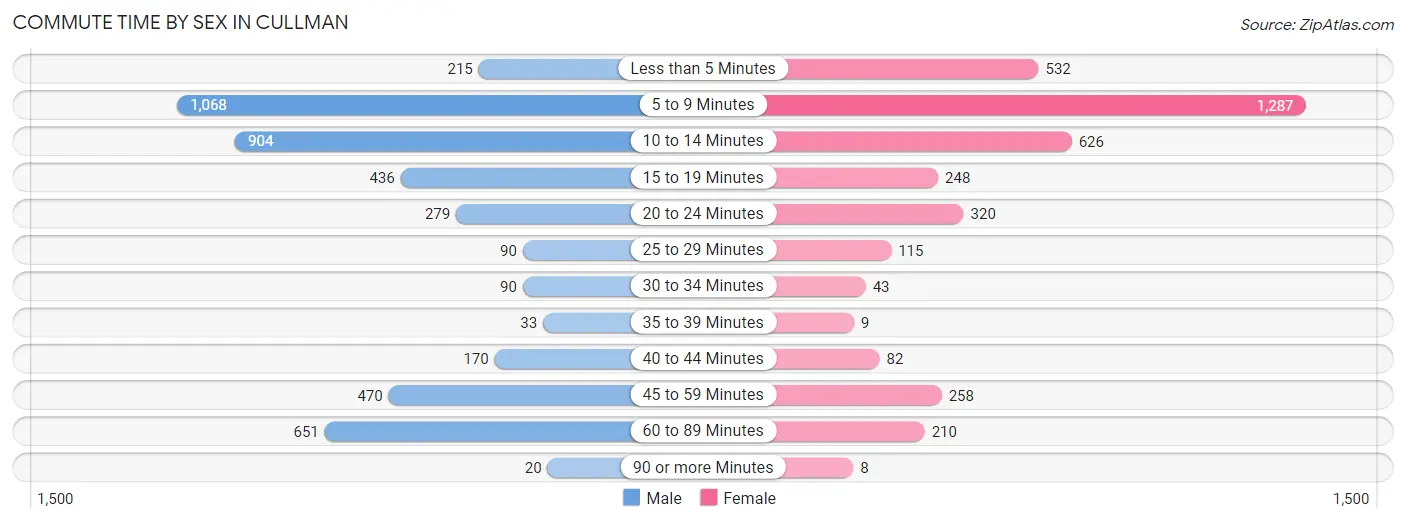
| Commute Time | Male | Female |
| Less than 5 Minutes | 215 (4.9%) | 532 (14.2%) |
| 5 to 9 Minutes | 1,068 (24.1%) | 1,287 (34.4%) |
| 10 to 14 Minutes | 904 (20.4%) | 626 (16.8%) |
| 15 to 19 Minutes | 436 (9.9%) | 248 (6.6%) |
| 20 to 24 Minutes | 279 (6.3%) | 320 (8.6%) |
| 25 to 29 Minutes | 90 (2.0%) | 115 (3.1%) |
| 30 to 34 Minutes | 90 (2.0%) | 43 (1.1%) |
| 35 to 39 Minutes | 33 (0.7%) | 9 (0.2%) |
| 40 to 44 Minutes | 170 (3.8%) | 82 (2.2%) |
| 45 to 59 Minutes | 470 (10.6%) | 258 (6.9%) |
| 60 to 89 Minutes | 651 (14.7%) | 210 (5.6%) |
| 90 or more Minutes | 20 (0.4%) | 8 (0.2%) |
Time of Departure to Work by Sex in Cullman
The most frequent times of departure to work in Cullman are 7:00 AM to 7:29 AM (767, 17.3%) for males and 7:30 AM to 7:59 AM (799, 21.4%) for females.
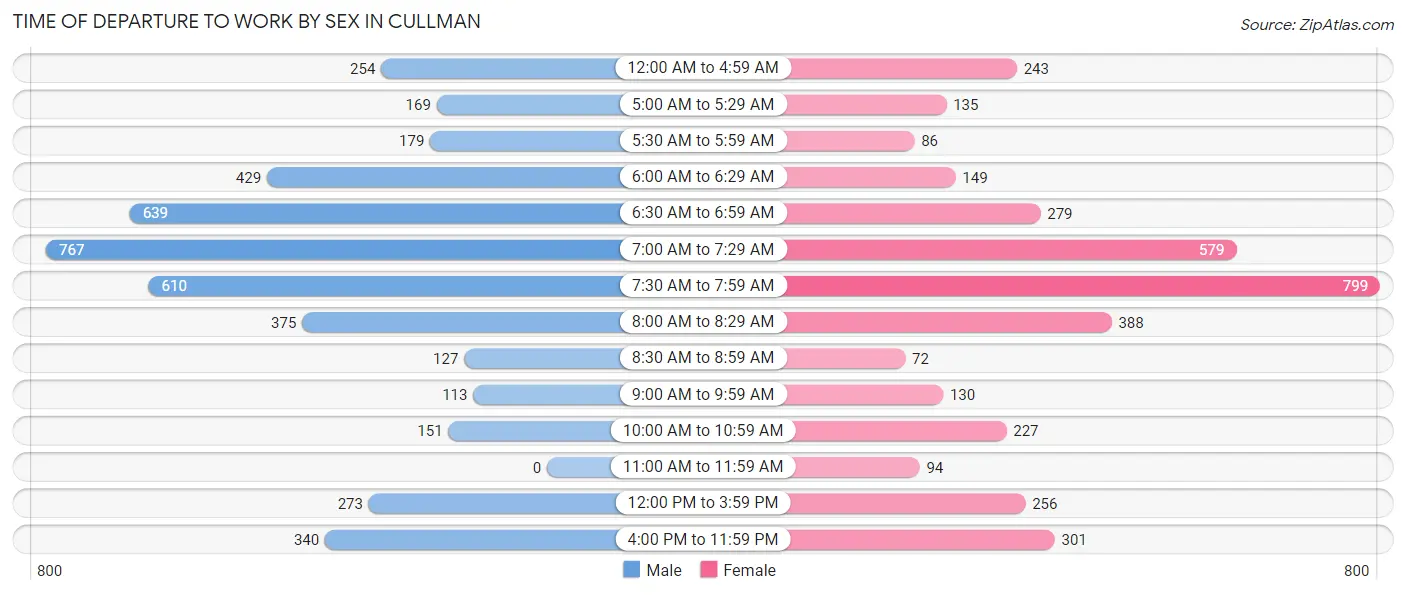
| Time of Departure | Male | Female |
| 12:00 AM to 4:59 AM | 254 (5.7%) | 243 (6.5%) |
| 5:00 AM to 5:29 AM | 169 (3.8%) | 135 (3.6%) |
| 5:30 AM to 5:59 AM | 179 (4.0%) | 86 (2.3%) |
| 6:00 AM to 6:29 AM | 429 (9.7%) | 149 (4.0%) |
| 6:30 AM to 6:59 AM | 639 (14.4%) | 279 (7.5%) |
| 7:00 AM to 7:29 AM | 767 (17.3%) | 579 (15.5%) |
| 7:30 AM to 7:59 AM | 610 (13.8%) | 799 (21.4%) |
| 8:00 AM to 8:29 AM | 375 (8.5%) | 388 (10.4%) |
| 8:30 AM to 8:59 AM | 127 (2.9%) | 72 (1.9%) |
| 9:00 AM to 9:59 AM | 113 (2.5%) | 130 (3.5%) |
| 10:00 AM to 10:59 AM | 151 (3.4%) | 227 (6.1%) |
| 11:00 AM to 11:59 AM | 0 (0.0%) | 94 (2.5%) |
| 12:00 PM to 3:59 PM | 273 (6.2%) | 256 (6.9%) |
| 4:00 PM to 11:59 PM | 340 (7.7%) | 301 (8.1%) |
| Total | 4,426 (100.0%) | 3,738 (100.0%) |
Housing Occupancy in Cullman
Occupancy by Ownership in Cullman
Of the total 7,725 dwellings in Cullman, owner-occupied units account for 4,759 (61.6%), while renter-occupied units make up 2,966 (38.4%).
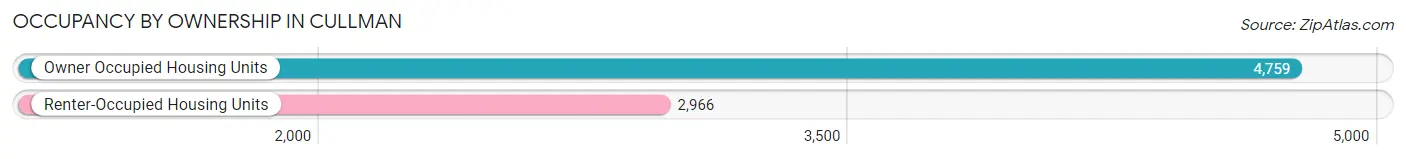
| Occupancy | # Housing Units | % Housing Units |
| Owner Occupied Housing Units | 4,759 | 61.6% |
| Renter-Occupied Housing Units | 2,966 | 38.4% |
| Total Occupied Housing Units | 7,725 | 100.0% |
Occupancy by Household Size in Cullman
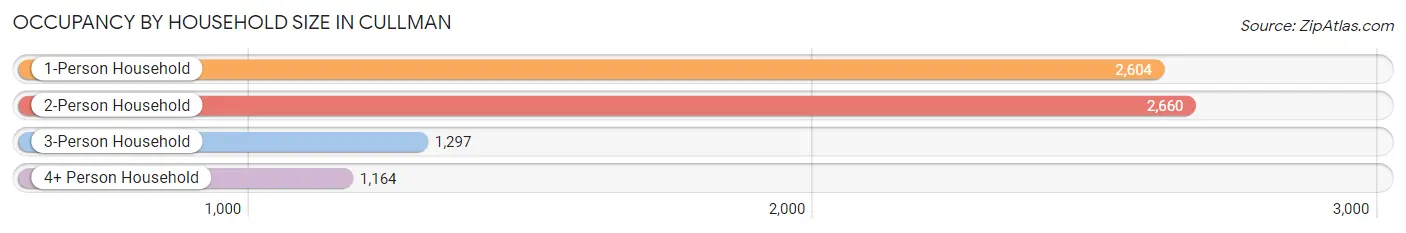
| Household Size | # Housing Units | % Housing Units |
| 1-Person Household | 2,604 | 33.7% |
| 2-Person Household | 2,660 | 34.4% |
| 3-Person Household | 1,297 | 16.8% |
| 4+ Person Household | 1,164 | 15.1% |
| Total Housing Units | 7,725 | 100.0% |
Occupancy by Ownership by Household Size in Cullman
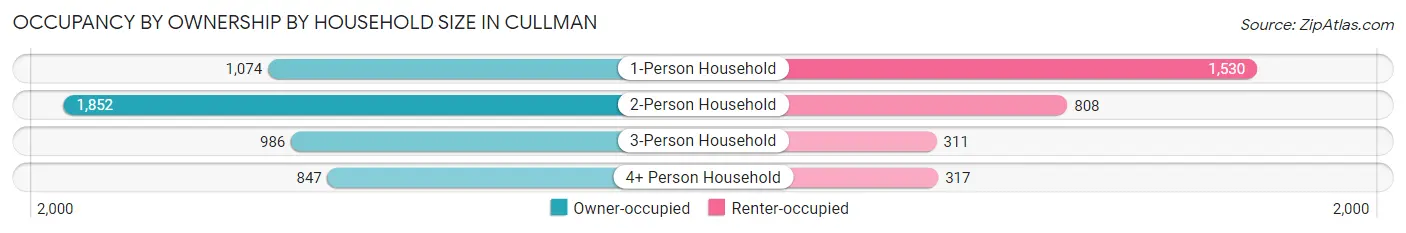
| Household Size | Owner-occupied | Renter-occupied |
| 1-Person Household | 1,074 (41.2%) | 1,530 (58.8%) |
| 2-Person Household | 1,852 (69.6%) | 808 (30.4%) |
| 3-Person Household | 986 (76.0%) | 311 (24.0%) |
| 4+ Person Household | 847 (72.8%) | 317 (27.2%) |
| Total Housing Units | 4,759 (61.6%) | 2,966 (38.4%) |
Occupancy by Educational Attainment in Cullman
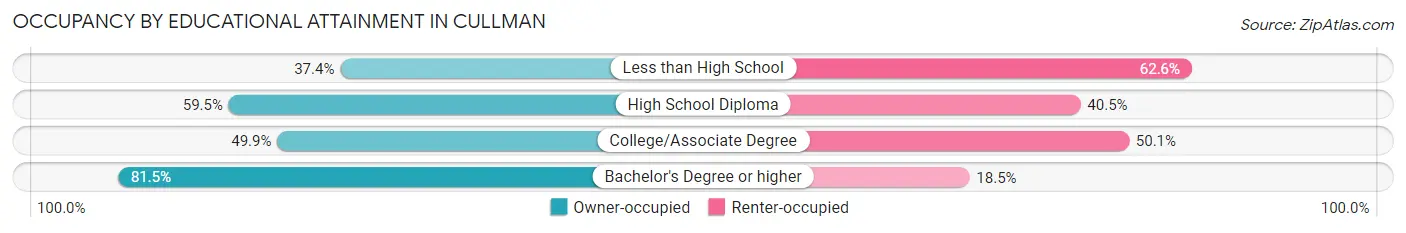
| Household Size | Owner-occupied | Renter-occupied |
| Less than High School | 229 (37.4%) | 383 (62.6%) |
| High School Diploma | 1,233 (59.5%) | 839 (40.5%) |
| College/Associate Degree | 1,282 (49.9%) | 1,287 (50.1%) |
| Bachelor's Degree or higher | 2,015 (81.5%) | 457 (18.5%) |
Occupancy by Age of Householder in Cullman
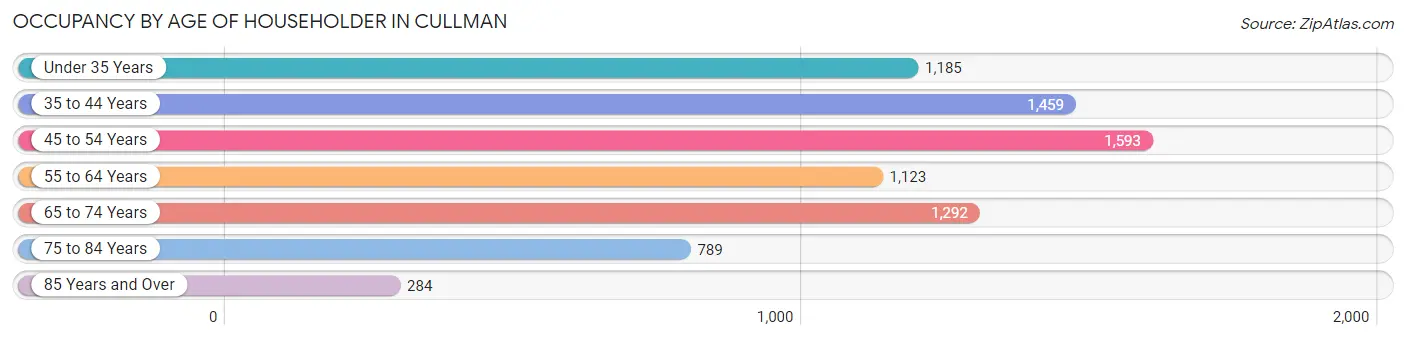
| Age Bracket | # Households | % Households |
| Under 35 Years | 1,185 | 15.3% |
| 35 to 44 Years | 1,459 | 18.9% |
| 45 to 54 Years | 1,593 | 20.6% |
| 55 to 64 Years | 1,123 | 14.5% |
| 65 to 74 Years | 1,292 | 16.7% |
| 75 to 84 Years | 789 | 10.2% |
| 85 Years and Over | 284 | 3.7% |
| Total | 7,725 | 100.0% |
Housing Finances in Cullman
Median Income by Occupancy in Cullman
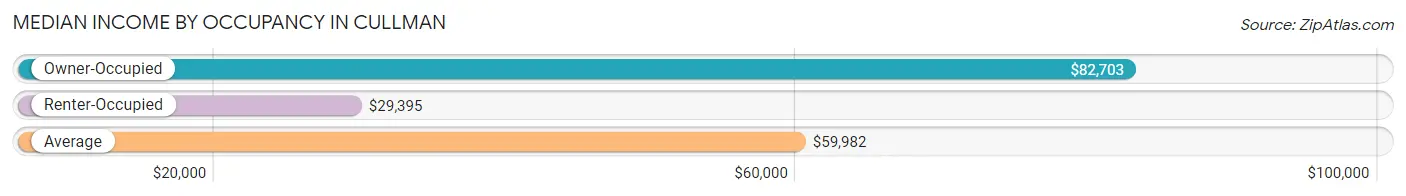
| Occupancy Type | # Households | Median Income |
| Owner-Occupied | 4,759 (61.6%) | $82,703 |
| Renter-Occupied | 2,966 (38.4%) | $29,395 |
| Average | 7,725 (100.0%) | $59,982 |
Occupancy by Householder Income Bracket in Cullman
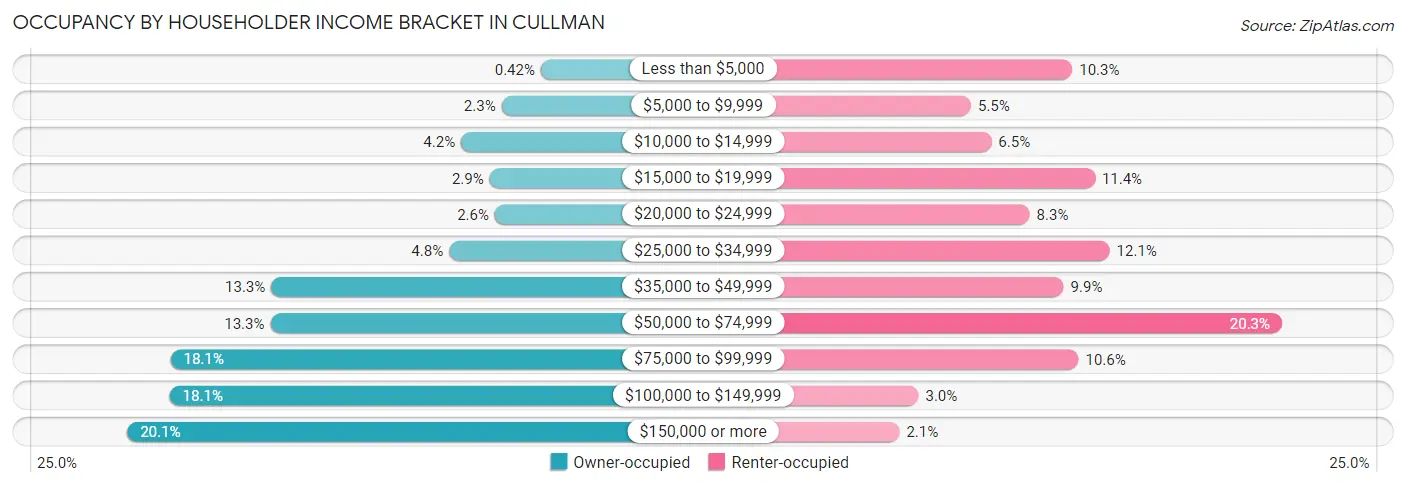
| Income Bracket | Owner-occupied | Renter-occupied |
| Less than $5,000 | 20 (0.4%) | 306 (10.3%) |
| $5,000 to $9,999 | 109 (2.3%) | 163 (5.5%) |
| $10,000 to $14,999 | 201 (4.2%) | 192 (6.5%) |
| $15,000 to $19,999 | 136 (2.9%) | 338 (11.4%) |
| $20,000 to $24,999 | 124 (2.6%) | 246 (8.3%) |
| $25,000 to $34,999 | 228 (4.8%) | 359 (12.1%) |
| $35,000 to $49,999 | 631 (13.3%) | 294 (9.9%) |
| $50,000 to $74,999 | 633 (13.3%) | 602 (20.3%) |
| $75,000 to $99,999 | 859 (18.0%) | 315 (10.6%) |
| $100,000 to $149,999 | 861 (18.1%) | 89 (3.0%) |
| $150,000 or more | 957 (20.1%) | 62 (2.1%) |
| Total | 4,759 (100.0%) | 2,966 (100.0%) |
Monthly Housing Cost Tiers in Cullman
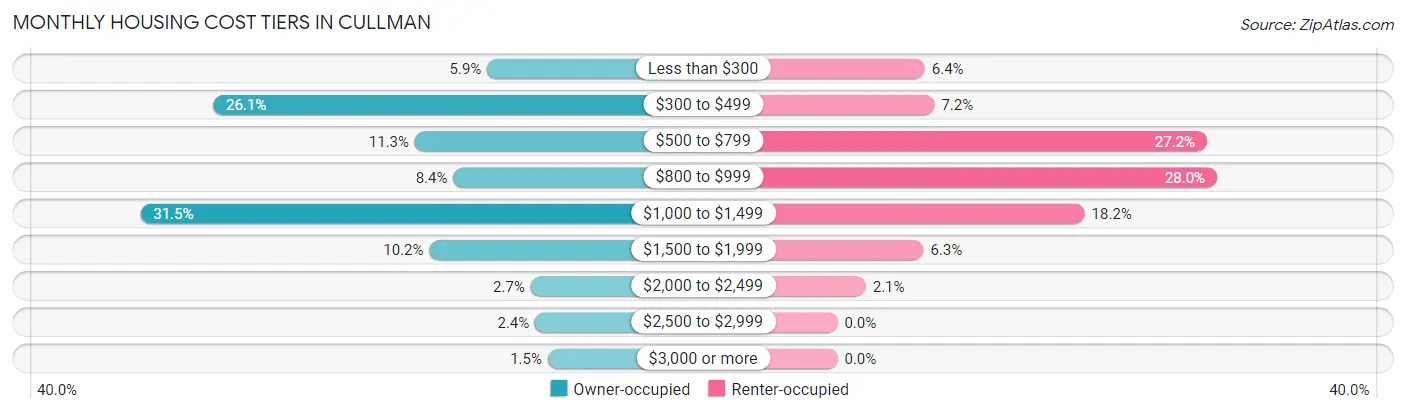
| Monthly Cost | Owner-occupied | Renter-occupied |
| Less than $300 | 282 (5.9%) | 191 (6.4%) |
| $300 to $499 | 1,243 (26.1%) | 212 (7.1%) |
| $500 to $799 | 536 (11.3%) | 807 (27.2%) |
| $800 to $999 | 401 (8.4%) | 829 (28.0%) |
| $1,000 to $1,499 | 1,498 (31.5%) | 540 (18.2%) |
| $1,500 to $1,999 | 485 (10.2%) | 188 (6.3%) |
| $2,000 to $2,499 | 130 (2.7%) | 62 (2.1%) |
| $2,500 to $2,999 | 114 (2.4%) | 0 (0.0%) |
| $3,000 or more | 70 (1.5%) | 0 (0.0%) |
| Total | 4,759 (100.0%) | 2,966 (100.0%) |
Physical Housing Characteristics in Cullman
Housing Structures in Cullman
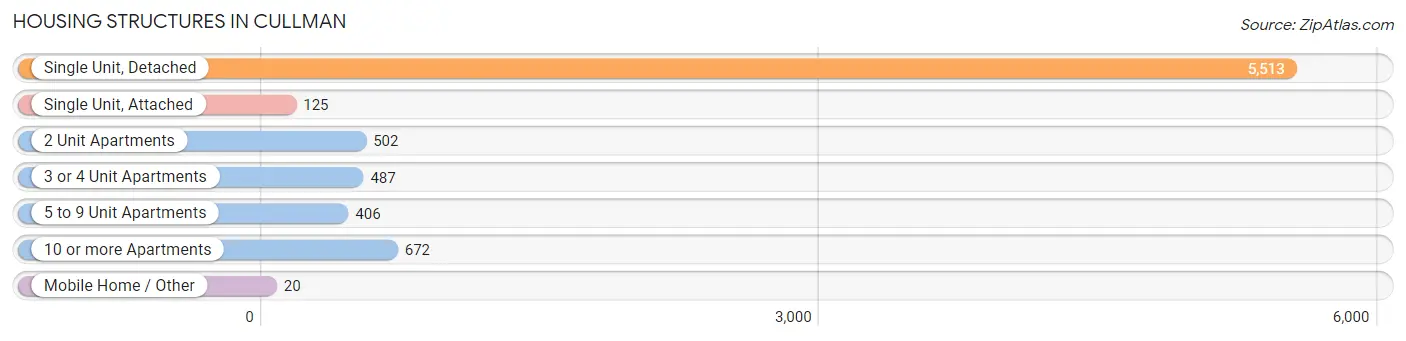
| Structure Type | # Housing Units | % Housing Units |
| Single Unit, Detached | 5,513 | 71.4% |
| Single Unit, Attached | 125 | 1.6% |
| 2 Unit Apartments | 502 | 6.5% |
| 3 or 4 Unit Apartments | 487 | 6.3% |
| 5 to 9 Unit Apartments | 406 | 5.3% |
| 10 or more Apartments | 672 | 8.7% |
| Mobile Home / Other | 20 | 0.3% |
| Total | 7,725 | 100.0% |
Housing Structures by Occupancy in Cullman
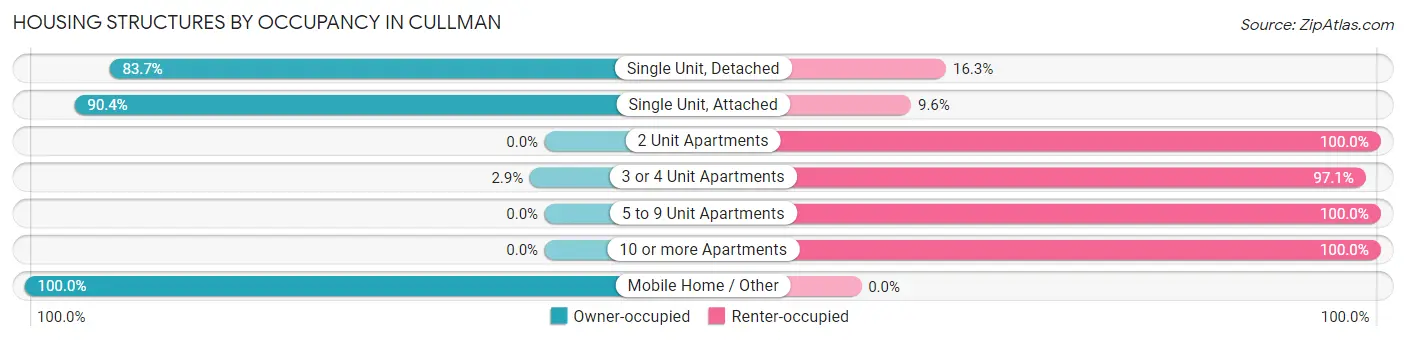
| Structure Type | Owner-occupied | Renter-occupied |
| Single Unit, Detached | 4,612 (83.7%) | 901 (16.3%) |
| Single Unit, Attached | 113 (90.4%) | 12 (9.6%) |
| 2 Unit Apartments | 0 (0.0%) | 502 (100.0%) |
| 3 or 4 Unit Apartments | 14 (2.9%) | 473 (97.1%) |
| 5 to 9 Unit Apartments | 0 (0.0%) | 406 (100.0%) |
| 10 or more Apartments | 0 (0.0%) | 672 (100.0%) |
| Mobile Home / Other | 20 (100.0%) | 0 (0.0%) |
| Total | 4,759 (61.6%) | 2,966 (38.4%) |
Housing Structures by Number of Rooms in Cullman
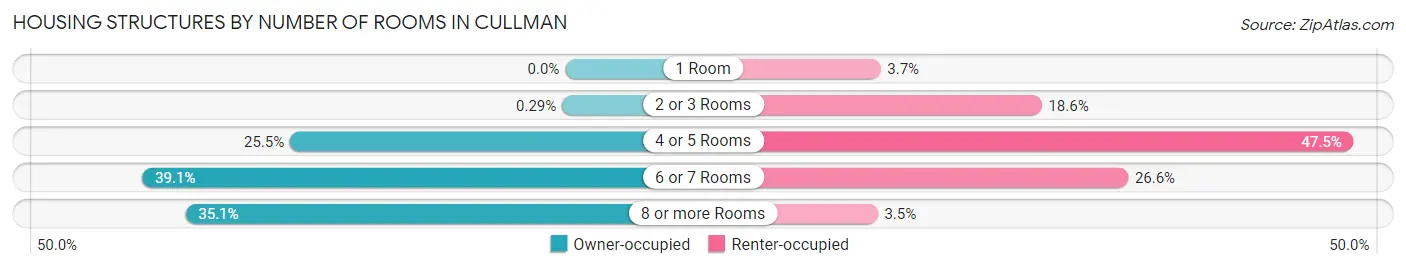
| Number of Rooms | Owner-occupied | Renter-occupied |
| 1 Room | 0 (0.0%) | 111 (3.7%) |
| 2 or 3 Rooms | 14 (0.3%) | 553 (18.6%) |
| 4 or 5 Rooms | 1,211 (25.5%) | 1,409 (47.5%) |
| 6 or 7 Rooms | 1,862 (39.1%) | 790 (26.6%) |
| 8 or more Rooms | 1,672 (35.1%) | 103 (3.5%) |
| Total | 4,759 (100.0%) | 2,966 (100.0%) |
Housing Structure by Heating Type in Cullman
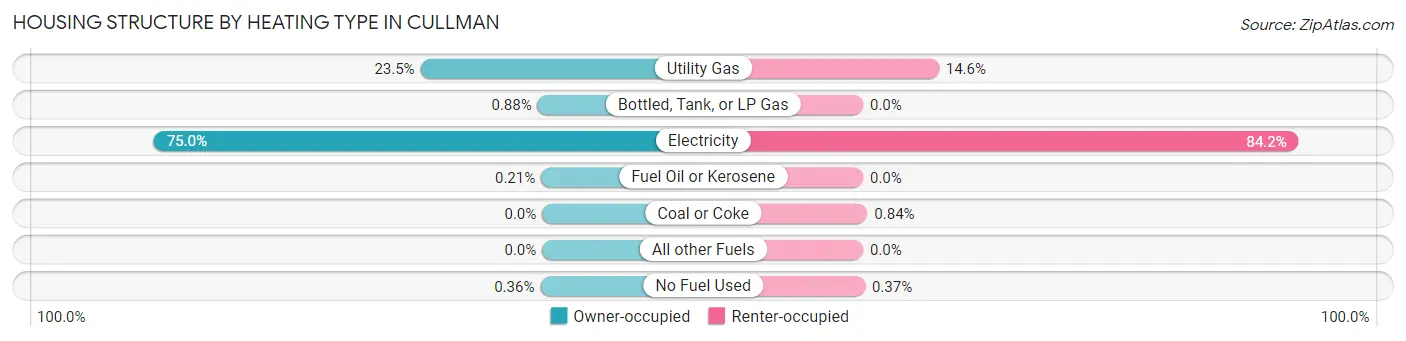
| Heating Type | Owner-occupied | Renter-occupied |
| Utility Gas | 1,119 (23.5%) | 434 (14.6%) |
| Bottled, Tank, or LP Gas | 42 (0.9%) | 0 (0.0%) |
| Electricity | 3,571 (75.0%) | 2,496 (84.2%) |
| Fuel Oil or Kerosene | 10 (0.2%) | 0 (0.0%) |
| Coal or Coke | 0 (0.0%) | 25 (0.8%) |
| All other Fuels | 0 (0.0%) | 0 (0.0%) |
| No Fuel Used | 17 (0.4%) | 11 (0.4%) |
| Total | 4,759 (100.0%) | 2,966 (100.0%) |
Household Vehicle Usage in Cullman
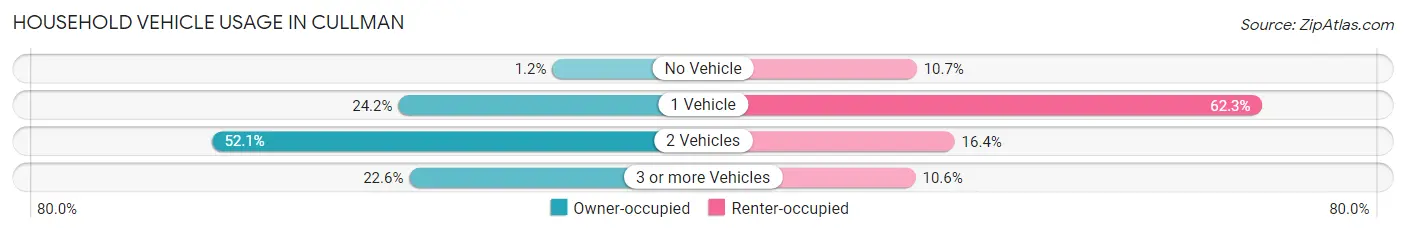
| Vehicles per Household | Owner-occupied | Renter-occupied |
| No Vehicle | 56 (1.2%) | 318 (10.7%) |
| 1 Vehicle | 1,151 (24.2%) | 1,849 (62.3%) |
| 2 Vehicles | 2,479 (52.1%) | 486 (16.4%) |
| 3 or more Vehicles | 1,073 (22.6%) | 313 (10.5%) |
| Total | 4,759 (100.0%) | 2,966 (100.0%) |
Real Estate & Mortgages in Cullman
Real Estate and Mortgage Overview in Cullman
| Characteristic | Without Mortgage | With Mortgage |
| Housing Units | 2,046 | 2,713 |
| Median Property Value | $192,800 | $209,900 |
| Median Household Income | $59,881 | $711 |
| Monthly Housing Costs | $425 | $61 |
| Real Estate Taxes | $663 | $157 |
Property Value by Mortgage Status in Cullman
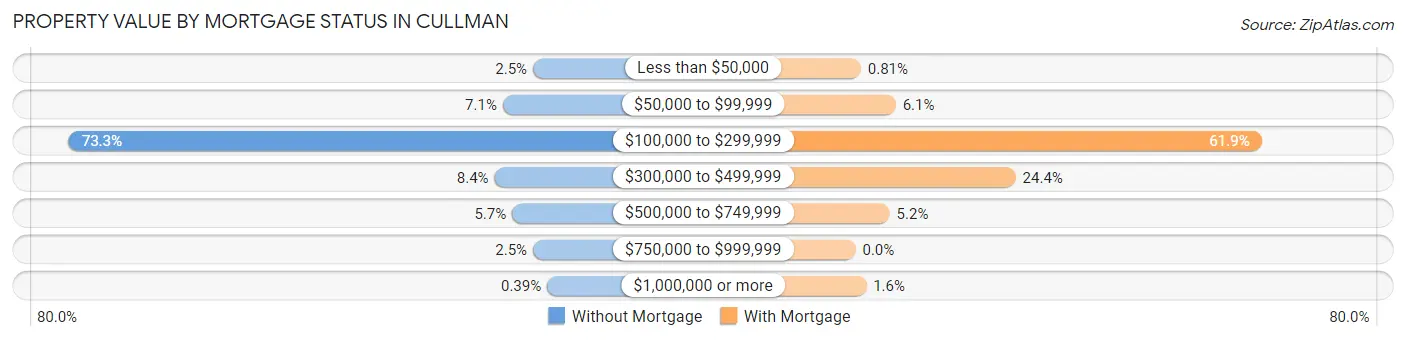
| Property Value | Without Mortgage | With Mortgage |
| Less than $50,000 | 52 (2.5%) | 22 (0.8%) |
| $50,000 to $99,999 | 146 (7.1%) | 166 (6.1%) |
| $100,000 to $299,999 | 1,499 (73.3%) | 1,678 (61.9%) |
| $300,000 to $499,999 | 172 (8.4%) | 662 (24.4%) |
| $500,000 to $749,999 | 117 (5.7%) | 141 (5.2%) |
| $750,000 to $999,999 | 52 (2.5%) | 0 (0.0%) |
| $1,000,000 or more | 8 (0.4%) | 44 (1.6%) |
| Total | 2,046 (100.0%) | 2,713 (100.0%) |
Household Income by Mortgage Status in Cullman
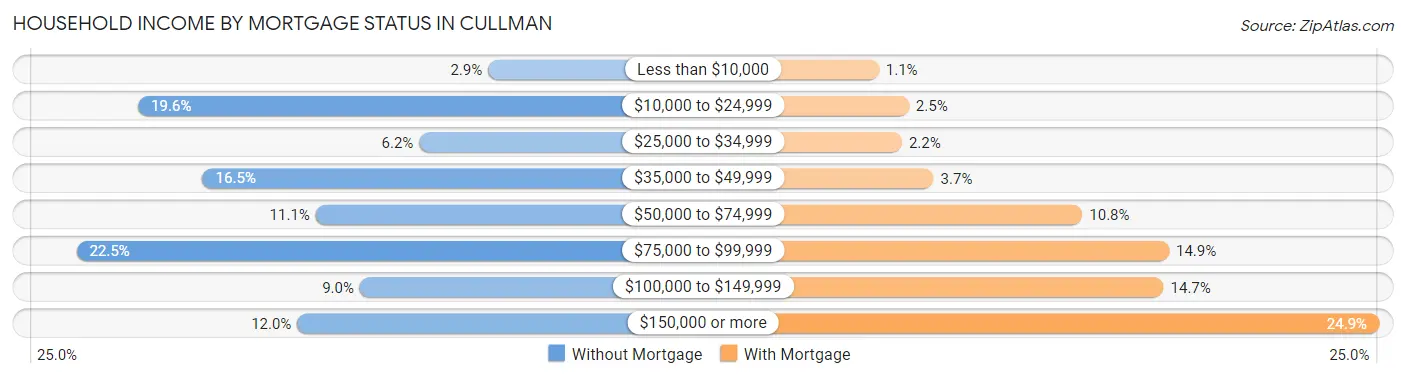
| Household Income | Without Mortgage | With Mortgage |
| Less than $10,000 | 60 (2.9%) | 30 (1.1%) |
| $10,000 to $24,999 | 401 (19.6%) | 69 (2.5%) |
| $25,000 to $34,999 | 127 (6.2%) | 60 (2.2%) |
| $35,000 to $49,999 | 338 (16.5%) | 101 (3.7%) |
| $50,000 to $74,999 | 228 (11.1%) | 293 (10.8%) |
| $75,000 to $99,999 | 461 (22.5%) | 405 (14.9%) |
| $100,000 to $149,999 | 185 (9.0%) | 398 (14.7%) |
| $150,000 or more | 246 (12.0%) | 676 (24.9%) |
| Total | 2,046 (100.0%) | 2,713 (100.0%) |
Property Value to Household Income Ratio in Cullman
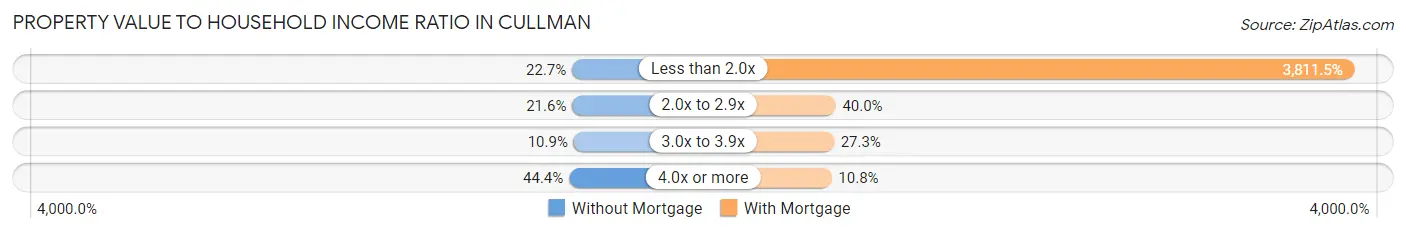
| Value-to-Income Ratio | Without Mortgage | With Mortgage |
| Less than 2.0x | 464 (22.7%) | 103,405 (3,811.5%) |
| 2.0x to 2.9x | 442 (21.6%) | 1,086 (40.0%) |
| 3.0x to 3.9x | 222 (10.8%) | 741 (27.3%) |
| 4.0x or more | 908 (44.4%) | 292 (10.8%) |
| Total | 2,046 (100.0%) | 2,713 (100.0%) |
Real Estate Taxes by Mortgage Status in Cullman
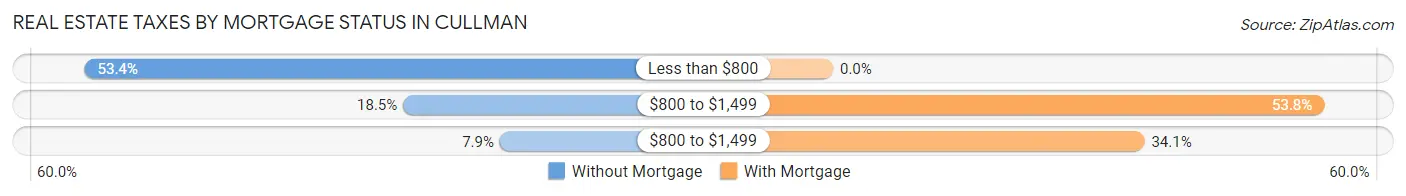
| Property Taxes | Without Mortgage | With Mortgage |
| Less than $800 | 1,093 (53.4%) | 0 (0.0%) |
| $800 to $1,499 | 379 (18.5%) | 1,460 (53.8%) |
| $800 to $1,499 | 162 (7.9%) | 926 (34.1%) |
| Total | 2,046 (100.0%) | 2,713 (100.0%) |
Health & Disability in Cullman
Health Insurance Coverage by Age in Cullman
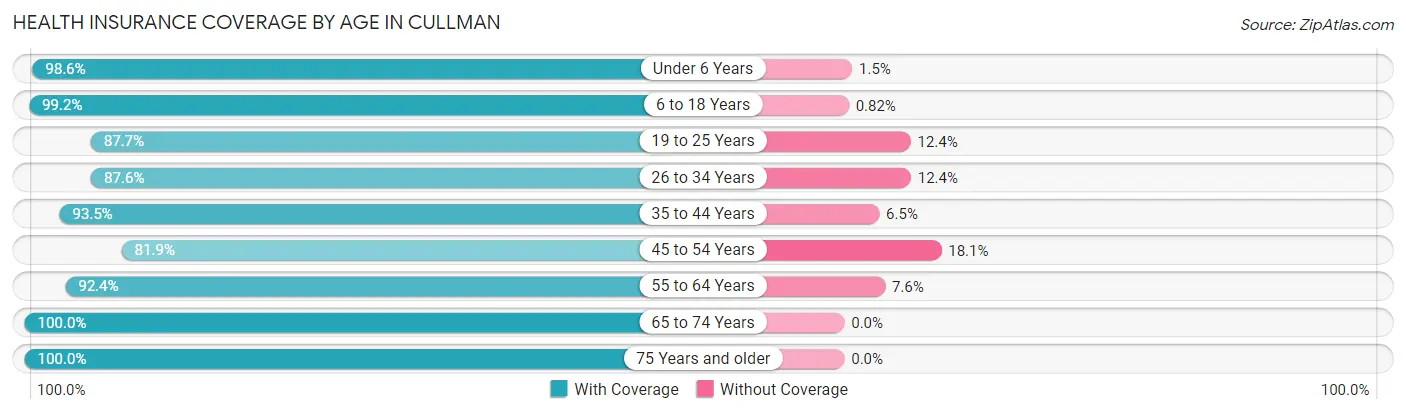
| Age Bracket | With Coverage | Without Coverage |
| Under 6 Years | 1,222 (98.6%) | 18 (1.5%) |
| 6 to 18 Years | 2,672 (99.2%) | 22 (0.8%) |
| 19 to 25 Years | 1,355 (87.6%) | 191 (12.3%) |
| 26 to 34 Years | 1,667 (87.6%) | 236 (12.4%) |
| 35 to 44 Years | 2,157 (93.5%) | 150 (6.5%) |
| 45 to 54 Years | 2,304 (81.9%) | 509 (18.1%) |
| 55 to 64 Years | 1,680 (92.4%) | 138 (7.6%) |
| 65 to 74 Years | 2,051 (100.0%) | 0 (0.0%) |
| 75 Years and older | 1,466 (100.0%) | 0 (0.0%) |
| Total | 16,574 (92.9%) | 1,264 (7.1%) |
Health Insurance Coverage by Citizenship Status in Cullman
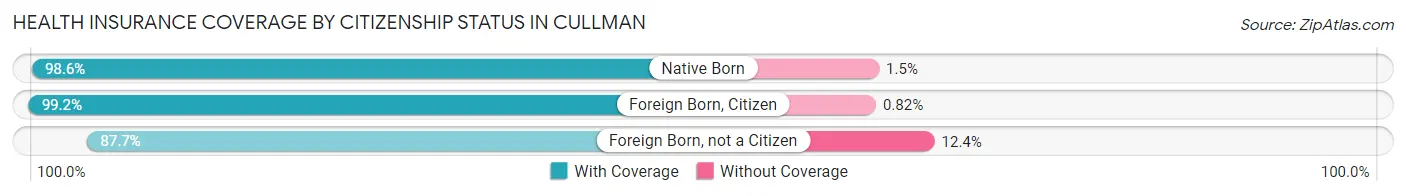
| Citizenship Status | With Coverage | Without Coverage |
| Native Born | 1,222 (98.6%) | 18 (1.5%) |
| Foreign Born, Citizen | 2,672 (99.2%) | 22 (0.8%) |
| Foreign Born, not a Citizen | 1,355 (87.6%) | 191 (12.3%) |
Health Insurance Coverage by Household Income in Cullman
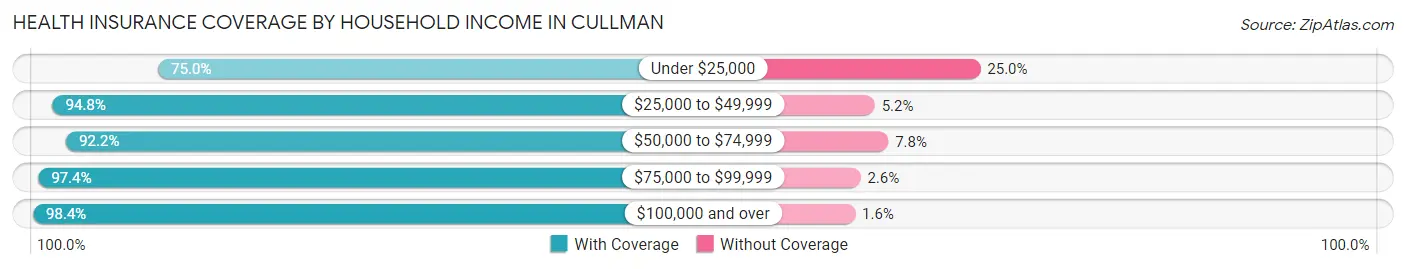
| Household Income | With Coverage | Without Coverage |
| Under $25,000 | 1,969 (75.0%) | 657 (25.0%) |
| $25,000 to $49,999 | 2,389 (94.8%) | 132 (5.2%) |
| $50,000 to $74,999 | 2,758 (92.2%) | 232 (7.8%) |
| $75,000 to $99,999 | 3,232 (97.4%) | 85 (2.6%) |
| $100,000 and over | 6,166 (98.4%) | 98 (1.6%) |
Public vs Private Health Insurance Coverage by Age in Cullman
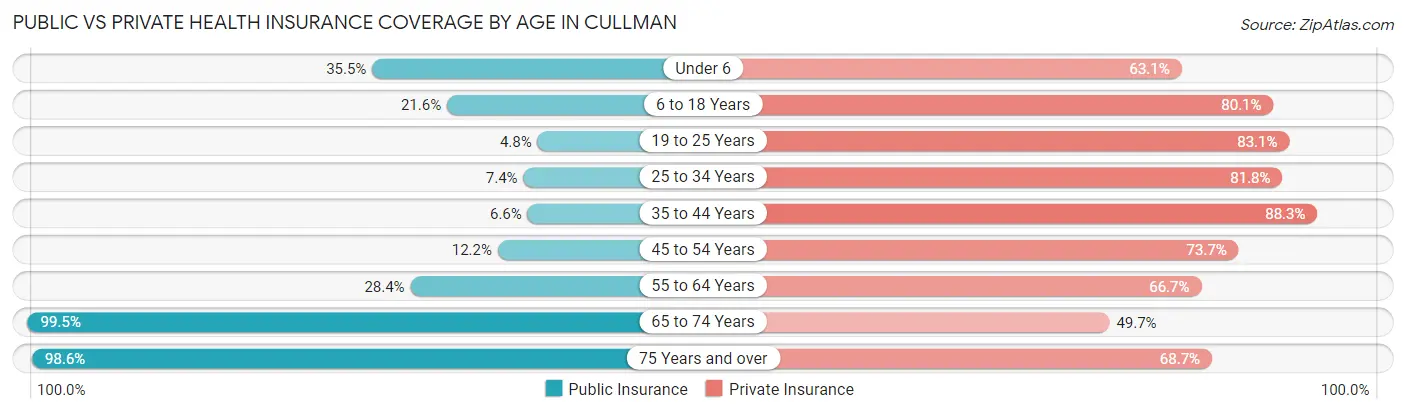
| Age Bracket | Public Insurance | Private Insurance |
| Under 6 | 440 (35.5%) | 782 (63.1%) |
| 6 to 18 Years | 582 (21.6%) | 2,158 (80.1%) |
| 19 to 25 Years | 74 (4.8%) | 1,284 (83.1%) |
| 25 to 34 Years | 141 (7.4%) | 1,556 (81.8%) |
| 35 to 44 Years | 153 (6.6%) | 2,036 (88.2%) |
| 45 to 54 Years | 342 (12.2%) | 2,072 (73.7%) |
| 55 to 64 Years | 516 (28.4%) | 1,213 (66.7%) |
| 65 to 74 Years | 2,040 (99.5%) | 1,019 (49.7%) |
| 75 Years and over | 1,446 (98.6%) | 1,007 (68.7%) |
| Total | 5,734 (32.1%) | 13,127 (73.6%) |
Disability Status by Sex by Age in Cullman
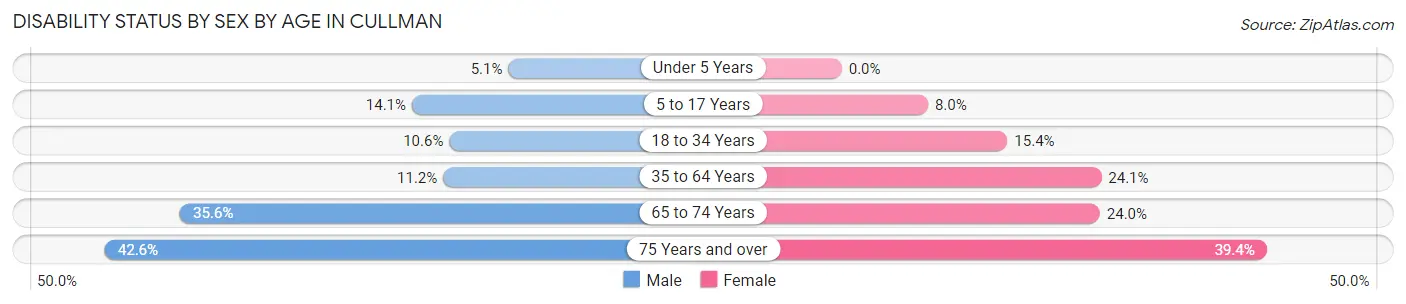
| Age Bracket | Male | Female |
| Under 5 Years | 23 (5.1%) | 0 (0.0%) |
| 5 to 17 Years | 193 (14.1%) | 135 (8.0%) |
| 18 to 34 Years | 202 (10.6%) | 255 (15.4%) |
| 35 to 64 Years | 385 (11.2%) | 840 (24.1%) |
| 65 to 74 Years | 324 (35.6%) | 273 (23.9%) |
| 75 Years and over | 177 (42.5%) | 414 (39.4%) |
Disability Class by Sex by Age in Cullman
Disability Class: Hearing Difficulty
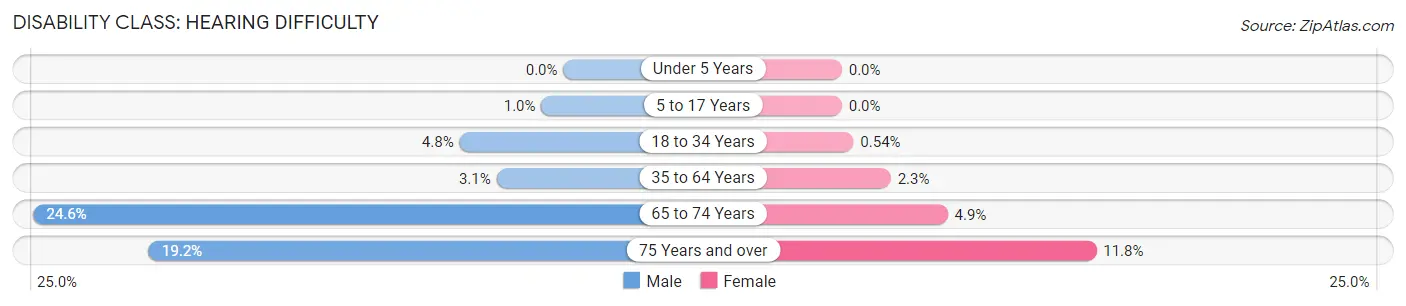
| Age Bracket | Male | Female |
| Under 5 Years | 0 (0.0%) | 0 (0.0%) |
| 5 to 17 Years | 14 (1.0%) | 0 (0.0%) |
| 18 to 34 Years | 92 (4.8%) | 9 (0.5%) |
| 35 to 64 Years | 107 (3.1%) | 79 (2.3%) |
| 65 to 74 Years | 224 (24.6%) | 56 (4.9%) |
| 75 Years and over | 80 (19.2%) | 124 (11.8%) |
Disability Class: Vision Difficulty
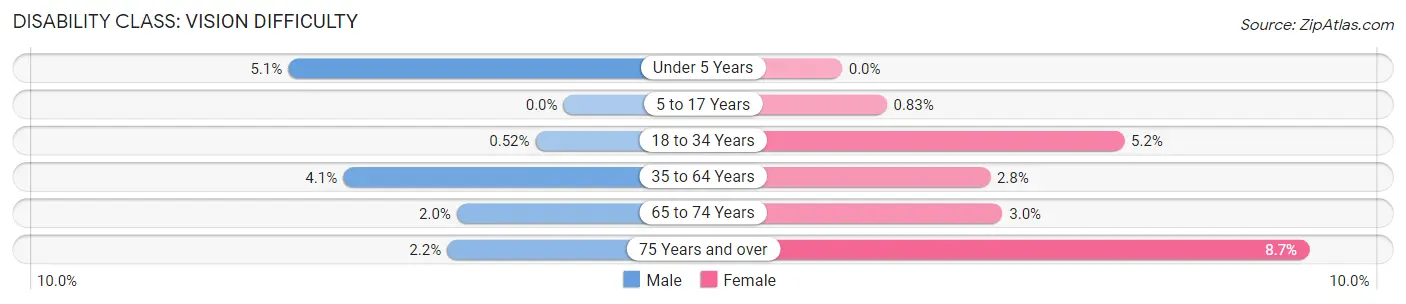
| Age Bracket | Male | Female |
| Under 5 Years | 23 (5.1%) | 0 (0.0%) |
| 5 to 17 Years | 0 (0.0%) | 14 (0.8%) |
| 18 to 34 Years | 10 (0.5%) | 87 (5.2%) |
| 35 to 64 Years | 141 (4.1%) | 96 (2.8%) |
| 65 to 74 Years | 18 (2.0%) | 34 (3.0%) |
| 75 Years and over | 9 (2.2%) | 91 (8.7%) |
Disability Class: Cognitive Difficulty
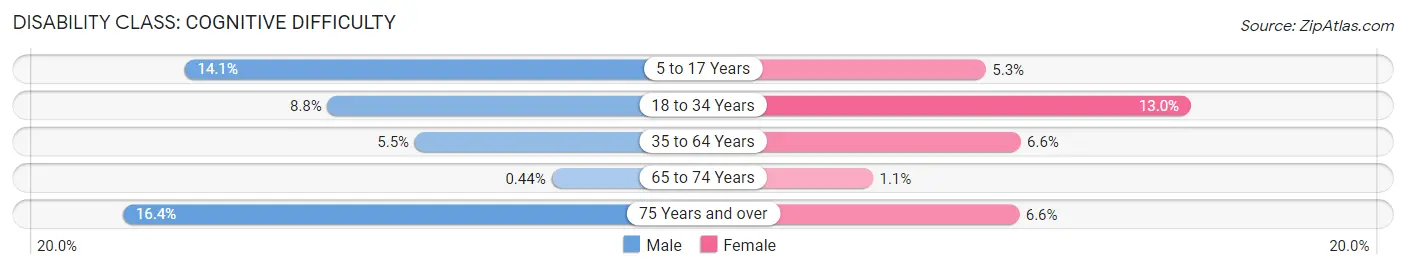
| Age Bracket | Male | Female |
| 5 to 17 Years | 193 (14.1%) | 90 (5.3%) |
| 18 to 34 Years | 167 (8.7%) | 215 (13.0%) |
| 35 to 64 Years | 190 (5.5%) | 231 (6.6%) |
| 65 to 74 Years | 4 (0.4%) | 13 (1.1%) |
| 75 Years and over | 68 (16.4%) | 69 (6.6%) |
Disability Class: Ambulatory Difficulty
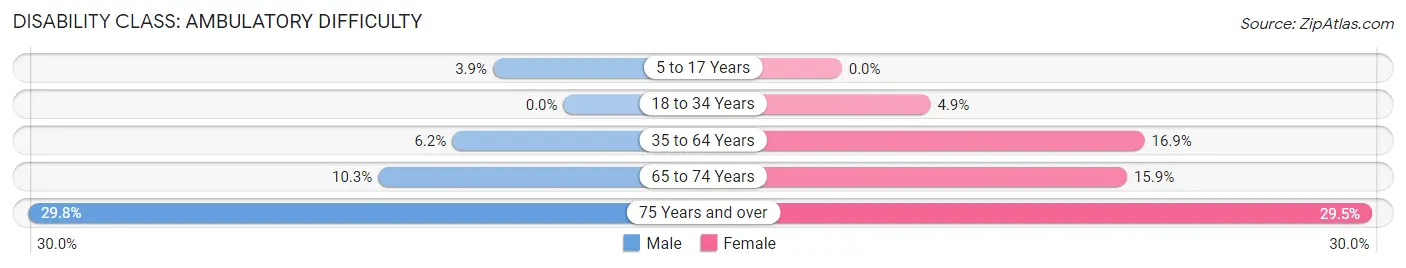
| Age Bracket | Male | Female |
| 5 to 17 Years | 54 (3.9%) | 0 (0.0%) |
| 18 to 34 Years | 0 (0.0%) | 82 (4.9%) |
| 35 to 64 Years | 214 (6.2%) | 588 (16.9%) |
| 65 to 74 Years | 94 (10.3%) | 181 (15.9%) |
| 75 Years and over | 124 (29.8%) | 310 (29.5%) |
Disability Class: Self-Care Difficulty
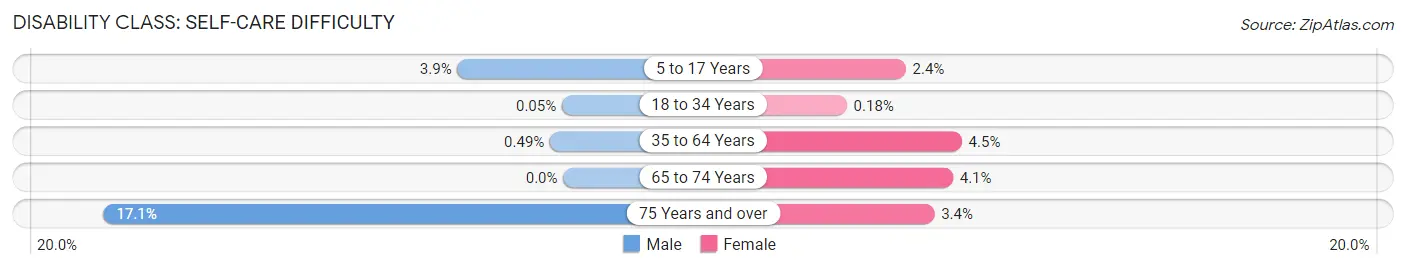
| Age Bracket | Male | Female |
| 5 to 17 Years | 54 (3.9%) | 40 (2.4%) |
| 18 to 34 Years | 1 (0.1%) | 3 (0.2%) |
| 35 to 64 Years | 17 (0.5%) | 155 (4.4%) |
| 65 to 74 Years | 0 (0.0%) | 47 (4.1%) |
| 75 Years and over | 71 (17.1%) | 36 (3.4%) |
Technology Access in Cullman
Computing Device Access in Cullman
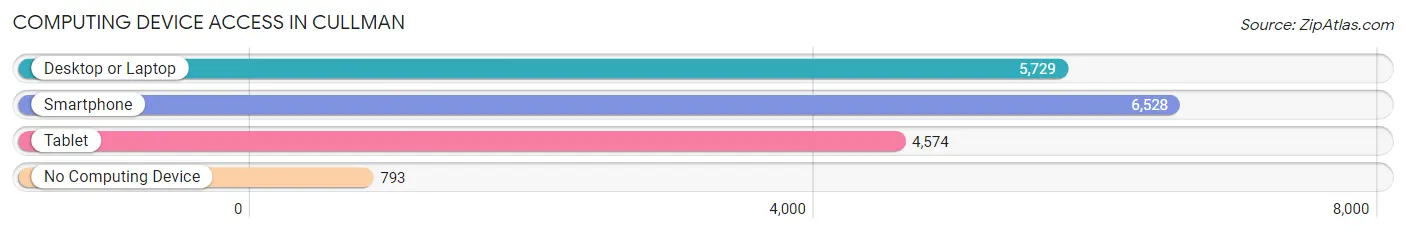
| Device Type | # Households | % Households |
| Desktop or Laptop | 5,729 | 74.2% |
| Smartphone | 6,528 | 84.5% |
| Tablet | 4,574 | 59.2% |
| No Computing Device | 793 | 10.3% |
| Total | 7,725 | 100.0% |
Internet Access in Cullman
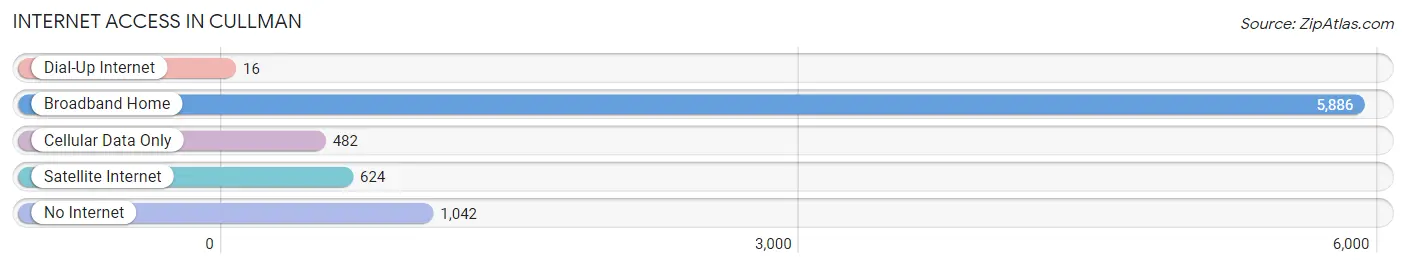
| Internet Type | # Households | % Households |
| Dial-Up Internet | 16 | 0.2% |
| Broadband Home | 5,886 | 76.2% |
| Cellular Data Only | 482 | 6.2% |
| Satellite Internet | 624 | 8.1% |
| No Internet | 1,042 | 13.5% |
| Total | 7,725 | 100.0% |
Cullman Summary
Cullman, Alabama is a city located in the north-central part of the state, in Cullman County. It is the county seat and the largest city in the county. The city is situated in the foothills of the Appalachian Mountains and is located along the banks of the Black Warrior River. The city has a population of 15,350 as of the 2010 census.
History
Cullman was founded in 1873 by German immigrant John G. Cullmann. He was a successful businessman and entrepreneur who had previously established a successful business in the nearby town of Vinemont. He purchased land in the area and established a settlement that he named after himself. The city was incorporated in 1877 and quickly grew to become a major center of commerce and industry in the region.
The city was a major center of the cotton industry in the late 19th and early 20th centuries. It was also a major center of the coal mining industry, with several coal mines located in the area. The city was also home to several large manufacturing plants, including a cotton mill, a paper mill, and a furniture factory.
Geography
Cullman is located in the north-central part of Alabama, in Cullman County. It is situated in the foothills of the Appalachian Mountains and is located along the banks of the Black Warrior River. The city has a total area of 16.2 square miles, of which 16.1 square miles is land and 0.1 square miles is water.
The city is located in the humid subtropical climate zone, with hot, humid summers and mild winters. The average annual temperature is 64°F, with an average high of 87°F in July and an average low of 41°F in January. The average annual precipitation is 51.2 inches, with the wettest month being April, with an average of 6.2 inches of rain.
Economy
Cullman’s economy is largely based on manufacturing and agriculture. The city is home to several large manufacturing plants, including a cotton mill, a paper mill, and a furniture factory. The city is also home to several large agricultural operations, including poultry farms, cattle farms, and vegetable farms.
The city is also home to several large retail stores, including Walmart, Lowe’s, and Target. The city is also home to several large medical facilities, including Cullman Regional Medical Center and Cullman Regional Medical Center North.
Demographics
As of the 2010 census, the city had a population of 15,350. The racial makeup of the city was 87.3% White, 8.3% African American, 0.4% Native American, 0.7% Asian, 0.1% Pacific Islander, 1.2% from other races, and 2.0% from two or more races. Hispanic or Latino of any race were 3.2% of the population.
The median income for a household in the city was $37,945, and the median income for a family was $45,945. The per capita income for the city was $20,845. About 11.3% of families and 14.2% of the population were below the poverty line, including 19.2% of those under age 18 and 11.2% of those age 65 or over.
Common Questions
What is Per Capita Income in Cullman?
Per Capita income in Cullman is $34,010.
What is the Median Family Income in Cullman?
Median Family Income in Cullman is $86,089.
What is the Median Household income in Cullman?
Median Household Income in Cullman is $59,982.
What is Income or Wage Gap in Cullman?
Income or Wage Gap in Cullman is 42.2%.
Women in Cullman earn 57.8 cents for every dollar earned by a man.
What is Inequality or Gini Index in Cullman?
Inequality or Gini Index in Cullman is 0.48.
What is the Total Population of Cullman?
Total Population of Cullman is 18,434.
What is the Total Male Population of Cullman?
Total Male Population of Cullman is 8,883.
What is the Total Female Population of Cullman?
Total Female Population of Cullman is 9,551.
What is the Ratio of Males per 100 Females in Cullman?
There are 93.01 Males per 100 Females in Cullman.
What is the Ratio of Females per 100 Males in Cullman?
There are 107.52 Females per 100 Males in Cullman.
What is the Median Population Age in Cullman?
Median Population Age in Cullman is 42.0 Years.
What is the Average Family Size in Cullman
Average Family Size in Cullman is 2.9 People.
What is the Average Household Size in Cullman
Average Household Size in Cullman is 2.3 People.
How Large is the Labor Force in Cullman?
There are 8,844 People in the Labor Forcein in Cullman.
What is the Percentage of People in the Labor Force in Cullman?
58.6% of People are in the Labor Force in Cullman.
What is the Unemployment Rate in Cullman?
Unemployment Rate in Cullman is 2.6%.