West Odessa, TX Map & Demographics
West Odessa Map
West Odessa Overview
$32,324
PER CAPITA INCOME
$75,455
AVG FAMILY INCOME
$63,207
AVG HOUSEHOLD INCOME
36.9%
WAGE / INCOME GAP [ % ]
63.1¢/ $1
WAGE / INCOME GAP [ $ ]
0.48
INEQUALITY / GINI INDEX
30,904
TOTAL POPULATION
16,013
MALE POPULATION
14,891
FEMALE POPULATION
107.53
MALES / 100 FEMALES
92.99
FEMALES / 100 MALES
32.9
MEDIAN AGE
3.4
AVG FAMILY SIZE
2.8
AVG HOUSEHOLD SIZE
14,504
LABOR FORCE [ PEOPLE ]
65.5%
PERCENT IN LABOR FORCE
5.0%
UNEMPLOYMENT RATE
Income in West Odessa
Income Overview in West Odessa
Per Capita Income in West Odessa is $32,324, while median incomes of families and households are $75,455 and $63,207 respectively.
| Characteristic | Number | Measure |
| Per Capita Income | 30,904 | $32,324 |
| Median Family Income | 7,443 | $75,455 |
| Mean Family Income | 7,443 | $106,824 |
| Median Household Income | 11,190 | $63,207 |
| Mean Household Income | 11,190 | $94,806 |
| Income Deficit | 7,443 | $0 |
| Wage / Income Gap (%) | 30,904 | 36.91% |
| Wage / Income Gap ($) | 30,904 | 63.09¢ per $1 |
| Gini / Inequality Index | 30,904 | 0.48 |
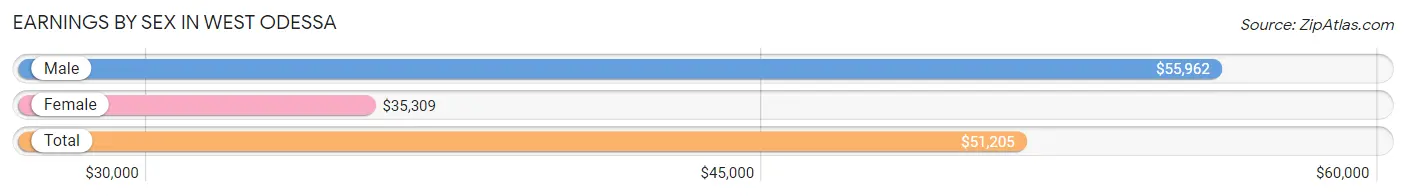
Earnings by Sex in West Odessa
Average Earnings in West Odessa are $51,205, $55,962 for men and $35,309 for women, a difference of 36.9%.
| Sex | Number | Average Earnings |
| Male | 9,307 (62.7%) | $55,962 |
| Female | 5,534 (37.3%) | $35,309 |
| Total | 14,841 (100.0%) | $51,205 |
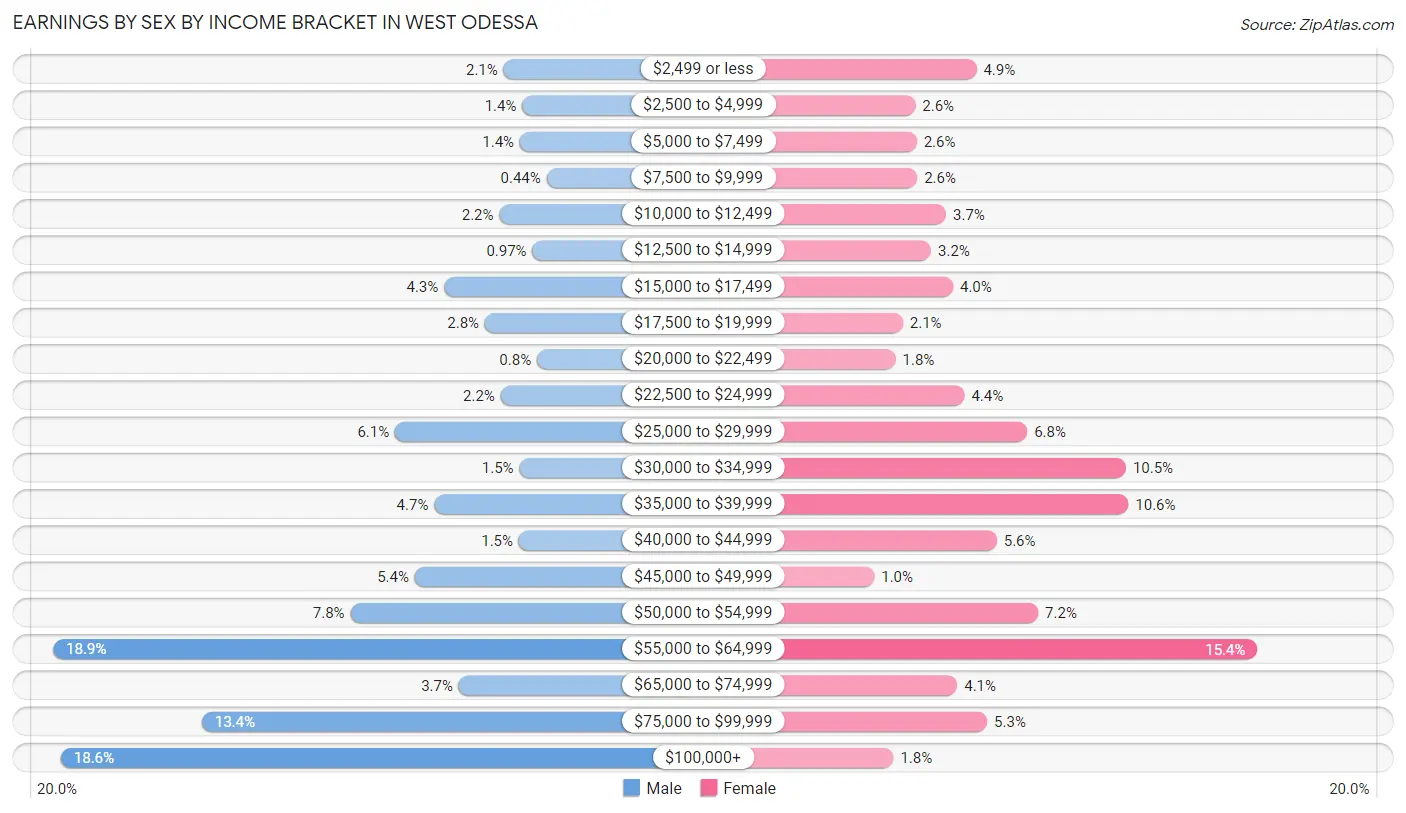
Earnings by Sex by Income Bracket in West Odessa
The most common earnings brackets in West Odessa are $55,000 to $64,999 for men (1,762 | 18.9%) and $55,000 to $64,999 for women (851 | 15.4%).
| Income | Male | Female |
| $2,499 or less | 191 (2.1%) | 269 (4.9%) |
| $2,500 to $4,999 | 126 (1.3%) | 142 (2.6%) |
| $5,000 to $7,499 | 134 (1.4%) | 145 (2.6%) |
| $7,500 to $9,999 | 41 (0.4%) | 146 (2.6%) |
| $10,000 to $12,499 | 206 (2.2%) | 206 (3.7%) |
| $12,500 to $14,999 | 90 (1.0%) | 175 (3.2%) |
| $15,000 to $17,499 | 398 (4.3%) | 220 (4.0%) |
| $17,500 to $19,999 | 256 (2.8%) | 116 (2.1%) |
| $20,000 to $22,499 | 74 (0.8%) | 101 (1.8%) |
| $22,500 to $24,999 | 201 (2.2%) | 244 (4.4%) |
| $25,000 to $29,999 | 570 (6.1%) | 374 (6.8%) |
| $30,000 to $34,999 | 136 (1.5%) | 579 (10.5%) |
| $35,000 to $39,999 | 433 (4.6%) | 584 (10.5%) |
| $40,000 to $44,999 | 138 (1.5%) | 311 (5.6%) |
| $45,000 to $49,999 | 501 (5.4%) | 57 (1.0%) |
| $50,000 to $54,999 | 725 (7.8%) | 397 (7.2%) |
| $55,000 to $64,999 | 1,762 (18.9%) | 851 (15.4%) |
| $65,000 to $74,999 | 347 (3.7%) | 229 (4.1%) |
| $75,000 to $99,999 | 1,243 (13.4%) | 291 (5.3%) |
| $100,000+ | 1,735 (18.6%) | 97 (1.8%) |
| Total | 9,307 (100.0%) | 5,534 (100.0%) |
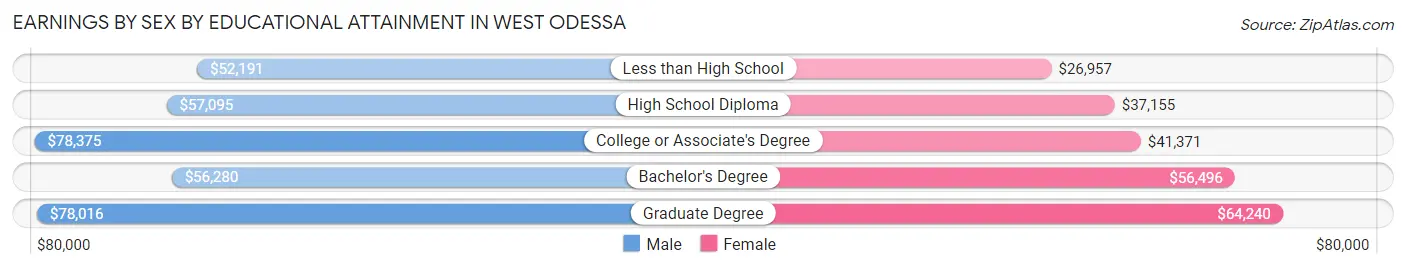
Earnings by Sex by Educational Attainment in West Odessa
Average earnings in West Odessa are $56,471 for men and $39,208 for women, a difference of 30.6%. Men with an educational attainment of college or associate's degree enjoy the highest average annual earnings of $78,375, while those with less than high school education earn the least with $52,191. Women with an educational attainment of graduate degree earn the most with the average annual earnings of $64,240, while those with less than high school education have the smallest earnings of $26,957.
| Educational Attainment | Male Income | Female Income |
| Less than High School | $52,191 | $26,957 |
| High School Diploma | $57,095 | $37,155 |
| College or Associate's Degree | $78,375 | $41,371 |
| Bachelor's Degree | $56,280 | $56,496 |
| Graduate Degree | $78,016 | $64,240 |
| Total | $56,471 | $39,208 |
Family Income in West Odessa
Family Income Brackets in West Odessa
According to the West Odessa family income data, there are 1,436 families falling into the $50,000 to $74,999 income range, which is the most common income bracket and makes up 19.3% of all families. Conversely, the $10,000 to $14,999 income bracket is the least frequent group with only 89 families (1.2%) belonging to this category.
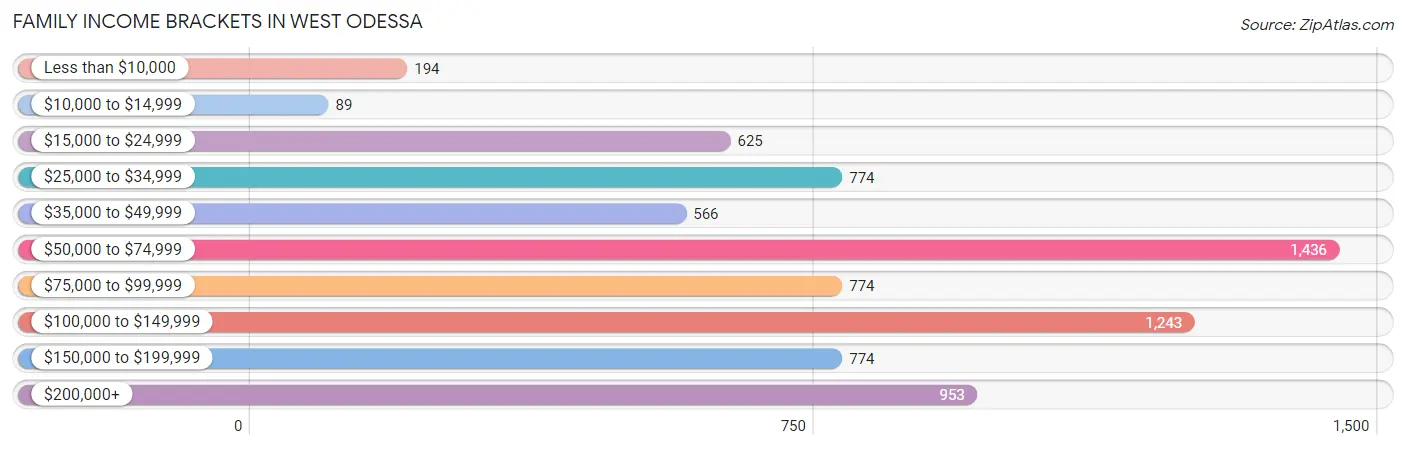
| Income Bracket | # Families | % Families |
| Less than $10,000 | 194 | 2.6% |
| $10,000 to $14,999 | 89 | 1.2% |
| $15,000 to $24,999 | 625 | 8.4% |
| $25,000 to $34,999 | 774 | 10.4% |
| $35,000 to $49,999 | 566 | 7.6% |
| $50,000 to $74,999 | 1,436 | 19.3% |
| $75,000 to $99,999 | 774 | 10.4% |
| $100,000 to $149,999 | 1,243 | 16.7% |
| $150,000 to $199,999 | 774 | 10.4% |
| $200,000+ | 953 | 12.8% |
Family Income by Famaliy Size in West Odessa
5-person families (1,321 | 17.7%) account for the highest median family income in West Odessa with $168,860 per family, while 3-person families (1,404 | 18.9%) have the highest median income of $34,328 per family member.
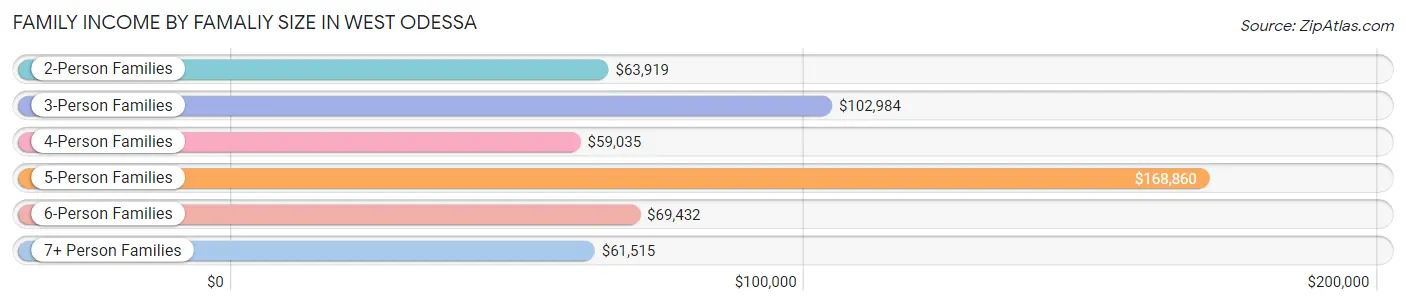
| Income Bracket | # Families | Median Income |
| 2-Person Families | 2,382 (32.0%) | $63,919 |
| 3-Person Families | 1,404 (18.9%) | $102,984 |
| 4-Person Families | 1,279 (17.2%) | $59,035 |
| 5-Person Families | 1,321 (17.7%) | $168,860 |
| 6-Person Families | 724 (9.7%) | $69,432 |
| 7+ Person Families | 333 (4.5%) | $61,515 |
| Total | 7,443 (100.0%) | $75,455 |
Family Income by Number of Earners in West Odessa
The median family income in West Odessa is $75,455, with families comprising 3+ earners (856) having the highest median family income of $220,840, while families with no earners (570) have the lowest median family income of $45,458, accounting for 11.5% and 7.7% of families, respectively.
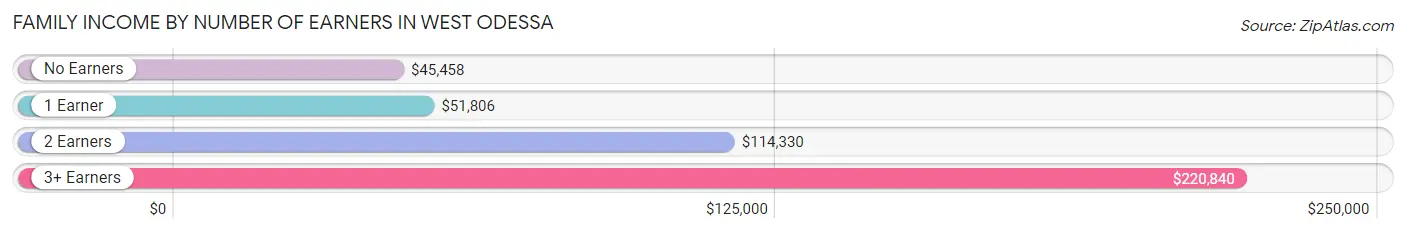
| Number of Earners | # Families | Median Income |
| No Earners | 570 (7.7%) | $45,458 |
| 1 Earner | 3,076 (41.3%) | $51,806 |
| 2 Earners | 2,941 (39.5%) | $114,330 |
| 3+ Earners | 856 (11.5%) | $220,840 |
| Total | 7,443 (100.0%) | $75,455 |
Household Income in West Odessa
Household Income Brackets in West Odessa
With 2,137 households falling in the category, the $50,000 to $74,999 income range is the most frequent in West Odessa, accounting for 19.1% of all households. In contrast, only 414 households (3.7%) fall into the $10,000 to $14,999 income bracket, making it the least populous group.
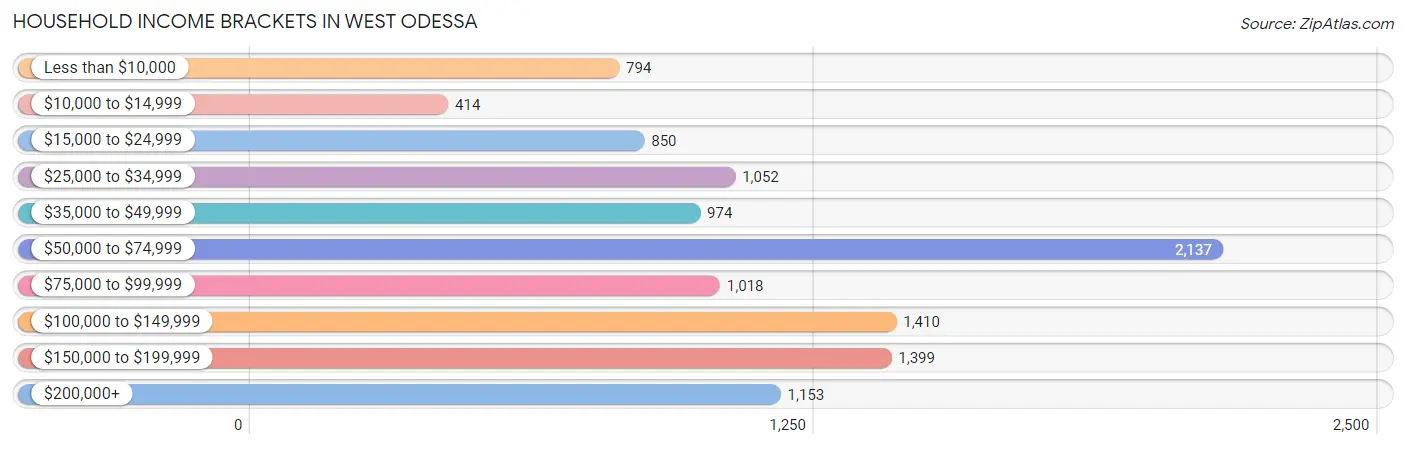
| Income Bracket | # Households | % Households |
| Less than $10,000 | 794 | 7.1% |
| $10,000 to $14,999 | 414 | 3.7% |
| $15,000 to $24,999 | 850 | 7.6% |
| $25,000 to $34,999 | 1,052 | 9.4% |
| $35,000 to $49,999 | 974 | 8.7% |
| $50,000 to $74,999 | 2,137 | 19.1% |
| $75,000 to $99,999 | 1,018 | 9.1% |
| $100,000 to $149,999 | 1,410 | 12.6% |
| $150,000 to $199,999 | 1,399 | 12.5% |
| $200,000+ | 1,153 | 10.3% |
Household Income by Householder Age in West Odessa
The median household income in West Odessa is $63,207, with the highest median household income of $86,971 found in the 25 to 44 years age bracket for the primary householder. A total of 4,439 households (39.7%) fall into this category. Meanwhile, the 65+ years age bracket for the primary householder has the lowest median household income of $39,087, with 2,111 households (18.9%) in this group.
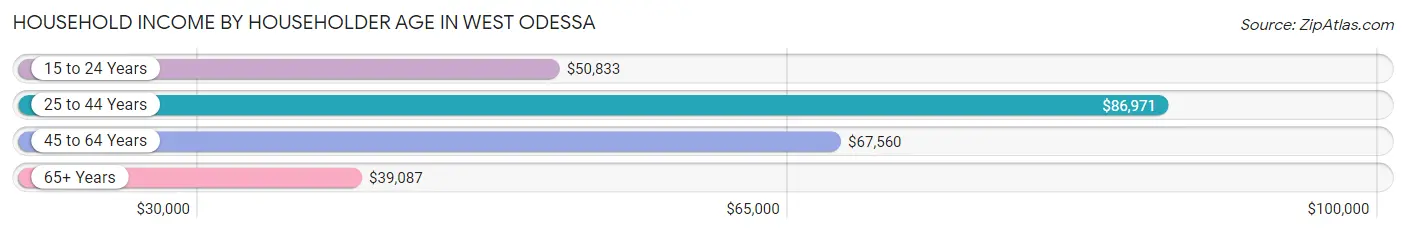
| Income Bracket | # Households | Median Income |
| 15 to 24 Years | 692 (6.2%) | $50,833 |
| 25 to 44 Years | 4,439 (39.7%) | $86,971 |
| 45 to 64 Years | 3,948 (35.3%) | $67,560 |
| 65+ Years | 2,111 (18.9%) | $39,087 |
| Total | 11,190 (100.0%) | $63,207 |
Poverty in West Odessa
Income Below Poverty by Sex and Age in West Odessa
With 13.6% poverty level for males and 22.3% for females among the residents of West Odessa, 12 to 14 year old males and 16 and 17 year old females are the most vulnerable to poverty, with 473 males (53.1%) and 281 females (49.9%) in their respective age groups living below the poverty level.
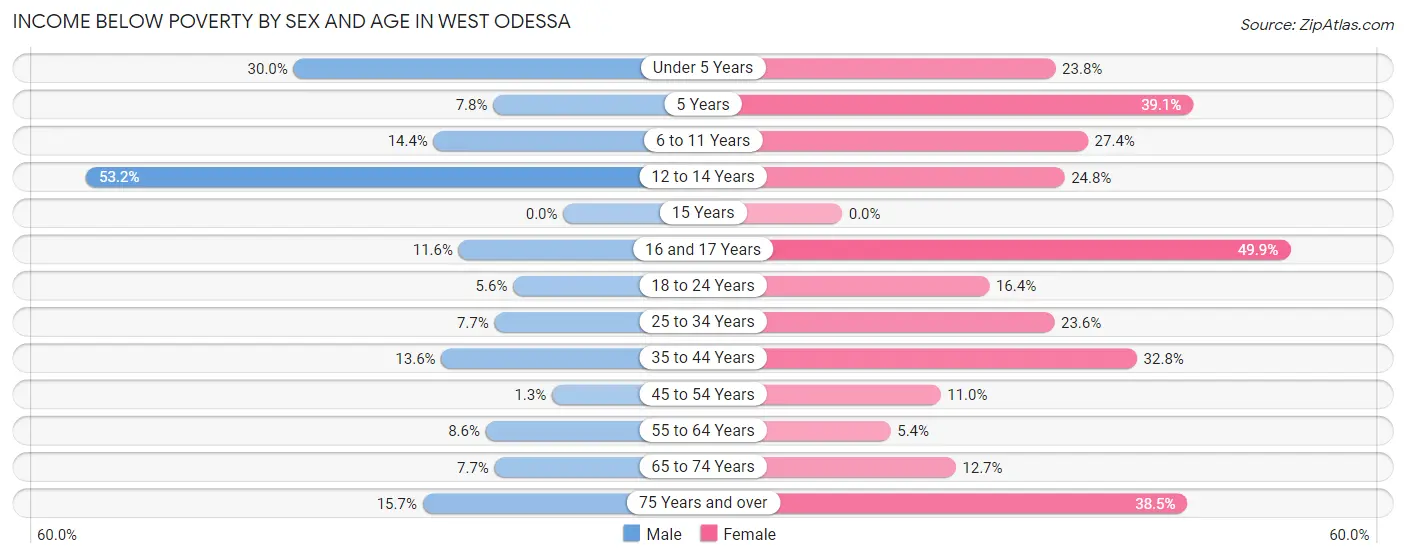
| Age Bracket | Male | Female |
| Under 5 Years | 411 (30.0%) | 187 (23.8%) |
| 5 Years | 29 (7.8%) | 117 (39.1%) |
| 6 to 11 Years | 275 (14.4%) | 533 (27.4%) |
| 12 to 14 Years | 473 (53.1%) | 217 (24.8%) |
| 15 Years | 0 (0.0%) | 0 (0.0%) |
| 16 and 17 Years | 32 (11.6%) | 281 (49.9%) |
| 18 to 24 Years | 65 (5.6%) | 264 (16.4%) |
| 25 to 34 Years | 199 (7.7%) | 473 (23.6%) |
| 35 to 44 Years | 346 (13.6%) | 615 (32.8%) |
| 45 to 54 Years | 21 (1.3%) | 218 (11.0%) |
| 55 to 64 Years | 124 (8.6%) | 65 (5.4%) |
| 65 to 74 Years | 67 (7.6%) | 124 (12.7%) |
| 75 Years and over | 127 (15.7%) | 212 (38.5%) |
| Total | 2,169 (13.6%) | 3,306 (22.3%) |
Income Above Poverty by Sex and Age in West Odessa
According to the poverty statistics in West Odessa, males aged 15 years and females aged 15 years are the age groups that are most secure financially, with 100.0% of males and 100.0% of females in these age groups living above the poverty line.
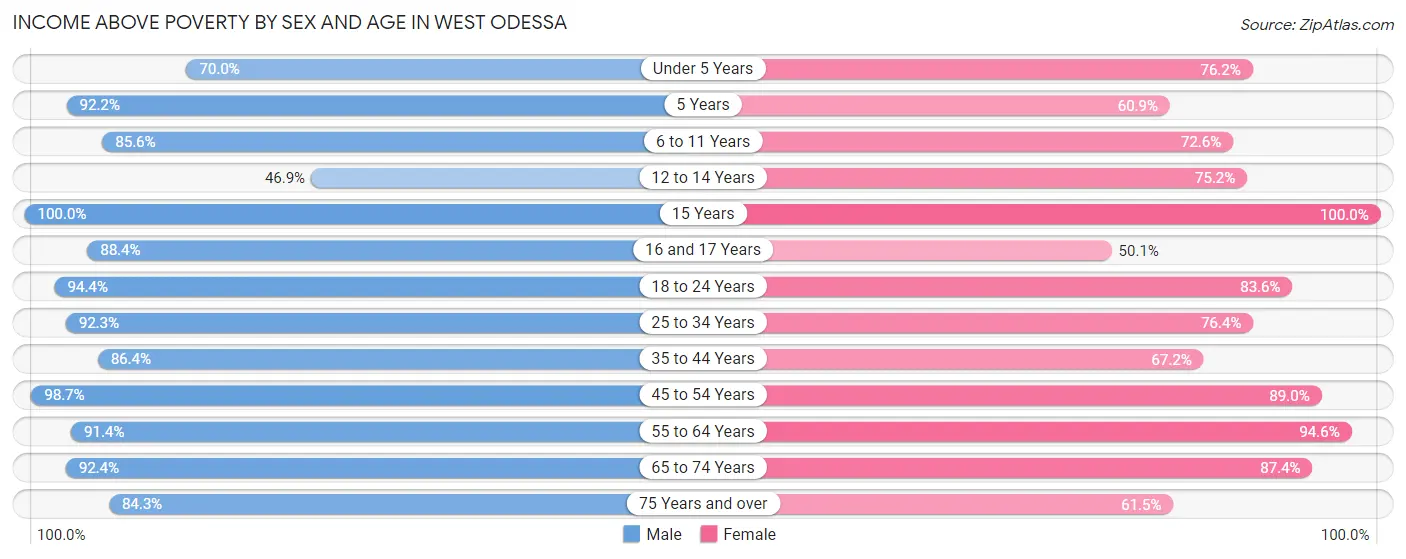
| Age Bracket | Male | Female |
| Under 5 Years | 957 (70.0%) | 600 (76.2%) |
| 5 Years | 343 (92.2%) | 182 (60.9%) |
| 6 to 11 Years | 1,629 (85.6%) | 1,414 (72.6%) |
| 12 to 14 Years | 417 (46.9%) | 659 (75.2%) |
| 15 Years | 104 (100.0%) | 143 (100.0%) |
| 16 and 17 Years | 243 (88.4%) | 282 (50.1%) |
| 18 to 24 Years | 1,100 (94.4%) | 1,347 (83.6%) |
| 25 to 34 Years | 2,399 (92.3%) | 1,528 (76.4%) |
| 35 to 44 Years | 2,201 (86.4%) | 1,258 (67.2%) |
| 45 to 54 Years | 1,646 (98.7%) | 1,769 (89.0%) |
| 55 to 64 Years | 1,312 (91.4%) | 1,138 (94.6%) |
| 65 to 74 Years | 809 (92.3%) | 856 (87.4%) |
| 75 Years and over | 684 (84.3%) | 339 (61.5%) |
| Total | 13,844 (86.5%) | 11,515 (77.7%) |
Income Below Poverty Among Married-Couple Families in West Odessa
The poverty statistics for married-couple families in West Odessa show that 11.9% or 638 of the total 5,342 families live below the poverty line. Families with 3 or 4 children have the highest poverty rate of 29.8%, comprising of 358 families. On the other hand, families with no children have the lowest poverty rate of 2.1%, which includes 49 families.
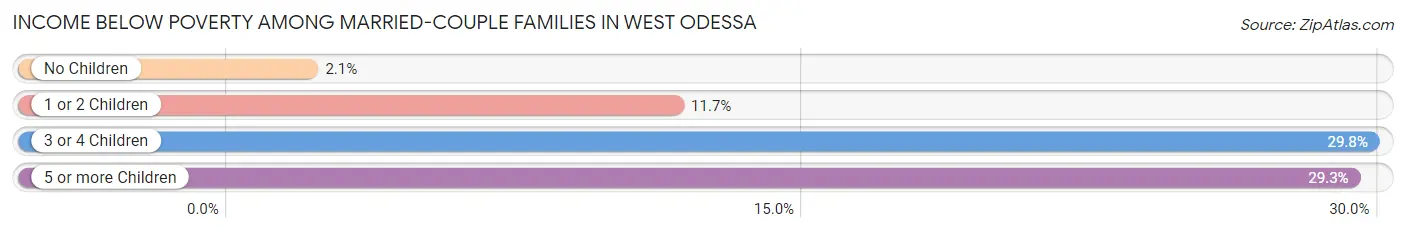
| Children | Above Poverty | Below Poverty |
| No Children | 2,285 (97.9%) | 49 (2.1%) |
| 1 or 2 Children | 1,494 (88.3%) | 197 (11.7%) |
| 3 or 4 Children | 843 (70.2%) | 358 (29.8%) |
| 5 or more Children | 82 (70.7%) | 34 (29.3%) |
| Total | 4,704 (88.1%) | 638 (11.9%) |
Income Below Poverty Among Single-Parent Households in West Odessa
According to the poverty data in West Odessa, 14.8% or 105 single-father households and 14.9% or 207 single-mother households are living below the poverty line. Among single-father households, those with 3 or 4 children have the highest poverty rate, with 90 households (72.0%) experiencing poverty. Likewise, among single-mother households, those with 3 or 4 children have the highest poverty rate, with 104 households (27.7%) falling below the poverty line.
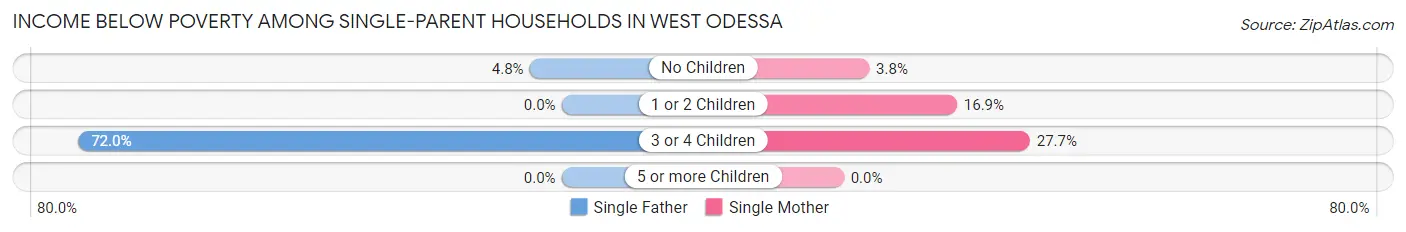
| Children | Single Father | Single Mother |
| No Children | 15 (4.8%) | 20 (3.8%) |
| 1 or 2 Children | 0 (0.0%) | 83 (16.9%) |
| 3 or 4 Children | 90 (72.0%) | 104 (27.7%) |
| 5 or more Children | 0 (0.0%) | 0 (0.0%) |
| Total | 105 (14.8%) | 207 (14.9%) |
Income Below Poverty Among Married-Couple vs Single-Parent Households in West Odessa
The poverty data for West Odessa shows that 638 of the married-couple family households (11.9%) and 312 of the single-parent households (14.8%) are living below the poverty level. Within the married-couple family households, those with 3 or 4 children have the highest poverty rate, with 358 households (29.8%) falling below the poverty line. Among the single-parent households, those with 3 or 4 children have the highest poverty rate, with 194 household (38.8%) living below poverty.
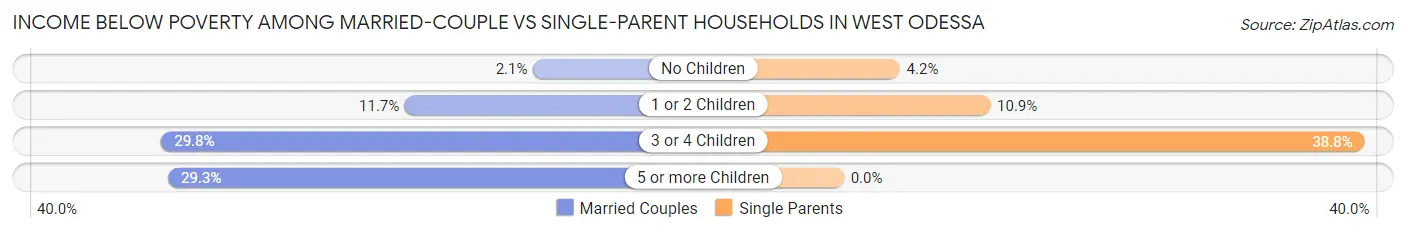
| Children | Married-Couple Families | Single-Parent Households |
| No Children | 49 (2.1%) | 35 (4.2%) |
| 1 or 2 Children | 197 (11.7%) | 83 (10.9%) |
| 3 or 4 Children | 358 (29.8%) | 194 (38.8%) |
| 5 or more Children | 34 (29.3%) | 0 (0.0%) |
| Total | 638 (11.9%) | 312 (14.8%) |
Race in West Odessa
The most populous races in West Odessa are Hispanic or Latino (21,041 | 68.1%), White / Caucasian (20,150 | 65.2%), and Some other Race (5,977 | 19.3%).
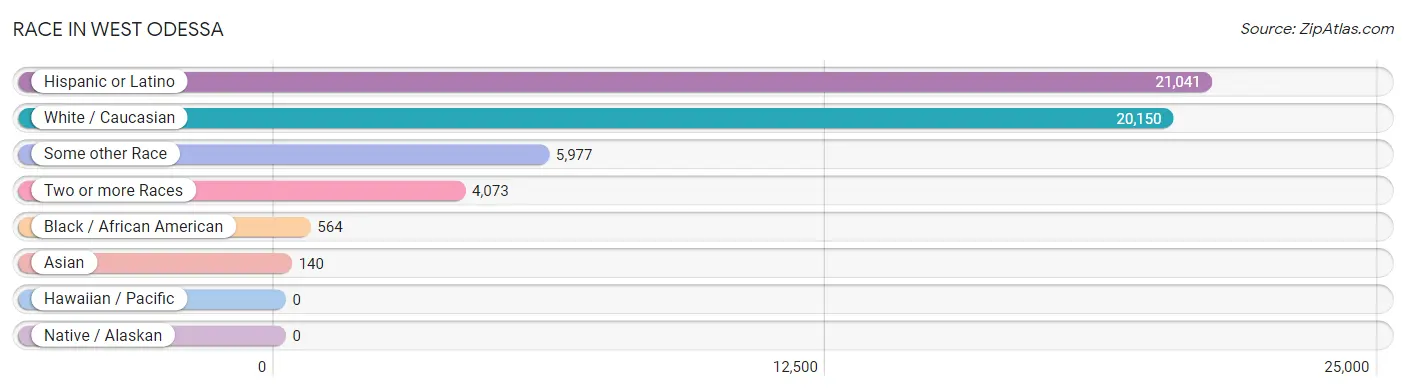
| Race | # Population | % Population |
| Asian | 140 | 0.4% |
| Black / African American | 564 | 1.8% |
| Hawaiian / Pacific | 0 | 0.0% |
| Hispanic or Latino | 21,041 | 68.1% |
| Native / Alaskan | 0 | 0.0% |
| White / Caucasian | 20,150 | 65.2% |
| Two or more Races | 4,073 | 13.2% |
| Some other Race | 5,977 | 19.3% |
| Total | 30,904 | 100.0% |
Ancestry in West Odessa
The most populous ancestries reported in West Odessa are Mexican (19,187 | 62.1%), American (2,093 | 6.8%), German (1,543 | 5.0%), South American (886 | 2.9%), and Venezuelan (850 | 2.8%), together accounting for 79.5% of all West Odessa residents.
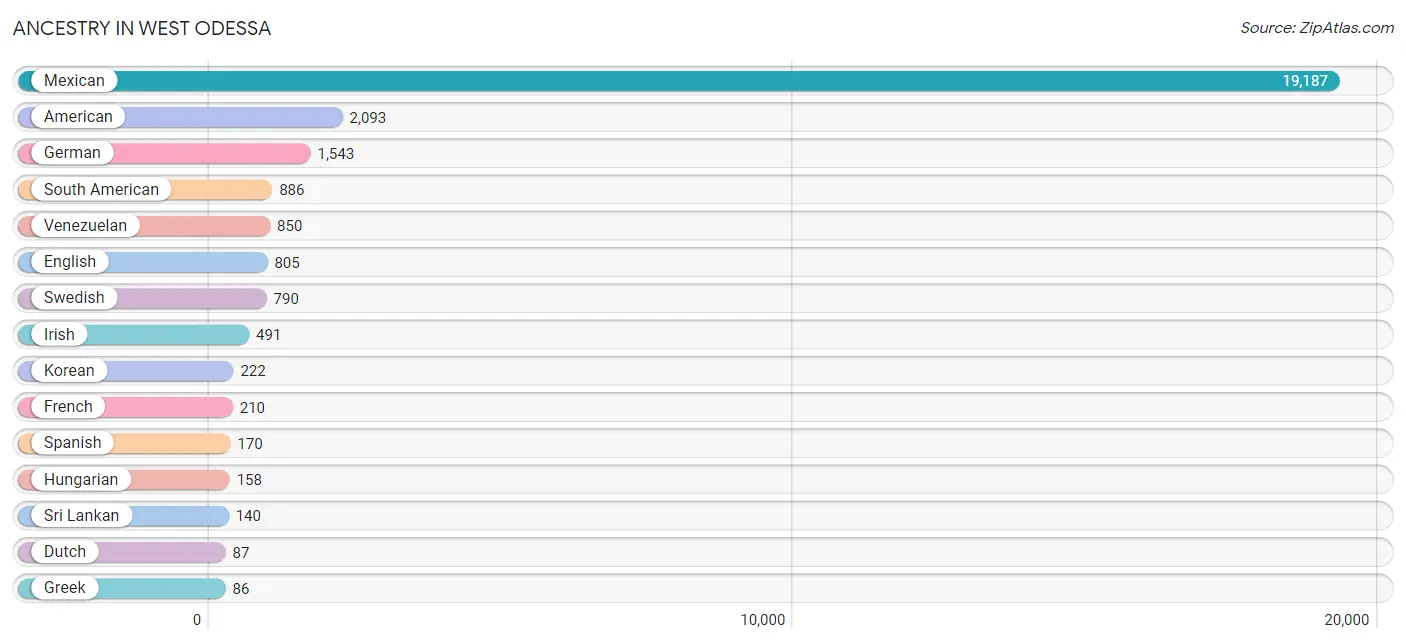
| Ancestry | # Population | % Population |
| American | 2,093 | 6.8% |
| Arab | 21 | 0.1% |
| Bolivian | 36 | 0.1% |
| Canadian | 21 | 0.1% |
| Central American | 49 | 0.2% |
| Costa Rican | 48 | 0.2% |
| Cree | 21 | 0.1% |
| Czech | 38 | 0.1% |
| Dutch | 87 | 0.3% |
| English | 805 | 2.6% |
| French | 210 | 0.7% |
| German | 1,543 | 5.0% |
| Greek | 86 | 0.3% |
| Hungarian | 158 | 0.5% |
| Irish | 491 | 1.6% |
| Italian | 19 | 0.1% |
| Korean | 222 | 0.7% |
| Lebanese | 21 | 0.1% |
| Mexican | 19,187 | 62.1% |
| Polish | 52 | 0.2% |
| Salvadoran | 1 | 0.0% |
| Scandinavian | 46 | 0.2% |
| Scotch-Irish | 31 | 0.1% |
| Scottish | 66 | 0.2% |
| South African | 46 | 0.2% |
| South American | 886 | 2.9% |
| Spaniard | 33 | 0.1% |
| Spanish | 170 | 0.5% |
| Sri Lankan | 140 | 0.4% |
| Subsaharan African | 46 | 0.2% |
| Swedish | 790 | 2.6% |
| Venezuelan | 850 | 2.8% |
| Welsh | 20 | 0.1% | View All 33 Rows |
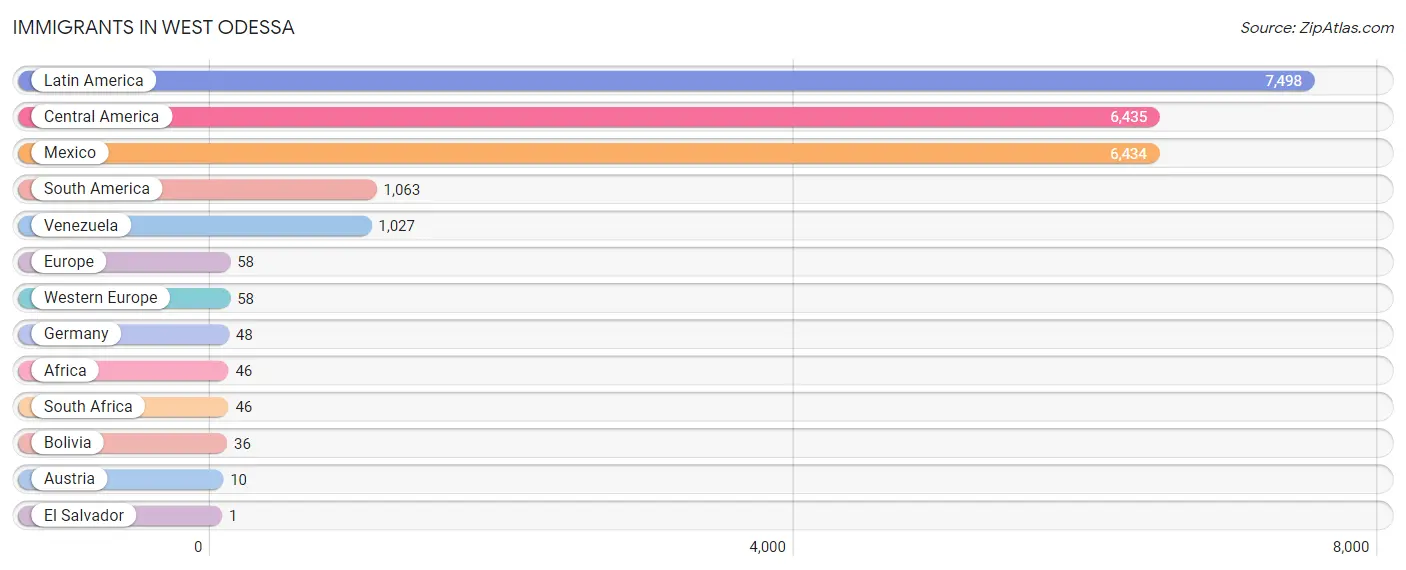
Immigrants in West Odessa
The most numerous immigrant groups reported in West Odessa came from Latin America (7,498 | 24.3%), Central America (6,435 | 20.8%), Mexico (6,434 | 20.8%), South America (1,063 | 3.4%), and Venezuela (1,027 | 3.3%), together accounting for 72.7% of all West Odessa residents.
| Immigration Origin | # Population | % Population |
| Africa | 46 | 0.2% |
| Austria | 10 | 0.0% |
| Bolivia | 36 | 0.1% |
| Central America | 6,435 | 20.8% |
| El Salvador | 1 | 0.0% |
| Europe | 58 | 0.2% |
| Germany | 48 | 0.2% |
| Latin America | 7,498 | 24.3% |
| Mexico | 6,434 | 20.8% |
| South Africa | 46 | 0.2% |
| South America | 1,063 | 3.4% |
| Venezuela | 1,027 | 3.3% |
| Western Europe | 58 | 0.2% | View All 13 Rows |
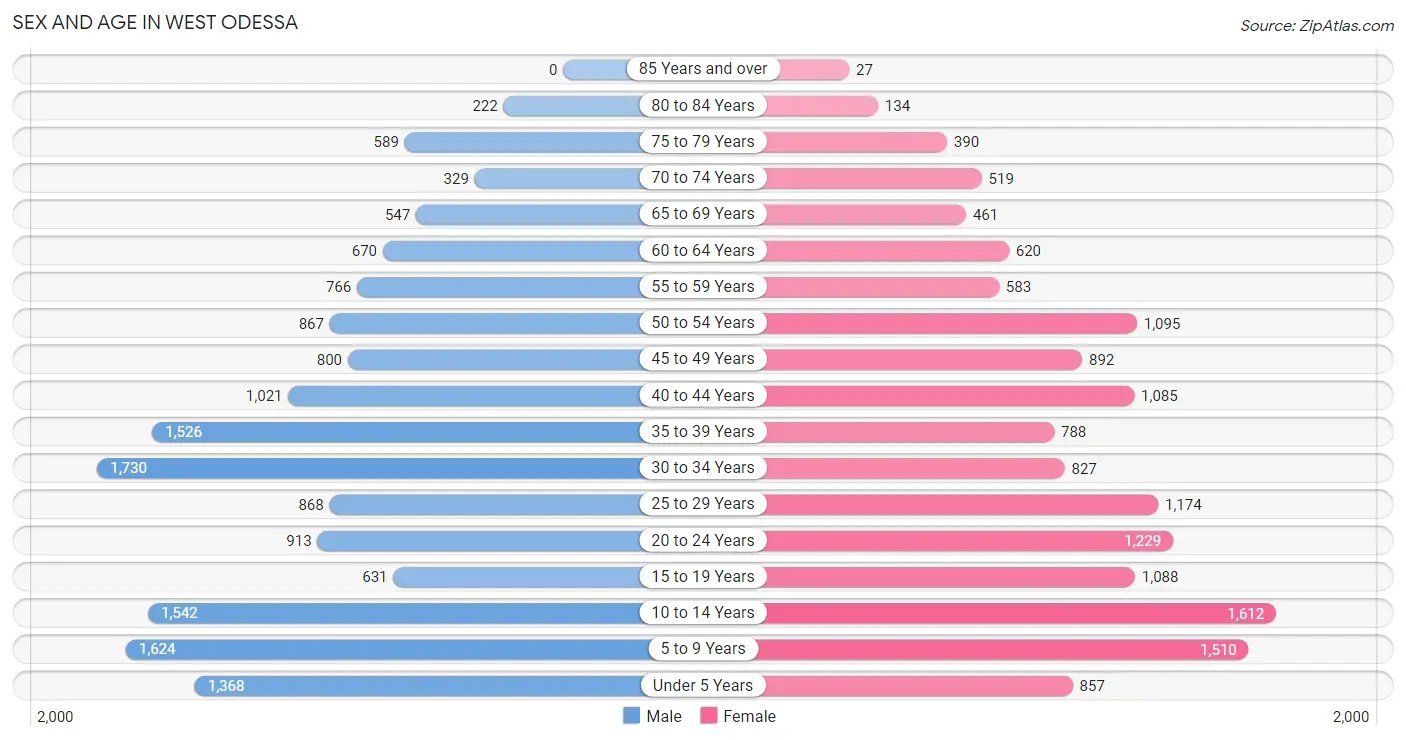
Sex and Age in West Odessa
Sex and Age in West Odessa
The most populous age groups in West Odessa are 30 to 34 Years (1,730 | 10.8%) for men and 10 to 14 Years (1,612 | 10.8%) for women.
| Age Bracket | Male | Female |
| Under 5 Years | 1,368 (8.5%) | 857 (5.8%) |
| 5 to 9 Years | 1,624 (10.1%) | 1,510 (10.1%) |
| 10 to 14 Years | 1,542 (9.6%) | 1,612 (10.8%) |
| 15 to 19 Years | 631 (3.9%) | 1,088 (7.3%) |
| 20 to 24 Years | 913 (5.7%) | 1,229 (8.3%) |
| 25 to 29 Years | 868 (5.4%) | 1,174 (7.9%) |
| 30 to 34 Years | 1,730 (10.8%) | 827 (5.6%) |
| 35 to 39 Years | 1,526 (9.5%) | 788 (5.3%) |
| 40 to 44 Years | 1,021 (6.4%) | 1,085 (7.3%) |
| 45 to 49 Years | 800 (5.0%) | 892 (6.0%) |
| 50 to 54 Years | 867 (5.4%) | 1,095 (7.3%) |
| 55 to 59 Years | 766 (4.8%) | 583 (3.9%) |
| 60 to 64 Years | 670 (4.2%) | 620 (4.2%) |
| 65 to 69 Years | 547 (3.4%) | 461 (3.1%) |
| 70 to 74 Years | 329 (2.1%) | 519 (3.5%) |
| 75 to 79 Years | 589 (3.7%) | 390 (2.6%) |
| 80 to 84 Years | 222 (1.4%) | 134 (0.9%) |
| 85 Years and over | 0 (0.0%) | 27 (0.2%) |
| Total | 16,013 (100.0%) | 14,891 (100.0%) |
Families and Households in West Odessa
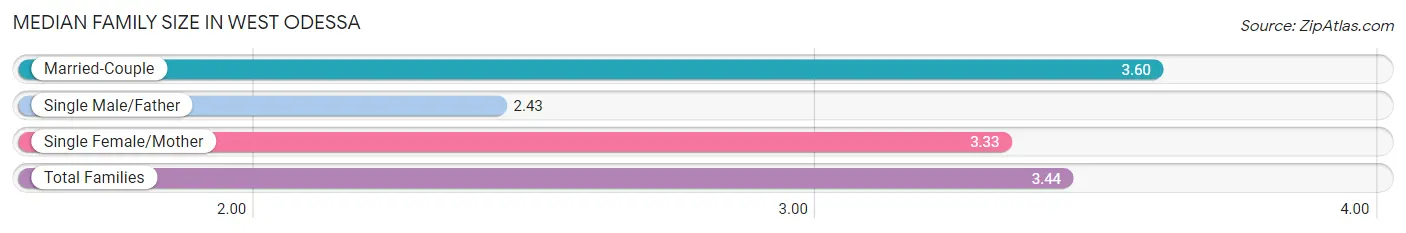
Median Family Size in West Odessa
The median family size in West Odessa is 3.44 persons per family, with married-couple families (5,342 | 71.8%) accounting for the largest median family size of 3.6 persons per family. On the other hand, single male/father families (708 | 9.5%) represent the smallest median family size with 2.43 persons per family.
| Family Type | # Families | Family Size |
| Married-Couple | 5,342 (71.8%) | 3.60 |
| Single Male/Father | 708 (9.5%) | 2.43 |
| Single Female/Mother | 1,393 (18.7%) | 3.33 |
| Total Families | 7,443 (100.0%) | 3.44 |
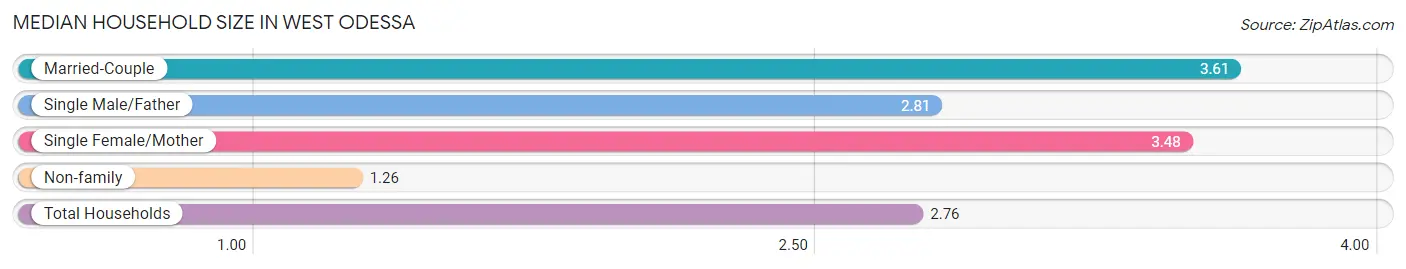
Median Household Size in West Odessa
The median household size in West Odessa is 2.76 persons per household, with married-couple households (5,342 | 47.7%) accounting for the largest median household size of 3.61 persons per household. non-family households (3,747 | 33.5%) represent the smallest median household size with 1.26 persons per household.
| Household Type | # Households | Household Size |
| Married-Couple | 5,342 (47.7%) | 3.61 |
| Single Male/Father | 708 (6.3%) | 2.81 |
| Single Female/Mother | 1,393 (12.4%) | 3.48 |
| Non-family | 3,747 (33.5%) | 1.26 |
| Total Households | 11,190 (100.0%) | 2.76 |
Household Size by Marriage Status in West Odessa
Out of a total of 11,190 households in West Odessa, 7,443 (66.5%) are family households, while 3,747 (33.5%) are nonfamily households. The most numerous type of family households are 2-person households, comprising 2,067, and the most common type of nonfamily households are 1-person households, comprising 2,764.
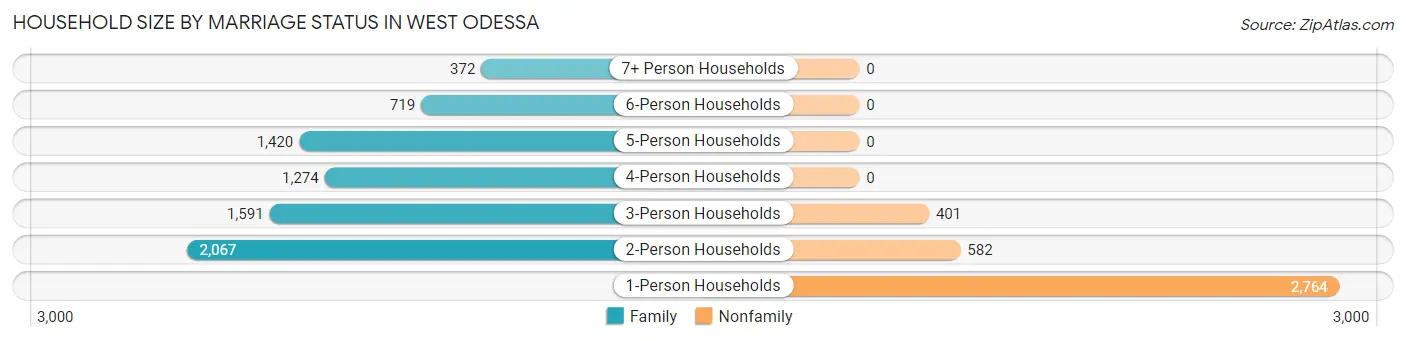
| Household Size | Family Households | Nonfamily Households |
| 1-Person Households | - | 2,764 (24.7%) |
| 2-Person Households | 2,067 (18.5%) | 582 (5.2%) |
| 3-Person Households | 1,591 (14.2%) | 401 (3.6%) |
| 4-Person Households | 1,274 (11.4%) | 0 (0.0%) |
| 5-Person Households | 1,420 (12.7%) | 0 (0.0%) |
| 6-Person Households | 719 (6.4%) | 0 (0.0%) |
| 7+ Person Households | 372 (3.3%) | 0 (0.0%) |
| Total | 7,443 (66.5%) | 3,747 (33.5%) |
Female Fertility in West Odessa
Fertility by Age in West Odessa
Average fertility rate in West Odessa is 89.0 births per 1,000 women. Women in the age bracket of 20 to 34 years have the highest fertility rate with 167.0 births per 1,000 women. Women in the age bracket of 20 to 34 years acount for 83.9% of all women with births.
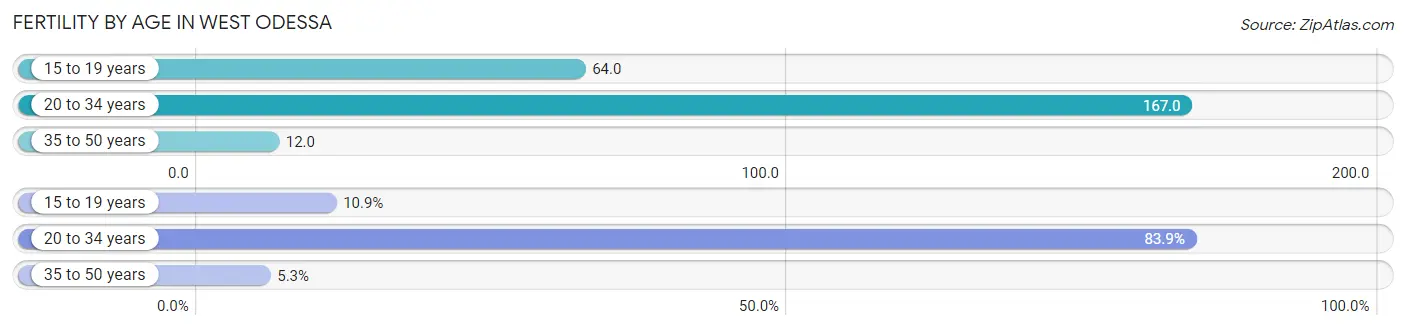
| Age Bracket | Women with Births | Births / 1,000 Women |
| 15 to 19 years | 70 (10.9%) | 64.0 |
| 20 to 34 years | 540 (83.9%) | 167.0 |
| 35 to 50 years | 34 (5.3%) | 12.0 |
| Total | 644 (100.0%) | 89.0 |
Fertility by Age by Marriage Status in West Odessa
95.2% of women with births (644) in West Odessa are married. The highest percentage of unmarried women with births falls into 15 to 19 years age bracket with 44.3% of them unmarried at the time of birth, while the lowest percentage of unmarried women with births belong to 20 to 34 years age bracket with 0.0% of them unmarried.
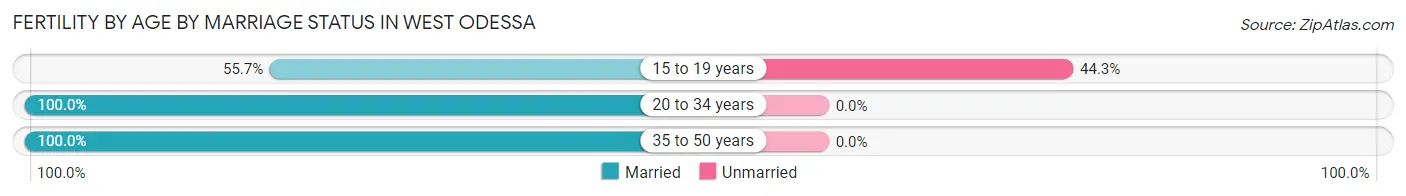
| Age Bracket | Married | Unmarried |
| 15 to 19 years | 39 (55.7%) | 31 (44.3%) |
| 20 to 34 years | 540 (100.0%) | 0 (0.0%) |
| 35 to 50 years | 34 (100.0%) | 0 (0.0%) |
| Total | 613 (95.2%) | 31 (4.8%) |
Fertility by Education in West Odessa
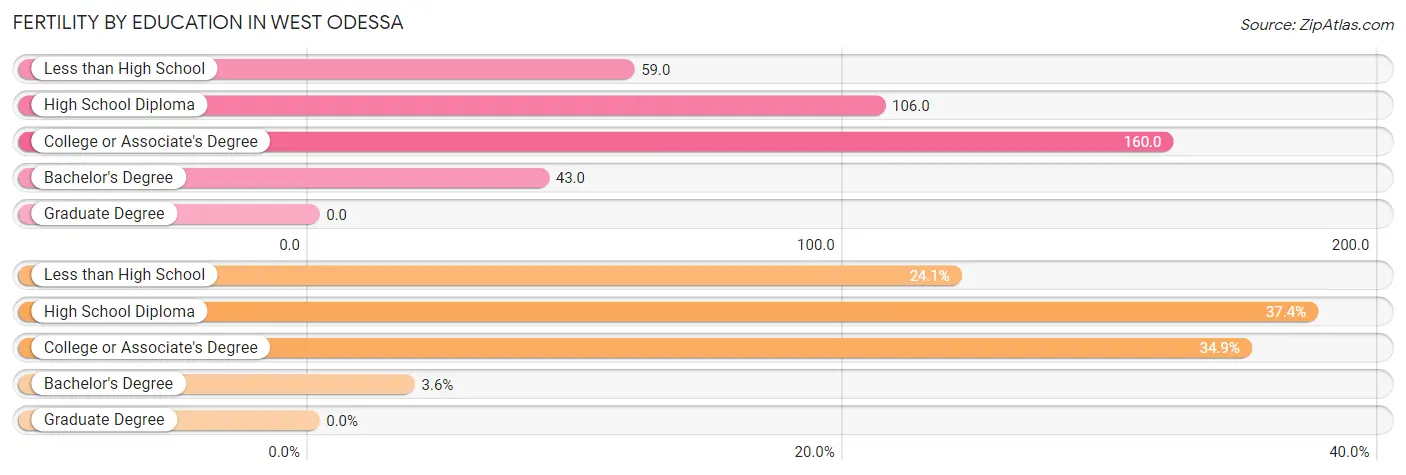
| Educational Attainment | Women with Births | Births / 1,000 Women |
| Less than High School | 155 (24.1%) | 59.0 |
| High School Diploma | 241 (37.4%) | 106.0 |
| College or Associate's Degree | 225 (34.9%) | 160.0 |
| Bachelor's Degree | 23 (3.6%) | 43.0 |
| Graduate Degree | 0 (0.0%) | 0.0 |
| Total | 644 (100.0%) | 89.0 |
Fertility by Education by Marriage Status in West Odessa
4.8% of women with births in West Odessa are unmarried. Women with the educational attainment of high school diploma are most likely to be married with 100.0% of them married at childbirth, while women with the educational attainment of less than high school are least likely to be married with 20.0% of them unmarried at childbirth.
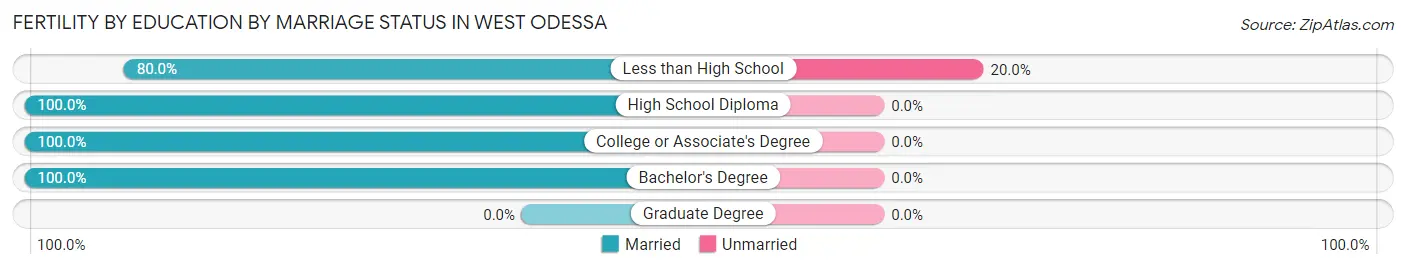
| Educational Attainment | Married | Unmarried |
| Less than High School | 124 (80.0%) | 31 (20.0%) |
| High School Diploma | 241 (100.0%) | 0 (0.0%) |
| College or Associate's Degree | 225 (100.0%) | 0 (0.0%) |
| Bachelor's Degree | 23 (100.0%) | 0 (0.0%) |
| Graduate Degree | 0 (0.0%) | 0 (0.0%) |
| Total | 613 (95.2%) | 31 (4.8%) |
Employment Characteristics in West Odessa
Employment by Class of Employer in West Odessa
Among the 13,645 employed individuals in West Odessa, private company employees (10,218 | 74.9%), self-employed (not incorporated) (1,391 | 10.2%), and local government employees (767 | 5.6%) make up the most common classes of employment.
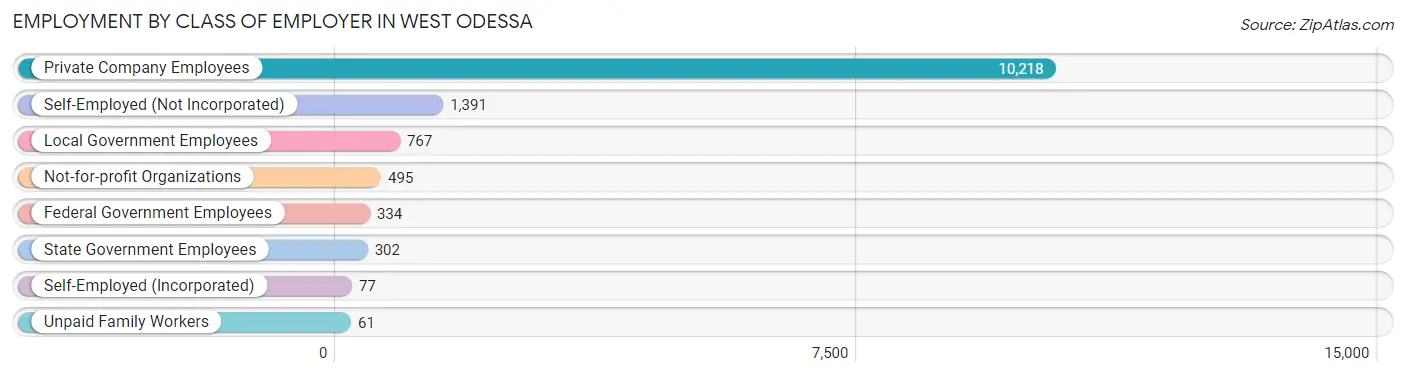
| Employer Class | # Employees | % Employees |
| Private Company Employees | 10,218 | 74.9% |
| Self-Employed (Incorporated) | 77 | 0.6% |
| Self-Employed (Not Incorporated) | 1,391 | 10.2% |
| Not-for-profit Organizations | 495 | 3.6% |
| Local Government Employees | 767 | 5.6% |
| State Government Employees | 302 | 2.2% |
| Federal Government Employees | 334 | 2.5% |
| Unpaid Family Workers | 61 | 0.4% |
| Total | 13,645 | 100.0% |
Employment Status by Age in West Odessa
According to the labor force statistics for West Odessa, out of the total population over 16 years of age (22,144), 65.5% or 14,504 individuals are in the labor force, with 5.0% or 725 of them unemployed. The age group with the highest labor force participation rate is 30 to 34 years, with 82.3% or 2,104 individuals in the labor force. Within the labor force, the 16 to 19 years age range has the highest percentage of unemployed individuals, with 16.8% or 73 of them being unemployed.
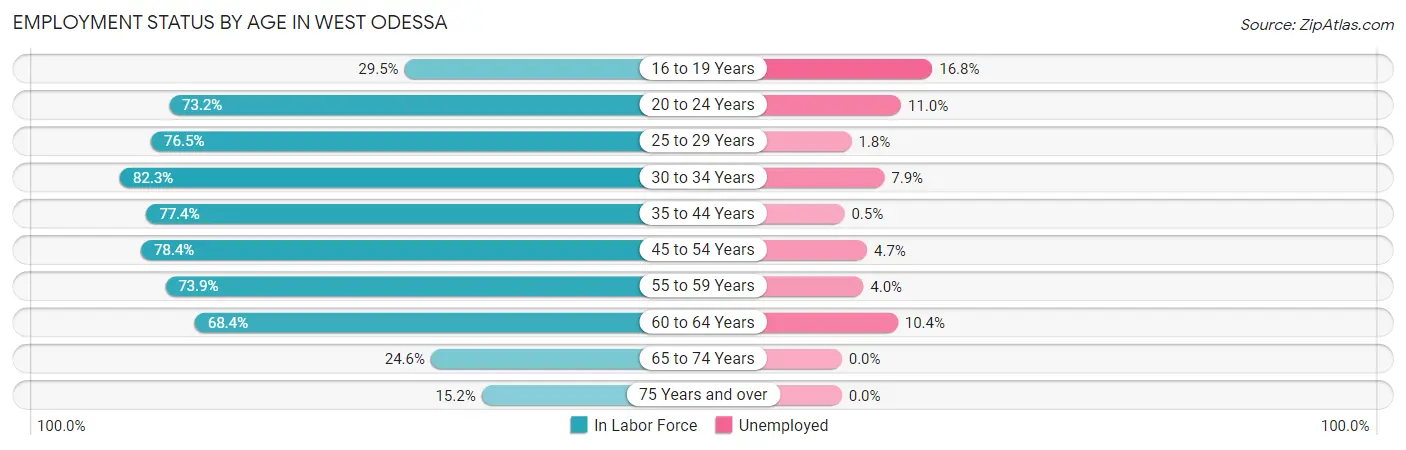
| Age Bracket | In Labor Force | Unemployed |
| 16 to 19 Years | 434 (29.5%) | 73 (16.8%) |
| 20 to 24 Years | 1,568 (73.2%) | 172 (11.0%) |
| 25 to 29 Years | 1,562 (76.5%) | 28 (1.8%) |
| 30 to 34 Years | 2,104 (82.3%) | 166 (7.9%) |
| 35 to 44 Years | 3,421 (77.4%) | 17 (0.5%) |
| 45 to 54 Years | 2,865 (78.4%) | 135 (4.7%) |
| 55 to 59 Years | 997 (73.9%) | 40 (4.0%) |
| 60 to 64 Years | 882 (68.4%) | 92 (10.4%) |
| 65 to 74 Years | 457 (24.6%) | 0 (0.0%) |
| 75 Years and over | 207 (15.2%) | 0 (0.0%) |
| Total | 14,504 (65.5%) | 725 (5.0%) |
Employment Status by Educational Attainment in West Odessa
According to labor force statistics for West Odessa, 77.3% of individuals (11,836) out of the total population between 25 and 64 years of age (15,312) are in the labor force, with 4.0% or 473 of them being unemployed. The group with the highest labor force participation rate are those with the educational attainment of bachelor's degree or higher, with 97.3% or 2,624 individuals in the labor force. Within the labor force, individuals with high school diploma education have the highest percentage of unemployment, with 8.2% or 300 of them being unemployed.
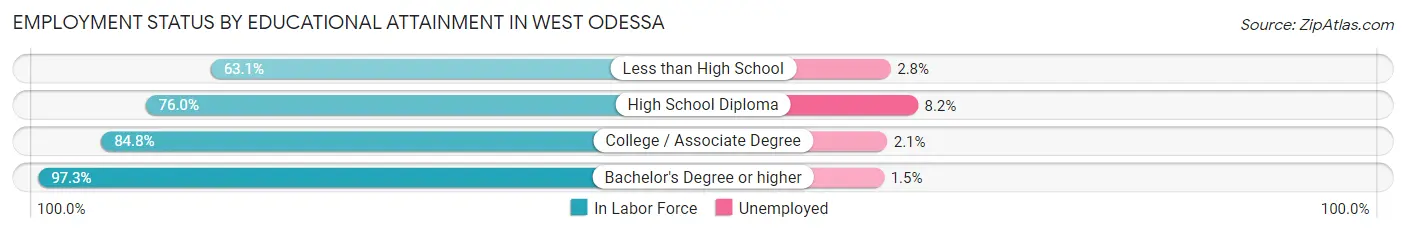
| Educational Attainment | In Labor Force | Unemployed |
| Less than High School | 3,090 (63.1%) | 137 (2.8%) |
| High School Diploma | 3,653 (76.0%) | 394 (8.2%) |
| College / Associate Degree | 2,469 (84.8%) | 61 (2.1%) |
| Bachelor's Degree or higher | 2,624 (97.3%) | 40 (1.5%) |
| Total | 11,836 (77.3%) | 612 (4.0%) |
Employment Occupations by Sex in West Odessa
Management, Business, Science and Arts Occupations
The most common Management, Business, Science and Arts occupations in West Odessa are Health Diagnosing & Treating (977 | 7.1%), Management (827 | 6.0%), Community & Social Service (678 | 4.9%), Health Technologists (625 | 4.5%), and Education Instruction & Library (514 | 3.7%).
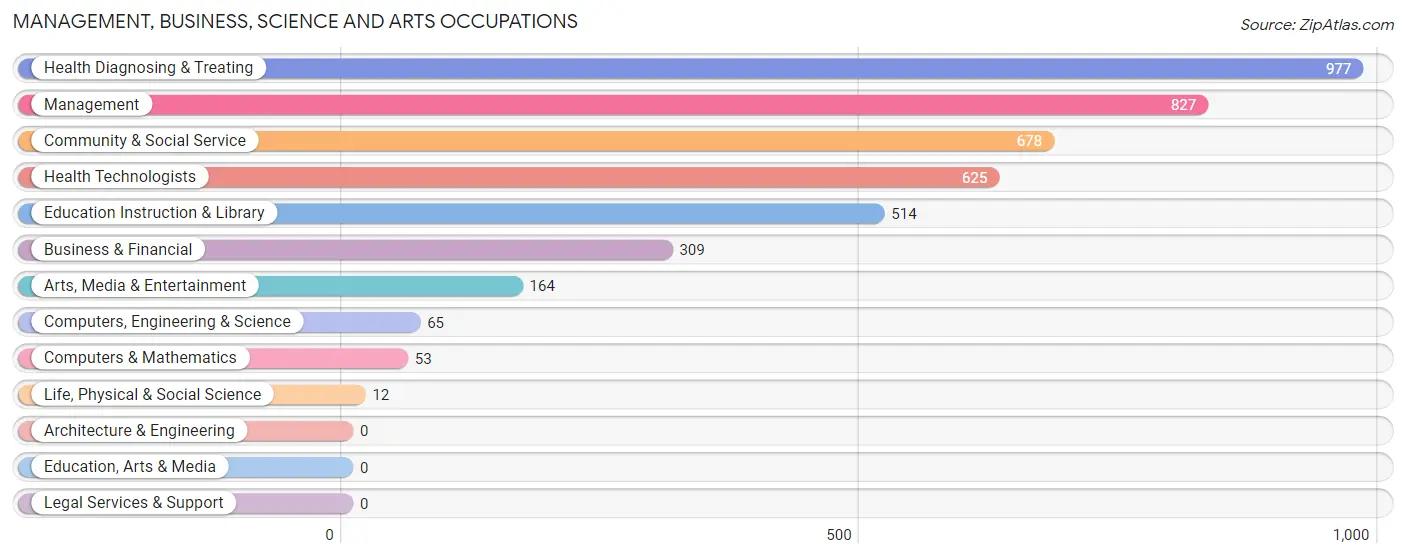
Management, Business, Science and Arts Occupations by Sex
Within the Management, Business, Science and Arts occupations in West Odessa, the most male-oriented occupations are Computers, Engineering & Science (100.0%), Computers & Mathematics (100.0%), and Life, Physical & Social Science (100.0%), while the most female-oriented occupations are Education Instruction & Library (93.6%), Health Diagnosing & Treating (92.9%), and Health Technologists (92.3%).
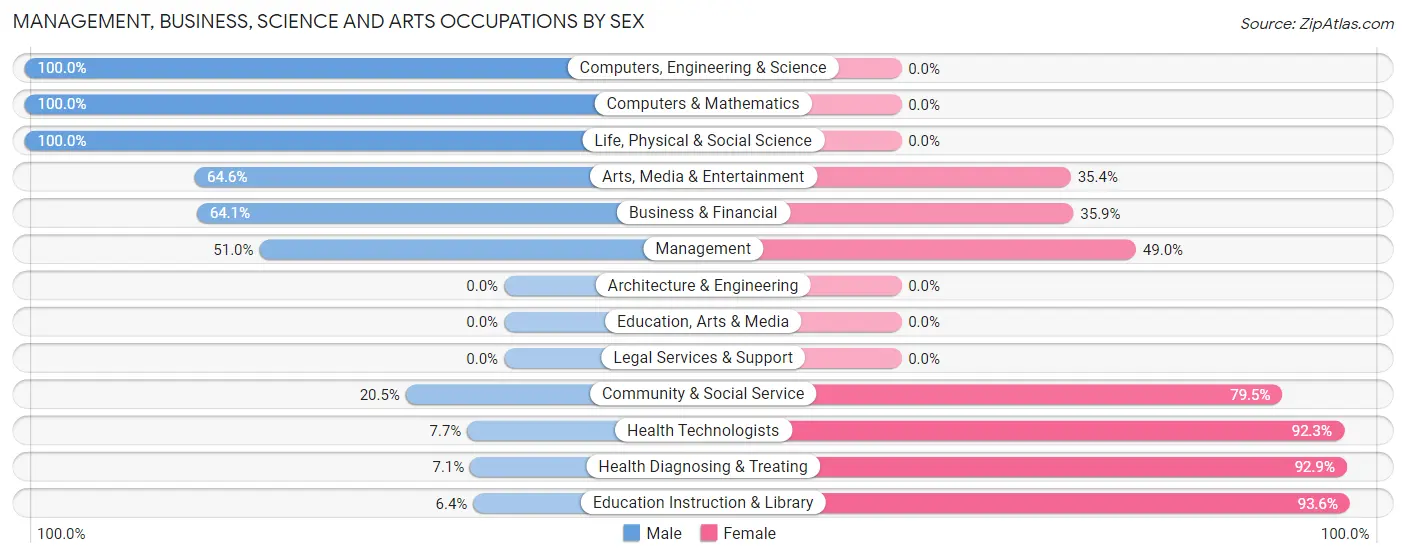
| Occupation | Male | Female |
| Management | 422 (51.0%) | 405 (49.0%) |
| Business & Financial | 198 (64.1%) | 111 (35.9%) |
| Computers, Engineering & Science | 65 (100.0%) | 0 (0.0%) |
| Computers & Mathematics | 53 (100.0%) | 0 (0.0%) |
| Architecture & Engineering | 0 (0.0%) | 0 (0.0%) |
| Life, Physical & Social Science | 12 (100.0%) | 0 (0.0%) |
| Community & Social Service | 139 (20.5%) | 539 (79.5%) |
| Education, Arts & Media | 0 (0.0%) | 0 (0.0%) |
| Legal Services & Support | 0 (0.0%) | 0 (0.0%) |
| Education Instruction & Library | 33 (6.4%) | 481 (93.6%) |
| Arts, Media & Entertainment | 106 (64.6%) | 58 (35.4%) |
| Health Diagnosing & Treating | 69 (7.1%) | 908 (92.9%) |
| Health Technologists | 48 (7.7%) | 577 (92.3%) |
| Total (Category) | 893 (31.3%) | 1,963 (68.7%) |
| Total (Overall) | 8,959 (65.0%) | 4,821 (35.0%) |
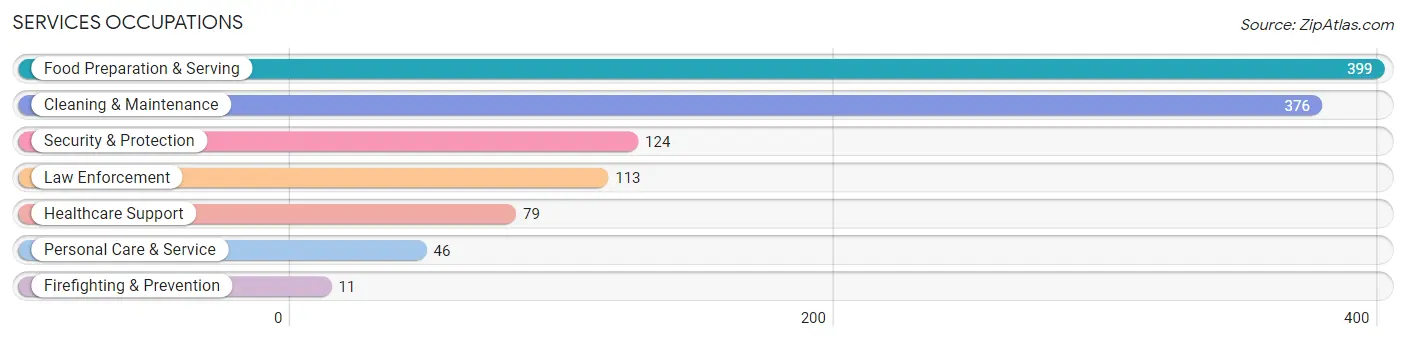
Services Occupations
The most common Services occupations in West Odessa are Food Preparation & Serving (399 | 2.9%), Cleaning & Maintenance (376 | 2.7%), Security & Protection (124 | 0.9%), Law Enforcement (113 | 0.8%), and Healthcare Support (79 | 0.6%).
Services Occupations by Sex
Within the Services occupations in West Odessa, the most male-oriented occupations are Security & Protection (100.0%), Firefighting & Prevention (100.0%), and Law Enforcement (100.0%), while the most female-oriented occupations are Food Preparation & Serving (91.2%), Personal Care & Service (76.1%), and Healthcare Support (73.4%).
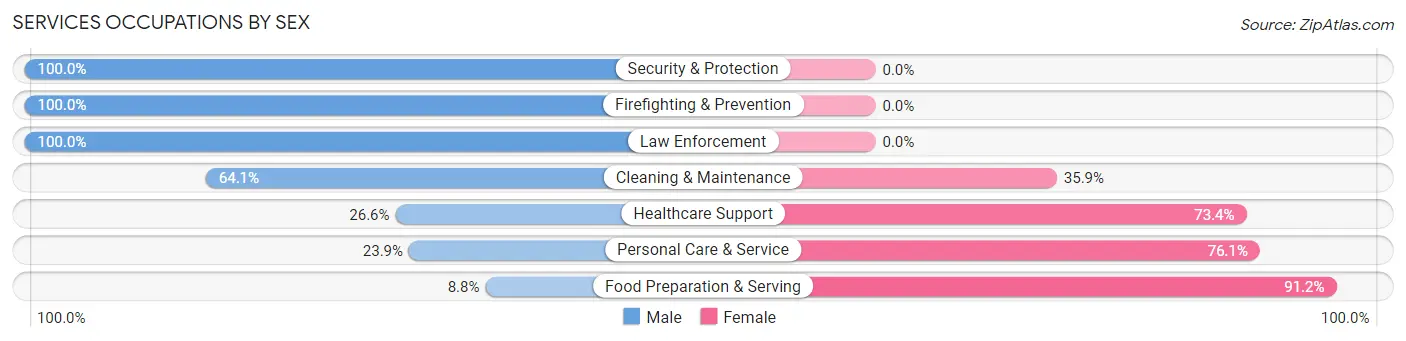
| Occupation | Male | Female |
| Healthcare Support | 21 (26.6%) | 58 (73.4%) |
| Security & Protection | 124 (100.0%) | 0 (0.0%) |
| Firefighting & Prevention | 11 (100.0%) | 0 (0.0%) |
| Law Enforcement | 113 (100.0%) | 0 (0.0%) |
| Food Preparation & Serving | 35 (8.8%) | 364 (91.2%) |
| Cleaning & Maintenance | 241 (64.1%) | 135 (35.9%) |
| Personal Care & Service | 11 (23.9%) | 35 (76.1%) |
| Total (Category) | 432 (42.2%) | 592 (57.8%) |
| Total (Overall) | 8,959 (65.0%) | 4,821 (35.0%) |
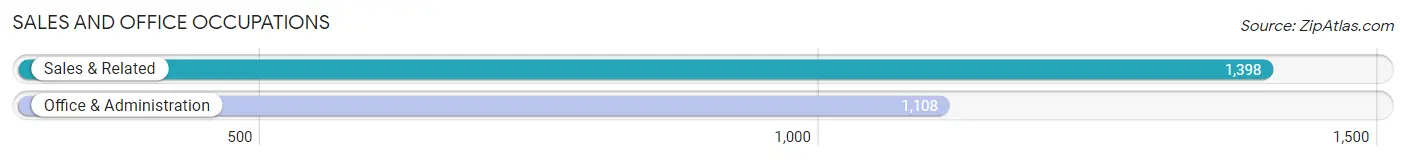
Sales and Office Occupations
The most common Sales and Office occupations in West Odessa are Sales & Related (1,398 | 10.2%), and Office & Administration (1,108 | 8.0%).
Sales and Office Occupations by Sex
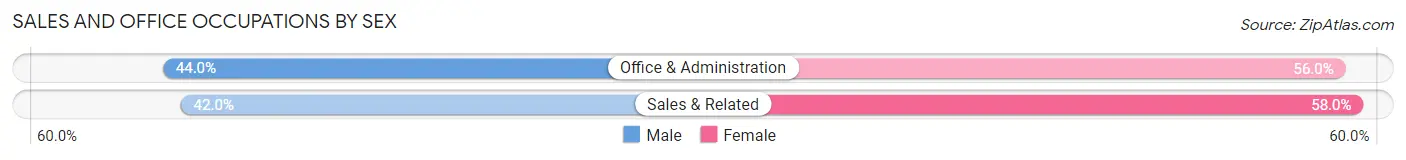
| Occupation | Male | Female |
| Sales & Related | 587 (42.0%) | 811 (58.0%) |
| Office & Administration | 488 (44.0%) | 620 (56.0%) |
| Total (Category) | 1,075 (42.9%) | 1,431 (57.1%) |
| Total (Overall) | 8,959 (65.0%) | 4,821 (35.0%) |
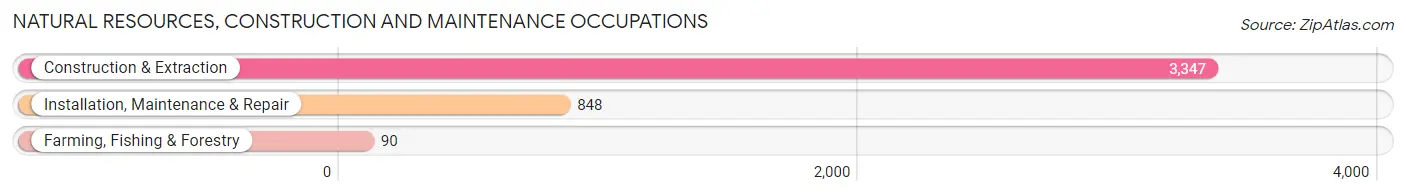
Natural Resources, Construction and Maintenance Occupations
The most common Natural Resources, Construction and Maintenance occupations in West Odessa are Construction & Extraction (3,347 | 24.3%), Installation, Maintenance & Repair (848 | 6.1%), and Farming, Fishing & Forestry (90 | 0.6%).
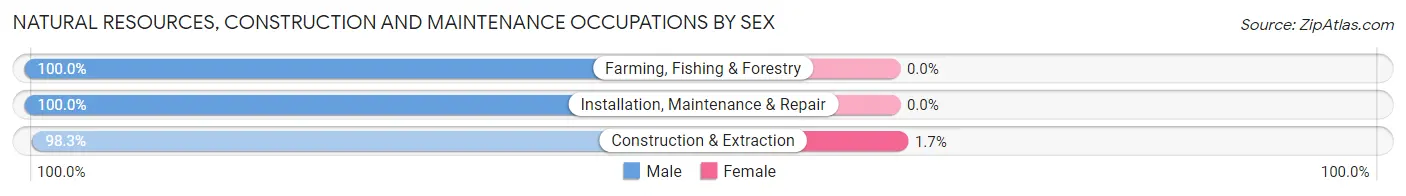
Natural Resources, Construction and Maintenance Occupations by Sex
| Occupation | Male | Female |
| Farming, Fishing & Forestry | 90 (100.0%) | 0 (0.0%) |
| Construction & Extraction | 3,291 (98.3%) | 56 (1.7%) |
| Installation, Maintenance & Repair | 848 (100.0%) | 0 (0.0%) |
| Total (Category) | 4,229 (98.7%) | 56 (1.3%) |
| Total (Overall) | 8,959 (65.0%) | 4,821 (35.0%) |
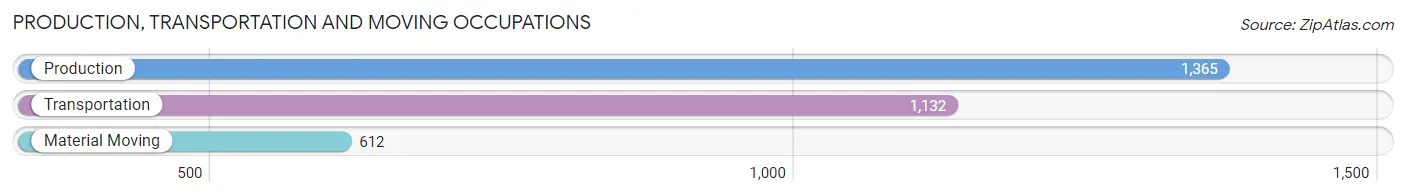
Production, Transportation and Moving Occupations
The most common Production, Transportation and Moving occupations in West Odessa are Production (1,365 | 9.9%), Transportation (1,132 | 8.2%), and Material Moving (612 | 4.4%).
Production, Transportation and Moving Occupations by Sex
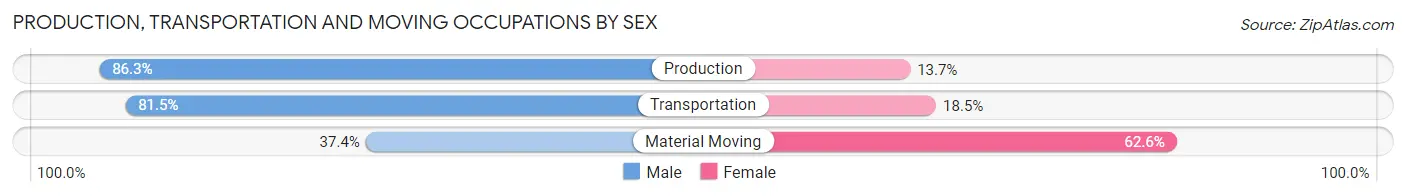
| Occupation | Male | Female |
| Production | 1,178 (86.3%) | 187 (13.7%) |
| Transportation | 923 (81.5%) | 209 (18.5%) |
| Material Moving | 229 (37.4%) | 383 (62.6%) |
| Total (Category) | 2,330 (74.9%) | 779 (25.1%) |
| Total (Overall) | 8,959 (65.0%) | 4,821 (35.0%) |
Employment Industries by Sex in West Odessa
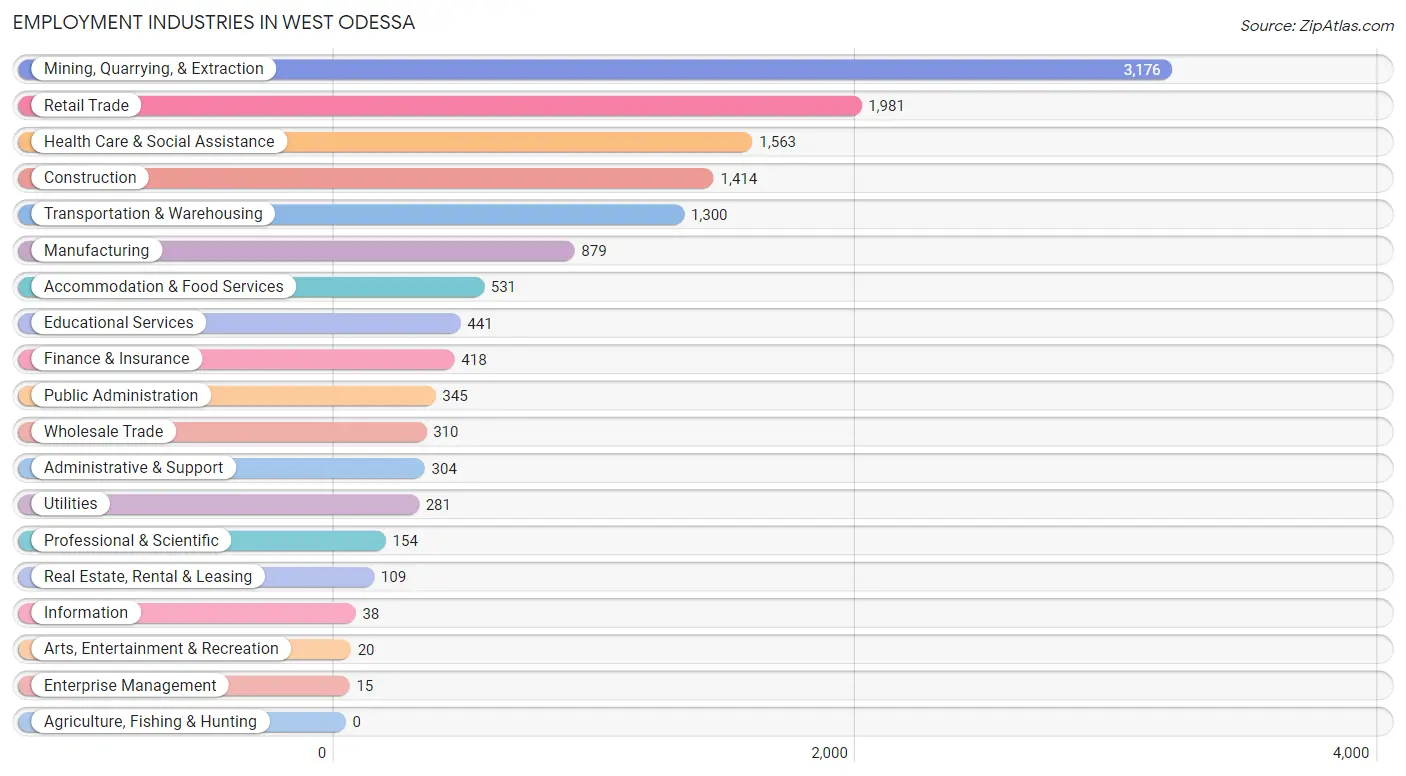
Employment Industries in West Odessa
The major employment industries in West Odessa include Mining, Quarrying, & Extraction (3,176 | 23.1%), Retail Trade (1,981 | 14.4%), Health Care & Social Assistance (1,563 | 11.3%), Construction (1,414 | 10.3%), and Transportation & Warehousing (1,300 | 9.4%).
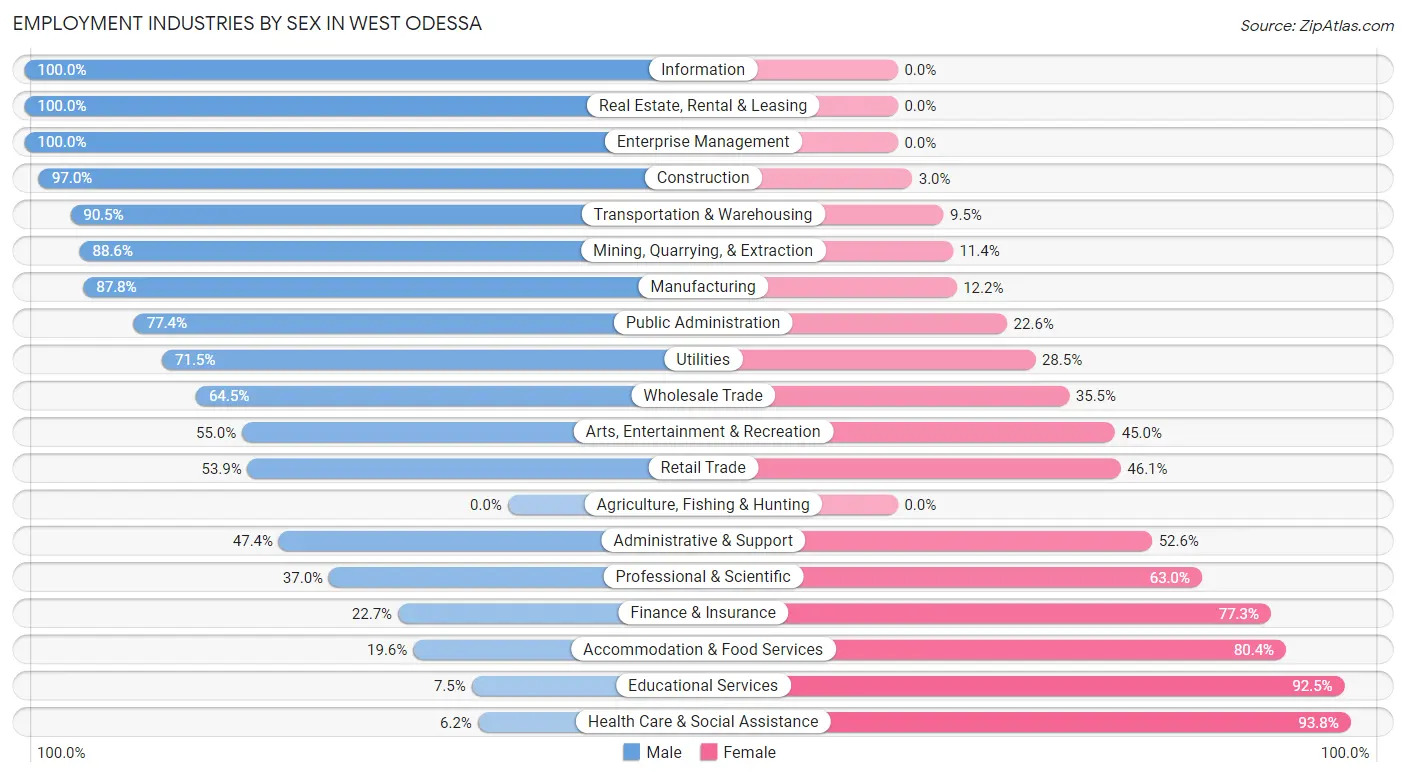
Employment Industries by Sex in West Odessa
The West Odessa industries that see more men than women are Information (100.0%), Real Estate, Rental & Leasing (100.0%), and Enterprise Management (100.0%), whereas the industries that tend to have a higher number of women are Health Care & Social Assistance (93.8%), Educational Services (92.5%), and Accommodation & Food Services (80.4%).
| Industry | Male | Female |
| Agriculture, Fishing & Hunting | 0 (0.0%) | 0 (0.0%) |
| Mining, Quarrying, & Extraction | 2,814 (88.6%) | 362 (11.4%) |
| Construction | 1,372 (97.0%) | 42 (3.0%) |
| Manufacturing | 772 (87.8%) | 107 (12.2%) |
| Wholesale Trade | 200 (64.5%) | 110 (35.5%) |
| Retail Trade | 1,067 (53.9%) | 914 (46.1%) |
| Transportation & Warehousing | 1,177 (90.5%) | 123 (9.5%) |
| Utilities | 201 (71.5%) | 80 (28.5%) |
| Information | 38 (100.0%) | 0 (0.0%) |
| Finance & Insurance | 95 (22.7%) | 323 (77.3%) |
| Real Estate, Rental & Leasing | 109 (100.0%) | 0 (0.0%) |
| Professional & Scientific | 57 (37.0%) | 97 (63.0%) |
| Enterprise Management | 15 (100.0%) | 0 (0.0%) |
| Administrative & Support | 144 (47.4%) | 160 (52.6%) |
| Educational Services | 33 (7.5%) | 408 (92.5%) |
| Health Care & Social Assistance | 97 (6.2%) | 1,466 (93.8%) |
| Arts, Entertainment & Recreation | 11 (55.0%) | 9 (45.0%) |
| Accommodation & Food Services | 104 (19.6%) | 427 (80.4%) |
| Public Administration | 267 (77.4%) | 78 (22.6%) |
| Total | 8,959 (65.0%) | 4,821 (35.0%) |
Education in West Odessa
School Enrollment in West Odessa
The most common levels of schooling among the 9,138 students in West Odessa are middle school (2,728 | 29.8%), elementary school (2,418 | 26.5%), and high school (1,667 | 18.2%).
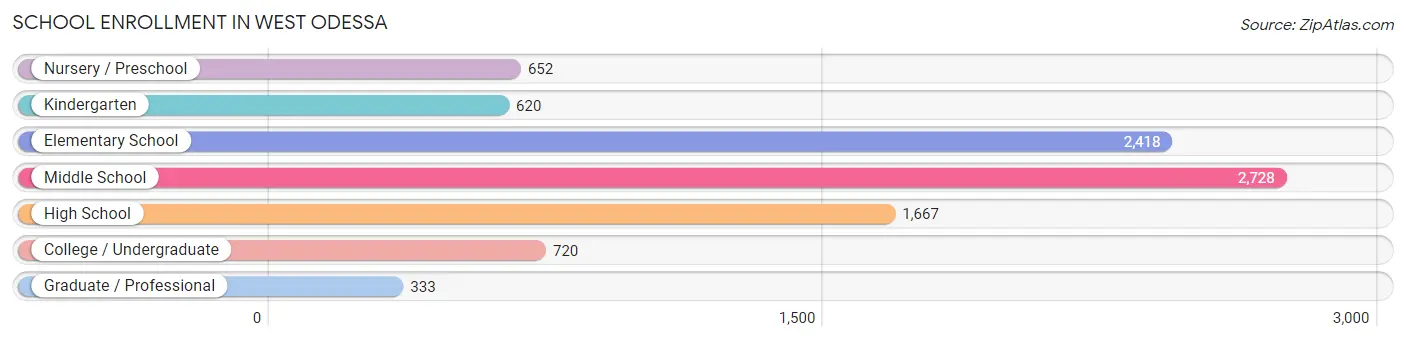
| School Level | # Students | % Students |
| Nursery / Preschool | 652 | 7.1% |
| Kindergarten | 620 | 6.8% |
| Elementary School | 2,418 | 26.5% |
| Middle School | 2,728 | 29.8% |
| High School | 1,667 | 18.2% |
| College / Undergraduate | 720 | 7.9% |
| Graduate / Professional | 333 | 3.6% |
| Total | 9,138 | 100.0% |
School Enrollment by Age by Funding Source in West Odessa
Out of a total of 9,138 students who are enrolled in schools in West Odessa, 822 (9.0%) attend a private institution, while the remaining 8,316 (91.0%) are enrolled in public schools. The age group of 25 to 34 year olds has the highest likelihood of being enrolled in private schools, with 47 (44.3% in the age bracket) enrolled. Conversely, the age group of 18 to 19 year olds has the lowest likelihood of being enrolled in a private school, with 318 (100.0% in the age bracket) attending a public institution.
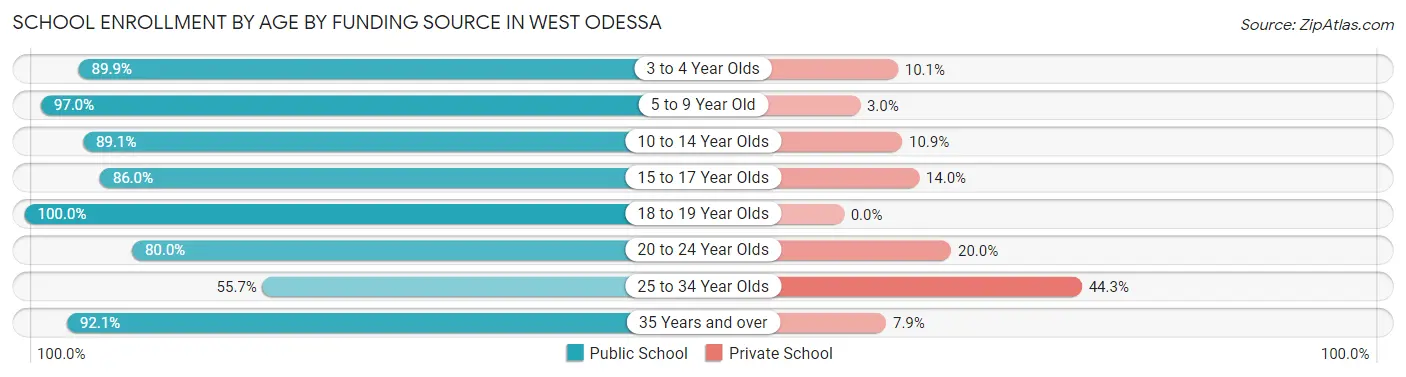
| Age Bracket | Public School | Private School |
| 3 to 4 Year Olds | 535 (89.9%) | 60 (10.1%) |
| 5 to 9 Year Old | 2,842 (97.0%) | 89 (3.0%) |
| 10 to 14 Year Olds | 2,811 (89.1%) | 343 (10.9%) |
| 15 to 17 Year Olds | 933 (86.0%) | 152 (14.0%) |
| 18 to 19 Year Olds | 318 (100.0%) | 0 (0.0%) |
| 20 to 24 Year Olds | 364 (80.0%) | 91 (20.0%) |
| 25 to 34 Year Olds | 59 (55.7%) | 47 (44.3%) |
| 35 Years and over | 455 (92.1%) | 39 (7.9%) |
| Total | 8,316 (91.0%) | 822 (9.0%) |
Educational Attainment by Field of Study in West Odessa
Engineering (537 | 15.1%), bio, nature & agricultural (510 | 14.4%), arts & humanities (436 | 12.3%), liberal arts & history (428 | 12.1%), and psychology (417 | 11.8%) are the most common fields of study among 3,546 individuals in West Odessa who have obtained a bachelor's degree or higher.
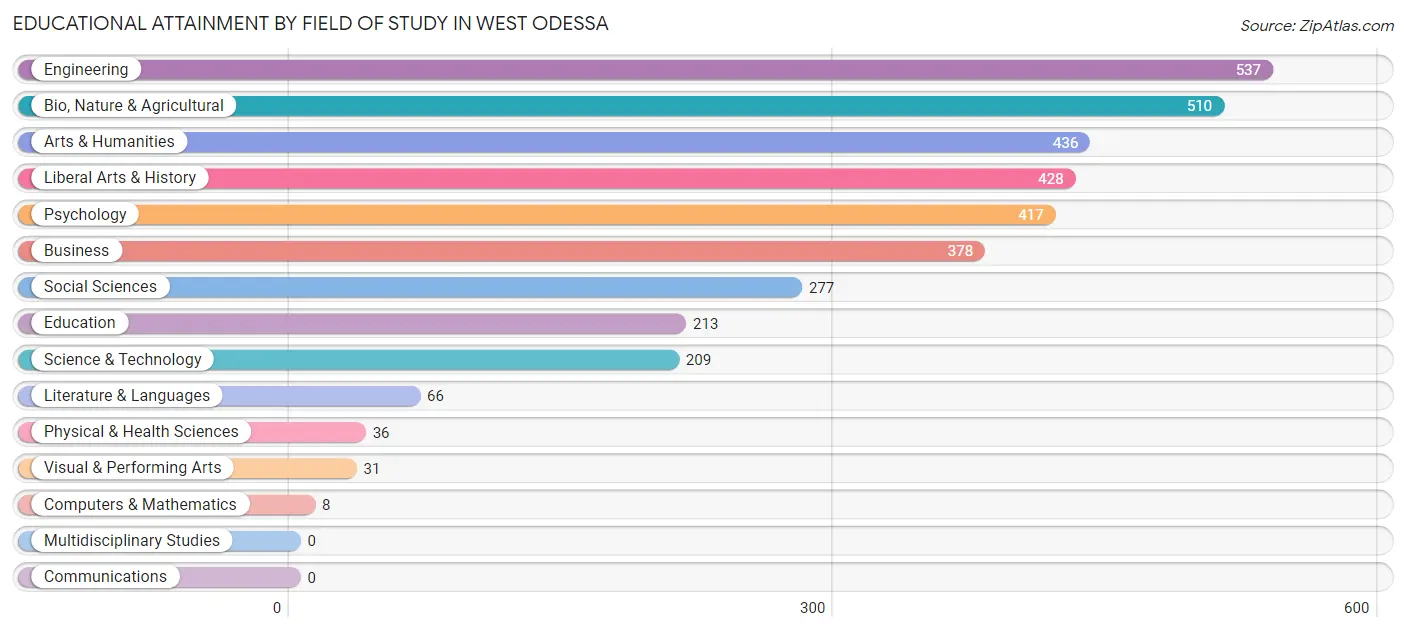
| Field of Study | # Graduates | % Graduates |
| Computers & Mathematics | 8 | 0.2% |
| Bio, Nature & Agricultural | 510 | 14.4% |
| Physical & Health Sciences | 36 | 1.0% |
| Psychology | 417 | 11.8% |
| Social Sciences | 277 | 7.8% |
| Engineering | 537 | 15.1% |
| Multidisciplinary Studies | 0 | 0.0% |
| Science & Technology | 209 | 5.9% |
| Business | 378 | 10.7% |
| Education | 213 | 6.0% |
| Literature & Languages | 66 | 1.9% |
| Liberal Arts & History | 428 | 12.1% |
| Visual & Performing Arts | 31 | 0.9% |
| Communications | 0 | 0.0% |
| Arts & Humanities | 436 | 12.3% |
| Total | 3,546 | 100.0% |
Transportation & Commute in West Odessa
Vehicle Availability by Sex in West Odessa
The most prevalent vehicle ownership categories in West Odessa are males with 2 vehicles (3,607, accounting for 40.9%) and females with 2 vehicles (2,426, making up 74.8%).
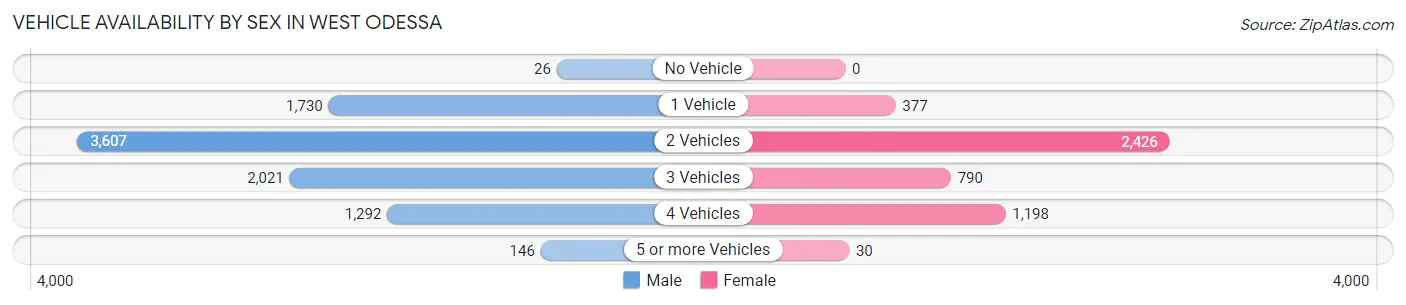
| Vehicles Available | Male | Female |
| No Vehicle | 26 (0.3%) | 0 (0.0%) |
| 1 Vehicle | 1,730 (19.6%) | 377 (7.8%) |
| 2 Vehicles | 3,607 (40.9%) | 2,426 (50.3%) |
| 3 Vehicles | 2,021 (22.9%) | 790 (16.4%) |
| 4 Vehicles | 1,292 (14.6%) | 1,198 (24.8%) |
| 5 or more Vehicles | 146 (1.7%) | 30 (0.6%) |
| Total | 8,822 (100.0%) | 4,821 (100.0%) |
Commute Time in West Odessa
The most frequently occuring commute durations in West Odessa are 30 to 34 minutes (2,468 commuters, 18.6%), 90 or more minutes (1,585 commuters, 12.0%), and 15 to 19 minutes (1,565 commuters, 11.8%).
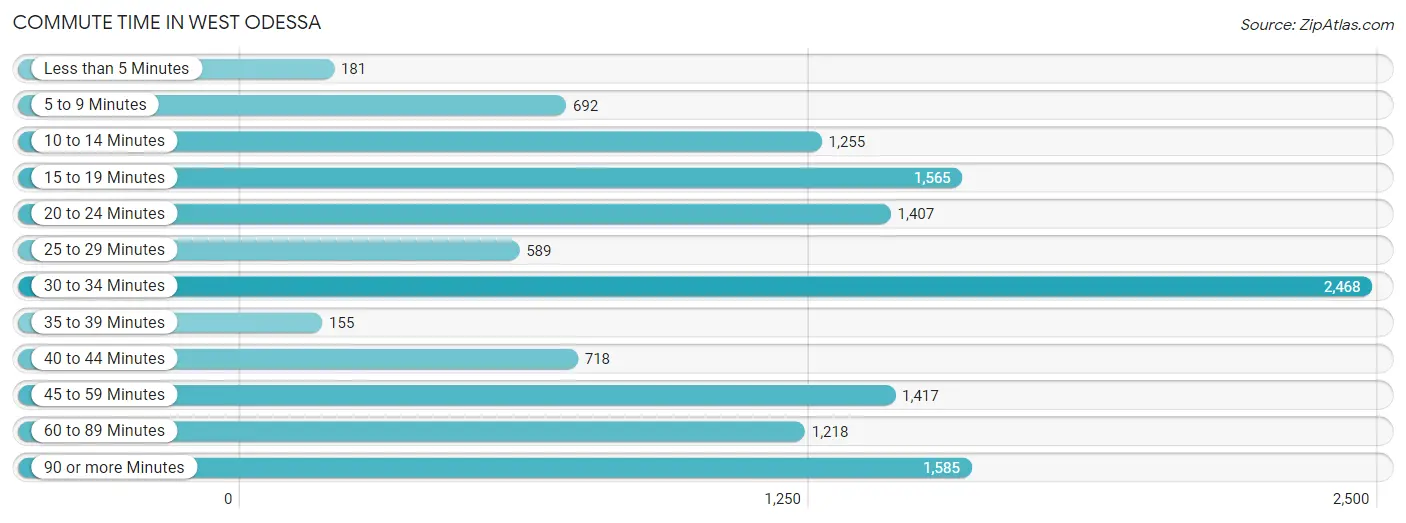
| Commute Time | # Commuters | % Commuters |
| Less than 5 Minutes | 181 | 1.4% |
| 5 to 9 Minutes | 692 | 5.2% |
| 10 to 14 Minutes | 1,255 | 9.5% |
| 15 to 19 Minutes | 1,565 | 11.8% |
| 20 to 24 Minutes | 1,407 | 10.6% |
| 25 to 29 Minutes | 589 | 4.4% |
| 30 to 34 Minutes | 2,468 | 18.6% |
| 35 to 39 Minutes | 155 | 1.2% |
| 40 to 44 Minutes | 718 | 5.4% |
| 45 to 59 Minutes | 1,417 | 10.7% |
| 60 to 89 Minutes | 1,218 | 9.2% |
| 90 or more Minutes | 1,585 | 12.0% |
Commute Time by Sex in West Odessa
The most common commute times in West Odessa are 30 to 34 minutes (1,562 commuters, 18.2%) for males and 30 to 34 minutes (906 commuters, 19.3%) for females.
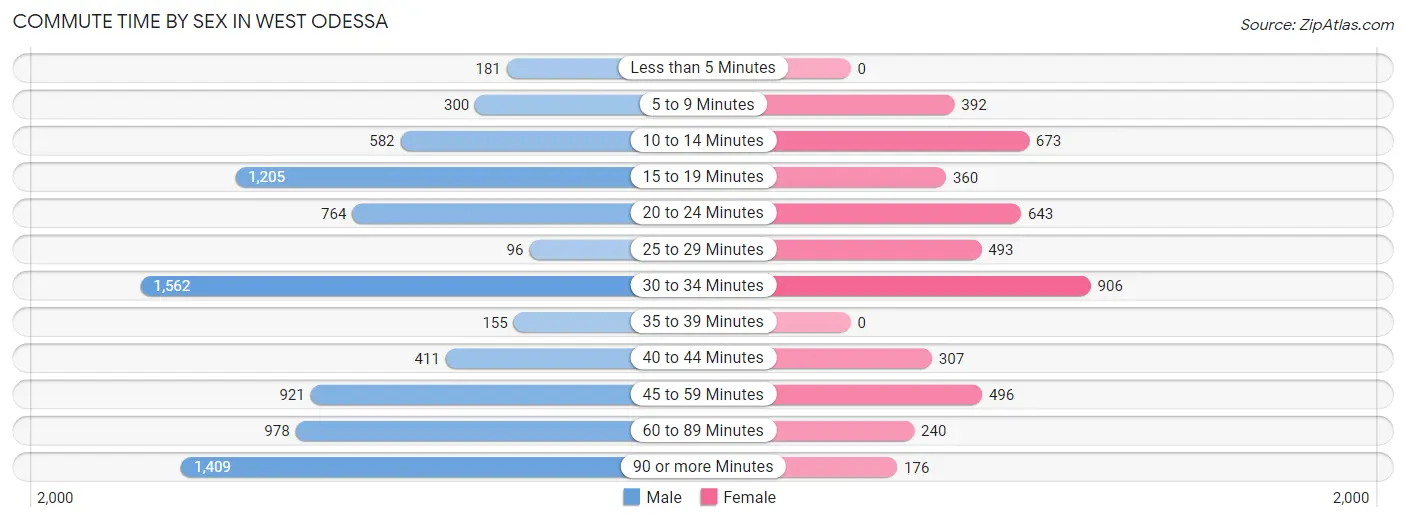
| Commute Time | Male | Female |
| Less than 5 Minutes | 181 (2.1%) | 0 (0.0%) |
| 5 to 9 Minutes | 300 (3.5%) | 392 (8.4%) |
| 10 to 14 Minutes | 582 (6.8%) | 673 (14.4%) |
| 15 to 19 Minutes | 1,205 (14.1%) | 360 (7.7%) |
| 20 to 24 Minutes | 764 (8.9%) | 643 (13.7%) |
| 25 to 29 Minutes | 96 (1.1%) | 493 (10.5%) |
| 30 to 34 Minutes | 1,562 (18.2%) | 906 (19.3%) |
| 35 to 39 Minutes | 155 (1.8%) | 0 (0.0%) |
| 40 to 44 Minutes | 411 (4.8%) | 307 (6.6%) |
| 45 to 59 Minutes | 921 (10.7%) | 496 (10.6%) |
| 60 to 89 Minutes | 978 (11.4%) | 240 (5.1%) |
| 90 or more Minutes | 1,409 (16.5%) | 176 (3.8%) |
Time of Departure to Work by Sex in West Odessa
The most frequent times of departure to work in West Odessa are 12:00 AM to 4:59 AM (1,445, 16.9%) for males and 7:00 AM to 7:29 AM (931, 19.9%) for females.
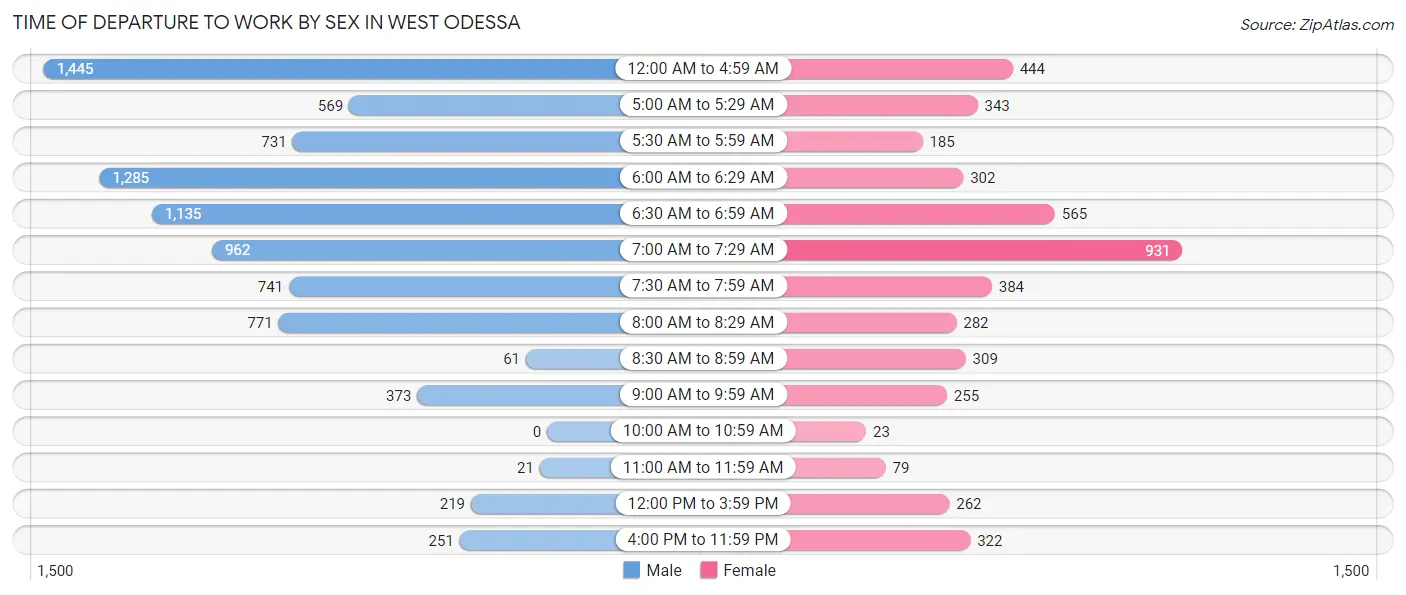
| Time of Departure | Male | Female |
| 12:00 AM to 4:59 AM | 1,445 (16.9%) | 444 (9.5%) |
| 5:00 AM to 5:29 AM | 569 (6.6%) | 343 (7.3%) |
| 5:30 AM to 5:59 AM | 731 (8.5%) | 185 (4.0%) |
| 6:00 AM to 6:29 AM | 1,285 (15.0%) | 302 (6.4%) |
| 6:30 AM to 6:59 AM | 1,135 (13.3%) | 565 (12.1%) |
| 7:00 AM to 7:29 AM | 962 (11.2%) | 931 (19.9%) |
| 7:30 AM to 7:59 AM | 741 (8.6%) | 384 (8.2%) |
| 8:00 AM to 8:29 AM | 771 (9.0%) | 282 (6.0%) |
| 8:30 AM to 8:59 AM | 61 (0.7%) | 309 (6.6%) |
| 9:00 AM to 9:59 AM | 373 (4.4%) | 255 (5.4%) |
| 10:00 AM to 10:59 AM | 0 (0.0%) | 23 (0.5%) |
| 11:00 AM to 11:59 AM | 21 (0.3%) | 79 (1.7%) |
| 12:00 PM to 3:59 PM | 219 (2.6%) | 262 (5.6%) |
| 4:00 PM to 11:59 PM | 251 (2.9%) | 322 (6.9%) |
| Total | 8,564 (100.0%) | 4,686 (100.0%) |
Housing Occupancy in West Odessa
Occupancy by Ownership in West Odessa
Of the total 11,190 dwellings in West Odessa, owner-occupied units account for 8,778 (78.4%), while renter-occupied units make up 2,412 (21.5%).
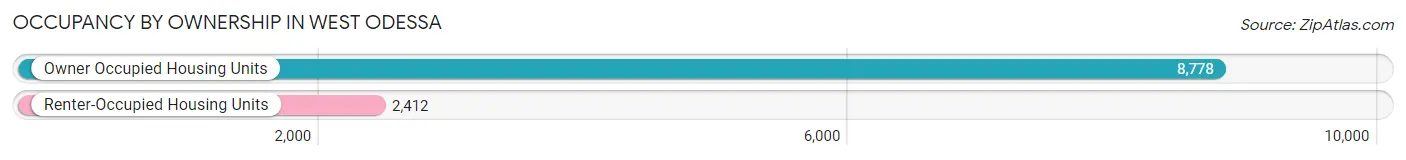
| Occupancy | # Housing Units | % Housing Units |
| Owner Occupied Housing Units | 8,778 | 78.4% |
| Renter-Occupied Housing Units | 2,412 | 21.5% |
| Total Occupied Housing Units | 11,190 | 100.0% |
Occupancy by Household Size in West Odessa
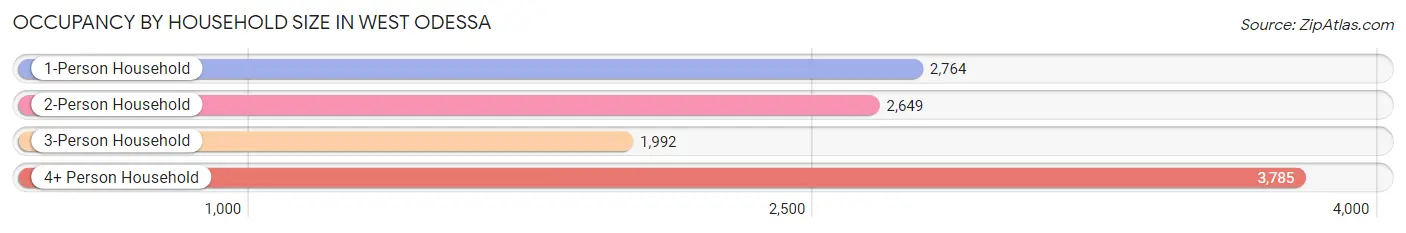
| Household Size | # Housing Units | % Housing Units |
| 1-Person Household | 2,764 | 24.7% |
| 2-Person Household | 2,649 | 23.7% |
| 3-Person Household | 1,992 | 17.8% |
| 4+ Person Household | 3,785 | 33.8% |
| Total Housing Units | 11,190 | 100.0% |
Occupancy by Ownership by Household Size in West Odessa
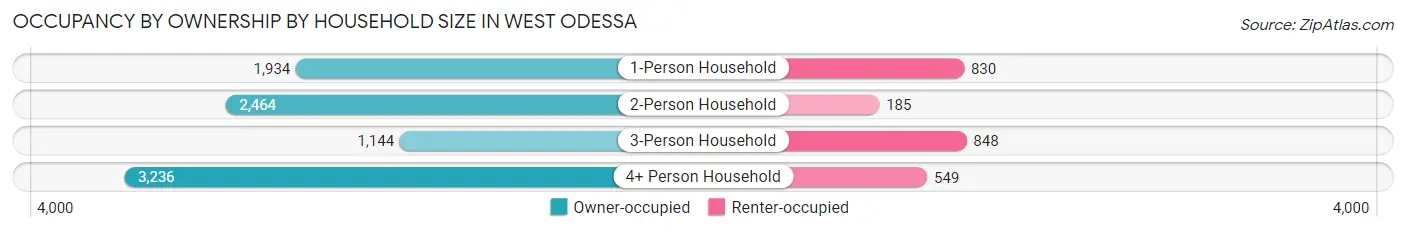
| Household Size | Owner-occupied | Renter-occupied |
| 1-Person Household | 1,934 (70.0%) | 830 (30.0%) |
| 2-Person Household | 2,464 (93.0%) | 185 (7.0%) |
| 3-Person Household | 1,144 (57.4%) | 848 (42.6%) |
| 4+ Person Household | 3,236 (85.5%) | 549 (14.5%) |
| Total Housing Units | 8,778 (78.4%) | 2,412 (21.5%) |
Occupancy by Educational Attainment in West Odessa
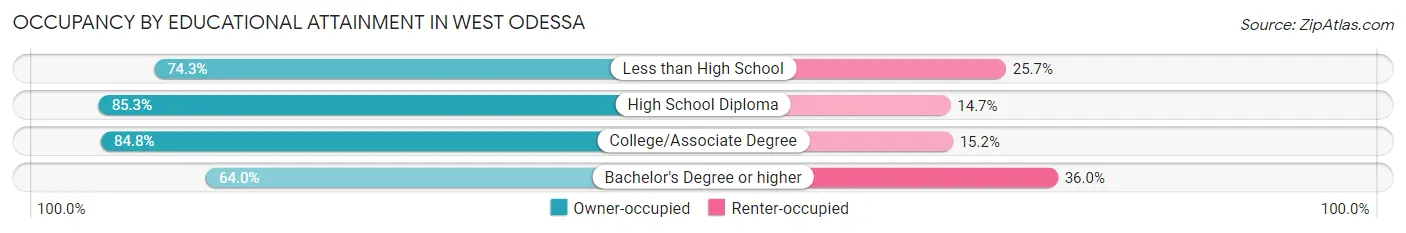
| Household Size | Owner-occupied | Renter-occupied |
| Less than High School | 2,903 (74.3%) | 1,004 (25.7%) |
| High School Diploma | 2,731 (85.3%) | 471 (14.7%) |
| College/Associate Degree | 2,168 (84.8%) | 388 (15.2%) |
| Bachelor's Degree or higher | 976 (64.0%) | 549 (36.0%) |
Occupancy by Age of Householder in West Odessa
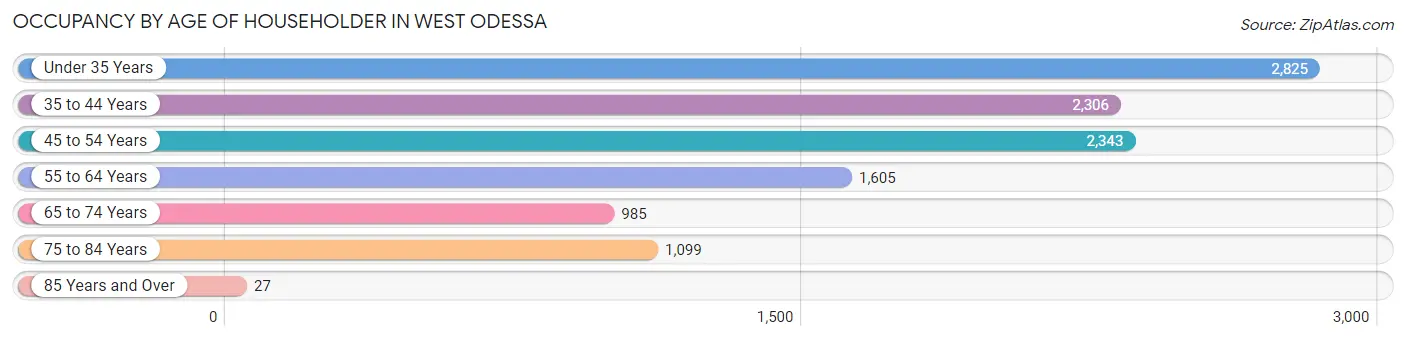
| Age Bracket | # Households | % Households |
| Under 35 Years | 2,825 | 25.3% |
| 35 to 44 Years | 2,306 | 20.6% |
| 45 to 54 Years | 2,343 | 20.9% |
| 55 to 64 Years | 1,605 | 14.3% |
| 65 to 74 Years | 985 | 8.8% |
| 75 to 84 Years | 1,099 | 9.8% |
| 85 Years and Over | 27 | 0.2% |
| Total | 11,190 | 100.0% |
Housing Finances in West Odessa
Median Income by Occupancy in West Odessa
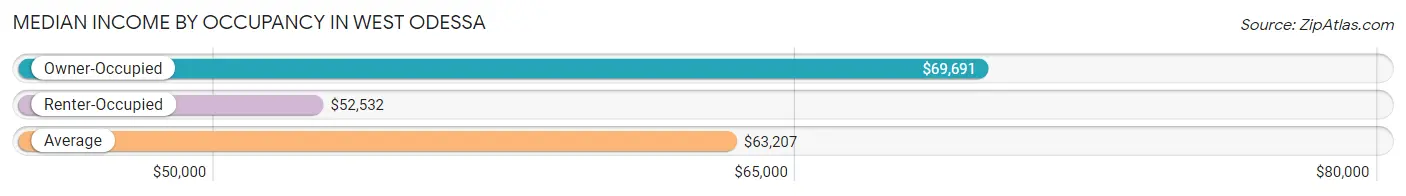
| Occupancy Type | # Households | Median Income |
| Owner-Occupied | 8,778 (78.4%) | $69,691 |
| Renter-Occupied | 2,412 (21.5%) | $52,532 |
| Average | 11,190 (100.0%) | $63,207 |
Occupancy by Householder Income Bracket in West Odessa
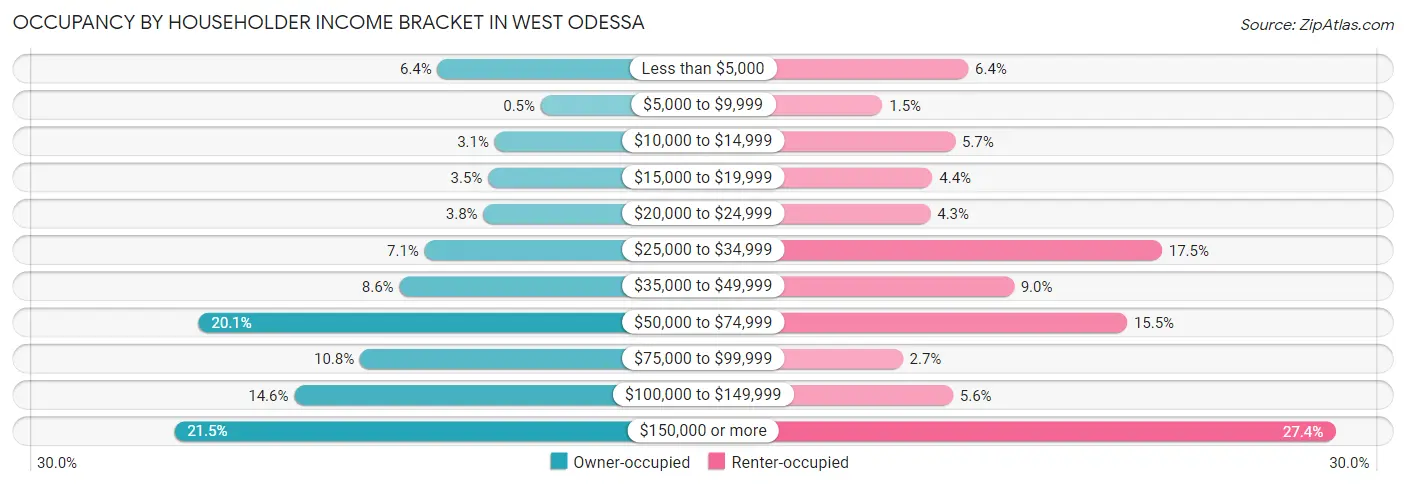
| Income Bracket | Owner-occupied | Renter-occupied |
| Less than $5,000 | 562 (6.4%) | 155 (6.4%) |
| $5,000 to $9,999 | 44 (0.5%) | 37 (1.5%) |
| $10,000 to $14,999 | 275 (3.1%) | 137 (5.7%) |
| $15,000 to $19,999 | 308 (3.5%) | 106 (4.4%) |
| $20,000 to $24,999 | 332 (3.8%) | 103 (4.3%) |
| $25,000 to $34,999 | 627 (7.1%) | 422 (17.5%) |
| $35,000 to $49,999 | 753 (8.6%) | 218 (9.0%) |
| $50,000 to $74,999 | 1,762 (20.1%) | 374 (15.5%) |
| $75,000 to $99,999 | 951 (10.8%) | 65 (2.7%) |
| $100,000 to $149,999 | 1,281 (14.6%) | 134 (5.6%) |
| $150,000 or more | 1,883 (21.4%) | 661 (27.4%) |
| Total | 8,778 (100.0%) | 2,412 (100.0%) |
Monthly Housing Cost Tiers in West Odessa
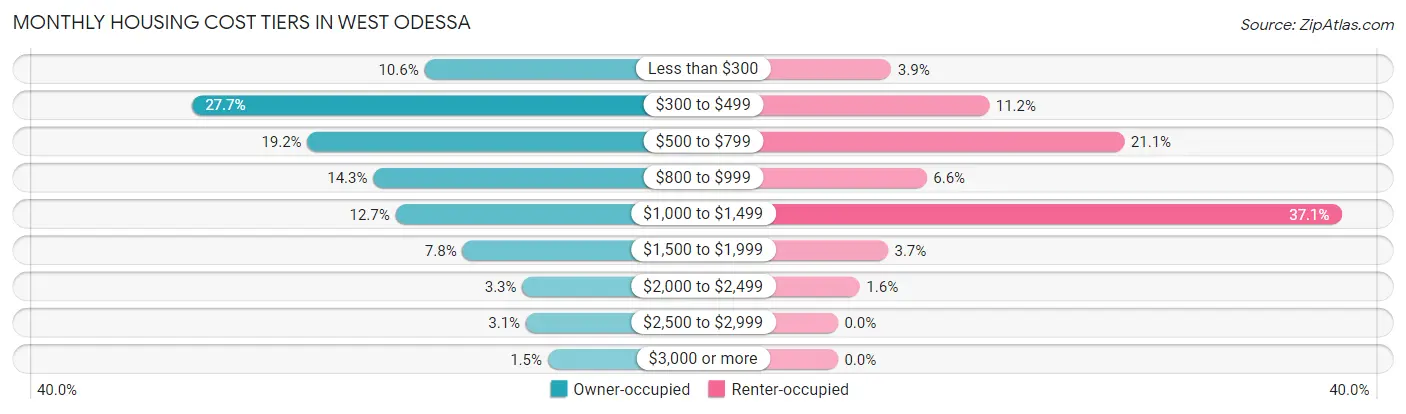
| Monthly Cost | Owner-occupied | Renter-occupied |
| Less than $300 | 926 (10.5%) | 95 (3.9%) |
| $300 to $499 | 2,427 (27.7%) | 269 (11.2%) |
| $500 to $799 | 1,683 (19.2%) | 509 (21.1%) |
| $800 to $999 | 1,257 (14.3%) | 158 (6.6%) |
| $1,000 to $1,499 | 1,113 (12.7%) | 895 (37.1%) |
| $1,500 to $1,999 | 680 (7.7%) | 89 (3.7%) |
| $2,000 to $2,499 | 293 (3.3%) | 39 (1.6%) |
| $2,500 to $2,999 | 270 (3.1%) | 0 (0.0%) |
| $3,000 or more | 129 (1.5%) | 0 (0.0%) |
| Total | 8,778 (100.0%) | 2,412 (100.0%) |
Physical Housing Characteristics in West Odessa
Housing Structures in West Odessa
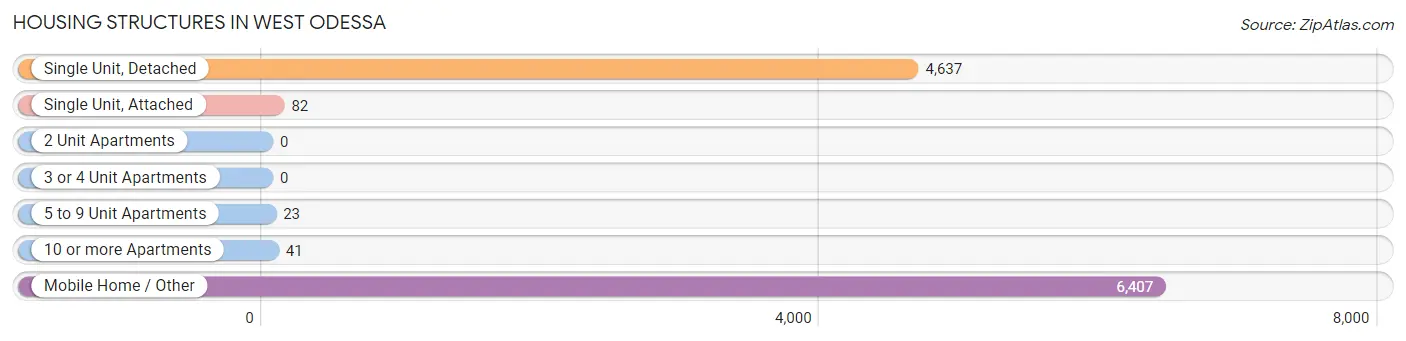
| Structure Type | # Housing Units | % Housing Units |
| Single Unit, Detached | 4,637 | 41.4% |
| Single Unit, Attached | 82 | 0.7% |
| 2 Unit Apartments | 0 | 0.0% |
| 3 or 4 Unit Apartments | 0 | 0.0% |
| 5 to 9 Unit Apartments | 23 | 0.2% |
| 10 or more Apartments | 41 | 0.4% |
| Mobile Home / Other | 6,407 | 57.3% |
| Total | 11,190 | 100.0% |
Housing Structures by Occupancy in West Odessa
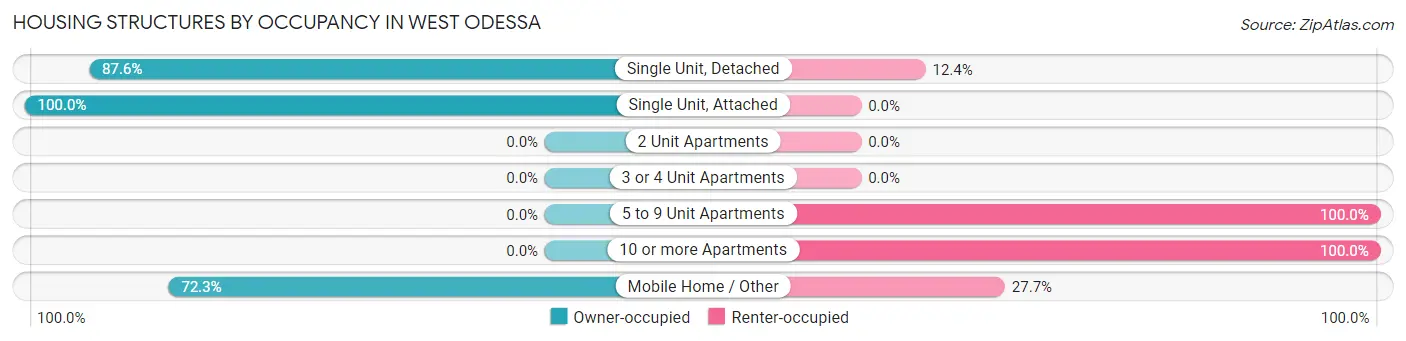
| Structure Type | Owner-occupied | Renter-occupied |
| Single Unit, Detached | 4,062 (87.6%) | 575 (12.4%) |
| Single Unit, Attached | 82 (100.0%) | 0 (0.0%) |
| 2 Unit Apartments | 0 (0.0%) | 0 (0.0%) |
| 3 or 4 Unit Apartments | 0 (0.0%) | 0 (0.0%) |
| 5 to 9 Unit Apartments | 0 (0.0%) | 23 (100.0%) |
| 10 or more Apartments | 0 (0.0%) | 41 (100.0%) |
| Mobile Home / Other | 4,634 (72.3%) | 1,773 (27.7%) |
| Total | 8,778 (78.4%) | 2,412 (21.5%) |
Housing Structures by Number of Rooms in West Odessa
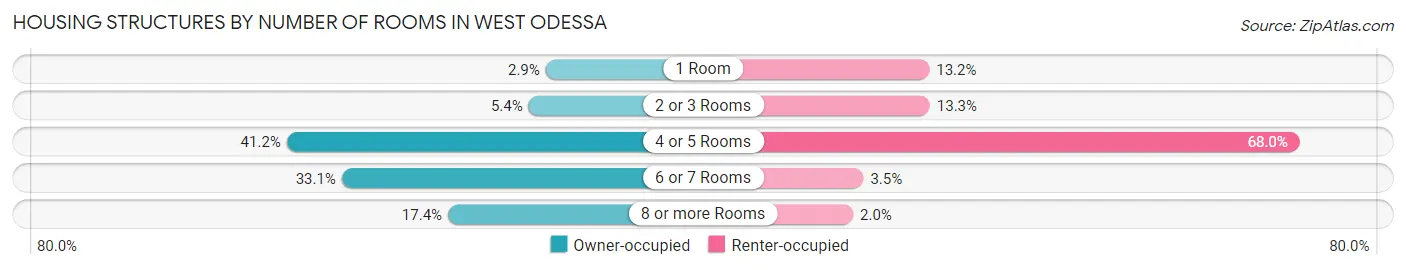
| Number of Rooms | Owner-occupied | Renter-occupied |
| 1 Room | 255 (2.9%) | 319 (13.2%) |
| 2 or 3 Rooms | 477 (5.4%) | 321 (13.3%) |
| 4 or 5 Rooms | 3,618 (41.2%) | 1,641 (68.0%) |
| 6 or 7 Rooms | 2,904 (33.1%) | 84 (3.5%) |
| 8 or more Rooms | 1,524 (17.4%) | 47 (1.9%) |
| Total | 8,778 (100.0%) | 2,412 (100.0%) |
Housing Structure by Heating Type in West Odessa
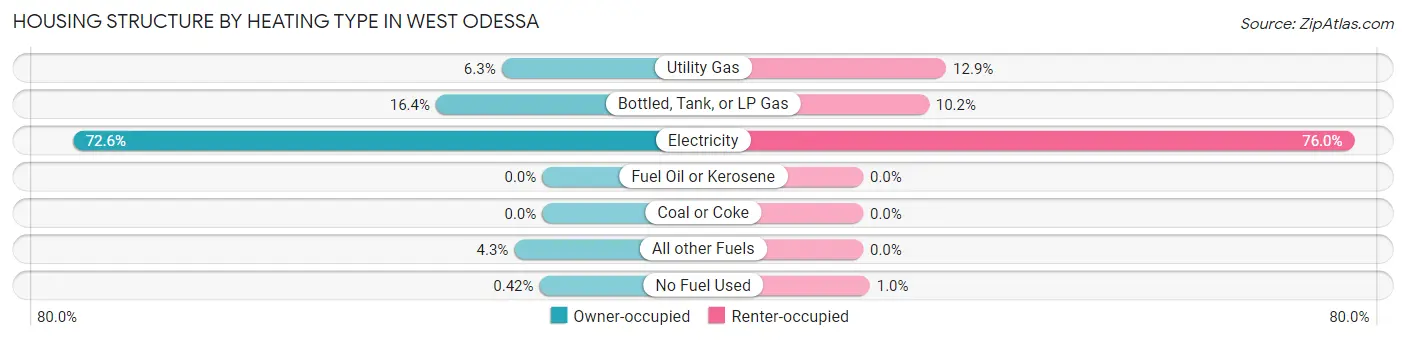
| Heating Type | Owner-occupied | Renter-occupied |
| Utility Gas | 551 (6.3%) | 310 (12.9%) |
| Bottled, Tank, or LP Gas | 1,442 (16.4%) | 245 (10.2%) |
| Electricity | 6,369 (72.6%) | 1,832 (75.9%) |
| Fuel Oil or Kerosene | 0 (0.0%) | 0 (0.0%) |
| Coal or Coke | 0 (0.0%) | 0 (0.0%) |
| All other Fuels | 379 (4.3%) | 0 (0.0%) |
| No Fuel Used | 37 (0.4%) | 25 (1.0%) |
| Total | 8,778 (100.0%) | 2,412 (100.0%) |
Household Vehicle Usage in West Odessa
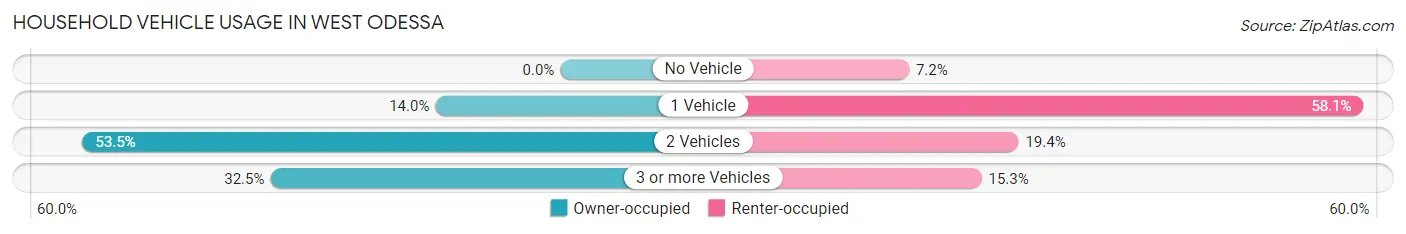
| Vehicles per Household | Owner-occupied | Renter-occupied |
| No Vehicle | 0 (0.0%) | 173 (7.2%) |
| 1 Vehicle | 1,229 (14.0%) | 1,401 (58.1%) |
| 2 Vehicles | 4,698 (53.5%) | 469 (19.4%) |
| 3 or more Vehicles | 2,851 (32.5%) | 369 (15.3%) |
| Total | 8,778 (100.0%) | 2,412 (100.0%) |
Real Estate & Mortgages in West Odessa
Real Estate and Mortgage Overview in West Odessa
| Characteristic | Without Mortgage | With Mortgage |
| Housing Units | 6,385 | 2,393 |
| Median Property Value | $112,500 | $132,900 |
| Median Household Income | $67,666 | $528 |
| Monthly Housing Costs | $481 | $129 |
| Real Estate Taxes | $1,252 | $11 |
Property Value by Mortgage Status in West Odessa
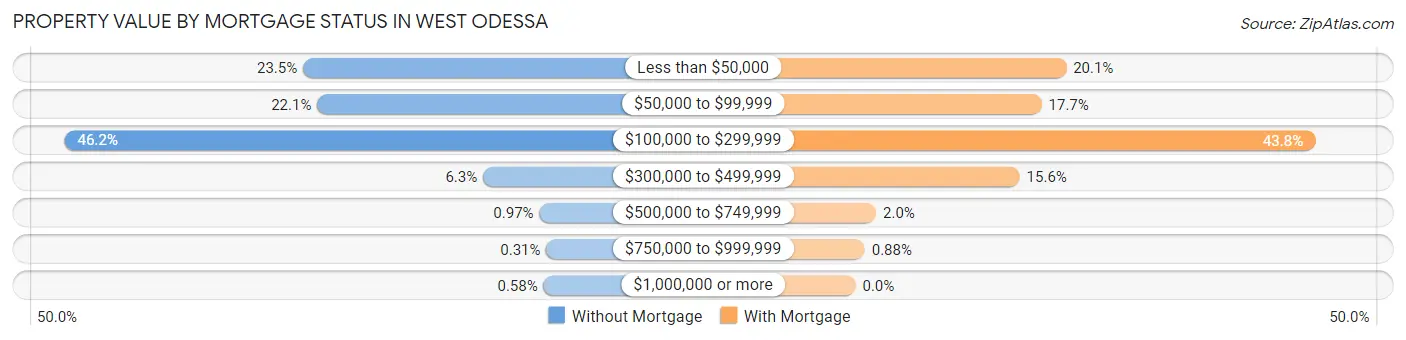
| Property Value | Without Mortgage | With Mortgage |
| Less than $50,000 | 1,499 (23.5%) | 480 (20.1%) |
| $50,000 to $99,999 | 1,413 (22.1%) | 424 (17.7%) |
| $100,000 to $299,999 | 2,949 (46.2%) | 1,047 (43.8%) |
| $300,000 to $499,999 | 405 (6.3%) | 374 (15.6%) |
| $500,000 to $749,999 | 62 (1.0%) | 47 (2.0%) |
| $750,000 to $999,999 | 20 (0.3%) | 21 (0.9%) |
| $1,000,000 or more | 37 (0.6%) | 0 (0.0%) |
| Total | 6,385 (100.0%) | 2,393 (100.0%) |
Household Income by Mortgage Status in West Odessa
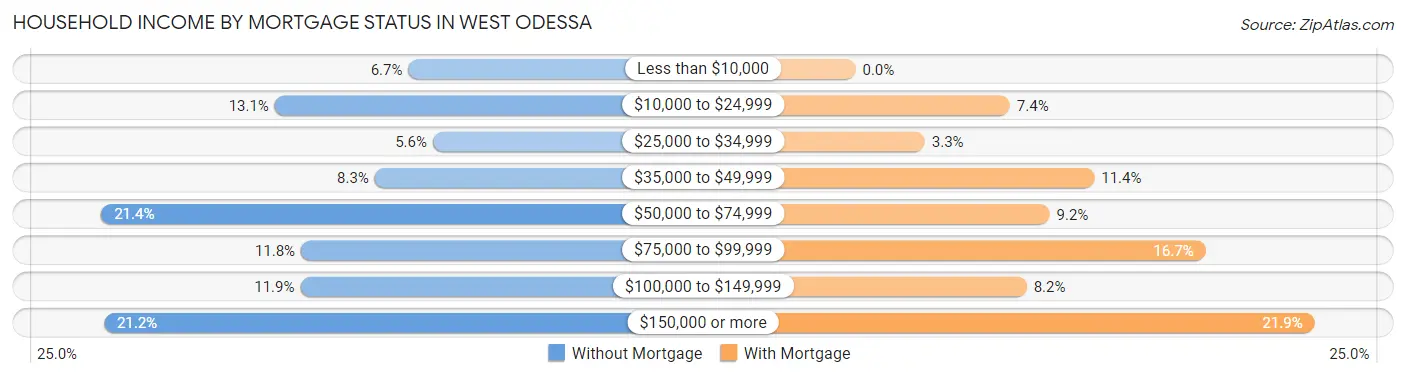
| Household Income | Without Mortgage | With Mortgage |
| Less than $10,000 | 430 (6.7%) | 0 (0.0%) |
| $10,000 to $24,999 | 836 (13.1%) | 176 (7.3%) |
| $25,000 to $34,999 | 355 (5.6%) | 79 (3.3%) |
| $35,000 to $49,999 | 532 (8.3%) | 272 (11.4%) |
| $50,000 to $74,999 | 1,363 (21.3%) | 221 (9.2%) |
| $75,000 to $99,999 | 756 (11.8%) | 399 (16.7%) |
| $100,000 to $149,999 | 758 (11.9%) | 195 (8.2%) |
| $150,000 or more | 1,355 (21.2%) | 523 (21.9%) |
| Total | 6,385 (100.0%) | 2,393 (100.0%) |
Property Value to Household Income Ratio in West Odessa
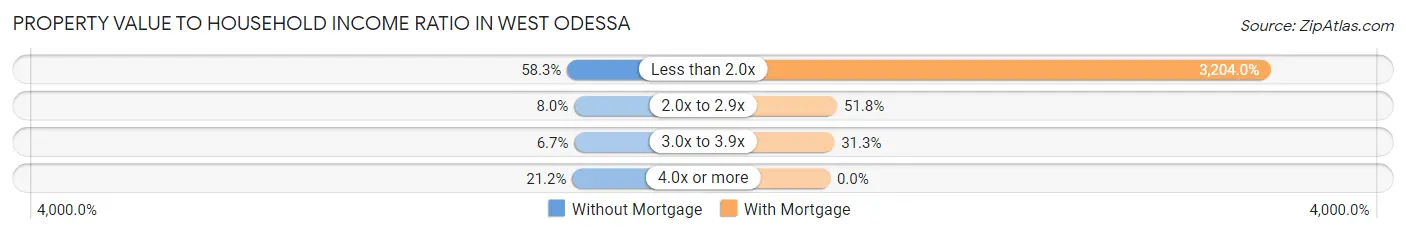
| Value-to-Income Ratio | Without Mortgage | With Mortgage |
| Less than 2.0x | 3,724 (58.3%) | 76,672 (3,204.0%) |
| 2.0x to 2.9x | 513 (8.0%) | 1,239 (51.8%) |
| 3.0x to 3.9x | 425 (6.7%) | 749 (31.3%) |
| 4.0x or more | 1,352 (21.2%) | 0 (0.0%) |
| Total | 6,385 (100.0%) | 2,393 (100.0%) |
Real Estate Taxes by Mortgage Status in West Odessa
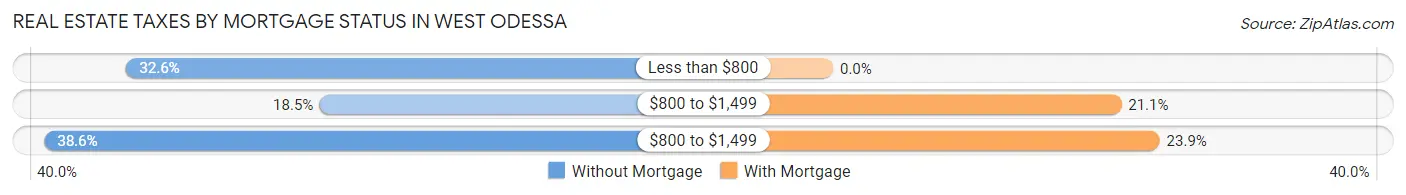
| Property Taxes | Without Mortgage | With Mortgage |
| Less than $800 | 2,079 (32.6%) | 0 (0.0%) |
| $800 to $1,499 | 1,180 (18.5%) | 504 (21.1%) |
| $800 to $1,499 | 2,462 (38.6%) | 571 (23.9%) |
| Total | 6,385 (100.0%) | 2,393 (100.0%) |
Health & Disability in West Odessa
Health Insurance Coverage by Age in West Odessa
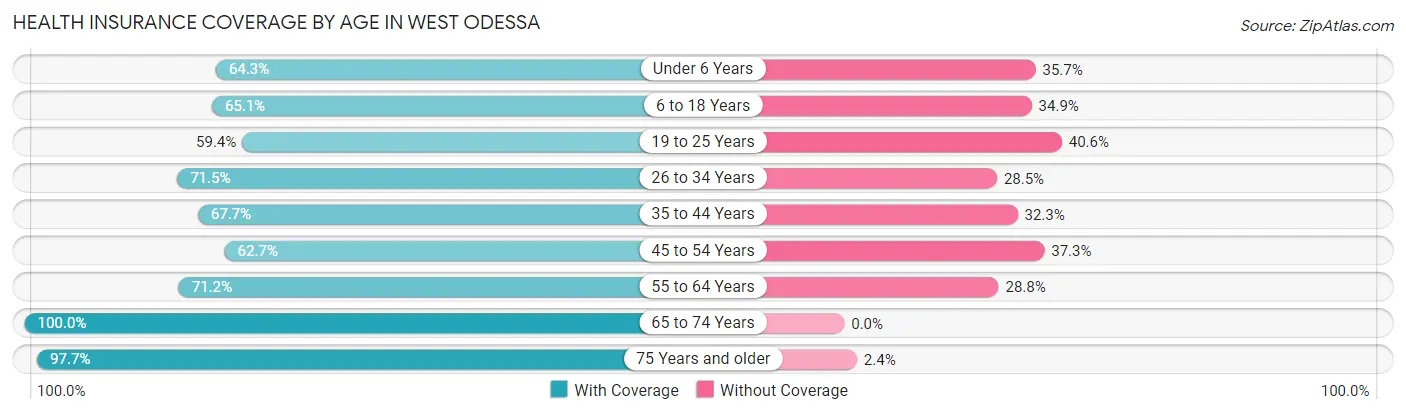
| Age Bracket | With Coverage | Without Coverage |
| Under 6 Years | 1,863 (64.3%) | 1,033 (35.7%) |
| 6 to 18 Years | 4,612 (65.1%) | 2,477 (34.9%) |
| 19 to 25 Years | 1,621 (59.4%) | 1,106 (40.6%) |
| 26 to 34 Years | 3,048 (71.5%) | 1,213 (28.5%) |
| 35 to 44 Years | 2,992 (67.7%) | 1,428 (32.3%) |
| 45 to 54 Years | 2,291 (62.7%) | 1,363 (37.3%) |
| 55 to 64 Years | 1,880 (71.2%) | 759 (28.8%) |
| 65 to 74 Years | 1,856 (100.0%) | 0 (0.0%) |
| 75 Years and older | 1,330 (97.7%) | 32 (2.4%) |
| Total | 21,493 (69.6%) | 9,411 (30.4%) |
Health Insurance Coverage by Citizenship Status in West Odessa
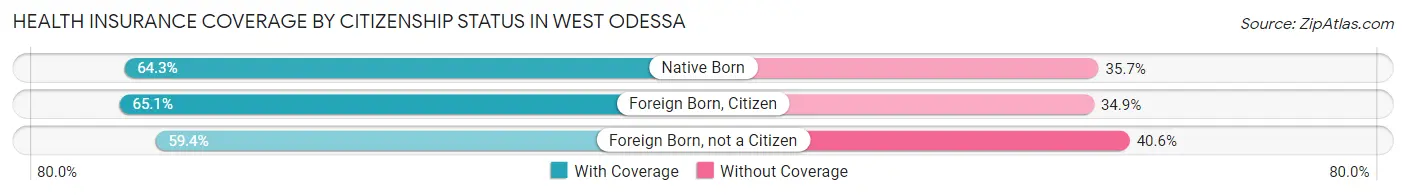
| Citizenship Status | With Coverage | Without Coverage |
| Native Born | 1,863 (64.3%) | 1,033 (35.7%) |
| Foreign Born, Citizen | 4,612 (65.1%) | 2,477 (34.9%) |
| Foreign Born, not a Citizen | 1,621 (59.4%) | 1,106 (40.6%) |
Health Insurance Coverage by Household Income in West Odessa
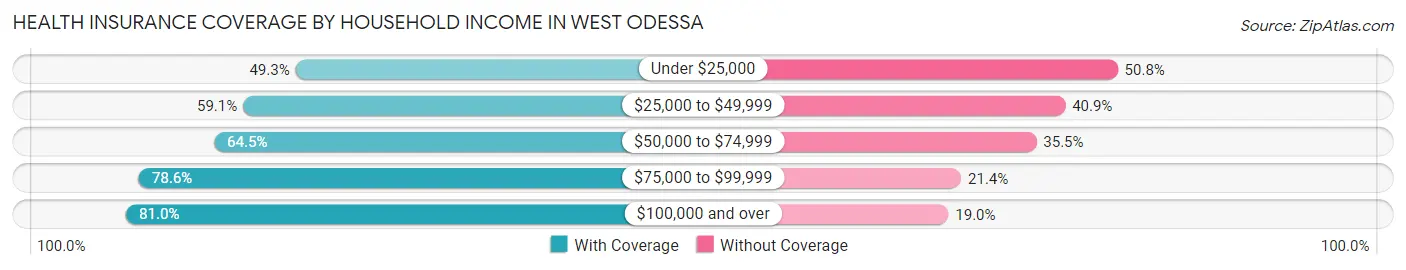
| Household Income | With Coverage | Without Coverage |
| Under $25,000 | 2,256 (49.2%) | 2,325 (50.7%) |
| $25,000 to $49,999 | 2,808 (59.1%) | 1,945 (40.9%) |
| $50,000 to $74,999 | 3,751 (64.5%) | 2,066 (35.5%) |
| $75,000 to $99,999 | 2,355 (78.6%) | 642 (21.4%) |
| $100,000 and over | 10,297 (81.0%) | 2,420 (19.0%) |
Public vs Private Health Insurance Coverage by Age in West Odessa
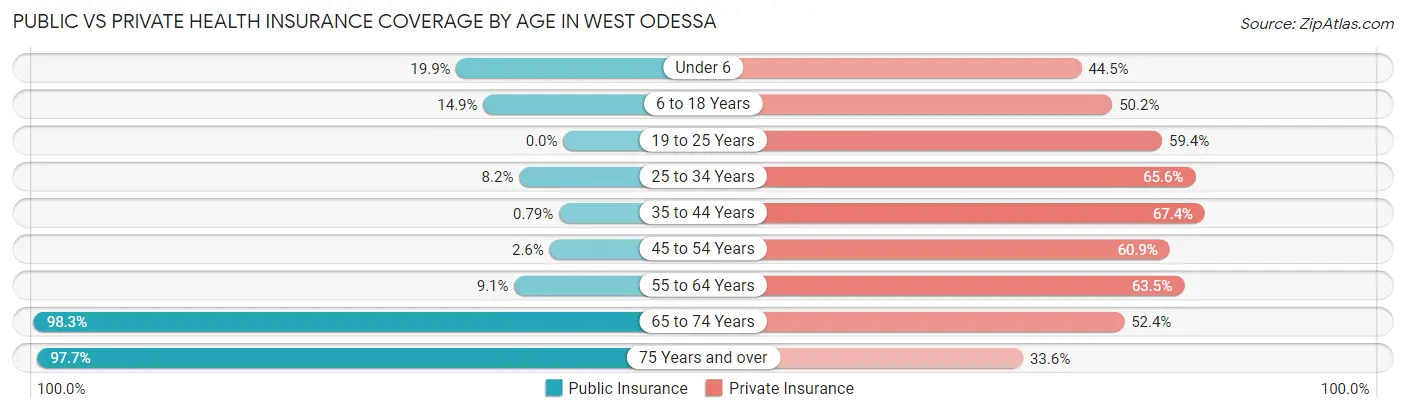
| Age Bracket | Public Insurance | Private Insurance |
| Under 6 | 575 (19.9%) | 1,288 (44.5%) |
| 6 to 18 Years | 1,053 (14.8%) | 3,559 (50.2%) |
| 19 to 25 Years | 0 (0.0%) | 1,621 (59.4%) |
| 25 to 34 Years | 349 (8.2%) | 2,795 (65.6%) |
| 35 to 44 Years | 35 (0.8%) | 2,979 (67.4%) |
| 45 to 54 Years | 93 (2.5%) | 2,224 (60.9%) |
| 55 to 64 Years | 240 (9.1%) | 1,676 (63.5%) |
| 65 to 74 Years | 1,824 (98.3%) | 973 (52.4%) |
| 75 Years and over | 1,330 (97.7%) | 458 (33.6%) |
| Total | 5,499 (17.8%) | 17,573 (56.9%) |
Disability Status by Sex by Age in West Odessa
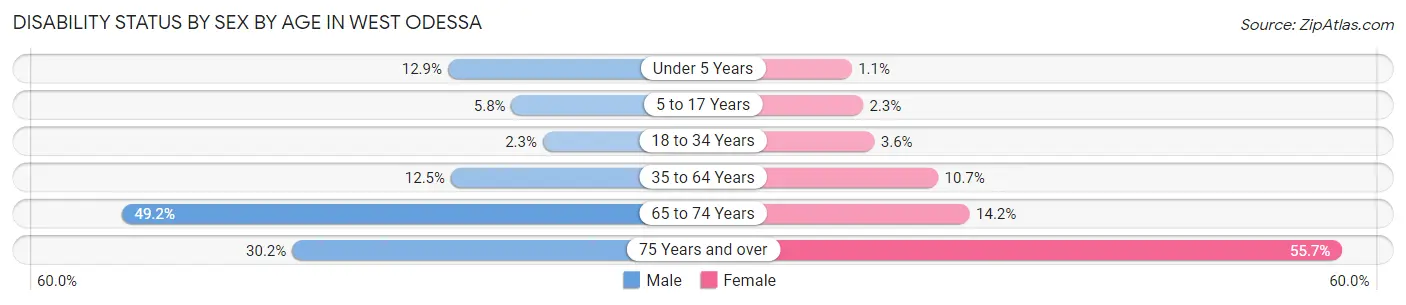
| Age Bracket | Male | Female |
| Under 5 Years | 176 (12.9%) | 9 (1.1%) |
| 5 to 17 Years | 205 (5.8%) | 88 (2.3%) |
| 18 to 34 Years | 86 (2.3%) | 129 (3.6%) |
| 35 to 64 Years | 708 (12.5%) | 540 (10.7%) |
| 65 to 74 Years | 431 (49.2%) | 139 (14.2%) |
| 75 Years and over | 245 (30.2%) | 307 (55.7%) |
Disability Class by Sex by Age in West Odessa
Disability Class: Hearing Difficulty
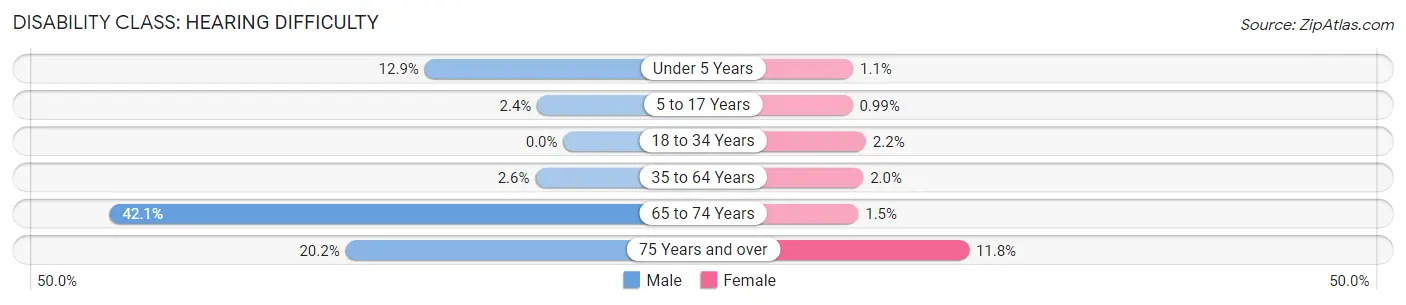
| Age Bracket | Male | Female |
| Under 5 Years | 176 (12.9%) | 9 (1.1%) |
| 5 to 17 Years | 86 (2.4%) | 38 (1.0%) |
| 18 to 34 Years | 0 (0.0%) | 81 (2.2%) |
| 35 to 64 Years | 147 (2.6%) | 101 (2.0%) |
| 65 to 74 Years | 369 (42.1%) | 15 (1.5%) |
| 75 Years and over | 164 (20.2%) | 65 (11.8%) |
Disability Class: Vision Difficulty
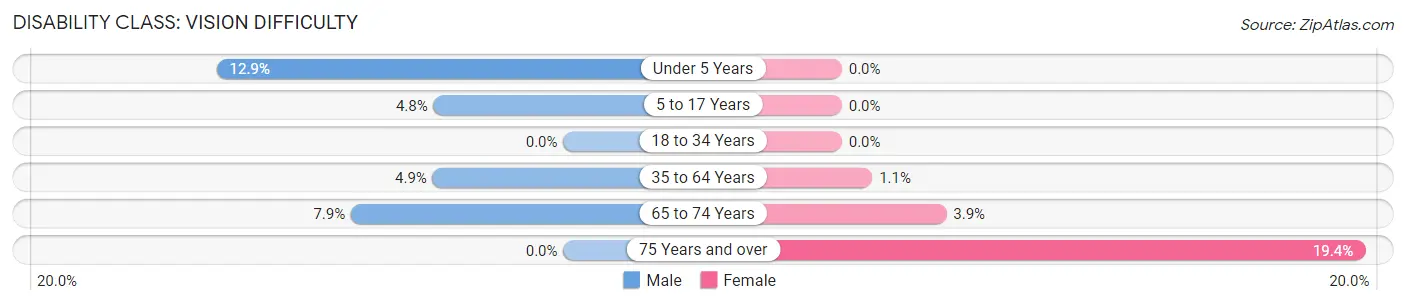
| Age Bracket | Male | Female |
| Under 5 Years | 176 (12.9%) | 0 (0.0%) |
| 5 to 17 Years | 171 (4.8%) | 0 (0.0%) |
| 18 to 34 Years | 0 (0.0%) | 0 (0.0%) |
| 35 to 64 Years | 274 (4.9%) | 57 (1.1%) |
| 65 to 74 Years | 69 (7.9%) | 38 (3.9%) |
| 75 Years and over | 0 (0.0%) | 107 (19.4%) |
Disability Class: Cognitive Difficulty
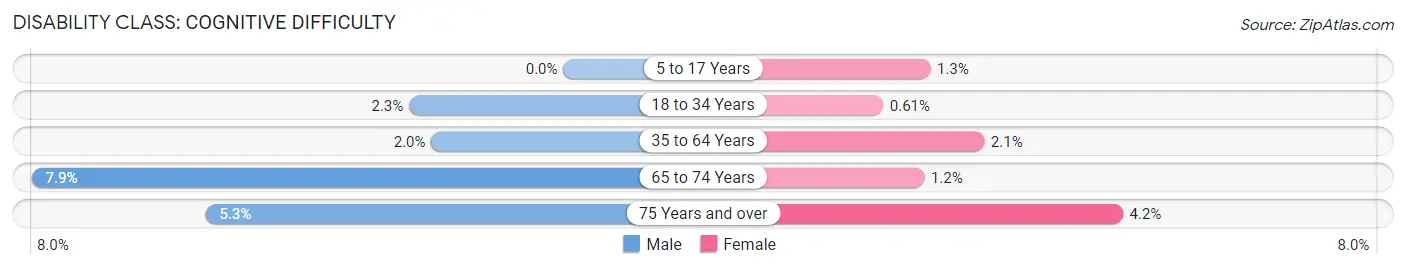
| Age Bracket | Male | Female |
| 5 to 17 Years | 0 (0.0%) | 50 (1.3%) |
| 18 to 34 Years | 86 (2.3%) | 22 (0.6%) |
| 35 to 64 Years | 111 (2.0%) | 107 (2.1%) |
| 65 to 74 Years | 69 (7.9%) | 12 (1.2%) |
| 75 Years and over | 43 (5.3%) | 23 (4.2%) |
Disability Class: Ambulatory Difficulty
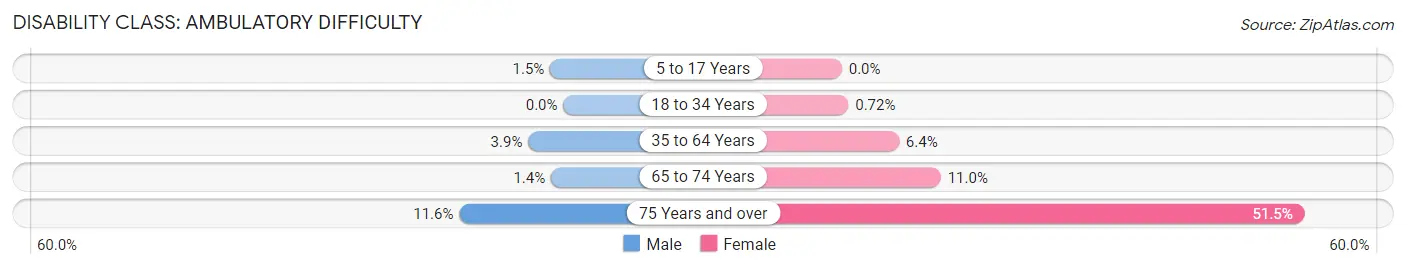
| Age Bracket | Male | Female |
| 5 to 17 Years | 52 (1.5%) | 0 (0.0%) |
| 18 to 34 Years | 0 (0.0%) | 26 (0.7%) |
| 35 to 64 Years | 221 (3.9%) | 322 (6.4%) |
| 65 to 74 Years | 12 (1.4%) | 108 (11.0%) |
| 75 Years and over | 94 (11.6%) | 284 (51.5%) |
Disability Class: Self-Care Difficulty
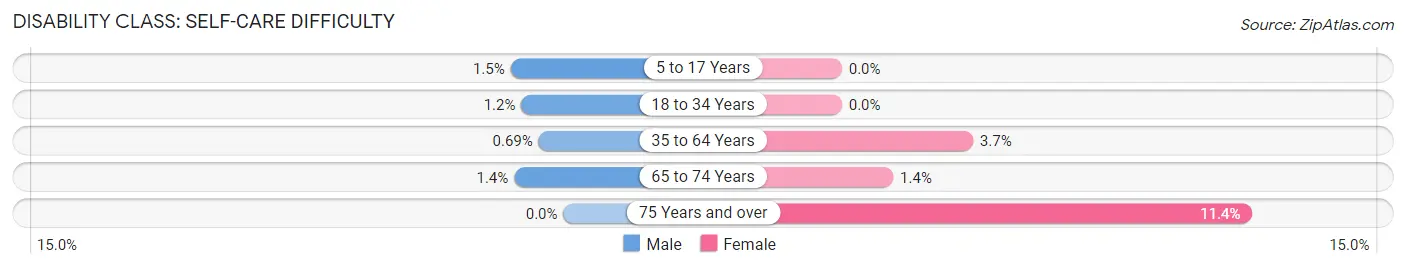
| Age Bracket | Male | Female |
| 5 to 17 Years | 52 (1.5%) | 0 (0.0%) |
| 18 to 34 Years | 44 (1.2%) | 0 (0.0%) |
| 35 to 64 Years | 39 (0.7%) | 185 (3.6%) |
| 65 to 74 Years | 12 (1.4%) | 14 (1.4%) |
| 75 Years and over | 0 (0.0%) | 63 (11.4%) |
Technology Access in West Odessa
Computing Device Access in West Odessa
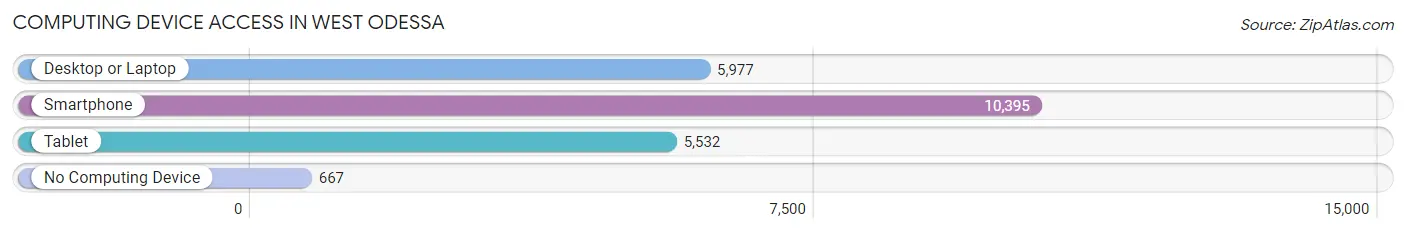
| Device Type | # Households | % Households |
| Desktop or Laptop | 5,977 | 53.4% |
| Smartphone | 10,395 | 92.9% |
| Tablet | 5,532 | 49.4% |
| No Computing Device | 667 | 6.0% |
| Total | 11,190 | 100.0% |
Internet Access in West Odessa
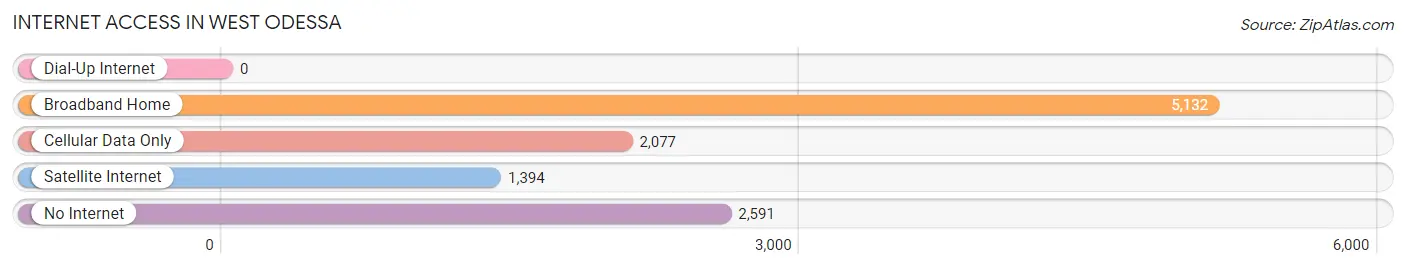
| Internet Type | # Households | % Households |
| Dial-Up Internet | 0 | 0.0% |
| Broadband Home | 5,132 | 45.9% |
| Cellular Data Only | 2,077 | 18.6% |
| Satellite Internet | 1,394 | 12.5% |
| No Internet | 2,591 | 23.2% |
| Total | 11,190 | 100.0% |
West Odessa Summary
West Odessa is a city located in Ector County, Texas, United States. It is part of the Odessa Metropolitan Statistical Area. The population was 11,811 at the 2010 census.
History
West Odessa was founded in the early 1900s as a farming community. The area was originally known as "Westfield" and was located on the western edge of Odessa. The name was changed to West Odessa in the 1920s when the city of Odessa was incorporated.
The city was officially incorporated in 1967. The city has grown steadily since then, and today is home to a variety of businesses, including oil and gas production, manufacturing, and retail.
Geography
West Odessa is located at 31 51 25 North 102 25 45 West 31 856944 102 429167
According to the United States Census Bureau, the city has a total area of 8.3 square miles (21.5 km2), all of it land.
Economy
West Odessa is home to a variety of businesses, including oil and gas production, manufacturing, and retail. The city is also home to several large employers, including the University of Texas of the Permian Basin, Odessa College, and the Ector County Independent School District.
Demographics
As of the census of 2000, there were 11,811 people, 4,072 households, and 3,072 families residing in the city. The population density was 1,421.3 people per square mile (548.7/km2). There were 4,521 housing units at an average density of 545.2 per square mile (210.3/km2). The racial makeup of the city was 75.2% White, 5.2% African American, 0.7% Native American, 0.7% Asian, 0.1% Pacific Islander, 15.7% from other races, and 2.4% from two or more races. Hispanic or Latino of any race were 33.2% of the population.
There were 4,072 households, out of which 41.2% had children under the age of 18 living with them, 56.2% were married couples living together, 14.2% had a female householder with no husband present, and 24.2% were non-families. 20.2% of all households were made up of individuals, and 8.2% had someone living alone who was 65 years of age or older. The average household size was 2.90 and the average family size was 3.37.
In the city, the population was spread out, with 32.2% under the age of 18, 10.2% from 18 to 24, 28.2% from 25 to 44, 19.2% from 45 to 64, and 10.2% who were 65 years of age or older. The median age was 31 years. For every 100 females, there were 95.2 males. For every 100 females age 18 and over, there were 91.2 males.
The median income for a household in the city was $30,945, and the median income for a family was $34,917. Males had a median income of $30,945 versus $20,917 for females. The per capita income for the city was $14,845. About 16.2% of families and 19.2% of the population were below the poverty line, including 25.2% of those under age 18 and 11.2% of those age 65 or over.
Common Questions
What is Per Capita Income in West Odessa?
Per Capita income in West Odessa is $32,324.
What is the Median Family Income in West Odessa?
Median Family Income in West Odessa is $75,455.
What is the Median Household income in West Odessa?
Median Household Income in West Odessa is $63,207.
What is Income or Wage Gap in West Odessa?
Income or Wage Gap in West Odessa is 36.9%.
Women in West Odessa earn 63.1 cents for every dollar earned by a man.
What is Inequality or Gini Index in West Odessa?
Inequality or Gini Index in West Odessa is 0.48.
What is the Total Population of West Odessa?
Total Population of West Odessa is 30,904.
What is the Total Male Population of West Odessa?
Total Male Population of West Odessa is 16,013.
What is the Total Female Population of West Odessa?
Total Female Population of West Odessa is 14,891.
What is the Ratio of Males per 100 Females in West Odessa?
There are 107.53 Males per 100 Females in West Odessa.
What is the Ratio of Females per 100 Males in West Odessa?
There are 92.99 Females per 100 Males in West Odessa.
What is the Median Population Age in West Odessa?
Median Population Age in West Odessa is 32.9 Years.
What is the Average Family Size in West Odessa
Average Family Size in West Odessa is 3.4 People.
What is the Average Household Size in West Odessa
Average Household Size in West Odessa is 2.8 People.
How Large is the Labor Force in West Odessa?
There are 14,504 People in the Labor Forcein in West Odessa.
What is the Percentage of People in the Labor Force in West Odessa?
65.5% of People are in the Labor Force in West Odessa.
What is the Unemployment Rate in West Odessa?
Unemployment Rate in West Odessa is 5.0%.