Winchester, NV Map & Demographics
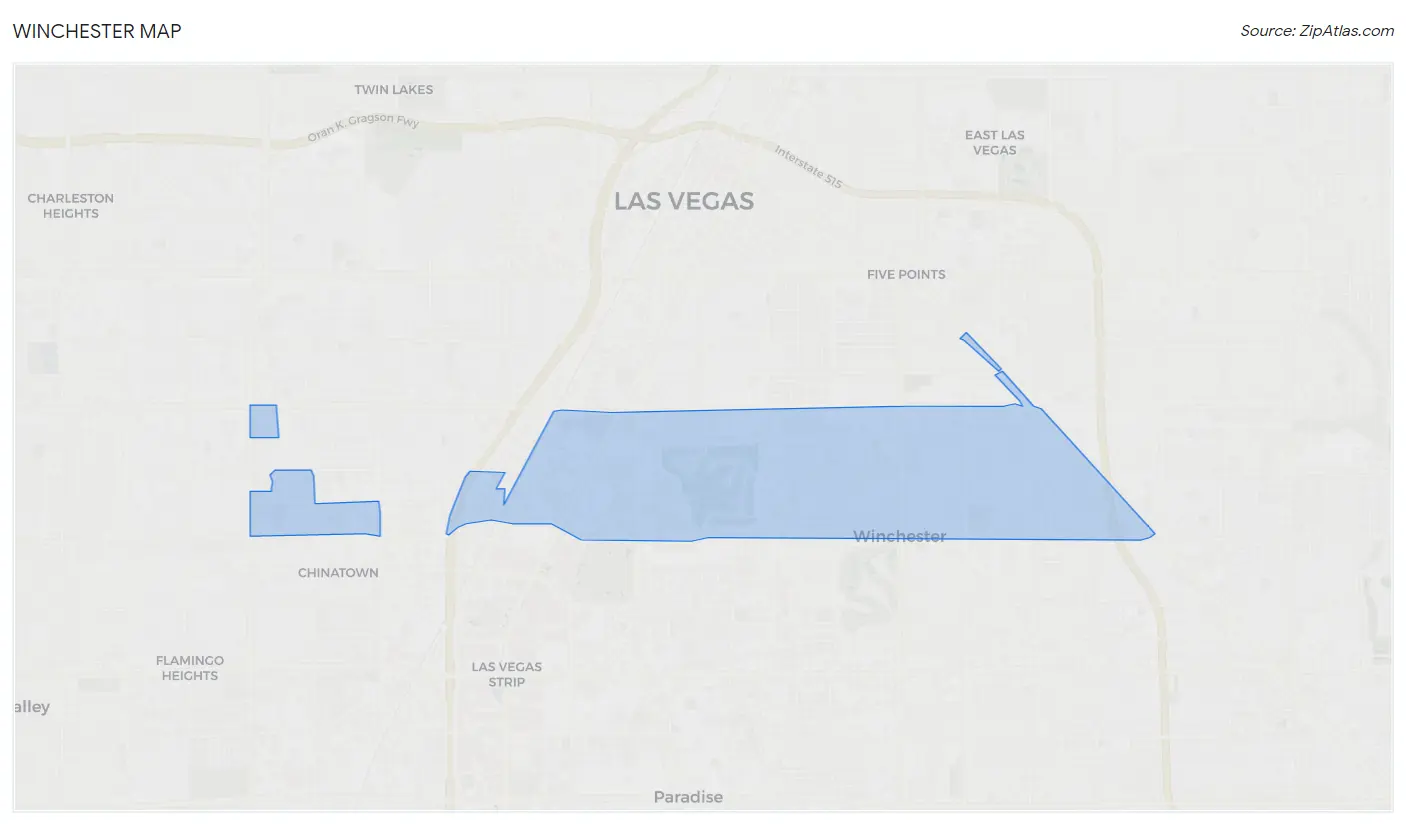
Winchester Map
Winchester Overview
$27,047
PER CAPITA INCOME
$48,613
AVG FAMILY INCOME
$45,709
AVG HOUSEHOLD INCOME
10.3%
WAGE / INCOME GAP [ % ]
89.7¢/ $1
WAGE / INCOME GAP [ $ ]
$11,692
FAMILY INCOME DEFICIT
0.49
INEQUALITY / GINI INDEX
37,531
TOTAL POPULATION
20,113
MALE POPULATION
17,418
FEMALE POPULATION
115.47
MALES / 100 FEMALES
86.60
FEMALES / 100 MALES
35.3
MEDIAN AGE
3.4
AVG FAMILY SIZE
2.6
AVG HOUSEHOLD SIZE
18,751
LABOR FORCE [ PEOPLE ]
63.6%
PERCENT IN LABOR FORCE
8.4%
UNEMPLOYMENT RATE
Income in Winchester
Income Overview in Winchester
Per Capita Income in Winchester is $27,047, while median incomes of families and households are $48,613 and $45,709 respectively.
| Characteristic | Number | Measure |
| Per Capita Income | 37,531 | $27,047 |
| Median Family Income | 7,994 | $48,613 |
| Mean Family Income | 7,994 | $69,946 |
| Median Household Income | 14,592 | $45,709 |
| Mean Household Income | 14,592 | $67,310 |
| Income Deficit | 7,994 | $11,692 |
| Wage / Income Gap (%) | 37,531 | 10.31% |
| Wage / Income Gap ($) | 37,531 | 89.69¢ per $1 |
| Gini / Inequality Index | 37,531 | 0.49 |
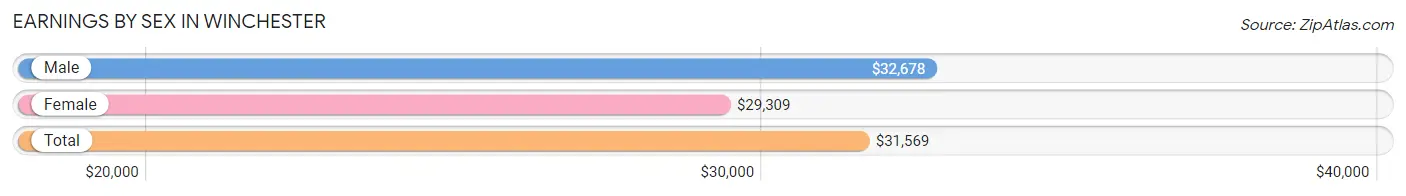
Earnings by Sex in Winchester
Average Earnings in Winchester are $31,569, $32,678 for men and $29,309 for women, a difference of 10.3%.
| Sex | Number | Average Earnings |
| Male | 11,293 (58.9%) | $32,678 |
| Female | 7,877 (41.1%) | $29,309 |
| Total | 19,170 (100.0%) | $31,569 |
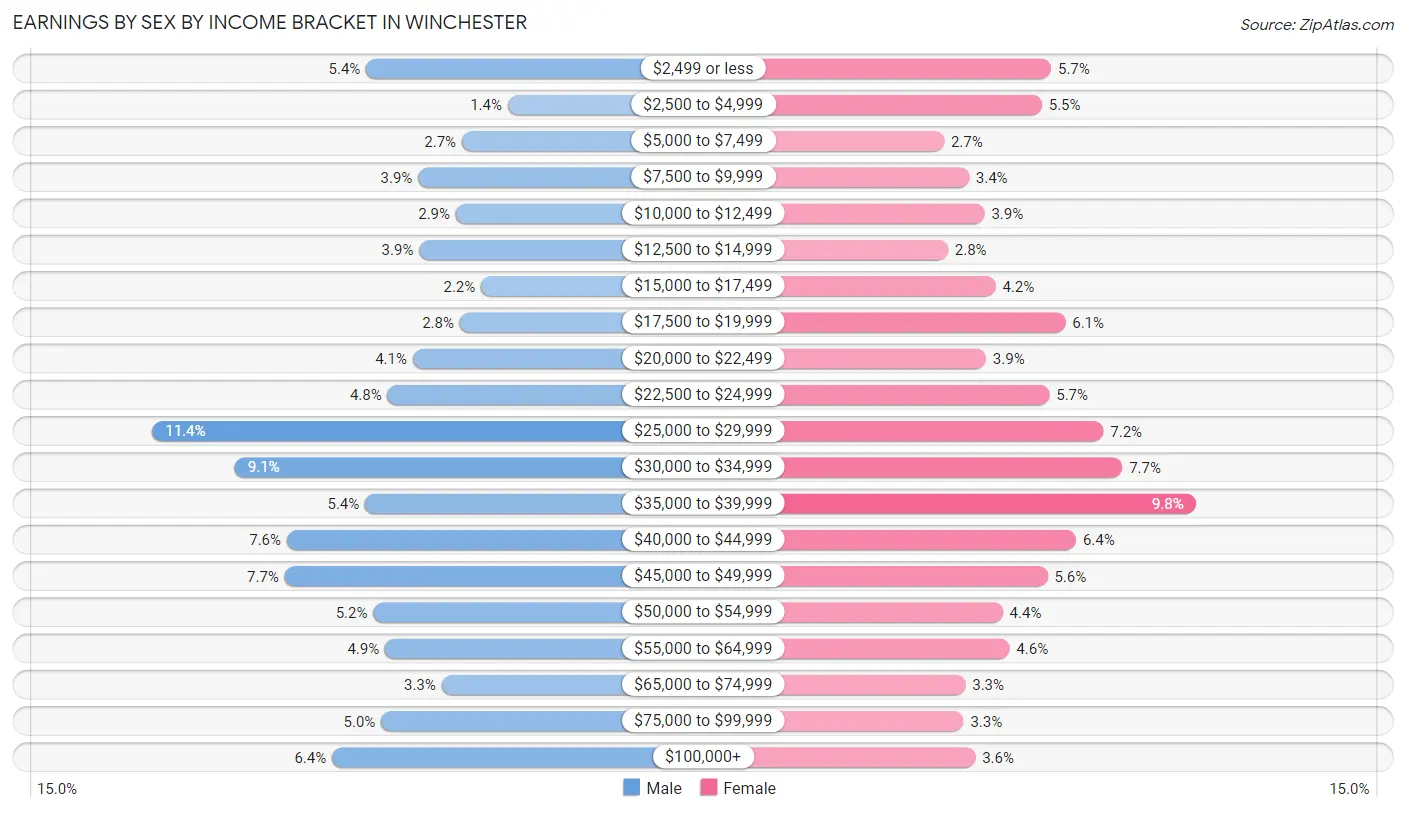
Earnings by Sex by Income Bracket in Winchester
The most common earnings brackets in Winchester are $25,000 to $29,999 for men (1,288 | 11.4%) and $35,000 to $39,999 for women (772 | 9.8%).
| Income | Male | Female |
| $2,499 or less | 610 (5.4%) | 452 (5.7%) |
| $2,500 to $4,999 | 160 (1.4%) | 432 (5.5%) |
| $5,000 to $7,499 | 306 (2.7%) | 215 (2.7%) |
| $7,500 to $9,999 | 445 (3.9%) | 270 (3.4%) |
| $10,000 to $12,499 | 325 (2.9%) | 305 (3.9%) |
| $12,500 to $14,999 | 441 (3.9%) | 224 (2.8%) |
| $15,000 to $17,499 | 245 (2.2%) | 329 (4.2%) |
| $17,500 to $19,999 | 313 (2.8%) | 484 (6.1%) |
| $20,000 to $22,499 | 462 (4.1%) | 308 (3.9%) |
| $22,500 to $24,999 | 542 (4.8%) | 448 (5.7%) |
| $25,000 to $29,999 | 1,288 (11.4%) | 568 (7.2%) |
| $30,000 to $34,999 | 1,026 (9.1%) | 610 (7.7%) |
| $35,000 to $39,999 | 613 (5.4%) | 772 (9.8%) |
| $40,000 to $44,999 | 862 (7.6%) | 507 (6.4%) |
| $45,000 to $49,999 | 868 (7.7%) | 444 (5.6%) |
| $50,000 to $54,999 | 587 (5.2%) | 345 (4.4%) |
| $55,000 to $64,999 | 550 (4.9%) | 360 (4.6%) |
| $65,000 to $74,999 | 370 (3.3%) | 262 (3.3%) |
| $75,000 to $99,999 | 562 (5.0%) | 258 (3.3%) |
| $100,000+ | 718 (6.4%) | 284 (3.6%) |
| Total | 11,293 (100.0%) | 7,877 (100.0%) |
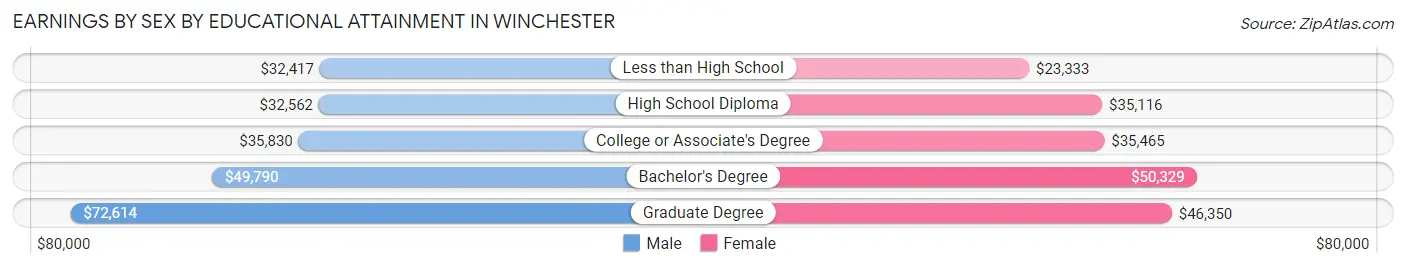
Earnings by Sex by Educational Attainment in Winchester
Average earnings in Winchester are $35,370 for men and $33,938 for women, a difference of 4.1%. Men with an educational attainment of graduate degree enjoy the highest average annual earnings of $72,614, while those with less than high school education earn the least with $32,417. Women with an educational attainment of bachelor's degree earn the most with the average annual earnings of $50,329, while those with less than high school education have the smallest earnings of $23,333.
| Educational Attainment | Male Income | Female Income |
| Less than High School | $32,417 | $23,333 |
| High School Diploma | $32,562 | $35,116 |
| College or Associate's Degree | $35,830 | $35,465 |
| Bachelor's Degree | $49,790 | $50,329 |
| Graduate Degree | $72,614 | $46,350 |
| Total | $35,370 | $33,938 |
Family Income in Winchester
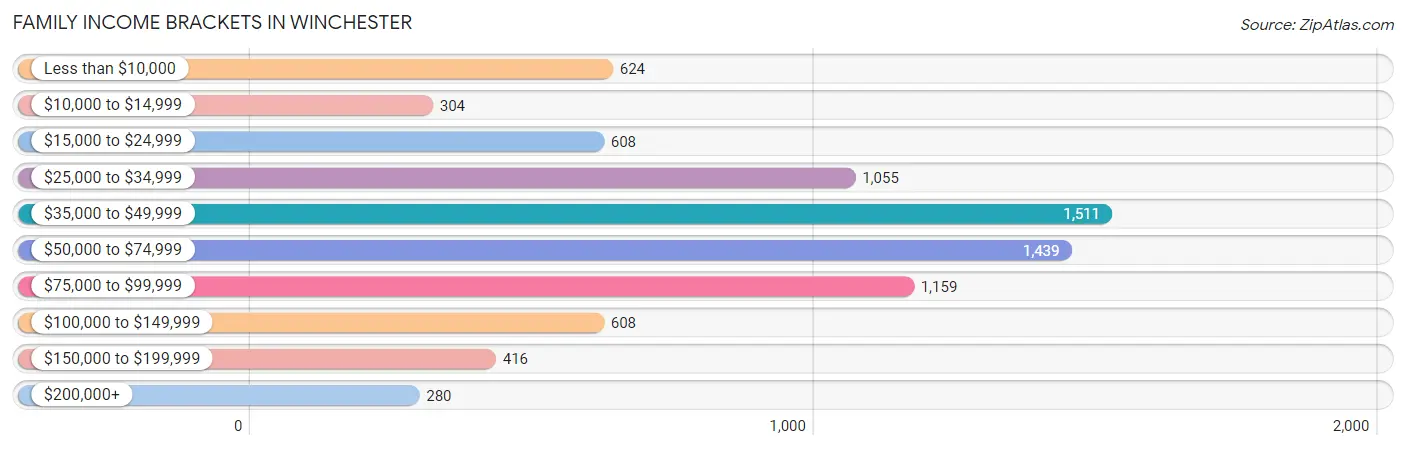
Family Income Brackets in Winchester
According to the Winchester family income data, there are 1,511 families falling into the $35,000 to $49,999 income range, which is the most common income bracket and makes up 18.9% of all families. Conversely, the $200,000+ income bracket is the least frequent group with only 280 families (3.5%) belonging to this category.
| Income Bracket | # Families | % Families |
| Less than $10,000 | 624 | 7.8% |
| $10,000 to $14,999 | 304 | 3.8% |
| $15,000 to $24,999 | 608 | 7.6% |
| $25,000 to $34,999 | 1,055 | 13.2% |
| $35,000 to $49,999 | 1,511 | 18.9% |
| $50,000 to $74,999 | 1,439 | 18.0% |
| $75,000 to $99,999 | 1,159 | 14.5% |
| $100,000 to $149,999 | 608 | 7.6% |
| $150,000 to $199,999 | 416 | 5.2% |
| $200,000+ | 280 | 3.5% |
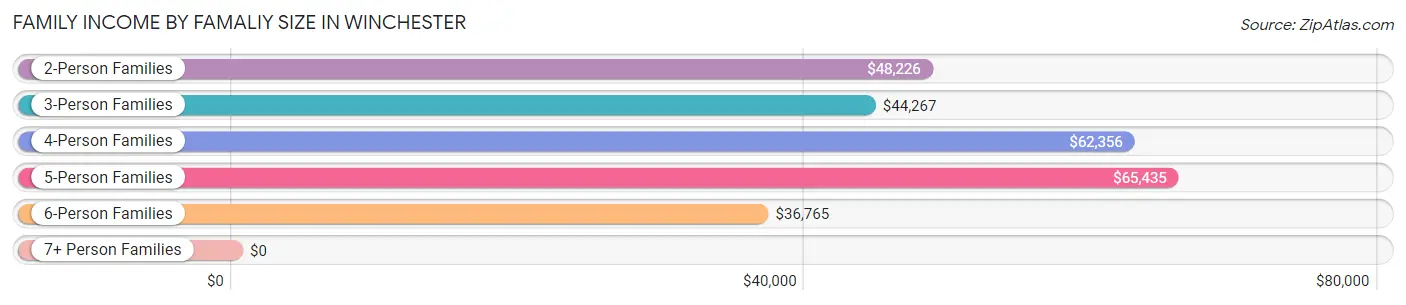
Family Income by Famaliy Size in Winchester
5-person families (746 | 9.3%) account for the highest median family income in Winchester with $65,435 per family, while 2-person families (3,855 | 48.2%) have the highest median income of $24,113 per family member.
| Income Bracket | # Families | Median Income |
| 2-Person Families | 3,855 (48.2%) | $48,226 |
| 3-Person Families | 1,636 (20.5%) | $44,267 |
| 4-Person Families | 1,121 (14.0%) | $62,356 |
| 5-Person Families | 746 (9.3%) | $65,435 |
| 6-Person Families | 374 (4.7%) | $36,765 |
| 7+ Person Families | 262 (3.3%) | $0 |
| Total | 7,994 (100.0%) | $48,613 |
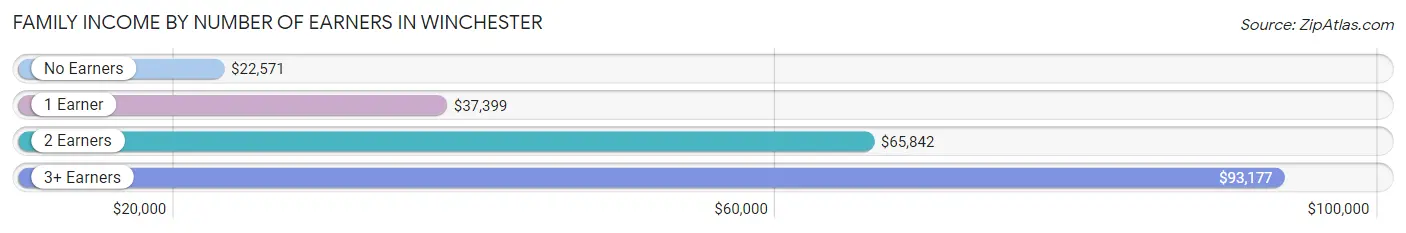
Family Income by Number of Earners in Winchester
The median family income in Winchester is $48,613, with families comprising 3+ earners (735) having the highest median family income of $93,177, while families with no earners (1,291) have the lowest median family income of $22,571, accounting for 9.2% and 16.2% of families, respectively.
| Number of Earners | # Families | Median Income |
| No Earners | 1,291 (16.2%) | $22,571 |
| 1 Earner | 3,080 (38.5%) | $37,399 |
| 2 Earners | 2,888 (36.1%) | $65,842 |
| 3+ Earners | 735 (9.2%) | $93,177 |
| Total | 7,994 (100.0%) | $48,613 |
Household Income in Winchester
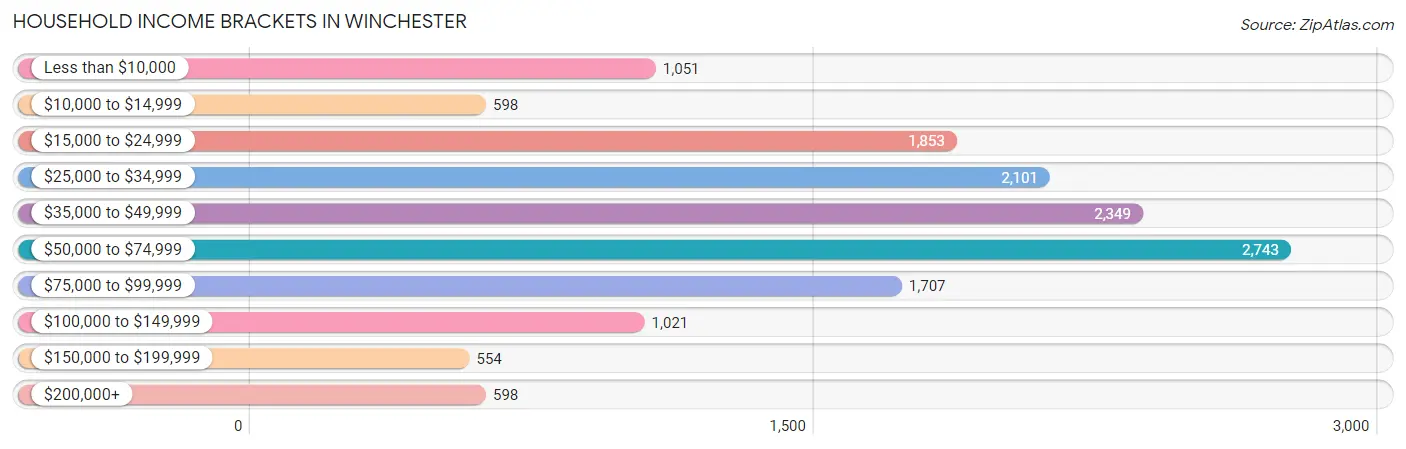
Household Income Brackets in Winchester
With 2,743 households falling in the category, the $50,000 to $74,999 income range is the most frequent in Winchester, accounting for 18.8% of all households. In contrast, only 554 households (3.8%) fall into the $150,000 to $199,999 income bracket, making it the least populous group.
| Income Bracket | # Households | % Households |
| Less than $10,000 | 1,051 | 7.2% |
| $10,000 to $14,999 | 598 | 4.1% |
| $15,000 to $24,999 | 1,853 | 12.7% |
| $25,000 to $34,999 | 2,101 | 14.4% |
| $35,000 to $49,999 | 2,349 | 16.1% |
| $50,000 to $74,999 | 2,743 | 18.8% |
| $75,000 to $99,999 | 1,707 | 11.7% |
| $100,000 to $149,999 | 1,021 | 7.0% |
| $150,000 to $199,999 | 554 | 3.8% |
| $200,000+ | 598 | 4.1% |
Household Income by Householder Age in Winchester
The median household income in Winchester is $45,709, with the highest median household income of $47,917 found in the 45 to 64 years age bracket for the primary householder. A total of 5,410 households (37.1%) fall into this category. Meanwhile, the 15 to 24 years age bracket for the primary householder has the lowest median household income of $31,625, with 851 households (5.8%) in this group.
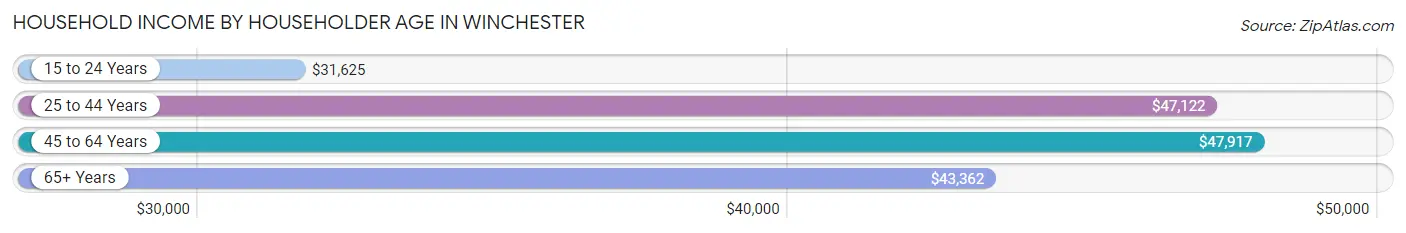
| Income Bracket | # Households | Median Income |
| 15 to 24 Years | 851 (5.8%) | $31,625 |
| 25 to 44 Years | 5,323 (36.5%) | $47,122 |
| 45 to 64 Years | 5,410 (37.1%) | $47,917 |
| 65+ Years | 3,008 (20.6%) | $43,362 |
| Total | 14,592 (100.0%) | $45,709 |
Poverty in Winchester
Income Below Poverty by Sex and Age in Winchester
With 21.5% poverty level for males and 29.1% for females among the residents of Winchester, 15 year old males and 5 year old females are the most vulnerable to poverty, with 136 males (66.3%) and 217 females (53.3%) in their respective age groups living below the poverty level.
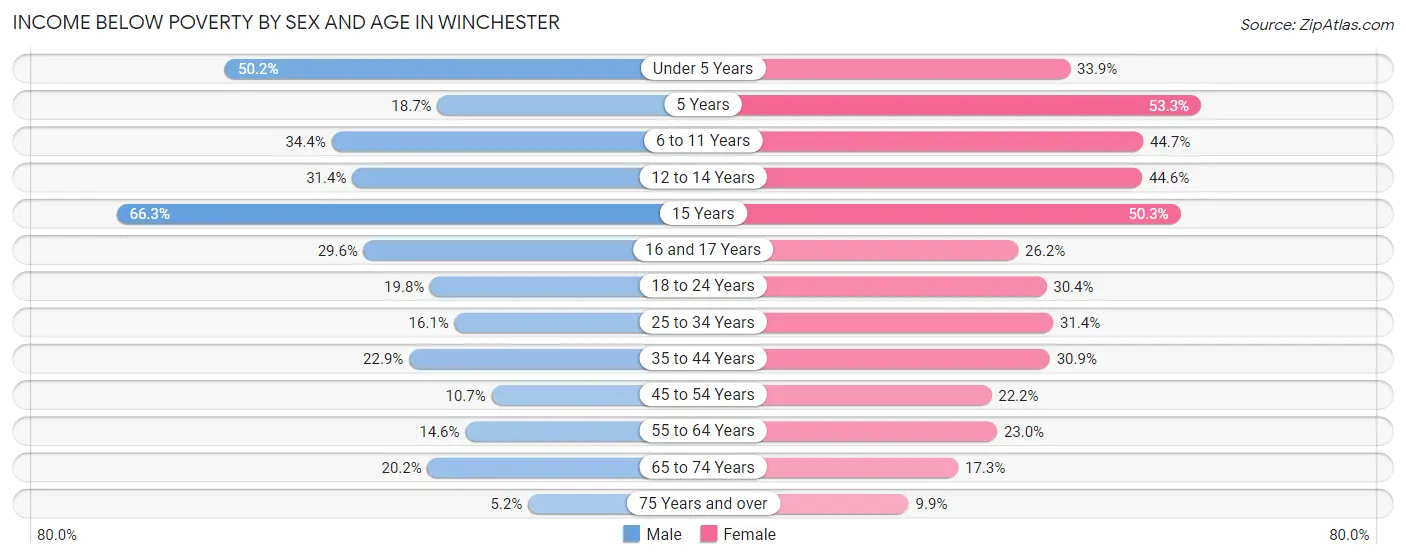
| Age Bracket | Male | Female |
| Under 5 Years | 579 (50.2%) | 338 (33.9%) |
| 5 Years | 49 (18.7%) | 217 (53.3%) |
| 6 to 11 Years | 543 (34.4%) | 641 (44.7%) |
| 12 to 14 Years | 306 (31.4%) | 313 (44.6%) |
| 15 Years | 136 (66.3%) | 89 (50.3%) |
| 16 and 17 Years | 155 (29.6%) | 89 (26.2%) |
| 18 to 24 Years | 387 (19.8%) | 529 (30.4%) |
| 25 to 34 Years | 548 (16.1%) | 797 (31.4%) |
| 35 to 44 Years | 595 (22.9%) | 655 (30.9%) |
| 45 to 54 Years | 290 (10.7%) | 635 (22.2%) |
| 55 to 64 Years | 321 (14.5%) | 417 (23.0%) |
| 65 to 74 Years | 361 (20.2%) | 218 (17.3%) |
| 75 Years and over | 37 (5.2%) | 83 (9.9%) |
| Total | 4,307 (21.5%) | 5,021 (29.1%) |
Income Above Poverty by Sex and Age in Winchester
According to the poverty statistics in Winchester, males aged 75 years and over and females aged 75 years and over are the age groups that are most secure financially, with 94.8% of males and 90.1% of females in these age groups living above the poverty line.
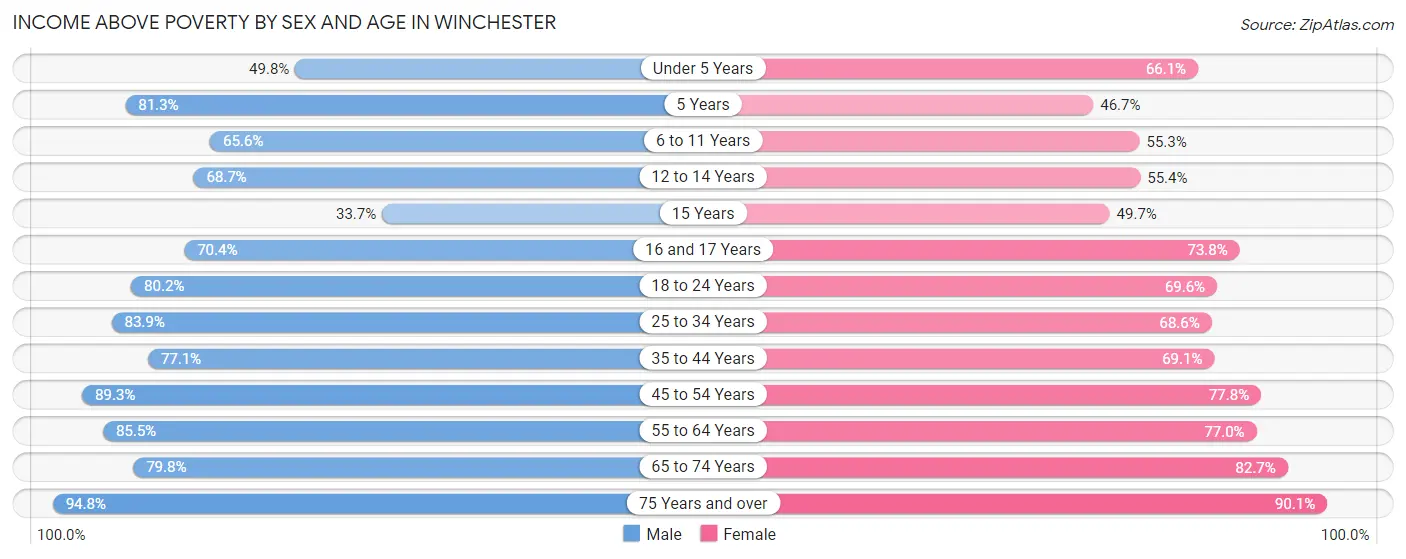
| Age Bracket | Male | Female |
| Under 5 Years | 574 (49.8%) | 659 (66.1%) |
| 5 Years | 213 (81.3%) | 190 (46.7%) |
| 6 to 11 Years | 1,034 (65.6%) | 792 (55.3%) |
| 12 to 14 Years | 670 (68.6%) | 389 (55.4%) |
| 15 Years | 69 (33.7%) | 88 (49.7%) |
| 16 and 17 Years | 368 (70.4%) | 251 (73.8%) |
| 18 to 24 Years | 1,570 (80.2%) | 1,213 (69.6%) |
| 25 to 34 Years | 2,848 (83.9%) | 1,744 (68.6%) |
| 35 to 44 Years | 2,003 (77.1%) | 1,466 (69.1%) |
| 45 to 54 Years | 2,431 (89.3%) | 2,225 (77.8%) |
| 55 to 64 Years | 1,885 (85.5%) | 1,393 (77.0%) |
| 65 to 74 Years | 1,429 (79.8%) | 1,045 (82.7%) |
| 75 Years and over | 672 (94.8%) | 753 (90.1%) |
| Total | 15,766 (78.5%) | 12,208 (70.9%) |
Income Below Poverty Among Married-Couple Families in Winchester
The poverty statistics for married-couple families in Winchester show that 17.5% or 685 of the total 3,917 families live below the poverty line. Families with 5 or more children have the highest poverty rate of 100.0%, comprising of 101 families. On the other hand, families with no children have the lowest poverty rate of 9.8%, which includes 230 families.
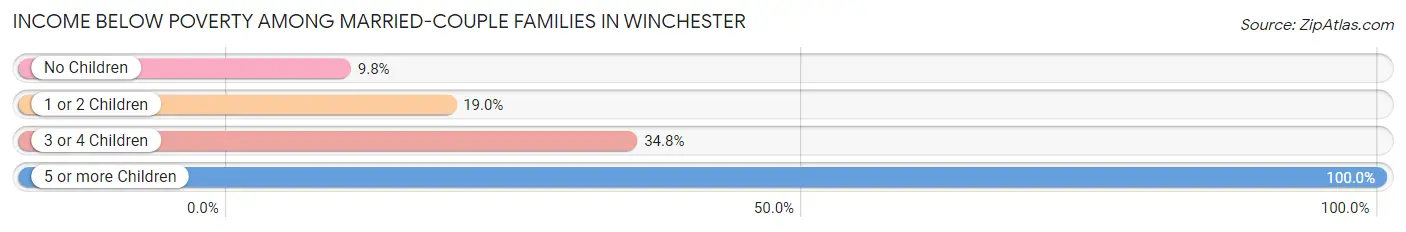
| Children | Above Poverty | Below Poverty |
| No Children | 2,111 (90.2%) | 230 (9.8%) |
| 1 or 2 Children | 815 (81.0%) | 191 (19.0%) |
| 3 or 4 Children | 306 (65.2%) | 163 (34.7%) |
| 5 or more Children | 0 (0.0%) | 101 (100.0%) |
| Total | 3,232 (82.5%) | 685 (17.5%) |
Income Below Poverty Among Single-Parent Households in Winchester
According to the poverty data in Winchester, 16.9% or 252 single-father households and 29.1% or 753 single-mother households are living below the poverty line. Among single-father households, those with 3 or 4 children have the highest poverty rate, with 84 households (73.0%) experiencing poverty. Likewise, among single-mother households, those with 3 or 4 children have the highest poverty rate, with 205 households (49.9%) falling below the poverty line.
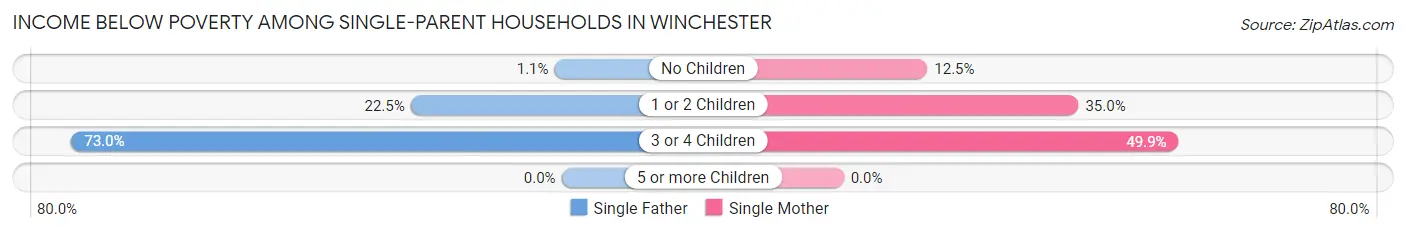
| Children | Single Father | Single Mother |
| No Children | 7 (1.1%) | 118 (12.5%) |
| 1 or 2 Children | 161 (22.5%) | 430 (35.0%) |
| 3 or 4 Children | 84 (73.0%) | 205 (49.9%) |
| 5 or more Children | 0 (0.0%) | 0 (0.0%) |
| Total | 252 (16.9%) | 753 (29.1%) |
Income Below Poverty Among Married-Couple vs Single-Parent Households in Winchester
The poverty data for Winchester shows that 685 of the married-couple family households (17.5%) and 1,005 of the single-parent households (24.6%) are living below the poverty level. Within the married-couple family households, those with 5 or more children have the highest poverty rate, with 101 households (100.0%) falling below the poverty line. Among the single-parent households, those with 3 or 4 children have the highest poverty rate, with 289 household (54.9%) living below poverty.
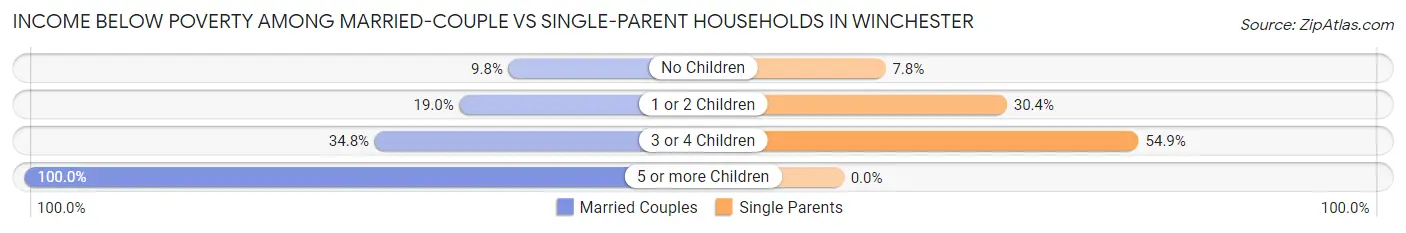
| Children | Married-Couple Families | Single-Parent Households |
| No Children | 230 (9.8%) | 125 (7.8%) |
| 1 or 2 Children | 191 (19.0%) | 591 (30.4%) |
| 3 or 4 Children | 163 (34.7%) | 289 (54.9%) |
| 5 or more Children | 101 (100.0%) | 0 (0.0%) |
| Total | 685 (17.5%) | 1,005 (24.6%) |
Race in Winchester
The most populous races in Winchester are Hispanic or Latino (19,132 | 51.0%), White / Caucasian (12,809 | 34.1%), and Some other Race (9,865 | 26.3%).
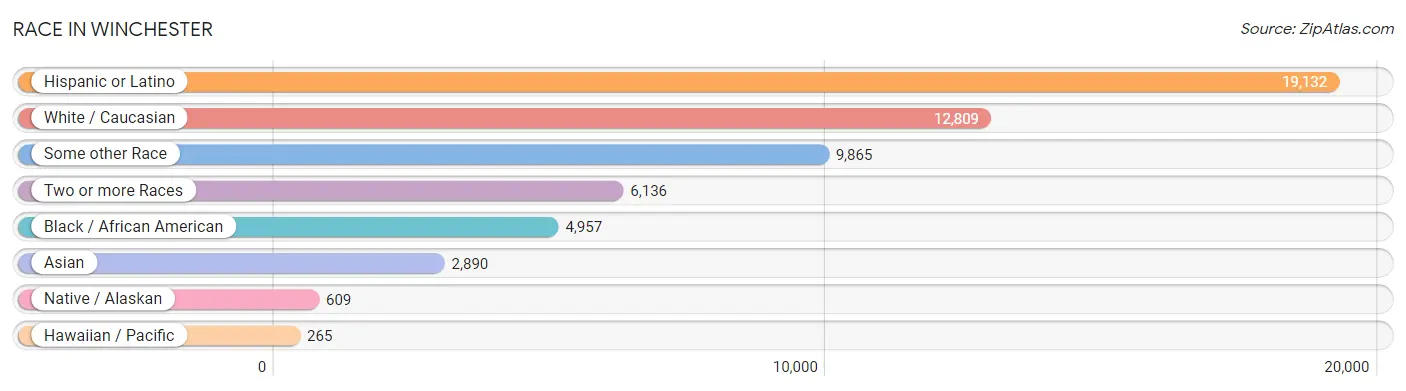
| Race | # Population | % Population |
| Asian | 2,890 | 7.7% |
| Black / African American | 4,957 | 13.2% |
| Hawaiian / Pacific | 265 | 0.7% |
| Hispanic or Latino | 19,132 | 51.0% |
| Native / Alaskan | 609 | 1.6% |
| White / Caucasian | 12,809 | 34.1% |
| Two or more Races | 6,136 | 16.4% |
| Some other Race | 9,865 | 26.3% |
| Total | 37,531 | 100.0% |
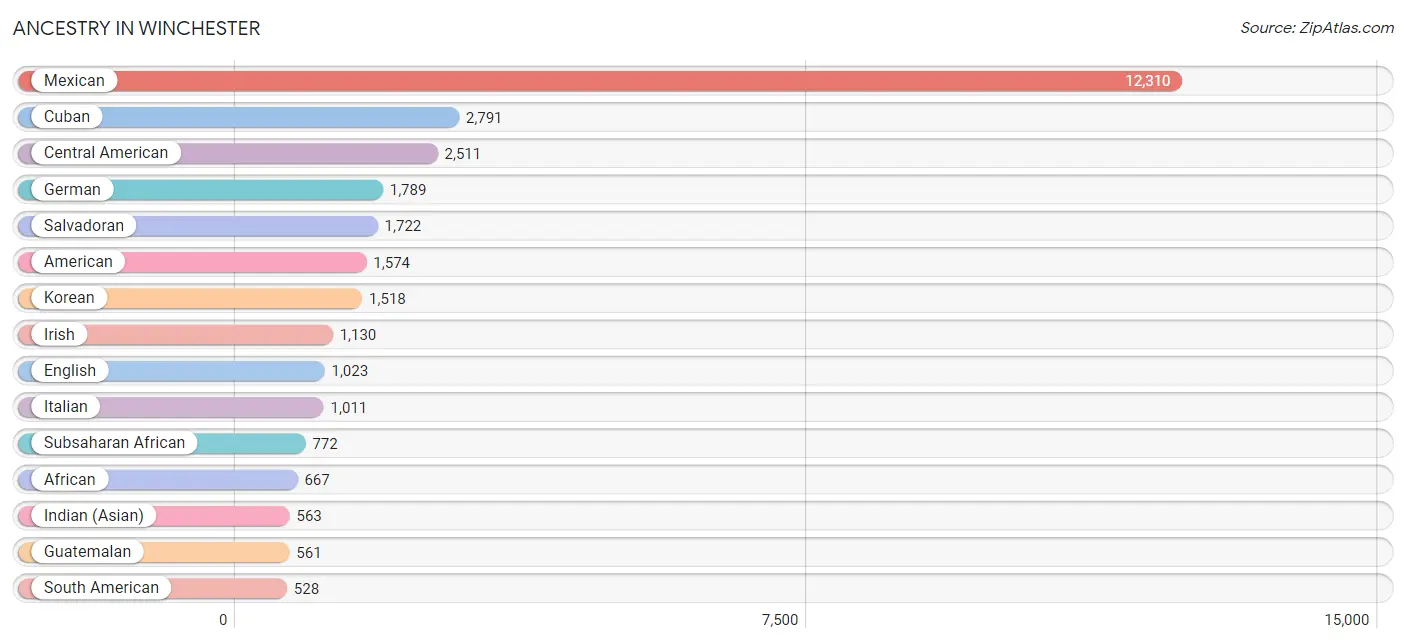
Ancestry in Winchester
The most populous ancestries reported in Winchester are Mexican (12,310 | 32.8%), Cuban (2,791 | 7.4%), Central American (2,511 | 6.7%), German (1,789 | 4.8%), and Salvadoran (1,722 | 4.6%), together accounting for 56.3% of all Winchester residents.
| Ancestry | # Population | % Population |
| African | 667 | 1.8% |
| American | 1,574 | 4.2% |
| Apache | 16 | 0.0% |
| Arab | 55 | 0.2% |
| Argentinean | 18 | 0.1% |
| Armenian | 15 | 0.0% |
| Australian | 5 | 0.0% |
| Austrian | 30 | 0.1% |
| Belizean | 35 | 0.1% |
| Bhutanese | 224 | 0.6% |
| Blackfeet | 79 | 0.2% |
| Brazilian | 12 | 0.0% |
| British | 84 | 0.2% |
| Burmese | 319 | 0.9% |
| Cambodian | 10 | 0.0% |
| Canadian | 89 | 0.2% |
| Central American | 2,511 | 6.7% |
| Central American Indian | 89 | 0.2% |
| Cherokee | 17 | 0.1% |
| Chilean | 37 | 0.1% |
| Colombian | 128 | 0.3% |
| Costa Rican | 36 | 0.1% |
| Croatian | 81 | 0.2% |
| Cuban | 2,791 | 7.4% |
| Czech | 38 | 0.1% |
| Danish | 24 | 0.1% |
| Dominican | 39 | 0.1% |
| Dutch | 113 | 0.3% |
| Eastern European | 23 | 0.1% |
| English | 1,023 | 2.7% |
| Ethiopian | 70 | 0.2% |
| European | 235 | 0.6% |
| Fijian | 16 | 0.0% |
| Filipino | 24 | 0.1% |
| Finnish | 14 | 0.0% |
| French | 517 | 1.4% |
| French Canadian | 15 | 0.0% |
| German | 1,789 | 4.8% |
| Greek | 101 | 0.3% |
| Guamanian / Chamorro | 47 | 0.1% |
| Guatemalan | 561 | 1.5% |
| Haitian | 142 | 0.4% |
| Honduran | 142 | 0.4% |
| Hopi | 52 | 0.1% |
| Hungarian | 87 | 0.2% |
| Indian (Asian) | 563 | 1.5% |
| Iranian | 189 | 0.5% |
| Iraqi | 18 | 0.1% |
| Irish | 1,130 | 3.0% |
| Iroquois | 6 | 0.0% |
| Israeli | 54 | 0.1% |
| Italian | 1,011 | 2.7% |
| Japanese | 10 | 0.0% |
| Korean | 1,518 | 4.0% |
| Laotian | 16 | 0.0% |
| Lithuanian | 15 | 0.0% |
| Malaysian | 248 | 0.7% |
| Mexican | 12,310 | 32.8% |
| Mexican American Indian | 268 | 0.7% |
| Moroccan | 24 | 0.1% |
| Native Hawaiian | 214 | 0.6% |
| Navajo | 23 | 0.1% |
| New Zealander | 25 | 0.1% |
| Nicaraguan | 50 | 0.1% |
| Nigerian | 10 | 0.0% |
| Northern European | 5 | 0.0% |
| Norwegian | 85 | 0.2% |
| Pakistani | 72 | 0.2% |
| Paraguayan | 10 | 0.0% |
| Peruvian | 76 | 0.2% |
| Polish | 284 | 0.8% |
| Portuguese | 97 | 0.3% |
| Pueblo | 7 | 0.0% |
| Puerto Rican | 251 | 0.7% |
| Romanian | 41 | 0.1% |
| Russian | 220 | 0.6% |
| Salvadoran | 1,722 | 4.6% |
| Samoan | 249 | 0.7% |
| Scandinavian | 85 | 0.2% |
| Scotch-Irish | 34 | 0.1% |
| Scottish | 206 | 0.5% |
| Serbian | 88 | 0.2% |
| Shoshone | 106 | 0.3% |
| Sioux | 79 | 0.2% |
| Slovene | 29 | 0.1% |
| South African | 14 | 0.0% |
| South American | 528 | 1.4% |
| Soviet Union | 6 | 0.0% |
| Spaniard | 34 | 0.1% |
| Spanish | 156 | 0.4% |
| Sri Lankan | 145 | 0.4% |
| Subsaharan African | 772 | 2.1% |
| Swedish | 66 | 0.2% |
| Swiss | 74 | 0.2% |
| Syrian | 8 | 0.0% |
| Thai | 152 | 0.4% |
| Trinidadian and Tobagonian | 118 | 0.3% |
| Turkish | 9 | 0.0% |
| Ukrainian | 28 | 0.1% |
| Uruguayan | 84 | 0.2% |
| Venezuelan | 175 | 0.5% |
| Welsh | 90 | 0.2% |
| West Indian | 17 | 0.1% | View All 103 Rows |
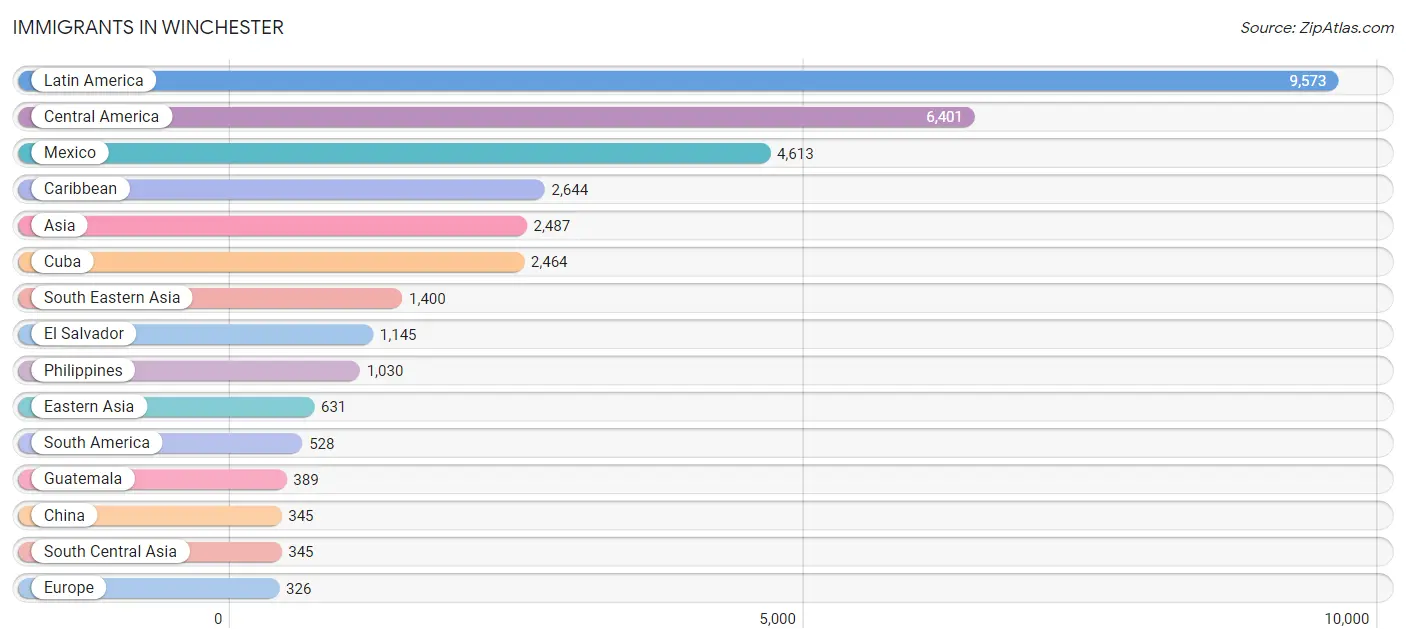
Immigrants in Winchester
The most numerous immigrant groups reported in Winchester came from Latin America (9,573 | 25.5%), Central America (6,401 | 17.1%), Mexico (4,613 | 12.3%), Caribbean (2,644 | 7.0%), and Asia (2,487 | 6.6%), together accounting for 68.5% of all Winchester residents.
| Immigration Origin | # Population | % Population |
| Africa | 256 | 0.7% |
| Argentina | 18 | 0.1% |
| Asia | 2,487 | 6.6% |
| Australia | 13 | 0.0% |
| Austria | 3 | 0.0% |
| Brazil | 75 | 0.2% |
| Cambodia | 18 | 0.1% |
| Canada | 124 | 0.3% |
| Caribbean | 2,644 | 7.0% |
| Central America | 6,401 | 17.1% |
| Chile | 14 | 0.0% |
| China | 345 | 0.9% |
| Colombia | 128 | 0.3% |
| Costa Rica | 31 | 0.1% |
| Croatia | 56 | 0.2% |
| Cuba | 2,464 | 6.6% |
| Eastern Africa | 169 | 0.4% |
| Eastern Asia | 631 | 1.7% |
| Eastern Europe | 176 | 0.5% |
| El Salvador | 1,145 | 3.0% |
| England | 14 | 0.0% |
| Ethiopia | 165 | 0.4% |
| Europe | 326 | 0.9% |
| France | 44 | 0.1% |
| Guatemala | 389 | 1.0% |
| Haiti | 50 | 0.1% |
| Honduras | 148 | 0.4% |
| Hong Kong | 5 | 0.0% |
| Hungary | 9 | 0.0% |
| India | 93 | 0.3% |
| Indonesia | 26 | 0.1% |
| Iran | 166 | 0.4% |
| Ireland | 10 | 0.0% |
| Israel | 86 | 0.2% |
| Italy | 23 | 0.1% |
| Jamaica | 12 | 0.0% |
| Japan | 30 | 0.1% |
| Korea | 235 | 0.6% |
| Laos | 82 | 0.2% |
| Latin America | 9,573 | 25.5% |
| Lebanon | 4 | 0.0% |
| Malaysia | 3 | 0.0% |
| Mexico | 4,613 | 12.3% |
| Middle Africa | 21 | 0.1% |
| Nicaragua | 75 | 0.2% |
| Northern Europe | 67 | 0.2% |
| Norway | 1 | 0.0% |
| Oceania | 174 | 0.5% |
| Pakistan | 75 | 0.2% |
| Peru | 55 | 0.2% |
| Philippines | 1,030 | 2.7% |
| Poland | 22 | 0.1% |
| Romania | 41 | 0.1% |
| Russia | 35 | 0.1% |
| Serbia | 7 | 0.0% |
| South Africa | 14 | 0.0% |
| South America | 528 | 1.4% |
| South Central Asia | 345 | 0.9% |
| South Eastern Asia | 1,400 | 3.7% |
| Southern Europe | 23 | 0.1% |
| Switzerland | 13 | 0.0% |
| Syria | 8 | 0.0% |
| Taiwan | 35 | 0.1% |
| Thailand | 167 | 0.4% |
| Trinidad and Tobago | 118 | 0.3% |
| Turkey | 8 | 0.0% |
| Uruguay | 84 | 0.2% |
| Uzbekistan | 11 | 0.0% |
| Venezuela | 144 | 0.4% |
| Vietnam | 74 | 0.2% |
| Western Asia | 111 | 0.3% |
| Western Europe | 60 | 0.2% |
| Zaire | 21 | 0.1% | View All 73 Rows |
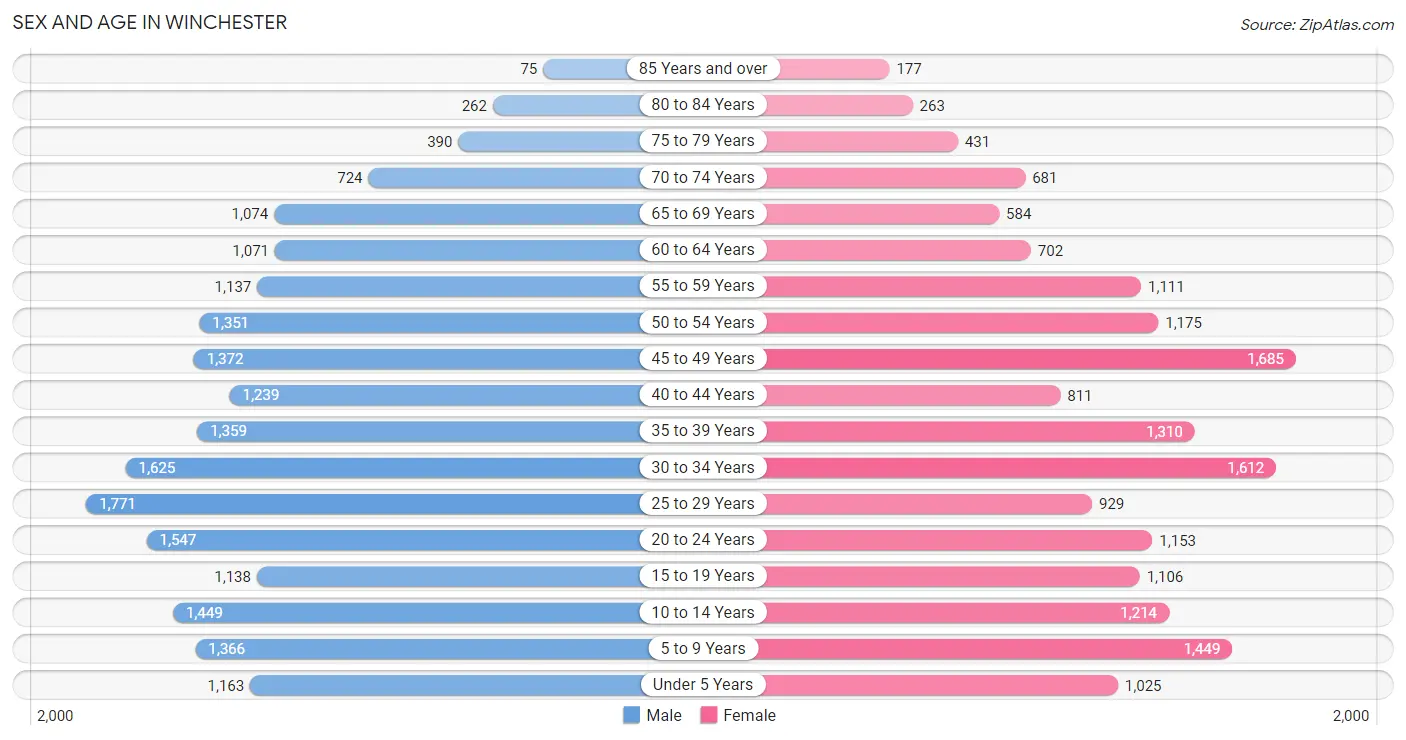
Sex and Age in Winchester
Sex and Age in Winchester
The most populous age groups in Winchester are 25 to 29 Years (1,771 | 8.8%) for men and 45 to 49 Years (1,685 | 9.7%) for women.
| Age Bracket | Male | Female |
| Under 5 Years | 1,163 (5.8%) | 1,025 (5.9%) |
| 5 to 9 Years | 1,366 (6.8%) | 1,449 (8.3%) |
| 10 to 14 Years | 1,449 (7.2%) | 1,214 (7.0%) |
| 15 to 19 Years | 1,138 (5.7%) | 1,106 (6.4%) |
| 20 to 24 Years | 1,547 (7.7%) | 1,153 (6.6%) |
| 25 to 29 Years | 1,771 (8.8%) | 929 (5.3%) |
| 30 to 34 Years | 1,625 (8.1%) | 1,612 (9.2%) |
| 35 to 39 Years | 1,359 (6.8%) | 1,310 (7.5%) |
| 40 to 44 Years | 1,239 (6.2%) | 811 (4.7%) |
| 45 to 49 Years | 1,372 (6.8%) | 1,685 (9.7%) |
| 50 to 54 Years | 1,351 (6.7%) | 1,175 (6.8%) |
| 55 to 59 Years | 1,137 (5.7%) | 1,111 (6.4%) |
| 60 to 64 Years | 1,071 (5.3%) | 702 (4.0%) |
| 65 to 69 Years | 1,074 (5.3%) | 584 (3.4%) |
| 70 to 74 Years | 724 (3.6%) | 681 (3.9%) |
| 75 to 79 Years | 390 (1.9%) | 431 (2.5%) |
| 80 to 84 Years | 262 (1.3%) | 263 (1.5%) |
| 85 Years and over | 75 (0.4%) | 177 (1.0%) |
| Total | 20,113 (100.0%) | 17,418 (100.0%) |
Families and Households in Winchester
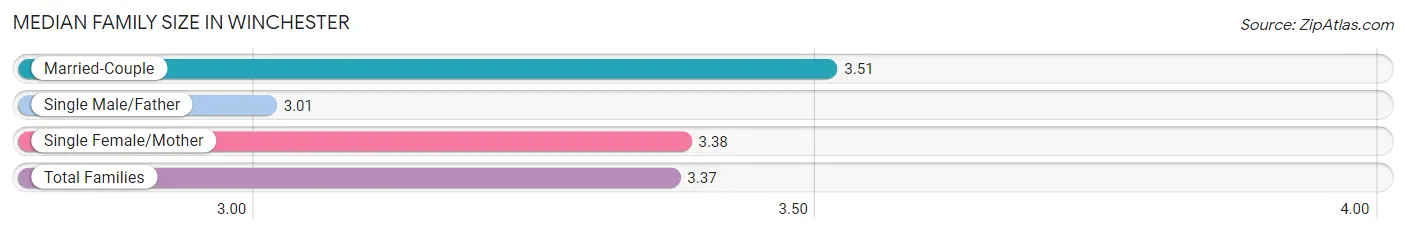
Median Family Size in Winchester
The median family size in Winchester is 3.37 persons per family, with married-couple families (3,917 | 49.0%) accounting for the largest median family size of 3.51 persons per family. On the other hand, single male/father families (1,491 | 18.6%) represent the smallest median family size with 3.01 persons per family.
| Family Type | # Families | Family Size |
| Married-Couple | 3,917 (49.0%) | 3.51 |
| Single Male/Father | 1,491 (18.6%) | 3.01 |
| Single Female/Mother | 2,586 (32.4%) | 3.38 |
| Total Families | 7,994 (100.0%) | 3.37 |
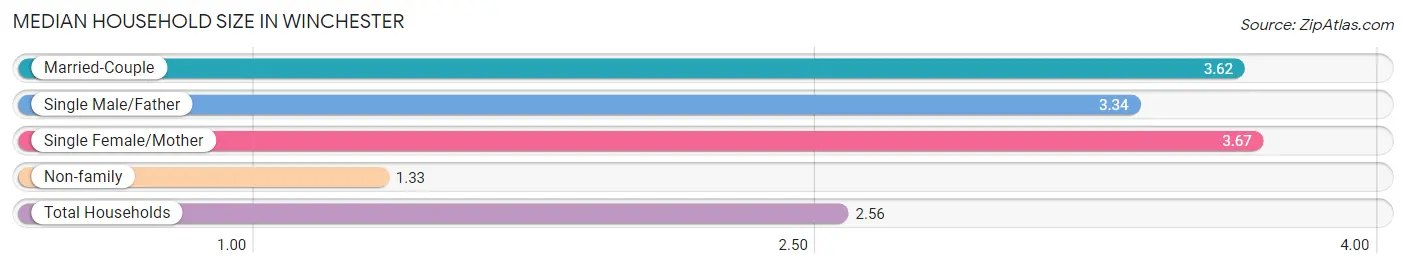
Median Household Size in Winchester
The median household size in Winchester is 2.56 persons per household, with single female/mother households (2,586 | 17.7%) accounting for the largest median household size of 3.67 persons per household. non-family households (6,598 | 45.2%) represent the smallest median household size with 1.33 persons per household.
| Household Type | # Households | Household Size |
| Married-Couple | 3,917 (26.8%) | 3.62 |
| Single Male/Father | 1,491 (10.2%) | 3.34 |
| Single Female/Mother | 2,586 (17.7%) | 3.67 |
| Non-family | 6,598 (45.2%) | 1.33 |
| Total Households | 14,592 (100.0%) | 2.56 |
Household Size by Marriage Status in Winchester
Out of a total of 14,592 households in Winchester, 7,994 (54.8%) are family households, while 6,598 (45.2%) are nonfamily households. The most numerous type of family households are 2-person households, comprising 3,324, and the most common type of nonfamily households are 1-person households, comprising 5,136.
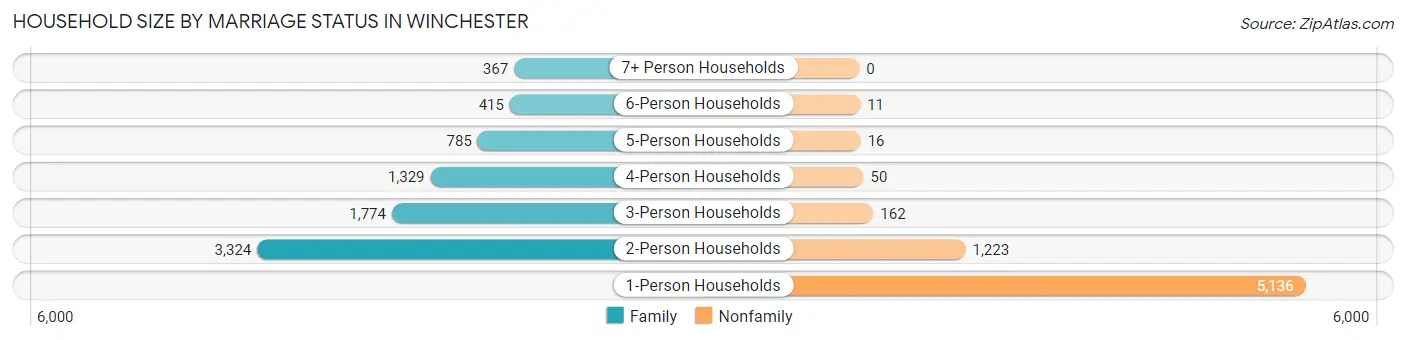
| Household Size | Family Households | Nonfamily Households |
| 1-Person Households | - | 5,136 (35.2%) |
| 2-Person Households | 3,324 (22.8%) | 1,223 (8.4%) |
| 3-Person Households | 1,774 (12.2%) | 162 (1.1%) |
| 4-Person Households | 1,329 (9.1%) | 50 (0.3%) |
| 5-Person Households | 785 (5.4%) | 16 (0.1%) |
| 6-Person Households | 415 (2.8%) | 11 (0.1%) |
| 7+ Person Households | 367 (2.5%) | 0 (0.0%) |
| Total | 7,994 (54.8%) | 6,598 (45.2%) |
Female Fertility in Winchester
Fertility by Age in Winchester
Average fertility rate in Winchester is 84.0 births per 1,000 women. Women in the age bracket of 20 to 34 years have the highest fertility rate with 118.0 births per 1,000 women. Women in the age bracket of 20 to 34 years acount for 58.2% of all women with births.
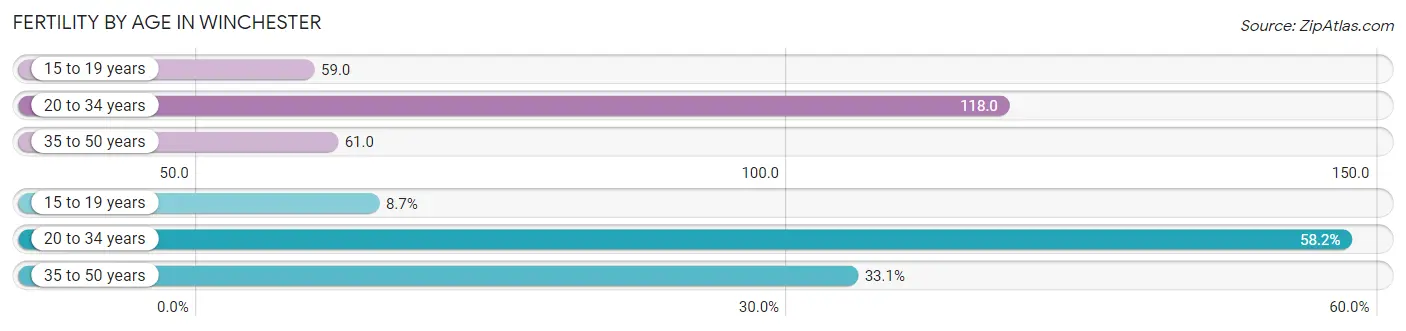
| Age Bracket | Women with Births | Births / 1,000 Women |
| 15 to 19 years | 65 (8.7%) | 59.0 |
| 20 to 34 years | 435 (58.2%) | 118.0 |
| 35 to 50 years | 247 (33.1%) | 61.0 |
| Total | 747 (100.0%) | 84.0 |
Fertility by Age by Marriage Status in Winchester
46.3% of women with births (747) in Winchester are married. The highest percentage of unmarried women with births falls into 20 to 34 years age bracket with 64.8% of them unmarried at the time of birth, while the lowest percentage of unmarried women with births belong to 15 to 19 years age bracket with 23.1% of them unmarried.

| Age Bracket | Married | Unmarried |
| 15 to 19 years | 50 (76.9%) | 15 (23.1%) |
| 20 to 34 years | 153 (35.2%) | 282 (64.8%) |
| 35 to 50 years | 143 (57.9%) | 104 (42.1%) |
| Total | 346 (46.3%) | 401 (53.7%) |
Fertility by Education in Winchester
Average fertility rate in Winchester is 84.0 births per 1,000 women. Women with the education attainment of high school diploma have the highest fertility rate of 174.0 births per 1,000 women, while women with the education attainment of less than high school have the lowest fertility at 15.0 births per 1,000 women. Women with the education attainment of high school diploma represent 74.6% of all women with births.
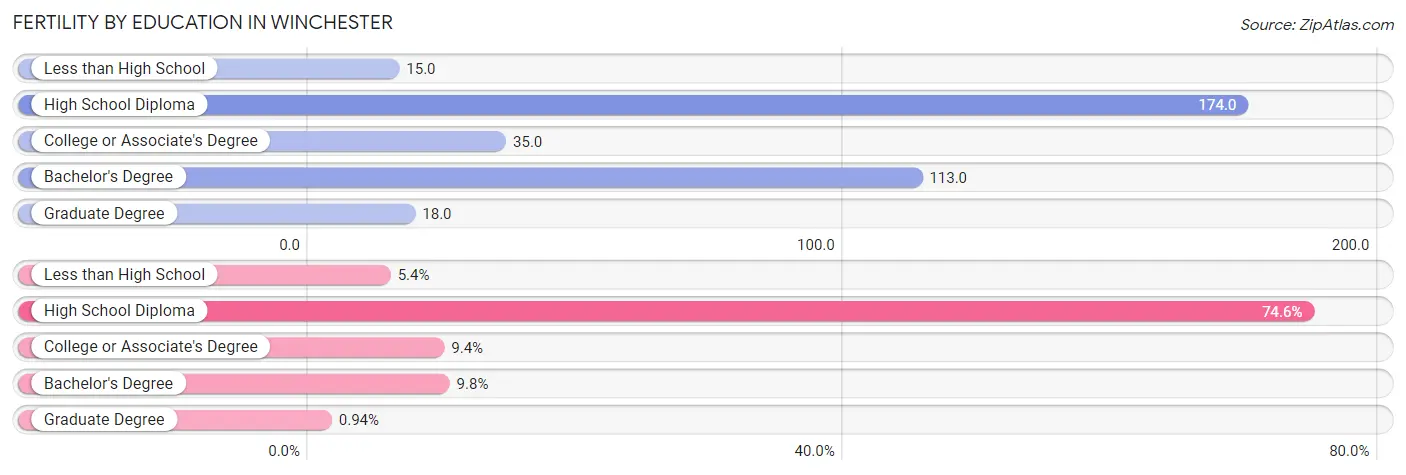
| Educational Attainment | Women with Births | Births / 1,000 Women |
| Less than High School | 40 (5.3%) | 15.0 |
| High School Diploma | 557 (74.6%) | 174.0 |
| College or Associate's Degree | 70 (9.4%) | 35.0 |
| Bachelor's Degree | 73 (9.8%) | 113.0 |
| Graduate Degree | 7 (0.9%) | 18.0 |
| Total | 747 (100.0%) | 84.0 |
Fertility by Education by Marriage Status in Winchester
53.7% of women with births in Winchester are unmarried. Women with the educational attainment of bachelor's degree are most likely to be married with 100.0% of them married at childbirth, while women with the educational attainment of high school diploma are least likely to be married with 62.1% of them unmarried at childbirth.
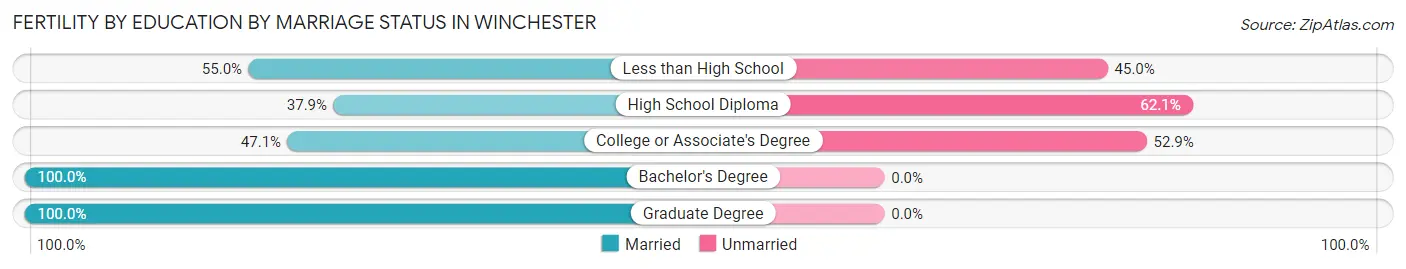
| Educational Attainment | Married | Unmarried |
| Less than High School | 22 (55.0%) | 18 (45.0%) |
| High School Diploma | 211 (37.9%) | 346 (62.1%) |
| College or Associate's Degree | 33 (47.1%) | 37 (52.9%) |
| Bachelor's Degree | 73 (100.0%) | 0 (0.0%) |
| Graduate Degree | 7 (100.0%) | 0 (0.0%) |
| Total | 346 (46.3%) | 401 (53.7%) |
Employment Characteristics in Winchester
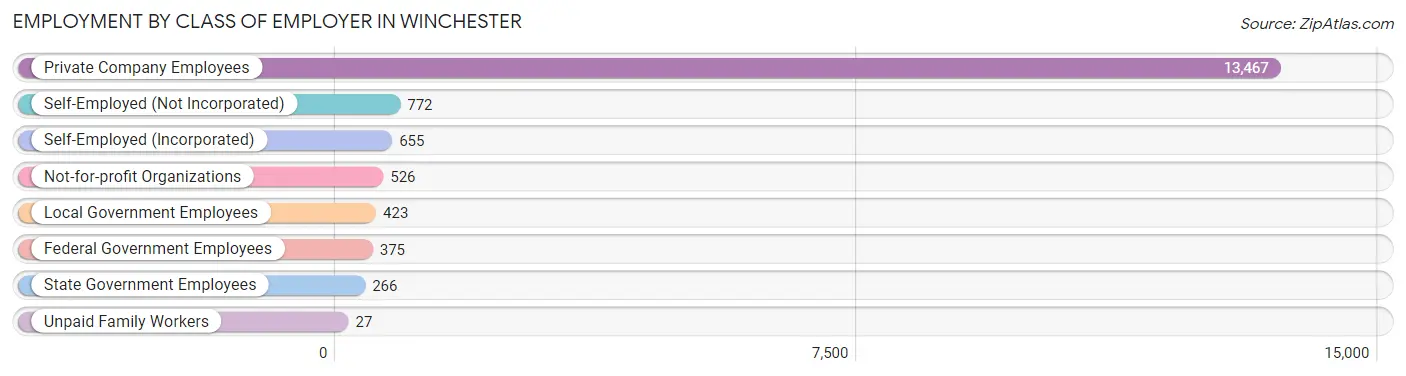
Employment by Class of Employer in Winchester
Among the 16,511 employed individuals in Winchester, private company employees (13,467 | 81.6%), self-employed (not incorporated) (772 | 4.7%), and self-employed (incorporated) (655 | 4.0%) make up the most common classes of employment.
| Employer Class | # Employees | % Employees |
| Private Company Employees | 13,467 | 81.6% |
| Self-Employed (Incorporated) | 655 | 4.0% |
| Self-Employed (Not Incorporated) | 772 | 4.7% |
| Not-for-profit Organizations | 526 | 3.2% |
| Local Government Employees | 423 | 2.6% |
| State Government Employees | 266 | 1.6% |
| Federal Government Employees | 375 | 2.3% |
| Unpaid Family Workers | 27 | 0.2% |
| Total | 16,511 | 100.0% |
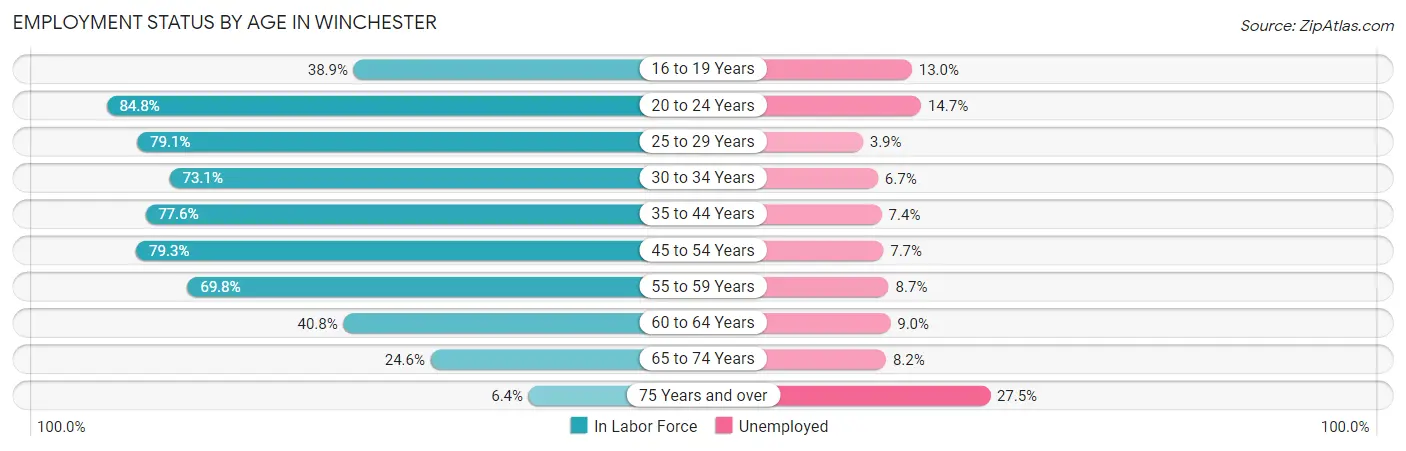
Employment Status by Age in Winchester
According to the labor force statistics for Winchester, out of the total population over 16 years of age (29,483), 63.6% or 18,751 individuals are in the labor force, with 8.4% or 1,575 of them unemployed. The age group with the highest labor force participation rate is 20 to 24 years, with 84.8% or 2,290 individuals in the labor force. Within the labor force, the 75 years and over age range has the highest percentage of unemployed individuals, with 27.5% or 28 of them being unemployed.
| Age Bracket | In Labor Force | Unemployed |
| 16 to 19 Years | 724 (38.9%) | 94 (13.0%) |
| 20 to 24 Years | 2,290 (84.8%) | 337 (14.7%) |
| 25 to 29 Years | 2,136 (79.1%) | 83 (3.9%) |
| 30 to 34 Years | 2,366 (73.1%) | 159 (6.7%) |
| 35 to 44 Years | 3,662 (77.6%) | 271 (7.4%) |
| 45 to 54 Years | 4,427 (79.3%) | 341 (7.7%) |
| 55 to 59 Years | 1,569 (69.8%) | 137 (8.7%) |
| 60 to 64 Years | 723 (40.8%) | 65 (9.0%) |
| 65 to 74 Years | 753 (24.6%) | 62 (8.2%) |
| 75 Years and over | 102 (6.4%) | 28 (27.5%) |
| Total | 18,751 (63.6%) | 1,575 (8.4%) |
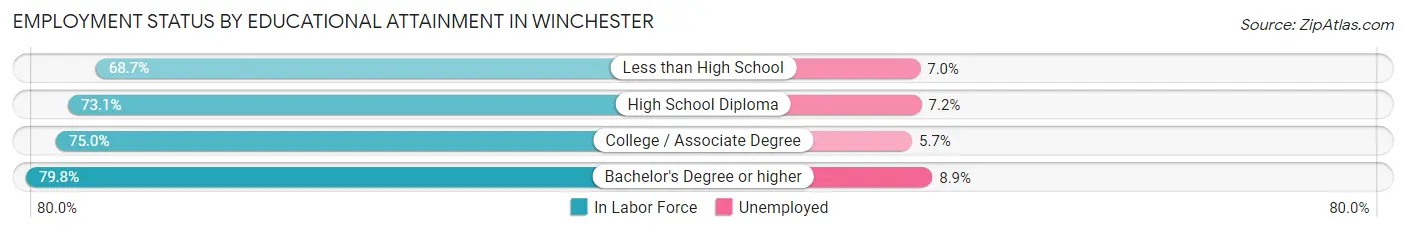
Employment Status by Educational Attainment in Winchester
According to labor force statistics for Winchester, 73.5% of individuals (14,891) out of the total population between 25 and 64 years of age (20,260) are in the labor force, with 7.1% or 1,057 of them being unemployed. The group with the highest labor force participation rate are those with the educational attainment of bachelor's degree or higher, with 79.8% or 2,732 individuals in the labor force. Within the labor force, individuals with bachelor's degree or higher education have the highest percentage of unemployment, with 8.9% or 243 of them being unemployed.
| Educational Attainment | In Labor Force | Unemployed |
| Less than High School | 3,874 (68.7%) | 395 (7.0%) |
| High School Diploma | 4,569 (73.1%) | 450 (7.2%) |
| College / Associate Degree | 3,710 (75.0%) | 282 (5.7%) |
| Bachelor's Degree or higher | 2,732 (79.8%) | 305 (8.9%) |
| Total | 14,891 (73.5%) | 1,438 (7.1%) |
Employment Occupations by Sex in Winchester
Management, Business, Science and Arts Occupations
The most common Management, Business, Science and Arts occupations in Winchester are Management (1,293 | 7.5%), Community & Social Service (954 | 5.6%), Computers, Engineering & Science (467 | 2.7%), Health Diagnosing & Treating (454 | 2.6%), and Education Instruction & Library (446 | 2.6%).
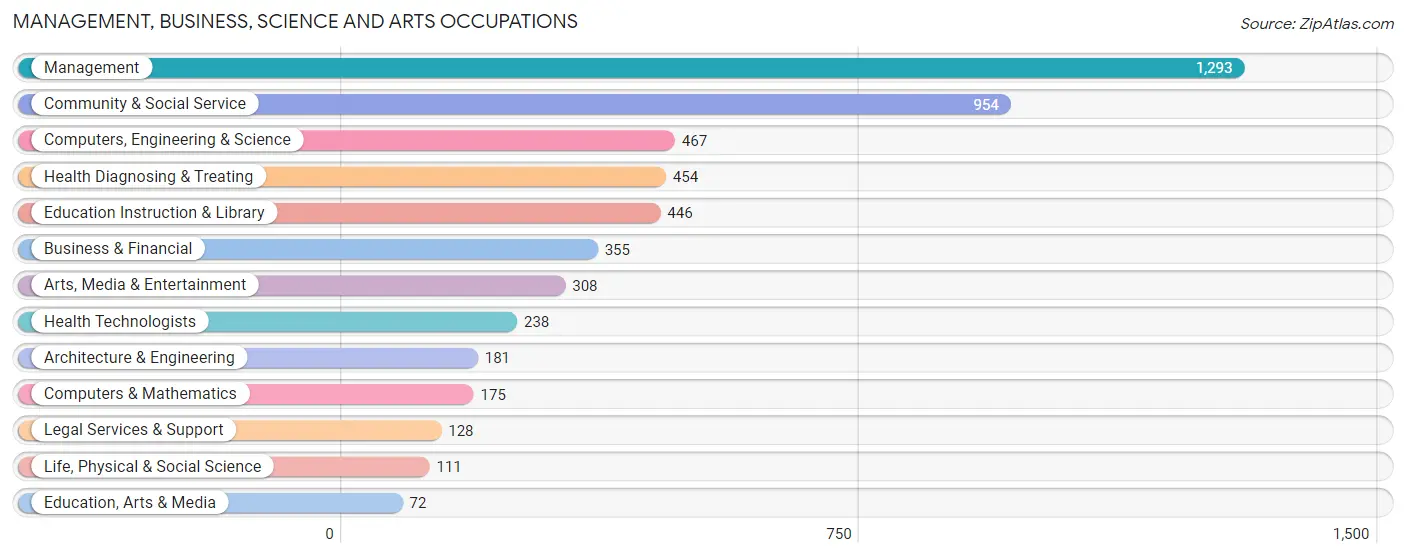
Management, Business, Science and Arts Occupations by Sex
Within the Management, Business, Science and Arts occupations in Winchester, the most male-oriented occupations are Computers & Mathematics (96.0%), Computers, Engineering & Science (66.8%), and Business & Financial (61.4%), while the most female-oriented occupations are Education Instruction & Library (79.4%), Community & Social Service (72.8%), and Arts, Media & Entertainment (68.2%).
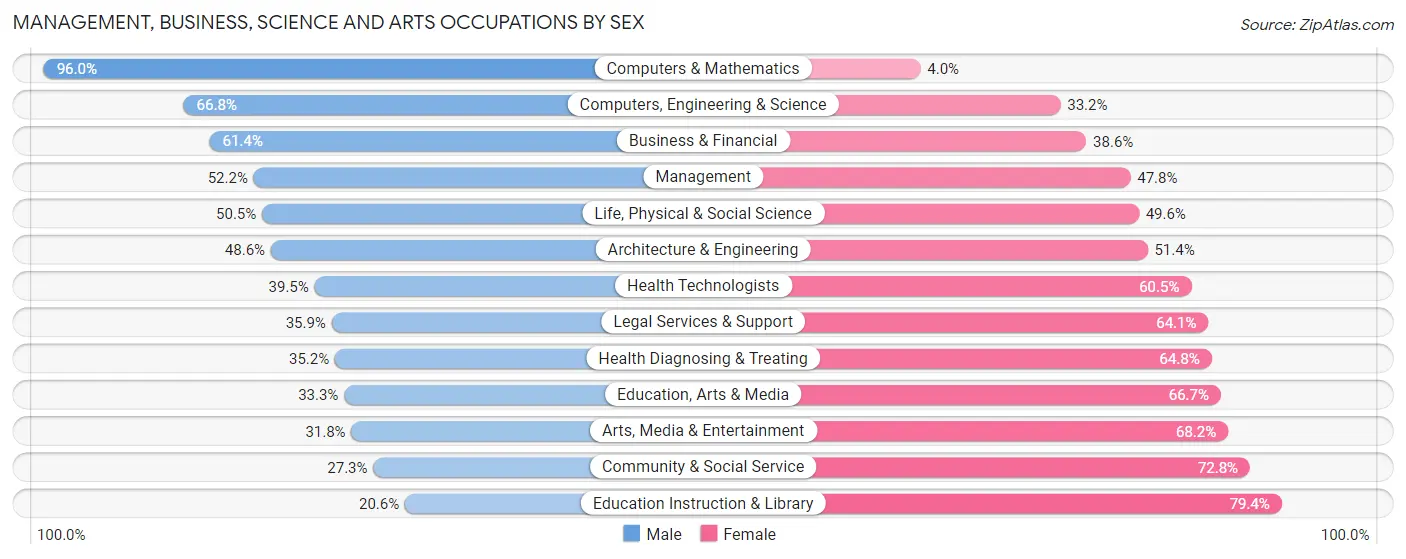
| Occupation | Male | Female |
| Management | 675 (52.2%) | 618 (47.8%) |
| Business & Financial | 218 (61.4%) | 137 (38.6%) |
| Computers, Engineering & Science | 312 (66.8%) | 155 (33.2%) |
| Computers & Mathematics | 168 (96.0%) | 7 (4.0%) |
| Architecture & Engineering | 88 (48.6%) | 93 (51.4%) |
| Life, Physical & Social Science | 56 (50.4%) | 55 (49.5%) |
| Community & Social Service | 260 (27.3%) | 694 (72.8%) |
| Education, Arts & Media | 24 (33.3%) | 48 (66.7%) |
| Legal Services & Support | 46 (35.9%) | 82 (64.1%) |
| Education Instruction & Library | 92 (20.6%) | 354 (79.4%) |
| Arts, Media & Entertainment | 98 (31.8%) | 210 (68.2%) |
| Health Diagnosing & Treating | 160 (35.2%) | 294 (64.8%) |
| Health Technologists | 94 (39.5%) | 144 (60.5%) |
| Total (Category) | 1,625 (46.1%) | 1,898 (53.9%) |
| Total (Overall) | 9,919 (57.8%) | 7,248 (42.2%) |
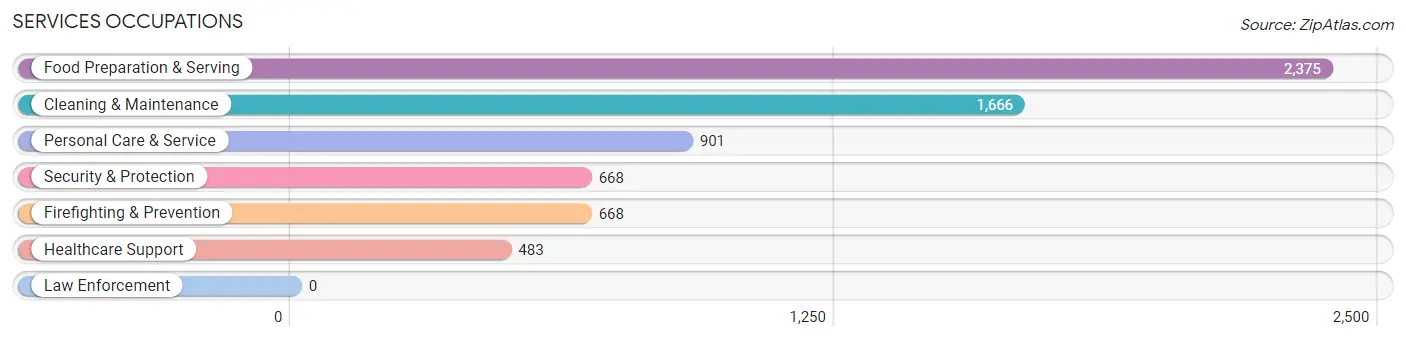
Services Occupations
The most common Services occupations in Winchester are Food Preparation & Serving (2,375 | 13.8%), Cleaning & Maintenance (1,666 | 9.7%), Personal Care & Service (901 | 5.2%), Security & Protection (668 | 3.9%), and Firefighting & Prevention (668 | 3.9%).
Services Occupations by Sex
Within the Services occupations in Winchester, the most male-oriented occupations are Security & Protection (72.8%), Firefighting & Prevention (72.8%), and Food Preparation & Serving (65.0%), while the most female-oriented occupations are Healthcare Support (94.2%), Personal Care & Service (64.1%), and Cleaning & Maintenance (61.8%).
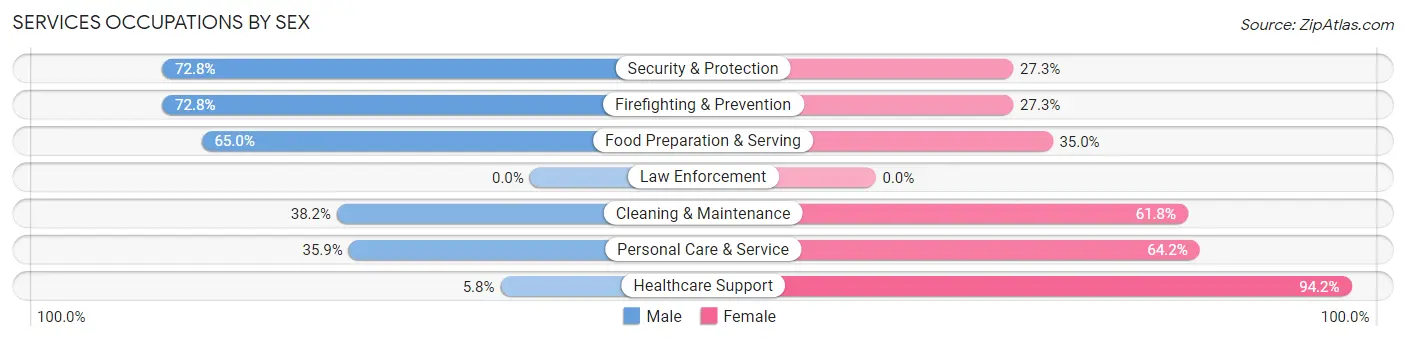
| Occupation | Male | Female |
| Healthcare Support | 28 (5.8%) | 455 (94.2%) |
| Security & Protection | 486 (72.8%) | 182 (27.3%) |
| Firefighting & Prevention | 486 (72.8%) | 182 (27.3%) |
| Law Enforcement | 0 (0.0%) | 0 (0.0%) |
| Food Preparation & Serving | 1,543 (65.0%) | 832 (35.0%) |
| Cleaning & Maintenance | 636 (38.2%) | 1,030 (61.8%) |
| Personal Care & Service | 323 (35.8%) | 578 (64.1%) |
| Total (Category) | 3,016 (49.5%) | 3,077 (50.5%) |
| Total (Overall) | 9,919 (57.8%) | 7,248 (42.2%) |
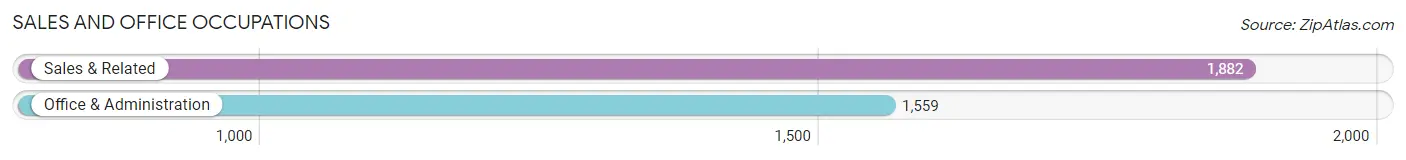
Sales and Office Occupations
The most common Sales and Office occupations in Winchester are Sales & Related (1,882 | 11.0%), and Office & Administration (1,559 | 9.1%).
Sales and Office Occupations by Sex
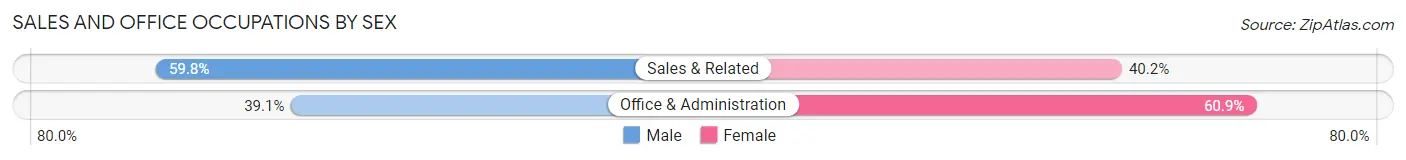
| Occupation | Male | Female |
| Sales & Related | 1,125 (59.8%) | 757 (40.2%) |
| Office & Administration | 610 (39.1%) | 949 (60.9%) |
| Total (Category) | 1,735 (50.4%) | 1,706 (49.6%) |
| Total (Overall) | 9,919 (57.8%) | 7,248 (42.2%) |
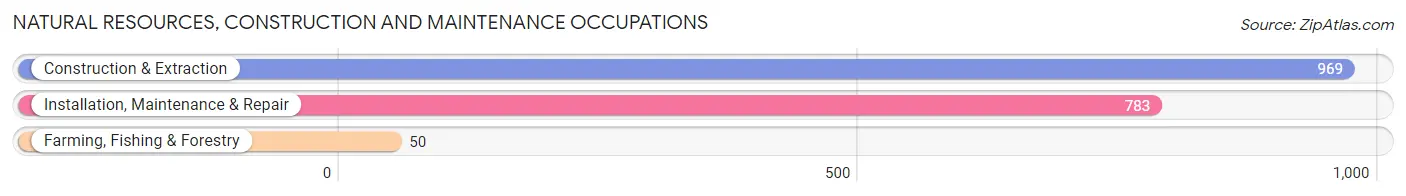
Natural Resources, Construction and Maintenance Occupations
The most common Natural Resources, Construction and Maintenance occupations in Winchester are Construction & Extraction (969 | 5.6%), Installation, Maintenance & Repair (783 | 4.6%), and Farming, Fishing & Forestry (50 | 0.3%).
Natural Resources, Construction and Maintenance Occupations by Sex
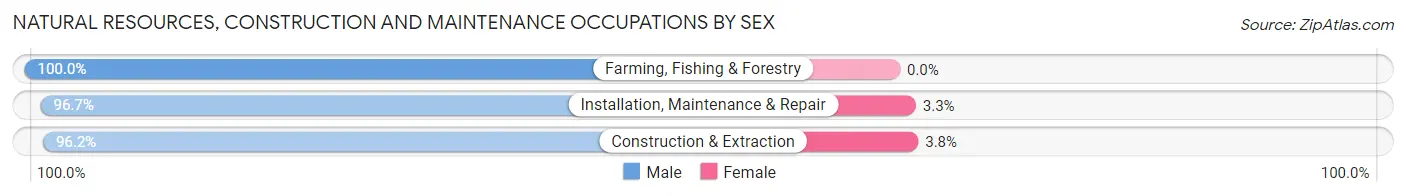
| Occupation | Male | Female |
| Farming, Fishing & Forestry | 50 (100.0%) | 0 (0.0%) |
| Construction & Extraction | 932 (96.2%) | 37 (3.8%) |
| Installation, Maintenance & Repair | 757 (96.7%) | 26 (3.3%) |
| Total (Category) | 1,739 (96.5%) | 63 (3.5%) |
| Total (Overall) | 9,919 (57.8%) | 7,248 (42.2%) |
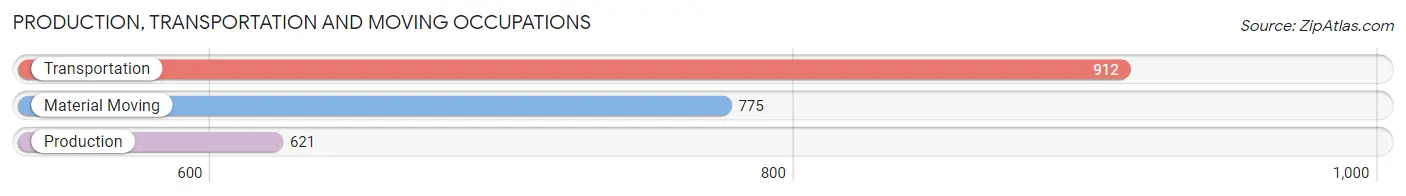
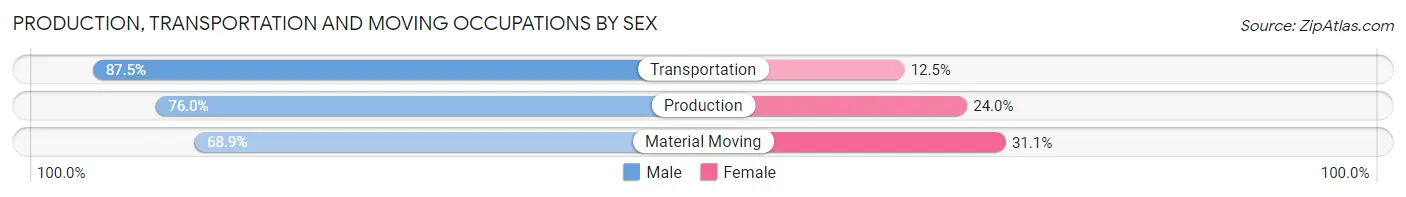
Production, Transportation and Moving Occupations
The most common Production, Transportation and Moving occupations in Winchester are Transportation (912 | 5.3%), Material Moving (775 | 4.5%), and Production (621 | 3.6%).
Production, Transportation and Moving Occupations by Sex
| Occupation | Male | Female |
| Production | 472 (76.0%) | 149 (24.0%) |
| Transportation | 798 (87.5%) | 114 (12.5%) |
| Material Moving | 534 (68.9%) | 241 (31.1%) |
| Total (Category) | 1,804 (78.2%) | 504 (21.8%) |
| Total (Overall) | 9,919 (57.8%) | 7,248 (42.2%) |
Employment Industries by Sex in Winchester
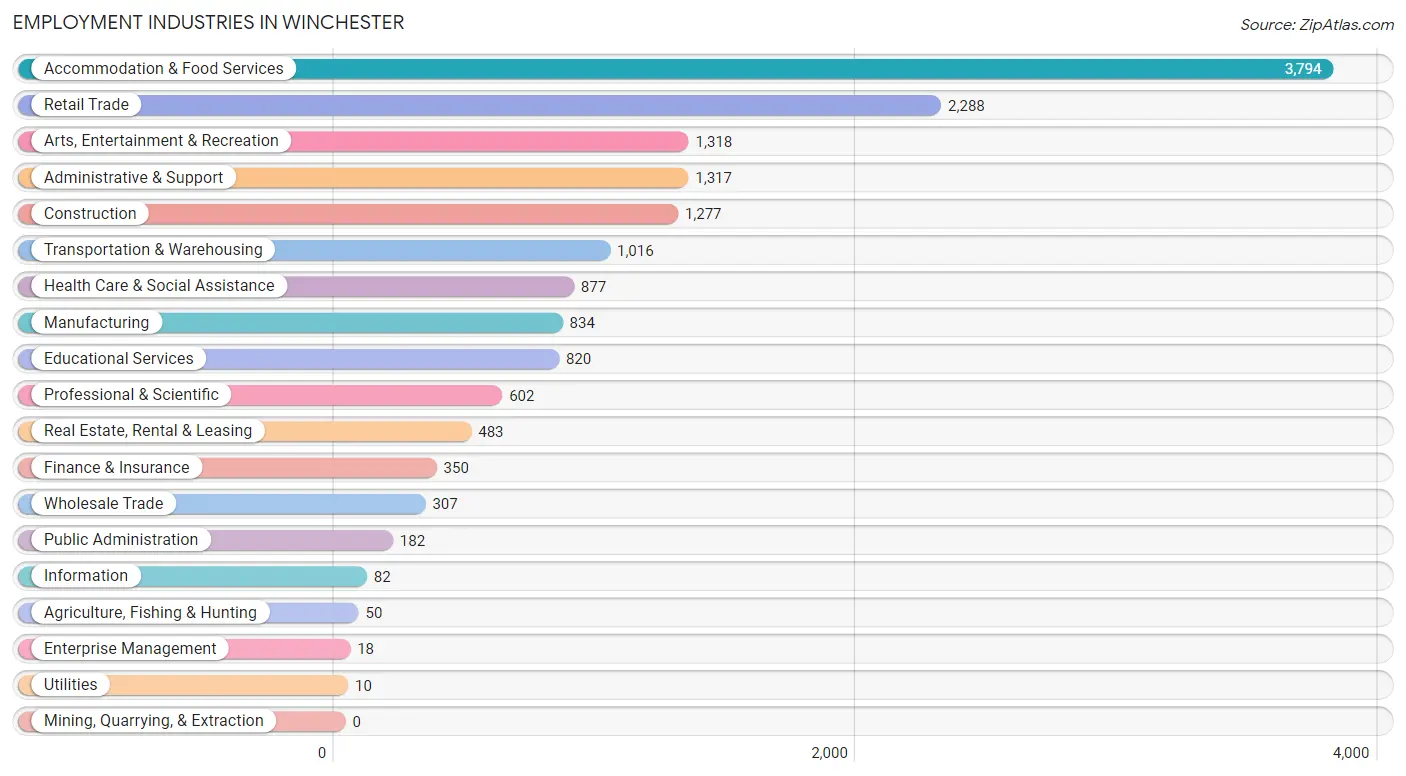
Employment Industries in Winchester
The major employment industries in Winchester include Accommodation & Food Services (3,794 | 22.1%), Retail Trade (2,288 | 13.3%), Arts, Entertainment & Recreation (1,318 | 7.7%), Administrative & Support (1,317 | 7.7%), and Construction (1,277 | 7.4%).
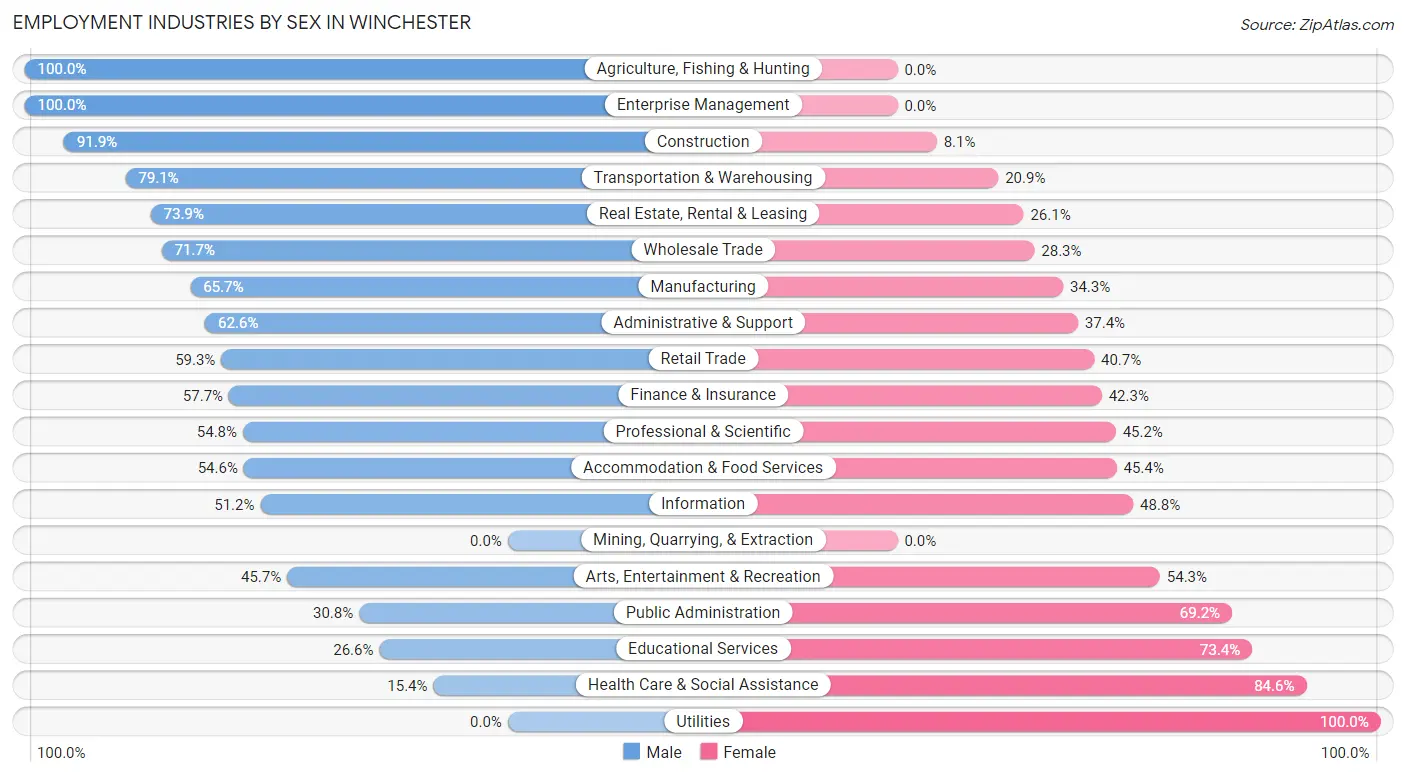
Employment Industries by Sex in Winchester
The Winchester industries that see more men than women are Agriculture, Fishing & Hunting (100.0%), Enterprise Management (100.0%), and Construction (91.9%), whereas the industries that tend to have a higher number of women are Utilities (100.0%), Health Care & Social Assistance (84.6%), and Educational Services (73.4%).
| Industry | Male | Female |
| Agriculture, Fishing & Hunting | 50 (100.0%) | 0 (0.0%) |
| Mining, Quarrying, & Extraction | 0 (0.0%) | 0 (0.0%) |
| Construction | 1,173 (91.9%) | 104 (8.1%) |
| Manufacturing | 548 (65.7%) | 286 (34.3%) |
| Wholesale Trade | 220 (71.7%) | 87 (28.3%) |
| Retail Trade | 1,357 (59.3%) | 931 (40.7%) |
| Transportation & Warehousing | 804 (79.1%) | 212 (20.9%) |
| Utilities | 0 (0.0%) | 10 (100.0%) |
| Information | 42 (51.2%) | 40 (48.8%) |
| Finance & Insurance | 202 (57.7%) | 148 (42.3%) |
| Real Estate, Rental & Leasing | 357 (73.9%) | 126 (26.1%) |
| Professional & Scientific | 330 (54.8%) | 272 (45.2%) |
| Enterprise Management | 18 (100.0%) | 0 (0.0%) |
| Administrative & Support | 825 (62.6%) | 492 (37.4%) |
| Educational Services | 218 (26.6%) | 602 (73.4%) |
| Health Care & Social Assistance | 135 (15.4%) | 742 (84.6%) |
| Arts, Entertainment & Recreation | 602 (45.7%) | 716 (54.3%) |
| Accommodation & Food Services | 2,073 (54.6%) | 1,721 (45.4%) |
| Public Administration | 56 (30.8%) | 126 (69.2%) |
| Total | 9,919 (57.8%) | 7,248 (42.2%) |
Education in Winchester
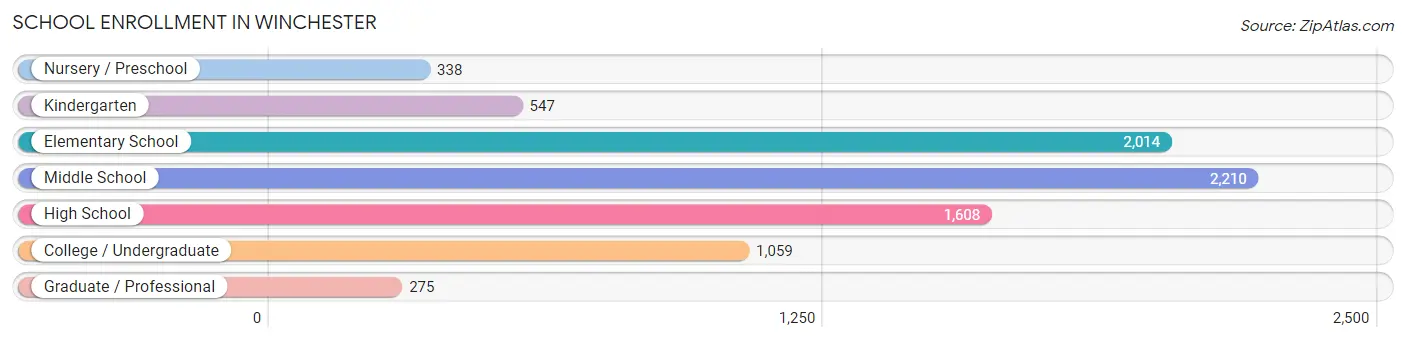
School Enrollment in Winchester
The most common levels of schooling among the 8,051 students in Winchester are middle school (2,210 | 27.5%), elementary school (2,014 | 25.0%), and high school (1,608 | 20.0%).
| School Level | # Students | % Students |
| Nursery / Preschool | 338 | 4.2% |
| Kindergarten | 547 | 6.8% |
| Elementary School | 2,014 | 25.0% |
| Middle School | 2,210 | 27.5% |
| High School | 1,608 | 20.0% |
| College / Undergraduate | 1,059 | 13.2% |
| Graduate / Professional | 275 | 3.4% |
| Total | 8,051 | 100.0% |
School Enrollment by Age by Funding Source in Winchester
Out of a total of 8,051 students who are enrolled in schools in Winchester, 556 (6.9%) attend a private institution, while the remaining 7,495 (93.1%) are enrolled in public schools. The age group of 35 years and over has the highest likelihood of being enrolled in private schools, with 142 (35.5% in the age bracket) enrolled. Conversely, the age group of 15 to 17 year olds has the lowest likelihood of being enrolled in a private school, with 1,146 (98.1% in the age bracket) attending a public institution.
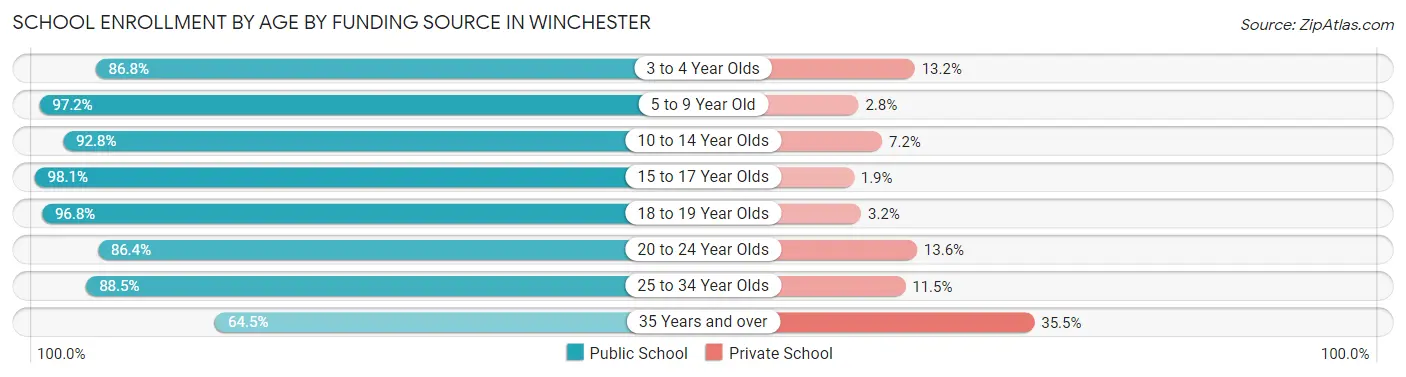
| Age Bracket | Public School | Private School |
| 3 to 4 Year Olds | 190 (86.8%) | 29 (13.2%) |
| 5 to 9 Year Old | 2,505 (97.2%) | 71 (2.8%) |
| 10 to 14 Year Olds | 2,255 (92.8%) | 174 (7.2%) |
| 15 to 17 Year Olds | 1,146 (98.1%) | 22 (1.9%) |
| 18 to 19 Year Olds | 388 (96.8%) | 13 (3.2%) |
| 20 to 24 Year Olds | 380 (86.4%) | 60 (13.6%) |
| 25 to 34 Year Olds | 370 (88.5%) | 48 (11.5%) |
| 35 Years and over | 258 (64.5%) | 142 (35.5%) |
| Total | 7,495 (93.1%) | 556 (6.9%) |
Educational Attainment by Field of Study in Winchester
Business (1,275 | 27.0%), education (394 | 8.4%), science & technology (389 | 8.3%), social sciences (373 | 7.9%), and arts & humanities (361 | 7.6%) are the most common fields of study among 4,717 individuals in Winchester who have obtained a bachelor's degree or higher.
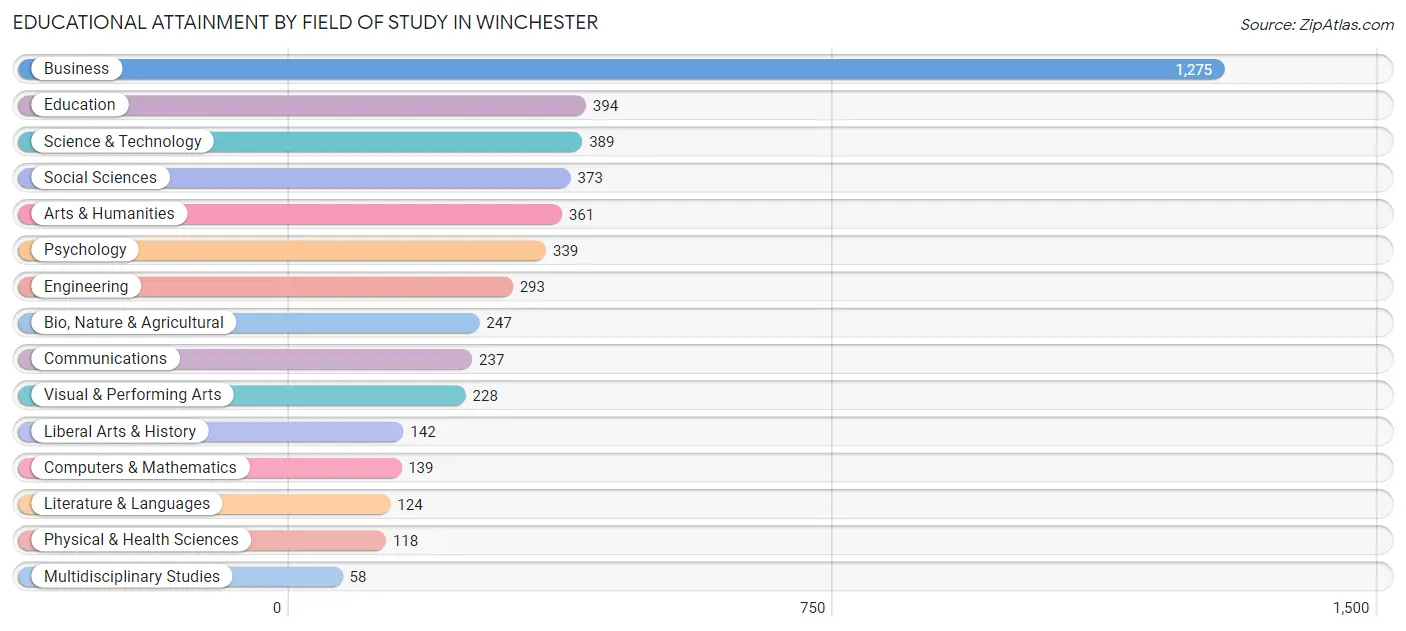
| Field of Study | # Graduates | % Graduates |
| Computers & Mathematics | 139 | 2.9% |
| Bio, Nature & Agricultural | 247 | 5.2% |
| Physical & Health Sciences | 118 | 2.5% |
| Psychology | 339 | 7.2% |
| Social Sciences | 373 | 7.9% |
| Engineering | 293 | 6.2% |
| Multidisciplinary Studies | 58 | 1.2% |
| Science & Technology | 389 | 8.3% |
| Business | 1,275 | 27.0% |
| Education | 394 | 8.4% |
| Literature & Languages | 124 | 2.6% |
| Liberal Arts & History | 142 | 3.0% |
| Visual & Performing Arts | 228 | 4.8% |
| Communications | 237 | 5.0% |
| Arts & Humanities | 361 | 7.6% |
| Total | 4,717 | 100.0% |
Transportation & Commute in Winchester
Vehicle Availability by Sex in Winchester
The most prevalent vehicle ownership categories in Winchester are males with 2 vehicles (3,650, accounting for 37.8%) and females with 2 vehicles (2,004, making up 53.4%).
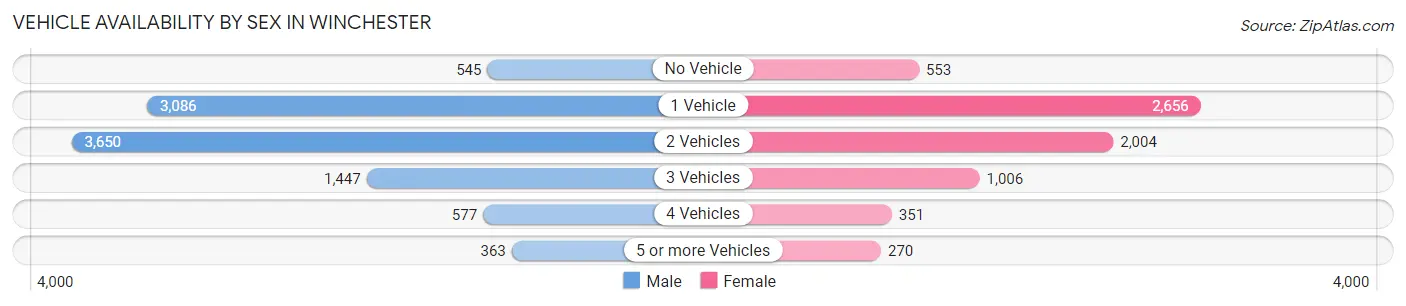
| Vehicles Available | Male | Female |
| No Vehicle | 545 (5.6%) | 553 (8.1%) |
| 1 Vehicle | 3,086 (31.9%) | 2,656 (38.8%) |
| 2 Vehicles | 3,650 (37.8%) | 2,004 (29.3%) |
| 3 Vehicles | 1,447 (15.0%) | 1,006 (14.7%) |
| 4 Vehicles | 577 (6.0%) | 351 (5.1%) |
| 5 or more Vehicles | 363 (3.7%) | 270 (4.0%) |
| Total | 9,668 (100.0%) | 6,840 (100.0%) |
Commute Time in Winchester
The most frequently occuring commute durations in Winchester are 20 to 24 minutes (3,664 commuters, 23.1%), 15 to 19 minutes (2,738 commuters, 17.3%), and 30 to 34 minutes (2,084 commuters, 13.2%).
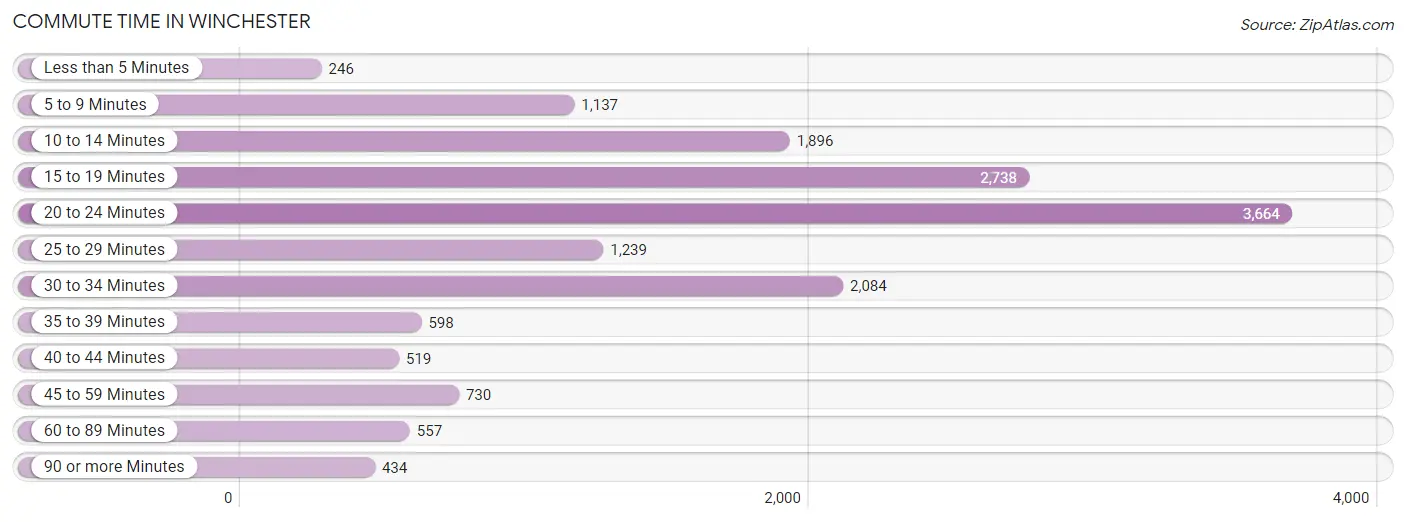
| Commute Time | # Commuters | % Commuters |
| Less than 5 Minutes | 246 | 1.5% |
| 5 to 9 Minutes | 1,137 | 7.2% |
| 10 to 14 Minutes | 1,896 | 12.0% |
| 15 to 19 Minutes | 2,738 | 17.3% |
| 20 to 24 Minutes | 3,664 | 23.1% |
| 25 to 29 Minutes | 1,239 | 7.8% |
| 30 to 34 Minutes | 2,084 | 13.2% |
| 35 to 39 Minutes | 598 | 3.8% |
| 40 to 44 Minutes | 519 | 3.3% |
| 45 to 59 Minutes | 730 | 4.6% |
| 60 to 89 Minutes | 557 | 3.5% |
| 90 or more Minutes | 434 | 2.7% |
Commute Time by Sex in Winchester
The most common commute times in Winchester are 20 to 24 minutes (2,194 commuters, 23.7%) for males and 20 to 24 minutes (1,470 commuters, 22.3%) for females.
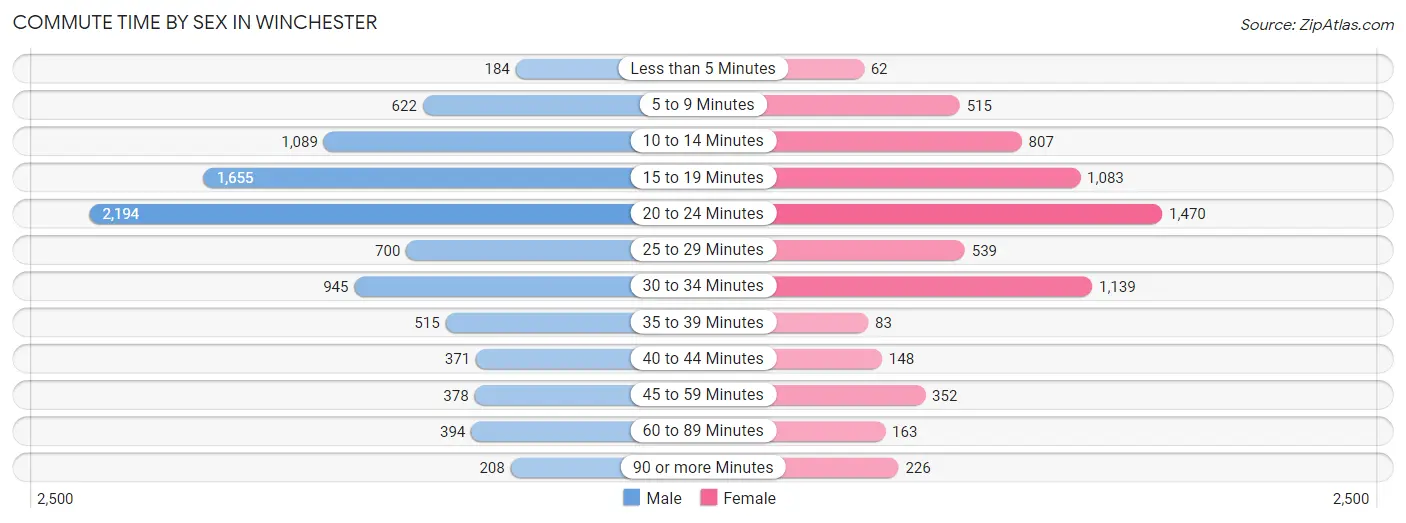
| Commute Time | Male | Female |
| Less than 5 Minutes | 184 (2.0%) | 62 (0.9%) |
| 5 to 9 Minutes | 622 (6.7%) | 515 (7.8%) |
| 10 to 14 Minutes | 1,089 (11.8%) | 807 (12.2%) |
| 15 to 19 Minutes | 1,655 (17.9%) | 1,083 (16.4%) |
| 20 to 24 Minutes | 2,194 (23.7%) | 1,470 (22.3%) |
| 25 to 29 Minutes | 700 (7.6%) | 539 (8.2%) |
| 30 to 34 Minutes | 945 (10.2%) | 1,139 (17.3%) |
| 35 to 39 Minutes | 515 (5.6%) | 83 (1.3%) |
| 40 to 44 Minutes | 371 (4.0%) | 148 (2.2%) |
| 45 to 59 Minutes | 378 (4.1%) | 352 (5.3%) |
| 60 to 89 Minutes | 394 (4.3%) | 163 (2.5%) |
| 90 or more Minutes | 208 (2.2%) | 226 (3.4%) |
Time of Departure to Work by Sex in Winchester
The most frequent times of departure to work in Winchester are 4:00 PM to 11:59 PM (1,539, 16.6%) for males and 4:00 PM to 11:59 PM (998, 15.1%) for females.
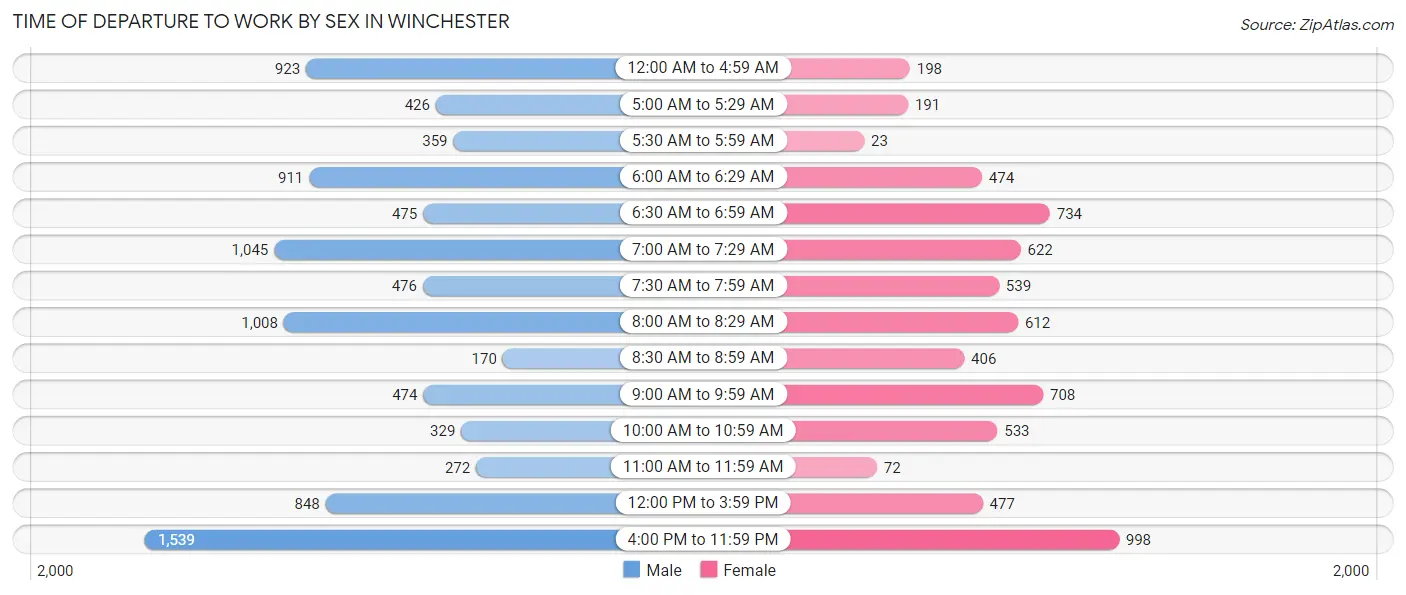
| Time of Departure | Male | Female |
| 12:00 AM to 4:59 AM | 923 (10.0%) | 198 (3.0%) |
| 5:00 AM to 5:29 AM | 426 (4.6%) | 191 (2.9%) |
| 5:30 AM to 5:59 AM | 359 (3.9%) | 23 (0.4%) |
| 6:00 AM to 6:29 AM | 911 (9.8%) | 474 (7.2%) |
| 6:30 AM to 6:59 AM | 475 (5.1%) | 734 (11.1%) |
| 7:00 AM to 7:29 AM | 1,045 (11.3%) | 622 (9.4%) |
| 7:30 AM to 7:59 AM | 476 (5.1%) | 539 (8.2%) |
| 8:00 AM to 8:29 AM | 1,008 (10.9%) | 612 (9.3%) |
| 8:30 AM to 8:59 AM | 170 (1.8%) | 406 (6.2%) |
| 9:00 AM to 9:59 AM | 474 (5.1%) | 708 (10.7%) |
| 10:00 AM to 10:59 AM | 329 (3.5%) | 533 (8.1%) |
| 11:00 AM to 11:59 AM | 272 (2.9%) | 72 (1.1%) |
| 12:00 PM to 3:59 PM | 848 (9.2%) | 477 (7.2%) |
| 4:00 PM to 11:59 PM | 1,539 (16.6%) | 998 (15.1%) |
| Total | 9,255 (100.0%) | 6,587 (100.0%) |
Housing Occupancy in Winchester
Occupancy by Ownership in Winchester
Of the total 14,592 dwellings in Winchester, owner-occupied units account for 4,715 (32.3%), while renter-occupied units make up 9,877 (67.7%).
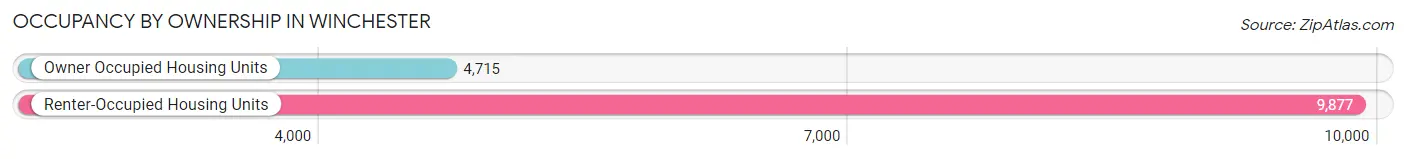
| Occupancy | # Housing Units | % Housing Units |
| Owner Occupied Housing Units | 4,715 | 32.3% |
| Renter-Occupied Housing Units | 9,877 | 67.7% |
| Total Occupied Housing Units | 14,592 | 100.0% |
Occupancy by Household Size in Winchester
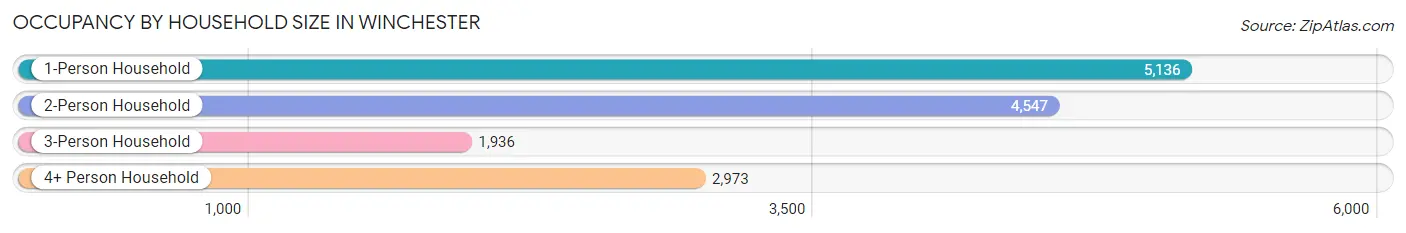
| Household Size | # Housing Units | % Housing Units |
| 1-Person Household | 5,136 | 35.2% |
| 2-Person Household | 4,547 | 31.2% |
| 3-Person Household | 1,936 | 13.3% |
| 4+ Person Household | 2,973 | 20.4% |
| Total Housing Units | 14,592 | 100.0% |
Occupancy by Ownership by Household Size in Winchester
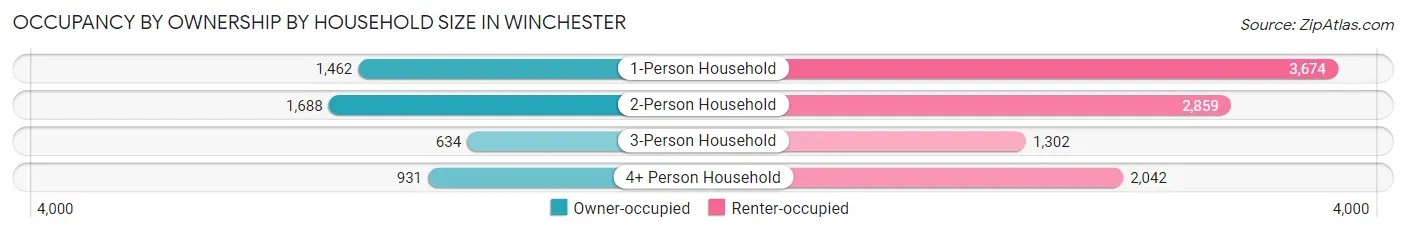
| Household Size | Owner-occupied | Renter-occupied |
| 1-Person Household | 1,462 (28.5%) | 3,674 (71.5%) |
| 2-Person Household | 1,688 (37.1%) | 2,859 (62.9%) |
| 3-Person Household | 634 (32.8%) | 1,302 (67.2%) |
| 4+ Person Household | 931 (31.3%) | 2,042 (68.7%) |
| Total Housing Units | 4,715 (32.3%) | 9,877 (67.7%) |
Occupancy by Educational Attainment in Winchester
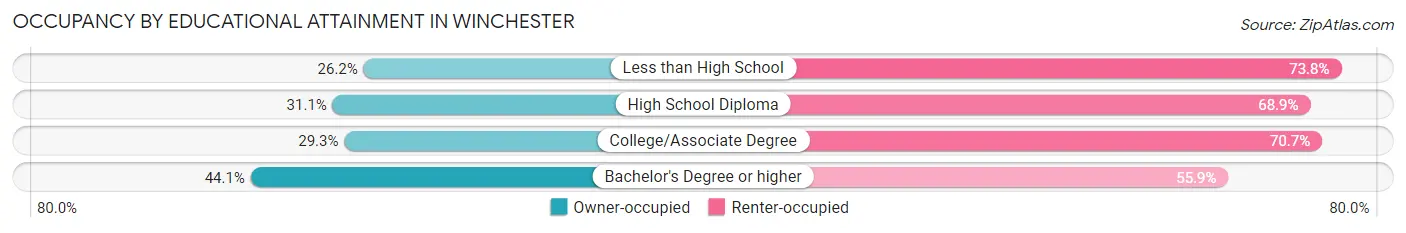
| Household Size | Owner-occupied | Renter-occupied |
| Less than High School | 717 (26.2%) | 2,017 (73.8%) |
| High School Diploma | 1,427 (31.1%) | 3,155 (68.9%) |
| College/Associate Degree | 1,264 (29.3%) | 3,051 (70.7%) |
| Bachelor's Degree or higher | 1,307 (44.1%) | 1,654 (55.9%) |
Occupancy by Age of Householder in Winchester
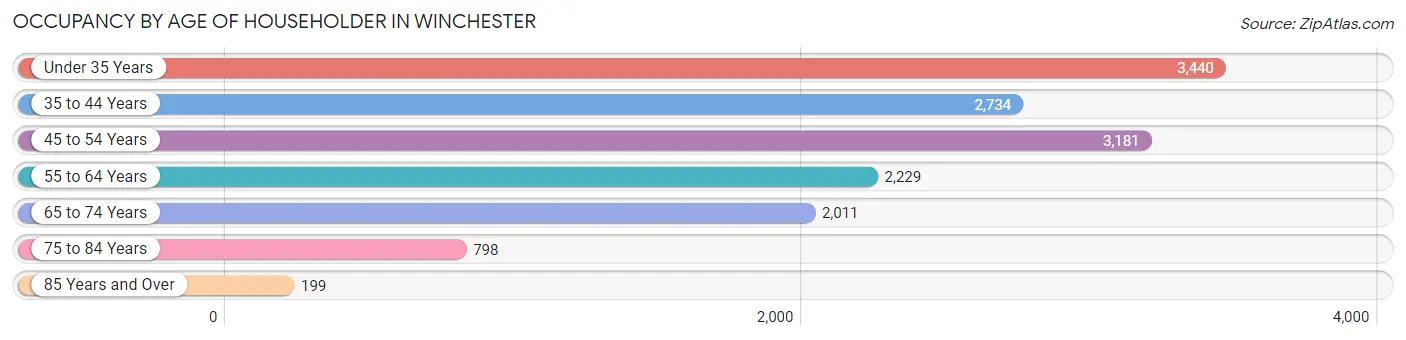
| Age Bracket | # Households | % Households |
| Under 35 Years | 3,440 | 23.6% |
| 35 to 44 Years | 2,734 | 18.7% |
| 45 to 54 Years | 3,181 | 21.8% |
| 55 to 64 Years | 2,229 | 15.3% |
| 65 to 74 Years | 2,011 | 13.8% |
| 75 to 84 Years | 798 | 5.5% |
| 85 Years and Over | 199 | 1.4% |
| Total | 14,592 | 100.0% |
Housing Finances in Winchester
Median Income by Occupancy in Winchester
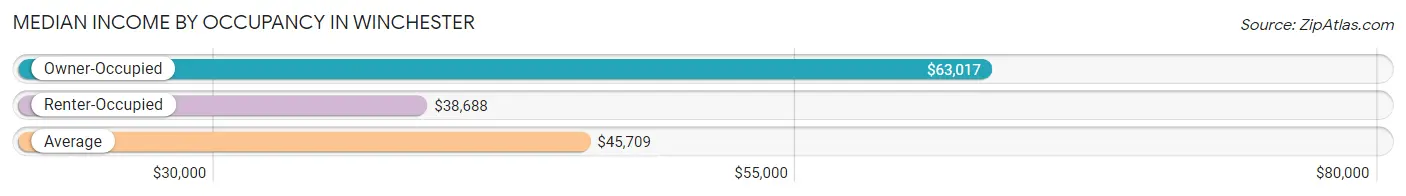
| Occupancy Type | # Households | Median Income |
| Owner-Occupied | 4,715 (32.3%) | $63,017 |
| Renter-Occupied | 9,877 (67.7%) | $38,688 |
| Average | 14,592 (100.0%) | $45,709 |
Occupancy by Householder Income Bracket in Winchester
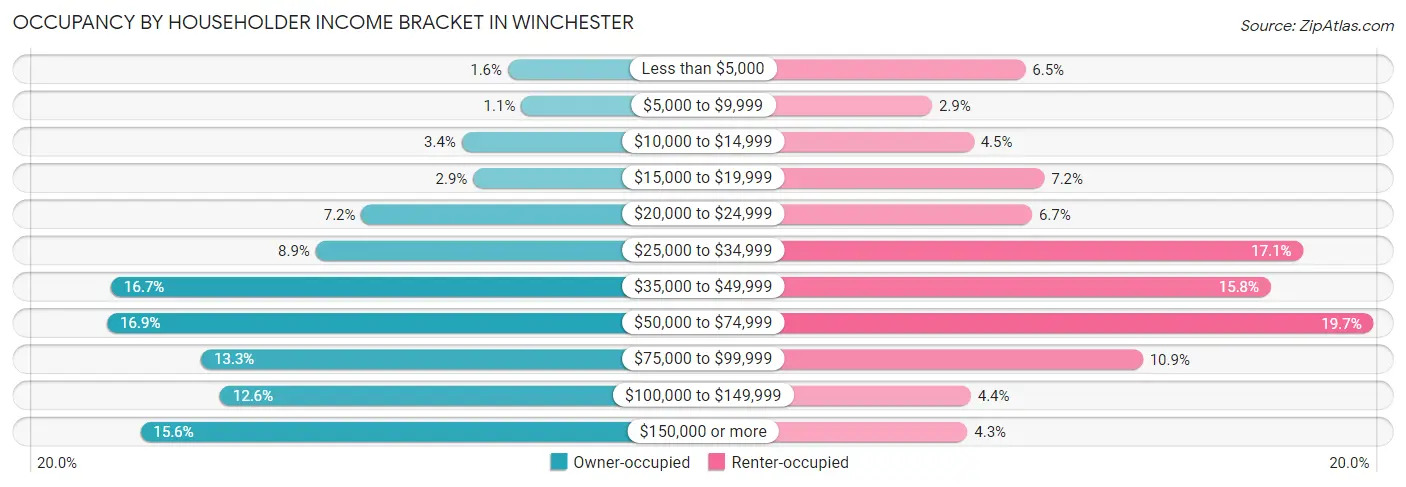
| Income Bracket | Owner-occupied | Renter-occupied |
| Less than $5,000 | 75 (1.6%) | 639 (6.5%) |
| $5,000 to $9,999 | 51 (1.1%) | 287 (2.9%) |
| $10,000 to $14,999 | 158 (3.4%) | 444 (4.5%) |
| $15,000 to $19,999 | 137 (2.9%) | 710 (7.2%) |
| $20,000 to $24,999 | 338 (7.2%) | 664 (6.7%) |
| $25,000 to $34,999 | 420 (8.9%) | 1,685 (17.1%) |
| $35,000 to $49,999 | 788 (16.7%) | 1,563 (15.8%) |
| $50,000 to $74,999 | 795 (16.9%) | 1,949 (19.7%) |
| $75,000 to $99,999 | 626 (13.3%) | 1,081 (10.9%) |
| $100,000 to $149,999 | 592 (12.6%) | 434 (4.4%) |
| $150,000 or more | 735 (15.6%) | 421 (4.3%) |
| Total | 4,715 (100.0%) | 9,877 (100.0%) |
Monthly Housing Cost Tiers in Winchester
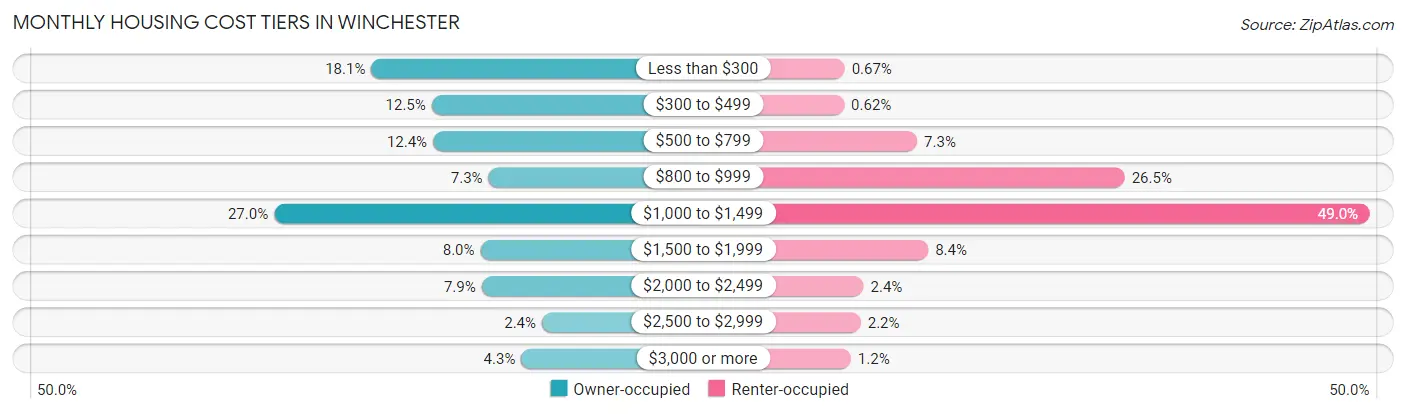
| Monthly Cost | Owner-occupied | Renter-occupied |
| Less than $300 | 853 (18.1%) | 66 (0.7%) |
| $300 to $499 | 591 (12.5%) | 61 (0.6%) |
| $500 to $799 | 585 (12.4%) | 725 (7.3%) |
| $800 to $999 | 344 (7.3%) | 2,612 (26.5%) |
| $1,000 to $1,499 | 1,275 (27.0%) | 4,842 (49.0%) |
| $1,500 to $1,999 | 379 (8.0%) | 826 (8.4%) |
| $2,000 to $2,499 | 374 (7.9%) | 238 (2.4%) |
| $2,500 to $2,999 | 112 (2.4%) | 212 (2.1%) |
| $3,000 or more | 202 (4.3%) | 122 (1.2%) |
| Total | 4,715 (100.0%) | 9,877 (100.0%) |
Physical Housing Characteristics in Winchester
Housing Structures in Winchester
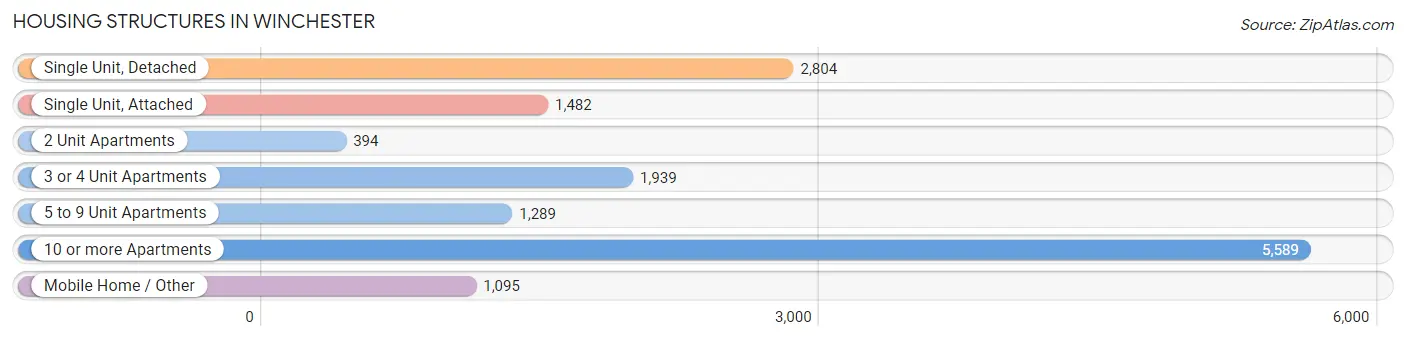
| Structure Type | # Housing Units | % Housing Units |
| Single Unit, Detached | 2,804 | 19.2% |
| Single Unit, Attached | 1,482 | 10.2% |
| 2 Unit Apartments | 394 | 2.7% |
| 3 or 4 Unit Apartments | 1,939 | 13.3% |
| 5 to 9 Unit Apartments | 1,289 | 8.8% |
| 10 or more Apartments | 5,589 | 38.3% |
| Mobile Home / Other | 1,095 | 7.5% |
| Total | 14,592 | 100.0% |
Housing Structures by Occupancy in Winchester
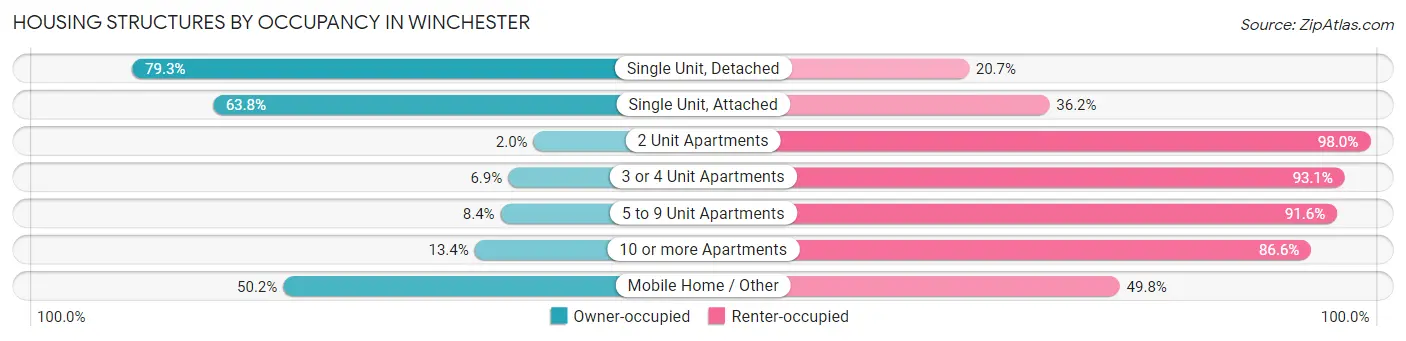
| Structure Type | Owner-occupied | Renter-occupied |
| Single Unit, Detached | 2,223 (79.3%) | 581 (20.7%) |
| Single Unit, Attached | 945 (63.8%) | 537 (36.2%) |
| 2 Unit Apartments | 8 (2.0%) | 386 (98.0%) |
| 3 or 4 Unit Apartments | 134 (6.9%) | 1,805 (93.1%) |
| 5 to 9 Unit Apartments | 108 (8.4%) | 1,181 (91.6%) |
| 10 or more Apartments | 747 (13.4%) | 4,842 (86.6%) |
| Mobile Home / Other | 550 (50.2%) | 545 (49.8%) |
| Total | 4,715 (32.3%) | 9,877 (67.7%) |
Housing Structures by Number of Rooms in Winchester
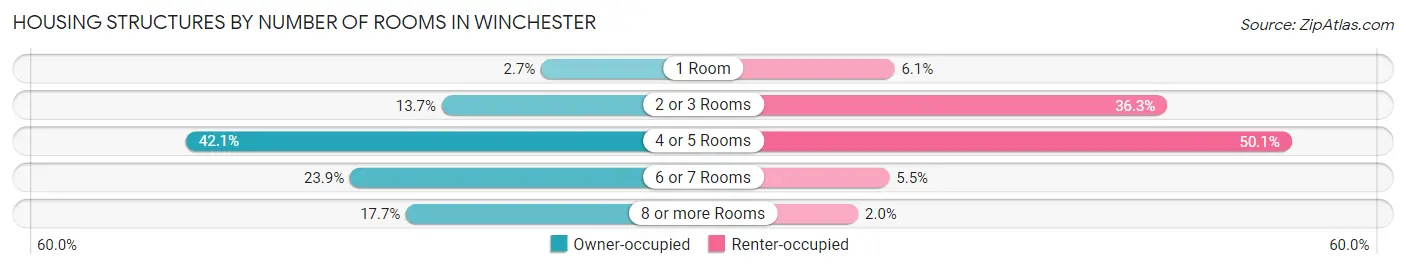
| Number of Rooms | Owner-occupied | Renter-occupied |
| 1 Room | 126 (2.7%) | 598 (6.0%) |
| 2 or 3 Rooms | 646 (13.7%) | 3,587 (36.3%) |
| 4 or 5 Rooms | 1,985 (42.1%) | 4,950 (50.1%) |
| 6 or 7 Rooms | 1,126 (23.9%) | 542 (5.5%) |
| 8 or more Rooms | 832 (17.6%) | 200 (2.0%) |
| Total | 4,715 (100.0%) | 9,877 (100.0%) |
Housing Structure by Heating Type in Winchester
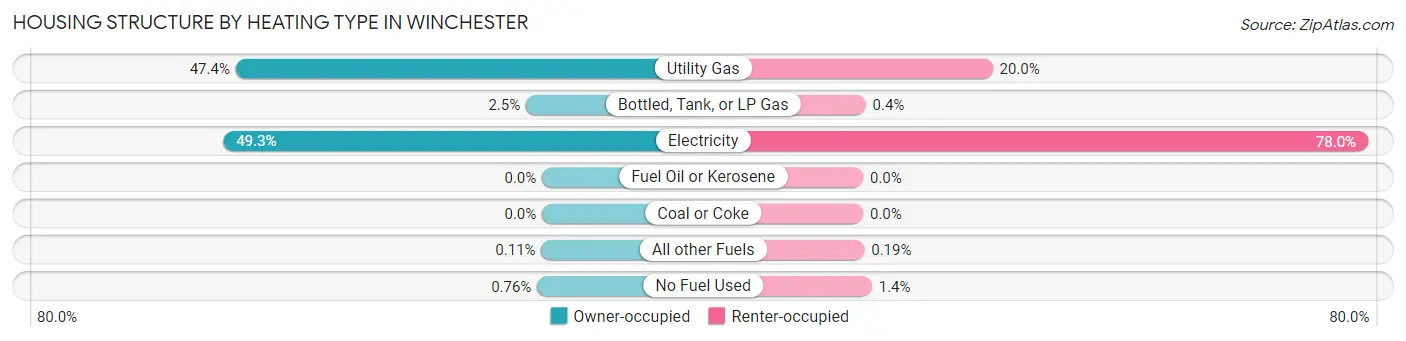
| Heating Type | Owner-occupied | Renter-occupied |
| Utility Gas | 2,233 (47.4%) | 1,977 (20.0%) |
| Bottled, Tank, or LP Gas | 117 (2.5%) | 40 (0.4%) |
| Electricity | 2,324 (49.3%) | 7,708 (78.0%) |
| Fuel Oil or Kerosene | 0 (0.0%) | 0 (0.0%) |
| Coal or Coke | 0 (0.0%) | 0 (0.0%) |
| All other Fuels | 5 (0.1%) | 19 (0.2%) |
| No Fuel Used | 36 (0.8%) | 133 (1.3%) |
| Total | 4,715 (100.0%) | 9,877 (100.0%) |
Household Vehicle Usage in Winchester
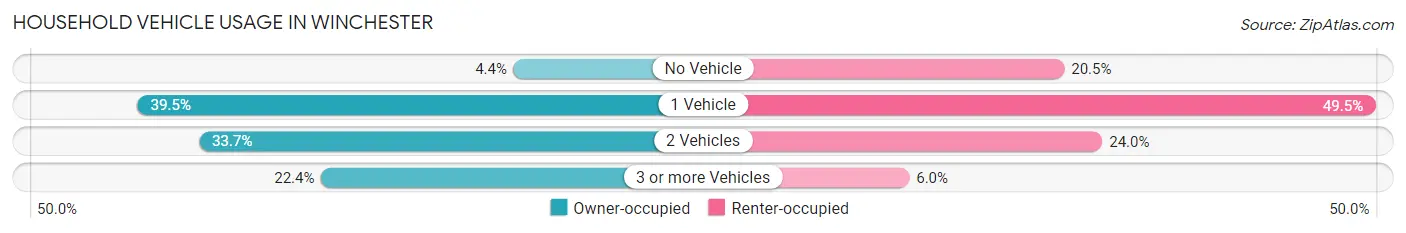
| Vehicles per Household | Owner-occupied | Renter-occupied |
| No Vehicle | 209 (4.4%) | 2,023 (20.5%) |
| 1 Vehicle | 1,860 (39.5%) | 4,887 (49.5%) |
| 2 Vehicles | 1,590 (33.7%) | 2,373 (24.0%) |
| 3 or more Vehicles | 1,056 (22.4%) | 594 (6.0%) |
| Total | 4,715 (100.0%) | 9,877 (100.0%) |
Real Estate & Mortgages in Winchester
Real Estate and Mortgage Overview in Winchester
| Characteristic | Without Mortgage | With Mortgage |
| Housing Units | 2,412 | 2,303 |
| Median Property Value | $234,000 | $272,100 |
| Median Household Income | $50,556 | $457 |
| Monthly Housing Costs | $422 | $174 |
| Real Estate Taxes | $872 | $190 |
Property Value by Mortgage Status in Winchester
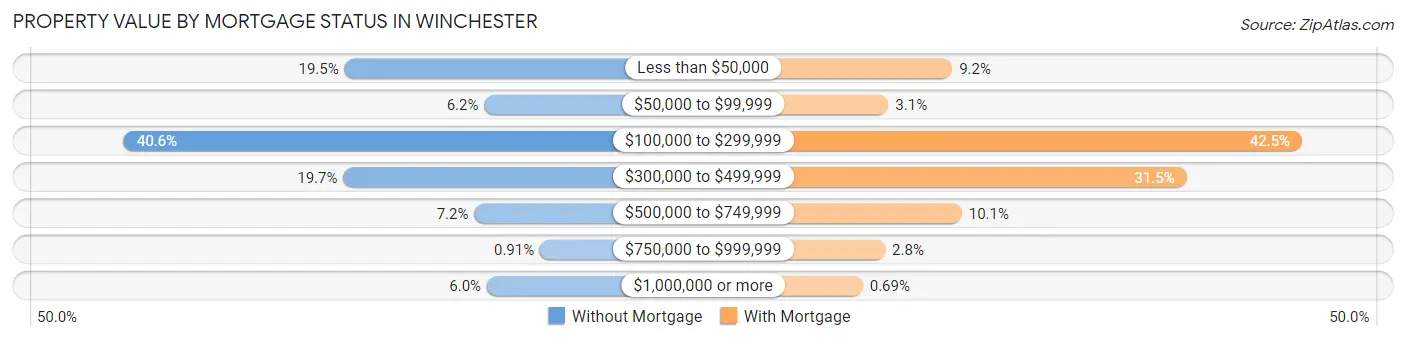
| Property Value | Without Mortgage | With Mortgage |
| Less than $50,000 | 471 (19.5%) | 212 (9.2%) |
| $50,000 to $99,999 | 150 (6.2%) | 72 (3.1%) |
| $100,000 to $299,999 | 978 (40.6%) | 979 (42.5%) |
| $300,000 to $499,999 | 474 (19.7%) | 726 (31.5%) |
| $500,000 to $749,999 | 173 (7.2%) | 233 (10.1%) |
| $750,000 to $999,999 | 22 (0.9%) | 65 (2.8%) |
| $1,000,000 or more | 144 (6.0%) | 16 (0.7%) |
| Total | 2,412 (100.0%) | 2,303 (100.0%) |
Household Income by Mortgage Status in Winchester
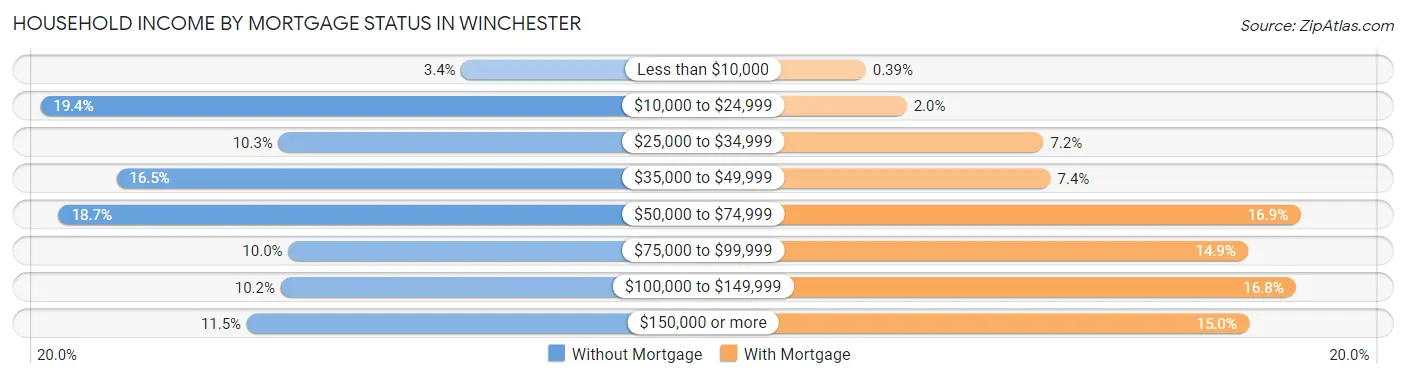
| Household Income | Without Mortgage | With Mortgage |
| Less than $10,000 | 81 (3.4%) | 9 (0.4%) |
| $10,000 to $24,999 | 468 (19.4%) | 45 (1.9%) |
| $25,000 to $34,999 | 249 (10.3%) | 165 (7.2%) |
| $35,000 to $49,999 | 398 (16.5%) | 171 (7.4%) |
| $50,000 to $74,999 | 451 (18.7%) | 390 (16.9%) |
| $75,000 to $99,999 | 240 (10.0%) | 344 (14.9%) |
| $100,000 to $149,999 | 247 (10.2%) | 386 (16.8%) |
| $150,000 or more | 278 (11.5%) | 345 (15.0%) |
| Total | 2,412 (100.0%) | 2,303 (100.0%) |
Property Value to Household Income Ratio in Winchester
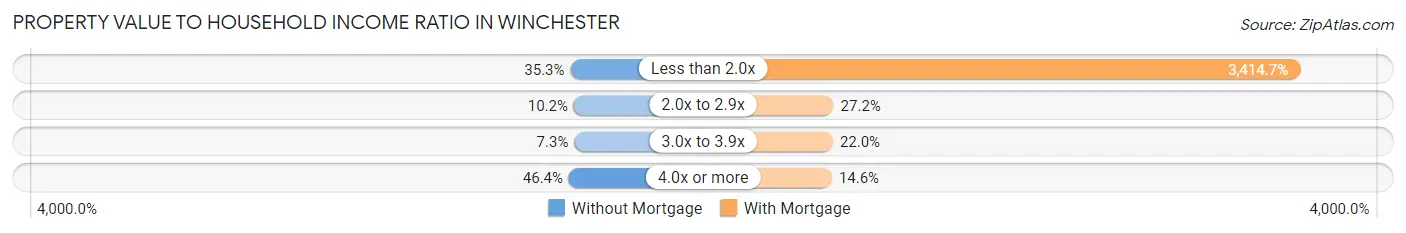
| Value-to-Income Ratio | Without Mortgage | With Mortgage |
| Less than 2.0x | 852 (35.3%) | 78,641 (3,414.7%) |
| 2.0x to 2.9x | 247 (10.2%) | 626 (27.2%) |
| 3.0x to 3.9x | 175 (7.3%) | 507 (22.0%) |
| 4.0x or more | 1,118 (46.4%) | 337 (14.6%) |
| Total | 2,412 (100.0%) | 2,303 (100.0%) |
Real Estate Taxes by Mortgage Status in Winchester
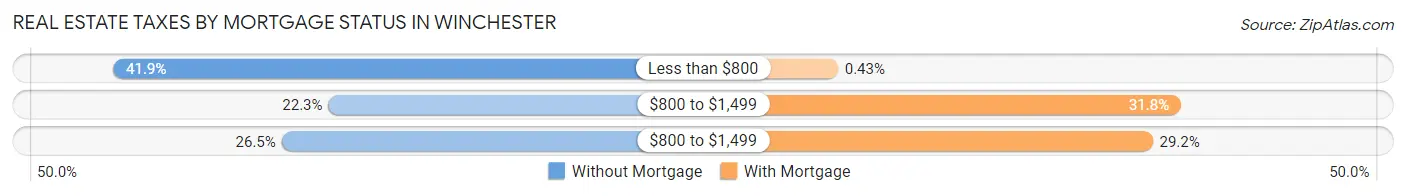
| Property Taxes | Without Mortgage | With Mortgage |
| Less than $800 | 1,011 (41.9%) | 10 (0.4%) |
| $800 to $1,499 | 537 (22.3%) | 732 (31.8%) |
| $800 to $1,499 | 640 (26.5%) | 672 (29.2%) |
| Total | 2,412 (100.0%) | 2,303 (100.0%) |
Health & Disability in Winchester
Health Insurance Coverage by Age in Winchester
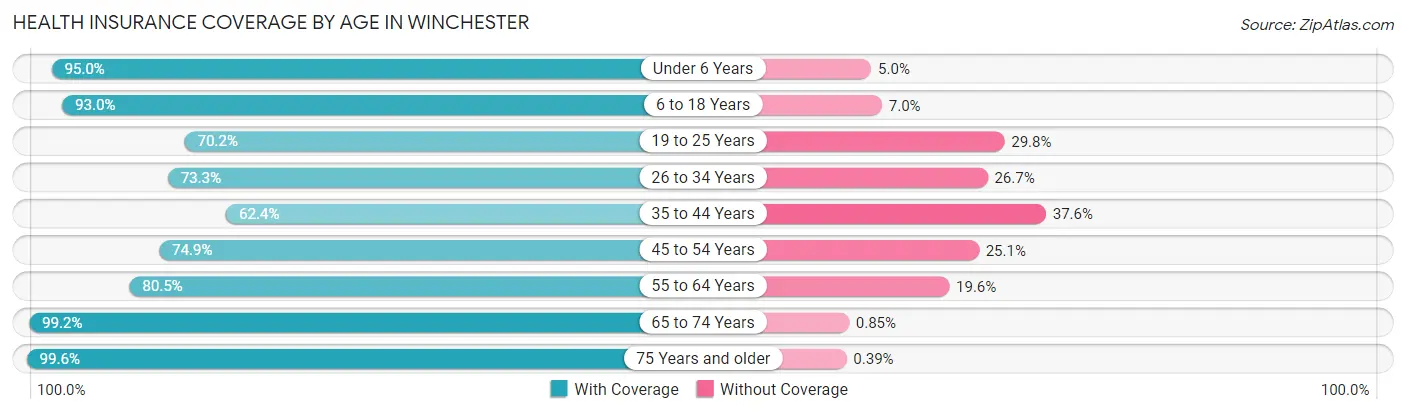
| Age Bracket | With Coverage | Without Coverage |
| Under 6 Years | 2,714 (95.0%) | 143 (5.0%) |
| 6 to 18 Years | 5,943 (93.0%) | 448 (7.0%) |
| 19 to 25 Years | 2,875 (70.2%) | 1,222 (29.8%) |
| 26 to 34 Years | 3,803 (73.3%) | 1,385 (26.7%) |
| 35 to 44 Years | 2,946 (62.4%) | 1,773 (37.6%) |
| 45 to 54 Years | 4,182 (74.9%) | 1,399 (25.1%) |
| 55 to 64 Years | 3,231 (80.4%) | 785 (19.6%) |
| 65 to 74 Years | 3,027 (99.2%) | 26 (0.9%) |
| 75 Years and older | 1,539 (99.6%) | 6 (0.4%) |
| Total | 30,260 (80.8%) | 7,187 (19.2%) |
Health Insurance Coverage by Citizenship Status in Winchester
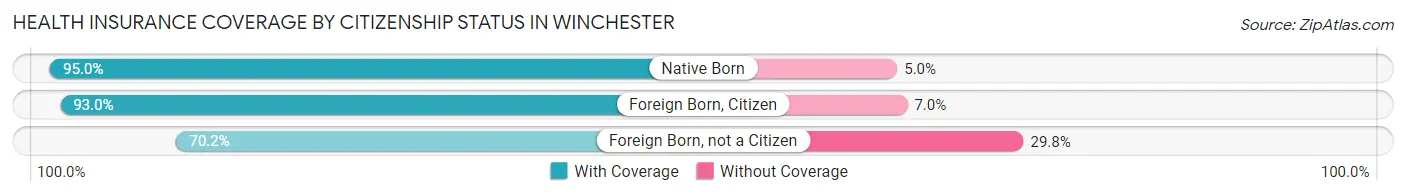
| Citizenship Status | With Coverage | Without Coverage |
| Native Born | 2,714 (95.0%) | 143 (5.0%) |
| Foreign Born, Citizen | 5,943 (93.0%) | 448 (7.0%) |
| Foreign Born, not a Citizen | 2,875 (70.2%) | 1,222 (29.8%) |
Health Insurance Coverage by Household Income in Winchester
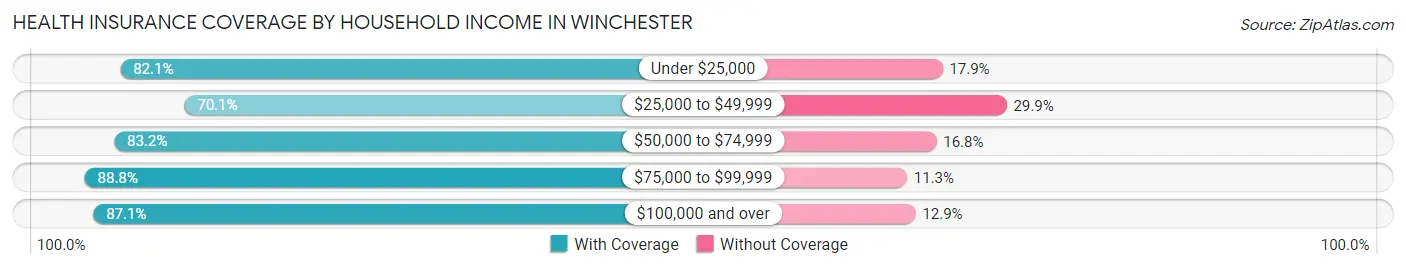
| Household Income | With Coverage | Without Coverage |
| Under $25,000 | 5,625 (82.1%) | 1,228 (17.9%) |
| $25,000 to $49,999 | 7,568 (70.1%) | 3,231 (29.9%) |
| $50,000 to $74,999 | 5,962 (83.2%) | 1,201 (16.8%) |
| $75,000 to $99,999 | 5,183 (88.7%) | 657 (11.3%) |
| $100,000 and over | 5,886 (87.1%) | 869 (12.9%) |
Public vs Private Health Insurance Coverage by Age in Winchester
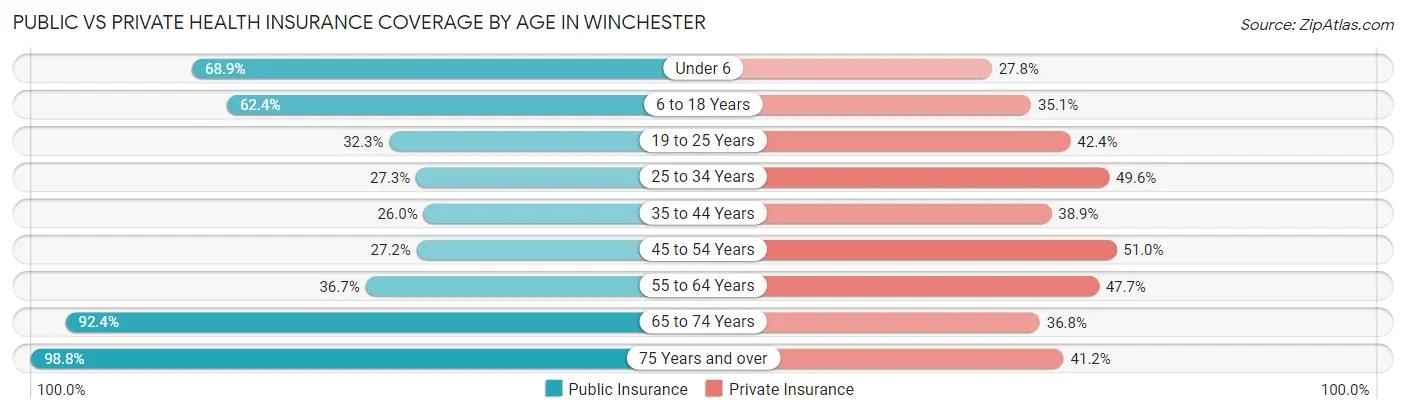
| Age Bracket | Public Insurance | Private Insurance |
| Under 6 | 1,969 (68.9%) | 795 (27.8%) |
| 6 to 18 Years | 3,990 (62.4%) | 2,246 (35.1%) |
| 19 to 25 Years | 1,324 (32.3%) | 1,738 (42.4%) |
| 25 to 34 Years | 1,418 (27.3%) | 2,575 (49.6%) |
| 35 to 44 Years | 1,225 (26.0%) | 1,835 (38.9%) |
| 45 to 54 Years | 1,520 (27.2%) | 2,844 (51.0%) |
| 55 to 64 Years | 1,475 (36.7%) | 1,915 (47.7%) |
| 65 to 74 Years | 2,821 (92.4%) | 1,122 (36.7%) |
| 75 Years and over | 1,526 (98.8%) | 636 (41.2%) |
| Total | 17,268 (46.1%) | 15,706 (41.9%) |
Disability Status by Sex by Age in Winchester
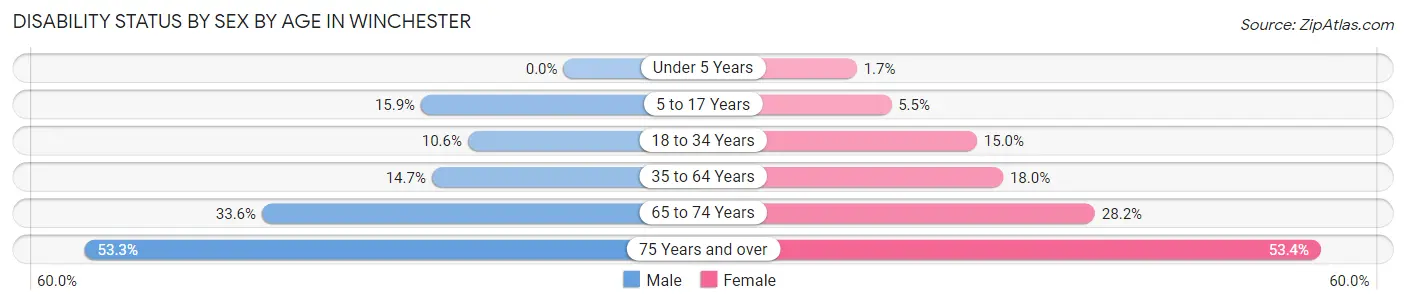
| Age Bracket | Male | Female |
| Under 5 Years | 0 (0.0%) | 17 (1.7%) |
| 5 to 17 Years | 562 (15.9%) | 175 (5.5%) |
| 18 to 34 Years | 568 (10.6%) | 644 (15.0%) |
| 35 to 64 Years | 1,103 (14.7%) | 1,219 (17.9%) |
| 65 to 74 Years | 601 (33.6%) | 356 (28.2%) |
| 75 Years and over | 378 (53.3%) | 446 (53.3%) |
Disability Class by Sex by Age in Winchester
Disability Class: Hearing Difficulty
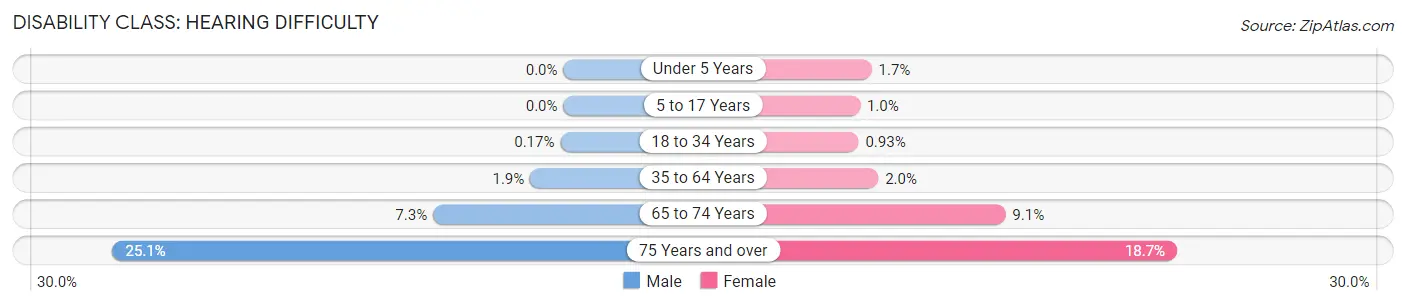
| Age Bracket | Male | Female |
| Under 5 Years | 0 (0.0%) | 17 (1.7%) |
| 5 to 17 Years | 0 (0.0%) | 32 (1.0%) |
| 18 to 34 Years | 9 (0.2%) | 40 (0.9%) |
| 35 to 64 Years | 139 (1.8%) | 138 (2.0%) |
| 65 to 74 Years | 130 (7.3%) | 115 (9.1%) |
| 75 Years and over | 178 (25.1%) | 156 (18.7%) |
Disability Class: Vision Difficulty
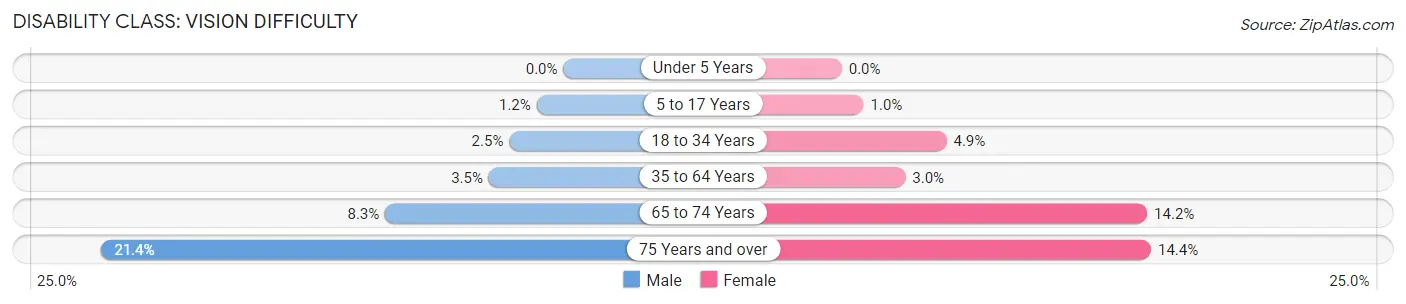
| Age Bracket | Male | Female |
| Under 5 Years | 0 (0.0%) | 0 (0.0%) |
| 5 to 17 Years | 44 (1.2%) | 32 (1.0%) |
| 18 to 34 Years | 134 (2.5%) | 208 (4.9%) |
| 35 to 64 Years | 260 (3.5%) | 200 (2.9%) |
| 65 to 74 Years | 148 (8.3%) | 179 (14.2%) |
| 75 Years and over | 152 (21.4%) | 120 (14.3%) |
Disability Class: Cognitive Difficulty
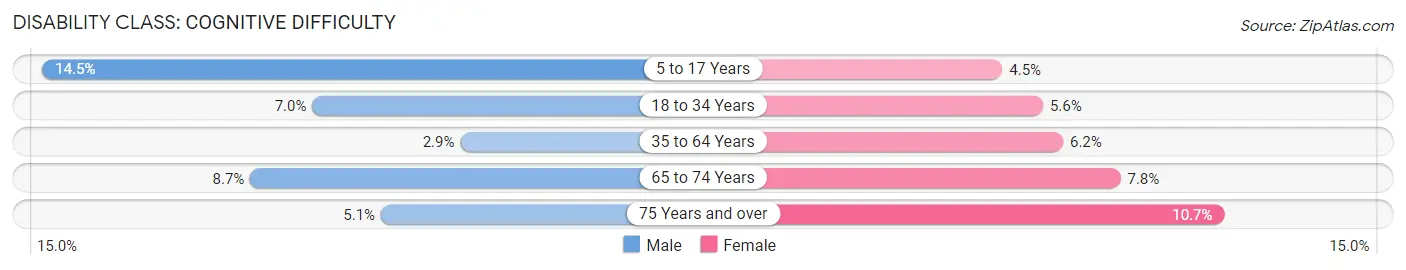
| Age Bracket | Male | Female |
| 5 to 17 Years | 514 (14.5%) | 142 (4.5%) |
| 18 to 34 Years | 373 (7.0%) | 240 (5.6%) |
| 35 to 64 Years | 216 (2.9%) | 418 (6.2%) |
| 65 to 74 Years | 156 (8.7%) | 98 (7.8%) |
| 75 Years and over | 36 (5.1%) | 89 (10.6%) |
Disability Class: Ambulatory Difficulty
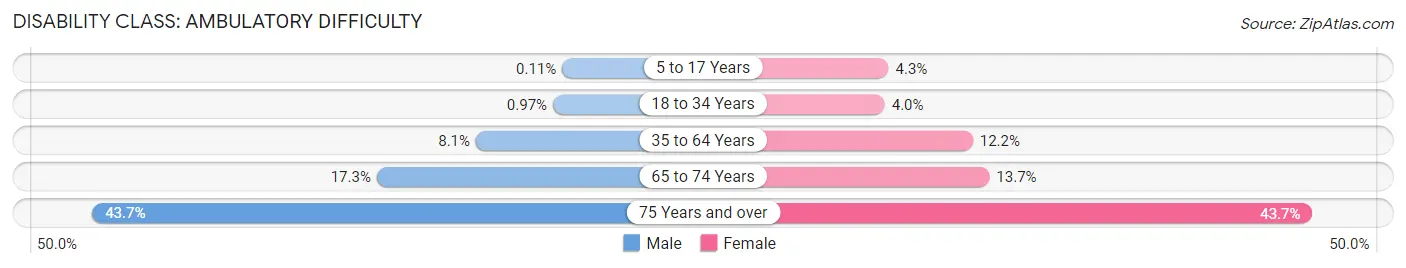
| Age Bracket | Male | Female |
| 5 to 17 Years | 4 (0.1%) | 138 (4.3%) |
| 18 to 34 Years | 52 (1.0%) | 171 (4.0%) |
| 35 to 64 Years | 611 (8.1%) | 826 (12.2%) |
| 65 to 74 Years | 310 (17.3%) | 173 (13.7%) |
| 75 Years and over | 310 (43.7%) | 365 (43.7%) |
Disability Class: Self-Care Difficulty
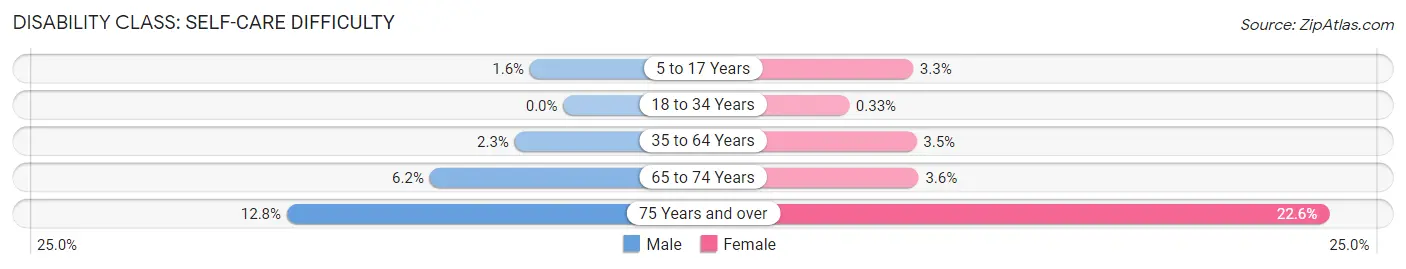
| Age Bracket | Male | Female |
| 5 to 17 Years | 55 (1.5%) | 105 (3.3%) |
| 18 to 34 Years | 0 (0.0%) | 14 (0.3%) |
| 35 to 64 Years | 170 (2.3%) | 235 (3.5%) |
| 65 to 74 Years | 111 (6.2%) | 45 (3.6%) |
| 75 Years and over | 91 (12.8%) | 189 (22.6%) |
Technology Access in Winchester
Computing Device Access in Winchester
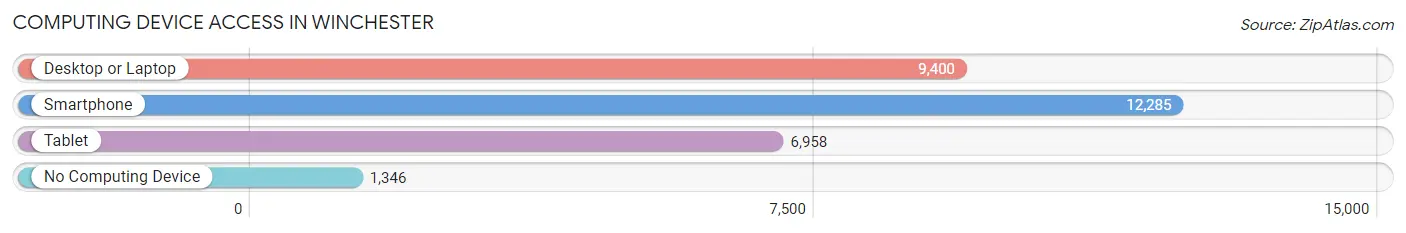
| Device Type | # Households | % Households |
| Desktop or Laptop | 9,400 | 64.4% |
| Smartphone | 12,285 | 84.2% |
| Tablet | 6,958 | 47.7% |
| No Computing Device | 1,346 | 9.2% |
| Total | 14,592 | 100.0% |
Internet Access in Winchester
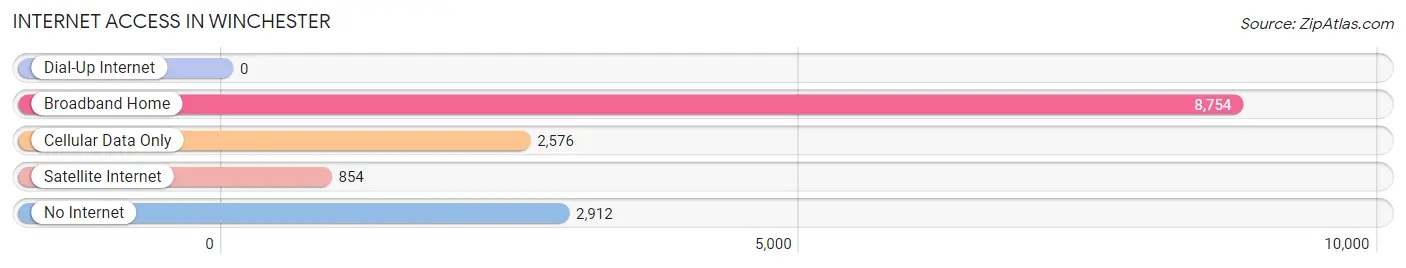
| Internet Type | # Households | % Households |
| Dial-Up Internet | 0 | 0.0% |
| Broadband Home | 8,754 | 60.0% |
| Cellular Data Only | 2,576 | 17.6% |
| Satellite Internet | 854 | 5.9% |
| No Internet | 2,912 | 20.0% |
| Total | 14,592 | 100.0% |
Winchester Summary
Winchester is a census-designated place (CDP) located in Clark County, Nevada, United States. The population was 27,978 at the 2010 census. It is part of the Las Vegas–Paradise–Henderson Metropolitan Statistical Area.
History
The area that is now Winchester was first settled in the late 19th century by ranchers and farmers. The area was originally known as Paradise Valley, but was renamed Winchester in the early 20th century after the Winchester Repeating Arms Company. The company had purchased a large tract of land in the area and was planning to build a factory there. The plans never materialized, but the name stuck.
Geography
Winchester is located at 36°3′25″N 115°7′17″W (36.056944, -115.121389). According to the United States Census Bureau, the CDP has a total area of 8.3 square miles (21.5 km2), all of it land.
Economy
Winchester is home to several businesses, including a number of casinos, restaurants, and retail stores. The city is also home to a number of industrial and manufacturing companies, including a large solar panel manufacturing plant.
Demographics
As of the census of 2000, there were 27,978 people, 10,845 households, and 7,845 families residing in the CDP. The population density was 3,364.3 people per square mile (1,299.3/km2). There were 11,845 housing units at an average density of 1,427.2 per square mile (551.3/km2). The racial makeup of the CDP was 68.2% White, 8.2% African American, 0.7% Native American, 4.3% Asian, 0.3% Pacific Islander, 13.7% from other races, and 4.4% from two or more races. Hispanic or Latino of any race were 24.2% of the population.
There were 10,845 households out of which 33.2% had children under the age of 18 living with them, 54.2% were married couples living together, 12.2% had a female householder with no husband present, and 28.2% were non-families. 21.2% of all households were made up of individuals and 5.2% had someone living alone who was 65 years of age or older. The average household size was 2.58 and the average family size was 3.02.
In the CDP, the population was spread out with 25.2% under the age of 18, 8.2% from 18 to 24, 32.2% from 25 to 44, 24.2% from 45 to 64, and 10.2% who were 65 years of age or older. The median age was 36 years. For every 100 females, there were 97.2 males. For every 100 females age 18 and over, there were 94.2 males.
The median income for a household in the CDP was $45,837, and the median income for a family was $50,837. Males had a median income of $35,837 versus $27,837 for females. The per capita income for the CDP was $20,837. About 8.2% of families and 11.2% of the population were below the poverty line, including 15.2% of those under age 18 and 8.2% of those age 65 or over.
Common Questions
What is Per Capita Income in Winchester?
Per Capita income in Winchester is $27,047.
What is the Median Family Income in Winchester?
Median Family Income in Winchester is $48,613.
What is the Median Household income in Winchester?
Median Household Income in Winchester is $45,709.
What is Income or Wage Gap in Winchester?
Income or Wage Gap in Winchester is 10.3%.
Women in Winchester earn 89.7 cents for every dollar earned by a man.
What is Family Income Deficit in Winchester?
Family Income Deficit in Winchester is $11,692.
Families that are below poverty line in Winchester earn $11,692 less on average than the poverty threshold level.
What is Inequality or Gini Index in Winchester?
Inequality or Gini Index in Winchester is 0.49.
What is the Total Population of Winchester?
Total Population of Winchester is 37,531.
What is the Total Male Population of Winchester?
Total Male Population of Winchester is 20,113.
What is the Total Female Population of Winchester?
Total Female Population of Winchester is 17,418.
What is the Ratio of Males per 100 Females in Winchester?
There are 115.47 Males per 100 Females in Winchester.
What is the Ratio of Females per 100 Males in Winchester?
There are 86.60 Females per 100 Males in Winchester.
What is the Median Population Age in Winchester?
Median Population Age in Winchester is 35.3 Years.
What is the Average Family Size in Winchester
Average Family Size in Winchester is 3.4 People.
What is the Average Household Size in Winchester
Average Household Size in Winchester is 2.6 People.
How Large is the Labor Force in Winchester?
There are 18,751 People in the Labor Forcein in Winchester.
What is the Percentage of People in the Labor Force in Winchester?
63.6% of People are in the Labor Force in Winchester.
What is the Unemployment Rate in Winchester?
Unemployment Rate in Winchester is 8.4%.