Bossier City, LA Map & Demographics
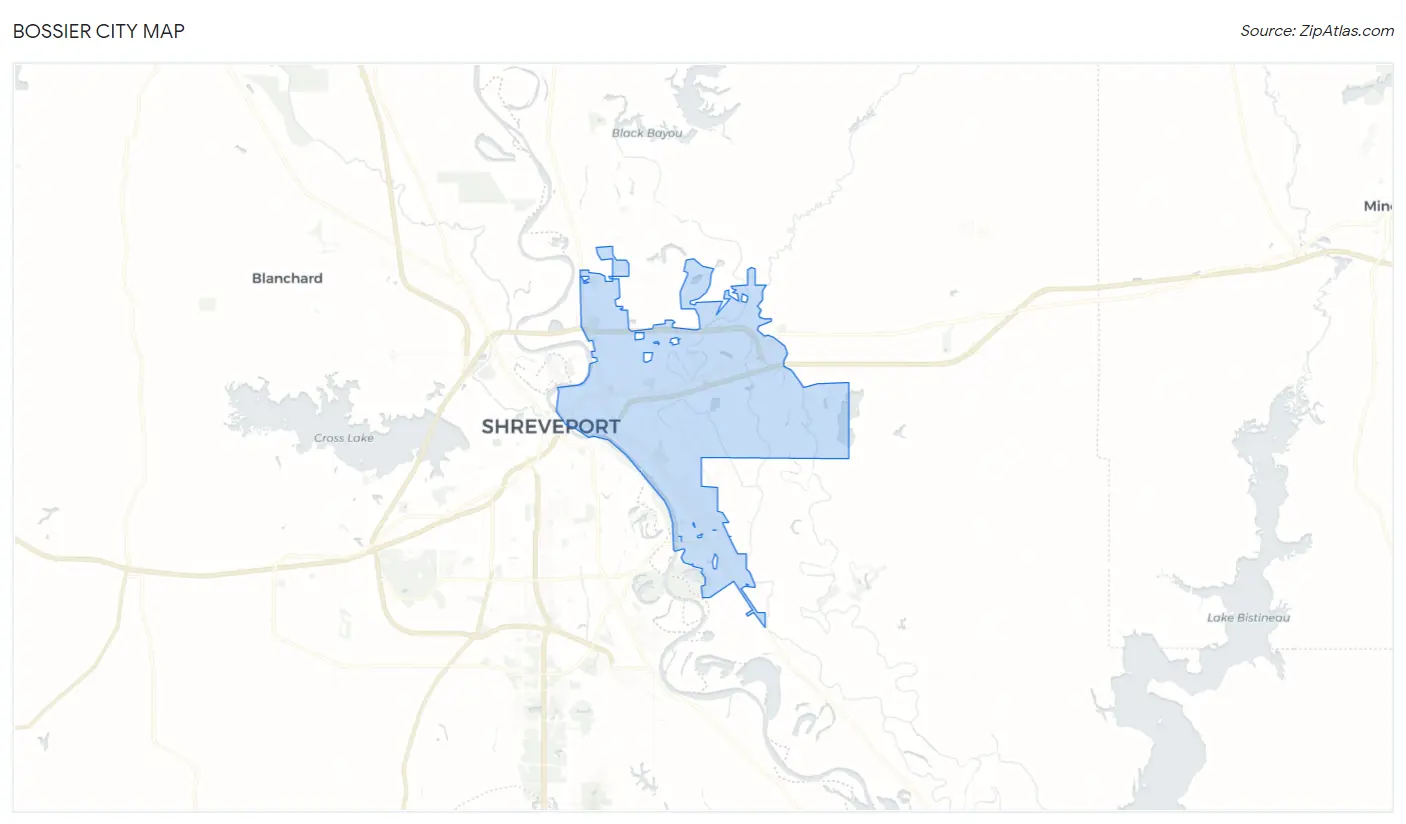
Bossier City Map
Bossier City Overview
$30,737
PER CAPITA INCOME
$68,272
AVG FAMILY INCOME
$54,100
AVG HOUSEHOLD INCOME
33.9%
WAGE / INCOME GAP [ % ]
66.1¢/ $1
WAGE / INCOME GAP [ $ ]
$11,464
FAMILY INCOME DEFICIT
0.46
INEQUALITY / GINI INDEX
62,971
TOTAL POPULATION
31,329
MALE POPULATION
31,642
FEMALE POPULATION
99.01
MALES / 100 FEMALES
101.00
FEMALES / 100 MALES
35.1
MEDIAN AGE
3.2
AVG FAMILY SIZE
2.5
AVG HOUSEHOLD SIZE
29,826
LABOR FORCE [ PEOPLE ]
60.0%
PERCENT IN LABOR FORCE
5.8%
UNEMPLOYMENT RATE
Bossier City Area Codes
Income in Bossier City
Income Overview in Bossier City
Per Capita Income in Bossier City is $30,737, while median incomes of families and households are $68,272 and $54,100 respectively.
| Characteristic | Number | Measure |
| Per Capita Income | 62,971 | $30,737 |
| Median Family Income | 14,685 | $68,272 |
| Mean Family Income | 14,685 | $86,566 |
| Median Household Income | 24,439 | $54,100 |
| Mean Household Income | 24,439 | $74,058 |
| Income Deficit | 14,685 | $11,464 |
| Wage / Income Gap (%) | 62,971 | 33.86% |
| Wage / Income Gap ($) | 62,971 | 66.14¢ per $1 |
| Gini / Inequality Index | 62,971 | 0.46 |
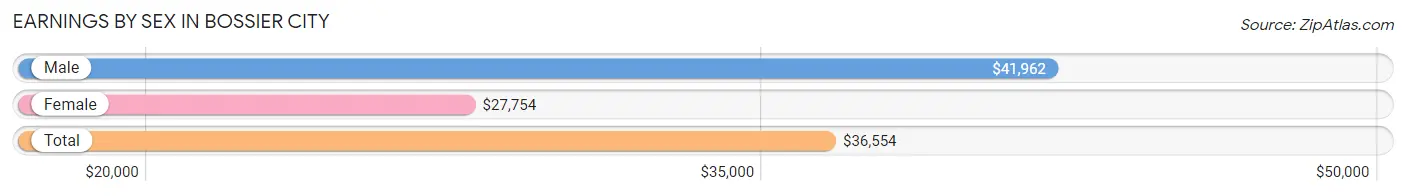
Earnings by Sex in Bossier City
Average Earnings in Bossier City are $36,554, $41,962 for men and $27,754 for women, a difference of 33.9%.
| Sex | Number | Average Earnings |
| Male | 16,941 (54.9%) | $41,962 |
| Female | 13,922 (45.1%) | $27,754 |
| Total | 30,863 (100.0%) | $36,554 |
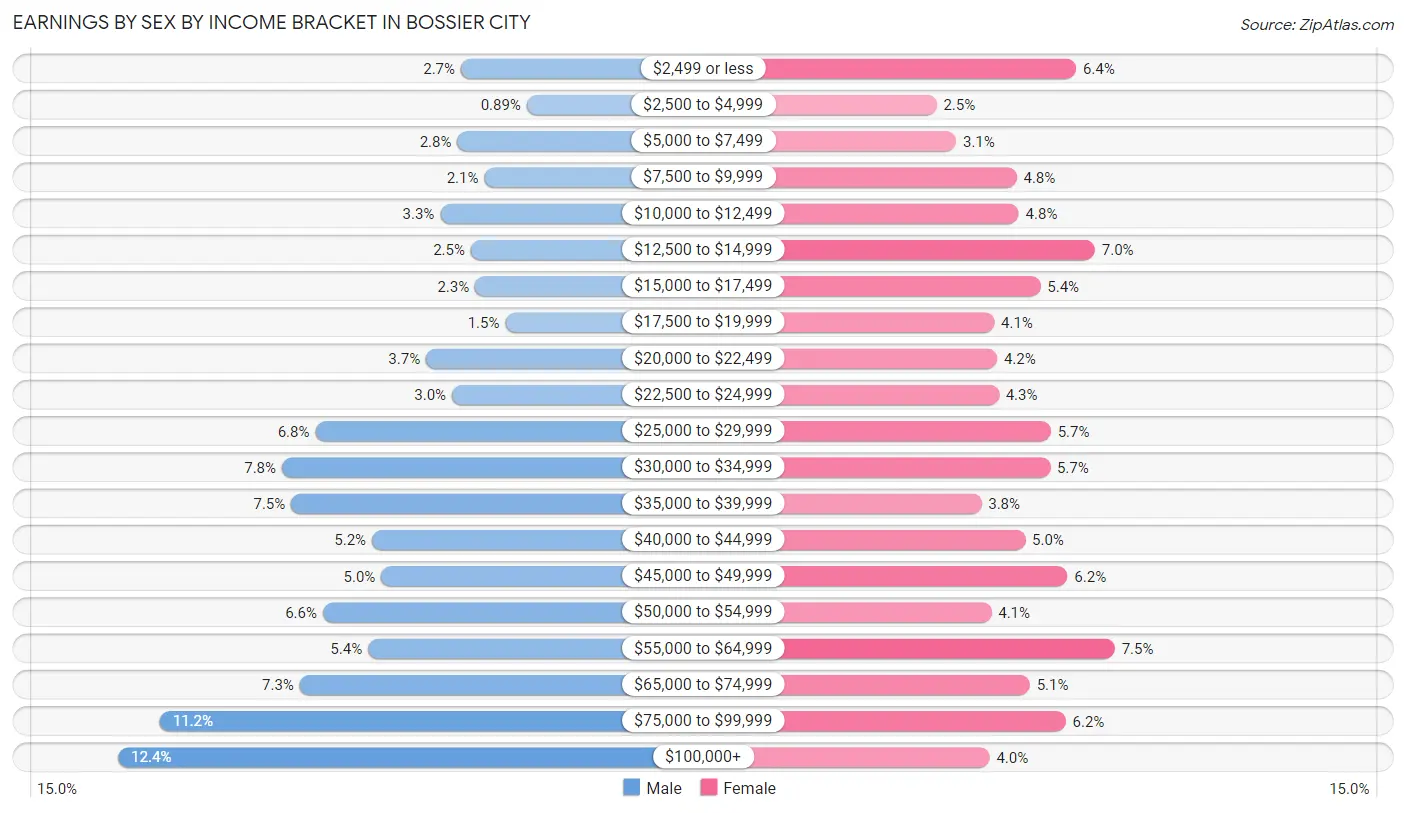
Earnings by Sex by Income Bracket in Bossier City
The most common earnings brackets in Bossier City are $100,000+ for men (2,095 | 12.4%) and $55,000 to $64,999 for women (1,049 | 7.5%).
| Income | Male | Female |
| $2,499 or less | 465 (2.7%) | 896 (6.4%) |
| $2,500 to $4,999 | 150 (0.9%) | 351 (2.5%) |
| $5,000 to $7,499 | 481 (2.8%) | 428 (3.1%) |
| $7,500 to $9,999 | 352 (2.1%) | 664 (4.8%) |
| $10,000 to $12,499 | 562 (3.3%) | 673 (4.8%) |
| $12,500 to $14,999 | 416 (2.5%) | 971 (7.0%) |
| $15,000 to $17,499 | 397 (2.3%) | 757 (5.4%) |
| $17,500 to $19,999 | 253 (1.5%) | 576 (4.1%) |
| $20,000 to $22,499 | 631 (3.7%) | 588 (4.2%) |
| $22,500 to $24,999 | 506 (3.0%) | 595 (4.3%) |
| $25,000 to $29,999 | 1,157 (6.8%) | 798 (5.7%) |
| $30,000 to $34,999 | 1,316 (7.8%) | 795 (5.7%) |
| $35,000 to $39,999 | 1,272 (7.5%) | 526 (3.8%) |
| $40,000 to $44,999 | 888 (5.2%) | 697 (5.0%) |
| $45,000 to $49,999 | 843 (5.0%) | 863 (6.2%) |
| $50,000 to $54,999 | 1,121 (6.6%) | 565 (4.1%) |
| $55,000 to $64,999 | 906 (5.3%) | 1,049 (7.5%) |
| $65,000 to $74,999 | 1,232 (7.3%) | 716 (5.1%) |
| $75,000 to $99,999 | 1,898 (11.2%) | 856 (6.1%) |
| $100,000+ | 2,095 (12.4%) | 558 (4.0%) |
| Total | 16,941 (100.0%) | 13,922 (100.0%) |
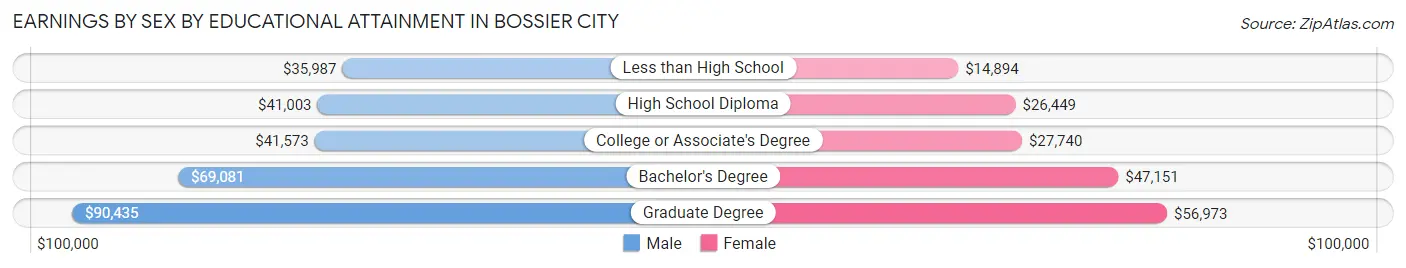
Earnings by Sex by Educational Attainment in Bossier City
Average earnings in Bossier City are $49,269 for men and $31,444 for women, a difference of 36.2%. Men with an educational attainment of graduate degree enjoy the highest average annual earnings of $90,435, while those with less than high school education earn the least with $35,987. Women with an educational attainment of graduate degree earn the most with the average annual earnings of $56,973, while those with less than high school education have the smallest earnings of $14,894.
| Educational Attainment | Male Income | Female Income |
| Less than High School | $35,987 | $14,894 |
| High School Diploma | $41,003 | $26,449 |
| College or Associate's Degree | $41,573 | $27,740 |
| Bachelor's Degree | $69,081 | $47,151 |
| Graduate Degree | $90,435 | $56,973 |
| Total | $49,269 | $31,444 |
Family Income in Bossier City
Family Income Brackets in Bossier City
According to the Bossier City family income data, there are 3,084 families falling into the $100,000 to $149,999 income range, which is the most common income bracket and makes up 21.0% of all families. Conversely, the $10,000 to $14,999 income bracket is the least frequent group with only 485 families (3.3%) belonging to this category.
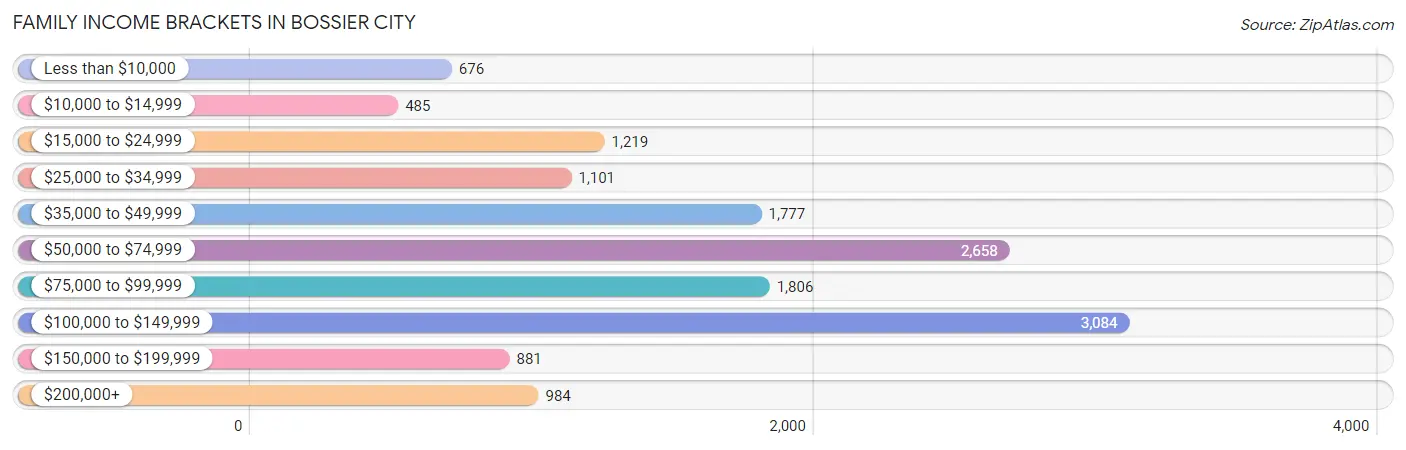
| Income Bracket | # Families | % Families |
| Less than $10,000 | 676 | 4.6% |
| $10,000 to $14,999 | 485 | 3.3% |
| $15,000 to $24,999 | 1,219 | 8.3% |
| $25,000 to $34,999 | 1,101 | 7.5% |
| $35,000 to $49,999 | 1,777 | 12.1% |
| $50,000 to $74,999 | 2,658 | 18.1% |
| $75,000 to $99,999 | 1,806 | 12.3% |
| $100,000 to $149,999 | 3,084 | 21.0% |
| $150,000 to $199,999 | 881 | 6.0% |
| $200,000+ | 984 | 6.7% |
Family Income by Famaliy Size in Bossier City
3-person families (3,786 | 25.8%) account for the highest median family income in Bossier City with $77,622 per family, while 2-person families (6,346 | 43.2%) have the highest median income of $33,806 per family member.
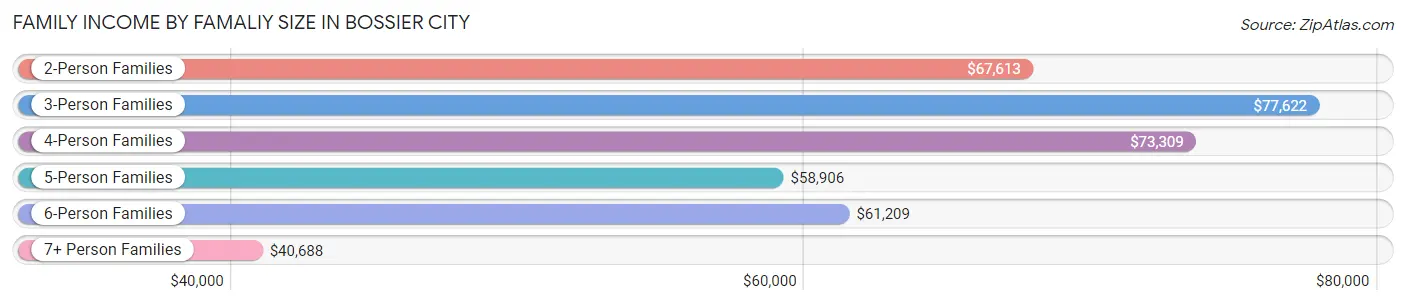
| Income Bracket | # Families | Median Income |
| 2-Person Families | 6,346 (43.2%) | $67,613 |
| 3-Person Families | 3,786 (25.8%) | $77,622 |
| 4-Person Families | 2,802 (19.1%) | $73,309 |
| 5-Person Families | 1,223 (8.3%) | $58,906 |
| 6-Person Families | 275 (1.9%) | $61,209 |
| 7+ Person Families | 253 (1.7%) | $40,688 |
| Total | 14,685 (100.0%) | $68,272 |
Family Income by Number of Earners in Bossier City
The median family income in Bossier City is $68,272, with families comprising 3+ earners (1,204) having the highest median family income of $124,079, while families with no earners (2,208) have the lowest median family income of $24,821, accounting for 8.2% and 15.0% of families, respectively.
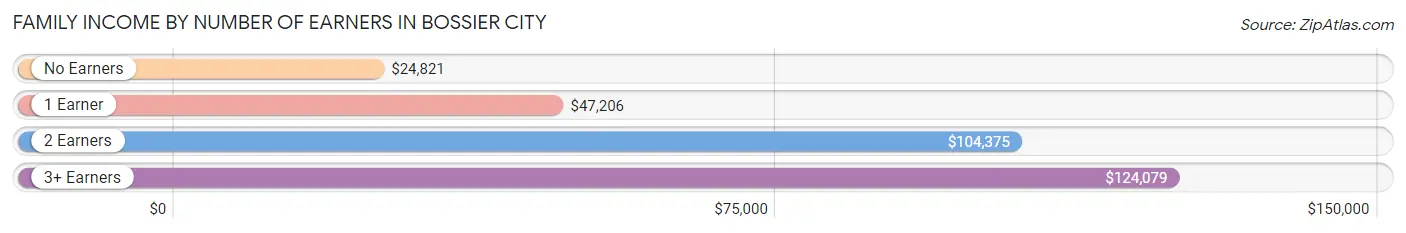
| Number of Earners | # Families | Median Income |
| No Earners | 2,208 (15.0%) | $24,821 |
| 1 Earner | 5,780 (39.4%) | $47,206 |
| 2 Earners | 5,493 (37.4%) | $104,375 |
| 3+ Earners | 1,204 (8.2%) | $124,079 |
| Total | 14,685 (100.0%) | $68,272 |
Household Income in Bossier City
Household Income Brackets in Bossier City
With 3,984 households falling in the category, the $50,000 to $74,999 income range is the most frequent in Bossier City, accounting for 16.3% of all households. In contrast, only 1,124 households (4.6%) fall into the $200,000+ income bracket, making it the least populous group.
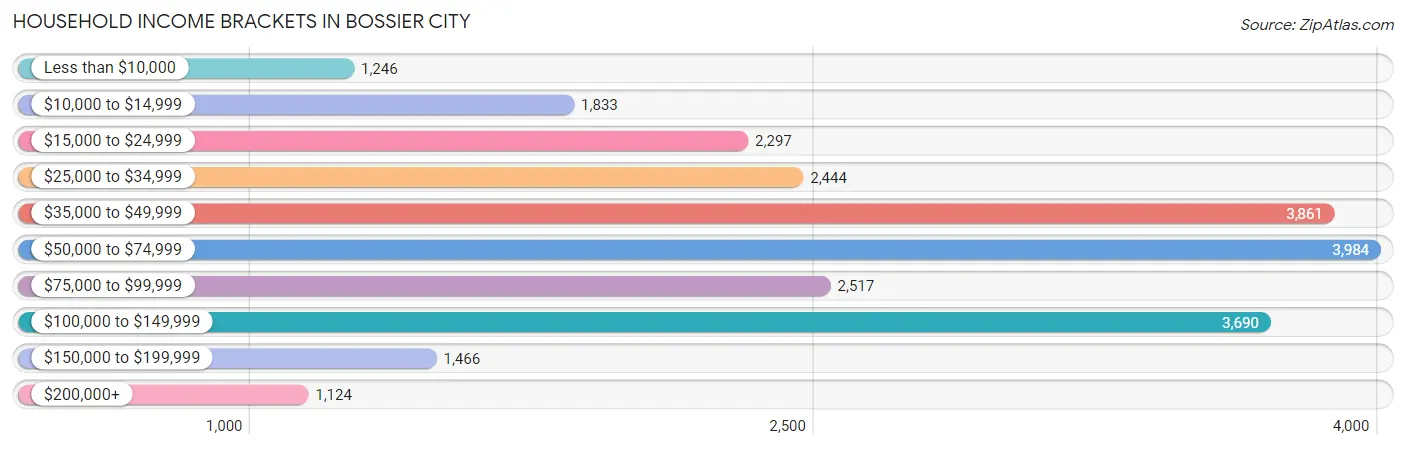
| Income Bracket | # Households | % Households |
| Less than $10,000 | 1,246 | 5.1% |
| $10,000 to $14,999 | 1,833 | 7.5% |
| $15,000 to $24,999 | 2,297 | 9.4% |
| $25,000 to $34,999 | 2,444 | 10.0% |
| $35,000 to $49,999 | 3,861 | 15.8% |
| $50,000 to $74,999 | 3,984 | 16.3% |
| $75,000 to $99,999 | 2,517 | 10.3% |
| $100,000 to $149,999 | 3,690 | 15.1% |
| $150,000 to $199,999 | 1,466 | 6.0% |
| $200,000+ | 1,124 | 4.6% |
Household Income by Householder Age in Bossier City
The median household income in Bossier City is $54,100, with the highest median household income of $60,377 found in the 45 to 64 years age bracket for the primary householder. A total of 7,469 households (30.6%) fall into this category. Meanwhile, the 65+ years age bracket for the primary householder has the lowest median household income of $44,144, with 5,648 households (23.1%) in this group.
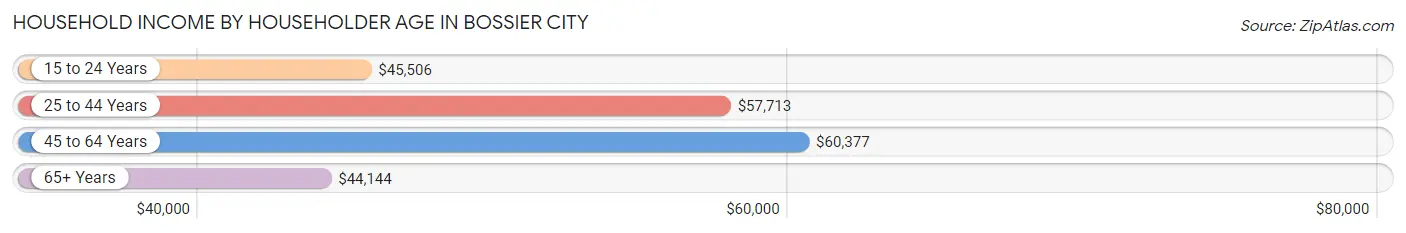
| Income Bracket | # Households | Median Income |
| 15 to 24 Years | 1,319 (5.4%) | $45,506 |
| 25 to 44 Years | 10,003 (40.9%) | $57,713 |
| 45 to 64 Years | 7,469 (30.6%) | $60,377 |
| 65+ Years | 5,648 (23.1%) | $44,144 |
| Total | 24,439 (100.0%) | $54,100 |
Poverty in Bossier City
Income Below Poverty by Sex and Age in Bossier City
With 19.6% poverty level for males and 21.1% for females among the residents of Bossier City, 5 year old males and under 5 year old females are the most vulnerable to poverty, with 212 males (57.8%) and 1,117 females (50.2%) in their respective age groups living below the poverty level.
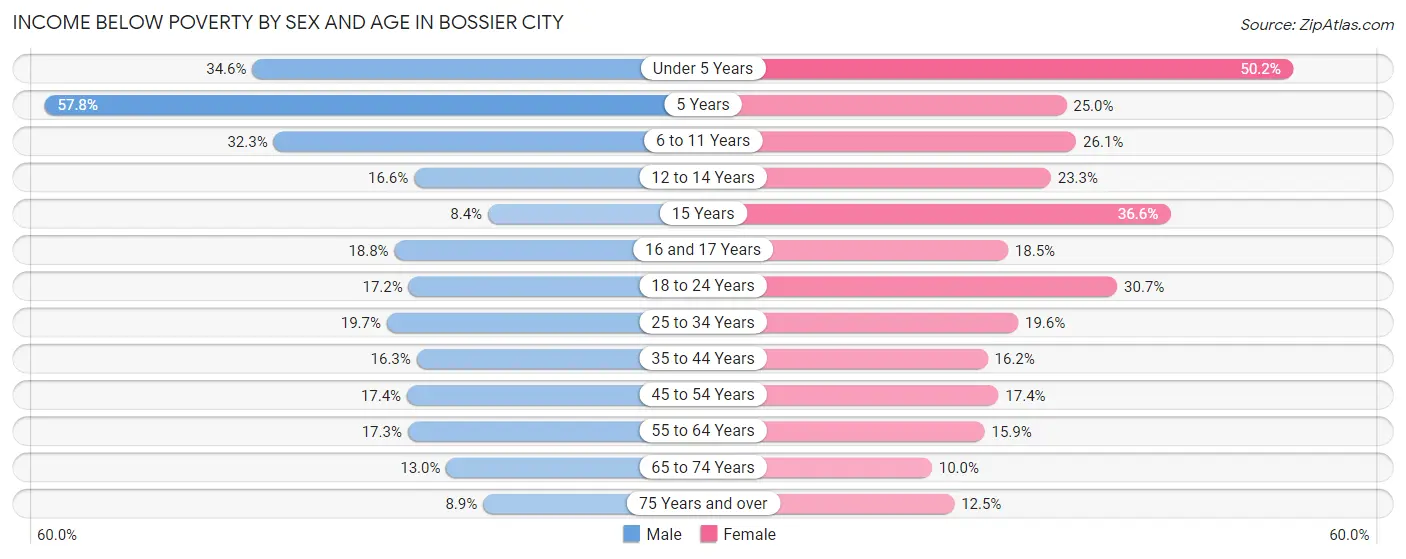
| Age Bracket | Male | Female |
| Under 5 Years | 752 (34.6%) | 1,117 (50.2%) |
| 5 Years | 212 (57.8%) | 80 (25.0%) |
| 6 to 11 Years | 725 (32.3%) | 541 (26.1%) |
| 12 to 14 Years | 188 (16.6%) | 378 (23.3%) |
| 15 Years | 21 (8.4%) | 197 (36.5%) |
| 16 and 17 Years | 174 (18.8%) | 131 (18.5%) |
| 18 to 24 Years | 523 (17.2%) | 724 (30.7%) |
| 25 to 34 Years | 1,055 (19.7%) | 995 (19.6%) |
| 35 to 44 Years | 716 (16.3%) | 654 (16.2%) |
| 45 to 54 Years | 599 (17.4%) | 580 (17.4%) |
| 55 to 64 Years | 548 (17.3%) | 588 (15.9%) |
| 65 to 74 Years | 282 (13.0%) | 304 (10.0%) |
| 75 Years and over | 144 (8.9%) | 262 (12.5%) |
| Total | 5,939 (19.6%) | 6,551 (21.1%) |
Income Above Poverty by Sex and Age in Bossier City
According to the poverty statistics in Bossier City, males aged 15 years and females aged 65 to 74 years are the age groups that are most secure financially, with 91.6% of males and 90.0% of females in these age groups living above the poverty line.
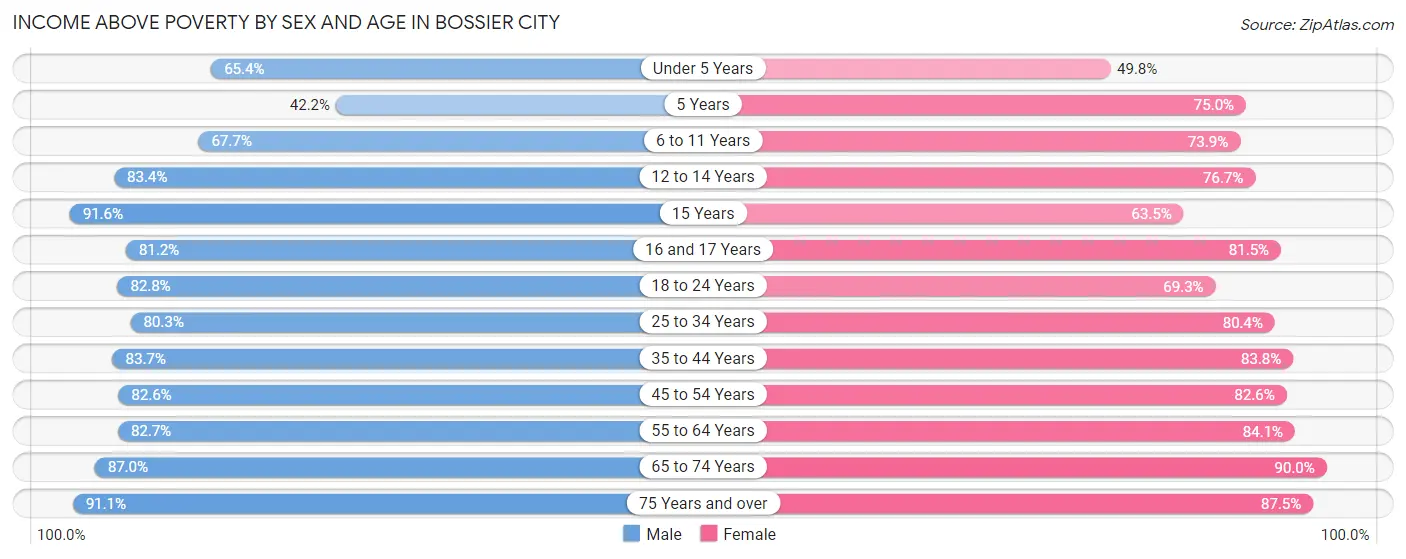
| Age Bracket | Male | Female |
| Under 5 Years | 1,419 (65.4%) | 1,108 (49.8%) |
| 5 Years | 155 (42.2%) | 240 (75.0%) |
| 6 to 11 Years | 1,521 (67.7%) | 1,532 (73.9%) |
| 12 to 14 Years | 943 (83.4%) | 1,246 (76.7%) |
| 15 Years | 229 (91.6%) | 342 (63.4%) |
| 16 and 17 Years | 751 (81.2%) | 577 (81.5%) |
| 18 to 24 Years | 2,511 (82.8%) | 1,637 (69.3%) |
| 25 to 34 Years | 4,310 (80.3%) | 4,075 (80.4%) |
| 35 to 44 Years | 3,665 (83.7%) | 3,372 (83.8%) |
| 45 to 54 Years | 2,840 (82.6%) | 2,745 (82.6%) |
| 55 to 64 Years | 2,614 (82.7%) | 3,111 (84.1%) |
| 65 to 74 Years | 1,880 (87.0%) | 2,729 (90.0%) |
| 75 Years and over | 1,467 (91.1%) | 1,830 (87.5%) |
| Total | 24,305 (80.4%) | 24,544 (78.9%) |
Income Below Poverty Among Married-Couple Families in Bossier City
The poverty statistics for married-couple families in Bossier City show that 8.7% or 838 of the total 9,662 families live below the poverty line. Families with 5 or more children have the highest poverty rate of 63.3%, comprising of 95 families. On the other hand, families with no children have the lowest poverty rate of 4.7%, which includes 251 families.
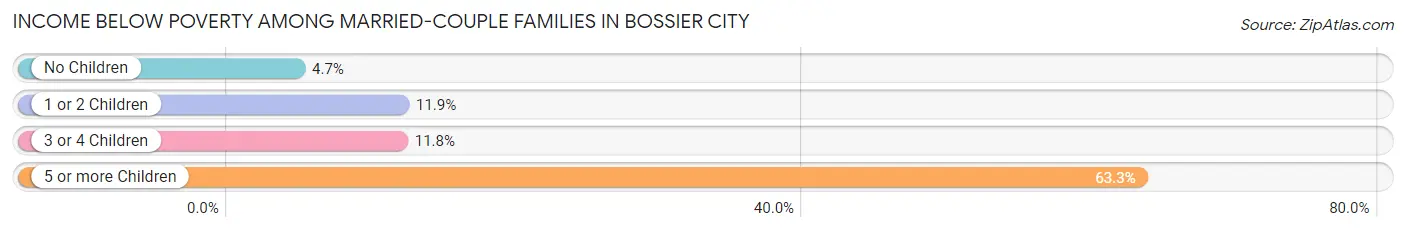
| Children | Above Poverty | Below Poverty |
| No Children | 5,127 (95.3%) | 251 (4.7%) |
| 1 or 2 Children | 3,120 (88.1%) | 422 (11.9%) |
| 3 or 4 Children | 522 (88.2%) | 70 (11.8%) |
| 5 or more Children | 55 (36.7%) | 95 (63.3%) |
| Total | 8,824 (91.3%) | 838 (8.7%) |
Income Below Poverty Among Single-Parent Households in Bossier City
According to the poverty data in Bossier City, 12.4% or 150 single-father households and 30.9% or 1,177 single-mother households are living below the poverty line. Among single-father households, those with 3 or 4 children have the highest poverty rate, with 25 households (31.7%) experiencing poverty. Likewise, among single-mother households, those with 1 or 2 children have the highest poverty rate, with 828 households (41.8%) falling below the poverty line.
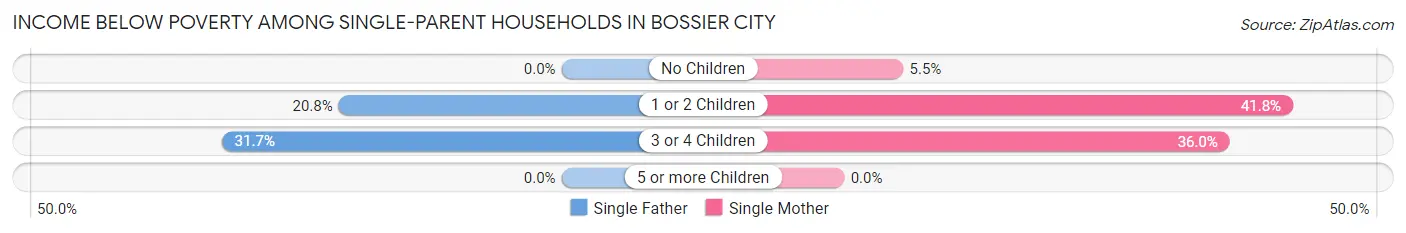
| Children | Single Father | Single Mother |
| No Children | 0 (0.0%) | 56 (5.5%) |
| 1 or 2 Children | 125 (20.8%) | 828 (41.8%) |
| 3 or 4 Children | 25 (31.7%) | 293 (35.9%) |
| 5 or more Children | 0 (0.0%) | 0 (0.0%) |
| Total | 150 (12.4%) | 1,177 (30.9%) |
Income Below Poverty Among Married-Couple vs Single-Parent Households in Bossier City
The poverty data for Bossier City shows that 838 of the married-couple family households (8.7%) and 1,327 of the single-parent households (26.4%) are living below the poverty level. Within the married-couple family households, those with 5 or more children have the highest poverty rate, with 95 households (63.3%) falling below the poverty line. Among the single-parent households, those with 1 or 2 children have the highest poverty rate, with 953 household (36.9%) living below poverty.
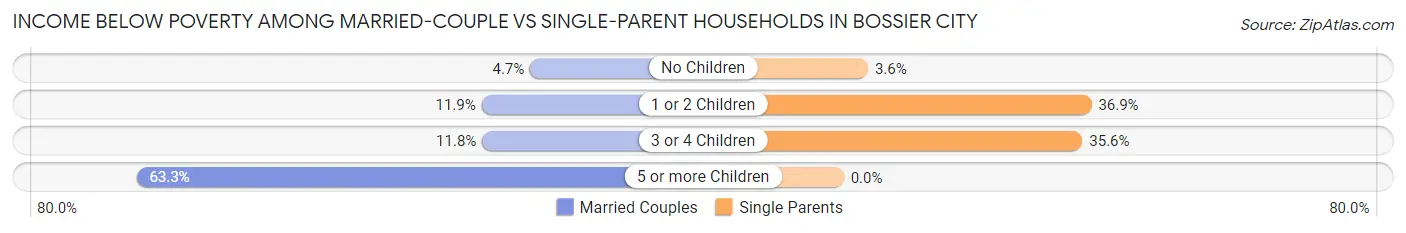
| Children | Married-Couple Families | Single-Parent Households |
| No Children | 251 (4.7%) | 56 (3.6%) |
| 1 or 2 Children | 422 (11.9%) | 953 (36.9%) |
| 3 or 4 Children | 70 (11.8%) | 318 (35.6%) |
| 5 or more Children | 95 (63.3%) | 0 (0.0%) |
| Total | 838 (8.7%) | 1,327 (26.4%) |
Race in Bossier City
The most populous races in Bossier City are White / Caucasian (38,279 | 60.8%), Black / African American (17,634 | 28.0%), and Hispanic or Latino (6,403 | 10.2%).
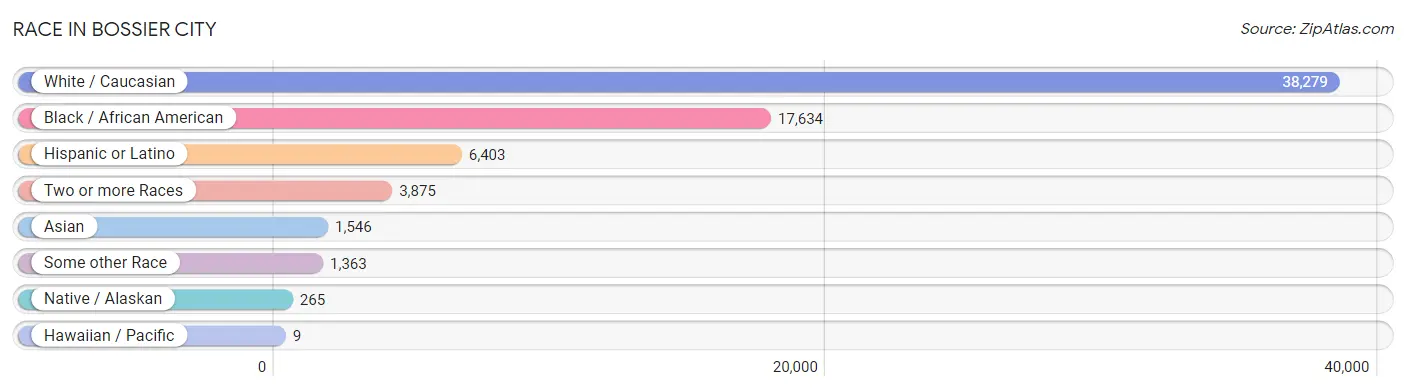
| Race | # Population | % Population |
| Asian | 1,546 | 2.5% |
| Black / African American | 17,634 | 28.0% |
| Hawaiian / Pacific | 9 | 0.0% |
| Hispanic or Latino | 6,403 | 10.2% |
| Native / Alaskan | 265 | 0.4% |
| White / Caucasian | 38,279 | 60.8% |
| Two or more Races | 3,875 | 6.1% |
| Some other Race | 1,363 | 2.2% |
| Total | 62,971 | 100.0% |
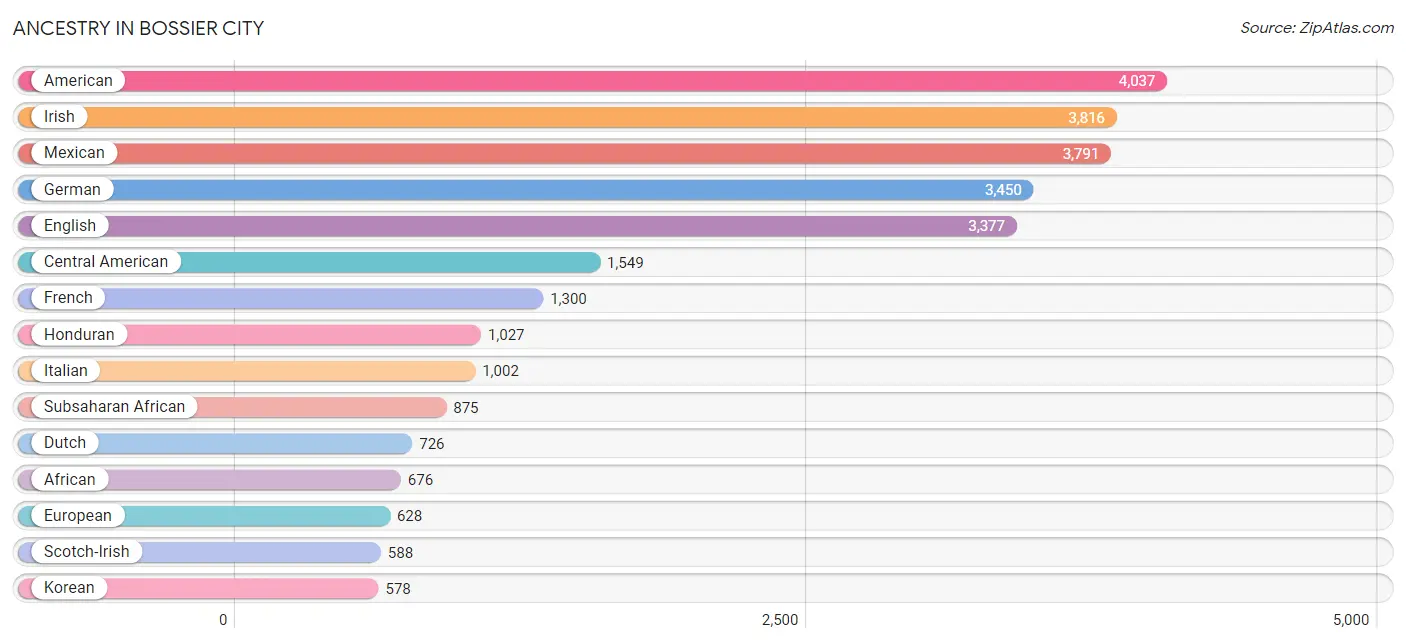
Ancestry in Bossier City
The most populous ancestries reported in Bossier City are American (4,037 | 6.4%), Irish (3,816 | 6.1%), Mexican (3,791 | 6.0%), German (3,450 | 5.5%), and English (3,377 | 5.4%), together accounting for 29.3% of all Bossier City residents.
| Ancestry | # Population | % Population |
| African | 676 | 1.1% |
| Albanian | 15 | 0.0% |
| American | 4,037 | 6.4% |
| Arab | 84 | 0.1% |
| Austrian | 16 | 0.0% |
| Belgian | 19 | 0.0% |
| Belizean | 76 | 0.1% |
| Bhutanese | 254 | 0.4% |
| Blackfeet | 36 | 0.1% |
| Bolivian | 9 | 0.0% |
| Brazilian | 12 | 0.0% |
| British | 152 | 0.2% |
| British West Indian | 6 | 0.0% |
| Burmese | 295 | 0.5% |
| Cajun | 136 | 0.2% |
| Central American | 1,549 | 2.5% |
| Central American Indian | 125 | 0.2% |
| Cherokee | 96 | 0.2% |
| Chickasaw | 23 | 0.0% |
| Choctaw | 35 | 0.1% |
| Colombian | 27 | 0.0% |
| Creek | 8 | 0.0% |
| Cuban | 48 | 0.1% |
| Czech | 118 | 0.2% |
| Danish | 74 | 0.1% |
| Dominican | 125 | 0.2% |
| Dutch | 726 | 1.1% |
| Eastern European | 28 | 0.0% |
| Egyptian | 36 | 0.1% |
| English | 3,377 | 5.4% |
| Ethiopian | 87 | 0.1% |
| European | 628 | 1.0% |
| French | 1,300 | 2.1% |
| French Canadian | 189 | 0.3% |
| German | 3,450 | 5.5% |
| Greek | 10 | 0.0% |
| Guatemalan | 333 | 0.5% |
| Guyanese | 16 | 0.0% |
| Honduran | 1,027 | 1.6% |
| Hungarian | 416 | 0.7% |
| Indian (Asian) | 237 | 0.4% |
| Indonesian | 51 | 0.1% |
| Iranian | 10 | 0.0% |
| Irish | 3,816 | 6.1% |
| Italian | 1,002 | 1.6% |
| Jamaican | 22 | 0.0% |
| Jordanian | 18 | 0.0% |
| Kenyan | 43 | 0.1% |
| Korean | 578 | 0.9% |
| Lebanese | 10 | 0.0% |
| Mexican | 3,791 | 6.0% |
| Native Hawaiian | 35 | 0.1% |
| Navajo | 98 | 0.2% |
| Nicaraguan | 24 | 0.0% |
| Nigerian | 35 | 0.1% |
| Northern European | 28 | 0.0% |
| Norwegian | 359 | 0.6% |
| Pakistani | 71 | 0.1% |
| Palestinian | 5 | 0.0% |
| Panamanian | 10 | 0.0% |
| Pennsylvania German | 19 | 0.0% |
| Polish | 393 | 0.6% |
| Portuguese | 79 | 0.1% |
| Potawatomi | 5 | 0.0% |
| Puerto Rican | 335 | 0.5% |
| Romanian | 15 | 0.0% |
| Russian | 6 | 0.0% |
| Salvadoran | 155 | 0.3% |
| Scandinavian | 354 | 0.6% |
| Scotch-Irish | 588 | 0.9% |
| Scottish | 546 | 0.9% |
| Serbian | 76 | 0.1% |
| Slovak | 56 | 0.1% |
| Slovene | 12 | 0.0% |
| South American | 36 | 0.1% |
| Spaniard | 71 | 0.1% |
| Spanish | 140 | 0.2% |
| Sri Lankan | 283 | 0.4% |
| Subsaharan African | 875 | 1.4% |
| Swedish | 112 | 0.2% |
| Swiss | 25 | 0.0% |
| Thai | 348 | 0.5% |
| Tlingit-Haida | 33 | 0.1% |
| Trinidadian and Tobagonian | 8 | 0.0% |
| Ukrainian | 69 | 0.1% |
| Welsh | 182 | 0.3% |
| West Indian | 6 | 0.0% |
| Yugoslavian | 8 | 0.0% | View All 88 Rows |
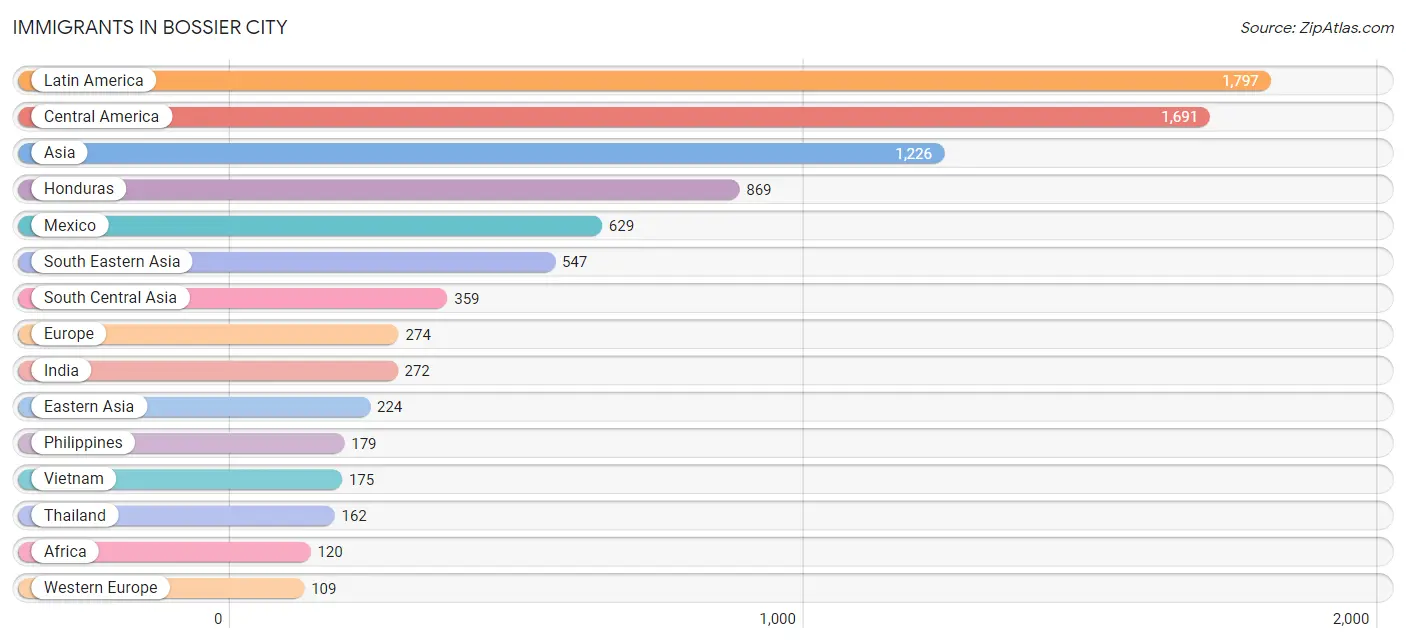
Immigrants in Bossier City
The most numerous immigrant groups reported in Bossier City came from Latin America (1,797 | 2.9%), Central America (1,691 | 2.7%), Asia (1,226 | 1.9%), Honduras (869 | 1.4%), and Mexico (629 | 1.0%), together accounting for 9.9% of all Bossier City residents.
| Immigration Origin | # Population | % Population |
| Africa | 120 | 0.2% |
| Asia | 1,226 | 1.9% |
| Belize | 76 | 0.1% |
| Brazil | 12 | 0.0% |
| Caribbean | 61 | 0.1% |
| Central America | 1,691 | 2.7% |
| Chile | 7 | 0.0% |
| China | 79 | 0.1% |
| Colombia | 6 | 0.0% |
| Cuba | 46 | 0.1% |
| Dominican Republic | 4 | 0.0% |
| Eastern Africa | 66 | 0.1% |
| Eastern Asia | 224 | 0.4% |
| Eastern Europe | 72 | 0.1% |
| Egypt | 36 | 0.1% |
| El Salvador | 23 | 0.0% |
| England | 66 | 0.1% |
| Ethiopia | 30 | 0.1% |
| Europe | 274 | 0.4% |
| France | 14 | 0.0% |
| Germany | 85 | 0.1% |
| Ghana | 3 | 0.0% |
| Guatemala | 94 | 0.2% |
| Honduras | 869 | 1.4% |
| India | 272 | 0.4% |
| Israel | 5 | 0.0% |
| Italy | 24 | 0.0% |
| Jamaica | 11 | 0.0% |
| Japan | 64 | 0.1% |
| Jordan | 67 | 0.1% |
| Kenya | 36 | 0.1% |
| Korea | 81 | 0.1% |
| Latin America | 1,797 | 2.9% |
| Malaysia | 16 | 0.0% |
| Mexico | 629 | 1.0% |
| Netherlands | 10 | 0.0% |
| Nigeria | 15 | 0.0% |
| Northern Africa | 36 | 0.1% |
| Northern Europe | 69 | 0.1% |
| Pakistan | 87 | 0.1% |
| Philippines | 179 | 0.3% |
| Romania | 15 | 0.0% |
| South America | 45 | 0.1% |
| South Central Asia | 359 | 0.6% |
| South Eastern Asia | 547 | 0.9% |
| Southern Europe | 24 | 0.0% |
| Taiwan | 19 | 0.0% |
| Thailand | 162 | 0.3% |
| Ukraine | 57 | 0.1% |
| Venezuela | 20 | 0.0% |
| Vietnam | 175 | 0.3% |
| Western Africa | 18 | 0.0% |
| Western Asia | 96 | 0.2% |
| Western Europe | 109 | 0.2% | View All 54 Rows |
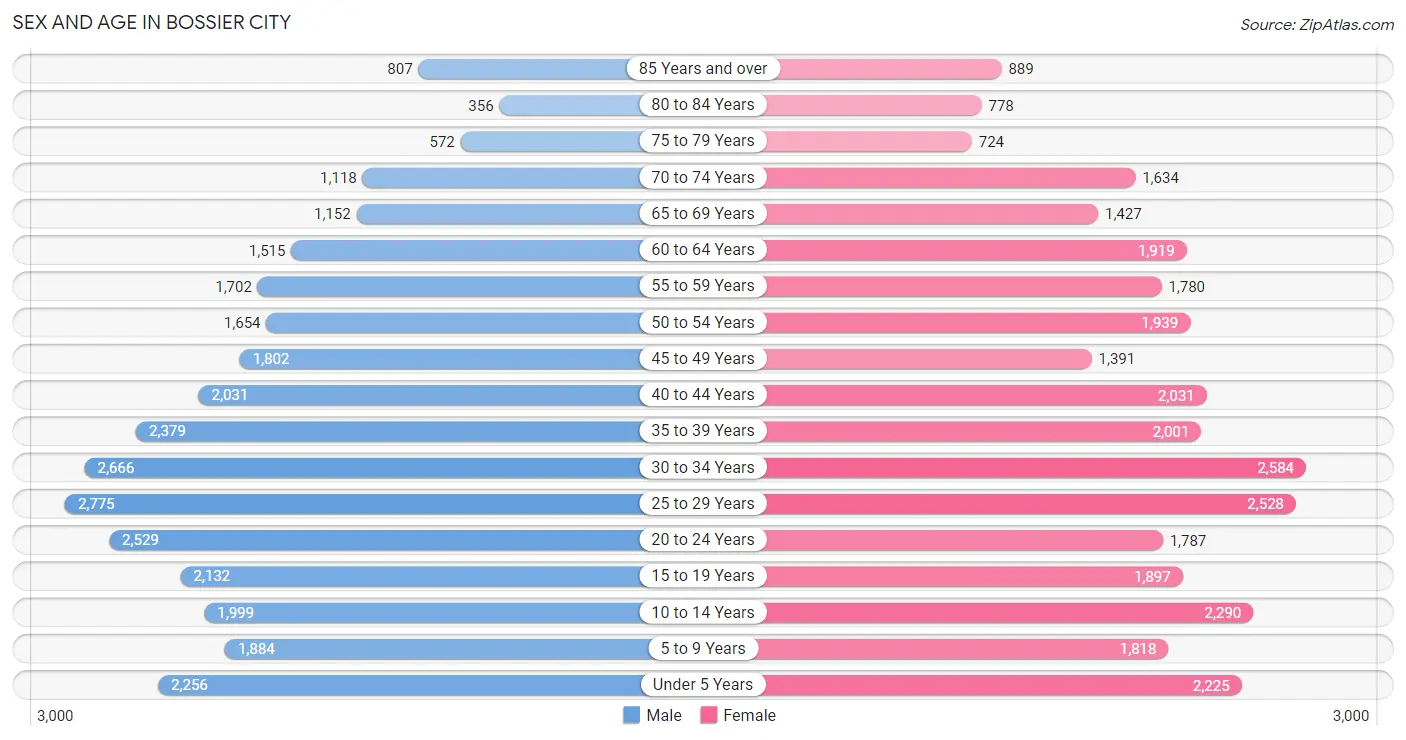
Sex and Age in Bossier City
Sex and Age in Bossier City
The most populous age groups in Bossier City are 25 to 29 Years (2,775 | 8.9%) for men and 30 to 34 Years (2,584 | 8.2%) for women.
| Age Bracket | Male | Female |
| Under 5 Years | 2,256 (7.2%) | 2,225 (7.0%) |
| 5 to 9 Years | 1,884 (6.0%) | 1,818 (5.8%) |
| 10 to 14 Years | 1,999 (6.4%) | 2,290 (7.2%) |
| 15 to 19 Years | 2,132 (6.8%) | 1,897 (6.0%) |
| 20 to 24 Years | 2,529 (8.1%) | 1,787 (5.7%) |
| 25 to 29 Years | 2,775 (8.9%) | 2,528 (8.0%) |
| 30 to 34 Years | 2,666 (8.5%) | 2,584 (8.2%) |
| 35 to 39 Years | 2,379 (7.6%) | 2,001 (6.3%) |
| 40 to 44 Years | 2,031 (6.5%) | 2,031 (6.4%) |
| 45 to 49 Years | 1,802 (5.8%) | 1,391 (4.4%) |
| 50 to 54 Years | 1,654 (5.3%) | 1,939 (6.1%) |
| 55 to 59 Years | 1,702 (5.4%) | 1,780 (5.6%) |
| 60 to 64 Years | 1,515 (4.8%) | 1,919 (6.1%) |
| 65 to 69 Years | 1,152 (3.7%) | 1,427 (4.5%) |
| 70 to 74 Years | 1,118 (3.6%) | 1,634 (5.2%) |
| 75 to 79 Years | 572 (1.8%) | 724 (2.3%) |
| 80 to 84 Years | 356 (1.1%) | 778 (2.5%) |
| 85 Years and over | 807 (2.6%) | 889 (2.8%) |
| Total | 31,329 (100.0%) | 31,642 (100.0%) |
Families and Households in Bossier City
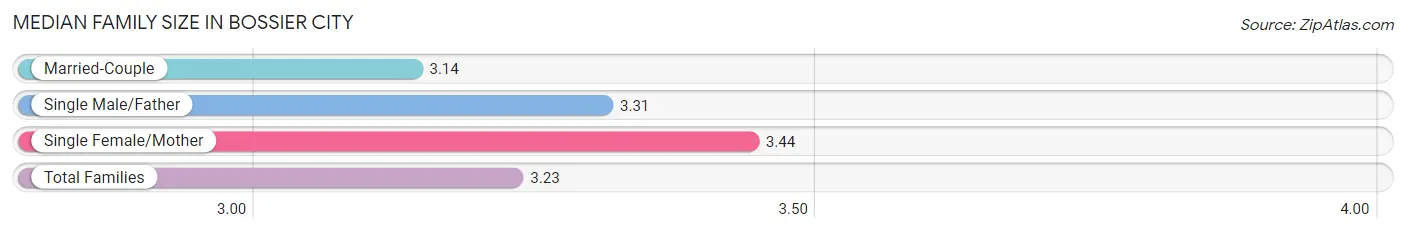
Median Family Size in Bossier City
The median family size in Bossier City is 3.23 persons per family, with single female/mother families (3,814 | 26.0%) accounting for the largest median family size of 3.44 persons per family. On the other hand, married-couple families (9,662 | 65.8%) represent the smallest median family size with 3.14 persons per family.
| Family Type | # Families | Family Size |
| Married-Couple | 9,662 (65.8%) | 3.14 |
| Single Male/Father | 1,209 (8.2%) | 3.31 |
| Single Female/Mother | 3,814 (26.0%) | 3.44 |
| Total Families | 14,685 (100.0%) | 3.23 |
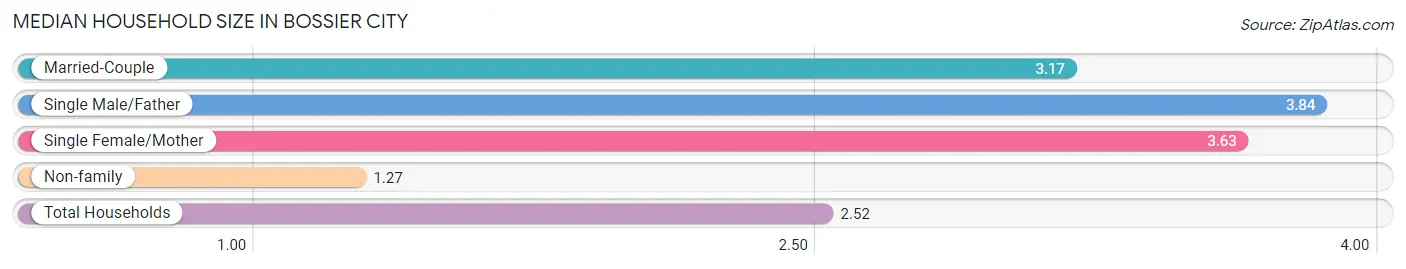
Median Household Size in Bossier City
The median household size in Bossier City is 2.52 persons per household, with single male/father households (1,209 | 5.0%) accounting for the largest median household size of 3.84 persons per household. non-family households (9,754 | 39.9%) represent the smallest median household size with 1.27 persons per household.
| Household Type | # Households | Household Size |
| Married-Couple | 9,662 (39.5%) | 3.17 |
| Single Male/Father | 1,209 (5.0%) | 3.84 |
| Single Female/Mother | 3,814 (15.6%) | 3.63 |
| Non-family | 9,754 (39.9%) | 1.27 |
| Total Households | 24,439 (100.0%) | 2.52 |
Household Size by Marriage Status in Bossier City
Out of a total of 24,439 households in Bossier City, 14,685 (60.1%) are family households, while 9,754 (39.9%) are nonfamily households. The most numerous type of family households are 2-person households, comprising 5,942, and the most common type of nonfamily households are 1-person households, comprising 8,015.
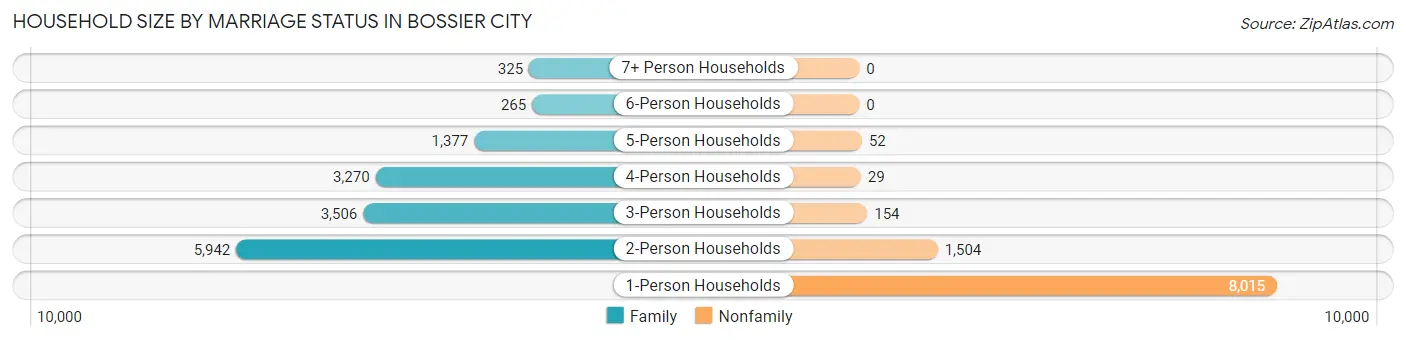
| Household Size | Family Households | Nonfamily Households |
| 1-Person Households | - | 8,015 (32.8%) |
| 2-Person Households | 5,942 (24.3%) | 1,504 (6.1%) |
| 3-Person Households | 3,506 (14.3%) | 154 (0.6%) |
| 4-Person Households | 3,270 (13.4%) | 29 (0.1%) |
| 5-Person Households | 1,377 (5.6%) | 52 (0.2%) |
| 6-Person Households | 265 (1.1%) | 0 (0.0%) |
| 7+ Person Households | 325 (1.3%) | 0 (0.0%) |
| Total | 14,685 (60.1%) | 9,754 (39.9%) |
Female Fertility in Bossier City
Fertility by Age in Bossier City
Average fertility rate in Bossier City is 29.0 births per 1,000 women. Women in the age bracket of 20 to 34 years have the highest fertility rate with 54.0 births per 1,000 women. Women in the age bracket of 20 to 34 years acount for 86.5% of all women with births.

| Age Bracket | Women with Births | Births / 1,000 Women |
| 15 to 19 years | 42 (9.8%) | 22.0 |
| 20 to 34 years | 371 (86.5%) | 54.0 |
| 35 to 50 years | 16 (3.7%) | 3.0 |
| Total | 429 (100.0%) | 29.0 |
Fertility by Age by Marriage Status in Bossier City
52.0% of women with births (429) in Bossier City are married. The highest percentage of unmarried women with births falls into 15 to 19 years age bracket with 71.4% of them unmarried at the time of birth, while the lowest percentage of unmarried women with births belong to 35 to 50 years age bracket with 6.2% of them unmarried.
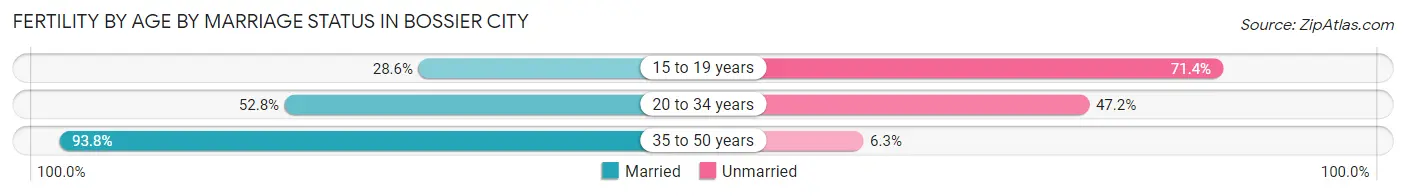
| Age Bracket | Married | Unmarried |
| 15 to 19 years | 12 (28.6%) | 30 (71.4%) |
| 20 to 34 years | 196 (52.8%) | 175 (47.2%) |
| 35 to 50 years | 15 (93.8%) | 1 (6.2%) |
| Total | 223 (52.0%) | 206 (48.0%) |
Fertility by Education in Bossier City
Average fertility rate in Bossier City is 29.0 births per 1,000 women. Women with the education attainment of graduate degree have the highest fertility rate of 40.0 births per 1,000 women, while women with the education attainment of less than high school have the lowest fertility at 12.0 births per 1,000 women. Women with the education attainment of college or associate's degree represent 35.0% of all women with births.
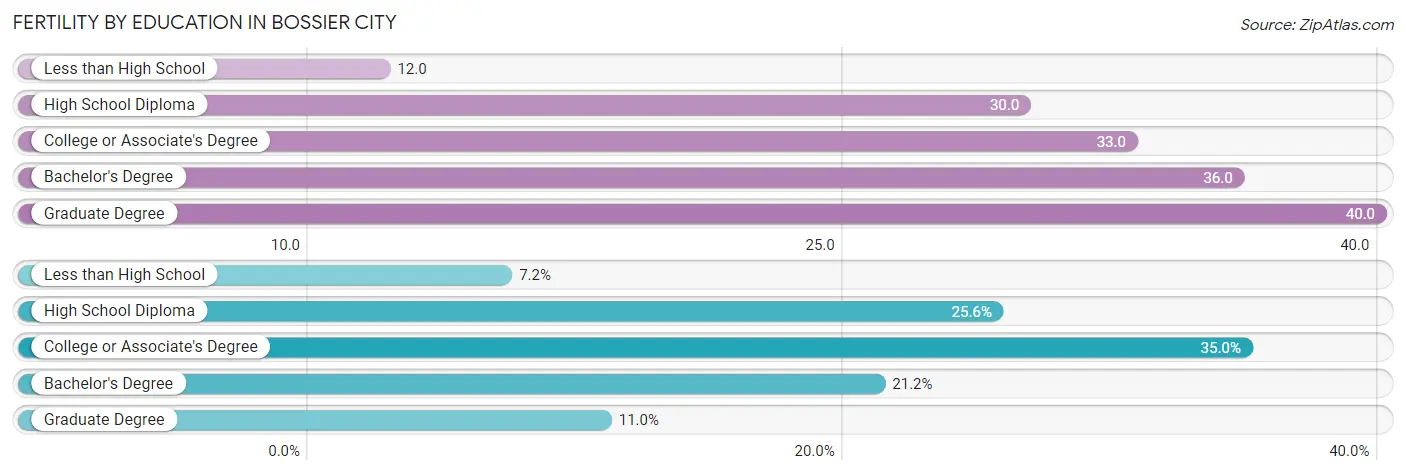
| Educational Attainment | Women with Births | Births / 1,000 Women |
| Less than High School | 31 (7.2%) | 12.0 |
| High School Diploma | 110 (25.6%) | 30.0 |
| College or Associate's Degree | 150 (35.0%) | 33.0 |
| Bachelor's Degree | 91 (21.2%) | 36.0 |
| Graduate Degree | 47 (11.0%) | 40.0 |
| Total | 429 (100.0%) | 29.0 |
Fertility by Education by Marriage Status in Bossier City
48.0% of women with births in Bossier City are unmarried. Women with the educational attainment of bachelor's degree are most likely to be married with 100.0% of them married at childbirth, while women with the educational attainment of high school diploma are least likely to be married with 83.6% of them unmarried at childbirth.
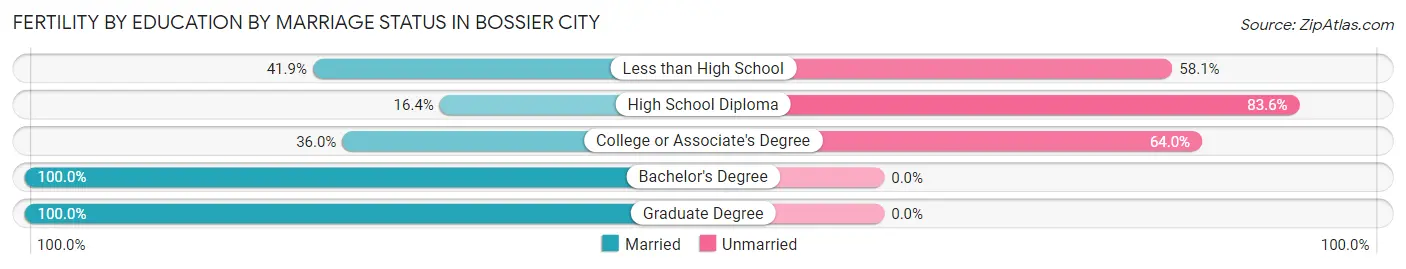
| Educational Attainment | Married | Unmarried |
| Less than High School | 13 (41.9%) | 18 (58.1%) |
| High School Diploma | 18 (16.4%) | 92 (83.6%) |
| College or Associate's Degree | 54 (36.0%) | 96 (64.0%) |
| Bachelor's Degree | 91 (100.0%) | 0 (0.0%) |
| Graduate Degree | 47 (100.0%) | 0 (0.0%) |
| Total | 223 (52.0%) | 206 (48.0%) |
Employment Characteristics in Bossier City
Employment by Class of Employer in Bossier City
Among the 27,985 employed individuals in Bossier City, private company employees (17,088 | 61.1%), federal government employees (4,474 | 16.0%), and not-for-profit organizations (2,111 | 7.5%) make up the most common classes of employment.
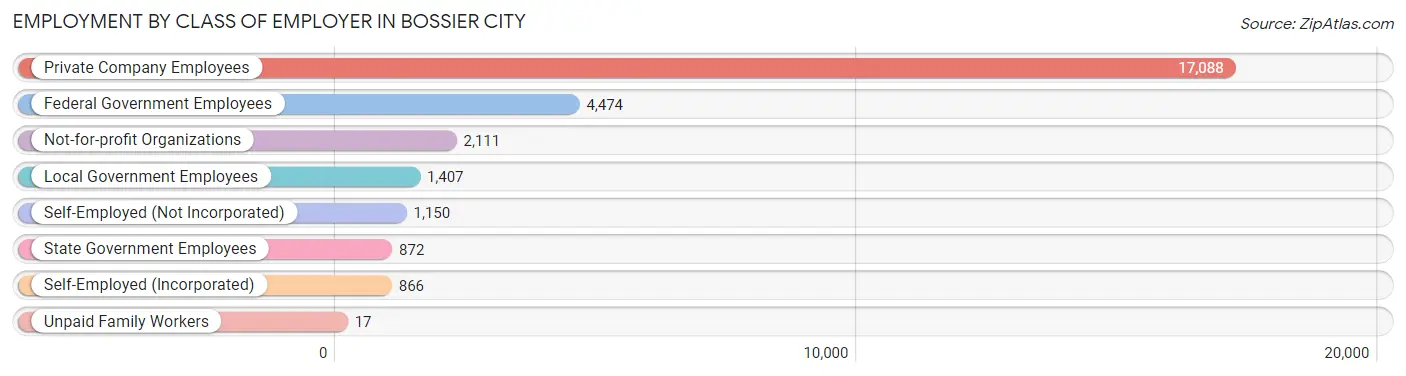
| Employer Class | # Employees | % Employees |
| Private Company Employees | 17,088 | 61.1% |
| Self-Employed (Incorporated) | 866 | 3.1% |
| Self-Employed (Not Incorporated) | 1,150 | 4.1% |
| Not-for-profit Organizations | 2,111 | 7.5% |
| Local Government Employees | 1,407 | 5.0% |
| State Government Employees | 872 | 3.1% |
| Federal Government Employees | 4,474 | 16.0% |
| Unpaid Family Workers | 17 | 0.1% |
| Total | 27,985 | 100.0% |
Employment Status by Age in Bossier City
According to the labor force statistics for Bossier City, out of the total population over 16 years of age (49,710), 60.0% or 29,826 individuals are in the labor force, with 5.8% or 1,730 of them unemployed. The age group with the highest labor force participation rate is 35 to 44 years, with 83.5% or 7,049 individuals in the labor force. Within the labor force, the 16 to 19 years age range has the highest percentage of unemployed individuals, with 21.0% or 218 of them being unemployed.
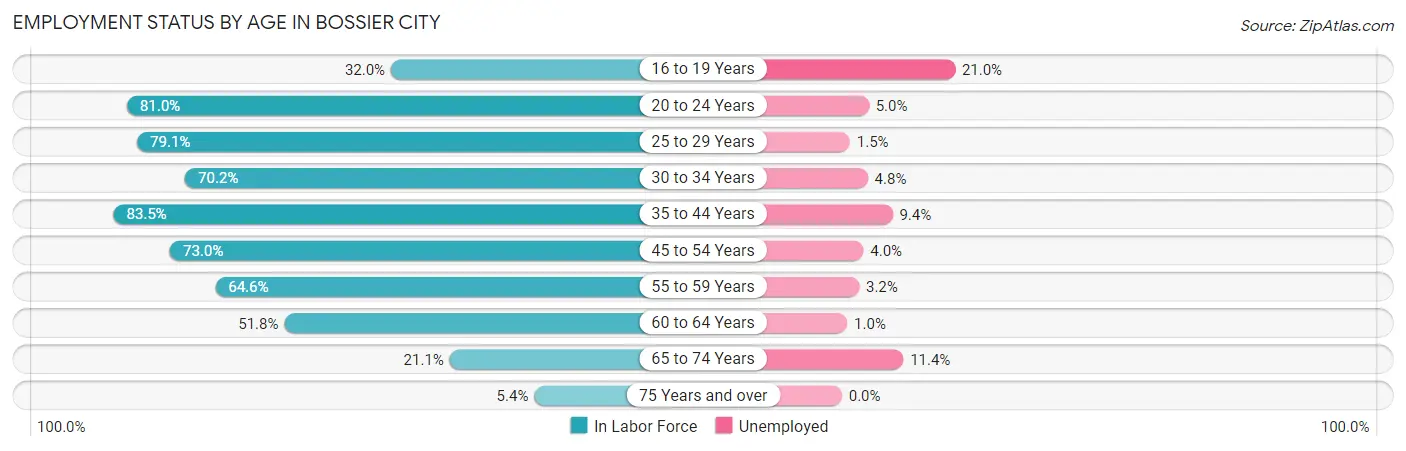
| Age Bracket | In Labor Force | Unemployed |
| 16 to 19 Years | 1,037 (32.0%) | 218 (21.0%) |
| 20 to 24 Years | 3,496 (81.0%) | 175 (5.0%) |
| 25 to 29 Years | 4,195 (79.1%) | 63 (1.5%) |
| 30 to 34 Years | 3,686 (70.2%) | 177 (4.8%) |
| 35 to 44 Years | 7,049 (83.5%) | 663 (9.4%) |
| 45 to 54 Years | 4,954 (73.0%) | 198 (4.0%) |
| 55 to 59 Years | 2,249 (64.6%) | 72 (3.2%) |
| 60 to 64 Years | 1,779 (51.8%) | 18 (1.0%) |
| 65 to 74 Years | 1,125 (21.1%) | 128 (11.4%) |
| 75 Years and over | 223 (5.4%) | 0 (0.0%) |
| Total | 29,826 (60.0%) | 1,730 (5.8%) |
Employment Status by Educational Attainment in Bossier City
According to labor force statistics for Bossier City, 73.2% of individuals (23,934) out of the total population between 25 and 64 years of age (32,697) are in the labor force, with 5.0% or 1,197 of them being unemployed. The group with the highest labor force participation rate are those with the educational attainment of bachelor's degree or higher, with 82.9% or 6,946 individuals in the labor force. Within the labor force, individuals with less than high school education have the highest percentage of unemployment, with 9.6% or 190 of them being unemployed.
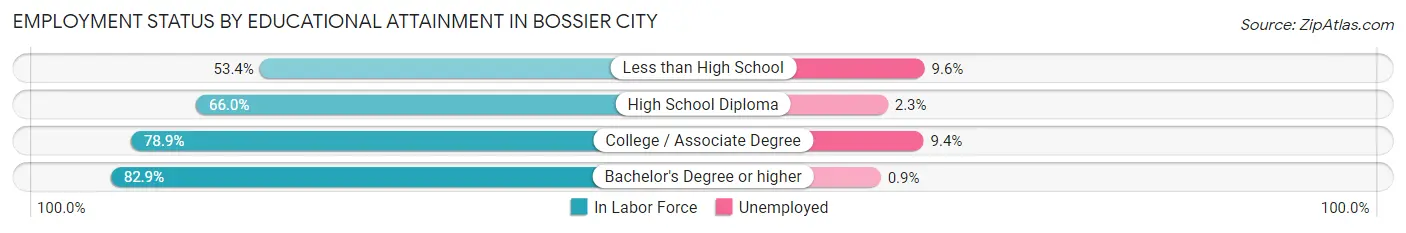
| Educational Attainment | In Labor Force | Unemployed |
| Less than High School | 1,977 (53.4%) | 355 (9.6%) |
| High School Diploma | 6,501 (66.0%) | 227 (2.3%) |
| College / Associate Degree | 8,494 (78.9%) | 1,012 (9.4%) |
| Bachelor's Degree or higher | 6,946 (82.9%) | 75 (0.9%) |
| Total | 23,934 (73.2%) | 1,635 (5.0%) |
Employment Occupations by Sex in Bossier City
Management, Business, Science and Arts Occupations
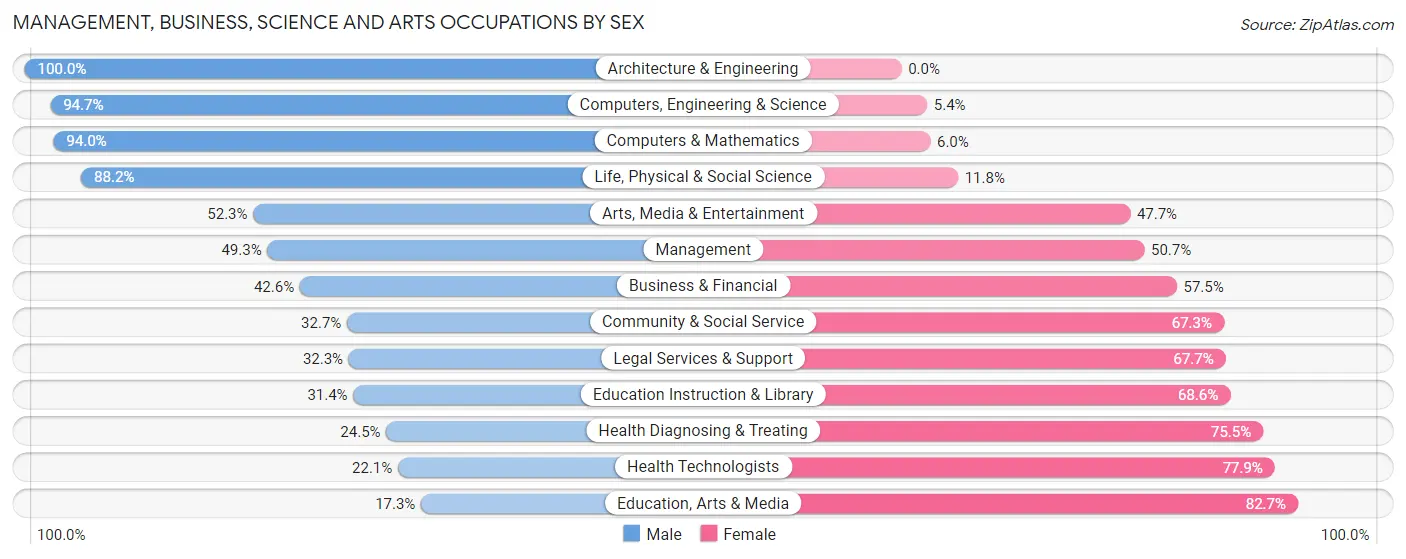
The most common Management, Business, Science and Arts occupations in Bossier City are Community & Social Service (2,528 | 10.0%), Management (2,307 | 9.1%), Health Diagnosing & Treating (2,011 | 8.0%), Health Technologists (1,553 | 6.1%), and Education Instruction & Library (1,261 | 5.0%).
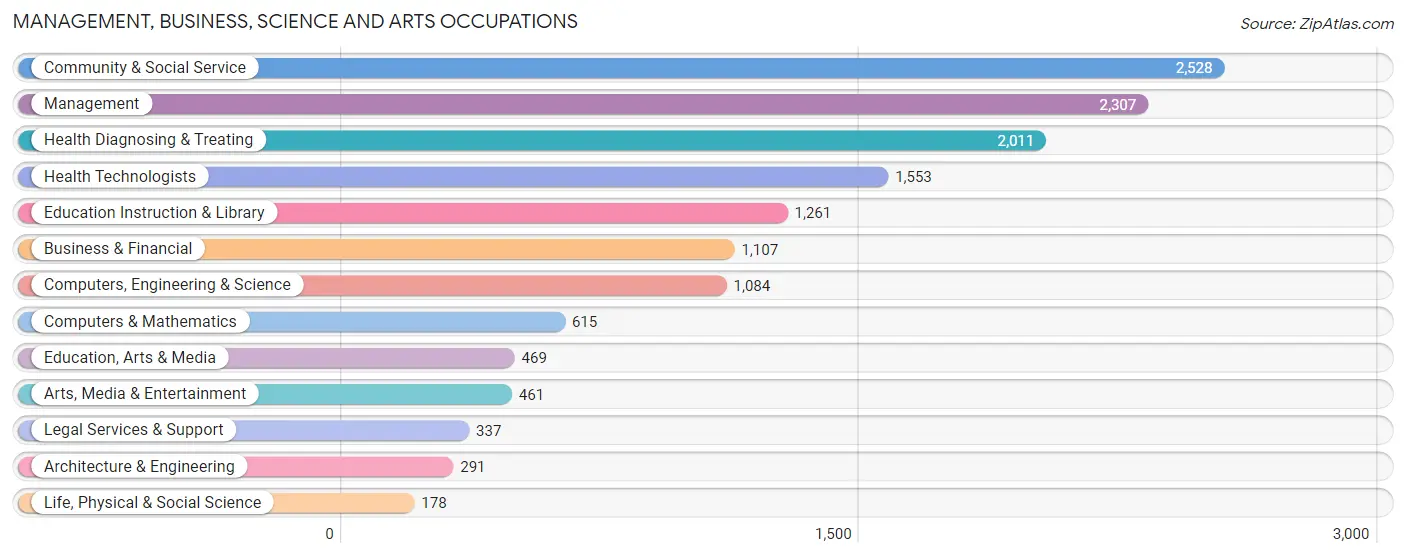
Management, Business, Science and Arts Occupations by Sex
Within the Management, Business, Science and Arts occupations in Bossier City, the most male-oriented occupations are Architecture & Engineering (100.0%), Computers, Engineering & Science (94.7%), and Computers & Mathematics (94.0%), while the most female-oriented occupations are Education, Arts & Media (82.7%), Health Technologists (77.9%), and Health Diagnosing & Treating (75.5%).
| Occupation | Male | Female |
| Management | 1,138 (49.3%) | 1,169 (50.7%) |
| Business & Financial | 471 (42.5%) | 636 (57.5%) |
| Computers, Engineering & Science | 1,026 (94.7%) | 58 (5.3%) |
| Computers & Mathematics | 578 (94.0%) | 37 (6.0%) |
| Architecture & Engineering | 291 (100.0%) | 0 (0.0%) |
| Life, Physical & Social Science | 157 (88.2%) | 21 (11.8%) |
| Community & Social Service | 827 (32.7%) | 1,701 (67.3%) |
| Education, Arts & Media | 81 (17.3%) | 388 (82.7%) |
| Legal Services & Support | 109 (32.3%) | 228 (67.7%) |
| Education Instruction & Library | 396 (31.4%) | 865 (68.6%) |
| Arts, Media & Entertainment | 241 (52.3%) | 220 (47.7%) |
| Health Diagnosing & Treating | 493 (24.5%) | 1,518 (75.5%) |
| Health Technologists | 343 (22.1%) | 1,210 (77.9%) |
| Total (Category) | 3,955 (43.8%) | 5,082 (56.2%) |
| Total (Overall) | 13,018 (51.6%) | 12,231 (48.4%) |
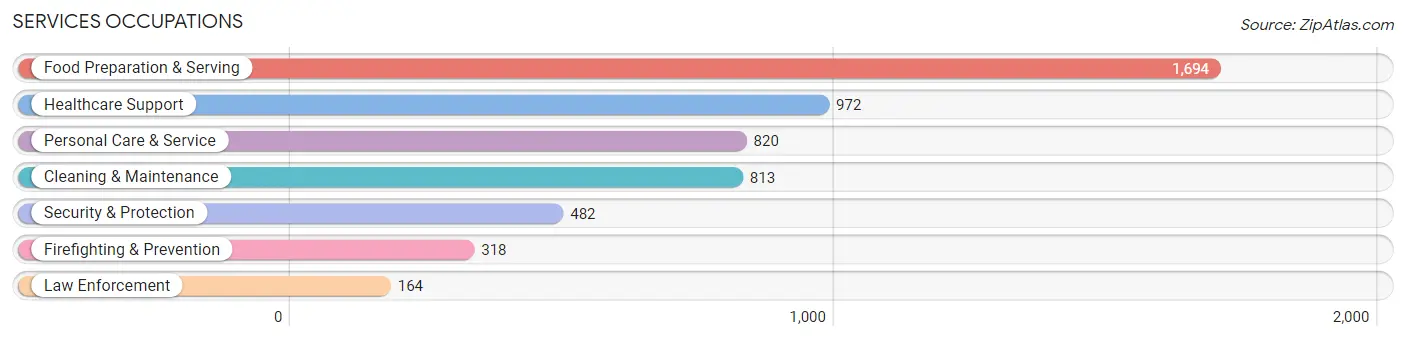
Services Occupations
The most common Services occupations in Bossier City are Food Preparation & Serving (1,694 | 6.7%), Healthcare Support (972 | 3.8%), Personal Care & Service (820 | 3.3%), Cleaning & Maintenance (813 | 3.2%), and Security & Protection (482 | 1.9%).
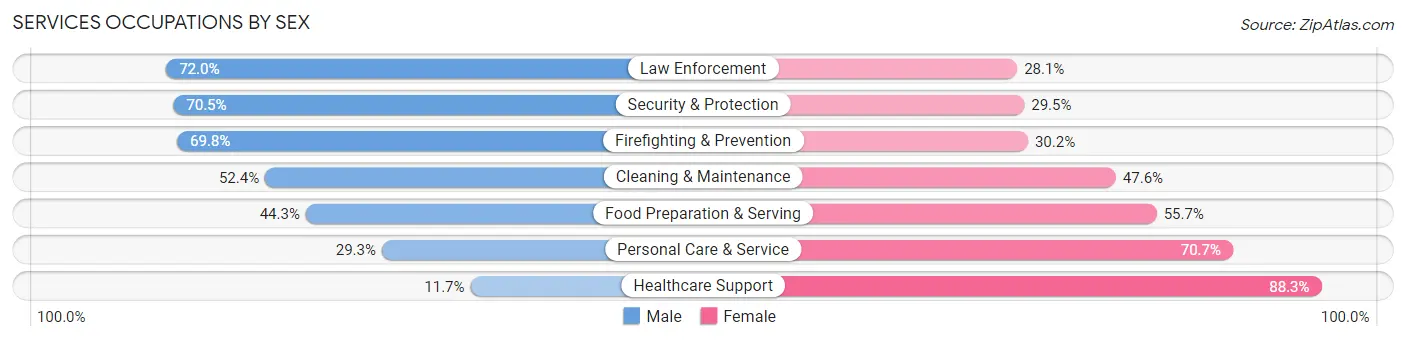
Services Occupations by Sex
Within the Services occupations in Bossier City, the most male-oriented occupations are Law Enforcement (72.0%), Security & Protection (70.5%), and Firefighting & Prevention (69.8%), while the most female-oriented occupations are Healthcare Support (88.3%), Personal Care & Service (70.7%), and Food Preparation & Serving (55.7%).
| Occupation | Male | Female |
| Healthcare Support | 114 (11.7%) | 858 (88.3%) |
| Security & Protection | 340 (70.5%) | 142 (29.5%) |
| Firefighting & Prevention | 222 (69.8%) | 96 (30.2%) |
| Law Enforcement | 118 (72.0%) | 46 (28.1%) |
| Food Preparation & Serving | 751 (44.3%) | 943 (55.7%) |
| Cleaning & Maintenance | 426 (52.4%) | 387 (47.6%) |
| Personal Care & Service | 240 (29.3%) | 580 (70.7%) |
| Total (Category) | 1,871 (39.1%) | 2,910 (60.9%) |
| Total (Overall) | 13,018 (51.6%) | 12,231 (48.4%) |
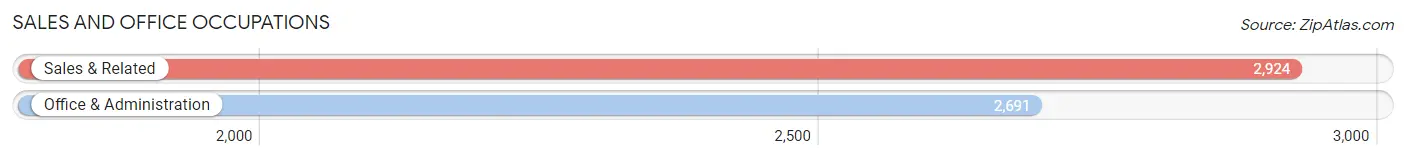
Sales and Office Occupations
The most common Sales and Office occupations in Bossier City are Sales & Related (2,924 | 11.6%), and Office & Administration (2,691 | 10.7%).
Sales and Office Occupations by Sex
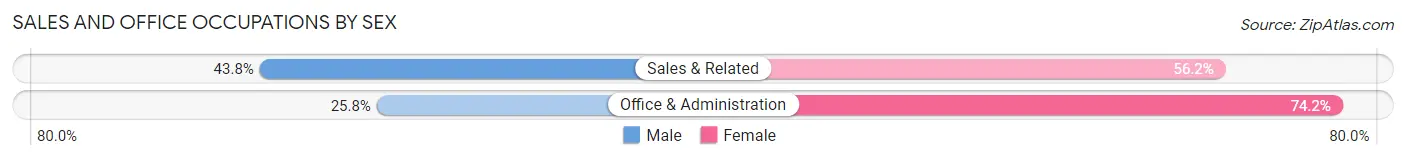
| Occupation | Male | Female |
| Sales & Related | 1,282 (43.8%) | 1,642 (56.2%) |
| Office & Administration | 695 (25.8%) | 1,996 (74.2%) |
| Total (Category) | 1,977 (35.2%) | 3,638 (64.8%) |
| Total (Overall) | 13,018 (51.6%) | 12,231 (48.4%) |
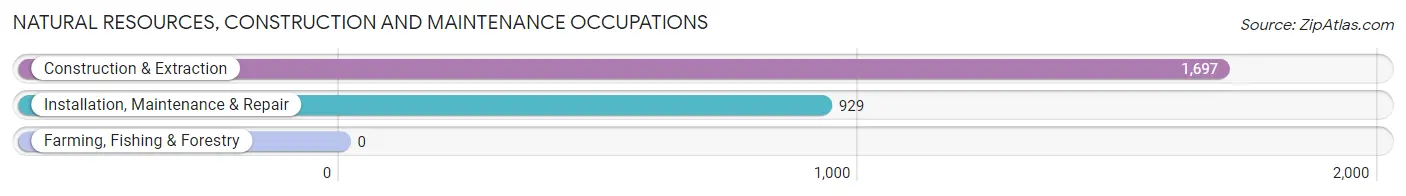
Natural Resources, Construction and Maintenance Occupations
The most common Natural Resources, Construction and Maintenance occupations in Bossier City are Construction & Extraction (1,697 | 6.7%), and Installation, Maintenance & Repair (929 | 3.7%).
Natural Resources, Construction and Maintenance Occupations by Sex
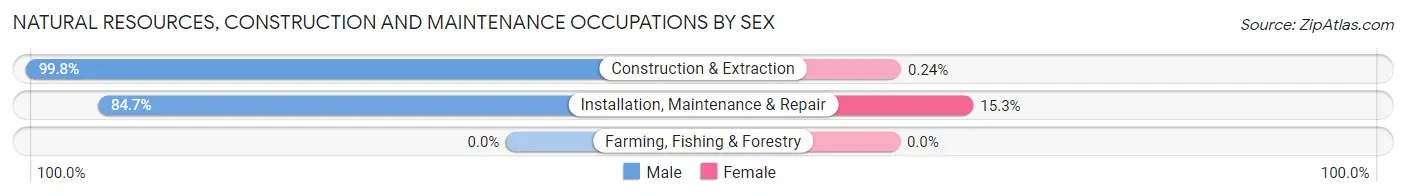
| Occupation | Male | Female |
| Farming, Fishing & Forestry | 0 (0.0%) | 0 (0.0%) |
| Construction & Extraction | 1,693 (99.8%) | 4 (0.2%) |
| Installation, Maintenance & Repair | 787 (84.7%) | 142 (15.3%) |
| Total (Category) | 2,480 (94.4%) | 146 (5.6%) |
| Total (Overall) | 13,018 (51.6%) | 12,231 (48.4%) |
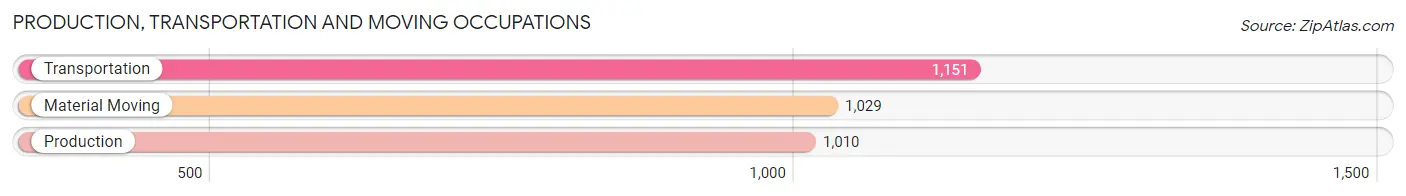
Production, Transportation and Moving Occupations
The most common Production, Transportation and Moving occupations in Bossier City are Transportation (1,151 | 4.6%), Material Moving (1,029 | 4.1%), and Production (1,010 | 4.0%).
Production, Transportation and Moving Occupations by Sex
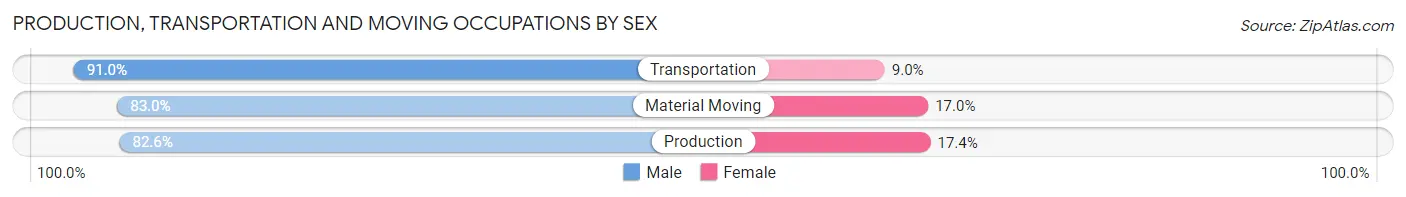
| Occupation | Male | Female |
| Production | 834 (82.6%) | 176 (17.4%) |
| Transportation | 1,047 (91.0%) | 104 (9.0%) |
| Material Moving | 854 (83.0%) | 175 (17.0%) |
| Total (Category) | 2,735 (85.7%) | 455 (14.3%) |
| Total (Overall) | 13,018 (51.6%) | 12,231 (48.4%) |
Employment Industries by Sex in Bossier City
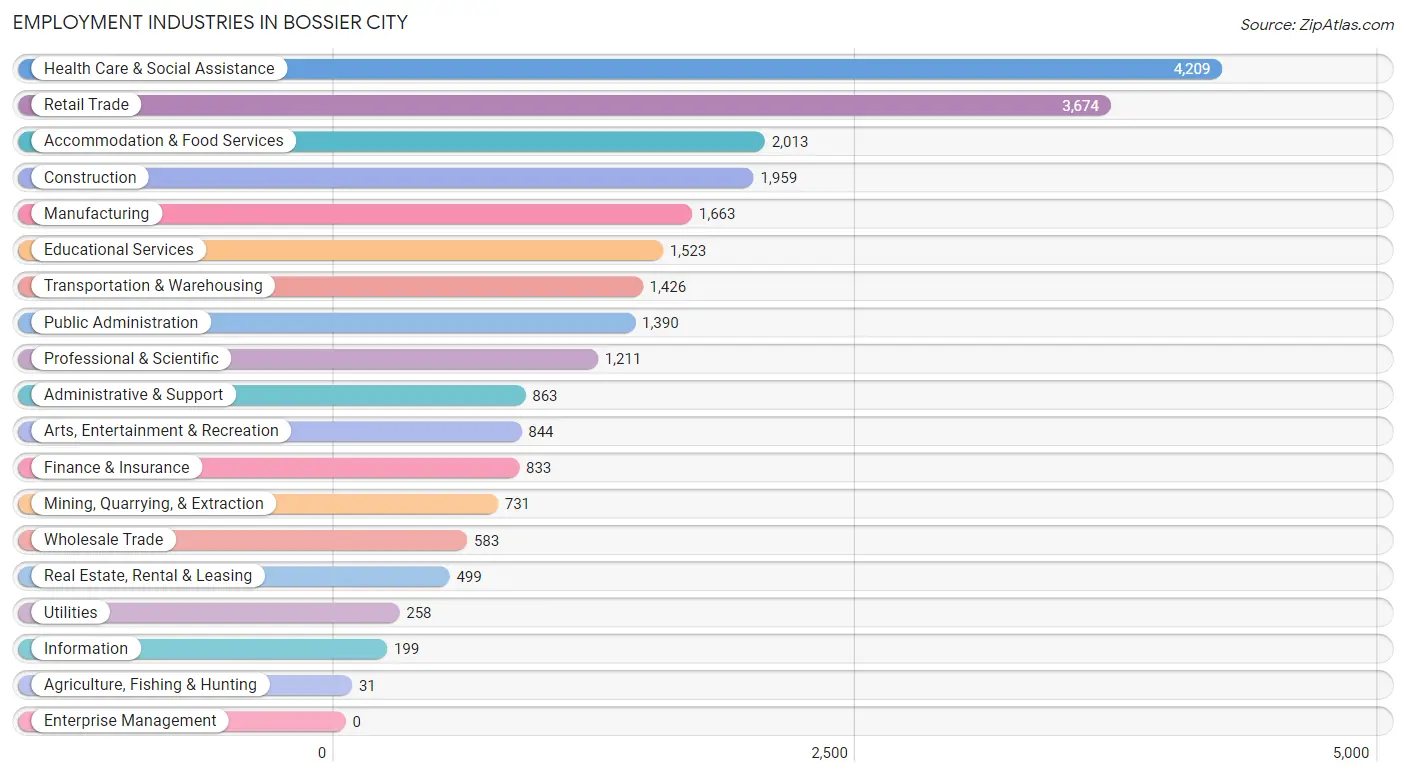
Employment Industries in Bossier City
The major employment industries in Bossier City include Health Care & Social Assistance (4,209 | 16.7%), Retail Trade (3,674 | 14.5%), Accommodation & Food Services (2,013 | 8.0%), Construction (1,959 | 7.8%), and Manufacturing (1,663 | 6.6%).
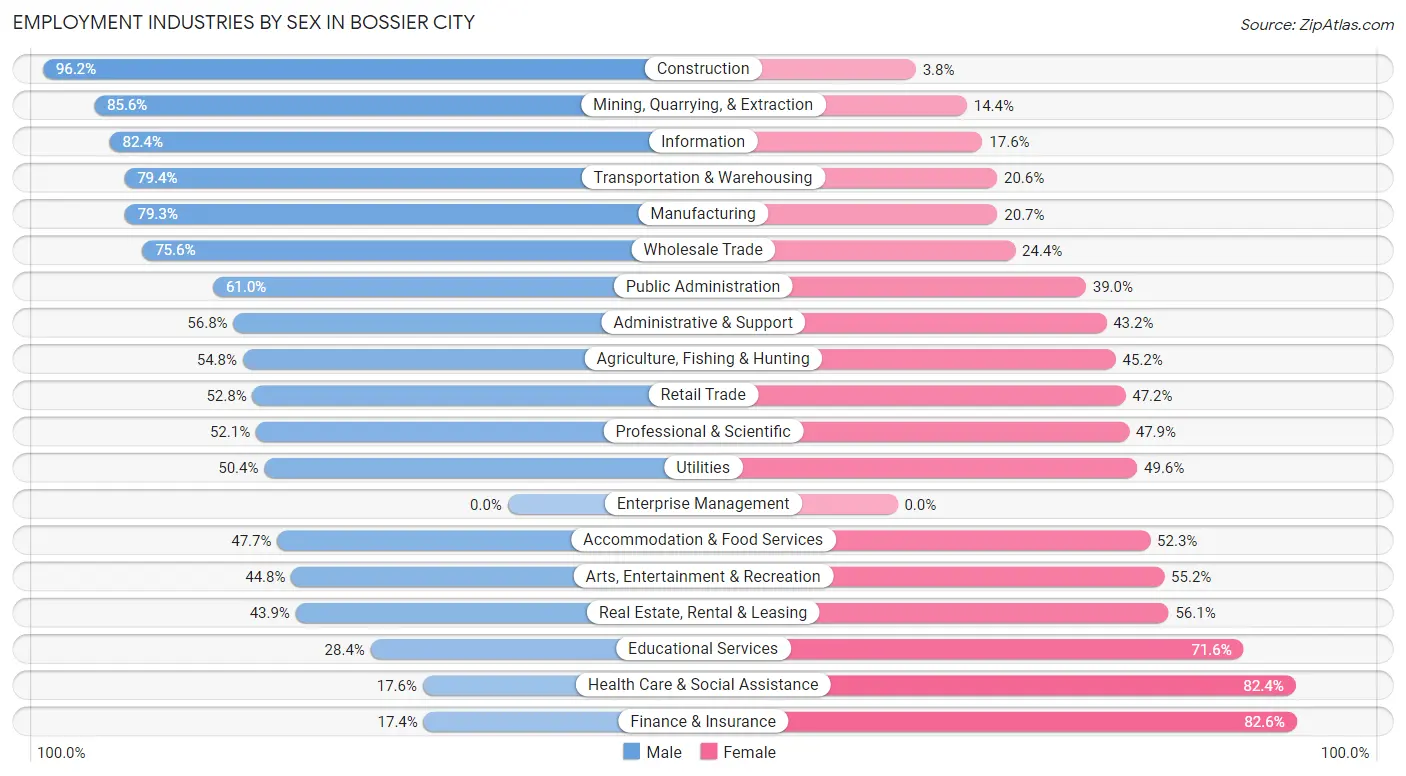
Employment Industries by Sex in Bossier City
The Bossier City industries that see more men than women are Construction (96.2%), Mining, Quarrying, & Extraction (85.6%), and Information (82.4%), whereas the industries that tend to have a higher number of women are Finance & Insurance (82.6%), Health Care & Social Assistance (82.4%), and Educational Services (71.6%).
| Industry | Male | Female |
| Agriculture, Fishing & Hunting | 17 (54.8%) | 14 (45.2%) |
| Mining, Quarrying, & Extraction | 626 (85.6%) | 105 (14.4%) |
| Construction | 1,885 (96.2%) | 74 (3.8%) |
| Manufacturing | 1,319 (79.3%) | 344 (20.7%) |
| Wholesale Trade | 441 (75.6%) | 142 (24.4%) |
| Retail Trade | 1,941 (52.8%) | 1,733 (47.2%) |
| Transportation & Warehousing | 1,132 (79.4%) | 294 (20.6%) |
| Utilities | 130 (50.4%) | 128 (49.6%) |
| Information | 164 (82.4%) | 35 (17.6%) |
| Finance & Insurance | 145 (17.4%) | 688 (82.6%) |
| Real Estate, Rental & Leasing | 219 (43.9%) | 280 (56.1%) |
| Professional & Scientific | 631 (52.1%) | 580 (47.9%) |
| Enterprise Management | 0 (0.0%) | 0 (0.0%) |
| Administrative & Support | 490 (56.8%) | 373 (43.2%) |
| Educational Services | 432 (28.4%) | 1,091 (71.6%) |
| Health Care & Social Assistance | 740 (17.6%) | 3,469 (82.4%) |
| Arts, Entertainment & Recreation | 378 (44.8%) | 466 (55.2%) |
| Accommodation & Food Services | 960 (47.7%) | 1,053 (52.3%) |
| Public Administration | 848 (61.0%) | 542 (39.0%) |
| Total | 13,018 (51.6%) | 12,231 (48.4%) |
Education in Bossier City
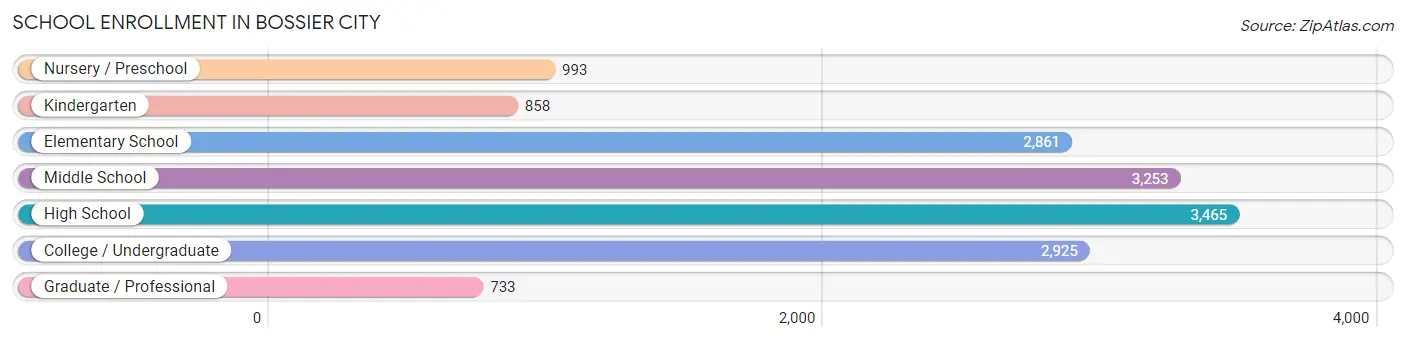
School Enrollment in Bossier City
The most common levels of schooling among the 15,088 students in Bossier City are high school (3,465 | 23.0%), middle school (3,253 | 21.6%), and college / undergraduate (2,925 | 19.4%).
| School Level | # Students | % Students |
| Nursery / Preschool | 993 | 6.6% |
| Kindergarten | 858 | 5.7% |
| Elementary School | 2,861 | 19.0% |
| Middle School | 3,253 | 21.6% |
| High School | 3,465 | 23.0% |
| College / Undergraduate | 2,925 | 19.4% |
| Graduate / Professional | 733 | 4.9% |
| Total | 15,088 | 100.0% |
School Enrollment by Age by Funding Source in Bossier City
Out of a total of 15,088 students who are enrolled in schools in Bossier City, 1,584 (10.5%) attend a private institution, while the remaining 13,504 (89.5%) are enrolled in public schools. The age group of 3 to 4 year olds has the highest likelihood of being enrolled in private schools, with 234 (26.5% in the age bracket) enrolled. Conversely, the age group of 18 to 19 year olds has the lowest likelihood of being enrolled in a private school, with 873 (98.6% in the age bracket) attending a public institution.
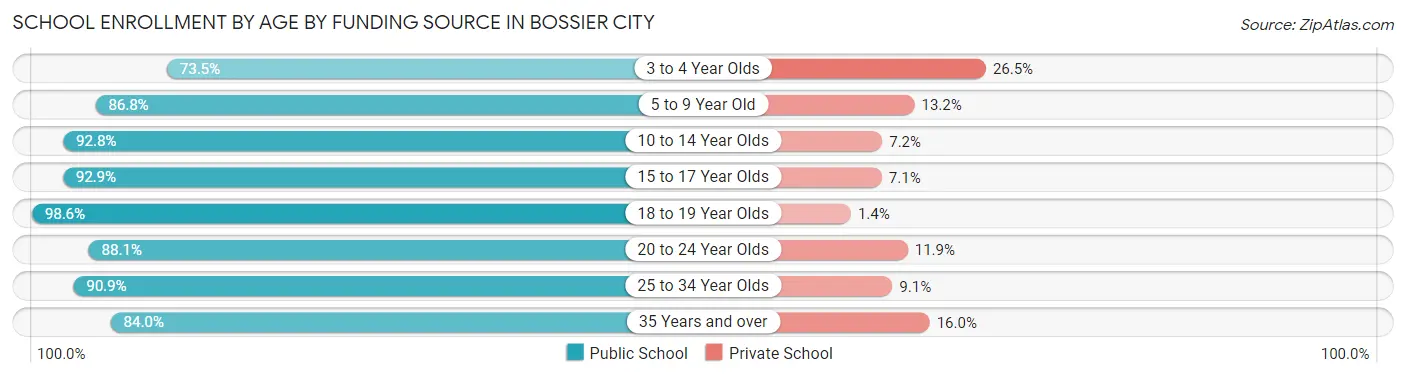
| Age Bracket | Public School | Private School |
| 3 to 4 Year Olds | 649 (73.5%) | 234 (26.5%) |
| 5 to 9 Year Old | 2,965 (86.8%) | 451 (13.2%) |
| 10 to 14 Year Olds | 3,937 (92.8%) | 305 (7.2%) |
| 15 to 17 Year Olds | 2,034 (92.9%) | 156 (7.1%) |
| 18 to 19 Year Olds | 873 (98.6%) | 12 (1.4%) |
| 20 to 24 Year Olds | 1,033 (88.1%) | 140 (11.9%) |
| 25 to 34 Year Olds | 1,132 (90.9%) | 113 (9.1%) |
| 35 Years and over | 885 (84.0%) | 169 (16.0%) |
| Total | 13,504 (89.5%) | 1,584 (10.5%) |
Educational Attainment by Field of Study in Bossier City
Business (1,896 | 18.1%), education (1,624 | 15.5%), science & technology (1,472 | 14.1%), arts & humanities (1,189 | 11.4%), and bio, nature & agricultural (789 | 7.5%) are the most common fields of study among 10,457 individuals in Bossier City who have obtained a bachelor's degree or higher.
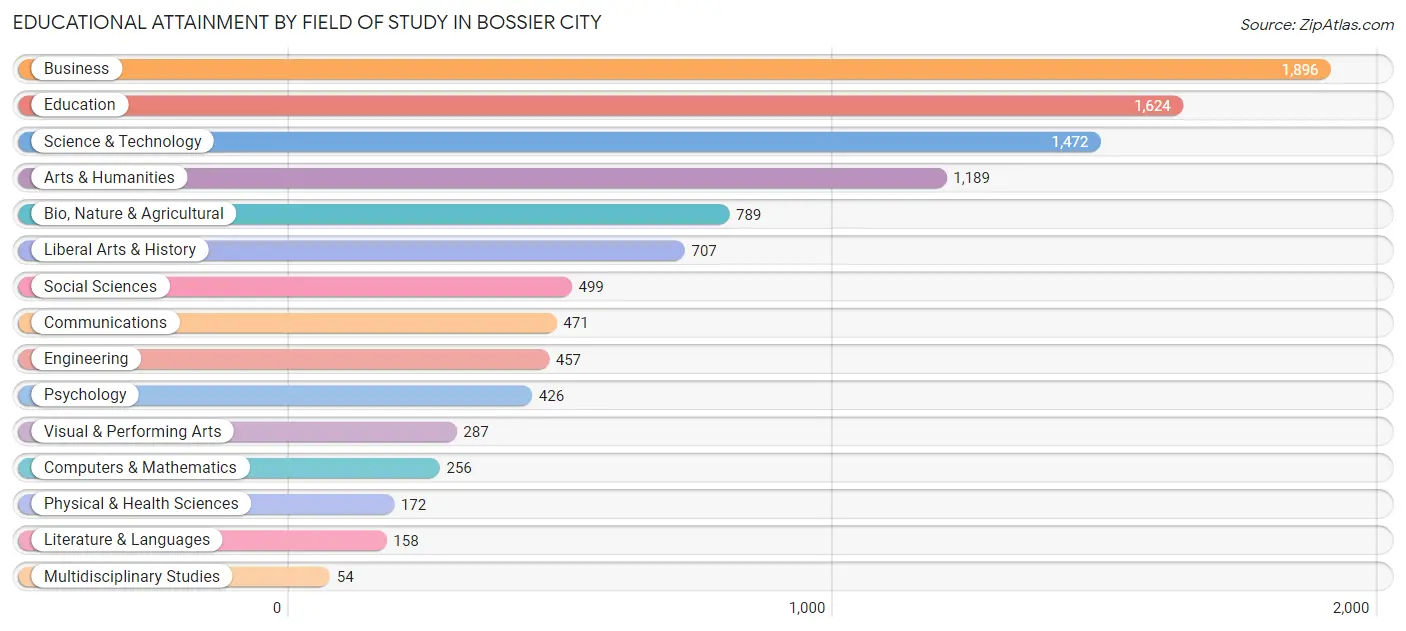
| Field of Study | # Graduates | % Graduates |
| Computers & Mathematics | 256 | 2.5% |
| Bio, Nature & Agricultural | 789 | 7.5% |
| Physical & Health Sciences | 172 | 1.6% |
| Psychology | 426 | 4.1% |
| Social Sciences | 499 | 4.8% |
| Engineering | 457 | 4.4% |
| Multidisciplinary Studies | 54 | 0.5% |
| Science & Technology | 1,472 | 14.1% |
| Business | 1,896 | 18.1% |
| Education | 1,624 | 15.5% |
| Literature & Languages | 158 | 1.5% |
| Liberal Arts & History | 707 | 6.8% |
| Visual & Performing Arts | 287 | 2.7% |
| Communications | 471 | 4.5% |
| Arts & Humanities | 1,189 | 11.4% |
| Total | 10,457 | 100.0% |
Transportation & Commute in Bossier City
Vehicle Availability by Sex in Bossier City
The most prevalent vehicle ownership categories in Bossier City are males with 2 vehicles (7,081, accounting for 47.7%) and females with 2 vehicles (4,931, making up 56.7%).
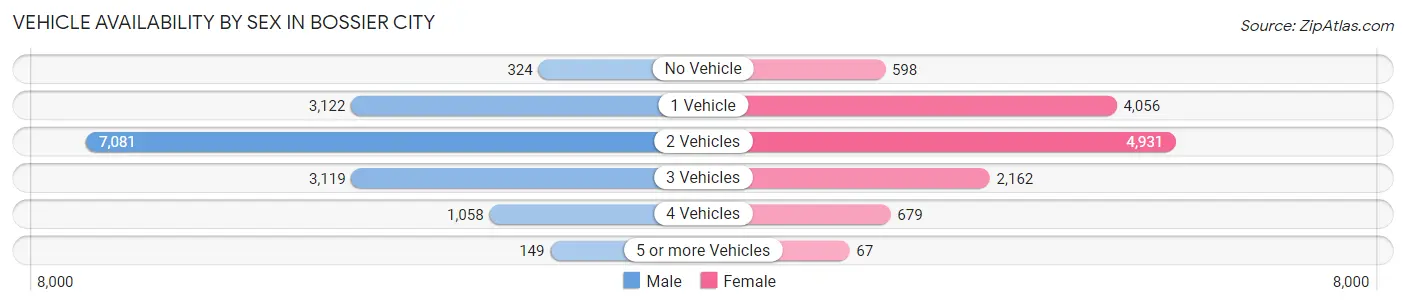
| Vehicles Available | Male | Female |
| No Vehicle | 324 (2.2%) | 598 (4.8%) |
| 1 Vehicle | 3,122 (21.0%) | 4,056 (32.5%) |
| 2 Vehicles | 7,081 (47.7%) | 4,931 (39.5%) |
| 3 Vehicles | 3,119 (21.0%) | 2,162 (17.3%) |
| 4 Vehicles | 1,058 (7.1%) | 679 (5.4%) |
| 5 or more Vehicles | 149 (1.0%) | 67 (0.5%) |
| Total | 14,853 (100.0%) | 12,493 (100.0%) |
Commute Time in Bossier City
The most frequently occuring commute durations in Bossier City are 15 to 19 minutes (7,350 commuters, 27.4%), 10 to 14 minutes (5,056 commuters, 18.8%), and 20 to 24 minutes (4,381 commuters, 16.3%).
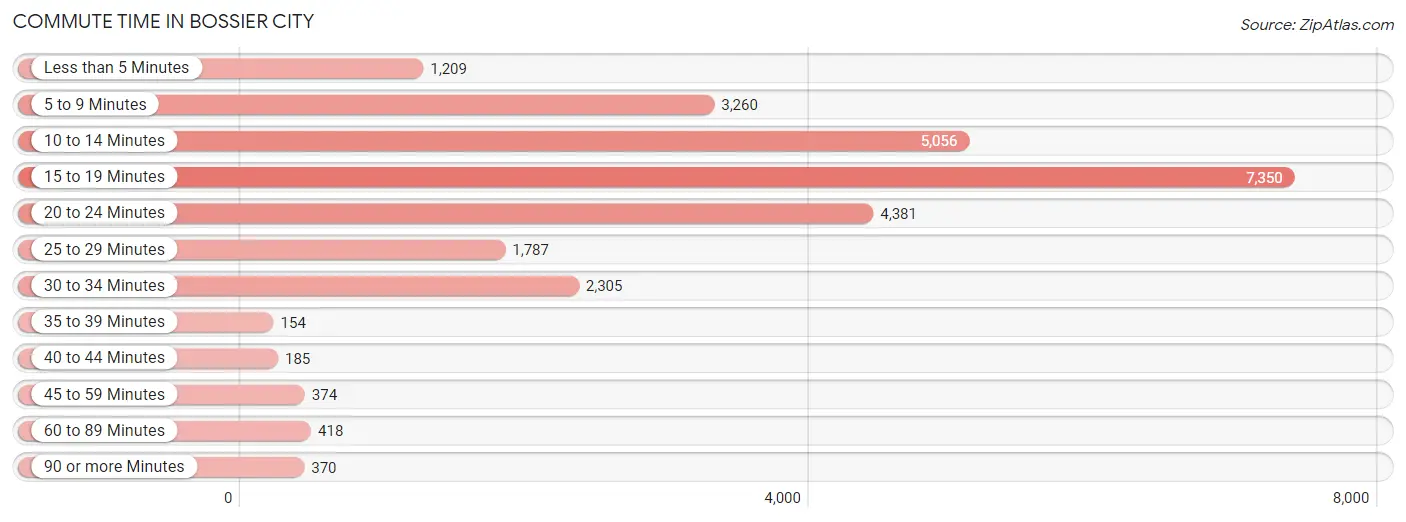
| Commute Time | # Commuters | % Commuters |
| Less than 5 Minutes | 1,209 | 4.5% |
| 5 to 9 Minutes | 3,260 | 12.1% |
| 10 to 14 Minutes | 5,056 | 18.8% |
| 15 to 19 Minutes | 7,350 | 27.4% |
| 20 to 24 Minutes | 4,381 | 16.3% |
| 25 to 29 Minutes | 1,787 | 6.7% |
| 30 to 34 Minutes | 2,305 | 8.6% |
| 35 to 39 Minutes | 154 | 0.6% |
| 40 to 44 Minutes | 185 | 0.7% |
| 45 to 59 Minutes | 374 | 1.4% |
| 60 to 89 Minutes | 418 | 1.6% |
| 90 or more Minutes | 370 | 1.4% |
Commute Time by Sex in Bossier City
The most common commute times in Bossier City are 15 to 19 minutes (4,139 commuters, 28.0%) for males and 15 to 19 minutes (3,211 commuters, 26.6%) for females.

| Commute Time | Male | Female |
| Less than 5 Minutes | 696 (4.7%) | 513 (4.3%) |
| 5 to 9 Minutes | 1,697 (11.5%) | 1,563 (13.0%) |
| 10 to 14 Minutes | 2,957 (20.0%) | 2,099 (17.4%) |
| 15 to 19 Minutes | 4,139 (28.0%) | 3,211 (26.6%) |
| 20 to 24 Minutes | 2,258 (15.3%) | 2,123 (17.6%) |
| 25 to 29 Minutes | 725 (4.9%) | 1,062 (8.8%) |
| 30 to 34 Minutes | 1,320 (8.9%) | 985 (8.2%) |
| 35 to 39 Minutes | 98 (0.7%) | 56 (0.5%) |
| 40 to 44 Minutes | 156 (1.1%) | 29 (0.2%) |
| 45 to 59 Minutes | 165 (1.1%) | 209 (1.7%) |
| 60 to 89 Minutes | 268 (1.8%) | 150 (1.2%) |
| 90 or more Minutes | 307 (2.1%) | 63 (0.5%) |
Time of Departure to Work by Sex in Bossier City
The most frequent times of departure to work in Bossier City are 12:00 AM to 4:59 AM (5,402, 36.5%) for males and 12:00 AM to 4:59 AM (3,479, 28.8%) for females.
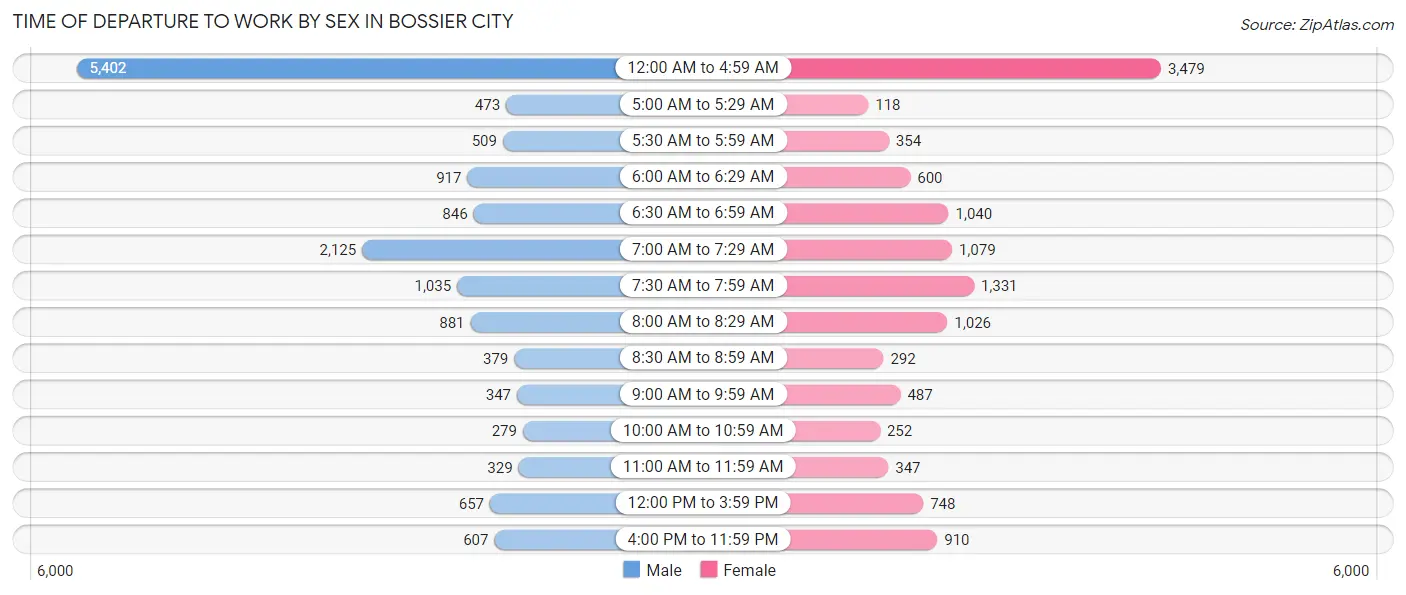
| Time of Departure | Male | Female |
| 12:00 AM to 4:59 AM | 5,402 (36.5%) | 3,479 (28.8%) |
| 5:00 AM to 5:29 AM | 473 (3.2%) | 118 (1.0%) |
| 5:30 AM to 5:59 AM | 509 (3.4%) | 354 (2.9%) |
| 6:00 AM to 6:29 AM | 917 (6.2%) | 600 (5.0%) |
| 6:30 AM to 6:59 AM | 846 (5.7%) | 1,040 (8.6%) |
| 7:00 AM to 7:29 AM | 2,125 (14.4%) | 1,079 (8.9%) |
| 7:30 AM to 7:59 AM | 1,035 (7.0%) | 1,331 (11.0%) |
| 8:00 AM to 8:29 AM | 881 (6.0%) | 1,026 (8.5%) |
| 8:30 AM to 8:59 AM | 379 (2.6%) | 292 (2.4%) |
| 9:00 AM to 9:59 AM | 347 (2.4%) | 487 (4.0%) |
| 10:00 AM to 10:59 AM | 279 (1.9%) | 252 (2.1%) |
| 11:00 AM to 11:59 AM | 329 (2.2%) | 347 (2.9%) |
| 12:00 PM to 3:59 PM | 657 (4.4%) | 748 (6.2%) |
| 4:00 PM to 11:59 PM | 607 (4.1%) | 910 (7.5%) |
| Total | 14,786 (100.0%) | 12,063 (100.0%) |
Housing Occupancy in Bossier City
Occupancy by Ownership in Bossier City
Of the total 24,439 dwellings in Bossier City, owner-occupied units account for 13,169 (53.9%), while renter-occupied units make up 11,270 (46.1%).
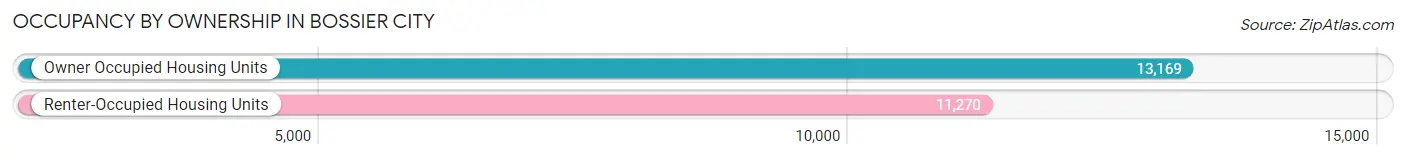
| Occupancy | # Housing Units | % Housing Units |
| Owner Occupied Housing Units | 13,169 | 53.9% |
| Renter-Occupied Housing Units | 11,270 | 46.1% |
| Total Occupied Housing Units | 24,439 | 100.0% |
Occupancy by Household Size in Bossier City
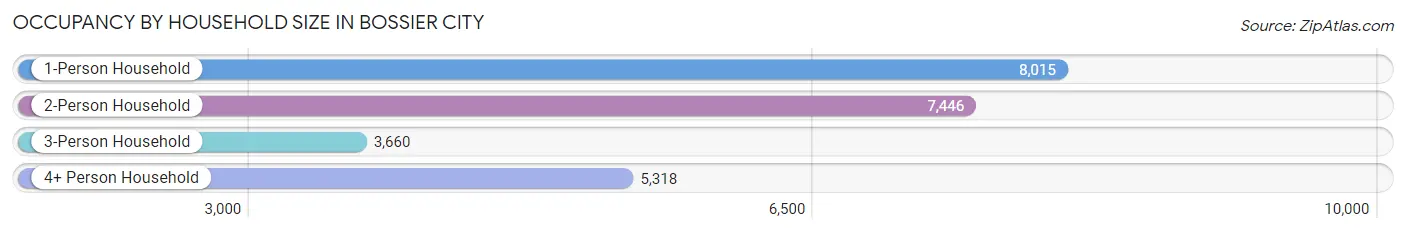
| Household Size | # Housing Units | % Housing Units |
| 1-Person Household | 8,015 | 32.8% |
| 2-Person Household | 7,446 | 30.5% |
| 3-Person Household | 3,660 | 15.0% |
| 4+ Person Household | 5,318 | 21.8% |
| Total Housing Units | 24,439 | 100.0% |
Occupancy by Ownership by Household Size in Bossier City
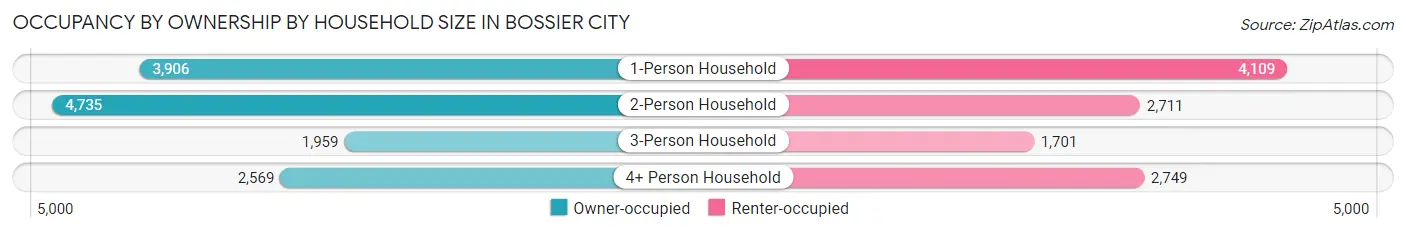
| Household Size | Owner-occupied | Renter-occupied |
| 1-Person Household | 3,906 (48.7%) | 4,109 (51.3%) |
| 2-Person Household | 4,735 (63.6%) | 2,711 (36.4%) |
| 3-Person Household | 1,959 (53.5%) | 1,701 (46.5%) |
| 4+ Person Household | 2,569 (48.3%) | 2,749 (51.7%) |
| Total Housing Units | 13,169 (53.9%) | 11,270 (46.1%) |
Occupancy by Educational Attainment in Bossier City
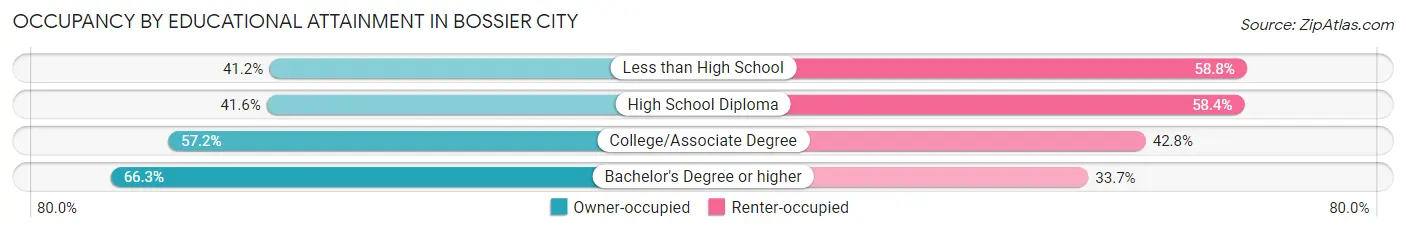
| Household Size | Owner-occupied | Renter-occupied |
| Less than High School | 897 (41.2%) | 1,278 (58.8%) |
| High School Diploma | 2,784 (41.6%) | 3,904 (58.4%) |
| College/Associate Degree | 5,310 (57.2%) | 3,968 (42.8%) |
| Bachelor's Degree or higher | 4,178 (66.3%) | 2,120 (33.7%) |
Occupancy by Age of Householder in Bossier City
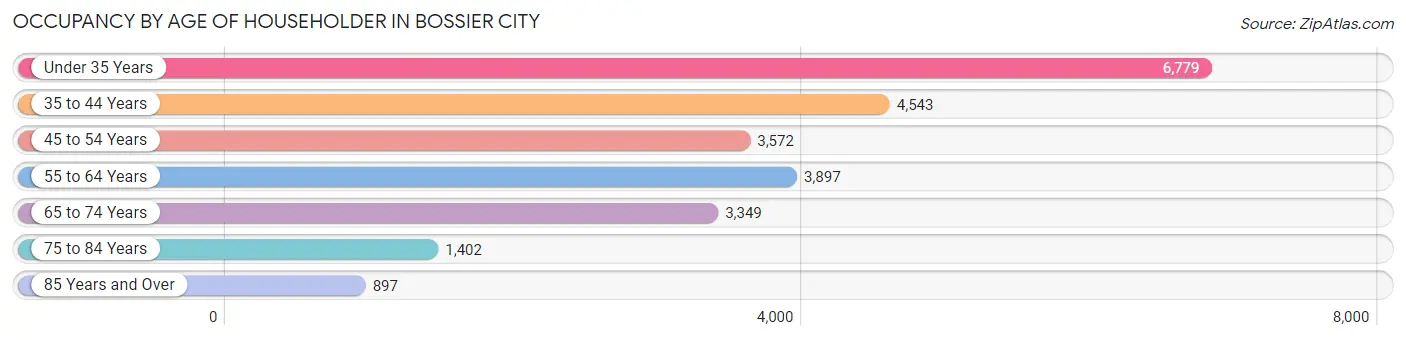
| Age Bracket | # Households | % Households |
| Under 35 Years | 6,779 | 27.7% |
| 35 to 44 Years | 4,543 | 18.6% |
| 45 to 54 Years | 3,572 | 14.6% |
| 55 to 64 Years | 3,897 | 16.0% |
| 65 to 74 Years | 3,349 | 13.7% |
| 75 to 84 Years | 1,402 | 5.7% |
| 85 Years and Over | 897 | 3.7% |
| Total | 24,439 | 100.0% |
Housing Finances in Bossier City
Median Income by Occupancy in Bossier City
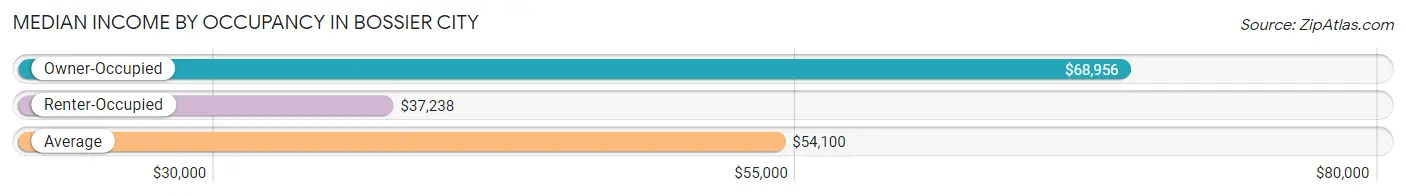
| Occupancy Type | # Households | Median Income |
| Owner-Occupied | 13,169 (53.9%) | $68,956 |
| Renter-Occupied | 11,270 (46.1%) | $37,238 |
| Average | 24,439 (100.0%) | $54,100 |
Occupancy by Householder Income Bracket in Bossier City
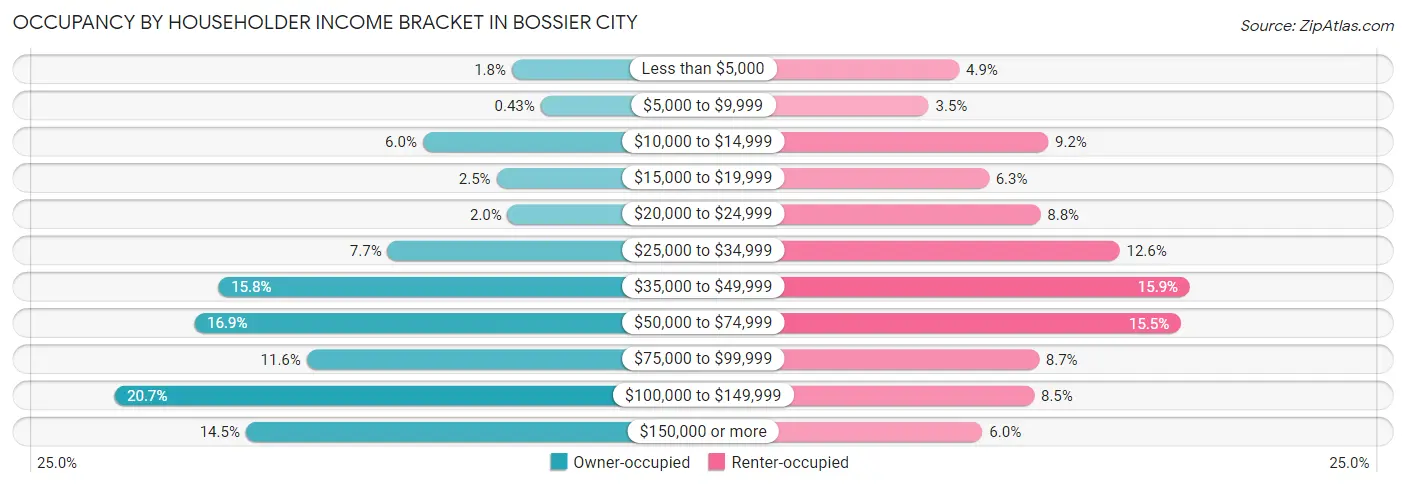
| Income Bracket | Owner-occupied | Renter-occupied |
| Less than $5,000 | 237 (1.8%) | 556 (4.9%) |
| $5,000 to $9,999 | 57 (0.4%) | 392 (3.5%) |
| $10,000 to $14,999 | 796 (6.0%) | 1,034 (9.2%) |
| $15,000 to $19,999 | 333 (2.5%) | 715 (6.3%) |
| $20,000 to $24,999 | 263 (2.0%) | 992 (8.8%) |
| $25,000 to $34,999 | 1,016 (7.7%) | 1,417 (12.6%) |
| $35,000 to $49,999 | 2,078 (15.8%) | 1,794 (15.9%) |
| $50,000 to $74,999 | 2,229 (16.9%) | 1,747 (15.5%) |
| $75,000 to $99,999 | 1,524 (11.6%) | 984 (8.7%) |
| $100,000 to $149,999 | 2,731 (20.7%) | 958 (8.5%) |
| $150,000 or more | 1,905 (14.5%) | 681 (6.0%) |
| Total | 13,169 (100.0%) | 11,270 (100.0%) |
Monthly Housing Cost Tiers in Bossier City
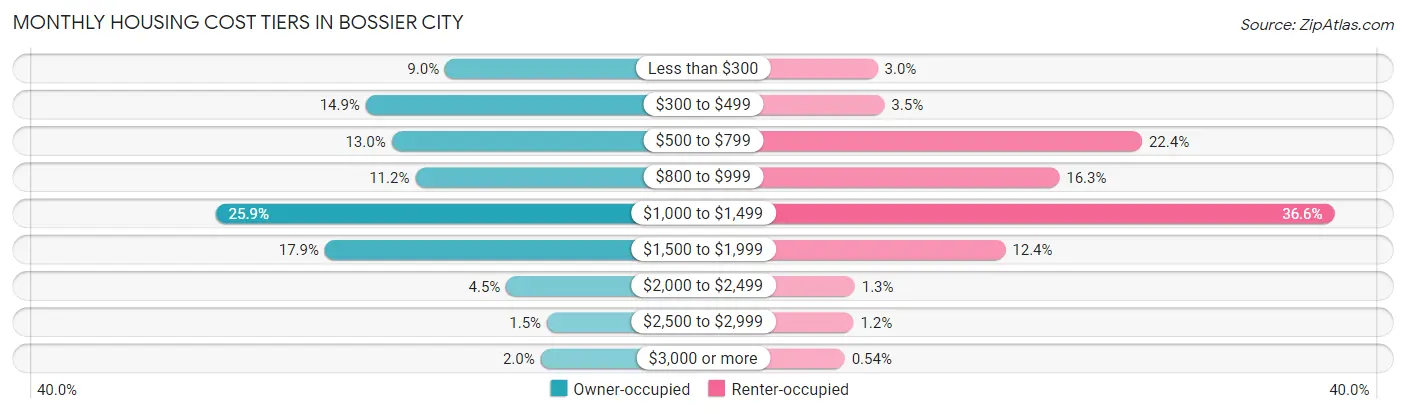
| Monthly Cost | Owner-occupied | Renter-occupied |
| Less than $300 | 1,190 (9.0%) | 334 (3.0%) |
| $300 to $499 | 1,959 (14.9%) | 390 (3.5%) |
| $500 to $799 | 1,709 (13.0%) | 2,528 (22.4%) |
| $800 to $999 | 1,479 (11.2%) | 1,842 (16.3%) |
| $1,000 to $1,499 | 3,415 (25.9%) | 4,124 (36.6%) |
| $1,500 to $1,999 | 2,356 (17.9%) | 1,394 (12.4%) |
| $2,000 to $2,499 | 596 (4.5%) | 144 (1.3%) |
| $2,500 to $2,999 | 201 (1.5%) | 133 (1.2%) |
| $3,000 or more | 264 (2.0%) | 61 (0.5%) |
| Total | 13,169 (100.0%) | 11,270 (100.0%) |
Physical Housing Characteristics in Bossier City
Housing Structures in Bossier City
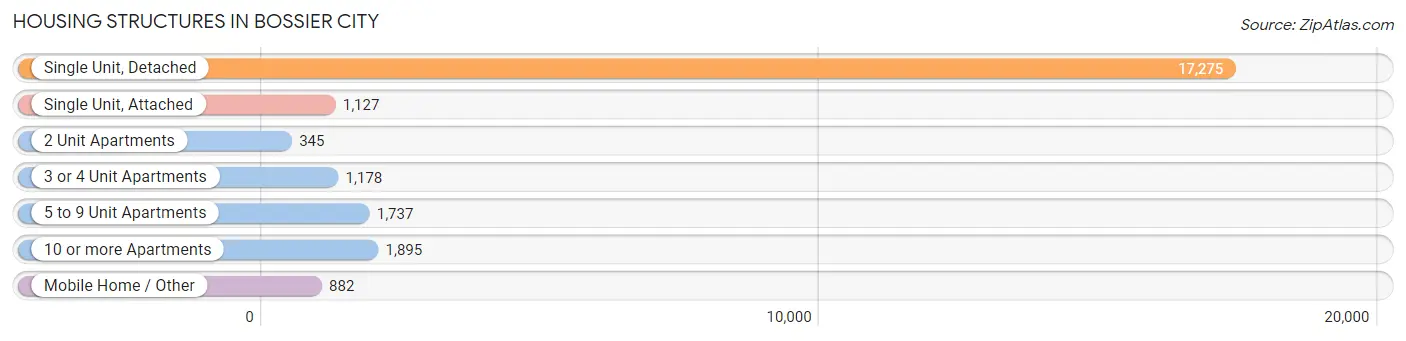
| Structure Type | # Housing Units | % Housing Units |
| Single Unit, Detached | 17,275 | 70.7% |
| Single Unit, Attached | 1,127 | 4.6% |
| 2 Unit Apartments | 345 | 1.4% |
| 3 or 4 Unit Apartments | 1,178 | 4.8% |
| 5 to 9 Unit Apartments | 1,737 | 7.1% |
| 10 or more Apartments | 1,895 | 7.7% |
| Mobile Home / Other | 882 | 3.6% |
| Total | 24,439 | 100.0% |
Housing Structures by Occupancy in Bossier City
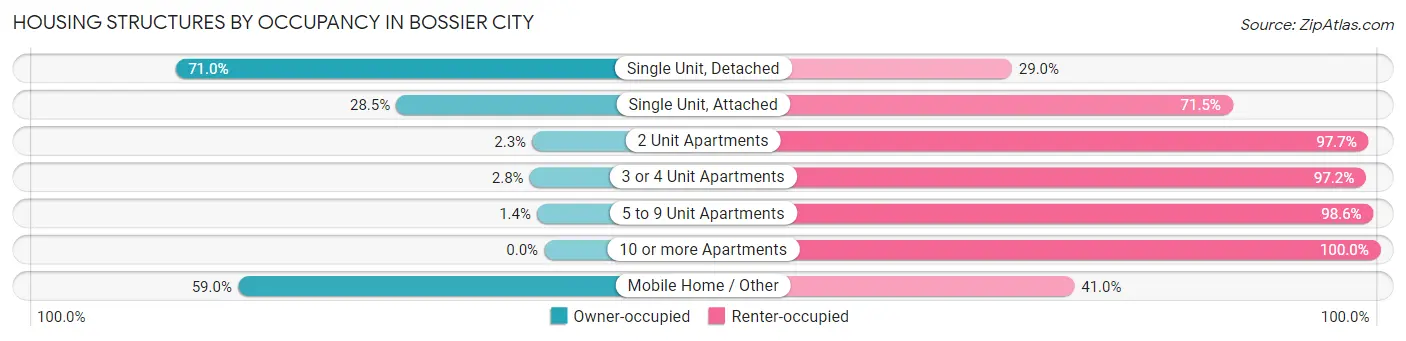
| Structure Type | Owner-occupied | Renter-occupied |
| Single Unit, Detached | 12,263 (71.0%) | 5,012 (29.0%) |
| Single Unit, Attached | 321 (28.5%) | 806 (71.5%) |
| 2 Unit Apartments | 8 (2.3%) | 337 (97.7%) |
| 3 or 4 Unit Apartments | 33 (2.8%) | 1,145 (97.2%) |
| 5 to 9 Unit Apartments | 24 (1.4%) | 1,713 (98.6%) |
| 10 or more Apartments | 0 (0.0%) | 1,895 (100.0%) |
| Mobile Home / Other | 520 (59.0%) | 362 (41.0%) |
| Total | 13,169 (53.9%) | 11,270 (46.1%) |
Housing Structures by Number of Rooms in Bossier City
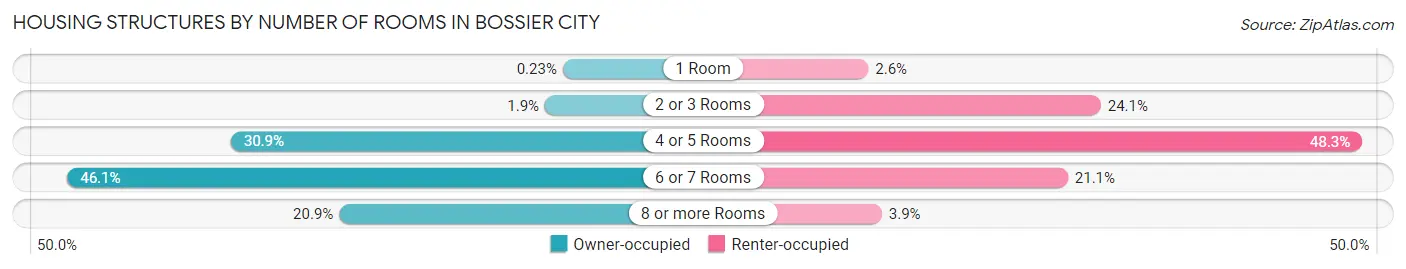
| Number of Rooms | Owner-occupied | Renter-occupied |
| 1 Room | 30 (0.2%) | 296 (2.6%) |
| 2 or 3 Rooms | 248 (1.9%) | 2,719 (24.1%) |
| 4 or 5 Rooms | 4,073 (30.9%) | 5,442 (48.3%) |
| 6 or 7 Rooms | 6,064 (46.1%) | 2,376 (21.1%) |
| 8 or more Rooms | 2,754 (20.9%) | 437 (3.9%) |
| Total | 13,169 (100.0%) | 11,270 (100.0%) |
Housing Structure by Heating Type in Bossier City
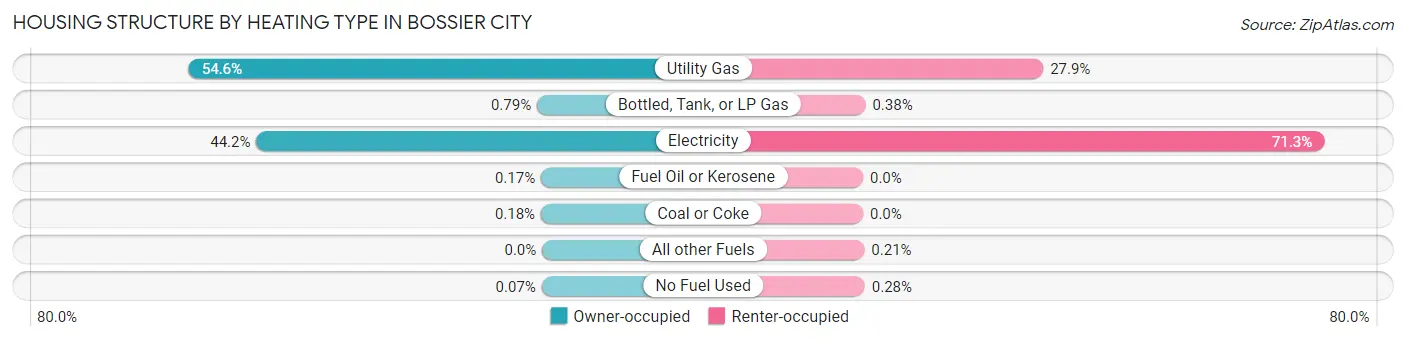
| Heating Type | Owner-occupied | Renter-occupied |
| Utility Gas | 7,191 (54.6%) | 3,139 (27.9%) |
| Bottled, Tank, or LP Gas | 104 (0.8%) | 43 (0.4%) |
| Electricity | 5,818 (44.2%) | 8,032 (71.3%) |
| Fuel Oil or Kerosene | 23 (0.2%) | 0 (0.0%) |
| Coal or Coke | 24 (0.2%) | 0 (0.0%) |
| All other Fuels | 0 (0.0%) | 24 (0.2%) |
| No Fuel Used | 9 (0.1%) | 32 (0.3%) |
| Total | 13,169 (100.0%) | 11,270 (100.0%) |
Household Vehicle Usage in Bossier City
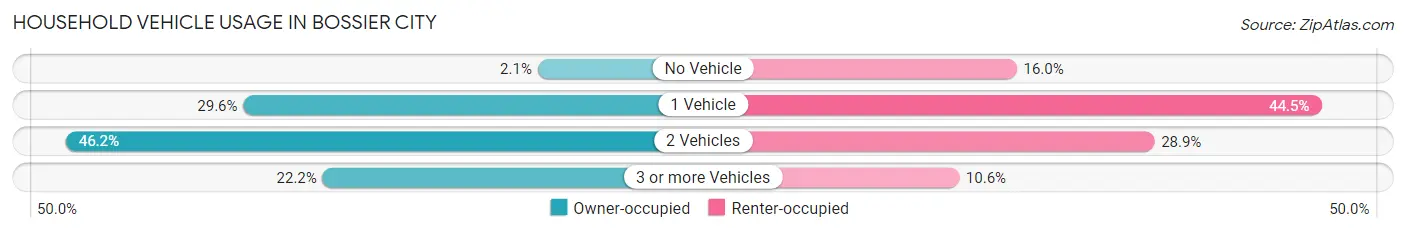
| Vehicles per Household | Owner-occupied | Renter-occupied |
| No Vehicle | 276 (2.1%) | 1,805 (16.0%) |
| 1 Vehicle | 3,895 (29.6%) | 5,012 (44.5%) |
| 2 Vehicles | 6,077 (46.2%) | 3,254 (28.9%) |
| 3 or more Vehicles | 2,921 (22.2%) | 1,199 (10.6%) |
| Total | 13,169 (100.0%) | 11,270 (100.0%) |
Real Estate & Mortgages in Bossier City
Real Estate and Mortgage Overview in Bossier City
| Characteristic | Without Mortgage | With Mortgage |
| Housing Units | 4,441 | 8,728 |
| Median Property Value | $172,800 | $195,300 |
| Median Household Income | $50,574 | $1,394 |
| Monthly Housing Costs | $385 | $264 |
| Real Estate Taxes | $829 | $848 |
Property Value by Mortgage Status in Bossier City
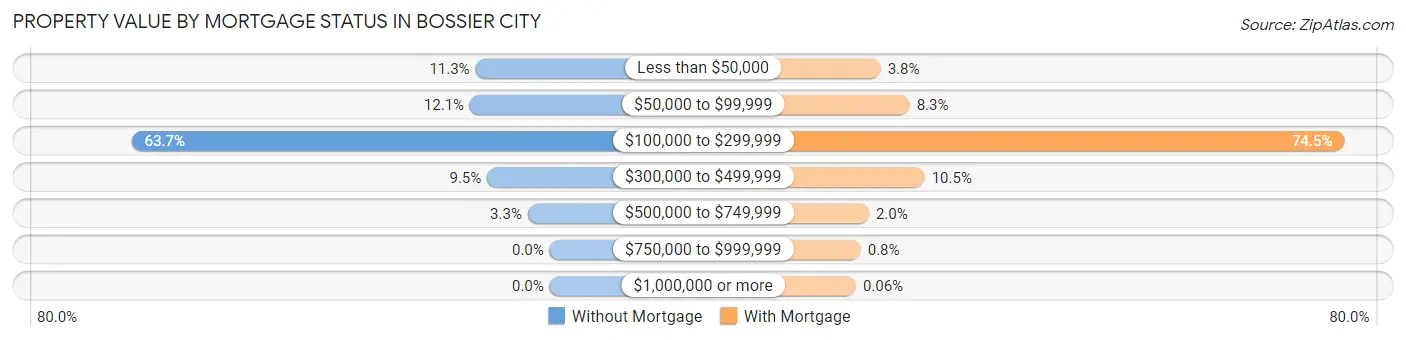
| Property Value | Without Mortgage | With Mortgage |
| Less than $50,000 | 502 (11.3%) | 335 (3.8%) |
| $50,000 to $99,999 | 539 (12.1%) | 721 (8.3%) |
| $100,000 to $299,999 | 2,829 (63.7%) | 6,499 (74.5%) |
| $300,000 to $499,999 | 423 (9.5%) | 920 (10.5%) |
| $500,000 to $749,999 | 148 (3.3%) | 178 (2.0%) |
| $750,000 to $999,999 | 0 (0.0%) | 70 (0.8%) |
| $1,000,000 or more | 0 (0.0%) | 5 (0.1%) |
| Total | 4,441 (100.0%) | 8,728 (100.0%) |
Household Income by Mortgage Status in Bossier City
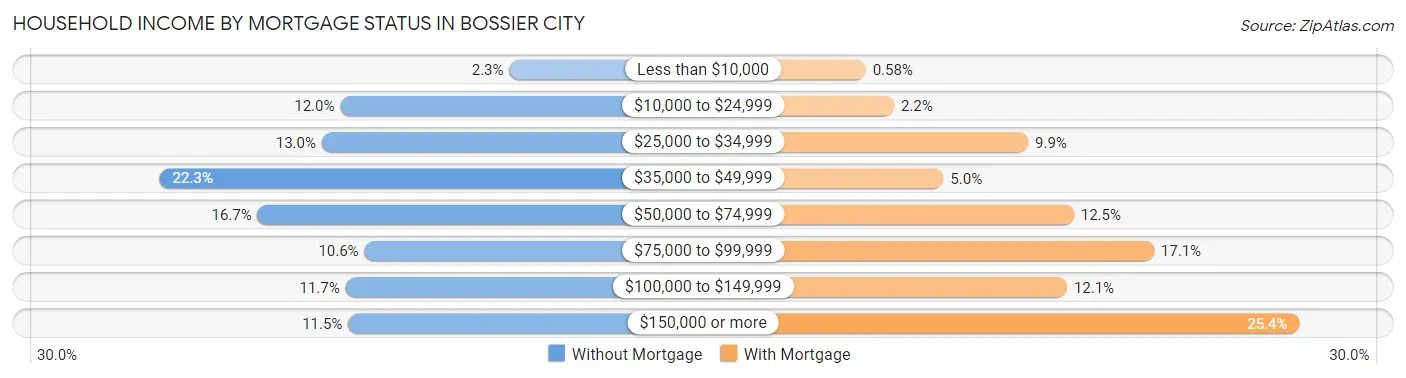
| Household Income | Without Mortgage | With Mortgage |
| Less than $10,000 | 102 (2.3%) | 51 (0.6%) |
| $10,000 to $24,999 | 531 (12.0%) | 192 (2.2%) |
| $25,000 to $34,999 | 578 (13.0%) | 861 (9.9%) |
| $35,000 to $49,999 | 990 (22.3%) | 438 (5.0%) |
| $50,000 to $74,999 | 741 (16.7%) | 1,088 (12.5%) |
| $75,000 to $99,999 | 470 (10.6%) | 1,488 (17.1%) |
| $100,000 to $149,999 | 518 (11.7%) | 1,054 (12.1%) |
| $150,000 or more | 511 (11.5%) | 2,213 (25.4%) |
| Total | 4,441 (100.0%) | 8,728 (100.0%) |
Property Value to Household Income Ratio in Bossier City
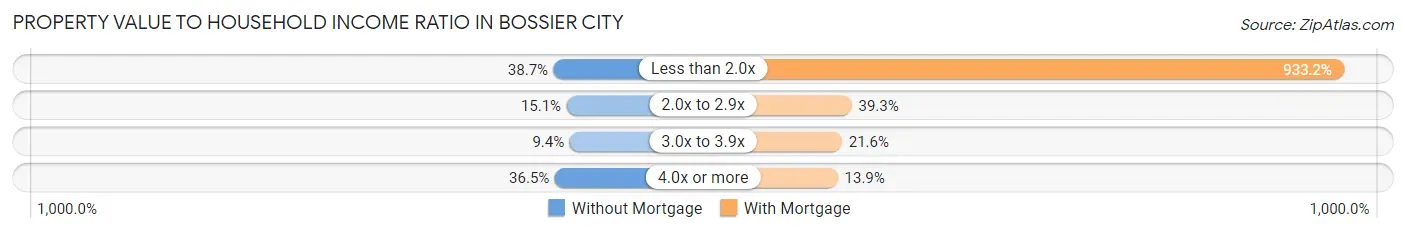
| Value-to-Income Ratio | Without Mortgage | With Mortgage |
| Less than 2.0x | 1,718 (38.7%) | 81,447 (933.2%) |
| 2.0x to 2.9x | 669 (15.1%) | 3,429 (39.3%) |
| 3.0x to 3.9x | 419 (9.4%) | 1,884 (21.6%) |
| 4.0x or more | 1,620 (36.5%) | 1,214 (13.9%) |
| Total | 4,441 (100.0%) | 8,728 (100.0%) |
Real Estate Taxes by Mortgage Status in Bossier City
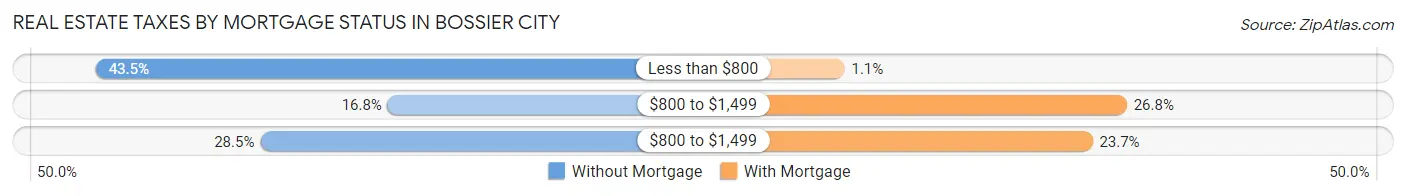
| Property Taxes | Without Mortgage | With Mortgage |
| Less than $800 | 1,932 (43.5%) | 92 (1.1%) |
| $800 to $1,499 | 748 (16.8%) | 2,341 (26.8%) |
| $800 to $1,499 | 1,265 (28.5%) | 2,068 (23.7%) |
| Total | 4,441 (100.0%) | 8,728 (100.0%) |
Health & Disability in Bossier City
Health Insurance Coverage by Age in Bossier City
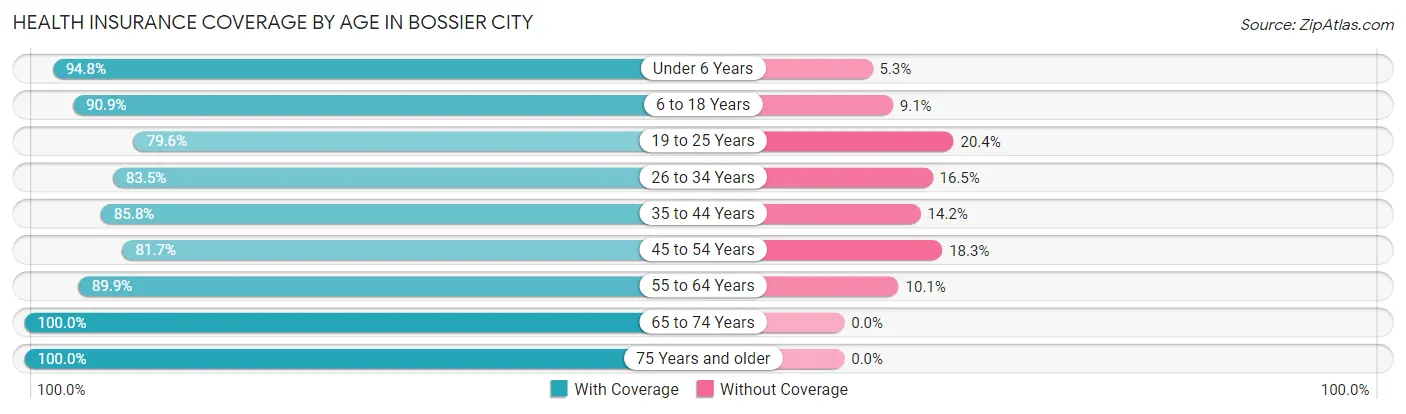
| Age Bracket | With Coverage | Without Coverage |
| Under 6 Years | 4,924 (94.8%) | 273 (5.2%) |
| 6 to 18 Years | 9,560 (90.9%) | 953 (9.1%) |
| 19 to 25 Years | 4,223 (79.6%) | 1,081 (20.4%) |
| 26 to 34 Years | 6,726 (83.5%) | 1,326 (16.5%) |
| 35 to 44 Years | 6,751 (85.8%) | 1,121 (14.2%) |
| 45 to 54 Years | 5,331 (81.7%) | 1,191 (18.3%) |
| 55 to 64 Years | 6,148 (89.9%) | 693 (10.1%) |
| 65 to 74 Years | 5,195 (100.0%) | 0 (0.0%) |
| 75 Years and older | 3,703 (100.0%) | 0 (0.0%) |
| Total | 52,561 (88.8%) | 6,638 (11.2%) |
Health Insurance Coverage by Citizenship Status in Bossier City
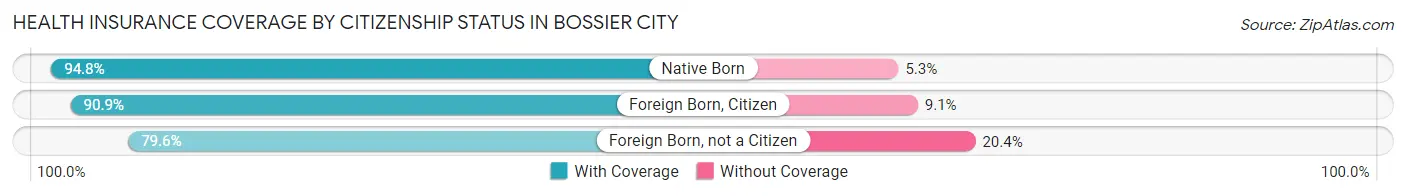
| Citizenship Status | With Coverage | Without Coverage |
| Native Born | 4,924 (94.8%) | 273 (5.2%) |
| Foreign Born, Citizen | 9,560 (90.9%) | 953 (9.1%) |
| Foreign Born, not a Citizen | 4,223 (79.6%) | 1,081 (20.4%) |
Health Insurance Coverage by Household Income in Bossier City
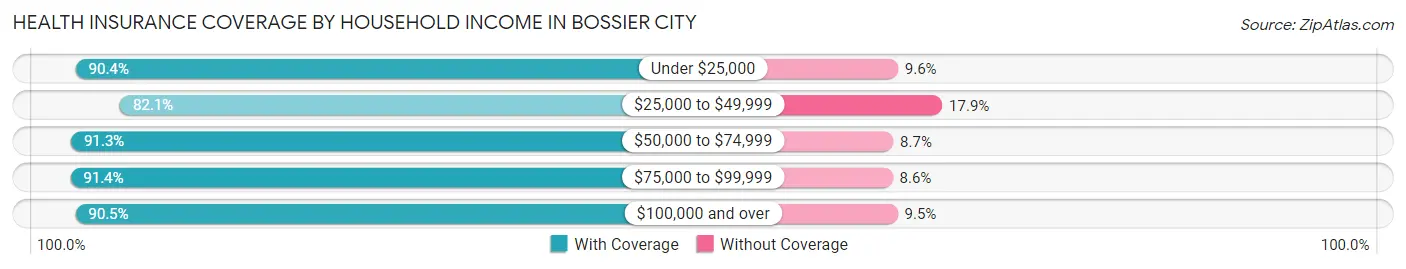
| Household Income | With Coverage | Without Coverage |
| Under $25,000 | 9,973 (90.4%) | 1,054 (9.6%) |
| $25,000 to $49,999 | 11,231 (82.1%) | 2,443 (17.9%) |
| $50,000 to $74,999 | 8,440 (91.3%) | 803 (8.7%) |
| $75,000 to $99,999 | 6,041 (91.4%) | 567 (8.6%) |
| $100,000 and over | 16,720 (90.5%) | 1,760 (9.5%) |
Public vs Private Health Insurance Coverage by Age in Bossier City
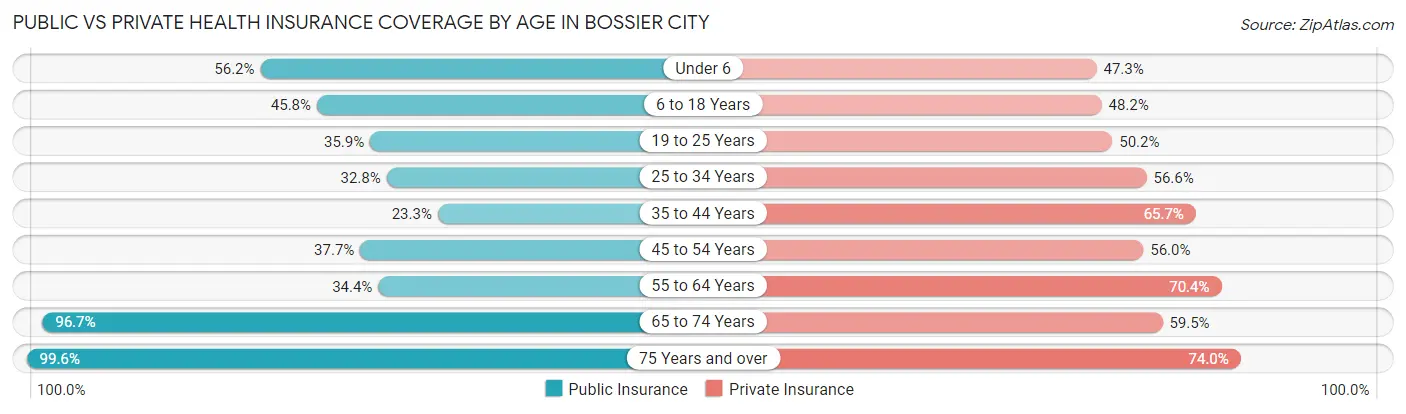
| Age Bracket | Public Insurance | Private Insurance |
| Under 6 | 2,923 (56.2%) | 2,457 (47.3%) |
| 6 to 18 Years | 4,810 (45.8%) | 5,068 (48.2%) |
| 19 to 25 Years | 1,903 (35.9%) | 2,663 (50.2%) |
| 25 to 34 Years | 2,643 (32.8%) | 4,555 (56.6%) |
| 35 to 44 Years | 1,836 (23.3%) | 5,170 (65.7%) |
| 45 to 54 Years | 2,460 (37.7%) | 3,650 (56.0%) |
| 55 to 64 Years | 2,351 (34.4%) | 4,818 (70.4%) |
| 65 to 74 Years | 5,024 (96.7%) | 3,092 (59.5%) |
| 75 Years and over | 3,689 (99.6%) | 2,741 (74.0%) |
| Total | 27,639 (46.7%) | 34,214 (57.8%) |
Disability Status by Sex by Age in Bossier City
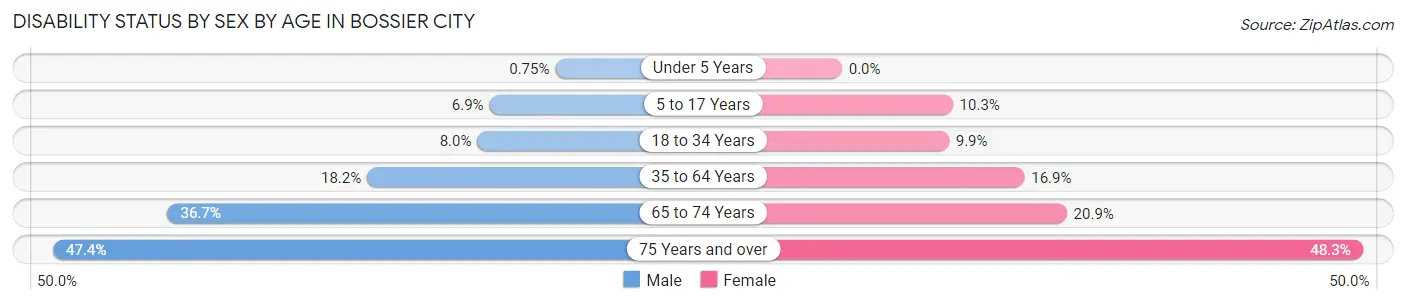
| Age Bracket | Male | Female |
| Under 5 Years | 17 (0.7%) | 0 (0.0%) |
| 5 to 17 Years | 347 (6.9%) | 551 (10.3%) |
| 18 to 34 Years | 568 (8.0%) | 702 (9.9%) |
| 35 to 64 Years | 1,873 (18.2%) | 1,856 (16.9%) |
| 65 to 74 Years | 794 (36.7%) | 633 (20.9%) |
| 75 Years and over | 763 (47.4%) | 1,011 (48.3%) |
Disability Class by Sex by Age in Bossier City
Disability Class: Hearing Difficulty
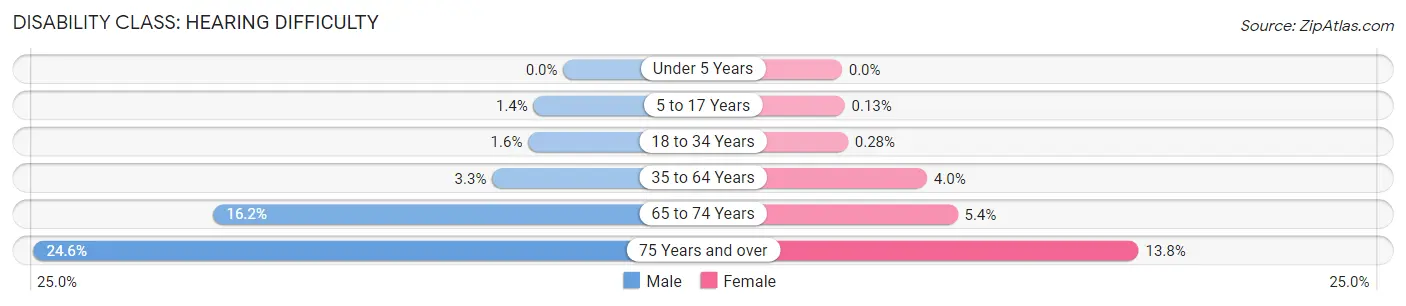
| Age Bracket | Male | Female |
| Under 5 Years | 0 (0.0%) | 0 (0.0%) |
| 5 to 17 Years | 70 (1.4%) | 7 (0.1%) |
| 18 to 34 Years | 116 (1.6%) | 20 (0.3%) |
| 35 to 64 Years | 339 (3.3%) | 433 (4.0%) |
| 65 to 74 Years | 351 (16.2%) | 163 (5.4%) |
| 75 Years and over | 396 (24.6%) | 288 (13.8%) |
Disability Class: Vision Difficulty
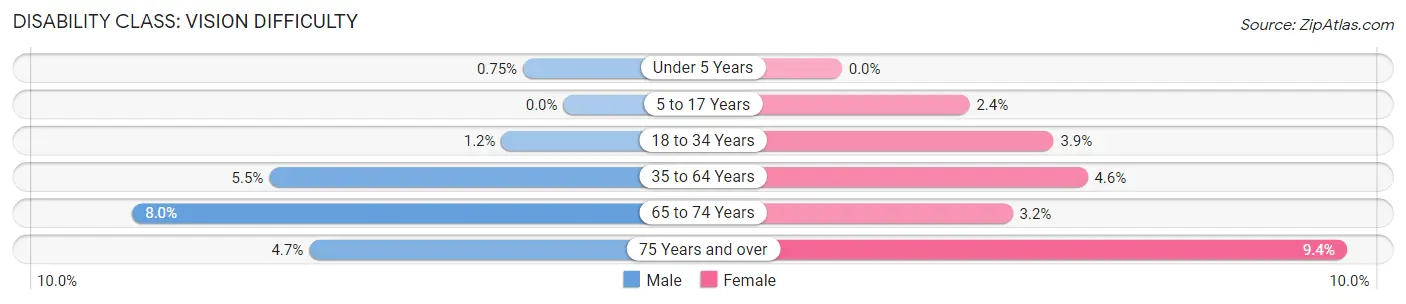
| Age Bracket | Male | Female |
| Under 5 Years | 17 (0.7%) | 0 (0.0%) |
| 5 to 17 Years | 0 (0.0%) | 127 (2.4%) |
| 18 to 34 Years | 82 (1.1%) | 278 (3.9%) |
| 35 to 64 Years | 561 (5.5%) | 500 (4.6%) |
| 65 to 74 Years | 173 (8.0%) | 96 (3.2%) |
| 75 Years and over | 76 (4.7%) | 196 (9.4%) |
Disability Class: Cognitive Difficulty
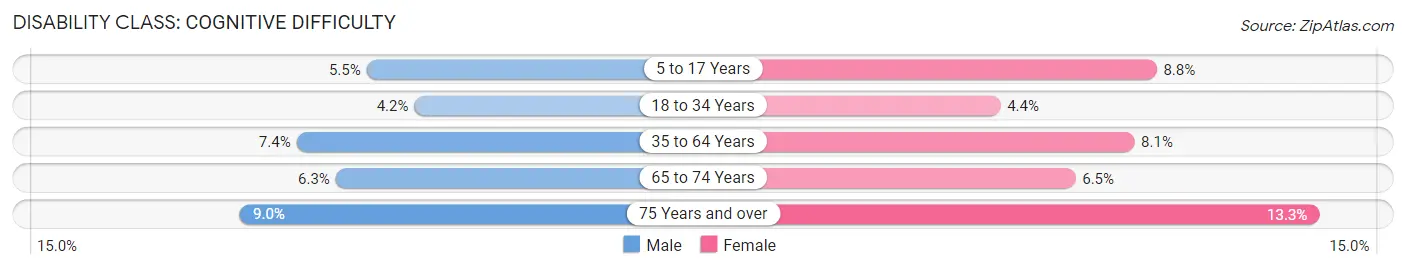
| Age Bracket | Male | Female |
| 5 to 17 Years | 277 (5.5%) | 469 (8.8%) |
| 18 to 34 Years | 295 (4.2%) | 312 (4.4%) |
| 35 to 64 Years | 764 (7.4%) | 892 (8.1%) |
| 65 to 74 Years | 137 (6.3%) | 197 (6.5%) |
| 75 Years and over | 145 (9.0%) | 278 (13.3%) |
Disability Class: Ambulatory Difficulty
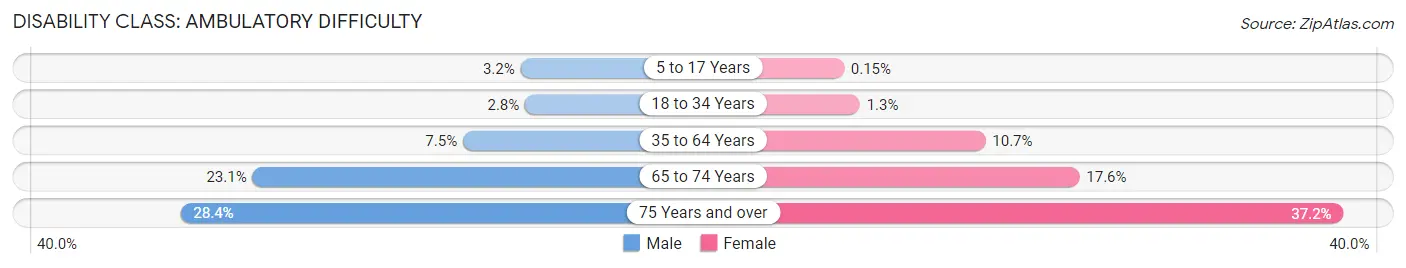
| Age Bracket | Male | Female |
| 5 to 17 Years | 161 (3.2%) | 8 (0.2%) |
| 18 to 34 Years | 202 (2.8%) | 94 (1.3%) |
| 35 to 64 Years | 766 (7.4%) | 1,168 (10.7%) |
| 65 to 74 Years | 499 (23.1%) | 535 (17.6%) |
| 75 Years and over | 458 (28.4%) | 779 (37.2%) |
Disability Class: Self-Care Difficulty
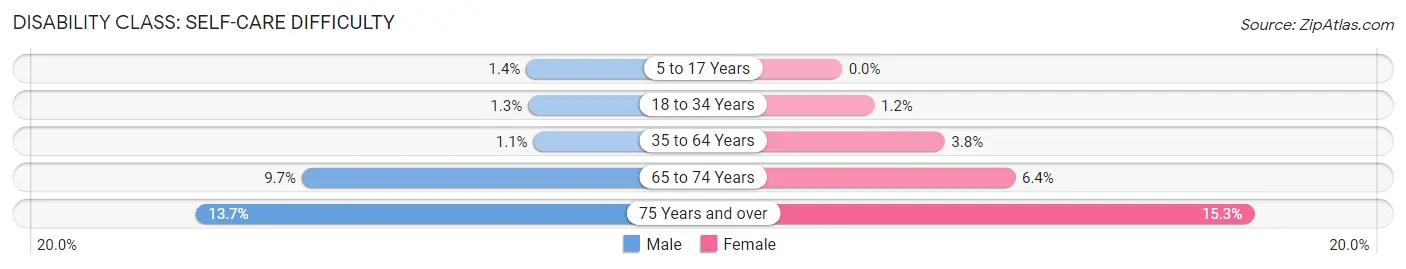
| Age Bracket | Male | Female |
| 5 to 17 Years | 70 (1.4%) | 0 (0.0%) |
| 18 to 34 Years | 93 (1.3%) | 85 (1.2%) |
| 35 to 64 Years | 114 (1.1%) | 417 (3.8%) |
| 65 to 74 Years | 210 (9.7%) | 195 (6.4%) |
| 75 Years and over | 220 (13.7%) | 320 (15.3%) |
Technology Access in Bossier City
Computing Device Access in Bossier City
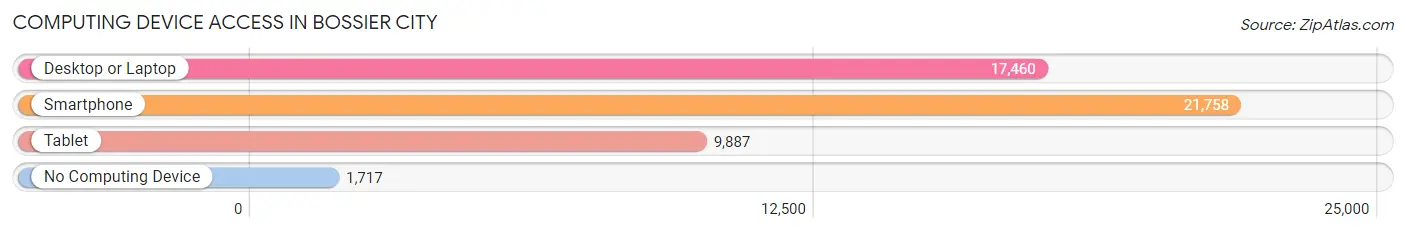
| Device Type | # Households | % Households |
| Desktop or Laptop | 17,460 | 71.4% |
| Smartphone | 21,758 | 89.0% |
| Tablet | 9,887 | 40.5% |
| No Computing Device | 1,717 | 7.0% |
| Total | 24,439 | 100.0% |
Internet Access in Bossier City
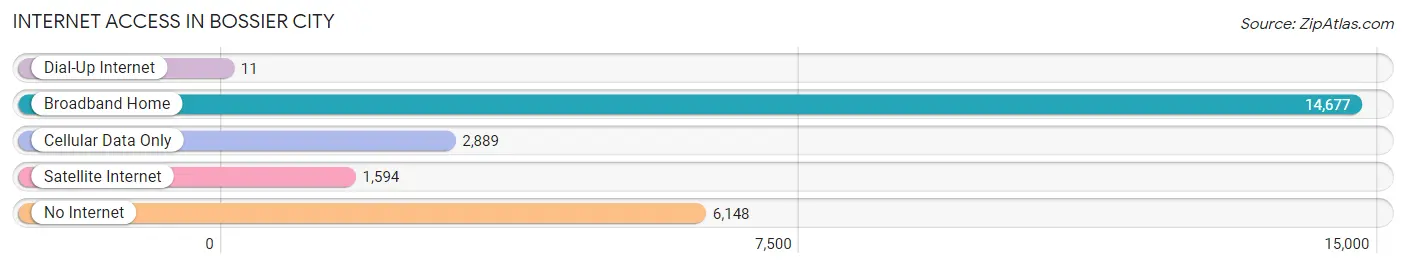
| Internet Type | # Households | % Households |
| Dial-Up Internet | 11 | 0.1% |
| Broadband Home | 14,677 | 60.1% |
| Cellular Data Only | 2,889 | 11.8% |
| Satellite Internet | 1,594 | 6.5% |
| No Internet | 6,148 | 25.2% |
| Total | 24,439 | 100.0% |
Bossier City Summary
Bossier City is a city located in Bossier Parish, Louisiana, United States. It is located on the eastern bank of the Red River and is adjacent to Shreveport, the parish seat of Caddo Parish. As of the 2010 census, Bossier City had a population of 61,315, making it the sixth-largest city in the state.
History
Bossier City was founded in 1843 by Charles Bossier, a cotton farmer from Natchitoches Parish. The city was named after him. The area was originally part of the land grant given to the Caddo Indians by the United States government in 1835. The land was later sold to Charles Bossier, who established a cotton plantation.
In the late 19th century, Bossier City began to grow as a center for the lumber industry. The city was incorporated in 1908. During World War II, the city was home to Barksdale Air Force Base, which was a major training center for the United States Army Air Corps.
Geography
Bossier City is located in the northwest corner of Louisiana, on the eastern bank of the Red River. It is bordered by Shreveport to the south, Haughton to the east, and Benton to the north. The city has a total area of 33.7 square miles, of which 33.3 square miles is land and 0.4 square miles is water.
The city is located in the humid subtropical climate zone, with hot, humid summers and mild winters. The average annual temperature is 64.2°F, with an average high of 79.2°F in July and an average low of 48.2°F in January. The average annual precipitation is 49.2 inches.
Economy
Bossier City is a major economic center in the Shreveport-Bossier City metropolitan area. The city is home to several major employers, including Barksdale Air Force Base, the Louisiana Boardwalk Outlets, and the Louisiana State University Health Sciences Center.
The city is also home to several major industries, including oil and gas, manufacturing, and healthcare. The city's economy is also supported by tourism, with the Louisiana Boardwalk Outlets and the Red River National Wildlife Refuge drawing visitors from across the region.
Demographics
As of the 2010 census, there were 61,315 people, 24,844 households, and 16,845 families residing in the city. The population density was 1,837.2 people per square mile. The racial makeup of the city was 68.2% White, 25.2% African American, 0.6% Native American, 1.9% Asian, 0.1% Pacific Islander, 1.7% from other races, and 2.3% from two or more races. Hispanic or Latino of any race were 5.2% of the population.
The median income for a household in the city was $45,945, and the median income for a family was $54,844. The per capita income for the city was $23,837. About 11.2% of families and 14.2% of the population were below the poverty line, including 19.2% of those under age 18 and 10.2% of those age 65 or over.
Conclusion
Bossier City is a vibrant city located in Bossier Parish, Louisiana. It is home to a diverse population and a strong economy, with major employers such as Barksdale Air Force Base, the Louisiana Boardwalk Outlets, and the Louisiana State University Health Sciences Center. The city is also home to several major industries, including oil and gas, manufacturing, and healthcare. With its rich history, diverse population, and strong economy, Bossier City is a great place to live and work.
Common Questions
What is Per Capita Income in Bossier City?
Per Capita income in Bossier City is $30,737.
What is the Median Family Income in Bossier City?
Median Family Income in Bossier City is $68,272.
What is the Median Household income in Bossier City?
Median Household Income in Bossier City is $54,100.
What is Income or Wage Gap in Bossier City?
Income or Wage Gap in Bossier City is 33.9%.
Women in Bossier City earn 66.1 cents for every dollar earned by a man.
What is Family Income Deficit in Bossier City?
Family Income Deficit in Bossier City is $11,464.
Families that are below poverty line in Bossier City earn $11,464 less on average than the poverty threshold level.
What is Inequality or Gini Index in Bossier City?
Inequality or Gini Index in Bossier City is 0.46.
What is the Total Population of Bossier City?
Total Population of Bossier City is 62,971.
What is the Total Male Population of Bossier City?
Total Male Population of Bossier City is 31,329.
What is the Total Female Population of Bossier City?
Total Female Population of Bossier City is 31,642.
What is the Ratio of Males per 100 Females in Bossier City?
There are 99.01 Males per 100 Females in Bossier City.
What is the Ratio of Females per 100 Males in Bossier City?
There are 101.00 Females per 100 Males in Bossier City.
What is the Median Population Age in Bossier City?
Median Population Age in Bossier City is 35.1 Years.
What is the Average Family Size in Bossier City
Average Family Size in Bossier City is 3.2 People.
What is the Average Household Size in Bossier City
Average Household Size in Bossier City is 2.5 People.
How Large is the Labor Force in Bossier City?
There are 29,826 People in the Labor Forcein in Bossier City.
What is the Percentage of People in the Labor Force in Bossier City?
60.0% of People are in the Labor Force in Bossier City.
What is the Unemployment Rate in Bossier City?
Unemployment Rate in Bossier City is 5.8%.