Roswell, NM Map & Demographics
Roswell Map
Roswell Overview
$25,906
PER CAPITA INCOME
$57,490
AVG FAMILY INCOME
$48,298
AVG HOUSEHOLD INCOME
27.1%
WAGE / INCOME GAP [ % ]
72.9¢/ $1
WAGE / INCOME GAP [ $ ]
$12,223
FAMILY INCOME DEFICIT
0.48
INEQUALITY / GINI INDEX
48,035
TOTAL POPULATION
23,937
MALE POPULATION
24,098
FEMALE POPULATION
99.33
MALES / 100 FEMALES
100.67
FEMALES / 100 MALES
35.5
MEDIAN AGE
3.3
AVG FAMILY SIZE
2.6
AVG HOUSEHOLD SIZE
20,749
LABOR FORCE [ PEOPLE ]
56.2%
PERCENT IN LABOR FORCE
5.4%
UNEMPLOYMENT RATE
Income in Roswell
Income Overview in Roswell
Per Capita Income in Roswell is $25,906, while median incomes of families and households are $57,490 and $48,298 respectively.
| Characteristic | Number | Measure |
| Per Capita Income | 48,035 | $25,906 |
| Median Family Income | 11,219 | $57,490 |
| Mean Family Income | 11,219 | $79,631 |
| Median Household Income | 17,438 | $48,298 |
| Mean Household Income | 17,438 | $68,407 |
| Income Deficit | 11,219 | $12,223 |
| Wage / Income Gap (%) | 48,035 | 27.07% |
| Wage / Income Gap ($) | 48,035 | 72.93¢ per $1 |
| Gini / Inequality Index | 48,035 | 0.48 |
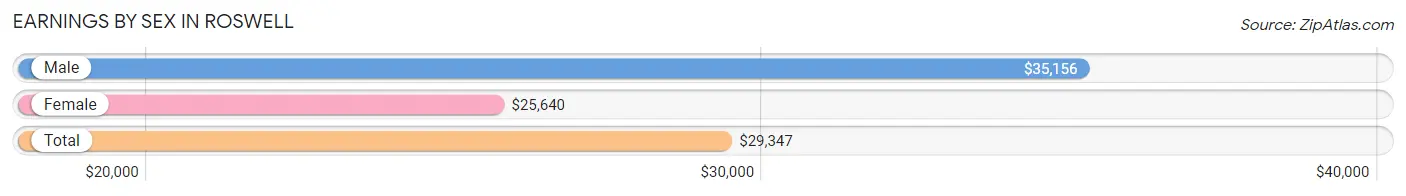
Earnings by Sex in Roswell
Average Earnings in Roswell are $29,347, $35,156 for men and $25,640 for women, a difference of 27.1%.
| Sex | Number | Average Earnings |
| Male | 11,653 (52.2%) | $35,156 |
| Female | 10,651 (47.7%) | $25,640 |
| Total | 22,304 (100.0%) | $29,347 |
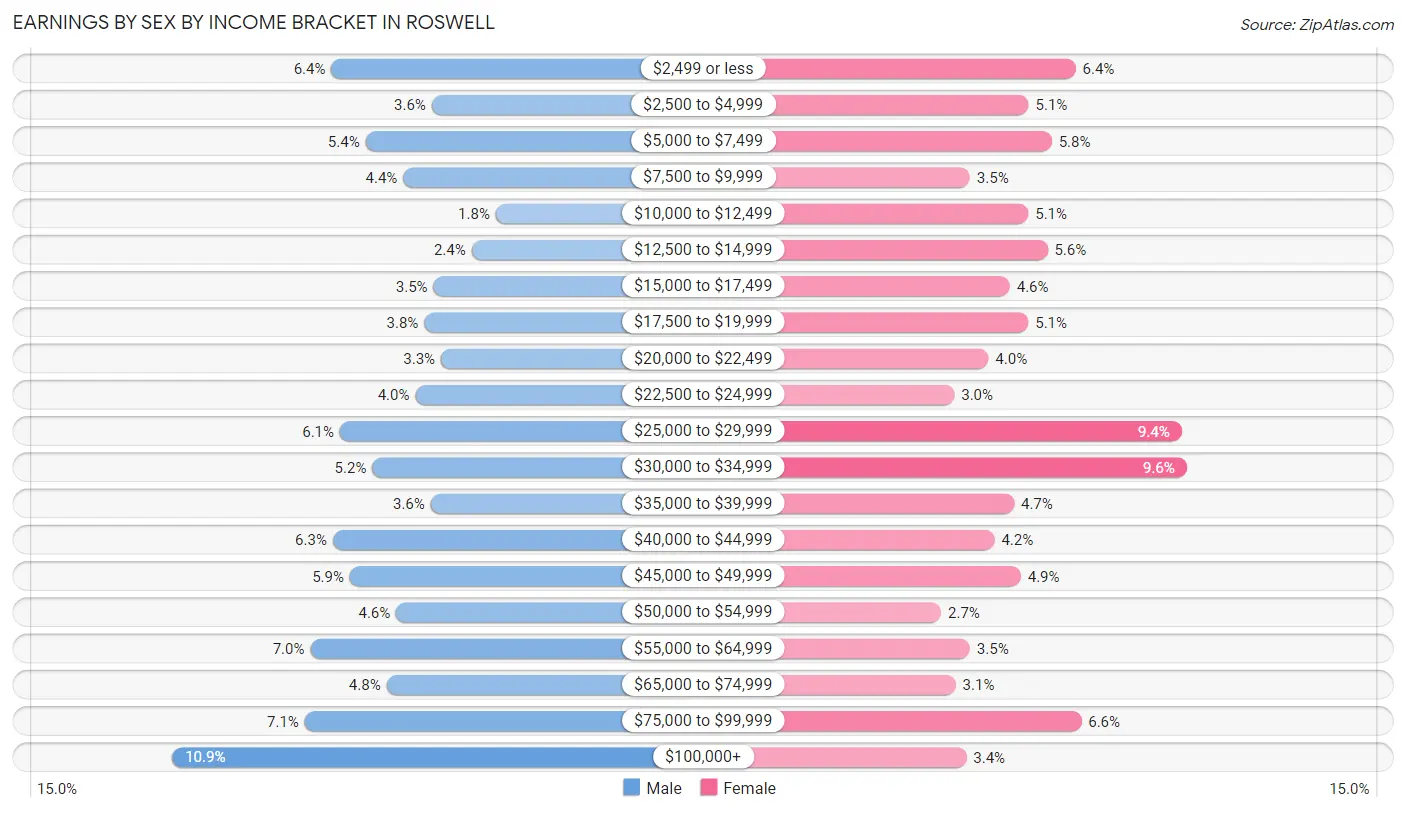
Earnings by Sex by Income Bracket in Roswell
The most common earnings brackets in Roswell are $100,000+ for men (1,264 | 10.8%) and $30,000 to $34,999 for women (1,017 | 9.6%).
| Income | Male | Female |
| $2,499 or less | 743 (6.4%) | 685 (6.4%) |
| $2,500 to $4,999 | 415 (3.6%) | 544 (5.1%) |
| $5,000 to $7,499 | 632 (5.4%) | 613 (5.8%) |
| $7,500 to $9,999 | 508 (4.4%) | 368 (3.5%) |
| $10,000 to $12,499 | 205 (1.8%) | 543 (5.1%) |
| $12,500 to $14,999 | 284 (2.4%) | 601 (5.6%) |
| $15,000 to $17,499 | 409 (3.5%) | 488 (4.6%) |
| $17,500 to $19,999 | 439 (3.8%) | 543 (5.1%) |
| $20,000 to $22,499 | 385 (3.3%) | 424 (4.0%) |
| $22,500 to $24,999 | 468 (4.0%) | 322 (3.0%) |
| $25,000 to $29,999 | 715 (6.1%) | 1,002 (9.4%) |
| $30,000 to $34,999 | 609 (5.2%) | 1,017 (9.6%) |
| $35,000 to $39,999 | 418 (3.6%) | 501 (4.7%) |
| $40,000 to $44,999 | 739 (6.3%) | 442 (4.2%) |
| $45,000 to $49,999 | 683 (5.9%) | 521 (4.9%) |
| $50,000 to $54,999 | 531 (4.6%) | 282 (2.6%) |
| $55,000 to $64,999 | 812 (7.0%) | 369 (3.5%) |
| $65,000 to $74,999 | 563 (4.8%) | 326 (3.1%) |
| $75,000 to $99,999 | 831 (7.1%) | 702 (6.6%) |
| $100,000+ | 1,264 (10.8%) | 358 (3.4%) |
| Total | 11,653 (100.0%) | 10,651 (100.0%) |
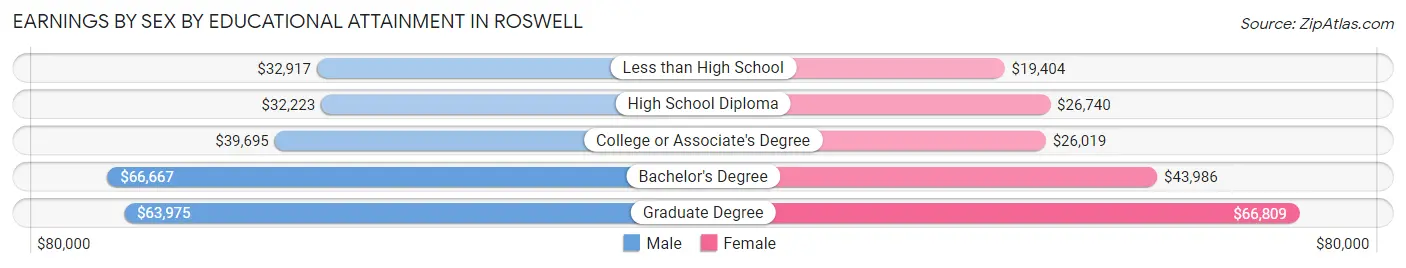
Earnings by Sex by Educational Attainment in Roswell
Average earnings in Roswell are $42,278 for men and $28,003 for women, a difference of 33.8%. Men with an educational attainment of bachelor's degree enjoy the highest average annual earnings of $66,667, while those with high school diploma education earn the least with $32,223. Women with an educational attainment of graduate degree earn the most with the average annual earnings of $66,809, while those with less than high school education have the smallest earnings of $19,404.
| Educational Attainment | Male Income | Female Income |
| Less than High School | $32,917 | $19,404 |
| High School Diploma | $32,223 | $26,740 |
| College or Associate's Degree | $39,695 | $26,019 |
| Bachelor's Degree | $66,667 | $43,986 |
| Graduate Degree | $63,975 | $66,809 |
| Total | $42,278 | $28,003 |
Family Income in Roswell
Family Income Brackets in Roswell
According to the Roswell family income data, there are 1,952 families falling into the $35,000 to $49,999 income range, which is the most common income bracket and makes up 17.4% of all families. Conversely, the $10,000 to $14,999 income bracket is the least frequent group with only 393 families (3.5%) belonging to this category.
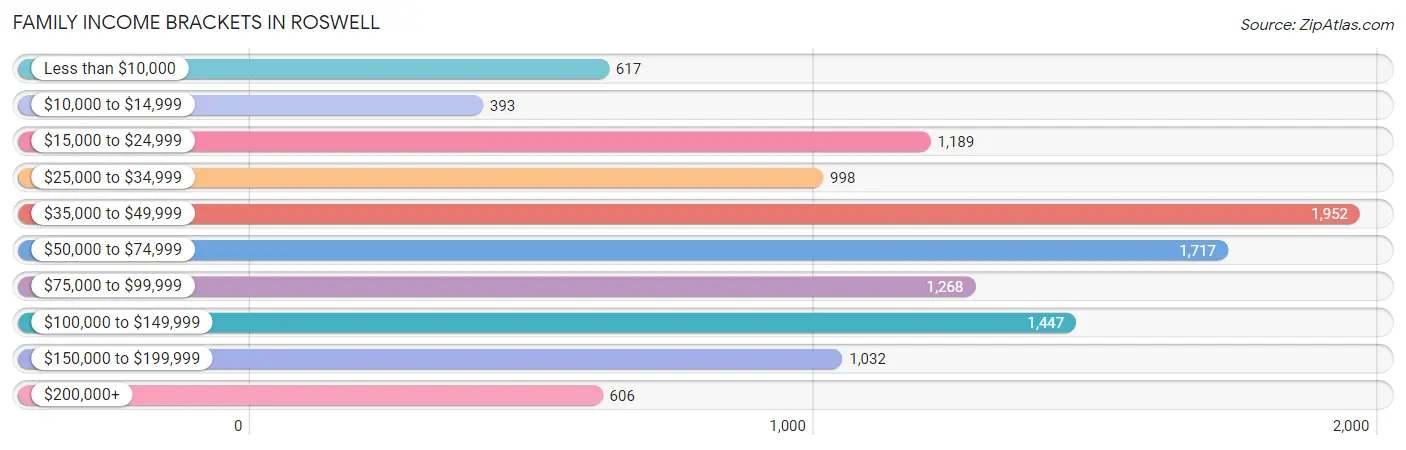
| Income Bracket | # Families | % Families |
| Less than $10,000 | 617 | 5.5% |
| $10,000 to $14,999 | 393 | 3.5% |
| $15,000 to $24,999 | 1,189 | 10.6% |
| $25,000 to $34,999 | 998 | 8.9% |
| $35,000 to $49,999 | 1,952 | 17.4% |
| $50,000 to $74,999 | 1,717 | 15.3% |
| $75,000 to $99,999 | 1,268 | 11.3% |
| $100,000 to $149,999 | 1,447 | 12.9% |
| $150,000 to $199,999 | 1,032 | 9.2% |
| $200,000+ | 606 | 5.4% |
Family Income by Famaliy Size in Roswell
6-person families (322 | 2.9%) account for the highest median family income in Roswell with $123,710 per family, while 2-person families (4,632 | 41.3%) have the highest median income of $26,984 per family member.
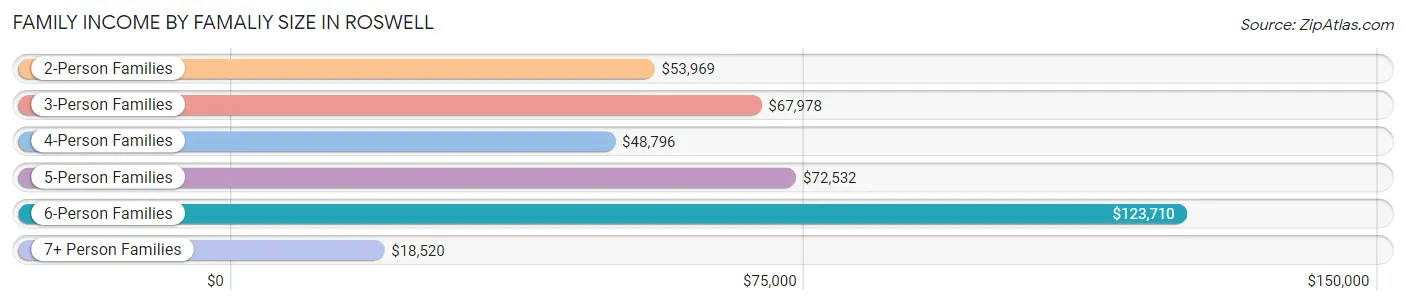
| Income Bracket | # Families | Median Income |
| 2-Person Families | 4,632 (41.3%) | $53,969 |
| 3-Person Families | 2,474 (22.1%) | $67,978 |
| 4-Person Families | 2,333 (20.8%) | $48,796 |
| 5-Person Families | 1,278 (11.4%) | $72,532 |
| 6-Person Families | 322 (2.9%) | $123,710 |
| 7+ Person Families | 180 (1.6%) | $18,520 |
| Total | 11,219 (100.0%) | $57,490 |
Family Income by Number of Earners in Roswell
The median family income in Roswell is $57,490, with families comprising 3+ earners (1,113) having the highest median family income of $109,135, while families with no earners (1,715) have the lowest median family income of $32,986, accounting for 9.9% and 15.3% of families, respectively.
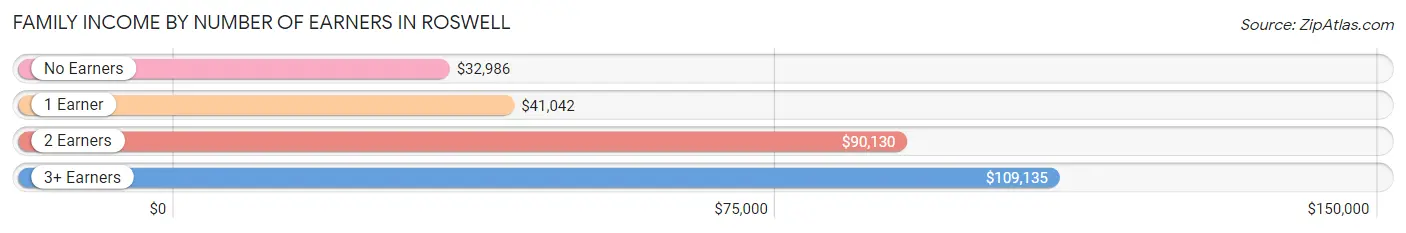
| Number of Earners | # Families | Median Income |
| No Earners | 1,715 (15.3%) | $32,986 |
| 1 Earner | 4,660 (41.5%) | $41,042 |
| 2 Earners | 3,731 (33.3%) | $90,130 |
| 3+ Earners | 1,113 (9.9%) | $109,135 |
| Total | 11,219 (100.0%) | $57,490 |
Household Income in Roswell
Household Income Brackets in Roswell
With 2,825 households falling in the category, the $50,000 to $74,999 income range is the most frequent in Roswell, accounting for 16.2% of all households. In contrast, only 715 households (4.1%) fall into the $200,000+ income bracket, making it the least populous group.
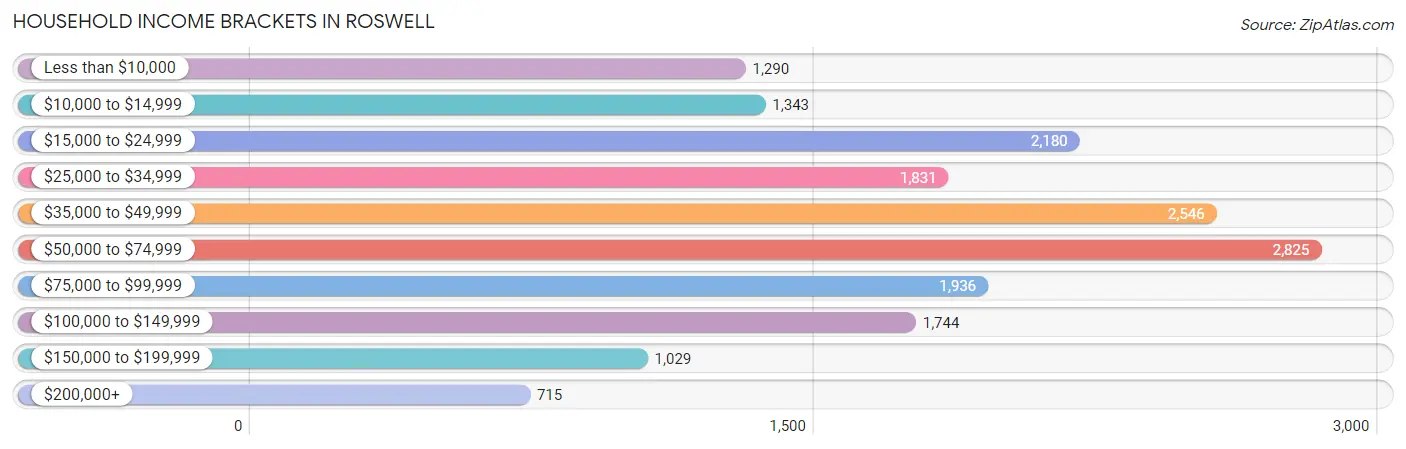
| Income Bracket | # Households | % Households |
| Less than $10,000 | 1,290 | 7.4% |
| $10,000 to $14,999 | 1,343 | 7.7% |
| $15,000 to $24,999 | 2,180 | 12.5% |
| $25,000 to $34,999 | 1,831 | 10.5% |
| $35,000 to $49,999 | 2,546 | 14.6% |
| $50,000 to $74,999 | 2,825 | 16.2% |
| $75,000 to $99,999 | 1,936 | 11.1% |
| $100,000 to $149,999 | 1,744 | 10.0% |
| $150,000 to $199,999 | 1,029 | 5.9% |
| $200,000+ | 715 | 4.1% |
Household Income by Householder Age in Roswell
The median household income in Roswell is $48,298, with the highest median household income of $51,343 found in the 25 to 44 years age bracket for the primary householder. A total of 5,348 households (30.7%) fall into this category. Meanwhile, the 15 to 24 years age bracket for the primary householder has the lowest median household income of $38,341, with 685 households (3.9%) in this group.
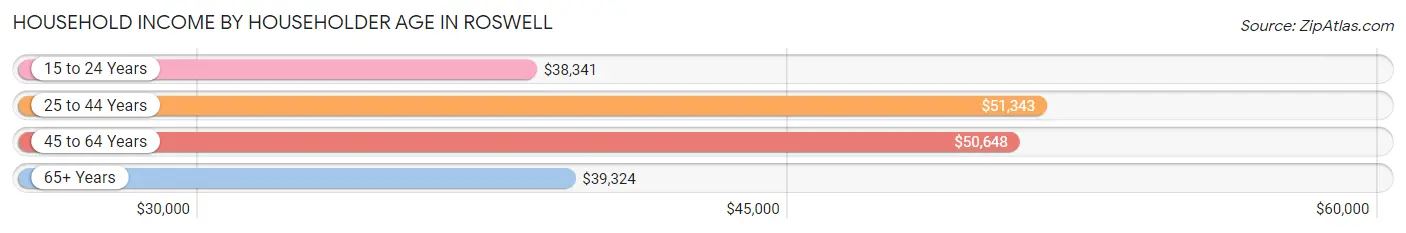
| Income Bracket | # Households | Median Income |
| 15 to 24 Years | 685 (3.9%) | $38,341 |
| 25 to 44 Years | 5,348 (30.7%) | $51,343 |
| 45 to 64 Years | 6,356 (36.4%) | $50,648 |
| 65+ Years | 5,049 (28.9%) | $39,324 |
| Total | 17,438 (100.0%) | $48,298 |
Poverty in Roswell
Income Below Poverty by Sex and Age in Roswell
With 19.8% poverty level for males and 26.5% for females among the residents of Roswell, 5 year old males and 16 and 17 year old females are the most vulnerable to poverty, with 149 males (43.2%) and 314 females (49.8%) in their respective age groups living below the poverty level.
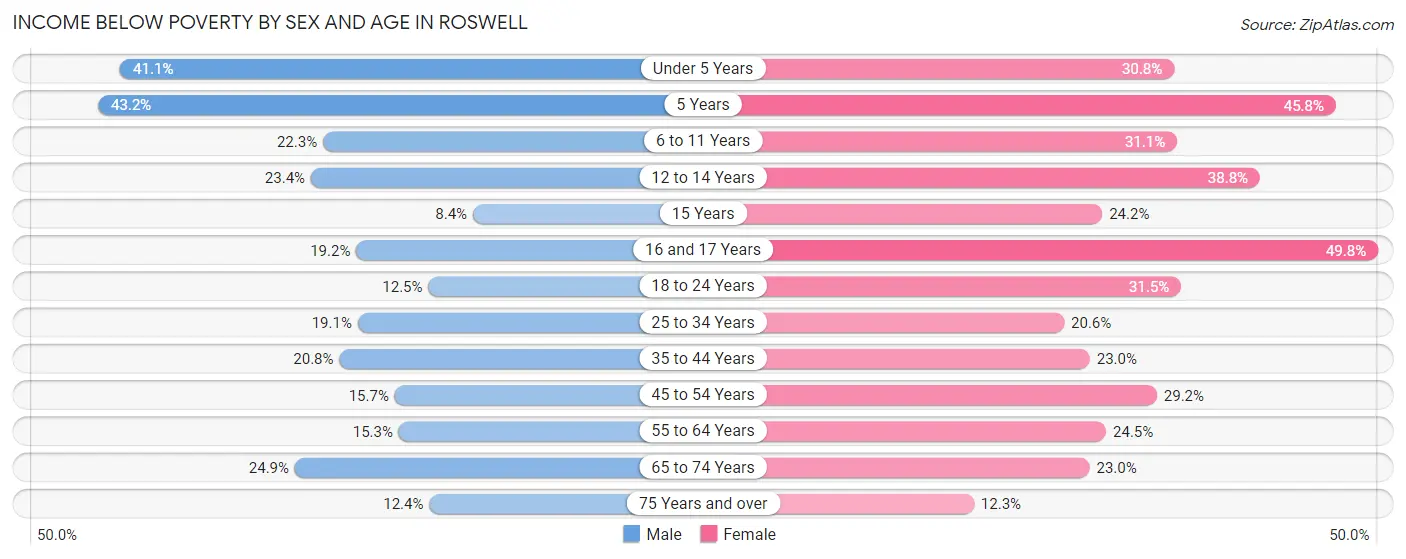
| Age Bracket | Male | Female |
| Under 5 Years | 533 (41.1%) | 503 (30.8%) |
| 5 Years | 149 (43.2%) | 171 (45.8%) |
| 6 to 11 Years | 488 (22.3%) | 659 (31.1%) |
| 12 to 14 Years | 261 (23.4%) | 265 (38.8%) |
| 15 Years | 37 (8.4%) | 102 (24.2%) |
| 16 and 17 Years | 89 (19.2%) | 314 (49.8%) |
| 18 to 24 Years | 288 (12.5%) | 638 (31.5%) |
| 25 to 34 Years | 582 (19.1%) | 639 (20.6%) |
| 35 to 44 Years | 555 (20.8%) | 699 (23.0%) |
| 45 to 54 Years | 411 (15.7%) | 838 (29.2%) |
| 55 to 64 Years | 402 (15.3%) | 723 (24.5%) |
| 65 to 74 Years | 482 (24.9%) | 500 (23.0%) |
| 75 Years and over | 168 (12.4%) | 198 (12.3%) |
| Total | 4,445 (19.8%) | 6,249 (26.5%) |
Income Above Poverty by Sex and Age in Roswell
According to the poverty statistics in Roswell, males aged 15 years and females aged 75 years and over are the age groups that are most secure financially, with 91.6% of males and 87.7% of females in these age groups living above the poverty line.
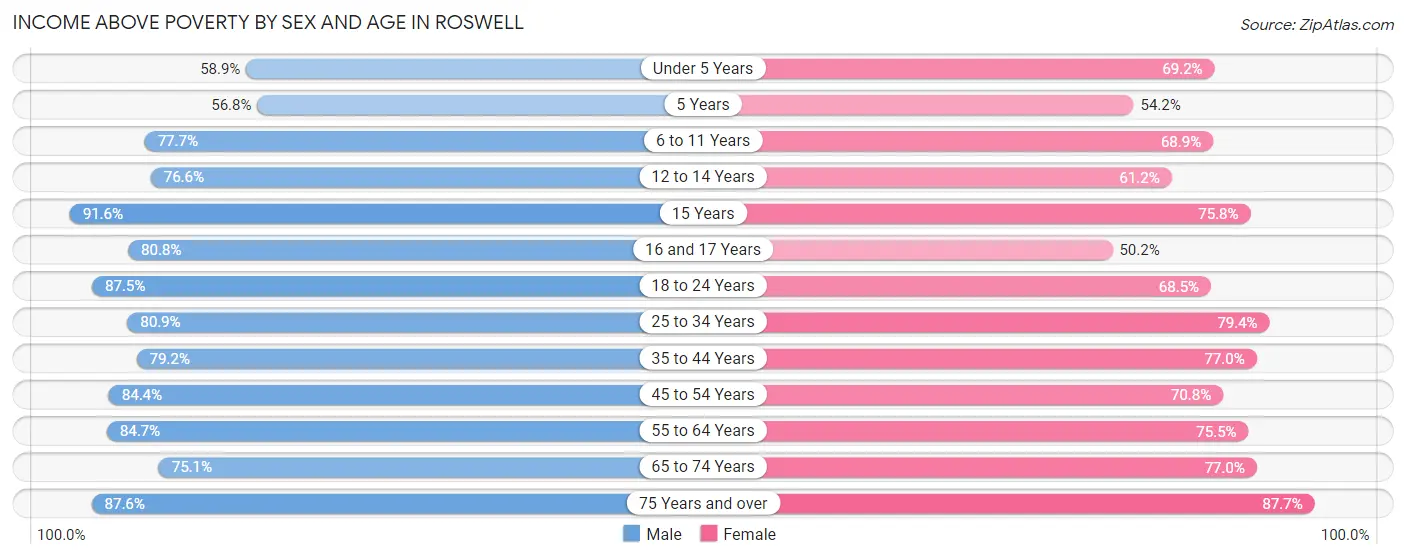
| Age Bracket | Male | Female |
| Under 5 Years | 763 (58.9%) | 1,128 (69.2%) |
| 5 Years | 196 (56.8%) | 202 (54.2%) |
| 6 to 11 Years | 1,699 (77.7%) | 1,459 (68.9%) |
| 12 to 14 Years | 853 (76.6%) | 418 (61.2%) |
| 15 Years | 404 (91.6%) | 320 (75.8%) |
| 16 and 17 Years | 374 (80.8%) | 317 (50.2%) |
| 18 to 24 Years | 2,010 (87.5%) | 1,388 (68.5%) |
| 25 to 34 Years | 2,469 (80.9%) | 2,458 (79.4%) |
| 35 to 44 Years | 2,114 (79.2%) | 2,338 (77.0%) |
| 45 to 54 Years | 2,216 (84.4%) | 2,028 (70.8%) |
| 55 to 64 Years | 2,231 (84.7%) | 2,225 (75.5%) |
| 65 to 74 Years | 1,452 (75.1%) | 1,675 (77.0%) |
| 75 Years and over | 1,183 (87.6%) | 1,417 (87.7%) |
| Total | 17,964 (80.2%) | 17,373 (73.6%) |
Income Below Poverty Among Married-Couple Families in Roswell
The poverty statistics for married-couple families in Roswell show that 10.7% or 748 of the total 6,994 families live below the poverty line. Families with 5 or more children have the highest poverty rate of 74.3%, comprising of 52 families. On the other hand, families with no children have the lowest poverty rate of 5.9%, which includes 228 families.
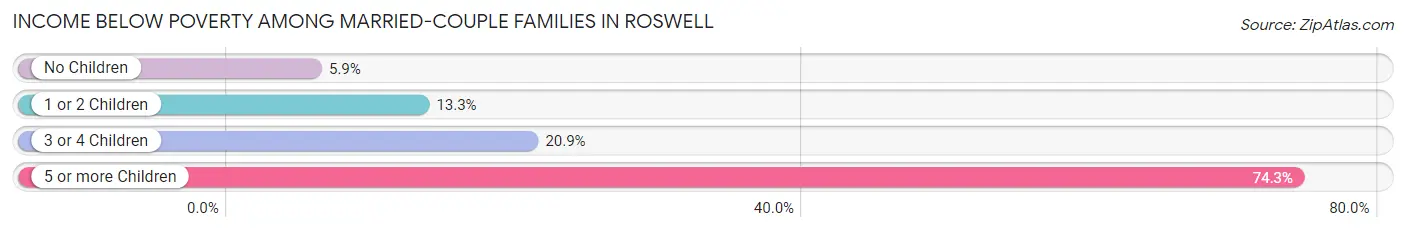
| Children | Above Poverty | Below Poverty |
| No Children | 3,670 (94.2%) | 228 (5.9%) |
| 1 or 2 Children | 1,885 (86.7%) | 290 (13.3%) |
| 3 or 4 Children | 673 (79.1%) | 178 (20.9%) |
| 5 or more Children | 18 (25.7%) | 52 (74.3%) |
| Total | 6,246 (89.3%) | 748 (10.7%) |
Income Below Poverty Among Single-Parent Households in Roswell
According to the poverty data in Roswell, 19.5% or 197 single-father households and 35.5% or 1,140 single-mother households are living below the poverty line. Among single-father households, those with 3 or 4 children have the highest poverty rate, with 37 households (40.2%) experiencing poverty. Likewise, among single-mother households, those with 5 or more children have the highest poverty rate, with 104 households (100.0%) falling below the poverty line.
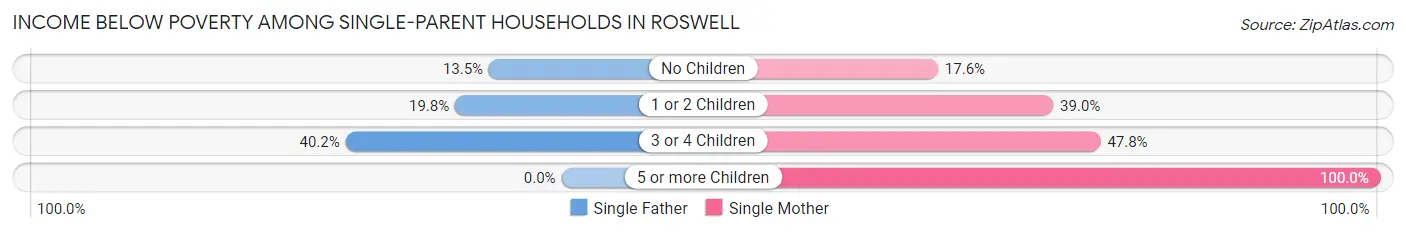
| Children | Single Father | Single Mother |
| No Children | 47 (13.5%) | 192 (17.5%) |
| 1 or 2 Children | 113 (19.8%) | 535 (39.0%) |
| 3 or 4 Children | 37 (40.2%) | 309 (47.8%) |
| 5 or more Children | 0 (0.0%) | 104 (100.0%) |
| Total | 197 (19.5%) | 1,140 (35.5%) |
Income Below Poverty Among Married-Couple vs Single-Parent Households in Roswell
The poverty data for Roswell shows that 748 of the married-couple family households (10.7%) and 1,337 of the single-parent households (31.6%) are living below the poverty level. Within the married-couple family households, those with 5 or more children have the highest poverty rate, with 52 households (74.3%) falling below the poverty line. Among the single-parent households, those with 5 or more children have the highest poverty rate, with 104 household (100.0%) living below poverty.
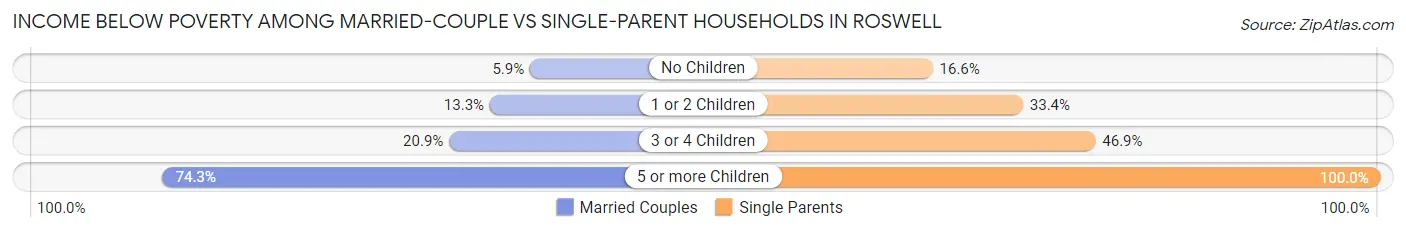
| Children | Married-Couple Families | Single-Parent Households |
| No Children | 228 (5.9%) | 239 (16.6%) |
| 1 or 2 Children | 290 (13.3%) | 648 (33.4%) |
| 3 or 4 Children | 178 (20.9%) | 346 (46.9%) |
| 5 or more Children | 52 (74.3%) | 104 (100.0%) |
| Total | 748 (10.7%) | 1,337 (31.6%) |
Race in Roswell
The most populous races in Roswell are White / Caucasian (32,701 | 68.1%), Hispanic or Latino (29,383 | 61.2%), and Some other Race (6,742 | 14.0%).
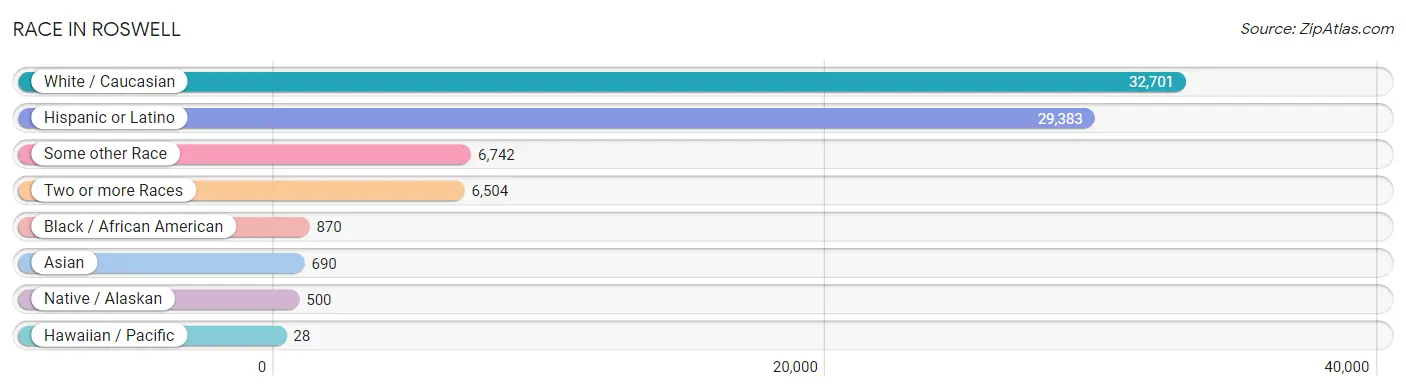
| Race | # Population | % Population |
| Asian | 690 | 1.4% |
| Black / African American | 870 | 1.8% |
| Hawaiian / Pacific | 28 | 0.1% |
| Hispanic or Latino | 29,383 | 61.2% |
| Native / Alaskan | 500 | 1.0% |
| White / Caucasian | 32,701 | 68.1% |
| Two or more Races | 6,504 | 13.5% |
| Some other Race | 6,742 | 14.0% |
| Total | 48,035 | 100.0% |
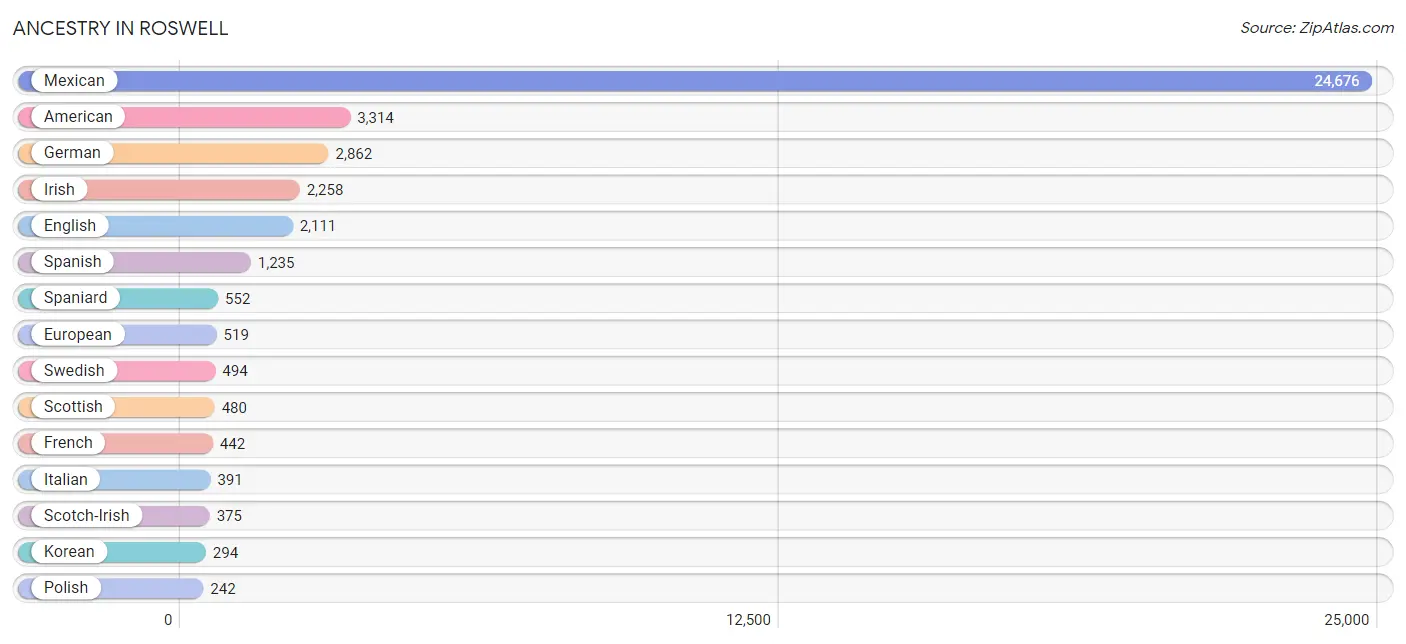
Ancestry in Roswell
The most populous ancestries reported in Roswell are Mexican (24,676 | 51.4%), American (3,314 | 6.9%), German (2,862 | 6.0%), Irish (2,258 | 4.7%), and English (2,111 | 4.4%), together accounting for 73.3% of all Roswell residents.
| Ancestry | # Population | % Population |
| African | 111 | 0.2% |
| American | 3,314 | 6.9% |
| Apache | 40 | 0.1% |
| Arab | 19 | 0.0% |
| Austrian | 42 | 0.1% |
| Bhutanese | 57 | 0.1% |
| Blackfeet | 102 | 0.2% |
| British | 78 | 0.2% |
| Burmese | 43 | 0.1% |
| Central American | 81 | 0.2% |
| Central American Indian | 37 | 0.1% |
| Cherokee | 214 | 0.4% |
| Choctaw | 46 | 0.1% |
| Colombian | 20 | 0.0% |
| Czech | 98 | 0.2% |
| Czechoslovakian | 17 | 0.0% |
| Danish | 169 | 0.4% |
| Dutch | 154 | 0.3% |
| Ecuadorian | 6 | 0.0% |
| Egyptian | 7 | 0.0% |
| English | 2,111 | 4.4% |
| European | 519 | 1.1% |
| French | 442 | 0.9% |
| French Canadian | 94 | 0.2% |
| German | 2,862 | 6.0% |
| German Russian | 29 | 0.1% |
| Greek | 31 | 0.1% |
| Guamanian / Chamorro | 22 | 0.1% |
| Guatemalan | 8 | 0.0% |
| Honduran | 34 | 0.1% |
| Hopi | 5 | 0.0% |
| Hungarian | 46 | 0.1% |
| Indian (Asian) | 49 | 0.1% |
| Iranian | 46 | 0.1% |
| Irish | 2,258 | 4.7% |
| Italian | 391 | 0.8% |
| Korean | 294 | 0.6% |
| Laotian | 8 | 0.0% |
| Latvian | 27 | 0.1% |
| Lebanese | 12 | 0.0% |
| Mexican | 24,676 | 51.4% |
| Mexican American Indian | 91 | 0.2% |
| Navajo | 174 | 0.4% |
| Nigerian | 8 | 0.0% |
| Northern European | 94 | 0.2% |
| Norwegian | 199 | 0.4% |
| Panamanian | 30 | 0.1% |
| Polish | 242 | 0.5% |
| Portuguese | 57 | 0.1% |
| Pueblo | 175 | 0.4% |
| Puerto Rican | 185 | 0.4% |
| Russian | 72 | 0.2% |
| Salvadoran | 9 | 0.0% |
| Samoan | 6 | 0.0% |
| Scandinavian | 33 | 0.1% |
| Scotch-Irish | 375 | 0.8% |
| Scottish | 480 | 1.0% |
| Sioux | 8 | 0.0% |
| Slavic | 23 | 0.1% |
| Slovak | 44 | 0.1% |
| South American | 90 | 0.2% |
| Soviet Union | 6 | 0.0% |
| Spaniard | 552 | 1.1% |
| Spanish | 1,235 | 2.6% |
| Spanish American | 156 | 0.3% |
| Spanish American Indian | 58 | 0.1% |
| Sri Lankan | 132 | 0.3% |
| Subsaharan African | 127 | 0.3% |
| Swedish | 494 | 1.0% |
| Swiss | 26 | 0.1% |
| Thai | 86 | 0.2% |
| Tongan | 37 | 0.1% |
| Ute | 12 | 0.0% |
| Venezuelan | 64 | 0.1% |
| Welsh | 175 | 0.4% |
| Yaqui | 38 | 0.1% | View All 76 Rows |
Immigrants in Roswell
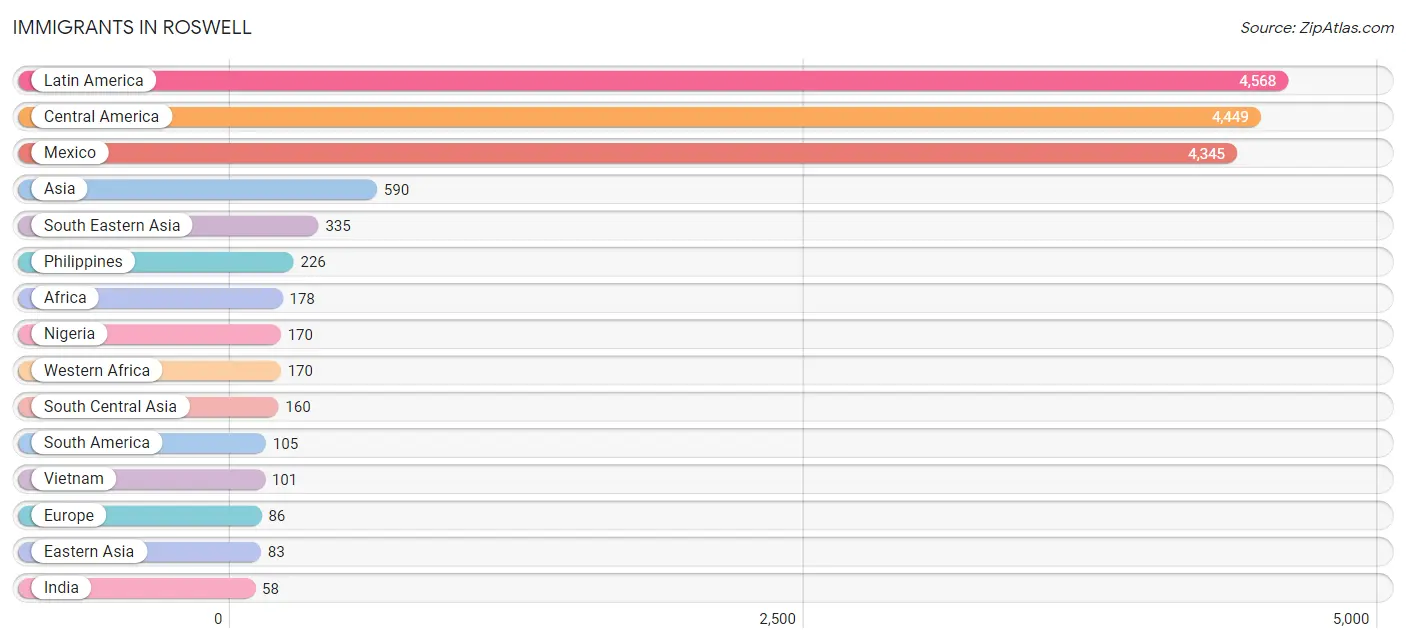
The most numerous immigrant groups reported in Roswell came from Latin America (4,568 | 9.5%), Central America (4,449 | 9.3%), Mexico (4,345 | 9.0%), Asia (590 | 1.2%), and South Eastern Asia (335 | 0.7%), together accounting for 29.7% of all Roswell residents.
| Immigration Origin | # Population | % Population |
| Africa | 178 | 0.4% |
| Asia | 590 | 1.2% |
| Canada | 7 | 0.0% |
| Caribbean | 14 | 0.0% |
| Central America | 4,449 | 9.3% |
| China | 26 | 0.1% |
| Colombia | 47 | 0.1% |
| Eastern Africa | 8 | 0.0% |
| Eastern Asia | 83 | 0.2% |
| Eastern Europe | 44 | 0.1% |
| El Salvador | 9 | 0.0% |
| Europe | 86 | 0.2% |
| France | 11 | 0.0% |
| Germany | 8 | 0.0% |
| Guatemala | 49 | 0.1% |
| Haiti | 14 | 0.0% |
| Honduras | 34 | 0.1% |
| India | 58 | 0.1% |
| Indonesia | 8 | 0.0% |
| Iran | 46 | 0.1% |
| Japan | 27 | 0.1% |
| Korea | 30 | 0.1% |
| Latin America | 4,568 | 9.5% |
| Lebanon | 12 | 0.0% |
| Mexico | 4,345 | 9.0% |
| Nigeria | 170 | 0.4% |
| Pakistan | 39 | 0.1% |
| Panama | 12 | 0.0% |
| Philippines | 226 | 0.5% |
| Poland | 44 | 0.1% |
| South America | 105 | 0.2% |
| South Central Asia | 160 | 0.3% |
| South Eastern Asia | 335 | 0.7% |
| Southern Europe | 23 | 0.1% |
| Spain | 23 | 0.1% |
| Sri Lanka | 17 | 0.0% |
| Venezuela | 58 | 0.1% |
| Vietnam | 101 | 0.2% |
| Western Africa | 170 | 0.4% |
| Western Asia | 12 | 0.0% |
| Western Europe | 19 | 0.0% | View All 41 Rows |
Sex and Age in Roswell
Sex and Age in Roswell
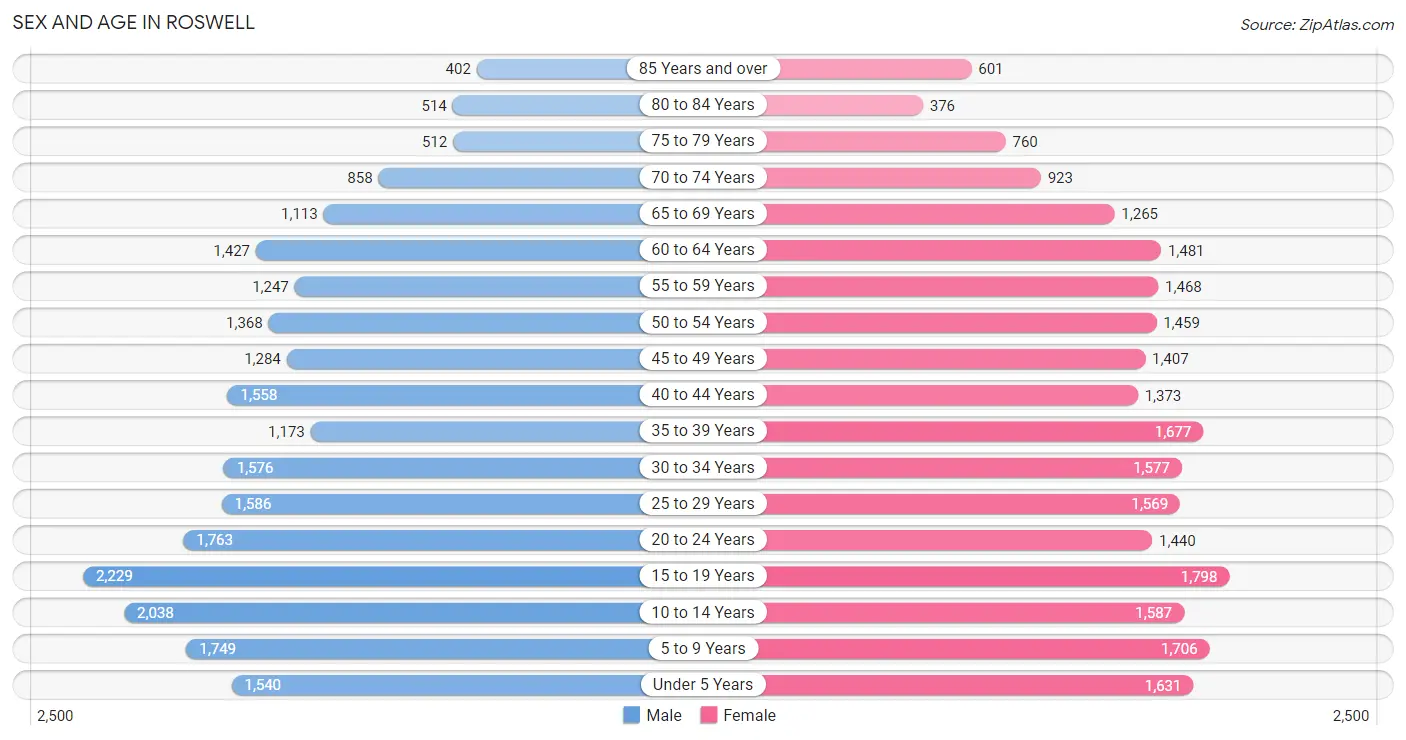
The most populous age groups in Roswell are 15 to 19 Years (2,229 | 9.3%) for men and 15 to 19 Years (1,798 | 7.5%) for women.
| Age Bracket | Male | Female |
| Under 5 Years | 1,540 (6.4%) | 1,631 (6.8%) |
| 5 to 9 Years | 1,749 (7.3%) | 1,706 (7.1%) |
| 10 to 14 Years | 2,038 (8.5%) | 1,587 (6.6%) |
| 15 to 19 Years | 2,229 (9.3%) | 1,798 (7.5%) |
| 20 to 24 Years | 1,763 (7.4%) | 1,440 (6.0%) |
| 25 to 29 Years | 1,586 (6.6%) | 1,569 (6.5%) |
| 30 to 34 Years | 1,576 (6.6%) | 1,577 (6.5%) |
| 35 to 39 Years | 1,173 (4.9%) | 1,677 (7.0%) |
| 40 to 44 Years | 1,558 (6.5%) | 1,373 (5.7%) |
| 45 to 49 Years | 1,284 (5.4%) | 1,407 (5.8%) |
| 50 to 54 Years | 1,368 (5.7%) | 1,459 (6.0%) |
| 55 to 59 Years | 1,247 (5.2%) | 1,468 (6.1%) |
| 60 to 64 Years | 1,427 (6.0%) | 1,481 (6.1%) |
| 65 to 69 Years | 1,113 (4.6%) | 1,265 (5.2%) |
| 70 to 74 Years | 858 (3.6%) | 923 (3.8%) |
| 75 to 79 Years | 512 (2.1%) | 760 (3.2%) |
| 80 to 84 Years | 514 (2.1%) | 376 (1.6%) |
| 85 Years and over | 402 (1.7%) | 601 (2.5%) |
| Total | 23,937 (100.0%) | 24,098 (100.0%) |
Families and Households in Roswell
Median Family Size in Roswell
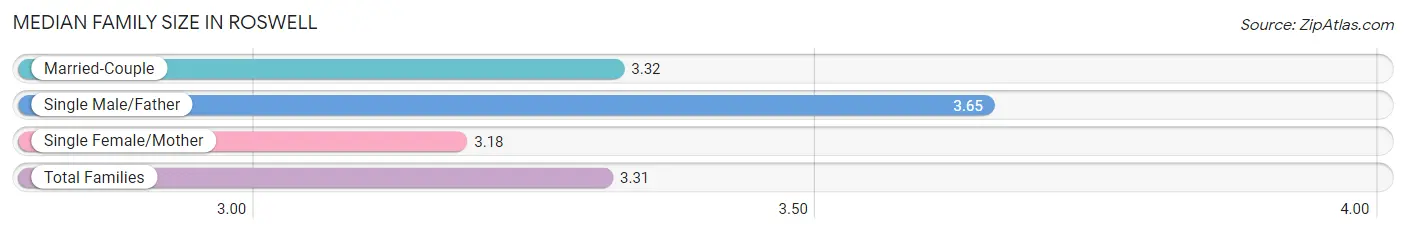
The median family size in Roswell is 3.31 persons per family, with single male/father families (1,010 | 9.0%) accounting for the largest median family size of 3.65 persons per family. On the other hand, single female/mother families (3,215 | 28.7%) represent the smallest median family size with 3.18 persons per family.
| Family Type | # Families | Family Size |
| Married-Couple | 6,994 (62.3%) | 3.32 |
| Single Male/Father | 1,010 (9.0%) | 3.65 |
| Single Female/Mother | 3,215 (28.7%) | 3.18 |
| Total Families | 11,219 (100.0%) | 3.31 |
Median Household Size in Roswell
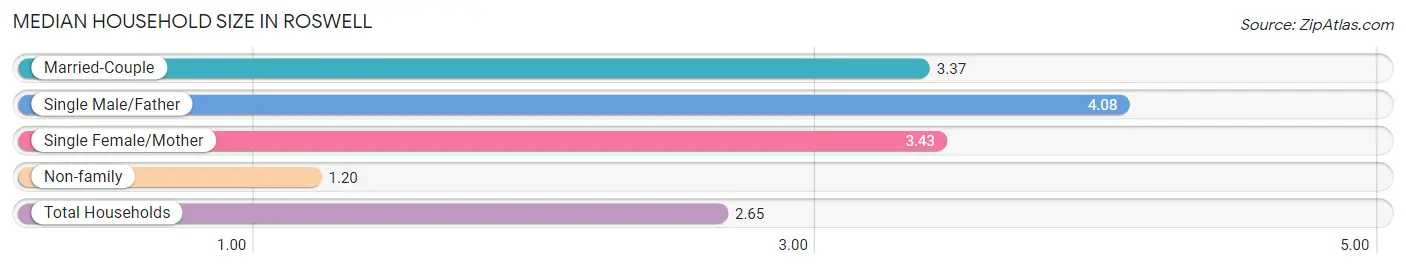
The median household size in Roswell is 2.65 persons per household, with single male/father households (1,010 | 5.8%) accounting for the largest median household size of 4.08 persons per household. non-family households (6,219 | 35.7%) represent the smallest median household size with 1.20 persons per household.
| Household Type | # Households | Household Size |
| Married-Couple | 6,994 (40.1%) | 3.37 |
| Single Male/Father | 1,010 (5.8%) | 4.08 |
| Single Female/Mother | 3,215 (18.4%) | 3.43 |
| Non-family | 6,219 (35.7%) | 1.20 |
| Total Households | 17,438 (100.0%) | 2.65 |
Household Size by Marriage Status in Roswell
Out of a total of 17,438 households in Roswell, 11,219 (64.3%) are family households, while 6,219 (35.7%) are nonfamily households. The most numerous type of family households are 2-person households, comprising 4,201, and the most common type of nonfamily households are 1-person households, comprising 5,414.
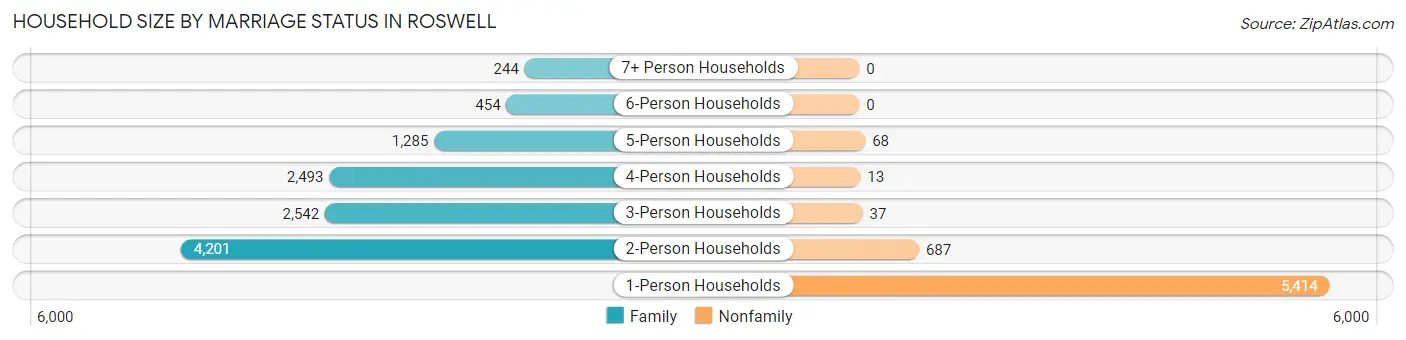
| Household Size | Family Households | Nonfamily Households |
| 1-Person Households | - | 5,414 (31.0%) |
| 2-Person Households | 4,201 (24.1%) | 687 (3.9%) |
| 3-Person Households | 2,542 (14.6%) | 37 (0.2%) |
| 4-Person Households | 2,493 (14.3%) | 13 (0.1%) |
| 5-Person Households | 1,285 (7.4%) | 68 (0.4%) |
| 6-Person Households | 454 (2.6%) | 0 (0.0%) |
| 7+ Person Households | 244 (1.4%) | 0 (0.0%) |
| Total | 11,219 (64.3%) | 6,219 (35.7%) |
Female Fertility in Roswell
Fertility by Age in Roswell
Average fertility rate in Roswell is 84.0 births per 1,000 women. Women in the age bracket of 20 to 34 years have the highest fertility rate with 181.0 births per 1,000 women. Women in the age bracket of 20 to 34 years acount for 89.1% of all women with births.
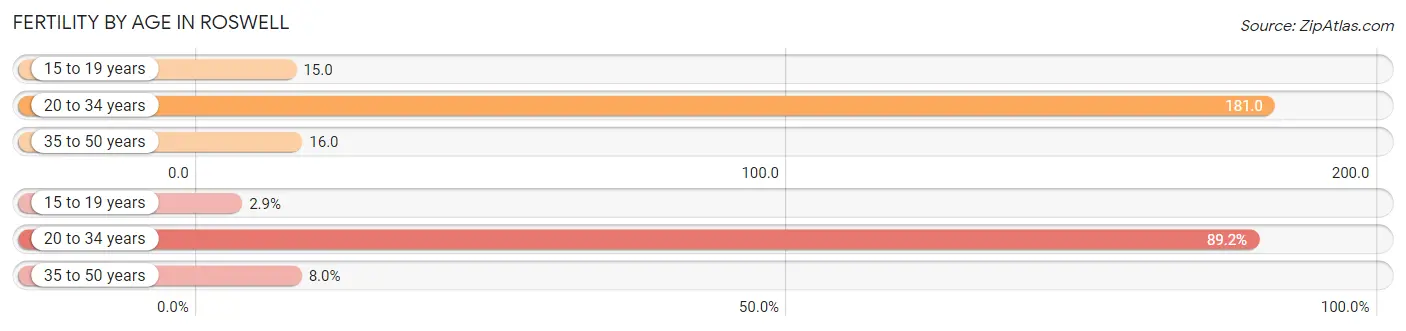
| Age Bracket | Women with Births | Births / 1,000 Women |
| 15 to 19 years | 27 (2.9%) | 15.0 |
| 20 to 34 years | 830 (89.1%) | 181.0 |
| 35 to 50 years | 74 (8.0%) | 16.0 |
| Total | 931 (100.0%) | 84.0 |
Fertility by Age by Marriage Status in Roswell
71.1% of women with births (931) in Roswell are married. The highest percentage of unmarried women with births falls into 15 to 19 years age bracket with 70.4% of them unmarried at the time of birth, while the lowest percentage of unmarried women with births belong to 35 to 50 years age bracket with 16.2% of them unmarried.
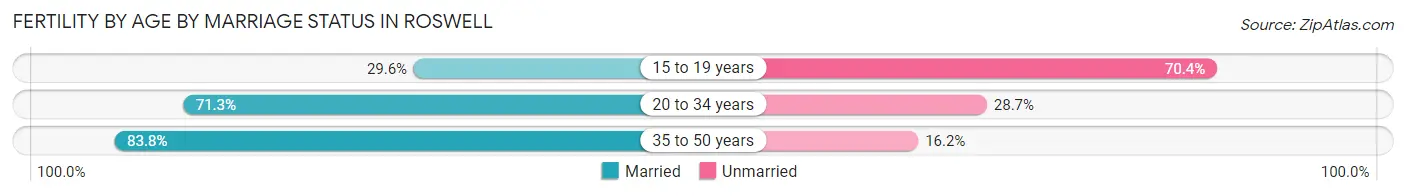
| Age Bracket | Married | Unmarried |
| 15 to 19 years | 8 (29.6%) | 19 (70.4%) |
| 20 to 34 years | 592 (71.3%) | 238 (28.7%) |
| 35 to 50 years | 62 (83.8%) | 12 (16.2%) |
| Total | 662 (71.1%) | 269 (28.9%) |
Fertility by Education in Roswell
Average fertility rate in Roswell is 84.0 births per 1,000 women. Women with the education attainment of graduate degree have the highest fertility rate of 213.0 births per 1,000 women, while women with the education attainment of college or associate's degree have the lowest fertility at 69.0 births per 1,000 women. Women with the education attainment of college or associate's degree represent 29.3% of all women with births.
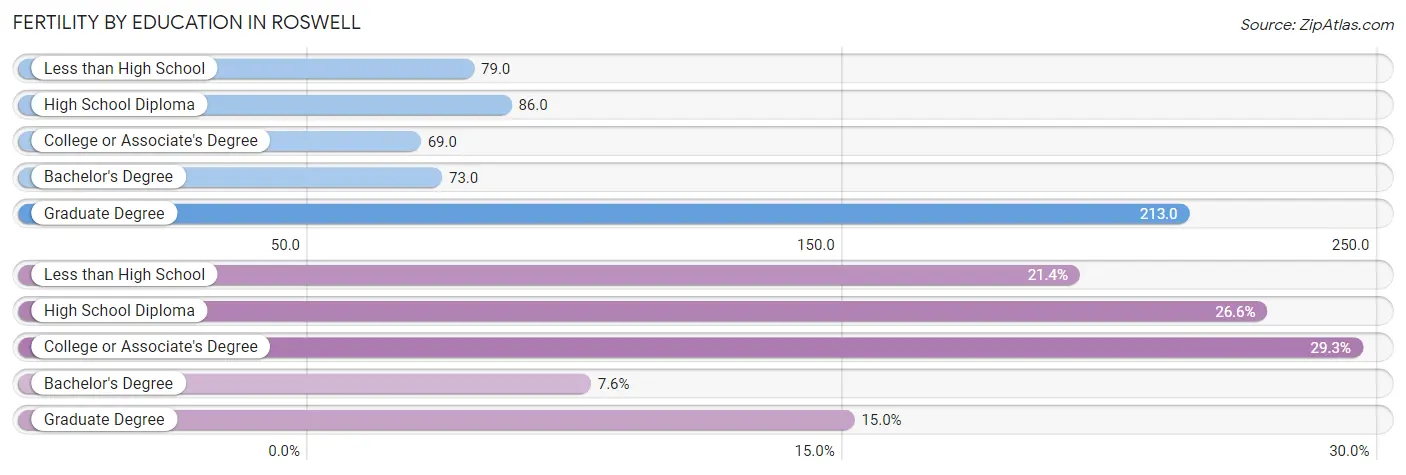
| Educational Attainment | Women with Births | Births / 1,000 Women |
| Less than High School | 199 (21.4%) | 79.0 |
| High School Diploma | 248 (26.6%) | 86.0 |
| College or Associate's Degree | 273 (29.3%) | 69.0 |
| Bachelor's Degree | 71 (7.6%) | 73.0 |
| Graduate Degree | 140 (15.0%) | 213.0 |
| Total | 931 (100.0%) | 84.0 |
Fertility by Education by Marriage Status in Roswell
28.9% of women with births in Roswell are unmarried. Women with the educational attainment of graduate degree are most likely to be married with 91.4% of them married at childbirth, while women with the educational attainment of less than high school are least likely to be married with 65.8% of them unmarried at childbirth.
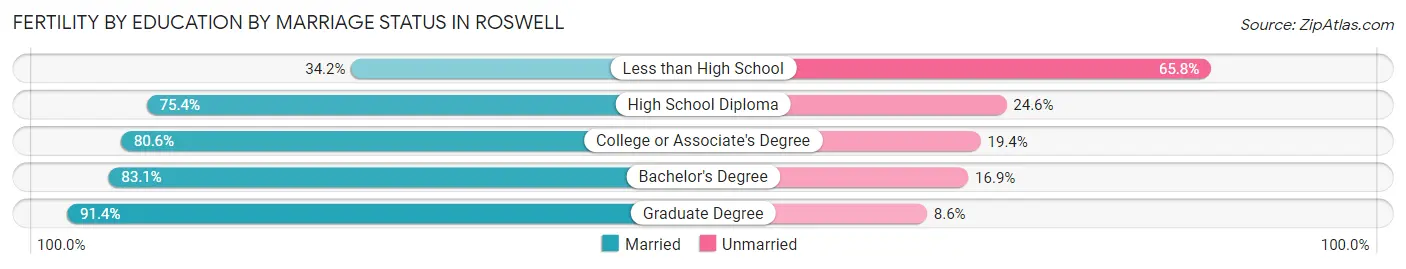
| Educational Attainment | Married | Unmarried |
| Less than High School | 68 (34.2%) | 131 (65.8%) |
| High School Diploma | 187 (75.4%) | 61 (24.6%) |
| College or Associate's Degree | 220 (80.6%) | 53 (19.4%) |
| Bachelor's Degree | 59 (83.1%) | 12 (16.9%) |
| Graduate Degree | 128 (91.4%) | 12 (8.6%) |
| Total | 662 (71.1%) | 269 (28.9%) |
Employment Characteristics in Roswell
Employment by Class of Employer in Roswell
Among the 19,066 employed individuals in Roswell, private company employees (12,408 | 65.1%), local government employees (1,734 | 9.1%), and not-for-profit organizations (1,420 | 7.4%) make up the most common classes of employment.
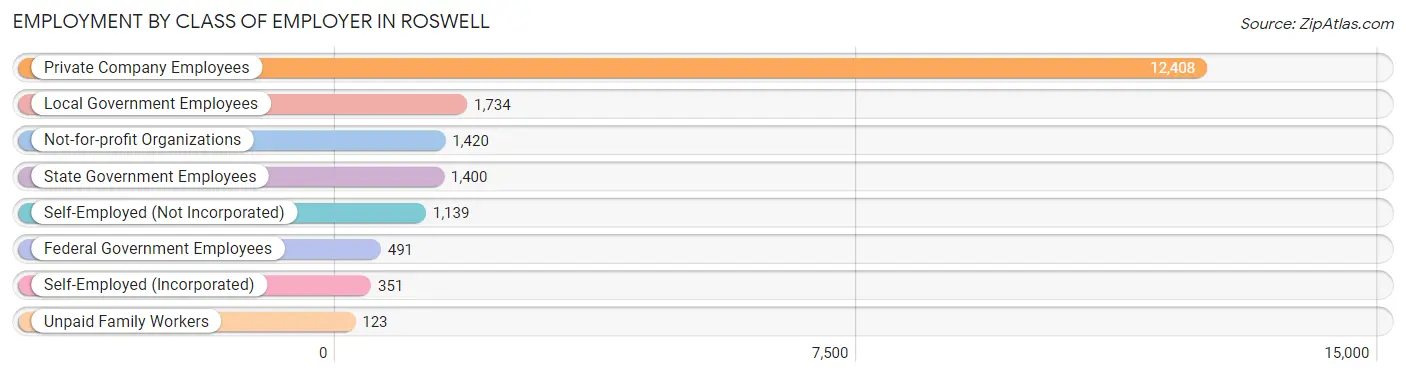
| Employer Class | # Employees | % Employees |
| Private Company Employees | 12,408 | 65.1% |
| Self-Employed (Incorporated) | 351 | 1.8% |
| Self-Employed (Not Incorporated) | 1,139 | 6.0% |
| Not-for-profit Organizations | 1,420 | 7.4% |
| Local Government Employees | 1,734 | 9.1% |
| State Government Employees | 1,400 | 7.3% |
| Federal Government Employees | 491 | 2.6% |
| Unpaid Family Workers | 123 | 0.6% |
| Total | 19,066 | 100.0% |
Employment Status by Age in Roswell
According to the labor force statistics for Roswell, out of the total population over 16 years of age (36,920), 56.2% or 20,749 individuals are in the labor force, with 5.4% or 1,120 of them unemployed. The age group with the highest labor force participation rate is 30 to 34 years, with 82.2% or 2,592 individuals in the labor force. Within the labor force, the 16 to 19 years age range has the highest percentage of unemployed individuals, with 12.6% or 128 of them being unemployed.
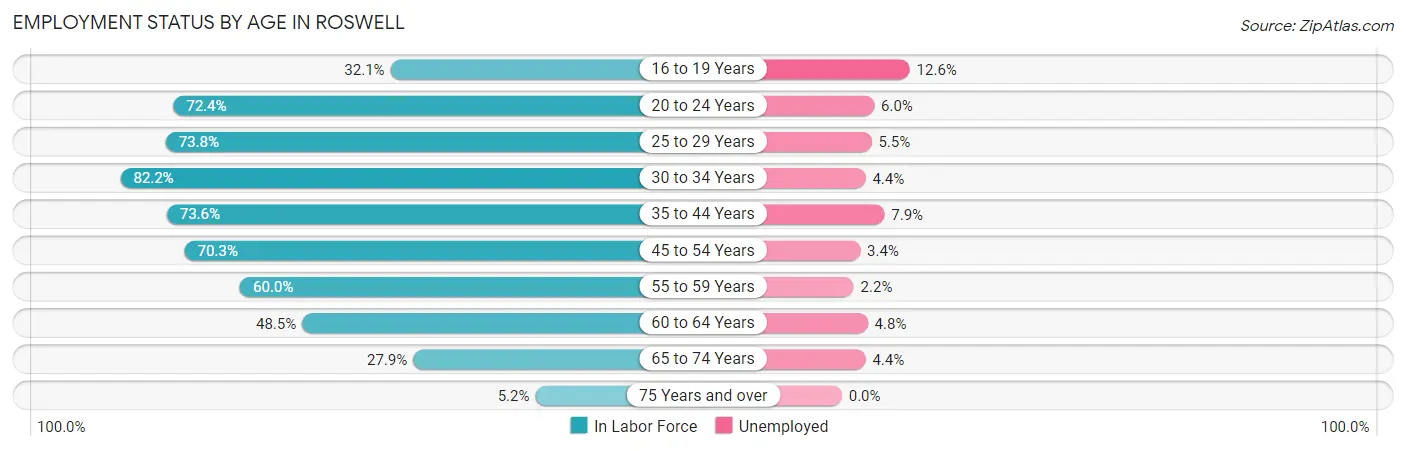
| Age Bracket | In Labor Force | Unemployed |
| 16 to 19 Years | 1,015 (32.1%) | 128 (12.6%) |
| 20 to 24 Years | 2,319 (72.4%) | 139 (6.0%) |
| 25 to 29 Years | 2,328 (73.8%) | 128 (5.5%) |
| 30 to 34 Years | 2,592 (82.2%) | 114 (4.4%) |
| 35 to 44 Years | 4,255 (73.6%) | 336 (7.9%) |
| 45 to 54 Years | 3,879 (70.3%) | 132 (3.4%) |
| 55 to 59 Years | 1,629 (60.0%) | 36 (2.2%) |
| 60 to 64 Years | 1,410 (48.5%) | 68 (4.8%) |
| 65 to 74 Years | 1,160 (27.9%) | 51 (4.4%) |
| 75 Years and over | 165 (5.2%) | 0 (0.0%) |
| Total | 20,749 (56.2%) | 1,120 (5.4%) |
Employment Status by Educational Attainment in Roswell
According to labor force statistics for Roswell, 69.3% of individuals (16,098) out of the total population between 25 and 64 years of age (23,230) are in the labor force, with 5.0% or 805 of them being unemployed. The group with the highest labor force participation rate are those with the educational attainment of bachelor's degree or higher, with 85.1% or 3,391 individuals in the labor force. Within the labor force, individuals with less than high school education have the highest percentage of unemployment, with 8.8% or 198 of them being unemployed.
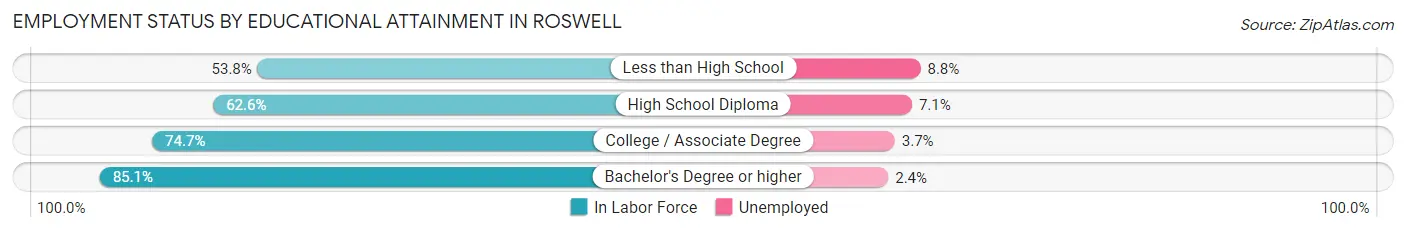
| Educational Attainment | In Labor Force | Unemployed |
| Less than High School | 2,255 (53.8%) | 369 (8.8%) |
| High School Diploma | 4,141 (62.6%) | 470 (7.1%) |
| College / Associate Degree | 6,304 (74.7%) | 312 (3.7%) |
| Bachelor's Degree or higher | 3,391 (85.1%) | 96 (2.4%) |
| Total | 16,098 (69.3%) | 1,162 (5.0%) |
Employment Occupations by Sex in Roswell
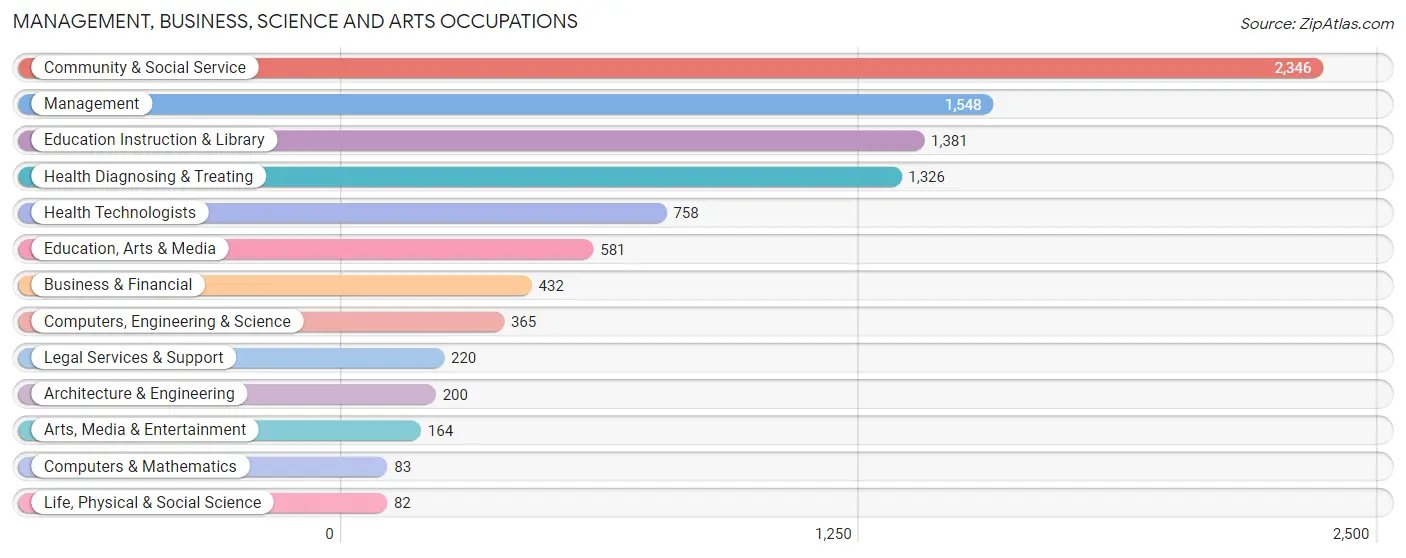
Management, Business, Science and Arts Occupations
The most common Management, Business, Science and Arts occupations in Roswell are Community & Social Service (2,346 | 12.0%), Management (1,548 | 7.9%), Education Instruction & Library (1,381 | 7.0%), Health Diagnosing & Treating (1,326 | 6.8%), and Health Technologists (758 | 3.9%).
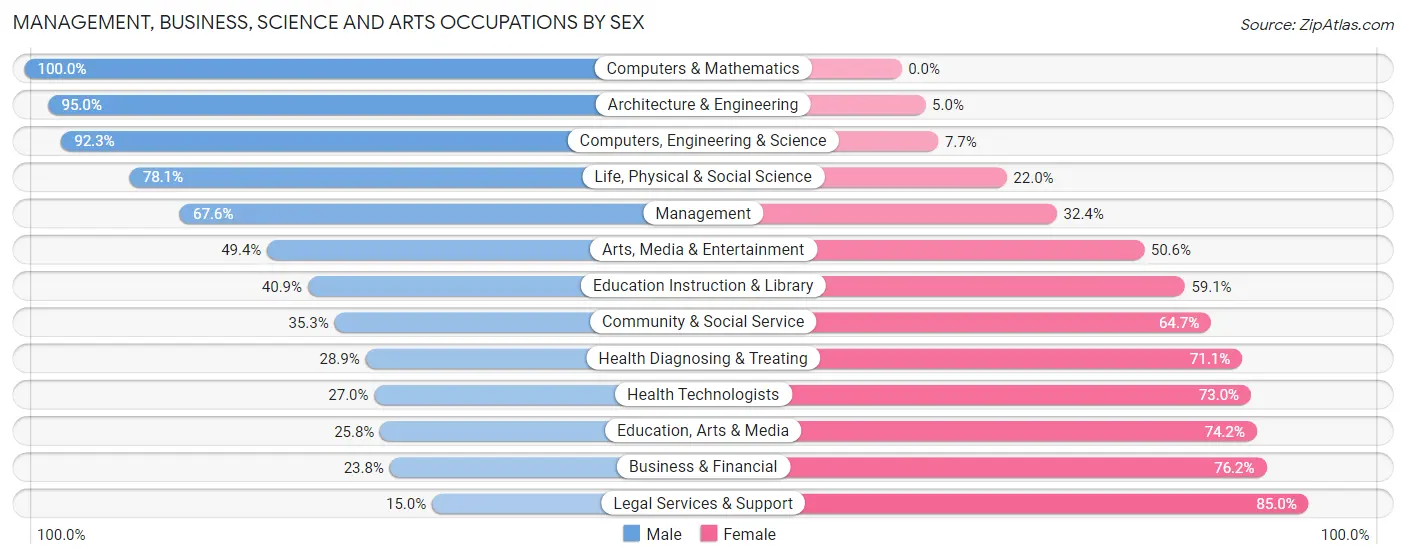
Management, Business, Science and Arts Occupations by Sex
Within the Management, Business, Science and Arts occupations in Roswell, the most male-oriented occupations are Computers & Mathematics (100.0%), Architecture & Engineering (95.0%), and Computers, Engineering & Science (92.3%), while the most female-oriented occupations are Legal Services & Support (85.0%), Business & Financial (76.2%), and Education, Arts & Media (74.2%).
| Occupation | Male | Female |
| Management | 1,046 (67.6%) | 502 (32.4%) |
| Business & Financial | 103 (23.8%) | 329 (76.2%) |
| Computers, Engineering & Science | 337 (92.3%) | 28 (7.7%) |
| Computers & Mathematics | 83 (100.0%) | 0 (0.0%) |
| Architecture & Engineering | 190 (95.0%) | 10 (5.0%) |
| Life, Physical & Social Science | 64 (78.0%) | 18 (22.0%) |
| Community & Social Service | 829 (35.3%) | 1,517 (64.7%) |
| Education, Arts & Media | 150 (25.8%) | 431 (74.2%) |
| Legal Services & Support | 33 (15.0%) | 187 (85.0%) |
| Education Instruction & Library | 565 (40.9%) | 816 (59.1%) |
| Arts, Media & Entertainment | 81 (49.4%) | 83 (50.6%) |
| Health Diagnosing & Treating | 383 (28.9%) | 943 (71.1%) |
| Health Technologists | 205 (27.0%) | 553 (73.0%) |
| Total (Category) | 2,698 (44.8%) | 3,319 (55.2%) |
| Total (Overall) | 9,865 (50.3%) | 9,739 (49.7%) |
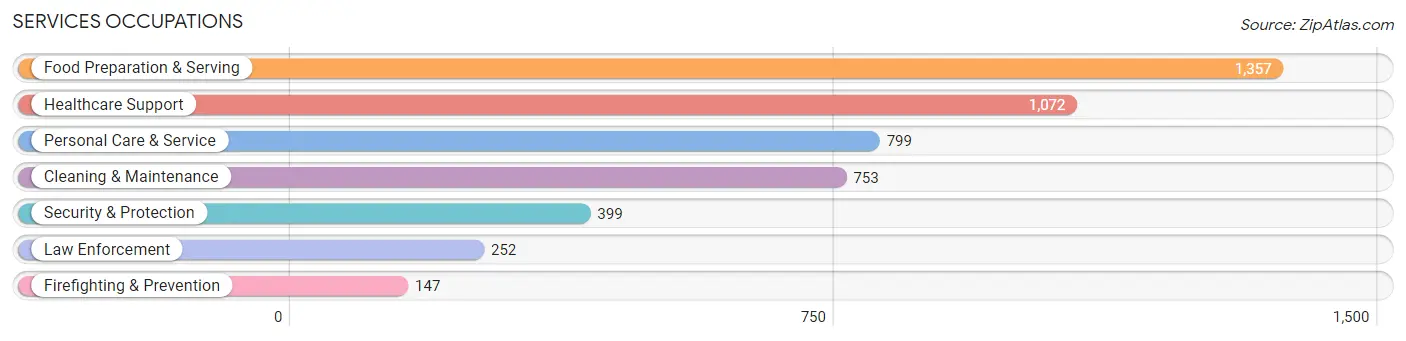
Services Occupations
The most common Services occupations in Roswell are Food Preparation & Serving (1,357 | 6.9%), Healthcare Support (1,072 | 5.5%), Personal Care & Service (799 | 4.1%), Cleaning & Maintenance (753 | 3.8%), and Security & Protection (399 | 2.0%).
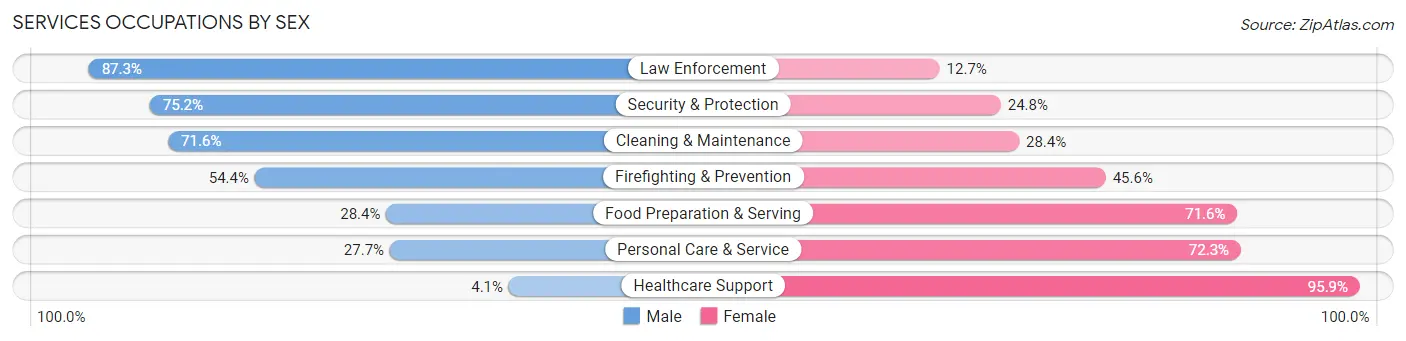
Services Occupations by Sex
Within the Services occupations in Roswell, the most male-oriented occupations are Law Enforcement (87.3%), Security & Protection (75.2%), and Cleaning & Maintenance (71.6%), while the most female-oriented occupations are Healthcare Support (95.9%), Personal Care & Service (72.3%), and Food Preparation & Serving (71.6%).
| Occupation | Male | Female |
| Healthcare Support | 44 (4.1%) | 1,028 (95.9%) |
| Security & Protection | 300 (75.2%) | 99 (24.8%) |
| Firefighting & Prevention | 80 (54.4%) | 67 (45.6%) |
| Law Enforcement | 220 (87.3%) | 32 (12.7%) |
| Food Preparation & Serving | 385 (28.4%) | 972 (71.6%) |
| Cleaning & Maintenance | 539 (71.6%) | 214 (28.4%) |
| Personal Care & Service | 221 (27.7%) | 578 (72.3%) |
| Total (Category) | 1,489 (34.0%) | 2,891 (66.0%) |
| Total (Overall) | 9,865 (50.3%) | 9,739 (49.7%) |
Sales and Office Occupations
The most common Sales and Office occupations in Roswell are Office & Administration (2,315 | 11.8%), and Sales & Related (1,654 | 8.4%).

Sales and Office Occupations by Sex
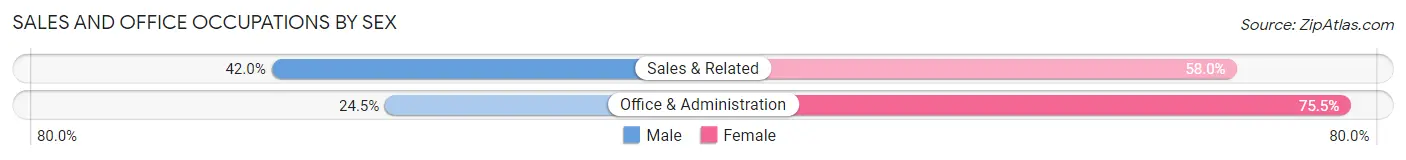
| Occupation | Male | Female |
| Sales & Related | 695 (42.0%) | 959 (58.0%) |
| Office & Administration | 568 (24.5%) | 1,747 (75.5%) |
| Total (Category) | 1,263 (31.8%) | 2,706 (68.2%) |
| Total (Overall) | 9,865 (50.3%) | 9,739 (49.7%) |
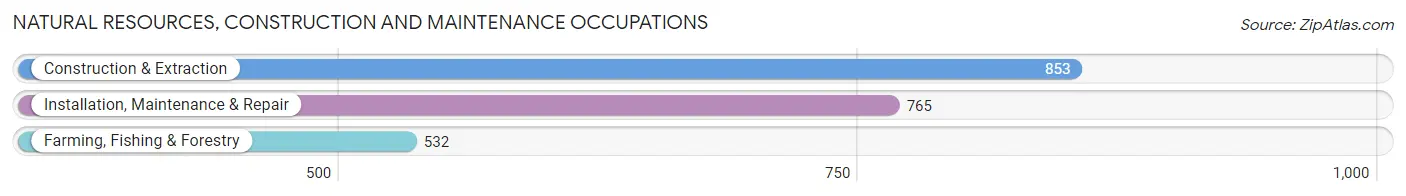
Natural Resources, Construction and Maintenance Occupations
The most common Natural Resources, Construction and Maintenance occupations in Roswell are Construction & Extraction (853 | 4.3%), Installation, Maintenance & Repair (765 | 3.9%), and Farming, Fishing & Forestry (532 | 2.7%).
Natural Resources, Construction and Maintenance Occupations by Sex
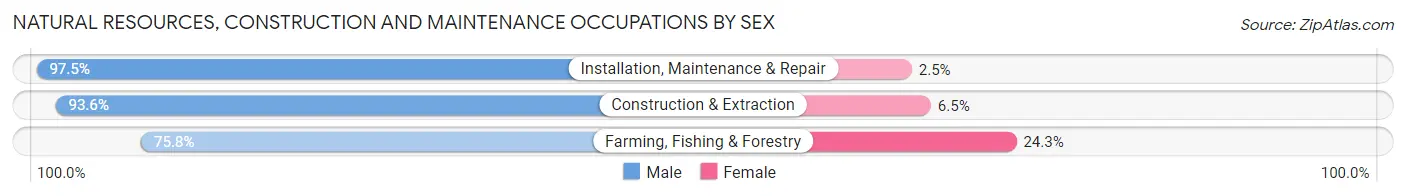
| Occupation | Male | Female |
| Farming, Fishing & Forestry | 403 (75.7%) | 129 (24.2%) |
| Construction & Extraction | 798 (93.5%) | 55 (6.5%) |
| Installation, Maintenance & Repair | 746 (97.5%) | 19 (2.5%) |
| Total (Category) | 1,947 (90.6%) | 203 (9.4%) |
| Total (Overall) | 9,865 (50.3%) | 9,739 (49.7%) |
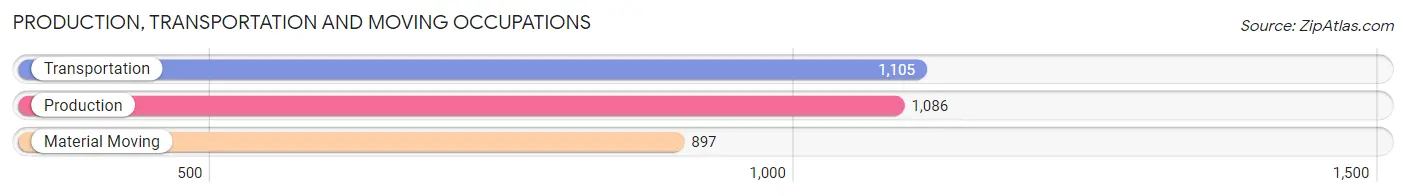
Production, Transportation and Moving Occupations
The most common Production, Transportation and Moving occupations in Roswell are Transportation (1,105 | 5.6%), Production (1,086 | 5.5%), and Material Moving (897 | 4.6%).
Production, Transportation and Moving Occupations by Sex
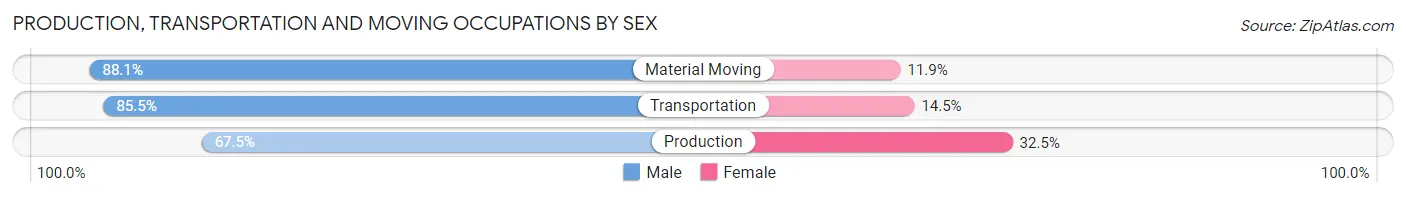
| Occupation | Male | Female |
| Production | 733 (67.5%) | 353 (32.5%) |
| Transportation | 945 (85.5%) | 160 (14.5%) |
| Material Moving | 790 (88.1%) | 107 (11.9%) |
| Total (Category) | 2,468 (79.9%) | 620 (20.1%) |
| Total (Overall) | 9,865 (50.3%) | 9,739 (49.7%) |
Employment Industries by Sex in Roswell
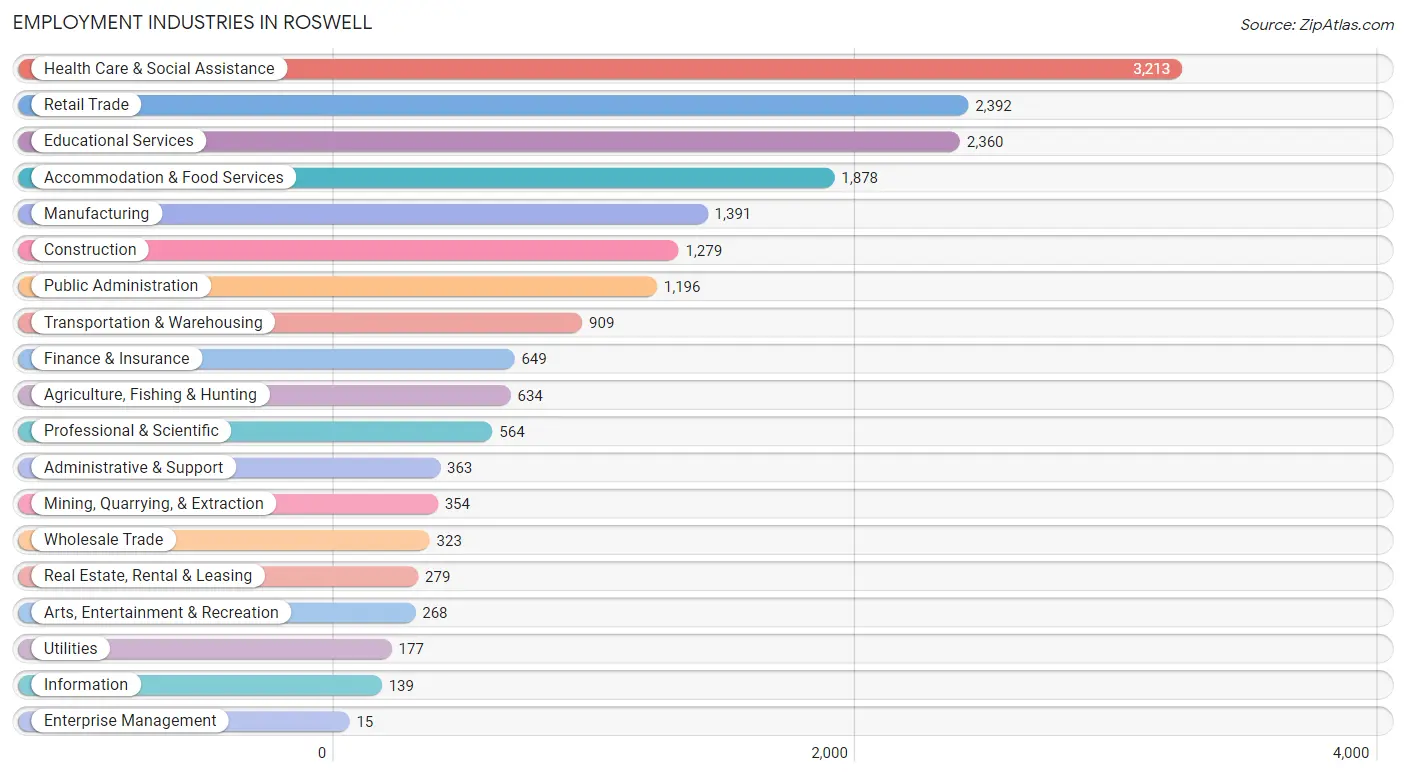
Employment Industries in Roswell
The major employment industries in Roswell include Health Care & Social Assistance (3,213 | 16.4%), Retail Trade (2,392 | 12.2%), Educational Services (2,360 | 12.0%), Accommodation & Food Services (1,878 | 9.6%), and Manufacturing (1,391 | 7.1%).
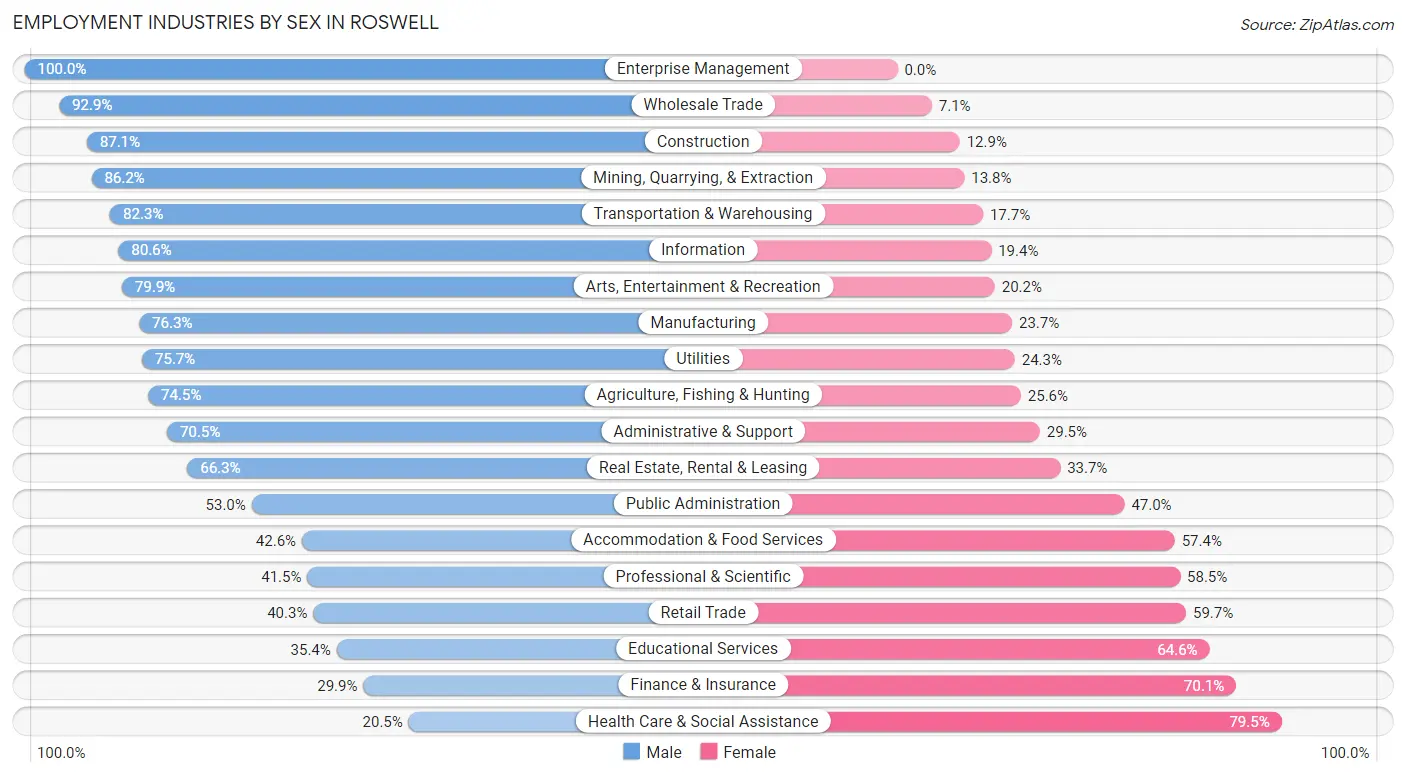
Employment Industries by Sex in Roswell
The Roswell industries that see more men than women are Enterprise Management (100.0%), Wholesale Trade (92.9%), and Construction (87.1%), whereas the industries that tend to have a higher number of women are Health Care & Social Assistance (79.5%), Finance & Insurance (70.1%), and Educational Services (64.6%).
| Industry | Male | Female |
| Agriculture, Fishing & Hunting | 472 (74.5%) | 162 (25.6%) |
| Mining, Quarrying, & Extraction | 305 (86.2%) | 49 (13.8%) |
| Construction | 1,114 (87.1%) | 165 (12.9%) |
| Manufacturing | 1,061 (76.3%) | 330 (23.7%) |
| Wholesale Trade | 300 (92.9%) | 23 (7.1%) |
| Retail Trade | 963 (40.3%) | 1,429 (59.7%) |
| Transportation & Warehousing | 748 (82.3%) | 161 (17.7%) |
| Utilities | 134 (75.7%) | 43 (24.3%) |
| Information | 112 (80.6%) | 27 (19.4%) |
| Finance & Insurance | 194 (29.9%) | 455 (70.1%) |
| Real Estate, Rental & Leasing | 185 (66.3%) | 94 (33.7%) |
| Professional & Scientific | 234 (41.5%) | 330 (58.5%) |
| Enterprise Management | 15 (100.0%) | 0 (0.0%) |
| Administrative & Support | 256 (70.5%) | 107 (29.5%) |
| Educational Services | 836 (35.4%) | 1,524 (64.6%) |
| Health Care & Social Assistance | 659 (20.5%) | 2,554 (79.5%) |
| Arts, Entertainment & Recreation | 214 (79.8%) | 54 (20.2%) |
| Accommodation & Food Services | 800 (42.6%) | 1,078 (57.4%) |
| Public Administration | 634 (53.0%) | 562 (47.0%) |
| Total | 9,865 (50.3%) | 9,739 (49.7%) |
Education in Roswell
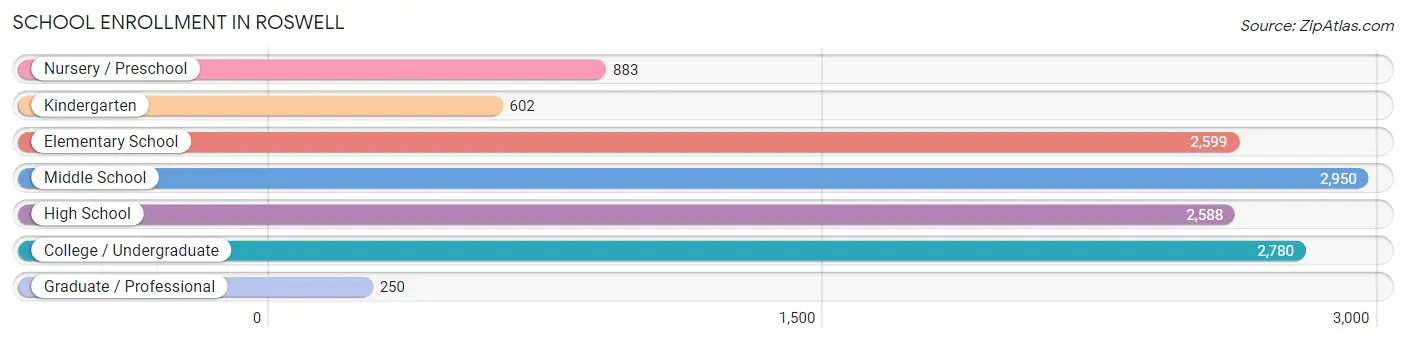
School Enrollment in Roswell
The most common levels of schooling among the 12,652 students in Roswell are middle school (2,950 | 23.3%), college / undergraduate (2,780 | 22.0%), and elementary school (2,599 | 20.5%).
| School Level | # Students | % Students |
| Nursery / Preschool | 883 | 7.0% |
| Kindergarten | 602 | 4.8% |
| Elementary School | 2,599 | 20.5% |
| Middle School | 2,950 | 23.3% |
| High School | 2,588 | 20.5% |
| College / Undergraduate | 2,780 | 22.0% |
| Graduate / Professional | 250 | 2.0% |
| Total | 12,652 | 100.0% |
School Enrollment by Age by Funding Source in Roswell
Out of a total of 12,652 students who are enrolled in schools in Roswell, 1,910 (15.1%) attend a private institution, while the remaining 10,742 (84.9%) are enrolled in public schools. The age group of 18 to 19 year olds has the highest likelihood of being enrolled in private schools, with 500 (37.8% in the age bracket) enrolled. Conversely, the age group of 5 to 9 year old has the lowest likelihood of being enrolled in a private school, with 2,931 (94.5% in the age bracket) attending a public institution.
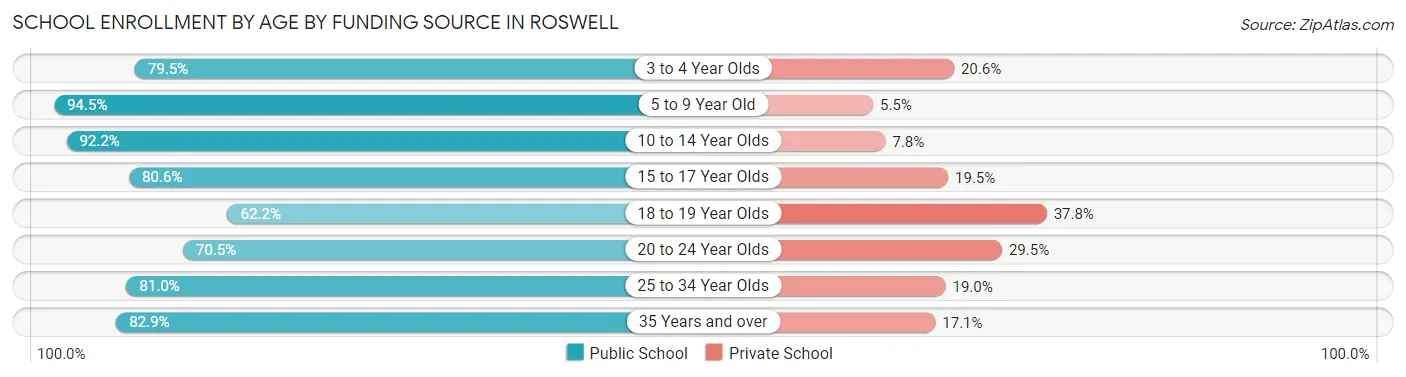
| Age Bracket | Public School | Private School |
| 3 to 4 Year Olds | 518 (79.4%) | 134 (20.5%) |
| 5 to 9 Year Old | 2,931 (94.5%) | 170 (5.5%) |
| 10 to 14 Year Olds | 3,308 (92.2%) | 280 (7.8%) |
| 15 to 17 Year Olds | 1,702 (80.5%) | 411 (19.5%) |
| 18 to 19 Year Olds | 822 (62.2%) | 500 (37.8%) |
| 20 to 24 Year Olds | 459 (70.5%) | 192 (29.5%) |
| 25 to 34 Year Olds | 504 (81.0%) | 118 (19.0%) |
| 35 Years and over | 500 (82.9%) | 103 (17.1%) |
| Total | 10,742 (84.9%) | 1,910 (15.1%) |
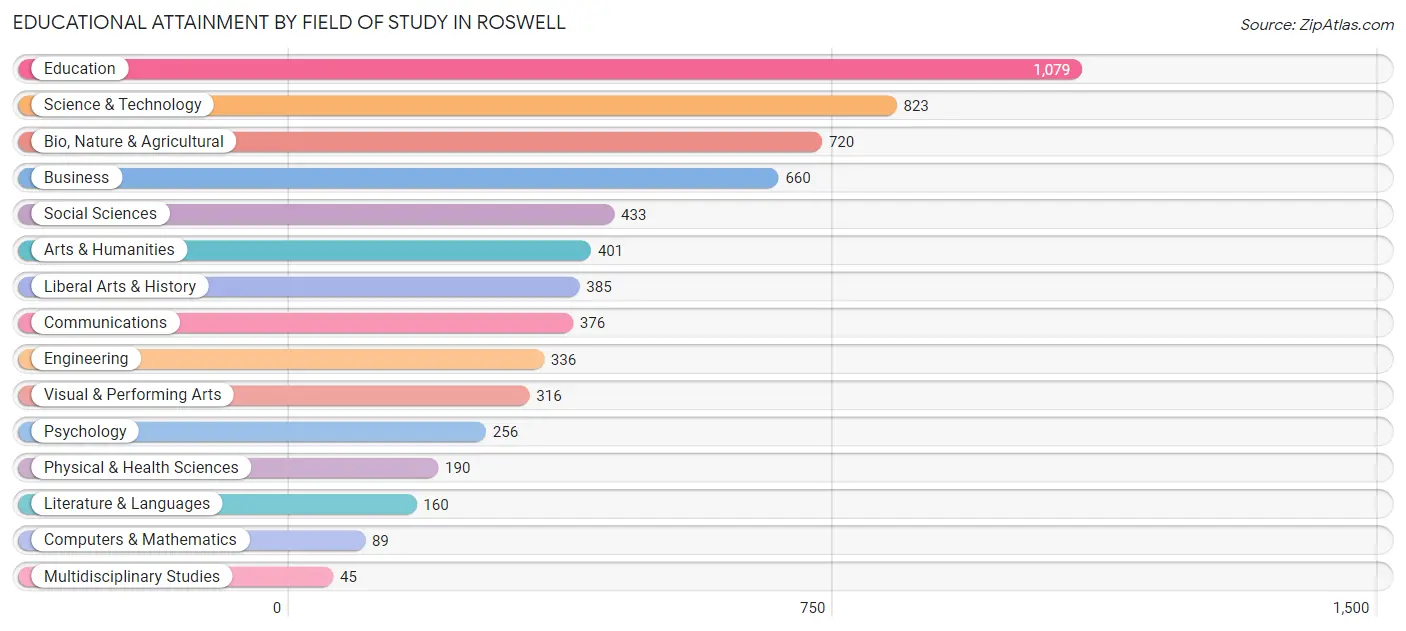
Educational Attainment by Field of Study in Roswell
Education (1,079 | 17.2%), science & technology (823 | 13.1%), bio, nature & agricultural (720 | 11.5%), business (660 | 10.5%), and social sciences (433 | 6.9%) are the most common fields of study among 6,269 individuals in Roswell who have obtained a bachelor's degree or higher.
| Field of Study | # Graduates | % Graduates |
| Computers & Mathematics | 89 | 1.4% |
| Bio, Nature & Agricultural | 720 | 11.5% |
| Physical & Health Sciences | 190 | 3.0% |
| Psychology | 256 | 4.1% |
| Social Sciences | 433 | 6.9% |
| Engineering | 336 | 5.4% |
| Multidisciplinary Studies | 45 | 0.7% |
| Science & Technology | 823 | 13.1% |
| Business | 660 | 10.5% |
| Education | 1,079 | 17.2% |
| Literature & Languages | 160 | 2.5% |
| Liberal Arts & History | 385 | 6.1% |
| Visual & Performing Arts | 316 | 5.0% |
| Communications | 376 | 6.0% |
| Arts & Humanities | 401 | 6.4% |
| Total | 6,269 | 100.0% |
Transportation & Commute in Roswell
Vehicle Availability by Sex in Roswell
The most prevalent vehicle ownership categories in Roswell are males with 2 vehicles (4,493, accounting for 47.1%) and females with 2 vehicles (3,770, making up 48.7%).
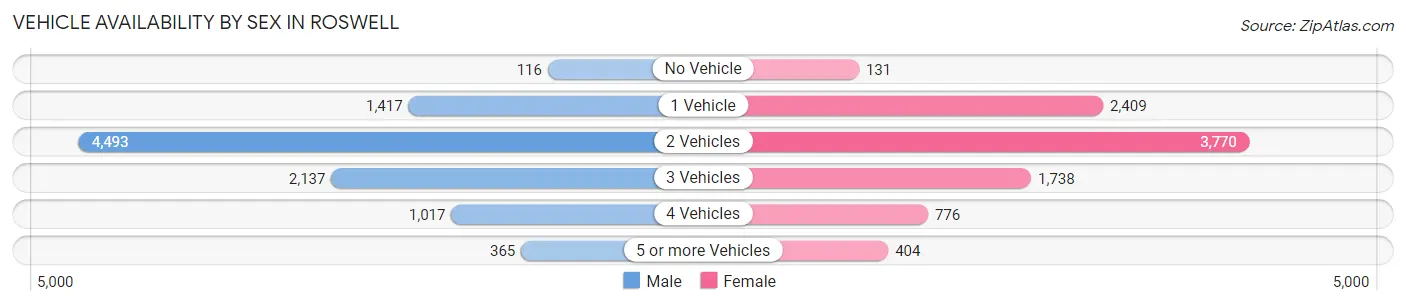
| Vehicles Available | Male | Female |
| No Vehicle | 116 (1.2%) | 131 (1.4%) |
| 1 Vehicle | 1,417 (14.8%) | 2,409 (26.1%) |
| 2 Vehicles | 4,493 (47.1%) | 3,770 (40.8%) |
| 3 Vehicles | 2,137 (22.4%) | 1,738 (18.8%) |
| 4 Vehicles | 1,017 (10.6%) | 776 (8.4%) |
| 5 or more Vehicles | 365 (3.8%) | 404 (4.4%) |
| Total | 9,545 (100.0%) | 9,228 (100.0%) |
Commute Time in Roswell
The most frequently occuring commute durations in Roswell are 10 to 14 minutes (4,938 commuters, 26.7%), 15 to 19 minutes (4,257 commuters, 23.0%), and 5 to 9 minutes (3,582 commuters, 19.3%).
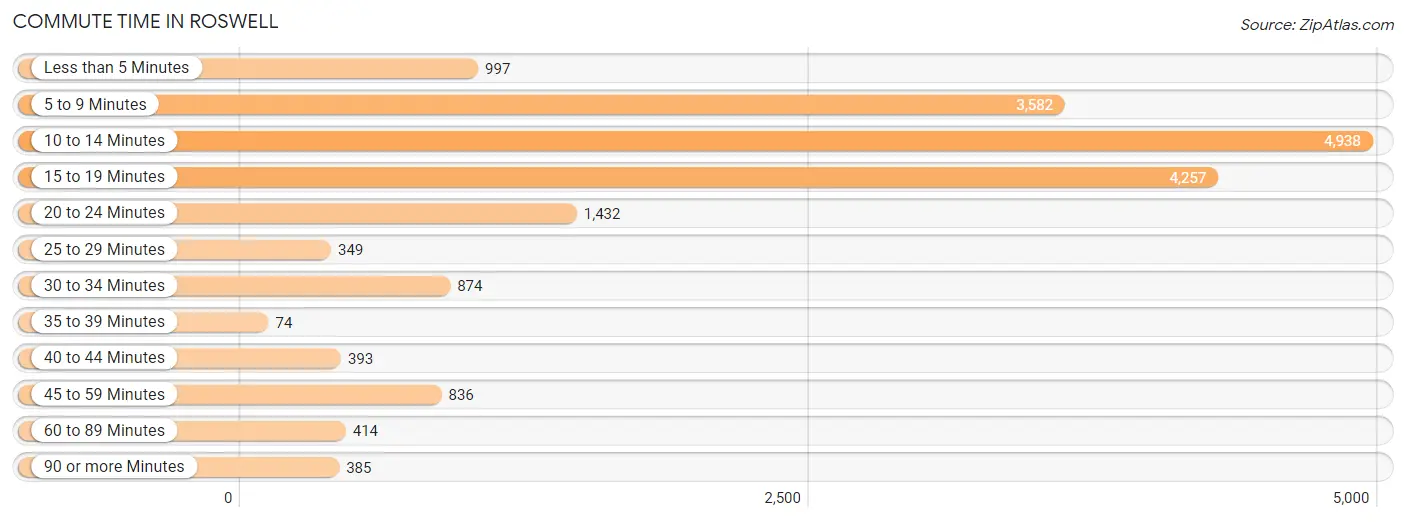
| Commute Time | # Commuters | % Commuters |
| Less than 5 Minutes | 997 | 5.4% |
| 5 to 9 Minutes | 3,582 | 19.3% |
| 10 to 14 Minutes | 4,938 | 26.7% |
| 15 to 19 Minutes | 4,257 | 23.0% |
| 20 to 24 Minutes | 1,432 | 7.7% |
| 25 to 29 Minutes | 349 | 1.9% |
| 30 to 34 Minutes | 874 | 4.7% |
| 35 to 39 Minutes | 74 | 0.4% |
| 40 to 44 Minutes | 393 | 2.1% |
| 45 to 59 Minutes | 836 | 4.5% |
| 60 to 89 Minutes | 414 | 2.2% |
| 90 or more Minutes | 385 | 2.1% |
Commute Time by Sex in Roswell
The most common commute times in Roswell are 10 to 14 minutes (2,170 commuters, 22.9%) for males and 10 to 14 minutes (2,768 commuters, 30.6%) for females.
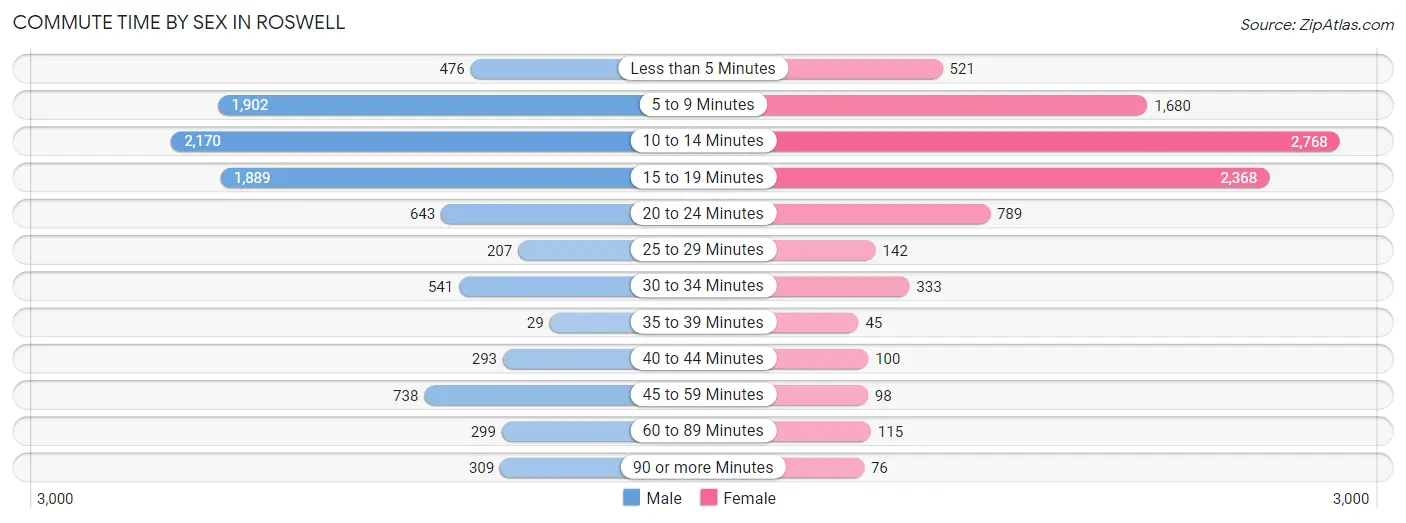
| Commute Time | Male | Female |
| Less than 5 Minutes | 476 (5.0%) | 521 (5.8%) |
| 5 to 9 Minutes | 1,902 (20.0%) | 1,680 (18.6%) |
| 10 to 14 Minutes | 2,170 (22.9%) | 2,768 (30.6%) |
| 15 to 19 Minutes | 1,889 (19.9%) | 2,368 (26.2%) |
| 20 to 24 Minutes | 643 (6.8%) | 789 (8.7%) |
| 25 to 29 Minutes | 207 (2.2%) | 142 (1.6%) |
| 30 to 34 Minutes | 541 (5.7%) | 333 (3.7%) |
| 35 to 39 Minutes | 29 (0.3%) | 45 (0.5%) |
| 40 to 44 Minutes | 293 (3.1%) | 100 (1.1%) |
| 45 to 59 Minutes | 738 (7.8%) | 98 (1.1%) |
| 60 to 89 Minutes | 299 (3.2%) | 115 (1.3%) |
| 90 or more Minutes | 309 (3.3%) | 76 (0.8%) |
Time of Departure to Work by Sex in Roswell
The most frequent times of departure to work in Roswell are 7:00 AM to 7:29 AM (1,177, 12.4%) for males and 7:30 AM to 7:59 AM (2,068, 22.9%) for females.
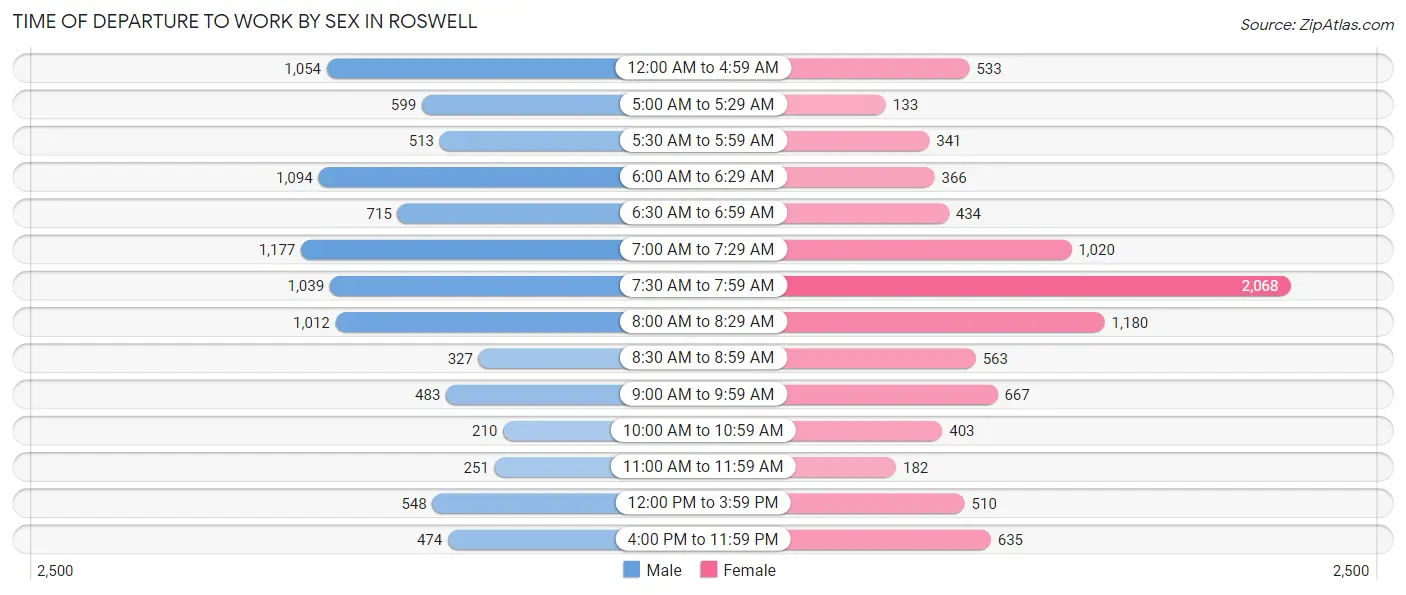
| Time of Departure | Male | Female |
| 12:00 AM to 4:59 AM | 1,054 (11.1%) | 533 (5.9%) |
| 5:00 AM to 5:29 AM | 599 (6.3%) | 133 (1.5%) |
| 5:30 AM to 5:59 AM | 513 (5.4%) | 341 (3.8%) |
| 6:00 AM to 6:29 AM | 1,094 (11.5%) | 366 (4.1%) |
| 6:30 AM to 6:59 AM | 715 (7.5%) | 434 (4.8%) |
| 7:00 AM to 7:29 AM | 1,177 (12.4%) | 1,020 (11.3%) |
| 7:30 AM to 7:59 AM | 1,039 (10.9%) | 2,068 (22.9%) |
| 8:00 AM to 8:29 AM | 1,012 (10.7%) | 1,180 (13.1%) |
| 8:30 AM to 8:59 AM | 327 (3.4%) | 563 (6.2%) |
| 9:00 AM to 9:59 AM | 483 (5.1%) | 667 (7.4%) |
| 10:00 AM to 10:59 AM | 210 (2.2%) | 403 (4.5%) |
| 11:00 AM to 11:59 AM | 251 (2.6%) | 182 (2.0%) |
| 12:00 PM to 3:59 PM | 548 (5.8%) | 510 (5.6%) |
| 4:00 PM to 11:59 PM | 474 (5.0%) | 635 (7.0%) |
| Total | 9,496 (100.0%) | 9,035 (100.0%) |
Housing Occupancy in Roswell
Occupancy by Ownership in Roswell
Of the total 17,438 dwellings in Roswell, owner-occupied units account for 11,221 (64.3%), while renter-occupied units make up 6,217 (35.6%).
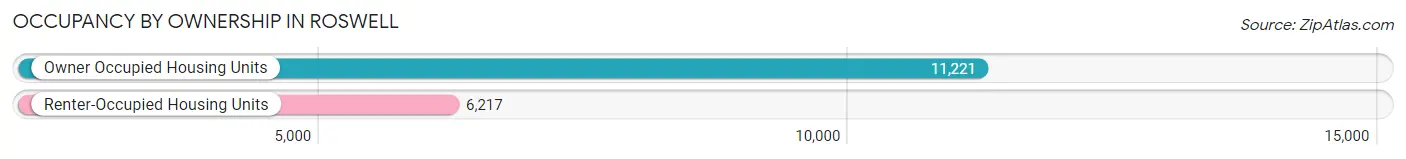
| Occupancy | # Housing Units | % Housing Units |
| Owner Occupied Housing Units | 11,221 | 64.3% |
| Renter-Occupied Housing Units | 6,217 | 35.6% |
| Total Occupied Housing Units | 17,438 | 100.0% |
Occupancy by Household Size in Roswell
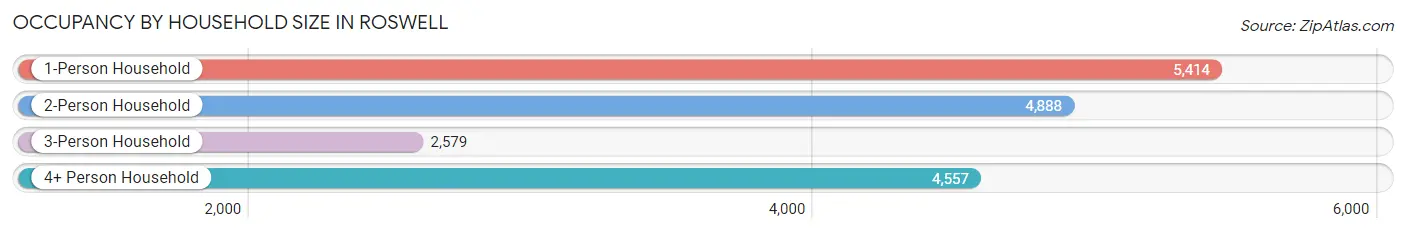
| Household Size | # Housing Units | % Housing Units |
| 1-Person Household | 5,414 | 31.0% |
| 2-Person Household | 4,888 | 28.0% |
| 3-Person Household | 2,579 | 14.8% |
| 4+ Person Household | 4,557 | 26.1% |
| Total Housing Units | 17,438 | 100.0% |
Occupancy by Ownership by Household Size in Roswell
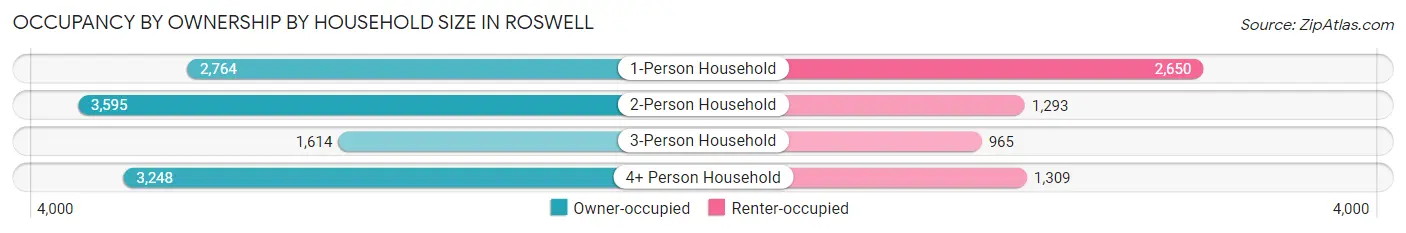
| Household Size | Owner-occupied | Renter-occupied |
| 1-Person Household | 2,764 (51.0%) | 2,650 (48.9%) |
| 2-Person Household | 3,595 (73.6%) | 1,293 (26.5%) |
| 3-Person Household | 1,614 (62.6%) | 965 (37.4%) |
| 4+ Person Household | 3,248 (71.3%) | 1,309 (28.7%) |
| Total Housing Units | 11,221 (64.3%) | 6,217 (35.6%) |
Occupancy by Educational Attainment in Roswell
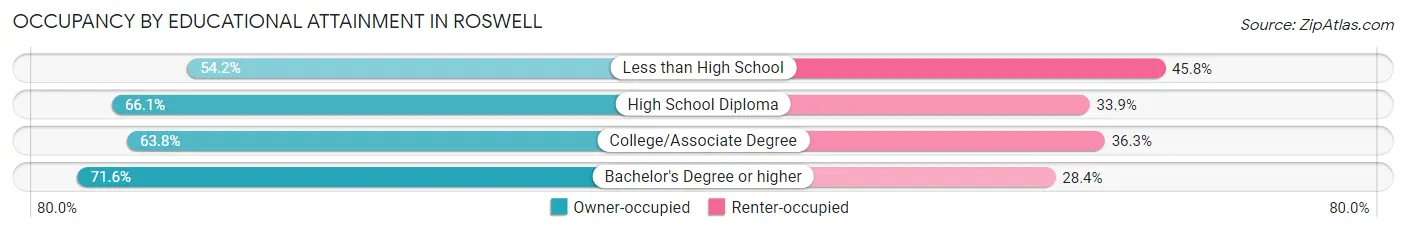
| Household Size | Owner-occupied | Renter-occupied |
| Less than High School | 1,576 (54.2%) | 1,332 (45.8%) |
| High School Diploma | 2,817 (66.1%) | 1,442 (33.9%) |
| College/Associate Degree | 4,262 (63.7%) | 2,424 (36.2%) |
| Bachelor's Degree or higher | 2,566 (71.6%) | 1,019 (28.4%) |
Occupancy by Age of Householder in Roswell
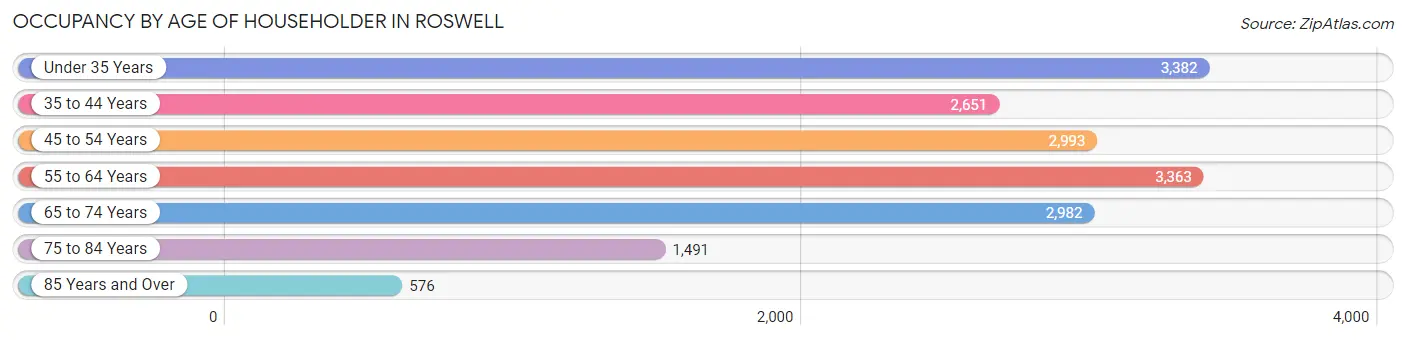
| Age Bracket | # Households | % Households |
| Under 35 Years | 3,382 | 19.4% |
| 35 to 44 Years | 2,651 | 15.2% |
| 45 to 54 Years | 2,993 | 17.2% |
| 55 to 64 Years | 3,363 | 19.3% |
| 65 to 74 Years | 2,982 | 17.1% |
| 75 to 84 Years | 1,491 | 8.6% |
| 85 Years and Over | 576 | 3.3% |
| Total | 17,438 | 100.0% |
Housing Finances in Roswell
Median Income by Occupancy in Roswell
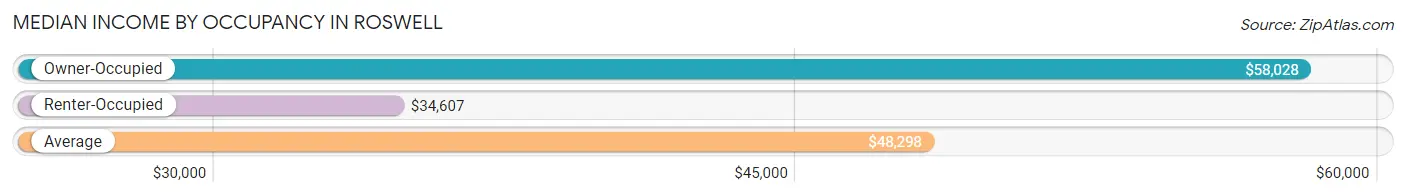
| Occupancy Type | # Households | Median Income |
| Owner-Occupied | 11,221 (64.3%) | $58,028 |
| Renter-Occupied | 6,217 (35.6%) | $34,607 |
| Average | 17,438 (100.0%) | $48,298 |
Occupancy by Householder Income Bracket in Roswell
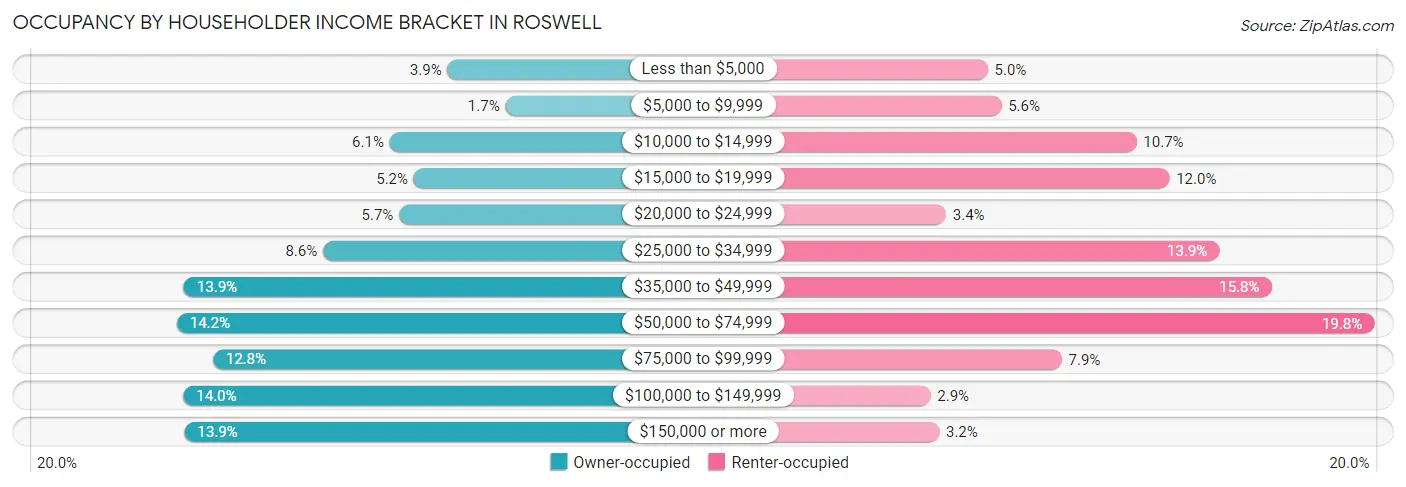
| Income Bracket | Owner-occupied | Renter-occupied |
| Less than $5,000 | 437 (3.9%) | 313 (5.0%) |
| $5,000 to $9,999 | 188 (1.7%) | 345 (5.6%) |
| $10,000 to $14,999 | 683 (6.1%) | 665 (10.7%) |
| $15,000 to $19,999 | 580 (5.2%) | 743 (11.9%) |
| $20,000 to $24,999 | 643 (5.7%) | 214 (3.4%) |
| $25,000 to $34,999 | 968 (8.6%) | 861 (13.9%) |
| $35,000 to $49,999 | 1,563 (13.9%) | 985 (15.8%) |
| $50,000 to $74,999 | 1,593 (14.2%) | 1,228 (19.8%) |
| $75,000 to $99,999 | 1,440 (12.8%) | 488 (7.9%) |
| $100,000 to $149,999 | 1,565 (14.0%) | 177 (2.9%) |
| $150,000 or more | 1,561 (13.9%) | 198 (3.2%) |
| Total | 11,221 (100.0%) | 6,217 (100.0%) |
Monthly Housing Cost Tiers in Roswell
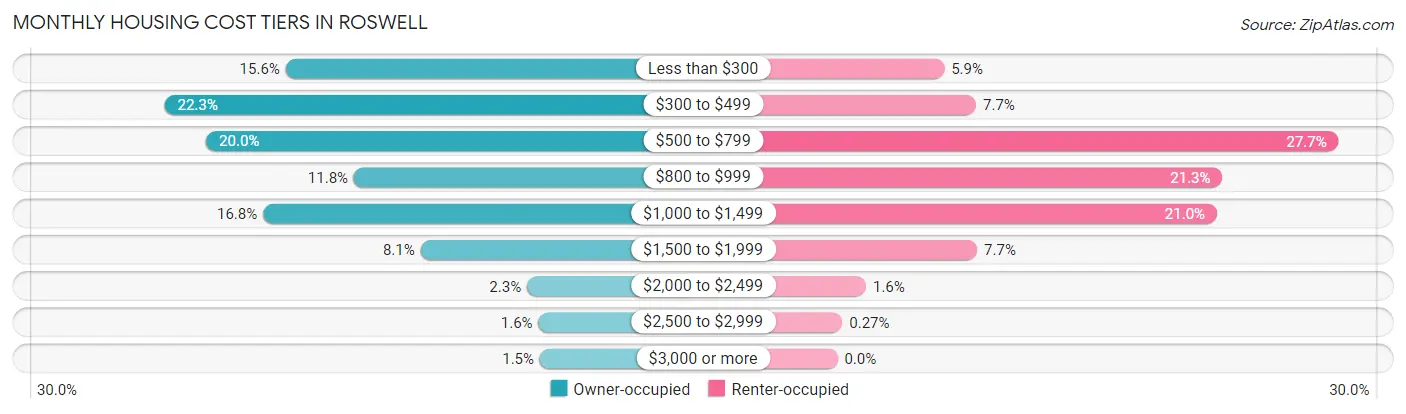
| Monthly Cost | Owner-occupied | Renter-occupied |
| Less than $300 | 1,748 (15.6%) | 367 (5.9%) |
| $300 to $499 | 2,499 (22.3%) | 476 (7.7%) |
| $500 to $799 | 2,241 (20.0%) | 1,721 (27.7%) |
| $800 to $999 | 1,325 (11.8%) | 1,322 (21.3%) |
| $1,000 to $1,499 | 1,889 (16.8%) | 1,303 (21.0%) |
| $1,500 to $1,999 | 912 (8.1%) | 480 (7.7%) |
| $2,000 to $2,499 | 252 (2.2%) | 98 (1.6%) |
| $2,500 to $2,999 | 182 (1.6%) | 17 (0.3%) |
| $3,000 or more | 173 (1.5%) | 0 (0.0%) |
| Total | 11,221 (100.0%) | 6,217 (100.0%) |
Physical Housing Characteristics in Roswell
Housing Structures in Roswell
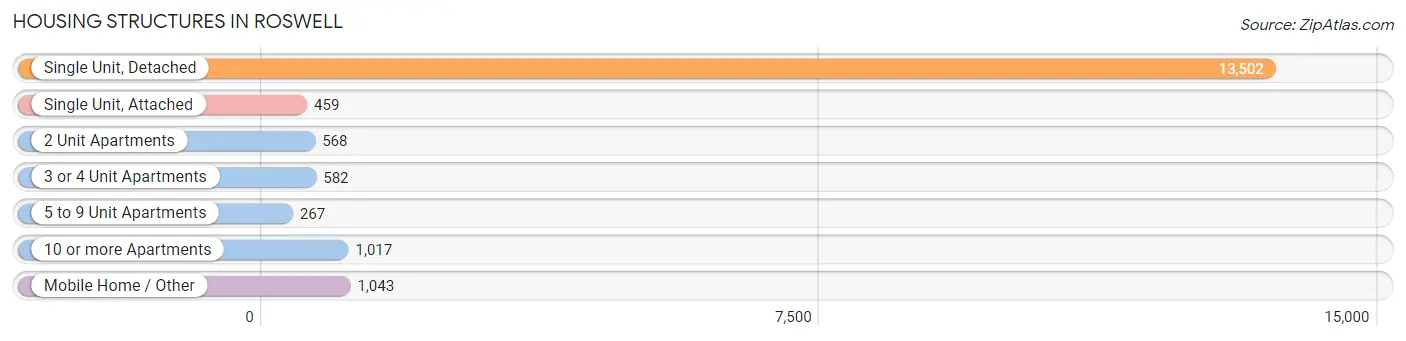
| Structure Type | # Housing Units | % Housing Units |
| Single Unit, Detached | 13,502 | 77.4% |
| Single Unit, Attached | 459 | 2.6% |
| 2 Unit Apartments | 568 | 3.3% |
| 3 or 4 Unit Apartments | 582 | 3.3% |
| 5 to 9 Unit Apartments | 267 | 1.5% |
| 10 or more Apartments | 1,017 | 5.8% |
| Mobile Home / Other | 1,043 | 6.0% |
| Total | 17,438 | 100.0% |
Housing Structures by Occupancy in Roswell
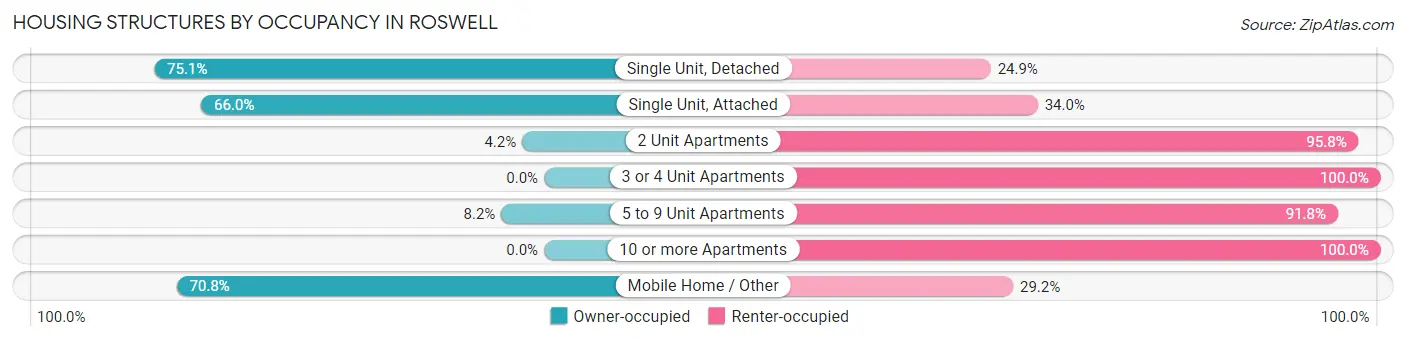
| Structure Type | Owner-occupied | Renter-occupied |
| Single Unit, Detached | 10,134 (75.1%) | 3,368 (24.9%) |
| Single Unit, Attached | 303 (66.0%) | 156 (34.0%) |
| 2 Unit Apartments | 24 (4.2%) | 544 (95.8%) |
| 3 or 4 Unit Apartments | 0 (0.0%) | 582 (100.0%) |
| 5 to 9 Unit Apartments | 22 (8.2%) | 245 (91.8%) |
| 10 or more Apartments | 0 (0.0%) | 1,017 (100.0%) |
| Mobile Home / Other | 738 (70.8%) | 305 (29.2%) |
| Total | 11,221 (64.3%) | 6,217 (35.6%) |
Housing Structures by Number of Rooms in Roswell
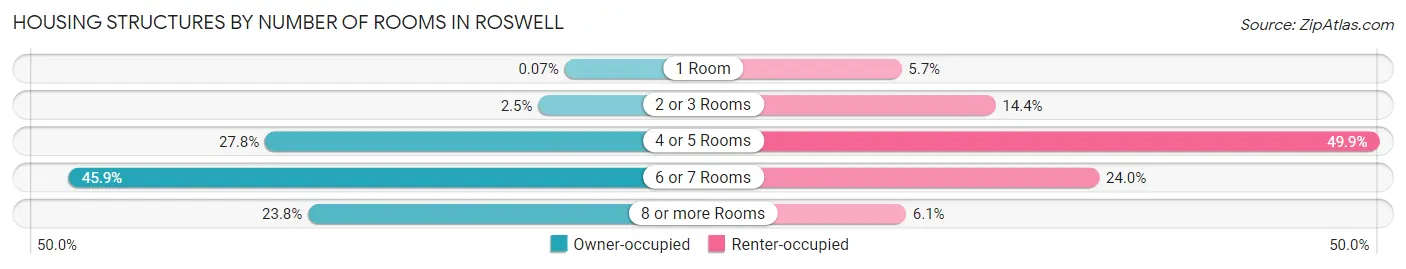
| Number of Rooms | Owner-occupied | Renter-occupied |
| 1 Room | 8 (0.1%) | 353 (5.7%) |
| 2 or 3 Rooms | 279 (2.5%) | 894 (14.4%) |
| 4 or 5 Rooms | 3,115 (27.8%) | 3,101 (49.9%) |
| 6 or 7 Rooms | 5,151 (45.9%) | 1,490 (24.0%) |
| 8 or more Rooms | 2,668 (23.8%) | 379 (6.1%) |
| Total | 11,221 (100.0%) | 6,217 (100.0%) |
Housing Structure by Heating Type in Roswell
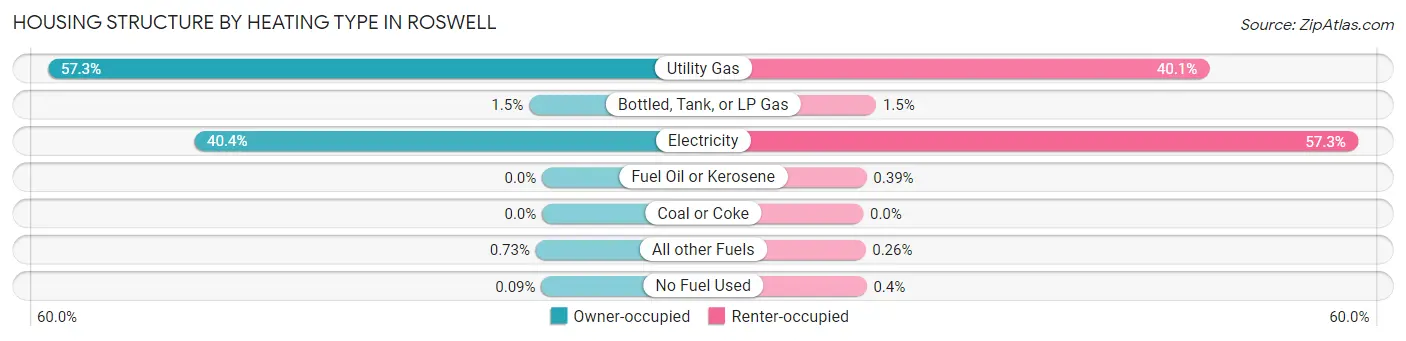
| Heating Type | Owner-occupied | Renter-occupied |
| Utility Gas | 6,431 (57.3%) | 2,494 (40.1%) |
| Bottled, Tank, or LP Gas | 170 (1.5%) | 93 (1.5%) |
| Electricity | 4,528 (40.4%) | 3,565 (57.3%) |
| Fuel Oil or Kerosene | 0 (0.0%) | 24 (0.4%) |
| Coal or Coke | 0 (0.0%) | 0 (0.0%) |
| All other Fuels | 82 (0.7%) | 16 (0.3%) |
| No Fuel Used | 10 (0.1%) | 25 (0.4%) |
| Total | 11,221 (100.0%) | 6,217 (100.0%) |
Household Vehicle Usage in Roswell
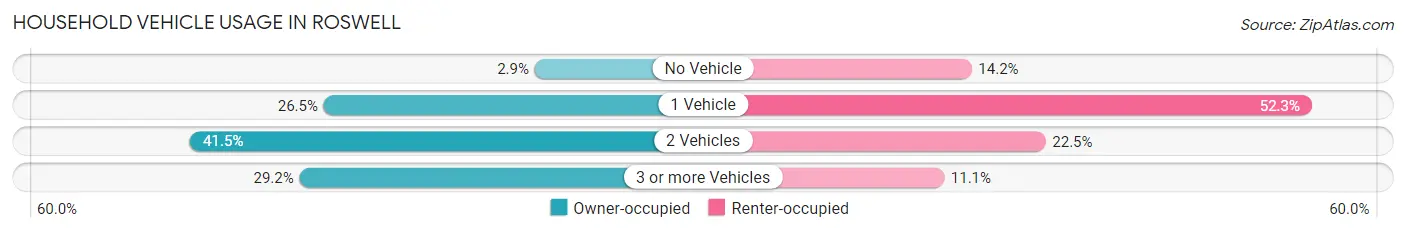
| Vehicles per Household | Owner-occupied | Renter-occupied |
| No Vehicle | 320 (2.9%) | 881 (14.2%) |
| 1 Vehicle | 2,971 (26.5%) | 3,251 (52.3%) |
| 2 Vehicles | 4,653 (41.5%) | 1,396 (22.5%) |
| 3 or more Vehicles | 3,277 (29.2%) | 689 (11.1%) |
| Total | 11,221 (100.0%) | 6,217 (100.0%) |
Real Estate & Mortgages in Roswell
Real Estate and Mortgage Overview in Roswell
| Characteristic | Without Mortgage | With Mortgage |
| Housing Units | 5,732 | 5,489 |
| Median Property Value | $105,200 | $151,500 |
| Median Household Income | $45,635 | $840 |
| Monthly Housing Costs | $382 | $142 |
| Real Estate Taxes | $646 | $431 |
Property Value by Mortgage Status in Roswell
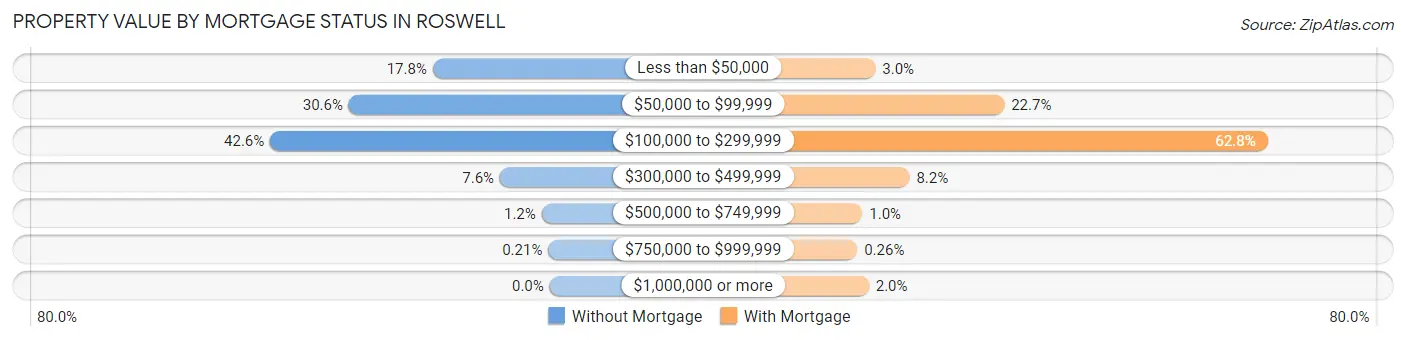
| Property Value | Without Mortgage | With Mortgage |
| Less than $50,000 | 1,021 (17.8%) | 166 (3.0%) |
| $50,000 to $99,999 | 1,754 (30.6%) | 1,244 (22.7%) |
| $100,000 to $299,999 | 2,441 (42.6%) | 3,446 (62.8%) |
| $300,000 to $499,999 | 434 (7.6%) | 451 (8.2%) |
| $500,000 to $749,999 | 70 (1.2%) | 57 (1.0%) |
| $750,000 to $999,999 | 12 (0.2%) | 14 (0.3%) |
| $1,000,000 or more | 0 (0.0%) | 111 (2.0%) |
| Total | 5,732 (100.0%) | 5,489 (100.0%) |
Household Income by Mortgage Status in Roswell
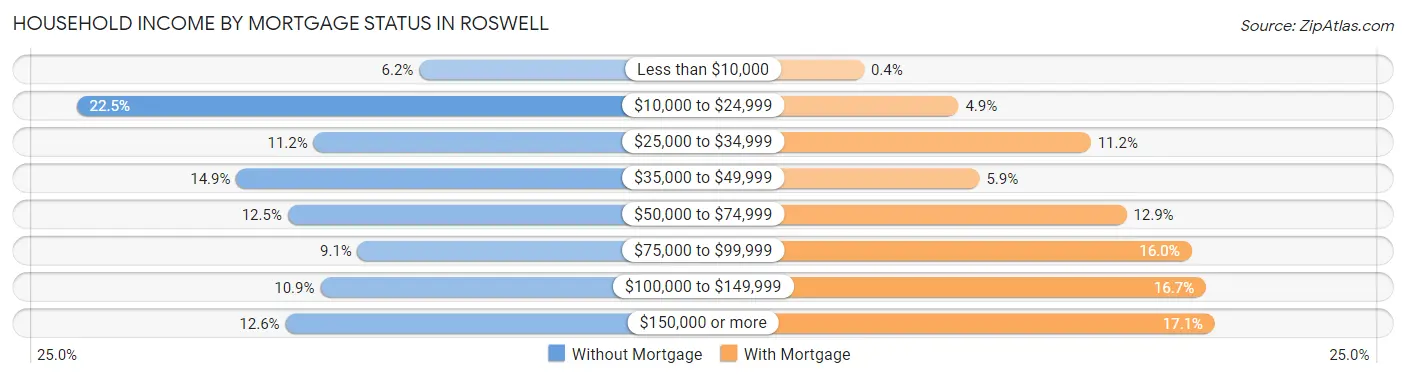
| Household Income | Without Mortgage | With Mortgage |
| Less than $10,000 | 356 (6.2%) | 22 (0.4%) |
| $10,000 to $24,999 | 1,291 (22.5%) | 269 (4.9%) |
| $25,000 to $34,999 | 644 (11.2%) | 615 (11.2%) |
| $35,000 to $49,999 | 855 (14.9%) | 324 (5.9%) |
| $50,000 to $74,999 | 715 (12.5%) | 708 (12.9%) |
| $75,000 to $99,999 | 524 (9.1%) | 878 (16.0%) |
| $100,000 to $149,999 | 626 (10.9%) | 916 (16.7%) |
| $150,000 or more | 721 (12.6%) | 939 (17.1%) |
| Total | 5,732 (100.0%) | 5,489 (100.0%) |
Property Value to Household Income Ratio in Roswell
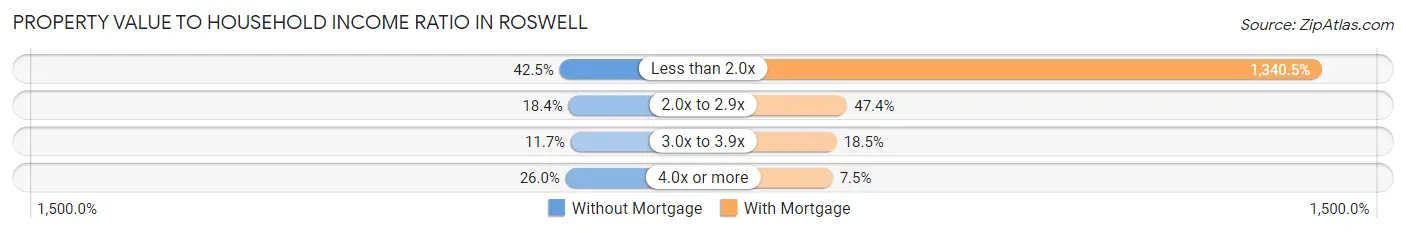
| Value-to-Income Ratio | Without Mortgage | With Mortgage |
| Less than 2.0x | 2,434 (42.5%) | 73,578 (1,340.5%) |
| 2.0x to 2.9x | 1,053 (18.4%) | 2,601 (47.4%) |
| 3.0x to 3.9x | 670 (11.7%) | 1,016 (18.5%) |
| 4.0x or more | 1,488 (26.0%) | 413 (7.5%) |
| Total | 5,732 (100.0%) | 5,489 (100.0%) |
Real Estate Taxes by Mortgage Status in Roswell
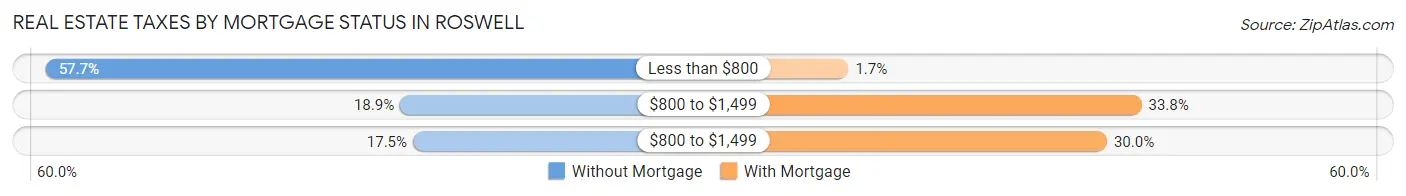
| Property Taxes | Without Mortgage | With Mortgage |
| Less than $800 | 3,306 (57.7%) | 93 (1.7%) |
| $800 to $1,499 | 1,081 (18.9%) | 1,856 (33.8%) |
| $800 to $1,499 | 1,000 (17.4%) | 1,648 (30.0%) |
| Total | 5,732 (100.0%) | 5,489 (100.0%) |
Health & Disability in Roswell
Health Insurance Coverage by Age in Roswell
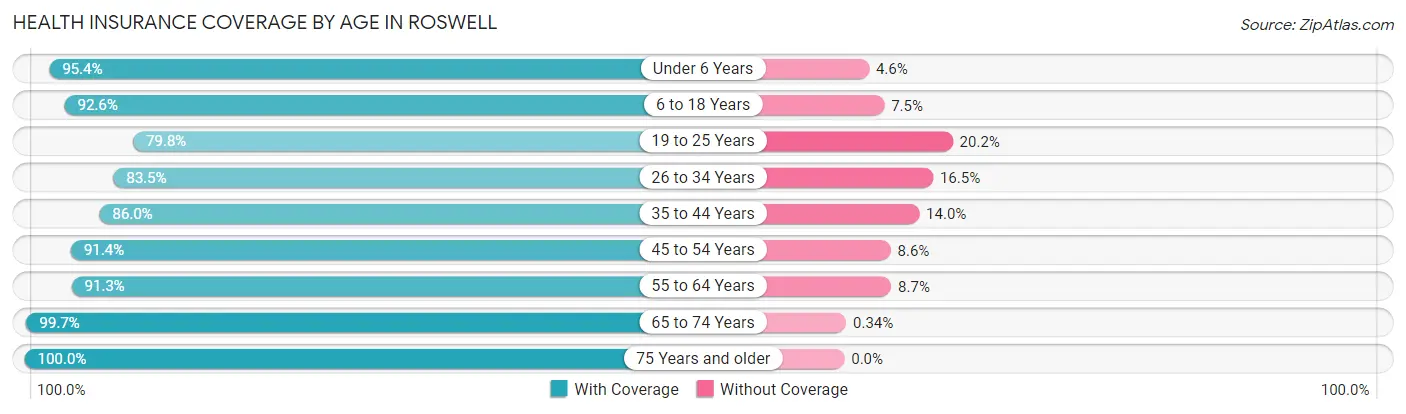
| Age Bracket | With Coverage | Without Coverage |
| Under 6 Years | 3,758 (95.4%) | 181 (4.6%) |
| 6 to 18 Years | 8,590 (92.5%) | 691 (7.4%) |
| 19 to 25 Years | 3,834 (79.8%) | 971 (20.2%) |
| 26 to 34 Years | 4,601 (83.5%) | 912 (16.5%) |
| 35 to 44 Years | 4,898 (86.0%) | 795 (14.0%) |
| 45 to 54 Years | 5,019 (91.4%) | 474 (8.6%) |
| 55 to 64 Years | 5,093 (91.3%) | 488 (8.7%) |
| 65 to 74 Years | 4,095 (99.7%) | 14 (0.3%) |
| 75 Years and older | 2,966 (100.0%) | 0 (0.0%) |
| Total | 42,854 (90.4%) | 4,526 (9.6%) |
Health Insurance Coverage by Citizenship Status in Roswell
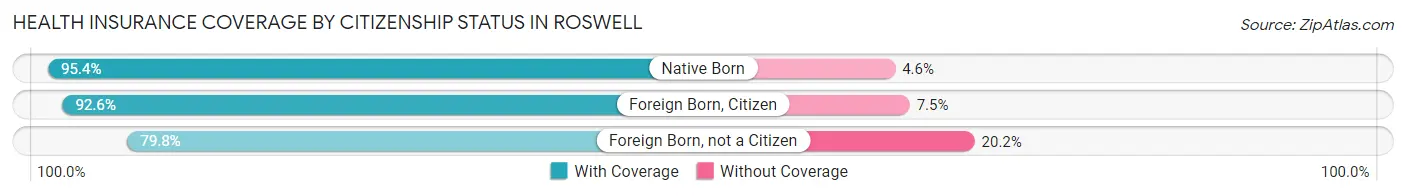
| Citizenship Status | With Coverage | Without Coverage |
| Native Born | 3,758 (95.4%) | 181 (4.6%) |
| Foreign Born, Citizen | 8,590 (92.5%) | 691 (7.4%) |
| Foreign Born, not a Citizen | 3,834 (79.8%) | 971 (20.2%) |
Health Insurance Coverage by Household Income in Roswell
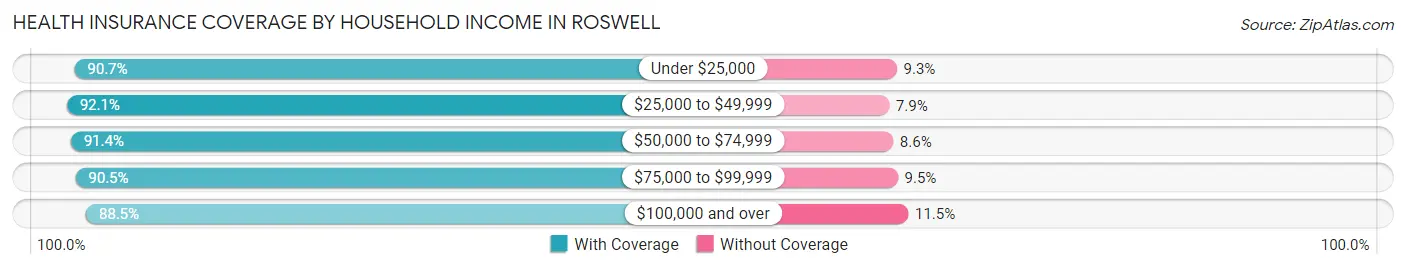
| Household Income | With Coverage | Without Coverage |
| Under $25,000 | 8,726 (90.7%) | 898 (9.3%) |
| $25,000 to $49,999 | 10,214 (92.1%) | 875 (7.9%) |
| $50,000 to $74,999 | 7,725 (91.4%) | 731 (8.6%) |
| $75,000 to $99,999 | 4,991 (90.5%) | 525 (9.5%) |
| $100,000 and over | 10,106 (88.5%) | 1,311 (11.5%) |
Public vs Private Health Insurance Coverage by Age in Roswell
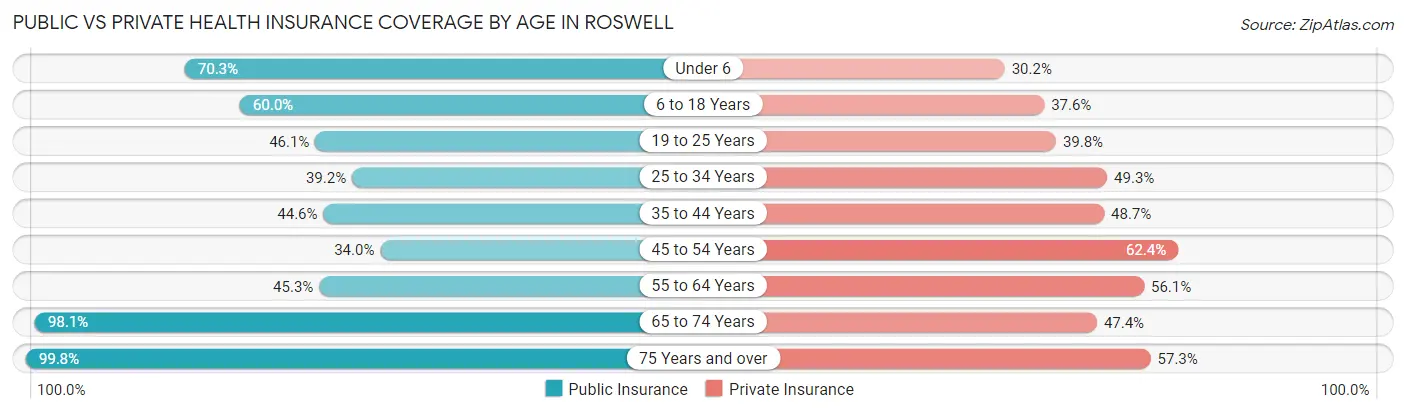
| Age Bracket | Public Insurance | Private Insurance |
| Under 6 | 2,767 (70.3%) | 1,191 (30.2%) |
| 6 to 18 Years | 5,571 (60.0%) | 3,487 (37.6%) |
| 19 to 25 Years | 2,213 (46.1%) | 1,910 (39.8%) |
| 25 to 34 Years | 2,163 (39.2%) | 2,715 (49.2%) |
| 35 to 44 Years | 2,536 (44.6%) | 2,772 (48.7%) |
| 45 to 54 Years | 1,867 (34.0%) | 3,428 (62.4%) |
| 55 to 64 Years | 2,530 (45.3%) | 3,131 (56.1%) |
| 65 to 74 Years | 4,030 (98.1%) | 1,946 (47.4%) |
| 75 Years and over | 2,959 (99.8%) | 1,700 (57.3%) |
| Total | 26,636 (56.2%) | 22,280 (47.0%) |
Disability Status by Sex by Age in Roswell
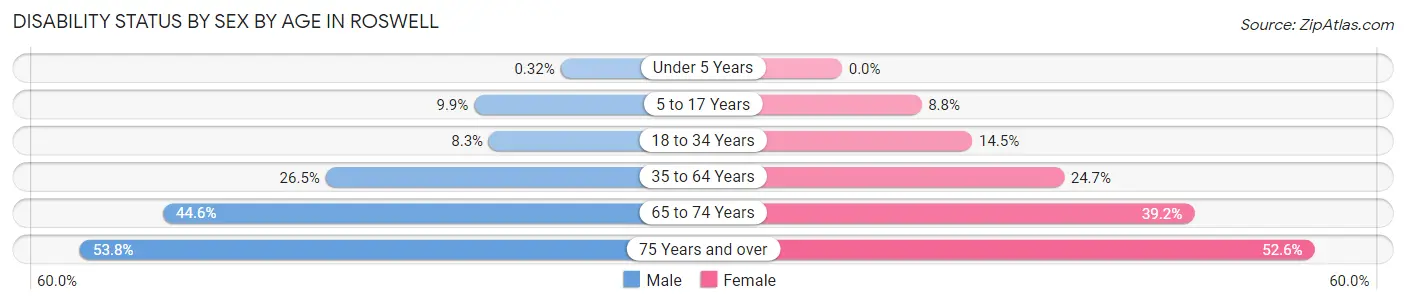
| Age Bracket | Male | Female |
| Under 5 Years | 5 (0.3%) | 0 (0.0%) |
| 5 to 17 Years | 488 (9.9%) | 387 (8.8%) |
| 18 to 34 Years | 486 (8.3%) | 757 (14.5%) |
| 35 to 64 Years | 2,095 (26.5%) | 2,188 (24.7%) |
| 65 to 74 Years | 862 (44.6%) | 853 (39.2%) |
| 75 Years and over | 727 (53.8%) | 850 (52.6%) |
Disability Class by Sex by Age in Roswell
Disability Class: Hearing Difficulty
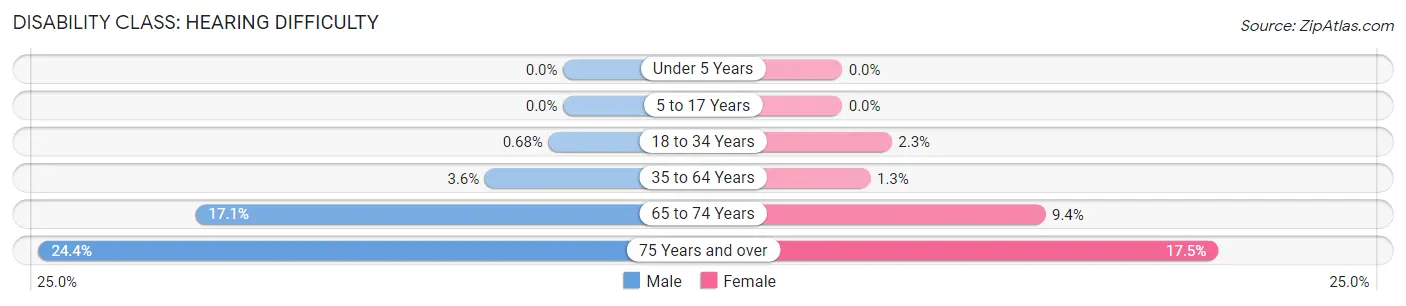
| Age Bracket | Male | Female |
| Under 5 Years | 0 (0.0%) | 0 (0.0%) |
| 5 to 17 Years | 0 (0.0%) | 0 (0.0%) |
| 18 to 34 Years | 40 (0.7%) | 120 (2.3%) |
| 35 to 64 Years | 287 (3.6%) | 116 (1.3%) |
| 65 to 74 Years | 330 (17.1%) | 205 (9.4%) |
| 75 Years and over | 329 (24.3%) | 282 (17.5%) |
Disability Class: Vision Difficulty
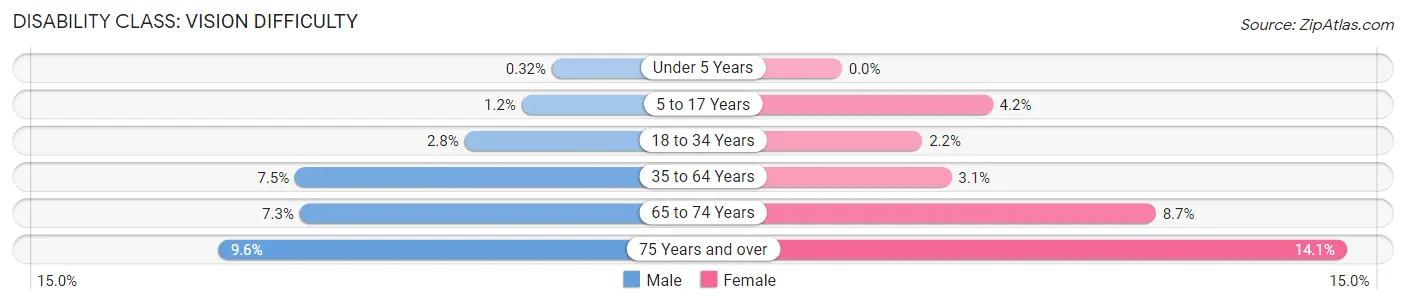
| Age Bracket | Male | Female |
| Under 5 Years | 5 (0.3%) | 0 (0.0%) |
| 5 to 17 Years | 57 (1.2%) | 184 (4.2%) |
| 18 to 34 Years | 161 (2.8%) | 117 (2.2%) |
| 35 to 64 Years | 591 (7.5%) | 270 (3.0%) |
| 65 to 74 Years | 142 (7.3%) | 190 (8.7%) |
| 75 Years and over | 130 (9.6%) | 227 (14.1%) |
Disability Class: Cognitive Difficulty
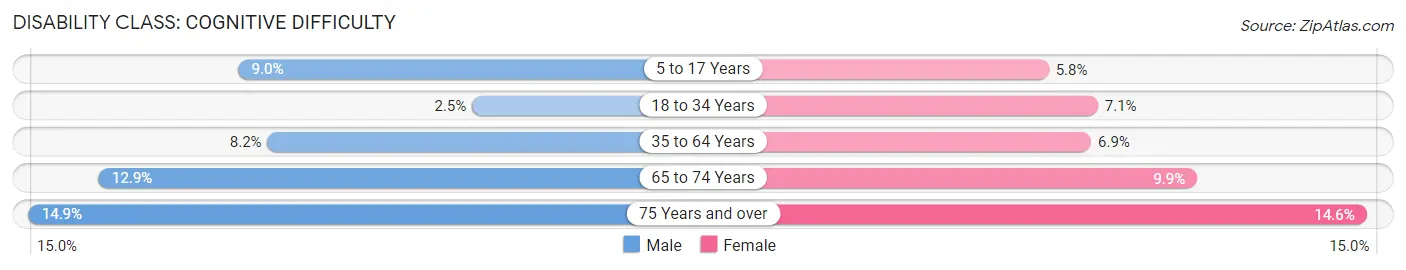
| Age Bracket | Male | Female |
| 5 to 17 Years | 444 (9.0%) | 252 (5.8%) |
| 18 to 34 Years | 149 (2.5%) | 372 (7.1%) |
| 35 to 64 Years | 652 (8.2%) | 614 (6.9%) |
| 65 to 74 Years | 250 (12.9%) | 215 (9.9%) |
| 75 Years and over | 201 (14.9%) | 236 (14.6%) |
Disability Class: Ambulatory Difficulty
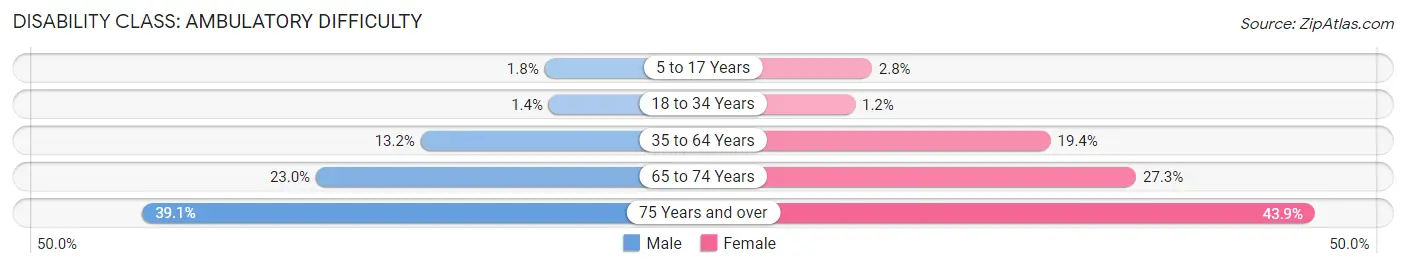
| Age Bracket | Male | Female |
| 5 to 17 Years | 86 (1.8%) | 122 (2.8%) |
| 18 to 34 Years | 79 (1.3%) | 64 (1.2%) |
| 35 to 64 Years | 1,048 (13.2%) | 1,715 (19.4%) |
| 65 to 74 Years | 444 (23.0%) | 594 (27.3%) |
| 75 Years and over | 528 (39.1%) | 709 (43.9%) |
Disability Class: Self-Care Difficulty
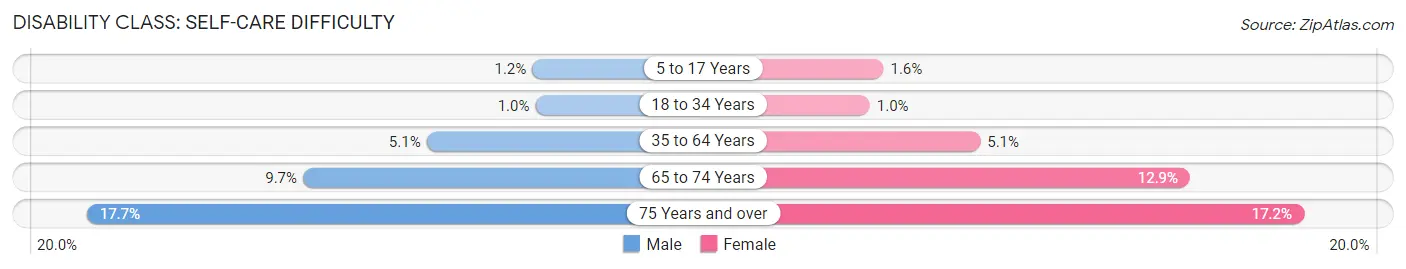
| Age Bracket | Male | Female |
| 5 to 17 Years | 57 (1.2%) | 68 (1.5%) |
| 18 to 34 Years | 61 (1.0%) | 54 (1.0%) |
| 35 to 64 Years | 402 (5.1%) | 455 (5.1%) |
| 65 to 74 Years | 187 (9.7%) | 281 (12.9%) |
| 75 Years and over | 239 (17.7%) | 277 (17.2%) |
Technology Access in Roswell
Computing Device Access in Roswell
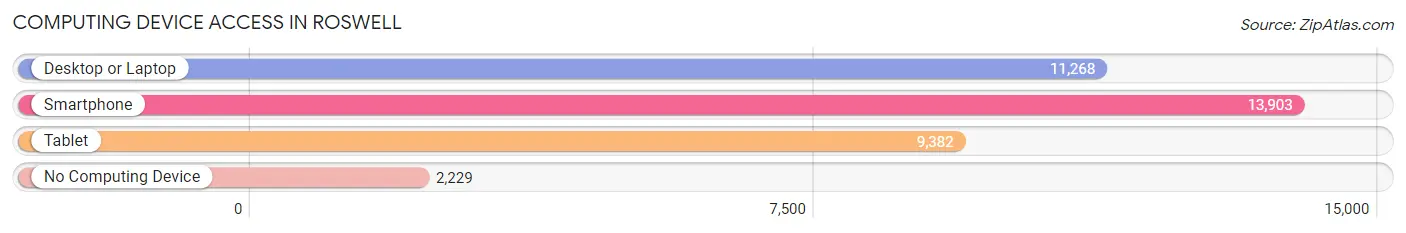
| Device Type | # Households | % Households |
| Desktop or Laptop | 11,268 | 64.6% |
| Smartphone | 13,903 | 79.7% |
| Tablet | 9,382 | 53.8% |
| No Computing Device | 2,229 | 12.8% |
| Total | 17,438 | 100.0% |
Internet Access in Roswell
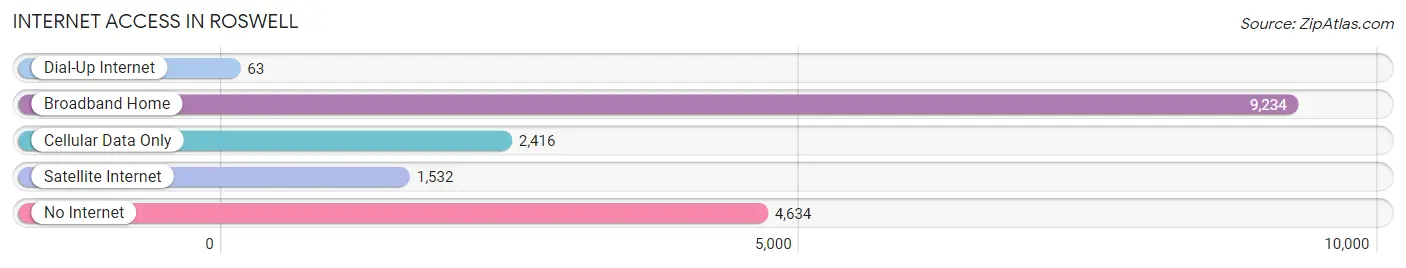
| Internet Type | # Households | % Households |
| Dial-Up Internet | 63 | 0.4% |
| Broadband Home | 9,234 | 52.9% |
| Cellular Data Only | 2,416 | 13.9% |
| Satellite Internet | 1,532 | 8.8% |
| No Internet | 4,634 | 26.6% |
| Total | 17,438 | 100.0% |
Roswell Summary
Roswell, New Mexico is a city located in the southeastern corner of the state, in Chaves County. It is the county seat and the largest city in the county. The city is located near the Pecos River and is the center of a large farming and ranching area. Roswell is known for its UFO history, as it was the site of an alleged UFO crash in 1947.
Geography
Roswell is located in the Chihuahuan Desert, at an elevation of 3,945 feet (1,202 m). The city is located in the Pecos Valley, which is a large alluvial valley that is bordered by the Capitan Mountains to the east and the San Andres Mountains to the west. The city is located near the Pecos River, which is a tributary of the Rio Grande. The climate in Roswell is semi-arid, with hot summers and mild winters.
Economy
The economy of Roswell is largely based on agriculture and ranching. The city is home to a large number of dairy farms, as well as a number of other agricultural operations. The city is also home to a number of manufacturing and industrial operations, including a large number of food processing plants. The city is also home to a number of retail stores, restaurants, and other businesses.
Demographics
As of the 2010 census, the population of Roswell was 48,366. The racial makeup of the city was 75.3% White, 1.2% African American, 1.2% Native American, 0.7% Asian, 0.1% Pacific Islander, 19.2% from other races, and 2.5% from two or more races. Hispanic or Latino of any race were 41.2% of the population.
The median income for a household in Roswell was $30,912, and the median income for a family was $37,845. The per capita income for the city was $17,845. About 17.2% of families and 21.3% of the population were below the poverty line, including 28.2% of those under age 18 and 11.2% of those age 65 or over.
History
The area that is now Roswell was first settled in the late 1800s by ranchers and farmers. The city was founded in 1869 and was named after the nearby Pecos River. The city was incorporated in 1891 and was named the county seat of Chaves County in 1893.
In 1947, Roswell gained international attention when an alleged UFO crash occurred near the city. The incident has been the subject of much speculation and debate, and has become a major part of the city's history.
In the 1950s, Roswell experienced a period of rapid growth, as the city became a center for the oil and gas industry. The city also became a center for the aerospace industry, as the nearby Walker Air Force Base was established in 1951. The base was closed in 1967, but the city continued to grow, as the oil and gas industry remained strong.
Today, Roswell is a thriving city with a diverse economy. The city is home to a number of businesses, including a number of manufacturing and industrial operations, as well as a number of retail stores, restaurants, and other businesses. The city is also home to a number of cultural attractions, including the Roswell Museum and Art Center, the International UFO Museum and Research Center, and the Roswell Convention and Civic Center.
Common Questions
What is Per Capita Income in Roswell?
Per Capita income in Roswell is $25,906.
What is the Median Family Income in Roswell?
Median Family Income in Roswell is $57,490.
What is the Median Household income in Roswell?
Median Household Income in Roswell is $48,298.
What is Income or Wage Gap in Roswell?
Income or Wage Gap in Roswell is 27.1%.
Women in Roswell earn 72.9 cents for every dollar earned by a man.
What is Family Income Deficit in Roswell?
Family Income Deficit in Roswell is $12,223.
Families that are below poverty line in Roswell earn $12,223 less on average than the poverty threshold level.
What is Inequality or Gini Index in Roswell?
Inequality or Gini Index in Roswell is 0.48.
What is the Total Population of Roswell?
Total Population of Roswell is 48,035.
What is the Total Male Population of Roswell?
Total Male Population of Roswell is 23,937.
What is the Total Female Population of Roswell?
Total Female Population of Roswell is 24,098.
What is the Ratio of Males per 100 Females in Roswell?
There are 99.33 Males per 100 Females in Roswell.
What is the Ratio of Females per 100 Males in Roswell?
There are 100.67 Females per 100 Males in Roswell.
What is the Median Population Age in Roswell?
Median Population Age in Roswell is 35.5 Years.
What is the Average Family Size in Roswell
Average Family Size in Roswell is 3.3 People.
What is the Average Household Size in Roswell
Average Household Size in Roswell is 2.6 People.
How Large is the Labor Force in Roswell?
There are 20,749 People in the Labor Forcein in Roswell.
What is the Percentage of People in the Labor Force in Roswell?
56.2% of People are in the Labor Force in Roswell.
What is the Unemployment Rate in Roswell?
Unemployment Rate in Roswell is 5.4%.