Kalispell, MT Map & Demographics
Kalispell Map
Kalispell Overview
$32,570
PER CAPITA INCOME
$78,386
AVG FAMILY INCOME
$57,123
AVG HOUSEHOLD INCOME
27.9%
WAGE / INCOME GAP [ % ]
72.1¢/ $1
WAGE / INCOME GAP [ $ ]
0.44
INEQUALITY / GINI INDEX
25,473
TOTAL POPULATION
12,244
MALE POPULATION
13,229
FEMALE POPULATION
92.55
MALES / 100 FEMALES
108.04
FEMALES / 100 MALES
35.8
MEDIAN AGE
3.2
AVG FAMILY SIZE
2.4
AVG HOUSEHOLD SIZE
13,048
LABOR FORCE [ PEOPLE ]
64.6%
PERCENT IN LABOR FORCE
4.1%
UNEMPLOYMENT RATE
Kalispell Zip Codes
Kalispell Area Codes
Income in Kalispell
Income Overview in Kalispell
Per Capita Income in Kalispell is $32,570, while median incomes of families and households are $78,386 and $57,123 respectively.
| Characteristic | Number | Measure |
| Per Capita Income | 25,473 | $32,570 |
| Median Family Income | 5,837 | $78,386 |
| Mean Family Income | 5,837 | $97,876 |
| Median Household Income | 10,449 | $57,123 |
| Mean Household Income | 10,449 | $75,192 |
| Income Deficit | 5,837 | $0 |
| Wage / Income Gap (%) | 25,473 | 27.90% |
| Wage / Income Gap ($) | 25,473 | 72.10¢ per $1 |
| Gini / Inequality Index | 25,473 | 0.44 |
Earnings by Sex in Kalispell
Average Earnings in Kalispell are $33,520, $39,108 for men and $28,197 for women, a difference of 27.9%.
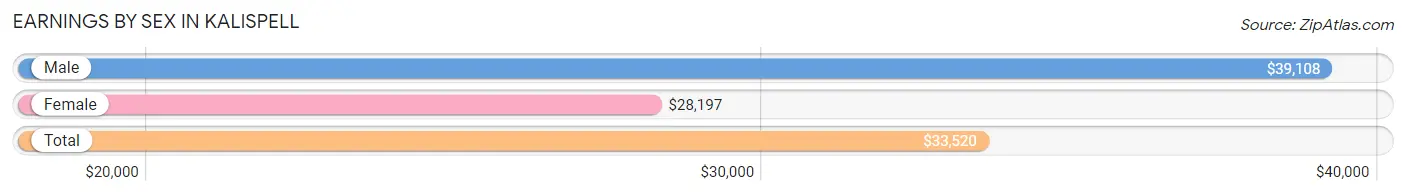
| Sex | Number | Average Earnings |
| Male | 6,968 (49.7%) | $39,108 |
| Female | 7,041 (50.3%) | $28,197 |
| Total | 14,009 (100.0%) | $33,520 |
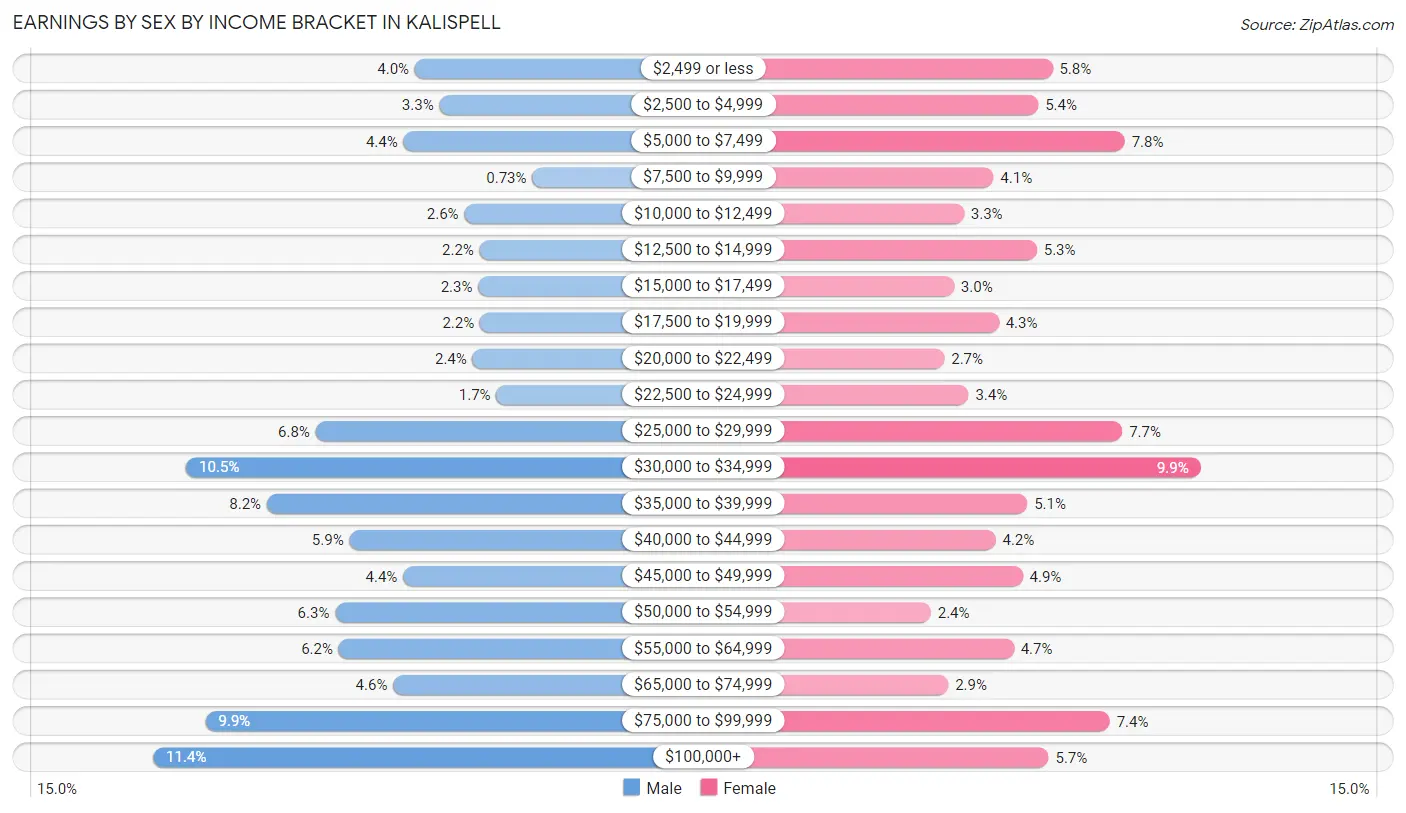
Earnings by Sex by Income Bracket in Kalispell
The most common earnings brackets in Kalispell are $100,000+ for men (794 | 11.4%) and $30,000 to $34,999 for women (700 | 9.9%).
| Income | Male | Female |
| $2,499 or less | 281 (4.0%) | 407 (5.8%) |
| $2,500 to $4,999 | 233 (3.3%) | 379 (5.4%) |
| $5,000 to $7,499 | 303 (4.3%) | 550 (7.8%) |
| $7,500 to $9,999 | 51 (0.7%) | 290 (4.1%) |
| $10,000 to $12,499 | 184 (2.6%) | 232 (3.3%) |
| $12,500 to $14,999 | 154 (2.2%) | 376 (5.3%) |
| $15,000 to $17,499 | 157 (2.2%) | 212 (3.0%) |
| $17,500 to $19,999 | 153 (2.2%) | 301 (4.3%) |
| $20,000 to $22,499 | 168 (2.4%) | 193 (2.7%) |
| $22,500 to $24,999 | 121 (1.7%) | 241 (3.4%) |
| $25,000 to $29,999 | 475 (6.8%) | 545 (7.7%) |
| $30,000 to $34,999 | 729 (10.5%) | 700 (9.9%) |
| $35,000 to $39,999 | 571 (8.2%) | 357 (5.1%) |
| $40,000 to $44,999 | 409 (5.9%) | 294 (4.2%) |
| $45,000 to $49,999 | 304 (4.4%) | 348 (4.9%) |
| $50,000 to $54,999 | 437 (6.3%) | 166 (2.4%) |
| $55,000 to $64,999 | 430 (6.2%) | 330 (4.7%) |
| $65,000 to $74,999 | 323 (4.6%) | 201 (2.9%) |
| $75,000 to $99,999 | 691 (9.9%) | 520 (7.4%) |
| $100,000+ | 794 (11.4%) | 399 (5.7%) |
| Total | 6,968 (100.0%) | 7,041 (100.0%) |
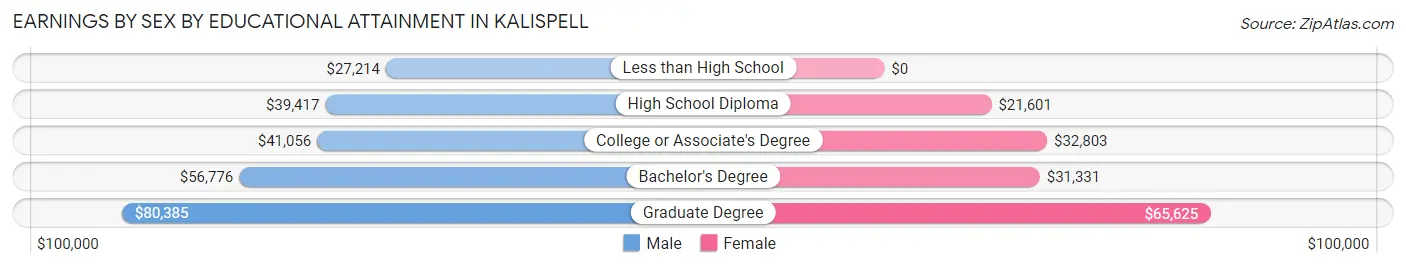
Earnings by Sex by Educational Attainment in Kalispell
Average earnings in Kalispell are $45,955 for men and $31,887 for women, a difference of 30.6%. Men with an educational attainment of graduate degree enjoy the highest average annual earnings of $80,385, while those with less than high school education earn the least with $27,214. Women with an educational attainment of graduate degree earn the most with the average annual earnings of $65,625, while those with high school diploma education have the smallest earnings of $21,601.
| Educational Attainment | Male Income | Female Income |
| Less than High School | $27,214 | $0 |
| High School Diploma | $39,417 | $21,601 |
| College or Associate's Degree | $41,056 | $32,803 |
| Bachelor's Degree | $56,776 | $31,331 |
| Graduate Degree | $80,385 | $65,625 |
| Total | $45,955 | $31,887 |
Family Income in Kalispell
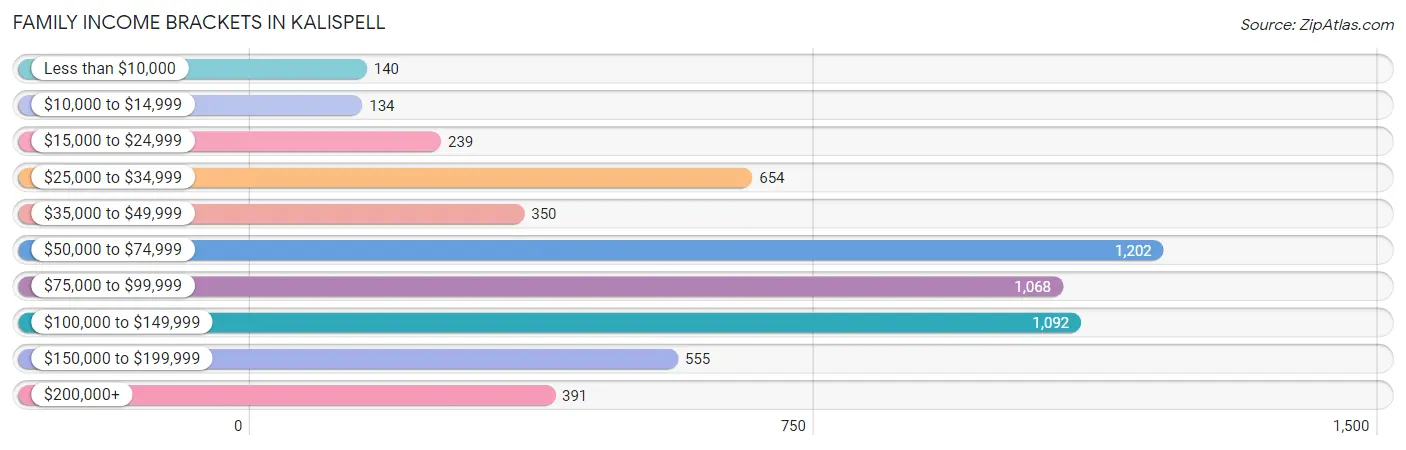
Family Income Brackets in Kalispell
According to the Kalispell family income data, there are 1,202 families falling into the $50,000 to $74,999 income range, which is the most common income bracket and makes up 20.6% of all families. Conversely, the $10,000 to $14,999 income bracket is the least frequent group with only 134 families (2.3%) belonging to this category.
| Income Bracket | # Families | % Families |
| Less than $10,000 | 140 | 2.4% |
| $10,000 to $14,999 | 134 | 2.3% |
| $15,000 to $24,999 | 239 | 4.1% |
| $25,000 to $34,999 | 654 | 11.2% |
| $35,000 to $49,999 | 350 | 6.0% |
| $50,000 to $74,999 | 1,202 | 20.6% |
| $75,000 to $99,999 | 1,068 | 18.3% |
| $100,000 to $149,999 | 1,092 | 18.7% |
| $150,000 to $199,999 | 555 | 9.5% |
| $200,000+ | 391 | 6.7% |
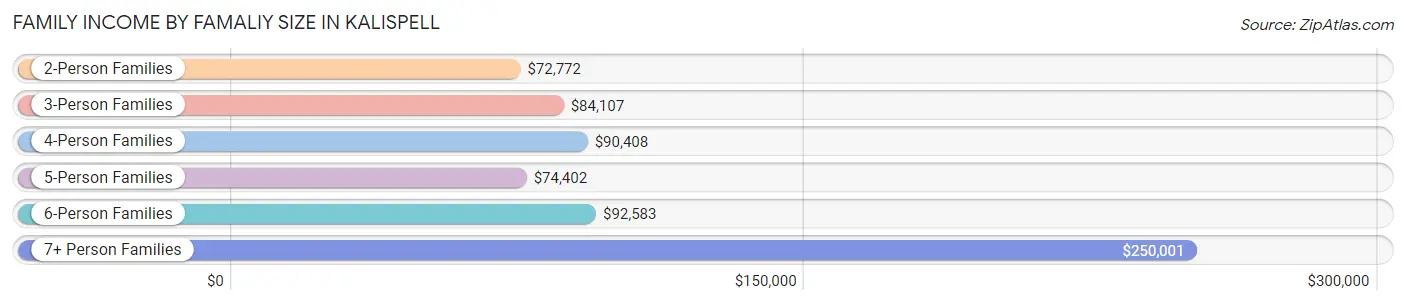
Family Income by Famaliy Size in Kalispell
7+ person families (97 | 1.7%) account for the highest median family income in Kalispell with $250,001 per family, while 2-person families (2,867 | 49.1%) have the highest median income of $36,386 per family member.
| Income Bracket | # Families | Median Income |
| 2-Person Families | 2,867 (49.1%) | $72,772 |
| 3-Person Families | 1,555 (26.6%) | $84,107 |
| 4-Person Families | 881 (15.1%) | $90,408 |
| 5-Person Families | 294 (5.0%) | $74,402 |
| 6-Person Families | 143 (2.5%) | $92,583 |
| 7+ Person Families | 97 (1.7%) | $250,001 |
| Total | 5,837 (100.0%) | $78,386 |
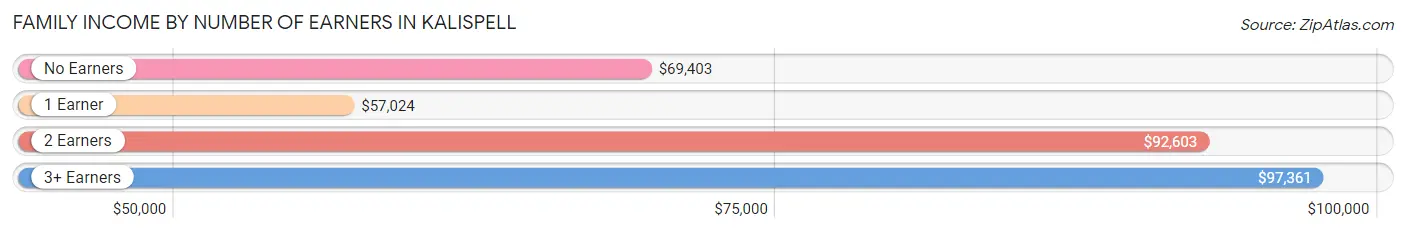
Family Income by Number of Earners in Kalispell
The median family income in Kalispell is $78,386, with families comprising 3+ earners (712) having the highest median family income of $97,361, while families with 1 earner (1,768) have the lowest median family income of $57,024, accounting for 12.2% and 30.3% of families, respectively.
| Number of Earners | # Families | Median Income |
| No Earners | 798 (13.7%) | $69,403 |
| 1 Earner | 1,768 (30.3%) | $57,024 |
| 2 Earners | 2,559 (43.8%) | $92,603 |
| 3+ Earners | 712 (12.2%) | $97,361 |
| Total | 5,837 (100.0%) | $78,386 |
Household Income in Kalispell
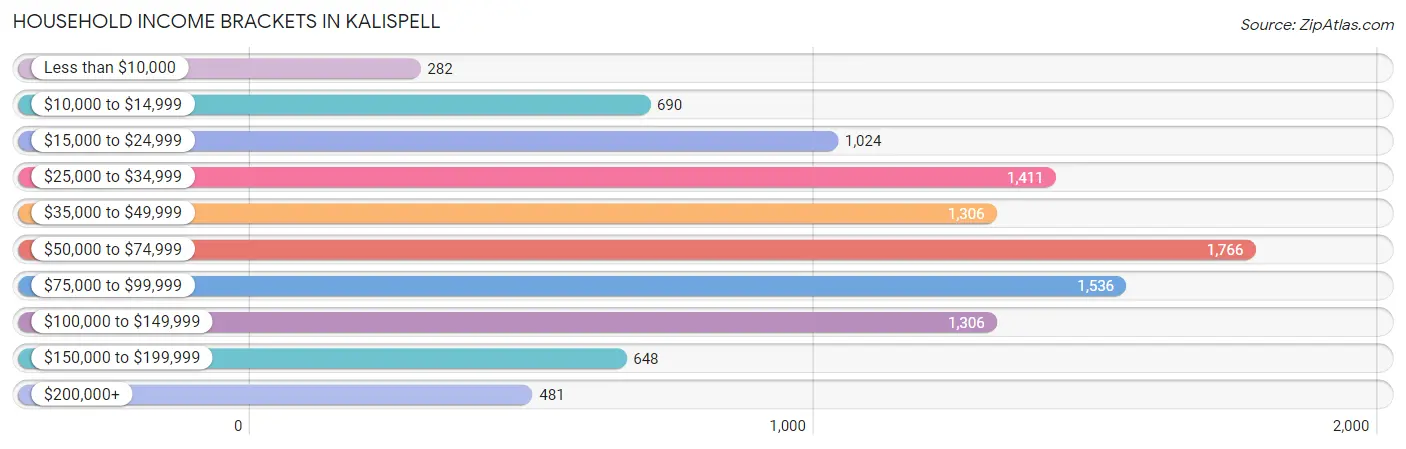
Household Income Brackets in Kalispell
With 1,766 households falling in the category, the $50,000 to $74,999 income range is the most frequent in Kalispell, accounting for 16.9% of all households. In contrast, only 282 households (2.7%) fall into the less than $10,000 income bracket, making it the least populous group.
| Income Bracket | # Households | % Households |
| Less than $10,000 | 282 | 2.7% |
| $10,000 to $14,999 | 690 | 6.6% |
| $15,000 to $24,999 | 1,024 | 9.8% |
| $25,000 to $34,999 | 1,411 | 13.5% |
| $35,000 to $49,999 | 1,306 | 12.5% |
| $50,000 to $74,999 | 1,766 | 16.9% |
| $75,000 to $99,999 | 1,536 | 14.7% |
| $100,000 to $149,999 | 1,306 | 12.5% |
| $150,000 to $199,999 | 648 | 6.2% |
| $200,000+ | 481 | 4.6% |
Household Income by Householder Age in Kalispell
The median household income in Kalispell is $57,123, with the highest median household income of $70,048 found in the 45 to 64 years age bracket for the primary householder. A total of 3,105 households (29.7%) fall into this category. Meanwhile, the 65+ years age bracket for the primary householder has the lowest median household income of $39,065, with 3,077 households (29.4%) in this group.
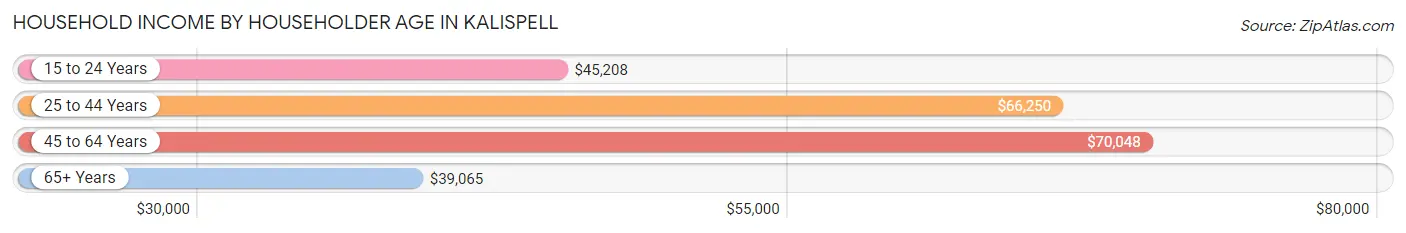
| Income Bracket | # Households | Median Income |
| 15 to 24 Years | 494 (4.7%) | $45,208 |
| 25 to 44 Years | 3,773 (36.1%) | $66,250 |
| 45 to 64 Years | 3,105 (29.7%) | $70,048 |
| 65+ Years | 3,077 (29.4%) | $39,065 |
| Total | 10,449 (100.0%) | $57,123 |
Poverty in Kalispell
Income Below Poverty by Sex and Age in Kalispell
With 8.8% poverty level for males and 11.8% for females among the residents of Kalispell, 18 to 24 year old males and 18 to 24 year old females are the most vulnerable to poverty, with 187 males (16.1%) and 275 females (23.4%) in their respective age groups living below the poverty level.
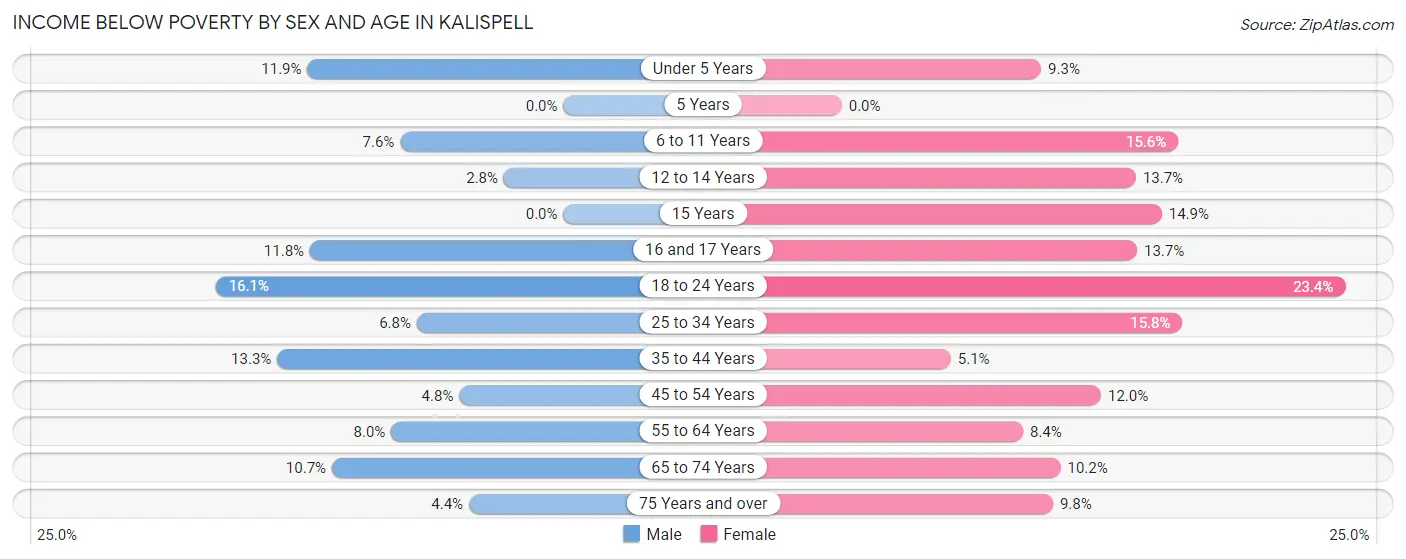
| Age Bracket | Male | Female |
| Under 5 Years | 96 (11.9%) | 107 (9.2%) |
| 5 Years | 0 (0.0%) | 0 (0.0%) |
| 6 to 11 Years | 82 (7.6%) | 90 (15.6%) |
| 12 to 14 Years | 12 (2.8%) | 70 (13.7%) |
| 15 Years | 0 (0.0%) | 15 (14.8%) |
| 16 and 17 Years | 34 (11.8%) | 63 (13.7%) |
| 18 to 24 Years | 187 (16.1%) | 275 (23.4%) |
| 25 to 34 Years | 141 (6.8%) | 307 (15.8%) |
| 35 to 44 Years | 218 (13.3%) | 83 (5.1%) |
| 45 to 54 Years | 65 (4.8%) | 149 (12.0%) |
| 55 to 64 Years | 88 (8.0%) | 125 (8.4%) |
| 65 to 74 Years | 102 (10.7%) | 126 (10.2%) |
| 75 Years and over | 34 (4.4%) | 128 (9.8%) |
| Total | 1,059 (8.8%) | 1,538 (11.8%) |
Income Above Poverty by Sex and Age in Kalispell
According to the poverty statistics in Kalispell, males aged 5 years and females aged 5 years are the age groups that are most secure financially, with 100.0% of males and 100.0% of females in these age groups living above the poverty line.
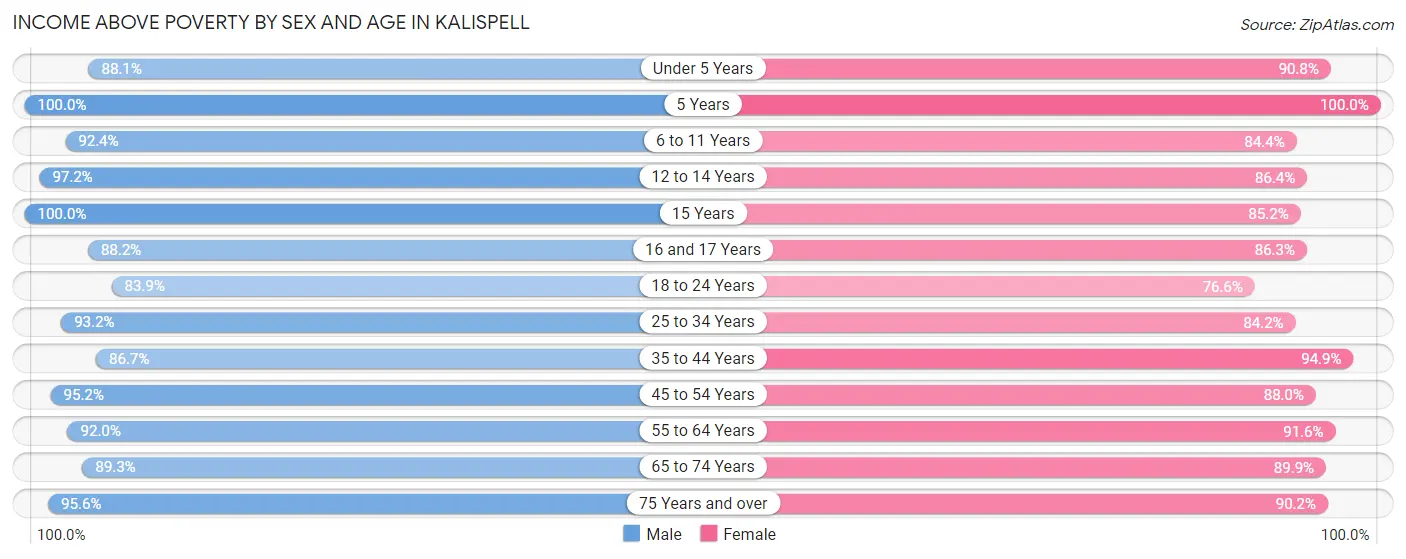
| Age Bracket | Male | Female |
| Under 5 Years | 712 (88.1%) | 1,050 (90.7%) |
| 5 Years | 227 (100.0%) | 165 (100.0%) |
| 6 to 11 Years | 1,001 (92.4%) | 487 (84.4%) |
| 12 to 14 Years | 422 (97.2%) | 443 (86.4%) |
| 15 Years | 145 (100.0%) | 86 (85.2%) |
| 16 and 17 Years | 255 (88.2%) | 397 (86.3%) |
| 18 to 24 Years | 972 (83.9%) | 902 (76.6%) |
| 25 to 34 Years | 1,933 (93.2%) | 1,636 (84.2%) |
| 35 to 44 Years | 1,423 (86.7%) | 1,556 (94.9%) |
| 45 to 54 Years | 1,280 (95.2%) | 1,090 (88.0%) |
| 55 to 64 Years | 1,013 (92.0%) | 1,362 (91.6%) |
| 65 to 74 Years | 848 (89.3%) | 1,115 (89.8%) |
| 75 Years and over | 743 (95.6%) | 1,178 (90.2%) |
| Total | 10,974 (91.2%) | 11,467 (88.2%) |
Income Below Poverty Among Married-Couple Families in Kalispell
The poverty statistics for married-couple families in Kalispell show that 2.3% or 91 of the total 3,970 families live below the poverty line. Families with 3 or 4 children have the highest poverty rate of 9.1%, comprising of 31 families. On the other hand, families with 5 or more children have the lowest poverty rate of 0.0%, which includes 0 families.
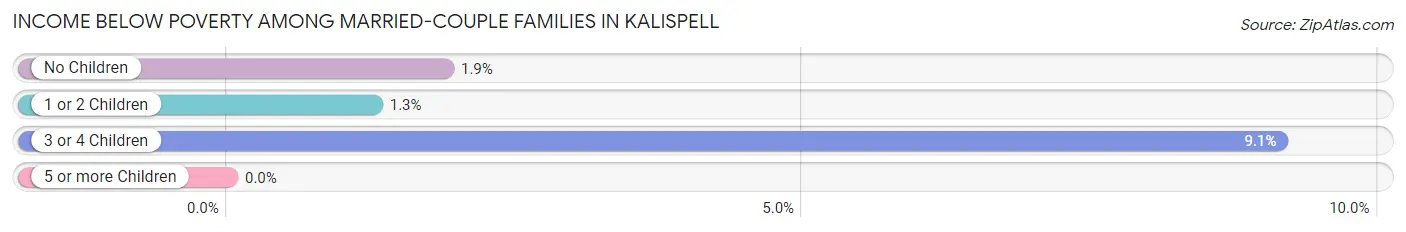
| Children | Above Poverty | Below Poverty |
| No Children | 2,396 (98.1%) | 46 (1.9%) |
| 1 or 2 Children | 1,097 (98.7%) | 14 (1.3%) |
| 3 or 4 Children | 308 (90.9%) | 31 (9.1%) |
| 5 or more Children | 78 (100.0%) | 0 (0.0%) |
| Total | 3,879 (97.7%) | 91 (2.3%) |
Income Below Poverty Among Single-Parent Households in Kalispell
According to the poverty data in Kalispell, 6.6% or 49 single-father households and 17.8% or 199 single-mother households are living below the poverty line. Among single-father households, those with 1 or 2 children have the highest poverty rate, with 49 households (8.2%) experiencing poverty. Likewise, among single-mother households, those with 1 or 2 children have the highest poverty rate, with 145 households (22.4%) falling below the poverty line.
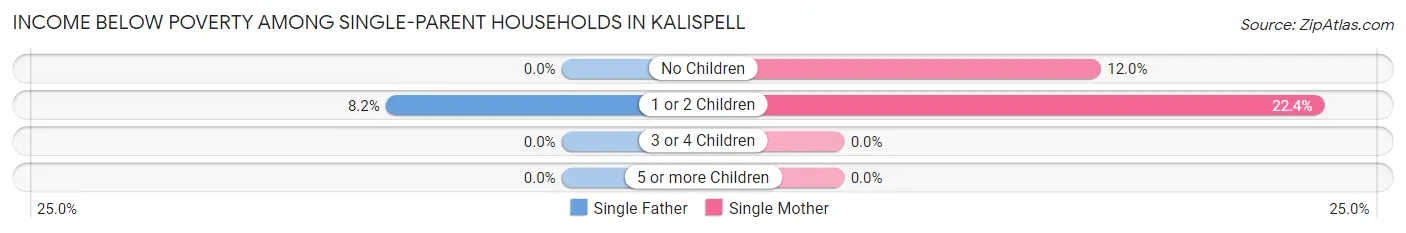
| Children | Single Father | Single Mother |
| No Children | 0 (0.0%) | 54 (11.9%) |
| 1 or 2 Children | 49 (8.2%) | 145 (22.4%) |
| 3 or 4 Children | 0 (0.0%) | 0 (0.0%) |
| 5 or more Children | 0 (0.0%) | 0 (0.0%) |
| Total | 49 (6.6%) | 199 (17.8%) |
Income Below Poverty Among Married-Couple vs Single-Parent Households in Kalispell
The poverty data for Kalispell shows that 91 of the married-couple family households (2.3%) and 248 of the single-parent households (13.3%) are living below the poverty level. Within the married-couple family households, those with 3 or 4 children have the highest poverty rate, with 31 households (9.1%) falling below the poverty line. Among the single-parent households, those with 1 or 2 children have the highest poverty rate, with 194 household (15.6%) living below poverty.
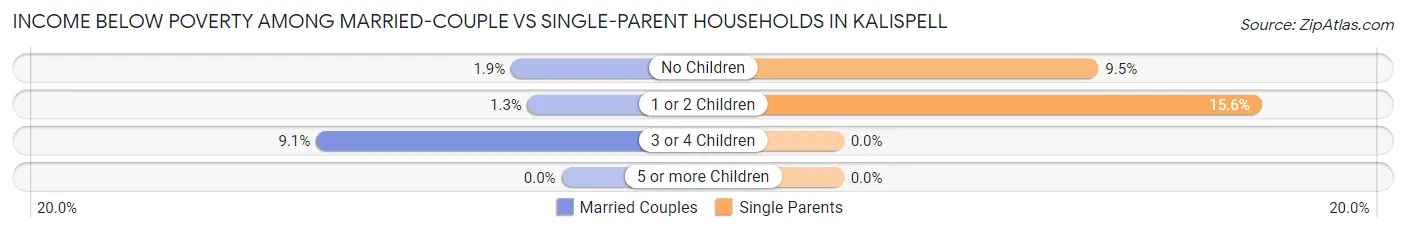
| Children | Married-Couple Families | Single-Parent Households |
| No Children | 46 (1.9%) | 54 (9.5%) |
| 1 or 2 Children | 14 (1.3%) | 194 (15.6%) |
| 3 or 4 Children | 31 (9.1%) | 0 (0.0%) |
| 5 or more Children | 0 (0.0%) | 0 (0.0%) |
| Total | 91 (2.3%) | 248 (13.3%) |
Race in Kalispell
The most populous races in Kalispell are White / Caucasian (23,019 | 90.4%), Two or more Races (1,409 | 5.5%), and Hispanic or Latino (1,044 | 4.1%).
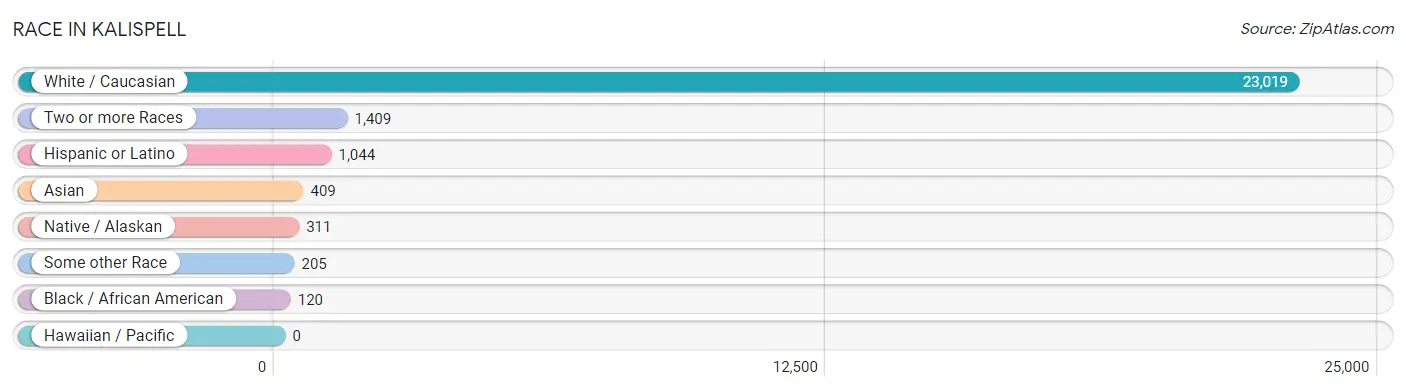
| Race | # Population | % Population |
| Asian | 409 | 1.6% |
| Black / African American | 120 | 0.5% |
| Hawaiian / Pacific | 0 | 0.0% |
| Hispanic or Latino | 1,044 | 4.1% |
| Native / Alaskan | 311 | 1.2% |
| White / Caucasian | 23,019 | 90.4% |
| Two or more Races | 1,409 | 5.5% |
| Some other Race | 205 | 0.8% |
| Total | 25,473 | 100.0% |
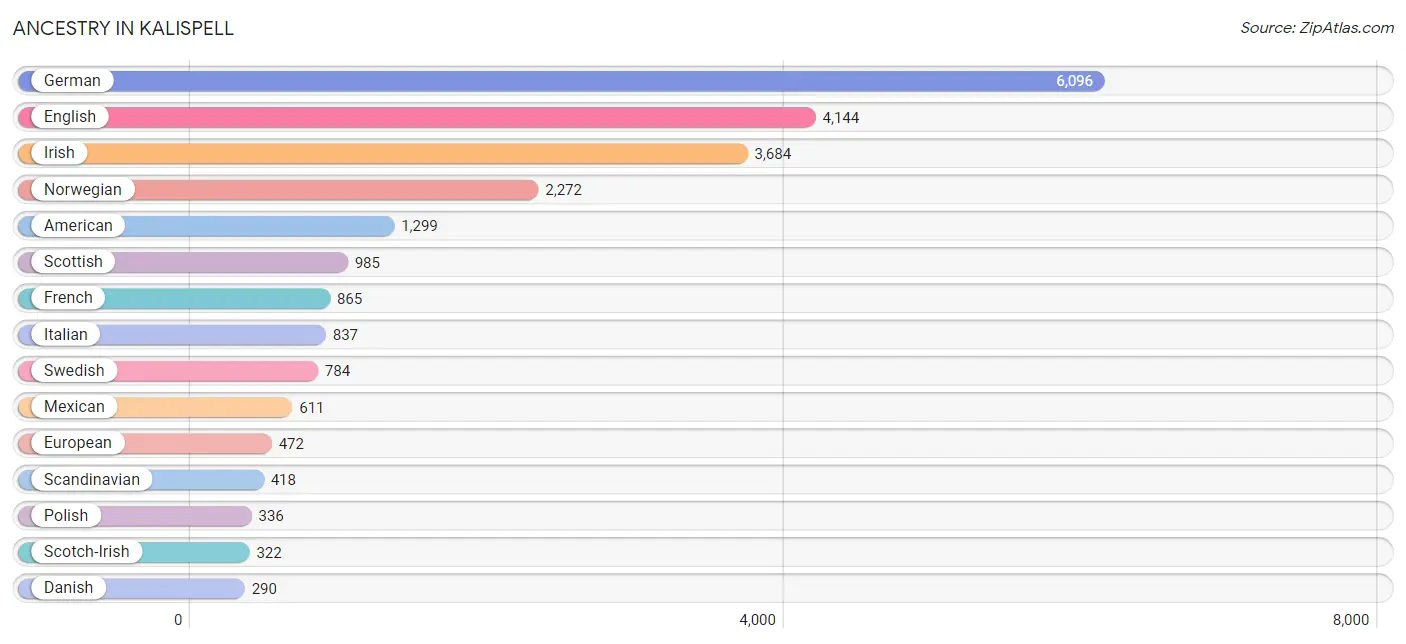
Ancestry in Kalispell
The most populous ancestries reported in Kalispell are German (6,096 | 23.9%), English (4,144 | 16.3%), Irish (3,684 | 14.5%), Norwegian (2,272 | 8.9%), and American (1,299 | 5.1%), together accounting for 68.7% of all Kalispell residents.
| Ancestry | # Population | % Population |
| Alaska Native | 34 | 0.1% |
| American | 1,299 | 5.1% |
| Arab | 152 | 0.6% |
| Australian | 44 | 0.2% |
| Austrian | 68 | 0.3% |
| Belgian | 68 | 0.3% |
| Bhutanese | 75 | 0.3% |
| Blackfeet | 98 | 0.4% |
| British | 263 | 1.0% |
| Burmese | 93 | 0.4% |
| Canadian | 65 | 0.3% |
| Central American | 113 | 0.4% |
| Cherokee | 13 | 0.1% |
| Chippewa | 184 | 0.7% |
| Croatian | 147 | 0.6% |
| Cuban | 38 | 0.2% |
| Czech | 88 | 0.4% |
| Danish | 290 | 1.1% |
| Dominican | 6 | 0.0% |
| Dutch | 247 | 1.0% |
| Dutch West Indian | 24 | 0.1% |
| Eastern European | 11 | 0.0% |
| Egyptian | 141 | 0.5% |
| English | 4,144 | 16.3% |
| European | 472 | 1.8% |
| Filipino | 29 | 0.1% |
| Finnish | 183 | 0.7% |
| French | 865 | 3.4% |
| French American Indian | 17 | 0.1% |
| French Canadian | 132 | 0.5% |
| German | 6,096 | 23.9% |
| Greek | 10 | 0.0% |
| Guatemalan | 52 | 0.2% |
| Hungarian | 151 | 0.6% |
| Indian (Asian) | 232 | 0.9% |
| Iranian | 10 | 0.0% |
| Irish | 3,684 | 14.5% |
| Italian | 837 | 3.3% |
| Jamaican | 1 | 0.0% |
| Korean | 250 | 1.0% |
| Lebanese | 11 | 0.0% |
| Maltese | 11 | 0.0% |
| Mexican | 611 | 2.4% |
| Native Hawaiian | 14 | 0.1% |
| Nigerian | 12 | 0.1% |
| Northern European | 47 | 0.2% |
| Norwegian | 2,272 | 8.9% |
| Panamanian | 61 | 0.2% |
| Peruvian | 20 | 0.1% |
| Polish | 336 | 1.3% |
| Portuguese | 11 | 0.0% |
| Russian | 214 | 0.8% |
| Scandinavian | 418 | 1.6% |
| Scotch-Irish | 322 | 1.3% |
| Scottish | 985 | 3.9% |
| Serbian | 28 | 0.1% |
| Sioux | 68 | 0.3% |
| Slavic | 42 | 0.2% |
| Slovak | 19 | 0.1% |
| South American | 20 | 0.1% |
| Spaniard | 122 | 0.5% |
| Spanish | 77 | 0.3% |
| Sri Lankan | 57 | 0.2% |
| Subsaharan African | 12 | 0.1% |
| Swedish | 784 | 3.1% |
| Swiss | 8 | 0.0% |
| Thai | 70 | 0.3% |
| Ukrainian | 66 | 0.3% |
| Welsh | 150 | 0.6% | View All 69 Rows |
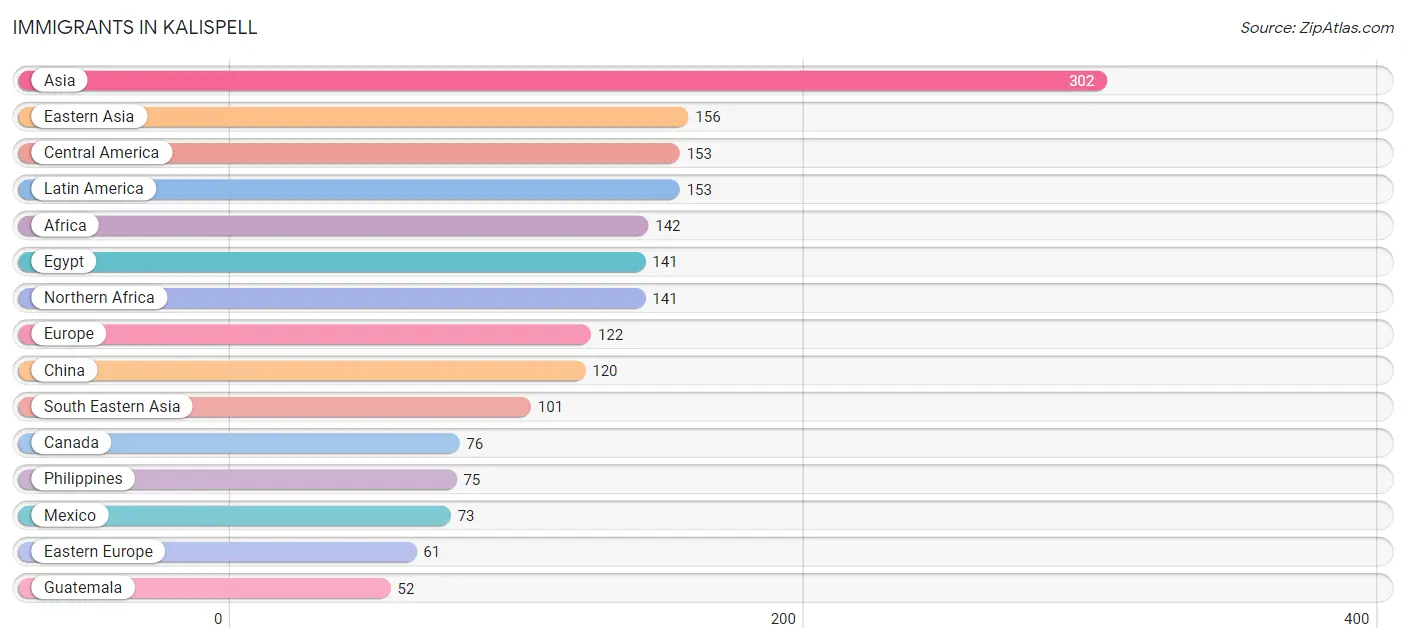
Immigrants in Kalispell
The most numerous immigrant groups reported in Kalispell came from Asia (302 | 1.2%), Eastern Asia (156 | 0.6%), Central America (153 | 0.6%), Latin America (153 | 0.6%), and Africa (142 | 0.6%), together accounting for 3.6% of all Kalispell residents.
| Immigration Origin | # Population | % Population |
| Africa | 142 | 0.6% |
| Asia | 302 | 1.2% |
| Australia | 32 | 0.1% |
| Canada | 76 | 0.3% |
| Central America | 153 | 0.6% |
| China | 120 | 0.5% |
| Eastern Africa | 1 | 0.0% |
| Eastern Asia | 156 | 0.6% |
| Eastern Europe | 61 | 0.2% |
| Egypt | 141 | 0.5% |
| England | 12 | 0.1% |
| Europe | 122 | 0.5% |
| Germany | 39 | 0.2% |
| Guatemala | 52 | 0.2% |
| Hungary | 20 | 0.1% |
| India | 45 | 0.2% |
| Japan | 21 | 0.1% |
| Korea | 15 | 0.1% |
| Latin America | 153 | 0.6% |
| Mexico | 73 | 0.3% |
| Northern Africa | 141 | 0.5% |
| Northern Europe | 22 | 0.1% |
| Oceania | 32 | 0.1% |
| Panama | 28 | 0.1% |
| Philippines | 75 | 0.3% |
| Poland | 5 | 0.0% |
| Russia | 12 | 0.1% |
| Scotland | 10 | 0.0% |
| South Central Asia | 45 | 0.2% |
| South Eastern Asia | 101 | 0.4% |
| Taiwan | 29 | 0.1% |
| Ukraine | 24 | 0.1% |
| Vietnam | 26 | 0.1% |
| Western Europe | 39 | 0.2% | View All 34 Rows |
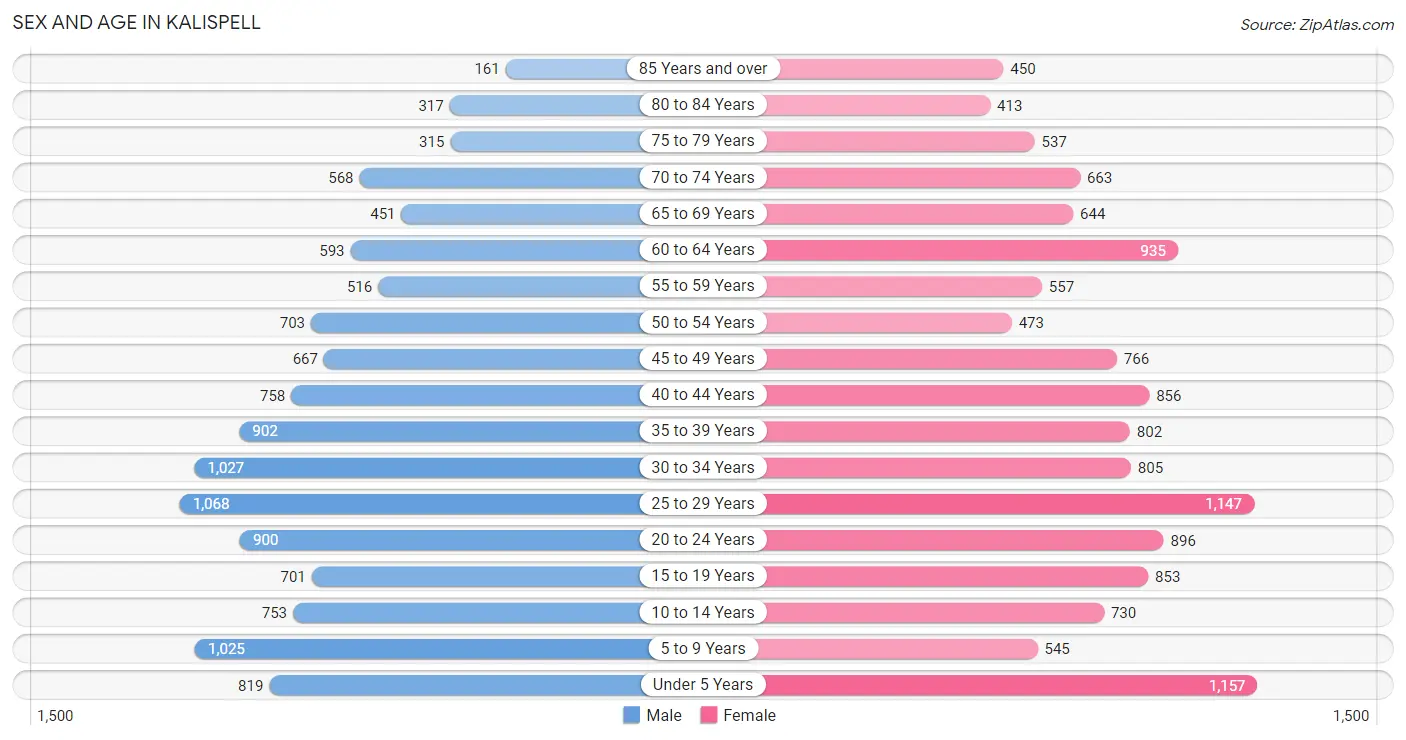
Sex and Age in Kalispell
Sex and Age in Kalispell
The most populous age groups in Kalispell are 25 to 29 Years (1,068 | 8.7%) for men and Under 5 Years (1,157 | 8.7%) for women.
| Age Bracket | Male | Female |
| Under 5 Years | 819 (6.7%) | 1,157 (8.7%) |
| 5 to 9 Years | 1,025 (8.4%) | 545 (4.1%) |
| 10 to 14 Years | 753 (6.1%) | 730 (5.5%) |
| 15 to 19 Years | 701 (5.7%) | 853 (6.5%) |
| 20 to 24 Years | 900 (7.3%) | 896 (6.8%) |
| 25 to 29 Years | 1,068 (8.7%) | 1,147 (8.7%) |
| 30 to 34 Years | 1,027 (8.4%) | 805 (6.1%) |
| 35 to 39 Years | 902 (7.4%) | 802 (6.1%) |
| 40 to 44 Years | 758 (6.2%) | 856 (6.5%) |
| 45 to 49 Years | 667 (5.4%) | 766 (5.8%) |
| 50 to 54 Years | 703 (5.7%) | 473 (3.6%) |
| 55 to 59 Years | 516 (4.2%) | 557 (4.2%) |
| 60 to 64 Years | 593 (4.8%) | 935 (7.1%) |
| 65 to 69 Years | 451 (3.7%) | 644 (4.9%) |
| 70 to 74 Years | 568 (4.6%) | 663 (5.0%) |
| 75 to 79 Years | 315 (2.6%) | 537 (4.1%) |
| 80 to 84 Years | 317 (2.6%) | 413 (3.1%) |
| 85 Years and over | 161 (1.3%) | 450 (3.4%) |
| Total | 12,244 (100.0%) | 13,229 (100.0%) |
Families and Households in Kalispell
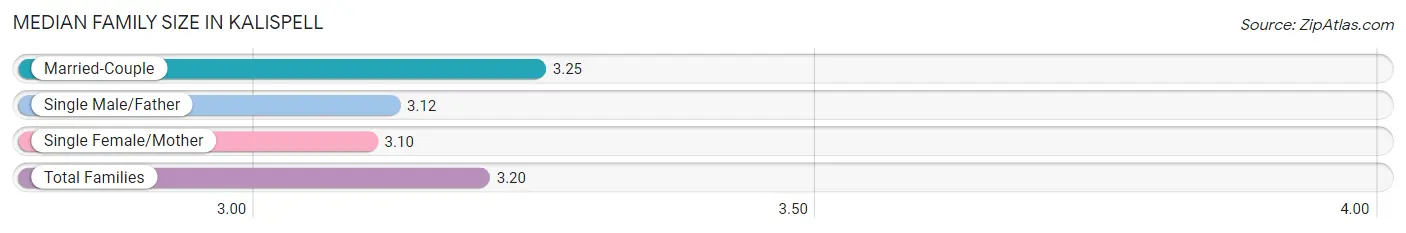
Median Family Size in Kalispell
The median family size in Kalispell is 3.20 persons per family, with married-couple families (3,970 | 68.0%) accounting for the largest median family size of 3.25 persons per family. On the other hand, single female/mother families (1,120 | 19.2%) represent the smallest median family size with 3.10 persons per family.
| Family Type | # Families | Family Size |
| Married-Couple | 3,970 (68.0%) | 3.25 |
| Single Male/Father | 747 (12.8%) | 3.12 |
| Single Female/Mother | 1,120 (19.2%) | 3.10 |
| Total Families | 5,837 (100.0%) | 3.20 |
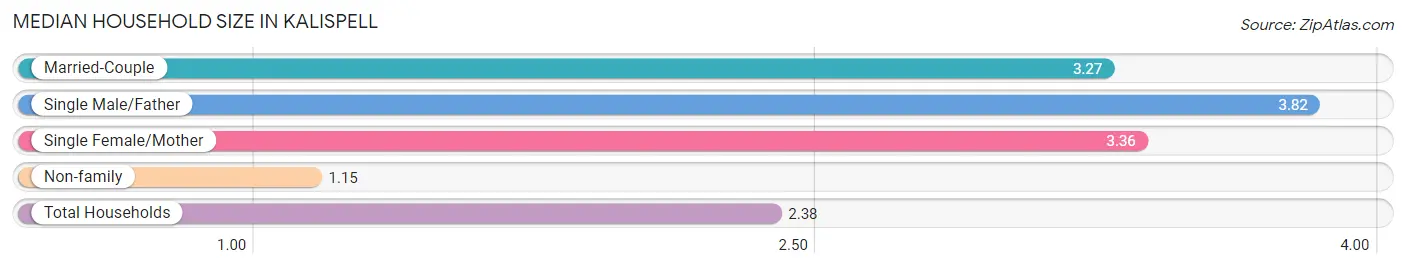
Median Household Size in Kalispell
The median household size in Kalispell is 2.38 persons per household, with single male/father households (747 | 7.1%) accounting for the largest median household size of 3.82 persons per household. non-family households (4,612 | 44.1%) represent the smallest median household size with 1.15 persons per household.
| Household Type | # Households | Household Size |
| Married-Couple | 3,970 (38.0%) | 3.27 |
| Single Male/Father | 747 (7.1%) | 3.82 |
| Single Female/Mother | 1,120 (10.7%) | 3.36 |
| Non-family | 4,612 (44.1%) | 1.15 |
| Total Households | 10,449 (100.0%) | 2.38 |
Household Size by Marriage Status in Kalispell
Out of a total of 10,449 households in Kalispell, 5,837 (55.9%) are family households, while 4,612 (44.1%) are nonfamily households. The most numerous type of family households are 2-person households, comprising 2,607, and the most common type of nonfamily households are 1-person households, comprising 3,988.
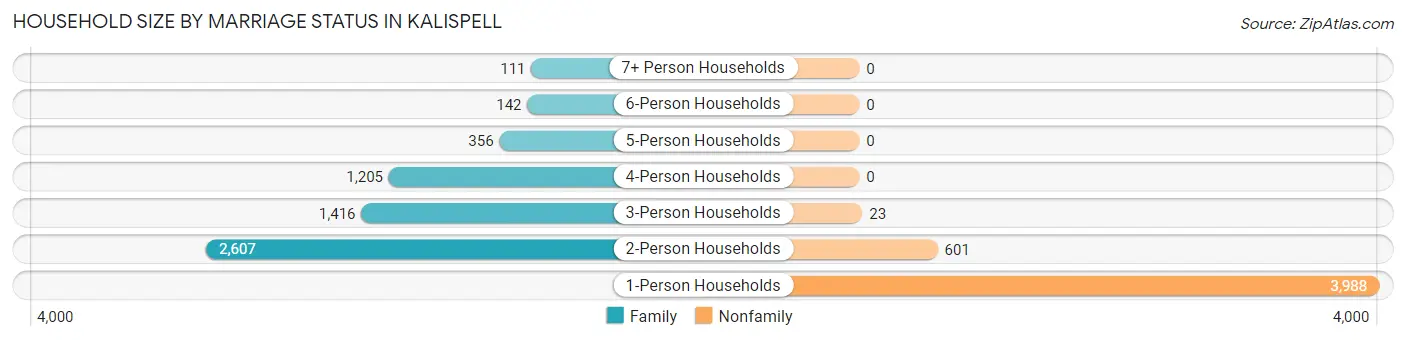
| Household Size | Family Households | Nonfamily Households |
| 1-Person Households | - | 3,988 (38.2%) |
| 2-Person Households | 2,607 (24.9%) | 601 (5.8%) |
| 3-Person Households | 1,416 (13.6%) | 23 (0.2%) |
| 4-Person Households | 1,205 (11.5%) | 0 (0.0%) |
| 5-Person Households | 356 (3.4%) | 0 (0.0%) |
| 6-Person Households | 142 (1.4%) | 0 (0.0%) |
| 7+ Person Households | 111 (1.1%) | 0 (0.0%) |
| Total | 5,837 (55.9%) | 4,612 (44.1%) |
Female Fertility in Kalispell
Fertility by Age in Kalispell
Average fertility rate in Kalispell is 55.0 births per 1,000 women. Women in the age bracket of 20 to 34 years have the highest fertility rate with 106.0 births per 1,000 women. Women in the age bracket of 20 to 34 years acount for 87.3% of all women with births.
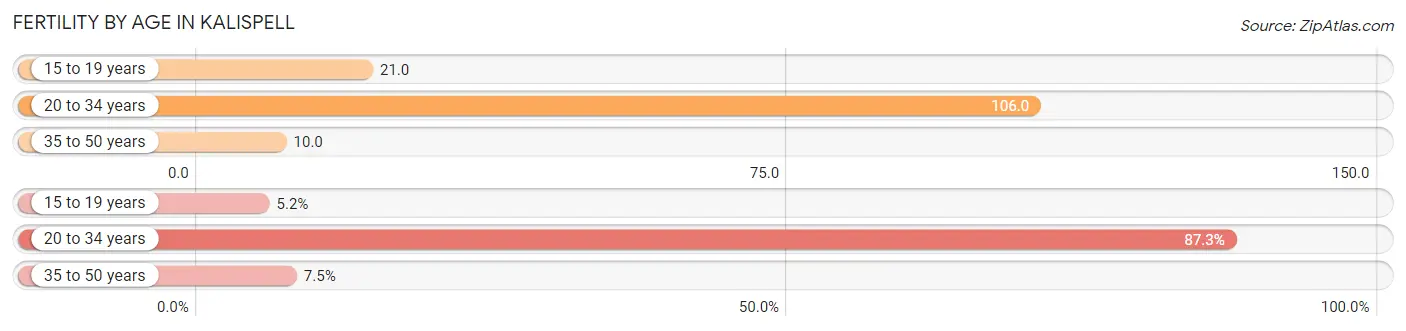
| Age Bracket | Women with Births | Births / 1,000 Women |
| 15 to 19 years | 18 (5.2%) | 21.0 |
| 20 to 34 years | 301 (87.3%) | 106.0 |
| 35 to 50 years | 26 (7.5%) | 10.0 |
| Total | 345 (100.0%) | 55.0 |
Fertility by Age by Marriage Status in Kalispell
73.9% of women with births (345) in Kalispell are married. The highest percentage of unmarried women with births falls into 20 to 34 years age bracket with 28.6% of them unmarried at the time of birth, while the lowest percentage of unmarried women with births belong to 35 to 50 years age bracket with 0.0% of them unmarried.
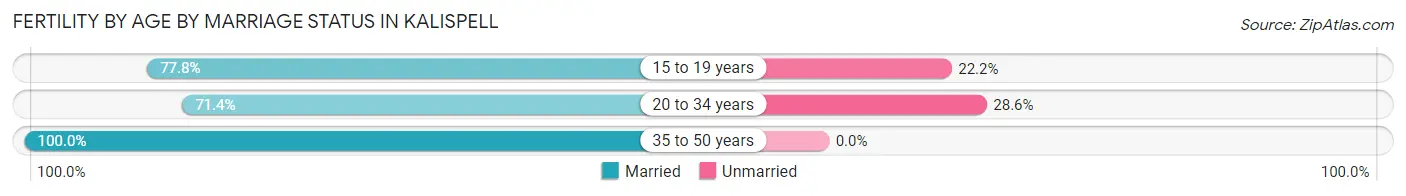
| Age Bracket | Married | Unmarried |
| 15 to 19 years | 14 (77.8%) | 4 (22.2%) |
| 20 to 34 years | 215 (71.4%) | 86 (28.6%) |
| 35 to 50 years | 26 (100.0%) | 0 (0.0%) |
| Total | 255 (73.9%) | 90 (26.1%) |
Fertility by Education in Kalispell
Average fertility rate in Kalispell is 55.0 births per 1,000 women. Women with the education attainment of graduate degree have the highest fertility rate of 84.0 births per 1,000 women, while women with the education attainment of less than high school have the lowest fertility at 9.0 births per 1,000 women. Women with the education attainment of college or associate's degree represent 44.9% of all women with births.
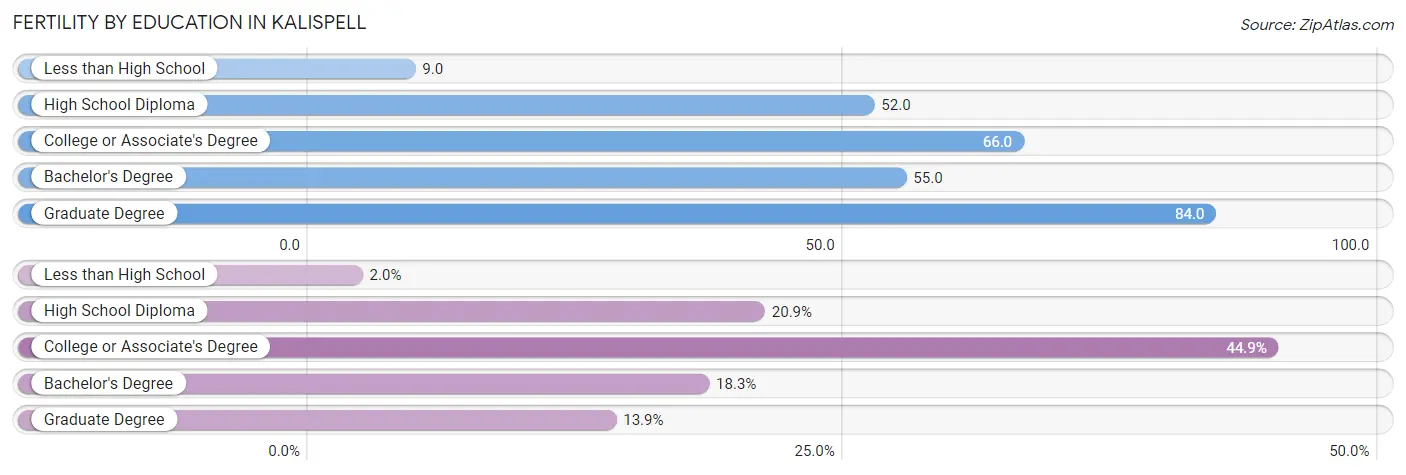
| Educational Attainment | Women with Births | Births / 1,000 Women |
| Less than High School | 7 (2.0%) | 9.0 |
| High School Diploma | 72 (20.9%) | 52.0 |
| College or Associate's Degree | 155 (44.9%) | 66.0 |
| Bachelor's Degree | 63 (18.3%) | 55.0 |
| Graduate Degree | 48 (13.9%) | 84.0 |
| Total | 345 (100.0%) | 55.0 |
Fertility by Education by Marriage Status in Kalispell
26.1% of women with births in Kalispell are unmarried. Women with the educational attainment of less than high school are most likely to be married with 100.0% of them married at childbirth, while women with the educational attainment of high school diploma are least likely to be married with 45.8% of them unmarried at childbirth.
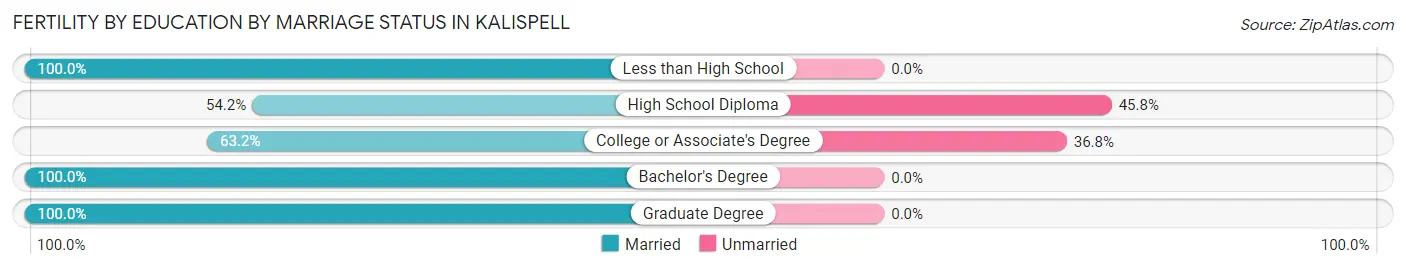
| Educational Attainment | Married | Unmarried |
| Less than High School | 7 (100.0%) | 0 (0.0%) |
| High School Diploma | 39 (54.2%) | 33 (45.8%) |
| College or Associate's Degree | 98 (63.2%) | 57 (36.8%) |
| Bachelor's Degree | 63 (100.0%) | 0 (0.0%) |
| Graduate Degree | 48 (100.0%) | 0 (0.0%) |
| Total | 255 (73.9%) | 90 (26.1%) |
Employment Characteristics in Kalispell
Employment by Class of Employer in Kalispell
Among the 12,361 employed individuals in Kalispell, private company employees (8,462 | 68.5%), not-for-profit organizations (1,207 | 9.8%), and self-employed (not incorporated) (921 | 7.4%) make up the most common classes of employment.
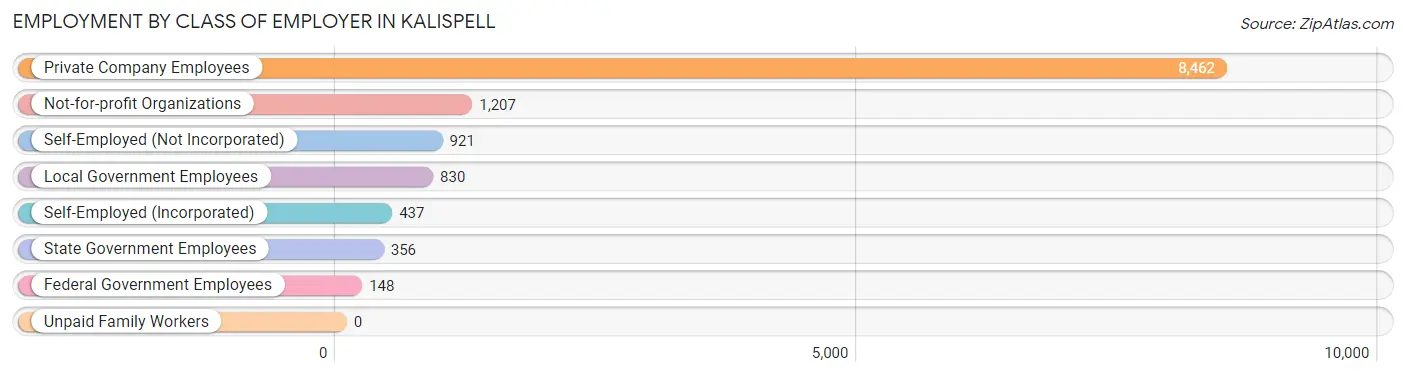
| Employer Class | # Employees | % Employees |
| Private Company Employees | 8,462 | 68.5% |
| Self-Employed (Incorporated) | 437 | 3.5% |
| Self-Employed (Not Incorporated) | 921 | 7.4% |
| Not-for-profit Organizations | 1,207 | 9.8% |
| Local Government Employees | 830 | 6.7% |
| State Government Employees | 356 | 2.9% |
| Federal Government Employees | 148 | 1.2% |
| Unpaid Family Workers | 0 | 0.0% |
| Total | 12,361 | 100.0% |
Employment Status by Age in Kalispell
According to the labor force statistics for Kalispell, out of the total population over 16 years of age (20,198), 64.6% or 13,048 individuals are in the labor force, with 4.1% or 535 of them unemployed. The age group with the highest labor force participation rate is 35 to 44 years, with 87.6% or 2,907 individuals in the labor force. Within the labor force, the 16 to 19 years age range has the highest percentage of unemployed individuals, with 13.3% or 100 of them being unemployed.
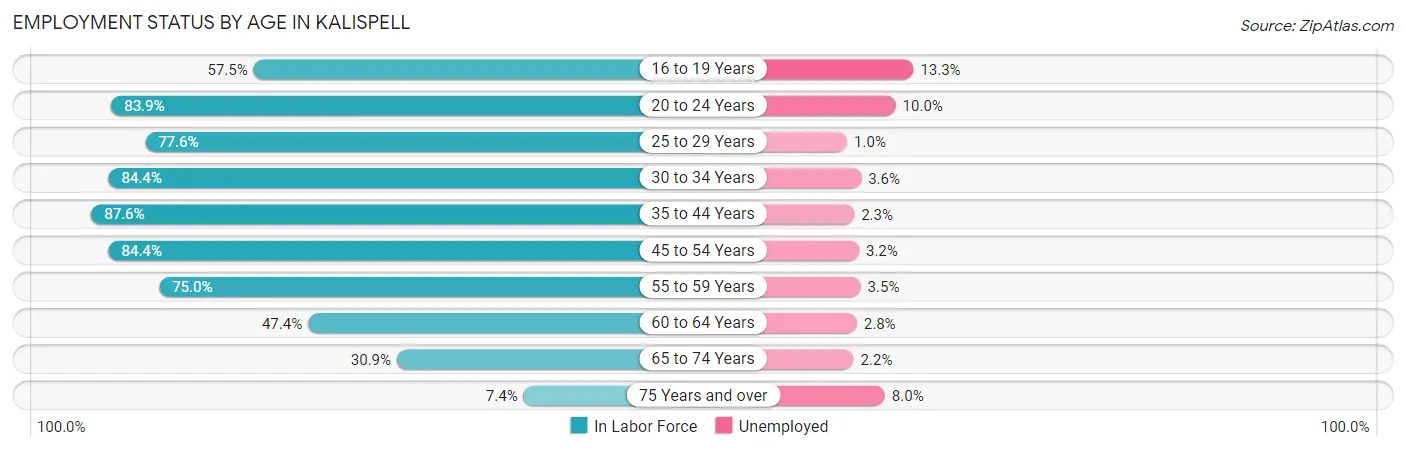
| Age Bracket | In Labor Force | Unemployed |
| 16 to 19 Years | 752 (57.5%) | 100 (13.3%) |
| 20 to 24 Years | 1,507 (83.9%) | 151 (10.0%) |
| 25 to 29 Years | 1,719 (77.6%) | 17 (1.0%) |
| 30 to 34 Years | 1,546 (84.4%) | 56 (3.6%) |
| 35 to 44 Years | 2,907 (87.6%) | 67 (2.3%) |
| 45 to 54 Years | 2,202 (84.4%) | 70 (3.2%) |
| 55 to 59 Years | 805 (75.0%) | 28 (3.5%) |
| 60 to 64 Years | 724 (47.4%) | 20 (2.8%) |
| 65 to 74 Years | 719 (30.9%) | 16 (2.2%) |
| 75 Years and over | 162 (7.4%) | 13 (8.0%) |
| Total | 13,048 (64.6%) | 535 (4.1%) |
Employment Status by Educational Attainment in Kalispell
According to labor force statistics for Kalispell, 78.8% of individuals (9,909) out of the total population between 25 and 64 years of age (12,575) are in the labor force, with 2.6% or 258 of them being unemployed. The group with the highest labor force participation rate are those with the educational attainment of bachelor's degree or higher, with 87.4% or 3,529 individuals in the labor force. Within the labor force, individuals with less than high school education have the highest percentage of unemployment, with 21.7% or 53 of them being unemployed.
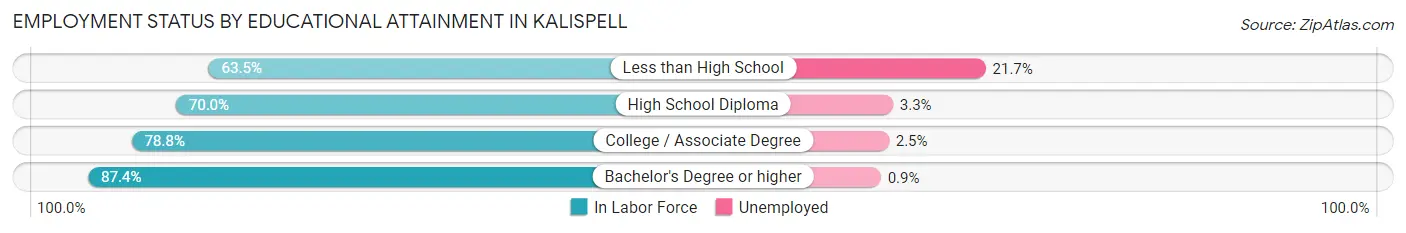
| Educational Attainment | In Labor Force | Unemployed |
| Less than High School | 244 (63.5%) | 83 (21.7%) |
| High School Diploma | 2,311 (70.0%) | 109 (3.3%) |
| College / Associate Degree | 3,823 (78.8%) | 121 (2.5%) |
| Bachelor's Degree or higher | 3,529 (87.4%) | 36 (0.9%) |
| Total | 9,909 (78.8%) | 327 (2.6%) |
Employment Occupations by Sex in Kalispell
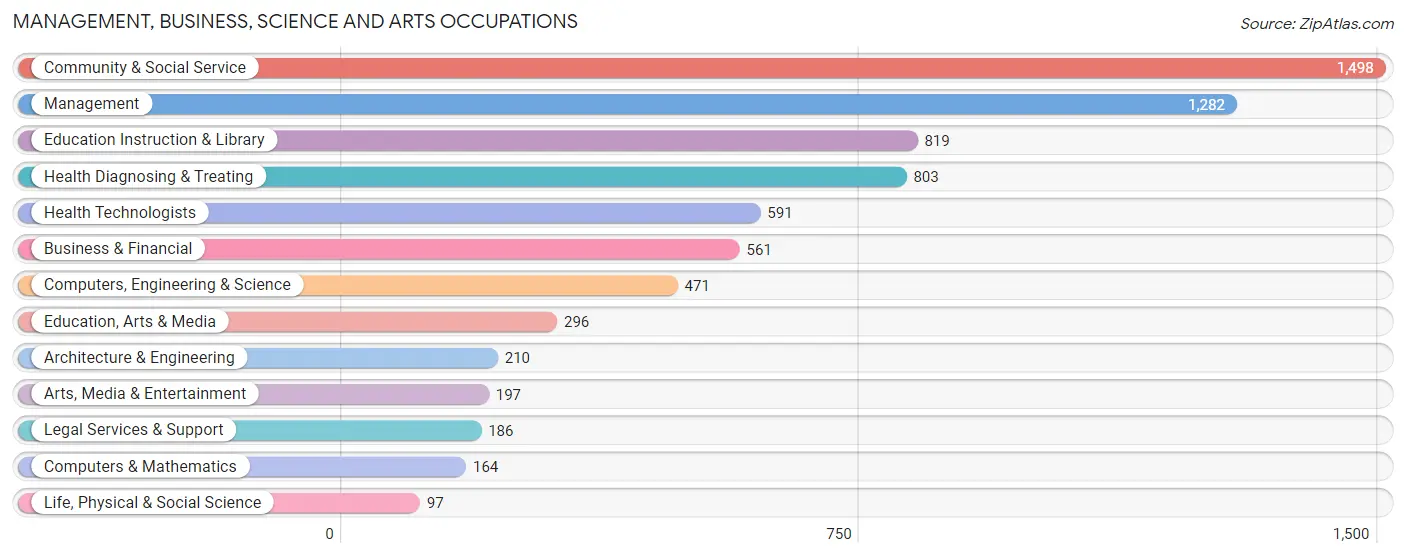
Management, Business, Science and Arts Occupations
The most common Management, Business, Science and Arts occupations in Kalispell are Community & Social Service (1,498 | 12.0%), Management (1,282 | 10.2%), Education Instruction & Library (819 | 6.6%), Health Diagnosing & Treating (803 | 6.4%), and Health Technologists (591 | 4.7%).
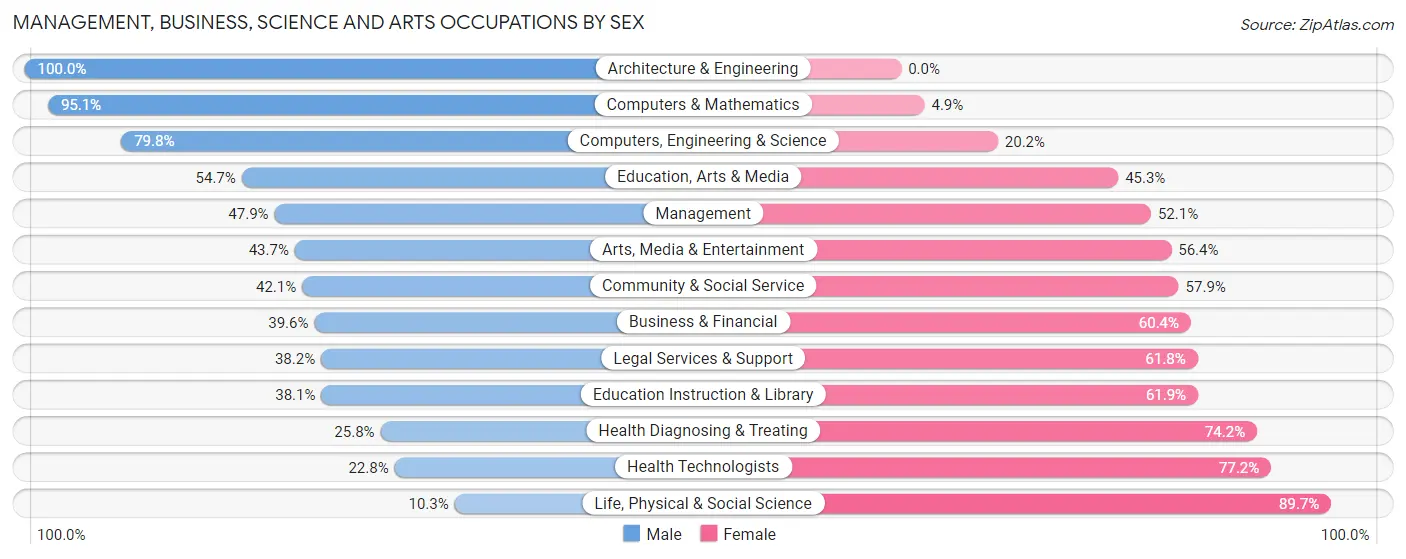
Management, Business, Science and Arts Occupations by Sex
Within the Management, Business, Science and Arts occupations in Kalispell, the most male-oriented occupations are Architecture & Engineering (100.0%), Computers & Mathematics (95.1%), and Computers, Engineering & Science (79.8%), while the most female-oriented occupations are Life, Physical & Social Science (89.7%), Health Technologists (77.2%), and Health Diagnosing & Treating (74.2%).
| Occupation | Male | Female |
| Management | 614 (47.9%) | 668 (52.1%) |
| Business & Financial | 222 (39.6%) | 339 (60.4%) |
| Computers, Engineering & Science | 376 (79.8%) | 95 (20.2%) |
| Computers & Mathematics | 156 (95.1%) | 8 (4.9%) |
| Architecture & Engineering | 210 (100.0%) | 0 (0.0%) |
| Life, Physical & Social Science | 10 (10.3%) | 87 (89.7%) |
| Community & Social Service | 631 (42.1%) | 867 (57.9%) |
| Education, Arts & Media | 162 (54.7%) | 134 (45.3%) |
| Legal Services & Support | 71 (38.2%) | 115 (61.8%) |
| Education Instruction & Library | 312 (38.1%) | 507 (61.9%) |
| Arts, Media & Entertainment | 86 (43.6%) | 111 (56.4%) |
| Health Diagnosing & Treating | 207 (25.8%) | 596 (74.2%) |
| Health Technologists | 135 (22.8%) | 456 (77.2%) |
| Total (Category) | 2,050 (44.4%) | 2,565 (55.6%) |
| Total (Overall) | 6,358 (50.8%) | 6,148 (49.2%) |
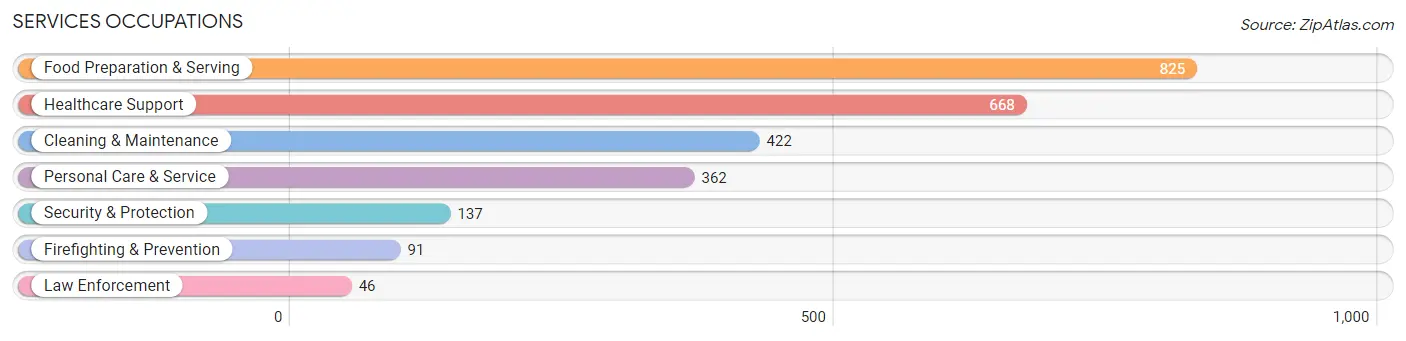
Services Occupations
The most common Services occupations in Kalispell are Food Preparation & Serving (825 | 6.6%), Healthcare Support (668 | 5.3%), Cleaning & Maintenance (422 | 3.4%), Personal Care & Service (362 | 2.9%), and Security & Protection (137 | 1.1%).
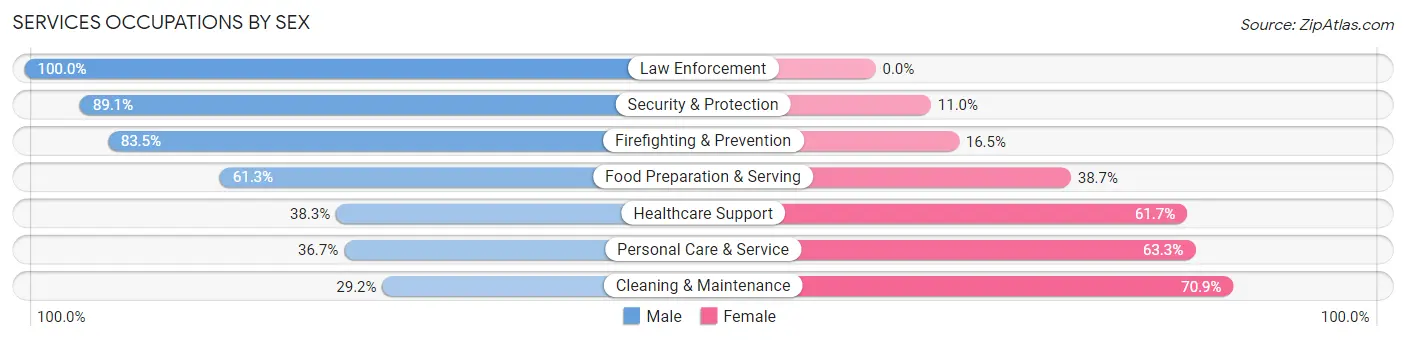
Services Occupations by Sex
Within the Services occupations in Kalispell, the most male-oriented occupations are Law Enforcement (100.0%), Security & Protection (89.0%), and Firefighting & Prevention (83.5%), while the most female-oriented occupations are Cleaning & Maintenance (70.9%), Personal Care & Service (63.3%), and Healthcare Support (61.7%).
| Occupation | Male | Female |
| Healthcare Support | 256 (38.3%) | 412 (61.7%) |
| Security & Protection | 122 (89.0%) | 15 (11.0%) |
| Firefighting & Prevention | 76 (83.5%) | 15 (16.5%) |
| Law Enforcement | 46 (100.0%) | 0 (0.0%) |
| Food Preparation & Serving | 506 (61.3%) | 319 (38.7%) |
| Cleaning & Maintenance | 123 (29.1%) | 299 (70.9%) |
| Personal Care & Service | 133 (36.7%) | 229 (63.3%) |
| Total (Category) | 1,140 (47.2%) | 1,274 (52.8%) |
| Total (Overall) | 6,358 (50.8%) | 6,148 (49.2%) |
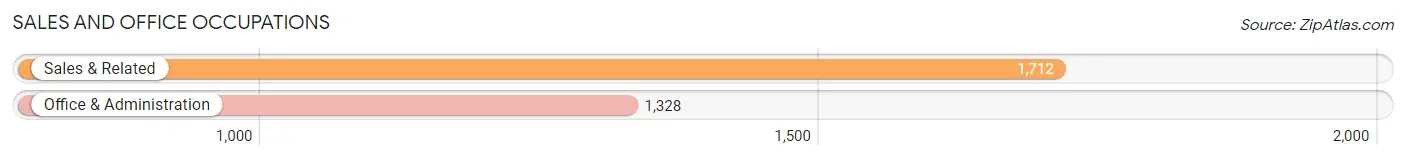
Sales and Office Occupations
The most common Sales and Office occupations in Kalispell are Sales & Related (1,712 | 13.7%), and Office & Administration (1,328 | 10.6%).
Sales and Office Occupations by Sex
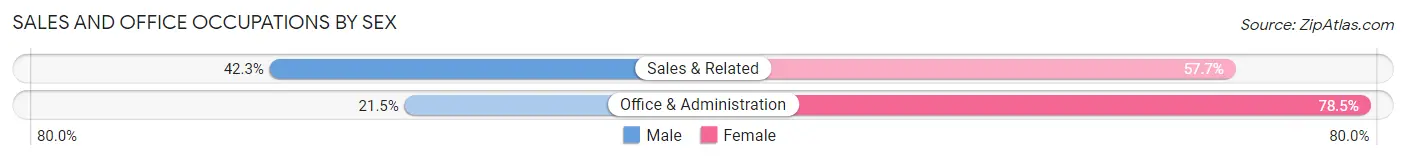
| Occupation | Male | Female |
| Sales & Related | 724 (42.3%) | 988 (57.7%) |
| Office & Administration | 286 (21.5%) | 1,042 (78.5%) |
| Total (Category) | 1,010 (33.2%) | 2,030 (66.8%) |
| Total (Overall) | 6,358 (50.8%) | 6,148 (49.2%) |
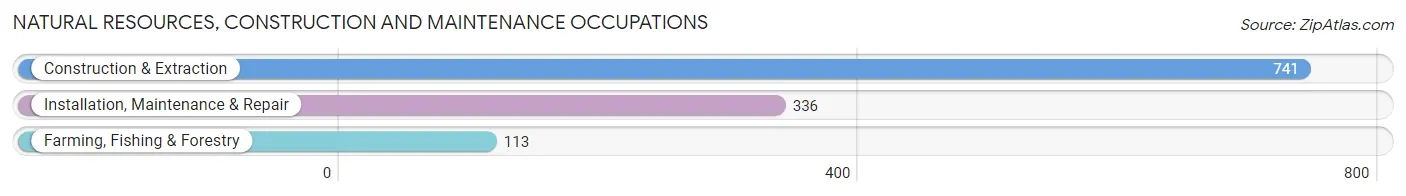
Natural Resources, Construction and Maintenance Occupations
The most common Natural Resources, Construction and Maintenance occupations in Kalispell are Construction & Extraction (741 | 5.9%), Installation, Maintenance & Repair (336 | 2.7%), and Farming, Fishing & Forestry (113 | 0.9%).
Natural Resources, Construction and Maintenance Occupations by Sex
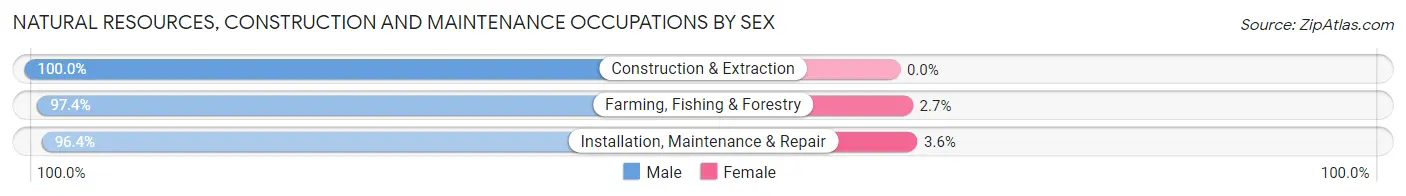
| Occupation | Male | Female |
| Farming, Fishing & Forestry | 110 (97.4%) | 3 (2.6%) |
| Construction & Extraction | 741 (100.0%) | 0 (0.0%) |
| Installation, Maintenance & Repair | 324 (96.4%) | 12 (3.6%) |
| Total (Category) | 1,175 (98.7%) | 15 (1.3%) |
| Total (Overall) | 6,358 (50.8%) | 6,148 (49.2%) |
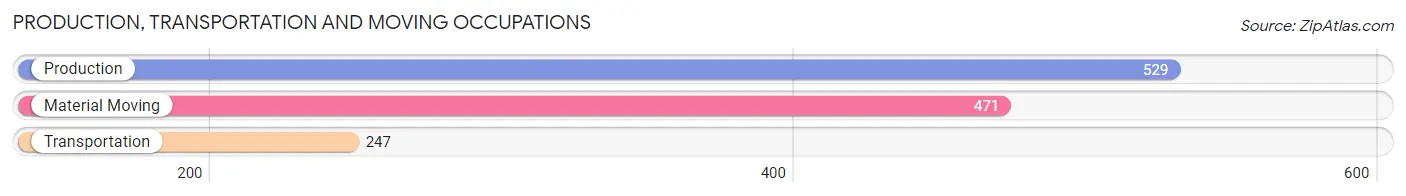
Production, Transportation and Moving Occupations
The most common Production, Transportation and Moving occupations in Kalispell are Production (529 | 4.2%), Material Moving (471 | 3.8%), and Transportation (247 | 2.0%).
Production, Transportation and Moving Occupations by Sex
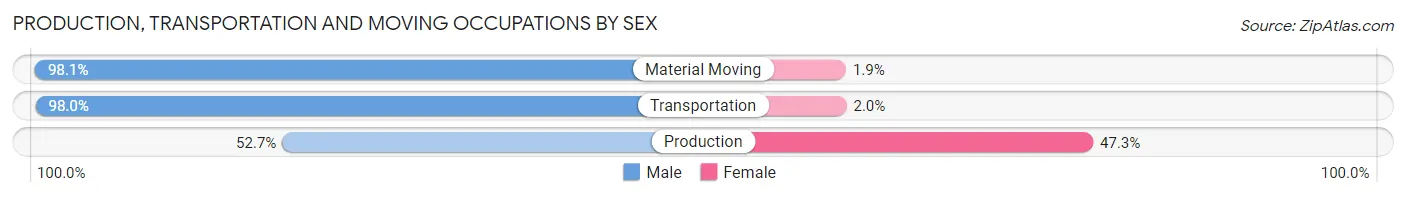
| Occupation | Male | Female |
| Production | 279 (52.7%) | 250 (47.3%) |
| Transportation | 242 (98.0%) | 5 (2.0%) |
| Material Moving | 462 (98.1%) | 9 (1.9%) |
| Total (Category) | 983 (78.8%) | 264 (21.2%) |
| Total (Overall) | 6,358 (50.8%) | 6,148 (49.2%) |
Employment Industries by Sex in Kalispell
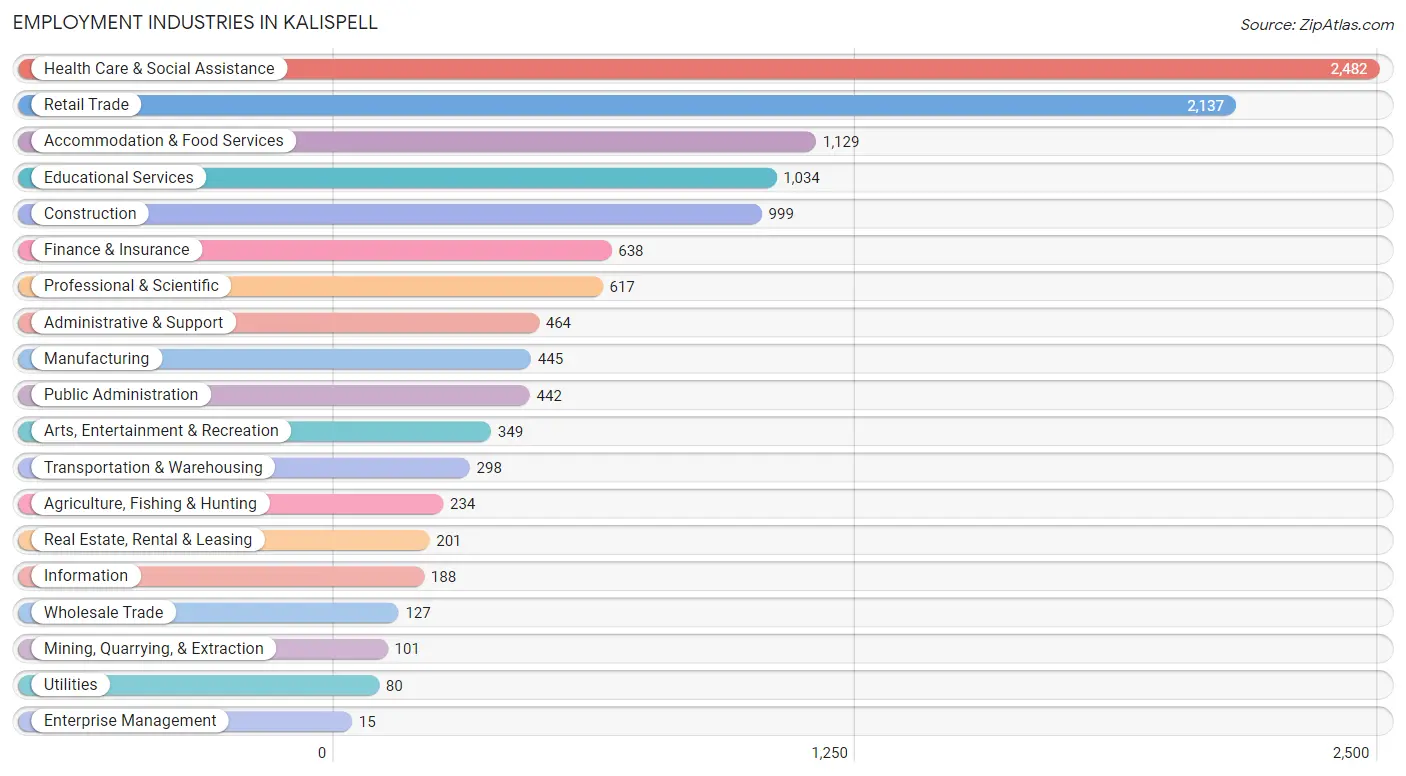
Employment Industries in Kalispell
The major employment industries in Kalispell include Health Care & Social Assistance (2,482 | 19.9%), Retail Trade (2,137 | 17.1%), Accommodation & Food Services (1,129 | 9.0%), Educational Services (1,034 | 8.3%), and Construction (999 | 8.0%).
Employment Industries by Sex in Kalispell
The Kalispell industries that see more men than women are Mining, Quarrying, & Extraction (100.0%), Enterprise Management (100.0%), and Agriculture, Fishing & Hunting (98.7%), whereas the industries that tend to have a higher number of women are Real Estate, Rental & Leasing (78.6%), Administrative & Support (75.4%), and Health Care & Social Assistance (73.0%).
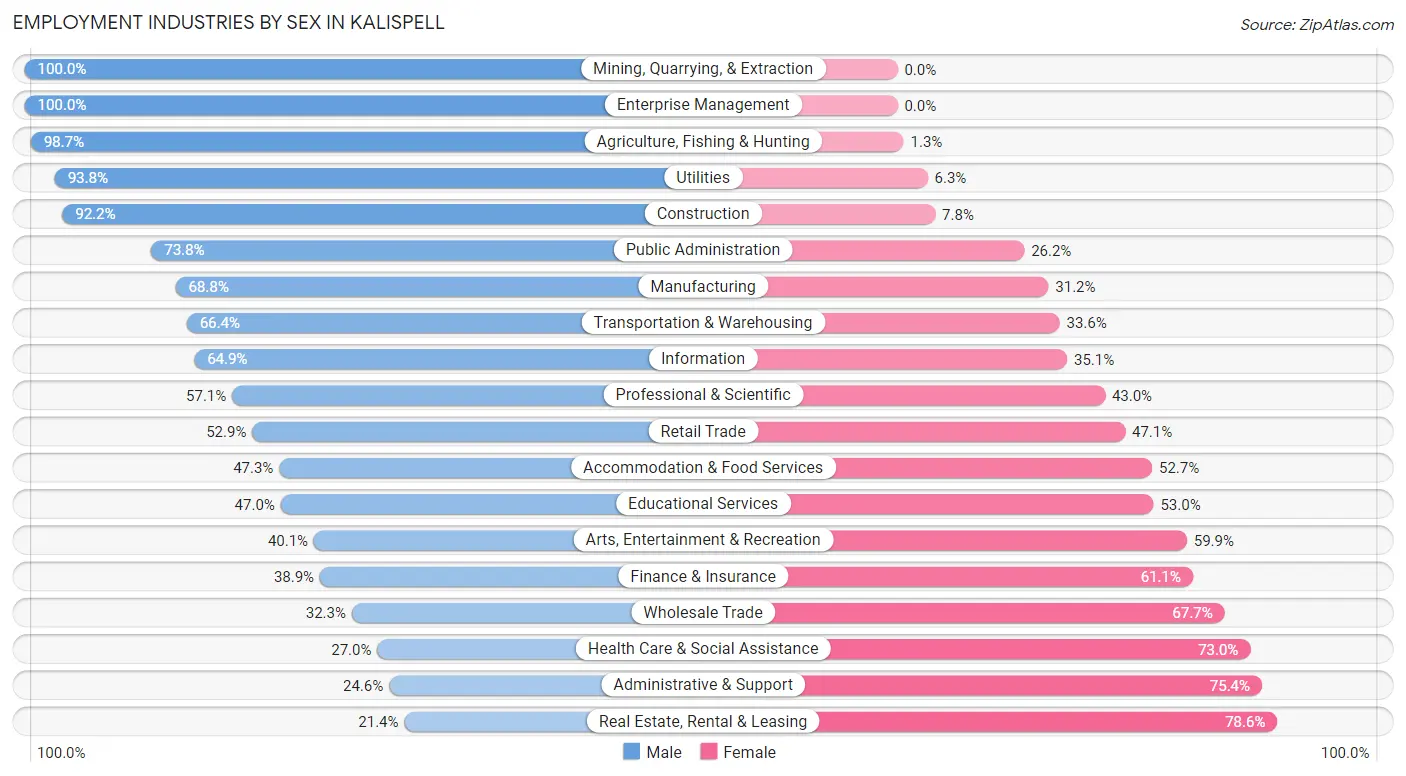
| Industry | Male | Female |
| Agriculture, Fishing & Hunting | 231 (98.7%) | 3 (1.3%) |
| Mining, Quarrying, & Extraction | 101 (100.0%) | 0 (0.0%) |
| Construction | 921 (92.2%) | 78 (7.8%) |
| Manufacturing | 306 (68.8%) | 139 (31.2%) |
| Wholesale Trade | 41 (32.3%) | 86 (67.7%) |
| Retail Trade | 1,130 (52.9%) | 1,007 (47.1%) |
| Transportation & Warehousing | 198 (66.4%) | 100 (33.6%) |
| Utilities | 75 (93.8%) | 5 (6.2%) |
| Information | 122 (64.9%) | 66 (35.1%) |
| Finance & Insurance | 248 (38.9%) | 390 (61.1%) |
| Real Estate, Rental & Leasing | 43 (21.4%) | 158 (78.6%) |
| Professional & Scientific | 352 (57.1%) | 265 (42.9%) |
| Enterprise Management | 15 (100.0%) | 0 (0.0%) |
| Administrative & Support | 114 (24.6%) | 350 (75.4%) |
| Educational Services | 486 (47.0%) | 548 (53.0%) |
| Health Care & Social Assistance | 670 (27.0%) | 1,812 (73.0%) |
| Arts, Entertainment & Recreation | 140 (40.1%) | 209 (59.9%) |
| Accommodation & Food Services | 534 (47.3%) | 595 (52.7%) |
| Public Administration | 326 (73.8%) | 116 (26.2%) |
| Total | 6,358 (50.8%) | 6,148 (49.2%) |
Education in Kalispell
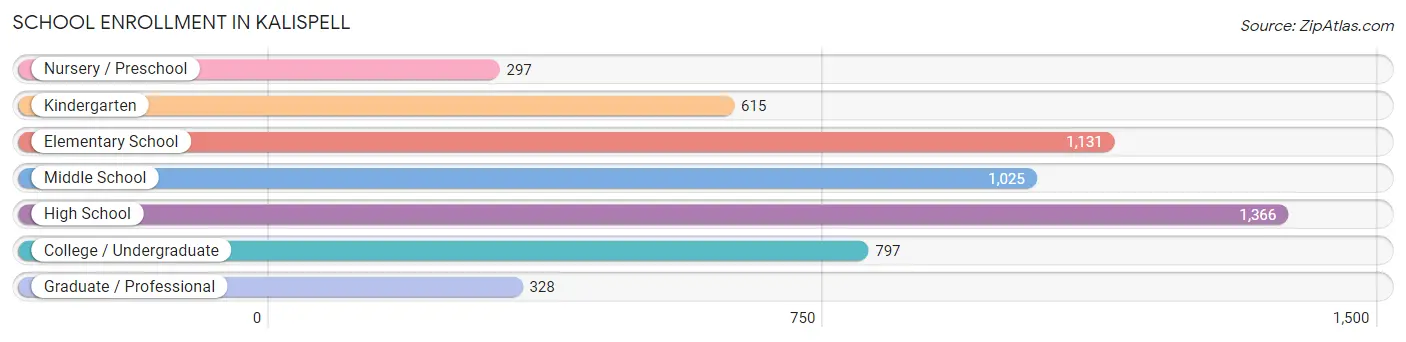
School Enrollment in Kalispell
The most common levels of schooling among the 5,559 students in Kalispell are high school (1,366 | 24.6%), elementary school (1,131 | 20.3%), and middle school (1,025 | 18.4%).
| School Level | # Students | % Students |
| Nursery / Preschool | 297 | 5.3% |
| Kindergarten | 615 | 11.1% |
| Elementary School | 1,131 | 20.3% |
| Middle School | 1,025 | 18.4% |
| High School | 1,366 | 24.6% |
| College / Undergraduate | 797 | 14.3% |
| Graduate / Professional | 328 | 5.9% |
| Total | 5,559 | 100.0% |
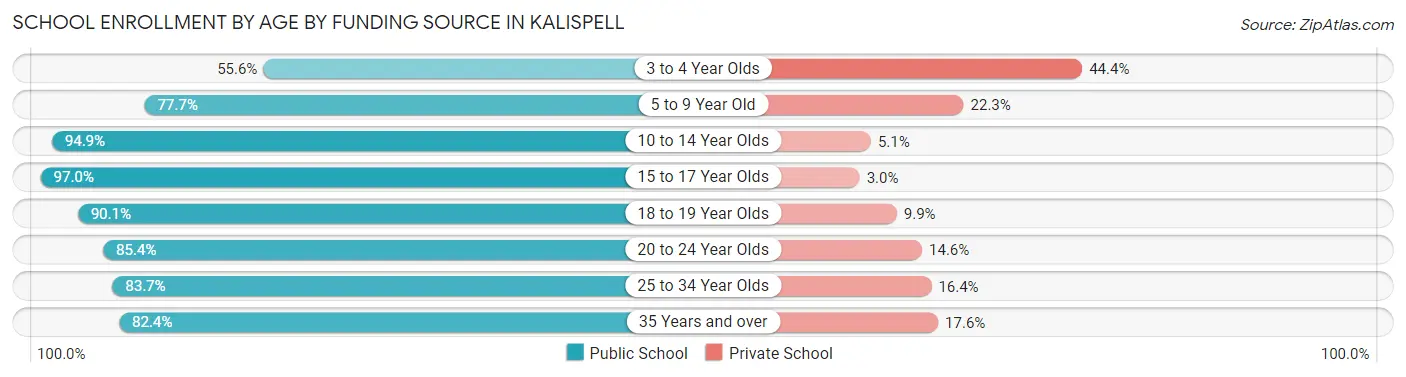
School Enrollment by Age by Funding Source in Kalispell
Out of a total of 5,559 students who are enrolled in schools in Kalispell, 806 (14.5%) attend a private institution, while the remaining 4,753 (85.5%) are enrolled in public schools. The age group of 3 to 4 year olds has the highest likelihood of being enrolled in private schools, with 180 (44.4% in the age bracket) enrolled. Conversely, the age group of 15 to 17 year olds has the lowest likelihood of being enrolled in a private school, with 877 (97.0% in the age bracket) attending a public institution.
| Age Bracket | Public School | Private School |
| 3 to 4 Year Olds | 225 (55.6%) | 180 (44.4%) |
| 5 to 9 Year Old | 1,144 (77.7%) | 329 (22.3%) |
| 10 to 14 Year Olds | 1,346 (94.9%) | 72 (5.1%) |
| 15 to 17 Year Olds | 877 (97.0%) | 27 (3.0%) |
| 18 to 19 Year Olds | 346 (90.1%) | 38 (9.9%) |
| 20 to 24 Year Olds | 228 (85.4%) | 39 (14.6%) |
| 25 to 34 Year Olds | 307 (83.7%) | 60 (16.4%) |
| 35 Years and over | 281 (82.4%) | 60 (17.6%) |
| Total | 4,753 (85.5%) | 806 (14.5%) |
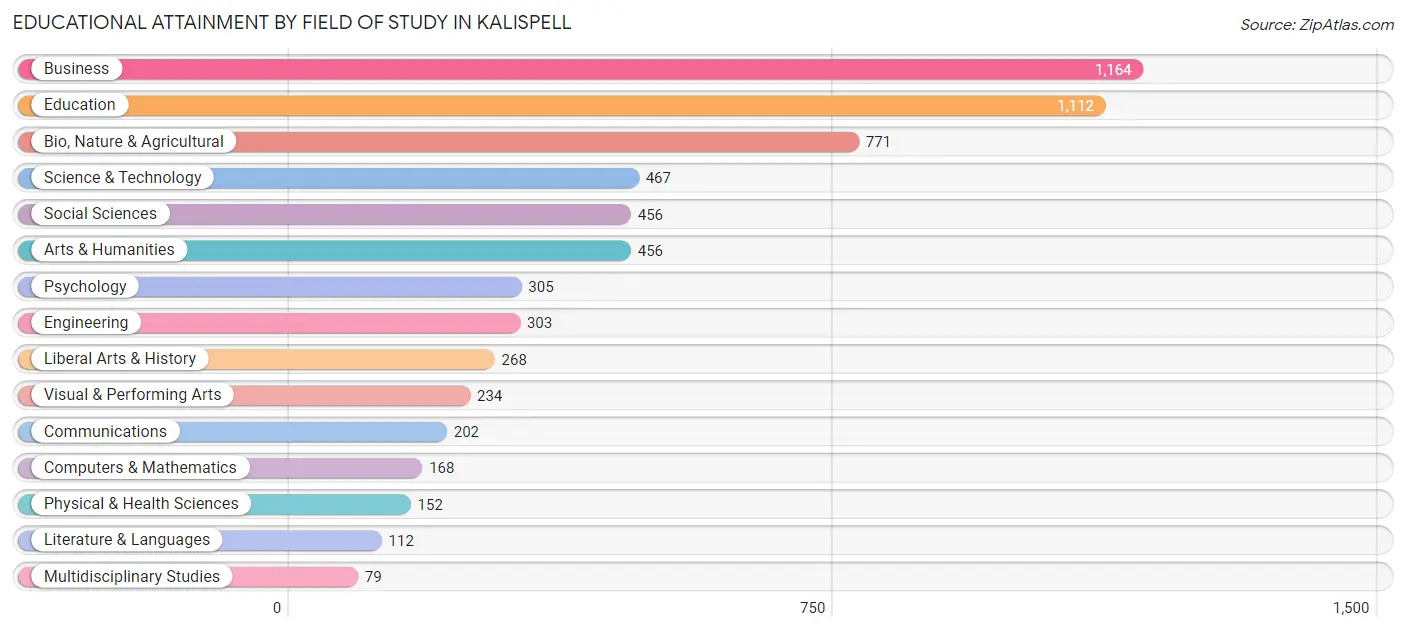
Educational Attainment by Field of Study in Kalispell
Business (1,164 | 18.6%), education (1,112 | 17.8%), bio, nature & agricultural (771 | 12.3%), science & technology (467 | 7.5%), and social sciences (456 | 7.3%) are the most common fields of study among 6,249 individuals in Kalispell who have obtained a bachelor's degree or higher.
| Field of Study | # Graduates | % Graduates |
| Computers & Mathematics | 168 | 2.7% |
| Bio, Nature & Agricultural | 771 | 12.3% |
| Physical & Health Sciences | 152 | 2.4% |
| Psychology | 305 | 4.9% |
| Social Sciences | 456 | 7.3% |
| Engineering | 303 | 4.9% |
| Multidisciplinary Studies | 79 | 1.3% |
| Science & Technology | 467 | 7.5% |
| Business | 1,164 | 18.6% |
| Education | 1,112 | 17.8% |
| Literature & Languages | 112 | 1.8% |
| Liberal Arts & History | 268 | 4.3% |
| Visual & Performing Arts | 234 | 3.7% |
| Communications | 202 | 3.2% |
| Arts & Humanities | 456 | 7.3% |
| Total | 6,249 | 100.0% |
Transportation & Commute in Kalispell
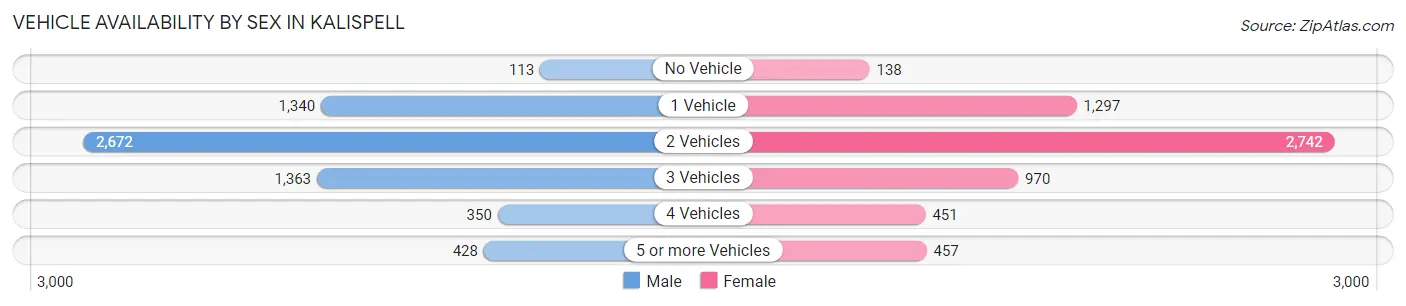
Vehicle Availability by Sex in Kalispell
The most prevalent vehicle ownership categories in Kalispell are males with 2 vehicles (2,672, accounting for 42.6%) and females with 2 vehicles (2,742, making up 44.1%).
| Vehicles Available | Male | Female |
| No Vehicle | 113 (1.8%) | 138 (2.3%) |
| 1 Vehicle | 1,340 (21.4%) | 1,297 (21.4%) |
| 2 Vehicles | 2,672 (42.6%) | 2,742 (45.3%) |
| 3 Vehicles | 1,363 (21.7%) | 970 (16.0%) |
| 4 Vehicles | 350 (5.6%) | 451 (7.4%) |
| 5 or more Vehicles | 428 (6.8%) | 457 (7.5%) |
| Total | 6,266 (100.0%) | 6,055 (100.0%) |
Commute Time in Kalispell
The most frequently occuring commute durations in Kalispell are 10 to 14 minutes (3,162 commuters, 28.1%), 5 to 9 minutes (2,777 commuters, 24.7%), and 15 to 19 minutes (2,169 commuters, 19.3%).
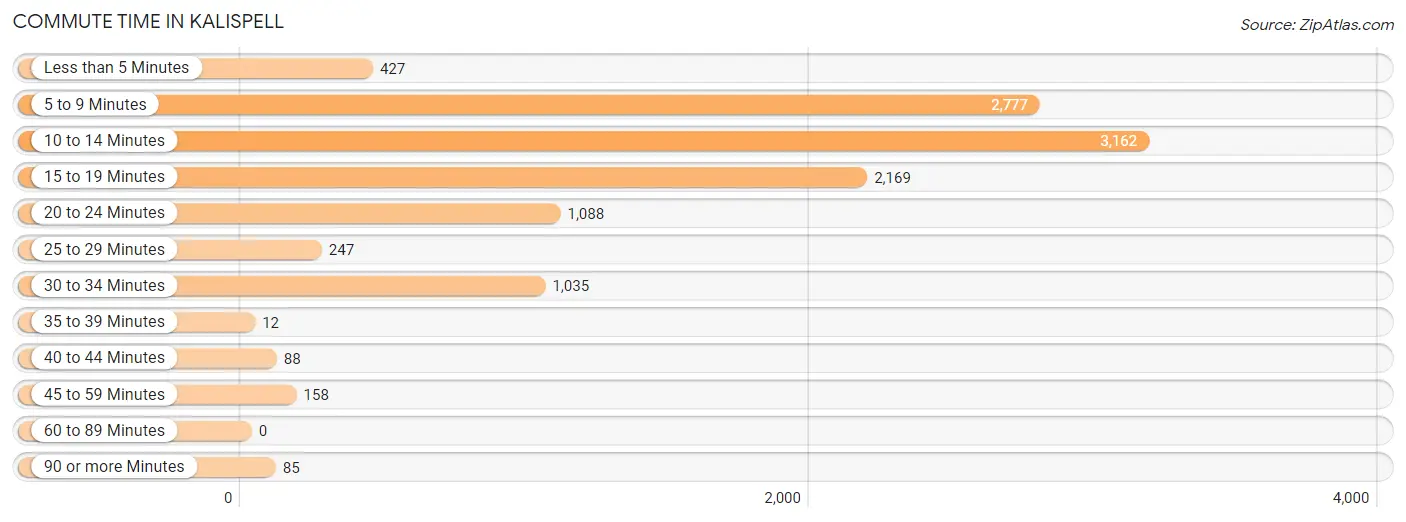
| Commute Time | # Commuters | % Commuters |
| Less than 5 Minutes | 427 | 3.8% |
| 5 to 9 Minutes | 2,777 | 24.7% |
| 10 to 14 Minutes | 3,162 | 28.1% |
| 15 to 19 Minutes | 2,169 | 19.3% |
| 20 to 24 Minutes | 1,088 | 9.7% |
| 25 to 29 Minutes | 247 | 2.2% |
| 30 to 34 Minutes | 1,035 | 9.2% |
| 35 to 39 Minutes | 12 | 0.1% |
| 40 to 44 Minutes | 88 | 0.8% |
| 45 to 59 Minutes | 158 | 1.4% |
| 60 to 89 Minutes | 0 | 0.0% |
| 90 or more Minutes | 85 | 0.8% |
Commute Time by Sex in Kalispell
The most common commute times in Kalispell are 5 to 9 minutes (1,532 commuters, 26.9%) for males and 10 to 14 minutes (1,818 commuters, 32.8%) for females.
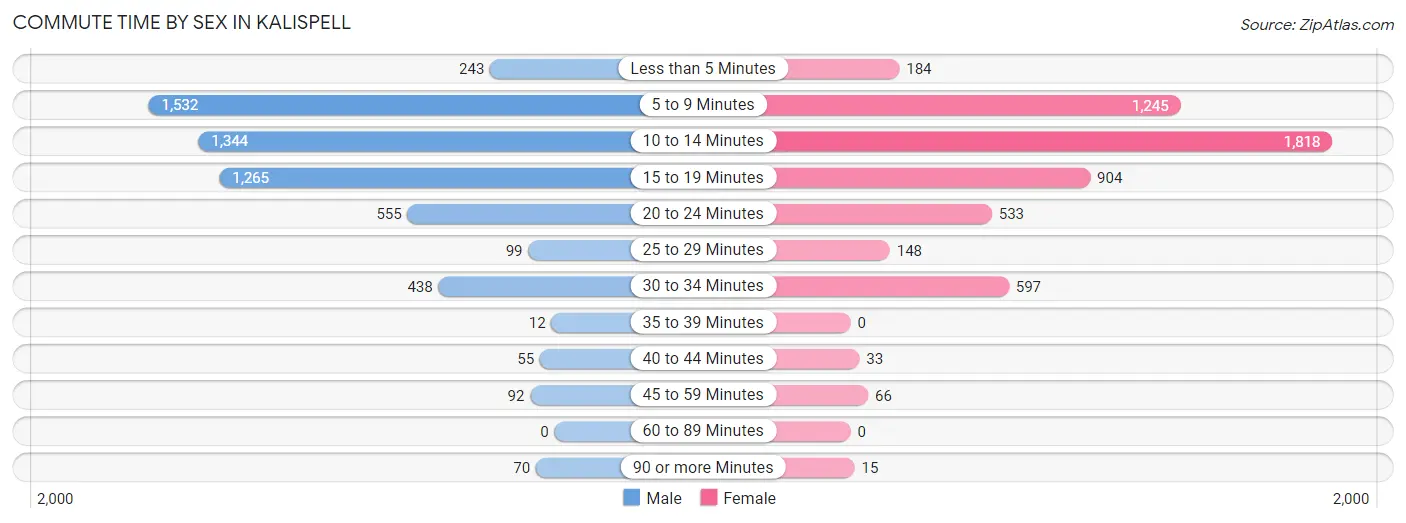
| Commute Time | Male | Female |
| Less than 5 Minutes | 243 (4.3%) | 184 (3.3%) |
| 5 to 9 Minutes | 1,532 (26.9%) | 1,245 (22.5%) |
| 10 to 14 Minutes | 1,344 (23.6%) | 1,818 (32.8%) |
| 15 to 19 Minutes | 1,265 (22.2%) | 904 (16.3%) |
| 20 to 24 Minutes | 555 (9.7%) | 533 (9.6%) |
| 25 to 29 Minutes | 99 (1.7%) | 148 (2.7%) |
| 30 to 34 Minutes | 438 (7.7%) | 597 (10.8%) |
| 35 to 39 Minutes | 12 (0.2%) | 0 (0.0%) |
| 40 to 44 Minutes | 55 (1.0%) | 33 (0.6%) |
| 45 to 59 Minutes | 92 (1.6%) | 66 (1.2%) |
| 60 to 89 Minutes | 0 (0.0%) | 0 (0.0%) |
| 90 or more Minutes | 70 (1.2%) | 15 (0.3%) |
Time of Departure to Work by Sex in Kalispell
The most frequent times of departure to work in Kalispell are 7:30 AM to 7:59 AM (1,498, 26.3%) for males and 7:30 AM to 7:59 AM (1,247, 22.5%) for females.
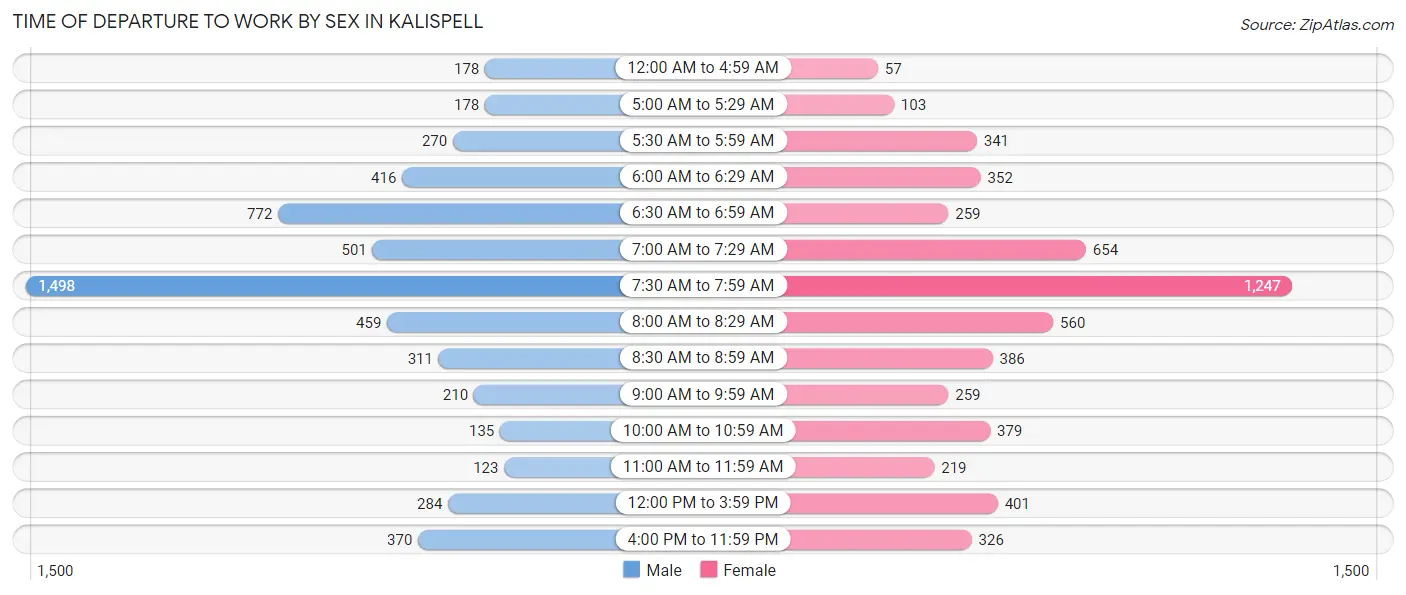
| Time of Departure | Male | Female |
| 12:00 AM to 4:59 AM | 178 (3.1%) | 57 (1.0%) |
| 5:00 AM to 5:29 AM | 178 (3.1%) | 103 (1.9%) |
| 5:30 AM to 5:59 AM | 270 (4.7%) | 341 (6.1%) |
| 6:00 AM to 6:29 AM | 416 (7.3%) | 352 (6.4%) |
| 6:30 AM to 6:59 AM | 772 (13.5%) | 259 (4.7%) |
| 7:00 AM to 7:29 AM | 501 (8.8%) | 654 (11.8%) |
| 7:30 AM to 7:59 AM | 1,498 (26.3%) | 1,247 (22.5%) |
| 8:00 AM to 8:29 AM | 459 (8.1%) | 560 (10.1%) |
| 8:30 AM to 8:59 AM | 311 (5.4%) | 386 (7.0%) |
| 9:00 AM to 9:59 AM | 210 (3.7%) | 259 (4.7%) |
| 10:00 AM to 10:59 AM | 135 (2.4%) | 379 (6.8%) |
| 11:00 AM to 11:59 AM | 123 (2.2%) | 219 (4.0%) |
| 12:00 PM to 3:59 PM | 284 (5.0%) | 401 (7.2%) |
| 4:00 PM to 11:59 PM | 370 (6.5%) | 326 (5.9%) |
| Total | 5,705 (100.0%) | 5,543 (100.0%) |
Housing Occupancy in Kalispell
Occupancy by Ownership in Kalispell
Of the total 10,449 dwellings in Kalispell, owner-occupied units account for 6,109 (58.5%), while renter-occupied units make up 4,340 (41.5%).
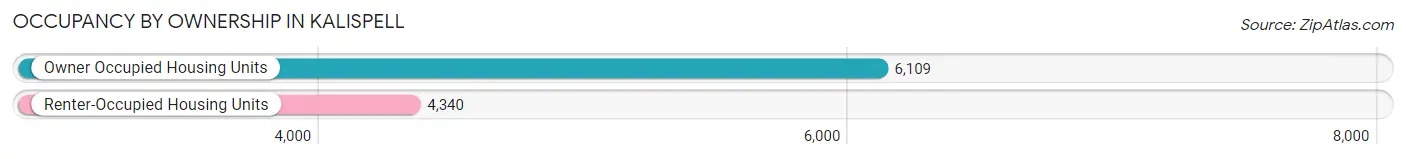
| Occupancy | # Housing Units | % Housing Units |
| Owner Occupied Housing Units | 6,109 | 58.5% |
| Renter-Occupied Housing Units | 4,340 | 41.5% |
| Total Occupied Housing Units | 10,449 | 100.0% |
Occupancy by Household Size in Kalispell
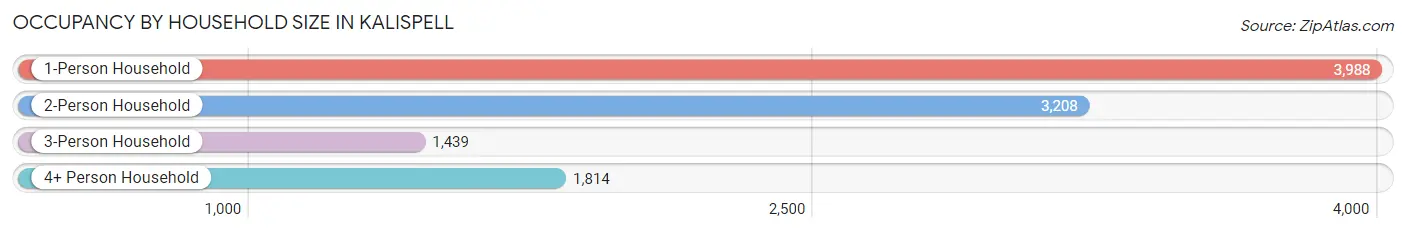
| Household Size | # Housing Units | % Housing Units |
| 1-Person Household | 3,988 | 38.2% |
| 2-Person Household | 3,208 | 30.7% |
| 3-Person Household | 1,439 | 13.8% |
| 4+ Person Household | 1,814 | 17.4% |
| Total Housing Units | 10,449 | 100.0% |
Occupancy by Ownership by Household Size in Kalispell
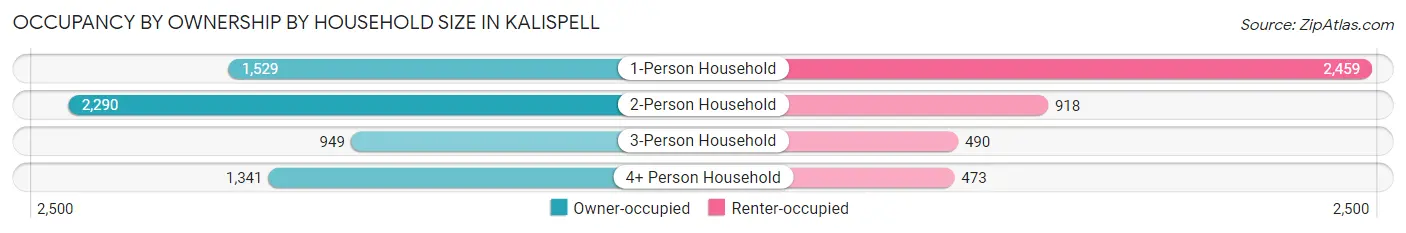
| Household Size | Owner-occupied | Renter-occupied |
| 1-Person Household | 1,529 (38.3%) | 2,459 (61.7%) |
| 2-Person Household | 2,290 (71.4%) | 918 (28.6%) |
| 3-Person Household | 949 (65.9%) | 490 (34.1%) |
| 4+ Person Household | 1,341 (73.9%) | 473 (26.1%) |
| Total Housing Units | 6,109 (58.5%) | 4,340 (41.5%) |
Occupancy by Educational Attainment in Kalispell
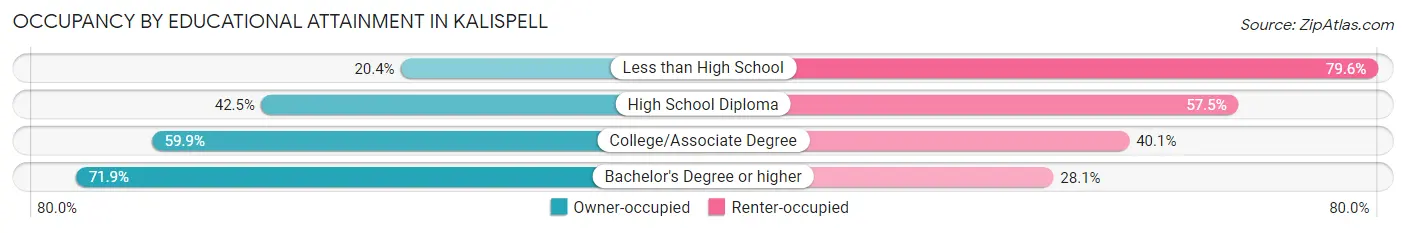
| Household Size | Owner-occupied | Renter-occupied |
| Less than High School | 74 (20.4%) | 289 (79.6%) |
| High School Diploma | 1,012 (42.5%) | 1,367 (57.5%) |
| College/Associate Degree | 2,575 (59.9%) | 1,727 (40.1%) |
| Bachelor's Degree or higher | 2,448 (71.9%) | 957 (28.1%) |
Occupancy by Age of Householder in Kalispell
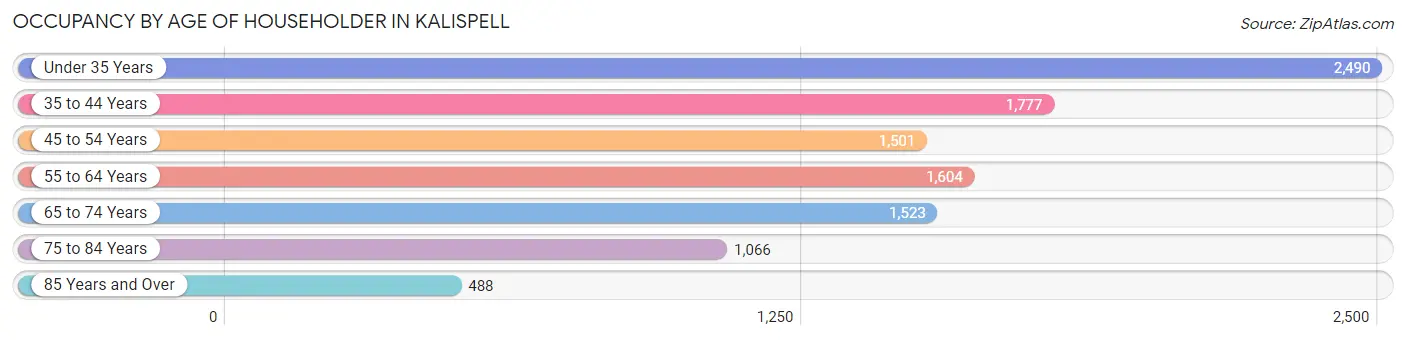
| Age Bracket | # Households | % Households |
| Under 35 Years | 2,490 | 23.8% |
| 35 to 44 Years | 1,777 | 17.0% |
| 45 to 54 Years | 1,501 | 14.4% |
| 55 to 64 Years | 1,604 | 15.3% |
| 65 to 74 Years | 1,523 | 14.6% |
| 75 to 84 Years | 1,066 | 10.2% |
| 85 Years and Over | 488 | 4.7% |
| Total | 10,449 | 100.0% |
Housing Finances in Kalispell
Median Income by Occupancy in Kalispell
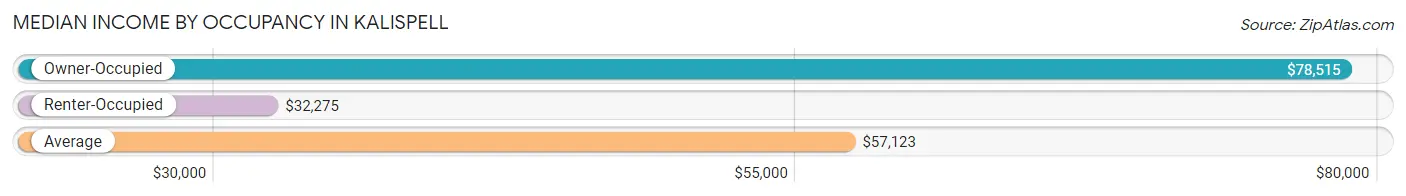
| Occupancy Type | # Households | Median Income |
| Owner-Occupied | 6,109 (58.5%) | $78,515 |
| Renter-Occupied | 4,340 (41.5%) | $32,275 |
| Average | 10,449 (100.0%) | $57,123 |
Occupancy by Householder Income Bracket in Kalispell
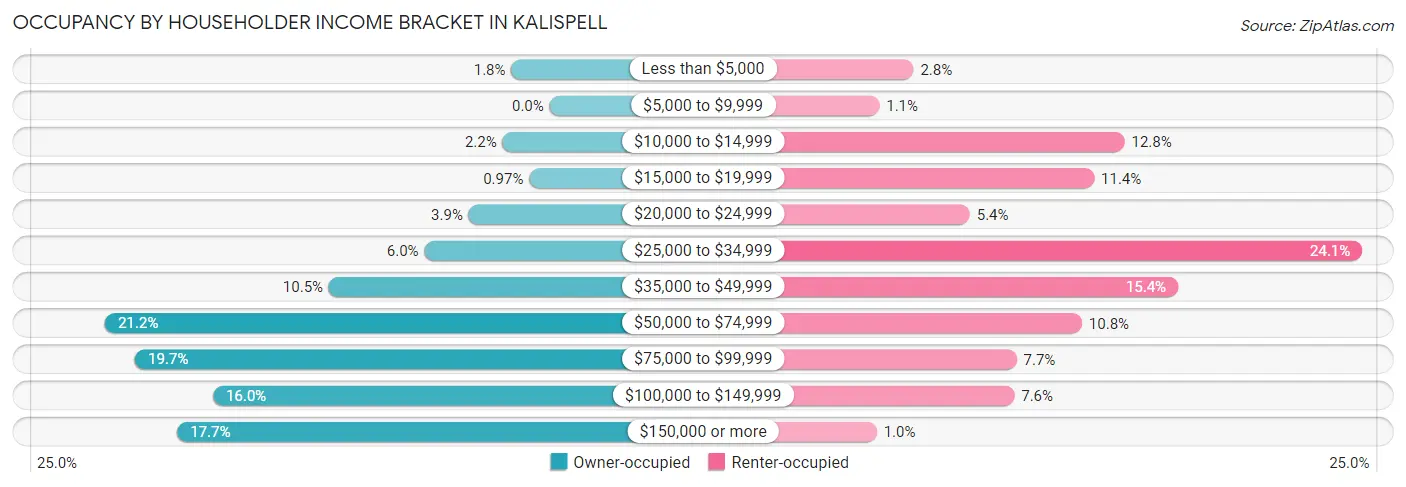
| Income Bracket | Owner-occupied | Renter-occupied |
| Less than $5,000 | 111 (1.8%) | 120 (2.8%) |
| $5,000 to $9,999 | 0 (0.0%) | 49 (1.1%) |
| $10,000 to $14,999 | 137 (2.2%) | 556 (12.8%) |
| $15,000 to $19,999 | 59 (1.0%) | 493 (11.4%) |
| $20,000 to $24,999 | 235 (3.8%) | 236 (5.4%) |
| $25,000 to $34,999 | 364 (6.0%) | 1,047 (24.1%) |
| $35,000 to $49,999 | 642 (10.5%) | 666 (15.3%) |
| $50,000 to $74,999 | 1,293 (21.2%) | 468 (10.8%) |
| $75,000 to $99,999 | 1,206 (19.7%) | 333 (7.7%) |
| $100,000 to $149,999 | 979 (16.0%) | 328 (7.6%) |
| $150,000 or more | 1,083 (17.7%) | 44 (1.0%) |
| Total | 6,109 (100.0%) | 4,340 (100.0%) |
Monthly Housing Cost Tiers in Kalispell
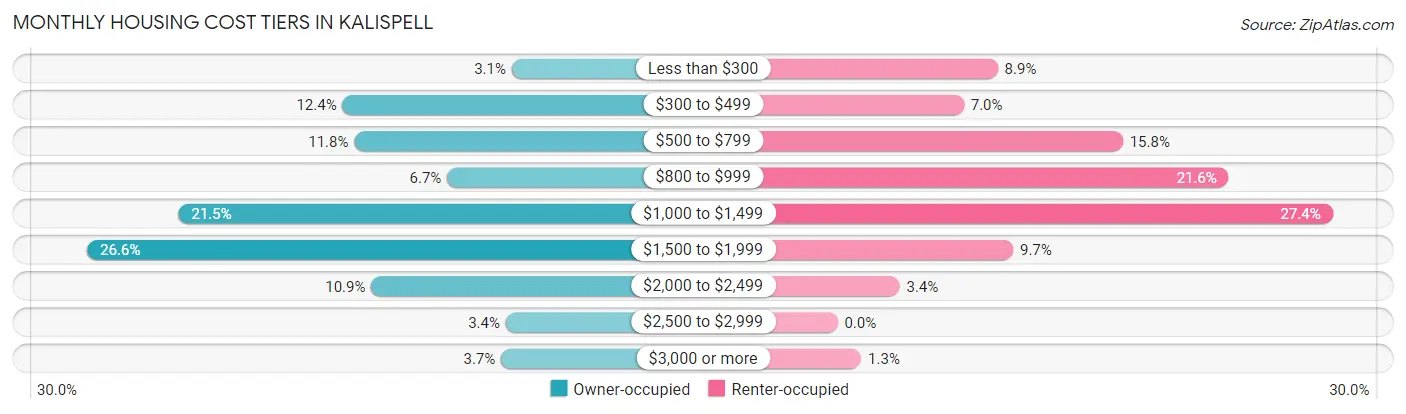
| Monthly Cost | Owner-occupied | Renter-occupied |
| Less than $300 | 189 (3.1%) | 384 (8.8%) |
| $300 to $499 | 760 (12.4%) | 303 (7.0%) |
| $500 to $799 | 720 (11.8%) | 684 (15.8%) |
| $800 to $999 | 407 (6.7%) | 938 (21.6%) |
| $1,000 to $1,499 | 1,314 (21.5%) | 1,187 (27.4%) |
| $1,500 to $1,999 | 1,622 (26.6%) | 421 (9.7%) |
| $2,000 to $2,499 | 663 (10.8%) | 149 (3.4%) |
| $2,500 to $2,999 | 209 (3.4%) | 0 (0.0%) |
| $3,000 or more | 225 (3.7%) | 57 (1.3%) |
| Total | 6,109 (100.0%) | 4,340 (100.0%) |
Physical Housing Characteristics in Kalispell
Housing Structures in Kalispell
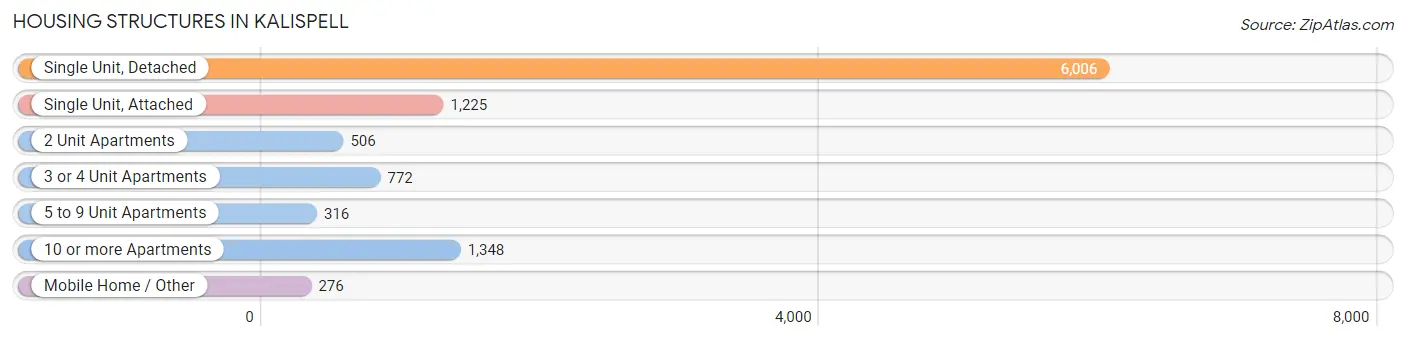
| Structure Type | # Housing Units | % Housing Units |
| Single Unit, Detached | 6,006 | 57.5% |
| Single Unit, Attached | 1,225 | 11.7% |
| 2 Unit Apartments | 506 | 4.8% |
| 3 or 4 Unit Apartments | 772 | 7.4% |
| 5 to 9 Unit Apartments | 316 | 3.0% |
| 10 or more Apartments | 1,348 | 12.9% |
| Mobile Home / Other | 276 | 2.6% |
| Total | 10,449 | 100.0% |
Housing Structures by Occupancy in Kalispell
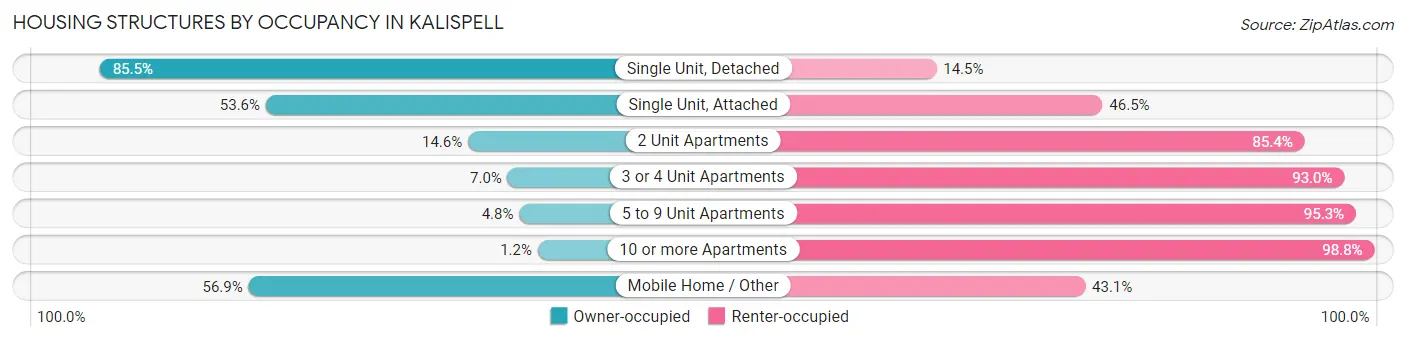
| Structure Type | Owner-occupied | Renter-occupied |
| Single Unit, Detached | 5,137 (85.5%) | 869 (14.5%) |
| Single Unit, Attached | 656 (53.5%) | 569 (46.5%) |
| 2 Unit Apartments | 74 (14.6%) | 432 (85.4%) |
| 3 or 4 Unit Apartments | 54 (7.0%) | 718 (93.0%) |
| 5 to 9 Unit Apartments | 15 (4.8%) | 301 (95.3%) |
| 10 or more Apartments | 16 (1.2%) | 1,332 (98.8%) |
| Mobile Home / Other | 157 (56.9%) | 119 (43.1%) |
| Total | 6,109 (58.5%) | 4,340 (41.5%) |
Housing Structures by Number of Rooms in Kalispell
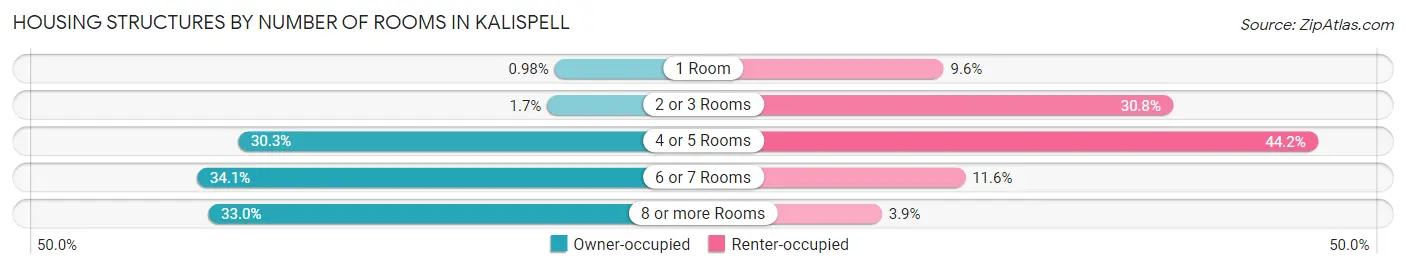
| Number of Rooms | Owner-occupied | Renter-occupied |
| 1 Room | 60 (1.0%) | 416 (9.6%) |
| 2 or 3 Rooms | 102 (1.7%) | 1,336 (30.8%) |
| 4 or 5 Rooms | 1,849 (30.3%) | 1,917 (44.2%) |
| 6 or 7 Rooms | 2,081 (34.1%) | 503 (11.6%) |
| 8 or more Rooms | 2,017 (33.0%) | 168 (3.9%) |
| Total | 6,109 (100.0%) | 4,340 (100.0%) |
Housing Structure by Heating Type in Kalispell
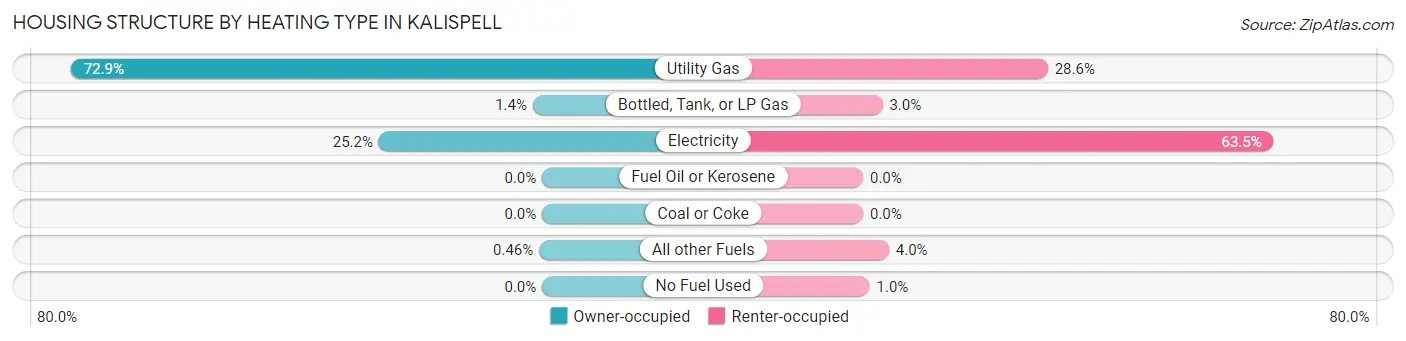
| Heating Type | Owner-occupied | Renter-occupied |
| Utility Gas | 4,451 (72.9%) | 1,239 (28.5%) |
| Bottled, Tank, or LP Gas | 88 (1.4%) | 130 (3.0%) |
| Electricity | 1,542 (25.2%) | 2,754 (63.5%) |
| Fuel Oil or Kerosene | 0 (0.0%) | 0 (0.0%) |
| Coal or Coke | 0 (0.0%) | 0 (0.0%) |
| All other Fuels | 28 (0.5%) | 173 (4.0%) |
| No Fuel Used | 0 (0.0%) | 44 (1.0%) |
| Total | 6,109 (100.0%) | 4,340 (100.0%) |
Household Vehicle Usage in Kalispell
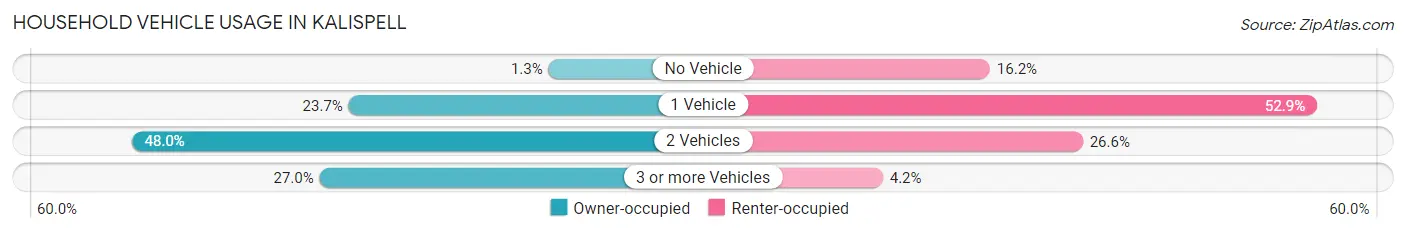
| Vehicles per Household | Owner-occupied | Renter-occupied |
| No Vehicle | 80 (1.3%) | 705 (16.2%) |
| 1 Vehicle | 1,448 (23.7%) | 2,295 (52.9%) |
| 2 Vehicles | 2,934 (48.0%) | 1,156 (26.6%) |
| 3 or more Vehicles | 1,647 (27.0%) | 184 (4.2%) |
| Total | 6,109 (100.0%) | 4,340 (100.0%) |
Real Estate & Mortgages in Kalispell
Real Estate and Mortgage Overview in Kalispell
| Characteristic | Without Mortgage | With Mortgage |
| Housing Units | 1,700 | 4,409 |
| Median Property Value | $327,900 | $344,400 |
| Median Household Income | $61,500 | $945 |
| Monthly Housing Costs | $482 | $225 |
| Real Estate Taxes | $2,758 | $51 |
Property Value by Mortgage Status in Kalispell
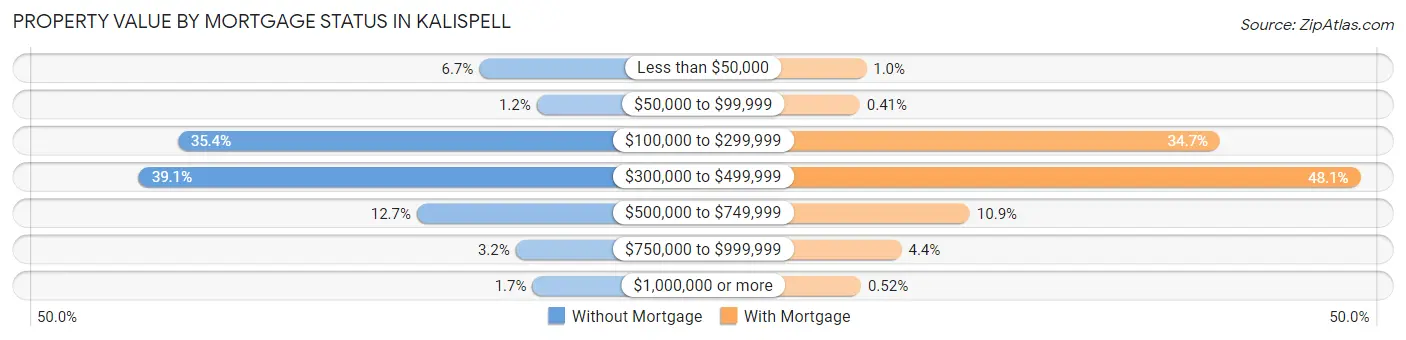
| Property Value | Without Mortgage | With Mortgage |
| Less than $50,000 | 114 (6.7%) | 45 (1.0%) |
| $50,000 to $99,999 | 21 (1.2%) | 18 (0.4%) |
| $100,000 to $299,999 | 602 (35.4%) | 1,530 (34.7%) |
| $300,000 to $499,999 | 665 (39.1%) | 2,120 (48.1%) |
| $500,000 to $749,999 | 215 (12.7%) | 480 (10.9%) |
| $750,000 to $999,999 | 55 (3.2%) | 193 (4.4%) |
| $1,000,000 or more | 28 (1.7%) | 23 (0.5%) |
| Total | 1,700 (100.0%) | 4,409 (100.0%) |
Household Income by Mortgage Status in Kalispell
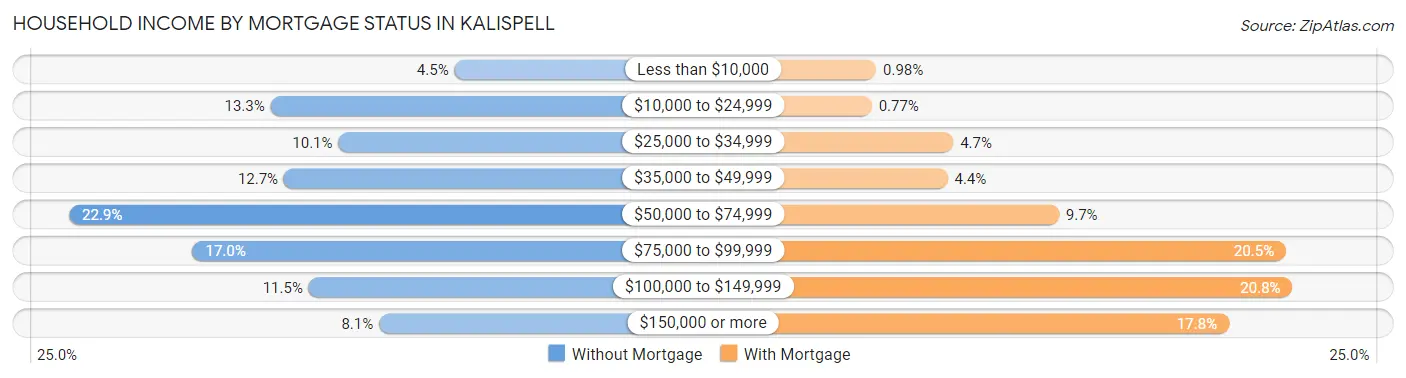
| Household Income | Without Mortgage | With Mortgage |
| Less than $10,000 | 77 (4.5%) | 43 (1.0%) |
| $10,000 to $24,999 | 226 (13.3%) | 34 (0.8%) |
| $25,000 to $34,999 | 171 (10.1%) | 205 (4.6%) |
| $35,000 to $49,999 | 215 (12.7%) | 193 (4.4%) |
| $50,000 to $74,999 | 389 (22.9%) | 427 (9.7%) |
| $75,000 to $99,999 | 289 (17.0%) | 904 (20.5%) |
| $100,000 to $149,999 | 195 (11.5%) | 917 (20.8%) |
| $150,000 or more | 138 (8.1%) | 784 (17.8%) |
| Total | 1,700 (100.0%) | 4,409 (100.0%) |
Property Value to Household Income Ratio in Kalispell
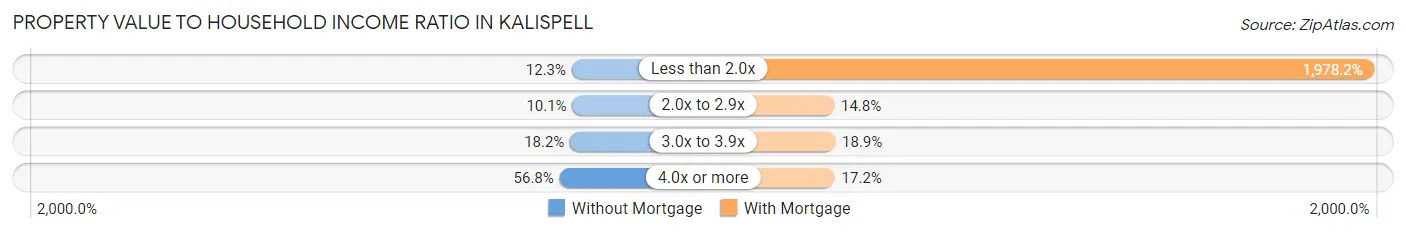
| Value-to-Income Ratio | Without Mortgage | With Mortgage |
| Less than 2.0x | 209 (12.3%) | 87,219 (1,978.2%) |
| 2.0x to 2.9x | 171 (10.1%) | 654 (14.8%) |
| 3.0x to 3.9x | 310 (18.2%) | 833 (18.9%) |
| 4.0x or more | 965 (56.8%) | 757 (17.2%) |
| Total | 1,700 (100.0%) | 4,409 (100.0%) |
Real Estate Taxes by Mortgage Status in Kalispell
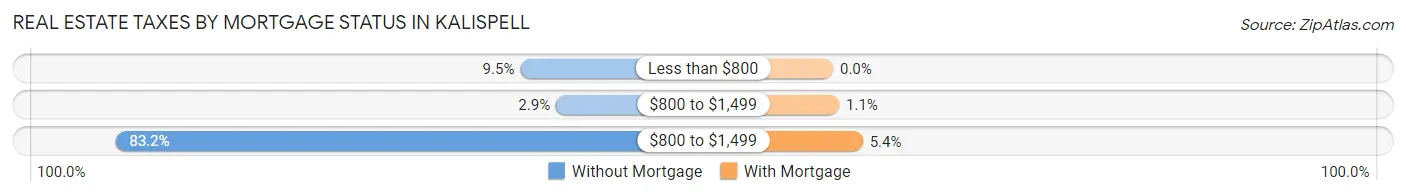
| Property Taxes | Without Mortgage | With Mortgage |
| Less than $800 | 161 (9.5%) | 0 (0.0%) |
| $800 to $1,499 | 50 (2.9%) | 49 (1.1%) |
| $800 to $1,499 | 1,415 (83.2%) | 239 (5.4%) |
| Total | 1,700 (100.0%) | 4,409 (100.0%) |
Health & Disability in Kalispell
Health Insurance Coverage by Age in Kalispell
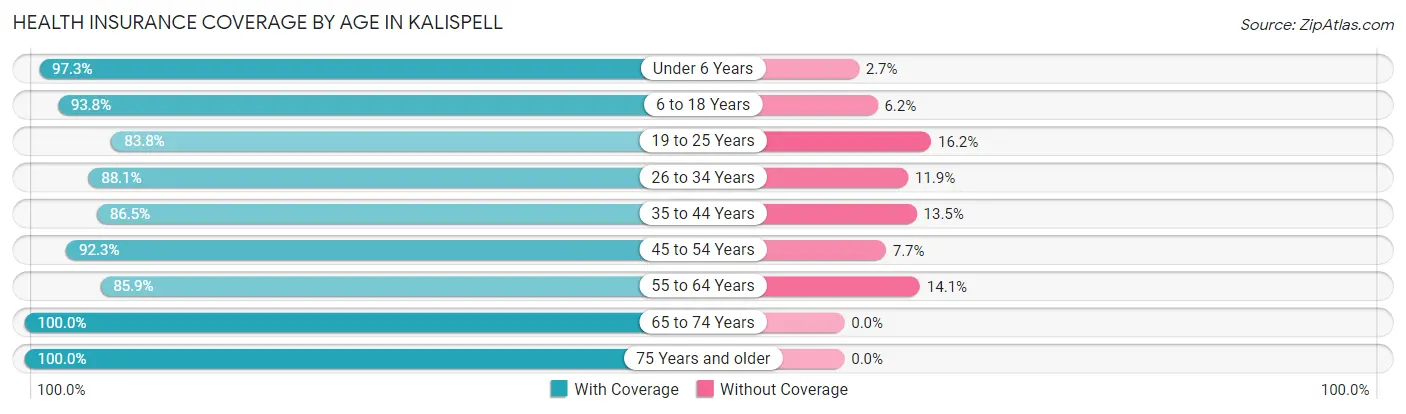
| Age Bracket | With Coverage | Without Coverage |
| Under 6 Years | 2,304 (97.3%) | 64 (2.7%) |
| 6 to 18 Years | 3,742 (93.8%) | 247 (6.2%) |
| 19 to 25 Years | 2,003 (83.8%) | 387 (16.2%) |
| 26 to 34 Years | 3,195 (88.1%) | 431 (11.9%) |
| 35 to 44 Years | 2,838 (86.5%) | 442 (13.5%) |
| 45 to 54 Years | 2,384 (92.3%) | 200 (7.7%) |
| 55 to 64 Years | 2,223 (85.9%) | 365 (14.1%) |
| 65 to 74 Years | 2,191 (100.0%) | 0 (0.0%) |
| 75 Years and older | 2,083 (100.0%) | 0 (0.0%) |
| Total | 22,963 (91.5%) | 2,136 (8.5%) |
Health Insurance Coverage by Citizenship Status in Kalispell
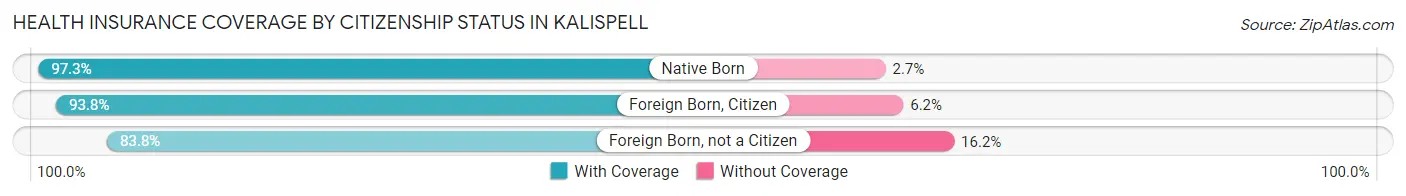
| Citizenship Status | With Coverage | Without Coverage |
| Native Born | 2,304 (97.3%) | 64 (2.7%) |
| Foreign Born, Citizen | 3,742 (93.8%) | 247 (6.2%) |
| Foreign Born, not a Citizen | 2,003 (83.8%) | 387 (16.2%) |
Health Insurance Coverage by Household Income in Kalispell
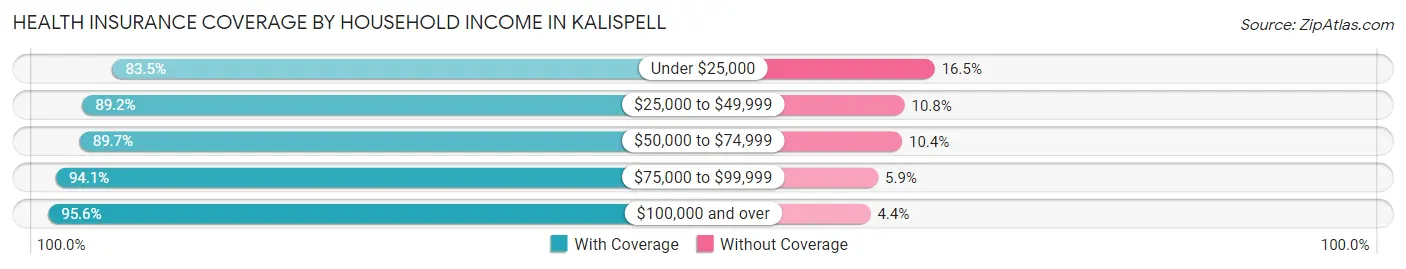
| Household Income | With Coverage | Without Coverage |
| Under $25,000 | 2,569 (83.5%) | 507 (16.5%) |
| $25,000 to $49,999 | 4,270 (89.2%) | 518 (10.8%) |
| $50,000 to $74,999 | 4,494 (89.6%) | 519 (10.3%) |
| $75,000 to $99,999 | 3,764 (94.1%) | 235 (5.9%) |
| $100,000 and over | 7,683 (95.6%) | 357 (4.4%) |
Public vs Private Health Insurance Coverage by Age in Kalispell
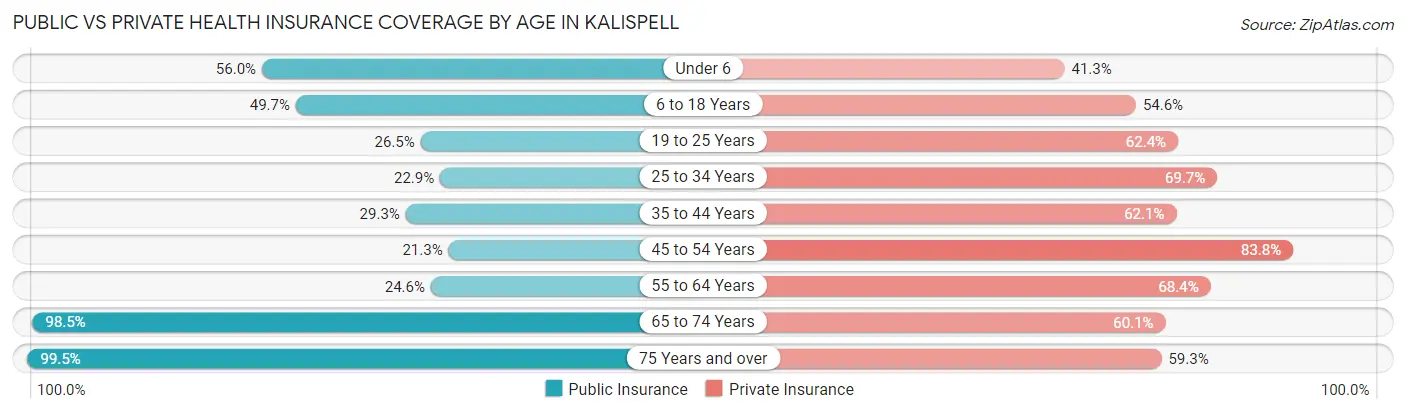
| Age Bracket | Public Insurance | Private Insurance |
| Under 6 | 1,325 (55.9%) | 979 (41.3%) |
| 6 to 18 Years | 1,981 (49.7%) | 2,178 (54.6%) |
| 19 to 25 Years | 633 (26.5%) | 1,491 (62.4%) |
| 25 to 34 Years | 830 (22.9%) | 2,526 (69.7%) |
| 35 to 44 Years | 960 (29.3%) | 2,036 (62.1%) |
| 45 to 54 Years | 551 (21.3%) | 2,164 (83.8%) |
| 55 to 64 Years | 637 (24.6%) | 1,771 (68.4%) |
| 65 to 74 Years | 2,159 (98.5%) | 1,316 (60.1%) |
| 75 Years and over | 2,072 (99.5%) | 1,236 (59.3%) |
| Total | 11,148 (44.4%) | 15,697 (62.5%) |
Disability Status by Sex by Age in Kalispell
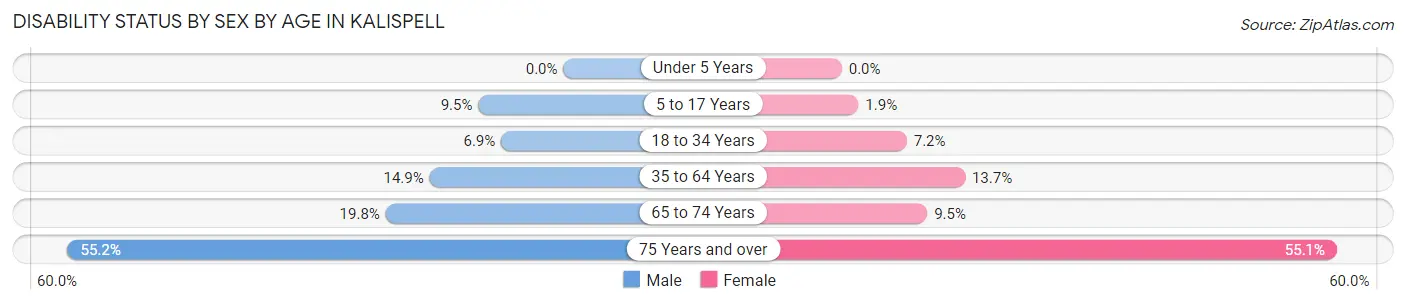
| Age Bracket | Male | Female |
| Under 5 Years | 0 (0.0%) | 0 (0.0%) |
| 5 to 17 Years | 209 (9.5%) | 34 (1.8%) |
| 18 to 34 Years | 224 (6.9%) | 226 (7.2%) |
| 35 to 64 Years | 609 (14.9%) | 599 (13.7%) |
| 65 to 74 Years | 188 (19.8%) | 118 (9.5%) |
| 75 Years and over | 429 (55.2%) | 720 (55.1%) |
Disability Class by Sex by Age in Kalispell
Disability Class: Hearing Difficulty
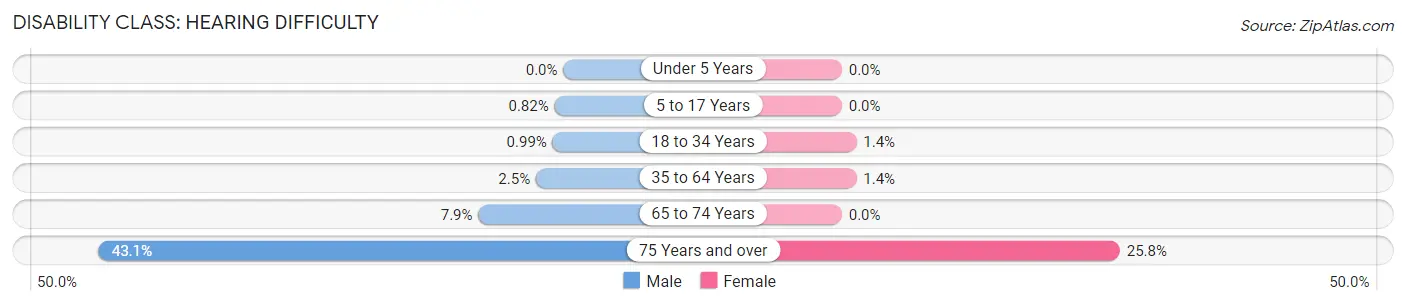
| Age Bracket | Male | Female |
| Under 5 Years | 0 (0.0%) | 0 (0.0%) |
| 5 to 17 Years | 18 (0.8%) | 0 (0.0%) |
| 18 to 34 Years | 32 (1.0%) | 42 (1.3%) |
| 35 to 64 Years | 104 (2.5%) | 59 (1.3%) |
| 65 to 74 Years | 75 (7.9%) | 0 (0.0%) |
| 75 Years and over | 335 (43.1%) | 337 (25.8%) |
Disability Class: Vision Difficulty
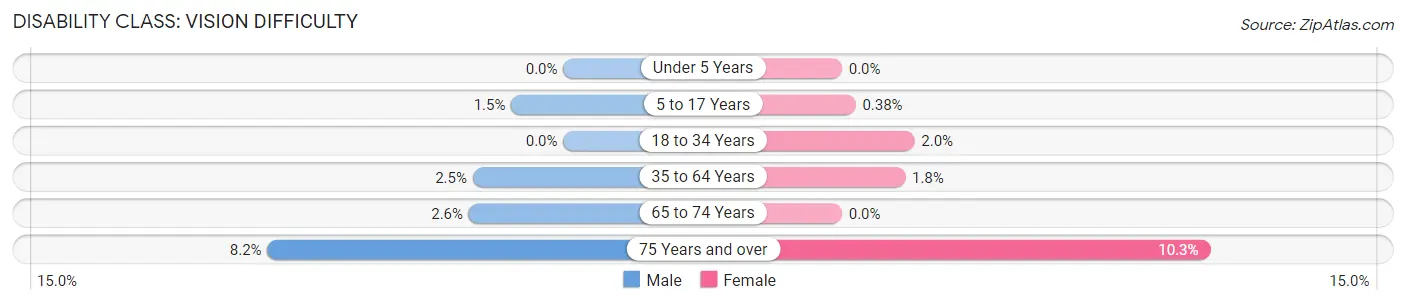
| Age Bracket | Male | Female |
| Under 5 Years | 0 (0.0%) | 0 (0.0%) |
| 5 to 17 Years | 32 (1.5%) | 7 (0.4%) |
| 18 to 34 Years | 0 (0.0%) | 63 (2.0%) |
| 35 to 64 Years | 103 (2.5%) | 77 (1.8%) |
| 65 to 74 Years | 25 (2.6%) | 0 (0.0%) |
| 75 Years and over | 64 (8.2%) | 134 (10.3%) |
Disability Class: Cognitive Difficulty
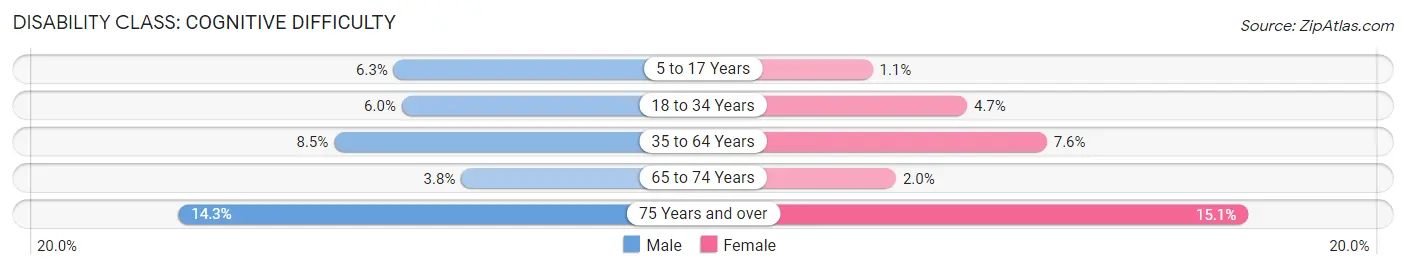
| Age Bracket | Male | Female |
| 5 to 17 Years | 139 (6.3%) | 21 (1.1%) |
| 18 to 34 Years | 194 (6.0%) | 145 (4.6%) |
| 35 to 64 Years | 348 (8.5%) | 332 (7.6%) |
| 65 to 74 Years | 36 (3.8%) | 25 (2.0%) |
| 75 Years and over | 111 (14.3%) | 197 (15.1%) |
Disability Class: Ambulatory Difficulty
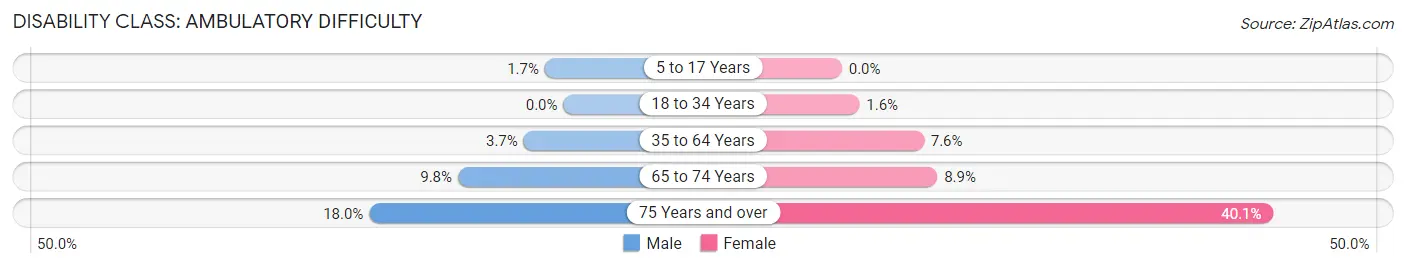
| Age Bracket | Male | Female |
| 5 to 17 Years | 38 (1.7%) | 0 (0.0%) |
| 18 to 34 Years | 0 (0.0%) | 51 (1.6%) |
| 35 to 64 Years | 151 (3.7%) | 332 (7.6%) |
| 65 to 74 Years | 93 (9.8%) | 110 (8.9%) |
| 75 Years and over | 140 (18.0%) | 523 (40.1%) |
Disability Class: Self-Care Difficulty
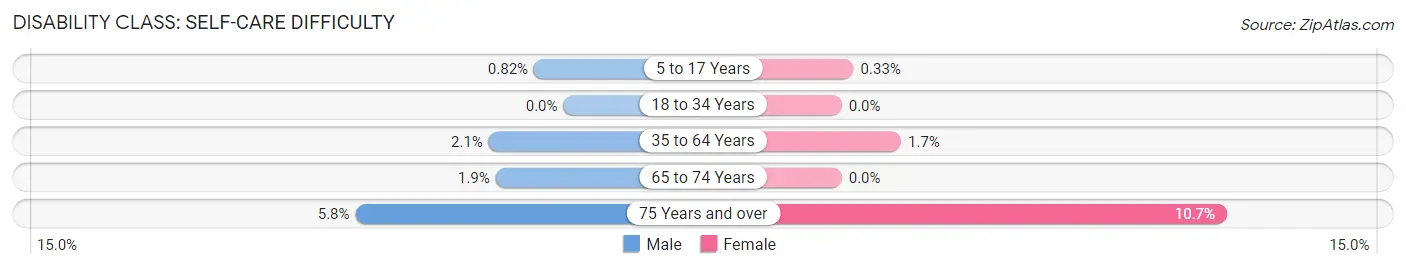
| Age Bracket | Male | Female |
| 5 to 17 Years | 18 (0.8%) | 6 (0.3%) |
| 18 to 34 Years | 0 (0.0%) | 0 (0.0%) |
| 35 to 64 Years | 85 (2.1%) | 72 (1.7%) |
| 65 to 74 Years | 18 (1.9%) | 0 (0.0%) |
| 75 Years and over | 45 (5.8%) | 140 (10.7%) |
Technology Access in Kalispell
Computing Device Access in Kalispell
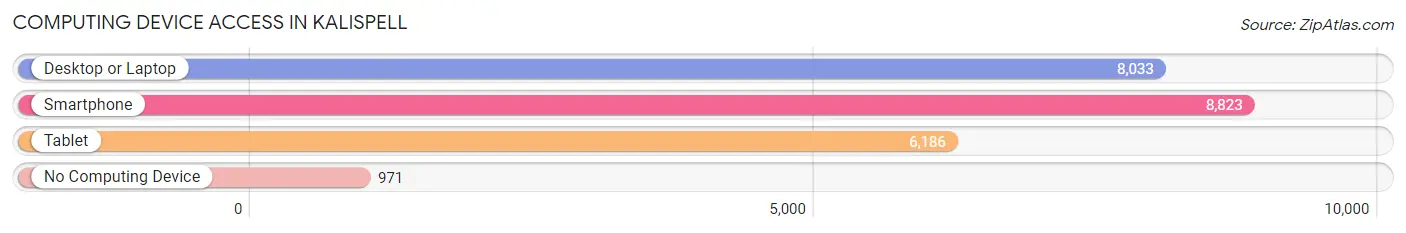
| Device Type | # Households | % Households |
| Desktop or Laptop | 8,033 | 76.9% |
| Smartphone | 8,823 | 84.4% |
| Tablet | 6,186 | 59.2% |
| No Computing Device | 971 | 9.3% |
| Total | 10,449 | 100.0% |
Internet Access in Kalispell
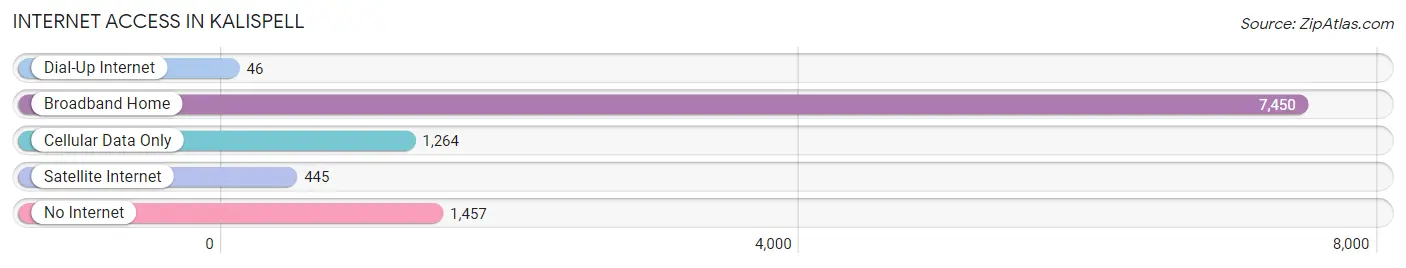
| Internet Type | # Households | % Households |
| Dial-Up Internet | 46 | 0.4% |
| Broadband Home | 7,450 | 71.3% |
| Cellular Data Only | 1,264 | 12.1% |
| Satellite Internet | 445 | 4.3% |
| No Internet | 1,457 | 13.9% |
| Total | 10,449 | 100.0% |
Kalispell Summary
Kalispell, Montana is a city located in the northwestern part of the state, in Flathead County. It is the county seat and the largest city in the county. Kalispell is situated in the Flathead Valley, surrounded by the Rocky Mountains and the Flathead National Forest. The city is located about 30 miles from the Canadian border and is the gateway to Glacier National Park. Kalispell is the commercial, cultural, and medical center of the Flathead Valley, and is the fifth largest city in Montana.
History
Kalispell was founded in 1891 by Charles E. Conrad, a businessman from Fort Benton, Montana. Conrad had been sent to the area by the Great Northern Railway to establish a town that would serve as a hub for the railway. The town was named after the Kalispell tribe of Native Americans who had lived in the area for centuries.
The city grew rapidly in the early 20th century, and by 1910, it had a population of over 3,000. Kalispell was incorporated in 1912, and by 1920, the population had grown to over 5,000. The city continued to grow throughout the 20th century, and by 2000, the population had reached over 19,000.
Geography
Kalispell is located in the northwestern part of Montana, in Flathead County. The city is situated in the Flathead Valley, surrounded by the Rocky Mountains and the Flathead National Forest. The city is located about 30 miles from the Canadian border and is the gateway to Glacier National Park.
The city has a total area of 11.2 square miles, of which 11.1 square miles is land and 0.1 square miles is water. The city is located at an elevation of 2,945 feet above sea level.
Economy
Kalispell’s economy is largely based on tourism, agriculture, and manufacturing. The city is home to several large companies, including Glacier Bancorp, Kalispell Regional Medical Center, and Glacier Bank.
The city is also home to several major tourist attractions, including Glacier National Park, Flathead Lake, and Whitefish Mountain Resort. Tourism is a major contributor to the local economy, and the city is home to several hotels, restaurants, and other tourist-related businesses.
Agriculture is also an important part of the local economy. The Flathead Valley is home to several large farms and ranches, and the city is home to several agricultural-related businesses.
Demographics
As of the 2010 census, Kalispell had a population of 19,927. The racial makeup of the city was 90.2% White, 0.7% African American, 1.2% Native American, 1.3% Asian, 0.2% Pacific Islander, 3.3% from other races, and 3.2% from two or more races. Hispanic or Latino of any race were 6.2% of the population.
The median income for a household in the city was $41,945, and the median income for a family was $50,945. The per capita income for the city was $22,845. About 11.2% of families and 15.2% of the population were below the poverty line, including 21.2% of those under age 18 and 8.2% of those age 65 or over.
Common Questions
What is Per Capita Income in Kalispell?
Per Capita income in Kalispell is $32,570.
What is the Median Family Income in Kalispell?
Median Family Income in Kalispell is $78,386.
What is the Median Household income in Kalispell?
Median Household Income in Kalispell is $57,123.
What is Income or Wage Gap in Kalispell?
Income or Wage Gap in Kalispell is 27.9%.
Women in Kalispell earn 72.1 cents for every dollar earned by a man.
What is Inequality or Gini Index in Kalispell?
Inequality or Gini Index in Kalispell is 0.44.
What is the Total Population of Kalispell?
Total Population of Kalispell is 25,473.
What is the Total Male Population of Kalispell?
Total Male Population of Kalispell is 12,244.
What is the Total Female Population of Kalispell?
Total Female Population of Kalispell is 13,229.
What is the Ratio of Males per 100 Females in Kalispell?
There are 92.55 Males per 100 Females in Kalispell.
What is the Ratio of Females per 100 Males in Kalispell?
There are 108.04 Females per 100 Males in Kalispell.
What is the Median Population Age in Kalispell?
Median Population Age in Kalispell is 35.8 Years.
What is the Average Family Size in Kalispell
Average Family Size in Kalispell is 3.2 People.
What is the Average Household Size in Kalispell
Average Household Size in Kalispell is 2.4 People.
How Large is the Labor Force in Kalispell?
There are 13,048 People in the Labor Forcein in Kalispell.
What is the Percentage of People in the Labor Force in Kalispell?
64.6% of People are in the Labor Force in Kalispell.
What is the Unemployment Rate in Kalispell?
Unemployment Rate in Kalispell is 4.1%.