Maud, OK Map & Demographics
Maud Map
Maud Overview
$20,346
PER CAPITA INCOME
$54,688
AVG FAMILY INCOME
$49,013
AVG HOUSEHOLD INCOME
39.3%
WAGE / INCOME GAP [ % ]
60.7¢/ $1
WAGE / INCOME GAP [ $ ]
0.38
INEQUALITY / GINI INDEX
872
TOTAL POPULATION
439
MALE POPULATION
433
FEMALE POPULATION
101.39
MALES / 100 FEMALES
98.63
FEMALES / 100 MALES
30.9
MEDIAN AGE
3.4
AVG FAMILY SIZE
2.9
AVG HOUSEHOLD SIZE
322
LABOR FORCE [ PEOPLE ]
48.2%
PERCENT IN LABOR FORCE
5.9%
UNEMPLOYMENT RATE
Maud Zip Codes
Maud Area Codes
Income in Maud
Income Overview in Maud
Per Capita Income in Maud is $20,346, while median incomes of families and households are $54,688 and $49,013 respectively.
| Characteristic | Number | Measure |
| Per Capita Income | 872 | $20,346 |
| Median Family Income | 199 | $54,688 |
| Mean Family Income | 199 | $64,829 |
| Median Household Income | 297 | $49,013 |
| Mean Household Income | 297 | $56,420 |
| Income Deficit | 199 | $0 |
| Wage / Income Gap (%) | 872 | 39.25% |
| Wage / Income Gap ($) | 872 | 60.75¢ per $1 |
| Gini / Inequality Index | 872 | 0.38 |
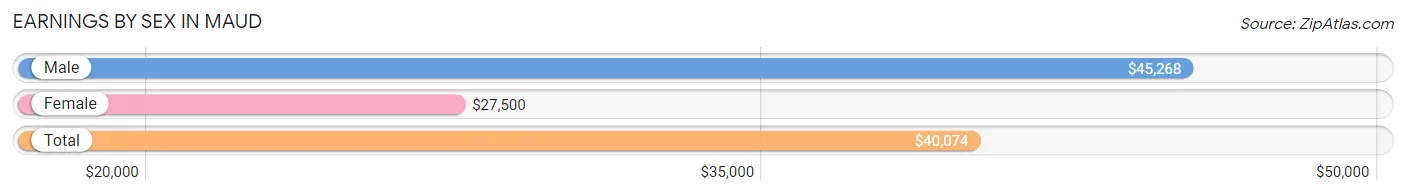
Earnings by Sex in Maud
Average Earnings in Maud are $40,074, $45,268 for men and $27,500 for women, a difference of 39.3%.
| Sex | Number | Average Earnings |
| Male | 187 (53.6%) | $45,268 |
| Female | 162 (46.4%) | $27,500 |
| Total | 349 (100.0%) | $40,074 |
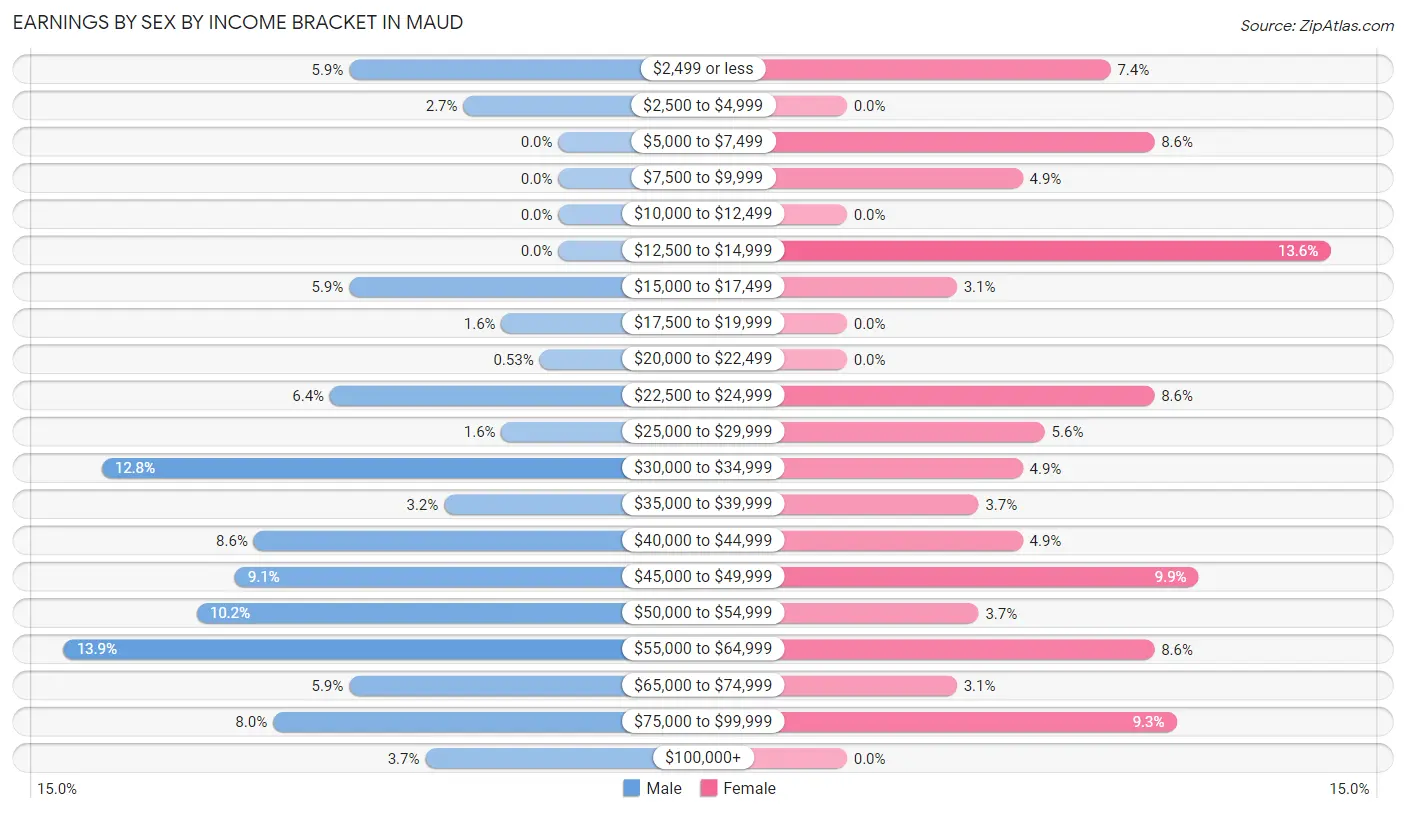
Earnings by Sex by Income Bracket in Maud
The most common earnings brackets in Maud are $55,000 to $64,999 for men (26 | 13.9%) and $12,500 to $14,999 for women (22 | 13.6%).
| Income | Male | Female |
| $2,499 or less | 11 (5.9%) | 12 (7.4%) |
| $2,500 to $4,999 | 5 (2.7%) | 0 (0.0%) |
| $5,000 to $7,499 | 0 (0.0%) | 14 (8.6%) |
| $7,500 to $9,999 | 0 (0.0%) | 8 (4.9%) |
| $10,000 to $12,499 | 0 (0.0%) | 0 (0.0%) |
| $12,500 to $14,999 | 0 (0.0%) | 22 (13.6%) |
| $15,000 to $17,499 | 11 (5.9%) | 5 (3.1%) |
| $17,500 to $19,999 | 3 (1.6%) | 0 (0.0%) |
| $20,000 to $22,499 | 1 (0.5%) | 0 (0.0%) |
| $22,500 to $24,999 | 12 (6.4%) | 14 (8.6%) |
| $25,000 to $29,999 | 3 (1.6%) | 9 (5.6%) |
| $30,000 to $34,999 | 24 (12.8%) | 8 (4.9%) |
| $35,000 to $39,999 | 6 (3.2%) | 6 (3.7%) |
| $40,000 to $44,999 | 16 (8.6%) | 8 (4.9%) |
| $45,000 to $49,999 | 17 (9.1%) | 16 (9.9%) |
| $50,000 to $54,999 | 19 (10.2%) | 6 (3.7%) |
| $55,000 to $64,999 | 26 (13.9%) | 14 (8.6%) |
| $65,000 to $74,999 | 11 (5.9%) | 5 (3.1%) |
| $75,000 to $99,999 | 15 (8.0%) | 15 (9.3%) |
| $100,000+ | 7 (3.7%) | 0 (0.0%) |
| Total | 187 (100.0%) | 162 (100.0%) |
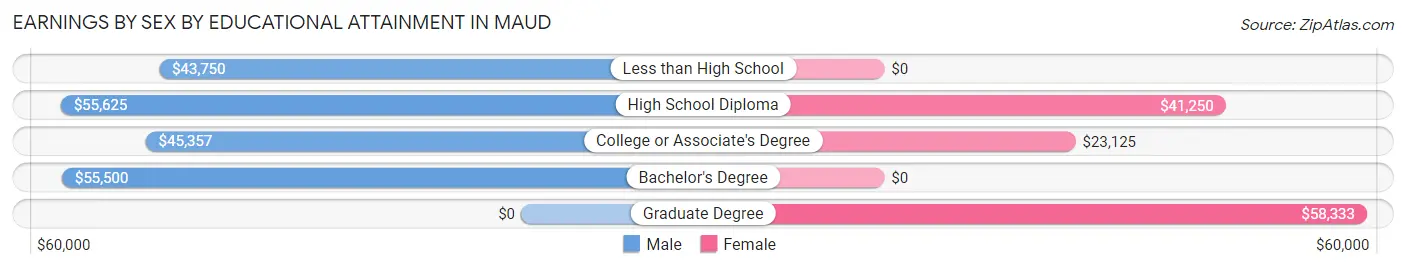
Earnings by Sex by Educational Attainment in Maud
Average earnings in Maud are $50,341 for men and $28,750 for women, a difference of 42.9%. Men with an educational attainment of high school diploma enjoy the highest average annual earnings of $55,625, while those with less than high school education earn the least with $43,750. Women with an educational attainment of graduate degree earn the most with the average annual earnings of $58,333, while those with college or associate's degree education have the smallest earnings of $23,125.
| Educational Attainment | Male Income | Female Income |
| Less than High School | $43,750 | $0 |
| High School Diploma | $55,625 | $41,250 |
| College or Associate's Degree | $45,357 | $23,125 |
| Bachelor's Degree | $55,500 | $0 |
| Graduate Degree | - | - |
| Total | $50,341 | $28,750 |
Family Income in Maud
Family Income Brackets in Maud
According to the Maud family income data, there are 41 families falling into the $100,000 to $149,999 income range, which is the most common income bracket and makes up 20.6% of all families. Conversely, the $10,000 to $14,999 income bracket is the least frequent group with only 1 families (0.5%) belonging to this category.
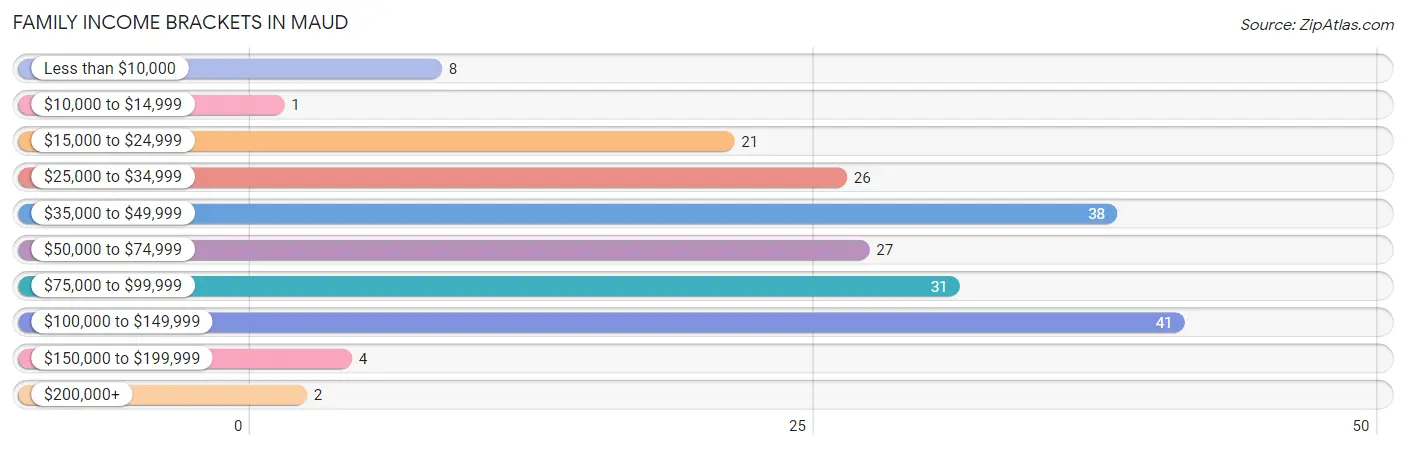
| Income Bracket | # Families | % Families |
| Less than $10,000 | 8 | 4.0% |
| $10,000 to $14,999 | 1 | 0.5% |
| $15,000 to $24,999 | 21 | 10.6% |
| $25,000 to $34,999 | 26 | 13.1% |
| $35,000 to $49,999 | 38 | 19.1% |
| $50,000 to $74,999 | 27 | 13.6% |
| $75,000 to $99,999 | 31 | 15.6% |
| $100,000 to $149,999 | 41 | 20.6% |
| $150,000 to $199,999 | 4 | 2.0% |
| $200,000+ | 2 | 1.0% |
Family Income by Famaliy Size in Maud
7+ person families (12 | 6.0%) account for the highest median family income in Maud with $118,333 per family, while 3-person families (52 | 26.1%) have the highest median income of $24,167 per family member.
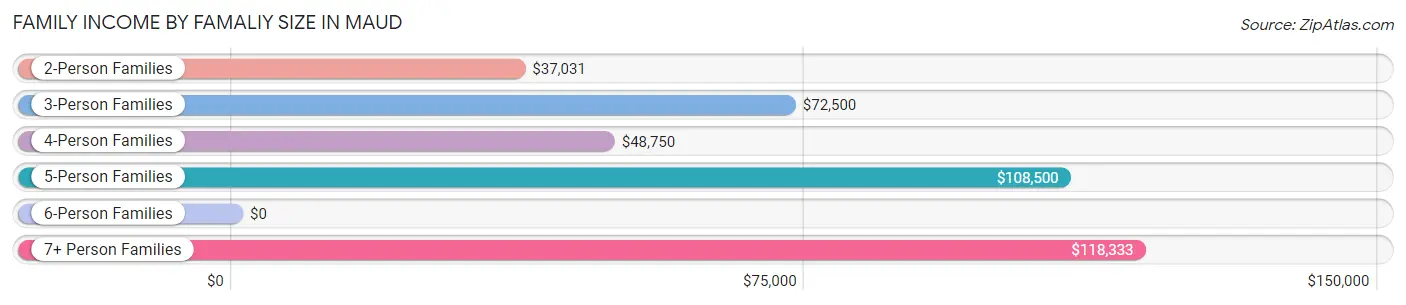
| Income Bracket | # Families | Median Income |
| 2-Person Families | 87 (43.7%) | $37,031 |
| 3-Person Families | 52 (26.1%) | $72,500 |
| 4-Person Families | 25 (12.6%) | $48,750 |
| 5-Person Families | 20 (10.1%) | $108,500 |
| 6-Person Families | 3 (1.5%) | $0 |
| 7+ Person Families | 12 (6.0%) | $118,333 |
| Total | 199 (100.0%) | $54,688 |
Family Income by Number of Earners in Maud
The median family income in Maud is $54,688, with families comprising 3+ earners (10) having the highest median family income of $140,625, while families with no earners (45) have the lowest median family income of $35,250, accounting for 5.0% and 22.6% of families, respectively.
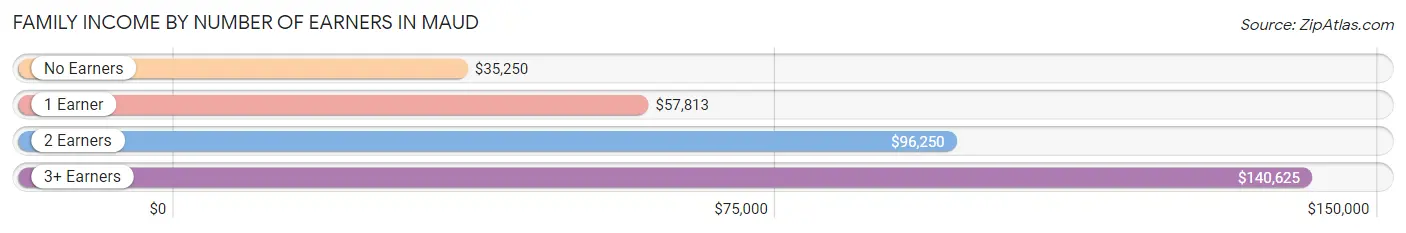
| Number of Earners | # Families | Median Income |
| No Earners | 45 (22.6%) | $35,250 |
| 1 Earner | 84 (42.2%) | $57,813 |
| 2 Earners | 60 (30.1%) | $96,250 |
| 3+ Earners | 10 (5.0%) | $140,625 |
| Total | 199 (100.0%) | $54,688 |
Household Income in Maud
Household Income Brackets in Maud
With 54 households falling in the category, the $50,000 to $74,999 income range is the most frequent in Maud, accounting for 18.2% of all households. In contrast, only 2 households (0.7%) fall into the $200,000+ income bracket, making it the least populous group.
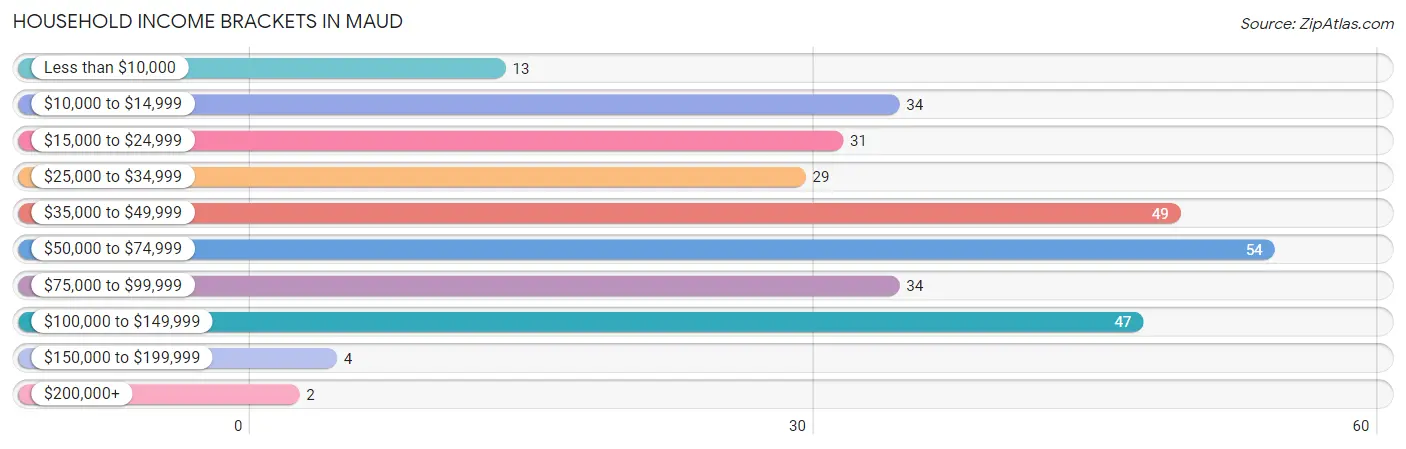
| Income Bracket | # Households | % Households |
| Less than $10,000 | 13 | 4.4% |
| $10,000 to $14,999 | 34 | 11.4% |
| $15,000 to $24,999 | 31 | 10.4% |
| $25,000 to $34,999 | 29 | 9.8% |
| $35,000 to $49,999 | 49 | 16.5% |
| $50,000 to $74,999 | 54 | 18.2% |
| $75,000 to $99,999 | 34 | 11.4% |
| $100,000 to $149,999 | 47 | 15.8% |
| $150,000 to $199,999 | 4 | 1.3% |
| $200,000+ | 2 | 0.7% |
Household Income by Householder Age in Maud
The median household income in Maud is $49,013, with the highest median household income of $56,932 found in the 25 to 44 years age bracket for the primary householder. A total of 111 households (37.4%) fall into this category. Meanwhile, the 15 to 24 years age bracket for the primary householder has the lowest median household income of $30,833, with 8 households (2.7%) in this group.
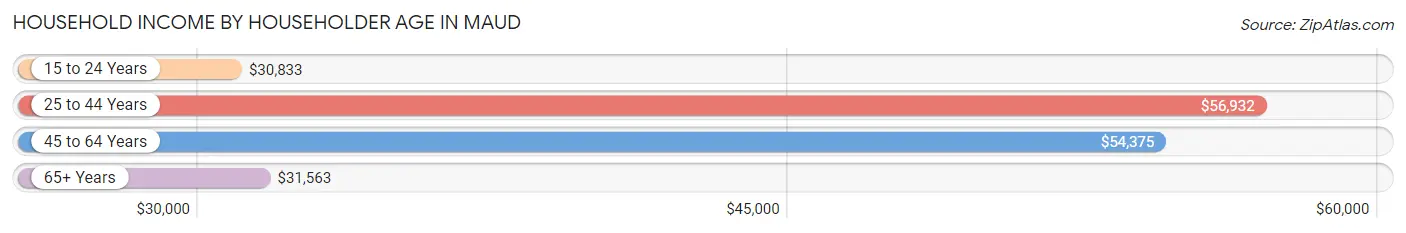
| Income Bracket | # Households | Median Income |
| 15 to 24 Years | 8 (2.7%) | $30,833 |
| 25 to 44 Years | 111 (37.4%) | $56,932 |
| 45 to 64 Years | 111 (37.4%) | $54,375 |
| 65+ Years | 67 (22.6%) | $31,563 |
| Total | 297 (100.0%) | $49,013 |
Poverty in Maud
Income Below Poverty by Sex and Age in Maud
With 13.2% poverty level for males and 25.7% for females among the residents of Maud, 18 to 24 year old males and 15 year old females are the most vulnerable to poverty, with 11 males (21.1%) and 5 females (62.5%) in their respective age groups living below the poverty level.
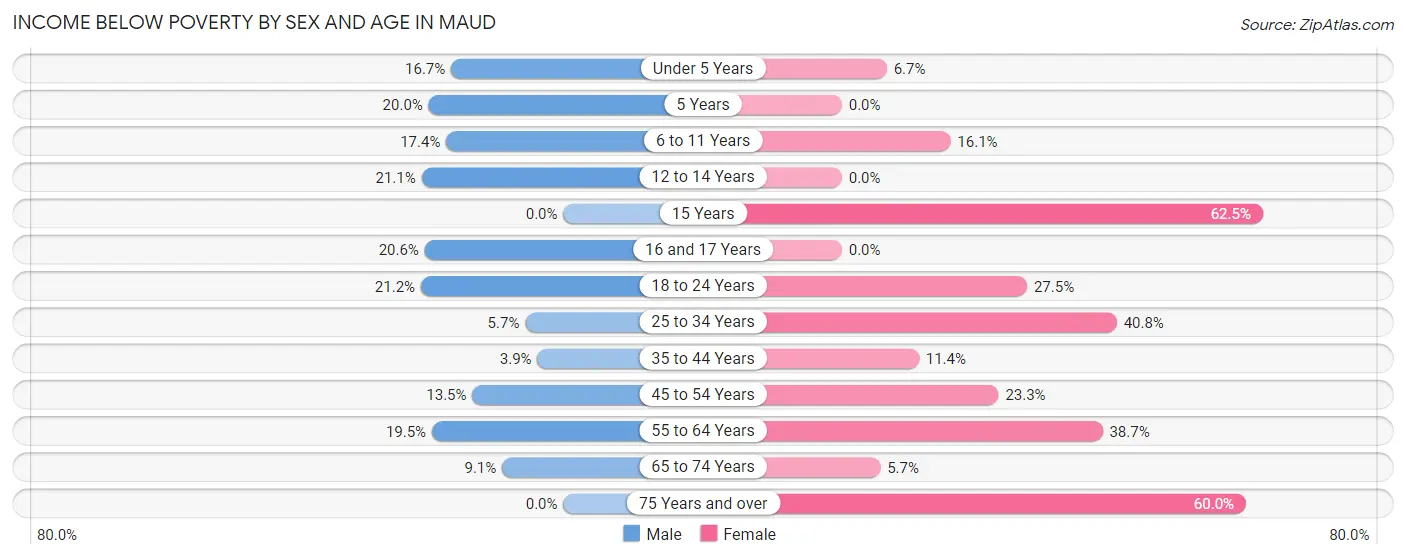
| Age Bracket | Male | Female |
| Under 5 Years | 4 (16.7%) | 2 (6.7%) |
| 5 Years | 2 (20.0%) | 0 (0.0%) |
| 6 to 11 Years | 4 (17.4%) | 5 (16.1%) |
| 12 to 14 Years | 4 (21.0%) | 0 (0.0%) |
| 15 Years | 0 (0.0%) | 5 (62.5%) |
| 16 and 17 Years | 7 (20.6%) | 0 (0.0%) |
| 18 to 24 Years | 11 (21.1%) | 11 (27.5%) |
| 25 to 34 Years | 3 (5.7%) | 40 (40.8%) |
| 35 to 44 Years | 2 (3.8%) | 4 (11.4%) |
| 45 to 54 Years | 5 (13.5%) | 10 (23.3%) |
| 55 to 64 Years | 8 (19.5%) | 24 (38.7%) |
| 65 to 74 Years | 4 (9.1%) | 2 (5.7%) |
| 75 Years and over | 0 (0.0%) | 6 (60.0%) |
| Total | 54 (13.2%) | 109 (25.7%) |
Income Above Poverty by Sex and Age in Maud
According to the poverty statistics in Maud, males aged 15 years and females aged 5 years are the age groups that are most secure financially, with 100.0% of males and 100.0% of females in these age groups living above the poverty line.
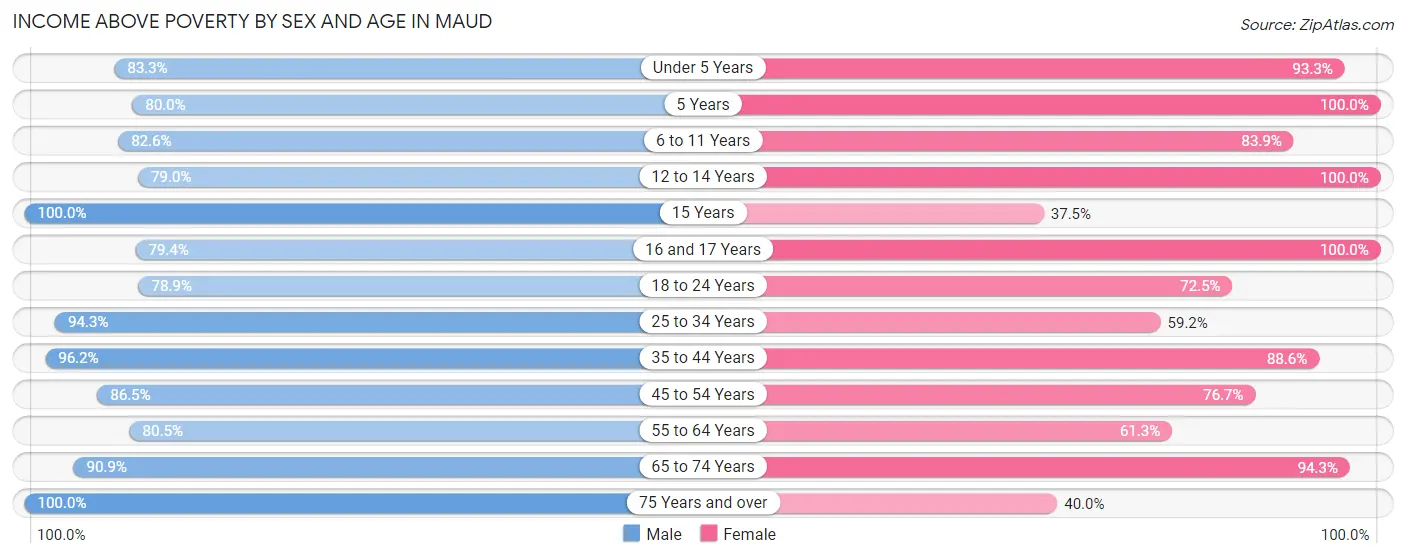
| Age Bracket | Male | Female |
| Under 5 Years | 20 (83.3%) | 28 (93.3%) |
| 5 Years | 8 (80.0%) | 6 (100.0%) |
| 6 to 11 Years | 19 (82.6%) | 26 (83.9%) |
| 12 to 14 Years | 15 (78.9%) | 14 (100.0%) |
| 15 Years | 9 (100.0%) | 3 (37.5%) |
| 16 and 17 Years | 27 (79.4%) | 12 (100.0%) |
| 18 to 24 Years | 41 (78.8%) | 29 (72.5%) |
| 25 to 34 Years | 50 (94.3%) | 58 (59.2%) |
| 35 to 44 Years | 50 (96.2%) | 31 (88.6%) |
| 45 to 54 Years | 32 (86.5%) | 33 (76.7%) |
| 55 to 64 Years | 33 (80.5%) | 38 (61.3%) |
| 65 to 74 Years | 40 (90.9%) | 33 (94.3%) |
| 75 Years and over | 11 (100.0%) | 4 (40.0%) |
| Total | 355 (86.8%) | 315 (74.3%) |
Income Below Poverty Among Married-Couple Families in Maud
The poverty statistics for married-couple families in Maud show that 4.4% or 6 of the total 135 families live below the poverty line. Families with 3 or 4 children have the highest poverty rate of 10.5%, comprising of 2 families. On the other hand, families with 1 or 2 children have the lowest poverty rate of 0.0%, which includes 0 families.
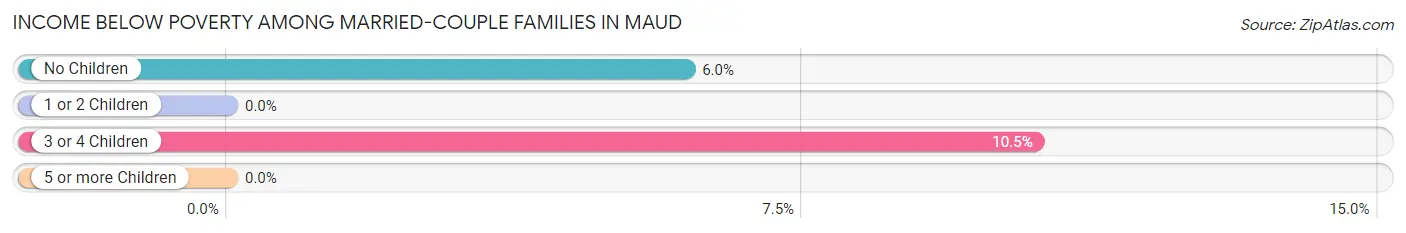
| Children | Above Poverty | Below Poverty |
| No Children | 63 (94.0%) | 4 (6.0%) |
| 1 or 2 Children | 43 (100.0%) | 0 (0.0%) |
| 3 or 4 Children | 17 (89.5%) | 2 (10.5%) |
| 5 or more Children | 6 (100.0%) | 0 (0.0%) |
| Total | 129 (95.6%) | 6 (4.4%) |
Income Below Poverty Among Single-Parent Households in Maud
According to the poverty data in Maud, 18.2% or 4 single-father households and 30.9% or 13 single-mother households are living below the poverty line. Among single-father households, those with 1 or 2 children have the highest poverty rate, with 4 households (33.3%) experiencing poverty. Likewise, among single-mother households, those with 3 or 4 children have the highest poverty rate, with 2 households (66.7%) falling below the poverty line.
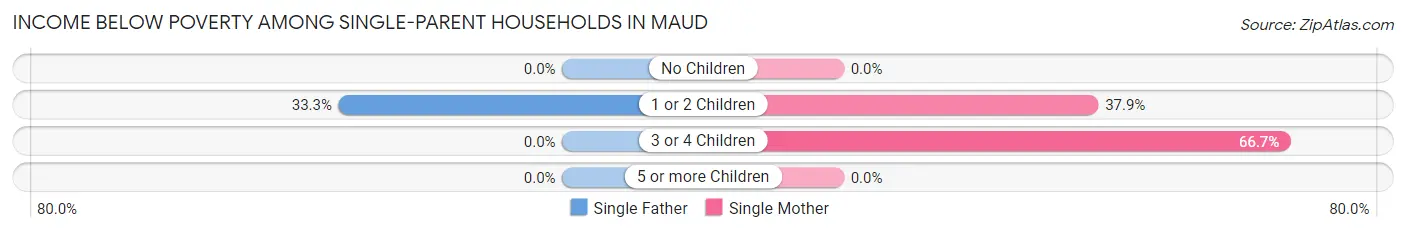
| Children | Single Father | Single Mother |
| No Children | 0 (0.0%) | 0 (0.0%) |
| 1 or 2 Children | 4 (33.3%) | 11 (37.9%) |
| 3 or 4 Children | 0 (0.0%) | 2 (66.7%) |
| 5 or more Children | 0 (0.0%) | 0 (0.0%) |
| Total | 4 (18.2%) | 13 (30.9%) |
Income Below Poverty Among Married-Couple vs Single-Parent Households in Maud
The poverty data for Maud shows that 6 of the married-couple family households (4.4%) and 17 of the single-parent households (26.6%) are living below the poverty level. Within the married-couple family households, those with 3 or 4 children have the highest poverty rate, with 2 households (10.5%) falling below the poverty line. Among the single-parent households, those with 3 or 4 children have the highest poverty rate, with 2 household (66.7%) living below poverty.
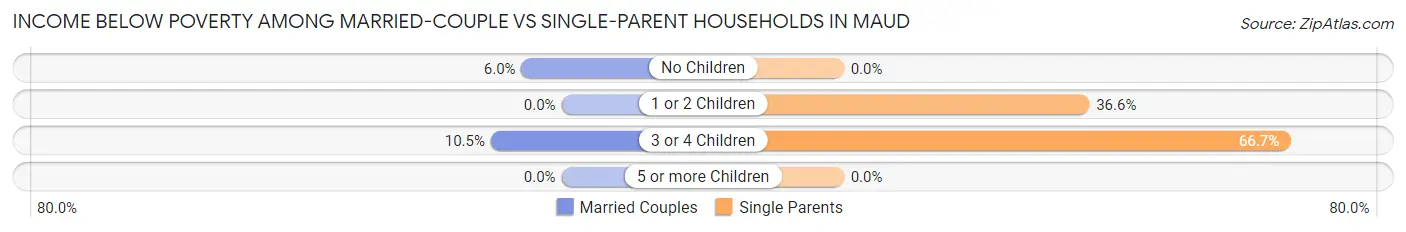
| Children | Married-Couple Families | Single-Parent Households |
| No Children | 4 (6.0%) | 0 (0.0%) |
| 1 or 2 Children | 0 (0.0%) | 15 (36.6%) |
| 3 or 4 Children | 2 (10.5%) | 2 (66.7%) |
| 5 or more Children | 0 (0.0%) | 0 (0.0%) |
| Total | 6 (4.4%) | 17 (26.6%) |
Race in Maud
The most populous races in Maud are White / Caucasian (691 | 79.2%), Native / Alaskan (121 | 13.9%), and Hispanic or Latino (61 | 7.0%).
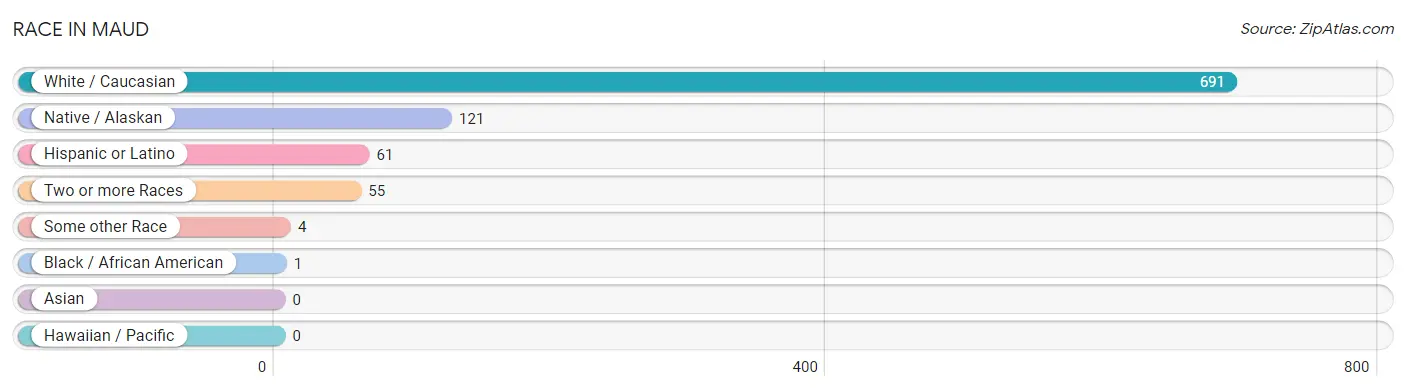
| Race | # Population | % Population |
| Asian | 0 | 0.0% |
| Black / African American | 1 | 0.1% |
| Hawaiian / Pacific | 0 | 0.0% |
| Hispanic or Latino | 61 | 7.0% |
| Native / Alaskan | 121 | 13.9% |
| White / Caucasian | 691 | 79.2% |
| Two or more Races | 55 | 6.3% |
| Some other Race | 4 | 0.5% |
| Total | 872 | 100.0% |
Ancestry in Maud
The most populous ancestries reported in Maud are English (88 | 10.1%), Seminole (63 | 7.2%), Irish (59 | 6.8%), Mexican (58 | 6.7%), and American (50 | 5.7%), together accounting for 36.5% of all Maud residents.
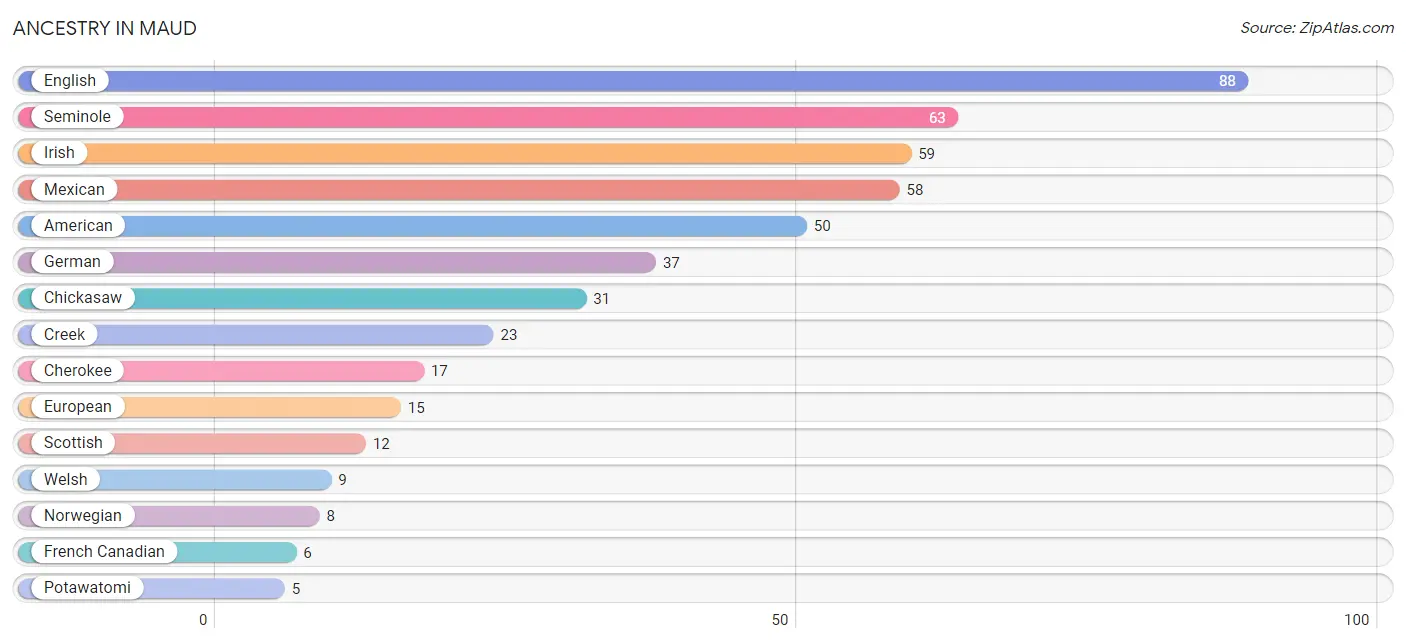
| Ancestry | # Population | % Population |
| American | 50 | 5.7% |
| Cherokee | 17 | 1.9% |
| Chickasaw | 31 | 3.6% |
| Choctaw | 4 | 0.5% |
| Creek | 23 | 2.6% |
| English | 88 | 10.1% |
| European | 15 | 1.7% |
| French Canadian | 6 | 0.7% |
| German | 37 | 4.2% |
| Irish | 59 | 6.8% |
| Italian | 3 | 0.3% |
| Kiowa | 4 | 0.5% |
| Mexican | 58 | 6.7% |
| Native Hawaiian | 3 | 0.3% |
| Norwegian | 8 | 0.9% |
| Potawatomi | 5 | 0.6% |
| Russian | 3 | 0.3% |
| Scandinavian | 1 | 0.1% |
| Scotch-Irish | 5 | 0.6% |
| Scottish | 12 | 1.4% |
| Seminole | 63 | 7.2% |
| Spanish | 3 | 0.3% |
| Welsh | 9 | 1.0% | View All 23 Rows |
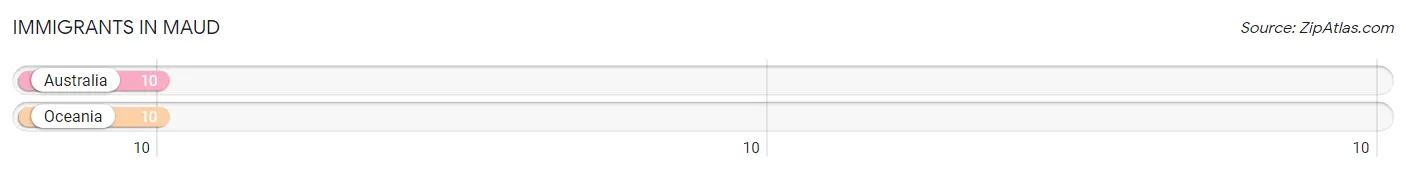
Immigrants in Maud
The most numerous immigrant groups reported in Maud came from Australia (10 | 1.1%), and Oceania (10 | 1.1%), together accounting for 2.3% of all Maud residents.
| Immigration Origin | # Population | % Population |
| Australia | 10 | 1.1% |
| Oceania | 10 | 1.1% | View All 2 Rows |
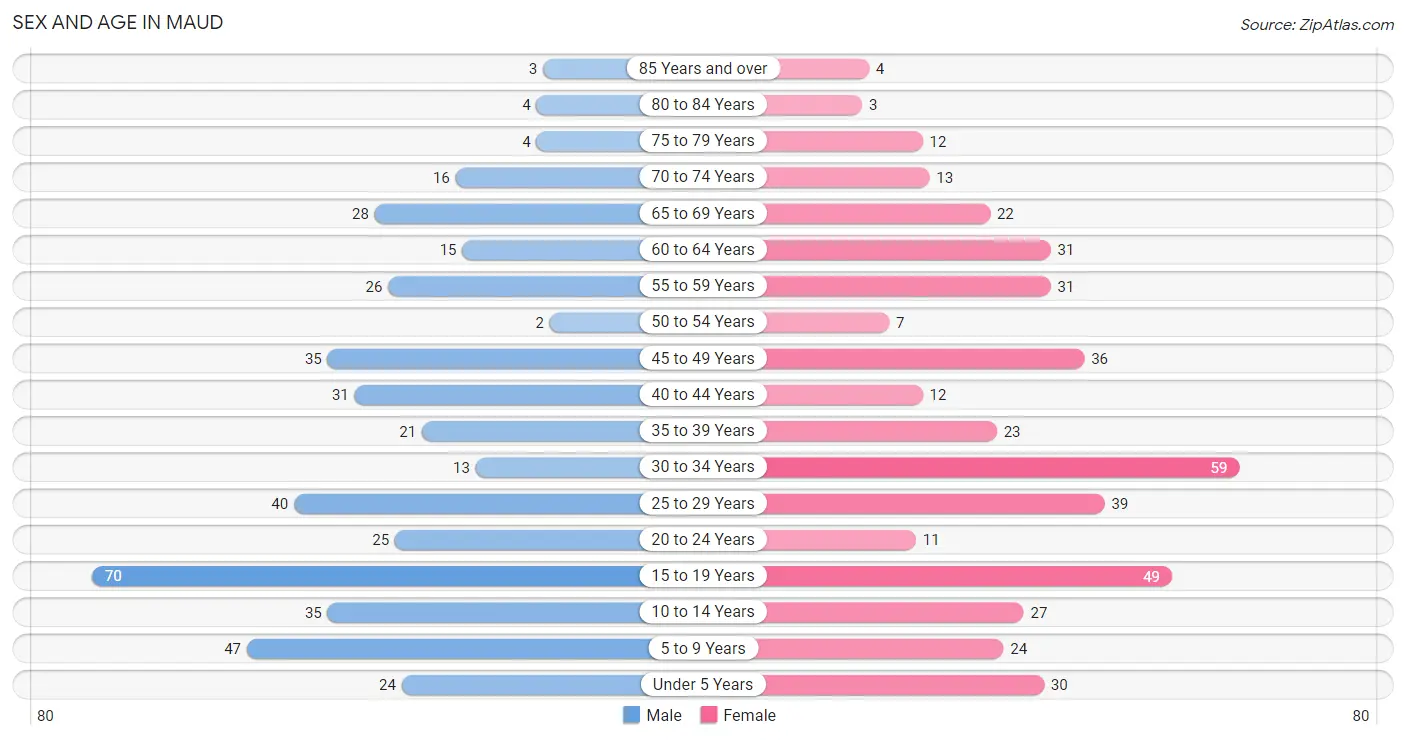
Sex and Age in Maud
Sex and Age in Maud
The most populous age groups in Maud are 15 to 19 Years (70 | 16.0%) for men and 30 to 34 Years (59 | 13.6%) for women.
| Age Bracket | Male | Female |
| Under 5 Years | 24 (5.5%) | 30 (6.9%) |
| 5 to 9 Years | 47 (10.7%) | 24 (5.5%) |
| 10 to 14 Years | 35 (8.0%) | 27 (6.2%) |
| 15 to 19 Years | 70 (16.0%) | 49 (11.3%) |
| 20 to 24 Years | 25 (5.7%) | 11 (2.5%) |
| 25 to 29 Years | 40 (9.1%) | 39 (9.0%) |
| 30 to 34 Years | 13 (3.0%) | 59 (13.6%) |
| 35 to 39 Years | 21 (4.8%) | 23 (5.3%) |
| 40 to 44 Years | 31 (7.1%) | 12 (2.8%) |
| 45 to 49 Years | 35 (8.0%) | 36 (8.3%) |
| 50 to 54 Years | 2 (0.5%) | 7 (1.6%) |
| 55 to 59 Years | 26 (5.9%) | 31 (7.2%) |
| 60 to 64 Years | 15 (3.4%) | 31 (7.2%) |
| 65 to 69 Years | 28 (6.4%) | 22 (5.1%) |
| 70 to 74 Years | 16 (3.6%) | 13 (3.0%) |
| 75 to 79 Years | 4 (0.9%) | 12 (2.8%) |
| 80 to 84 Years | 4 (0.9%) | 3 (0.7%) |
| 85 Years and over | 3 (0.7%) | 4 (0.9%) |
| Total | 439 (100.0%) | 433 (100.0%) |
Families and Households in Maud
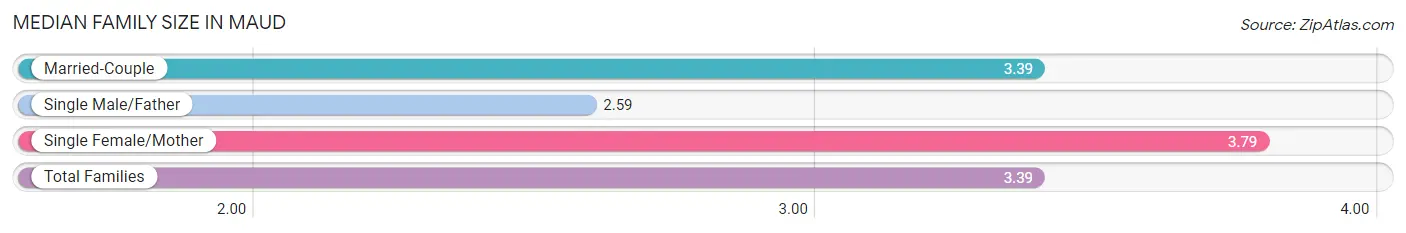
Median Family Size in Maud
The median family size in Maud is 3.39 persons per family, with single female/mother families (42 | 21.1%) accounting for the largest median family size of 3.79 persons per family. On the other hand, single male/father families (22 | 11.1%) represent the smallest median family size with 2.59 persons per family.
| Family Type | # Families | Family Size |
| Married-Couple | 135 (67.8%) | 3.39 |
| Single Male/Father | 22 (11.1%) | 2.59 |
| Single Female/Mother | 42 (21.1%) | 3.79 |
| Total Families | 199 (100.0%) | 3.39 |
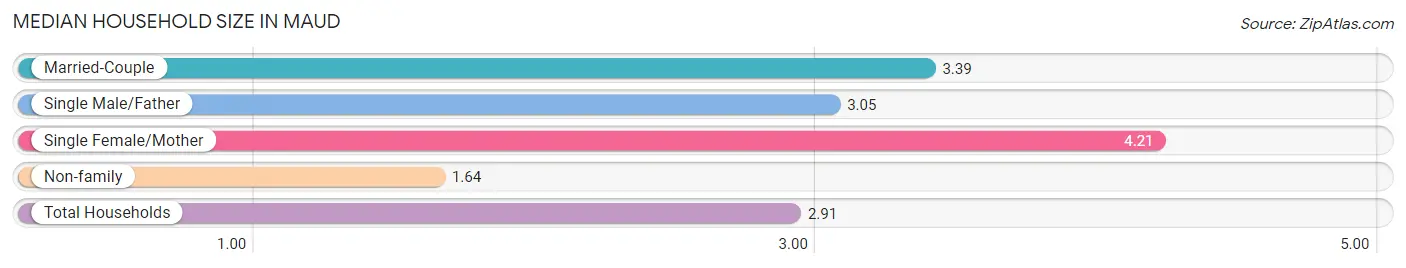
Median Household Size in Maud
The median household size in Maud is 2.91 persons per household, with single female/mother households (42 | 14.1%) accounting for the largest median household size of 4.21 persons per household. non-family households (98 | 33.0%) represent the smallest median household size with 1.64 persons per household.
| Household Type | # Households | Household Size |
| Married-Couple | 135 (45.5%) | 3.39 |
| Single Male/Father | 22 (7.4%) | 3.05 |
| Single Female/Mother | 42 (14.1%) | 4.21 |
| Non-family | 98 (33.0%) | 1.64 |
| Total Households | 297 (100.0%) | 2.91 |
Household Size by Marriage Status in Maud
Out of a total of 297 households in Maud, 199 (67.0%) are family households, while 98 (33.0%) are nonfamily households. The most numerous type of family households are 2-person households, comprising 77, and the most common type of nonfamily households are 1-person households, comprising 72.
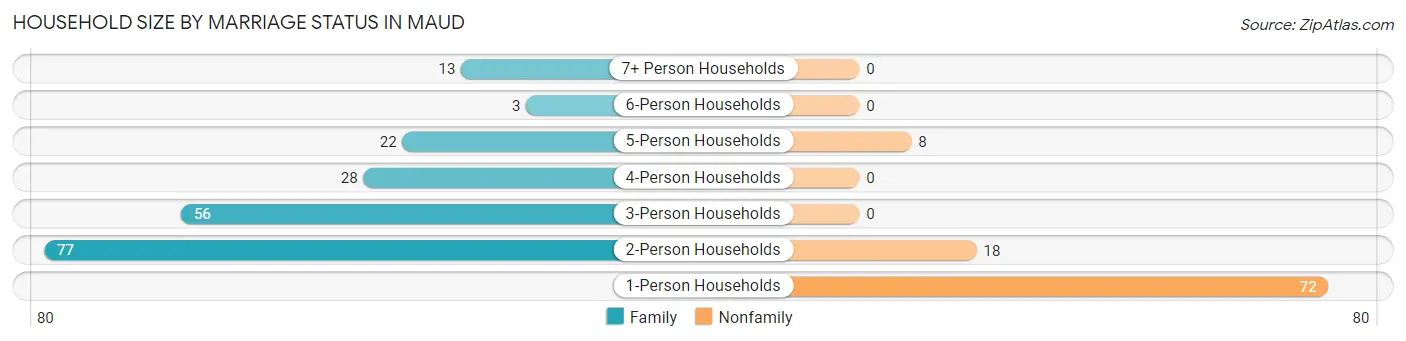
| Household Size | Family Households | Nonfamily Households |
| 1-Person Households | - | 72 (24.2%) |
| 2-Person Households | 77 (25.9%) | 18 (6.1%) |
| 3-Person Households | 56 (18.9%) | 0 (0.0%) |
| 4-Person Households | 28 (9.4%) | 0 (0.0%) |
| 5-Person Households | 22 (7.4%) | 8 (2.7%) |
| 6-Person Households | 3 (1.0%) | 0 (0.0%) |
| 7+ Person Households | 13 (4.4%) | 0 (0.0%) |
| Total | 199 (67.0%) | 98 (33.0%) |
Female Fertility in Maud
Fertility by Age in Maud
Average fertility rate in Maud is 74.0 births per 1,000 women. Women in the age bracket of 15 to 19 years have the highest fertility rate with 163.0 births per 1,000 women. Women in the age bracket of 20 to 34 years acount for 52.9% of all women with births.
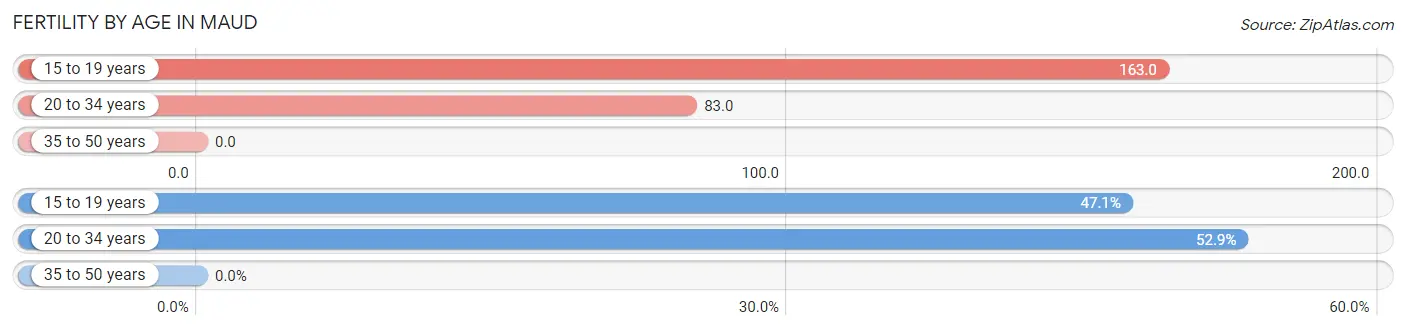
| Age Bracket | Women with Births | Births / 1,000 Women |
| 15 to 19 years | 8 (47.1%) | 163.0 |
| 20 to 34 years | 9 (52.9%) | 83.0 |
| 35 to 50 years | 0 (0.0%) | 0.0 |
| Total | 17 (100.0%) | 74.0 |
Fertility by Age by Marriage Status in Maud
58.8% of women with births (17) in Maud are married. The highest percentage of unmarried women with births falls into 20 to 34 years age bracket with 55.6% of them unmarried at the time of birth, while the lowest percentage of unmarried women with births belong to 15 to 19 years age bracket with 25.0% of them unmarried.
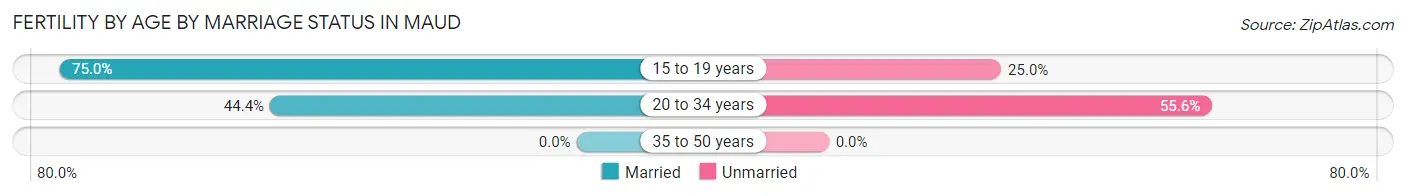
| Age Bracket | Married | Unmarried |
| 15 to 19 years | 6 (75.0%) | 2 (25.0%) |
| 20 to 34 years | 4 (44.4%) | 5 (55.6%) |
| 35 to 50 years | 0 (0.0%) | 0 (0.0%) |
| Total | 10 (58.8%) | 7 (41.2%) |
Fertility by Education in Maud
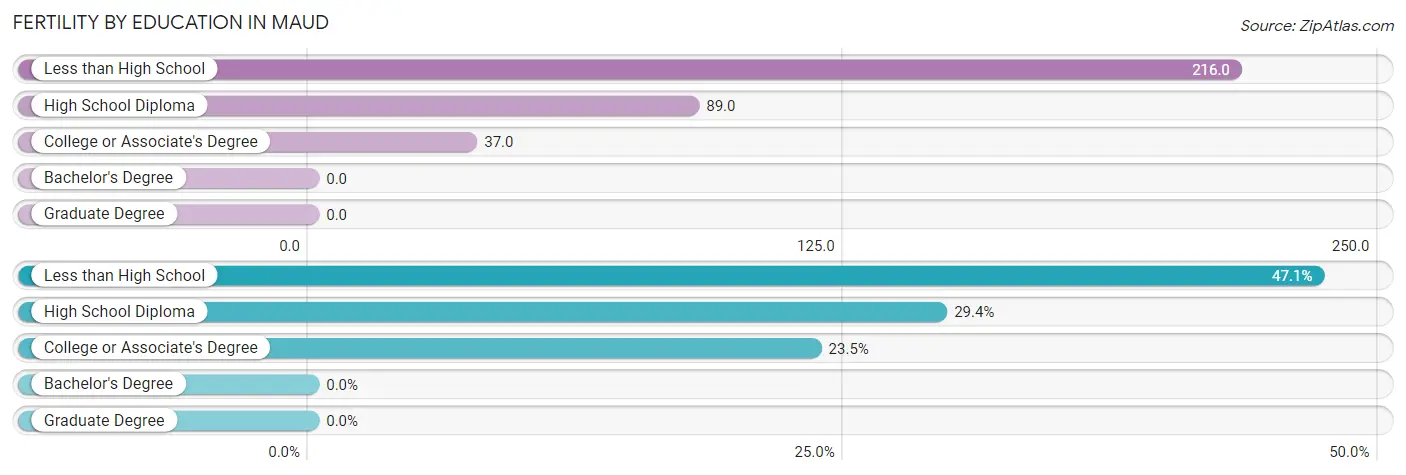
| Educational Attainment | Women with Births | Births / 1,000 Women |
| Less than High School | 8 (47.1%) | 216.0 |
| High School Diploma | 5 (29.4%) | 89.0 |
| College or Associate's Degree | 4 (23.5%) | 37.0 |
| Bachelor's Degree | 0 (0.0%) | 0.0 |
| Graduate Degree | 0 (0.0%) | 0.0 |
| Total | 17 (100.0%) | 74.0 |
Fertility by Education by Marriage Status in Maud
41.2% of women with births in Maud are unmarried. Women with the educational attainment of high school diploma are most likely to be married with 100.0% of them married at childbirth, while women with the educational attainment of less than high school are least likely to be married with 87.5% of them unmarried at childbirth.
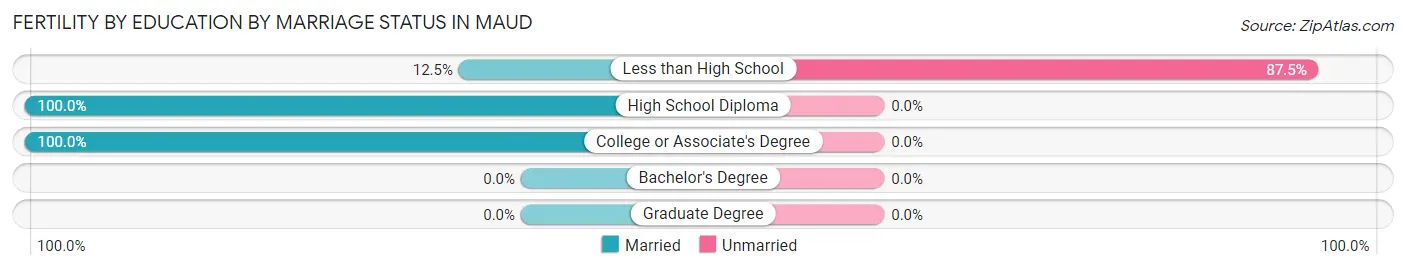
| Educational Attainment | Married | Unmarried |
| Less than High School | 1 (12.5%) | 7 (87.5%) |
| High School Diploma | 5 (100.0%) | 0 (0.0%) |
| College or Associate's Degree | 4 (100.0%) | 0 (0.0%) |
| Bachelor's Degree | 0 (0.0%) | 0 (0.0%) |
| Graduate Degree | 0 (0.0%) | 0 (0.0%) |
| Total | 10 (58.8%) | 7 (41.2%) |
Employment Characteristics in Maud
Employment by Class of Employer in Maud
Among the 302 employed individuals in Maud, private company employees (214 | 70.9%), federal government employees (28 | 9.3%), and local government employees (26 | 8.6%) make up the most common classes of employment.
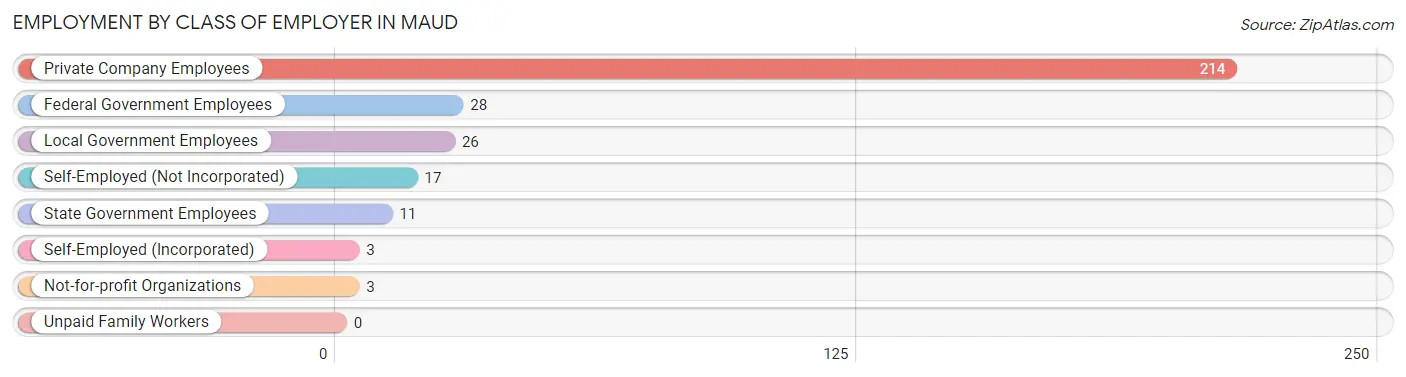
| Employer Class | # Employees | % Employees |
| Private Company Employees | 214 | 70.9% |
| Self-Employed (Incorporated) | 3 | 1.0% |
| Self-Employed (Not Incorporated) | 17 | 5.6% |
| Not-for-profit Organizations | 3 | 1.0% |
| Local Government Employees | 26 | 8.6% |
| State Government Employees | 11 | 3.6% |
| Federal Government Employees | 28 | 9.3% |
| Unpaid Family Workers | 0 | 0.0% |
| Total | 302 | 100.0% |
Employment Status by Age in Maud
According to the labor force statistics for Maud, out of the total population over 16 years of age (668), 48.2% or 322 individuals are in the labor force, with 5.9% or 19 of them unemployed. The age group with the highest labor force participation rate is 25 to 29 years, with 88.6% or 70 individuals in the labor force. Within the labor force, the 20 to 24 years age range has the highest percentage of unemployed individuals, with 30.4% or 7 of them being unemployed.
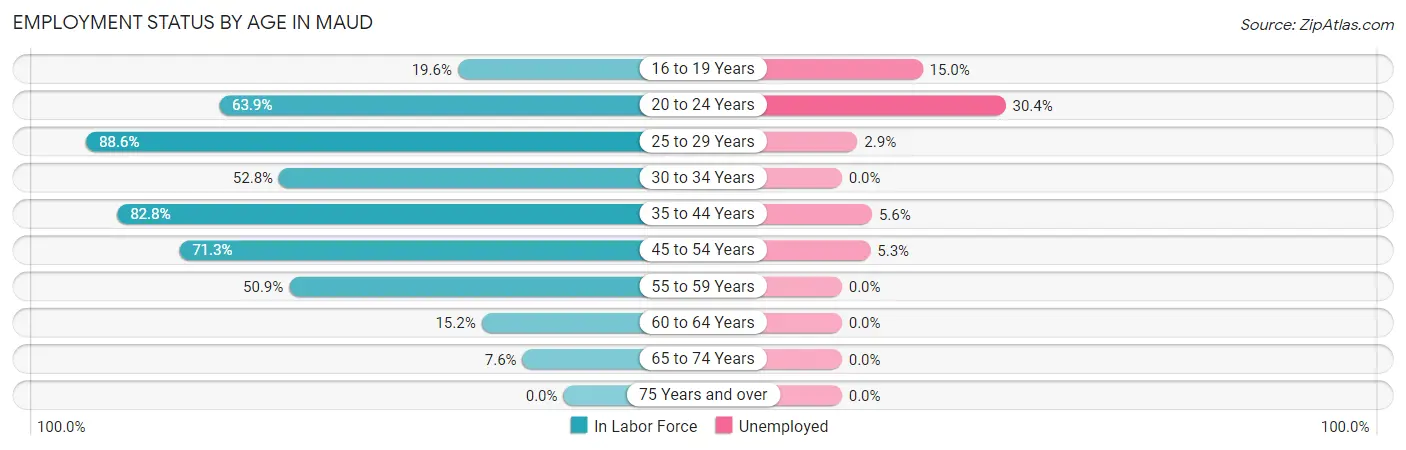
| Age Bracket | In Labor Force | Unemployed |
| 16 to 19 Years | 20 (19.6%) | 3 (15.0%) |
| 20 to 24 Years | 23 (63.9%) | 7 (30.4%) |
| 25 to 29 Years | 70 (88.6%) | 2 (2.9%) |
| 30 to 34 Years | 38 (52.8%) | 0 (0.0%) |
| 35 to 44 Years | 72 (82.8%) | 4 (5.6%) |
| 45 to 54 Years | 57 (71.3%) | 3 (5.3%) |
| 55 to 59 Years | 29 (50.9%) | 0 (0.0%) |
| 60 to 64 Years | 7 (15.2%) | 0 (0.0%) |
| 65 to 74 Years | 6 (7.6%) | 0 (0.0%) |
| 75 Years and over | 0 (0.0%) | 0 (0.0%) |
| Total | 322 (48.2%) | 19 (5.9%) |
Employment Status by Educational Attainment in Maud
According to labor force statistics for Maud, 64.8% of individuals (273) out of the total population between 25 and 64 years of age (421) are in the labor force, with 3.3% or 9 of them being unemployed. The group with the highest labor force participation rate are those with the educational attainment of bachelor's degree or higher, with 100.0% or 40 individuals in the labor force. Within the labor force, individuals with high school diploma education have the highest percentage of unemployment, with 5.8% or 6 of them being unemployed.
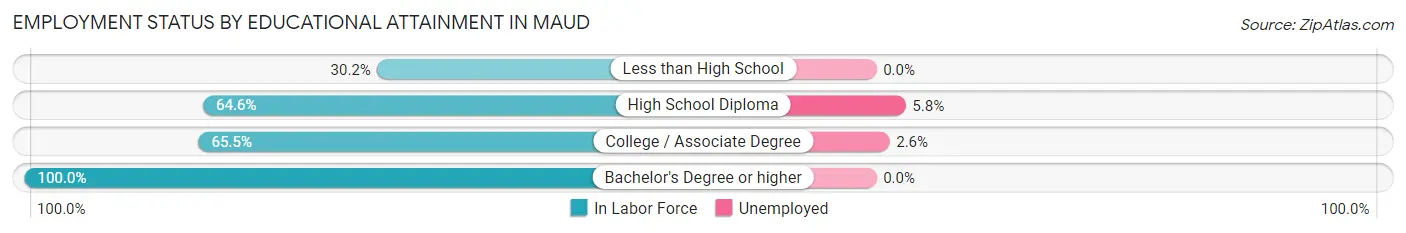
| Educational Attainment | In Labor Force | Unemployed |
| Less than High School | 13 (30.2%) | 0 (0.0%) |
| High School Diploma | 104 (64.6%) | 9 (5.8%) |
| College / Associate Degree | 116 (65.5%) | 5 (2.6%) |
| Bachelor's Degree or higher | 40 (100.0%) | 0 (0.0%) |
| Total | 273 (64.8%) | 14 (3.3%) |
Employment Occupations by Sex in Maud
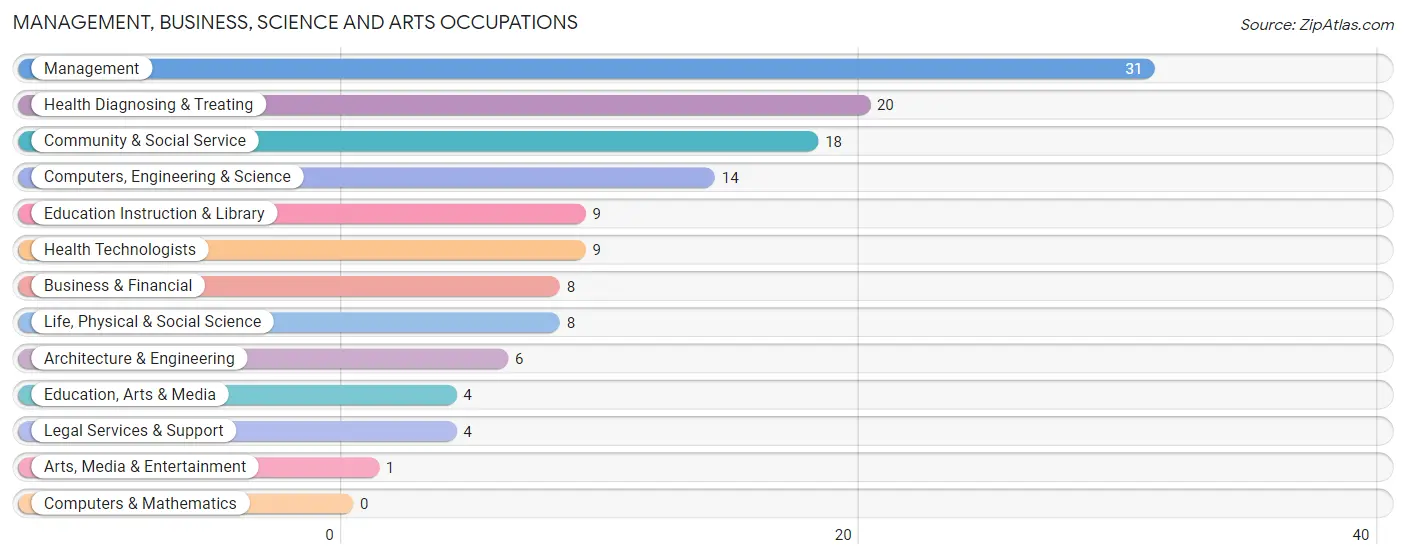
Management, Business, Science and Arts Occupations
The most common Management, Business, Science and Arts occupations in Maud are Management (31 | 10.2%), Health Diagnosing & Treating (20 | 6.6%), Community & Social Service (18 | 5.9%), Computers, Engineering & Science (14 | 4.6%), and Education Instruction & Library (9 | 3.0%).
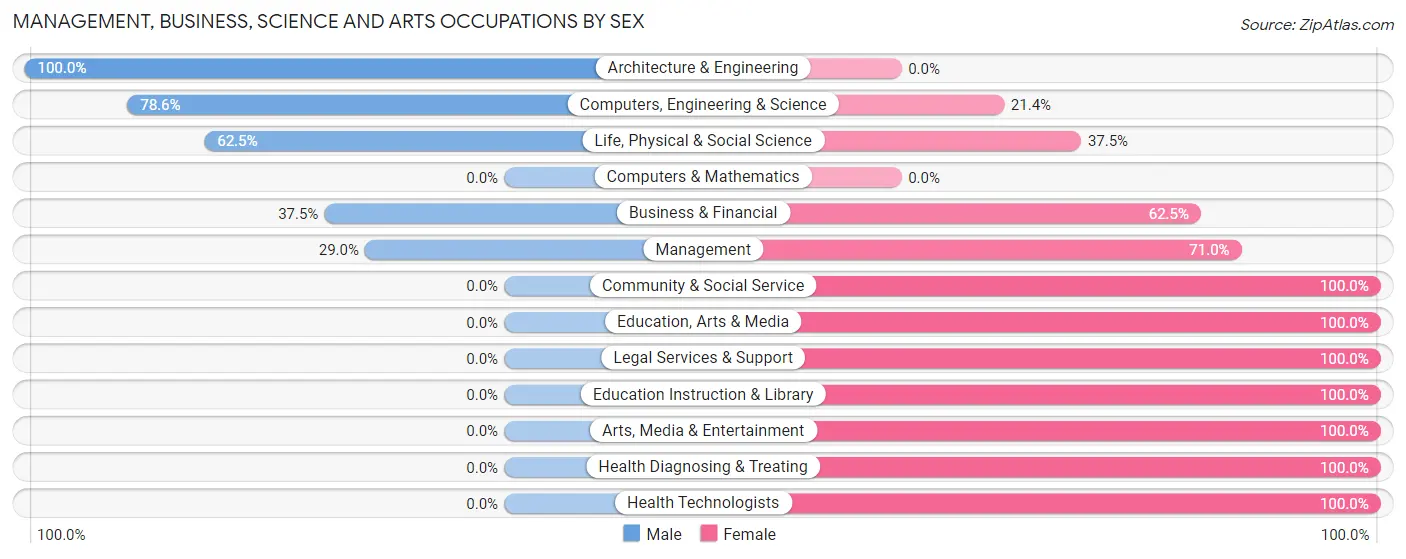
Management, Business, Science and Arts Occupations by Sex
Within the Management, Business, Science and Arts occupations in Maud, the most male-oriented occupations are Architecture & Engineering (100.0%), Computers, Engineering & Science (78.6%), and Life, Physical & Social Science (62.5%), while the most female-oriented occupations are Community & Social Service (100.0%), Education, Arts & Media (100.0%), and Legal Services & Support (100.0%).
| Occupation | Male | Female |
| Management | 9 (29.0%) | 22 (71.0%) |
| Business & Financial | 3 (37.5%) | 5 (62.5%) |
| Computers, Engineering & Science | 11 (78.6%) | 3 (21.4%) |
| Computers & Mathematics | 0 (0.0%) | 0 (0.0%) |
| Architecture & Engineering | 6 (100.0%) | 0 (0.0%) |
| Life, Physical & Social Science | 5 (62.5%) | 3 (37.5%) |
| Community & Social Service | 0 (0.0%) | 18 (100.0%) |
| Education, Arts & Media | 0 (0.0%) | 4 (100.0%) |
| Legal Services & Support | 0 (0.0%) | 4 (100.0%) |
| Education Instruction & Library | 0 (0.0%) | 9 (100.0%) |
| Arts, Media & Entertainment | 0 (0.0%) | 1 (100.0%) |
| Health Diagnosing & Treating | 0 (0.0%) | 20 (100.0%) |
| Health Technologists | 0 (0.0%) | 9 (100.0%) |
| Total (Category) | 23 (25.3%) | 68 (74.7%) |
| Total (Overall) | 166 (54.8%) | 137 (45.2%) |
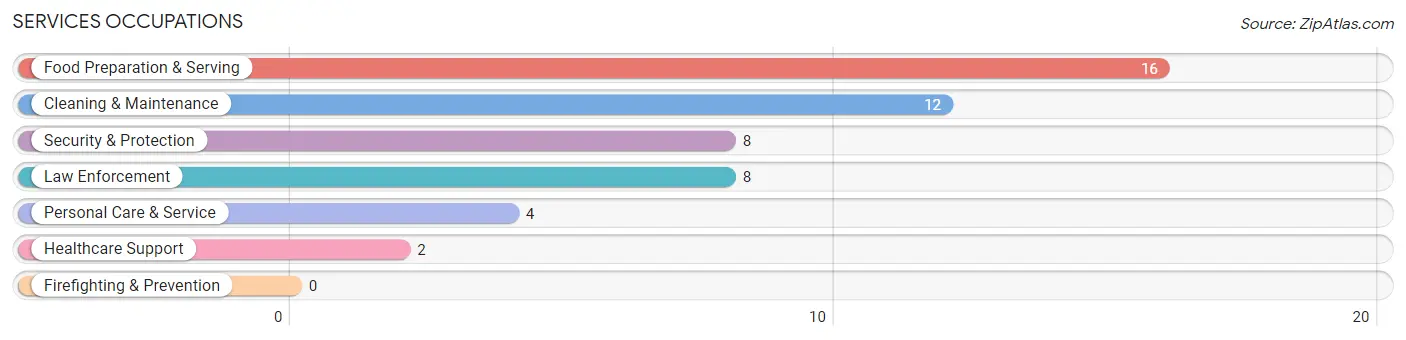
Services Occupations
The most common Services occupations in Maud are Food Preparation & Serving (16 | 5.3%), Cleaning & Maintenance (12 | 4.0%), Security & Protection (8 | 2.6%), Law Enforcement (8 | 2.6%), and Personal Care & Service (4 | 1.3%).
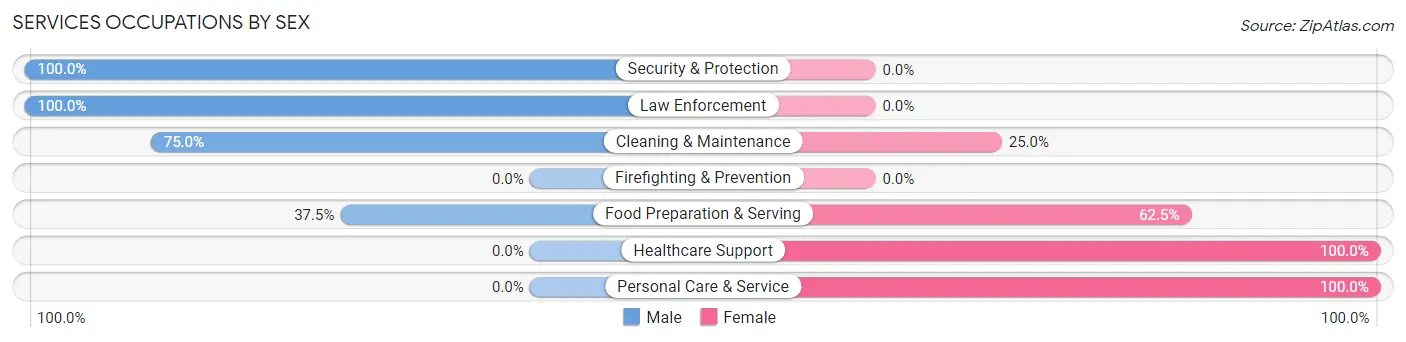
Services Occupations by Sex
Within the Services occupations in Maud, the most male-oriented occupations are Security & Protection (100.0%), Law Enforcement (100.0%), and Cleaning & Maintenance (75.0%), while the most female-oriented occupations are Healthcare Support (100.0%), Personal Care & Service (100.0%), and Food Preparation & Serving (62.5%).
| Occupation | Male | Female |
| Healthcare Support | 0 (0.0%) | 2 (100.0%) |
| Security & Protection | 8 (100.0%) | 0 (0.0%) |
| Firefighting & Prevention | 0 (0.0%) | 0 (0.0%) |
| Law Enforcement | 8 (100.0%) | 0 (0.0%) |
| Food Preparation & Serving | 6 (37.5%) | 10 (62.5%) |
| Cleaning & Maintenance | 9 (75.0%) | 3 (25.0%) |
| Personal Care & Service | 0 (0.0%) | 4 (100.0%) |
| Total (Category) | 23 (54.8%) | 19 (45.2%) |
| Total (Overall) | 166 (54.8%) | 137 (45.2%) |
Sales and Office Occupations
The most common Sales and Office occupations in Maud are Office & Administration (44 | 14.5%), and Sales & Related (27 | 8.9%).
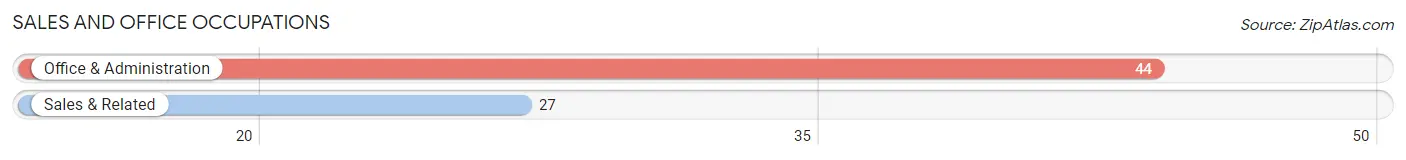
Sales and Office Occupations by Sex
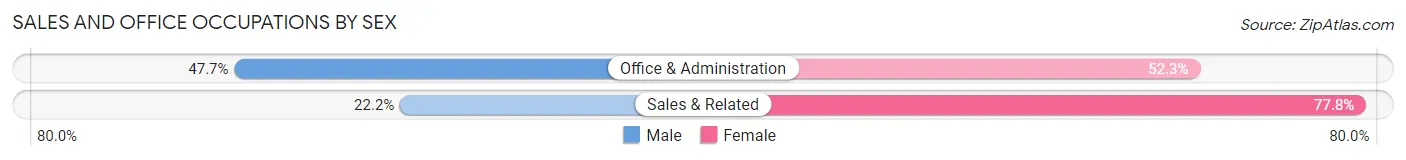
| Occupation | Male | Female |
| Sales & Related | 6 (22.2%) | 21 (77.8%) |
| Office & Administration | 21 (47.7%) | 23 (52.3%) |
| Total (Category) | 27 (38.0%) | 44 (62.0%) |
| Total (Overall) | 166 (54.8%) | 137 (45.2%) |
Natural Resources, Construction and Maintenance Occupations
The most common Natural Resources, Construction and Maintenance occupations in Maud are Construction & Extraction (29 | 9.6%), Installation, Maintenance & Repair (22 | 7.3%), and Farming, Fishing & Forestry (4 | 1.3%).
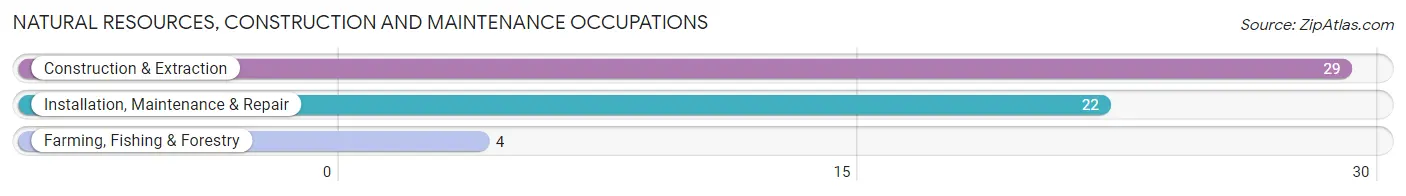
Natural Resources, Construction and Maintenance Occupations by Sex
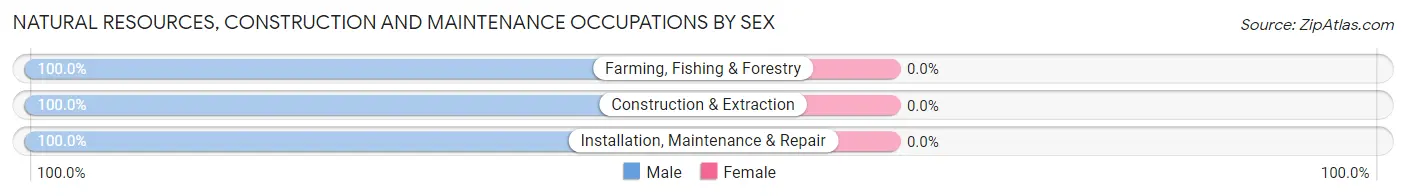
| Occupation | Male | Female |
| Farming, Fishing & Forestry | 4 (100.0%) | 0 (0.0%) |
| Construction & Extraction | 29 (100.0%) | 0 (0.0%) |
| Installation, Maintenance & Repair | 22 (100.0%) | 0 (0.0%) |
| Total (Category) | 55 (100.0%) | 0 (0.0%) |
| Total (Overall) | 166 (54.8%) | 137 (45.2%) |
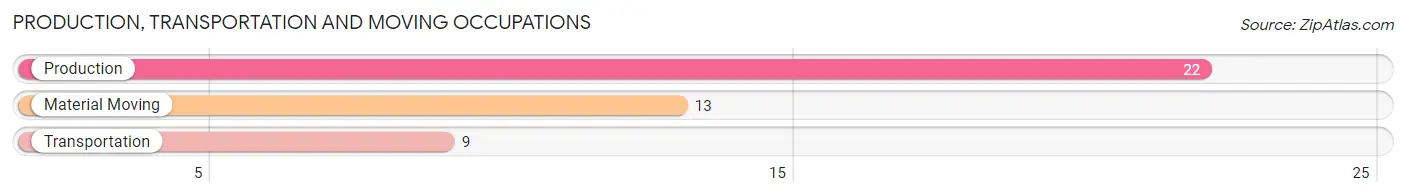
Production, Transportation and Moving Occupations
The most common Production, Transportation and Moving occupations in Maud are Production (22 | 7.3%), Material Moving (13 | 4.3%), and Transportation (9 | 3.0%).
Production, Transportation and Moving Occupations by Sex
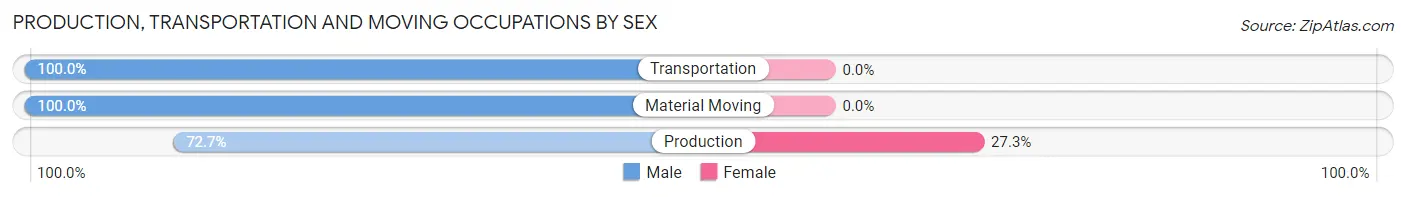
| Occupation | Male | Female |
| Production | 16 (72.7%) | 6 (27.3%) |
| Transportation | 9 (100.0%) | 0 (0.0%) |
| Material Moving | 13 (100.0%) | 0 (0.0%) |
| Total (Category) | 38 (86.4%) | 6 (13.6%) |
| Total (Overall) | 166 (54.8%) | 137 (45.2%) |
Employment Industries by Sex in Maud
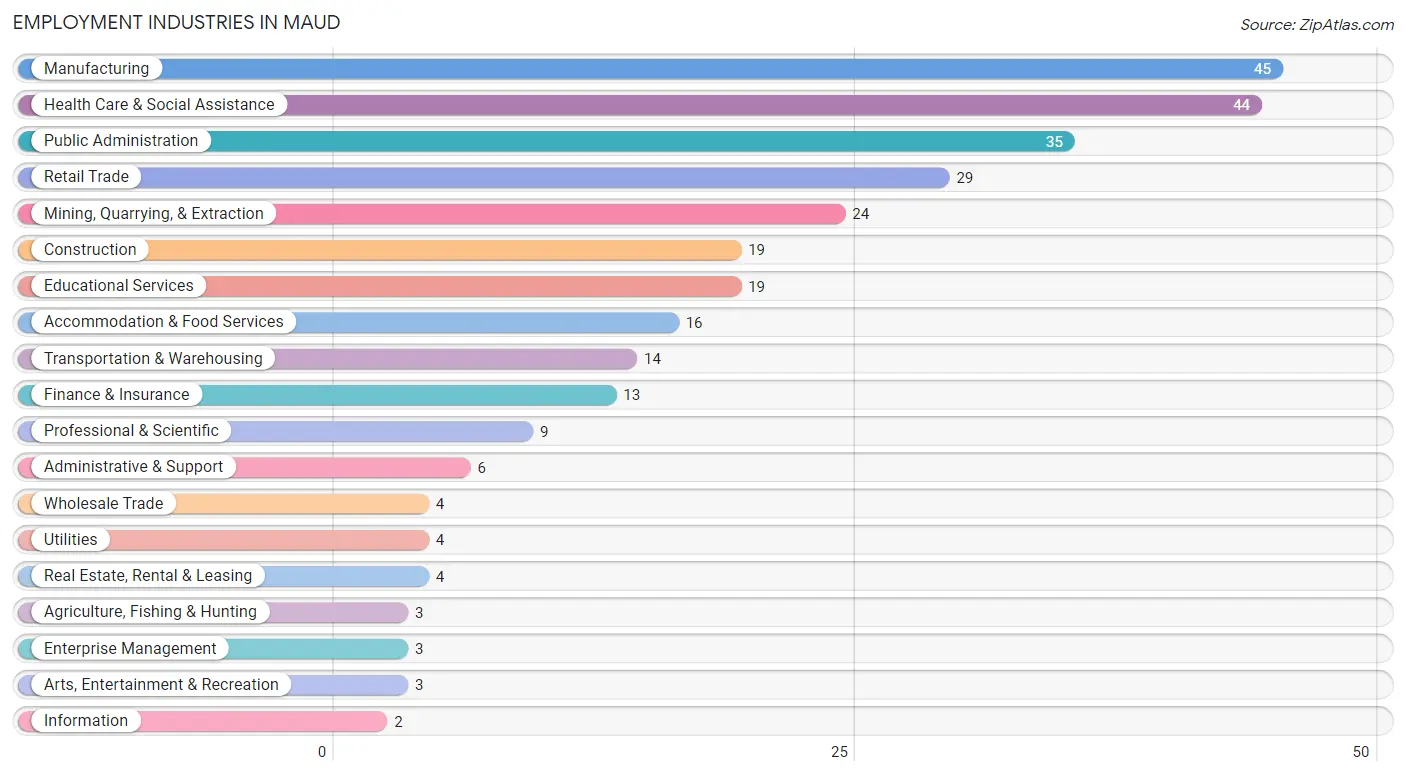
Employment Industries in Maud
The major employment industries in Maud include Manufacturing (45 | 14.8%), Health Care & Social Assistance (44 | 14.5%), Public Administration (35 | 11.6%), Retail Trade (29 | 9.6%), and Mining, Quarrying, & Extraction (24 | 7.9%).
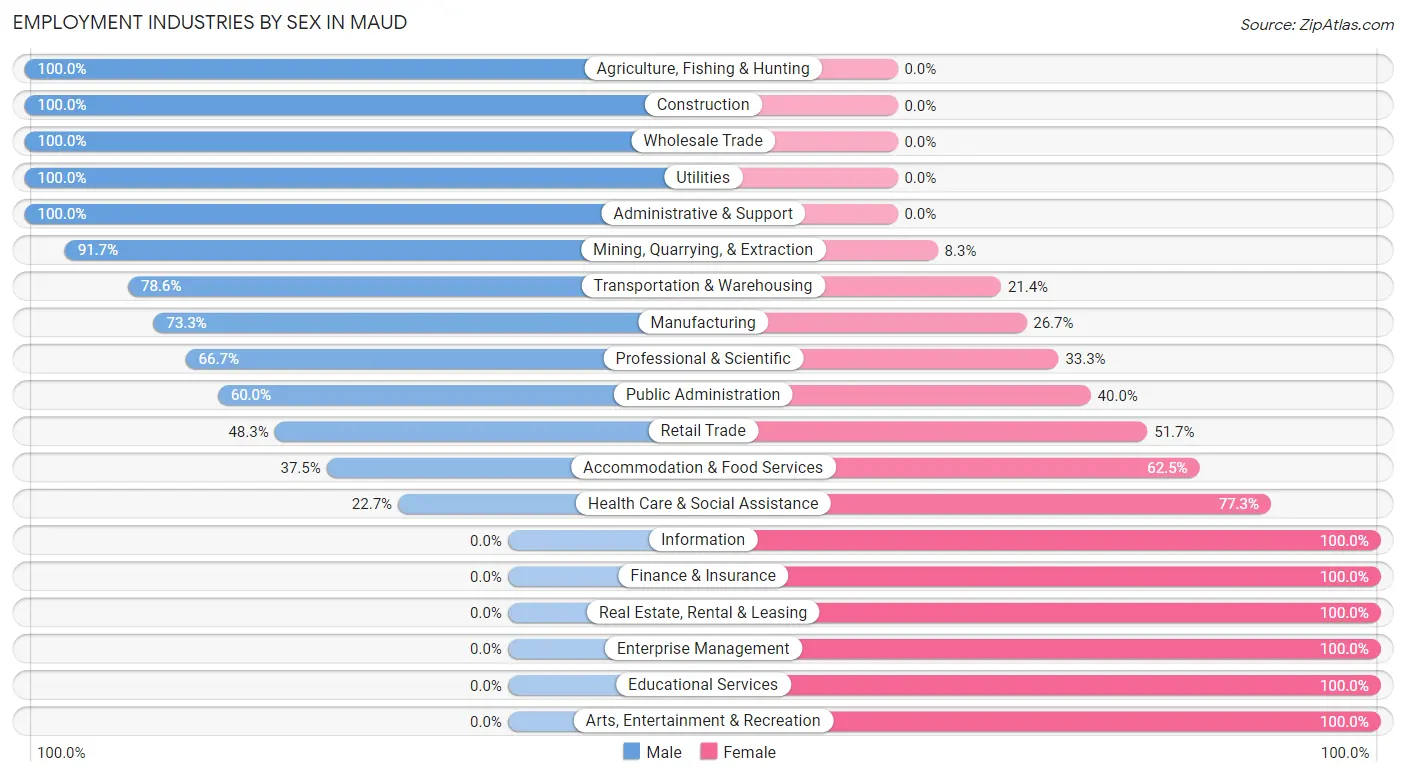
Employment Industries by Sex in Maud
The Maud industries that see more men than women are Agriculture, Fishing & Hunting (100.0%), Construction (100.0%), and Wholesale Trade (100.0%), whereas the industries that tend to have a higher number of women are Information (100.0%), Finance & Insurance (100.0%), and Real Estate, Rental & Leasing (100.0%).
| Industry | Male | Female |
| Agriculture, Fishing & Hunting | 3 (100.0%) | 0 (0.0%) |
| Mining, Quarrying, & Extraction | 22 (91.7%) | 2 (8.3%) |
| Construction | 19 (100.0%) | 0 (0.0%) |
| Manufacturing | 33 (73.3%) | 12 (26.7%) |
| Wholesale Trade | 4 (100.0%) | 0 (0.0%) |
| Retail Trade | 14 (48.3%) | 15 (51.7%) |
| Transportation & Warehousing | 11 (78.6%) | 3 (21.4%) |
| Utilities | 4 (100.0%) | 0 (0.0%) |
| Information | 0 (0.0%) | 2 (100.0%) |
| Finance & Insurance | 0 (0.0%) | 13 (100.0%) |
| Real Estate, Rental & Leasing | 0 (0.0%) | 4 (100.0%) |
| Professional & Scientific | 6 (66.7%) | 3 (33.3%) |
| Enterprise Management | 0 (0.0%) | 3 (100.0%) |
| Administrative & Support | 6 (100.0%) | 0 (0.0%) |
| Educational Services | 0 (0.0%) | 19 (100.0%) |
| Health Care & Social Assistance | 10 (22.7%) | 34 (77.3%) |
| Arts, Entertainment & Recreation | 0 (0.0%) | 3 (100.0%) |
| Accommodation & Food Services | 6 (37.5%) | 10 (62.5%) |
| Public Administration | 21 (60.0%) | 14 (40.0%) |
| Total | 166 (54.8%) | 137 (45.2%) |
Education in Maud
School Enrollment in Maud
The most common levels of schooling among the 223 students in Maud are high school (69 | 30.9%), elementary school (59 | 26.5%), and middle school (48 | 21.5%).
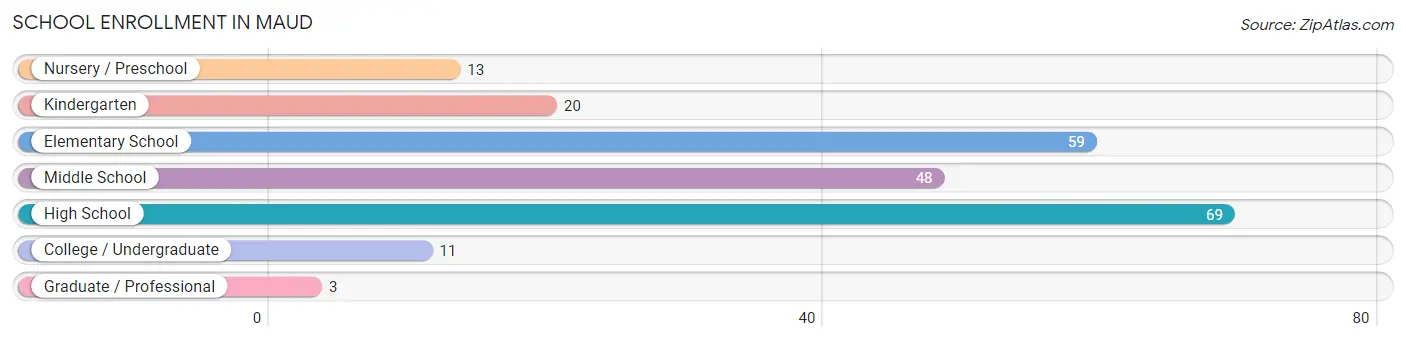
| School Level | # Students | % Students |
| Nursery / Preschool | 13 | 5.8% |
| Kindergarten | 20 | 9.0% |
| Elementary School | 59 | 26.5% |
| Middle School | 48 | 21.5% |
| High School | 69 | 30.9% |
| College / Undergraduate | 11 | 4.9% |
| Graduate / Professional | 3 | 1.3% |
| Total | 223 | 100.0% |
School Enrollment by Age by Funding Source in Maud
Out of a total of 223 students who are enrolled in schools in Maud, 16 (7.2%) attend a private institution, while the remaining 207 (92.8%) are enrolled in public schools. The age group of 3 to 4 year olds has the highest likelihood of being enrolled in private schools, with 2 (18.2% in the age bracket) enrolled. Conversely, the age group of 18 to 19 year olds has the lowest likelihood of being enrolled in a private school, with 18 (100.0% in the age bracket) attending a public institution.
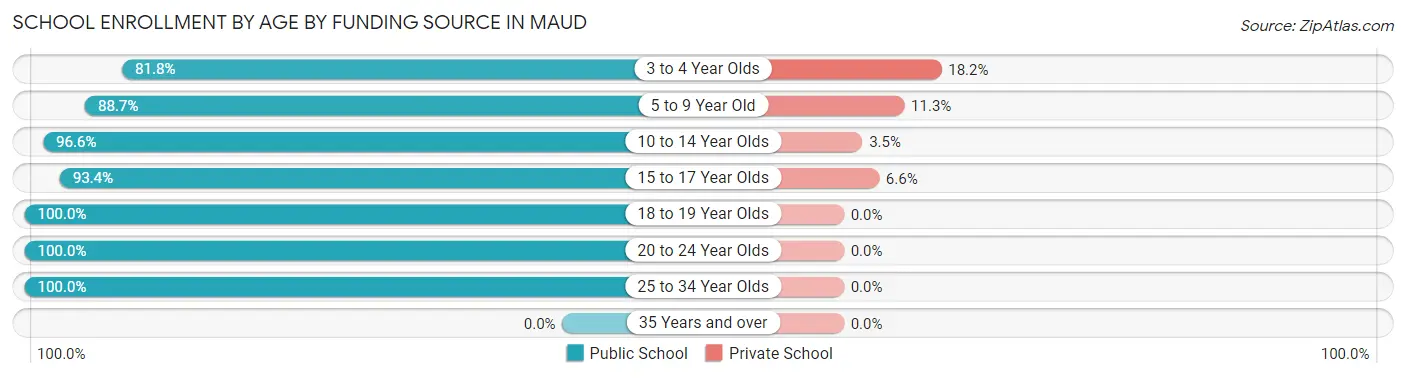
| Age Bracket | Public School | Private School |
| 3 to 4 Year Olds | 9 (81.8%) | 2 (18.2%) |
| 5 to 9 Year Old | 63 (88.7%) | 8 (11.3%) |
| 10 to 14 Year Olds | 56 (96.6%) | 2 (3.5%) |
| 15 to 17 Year Olds | 57 (93.4%) | 4 (6.6%) |
| 18 to 19 Year Olds | 18 (100.0%) | 0 (0.0%) |
| 20 to 24 Year Olds | 3 (100.0%) | 0 (0.0%) |
| 25 to 34 Year Olds | 1 (100.0%) | 0 (0.0%) |
| 35 Years and over | 0 (0.0%) | 0 (0.0%) |
| Total | 207 (92.8%) | 16 (7.2%) |
Educational Attainment by Field of Study in Maud
Education (13 | 29.5%), arts & humanities (9 | 20.4%), science & technology (5 | 11.4%), business (5 | 11.4%), and computers & mathematics (4 | 9.1%) are the most common fields of study among 44 individuals in Maud who have obtained a bachelor's degree or higher.
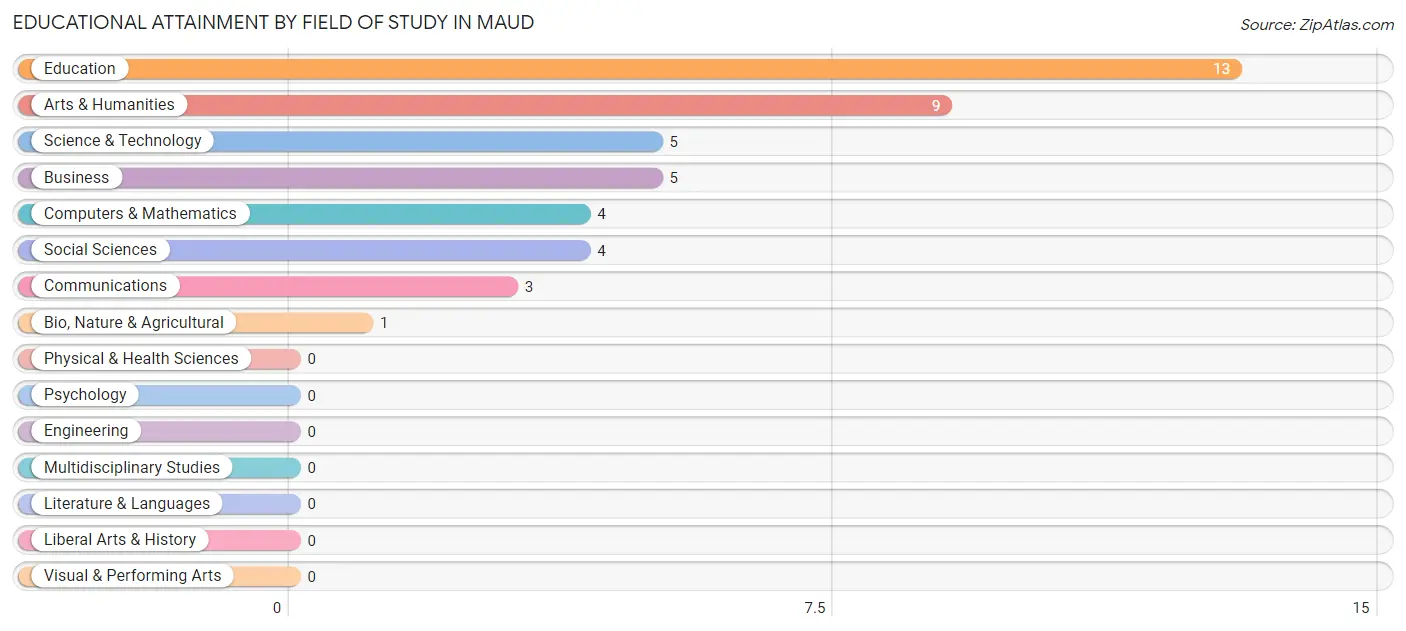
| Field of Study | # Graduates | % Graduates |
| Computers & Mathematics | 4 | 9.1% |
| Bio, Nature & Agricultural | 1 | 2.3% |
| Physical & Health Sciences | 0 | 0.0% |
| Psychology | 0 | 0.0% |
| Social Sciences | 4 | 9.1% |
| Engineering | 0 | 0.0% |
| Multidisciplinary Studies | 0 | 0.0% |
| Science & Technology | 5 | 11.4% |
| Business | 5 | 11.4% |
| Education | 13 | 29.5% |
| Literature & Languages | 0 | 0.0% |
| Liberal Arts & History | 0 | 0.0% |
| Visual & Performing Arts | 0 | 0.0% |
| Communications | 3 | 6.8% |
| Arts & Humanities | 9 | 20.4% |
| Total | 44 | 100.0% |
Transportation & Commute in Maud
Vehicle Availability by Sex in Maud
The most prevalent vehicle ownership categories in Maud are males with 2 vehicles (48, accounting for 28.9%) and females with 2 vehicles (43, making up 35.3%).
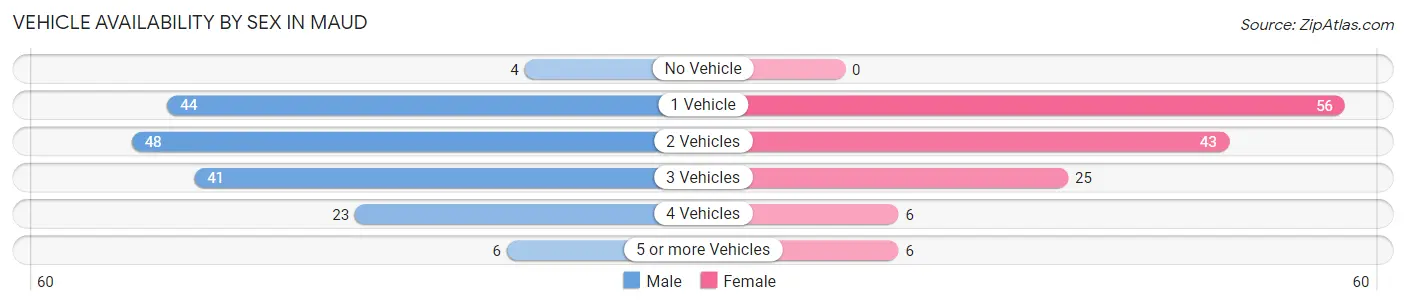
| Vehicles Available | Male | Female |
| No Vehicle | 4 (2.4%) | 0 (0.0%) |
| 1 Vehicle | 44 (26.5%) | 56 (41.2%) |
| 2 Vehicles | 48 (28.9%) | 43 (31.6%) |
| 3 Vehicles | 41 (24.7%) | 25 (18.4%) |
| 4 Vehicles | 23 (13.9%) | 6 (4.4%) |
| 5 or more Vehicles | 6 (3.6%) | 6 (4.4%) |
| Total | 166 (100.0%) | 136 (100.0%) |
Commute Time in Maud
The most frequently occuring commute durations in Maud are 20 to 24 minutes (51 commuters, 17.6%), 30 to 34 minutes (46 commuters, 15.9%), and less than 5 minutes (37 commuters, 12.8%).
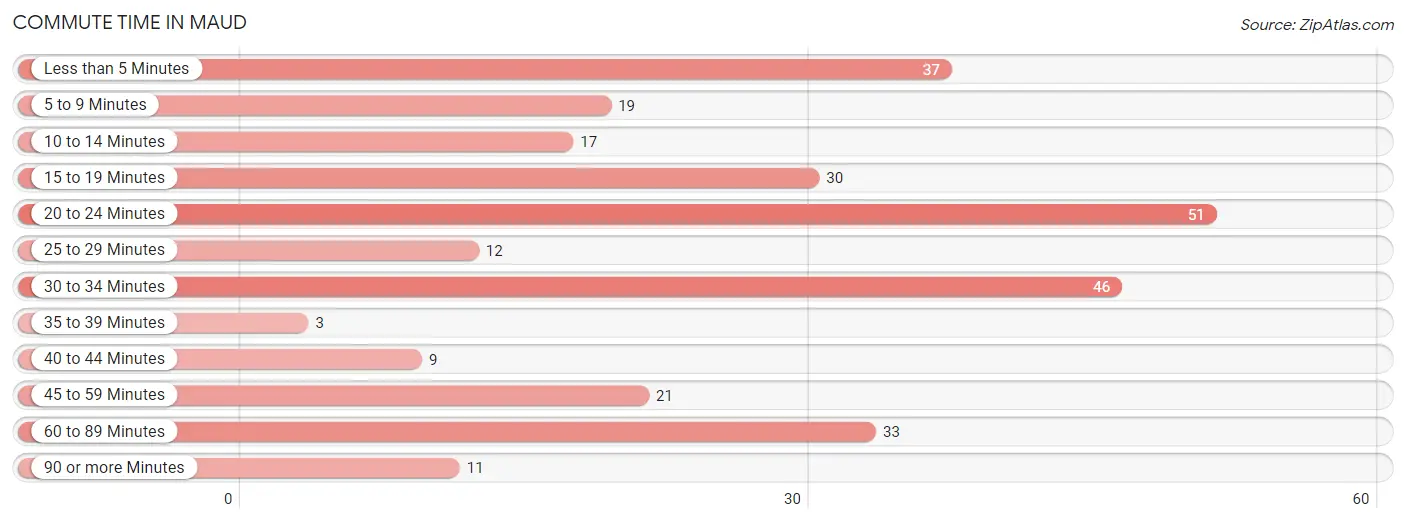
| Commute Time | # Commuters | % Commuters |
| Less than 5 Minutes | 37 | 12.8% |
| 5 to 9 Minutes | 19 | 6.6% |
| 10 to 14 Minutes | 17 | 5.9% |
| 15 to 19 Minutes | 30 | 10.4% |
| 20 to 24 Minutes | 51 | 17.6% |
| 25 to 29 Minutes | 12 | 4.2% |
| 30 to 34 Minutes | 46 | 15.9% |
| 35 to 39 Minutes | 3 | 1.0% |
| 40 to 44 Minutes | 9 | 3.1% |
| 45 to 59 Minutes | 21 | 7.3% |
| 60 to 89 Minutes | 33 | 11.4% |
| 90 or more Minutes | 11 | 3.8% |
Commute Time by Sex in Maud
The most common commute times in Maud are 60 to 89 minutes (30 commuters, 19.6%) for males and 20 to 24 minutes (32 commuters, 23.5%) for females.
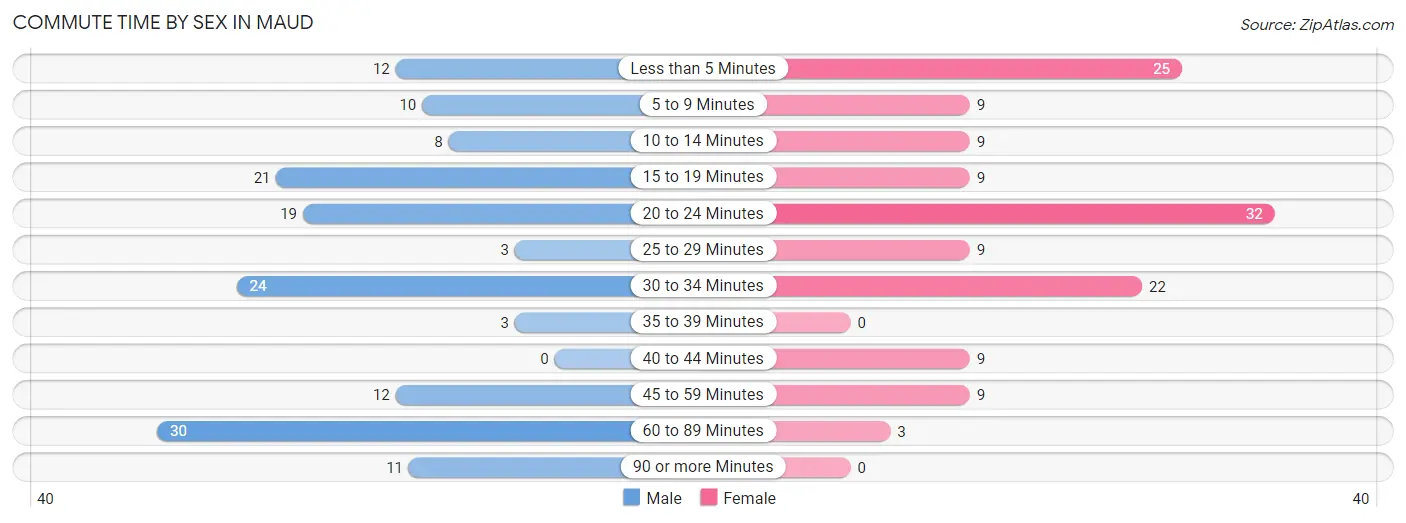
| Commute Time | Male | Female |
| Less than 5 Minutes | 12 (7.8%) | 25 (18.4%) |
| 5 to 9 Minutes | 10 (6.5%) | 9 (6.6%) |
| 10 to 14 Minutes | 8 (5.2%) | 9 (6.6%) |
| 15 to 19 Minutes | 21 (13.7%) | 9 (6.6%) |
| 20 to 24 Minutes | 19 (12.4%) | 32 (23.5%) |
| 25 to 29 Minutes | 3 (2.0%) | 9 (6.6%) |
| 30 to 34 Minutes | 24 (15.7%) | 22 (16.2%) |
| 35 to 39 Minutes | 3 (2.0%) | 0 (0.0%) |
| 40 to 44 Minutes | 0 (0.0%) | 9 (6.6%) |
| 45 to 59 Minutes | 12 (7.8%) | 9 (6.6%) |
| 60 to 89 Minutes | 30 (19.6%) | 3 (2.2%) |
| 90 or more Minutes | 11 (7.2%) | 0 (0.0%) |
Time of Departure to Work by Sex in Maud
The most frequent times of departure to work in Maud are 7:00 AM to 7:29 AM (37, 24.2%) for males and 7:30 AM to 7:59 AM (38, 27.9%) for females.
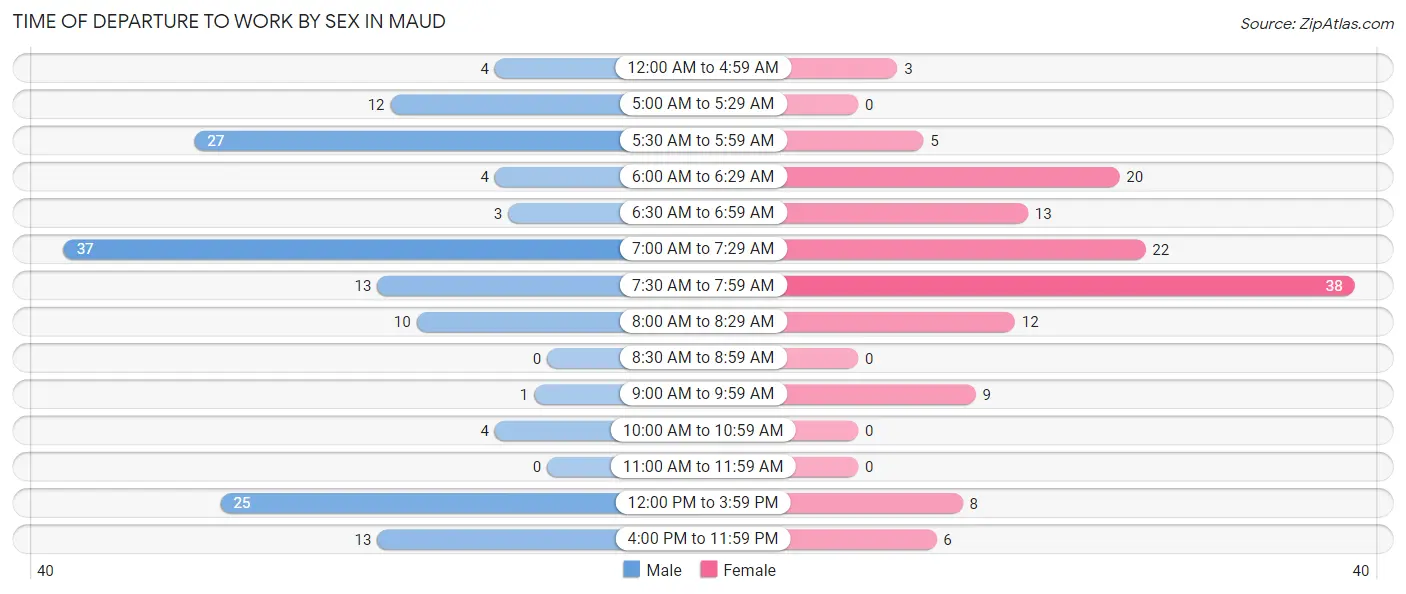
| Time of Departure | Male | Female |
| 12:00 AM to 4:59 AM | 4 (2.6%) | 3 (2.2%) |
| 5:00 AM to 5:29 AM | 12 (7.8%) | 0 (0.0%) |
| 5:30 AM to 5:59 AM | 27 (17.6%) | 5 (3.7%) |
| 6:00 AM to 6:29 AM | 4 (2.6%) | 20 (14.7%) |
| 6:30 AM to 6:59 AM | 3 (2.0%) | 13 (9.6%) |
| 7:00 AM to 7:29 AM | 37 (24.2%) | 22 (16.2%) |
| 7:30 AM to 7:59 AM | 13 (8.5%) | 38 (27.9%) |
| 8:00 AM to 8:29 AM | 10 (6.5%) | 12 (8.8%) |
| 8:30 AM to 8:59 AM | 0 (0.0%) | 0 (0.0%) |
| 9:00 AM to 9:59 AM | 1 (0.6%) | 9 (6.6%) |
| 10:00 AM to 10:59 AM | 4 (2.6%) | 0 (0.0%) |
| 11:00 AM to 11:59 AM | 0 (0.0%) | 0 (0.0%) |
| 12:00 PM to 3:59 PM | 25 (16.3%) | 8 (5.9%) |
| 4:00 PM to 11:59 PM | 13 (8.5%) | 6 (4.4%) |
| Total | 153 (100.0%) | 136 (100.0%) |
Housing Occupancy in Maud
Occupancy by Ownership in Maud
Of the total 297 dwellings in Maud, owner-occupied units account for 217 (73.1%), while renter-occupied units make up 80 (26.9%).
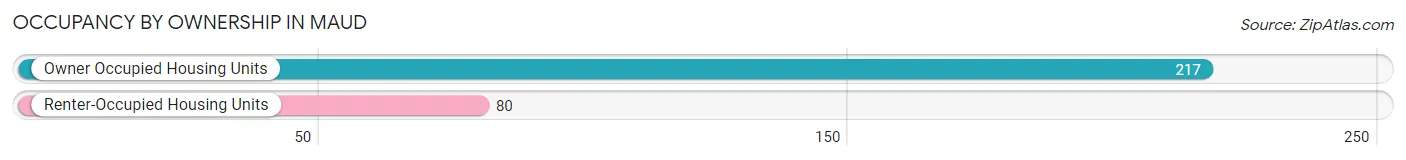
| Occupancy | # Housing Units | % Housing Units |
| Owner Occupied Housing Units | 217 | 73.1% |
| Renter-Occupied Housing Units | 80 | 26.9% |
| Total Occupied Housing Units | 297 | 100.0% |
Occupancy by Household Size in Maud
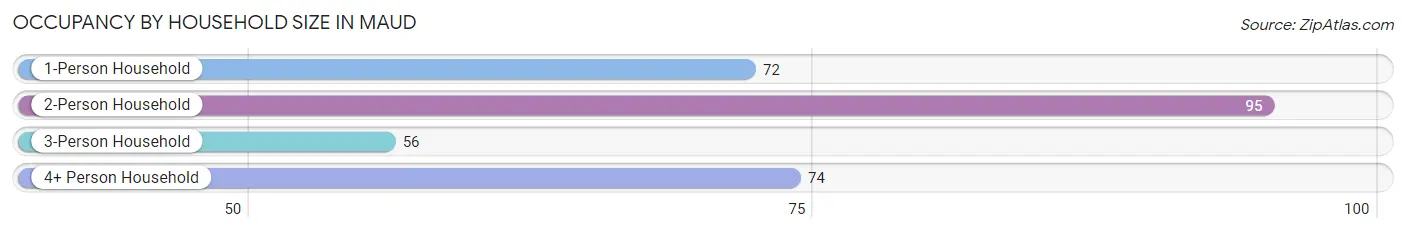
| Household Size | # Housing Units | % Housing Units |
| 1-Person Household | 72 | 24.2% |
| 2-Person Household | 95 | 32.0% |
| 3-Person Household | 56 | 18.9% |
| 4+ Person Household | 74 | 24.9% |
| Total Housing Units | 297 | 100.0% |
Occupancy by Ownership by Household Size in Maud
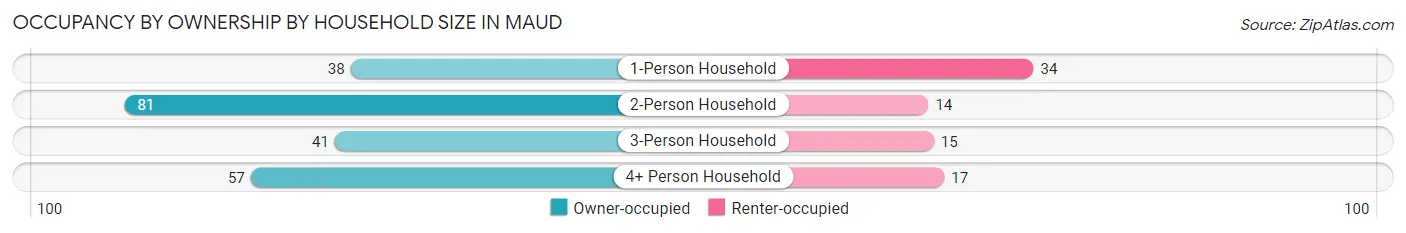
| Household Size | Owner-occupied | Renter-occupied |
| 1-Person Household | 38 (52.8%) | 34 (47.2%) |
| 2-Person Household | 81 (85.3%) | 14 (14.7%) |
| 3-Person Household | 41 (73.2%) | 15 (26.8%) |
| 4+ Person Household | 57 (77.0%) | 17 (23.0%) |
| Total Housing Units | 217 (73.1%) | 80 (26.9%) |
Occupancy by Educational Attainment in Maud
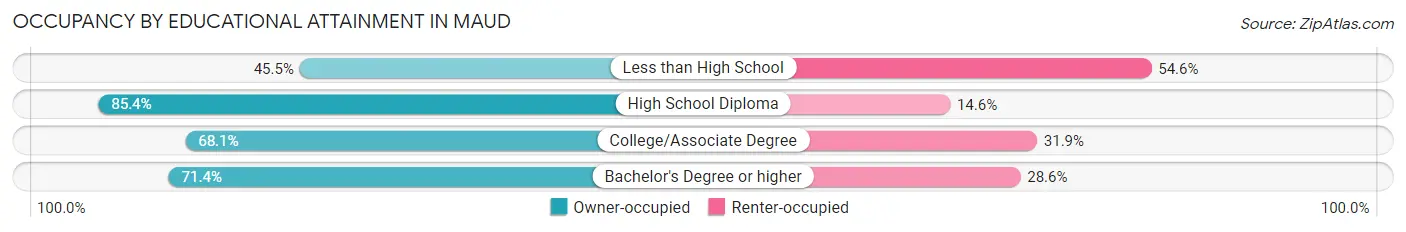
| Household Size | Owner-occupied | Renter-occupied |
| Less than High School | 15 (45.5%) | 18 (54.5%) |
| High School Diploma | 105 (85.4%) | 18 (14.6%) |
| College/Associate Degree | 77 (68.1%) | 36 (31.9%) |
| Bachelor's Degree or higher | 20 (71.4%) | 8 (28.6%) |
Occupancy by Age of Householder in Maud
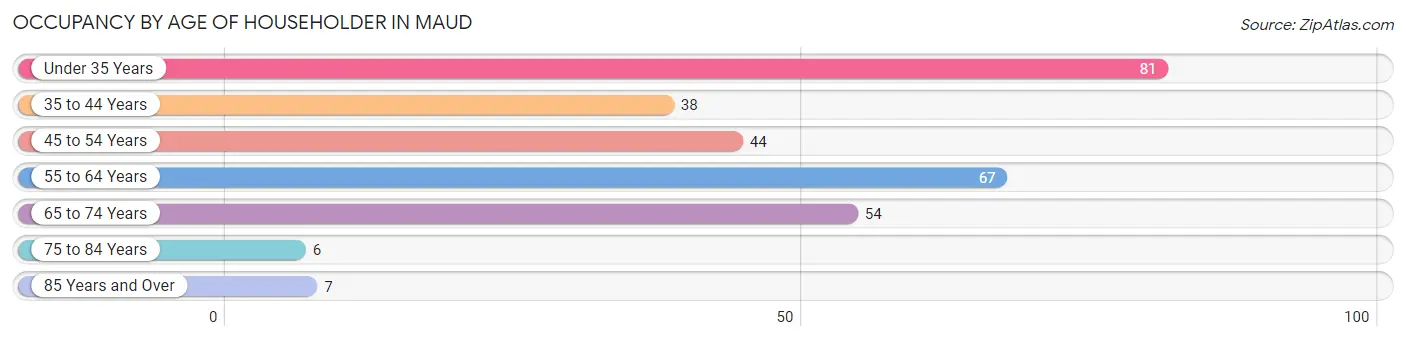
| Age Bracket | # Households | % Households |
| Under 35 Years | 81 | 27.3% |
| 35 to 44 Years | 38 | 12.8% |
| 45 to 54 Years | 44 | 14.8% |
| 55 to 64 Years | 67 | 22.6% |
| 65 to 74 Years | 54 | 18.2% |
| 75 to 84 Years | 6 | 2.0% |
| 85 Years and Over | 7 | 2.4% |
| Total | 297 | 100.0% |
Housing Finances in Maud
Median Income by Occupancy in Maud
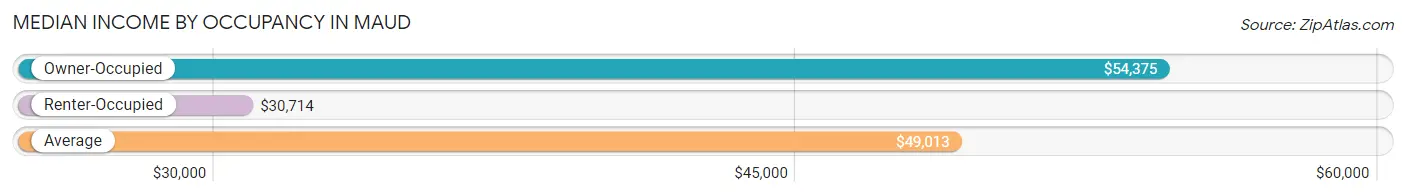
| Occupancy Type | # Households | Median Income |
| Owner-Occupied | 217 (73.1%) | $54,375 |
| Renter-Occupied | 80 (26.9%) | $30,714 |
| Average | 297 (100.0%) | $49,013 |
Occupancy by Householder Income Bracket in Maud
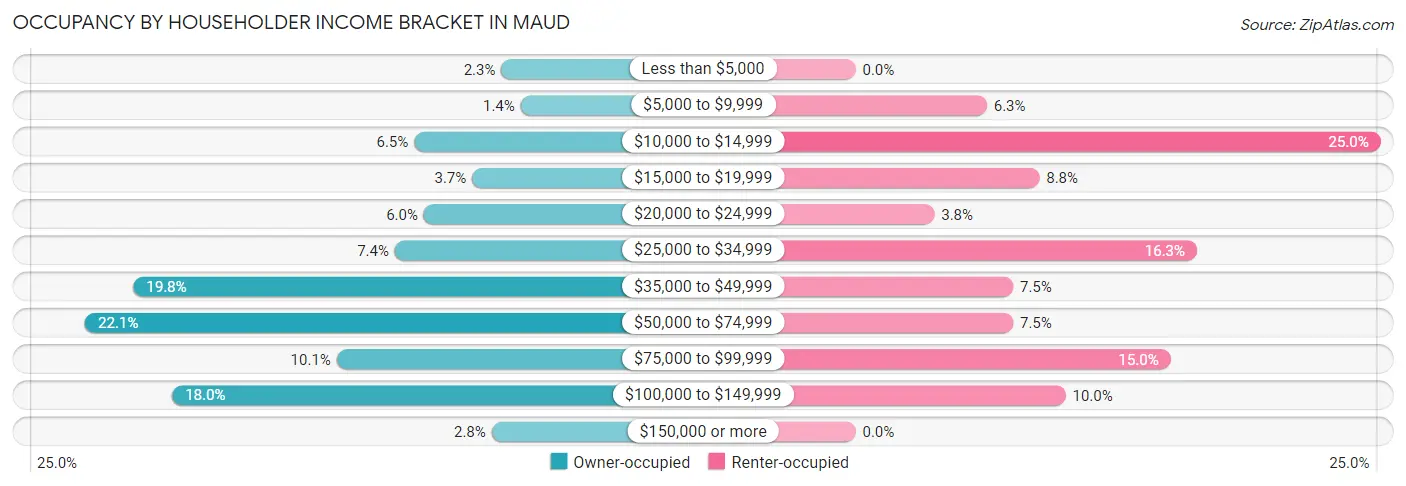
| Income Bracket | Owner-occupied | Renter-occupied |
| Less than $5,000 | 5 (2.3%) | 0 (0.0%) |
| $5,000 to $9,999 | 3 (1.4%) | 5 (6.2%) |
| $10,000 to $14,999 | 14 (6.5%) | 20 (25.0%) |
| $15,000 to $19,999 | 8 (3.7%) | 7 (8.7%) |
| $20,000 to $24,999 | 13 (6.0%) | 3 (3.7%) |
| $25,000 to $34,999 | 16 (7.4%) | 13 (16.3%) |
| $35,000 to $49,999 | 43 (19.8%) | 6 (7.5%) |
| $50,000 to $74,999 | 48 (22.1%) | 6 (7.5%) |
| $75,000 to $99,999 | 22 (10.1%) | 12 (15.0%) |
| $100,000 to $149,999 | 39 (18.0%) | 8 (10.0%) |
| $150,000 or more | 6 (2.8%) | 0 (0.0%) |
| Total | 217 (100.0%) | 80 (100.0%) |
Monthly Housing Cost Tiers in Maud
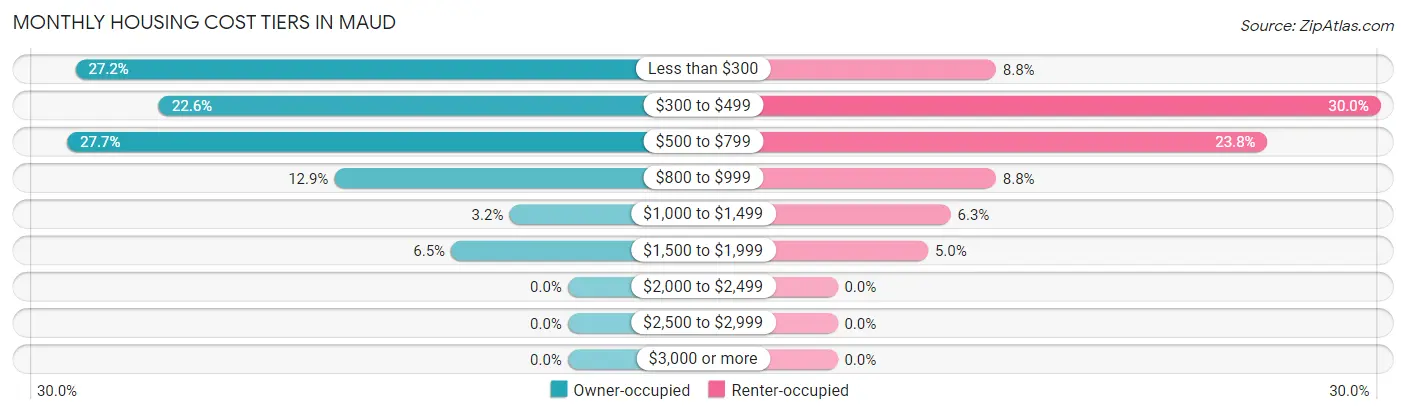
| Monthly Cost | Owner-occupied | Renter-occupied |
| Less than $300 | 59 (27.2%) | 7 (8.7%) |
| $300 to $499 | 49 (22.6%) | 24 (30.0%) |
| $500 to $799 | 60 (27.7%) | 19 (23.7%) |
| $800 to $999 | 28 (12.9%) | 7 (8.7%) |
| $1,000 to $1,499 | 7 (3.2%) | 5 (6.2%) |
| $1,500 to $1,999 | 14 (6.5%) | 4 (5.0%) |
| $2,000 to $2,499 | 0 (0.0%) | 0 (0.0%) |
| $2,500 to $2,999 | 0 (0.0%) | 0 (0.0%) |
| $3,000 or more | 0 (0.0%) | 0 (0.0%) |
| Total | 217 (100.0%) | 80 (100.0%) |
Physical Housing Characteristics in Maud
Housing Structures in Maud
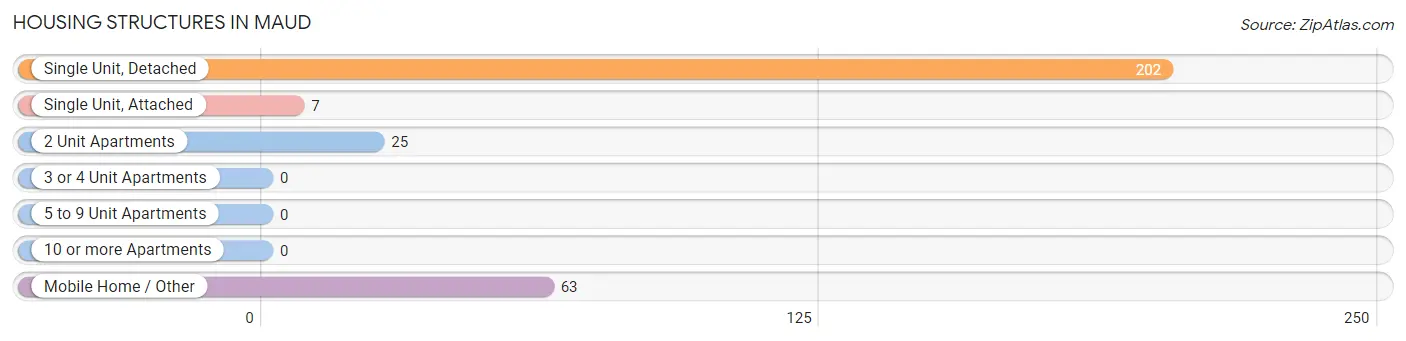
| Structure Type | # Housing Units | % Housing Units |
| Single Unit, Detached | 202 | 68.0% |
| Single Unit, Attached | 7 | 2.4% |
| 2 Unit Apartments | 25 | 8.4% |
| 3 or 4 Unit Apartments | 0 | 0.0% |
| 5 to 9 Unit Apartments | 0 | 0.0% |
| 10 or more Apartments | 0 | 0.0% |
| Mobile Home / Other | 63 | 21.2% |
| Total | 297 | 100.0% |
Housing Structures by Occupancy in Maud
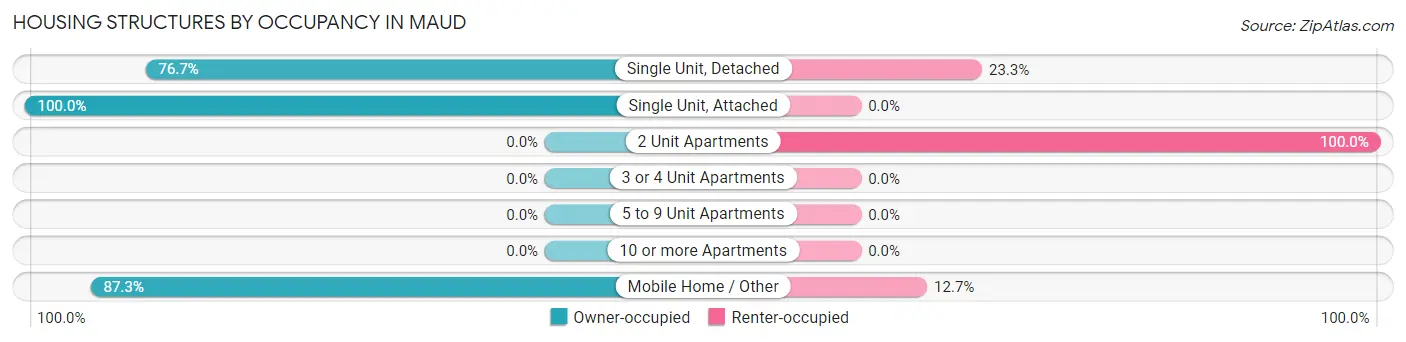
| Structure Type | Owner-occupied | Renter-occupied |
| Single Unit, Detached | 155 (76.7%) | 47 (23.3%) |
| Single Unit, Attached | 7 (100.0%) | 0 (0.0%) |
| 2 Unit Apartments | 0 (0.0%) | 25 (100.0%) |
| 3 or 4 Unit Apartments | 0 (0.0%) | 0 (0.0%) |
| 5 to 9 Unit Apartments | 0 (0.0%) | 0 (0.0%) |
| 10 or more Apartments | 0 (0.0%) | 0 (0.0%) |
| Mobile Home / Other | 55 (87.3%) | 8 (12.7%) |
| Total | 217 (73.1%) | 80 (26.9%) |
Housing Structures by Number of Rooms in Maud
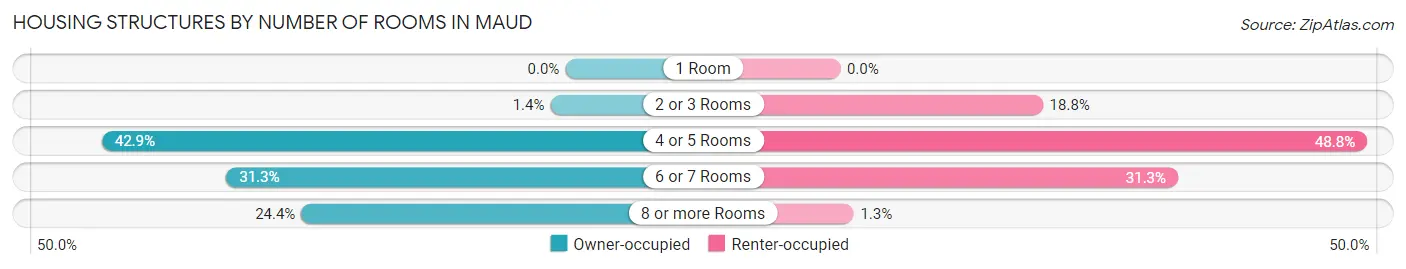
| Number of Rooms | Owner-occupied | Renter-occupied |
| 1 Room | 0 (0.0%) | 0 (0.0%) |
| 2 or 3 Rooms | 3 (1.4%) | 15 (18.8%) |
| 4 or 5 Rooms | 93 (42.9%) | 39 (48.7%) |
| 6 or 7 Rooms | 68 (31.3%) | 25 (31.2%) |
| 8 or more Rooms | 53 (24.4%) | 1 (1.3%) |
| Total | 217 (100.0%) | 80 (100.0%) |
Housing Structure by Heating Type in Maud
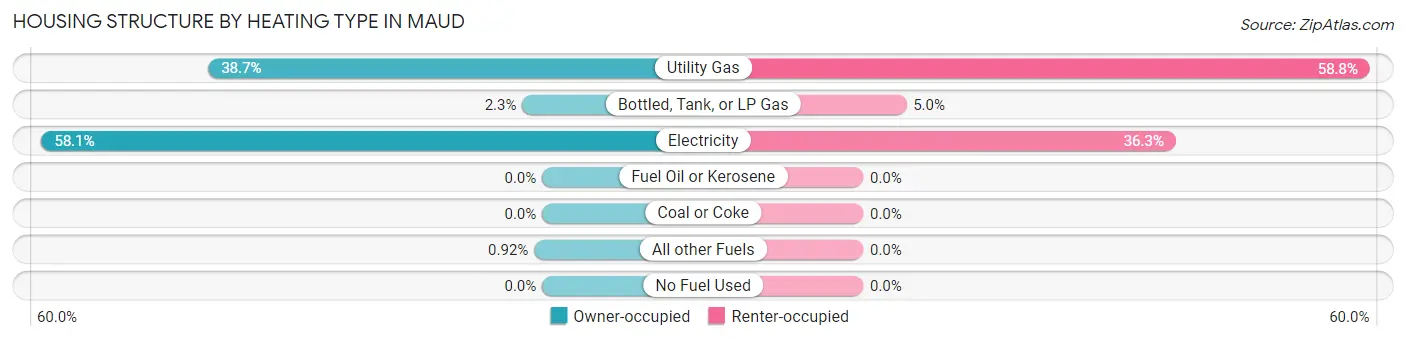
| Heating Type | Owner-occupied | Renter-occupied |
| Utility Gas | 84 (38.7%) | 47 (58.8%) |
| Bottled, Tank, or LP Gas | 5 (2.3%) | 4 (5.0%) |
| Electricity | 126 (58.1%) | 29 (36.2%) |
| Fuel Oil or Kerosene | 0 (0.0%) | 0 (0.0%) |
| Coal or Coke | 0 (0.0%) | 0 (0.0%) |
| All other Fuels | 2 (0.9%) | 0 (0.0%) |
| No Fuel Used | 0 (0.0%) | 0 (0.0%) |
| Total | 217 (100.0%) | 80 (100.0%) |
Household Vehicle Usage in Maud
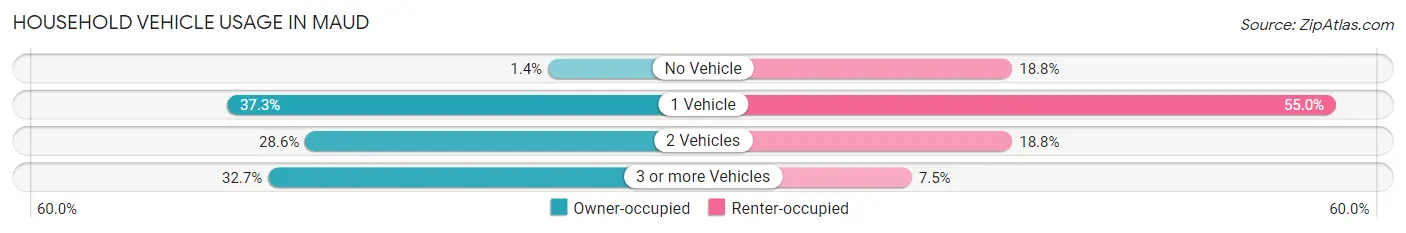
| Vehicles per Household | Owner-occupied | Renter-occupied |
| No Vehicle | 3 (1.4%) | 15 (18.8%) |
| 1 Vehicle | 81 (37.3%) | 44 (55.0%) |
| 2 Vehicles | 62 (28.6%) | 15 (18.8%) |
| 3 or more Vehicles | 71 (32.7%) | 6 (7.5%) |
| Total | 217 (100.0%) | 80 (100.0%) |
Real Estate & Mortgages in Maud
Real Estate and Mortgage Overview in Maud
| Characteristic | Without Mortgage | With Mortgage |
| Housing Units | 119 | 98 |
| Median Property Value | $55,000 | $57,500 |
| Median Household Income | $40,938 | $6 |
| Monthly Housing Costs | $302 | $0 |
| Real Estate Taxes | $239 | $0 |
Property Value by Mortgage Status in Maud
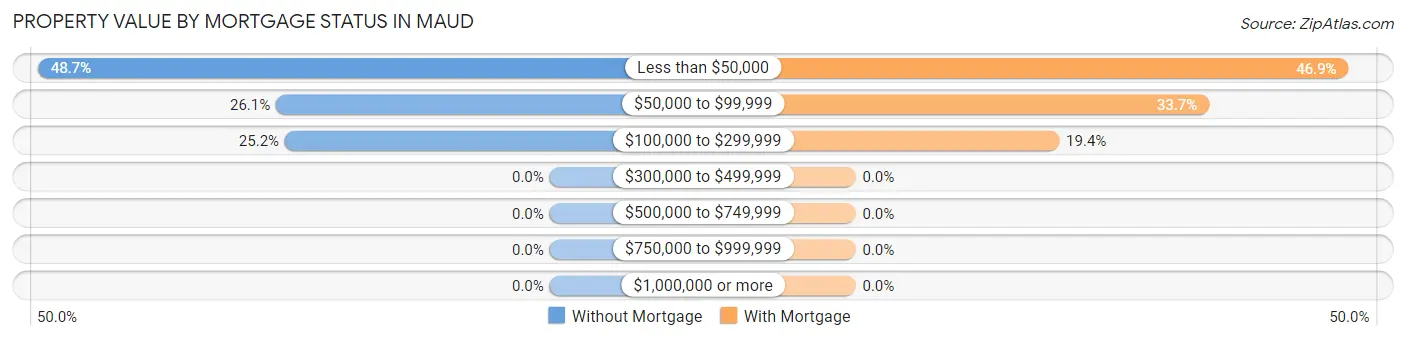
| Property Value | Without Mortgage | With Mortgage |
| Less than $50,000 | 58 (48.7%) | 46 (46.9%) |
| $50,000 to $99,999 | 31 (26.1%) | 33 (33.7%) |
| $100,000 to $299,999 | 30 (25.2%) | 19 (19.4%) |
| $300,000 to $499,999 | 0 (0.0%) | 0 (0.0%) |
| $500,000 to $749,999 | 0 (0.0%) | 0 (0.0%) |
| $750,000 to $999,999 | 0 (0.0%) | 0 (0.0%) |
| $1,000,000 or more | 0 (0.0%) | 0 (0.0%) |
| Total | 119 (100.0%) | 98 (100.0%) |
Household Income by Mortgage Status in Maud
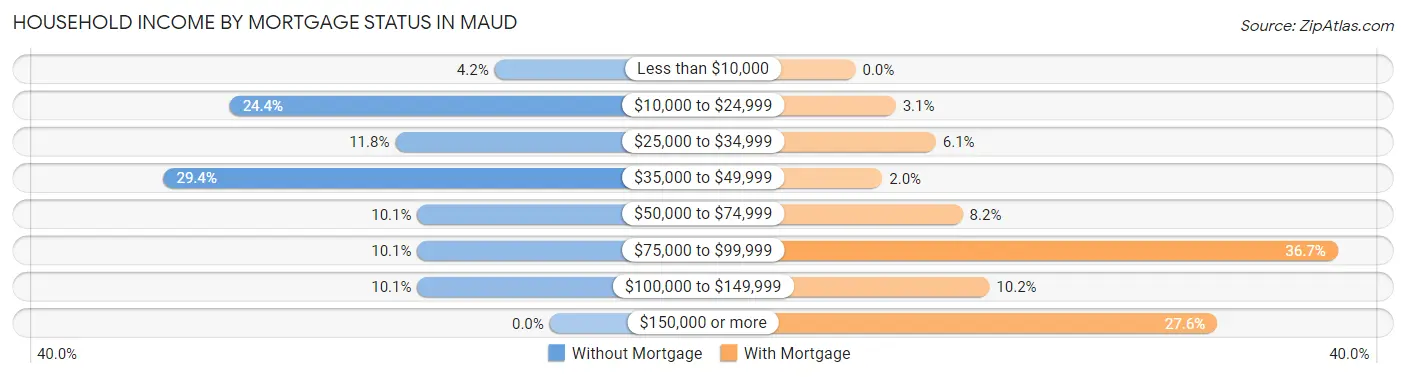
| Household Income | Without Mortgage | With Mortgage |
| Less than $10,000 | 5 (4.2%) | 0 (0.0%) |
| $10,000 to $24,999 | 29 (24.4%) | 3 (3.1%) |
| $25,000 to $34,999 | 14 (11.8%) | 6 (6.1%) |
| $35,000 to $49,999 | 35 (29.4%) | 2 (2.0%) |
| $50,000 to $74,999 | 12 (10.1%) | 8 (8.2%) |
| $75,000 to $99,999 | 12 (10.1%) | 36 (36.7%) |
| $100,000 to $149,999 | 12 (10.1%) | 10 (10.2%) |
| $150,000 or more | 0 (0.0%) | 27 (27.6%) |
| Total | 119 (100.0%) | 98 (100.0%) |
Property Value to Household Income Ratio in Maud
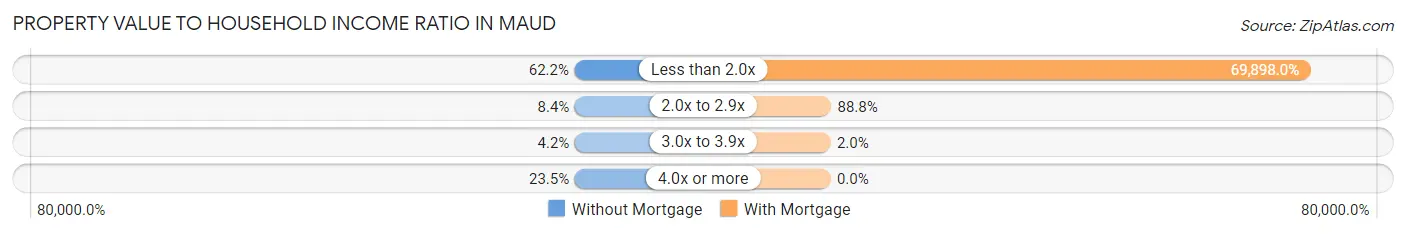
| Value-to-Income Ratio | Without Mortgage | With Mortgage |
| Less than 2.0x | 74 (62.2%) | 68,500 (69,898.0%) |
| 2.0x to 2.9x | 10 (8.4%) | 87 (88.8%) |
| 3.0x to 3.9x | 5 (4.2%) | 2 (2.0%) |
| 4.0x or more | 28 (23.5%) | 0 (0.0%) |
| Total | 119 (100.0%) | 98 (100.0%) |
Real Estate Taxes by Mortgage Status in Maud
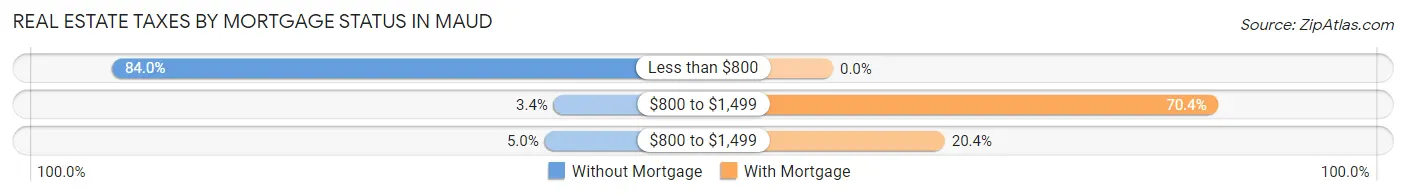
| Property Taxes | Without Mortgage | With Mortgage |
| Less than $800 | 100 (84.0%) | 0 (0.0%) |
| $800 to $1,499 | 4 (3.4%) | 69 (70.4%) |
| $800 to $1,499 | 6 (5.0%) | 20 (20.4%) |
| Total | 119 (100.0%) | 98 (100.0%) |
Health & Disability in Maud
Health Insurance Coverage by Age in Maud
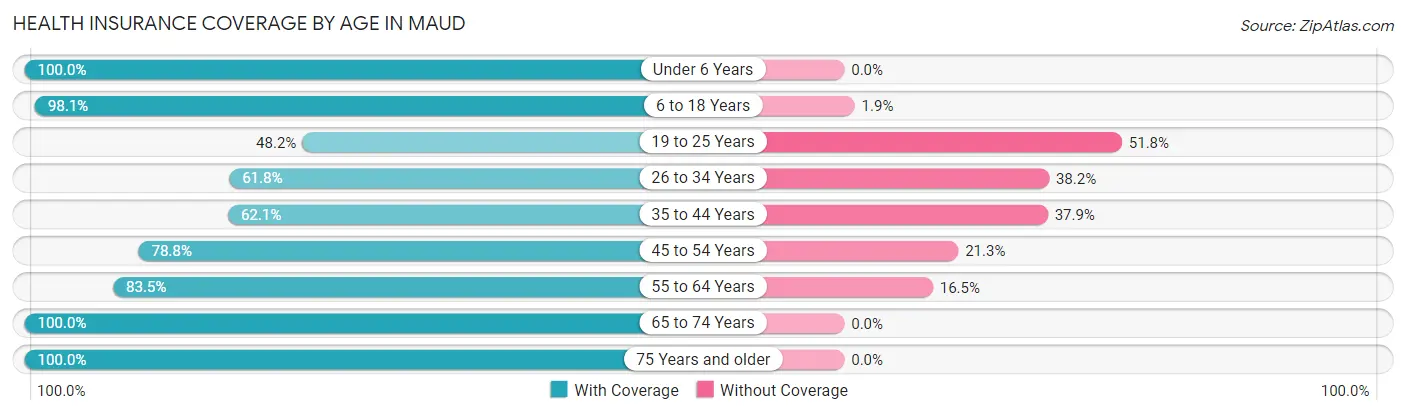
| Age Bracket | With Coverage | Without Coverage |
| Under 6 Years | 70 (100.0%) | 0 (0.0%) |
| 6 to 18 Years | 203 (98.1%) | 4 (1.9%) |
| 19 to 25 Years | 41 (48.2%) | 44 (51.8%) |
| 26 to 34 Years | 81 (61.8%) | 50 (38.2%) |
| 35 to 44 Years | 54 (62.1%) | 33 (37.9%) |
| 45 to 54 Years | 63 (78.7%) | 17 (21.2%) |
| 55 to 64 Years | 86 (83.5%) | 17 (16.5%) |
| 65 to 74 Years | 79 (100.0%) | 0 (0.0%) |
| 75 Years and older | 21 (100.0%) | 0 (0.0%) |
| Total | 698 (80.9%) | 165 (19.1%) |
Health Insurance Coverage by Citizenship Status in Maud
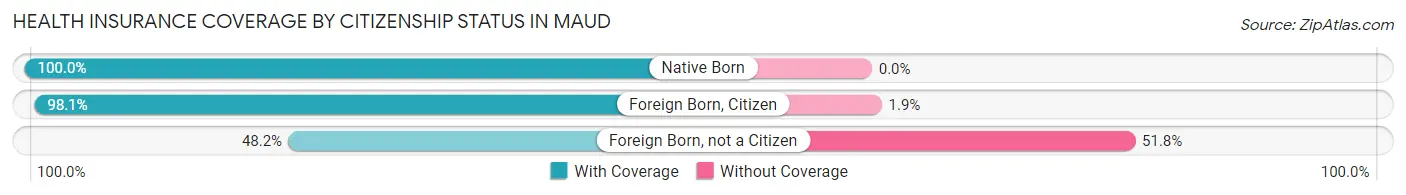
| Citizenship Status | With Coverage | Without Coverage |
| Native Born | 70 (100.0%) | 0 (0.0%) |
| Foreign Born, Citizen | 203 (98.1%) | 4 (1.9%) |
| Foreign Born, not a Citizen | 41 (48.2%) | 44 (51.8%) |
Health Insurance Coverage by Household Income in Maud
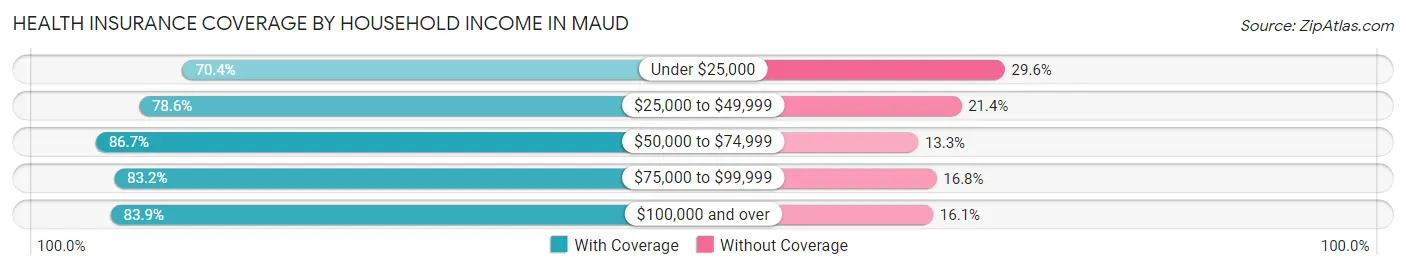
| Household Income | With Coverage | Without Coverage |
| Under $25,000 | 100 (70.4%) | 42 (29.6%) |
| $25,000 to $49,999 | 154 (78.6%) | 42 (21.4%) |
| $50,000 to $74,999 | 143 (86.7%) | 22 (13.3%) |
| $75,000 to $99,999 | 119 (83.2%) | 24 (16.8%) |
| $100,000 and over | 182 (83.9%) | 35 (16.1%) |
Public vs Private Health Insurance Coverage by Age in Maud
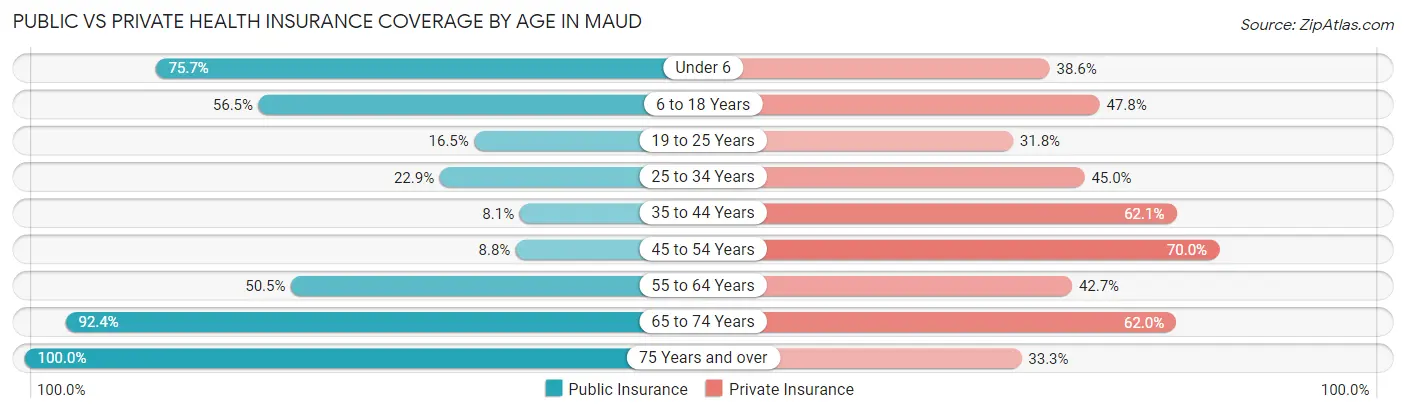
| Age Bracket | Public Insurance | Private Insurance |
| Under 6 | 53 (75.7%) | 27 (38.6%) |
| 6 to 18 Years | 117 (56.5%) | 99 (47.8%) |
| 19 to 25 Years | 14 (16.5%) | 27 (31.8%) |
| 25 to 34 Years | 30 (22.9%) | 59 (45.0%) |
| 35 to 44 Years | 7 (8.1%) | 54 (62.1%) |
| 45 to 54 Years | 7 (8.7%) | 56 (70.0%) |
| 55 to 64 Years | 52 (50.5%) | 44 (42.7%) |
| 65 to 74 Years | 73 (92.4%) | 49 (62.0%) |
| 75 Years and over | 21 (100.0%) | 7 (33.3%) |
| Total | 374 (43.3%) | 422 (48.9%) |
Disability Status by Sex by Age in Maud
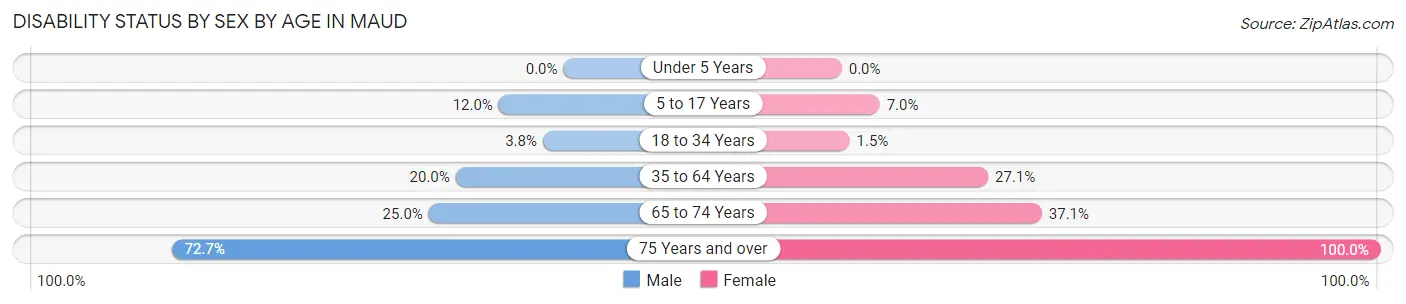
| Age Bracket | Male | Female |
| Under 5 Years | 0 (0.0%) | 0 (0.0%) |
| 5 to 17 Years | 15 (12.0%) | 5 (7.0%) |
| 18 to 34 Years | 4 (3.8%) | 2 (1.5%) |
| 35 to 64 Years | 26 (20.0%) | 38 (27.1%) |
| 65 to 74 Years | 11 (25.0%) | 13 (37.1%) |
| 75 Years and over | 8 (72.7%) | 10 (100.0%) |
Disability Class by Sex by Age in Maud
Disability Class: Hearing Difficulty
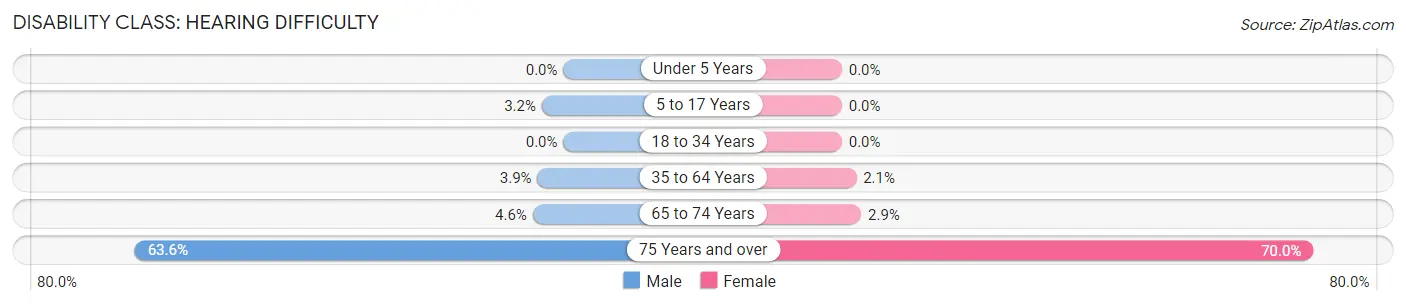
| Age Bracket | Male | Female |
| Under 5 Years | 0 (0.0%) | 0 (0.0%) |
| 5 to 17 Years | 4 (3.2%) | 0 (0.0%) |
| 18 to 34 Years | 0 (0.0%) | 0 (0.0%) |
| 35 to 64 Years | 5 (3.8%) | 3 (2.1%) |
| 65 to 74 Years | 2 (4.5%) | 1 (2.9%) |
| 75 Years and over | 7 (63.6%) | 7 (70.0%) |
Disability Class: Vision Difficulty
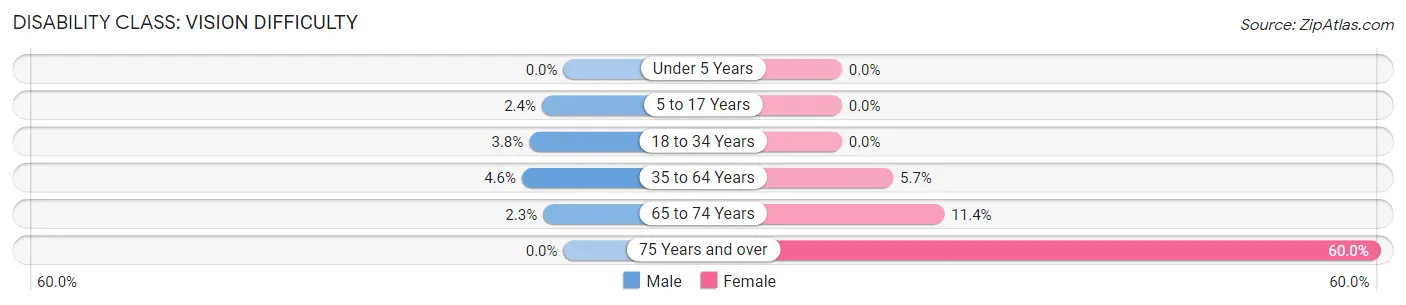
| Age Bracket | Male | Female |
| Under 5 Years | 0 (0.0%) | 0 (0.0%) |
| 5 to 17 Years | 3 (2.4%) | 0 (0.0%) |
| 18 to 34 Years | 4 (3.8%) | 0 (0.0%) |
| 35 to 64 Years | 6 (4.6%) | 8 (5.7%) |
| 65 to 74 Years | 1 (2.3%) | 4 (11.4%) |
| 75 Years and over | 0 (0.0%) | 6 (60.0%) |
Disability Class: Cognitive Difficulty
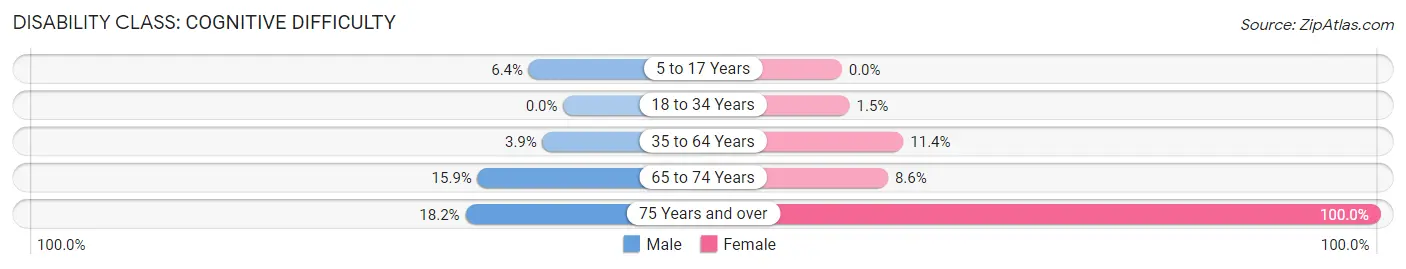
| Age Bracket | Male | Female |
| 5 to 17 Years | 8 (6.4%) | 0 (0.0%) |
| 18 to 34 Years | 0 (0.0%) | 2 (1.5%) |
| 35 to 64 Years | 5 (3.8%) | 16 (11.4%) |
| 65 to 74 Years | 7 (15.9%) | 3 (8.6%) |
| 75 Years and over | 2 (18.2%) | 10 (100.0%) |
Disability Class: Ambulatory Difficulty
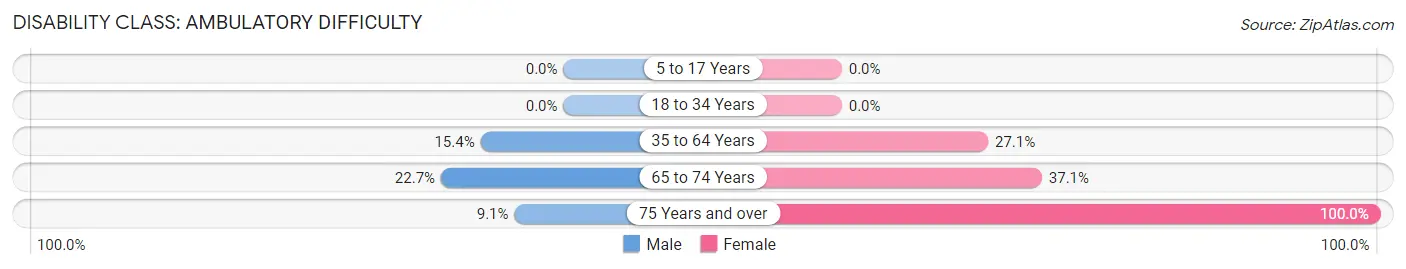
| Age Bracket | Male | Female |
| 5 to 17 Years | 0 (0.0%) | 0 (0.0%) |
| 18 to 34 Years | 0 (0.0%) | 0 (0.0%) |
| 35 to 64 Years | 20 (15.4%) | 38 (27.1%) |
| 65 to 74 Years | 10 (22.7%) | 13 (37.1%) |
| 75 Years and over | 1 (9.1%) | 10 (100.0%) |
Disability Class: Self-Care Difficulty
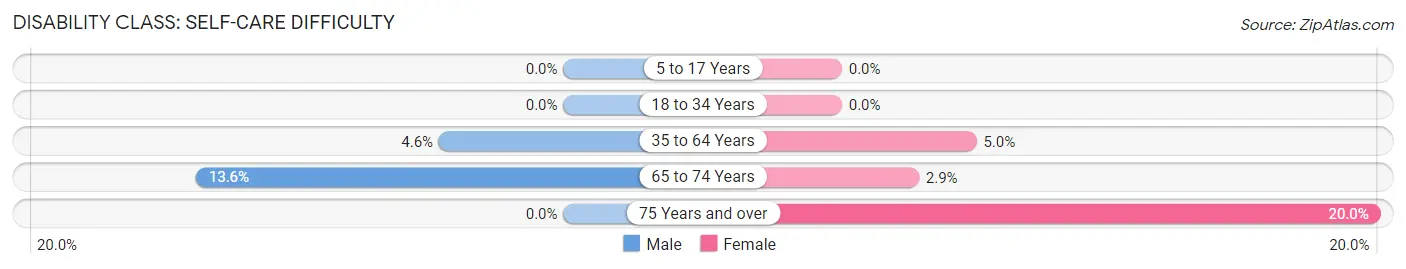
| Age Bracket | Male | Female |
| 5 to 17 Years | 0 (0.0%) | 0 (0.0%) |
| 18 to 34 Years | 0 (0.0%) | 0 (0.0%) |
| 35 to 64 Years | 6 (4.6%) | 7 (5.0%) |
| 65 to 74 Years | 6 (13.6%) | 1 (2.9%) |
| 75 Years and over | 0 (0.0%) | 2 (20.0%) |
Technology Access in Maud
Computing Device Access in Maud
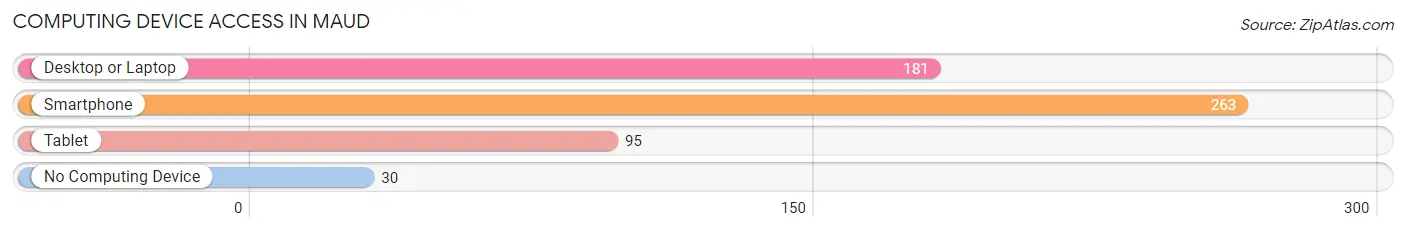
| Device Type | # Households | % Households |
| Desktop or Laptop | 181 | 60.9% |
| Smartphone | 263 | 88.5% |
| Tablet | 95 | 32.0% |
| No Computing Device | 30 | 10.1% |
| Total | 297 | 100.0% |
Internet Access in Maud
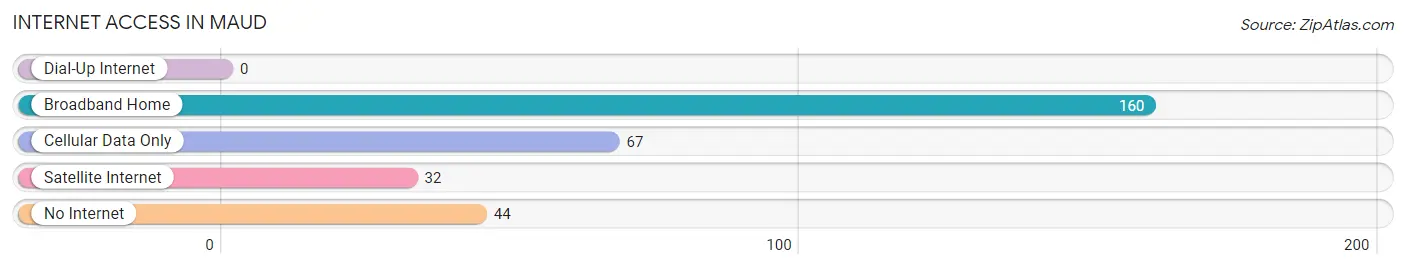
| Internet Type | # Households | % Households |
| Dial-Up Internet | 0 | 0.0% |
| Broadband Home | 160 | 53.9% |
| Cellular Data Only | 67 | 22.6% |
| Satellite Internet | 32 | 10.8% |
| No Internet | 44 | 14.8% |
| Total | 297 | 100.0% |
Maud Summary
Maud is a small town located in Pottawatomie County, Oklahoma. It is situated in the east-central part of the state, about 40 miles east of Oklahoma City. The town was founded in 1891 and named after Maud Suggs, the daughter of a local rancher. The population of Maud was 1,845 in the 2010 census.
Geography
Maud is located in the east-central part of Oklahoma, about 40 miles east of Oklahoma City. It is situated in the Cross Timbers region of the state, which is characterized by rolling hills and wooded areas. The town is located on the banks of the North Canadian River, which flows through the area. The climate in Maud is generally mild, with hot summers and cold winters.
Economy
Maud’s economy is largely based on agriculture and oil production. The town is home to several large farms, which produce a variety of crops, including wheat, corn, soybeans, and cotton. The town is also home to several oil and gas wells, which provide jobs and revenue for the local economy. In addition, Maud is home to several small businesses, including restaurants, retail stores, and service providers.
Demographics
As of the 2010 census, the population of Maud was 1,845. The racial makeup of the town was 94.3% White, 0.7% African American, 0.7% Native American, 0.2% Asian, 0.1% Pacific Islander, and 3.1% from other races. The median household income in Maud was $35,938, and the median family income was $41,250. The per capita income in Maud was $17,845.
Education
Maud is served by the Maud Public School District, which includes an elementary school, a middle school, and a high school. The town is also home to a branch of Eastern Oklahoma State College, which offers a variety of degree and certificate programs.
Conclusion
Maud is a small town located in Pottawatomie County, Oklahoma. It is situated in the east-central part of the state, about 40 miles east of Oklahoma City. The town was founded in 1891 and named after Maud Suggs, the daughter of a local rancher. The population of Maud was 1,845 in the 2010 census. The town’s economy is largely based on agriculture and oil production, and it is served by the Maud Public School District and a branch of Eastern Oklahoma State College.
Common Questions
What is Per Capita Income in Maud?
Per Capita income in Maud is $20,346.
What is the Median Family Income in Maud?
Median Family Income in Maud is $54,688.
What is the Median Household income in Maud?
Median Household Income in Maud is $49,013.
What is Income or Wage Gap in Maud?
Income or Wage Gap in Maud is 39.3%.
Women in Maud earn 60.7 cents for every dollar earned by a man.
What is Inequality or Gini Index in Maud?
Inequality or Gini Index in Maud is 0.38.
What is the Total Population of Maud?
Total Population of Maud is 872.
What is the Total Male Population of Maud?
Total Male Population of Maud is 439.
What is the Total Female Population of Maud?
Total Female Population of Maud is 433.
What is the Ratio of Males per 100 Females in Maud?
There are 101.39 Males per 100 Females in Maud.
What is the Ratio of Females per 100 Males in Maud?
There are 98.63 Females per 100 Males in Maud.
What is the Median Population Age in Maud?
Median Population Age in Maud is 30.9 Years.
What is the Average Family Size in Maud
Average Family Size in Maud is 3.4 People.
What is the Average Household Size in Maud
Average Household Size in Maud is 2.9 People.
How Large is the Labor Force in Maud?
There are 322 People in the Labor Forcein in Maud.
What is the Percentage of People in the Labor Force in Maud?
48.2% of People are in the Labor Force in Maud.
What is the Unemployment Rate in Maud?
Unemployment Rate in Maud is 5.9%.