Bartlesville, OK Map & Demographics
Bartlesville Map
Bartlesville Overview
$34,131
PER CAPITA INCOME
$77,328
AVG FAMILY INCOME
$58,230
AVG HOUSEHOLD INCOME
18.4%
WAGE / INCOME GAP [ % ]
81.6¢/ $1
WAGE / INCOME GAP [ $ ]
$11,110
FAMILY INCOME DEFICIT
0.47
INEQUALITY / GINI INDEX
37,314
TOTAL POPULATION
18,282
MALE POPULATION
19,032
FEMALE POPULATION
96.06
MALES / 100 FEMALES
104.10
FEMALES / 100 MALES
37.5
MEDIAN AGE
3.1
AVG FAMILY SIZE
2.5
AVG HOUSEHOLD SIZE
17,227
LABOR FORCE [ PEOPLE ]
58.9%
PERCENT IN LABOR FORCE
4.1%
UNEMPLOYMENT RATE
Bartlesville Area Codes
Income in Bartlesville
Income Overview in Bartlesville
Per Capita Income in Bartlesville is $34,131, while median incomes of families and households are $77,328 and $58,230 respectively.
| Characteristic | Number | Measure |
| Per Capita Income | 37,314 | $34,131 |
| Median Family Income | 9,366 | $77,328 |
| Mean Family Income | 9,366 | $101,374 |
| Median Household Income | 14,480 | $58,230 |
| Mean Household Income | 14,480 | $83,624 |
| Income Deficit | 9,366 | $11,110 |
| Wage / Income Gap (%) | 37,314 | 18.44% |
| Wage / Income Gap ($) | 37,314 | 81.56¢ per $1 |
| Gini / Inequality Index | 37,314 | 0.47 |
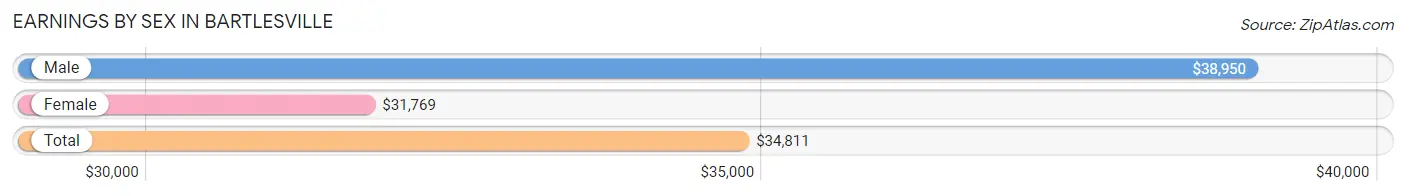
Earnings by Sex in Bartlesville
Average Earnings in Bartlesville are $34,811, $38,950 for men and $31,769 for women, a difference of 18.4%.
| Sex | Number | Average Earnings |
| Male | 9,740 (53.4%) | $38,950 |
| Female | 8,495 (46.6%) | $31,769 |
| Total | 18,235 (100.0%) | $34,811 |
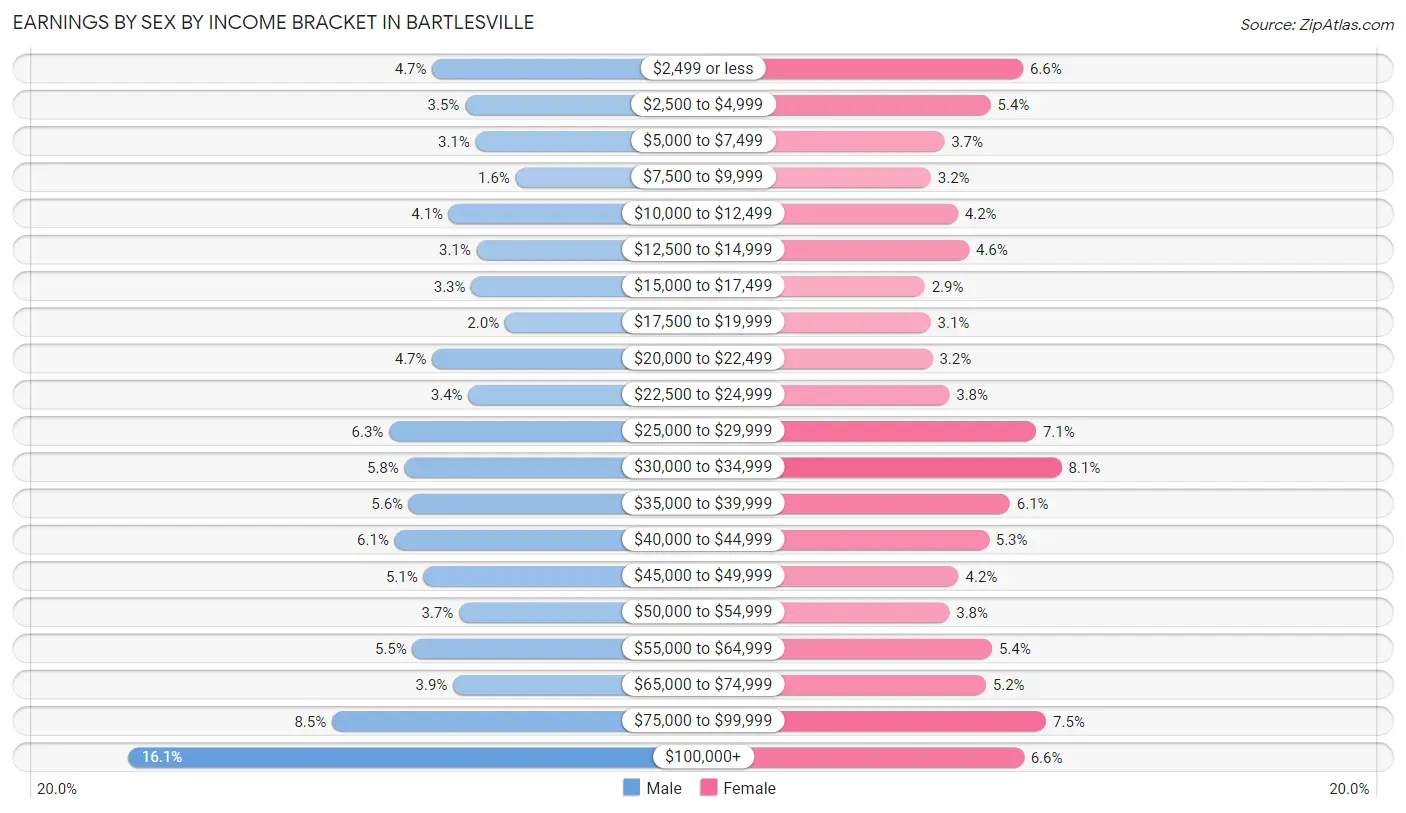
Earnings by Sex by Income Bracket in Bartlesville
The most common earnings brackets in Bartlesville are $100,000+ for men (1,567 | 16.1%) and $30,000 to $34,999 for women (684 | 8.1%).
| Income | Male | Female |
| $2,499 or less | 460 (4.7%) | 561 (6.6%) |
| $2,500 to $4,999 | 340 (3.5%) | 458 (5.4%) |
| $5,000 to $7,499 | 302 (3.1%) | 310 (3.6%) |
| $7,500 to $9,999 | 156 (1.6%) | 268 (3.2%) |
| $10,000 to $12,499 | 399 (4.1%) | 353 (4.2%) |
| $12,500 to $14,999 | 298 (3.1%) | 389 (4.6%) |
| $15,000 to $17,499 | 318 (3.3%) | 248 (2.9%) |
| $17,500 to $19,999 | 195 (2.0%) | 267 (3.1%) |
| $20,000 to $22,499 | 460 (4.7%) | 273 (3.2%) |
| $22,500 to $24,999 | 328 (3.4%) | 326 (3.8%) |
| $25,000 to $29,999 | 618 (6.3%) | 602 (7.1%) |
| $30,000 to $34,999 | 561 (5.8%) | 684 (8.1%) |
| $35,000 to $39,999 | 545 (5.6%) | 519 (6.1%) |
| $40,000 to $44,999 | 597 (6.1%) | 452 (5.3%) |
| $45,000 to $49,999 | 492 (5.1%) | 356 (4.2%) |
| $50,000 to $54,999 | 362 (3.7%) | 326 (3.8%) |
| $55,000 to $64,999 | 532 (5.5%) | 462 (5.4%) |
| $65,000 to $74,999 | 384 (3.9%) | 443 (5.2%) |
| $75,000 to $99,999 | 826 (8.5%) | 635 (7.5%) |
| $100,000+ | 1,567 (16.1%) | 563 (6.6%) |
| Total | 9,740 (100.0%) | 8,495 (100.0%) |
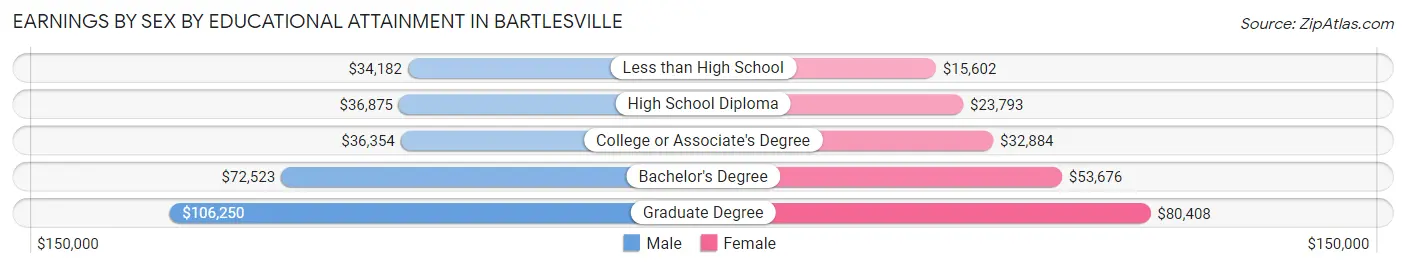
Earnings by Sex by Educational Attainment in Bartlesville
Average earnings in Bartlesville are $45,108 for men and $34,994 for women, a difference of 22.4%. Men with an educational attainment of graduate degree enjoy the highest average annual earnings of $106,250, while those with less than high school education earn the least with $34,182. Women with an educational attainment of graduate degree earn the most with the average annual earnings of $80,408, while those with less than high school education have the smallest earnings of $15,602.
| Educational Attainment | Male Income | Female Income |
| Less than High School | $34,182 | $15,602 |
| High School Diploma | $36,875 | $23,793 |
| College or Associate's Degree | $36,354 | $32,884 |
| Bachelor's Degree | $72,523 | $53,676 |
| Graduate Degree | $106,250 | $80,408 |
| Total | $45,108 | $34,994 |
Family Income in Bartlesville
Family Income Brackets in Bartlesville
According to the Bartlesville family income data, there are 1,751 families falling into the $100,000 to $149,999 income range, which is the most common income bracket and makes up 18.7% of all families. Conversely, the $10,000 to $14,999 income bracket is the least frequent group with only 197 families (2.1%) belonging to this category.
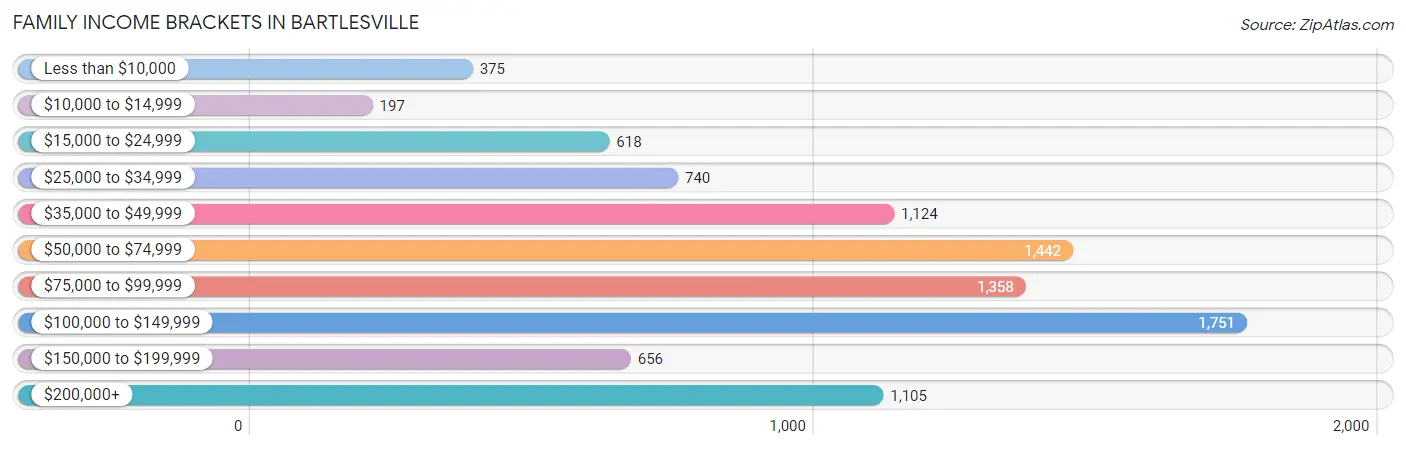
| Income Bracket | # Families | % Families |
| Less than $10,000 | 375 | 4.0% |
| $10,000 to $14,999 | 197 | 2.1% |
| $15,000 to $24,999 | 618 | 6.6% |
| $25,000 to $34,999 | 740 | 7.9% |
| $35,000 to $49,999 | 1,124 | 12.0% |
| $50,000 to $74,999 | 1,442 | 15.4% |
| $75,000 to $99,999 | 1,358 | 14.5% |
| $100,000 to $149,999 | 1,751 | 18.7% |
| $150,000 to $199,999 | 656 | 7.0% |
| $200,000+ | 1,105 | 11.8% |
Family Income by Famaliy Size in Bartlesville
6-person families (357 | 3.8%) account for the highest median family income in Bartlesville with $100,917 per family, while 2-person families (4,859 | 51.9%) have the highest median income of $36,184 per family member.
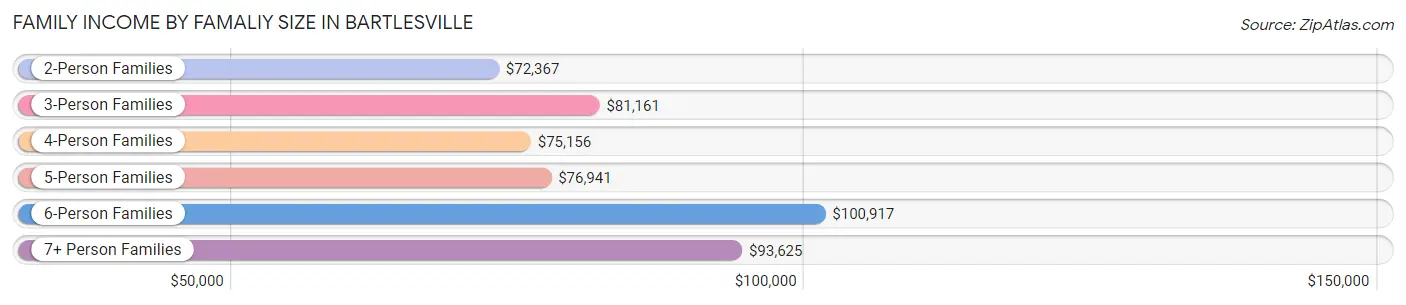
| Income Bracket | # Families | Median Income |
| 2-Person Families | 4,859 (51.9%) | $72,367 |
| 3-Person Families | 1,858 (19.8%) | $81,161 |
| 4-Person Families | 1,500 (16.0%) | $75,156 |
| 5-Person Families | 695 (7.4%) | $76,941 |
| 6-Person Families | 357 (3.8%) | $100,917 |
| 7+ Person Families | 97 (1.0%) | $93,625 |
| Total | 9,366 (100.0%) | $77,328 |
Family Income by Number of Earners in Bartlesville
The median family income in Bartlesville is $77,328, with families comprising 3+ earners (667) having the highest median family income of $111,678, while families with no earners (1,486) have the lowest median family income of $49,018, accounting for 7.1% and 15.9% of families, respectively.
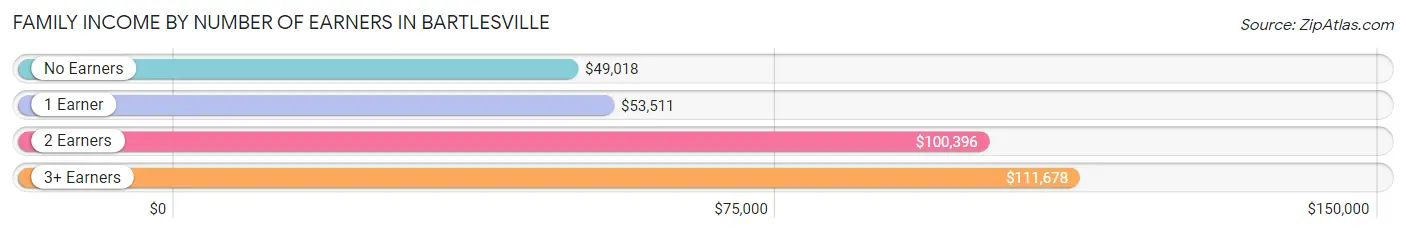
| Number of Earners | # Families | Median Income |
| No Earners | 1,486 (15.9%) | $49,018 |
| 1 Earner | 3,600 (38.4%) | $53,511 |
| 2 Earners | 3,613 (38.6%) | $100,396 |
| 3+ Earners | 667 (7.1%) | $111,678 |
| Total | 9,366 (100.0%) | $77,328 |
Household Income in Bartlesville
Household Income Brackets in Bartlesville
With 2,302 households falling in the category, the $50,000 to $74,999 income range is the most frequent in Bartlesville, accounting for 15.9% of all households. In contrast, only 550 households (3.8%) fall into the $10,000 to $14,999 income bracket, making it the least populous group.
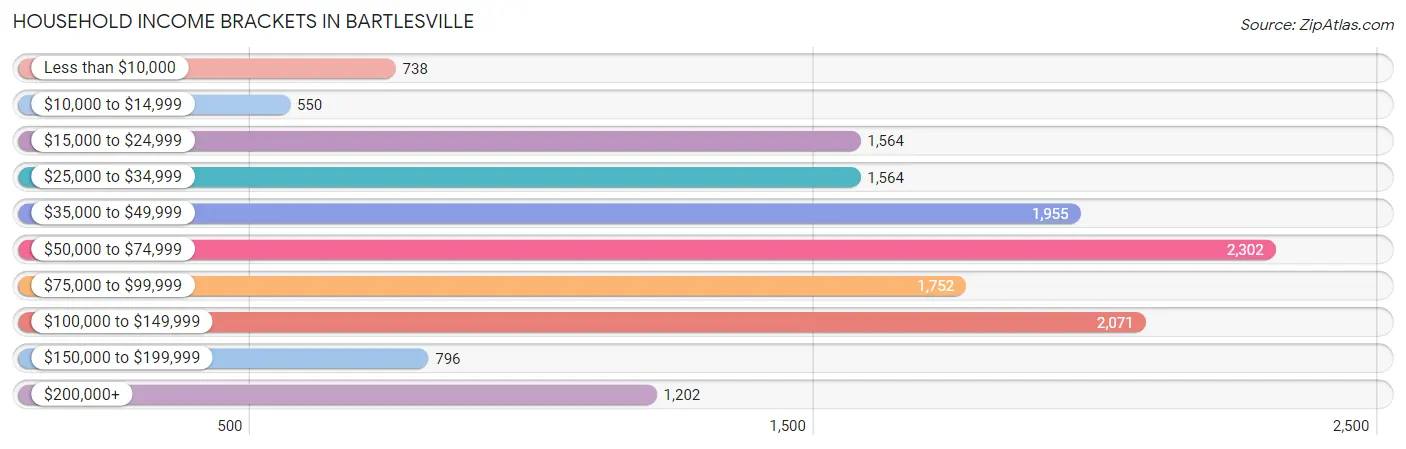
| Income Bracket | # Households | % Households |
| Less than $10,000 | 738 | 5.1% |
| $10,000 to $14,999 | 550 | 3.8% |
| $15,000 to $24,999 | 1,564 | 10.8% |
| $25,000 to $34,999 | 1,564 | 10.8% |
| $35,000 to $49,999 | 1,955 | 13.5% |
| $50,000 to $74,999 | 2,302 | 15.9% |
| $75,000 to $99,999 | 1,752 | 12.1% |
| $100,000 to $149,999 | 2,071 | 14.3% |
| $150,000 to $199,999 | 796 | 5.5% |
| $200,000+ | 1,202 | 8.3% |
Household Income by Householder Age in Bartlesville
The median household income in Bartlesville is $58,230, with the highest median household income of $72,731 found in the 45 to 64 years age bracket for the primary householder. A total of 4,895 households (33.8%) fall into this category. Meanwhile, the 15 to 24 years age bracket for the primary householder has the lowest median household income of $35,708, with 673 households (4.6%) in this group.
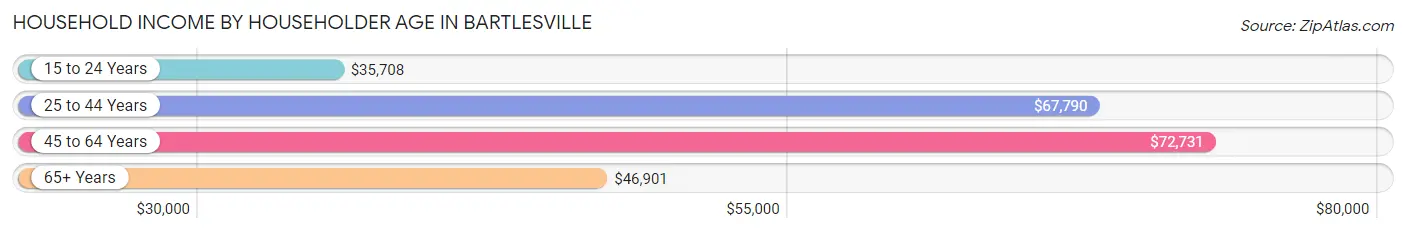
| Income Bracket | # Households | Median Income |
| 15 to 24 Years | 673 (4.6%) | $35,708 |
| 25 to 44 Years | 4,455 (30.8%) | $67,790 |
| 45 to 64 Years | 4,895 (33.8%) | $72,731 |
| 65+ Years | 4,457 (30.8%) | $46,901 |
| Total | 14,480 (100.0%) | $58,230 |
Poverty in Bartlesville
Income Below Poverty by Sex and Age in Bartlesville
With 13.1% poverty level for males and 15.5% for females among the residents of Bartlesville, 5 year old males and under 5 year old females are the most vulnerable to poverty, with 49 males (28.5%) and 329 females (27.9%) in their respective age groups living below the poverty level.
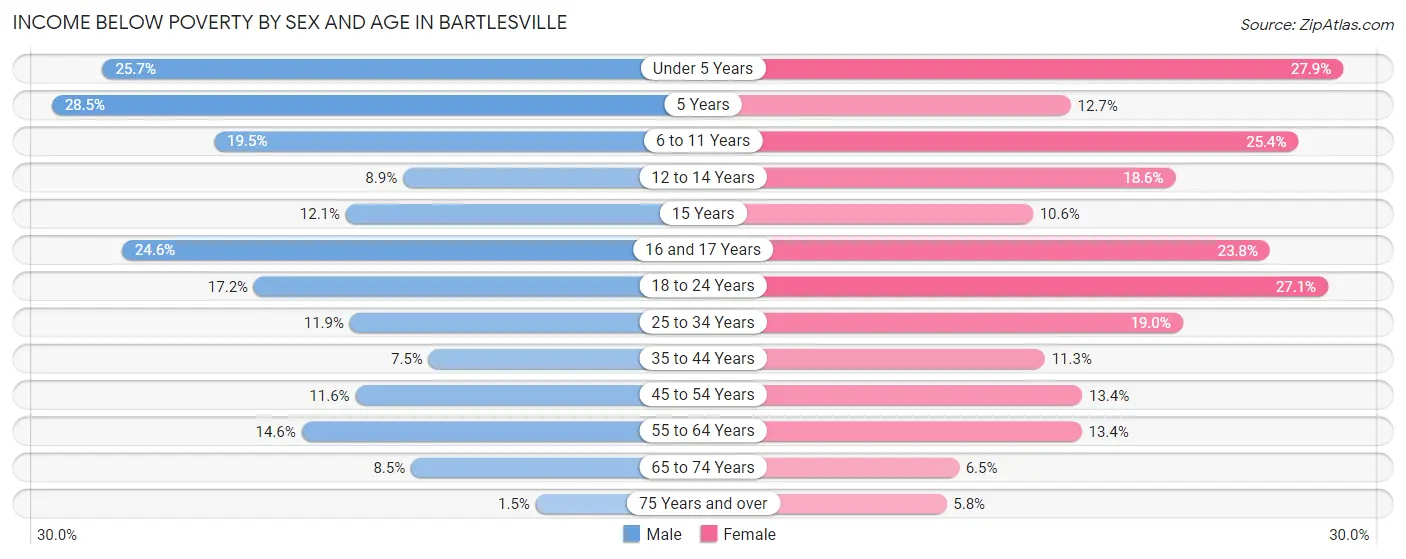
| Age Bracket | Male | Female |
| Under 5 Years | 312 (25.7%) | 329 (27.9%) |
| 5 Years | 49 (28.5%) | 27 (12.7%) |
| 6 to 11 Years | 311 (19.5%) | 350 (25.4%) |
| 12 to 14 Years | 65 (8.9%) | 138 (18.6%) |
| 15 Years | 31 (12.1%) | 27 (10.6%) |
| 16 and 17 Years | 132 (24.6%) | 92 (23.8%) |
| 18 to 24 Years | 279 (17.2%) | 379 (27.1%) |
| 25 to 34 Years | 289 (11.9%) | 460 (19.0%) |
| 35 to 44 Years | 167 (7.5%) | 241 (11.3%) |
| 45 to 54 Years | 227 (11.6%) | 296 (13.4%) |
| 55 to 64 Years | 286 (14.6%) | 309 (13.4%) |
| 65 to 74 Years | 141 (8.5%) | 133 (6.5%) |
| 75 Years and over | 19 (1.5%) | 115 (5.8%) |
| Total | 2,308 (13.1%) | 2,896 (15.5%) |
Income Above Poverty by Sex and Age in Bartlesville
According to the poverty statistics in Bartlesville, males aged 75 years and over and females aged 75 years and over are the age groups that are most secure financially, with 98.5% of males and 94.2% of females in these age groups living above the poverty line.
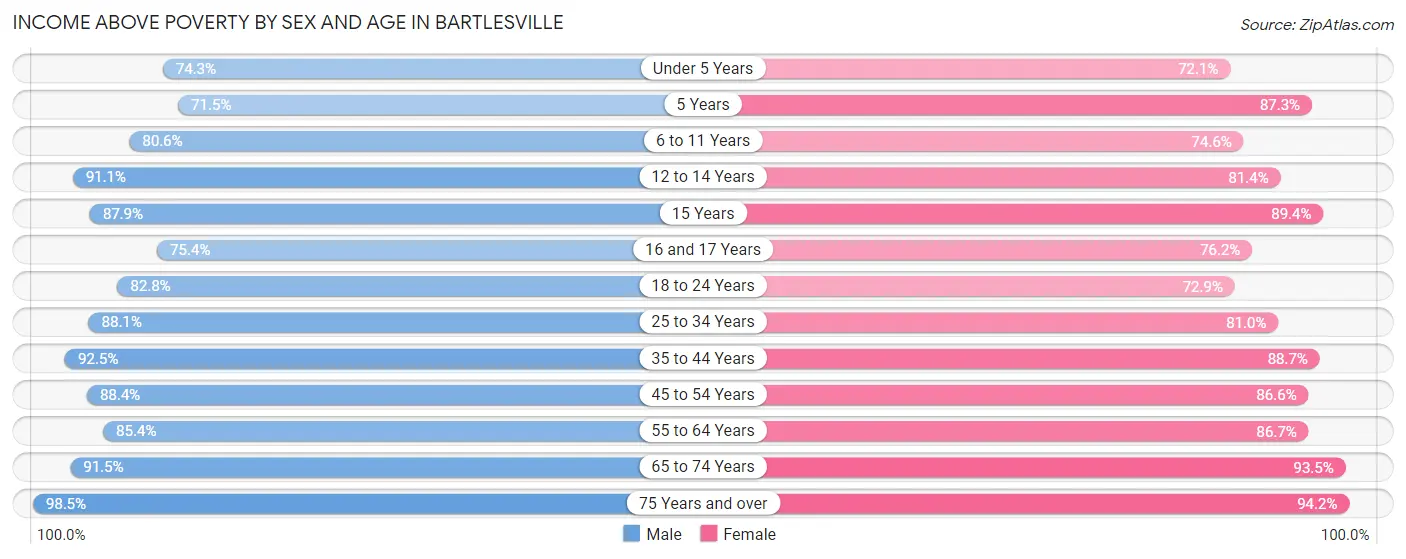
| Age Bracket | Male | Female |
| Under 5 Years | 904 (74.3%) | 850 (72.1%) |
| 5 Years | 123 (71.5%) | 185 (87.3%) |
| 6 to 11 Years | 1,288 (80.5%) | 1,027 (74.6%) |
| 12 to 14 Years | 663 (91.1%) | 605 (81.4%) |
| 15 Years | 225 (87.9%) | 227 (89.4%) |
| 16 and 17 Years | 405 (75.4%) | 294 (76.2%) |
| 18 to 24 Years | 1,340 (82.8%) | 1,021 (72.9%) |
| 25 to 34 Years | 2,141 (88.1%) | 1,964 (81.0%) |
| 35 to 44 Years | 2,061 (92.5%) | 1,891 (88.7%) |
| 45 to 54 Years | 1,734 (88.4%) | 1,916 (86.6%) |
| 55 to 64 Years | 1,676 (85.4%) | 2,006 (86.7%) |
| 65 to 74 Years | 1,521 (91.5%) | 1,909 (93.5%) |
| 75 Years and over | 1,213 (98.5%) | 1,860 (94.2%) |
| Total | 15,294 (86.9%) | 15,755 (84.5%) |
Income Below Poverty Among Married-Couple Families in Bartlesville
The poverty statistics for married-couple families in Bartlesville show that 5.6% or 395 of the total 7,058 families live below the poverty line. Families with 3 or 4 children have the highest poverty rate of 13.4%, comprising of 95 families. On the other hand, families with 5 or more children have the lowest poverty rate of 0.0%, which includes 0 families.
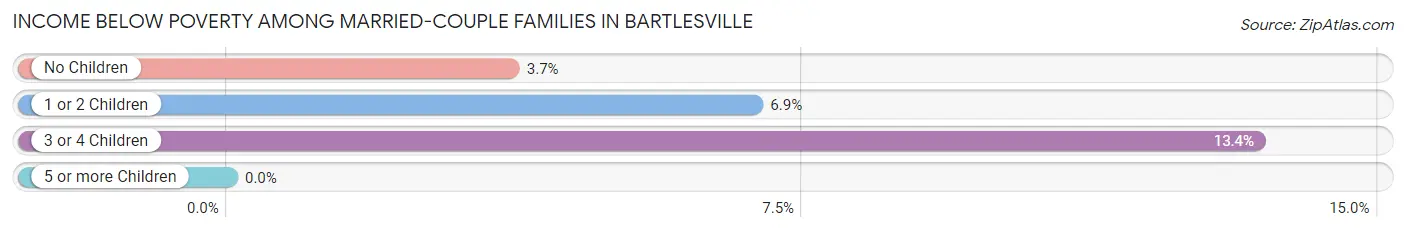
| Children | Above Poverty | Below Poverty |
| No Children | 4,060 (96.3%) | 155 (3.7%) |
| 1 or 2 Children | 1,968 (93.1%) | 145 (6.9%) |
| 3 or 4 Children | 613 (86.6%) | 95 (13.4%) |
| 5 or more Children | 22 (100.0%) | 0 (0.0%) |
| Total | 6,663 (94.4%) | 395 (5.6%) |
Income Below Poverty Among Single-Parent Households in Bartlesville
According to the poverty data in Bartlesville, 32.2% or 195 single-father households and 26.0% or 443 single-mother households are living below the poverty line. Among single-father households, those with 3 or 4 children have the highest poverty rate, with 52 households (48.1%) experiencing poverty. Likewise, among single-mother households, those with 5 or more children have the highest poverty rate, with 67 households (100.0%) falling below the poverty line.
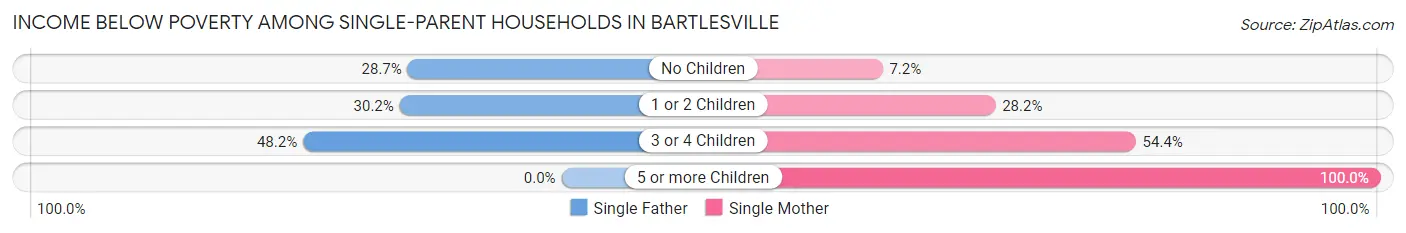
| Children | Single Father | Single Mother |
| No Children | 45 (28.7%) | 45 (7.2%) |
| 1 or 2 Children | 98 (30.1%) | 238 (28.2%) |
| 3 or 4 Children | 52 (48.1%) | 93 (54.4%) |
| 5 or more Children | 0 (0.0%) | 67 (100.0%) |
| Total | 195 (32.2%) | 443 (26.0%) |
Income Below Poverty Among Married-Couple vs Single-Parent Households in Bartlesville
The poverty data for Bartlesville shows that 395 of the married-couple family households (5.6%) and 638 of the single-parent households (27.6%) are living below the poverty level. Within the married-couple family households, those with 3 or 4 children have the highest poverty rate, with 95 households (13.4%) falling below the poverty line. Among the single-parent households, those with 5 or more children have the highest poverty rate, with 67 household (81.7%) living below poverty.
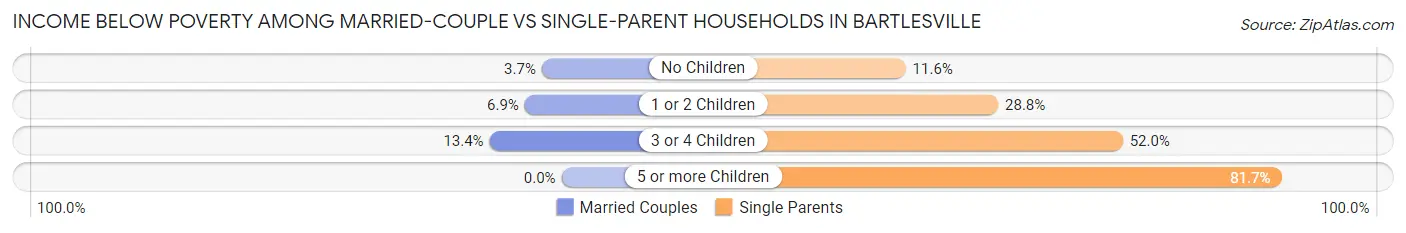
| Children | Married-Couple Families | Single-Parent Households |
| No Children | 155 (3.7%) | 90 (11.6%) |
| 1 or 2 Children | 145 (6.9%) | 336 (28.8%) |
| 3 or 4 Children | 95 (13.4%) | 145 (52.0%) |
| 5 or more Children | 0 (0.0%) | 67 (81.7%) |
| Total | 395 (5.6%) | 638 (27.6%) |
Race in Bartlesville
The most populous races in Bartlesville are White / Caucasian (27,356 | 73.3%), Two or more Races (3,524 | 9.4%), and Native / Alaskan (2,987 | 8.0%).
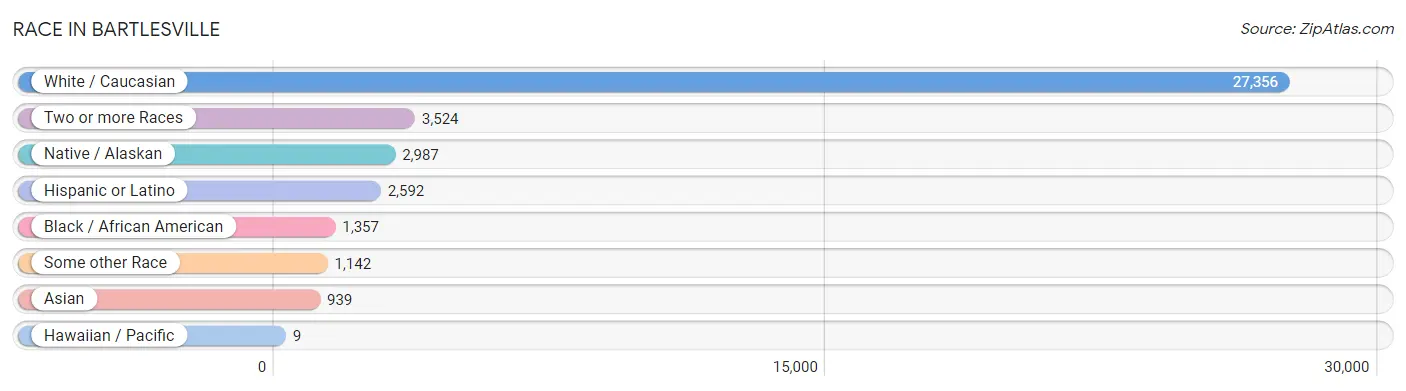
| Race | # Population | % Population |
| Asian | 939 | 2.5% |
| Black / African American | 1,357 | 3.6% |
| Hawaiian / Pacific | 9 | 0.0% |
| Hispanic or Latino | 2,592 | 7.0% |
| Native / Alaskan | 2,987 | 8.0% |
| White / Caucasian | 27,356 | 73.3% |
| Two or more Races | 3,524 | 9.4% |
| Some other Race | 1,142 | 3.1% |
| Total | 37,314 | 100.0% |
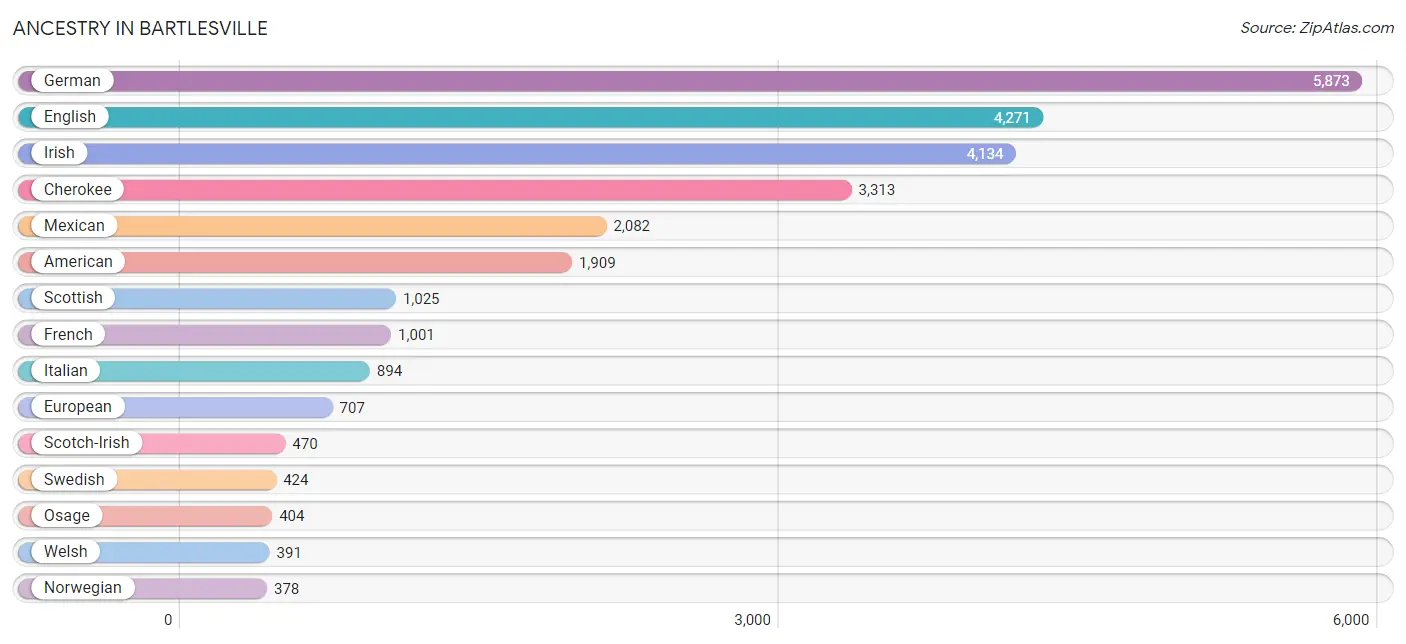
Ancestry in Bartlesville
The most populous ancestries reported in Bartlesville are German (5,873 | 15.7%), English (4,271 | 11.5%), Irish (4,134 | 11.1%), Cherokee (3,313 | 8.9%), and Mexican (2,082 | 5.6%), together accounting for 52.7% of all Bartlesville residents.
| Ancestry | # Population | % Population |
| African | 44 | 0.1% |
| Alaska Native | 8 | 0.0% |
| Alaskan Athabascan | 5 | 0.0% |
| American | 1,909 | 5.1% |
| Apache | 15 | 0.0% |
| Arab | 66 | 0.2% |
| Argentinean | 13 | 0.0% |
| Austrian | 17 | 0.1% |
| Basque | 4 | 0.0% |
| Bhutanese | 48 | 0.1% |
| Blackfeet | 50 | 0.1% |
| Brazilian | 16 | 0.0% |
| British | 254 | 0.7% |
| British West Indian | 18 | 0.1% |
| Burmese | 37 | 0.1% |
| Canadian | 27 | 0.1% |
| Central American | 100 | 0.3% |
| Central American Indian | 17 | 0.1% |
| Cherokee | 3,313 | 8.9% |
| Cheyenne | 17 | 0.1% |
| Chickasaw | 104 | 0.3% |
| Chilean | 10 | 0.0% |
| Chippewa | 14 | 0.0% |
| Choctaw | 219 | 0.6% |
| Colombian | 23 | 0.1% |
| Comanche | 27 | 0.1% |
| Costa Rican | 17 | 0.1% |
| Creek | 358 | 1.0% |
| Croatian | 14 | 0.0% |
| Cuban | 8 | 0.0% |
| Czech | 140 | 0.4% |
| Czechoslovakian | 15 | 0.0% |
| Danish | 104 | 0.3% |
| Delaware | 216 | 0.6% |
| Dominican | 40 | 0.1% |
| Dutch | 294 | 0.8% |
| Dutch West Indian | 99 | 0.3% |
| Eastern European | 31 | 0.1% |
| Ecuadorian | 6 | 0.0% |
| English | 4,271 | 11.5% |
| European | 707 | 1.9% |
| Finnish | 1 | 0.0% |
| French | 1,001 | 2.7% |
| French Canadian | 8 | 0.0% |
| German | 5,873 | 15.7% |
| Greek | 51 | 0.1% |
| Guamanian / Chamorro | 3 | 0.0% |
| Guatemalan | 28 | 0.1% |
| Haitian | 15 | 0.0% |
| Honduran | 36 | 0.1% |
| Hungarian | 52 | 0.1% |
| Indian (Asian) | 274 | 0.7% |
| Inupiat | 26 | 0.1% |
| Iranian | 15 | 0.0% |
| Irish | 4,134 | 11.1% |
| Iroquois | 49 | 0.1% |
| Italian | 894 | 2.4% |
| Korean | 283 | 0.8% |
| Lebanese | 54 | 0.1% |
| Lithuanian | 12 | 0.0% |
| Maltese | 1 | 0.0% |
| Mexican | 2,082 | 5.6% |
| Mexican American Indian | 29 | 0.1% |
| Native Hawaiian | 97 | 0.3% |
| Nigerian | 11 | 0.0% |
| Northern European | 46 | 0.1% |
| Norwegian | 378 | 1.0% |
| Osage | 404 | 1.1% |
| Pakistani | 6 | 0.0% |
| Panamanian | 11 | 0.0% |
| Pennsylvania German | 12 | 0.0% |
| Peruvian | 4 | 0.0% |
| Polish | 337 | 0.9% |
| Portuguese | 40 | 0.1% |
| Potawatomi | 99 | 0.3% |
| Pueblo | 6 | 0.0% |
| Puerto Rican | 96 | 0.3% |
| Russian | 118 | 0.3% |
| Salvadoran | 8 | 0.0% |
| Scandinavian | 185 | 0.5% |
| Scotch-Irish | 470 | 1.3% |
| Scottish | 1,025 | 2.8% |
| Serbian | 57 | 0.2% |
| Sioux | 69 | 0.2% |
| Slavic | 27 | 0.1% |
| Slovak | 25 | 0.1% |
| Slovene | 30 | 0.1% |
| South American | 131 | 0.4% |
| South American Indian | 4 | 0.0% |
| Spaniard | 65 | 0.2% |
| Spanish | 51 | 0.1% |
| Sri Lankan | 114 | 0.3% |
| Subsaharan African | 78 | 0.2% |
| Swedish | 424 | 1.1% |
| Swiss | 46 | 0.1% |
| Thai | 317 | 0.9% |
| Trinidadian and Tobagonian | 50 | 0.1% |
| Turkish | 12 | 0.0% |
| Ukrainian | 10 | 0.0% |
| Venezuelan | 75 | 0.2% |
| Welsh | 391 | 1.1% |
| Zimbabwean | 23 | 0.1% | View All 102 Rows |
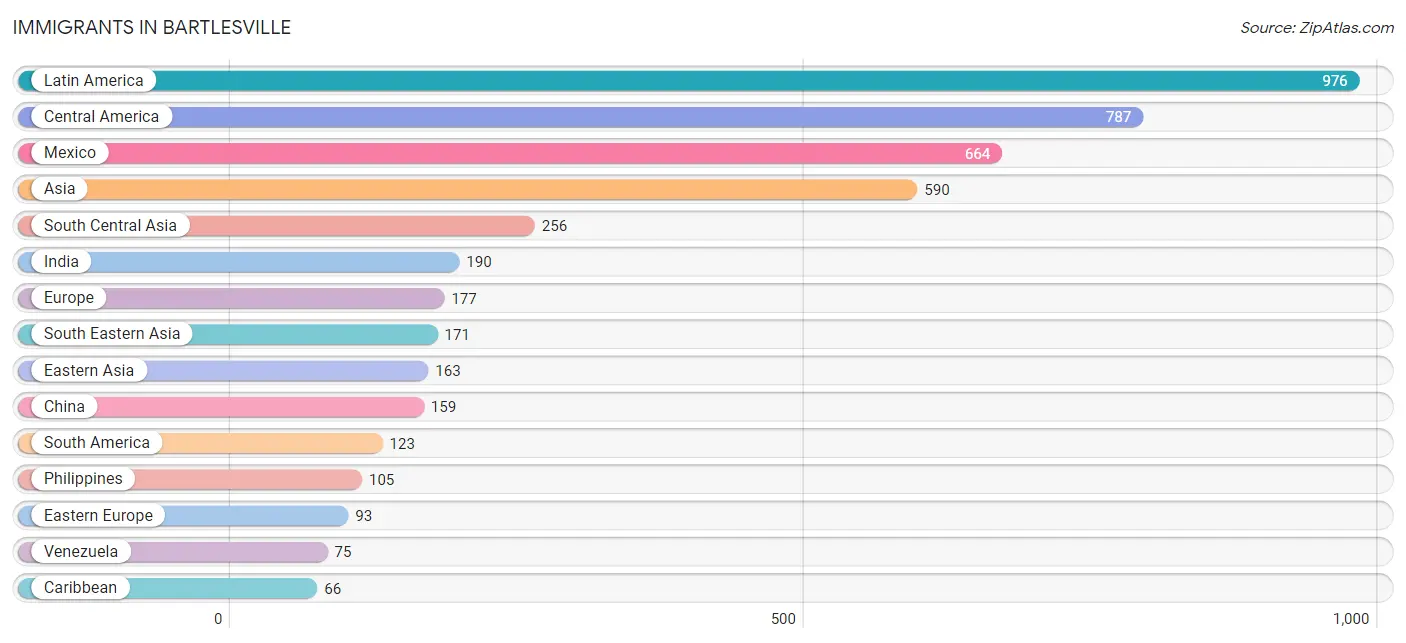
Immigrants in Bartlesville
The most numerous immigrant groups reported in Bartlesville came from Latin America (976 | 2.6%), Central America (787 | 2.1%), Mexico (664 | 1.8%), Asia (590 | 1.6%), and South Central Asia (256 | 0.7%), together accounting for 8.8% of all Bartlesville residents.
| Immigration Origin | # Population | % Population |
| Africa | 52 | 0.1% |
| Argentina | 15 | 0.0% |
| Asia | 590 | 1.6% |
| Canada | 2 | 0.0% |
| Caribbean | 66 | 0.2% |
| Central America | 787 | 2.1% |
| Chile | 10 | 0.0% |
| China | 159 | 0.4% |
| Colombia | 23 | 0.1% |
| Costa Rica | 65 | 0.2% |
| Cuba | 5 | 0.0% |
| Dominican Republic | 43 | 0.1% |
| Eastern Africa | 41 | 0.1% |
| Eastern Asia | 163 | 0.4% |
| Eastern Europe | 93 | 0.3% |
| El Salvador | 8 | 0.0% |
| Europe | 177 | 0.5% |
| France | 9 | 0.0% |
| Germany | 35 | 0.1% |
| Guatemala | 28 | 0.1% |
| Honduras | 11 | 0.0% |
| Hong Kong | 10 | 0.0% |
| India | 190 | 0.5% |
| Iran | 34 | 0.1% |
| Japan | 4 | 0.0% |
| Kenya | 18 | 0.1% |
| Latin America | 976 | 2.6% |
| Mexico | 664 | 1.8% |
| Nepal | 26 | 0.1% |
| Nigeria | 11 | 0.0% |
| Northern Europe | 5 | 0.0% |
| Pakistan | 6 | 0.0% |
| Panama | 11 | 0.0% |
| Philippines | 105 | 0.3% |
| Russia | 36 | 0.1% |
| Scotland | 5 | 0.0% |
| Serbia | 57 | 0.2% |
| South America | 123 | 0.3% |
| South Central Asia | 256 | 0.7% |
| South Eastern Asia | 171 | 0.5% |
| Southern Europe | 35 | 0.1% |
| Spain | 34 | 0.1% |
| St. Vincent and the Grenadines | 18 | 0.1% |
| Taiwan | 8 | 0.0% |
| Thailand | 6 | 0.0% |
| Venezuela | 75 | 0.2% |
| Vietnam | 60 | 0.2% |
| Western Africa | 11 | 0.0% |
| Western Europe | 44 | 0.1% |
| Zimbabwe | 23 | 0.1% | View All 50 Rows |
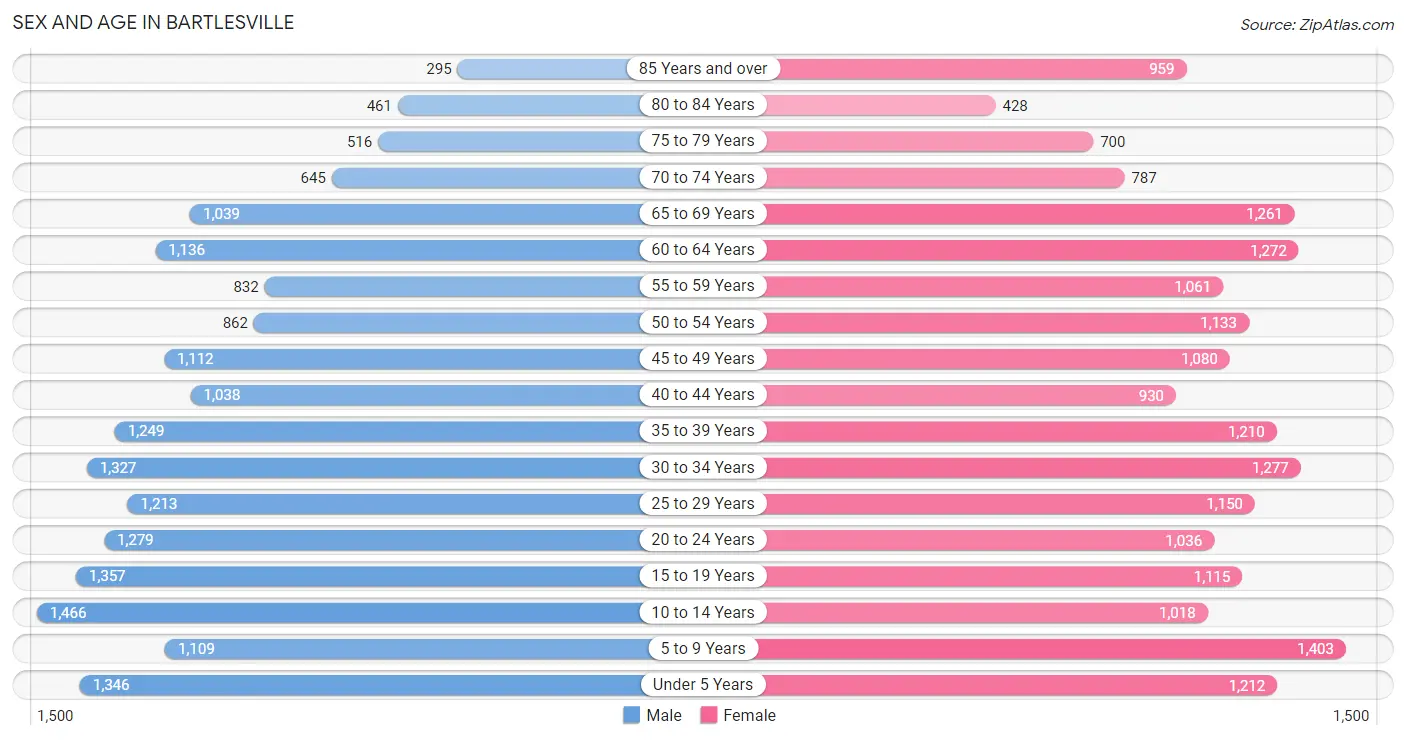
Sex and Age in Bartlesville
Sex and Age in Bartlesville
The most populous age groups in Bartlesville are 10 to 14 Years (1,466 | 8.0%) for men and 5 to 9 Years (1,403 | 7.4%) for women.
| Age Bracket | Male | Female |
| Under 5 Years | 1,346 (7.4%) | 1,212 (6.4%) |
| 5 to 9 Years | 1,109 (6.1%) | 1,403 (7.4%) |
| 10 to 14 Years | 1,466 (8.0%) | 1,018 (5.3%) |
| 15 to 19 Years | 1,357 (7.4%) | 1,115 (5.9%) |
| 20 to 24 Years | 1,279 (7.0%) | 1,036 (5.4%) |
| 25 to 29 Years | 1,213 (6.6%) | 1,150 (6.0%) |
| 30 to 34 Years | 1,327 (7.3%) | 1,277 (6.7%) |
| 35 to 39 Years | 1,249 (6.8%) | 1,210 (6.4%) |
| 40 to 44 Years | 1,038 (5.7%) | 930 (4.9%) |
| 45 to 49 Years | 1,112 (6.1%) | 1,080 (5.7%) |
| 50 to 54 Years | 862 (4.7%) | 1,133 (5.9%) |
| 55 to 59 Years | 832 (4.5%) | 1,061 (5.6%) |
| 60 to 64 Years | 1,136 (6.2%) | 1,272 (6.7%) |
| 65 to 69 Years | 1,039 (5.7%) | 1,261 (6.6%) |
| 70 to 74 Years | 645 (3.5%) | 787 (4.1%) |
| 75 to 79 Years | 516 (2.8%) | 700 (3.7%) |
| 80 to 84 Years | 461 (2.5%) | 428 (2.2%) |
| 85 Years and over | 295 (1.6%) | 959 (5.0%) |
| Total | 18,282 (100.0%) | 19,032 (100.0%) |
Families and Households in Bartlesville
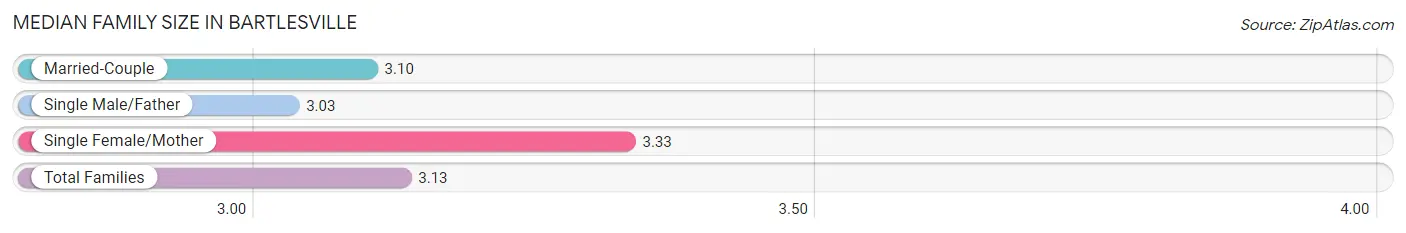
Median Family Size in Bartlesville
The median family size in Bartlesville is 3.13 persons per family, with single female/mother families (1,703 | 18.2%) accounting for the largest median family size of 3.33 persons per family. On the other hand, single male/father families (605 | 6.5%) represent the smallest median family size with 3.03 persons per family.
| Family Type | # Families | Family Size |
| Married-Couple | 7,058 (75.4%) | 3.10 |
| Single Male/Father | 605 (6.5%) | 3.03 |
| Single Female/Mother | 1,703 (18.2%) | 3.33 |
| Total Families | 9,366 (100.0%) | 3.13 |
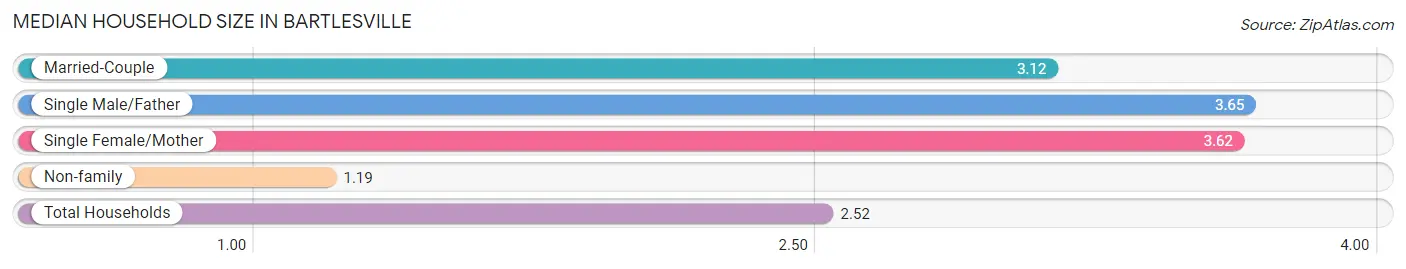
Median Household Size in Bartlesville
The median household size in Bartlesville is 2.52 persons per household, with single male/father households (605 | 4.2%) accounting for the largest median household size of 3.65 persons per household. non-family households (5,114 | 35.3%) represent the smallest median household size with 1.19 persons per household.
| Household Type | # Households | Household Size |
| Married-Couple | 7,058 (48.7%) | 3.12 |
| Single Male/Father | 605 (4.2%) | 3.65 |
| Single Female/Mother | 1,703 (11.8%) | 3.62 |
| Non-family | 5,114 (35.3%) | 1.19 |
| Total Households | 14,480 (100.0%) | 2.52 |
Household Size by Marriage Status in Bartlesville
Out of a total of 14,480 households in Bartlesville, 9,366 (64.7%) are family households, while 5,114 (35.3%) are nonfamily households. The most numerous type of family households are 2-person households, comprising 4,554, and the most common type of nonfamily households are 1-person households, comprising 4,531.
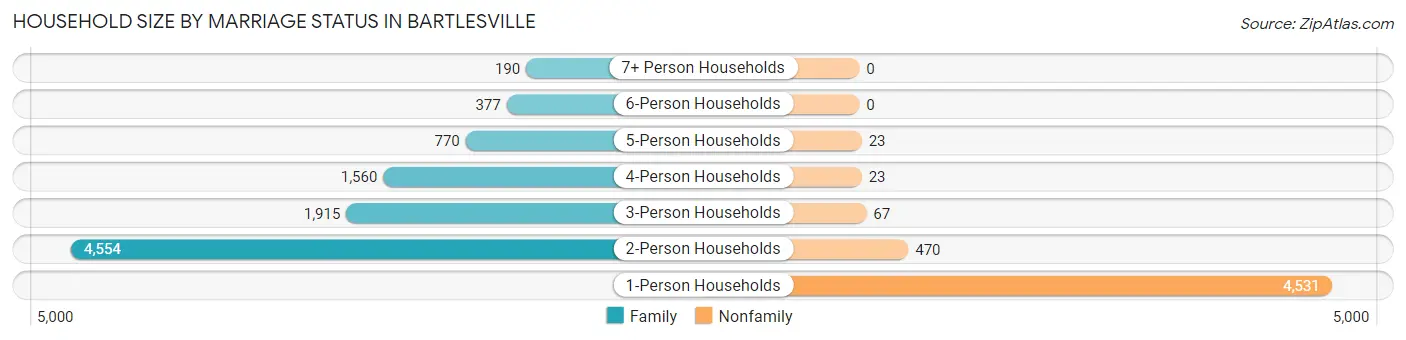
| Household Size | Family Households | Nonfamily Households |
| 1-Person Households | - | 4,531 (31.3%) |
| 2-Person Households | 4,554 (31.5%) | 470 (3.3%) |
| 3-Person Households | 1,915 (13.2%) | 67 (0.5%) |
| 4-Person Households | 1,560 (10.8%) | 23 (0.2%) |
| 5-Person Households | 770 (5.3%) | 23 (0.2%) |
| 6-Person Households | 377 (2.6%) | 0 (0.0%) |
| 7+ Person Households | 190 (1.3%) | 0 (0.0%) |
| Total | 9,366 (64.7%) | 5,114 (35.3%) |
Female Fertility in Bartlesville
Fertility by Age in Bartlesville
Average fertility rate in Bartlesville is 63.0 births per 1,000 women. Women in the age bracket of 20 to 34 years have the highest fertility rate with 110.0 births per 1,000 women. Women in the age bracket of 20 to 34 years acount for 74.8% of all women with births.
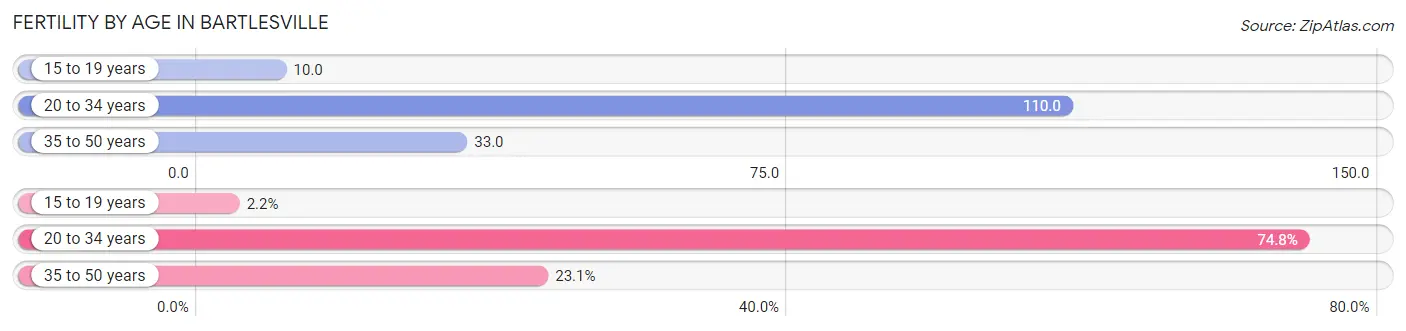
| Age Bracket | Women with Births | Births / 1,000 Women |
| 15 to 19 years | 11 (2.1%) | 10.0 |
| 20 to 34 years | 382 (74.8%) | 110.0 |
| 35 to 50 years | 118 (23.1%) | 33.0 |
| Total | 511 (100.0%) | 63.0 |
Fertility by Age by Marriage Status in Bartlesville
81.4% of women with births (511) in Bartlesville are married. The highest percentage of unmarried women with births falls into 15 to 19 years age bracket with 36.4% of them unmarried at the time of birth, while the lowest percentage of unmarried women with births belong to 35 to 50 years age bracket with 11.9% of them unmarried.
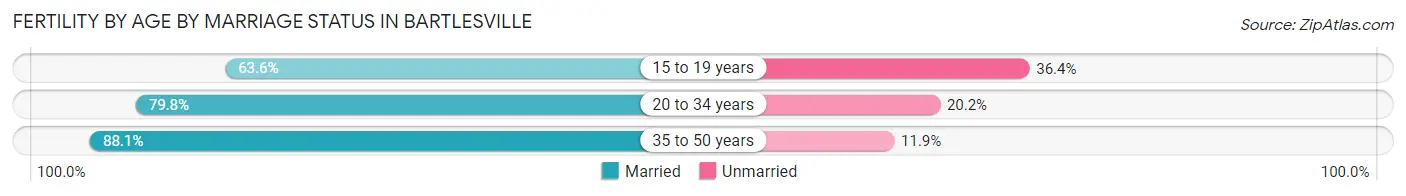
| Age Bracket | Married | Unmarried |
| 15 to 19 years | 7 (63.6%) | 4 (36.4%) |
| 20 to 34 years | 305 (79.8%) | 77 (20.2%) |
| 35 to 50 years | 104 (88.1%) | 14 (11.9%) |
| Total | 416 (81.4%) | 95 (18.6%) |
Fertility by Education in Bartlesville
Average fertility rate in Bartlesville is 63.0 births per 1,000 women. Women with the education attainment of graduate degree have the highest fertility rate of 95.0 births per 1,000 women, while women with the education attainment of less than high school have the lowest fertility at 28.0 births per 1,000 women. Women with the education attainment of college or associate's degree represent 38.2% of all women with births.
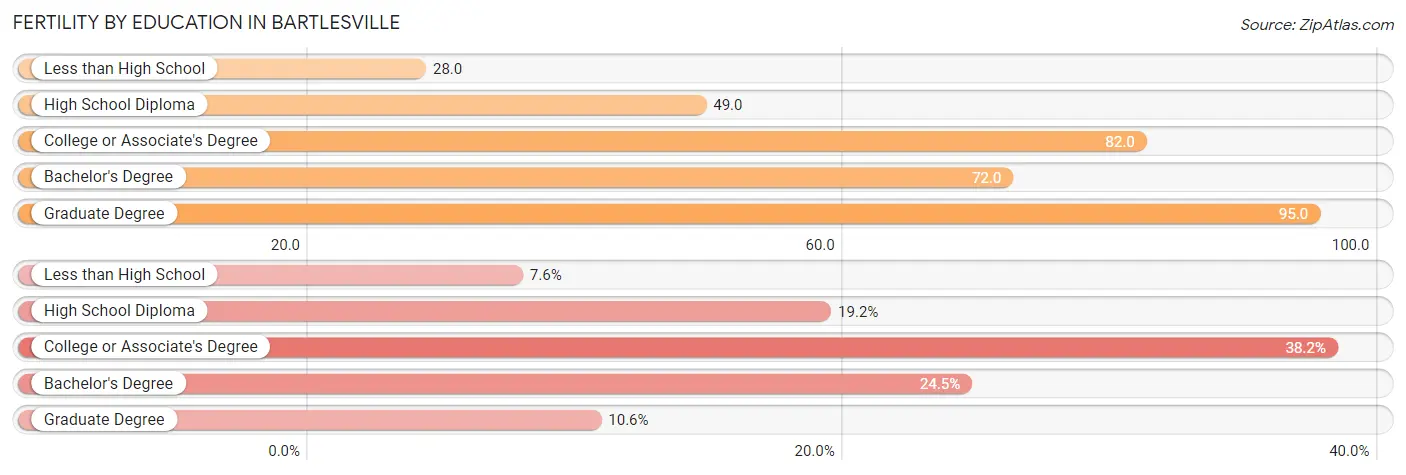
| Educational Attainment | Women with Births | Births / 1,000 Women |
| Less than High School | 39 (7.6%) | 28.0 |
| High School Diploma | 98 (19.2%) | 49.0 |
| College or Associate's Degree | 195 (38.2%) | 82.0 |
| Bachelor's Degree | 125 (24.5%) | 72.0 |
| Graduate Degree | 54 (10.6%) | 95.0 |
| Total | 511 (100.0%) | 63.0 |
Fertility by Education by Marriage Status in Bartlesville
18.6% of women with births in Bartlesville are unmarried. Women with the educational attainment of graduate degree are most likely to be married with 100.0% of them married at childbirth, while women with the educational attainment of high school diploma are least likely to be married with 35.7% of them unmarried at childbirth.
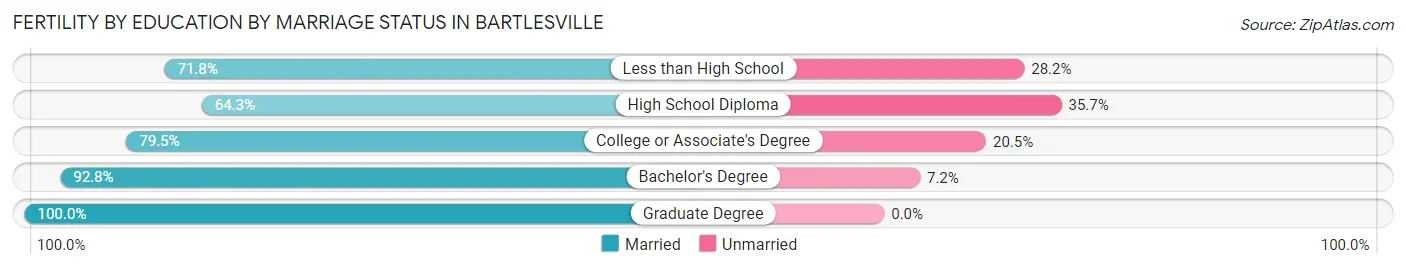
| Educational Attainment | Married | Unmarried |
| Less than High School | 28 (71.8%) | 11 (28.2%) |
| High School Diploma | 63 (64.3%) | 35 (35.7%) |
| College or Associate's Degree | 155 (79.5%) | 40 (20.5%) |
| Bachelor's Degree | 116 (92.8%) | 9 (7.2%) |
| Graduate Degree | 54 (100.0%) | 0 (0.0%) |
| Total | 416 (81.4%) | 95 (18.6%) |
Employment Characteristics in Bartlesville
Employment by Class of Employer in Bartlesville
Among the 16,383 employed individuals in Bartlesville, private company employees (11,965 | 73.0%), not-for-profit organizations (1,668 | 10.2%), and local government employees (957 | 5.8%) make up the most common classes of employment.
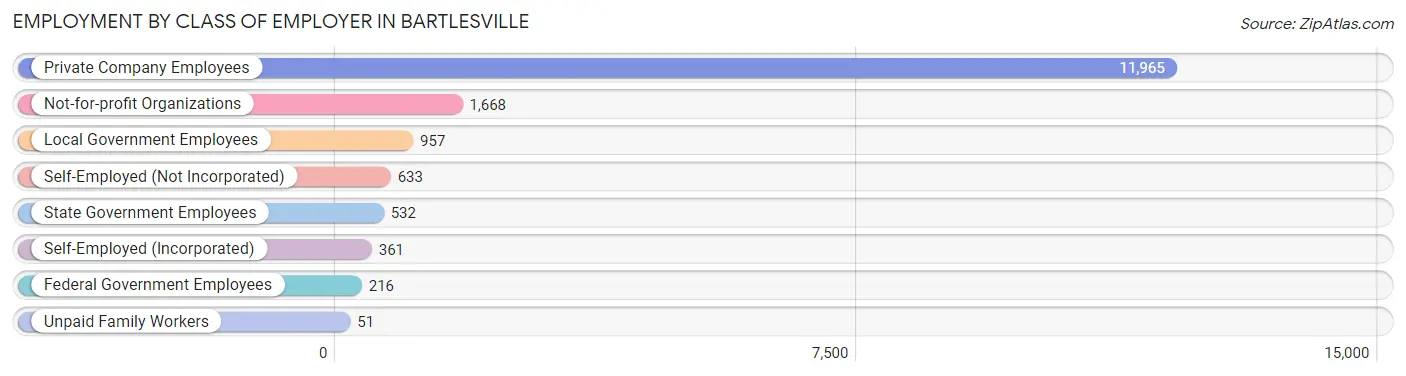
| Employer Class | # Employees | % Employees |
| Private Company Employees | 11,965 | 73.0% |
| Self-Employed (Incorporated) | 361 | 2.2% |
| Self-Employed (Not Incorporated) | 633 | 3.9% |
| Not-for-profit Organizations | 1,668 | 10.2% |
| Local Government Employees | 957 | 5.8% |
| State Government Employees | 532 | 3.3% |
| Federal Government Employees | 216 | 1.3% |
| Unpaid Family Workers | 51 | 0.3% |
| Total | 16,383 | 100.0% |
Employment Status by Age in Bartlesville
According to the labor force statistics for Bartlesville, out of the total population over 16 years of age (29,248), 58.9% or 17,227 individuals are in the labor force, with 4.1% or 706 of them unemployed. The age group with the highest labor force participation rate is 35 to 44 years, with 84.1% or 3,723 individuals in the labor force. Within the labor force, the 16 to 19 years age range has the highest percentage of unemployed individuals, with 7.6% or 53 of them being unemployed.
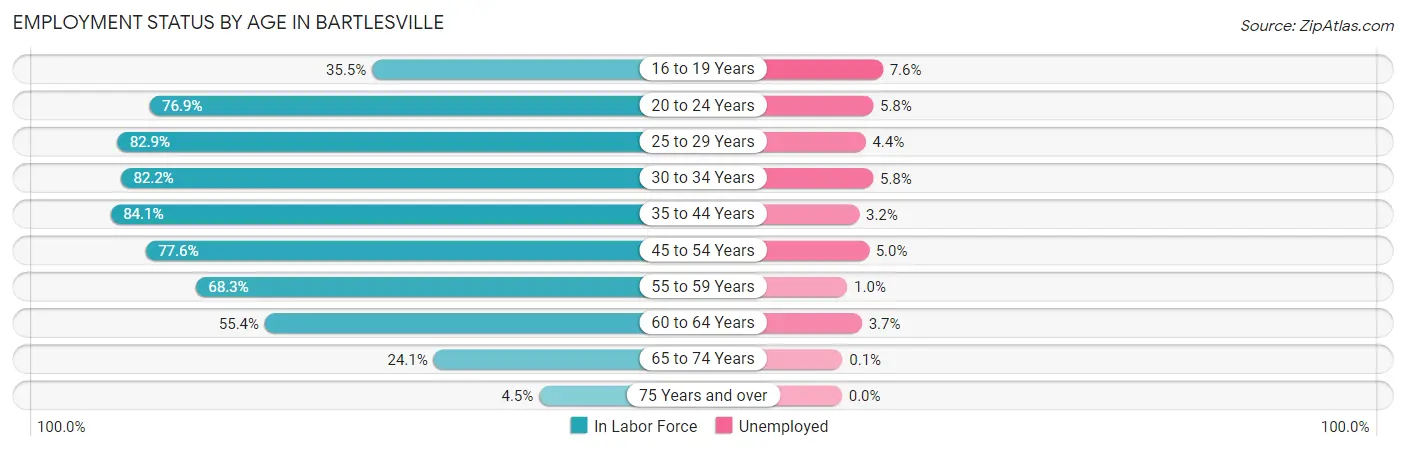
| Age Bracket | In Labor Force | Unemployed |
| 16 to 19 Years | 696 (35.5%) | 53 (7.6%) |
| 20 to 24 Years | 1,780 (76.9%) | 103 (5.8%) |
| 25 to 29 Years | 1,959 (82.9%) | 86 (4.4%) |
| 30 to 34 Years | 2,140 (82.2%) | 124 (5.8%) |
| 35 to 44 Years | 3,723 (84.1%) | 119 (3.2%) |
| 45 to 54 Years | 3,249 (77.6%) | 162 (5.0%) |
| 55 to 59 Years | 1,293 (68.3%) | 13 (1.0%) |
| 60 to 64 Years | 1,334 (55.4%) | 49 (3.7%) |
| 65 to 74 Years | 899 (24.1%) | 1 (0.1%) |
| 75 Years and over | 151 (4.5%) | 0 (0.0%) |
| Total | 17,227 (58.9%) | 706 (4.1%) |
Employment Status by Educational Attainment in Bartlesville
According to labor force statistics for Bartlesville, 76.6% of individuals (13,698) out of the total population between 25 and 64 years of age (17,882) are in the labor force, with 4.1% or 562 of them being unemployed. The group with the highest labor force participation rate are those with the educational attainment of college / associate degree, with 82.1% or 4,305 individuals in the labor force. Within the labor force, individuals with high school diploma education have the highest percentage of unemployment, with 6.6% or 247 of them being unemployed.
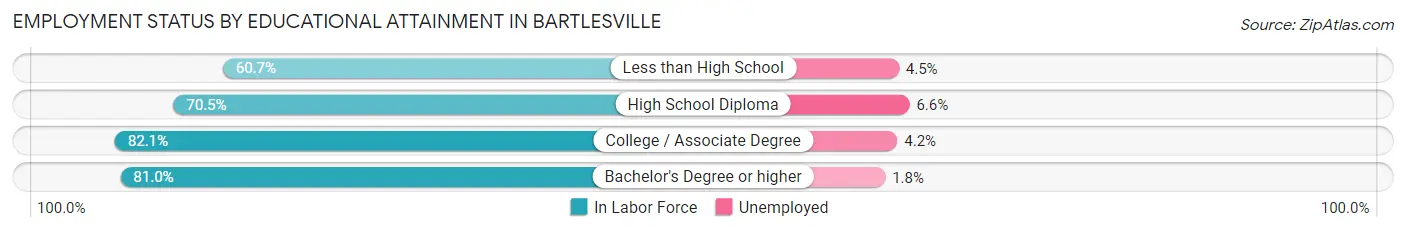
| Educational Attainment | In Labor Force | Unemployed |
| Less than High School | 877 (60.7%) | 65 (4.5%) |
| High School Diploma | 3,741 (70.5%) | 350 (6.6%) |
| College / Associate Degree | 4,305 (82.1%) | 220 (4.2%) |
| Bachelor's Degree or higher | 4,769 (81.0%) | 106 (1.8%) |
| Total | 13,698 (76.6%) | 733 (4.1%) |
Employment Occupations by Sex in Bartlesville
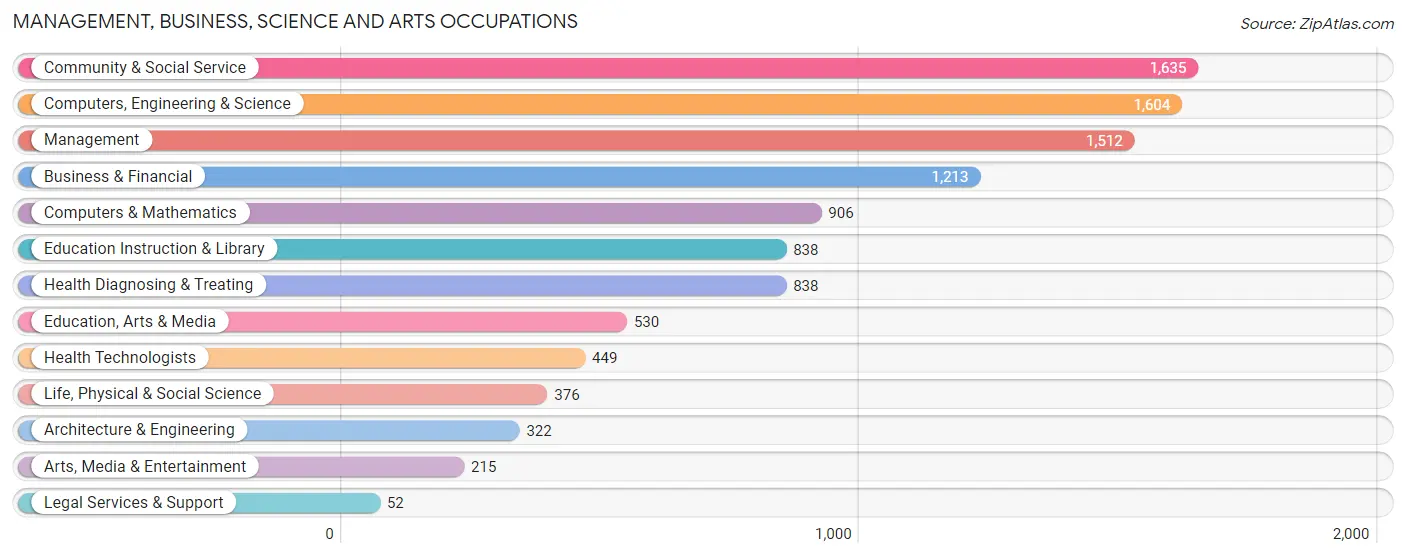
Management, Business, Science and Arts Occupations
The most common Management, Business, Science and Arts occupations in Bartlesville are Community & Social Service (1,635 | 9.9%), Computers, Engineering & Science (1,604 | 9.7%), Management (1,512 | 9.2%), Business & Financial (1,213 | 7.4%), and Computers & Mathematics (906 | 5.5%).
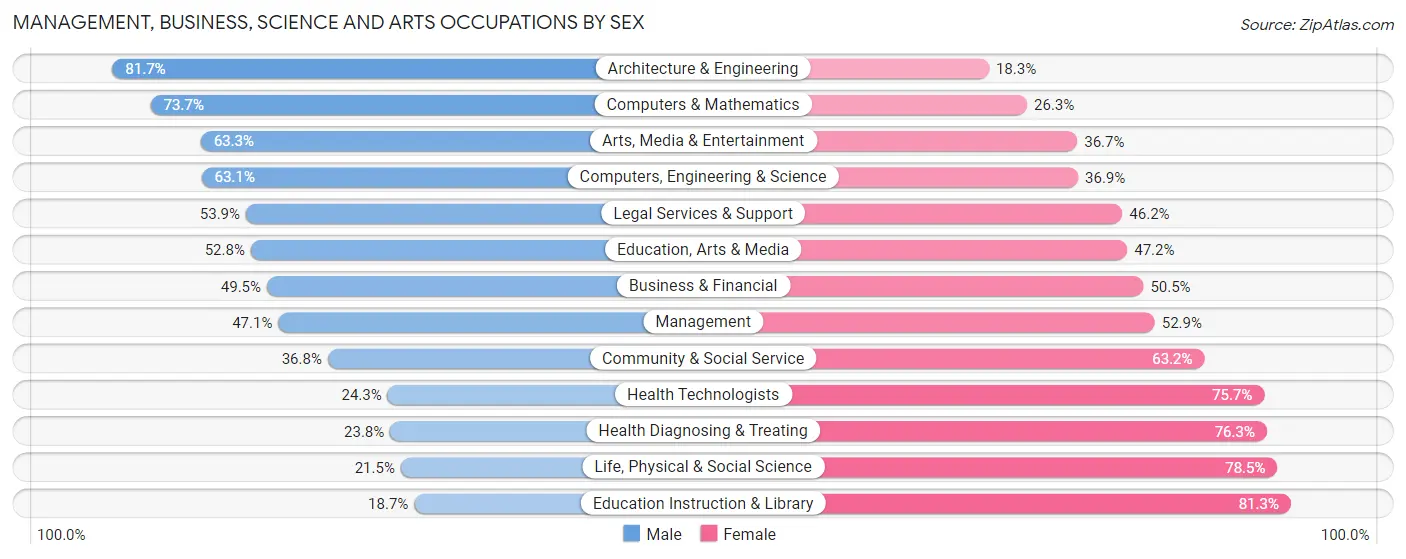
Management, Business, Science and Arts Occupations by Sex
Within the Management, Business, Science and Arts occupations in Bartlesville, the most male-oriented occupations are Architecture & Engineering (81.7%), Computers & Mathematics (73.7%), and Arts, Media & Entertainment (63.3%), while the most female-oriented occupations are Education Instruction & Library (81.3%), Life, Physical & Social Science (78.5%), and Health Diagnosing & Treating (76.2%).
| Occupation | Male | Female |
| Management | 712 (47.1%) | 800 (52.9%) |
| Business & Financial | 600 (49.5%) | 613 (50.5%) |
| Computers, Engineering & Science | 1,012 (63.1%) | 592 (36.9%) |
| Computers & Mathematics | 668 (73.7%) | 238 (26.3%) |
| Architecture & Engineering | 263 (81.7%) | 59 (18.3%) |
| Life, Physical & Social Science | 81 (21.5%) | 295 (78.5%) |
| Community & Social Service | 601 (36.8%) | 1,034 (63.2%) |
| Education, Arts & Media | 280 (52.8%) | 250 (47.2%) |
| Legal Services & Support | 28 (53.8%) | 24 (46.2%) |
| Education Instruction & Library | 157 (18.7%) | 681 (81.3%) |
| Arts, Media & Entertainment | 136 (63.3%) | 79 (36.7%) |
| Health Diagnosing & Treating | 199 (23.7%) | 639 (76.2%) |
| Health Technologists | 109 (24.3%) | 340 (75.7%) |
| Total (Category) | 3,124 (45.9%) | 3,678 (54.1%) |
| Total (Overall) | 8,674 (52.6%) | 7,818 (47.4%) |
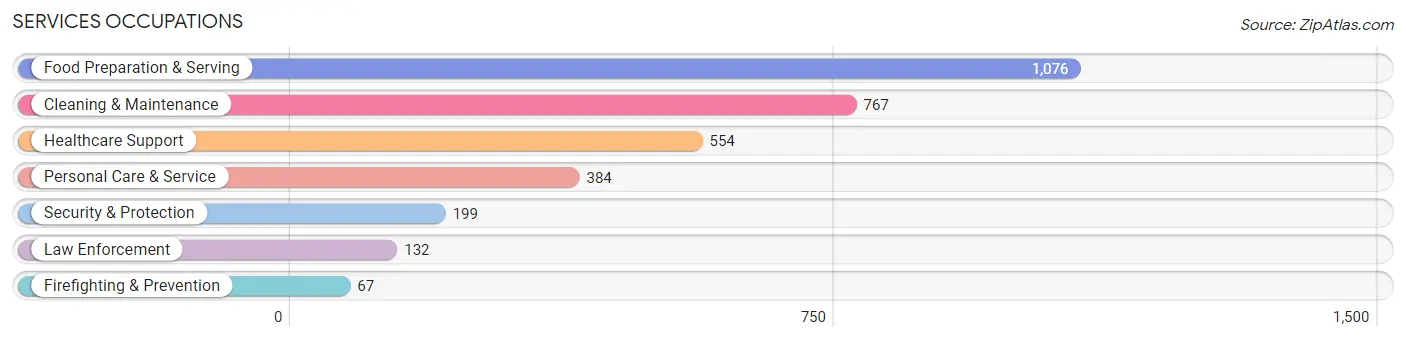
Services Occupations
The most common Services occupations in Bartlesville are Food Preparation & Serving (1,076 | 6.5%), Cleaning & Maintenance (767 | 4.6%), Healthcare Support (554 | 3.4%), Personal Care & Service (384 | 2.3%), and Security & Protection (199 | 1.2%).
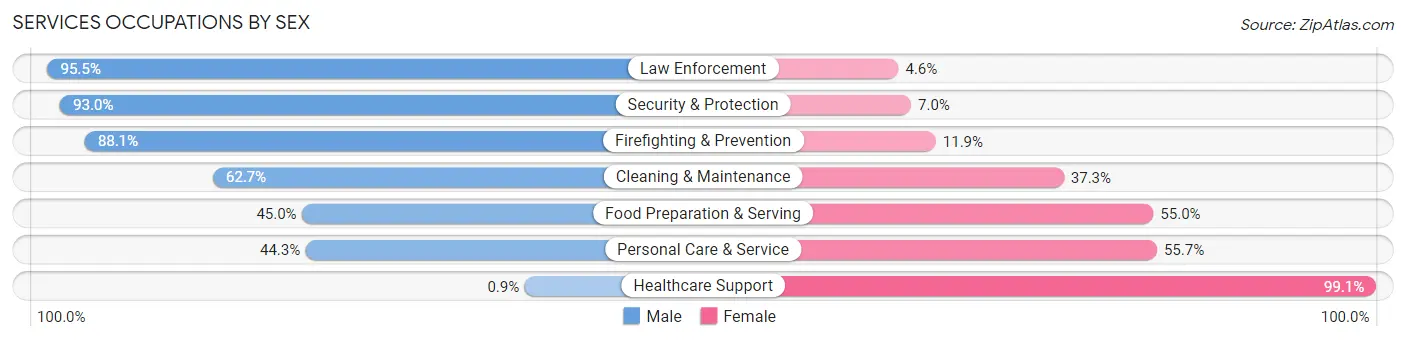
Services Occupations by Sex
Within the Services occupations in Bartlesville, the most male-oriented occupations are Law Enforcement (95.5%), Security & Protection (93.0%), and Firefighting & Prevention (88.1%), while the most female-oriented occupations are Healthcare Support (99.1%), Personal Care & Service (55.7%), and Food Preparation & Serving (55.0%).
| Occupation | Male | Female |
| Healthcare Support | 5 (0.9%) | 549 (99.1%) |
| Security & Protection | 185 (93.0%) | 14 (7.0%) |
| Firefighting & Prevention | 59 (88.1%) | 8 (11.9%) |
| Law Enforcement | 126 (95.5%) | 6 (4.5%) |
| Food Preparation & Serving | 484 (45.0%) | 592 (55.0%) |
| Cleaning & Maintenance | 481 (62.7%) | 286 (37.3%) |
| Personal Care & Service | 170 (44.3%) | 214 (55.7%) |
| Total (Category) | 1,325 (44.5%) | 1,655 (55.5%) |
| Total (Overall) | 8,674 (52.6%) | 7,818 (47.4%) |
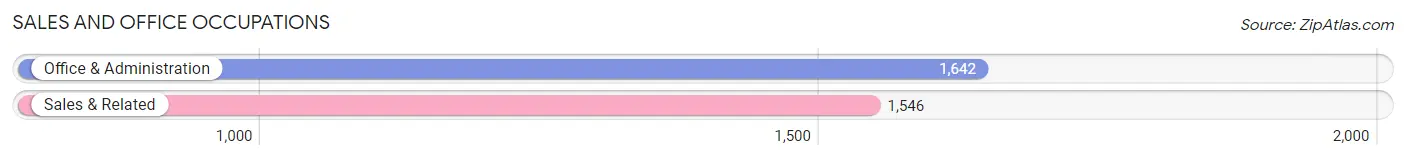
Sales and Office Occupations
The most common Sales and Office occupations in Bartlesville are Office & Administration (1,642 | 10.0%), and Sales & Related (1,546 | 9.4%).
Sales and Office Occupations by Sex
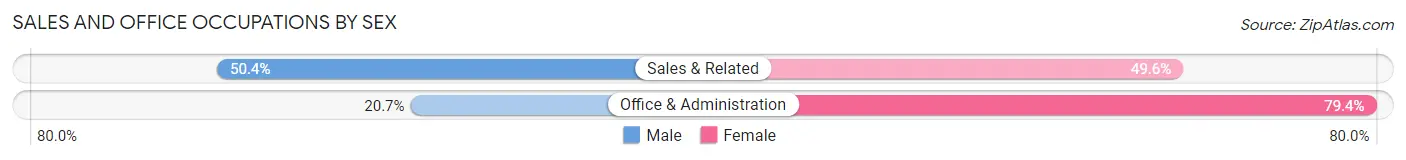
| Occupation | Male | Female |
| Sales & Related | 779 (50.4%) | 767 (49.6%) |
| Office & Administration | 339 (20.6%) | 1,303 (79.3%) |
| Total (Category) | 1,118 (35.1%) | 2,070 (64.9%) |
| Total (Overall) | 8,674 (52.6%) | 7,818 (47.4%) |
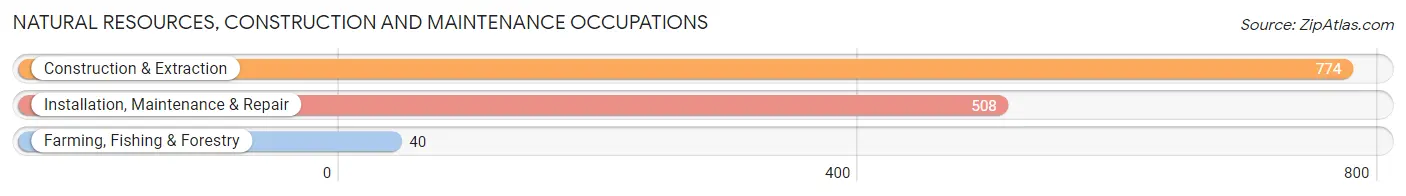
Natural Resources, Construction and Maintenance Occupations
The most common Natural Resources, Construction and Maintenance occupations in Bartlesville are Construction & Extraction (774 | 4.7%), Installation, Maintenance & Repair (508 | 3.1%), and Farming, Fishing & Forestry (40 | 0.2%).
Natural Resources, Construction and Maintenance Occupations by Sex
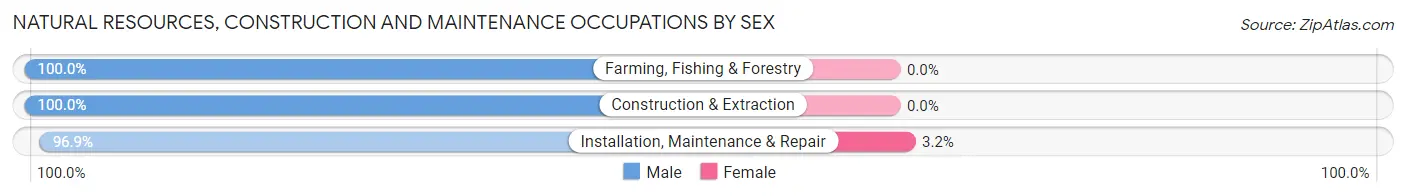
| Occupation | Male | Female |
| Farming, Fishing & Forestry | 40 (100.0%) | 0 (0.0%) |
| Construction & Extraction | 774 (100.0%) | 0 (0.0%) |
| Installation, Maintenance & Repair | 492 (96.9%) | 16 (3.2%) |
| Total (Category) | 1,306 (98.8%) | 16 (1.2%) |
| Total (Overall) | 8,674 (52.6%) | 7,818 (47.4%) |
Production, Transportation and Moving Occupations
The most common Production, Transportation and Moving occupations in Bartlesville are Production (877 | 5.3%), Material Moving (806 | 4.9%), and Transportation (517 | 3.1%).
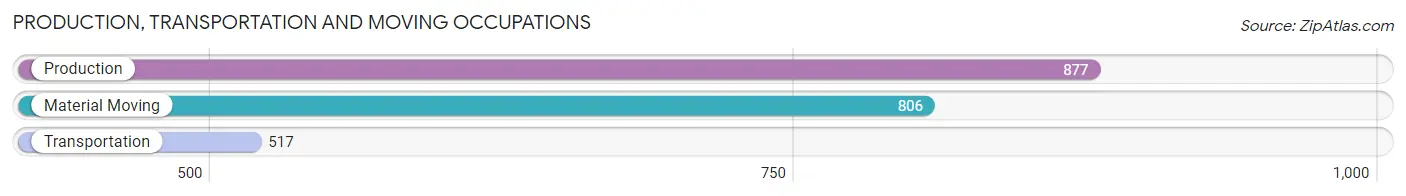
Production, Transportation and Moving Occupations by Sex
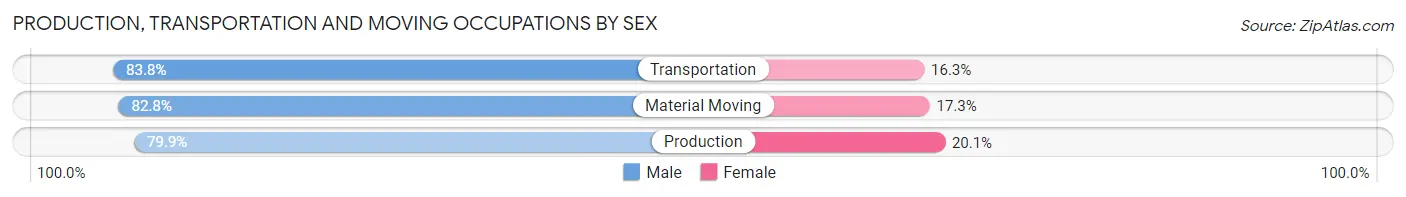
| Occupation | Male | Female |
| Production | 701 (79.9%) | 176 (20.1%) |
| Transportation | 433 (83.8%) | 84 (16.3%) |
| Material Moving | 667 (82.8%) | 139 (17.2%) |
| Total (Category) | 1,801 (81.9%) | 399 (18.1%) |
| Total (Overall) | 8,674 (52.6%) | 7,818 (47.4%) |
Employment Industries by Sex in Bartlesville
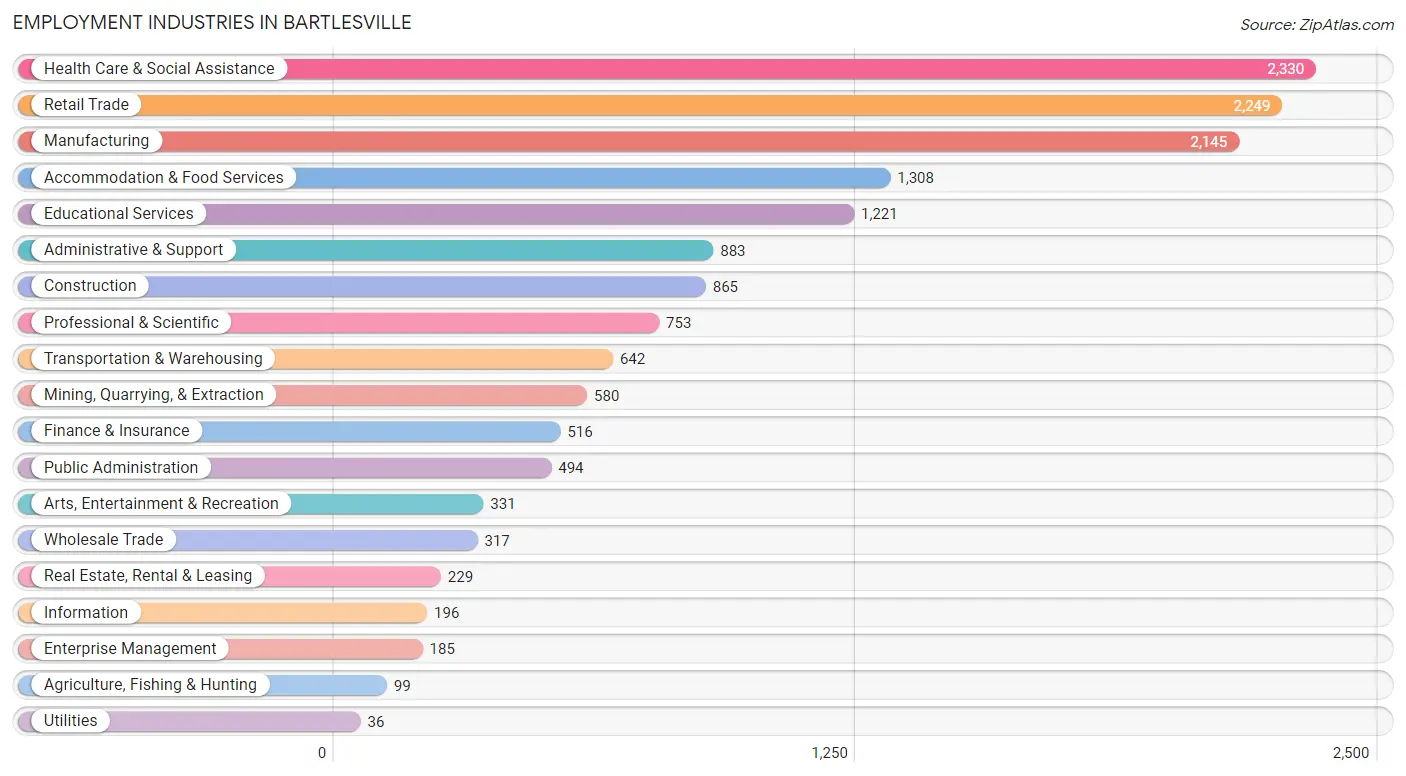
Employment Industries in Bartlesville
The major employment industries in Bartlesville include Health Care & Social Assistance (2,330 | 14.1%), Retail Trade (2,249 | 13.6%), Manufacturing (2,145 | 13.0%), Accommodation & Food Services (1,308 | 7.9%), and Educational Services (1,221 | 7.4%).
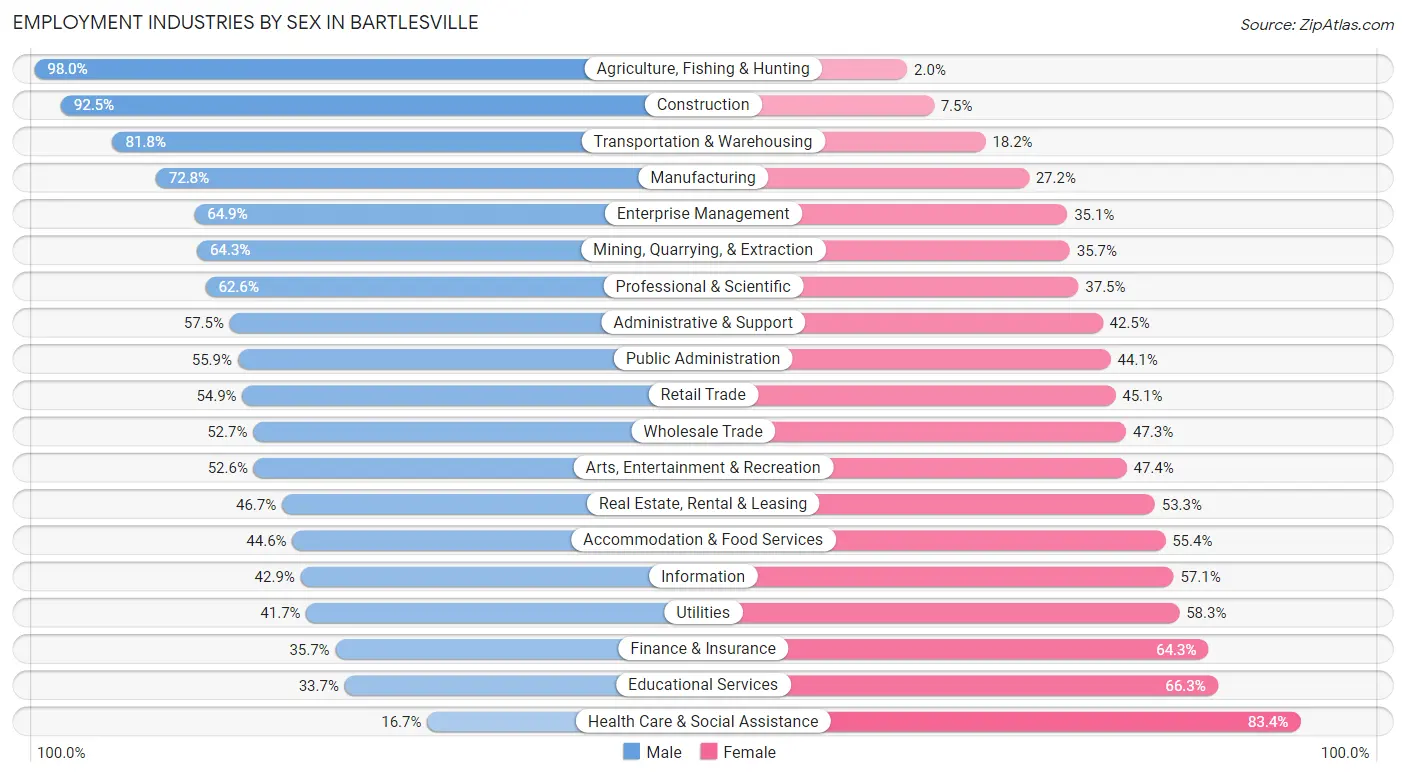
Employment Industries by Sex in Bartlesville
The Bartlesville industries that see more men than women are Agriculture, Fishing & Hunting (98.0%), Construction (92.5%), and Transportation & Warehousing (81.8%), whereas the industries that tend to have a higher number of women are Health Care & Social Assistance (83.4%), Educational Services (66.3%), and Finance & Insurance (64.3%).
| Industry | Male | Female |
| Agriculture, Fishing & Hunting | 97 (98.0%) | 2 (2.0%) |
| Mining, Quarrying, & Extraction | 373 (64.3%) | 207 (35.7%) |
| Construction | 800 (92.5%) | 65 (7.5%) |
| Manufacturing | 1,562 (72.8%) | 583 (27.2%) |
| Wholesale Trade | 167 (52.7%) | 150 (47.3%) |
| Retail Trade | 1,235 (54.9%) | 1,014 (45.1%) |
| Transportation & Warehousing | 525 (81.8%) | 117 (18.2%) |
| Utilities | 15 (41.7%) | 21 (58.3%) |
| Information | 84 (42.9%) | 112 (57.1%) |
| Finance & Insurance | 184 (35.7%) | 332 (64.3%) |
| Real Estate, Rental & Leasing | 107 (46.7%) | 122 (53.3%) |
| Professional & Scientific | 471 (62.5%) | 282 (37.4%) |
| Enterprise Management | 120 (64.9%) | 65 (35.1%) |
| Administrative & Support | 508 (57.5%) | 375 (42.5%) |
| Educational Services | 412 (33.7%) | 809 (66.3%) |
| Health Care & Social Assistance | 388 (16.7%) | 1,942 (83.4%) |
| Arts, Entertainment & Recreation | 174 (52.6%) | 157 (47.4%) |
| Accommodation & Food Services | 583 (44.6%) | 725 (55.4%) |
| Public Administration | 276 (55.9%) | 218 (44.1%) |
| Total | 8,674 (52.6%) | 7,818 (47.4%) |
Education in Bartlesville
School Enrollment in Bartlesville
The most common levels of schooling among the 8,904 students in Bartlesville are elementary school (2,120 | 23.8%), high school (1,933 | 21.7%), and middle school (1,877 | 21.1%).
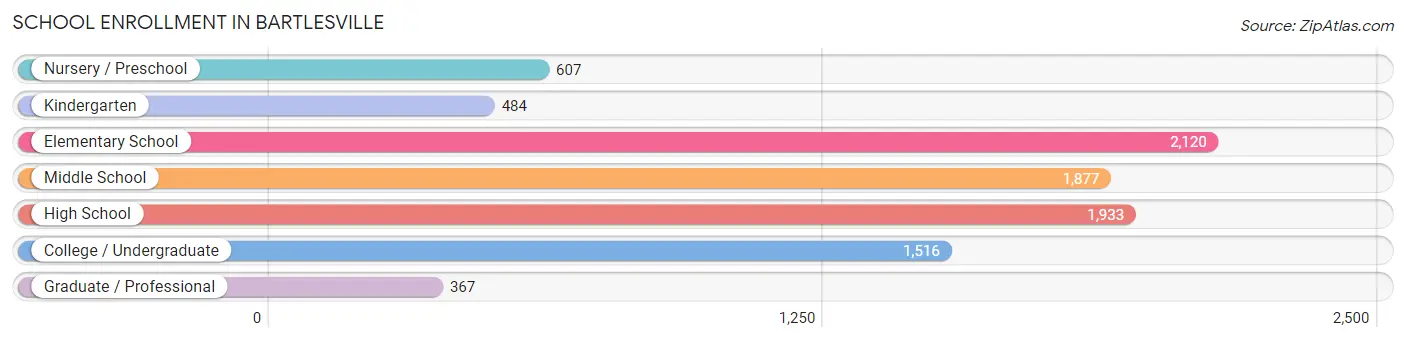
| School Level | # Students | % Students |
| Nursery / Preschool | 607 | 6.8% |
| Kindergarten | 484 | 5.4% |
| Elementary School | 2,120 | 23.8% |
| Middle School | 1,877 | 21.1% |
| High School | 1,933 | 21.7% |
| College / Undergraduate | 1,516 | 17.0% |
| Graduate / Professional | 367 | 4.1% |
| Total | 8,904 | 100.0% |
School Enrollment by Age by Funding Source in Bartlesville
Out of a total of 8,904 students who are enrolled in schools in Bartlesville, 1,799 (20.2%) attend a private institution, while the remaining 7,105 (79.8%) are enrolled in public schools. The age group of 35 years and over has the highest likelihood of being enrolled in private schools, with 213 (53.6% in the age bracket) enrolled. Conversely, the age group of 10 to 14 year olds has the lowest likelihood of being enrolled in a private school, with 2,169 (89.8% in the age bracket) attending a public institution.
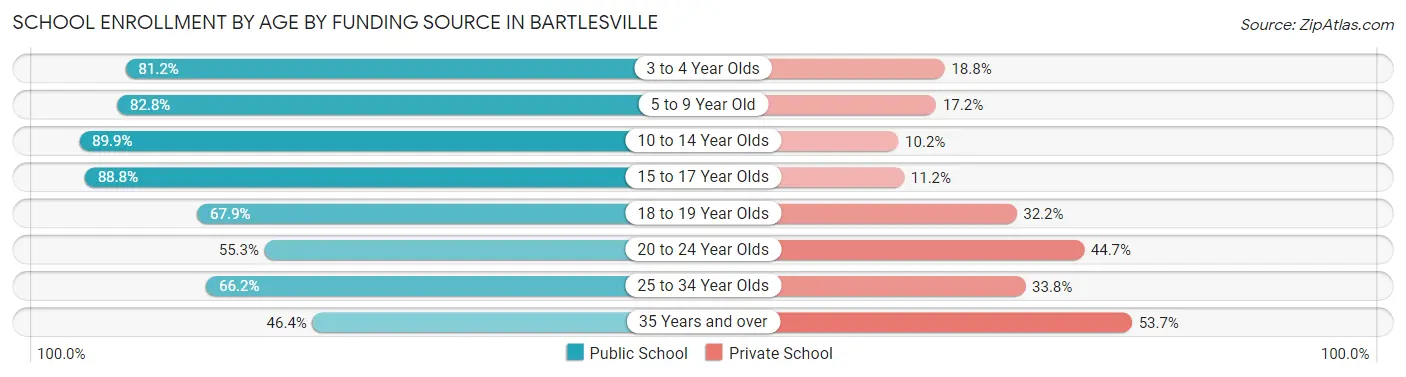
| Age Bracket | Public School | Private School |
| 3 to 4 Year Olds | 346 (81.2%) | 80 (18.8%) |
| 5 to 9 Year Old | 2,041 (82.8%) | 424 (17.2%) |
| 10 to 14 Year Olds | 2,169 (89.8%) | 245 (10.2%) |
| 15 to 17 Year Olds | 1,220 (88.8%) | 154 (11.2%) |
| 18 to 19 Year Olds | 401 (67.8%) | 190 (32.2%) |
| 20 to 24 Year Olds | 368 (55.3%) | 298 (44.7%) |
| 25 to 34 Year Olds | 378 (66.2%) | 193 (33.8%) |
| 35 Years and over | 184 (46.4%) | 213 (53.6%) |
| Total | 7,105 (79.8%) | 1,799 (20.2%) |
Educational Attainment by Field of Study in Bartlesville
Business (2,813 | 30.6%), education (1,339 | 14.5%), science & technology (776 | 8.4%), computers & mathematics (647 | 7.0%), and engineering (587 | 6.4%) are the most common fields of study among 9,206 individuals in Bartlesville who have obtained a bachelor's degree or higher.
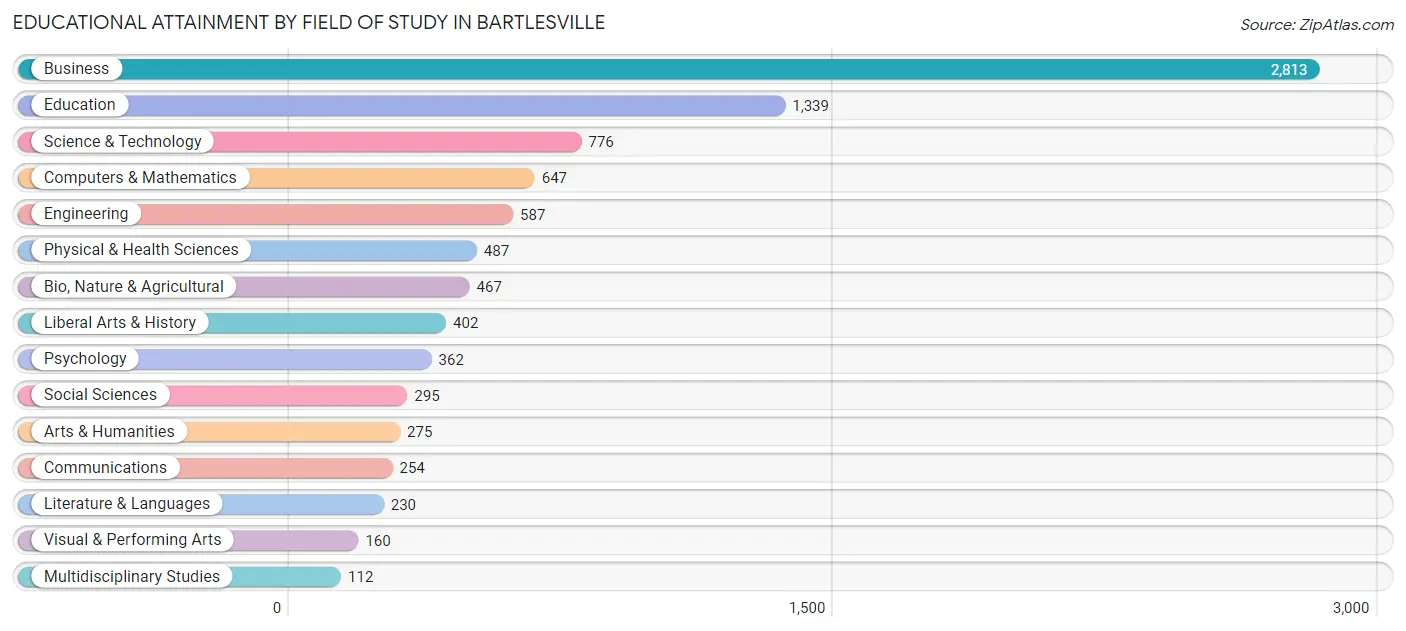
| Field of Study | # Graduates | % Graduates |
| Computers & Mathematics | 647 | 7.0% |
| Bio, Nature & Agricultural | 467 | 5.1% |
| Physical & Health Sciences | 487 | 5.3% |
| Psychology | 362 | 3.9% |
| Social Sciences | 295 | 3.2% |
| Engineering | 587 | 6.4% |
| Multidisciplinary Studies | 112 | 1.2% |
| Science & Technology | 776 | 8.4% |
| Business | 2,813 | 30.6% |
| Education | 1,339 | 14.5% |
| Literature & Languages | 230 | 2.5% |
| Liberal Arts & History | 402 | 4.4% |
| Visual & Performing Arts | 160 | 1.7% |
| Communications | 254 | 2.8% |
| Arts & Humanities | 275 | 3.0% |
| Total | 9,206 | 100.0% |
Transportation & Commute in Bartlesville
Vehicle Availability by Sex in Bartlesville
The most prevalent vehicle ownership categories in Bartlesville are males with 2 vehicles (3,757, accounting for 44.8%) and females with 2 vehicles (3,199, making up 48.6%).
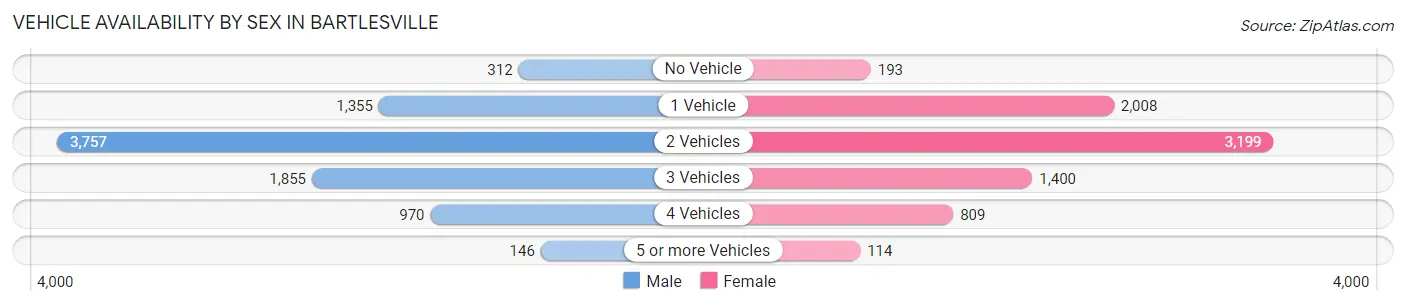
| Vehicles Available | Male | Female |
| No Vehicle | 312 (3.7%) | 193 (2.5%) |
| 1 Vehicle | 1,355 (16.1%) | 2,008 (26.0%) |
| 2 Vehicles | 3,757 (44.8%) | 3,199 (41.4%) |
| 3 Vehicles | 1,855 (22.1%) | 1,400 (18.1%) |
| 4 Vehicles | 970 (11.6%) | 809 (10.5%) |
| 5 or more Vehicles | 146 (1.7%) | 114 (1.5%) |
| Total | 8,395 (100.0%) | 7,723 (100.0%) |
Commute Time in Bartlesville
The most frequently occuring commute durations in Bartlesville are 10 to 14 minutes (3,980 commuters, 25.7%), 5 to 9 minutes (3,560 commuters, 23.0%), and 15 to 19 minutes (2,812 commuters, 18.2%).
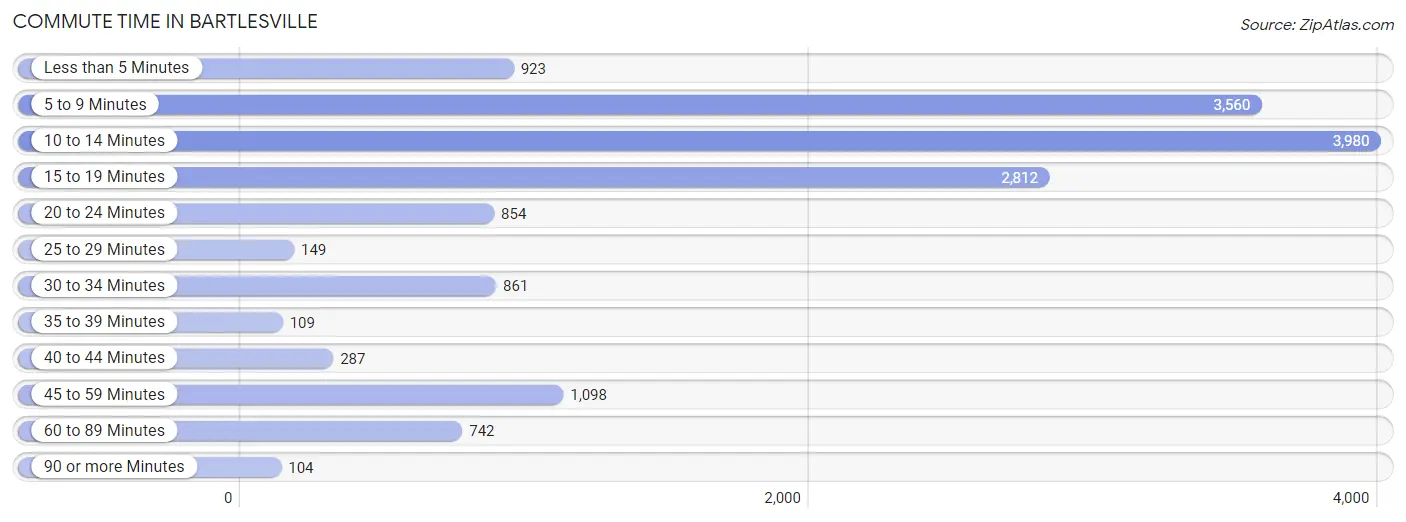
| Commute Time | # Commuters | % Commuters |
| Less than 5 Minutes | 923 | 6.0% |
| 5 to 9 Minutes | 3,560 | 23.0% |
| 10 to 14 Minutes | 3,980 | 25.7% |
| 15 to 19 Minutes | 2,812 | 18.2% |
| 20 to 24 Minutes | 854 | 5.5% |
| 25 to 29 Minutes | 149 | 1.0% |
| 30 to 34 Minutes | 861 | 5.6% |
| 35 to 39 Minutes | 109 | 0.7% |
| 40 to 44 Minutes | 287 | 1.8% |
| 45 to 59 Minutes | 1,098 | 7.1% |
| 60 to 89 Minutes | 742 | 4.8% |
| 90 or more Minutes | 104 | 0.7% |
Commute Time by Sex in Bartlesville
The most common commute times in Bartlesville are 5 to 9 minutes (1,988 commuters, 24.2%) for males and 10 to 14 minutes (2,189 commuters, 30.1%) for females.
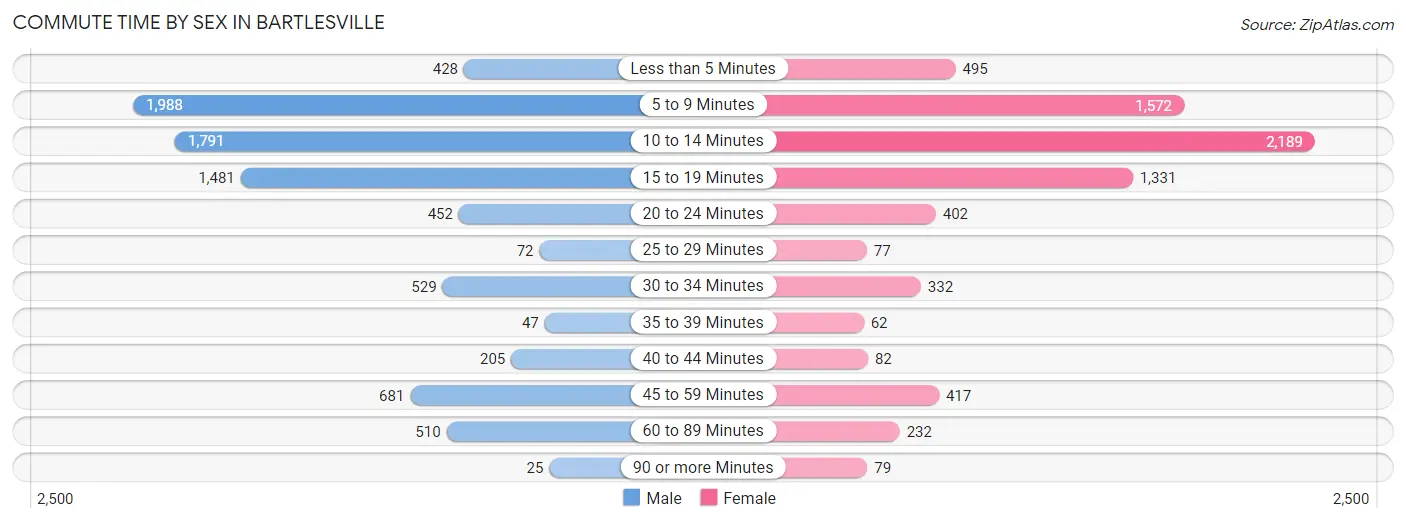
| Commute Time | Male | Female |
| Less than 5 Minutes | 428 (5.2%) | 495 (6.8%) |
| 5 to 9 Minutes | 1,988 (24.2%) | 1,572 (21.6%) |
| 10 to 14 Minutes | 1,791 (21.8%) | 2,189 (30.1%) |
| 15 to 19 Minutes | 1,481 (18.0%) | 1,331 (18.3%) |
| 20 to 24 Minutes | 452 (5.5%) | 402 (5.5%) |
| 25 to 29 Minutes | 72 (0.9%) | 77 (1.1%) |
| 30 to 34 Minutes | 529 (6.4%) | 332 (4.6%) |
| 35 to 39 Minutes | 47 (0.6%) | 62 (0.9%) |
| 40 to 44 Minutes | 205 (2.5%) | 82 (1.1%) |
| 45 to 59 Minutes | 681 (8.3%) | 417 (5.7%) |
| 60 to 89 Minutes | 510 (6.2%) | 232 (3.2%) |
| 90 or more Minutes | 25 (0.3%) | 79 (1.1%) |
Time of Departure to Work by Sex in Bartlesville
The most frequent times of departure to work in Bartlesville are 7:30 AM to 7:59 AM (1,391, 16.9%) for males and 7:30 AM to 7:59 AM (1,622, 22.3%) for females.
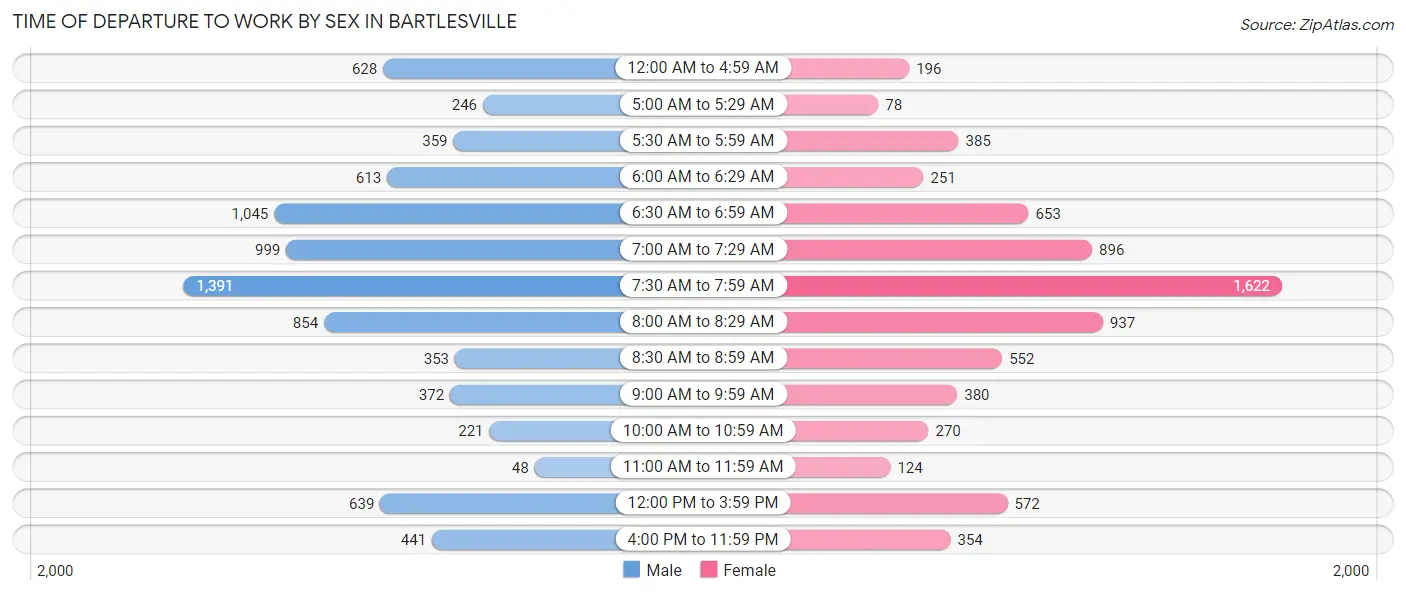
| Time of Departure | Male | Female |
| 12:00 AM to 4:59 AM | 628 (7.6%) | 196 (2.7%) |
| 5:00 AM to 5:29 AM | 246 (3.0%) | 78 (1.1%) |
| 5:30 AM to 5:59 AM | 359 (4.4%) | 385 (5.3%) |
| 6:00 AM to 6:29 AM | 613 (7.5%) | 251 (3.5%) |
| 6:30 AM to 6:59 AM | 1,045 (12.7%) | 653 (9.0%) |
| 7:00 AM to 7:29 AM | 999 (12.2%) | 896 (12.3%) |
| 7:30 AM to 7:59 AM | 1,391 (16.9%) | 1,622 (22.3%) |
| 8:00 AM to 8:29 AM | 854 (10.4%) | 937 (12.9%) |
| 8:30 AM to 8:59 AM | 353 (4.3%) | 552 (7.6%) |
| 9:00 AM to 9:59 AM | 372 (4.5%) | 380 (5.2%) |
| 10:00 AM to 10:59 AM | 221 (2.7%) | 270 (3.7%) |
| 11:00 AM to 11:59 AM | 48 (0.6%) | 124 (1.7%) |
| 12:00 PM to 3:59 PM | 639 (7.8%) | 572 (7.9%) |
| 4:00 PM to 11:59 PM | 441 (5.4%) | 354 (4.9%) |
| Total | 8,209 (100.0%) | 7,270 (100.0%) |
Housing Occupancy in Bartlesville
Occupancy by Ownership in Bartlesville
Of the total 14,480 dwellings in Bartlesville, owner-occupied units account for 10,081 (69.6%), while renter-occupied units make up 4,399 (30.4%).
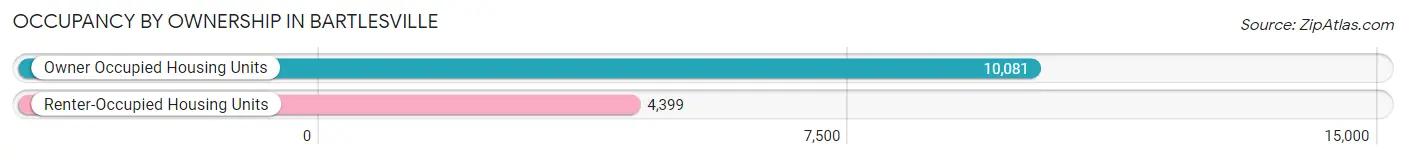
| Occupancy | # Housing Units | % Housing Units |
| Owner Occupied Housing Units | 10,081 | 69.6% |
| Renter-Occupied Housing Units | 4,399 | 30.4% |
| Total Occupied Housing Units | 14,480 | 100.0% |
Occupancy by Household Size in Bartlesville
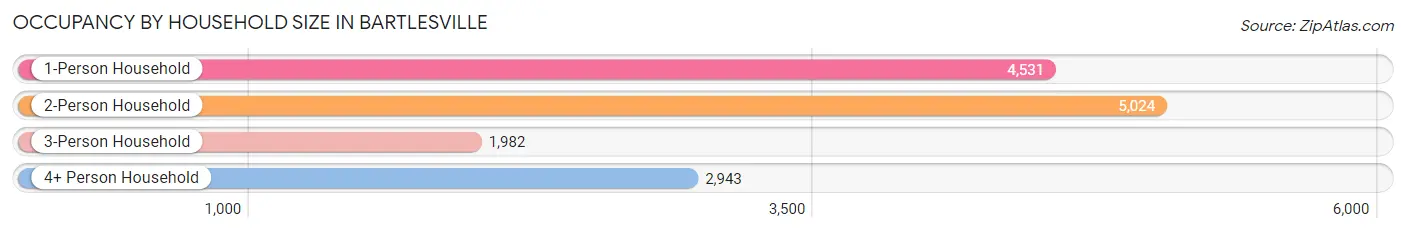
| Household Size | # Housing Units | % Housing Units |
| 1-Person Household | 4,531 | 31.3% |
| 2-Person Household | 5,024 | 34.7% |
| 3-Person Household | 1,982 | 13.7% |
| 4+ Person Household | 2,943 | 20.3% |
| Total Housing Units | 14,480 | 100.0% |
Occupancy by Ownership by Household Size in Bartlesville
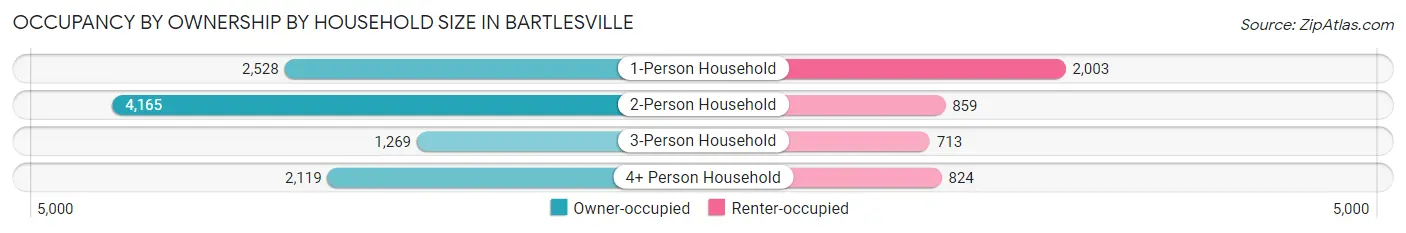
| Household Size | Owner-occupied | Renter-occupied |
| 1-Person Household | 2,528 (55.8%) | 2,003 (44.2%) |
| 2-Person Household | 4,165 (82.9%) | 859 (17.1%) |
| 3-Person Household | 1,269 (64.0%) | 713 (36.0%) |
| 4+ Person Household | 2,119 (72.0%) | 824 (28.0%) |
| Total Housing Units | 10,081 (69.6%) | 4,399 (30.4%) |
Occupancy by Educational Attainment in Bartlesville
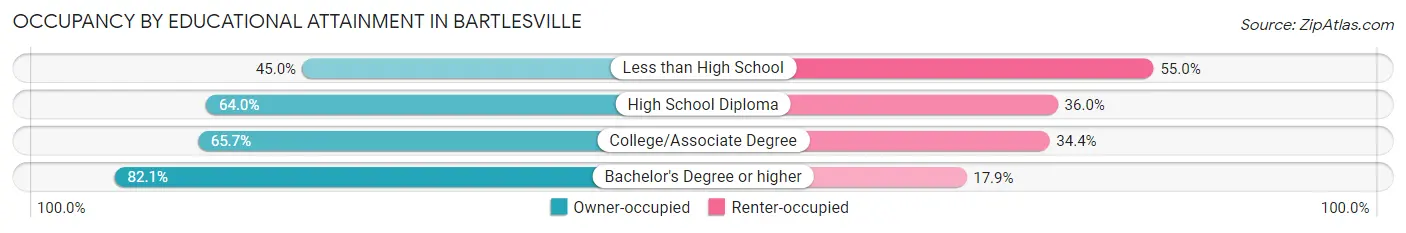
| Household Size | Owner-occupied | Renter-occupied |
| Less than High School | 470 (45.0%) | 574 (55.0%) |
| High School Diploma | 2,612 (64.0%) | 1,468 (36.0%) |
| College/Associate Degree | 2,731 (65.6%) | 1,429 (34.4%) |
| Bachelor's Degree or higher | 4,268 (82.1%) | 928 (17.9%) |
Occupancy by Age of Householder in Bartlesville
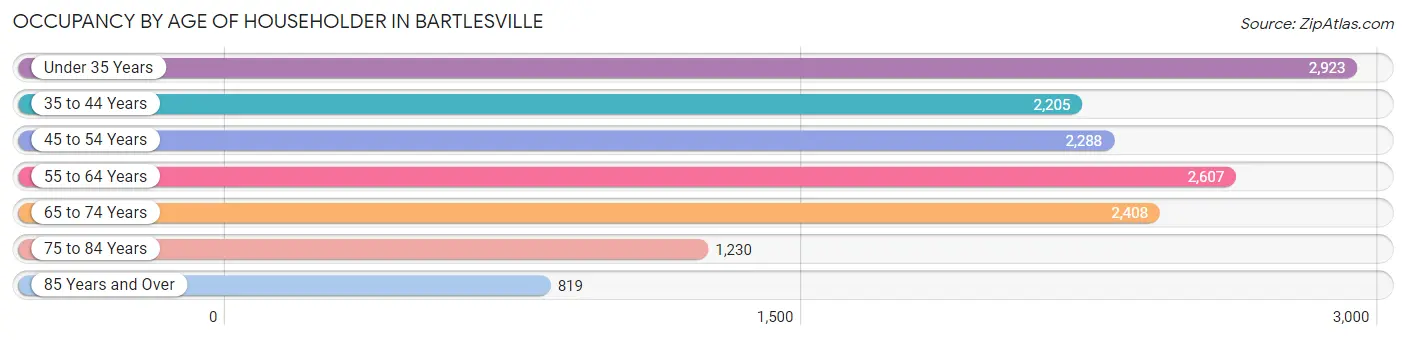
| Age Bracket | # Households | % Households |
| Under 35 Years | 2,923 | 20.2% |
| 35 to 44 Years | 2,205 | 15.2% |
| 45 to 54 Years | 2,288 | 15.8% |
| 55 to 64 Years | 2,607 | 18.0% |
| 65 to 74 Years | 2,408 | 16.6% |
| 75 to 84 Years | 1,230 | 8.5% |
| 85 Years and Over | 819 | 5.7% |
| Total | 14,480 | 100.0% |
Housing Finances in Bartlesville
Median Income by Occupancy in Bartlesville
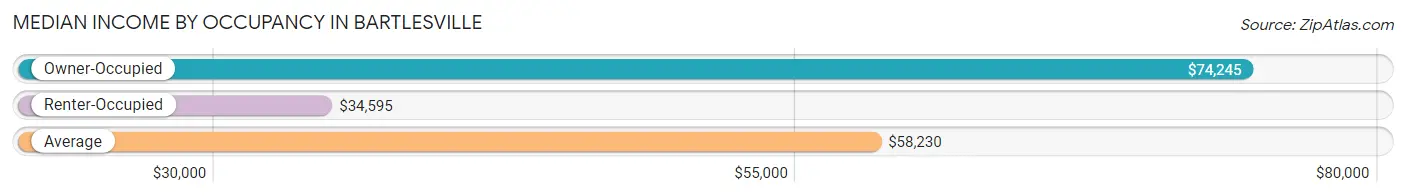
| Occupancy Type | # Households | Median Income |
| Owner-Occupied | 10,081 (69.6%) | $74,245 |
| Renter-Occupied | 4,399 (30.4%) | $34,595 |
| Average | 14,480 (100.0%) | $58,230 |
Occupancy by Householder Income Bracket in Bartlesville
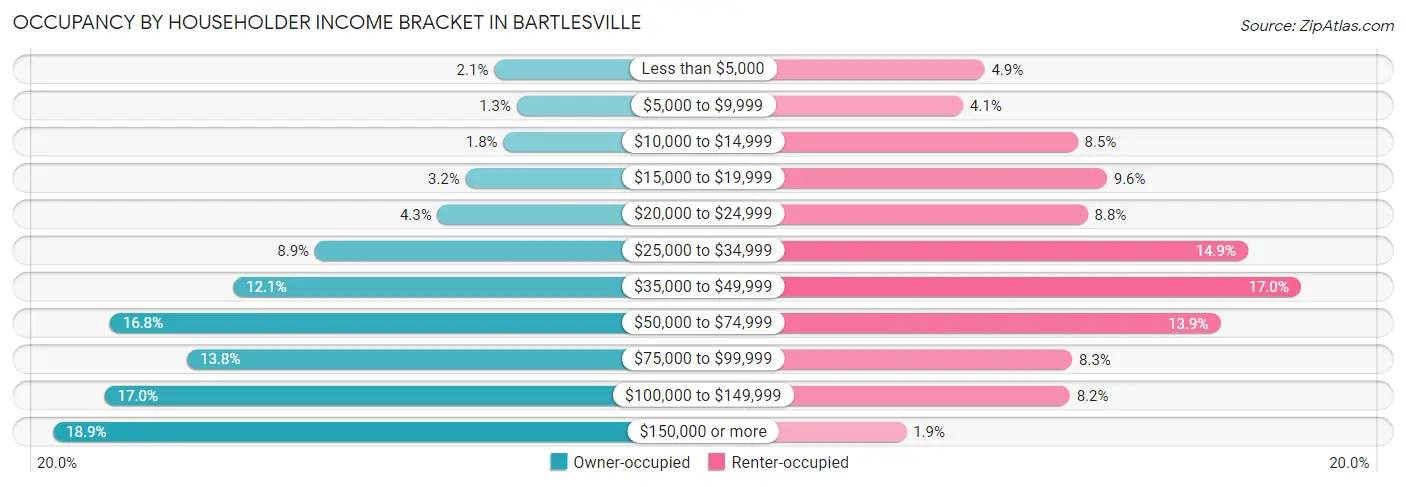
| Income Bracket | Owner-occupied | Renter-occupied |
| Less than $5,000 | 213 (2.1%) | 216 (4.9%) |
| $5,000 to $9,999 | 126 (1.3%) | 180 (4.1%) |
| $10,000 to $14,999 | 177 (1.8%) | 372 (8.5%) |
| $15,000 to $19,999 | 323 (3.2%) | 421 (9.6%) |
| $20,000 to $24,999 | 430 (4.3%) | 389 (8.8%) |
| $25,000 to $34,999 | 901 (8.9%) | 657 (14.9%) |
| $35,000 to $49,999 | 1,215 (12.0%) | 746 (17.0%) |
| $50,000 to $74,999 | 1,689 (16.8%) | 611 (13.9%) |
| $75,000 to $99,999 | 1,392 (13.8%) | 363 (8.3%) |
| $100,000 to $149,999 | 1,709 (17.0%) | 359 (8.2%) |
| $150,000 or more | 1,906 (18.9%) | 85 (1.9%) |
| Total | 10,081 (100.0%) | 4,399 (100.0%) |
Monthly Housing Cost Tiers in Bartlesville
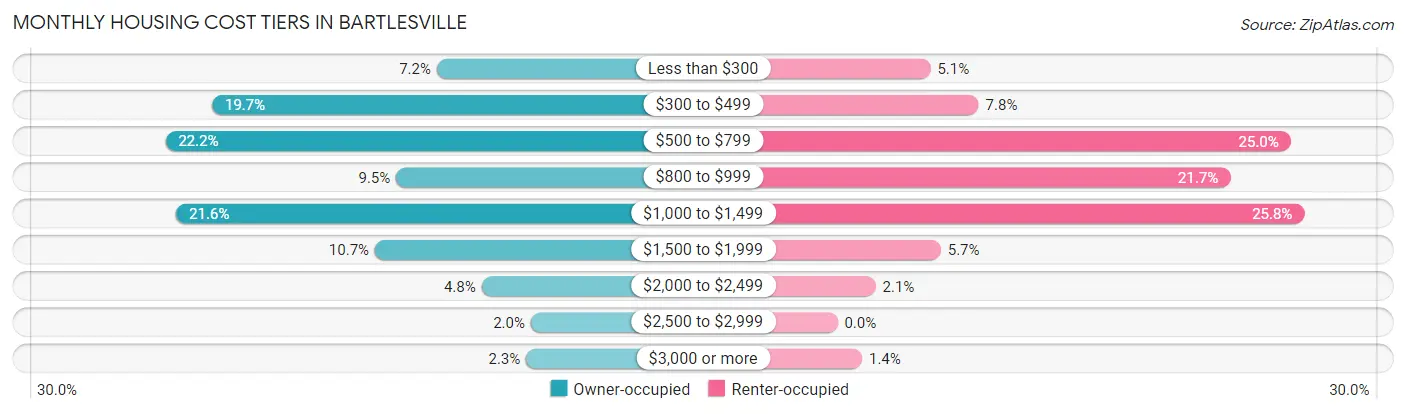
| Monthly Cost | Owner-occupied | Renter-occupied |
| Less than $300 | 729 (7.2%) | 226 (5.1%) |
| $300 to $499 | 1,982 (19.7%) | 343 (7.8%) |
| $500 to $799 | 2,241 (22.2%) | 1,101 (25.0%) |
| $800 to $999 | 956 (9.5%) | 954 (21.7%) |
| $1,000 to $1,499 | 2,181 (21.6%) | 1,134 (25.8%) |
| $1,500 to $1,999 | 1,074 (10.6%) | 251 (5.7%) |
| $2,000 to $2,499 | 480 (4.8%) | 93 (2.1%) |
| $2,500 to $2,999 | 206 (2.0%) | 0 (0.0%) |
| $3,000 or more | 232 (2.3%) | 60 (1.4%) |
| Total | 10,081 (100.0%) | 4,399 (100.0%) |
Physical Housing Characteristics in Bartlesville
Housing Structures in Bartlesville
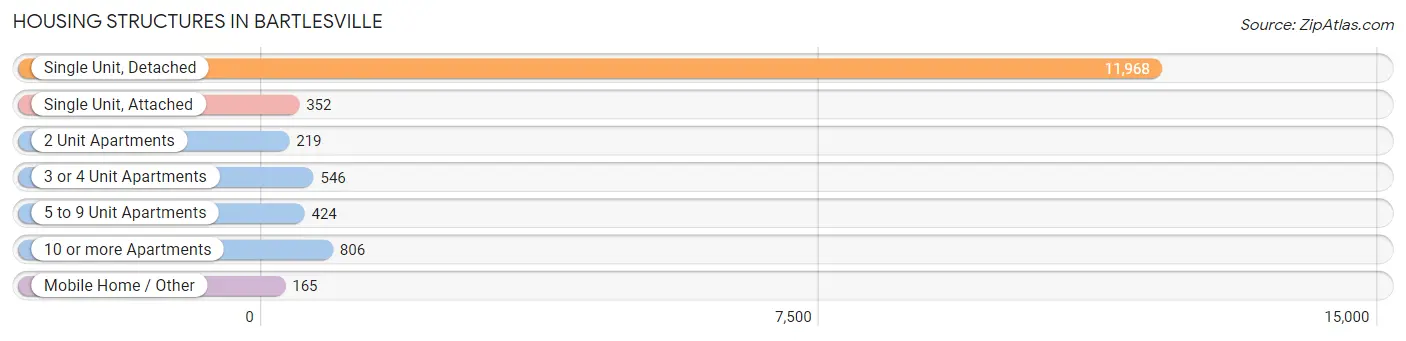
| Structure Type | # Housing Units | % Housing Units |
| Single Unit, Detached | 11,968 | 82.7% |
| Single Unit, Attached | 352 | 2.4% |
| 2 Unit Apartments | 219 | 1.5% |
| 3 or 4 Unit Apartments | 546 | 3.8% |
| 5 to 9 Unit Apartments | 424 | 2.9% |
| 10 or more Apartments | 806 | 5.6% |
| Mobile Home / Other | 165 | 1.1% |
| Total | 14,480 | 100.0% |
Housing Structures by Occupancy in Bartlesville
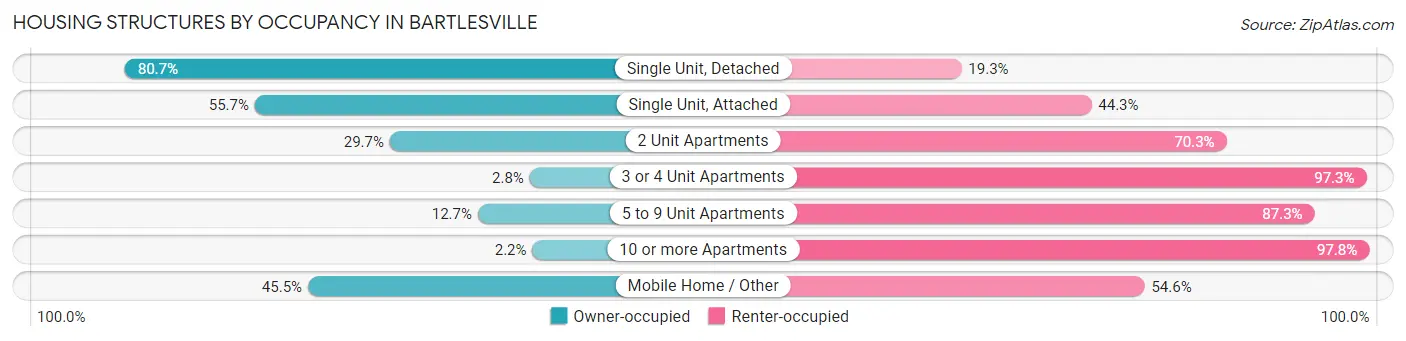
| Structure Type | Owner-occupied | Renter-occupied |
| Single Unit, Detached | 9,658 (80.7%) | 2,310 (19.3%) |
| Single Unit, Attached | 196 (55.7%) | 156 (44.3%) |
| 2 Unit Apartments | 65 (29.7%) | 154 (70.3%) |
| 3 or 4 Unit Apartments | 15 (2.8%) | 531 (97.3%) |
| 5 to 9 Unit Apartments | 54 (12.7%) | 370 (87.3%) |
| 10 or more Apartments | 18 (2.2%) | 788 (97.8%) |
| Mobile Home / Other | 75 (45.5%) | 90 (54.5%) |
| Total | 10,081 (69.6%) | 4,399 (30.4%) |
Housing Structures by Number of Rooms in Bartlesville
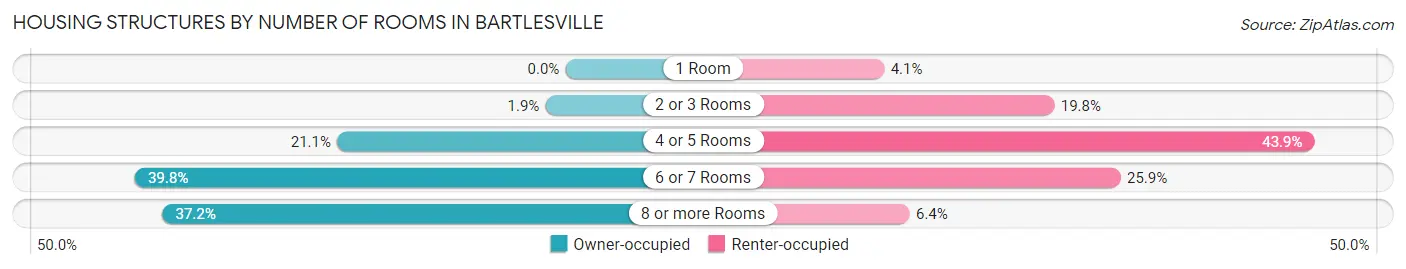
| Number of Rooms | Owner-occupied | Renter-occupied |
| 1 Room | 0 (0.0%) | 178 (4.1%) |
| 2 or 3 Rooms | 186 (1.8%) | 870 (19.8%) |
| 4 or 5 Rooms | 2,130 (21.1%) | 1,930 (43.9%) |
| 6 or 7 Rooms | 4,011 (39.8%) | 1,140 (25.9%) |
| 8 or more Rooms | 3,754 (37.2%) | 281 (6.4%) |
| Total | 10,081 (100.0%) | 4,399 (100.0%) |
Housing Structure by Heating Type in Bartlesville
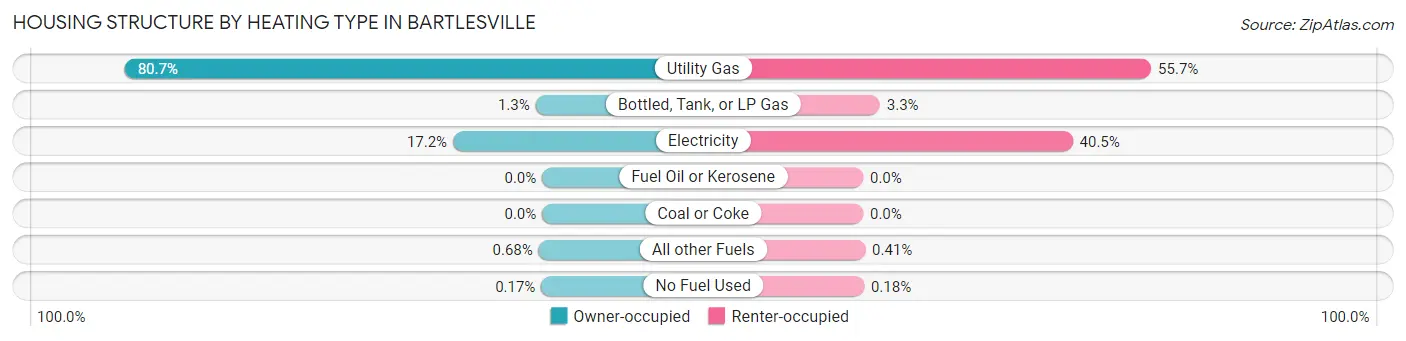
| Heating Type | Owner-occupied | Renter-occupied |
| Utility Gas | 8,130 (80.6%) | 2,449 (55.7%) |
| Bottled, Tank, or LP Gas | 128 (1.3%) | 143 (3.3%) |
| Electricity | 1,737 (17.2%) | 1,781 (40.5%) |
| Fuel Oil or Kerosene | 0 (0.0%) | 0 (0.0%) |
| Coal or Coke | 0 (0.0%) | 0 (0.0%) |
| All other Fuels | 69 (0.7%) | 18 (0.4%) |
| No Fuel Used | 17 (0.2%) | 8 (0.2%) |
| Total | 10,081 (100.0%) | 4,399 (100.0%) |
Household Vehicle Usage in Bartlesville
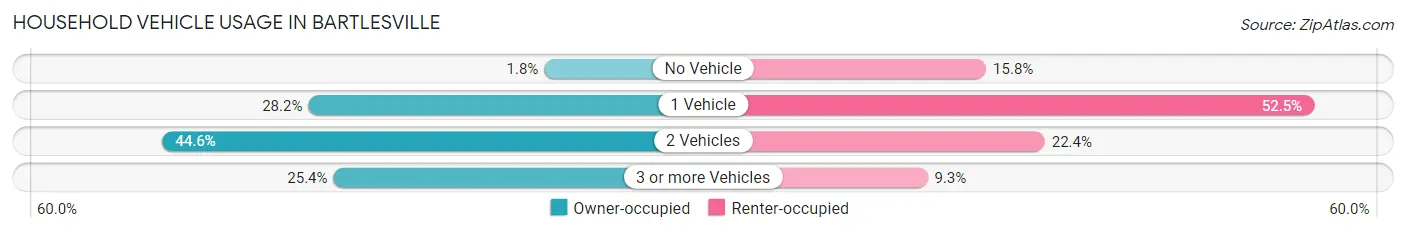
| Vehicles per Household | Owner-occupied | Renter-occupied |
| No Vehicle | 181 (1.8%) | 696 (15.8%) |
| 1 Vehicle | 2,846 (28.2%) | 2,311 (52.5%) |
| 2 Vehicles | 4,492 (44.6%) | 985 (22.4%) |
| 3 or more Vehicles | 2,562 (25.4%) | 407 (9.2%) |
| Total | 10,081 (100.0%) | 4,399 (100.0%) |
Real Estate & Mortgages in Bartlesville
Real Estate and Mortgage Overview in Bartlesville
| Characteristic | Without Mortgage | With Mortgage |
| Housing Units | 4,702 | 5,379 |
| Median Property Value | $138,100 | $157,500 |
| Median Household Income | $56,156 | $1,323 |
| Monthly Housing Costs | $455 | $232 |
| Real Estate Taxes | $1,323 | $272 |
Property Value by Mortgage Status in Bartlesville
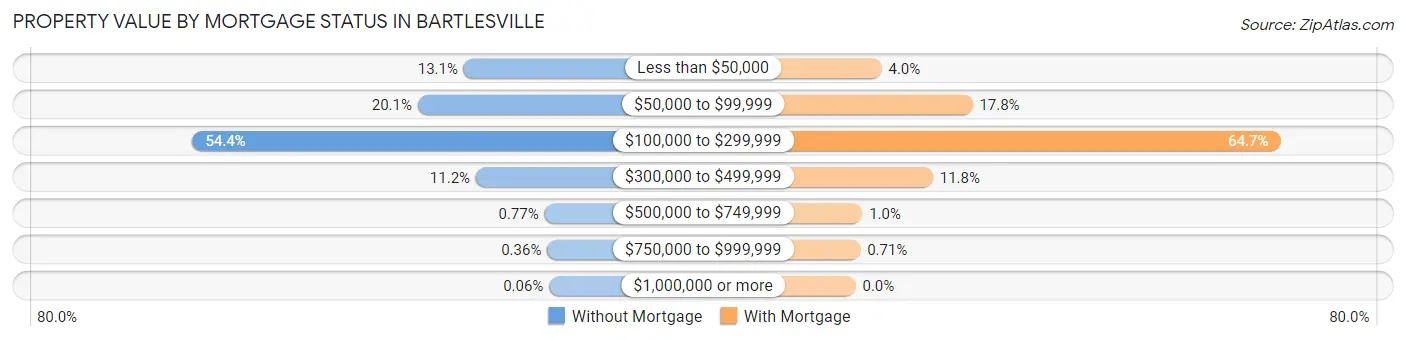
| Property Value | Without Mortgage | With Mortgage |
| Less than $50,000 | 615 (13.1%) | 213 (4.0%) |
| $50,000 to $99,999 | 944 (20.1%) | 958 (17.8%) |
| $100,000 to $299,999 | 2,559 (54.4%) | 3,482 (64.7%) |
| $300,000 to $499,999 | 528 (11.2%) | 633 (11.8%) |
| $500,000 to $749,999 | 36 (0.8%) | 55 (1.0%) |
| $750,000 to $999,999 | 17 (0.4%) | 38 (0.7%) |
| $1,000,000 or more | 3 (0.1%) | 0 (0.0%) |
| Total | 4,702 (100.0%) | 5,379 (100.0%) |
Household Income by Mortgage Status in Bartlesville
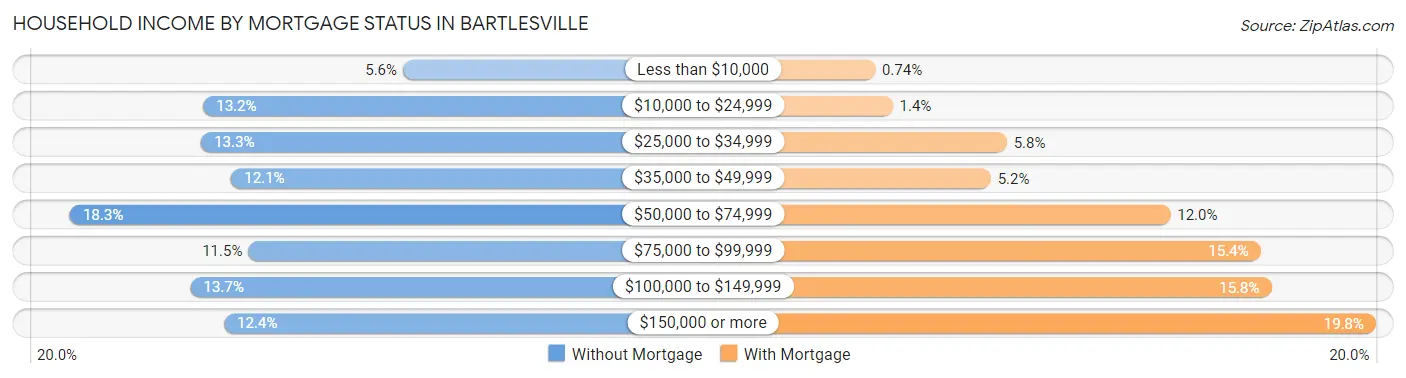
| Household Income | Without Mortgage | With Mortgage |
| Less than $10,000 | 263 (5.6%) | 40 (0.7%) |
| $10,000 to $24,999 | 620 (13.2%) | 76 (1.4%) |
| $25,000 to $34,999 | 624 (13.3%) | 310 (5.8%) |
| $35,000 to $49,999 | 570 (12.1%) | 277 (5.1%) |
| $50,000 to $74,999 | 859 (18.3%) | 645 (12.0%) |
| $75,000 to $99,999 | 540 (11.5%) | 830 (15.4%) |
| $100,000 to $149,999 | 643 (13.7%) | 852 (15.8%) |
| $150,000 or more | 583 (12.4%) | 1,066 (19.8%) |
| Total | 4,702 (100.0%) | 5,379 (100.0%) |
Property Value to Household Income Ratio in Bartlesville
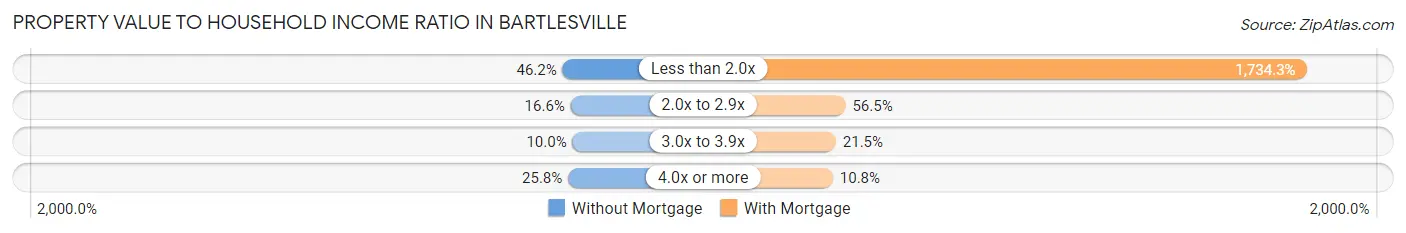
| Value-to-Income Ratio | Without Mortgage | With Mortgage |
| Less than 2.0x | 2,170 (46.2%) | 93,290 (1,734.3%) |
| 2.0x to 2.9x | 781 (16.6%) | 3,041 (56.5%) |
| 3.0x to 3.9x | 468 (10.0%) | 1,157 (21.5%) |
| 4.0x or more | 1,215 (25.8%) | 580 (10.8%) |
| Total | 4,702 (100.0%) | 5,379 (100.0%) |
Real Estate Taxes by Mortgage Status in Bartlesville
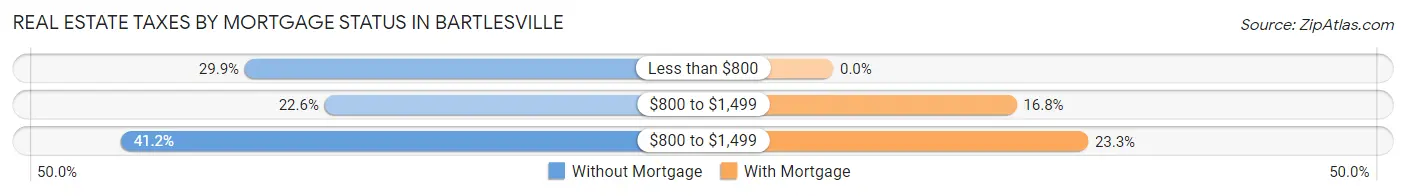
| Property Taxes | Without Mortgage | With Mortgage |
| Less than $800 | 1,405 (29.9%) | 0 (0.0%) |
| $800 to $1,499 | 1,062 (22.6%) | 901 (16.8%) |
| $800 to $1,499 | 1,938 (41.2%) | 1,252 (23.3%) |
| Total | 4,702 (100.0%) | 5,379 (100.0%) |
Health & Disability in Bartlesville
Health Insurance Coverage by Age in Bartlesville
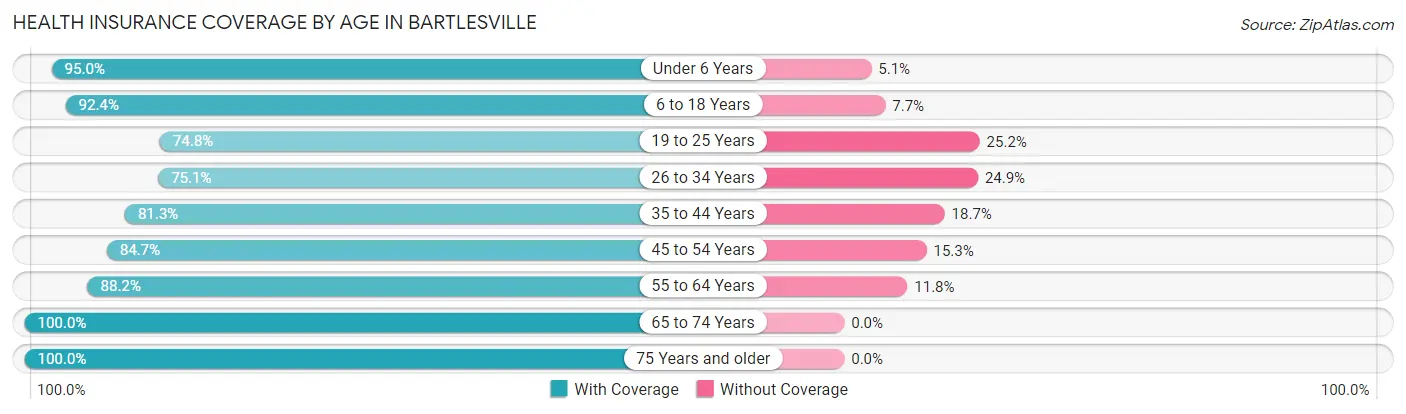
| Age Bracket | With Coverage | Without Coverage |
| Under 6 Years | 2,800 (95.0%) | 149 (5.1%) |
| 6 to 18 Years | 6,027 (92.3%) | 499 (7.6%) |
| 19 to 25 Years | 2,462 (74.8%) | 831 (25.2%) |
| 26 to 34 Years | 3,351 (75.1%) | 1,112 (24.9%) |
| 35 to 44 Years | 3,544 (81.3%) | 816 (18.7%) |
| 45 to 54 Years | 3,533 (84.7%) | 640 (15.3%) |
| 55 to 64 Years | 3,774 (88.2%) | 503 (11.8%) |
| 65 to 74 Years | 3,704 (100.0%) | 0 (0.0%) |
| 75 Years and older | 3,207 (100.0%) | 0 (0.0%) |
| Total | 32,402 (87.7%) | 4,550 (12.3%) |
Health Insurance Coverage by Citizenship Status in Bartlesville
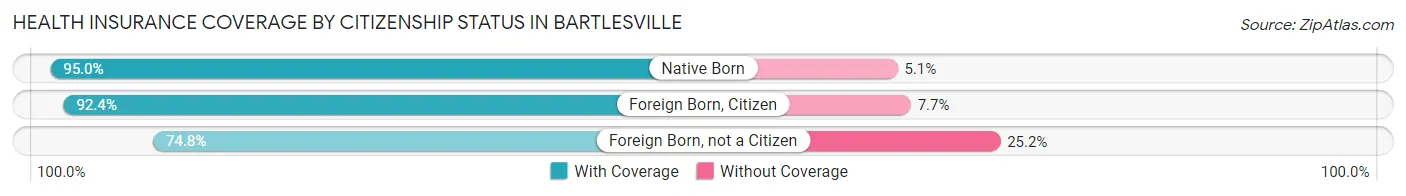
| Citizenship Status | With Coverage | Without Coverage |
| Native Born | 2,800 (95.0%) | 149 (5.1%) |
| Foreign Born, Citizen | 6,027 (92.3%) | 499 (7.6%) |
| Foreign Born, not a Citizen | 2,462 (74.8%) | 831 (25.2%) |
Health Insurance Coverage by Household Income in Bartlesville
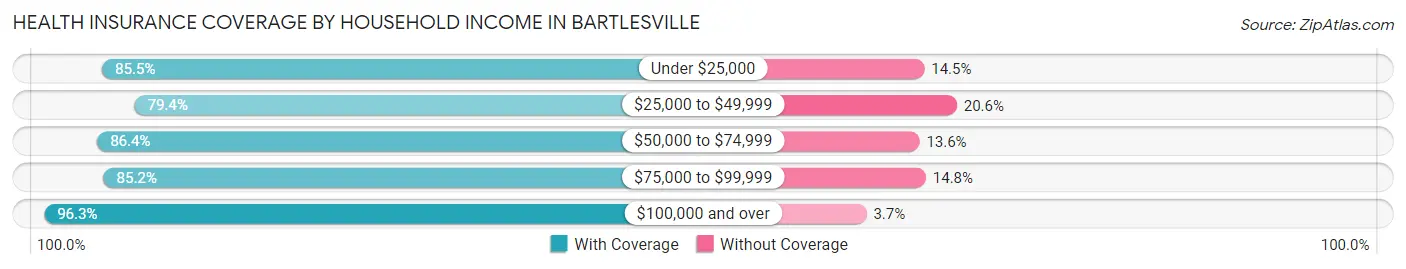
| Household Income | With Coverage | Without Coverage |
| Under $25,000 | 4,298 (85.5%) | 730 (14.5%) |
| $25,000 to $49,999 | 6,304 (79.4%) | 1,637 (20.6%) |
| $50,000 to $74,999 | 4,995 (86.4%) | 787 (13.6%) |
| $75,000 to $99,999 | 4,669 (85.2%) | 812 (14.8%) |
| $100,000 and over | 11,789 (96.3%) | 450 (3.7%) |
Public vs Private Health Insurance Coverage by Age in Bartlesville
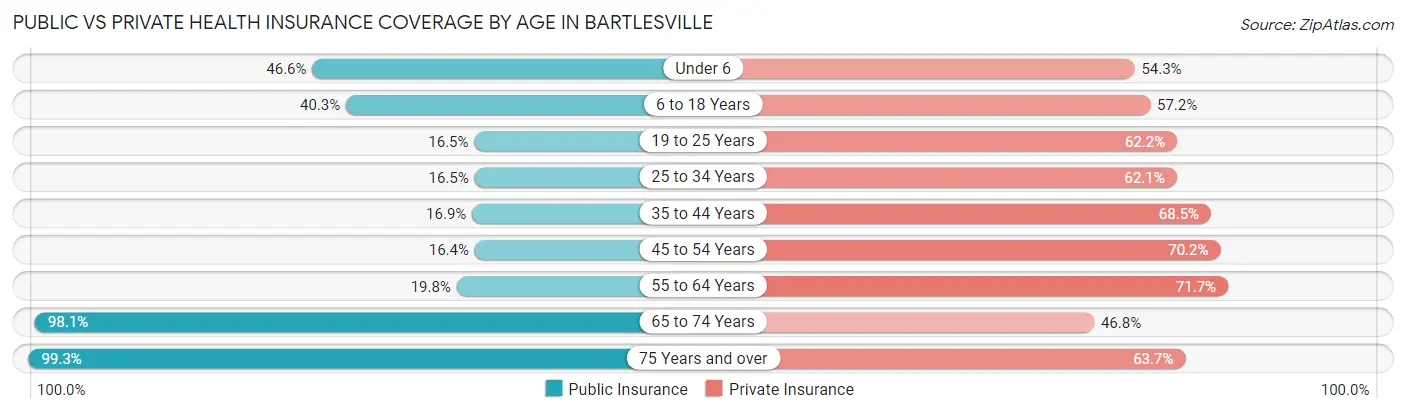
| Age Bracket | Public Insurance | Private Insurance |
| Under 6 | 1,374 (46.6%) | 1,602 (54.3%) |
| 6 to 18 Years | 2,632 (40.3%) | 3,734 (57.2%) |
| 19 to 25 Years | 544 (16.5%) | 2,049 (62.2%) |
| 25 to 34 Years | 735 (16.5%) | 2,773 (62.1%) |
| 35 to 44 Years | 738 (16.9%) | 2,987 (68.5%) |
| 45 to 54 Years | 686 (16.4%) | 2,931 (70.2%) |
| 55 to 64 Years | 847 (19.8%) | 3,065 (71.7%) |
| 65 to 74 Years | 3,633 (98.1%) | 1,734 (46.8%) |
| 75 Years and over | 3,184 (99.3%) | 2,044 (63.7%) |
| Total | 14,373 (38.9%) | 22,919 (62.0%) |
Disability Status by Sex by Age in Bartlesville
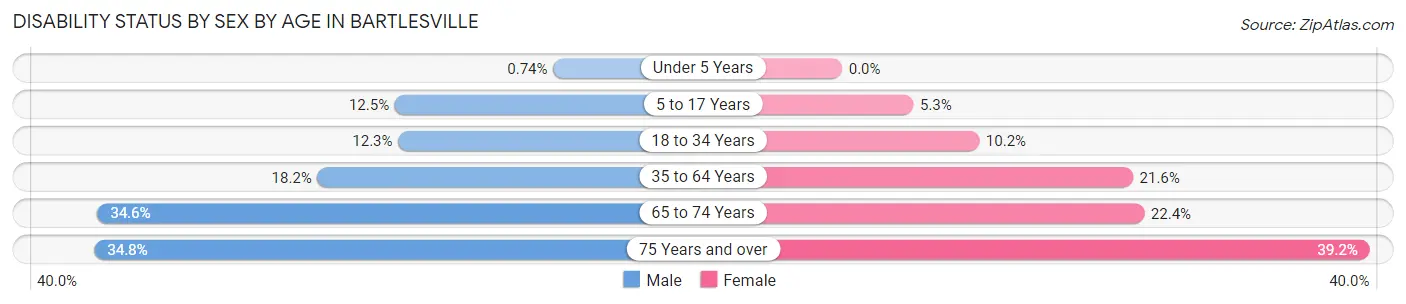
| Age Bracket | Male | Female |
| Under 5 Years | 10 (0.7%) | 0 (0.0%) |
| 5 to 17 Years | 421 (12.5%) | 162 (5.3%) |
| 18 to 34 Years | 530 (12.2%) | 399 (10.2%) |
| 35 to 64 Years | 1,122 (18.2%) | 1,438 (21.6%) |
| 65 to 74 Years | 575 (34.6%) | 458 (22.4%) |
| 75 Years and over | 429 (34.8%) | 774 (39.2%) |
Disability Class by Sex by Age in Bartlesville
Disability Class: Hearing Difficulty
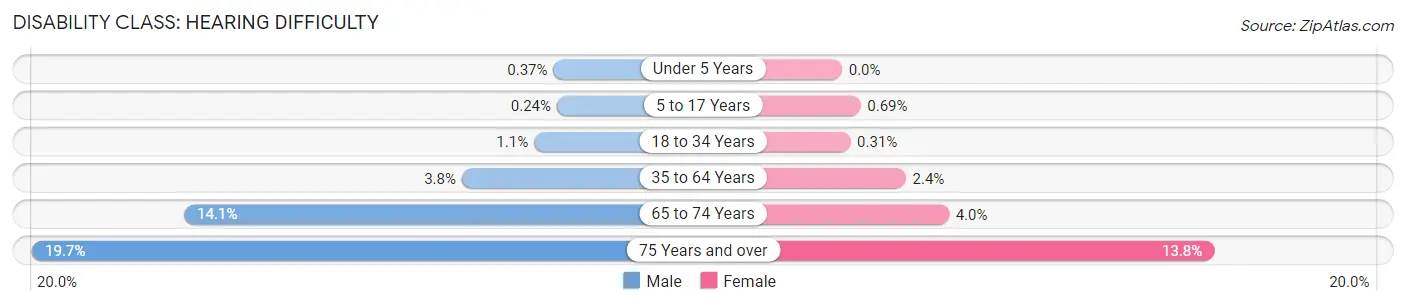
| Age Bracket | Male | Female |
| Under 5 Years | 5 (0.4%) | 0 (0.0%) |
| 5 to 17 Years | 8 (0.2%) | 21 (0.7%) |
| 18 to 34 Years | 47 (1.1%) | 12 (0.3%) |
| 35 to 64 Years | 232 (3.8%) | 158 (2.4%) |
| 65 to 74 Years | 234 (14.1%) | 81 (4.0%) |
| 75 Years and over | 243 (19.7%) | 273 (13.8%) |
Disability Class: Vision Difficulty
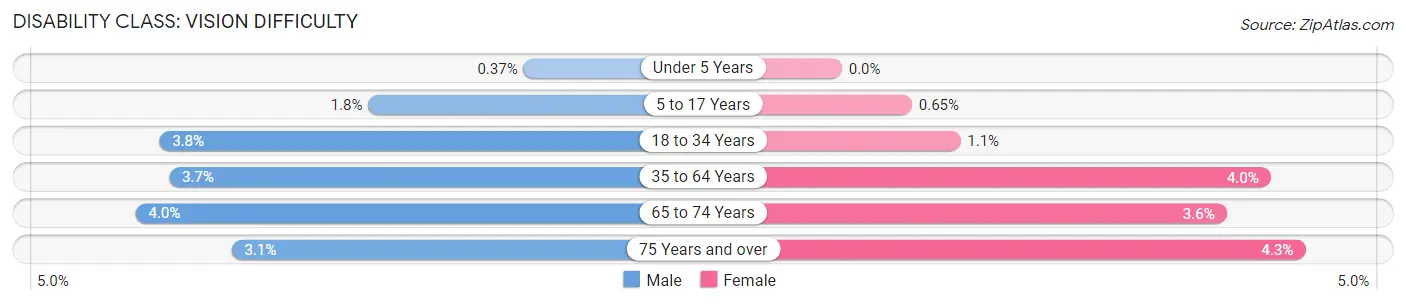
| Age Bracket | Male | Female |
| Under 5 Years | 5 (0.4%) | 0 (0.0%) |
| 5 to 17 Years | 61 (1.8%) | 20 (0.6%) |
| 18 to 34 Years | 162 (3.7%) | 43 (1.1%) |
| 35 to 64 Years | 225 (3.7%) | 265 (4.0%) |
| 65 to 74 Years | 66 (4.0%) | 73 (3.6%) |
| 75 Years and over | 38 (3.1%) | 85 (4.3%) |
Disability Class: Cognitive Difficulty
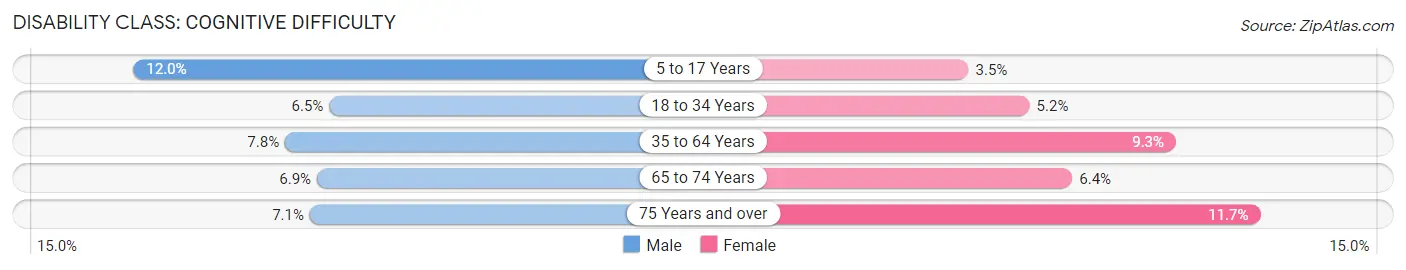
| Age Bracket | Male | Female |
| 5 to 17 Years | 403 (12.0%) | 108 (3.5%) |
| 18 to 34 Years | 282 (6.5%) | 205 (5.2%) |
| 35 to 64 Years | 477 (7.7%) | 619 (9.3%) |
| 65 to 74 Years | 114 (6.9%) | 131 (6.4%) |
| 75 Years and over | 87 (7.1%) | 230 (11.7%) |
Disability Class: Ambulatory Difficulty
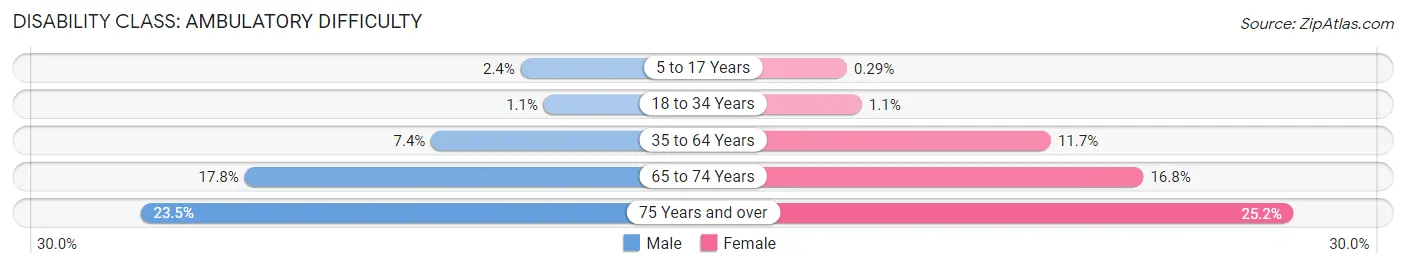
| Age Bracket | Male | Female |
| 5 to 17 Years | 80 (2.4%) | 9 (0.3%) |
| 18 to 34 Years | 47 (1.1%) | 44 (1.1%) |
| 35 to 64 Years | 453 (7.4%) | 776 (11.7%) |
| 65 to 74 Years | 295 (17.7%) | 343 (16.8%) |
| 75 Years and over | 290 (23.5%) | 497 (25.2%) |
Disability Class: Self-Care Difficulty
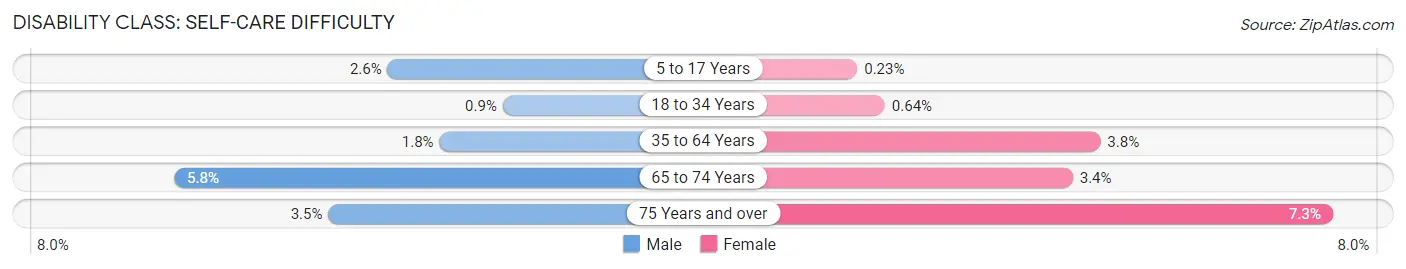
| Age Bracket | Male | Female |
| 5 to 17 Years | 88 (2.6%) | 7 (0.2%) |
| 18 to 34 Years | 39 (0.9%) | 25 (0.6%) |
| 35 to 64 Years | 113 (1.8%) | 256 (3.8%) |
| 65 to 74 Years | 96 (5.8%) | 70 (3.4%) |
| 75 Years and over | 43 (3.5%) | 144 (7.3%) |
Technology Access in Bartlesville
Computing Device Access in Bartlesville
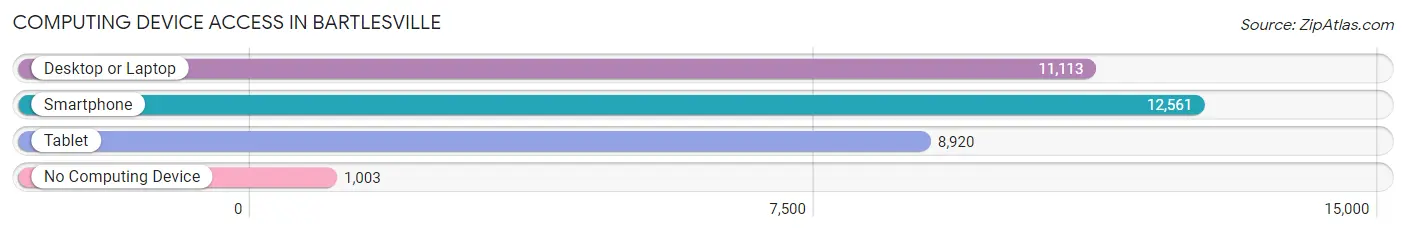
| Device Type | # Households | % Households |
| Desktop or Laptop | 11,113 | 76.7% |
| Smartphone | 12,561 | 86.8% |
| Tablet | 8,920 | 61.6% |
| No Computing Device | 1,003 | 6.9% |
| Total | 14,480 | 100.0% |
Internet Access in Bartlesville
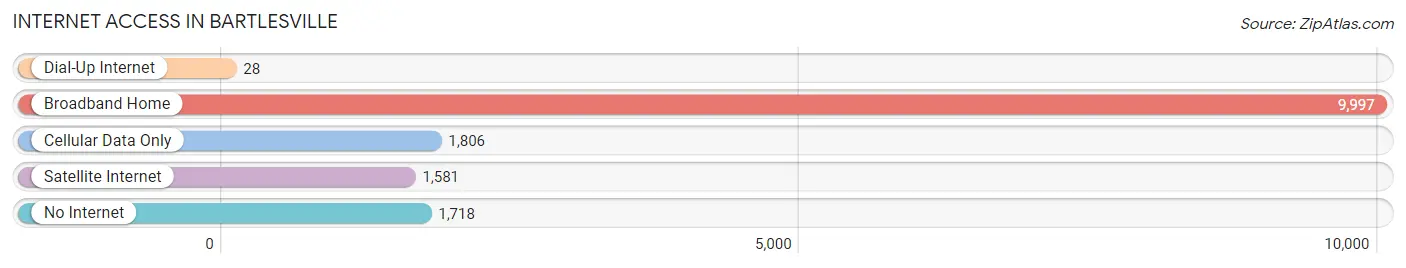
| Internet Type | # Households | % Households |
| Dial-Up Internet | 28 | 0.2% |
| Broadband Home | 9,997 | 69.0% |
| Cellular Data Only | 1,806 | 12.5% |
| Satellite Internet | 1,581 | 10.9% |
| No Internet | 1,718 | 11.9% |
| Total | 14,480 | 100.0% |
Bartlesville Summary
Bartlesville, Oklahoma is a city located in Washington County, in the northeastern part of the state. It is the county seat of Washington County and is the largest city in the county. The city is located in the foothills of the Ozark Mountains and is situated on the Caney River. The population of Bartlesville was estimated to be 36,845 in 2019.
History
Bartlesville was founded in 1897 by Jacob Bartles, a German immigrant who had moved to the area from Pennsylvania. He purchased a large tract of land and began to develop it into a town. The town was named after him and was incorporated in 1898.
The city grew rapidly in the early 1900s, due to the discovery of oil in the area. The first oil well was drilled in 1897 and the city quickly became a major oil center. The city was home to the Phillips Petroleum Company, which was founded in Bartlesville in 1917. The company was a major employer in the city and helped to fuel its growth.
The city was also home to the Frank Phillips Home, which was built in 1909 and is now a museum. The home was the residence of Frank Phillips, the founder of the Phillips Petroleum Company.
Geography
Bartlesville is located in the northeastern part of Oklahoma, in Washington County. It is situated in the foothills of the Ozark Mountains and is located on the Caney River. The city has a total area of 24.2 square miles, of which 24.1 square miles is land and 0.1 square miles is water.
The city has a humid subtropical climate, with hot, humid summers and mild winters. The average temperature in the summer is around 86°F and the average temperature in the winter is around 40°F.
Economy
Bartlesville is a major center for the oil and gas industry. The city is home to the Phillips Petroleum Company, which is one of the largest oil and gas companies in the world. The company is a major employer in the city and has helped to fuel its economic growth.
The city is also home to several other major employers, including ConocoPhillips, Arvest Bank, and the Bartlesville Public Schools. The city is also home to several manufacturing companies, including the Bama Companies, which produces food products, and the Bartlesville Foundry, which produces metal products.
Demographics
As of the 2019 census, the population of Bartlesville was estimated to be 36,845. The racial makeup of the city was 79.2% White, 8.2% African American, 0.7% Native American, 1.3% Asian, 0.1% Pacific Islander, and 8.3% from other races. The median household income in the city was $45,945 and the median family income was $54,945.
Conclusion
Bartlesville, Oklahoma is a city located in Washington County, in the northeastern part of the state. It is the county seat of Washington County and is the largest city in the county. The city is located in the foothills of the Ozark Mountains and is situated on the Caney River. The city is a major center for the oil and gas industry and is home to the Phillips Petroleum Company. The population of Bartlesville was estimated to be 36,845 in 2019. The city has a humid subtropical climate, with hot, humid summers and mild winters. The median household income in the city was $45,945 and the median family income was $54,945.
Common Questions
What is Per Capita Income in Bartlesville?
Per Capita income in Bartlesville is $34,131.
What is the Median Family Income in Bartlesville?
Median Family Income in Bartlesville is $77,328.
What is the Median Household income in Bartlesville?
Median Household Income in Bartlesville is $58,230.
What is Income or Wage Gap in Bartlesville?
Income or Wage Gap in Bartlesville is 18.4%.
Women in Bartlesville earn 81.6 cents for every dollar earned by a man.
What is Family Income Deficit in Bartlesville?
Family Income Deficit in Bartlesville is $11,110.
Families that are below poverty line in Bartlesville earn $11,110 less on average than the poverty threshold level.
What is Inequality or Gini Index in Bartlesville?
Inequality or Gini Index in Bartlesville is 0.47.
What is the Total Population of Bartlesville?
Total Population of Bartlesville is 37,314.
What is the Total Male Population of Bartlesville?
Total Male Population of Bartlesville is 18,282.
What is the Total Female Population of Bartlesville?
Total Female Population of Bartlesville is 19,032.
What is the Ratio of Males per 100 Females in Bartlesville?
There are 96.06 Males per 100 Females in Bartlesville.
What is the Ratio of Females per 100 Males in Bartlesville?
There are 104.10 Females per 100 Males in Bartlesville.
What is the Median Population Age in Bartlesville?
Median Population Age in Bartlesville is 37.5 Years.
What is the Average Family Size in Bartlesville
Average Family Size in Bartlesville is 3.1 People.
What is the Average Household Size in Bartlesville
Average Household Size in Bartlesville is 2.5 People.
How Large is the Labor Force in Bartlesville?
There are 17,227 People in the Labor Forcein in Bartlesville.
What is the Percentage of People in the Labor Force in Bartlesville?
58.9% of People are in the Labor Force in Bartlesville.
What is the Unemployment Rate in Bartlesville?
Unemployment Rate in Bartlesville is 4.1%.