Tonkawa, OK Map & Demographics
Tonkawa Map
Tonkawa Overview
$25,977
PER CAPITA INCOME
$66,129
AVG FAMILY INCOME
$55,299
AVG HOUSEHOLD INCOME
20.1%
WAGE / INCOME GAP [ % ]
79.9¢/ $1
WAGE / INCOME GAP [ $ ]
$10,418
FAMILY INCOME DEFICIT
0.38
INEQUALITY / GINI INDEX
3,027
TOTAL POPULATION
1,492
MALE POPULATION
1,535
FEMALE POPULATION
97.20
MALES / 100 FEMALES
102.88
FEMALES / 100 MALES
36.8
MEDIAN AGE
3.2
AVG FAMILY SIZE
2.3
AVG HOUSEHOLD SIZE
1,340
LABOR FORCE [ PEOPLE ]
54.8%
PERCENT IN LABOR FORCE
6.9%
UNEMPLOYMENT RATE
Tonkawa Zip Codes
Tonkawa Area Codes
Income in Tonkawa
Income Overview in Tonkawa
Per Capita Income in Tonkawa is $25,977, while median incomes of families and households are $66,129 and $55,299 respectively.
| Characteristic | Number | Measure |
| Per Capita Income | 3,027 | $25,977 |
| Median Family Income | 660 | $66,129 |
| Mean Family Income | 660 | $75,972 |
| Median Household Income | 1,228 | $55,299 |
| Mean Household Income | 1,228 | $63,277 |
| Income Deficit | 660 | $10,418 |
| Wage / Income Gap (%) | 3,027 | 20.10% |
| Wage / Income Gap ($) | 3,027 | 79.90¢ per $1 |
| Gini / Inequality Index | 3,027 | 0.38 |
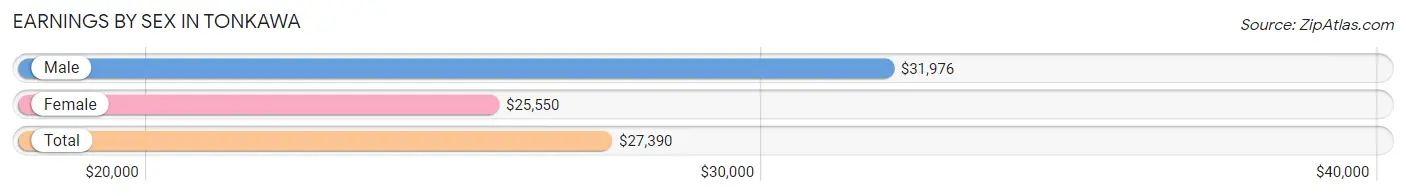
Earnings by Sex in Tonkawa
Average Earnings in Tonkawa are $27,390, $31,976 for men and $25,550 for women, a difference of 20.1%.
| Sex | Number | Average Earnings |
| Male | 823 (52.8%) | $31,976 |
| Female | 735 (47.2%) | $25,550 |
| Total | 1,558 (100.0%) | $27,390 |
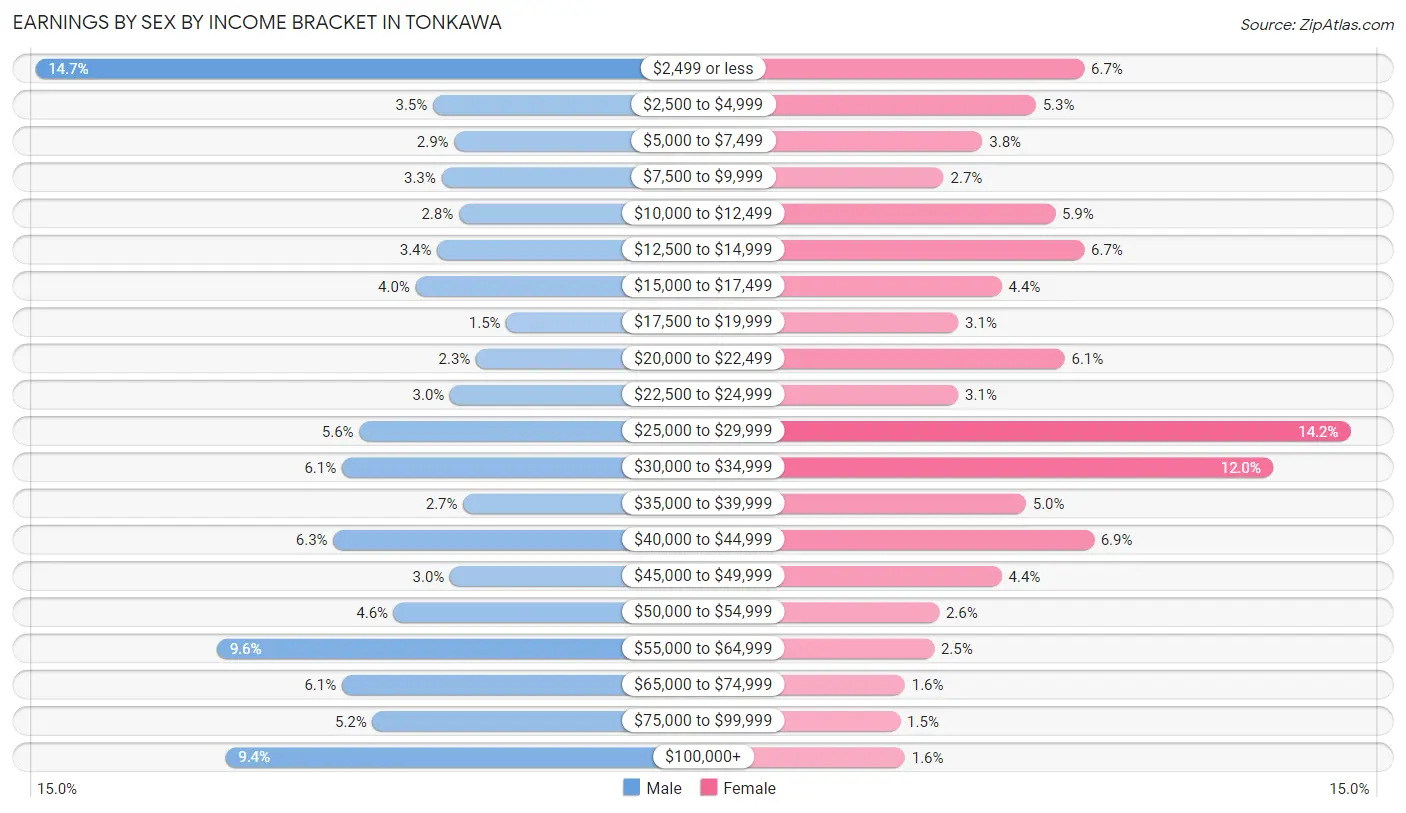
Earnings by Sex by Income Bracket in Tonkawa
The most common earnings brackets in Tonkawa are $2,499 or less for men (121 | 14.7%) and $25,000 to $29,999 for women (104 | 14.1%).
| Income | Male | Female |
| $2,499 or less | 121 (14.7%) | 49 (6.7%) |
| $2,500 to $4,999 | 29 (3.5%) | 39 (5.3%) |
| $5,000 to $7,499 | 24 (2.9%) | 28 (3.8%) |
| $7,500 to $9,999 | 27 (3.3%) | 20 (2.7%) |
| $10,000 to $12,499 | 23 (2.8%) | 43 (5.9%) |
| $12,500 to $14,999 | 28 (3.4%) | 49 (6.7%) |
| $15,000 to $17,499 | 33 (4.0%) | 32 (4.3%) |
| $17,500 to $19,999 | 12 (1.5%) | 23 (3.1%) |
| $20,000 to $22,499 | 19 (2.3%) | 45 (6.1%) |
| $22,500 to $24,999 | 25 (3.0%) | 23 (3.1%) |
| $25,000 to $29,999 | 46 (5.6%) | 104 (14.1%) |
| $30,000 to $34,999 | 50 (6.1%) | 88 (12.0%) |
| $35,000 to $39,999 | 22 (2.7%) | 37 (5.0%) |
| $40,000 to $44,999 | 52 (6.3%) | 51 (6.9%) |
| $45,000 to $49,999 | 25 (3.0%) | 32 (4.3%) |
| $50,000 to $54,999 | 38 (4.6%) | 19 (2.6%) |
| $55,000 to $64,999 | 79 (9.6%) | 18 (2.5%) |
| $65,000 to $74,999 | 50 (6.1%) | 12 (1.6%) |
| $75,000 to $99,999 | 43 (5.2%) | 11 (1.5%) |
| $100,000+ | 77 (9.4%) | 12 (1.6%) |
| Total | 823 (100.0%) | 735 (100.0%) |
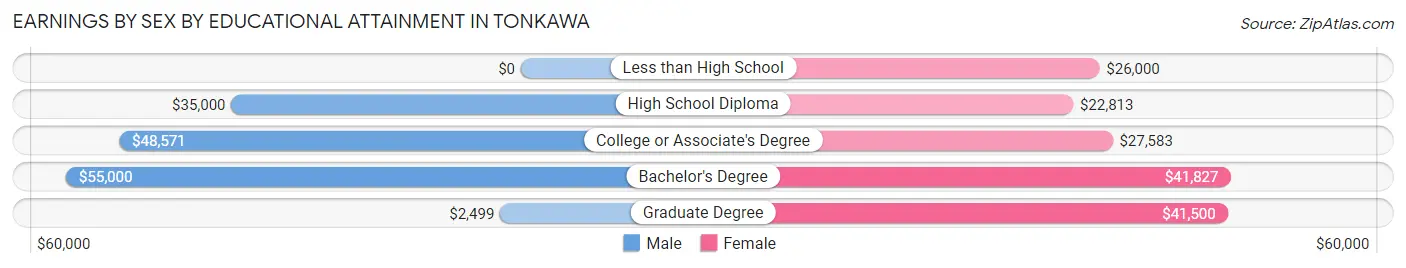
Earnings by Sex by Educational Attainment in Tonkawa
Average earnings in Tonkawa are $40,043 for men and $27,083 for women, a difference of 32.4%. Men with an educational attainment of bachelor's degree enjoy the highest average annual earnings of $55,000, while those with graduate degree education earn the least with $2,499. Women with an educational attainment of bachelor's degree earn the most with the average annual earnings of $41,827, while those with high school diploma education have the smallest earnings of $22,813.
| Educational Attainment | Male Income | Female Income |
| Less than High School | - | - |
| High School Diploma | $35,000 | $22,813 |
| College or Associate's Degree | $48,571 | $27,583 |
| Bachelor's Degree | $55,000 | $41,827 |
| Graduate Degree | $2,499 | $41,500 |
| Total | $40,043 | $27,083 |
Family Income in Tonkawa
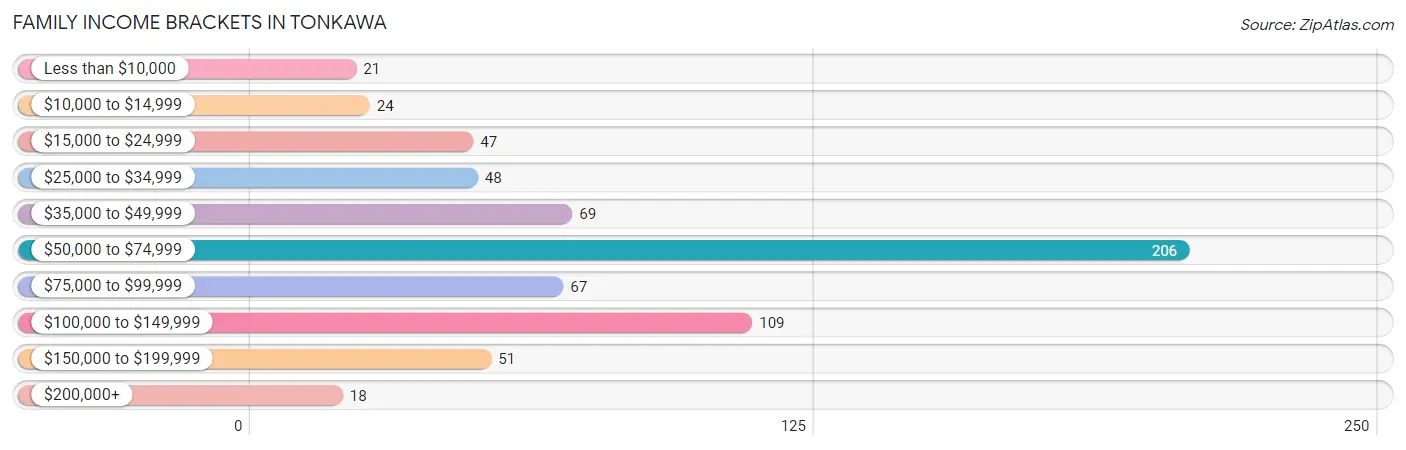
Family Income Brackets in Tonkawa
According to the Tonkawa family income data, there are 206 families falling into the $50,000 to $74,999 income range, which is the most common income bracket and makes up 31.2% of all families. Conversely, the $200,000+ income bracket is the least frequent group with only 18 families (2.7%) belonging to this category.
| Income Bracket | # Families | % Families |
| Less than $10,000 | 21 | 3.2% |
| $10,000 to $14,999 | 24 | 3.6% |
| $15,000 to $24,999 | 47 | 7.1% |
| $25,000 to $34,999 | 48 | 7.3% |
| $35,000 to $49,999 | 69 | 10.5% |
| $50,000 to $74,999 | 206 | 31.2% |
| $75,000 to $99,999 | 67 | 10.2% |
| $100,000 to $149,999 | 109 | 16.5% |
| $150,000 to $199,999 | 51 | 7.7% |
| $200,000+ | 18 | 2.7% |
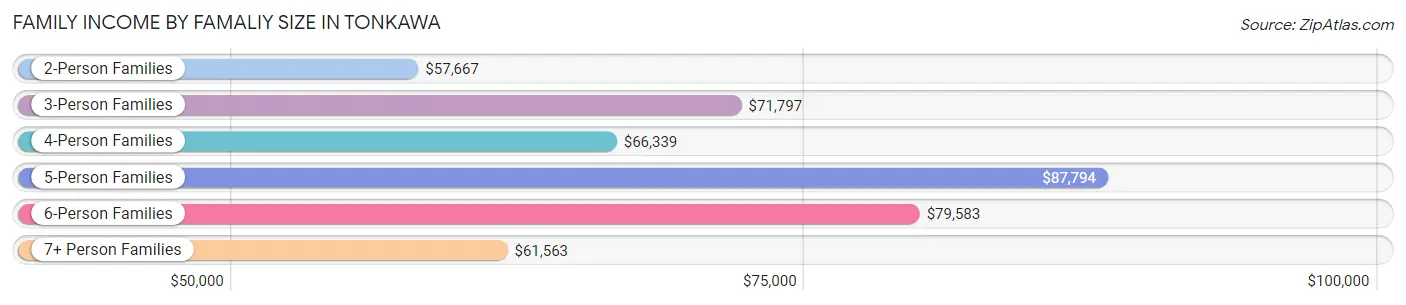
Family Income by Famaliy Size in Tonkawa
5-person families (64 | 9.7%) account for the highest median family income in Tonkawa with $87,794 per family, while 2-person families (308 | 46.7%) have the highest median income of $28,834 per family member.
| Income Bracket | # Families | Median Income |
| 2-Person Families | 308 (46.7%) | $57,667 |
| 3-Person Families | 135 (20.4%) | $71,797 |
| 4-Person Families | 113 (17.1%) | $66,339 |
| 5-Person Families | 64 (9.7%) | $87,794 |
| 6-Person Families | 25 (3.8%) | $79,583 |
| 7+ Person Families | 15 (2.3%) | $61,563 |
| Total | 660 (100.0%) | $66,129 |
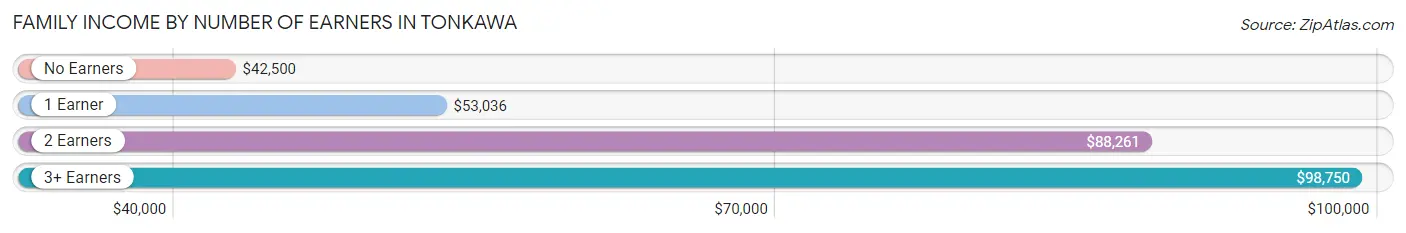
Family Income by Number of Earners in Tonkawa
The median family income in Tonkawa is $66,129, with families comprising 3+ earners (73) having the highest median family income of $98,750, while families with no earners (82) have the lowest median family income of $42,500, accounting for 11.1% and 12.4% of families, respectively.
| Number of Earners | # Families | Median Income |
| No Earners | 82 (12.4%) | $42,500 |
| 1 Earner | 243 (36.8%) | $53,036 |
| 2 Earners | 262 (39.7%) | $88,261 |
| 3+ Earners | 73 (11.1%) | $98,750 |
| Total | 660 (100.0%) | $66,129 |
Household Income in Tonkawa
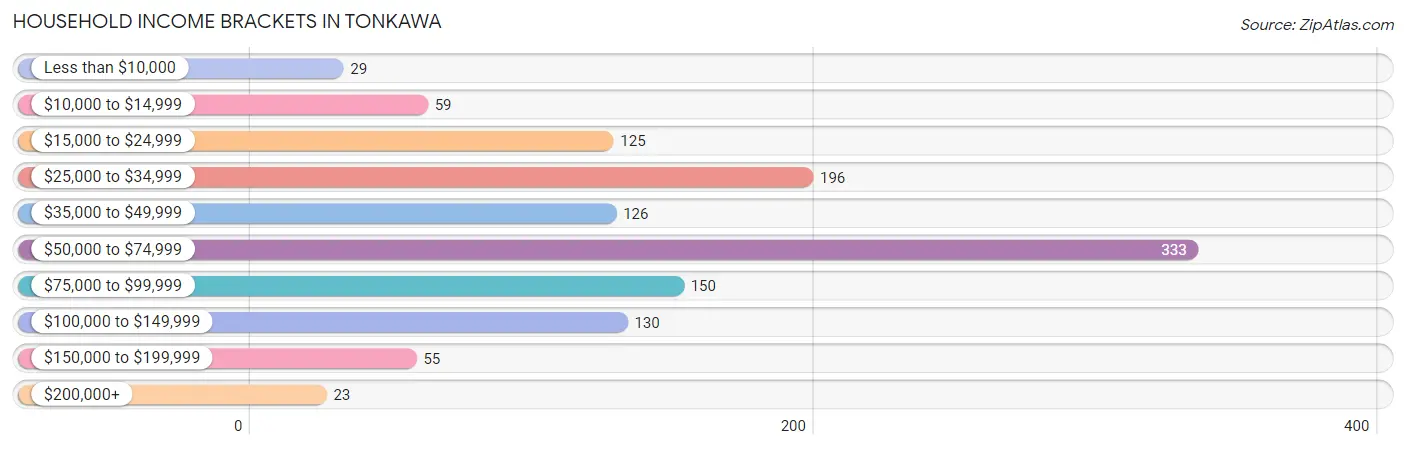
Household Income Brackets in Tonkawa
With 333 households falling in the category, the $50,000 to $74,999 income range is the most frequent in Tonkawa, accounting for 27.1% of all households. In contrast, only 23 households (1.9%) fall into the $200,000+ income bracket, making it the least populous group.
| Income Bracket | # Households | % Households |
| Less than $10,000 | 29 | 2.4% |
| $10,000 to $14,999 | 59 | 4.8% |
| $15,000 to $24,999 | 125 | 10.2% |
| $25,000 to $34,999 | 196 | 16.0% |
| $35,000 to $49,999 | 126 | 10.3% |
| $50,000 to $74,999 | 333 | 27.1% |
| $75,000 to $99,999 | 150 | 12.2% |
| $100,000 to $149,999 | 130 | 10.6% |
| $150,000 to $199,999 | 55 | 4.5% |
| $200,000+ | 23 | 1.9% |
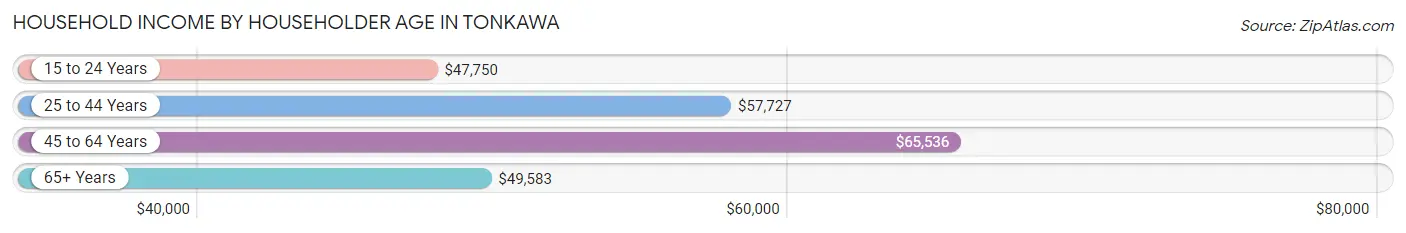
Household Income by Householder Age in Tonkawa
The median household income in Tonkawa is $55,299, with the highest median household income of $65,536 found in the 45 to 64 years age bracket for the primary householder. A total of 408 households (33.2%) fall into this category. Meanwhile, the 15 to 24 years age bracket for the primary householder has the lowest median household income of $47,750, with 83 households (6.8%) in this group.
| Income Bracket | # Households | Median Income |
| 15 to 24 Years | 83 (6.8%) | $47,750 |
| 25 to 44 Years | 312 (25.4%) | $57,727 |
| 45 to 64 Years | 408 (33.2%) | $65,536 |
| 65+ Years | 425 (34.6%) | $49,583 |
| Total | 1,228 (100.0%) | $55,299 |
Poverty in Tonkawa
Income Below Poverty by Sex and Age in Tonkawa
With 15.5% poverty level for males and 14.9% for females among the residents of Tonkawa, under 5 year old males and 15 year old females are the most vulnerable to poverty, with 33 males (39.8%) and 4 females (30.8%) in their respective age groups living below the poverty level.
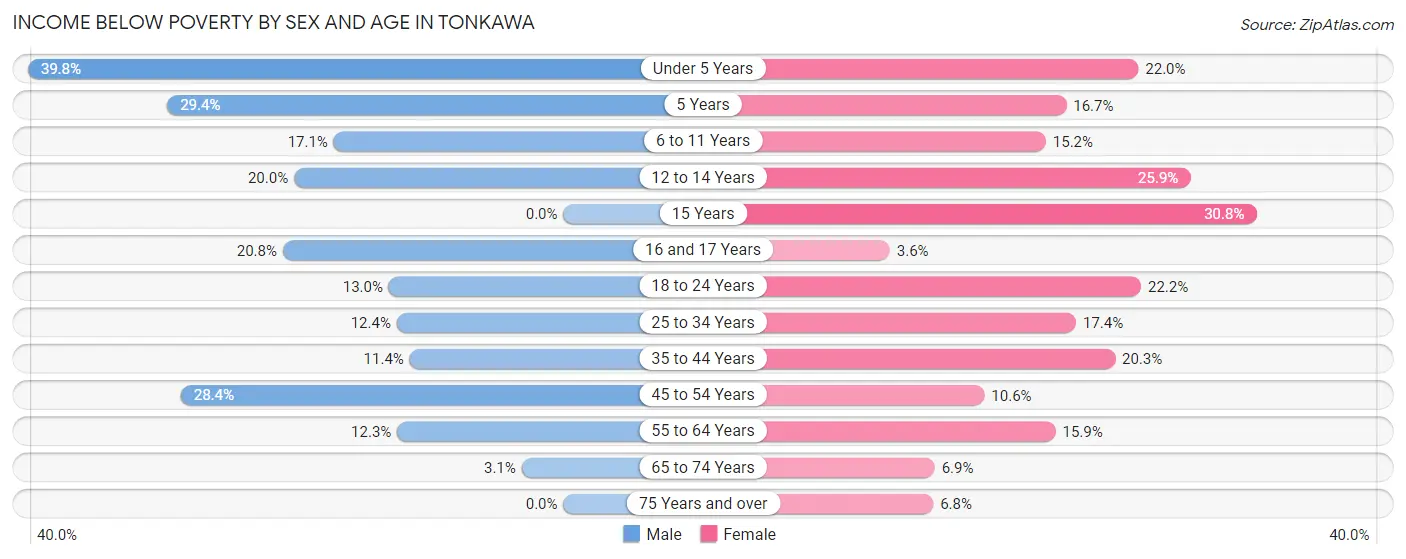
| Age Bracket | Male | Female |
| Under 5 Years | 33 (39.8%) | 24 (22.0%) |
| 5 Years | 5 (29.4%) | 3 (16.7%) |
| 6 to 11 Years | 22 (17.1%) | 15 (15.1%) |
| 12 to 14 Years | 6 (20.0%) | 15 (25.9%) |
| 15 Years | 0 (0.0%) | 4 (30.8%) |
| 16 and 17 Years | 5 (20.8%) | 2 (3.6%) |
| 18 to 24 Years | 21 (13.0%) | 30 (22.2%) |
| 25 to 34 Years | 24 (12.4%) | 32 (17.4%) |
| 35 to 44 Years | 17 (11.4%) | 28 (20.3%) |
| 45 to 54 Years | 48 (28.4%) | 18 (10.6%) |
| 55 to 64 Years | 19 (12.3%) | 30 (15.9%) |
| 65 to 74 Years | 4 (3.1%) | 12 (6.9%) |
| 75 Years and over | 0 (0.0%) | 11 (6.8%) |
| Total | 204 (15.5%) | 224 (14.9%) |
Income Above Poverty by Sex and Age in Tonkawa
According to the poverty statistics in Tonkawa, males aged 15 years and females aged 16 and 17 years are the age groups that are most secure financially, with 100.0% of males and 96.4% of females in these age groups living above the poverty line.
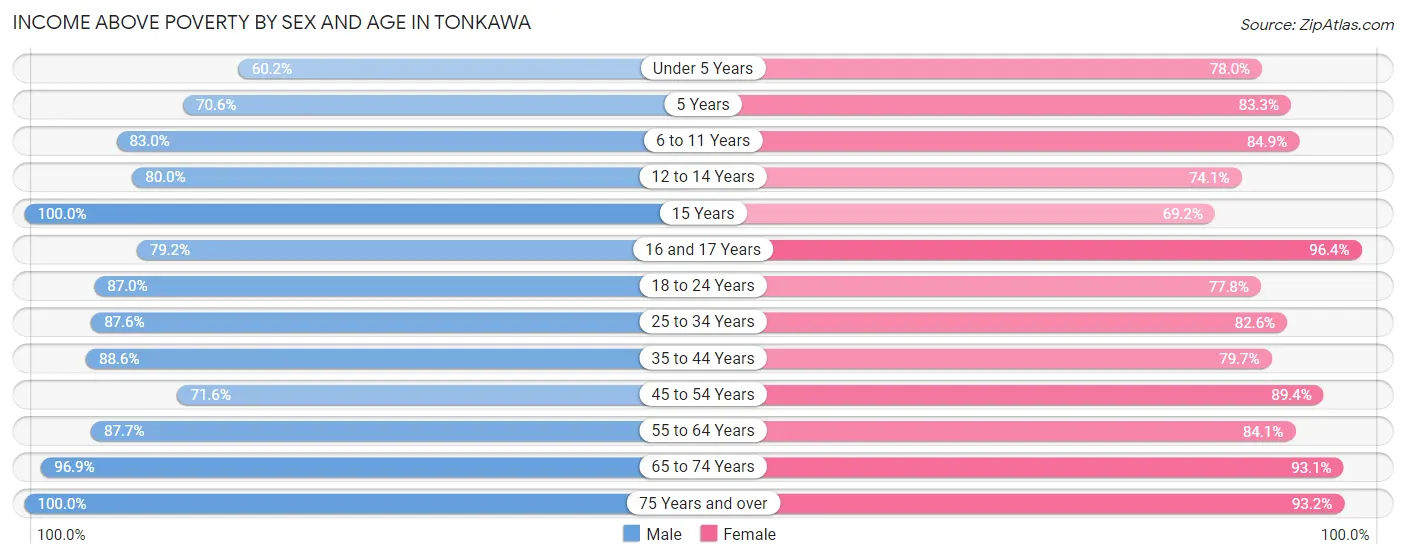
| Age Bracket | Male | Female |
| Under 5 Years | 50 (60.2%) | 85 (78.0%) |
| 5 Years | 12 (70.6%) | 15 (83.3%) |
| 6 to 11 Years | 107 (83.0%) | 84 (84.9%) |
| 12 to 14 Years | 24 (80.0%) | 43 (74.1%) |
| 15 Years | 13 (100.0%) | 9 (69.2%) |
| 16 and 17 Years | 19 (79.2%) | 54 (96.4%) |
| 18 to 24 Years | 141 (87.0%) | 105 (77.8%) |
| 25 to 34 Years | 170 (87.6%) | 152 (82.6%) |
| 35 to 44 Years | 132 (88.6%) | 110 (79.7%) |
| 45 to 54 Years | 121 (71.6%) | 152 (89.4%) |
| 55 to 64 Years | 135 (87.7%) | 159 (84.1%) |
| 65 to 74 Years | 125 (96.9%) | 162 (93.1%) |
| 75 Years and over | 65 (100.0%) | 151 (93.2%) |
| Total | 1,114 (84.5%) | 1,281 (85.1%) |
Income Below Poverty Among Married-Couple Families in Tonkawa
The poverty statistics for married-couple families in Tonkawa show that 7.4% or 37 of the total 498 families live below the poverty line. Families with 3 or 4 children have the highest poverty rate of 14.1%, comprising of 9 families. On the other hand, families with 5 or more children have the lowest poverty rate of 0.0%, which includes 0 families.
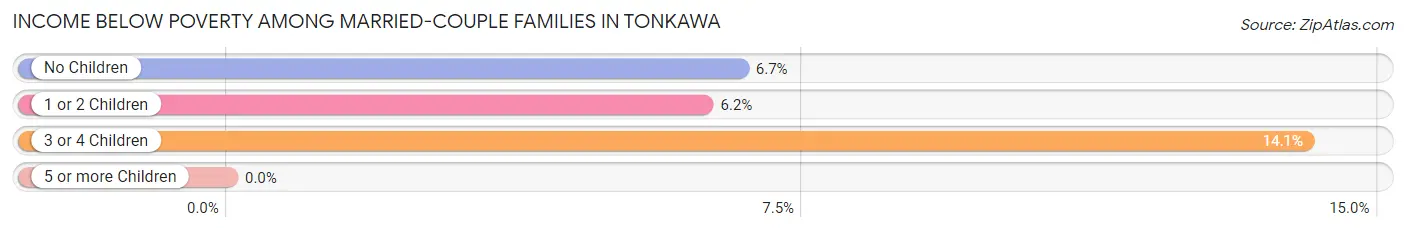
| Children | Above Poverty | Below Poverty |
| No Children | 252 (93.3%) | 18 (6.7%) |
| 1 or 2 Children | 151 (93.8%) | 10 (6.2%) |
| 3 or 4 Children | 55 (85.9%) | 9 (14.1%) |
| 5 or more Children | 3 (100.0%) | 0 (0.0%) |
| Total | 461 (92.6%) | 37 (7.4%) |
Income Below Poverty Among Single-Parent Households in Tonkawa
According to the poverty data in Tonkawa, 14.8% or 8 single-father households and 37.0% or 40 single-mother households are living below the poverty line. Among single-father households, those with 1 or 2 children have the highest poverty rate, with 8 households (22.2%) experiencing poverty. Likewise, among single-mother households, those with 3 or 4 children have the highest poverty rate, with 7 households (41.2%) falling below the poverty line.
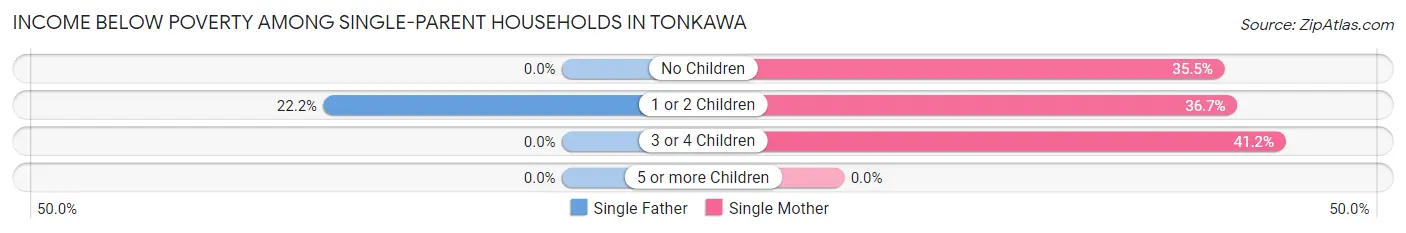
| Children | Single Father | Single Mother |
| No Children | 0 (0.0%) | 11 (35.5%) |
| 1 or 2 Children | 8 (22.2%) | 22 (36.7%) |
| 3 or 4 Children | 0 (0.0%) | 7 (41.2%) |
| 5 or more Children | 0 (0.0%) | 0 (0.0%) |
| Total | 8 (14.8%) | 40 (37.0%) |
Income Below Poverty Among Married-Couple vs Single-Parent Households in Tonkawa
The poverty data for Tonkawa shows that 37 of the married-couple family households (7.4%) and 48 of the single-parent households (29.6%) are living below the poverty level. Within the married-couple family households, those with 3 or 4 children have the highest poverty rate, with 9 households (14.1%) falling below the poverty line. Among the single-parent households, those with 3 or 4 children have the highest poverty rate, with 7 household (38.9%) living below poverty.
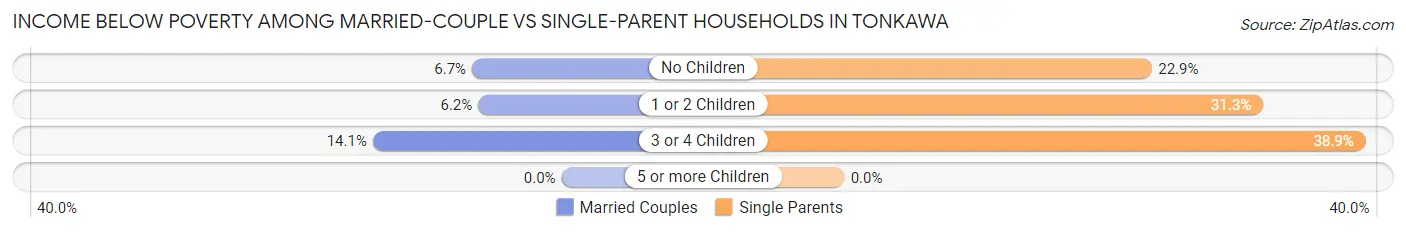
| Children | Married-Couple Families | Single-Parent Households |
| No Children | 18 (6.7%) | 11 (22.9%) |
| 1 or 2 Children | 10 (6.2%) | 30 (31.2%) |
| 3 or 4 Children | 9 (14.1%) | 7 (38.9%) |
| 5 or more Children | 0 (0.0%) | 0 (0.0%) |
| Total | 37 (7.4%) | 48 (29.6%) |
Race in Tonkawa
The most populous races in Tonkawa are White / Caucasian (2,409 | 79.6%), Two or more Races (324 | 10.7%), and Hispanic or Latino (247 | 8.2%).
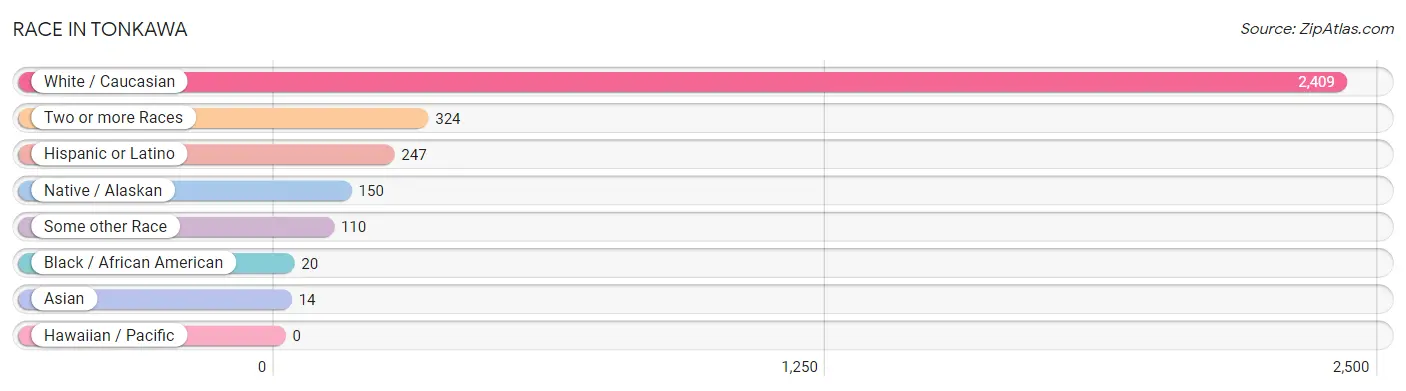
| Race | # Population | % Population |
| Asian | 14 | 0.5% |
| Black / African American | 20 | 0.7% |
| Hawaiian / Pacific | 0 | 0.0% |
| Hispanic or Latino | 247 | 8.2% |
| Native / Alaskan | 150 | 5.0% |
| White / Caucasian | 2,409 | 79.6% |
| Two or more Races | 324 | 10.7% |
| Some other Race | 110 | 3.6% |
| Total | 3,027 | 100.0% |
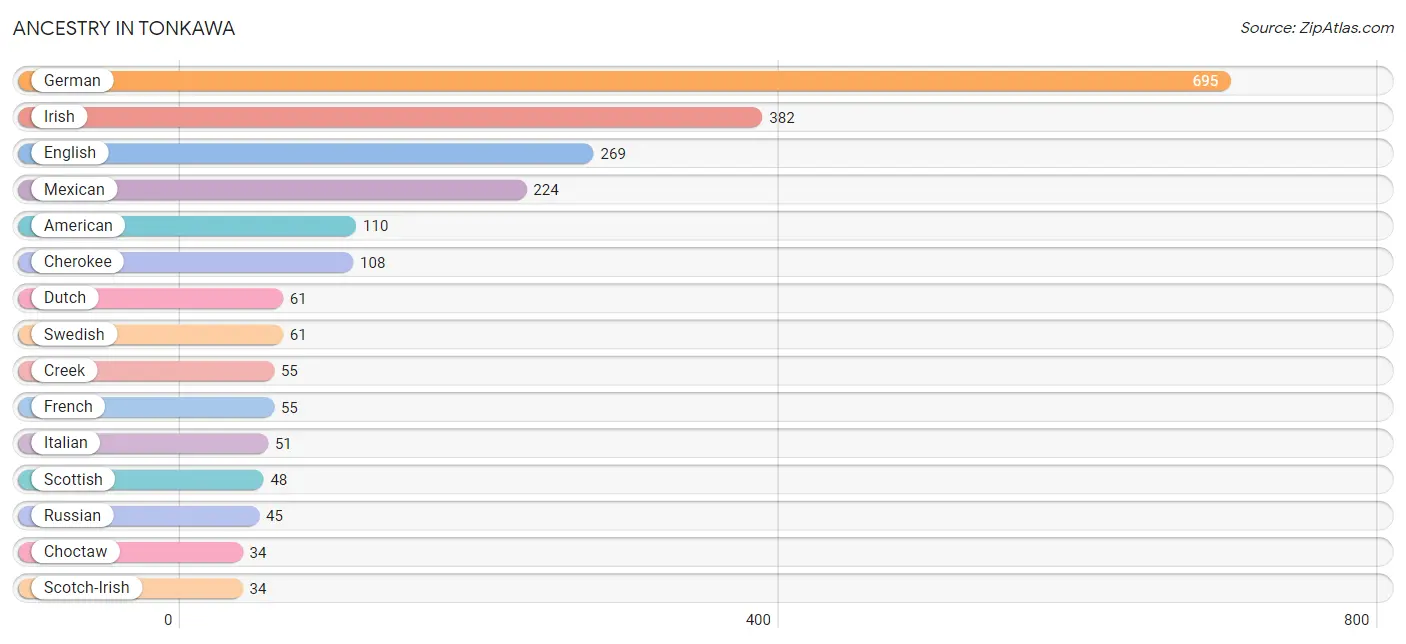
Ancestry in Tonkawa
The most populous ancestries reported in Tonkawa are German (695 | 23.0%), Irish (382 | 12.6%), English (269 | 8.9%), Mexican (224 | 7.4%), and American (110 | 3.6%), together accounting for 55.5% of all Tonkawa residents.
| Ancestry | # Population | % Population |
| Aleut | 3 | 0.1% |
| American | 110 | 3.6% |
| Apache | 4 | 0.1% |
| Australian | 2 | 0.1% |
| Austrian | 3 | 0.1% |
| Bhutanese | 6 | 0.2% |
| Bolivian | 2 | 0.1% |
| British | 22 | 0.7% |
| Burmese | 3 | 0.1% |
| Central American | 1 | 0.0% |
| Central American Indian | 2 | 0.1% |
| Cherokee | 108 | 3.6% |
| Cheyenne | 9 | 0.3% |
| Chickasaw | 3 | 0.1% |
| Choctaw | 34 | 1.1% |
| Creek | 55 | 1.8% |
| Croatian | 2 | 0.1% |
| Cuban | 2 | 0.1% |
| Czech | 17 | 0.6% |
| Czechoslovakian | 2 | 0.1% |
| Danish | 13 | 0.4% |
| Dutch | 61 | 2.0% |
| Dutch West Indian | 11 | 0.4% |
| English | 269 | 8.9% |
| European | 13 | 0.4% |
| Finnish | 3 | 0.1% |
| French | 55 | 1.8% |
| German | 695 | 23.0% |
| Greek | 2 | 0.1% |
| Irish | 382 | 12.6% |
| Italian | 51 | 1.7% |
| Kiowa | 9 | 0.3% |
| Korean | 30 | 1.0% |
| Luxembourger | 7 | 0.2% |
| Mexican | 224 | 7.4% |
| Native Hawaiian | 6 | 0.2% |
| Nicaraguan | 1 | 0.0% |
| Norwegian | 8 | 0.3% |
| Osage | 21 | 0.7% |
| Pakistani | 4 | 0.1% |
| Polish | 13 | 0.4% |
| Potawatomi | 11 | 0.4% |
| Pueblo | 1 | 0.0% |
| Puerto Rican | 2 | 0.1% |
| Russian | 45 | 1.5% |
| Scandinavian | 4 | 0.1% |
| Scotch-Irish | 34 | 1.1% |
| Scottish | 48 | 1.6% |
| Seminole | 18 | 0.6% |
| Sioux | 4 | 0.1% |
| Slovak | 2 | 0.1% |
| South American | 2 | 0.1% |
| Spaniard | 1 | 0.0% |
| Sri Lankan | 3 | 0.1% |
| Swedish | 61 | 2.0% |
| Swiss | 5 | 0.2% |
| Welsh | 22 | 0.7% | View All 57 Rows |
Immigrants in Tonkawa
The most numerous immigrant groups reported in Tonkawa came from Latin America (75 | 2.5%), Central America (73 | 2.4%), Mexico (71 | 2.4%), Asia (14 | 0.5%), and Philippines (11 | 0.4%), together accounting for 8.1% of all Tonkawa residents.
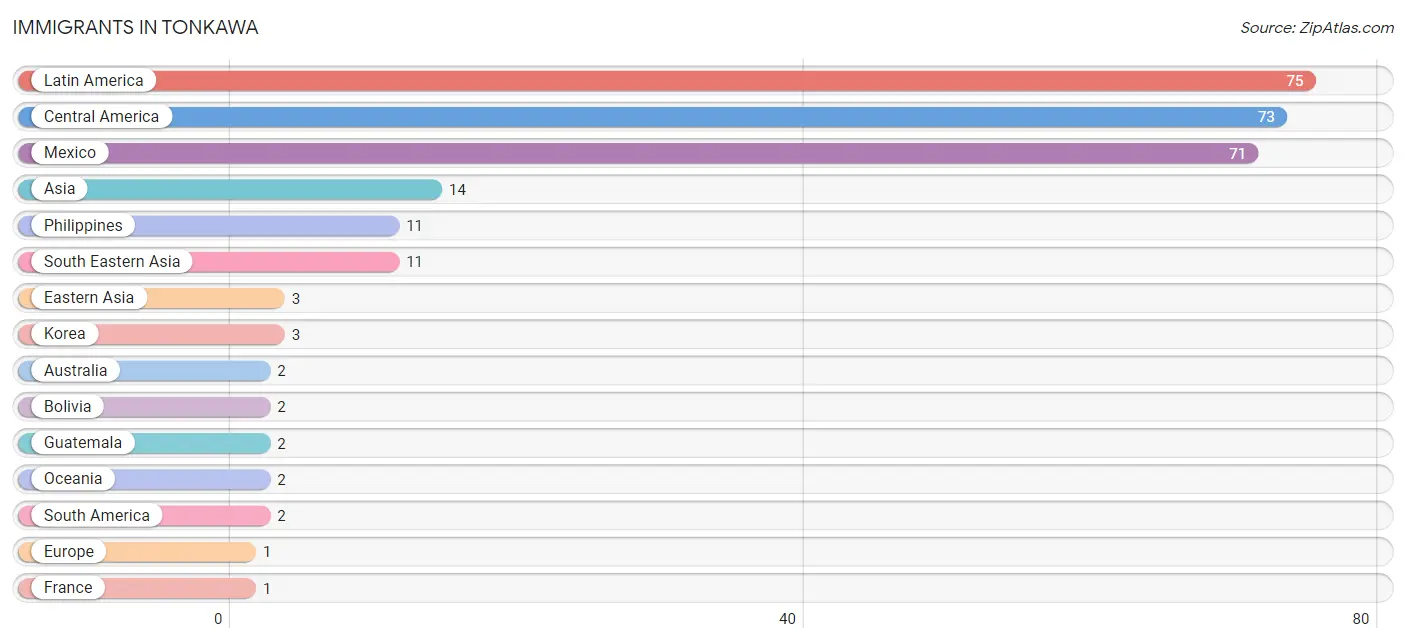
| Immigration Origin | # Population | % Population |
| Asia | 14 | 0.5% |
| Australia | 2 | 0.1% |
| Bolivia | 2 | 0.1% |
| Central America | 73 | 2.4% |
| Eastern Asia | 3 | 0.1% |
| Europe | 1 | 0.0% |
| France | 1 | 0.0% |
| Guatemala | 2 | 0.1% |
| Korea | 3 | 0.1% |
| Latin America | 75 | 2.5% |
| Mexico | 71 | 2.4% |
| Oceania | 2 | 0.1% |
| Philippines | 11 | 0.4% |
| South America | 2 | 0.1% |
| South Eastern Asia | 11 | 0.4% |
| Western Europe | 1 | 0.0% | View All 16 Rows |
Sex and Age in Tonkawa
Sex and Age in Tonkawa
The most populous age groups in Tonkawa are 15 to 19 Years (176 | 11.8%) for men and 15 to 19 Years (128 | 8.3%) for women.
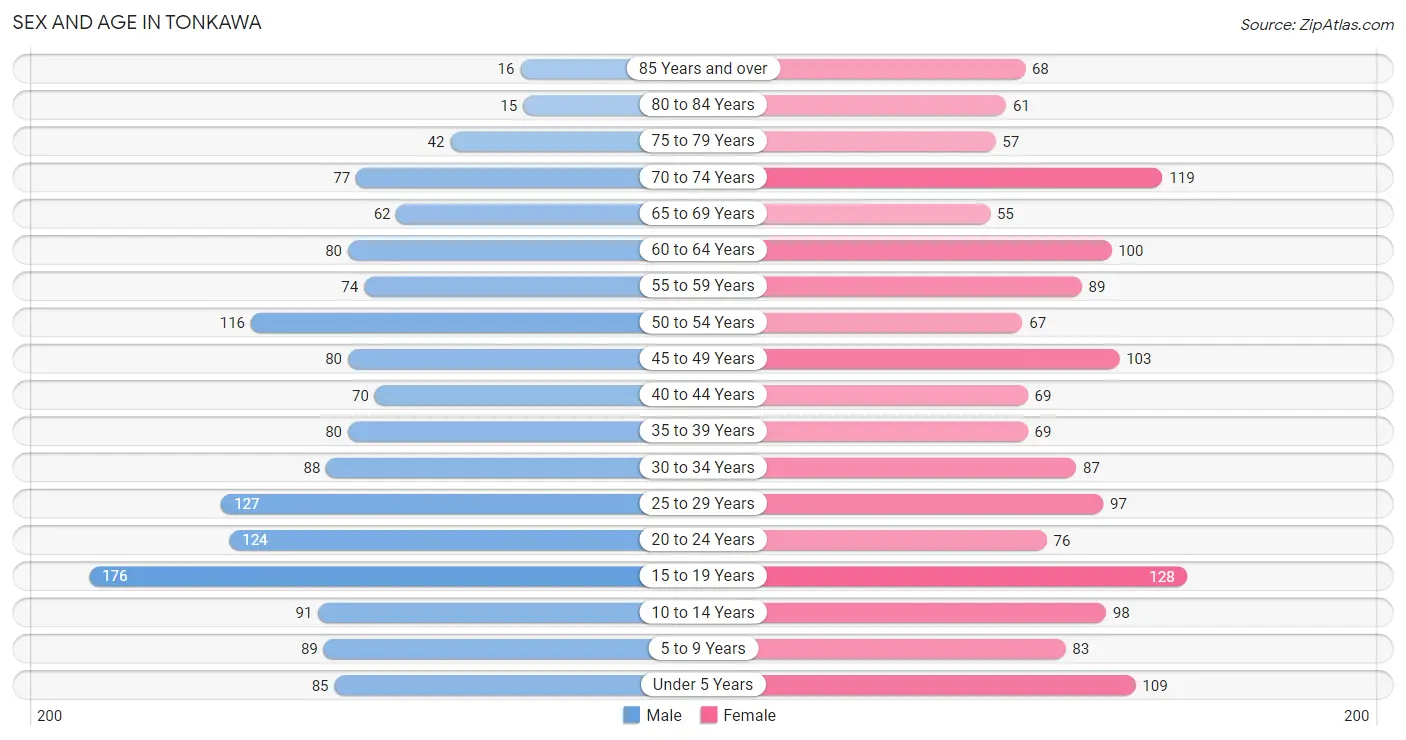
| Age Bracket | Male | Female |
| Under 5 Years | 85 (5.7%) | 109 (7.1%) |
| 5 to 9 Years | 89 (6.0%) | 83 (5.4%) |
| 10 to 14 Years | 91 (6.1%) | 98 (6.4%) |
| 15 to 19 Years | 176 (11.8%) | 128 (8.3%) |
| 20 to 24 Years | 124 (8.3%) | 76 (5.0%) |
| 25 to 29 Years | 127 (8.5%) | 97 (6.3%) |
| 30 to 34 Years | 88 (5.9%) | 87 (5.7%) |
| 35 to 39 Years | 80 (5.4%) | 69 (4.5%) |
| 40 to 44 Years | 70 (4.7%) | 69 (4.5%) |
| 45 to 49 Years | 80 (5.4%) | 103 (6.7%) |
| 50 to 54 Years | 116 (7.8%) | 67 (4.4%) |
| 55 to 59 Years | 74 (5.0%) | 89 (5.8%) |
| 60 to 64 Years | 80 (5.4%) | 100 (6.5%) |
| 65 to 69 Years | 62 (4.2%) | 55 (3.6%) |
| 70 to 74 Years | 77 (5.2%) | 119 (7.7%) |
| 75 to 79 Years | 42 (2.8%) | 57 (3.7%) |
| 80 to 84 Years | 15 (1.0%) | 61 (4.0%) |
| 85 Years and over | 16 (1.1%) | 68 (4.4%) |
| Total | 1,492 (100.0%) | 1,535 (100.0%) |
Families and Households in Tonkawa
Median Family Size in Tonkawa
The median family size in Tonkawa is 3.19 persons per family, with married-couple families (498 | 75.4%) accounting for the largest median family size of 3.29 persons per family. On the other hand, single male/father families (54 | 8.2%) represent the smallest median family size with 2.67 persons per family.
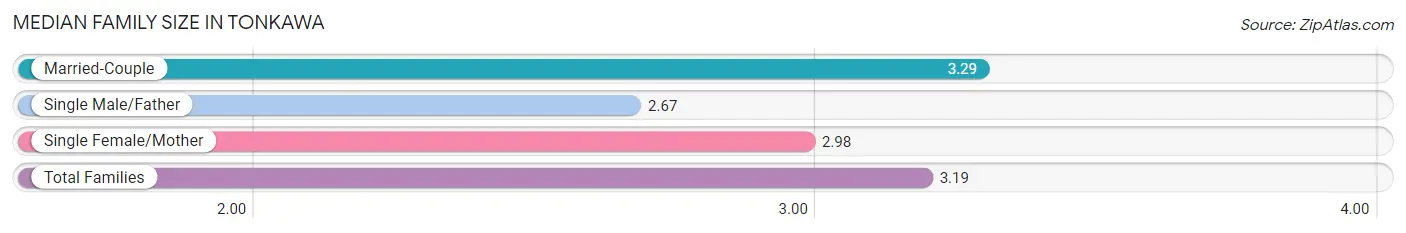
| Family Type | # Families | Family Size |
| Married-Couple | 498 (75.4%) | 3.29 |
| Single Male/Father | 54 (8.2%) | 2.67 |
| Single Female/Mother | 108 (16.4%) | 2.98 |
| Total Families | 660 (100.0%) | 3.19 |
Median Household Size in Tonkawa
The median household size in Tonkawa is 2.31 persons per household, with married-couple households (498 | 40.6%) accounting for the largest median household size of 3.34 persons per household. non-family households (568 | 46.3%) represent the smallest median household size with 1.18 persons per household.
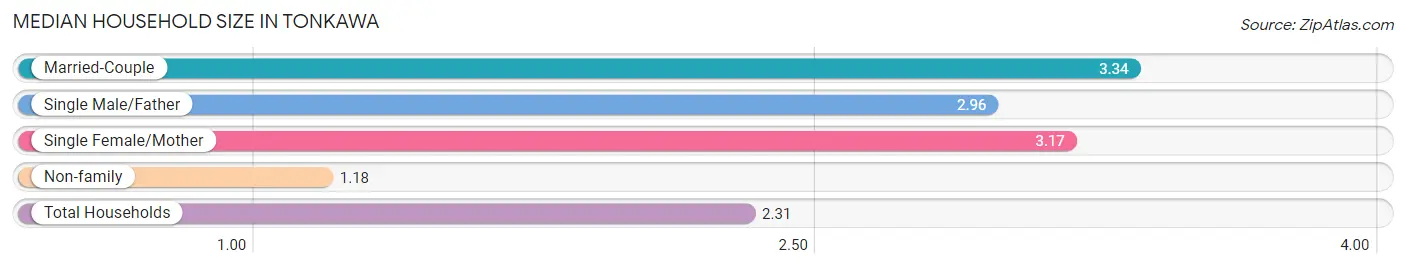
| Household Type | # Households | Household Size |
| Married-Couple | 498 (40.6%) | 3.34 |
| Single Male/Father | 54 (4.4%) | 2.96 |
| Single Female/Mother | 108 (8.8%) | 3.17 |
| Non-family | 568 (46.3%) | 1.18 |
| Total Households | 1,228 (100.0%) | 2.31 |
Household Size by Marriage Status in Tonkawa
Out of a total of 1,228 households in Tonkawa, 660 (53.7%) are family households, while 568 (46.3%) are nonfamily households. The most numerous type of family households are 2-person households, comprising 275, and the most common type of nonfamily households are 1-person households, comprising 494.
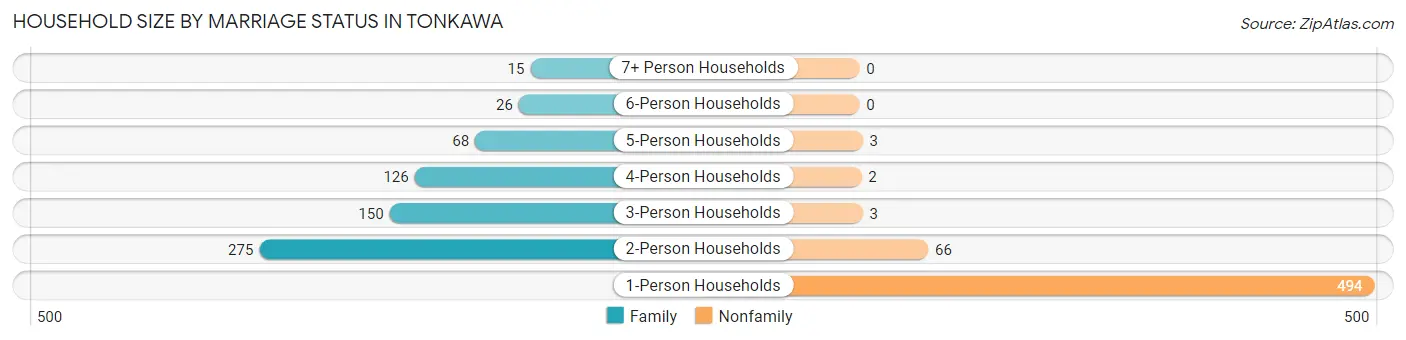
| Household Size | Family Households | Nonfamily Households |
| 1-Person Households | - | 494 (40.2%) |
| 2-Person Households | 275 (22.4%) | 66 (5.4%) |
| 3-Person Households | 150 (12.2%) | 3 (0.2%) |
| 4-Person Households | 126 (10.3%) | 2 (0.2%) |
| 5-Person Households | 68 (5.5%) | 3 (0.2%) |
| 6-Person Households | 26 (2.1%) | 0 (0.0%) |
| 7+ Person Households | 15 (1.2%) | 0 (0.0%) |
| Total | 660 (53.7%) | 568 (46.3%) |
Female Fertility in Tonkawa
Fertility by Age in Tonkawa
Average fertility rate in Tonkawa is 62.0 births per 1,000 women. Women in the age bracket of 20 to 34 years have the highest fertility rate with 135.0 births per 1,000 women. Women in the age bracket of 20 to 34 years acount for 85.4% of all women with births.
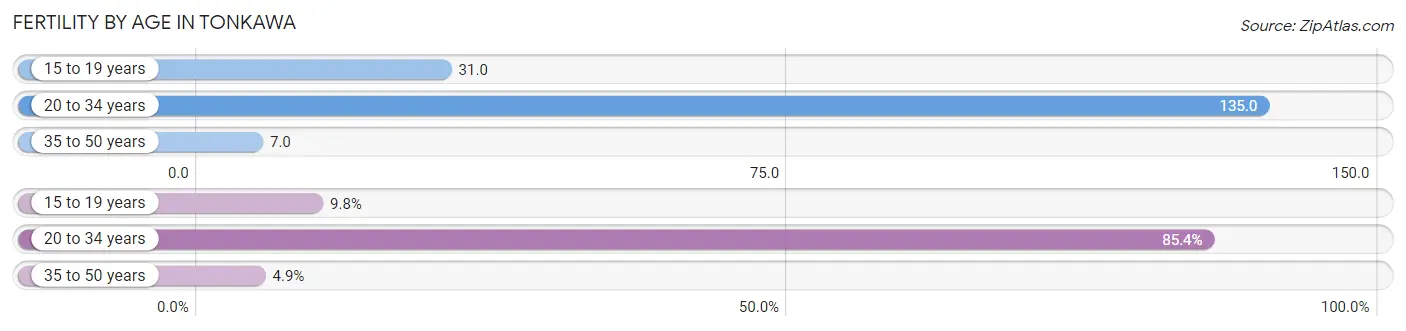
| Age Bracket | Women with Births | Births / 1,000 Women |
| 15 to 19 years | 4 (9.8%) | 31.0 |
| 20 to 34 years | 35 (85.4%) | 135.0 |
| 35 to 50 years | 2 (4.9%) | 7.0 |
| Total | 41 (100.0%) | 62.0 |
Fertility by Age by Marriage Status in Tonkawa
56.1% of women with births (41) in Tonkawa are married. The highest percentage of unmarried women with births falls into 20 to 34 years age bracket with 48.6% of them unmarried at the time of birth, while the lowest percentage of unmarried women with births belong to 35 to 50 years age bracket with 0.0% of them unmarried.
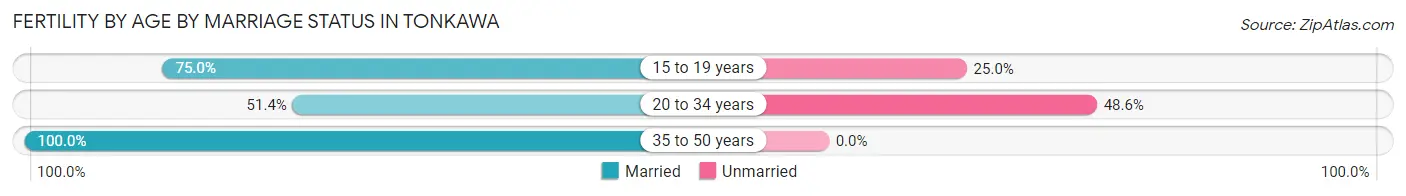
| Age Bracket | Married | Unmarried |
| 15 to 19 years | 3 (75.0%) | 1 (25.0%) |
| 20 to 34 years | 18 (51.4%) | 17 (48.6%) |
| 35 to 50 years | 2 (100.0%) | 0 (0.0%) |
| Total | 23 (56.1%) | 18 (43.9%) |
Fertility by Education in Tonkawa
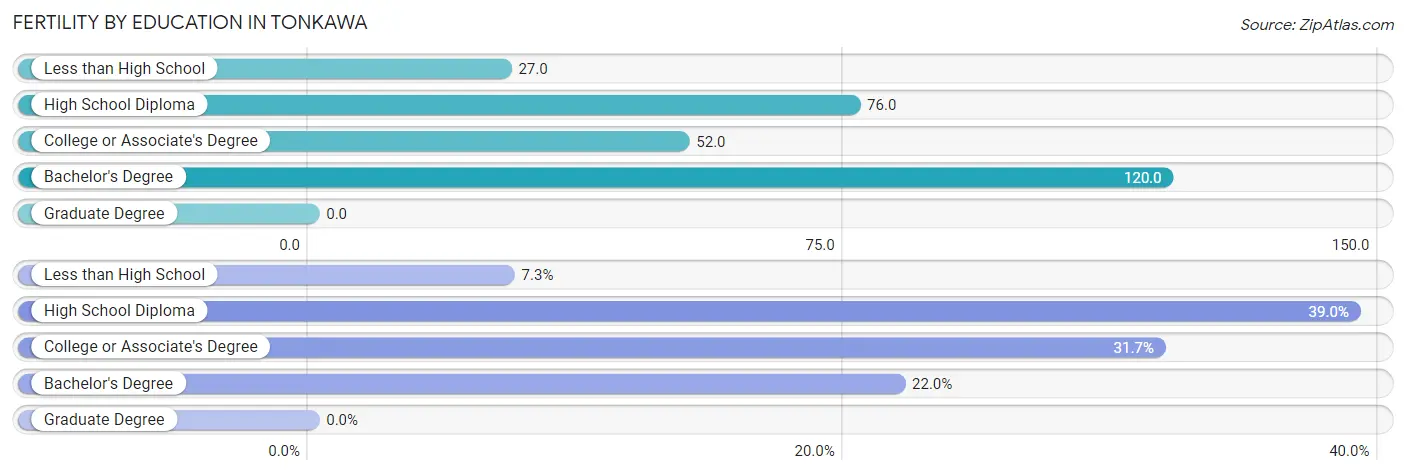
| Educational Attainment | Women with Births | Births / 1,000 Women |
| Less than High School | 3 (7.3%) | 27.0 |
| High School Diploma | 16 (39.0%) | 76.0 |
| College or Associate's Degree | 13 (31.7%) | 52.0 |
| Bachelor's Degree | 9 (22.0%) | 120.0 |
| Graduate Degree | 0 (0.0%) | 0.0 |
| Total | 41 (100.0%) | 62.0 |
Fertility by Education by Marriage Status in Tonkawa
43.9% of women with births in Tonkawa are unmarried. Women with the educational attainment of bachelor's degree are most likely to be married with 100.0% of them married at childbirth, while women with the educational attainment of high school diploma are least likely to be married with 62.5% of them unmarried at childbirth.
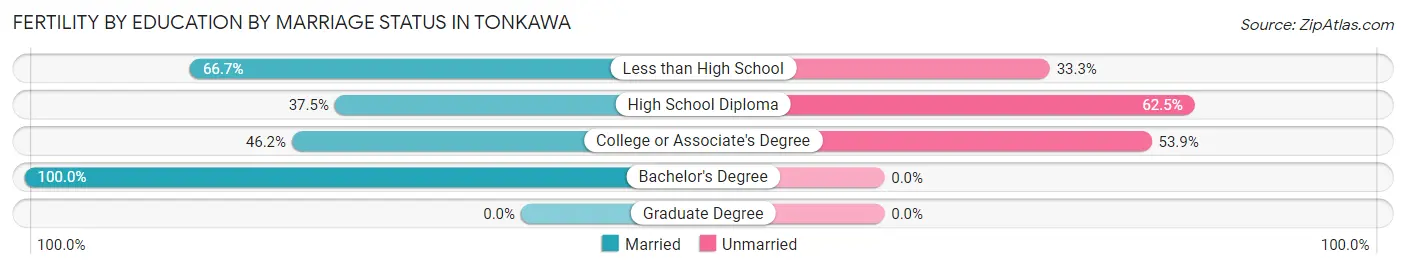
| Educational Attainment | Married | Unmarried |
| Less than High School | 2 (66.7%) | 1 (33.3%) |
| High School Diploma | 6 (37.5%) | 10 (62.5%) |
| College or Associate's Degree | 6 (46.2%) | 7 (53.8%) |
| Bachelor's Degree | 9 (100.0%) | 0 (0.0%) |
| Graduate Degree | 0 (0.0%) | 0 (0.0%) |
| Total | 23 (56.1%) | 18 (43.9%) |
Employment Characteristics in Tonkawa
Employment by Class of Employer in Tonkawa
Among the 1,216 employed individuals in Tonkawa, private company employees (736 | 60.5%), state government employees (161 | 13.2%), and self-employed (not incorporated) (82 | 6.7%) make up the most common classes of employment.
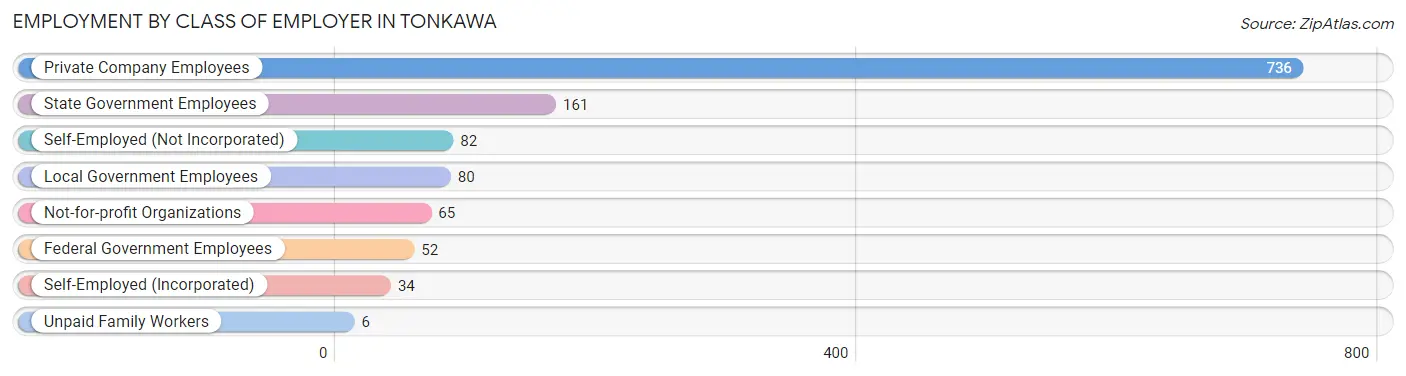
| Employer Class | # Employees | % Employees |
| Private Company Employees | 736 | 60.5% |
| Self-Employed (Incorporated) | 34 | 2.8% |
| Self-Employed (Not Incorporated) | 82 | 6.7% |
| Not-for-profit Organizations | 65 | 5.3% |
| Local Government Employees | 80 | 6.6% |
| State Government Employees | 161 | 13.2% |
| Federal Government Employees | 52 | 4.3% |
| Unpaid Family Workers | 6 | 0.5% |
| Total | 1,216 | 100.0% |
Employment Status by Age in Tonkawa
According to the labor force statistics for Tonkawa, out of the total population over 16 years of age (2,446), 54.8% or 1,340 individuals are in the labor force, with 6.9% or 92 of them unemployed. The age group with the highest labor force participation rate is 20 to 24 years, with 85.0% or 170 individuals in the labor force. Within the labor force, the 25 to 29 years age range has the highest percentage of unemployed individuals, with 14.9% or 27 of them being unemployed.
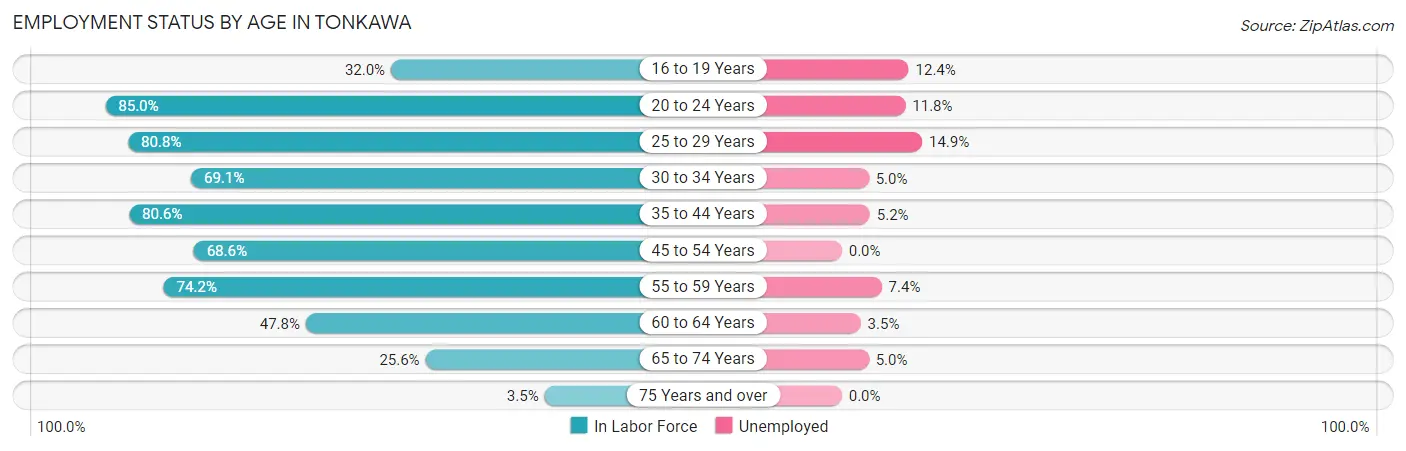
| Age Bracket | In Labor Force | Unemployed |
| 16 to 19 Years | 89 (32.0%) | 11 (12.4%) |
| 20 to 24 Years | 170 (85.0%) | 20 (11.8%) |
| 25 to 29 Years | 181 (80.8%) | 27 (14.9%) |
| 30 to 34 Years | 121 (69.1%) | 6 (5.0%) |
| 35 to 44 Years | 232 (80.6%) | 12 (5.2%) |
| 45 to 54 Years | 251 (68.6%) | 0 (0.0%) |
| 55 to 59 Years | 121 (74.2%) | 9 (7.4%) |
| 60 to 64 Years | 86 (47.8%) | 3 (3.5%) |
| 65 to 74 Years | 80 (25.6%) | 4 (5.0%) |
| 75 Years and over | 9 (3.5%) | 0 (0.0%) |
| Total | 1,340 (54.8%) | 92 (6.9%) |
Employment Status by Educational Attainment in Tonkawa
According to labor force statistics for Tonkawa, 71.1% of individuals (993) out of the total population between 25 and 64 years of age (1,396) are in the labor force, with 5.7% or 57 of them being unemployed. The group with the highest labor force participation rate are those with the educational attainment of bachelor's degree or higher, with 89.9% or 222 individuals in the labor force. Within the labor force, individuals with less than high school education have the highest percentage of unemployment, with 15.9% or 11 of them being unemployed.
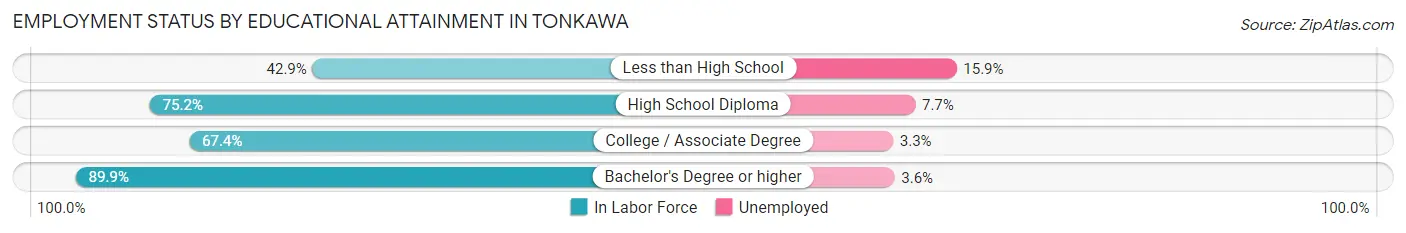
| Educational Attainment | In Labor Force | Unemployed |
| Less than High School | 69 (42.9%) | 26 (15.9%) |
| High School Diploma | 339 (75.2%) | 35 (7.7%) |
| College / Associate Degree | 362 (67.4%) | 18 (3.3%) |
| Bachelor's Degree or higher | 222 (89.9%) | 9 (3.6%) |
| Total | 993 (71.1%) | 80 (5.7%) |
Employment Occupations by Sex in Tonkawa
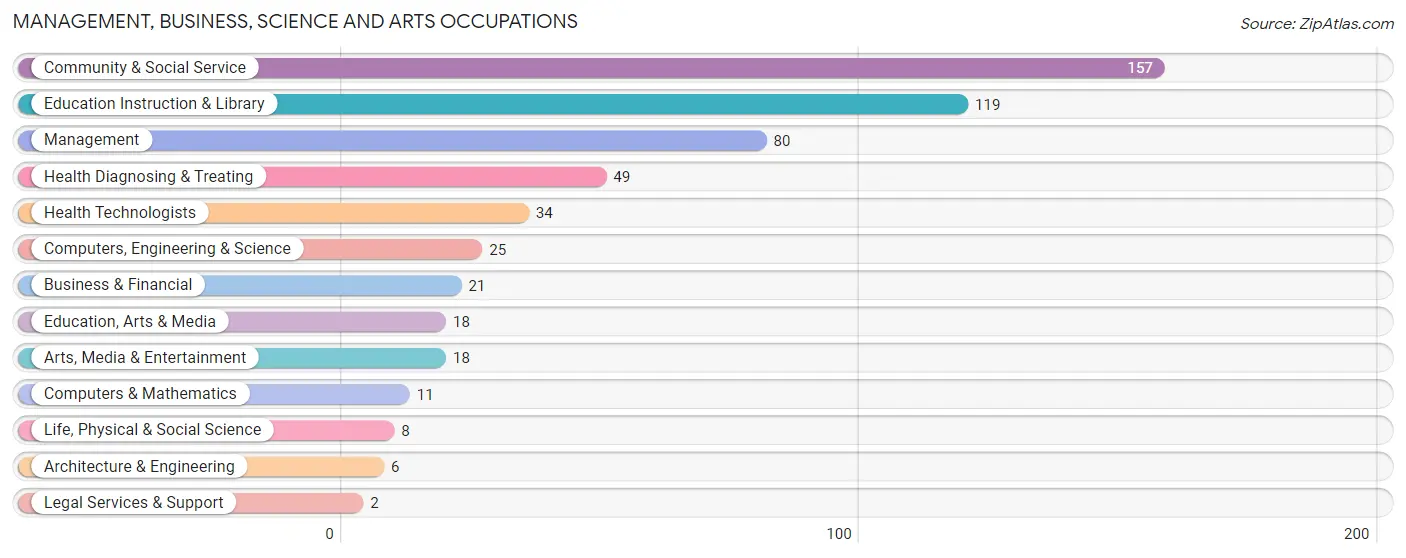
Management, Business, Science and Arts Occupations
The most common Management, Business, Science and Arts occupations in Tonkawa are Community & Social Service (157 | 12.6%), Education Instruction & Library (119 | 9.5%), Management (80 | 6.4%), Health Diagnosing & Treating (49 | 3.9%), and Health Technologists (34 | 2.7%).
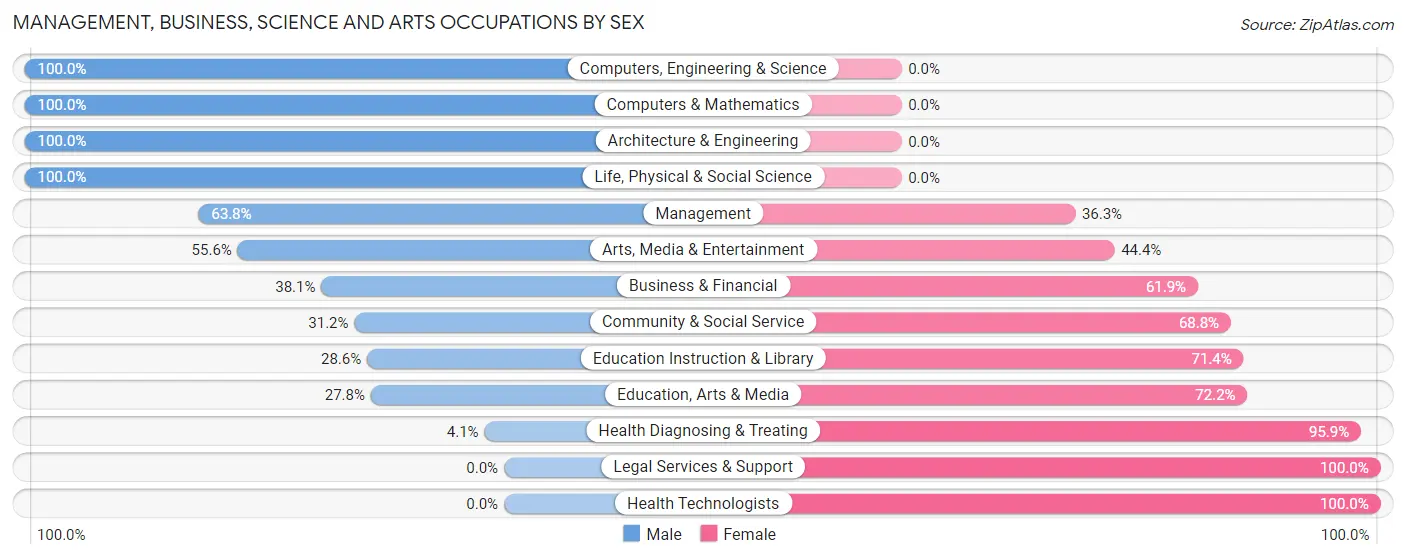
Management, Business, Science and Arts Occupations by Sex
Within the Management, Business, Science and Arts occupations in Tonkawa, the most male-oriented occupations are Computers, Engineering & Science (100.0%), Computers & Mathematics (100.0%), and Architecture & Engineering (100.0%), while the most female-oriented occupations are Legal Services & Support (100.0%), Health Technologists (100.0%), and Health Diagnosing & Treating (95.9%).
| Occupation | Male | Female |
| Management | 51 (63.7%) | 29 (36.2%) |
| Business & Financial | 8 (38.1%) | 13 (61.9%) |
| Computers, Engineering & Science | 25 (100.0%) | 0 (0.0%) |
| Computers & Mathematics | 11 (100.0%) | 0 (0.0%) |
| Architecture & Engineering | 6 (100.0%) | 0 (0.0%) |
| Life, Physical & Social Science | 8 (100.0%) | 0 (0.0%) |
| Community & Social Service | 49 (31.2%) | 108 (68.8%) |
| Education, Arts & Media | 5 (27.8%) | 13 (72.2%) |
| Legal Services & Support | 0 (0.0%) | 2 (100.0%) |
| Education Instruction & Library | 34 (28.6%) | 85 (71.4%) |
| Arts, Media & Entertainment | 10 (55.6%) | 8 (44.4%) |
| Health Diagnosing & Treating | 2 (4.1%) | 47 (95.9%) |
| Health Technologists | 0 (0.0%) | 34 (100.0%) |
| Total (Category) | 135 (40.7%) | 197 (59.3%) |
| Total (Overall) | 616 (49.4%) | 632 (50.6%) |
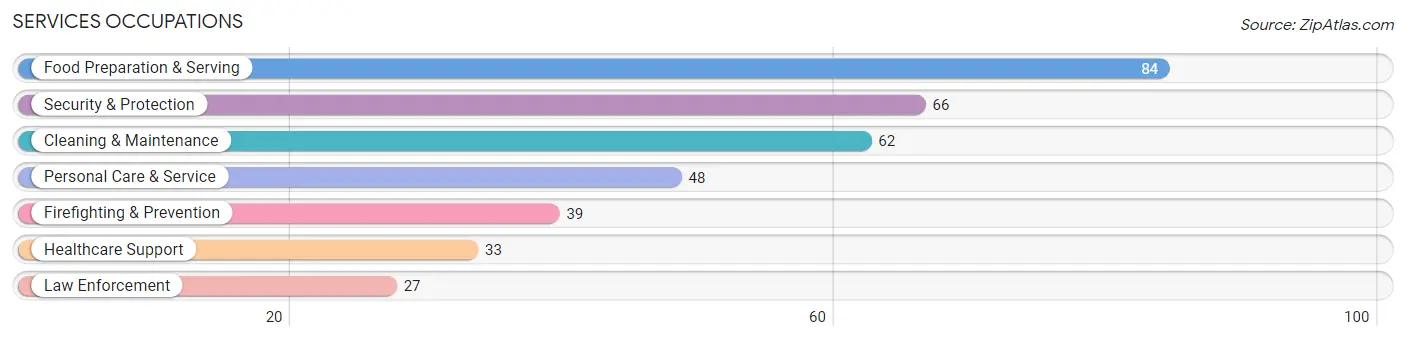
Services Occupations
The most common Services occupations in Tonkawa are Food Preparation & Serving (84 | 6.7%), Security & Protection (66 | 5.3%), Cleaning & Maintenance (62 | 5.0%), Personal Care & Service (48 | 3.8%), and Firefighting & Prevention (39 | 3.1%).
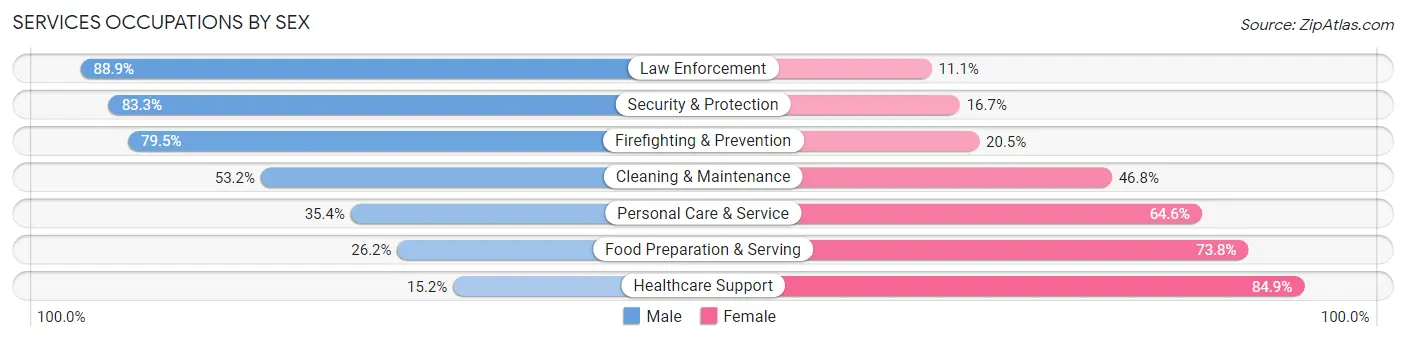
Services Occupations by Sex
Within the Services occupations in Tonkawa, the most male-oriented occupations are Law Enforcement (88.9%), Security & Protection (83.3%), and Firefighting & Prevention (79.5%), while the most female-oriented occupations are Healthcare Support (84.9%), Food Preparation & Serving (73.8%), and Personal Care & Service (64.6%).
| Occupation | Male | Female |
| Healthcare Support | 5 (15.1%) | 28 (84.9%) |
| Security & Protection | 55 (83.3%) | 11 (16.7%) |
| Firefighting & Prevention | 31 (79.5%) | 8 (20.5%) |
| Law Enforcement | 24 (88.9%) | 3 (11.1%) |
| Food Preparation & Serving | 22 (26.2%) | 62 (73.8%) |
| Cleaning & Maintenance | 33 (53.2%) | 29 (46.8%) |
| Personal Care & Service | 17 (35.4%) | 31 (64.6%) |
| Total (Category) | 132 (45.1%) | 161 (54.9%) |
| Total (Overall) | 616 (49.4%) | 632 (50.6%) |
Sales and Office Occupations
The most common Sales and Office occupations in Tonkawa are Office & Administration (133 | 10.7%), and Sales & Related (124 | 9.9%).
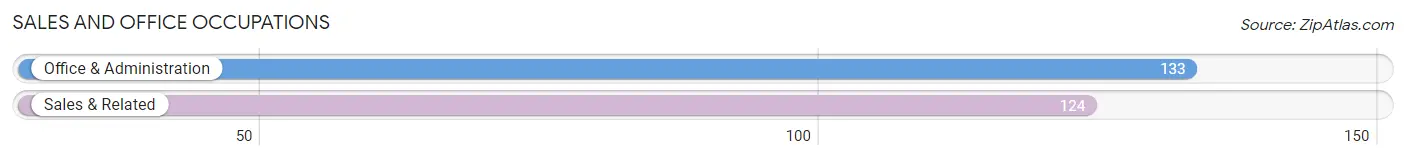
Sales and Office Occupations by Sex
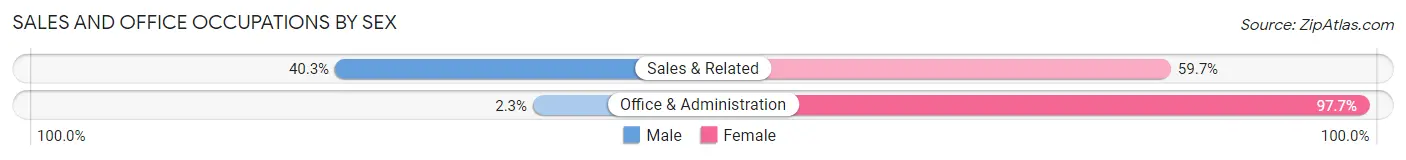
| Occupation | Male | Female |
| Sales & Related | 50 (40.3%) | 74 (59.7%) |
| Office & Administration | 3 (2.3%) | 130 (97.7%) |
| Total (Category) | 53 (20.6%) | 204 (79.4%) |
| Total (Overall) | 616 (49.4%) | 632 (50.6%) |
Natural Resources, Construction and Maintenance Occupations
The most common Natural Resources, Construction and Maintenance occupations in Tonkawa are Construction & Extraction (71 | 5.7%), Installation, Maintenance & Repair (66 | 5.3%), and Farming, Fishing & Forestry (19 | 1.5%).
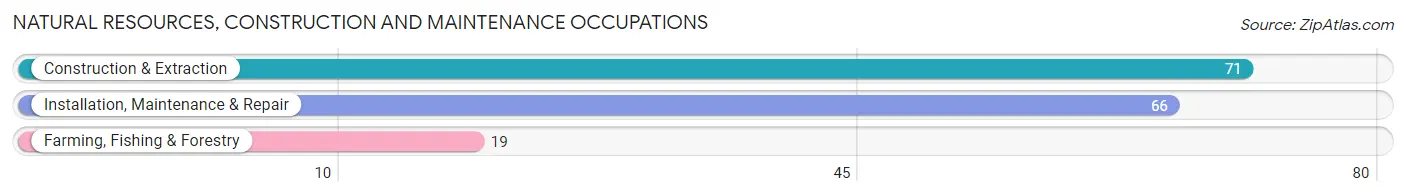
Natural Resources, Construction and Maintenance Occupations by Sex
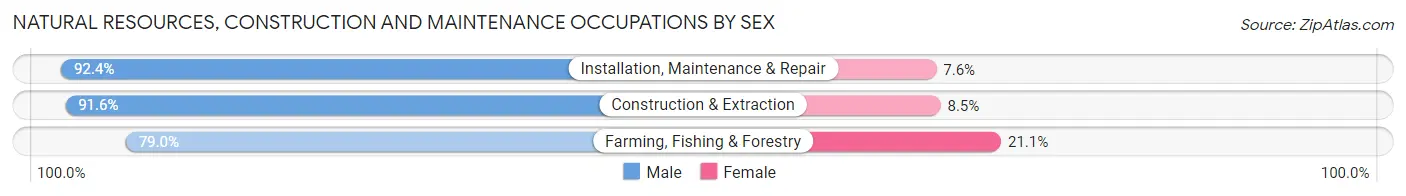
| Occupation | Male | Female |
| Farming, Fishing & Forestry | 15 (78.9%) | 4 (21.0%) |
| Construction & Extraction | 65 (91.5%) | 6 (8.5%) |
| Installation, Maintenance & Repair | 61 (92.4%) | 5 (7.6%) |
| Total (Category) | 141 (90.4%) | 15 (9.6%) |
| Total (Overall) | 616 (49.4%) | 632 (50.6%) |
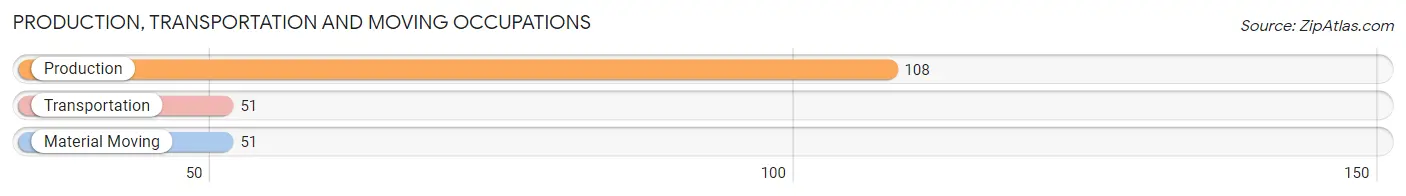
Production, Transportation and Moving Occupations
The most common Production, Transportation and Moving occupations in Tonkawa are Production (108 | 8.6%), Transportation (51 | 4.1%), and Material Moving (51 | 4.1%).
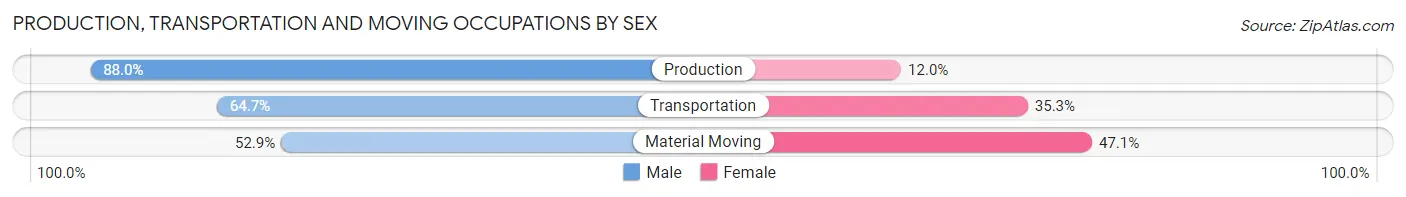
Production, Transportation and Moving Occupations by Sex
| Occupation | Male | Female |
| Production | 95 (88.0%) | 13 (12.0%) |
| Transportation | 33 (64.7%) | 18 (35.3%) |
| Material Moving | 27 (52.9%) | 24 (47.1%) |
| Total (Category) | 155 (73.8%) | 55 (26.2%) |
| Total (Overall) | 616 (49.4%) | 632 (50.6%) |
Employment Industries by Sex in Tonkawa
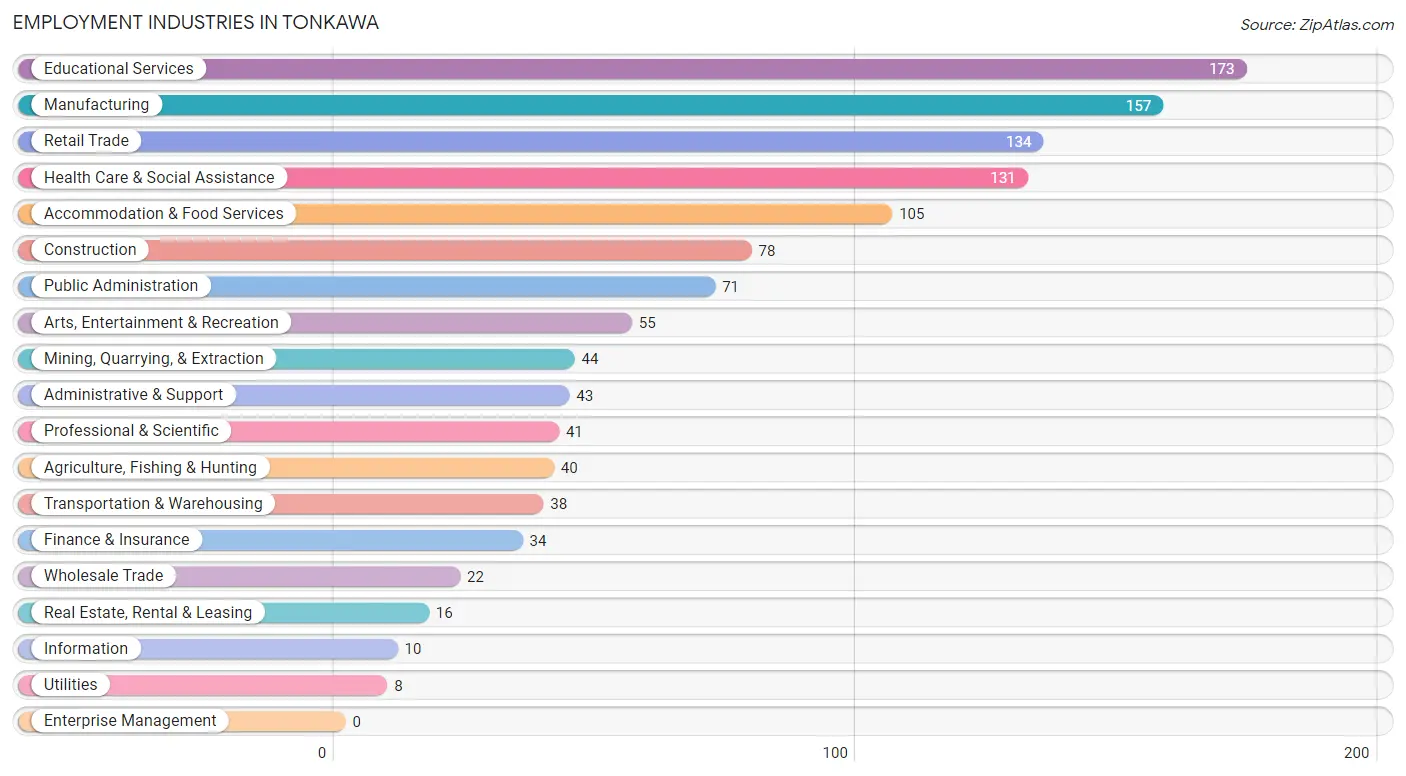
Employment Industries in Tonkawa
The major employment industries in Tonkawa include Educational Services (173 | 13.9%), Manufacturing (157 | 12.6%), Retail Trade (134 | 10.7%), Health Care & Social Assistance (131 | 10.5%), and Accommodation & Food Services (105 | 8.4%).
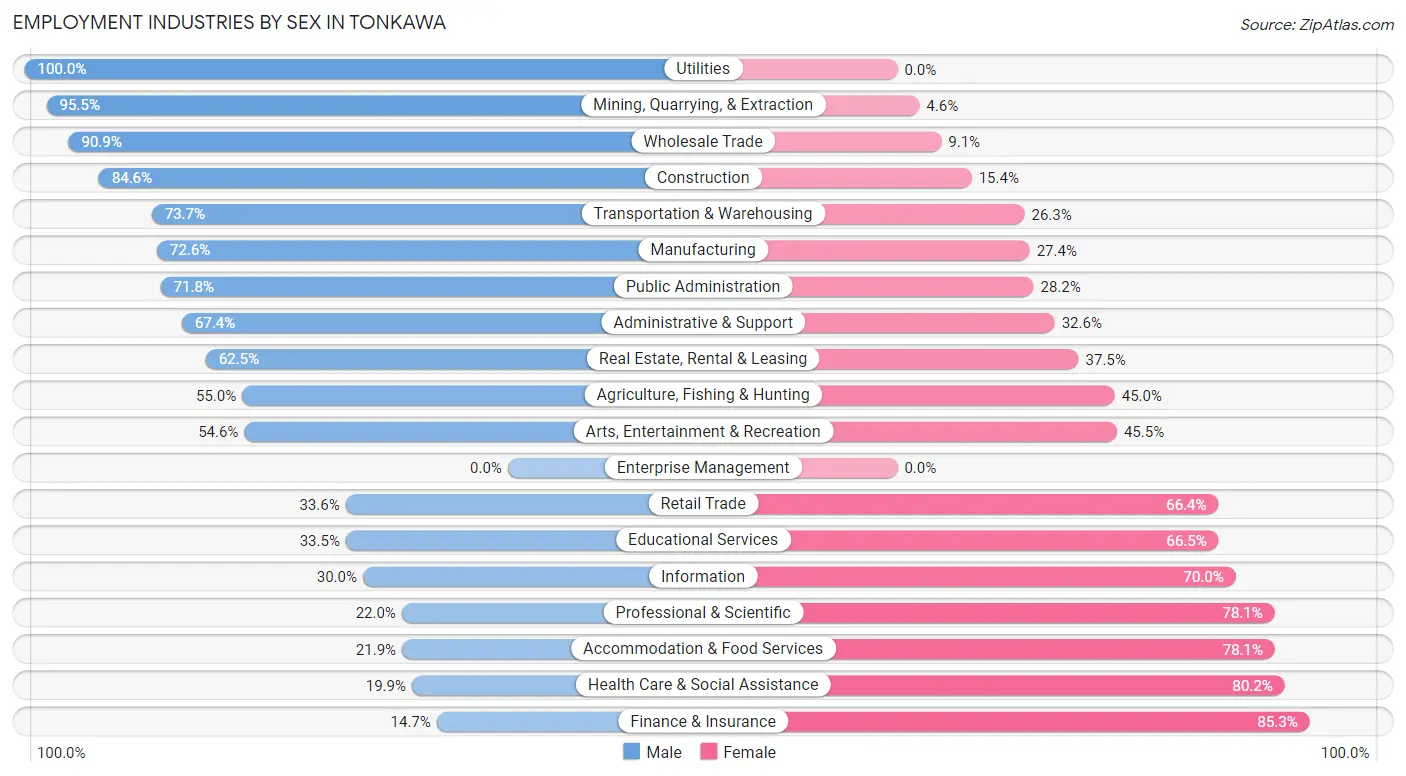
Employment Industries by Sex in Tonkawa
The Tonkawa industries that see more men than women are Utilities (100.0%), Mining, Quarrying, & Extraction (95.5%), and Wholesale Trade (90.9%), whereas the industries that tend to have a higher number of women are Finance & Insurance (85.3%), Health Care & Social Assistance (80.1%), and Accommodation & Food Services (78.1%).
| Industry | Male | Female |
| Agriculture, Fishing & Hunting | 22 (55.0%) | 18 (45.0%) |
| Mining, Quarrying, & Extraction | 42 (95.5%) | 2 (4.5%) |
| Construction | 66 (84.6%) | 12 (15.4%) |
| Manufacturing | 114 (72.6%) | 43 (27.4%) |
| Wholesale Trade | 20 (90.9%) | 2 (9.1%) |
| Retail Trade | 45 (33.6%) | 89 (66.4%) |
| Transportation & Warehousing | 28 (73.7%) | 10 (26.3%) |
| Utilities | 8 (100.0%) | 0 (0.0%) |
| Information | 3 (30.0%) | 7 (70.0%) |
| Finance & Insurance | 5 (14.7%) | 29 (85.3%) |
| Real Estate, Rental & Leasing | 10 (62.5%) | 6 (37.5%) |
| Professional & Scientific | 9 (22.0%) | 32 (78.0%) |
| Enterprise Management | 0 (0.0%) | 0 (0.0%) |
| Administrative & Support | 29 (67.4%) | 14 (32.6%) |
| Educational Services | 58 (33.5%) | 115 (66.5%) |
| Health Care & Social Assistance | 26 (19.9%) | 105 (80.1%) |
| Arts, Entertainment & Recreation | 30 (54.5%) | 25 (45.5%) |
| Accommodation & Food Services | 23 (21.9%) | 82 (78.1%) |
| Public Administration | 51 (71.8%) | 20 (28.2%) |
| Total | 616 (49.4%) | 632 (50.6%) |
Education in Tonkawa
School Enrollment in Tonkawa
The most common levels of schooling among the 748 students in Tonkawa are college / undergraduate (200 | 26.7%), high school (162 | 21.7%), and elementary school (145 | 19.4%).
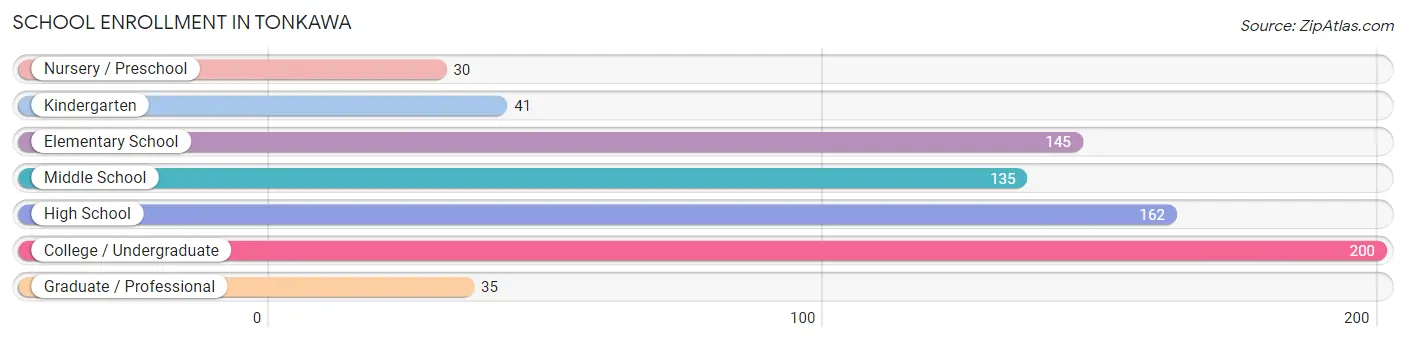
| School Level | # Students | % Students |
| Nursery / Preschool | 30 | 4.0% |
| Kindergarten | 41 | 5.5% |
| Elementary School | 145 | 19.4% |
| Middle School | 135 | 18.0% |
| High School | 162 | 21.7% |
| College / Undergraduate | 200 | 26.7% |
| Graduate / Professional | 35 | 4.7% |
| Total | 748 | 100.0% |
School Enrollment by Age by Funding Source in Tonkawa
Out of a total of 748 students who are enrolled in schools in Tonkawa, 39 (5.2%) attend a private institution, while the remaining 709 (94.8%) are enrolled in public schools. The age group of 35 years and over has the highest likelihood of being enrolled in private schools, with 10 (26.3% in the age bracket) enrolled. Conversely, the age group of 10 to 14 year olds has the lowest likelihood of being enrolled in a private school, with 176 (97.8% in the age bracket) attending a public institution.
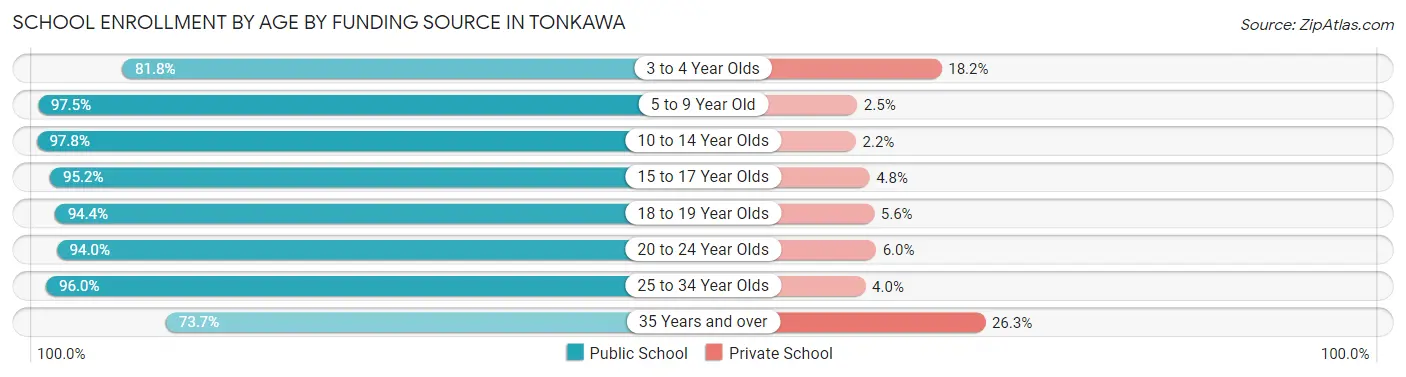
| Age Bracket | Public School | Private School |
| 3 to 4 Year Olds | 9 (81.8%) | 2 (18.2%) |
| 5 to 9 Year Old | 158 (97.5%) | 4 (2.5%) |
| 10 to 14 Year Olds | 176 (97.8%) | 4 (2.2%) |
| 15 to 17 Year Olds | 100 (95.2%) | 5 (4.8%) |
| 18 to 19 Year Olds | 151 (94.4%) | 9 (5.6%) |
| 20 to 24 Year Olds | 63 (94.0%) | 4 (6.0%) |
| 25 to 34 Year Olds | 24 (96.0%) | 1 (4.0%) |
| 35 Years and over | 28 (73.7%) | 10 (26.3%) |
| Total | 709 (94.8%) | 39 (5.2%) |
Educational Attainment by Field of Study in Tonkawa
Education (176 | 40.3%), business (74 | 16.9%), arts & humanities (37 | 8.5%), science & technology (30 | 6.9%), and psychology (25 | 5.7%) are the most common fields of study among 437 individuals in Tonkawa who have obtained a bachelor's degree or higher.
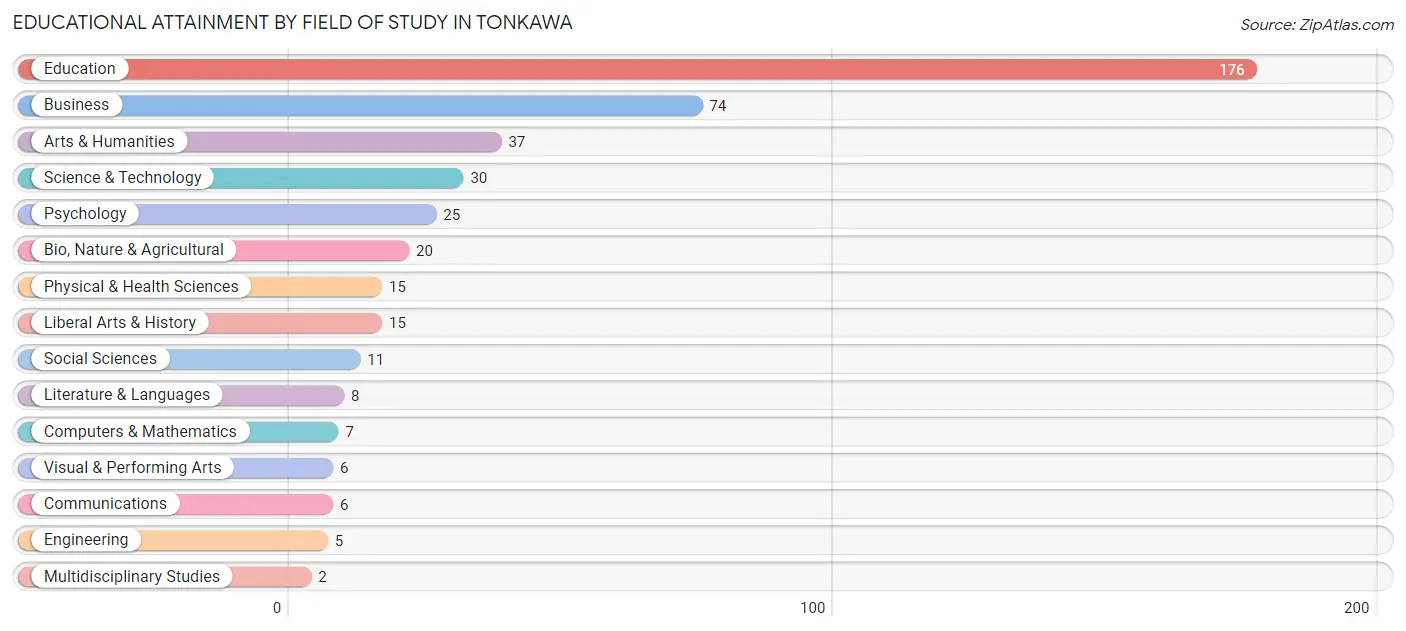
| Field of Study | # Graduates | % Graduates |
| Computers & Mathematics | 7 | 1.6% |
| Bio, Nature & Agricultural | 20 | 4.6% |
| Physical & Health Sciences | 15 | 3.4% |
| Psychology | 25 | 5.7% |
| Social Sciences | 11 | 2.5% |
| Engineering | 5 | 1.1% |
| Multidisciplinary Studies | 2 | 0.5% |
| Science & Technology | 30 | 6.9% |
| Business | 74 | 16.9% |
| Education | 176 | 40.3% |
| Literature & Languages | 8 | 1.8% |
| Liberal Arts & History | 15 | 3.4% |
| Visual & Performing Arts | 6 | 1.4% |
| Communications | 6 | 1.4% |
| Arts & Humanities | 37 | 8.5% |
| Total | 437 | 100.0% |
Transportation & Commute in Tonkawa
Vehicle Availability by Sex in Tonkawa
The most prevalent vehicle ownership categories in Tonkawa are males with 2 vehicles (241, accounting for 39.9%) and females with 2 vehicles (216, making up 39.6%).
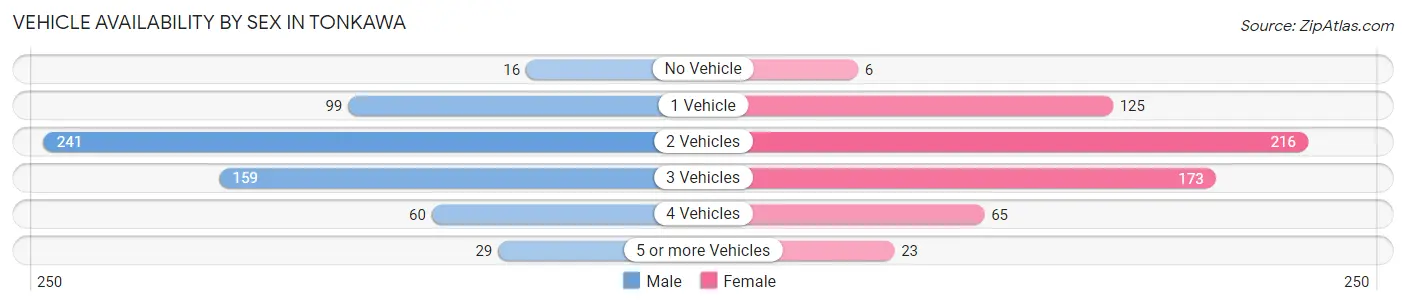
| Vehicles Available | Male | Female |
| No Vehicle | 16 (2.6%) | 6 (1.0%) |
| 1 Vehicle | 99 (16.4%) | 125 (20.6%) |
| 2 Vehicles | 241 (39.9%) | 216 (35.5%) |
| 3 Vehicles | 159 (26.3%) | 173 (28.4%) |
| 4 Vehicles | 60 (9.9%) | 65 (10.7%) |
| 5 or more Vehicles | 29 (4.8%) | 23 (3.8%) |
| Total | 604 (100.0%) | 608 (100.0%) |
Commute Time in Tonkawa
The most frequently occuring commute durations in Tonkawa are 5 to 9 minutes (239 commuters, 20.7%), less than 5 minutes (221 commuters, 19.2%), and 15 to 19 minutes (133 commuters, 11.5%).
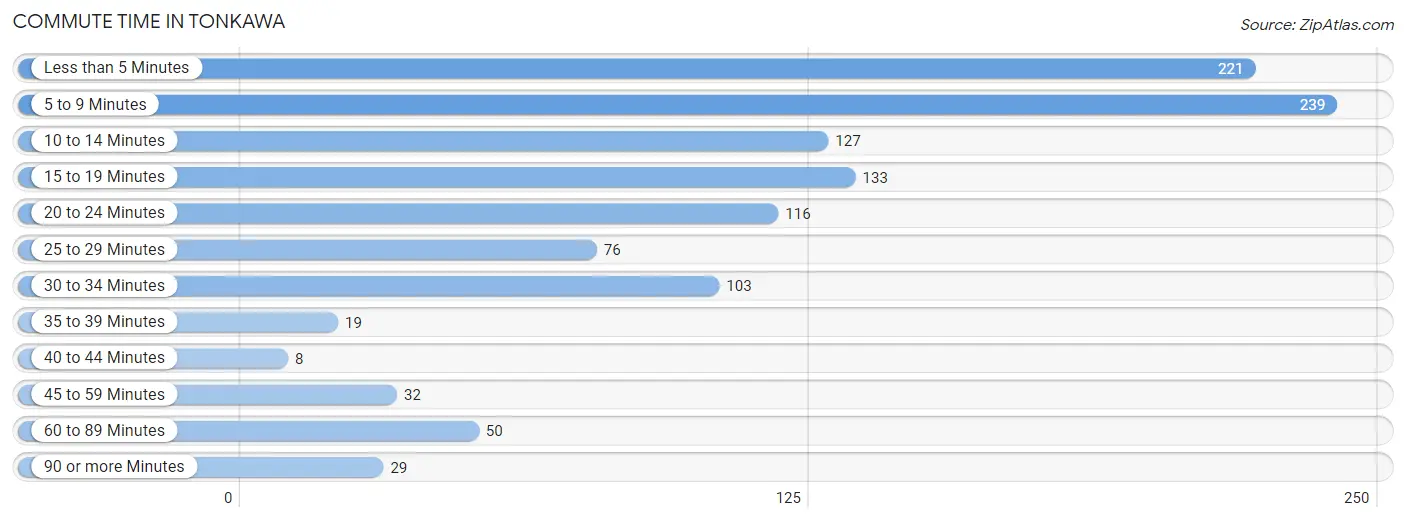
| Commute Time | # Commuters | % Commuters |
| Less than 5 Minutes | 221 | 19.2% |
| 5 to 9 Minutes | 239 | 20.7% |
| 10 to 14 Minutes | 127 | 11.0% |
| 15 to 19 Minutes | 133 | 11.5% |
| 20 to 24 Minutes | 116 | 10.1% |
| 25 to 29 Minutes | 76 | 6.6% |
| 30 to 34 Minutes | 103 | 8.9% |
| 35 to 39 Minutes | 19 | 1.7% |
| 40 to 44 Minutes | 8 | 0.7% |
| 45 to 59 Minutes | 32 | 2.8% |
| 60 to 89 Minutes | 50 | 4.3% |
| 90 or more Minutes | 29 | 2.5% |
Commute Time by Sex in Tonkawa
The most common commute times in Tonkawa are less than 5 minutes (105 commuters, 17.8%) for males and 5 to 9 minutes (137 commuters, 24.3%) for females.
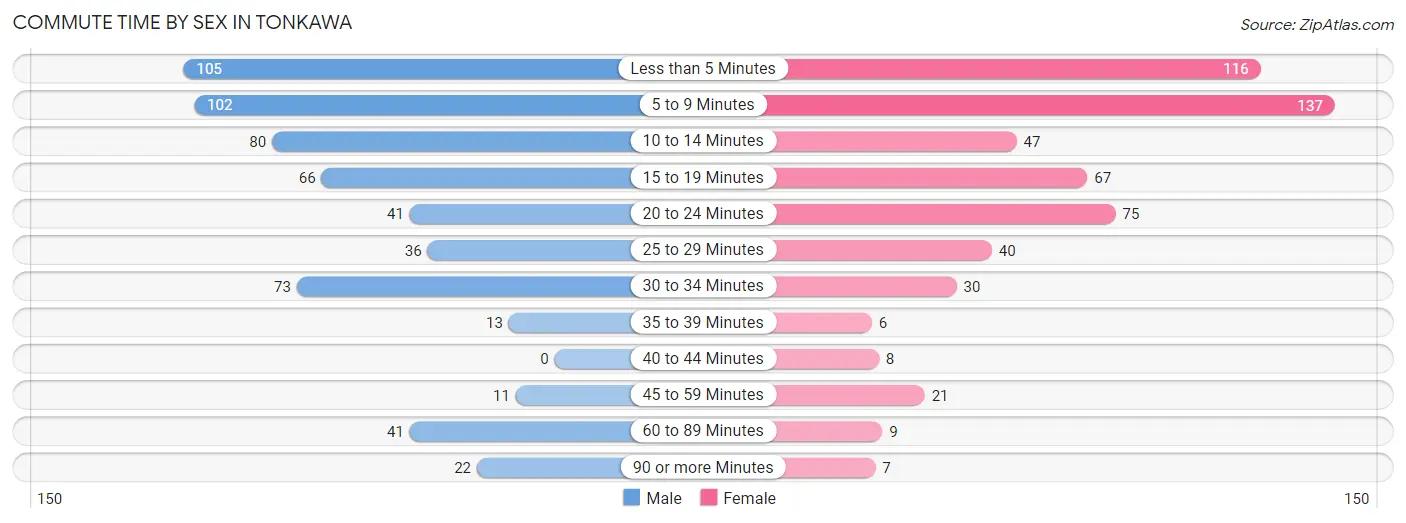
| Commute Time | Male | Female |
| Less than 5 Minutes | 105 (17.8%) | 116 (20.6%) |
| 5 to 9 Minutes | 102 (17.3%) | 137 (24.3%) |
| 10 to 14 Minutes | 80 (13.6%) | 47 (8.4%) |
| 15 to 19 Minutes | 66 (11.2%) | 67 (11.9%) |
| 20 to 24 Minutes | 41 (7.0%) | 75 (13.3%) |
| 25 to 29 Minutes | 36 (6.1%) | 40 (7.1%) |
| 30 to 34 Minutes | 73 (12.4%) | 30 (5.3%) |
| 35 to 39 Minutes | 13 (2.2%) | 6 (1.1%) |
| 40 to 44 Minutes | 0 (0.0%) | 8 (1.4%) |
| 45 to 59 Minutes | 11 (1.9%) | 21 (3.7%) |
| 60 to 89 Minutes | 41 (7.0%) | 9 (1.6%) |
| 90 or more Minutes | 22 (3.7%) | 7 (1.2%) |
Time of Departure to Work by Sex in Tonkawa
The most frequent times of departure to work in Tonkawa are 7:30 AM to 7:59 AM (112, 19.0%) for males and 7:30 AM to 7:59 AM (122, 21.7%) for females.
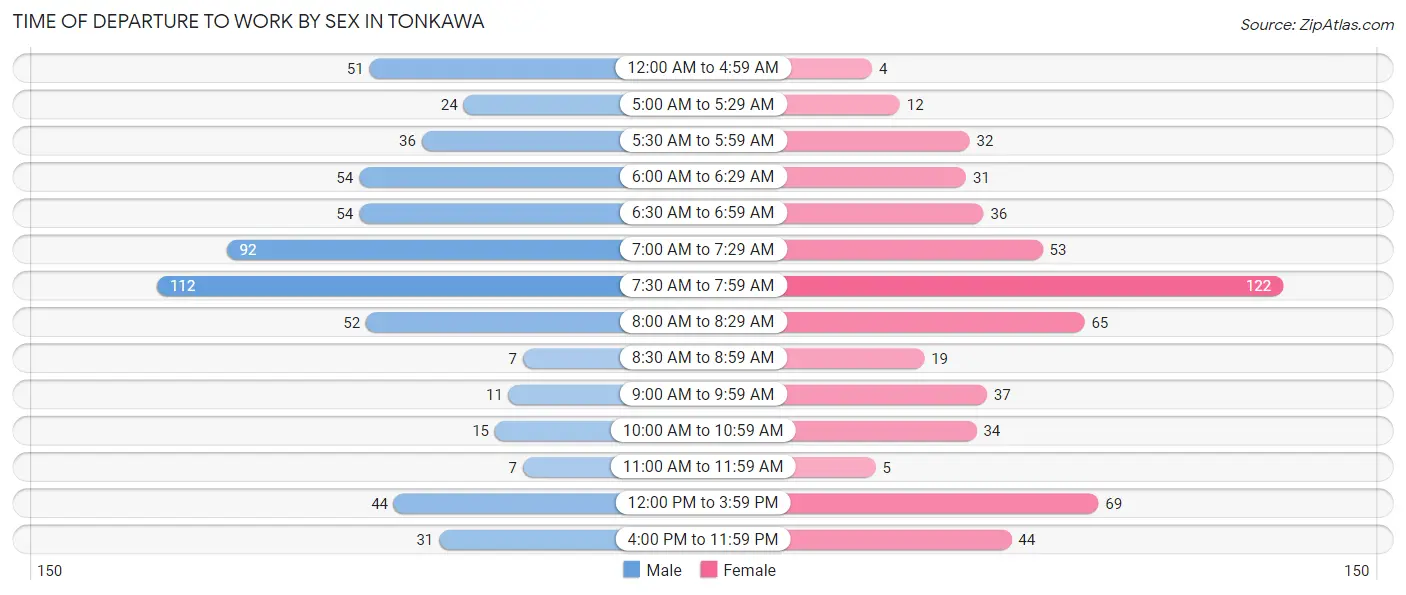
| Time of Departure | Male | Female |
| 12:00 AM to 4:59 AM | 51 (8.6%) | 4 (0.7%) |
| 5:00 AM to 5:29 AM | 24 (4.1%) | 12 (2.1%) |
| 5:30 AM to 5:59 AM | 36 (6.1%) | 32 (5.7%) |
| 6:00 AM to 6:29 AM | 54 (9.1%) | 31 (5.5%) |
| 6:30 AM to 6:59 AM | 54 (9.1%) | 36 (6.4%) |
| 7:00 AM to 7:29 AM | 92 (15.6%) | 53 (9.4%) |
| 7:30 AM to 7:59 AM | 112 (19.0%) | 122 (21.7%) |
| 8:00 AM to 8:29 AM | 52 (8.8%) | 65 (11.6%) |
| 8:30 AM to 8:59 AM | 7 (1.2%) | 19 (3.4%) |
| 9:00 AM to 9:59 AM | 11 (1.9%) | 37 (6.6%) |
| 10:00 AM to 10:59 AM | 15 (2.5%) | 34 (6.0%) |
| 11:00 AM to 11:59 AM | 7 (1.2%) | 5 (0.9%) |
| 12:00 PM to 3:59 PM | 44 (7.5%) | 69 (12.3%) |
| 4:00 PM to 11:59 PM | 31 (5.2%) | 44 (7.8%) |
| Total | 590 (100.0%) | 563 (100.0%) |
Housing Occupancy in Tonkawa
Occupancy by Ownership in Tonkawa
Of the total 1,228 dwellings in Tonkawa, owner-occupied units account for 877 (71.4%), while renter-occupied units make up 351 (28.6%).
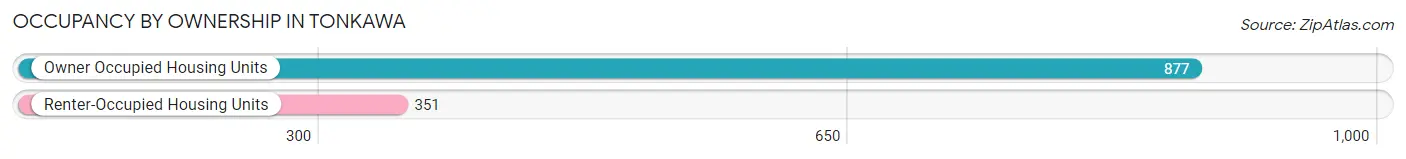
| Occupancy | # Housing Units | % Housing Units |
| Owner Occupied Housing Units | 877 | 71.4% |
| Renter-Occupied Housing Units | 351 | 28.6% |
| Total Occupied Housing Units | 1,228 | 100.0% |
Occupancy by Household Size in Tonkawa
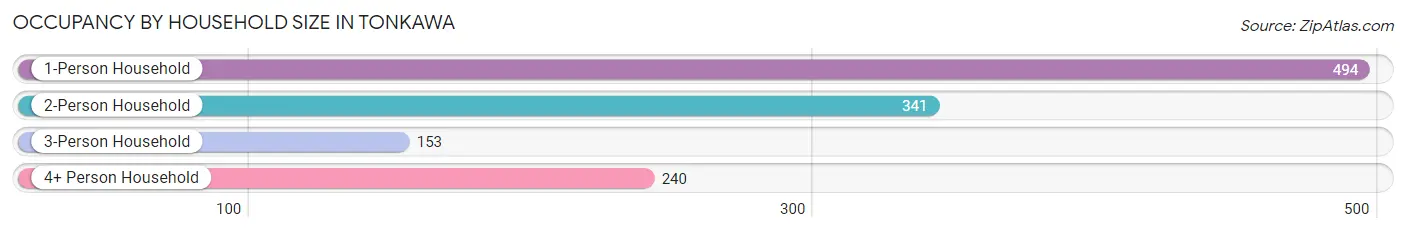
| Household Size | # Housing Units | % Housing Units |
| 1-Person Household | 494 | 40.2% |
| 2-Person Household | 341 | 27.8% |
| 3-Person Household | 153 | 12.5% |
| 4+ Person Household | 240 | 19.5% |
| Total Housing Units | 1,228 | 100.0% |
Occupancy by Ownership by Household Size in Tonkawa
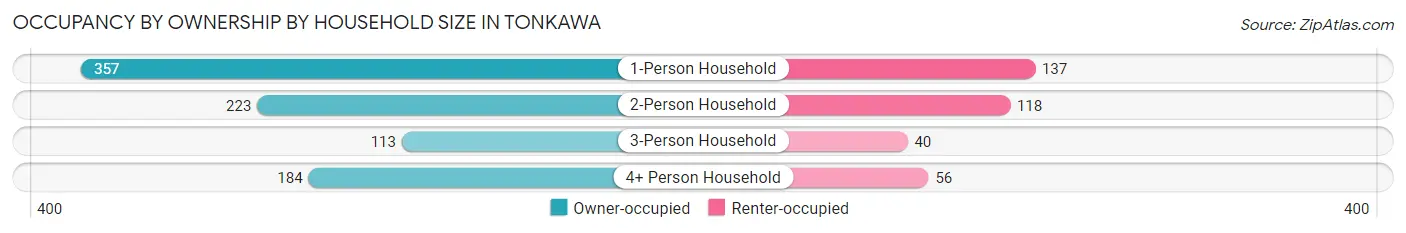
| Household Size | Owner-occupied | Renter-occupied |
| 1-Person Household | 357 (72.3%) | 137 (27.7%) |
| 2-Person Household | 223 (65.4%) | 118 (34.6%) |
| 3-Person Household | 113 (73.9%) | 40 (26.1%) |
| 4+ Person Household | 184 (76.7%) | 56 (23.3%) |
| Total Housing Units | 877 (71.4%) | 351 (28.6%) |
Occupancy by Educational Attainment in Tonkawa
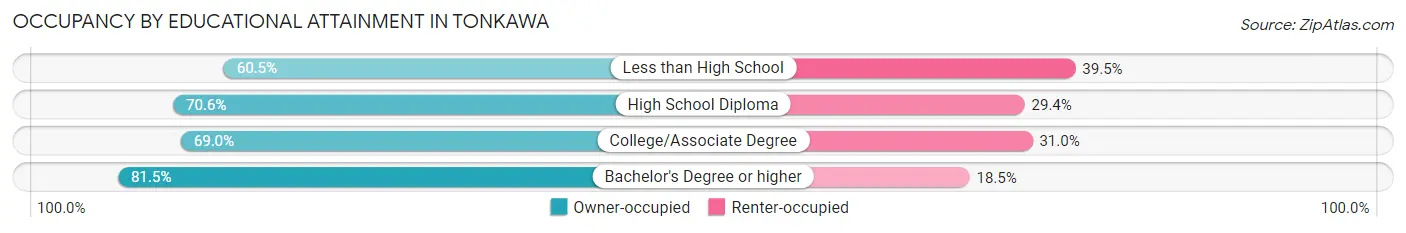
| Household Size | Owner-occupied | Renter-occupied |
| Less than High School | 72 (60.5%) | 47 (39.5%) |
| High School Diploma | 271 (70.6%) | 113 (29.4%) |
| College/Associate Degree | 314 (69.0%) | 141 (31.0%) |
| Bachelor's Degree or higher | 220 (81.5%) | 50 (18.5%) |
Occupancy by Age of Householder in Tonkawa
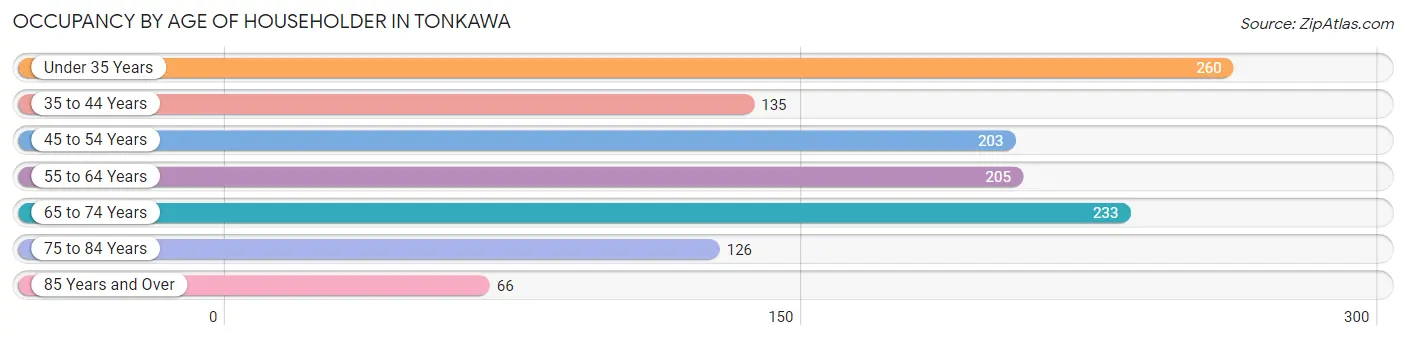
| Age Bracket | # Households | % Households |
| Under 35 Years | 260 | 21.2% |
| 35 to 44 Years | 135 | 11.0% |
| 45 to 54 Years | 203 | 16.5% |
| 55 to 64 Years | 205 | 16.7% |
| 65 to 74 Years | 233 | 19.0% |
| 75 to 84 Years | 126 | 10.3% |
| 85 Years and Over | 66 | 5.4% |
| Total | 1,228 | 100.0% |
Housing Finances in Tonkawa
Median Income by Occupancy in Tonkawa
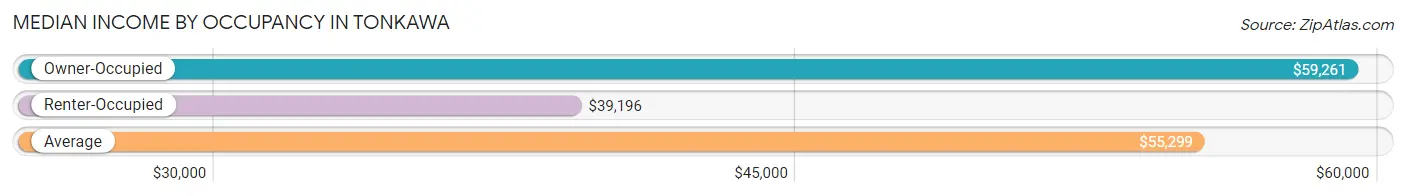
| Occupancy Type | # Households | Median Income |
| Owner-Occupied | 877 (71.4%) | $59,261 |
| Renter-Occupied | 351 (28.6%) | $39,196 |
| Average | 1,228 (100.0%) | $55,299 |
Occupancy by Householder Income Bracket in Tonkawa
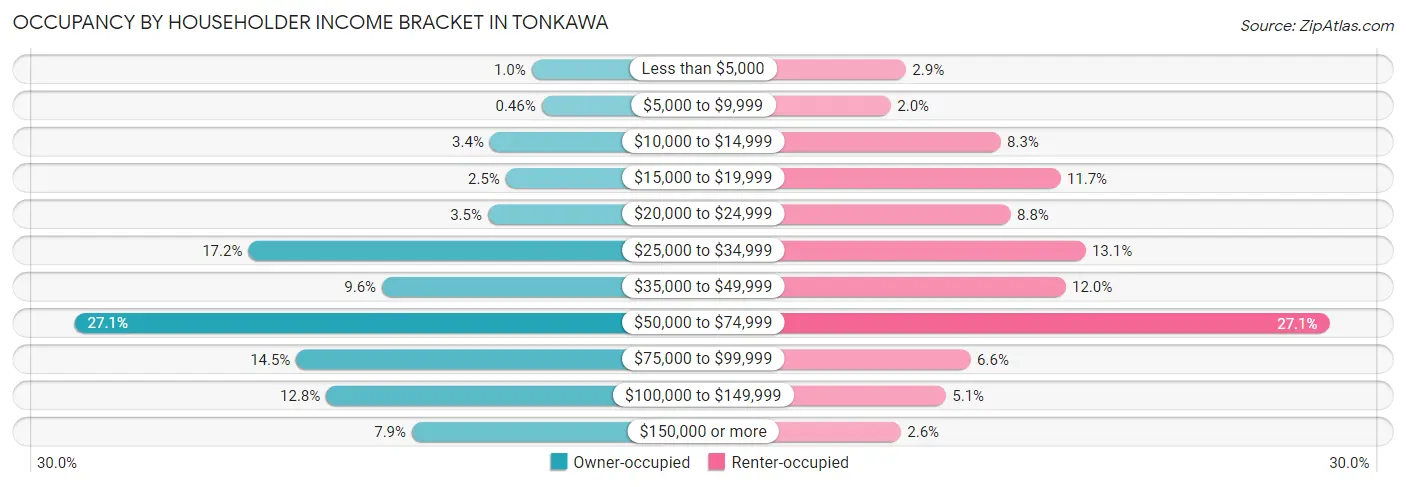
| Income Bracket | Owner-occupied | Renter-occupied |
| Less than $5,000 | 9 (1.0%) | 10 (2.9%) |
| $5,000 to $9,999 | 4 (0.5%) | 7 (2.0%) |
| $10,000 to $14,999 | 30 (3.4%) | 29 (8.3%) |
| $15,000 to $19,999 | 22 (2.5%) | 41 (11.7%) |
| $20,000 to $24,999 | 31 (3.5%) | 31 (8.8%) |
| $25,000 to $34,999 | 151 (17.2%) | 46 (13.1%) |
| $35,000 to $49,999 | 84 (9.6%) | 42 (12.0%) |
| $50,000 to $74,999 | 238 (27.1%) | 95 (27.1%) |
| $75,000 to $99,999 | 127 (14.5%) | 23 (6.6%) |
| $100,000 to $149,999 | 112 (12.8%) | 18 (5.1%) |
| $150,000 or more | 69 (7.9%) | 9 (2.6%) |
| Total | 877 (100.0%) | 351 (100.0%) |
Monthly Housing Cost Tiers in Tonkawa
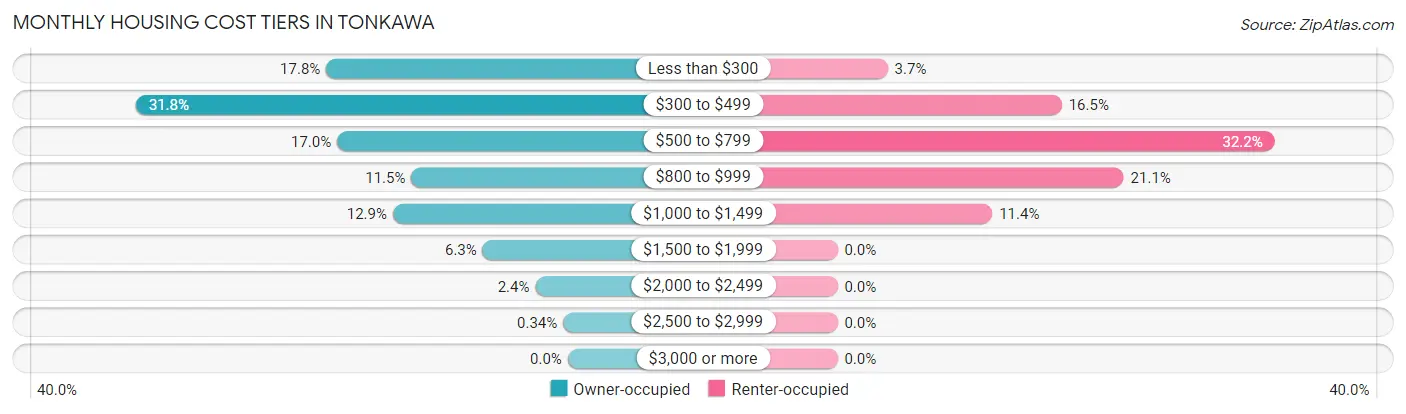
| Monthly Cost | Owner-occupied | Renter-occupied |
| Less than $300 | 156 (17.8%) | 13 (3.7%) |
| $300 to $499 | 279 (31.8%) | 58 (16.5%) |
| $500 to $799 | 149 (17.0%) | 113 (32.2%) |
| $800 to $999 | 101 (11.5%) | 74 (21.1%) |
| $1,000 to $1,499 | 113 (12.9%) | 40 (11.4%) |
| $1,500 to $1,999 | 55 (6.3%) | 0 (0.0%) |
| $2,000 to $2,499 | 21 (2.4%) | 0 (0.0%) |
| $2,500 to $2,999 | 3 (0.3%) | 0 (0.0%) |
| $3,000 or more | 0 (0.0%) | 0 (0.0%) |
| Total | 877 (100.0%) | 351 (100.0%) |
Physical Housing Characteristics in Tonkawa
Housing Structures in Tonkawa
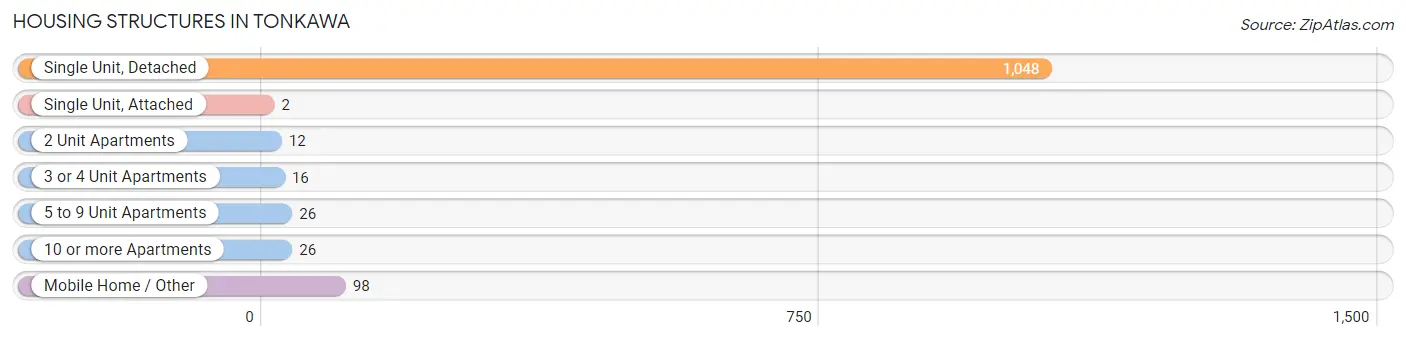
| Structure Type | # Housing Units | % Housing Units |
| Single Unit, Detached | 1,048 | 85.3% |
| Single Unit, Attached | 2 | 0.2% |
| 2 Unit Apartments | 12 | 1.0% |
| 3 or 4 Unit Apartments | 16 | 1.3% |
| 5 to 9 Unit Apartments | 26 | 2.1% |
| 10 or more Apartments | 26 | 2.1% |
| Mobile Home / Other | 98 | 8.0% |
| Total | 1,228 | 100.0% |
Housing Structures by Occupancy in Tonkawa
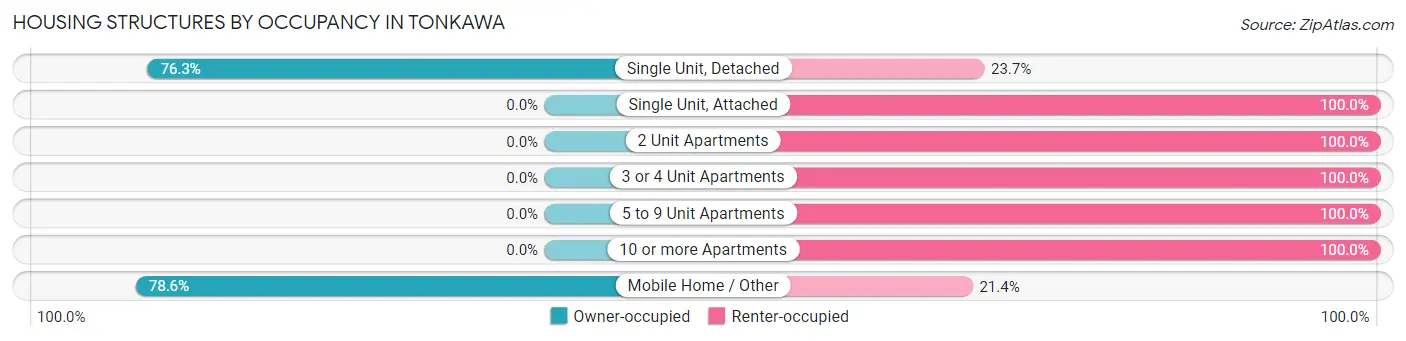
| Structure Type | Owner-occupied | Renter-occupied |
| Single Unit, Detached | 800 (76.3%) | 248 (23.7%) |
| Single Unit, Attached | 0 (0.0%) | 2 (100.0%) |
| 2 Unit Apartments | 0 (0.0%) | 12 (100.0%) |
| 3 or 4 Unit Apartments | 0 (0.0%) | 16 (100.0%) |
| 5 to 9 Unit Apartments | 0 (0.0%) | 26 (100.0%) |
| 10 or more Apartments | 0 (0.0%) | 26 (100.0%) |
| Mobile Home / Other | 77 (78.6%) | 21 (21.4%) |
| Total | 877 (71.4%) | 351 (28.6%) |
Housing Structures by Number of Rooms in Tonkawa
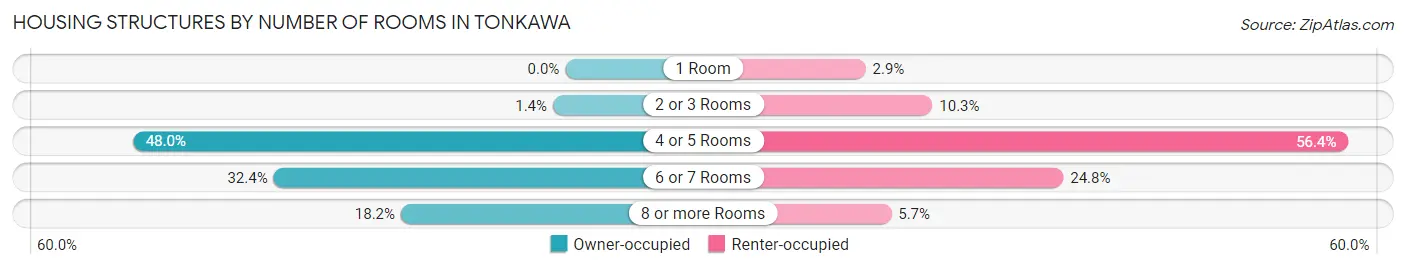
| Number of Rooms | Owner-occupied | Renter-occupied |
| 1 Room | 0 (0.0%) | 10 (2.9%) |
| 2 or 3 Rooms | 12 (1.4%) | 36 (10.3%) |
| 4 or 5 Rooms | 421 (48.0%) | 198 (56.4%) |
| 6 or 7 Rooms | 284 (32.4%) | 87 (24.8%) |
| 8 or more Rooms | 160 (18.2%) | 20 (5.7%) |
| Total | 877 (100.0%) | 351 (100.0%) |
Housing Structure by Heating Type in Tonkawa
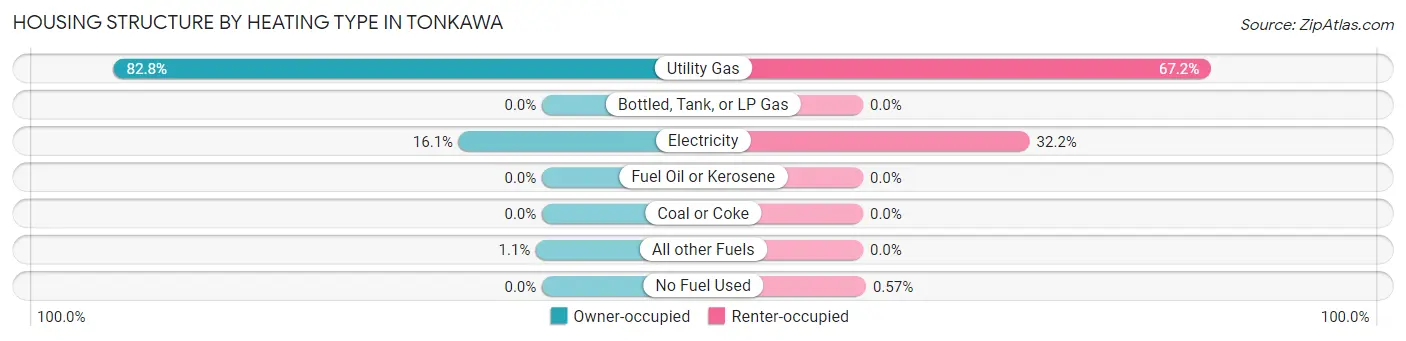
| Heating Type | Owner-occupied | Renter-occupied |
| Utility Gas | 726 (82.8%) | 236 (67.2%) |
| Bottled, Tank, or LP Gas | 0 (0.0%) | 0 (0.0%) |
| Electricity | 141 (16.1%) | 113 (32.2%) |
| Fuel Oil or Kerosene | 0 (0.0%) | 0 (0.0%) |
| Coal or Coke | 0 (0.0%) | 0 (0.0%) |
| All other Fuels | 10 (1.1%) | 0 (0.0%) |
| No Fuel Used | 0 (0.0%) | 2 (0.6%) |
| Total | 877 (100.0%) | 351 (100.0%) |
Household Vehicle Usage in Tonkawa
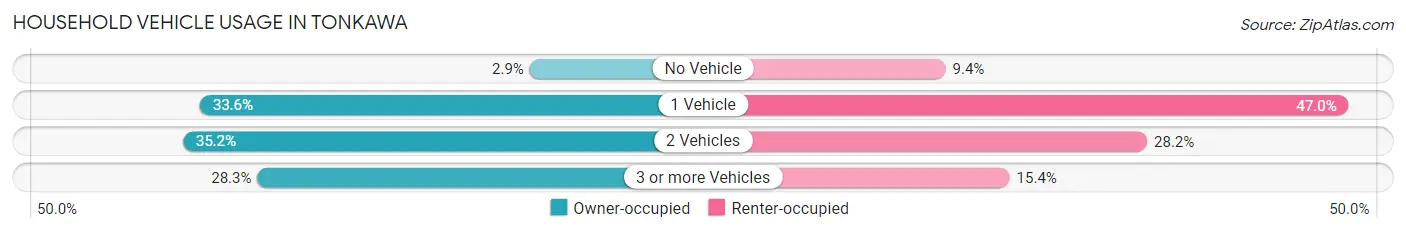
| Vehicles per Household | Owner-occupied | Renter-occupied |
| No Vehicle | 25 (2.9%) | 33 (9.4%) |
| 1 Vehicle | 295 (33.6%) | 165 (47.0%) |
| 2 Vehicles | 309 (35.2%) | 99 (28.2%) |
| 3 or more Vehicles | 248 (28.3%) | 54 (15.4%) |
| Total | 877 (100.0%) | 351 (100.0%) |
Real Estate & Mortgages in Tonkawa
Real Estate and Mortgage Overview in Tonkawa
| Characteristic | Without Mortgage | With Mortgage |
| Housing Units | 540 | 337 |
| Median Property Value | $53,800 | $98,600 |
| Median Household Income | $51,346 | $45 |
| Monthly Housing Costs | $351 | $0 |
| Real Estate Taxes | $317 | $12 |
Property Value by Mortgage Status in Tonkawa
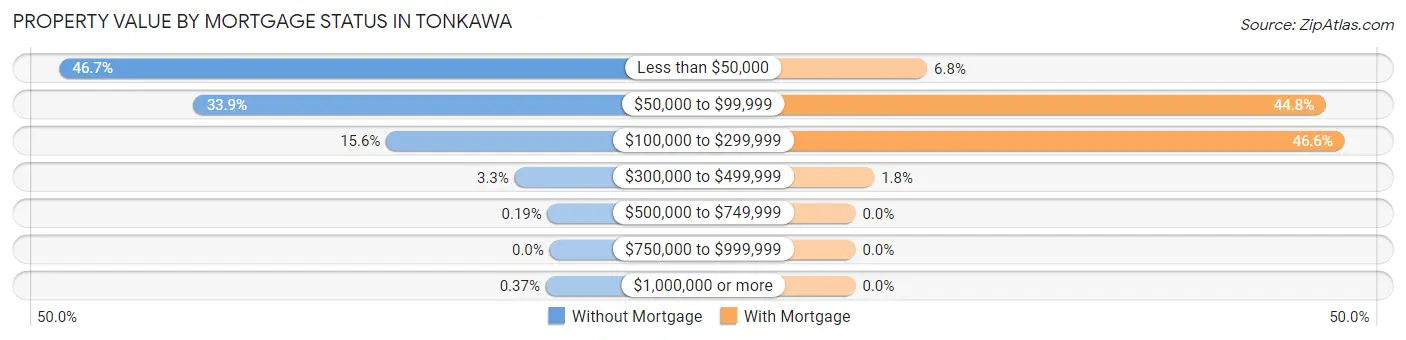
| Property Value | Without Mortgage | With Mortgage |
| Less than $50,000 | 252 (46.7%) | 23 (6.8%) |
| $50,000 to $99,999 | 183 (33.9%) | 151 (44.8%) |
| $100,000 to $299,999 | 84 (15.6%) | 157 (46.6%) |
| $300,000 to $499,999 | 18 (3.3%) | 6 (1.8%) |
| $500,000 to $749,999 | 1 (0.2%) | 0 (0.0%) |
| $750,000 to $999,999 | 0 (0.0%) | 0 (0.0%) |
| $1,000,000 or more | 2 (0.4%) | 0 (0.0%) |
| Total | 540 (100.0%) | 337 (100.0%) |
Household Income by Mortgage Status in Tonkawa
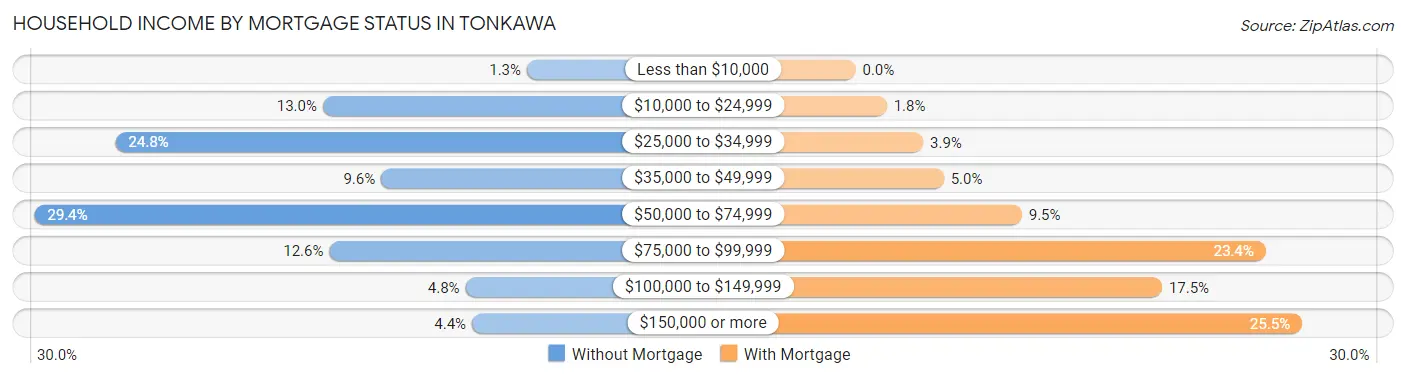
| Household Income | Without Mortgage | With Mortgage |
| Less than $10,000 | 7 (1.3%) | 0 (0.0%) |
| $10,000 to $24,999 | 70 (13.0%) | 6 (1.8%) |
| $25,000 to $34,999 | 134 (24.8%) | 13 (3.9%) |
| $35,000 to $49,999 | 52 (9.6%) | 17 (5.0%) |
| $50,000 to $74,999 | 159 (29.4%) | 32 (9.5%) |
| $75,000 to $99,999 | 68 (12.6%) | 79 (23.4%) |
| $100,000 to $149,999 | 26 (4.8%) | 59 (17.5%) |
| $150,000 or more | 24 (4.4%) | 86 (25.5%) |
| Total | 540 (100.0%) | 337 (100.0%) |
Property Value to Household Income Ratio in Tonkawa
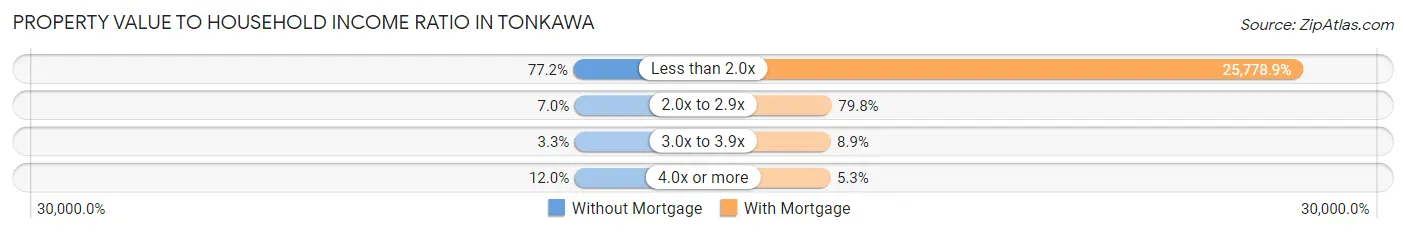
| Value-to-Income Ratio | Without Mortgage | With Mortgage |
| Less than 2.0x | 417 (77.2%) | 86,875 (25,778.9%) |
| 2.0x to 2.9x | 38 (7.0%) | 269 (79.8%) |
| 3.0x to 3.9x | 18 (3.3%) | 30 (8.9%) |
| 4.0x or more | 65 (12.0%) | 18 (5.3%) |
| Total | 540 (100.0%) | 337 (100.0%) |
Real Estate Taxes by Mortgage Status in Tonkawa
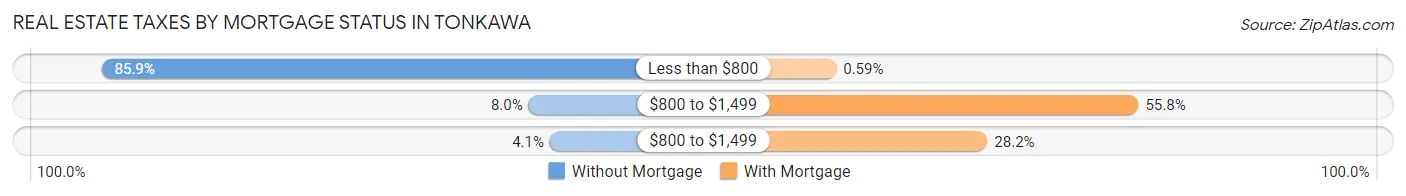
| Property Taxes | Without Mortgage | With Mortgage |
| Less than $800 | 464 (85.9%) | 2 (0.6%) |
| $800 to $1,499 | 43 (8.0%) | 188 (55.8%) |
| $800 to $1,499 | 22 (4.1%) | 95 (28.2%) |
| Total | 540 (100.0%) | 337 (100.0%) |
Health & Disability in Tonkawa
Health Insurance Coverage by Age in Tonkawa
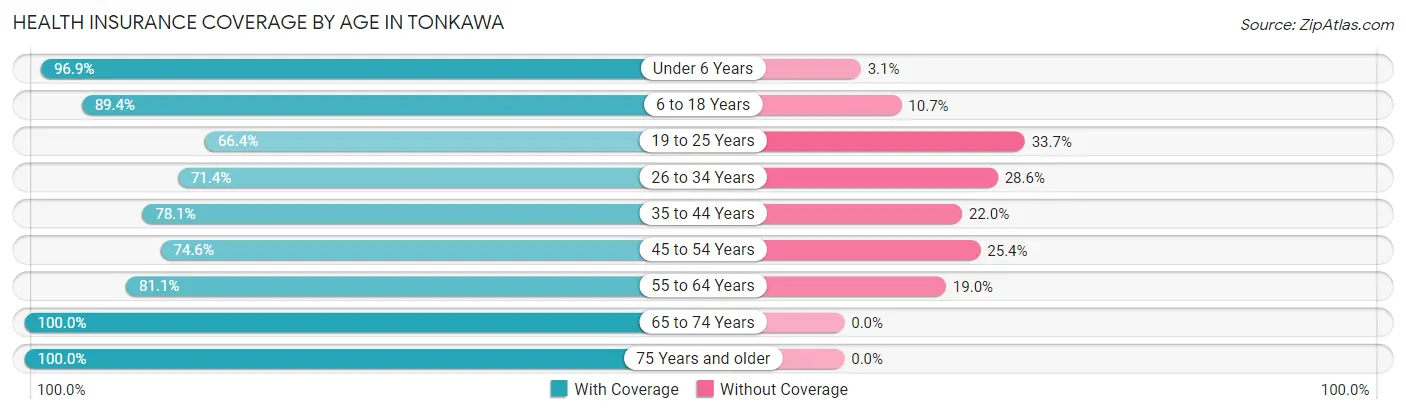
| Age Bracket | With Coverage | Without Coverage |
| Under 6 Years | 222 (96.9%) | 7 (3.1%) |
| 6 to 18 Years | 495 (89.3%) | 59 (10.6%) |
| 19 to 25 Years | 209 (66.3%) | 106 (33.7%) |
| 26 to 34 Years | 242 (71.4%) | 97 (28.6%) |
| 35 to 44 Years | 224 (78.0%) | 63 (22.0%) |
| 45 to 54 Years | 253 (74.6%) | 86 (25.4%) |
| 55 to 64 Years | 278 (81.0%) | 65 (19.0%) |
| 65 to 74 Years | 303 (100.0%) | 0 (0.0%) |
| 75 Years and older | 227 (100.0%) | 0 (0.0%) |
| Total | 2,453 (83.6%) | 483 (16.5%) |
Health Insurance Coverage by Citizenship Status in Tonkawa
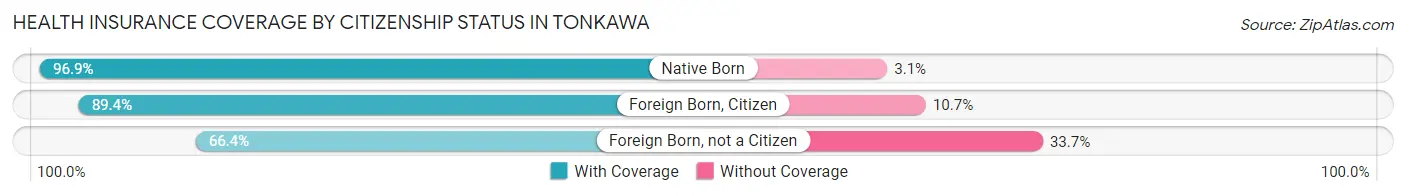
| Citizenship Status | With Coverage | Without Coverage |
| Native Born | 222 (96.9%) | 7 (3.1%) |
| Foreign Born, Citizen | 495 (89.3%) | 59 (10.6%) |
| Foreign Born, not a Citizen | 209 (66.3%) | 106 (33.7%) |
Health Insurance Coverage by Household Income in Tonkawa
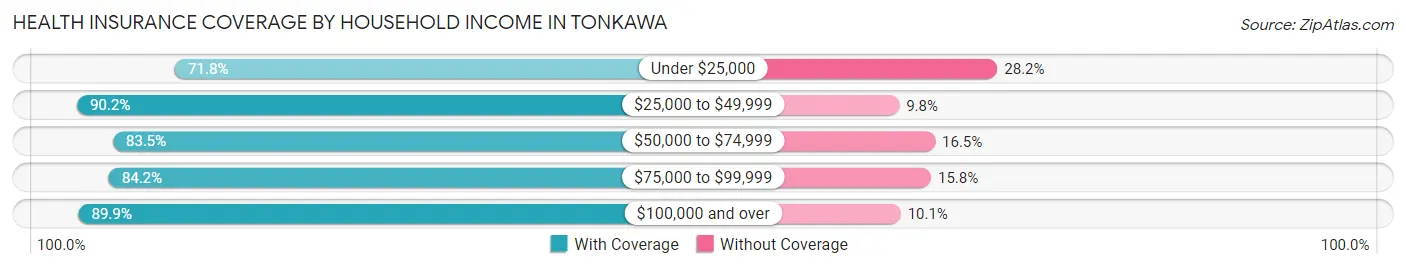
| Household Income | With Coverage | Without Coverage |
| Under $25,000 | 308 (71.8%) | 121 (28.2%) |
| $25,000 to $49,999 | 505 (90.2%) | 55 (9.8%) |
| $50,000 to $74,999 | 661 (83.5%) | 131 (16.5%) |
| $75,000 to $99,999 | 304 (84.2%) | 57 (15.8%) |
| $100,000 and over | 623 (89.9%) | 70 (10.1%) |
Public vs Private Health Insurance Coverage by Age in Tonkawa
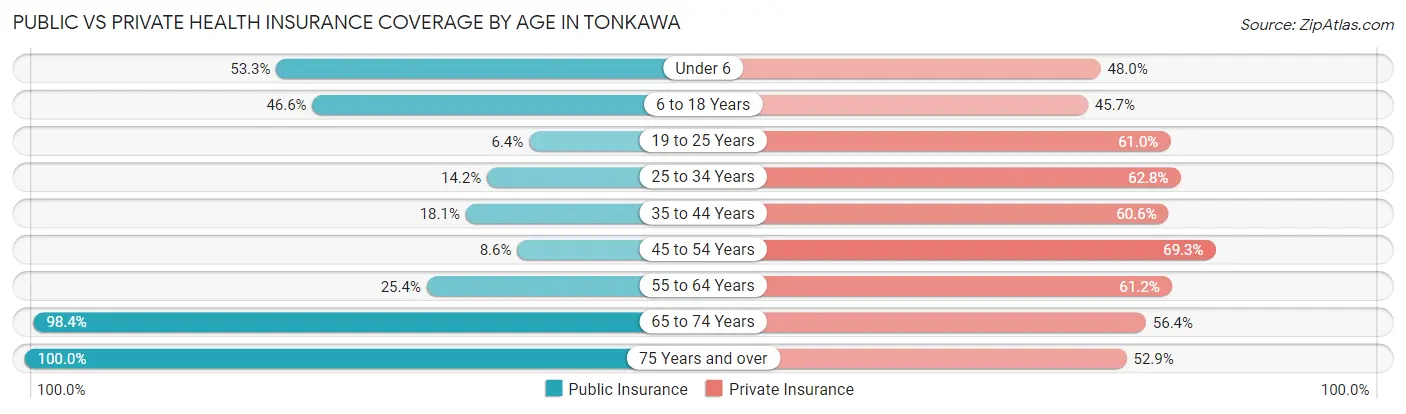
| Age Bracket | Public Insurance | Private Insurance |
| Under 6 | 122 (53.3%) | 110 (48.0%) |
| 6 to 18 Years | 258 (46.6%) | 253 (45.7%) |
| 19 to 25 Years | 20 (6.4%) | 192 (61.0%) |
| 25 to 34 Years | 48 (14.2%) | 213 (62.8%) |
| 35 to 44 Years | 52 (18.1%) | 174 (60.6%) |
| 45 to 54 Years | 29 (8.6%) | 235 (69.3%) |
| 55 to 64 Years | 87 (25.4%) | 210 (61.2%) |
| 65 to 74 Years | 298 (98.4%) | 171 (56.4%) |
| 75 Years and over | 227 (100.0%) | 120 (52.9%) |
| Total | 1,141 (38.9%) | 1,678 (57.2%) |
Disability Status by Sex by Age in Tonkawa
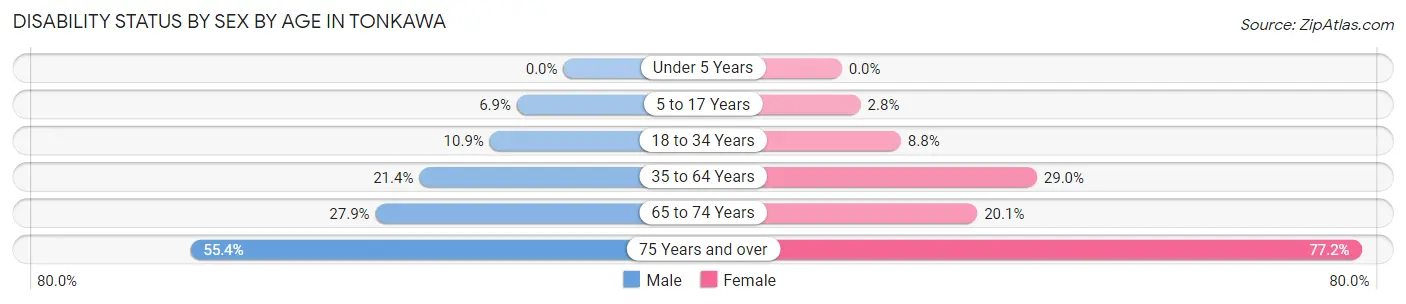
| Age Bracket | Male | Female |
| Under 5 Years | 0 (0.0%) | 0 (0.0%) |
| 5 to 17 Years | 15 (6.9%) | 7 (2.8%) |
| 18 to 34 Years | 50 (10.9%) | 28 (8.8%) |
| 35 to 64 Years | 101 (21.4%) | 144 (29.0%) |
| 65 to 74 Years | 36 (27.9%) | 35 (20.1%) |
| 75 Years and over | 36 (55.4%) | 125 (77.2%) |
Disability Class by Sex by Age in Tonkawa
Disability Class: Hearing Difficulty
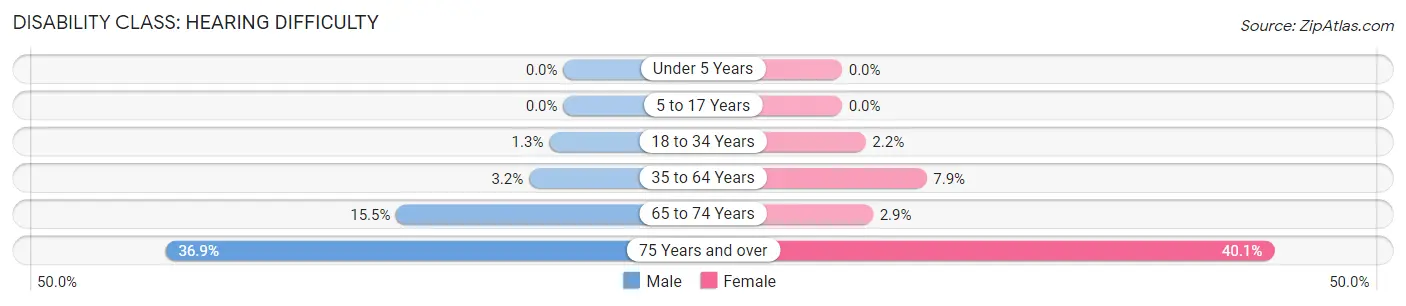
| Age Bracket | Male | Female |
| Under 5 Years | 0 (0.0%) | 0 (0.0%) |
| 5 to 17 Years | 0 (0.0%) | 0 (0.0%) |
| 18 to 34 Years | 6 (1.3%) | 7 (2.2%) |
| 35 to 64 Years | 15 (3.2%) | 39 (7.9%) |
| 65 to 74 Years | 20 (15.5%) | 5 (2.9%) |
| 75 Years and over | 24 (36.9%) | 65 (40.1%) |
Disability Class: Vision Difficulty
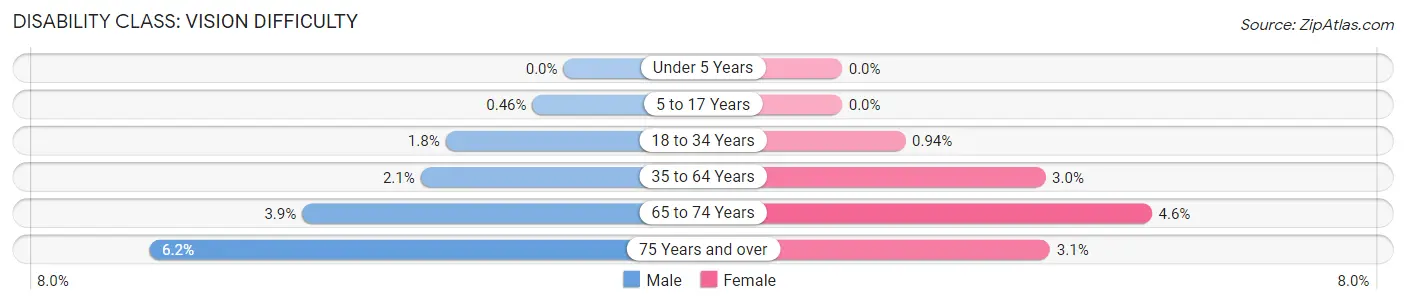
| Age Bracket | Male | Female |
| Under 5 Years | 0 (0.0%) | 0 (0.0%) |
| 5 to 17 Years | 1 (0.5%) | 0 (0.0%) |
| 18 to 34 Years | 8 (1.8%) | 3 (0.9%) |
| 35 to 64 Years | 10 (2.1%) | 15 (3.0%) |
| 65 to 74 Years | 5 (3.9%) | 8 (4.6%) |
| 75 Years and over | 4 (6.1%) | 5 (3.1%) |
Disability Class: Cognitive Difficulty
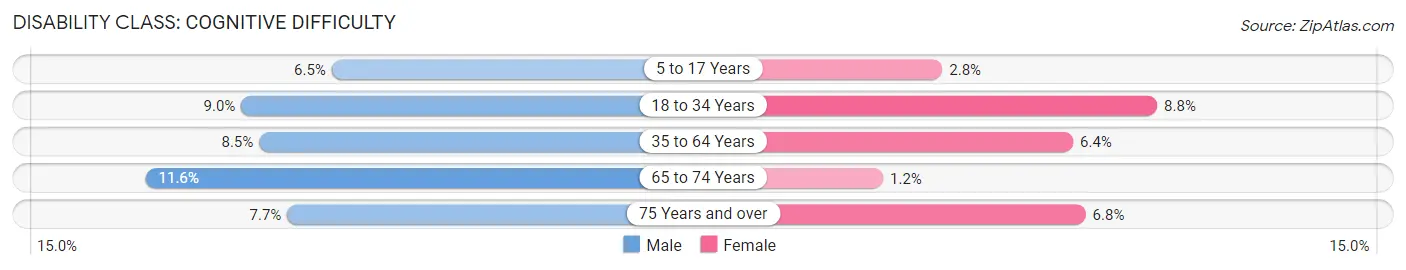
| Age Bracket | Male | Female |
| 5 to 17 Years | 14 (6.5%) | 7 (2.8%) |
| 18 to 34 Years | 41 (9.0%) | 28 (8.8%) |
| 35 to 64 Years | 40 (8.5%) | 32 (6.4%) |
| 65 to 74 Years | 15 (11.6%) | 2 (1.1%) |
| 75 Years and over | 5 (7.7%) | 11 (6.8%) |
Disability Class: Ambulatory Difficulty
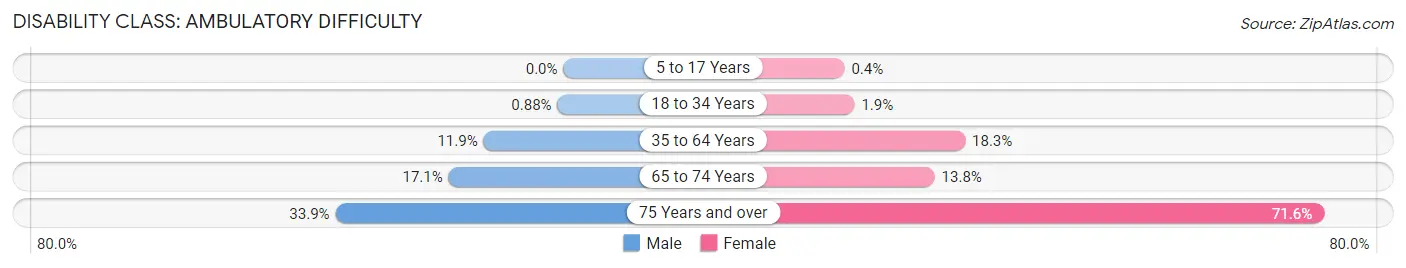
| Age Bracket | Male | Female |
| 5 to 17 Years | 0 (0.0%) | 1 (0.4%) |
| 18 to 34 Years | 4 (0.9%) | 6 (1.9%) |
| 35 to 64 Years | 56 (11.9%) | 91 (18.3%) |
| 65 to 74 Years | 22 (17.1%) | 24 (13.8%) |
| 75 Years and over | 22 (33.9%) | 116 (71.6%) |
Disability Class: Self-Care Difficulty
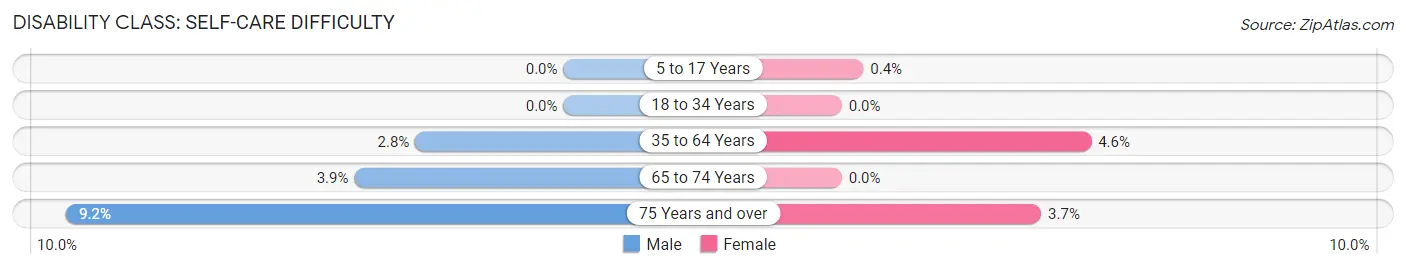
| Age Bracket | Male | Female |
| 5 to 17 Years | 0 (0.0%) | 1 (0.4%) |
| 18 to 34 Years | 0 (0.0%) | 0 (0.0%) |
| 35 to 64 Years | 13 (2.8%) | 23 (4.6%) |
| 65 to 74 Years | 5 (3.9%) | 0 (0.0%) |
| 75 Years and over | 6 (9.2%) | 6 (3.7%) |
Technology Access in Tonkawa
Computing Device Access in Tonkawa
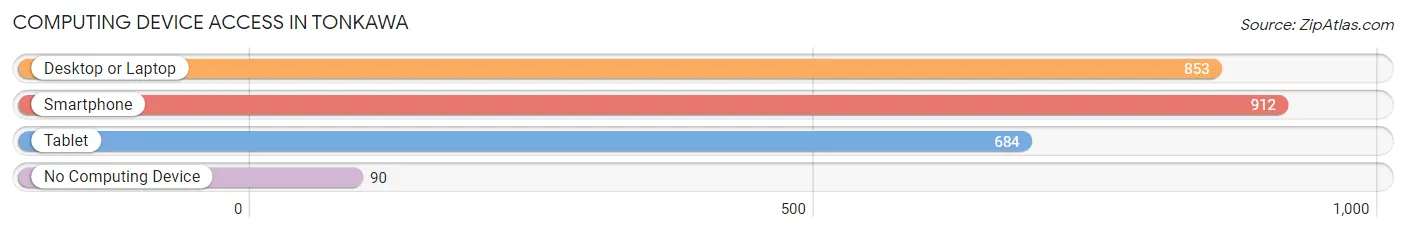
| Device Type | # Households | % Households |
| Desktop or Laptop | 853 | 69.5% |
| Smartphone | 912 | 74.3% |
| Tablet | 684 | 55.7% |
| No Computing Device | 90 | 7.3% |
| Total | 1,228 | 100.0% |
Internet Access in Tonkawa
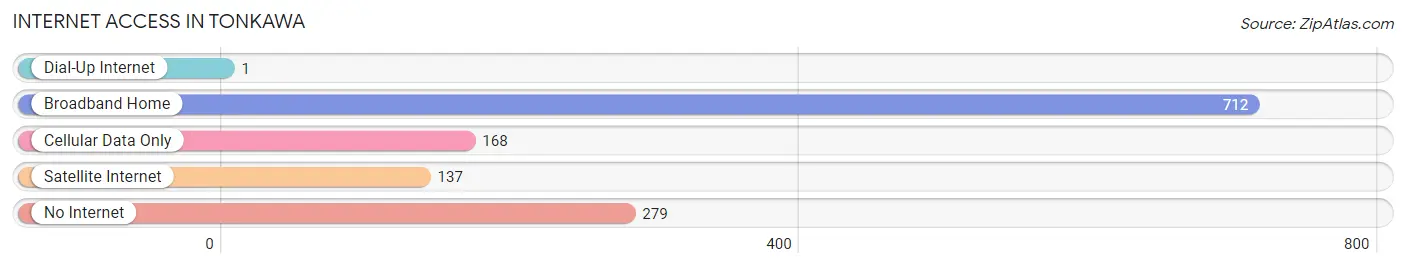
| Internet Type | # Households | % Households |
| Dial-Up Internet | 1 | 0.1% |
| Broadband Home | 712 | 58.0% |
| Cellular Data Only | 168 | 13.7% |
| Satellite Internet | 137 | 11.2% |
| No Internet | 279 | 22.7% |
| Total | 1,228 | 100.0% |
Tonkawa Summary
The town of Tonkawa, Oklahoma is located in Kay County, in the north-central part of the state. It is situated on the banks of the Salt Fork of the Arkansas River, about 50 miles south of the Kansas border. The town was founded in 1871 by the Tonkawa tribe, who had been relocated to the area from their original home in Texas. The town was named after the tribe, which means “people of the south” in the Tonkawa language.
History
The Tonkawa tribe had been living in the area for centuries before the arrival of European settlers. The tribe was known for its fierce warriors and their ability to survive in the harsh environment of the Great Plains. The tribe was forced to relocate to the area in 1871, after the US government signed a treaty with the tribe that allowed them to settle in the area.
The town of Tonkawa was officially established in 1872, and the first post office was opened in 1873. The town quickly grew, and by the early 1900s it had become a thriving community with a population of over 1,000 people. The town was home to several businesses, including a flour mill, a cotton gin, a blacksmith shop, and a hotel.
The town was also home to a number of churches, including the First Baptist Church, which was established in 1875. The town also had a school, which was established in 1876. The school was later renamed Tonkawa High School, and it is still in operation today.
The town was also home to a number of Native American tribes, including the Kiowa, Comanche, and Apache. The town was also home to a number of settlers from other parts of the United States, including Germany, Ireland, and Scotland.
Geography
Tonkawa is located in Kay County, in the north-central part of Oklahoma. The town is situated on the banks of the Salt Fork of the Arkansas River, about 50 miles south of the Kansas border. The town is located in a region of rolling hills and prairies, and is surrounded by farmland. The town is located about 50 miles north of Oklahoma City, and about 100 miles south of Wichita, Kansas.
The climate in Tonkawa is generally mild, with hot summers and cold winters. The average temperature in the summer is around 85 degrees Fahrenheit, and the average temperature in the winter is around 40 degrees Fahrenheit. The town receives an average of about 30 inches of precipitation each year.
Economy
The economy of Tonkawa is largely based on agriculture and oil production. The town is home to several large farms, which produce a variety of crops, including wheat, corn, soybeans, and cotton. The town is also home to several oil and gas production companies, which are responsible for much of the town’s economic activity.
The town is also home to several small businesses, including restaurants, retail stores, and service providers. The town is also home to a number of manufacturing companies, which produce a variety of products, including furniture, clothing, and electronics.
Demographics
As of the 2010 census, the population of Tonkawa was 2,543. The town has a population that is largely white, with about 90% of the population being white. The town also has a large Native American population, with about 10% of the population being Native American. The town also has a small Hispanic population, with about 2% of the population being Hispanic.
The median household income in Tonkawa is about $35,000, and the median home value is about $90,000. The town has a poverty rate of about 17%, which is slightly higher than the national average. The town also has a high unemployment rate, with about 8% of the population being unemployed.
Conclusion
Tonkawa, Oklahoma is a small town located in Kay County, in the north-central part of the state. The town was founded in 1871 by the Tonkawa tribe, and it has since grown into a thriving community with a population of over 2,500 people. The town is largely based on agriculture and oil production, and it is home to several small businesses, including restaurants, retail stores, and service providers. The town has a largely white population, with a small Native American and Hispanic population. The town has a median household income of about $35,000, and a median home value of about $90,000. The town also has a high unemployment rate, with about 8% of the population being unemployed.
Common Questions
What is Per Capita Income in Tonkawa?
Per Capita income in Tonkawa is $25,977.
What is the Median Family Income in Tonkawa?
Median Family Income in Tonkawa is $66,129.
What is the Median Household income in Tonkawa?
Median Household Income in Tonkawa is $55,299.
What is Income or Wage Gap in Tonkawa?
Income or Wage Gap in Tonkawa is 20.1%.
Women in Tonkawa earn 79.9 cents for every dollar earned by a man.
What is Family Income Deficit in Tonkawa?
Family Income Deficit in Tonkawa is $10,418.
Families that are below poverty line in Tonkawa earn $10,418 less on average than the poverty threshold level.
What is Inequality or Gini Index in Tonkawa?
Inequality or Gini Index in Tonkawa is 0.38.
What is the Total Population of Tonkawa?
Total Population of Tonkawa is 3,027.
What is the Total Male Population of Tonkawa?
Total Male Population of Tonkawa is 1,492.
What is the Total Female Population of Tonkawa?
Total Female Population of Tonkawa is 1,535.
What is the Ratio of Males per 100 Females in Tonkawa?
There are 97.20 Males per 100 Females in Tonkawa.
What is the Ratio of Females per 100 Males in Tonkawa?
There are 102.88 Females per 100 Males in Tonkawa.
What is the Median Population Age in Tonkawa?
Median Population Age in Tonkawa is 36.8 Years.
What is the Average Family Size in Tonkawa
Average Family Size in Tonkawa is 3.2 People.
What is the Average Household Size in Tonkawa
Average Household Size in Tonkawa is 2.3 People.
How Large is the Labor Force in Tonkawa?
There are 1,340 People in the Labor Forcein in Tonkawa.
What is the Percentage of People in the Labor Force in Tonkawa?
54.8% of People are in the Labor Force in Tonkawa.
What is the Unemployment Rate in Tonkawa?
Unemployment Rate in Tonkawa is 6.9%.