Enid, OK Map & Demographics
Enid Map
Enid Overview
$30,253
PER CAPITA INCOME
$72,115
AVG FAMILY INCOME
$60,790
AVG HOUSEHOLD INCOME
29.4%
WAGE / INCOME GAP [ % ]
70.6¢/ $1
WAGE / INCOME GAP [ $ ]
$10,739
FAMILY INCOME DEFICIT
0.44
INEQUALITY / GINI INDEX
50,961
TOTAL POPULATION
25,670
MALE POPULATION
25,291
FEMALE POPULATION
101.50
MALES / 100 FEMALES
98.52
FEMALES / 100 MALES
34.8
MEDIAN AGE
3.2
AVG FAMILY SIZE
2.5
AVG HOUSEHOLD SIZE
24,999
LABOR FORCE [ PEOPLE ]
63.9%
PERCENT IN LABOR FORCE
4.7%
UNEMPLOYMENT RATE
Enid Area Codes
Income in Enid
Income Overview in Enid
Per Capita Income in Enid is $30,253, while median incomes of families and households are $72,115 and $60,790 respectively.
| Characteristic | Number | Measure |
| Per Capita Income | 50,961 | $30,253 |
| Median Family Income | 12,191 | $72,115 |
| Mean Family Income | 12,191 | $89,242 |
| Median Household Income | 19,456 | $60,790 |
| Mean Household Income | 19,456 | $75,874 |
| Income Deficit | 12,191 | $10,739 |
| Wage / Income Gap (%) | 50,961 | 29.43% |
| Wage / Income Gap ($) | 50,961 | 70.57¢ per $1 |
| Gini / Inequality Index | 50,961 | 0.44 |
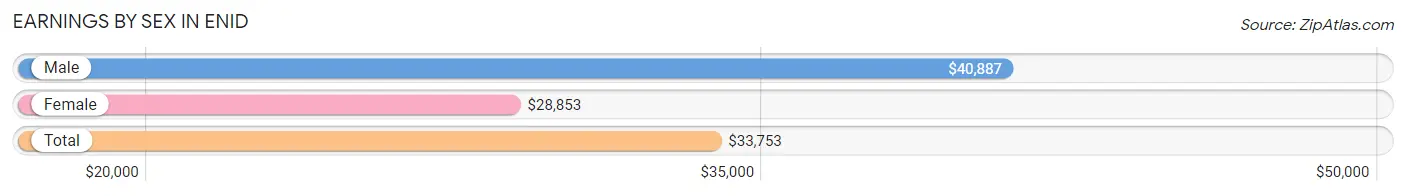
Earnings by Sex in Enid
Average Earnings in Enid are $33,753, $40,887 for men and $28,853 for women, a difference of 29.4%.
| Sex | Number | Average Earnings |
| Male | 14,296 (54.8%) | $40,887 |
| Female | 11,769 (45.2%) | $28,853 |
| Total | 26,065 (100.0%) | $33,753 |
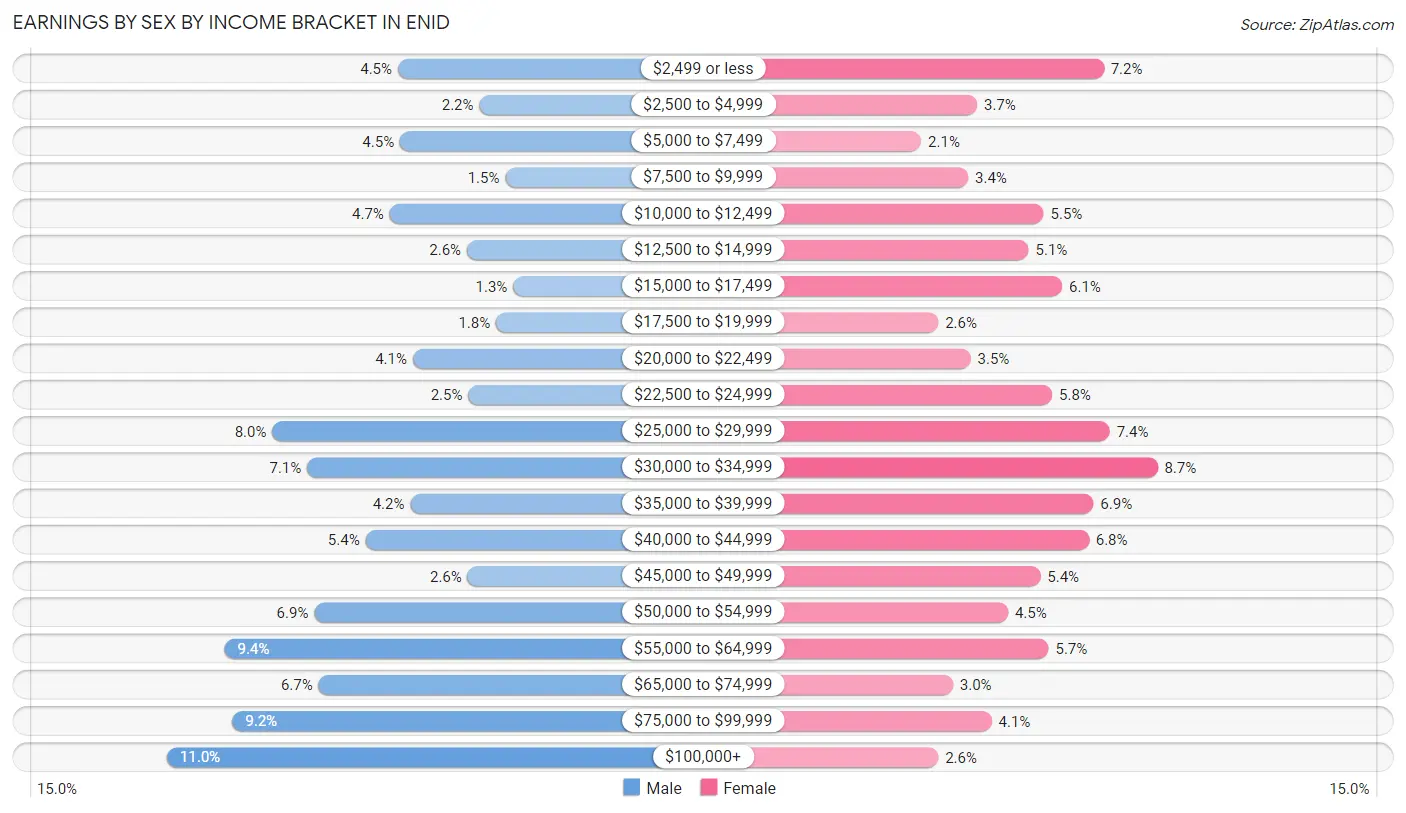
Earnings by Sex by Income Bracket in Enid
The most common earnings brackets in Enid are $100,000+ for men (1,573 | 11.0%) and $30,000 to $34,999 for women (1,028 | 8.7%).
| Income | Male | Female |
| $2,499 or less | 645 (4.5%) | 850 (7.2%) |
| $2,500 to $4,999 | 318 (2.2%) | 431 (3.7%) |
| $5,000 to $7,499 | 636 (4.4%) | 246 (2.1%) |
| $7,500 to $9,999 | 213 (1.5%) | 401 (3.4%) |
| $10,000 to $12,499 | 677 (4.7%) | 651 (5.5%) |
| $12,500 to $14,999 | 368 (2.6%) | 601 (5.1%) |
| $15,000 to $17,499 | 181 (1.3%) | 712 (6.0%) |
| $17,500 to $19,999 | 250 (1.8%) | 302 (2.6%) |
| $20,000 to $22,499 | 584 (4.1%) | 409 (3.5%) |
| $22,500 to $24,999 | 361 (2.5%) | 679 (5.8%) |
| $25,000 to $29,999 | 1,150 (8.0%) | 870 (7.4%) |
| $30,000 to $34,999 | 1,010 (7.1%) | 1,028 (8.7%) |
| $35,000 to $39,999 | 595 (4.2%) | 816 (6.9%) |
| $40,000 to $44,999 | 775 (5.4%) | 800 (6.8%) |
| $45,000 to $49,999 | 364 (2.5%) | 640 (5.4%) |
| $50,000 to $54,999 | 981 (6.9%) | 533 (4.5%) |
| $55,000 to $64,999 | 1,341 (9.4%) | 667 (5.7%) |
| $65,000 to $74,999 | 964 (6.7%) | 351 (3.0%) |
| $75,000 to $99,999 | 1,310 (9.2%) | 479 (4.1%) |
| $100,000+ | 1,573 (11.0%) | 303 (2.6%) |
| Total | 14,296 (100.0%) | 11,769 (100.0%) |
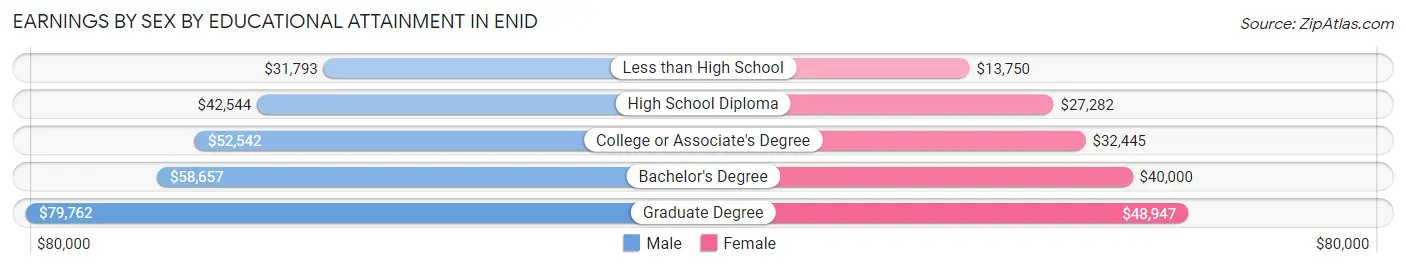
Earnings by Sex by Educational Attainment in Enid
Average earnings in Enid are $48,873 for men and $31,882 for women, a difference of 34.8%. Men with an educational attainment of graduate degree enjoy the highest average annual earnings of $79,762, while those with less than high school education earn the least with $31,793. Women with an educational attainment of graduate degree earn the most with the average annual earnings of $48,947, while those with less than high school education have the smallest earnings of $13,750.
| Educational Attainment | Male Income | Female Income |
| Less than High School | $31,793 | $13,750 |
| High School Diploma | $42,544 | $27,282 |
| College or Associate's Degree | $52,542 | $32,445 |
| Bachelor's Degree | $58,657 | $40,000 |
| Graduate Degree | $79,762 | $48,947 |
| Total | $48,873 | $31,882 |
Family Income in Enid
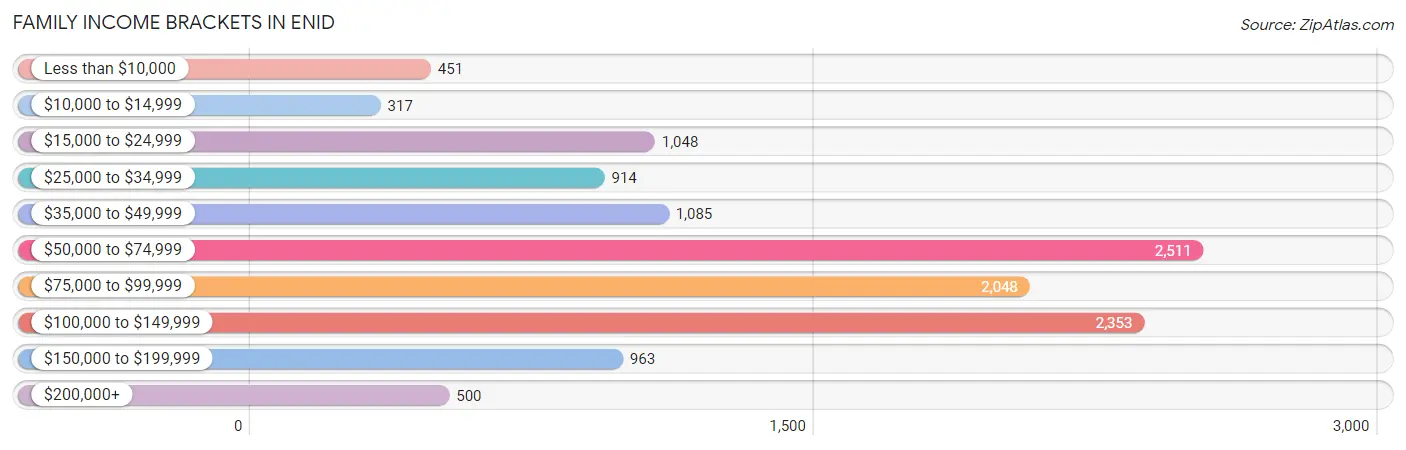
Family Income Brackets in Enid
According to the Enid family income data, there are 2,511 families falling into the $50,000 to $74,999 income range, which is the most common income bracket and makes up 20.6% of all families. Conversely, the $10,000 to $14,999 income bracket is the least frequent group with only 317 families (2.6%) belonging to this category.
| Income Bracket | # Families | % Families |
| Less than $10,000 | 451 | 3.7% |
| $10,000 to $14,999 | 317 | 2.6% |
| $15,000 to $24,999 | 1,048 | 8.6% |
| $25,000 to $34,999 | 914 | 7.5% |
| $35,000 to $49,999 | 1,085 | 8.9% |
| $50,000 to $74,999 | 2,511 | 20.6% |
| $75,000 to $99,999 | 2,048 | 16.8% |
| $100,000 to $149,999 | 2,353 | 19.3% |
| $150,000 to $199,999 | 963 | 7.9% |
| $200,000+ | 500 | 4.1% |
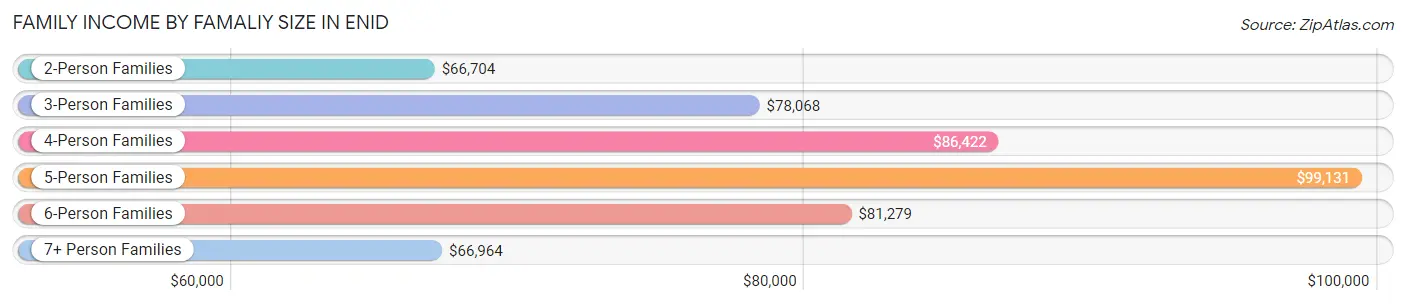
Family Income by Famaliy Size in Enid
5-person families (843 | 6.9%) account for the highest median family income in Enid with $99,131 per family, while 2-person families (6,470 | 53.1%) have the highest median income of $33,352 per family member.
| Income Bracket | # Families | Median Income |
| 2-Person Families | 6,470 (53.1%) | $66,704 |
| 3-Person Families | 2,028 (16.6%) | $78,068 |
| 4-Person Families | 1,956 (16.0%) | $86,422 |
| 5-Person Families | 843 (6.9%) | $99,131 |
| 6-Person Families | 390 (3.2%) | $81,279 |
| 7+ Person Families | 504 (4.1%) | $66,964 |
| Total | 12,191 (100.0%) | $72,115 |
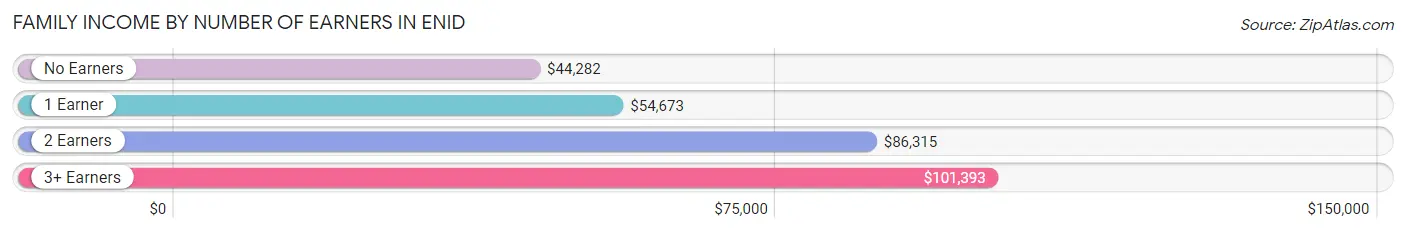
Family Income by Number of Earners in Enid
The median family income in Enid is $72,115, with families comprising 3+ earners (1,274) having the highest median family income of $101,393, while families with no earners (1,899) have the lowest median family income of $44,282, accounting for 10.4% and 15.6% of families, respectively.
| Number of Earners | # Families | Median Income |
| No Earners | 1,899 (15.6%) | $44,282 |
| 1 Earner | 4,297 (35.2%) | $54,673 |
| 2 Earners | 4,721 (38.7%) | $86,315 |
| 3+ Earners | 1,274 (10.4%) | $101,393 |
| Total | 12,191 (100.0%) | $72,115 |
Household Income in Enid
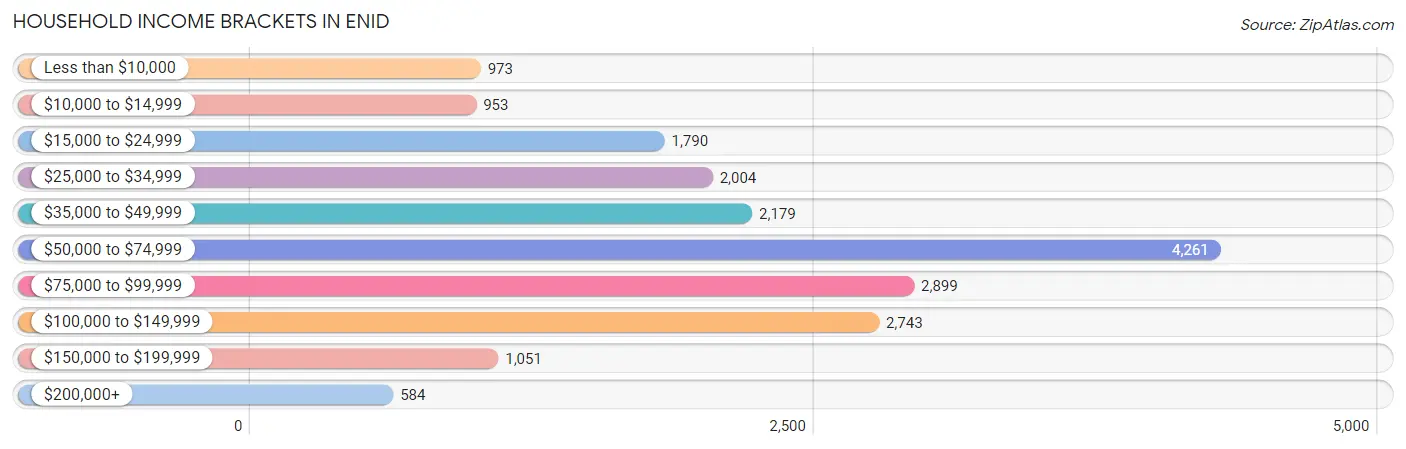
Household Income Brackets in Enid
With 4,261 households falling in the category, the $50,000 to $74,999 income range is the most frequent in Enid, accounting for 21.9% of all households. In contrast, only 584 households (3.0%) fall into the $200,000+ income bracket, making it the least populous group.
| Income Bracket | # Households | % Households |
| Less than $10,000 | 973 | 5.0% |
| $10,000 to $14,999 | 953 | 4.9% |
| $15,000 to $24,999 | 1,790 | 9.2% |
| $25,000 to $34,999 | 2,004 | 10.3% |
| $35,000 to $49,999 | 2,179 | 11.2% |
| $50,000 to $74,999 | 4,261 | 21.9% |
| $75,000 to $99,999 | 2,899 | 14.9% |
| $100,000 to $149,999 | 2,743 | 14.1% |
| $150,000 to $199,999 | 1,051 | 5.4% |
| $200,000+ | 584 | 3.0% |
Household Income by Householder Age in Enid
The median household income in Enid is $60,790, with the highest median household income of $65,379 found in the 45 to 64 years age bracket for the primary householder. A total of 5,955 households (30.6%) fall into this category. Meanwhile, the 15 to 24 years age bracket for the primary householder has the lowest median household income of $48,154, with 1,178 households (6.0%) in this group.
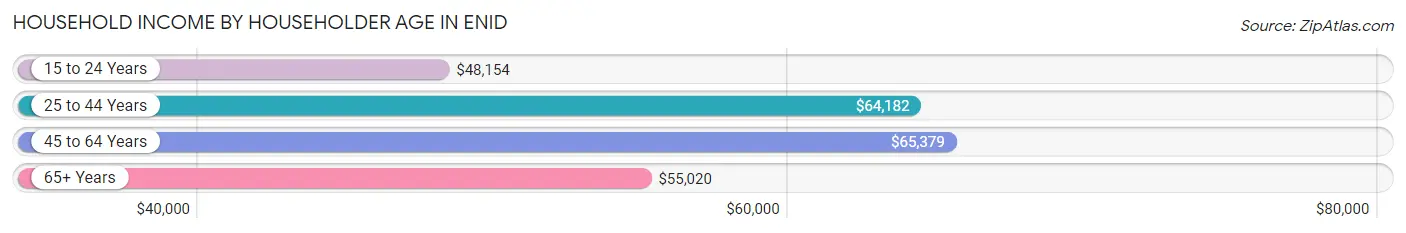
| Income Bracket | # Households | Median Income |
| 15 to 24 Years | 1,178 (6.0%) | $48,154 |
| 25 to 44 Years | 7,016 (36.1%) | $64,182 |
| 45 to 64 Years | 5,955 (30.6%) | $65,379 |
| 65+ Years | 5,307 (27.3%) | $55,020 |
| Total | 19,456 (100.0%) | $60,790 |
Poverty in Enid
Income Below Poverty by Sex and Age in Enid
With 13.9% poverty level for males and 17.5% for females among the residents of Enid, 6 to 11 year old males and 5 year old females are the most vulnerable to poverty, with 521 males (21.6%) and 112 females (37.3%) in their respective age groups living below the poverty level.
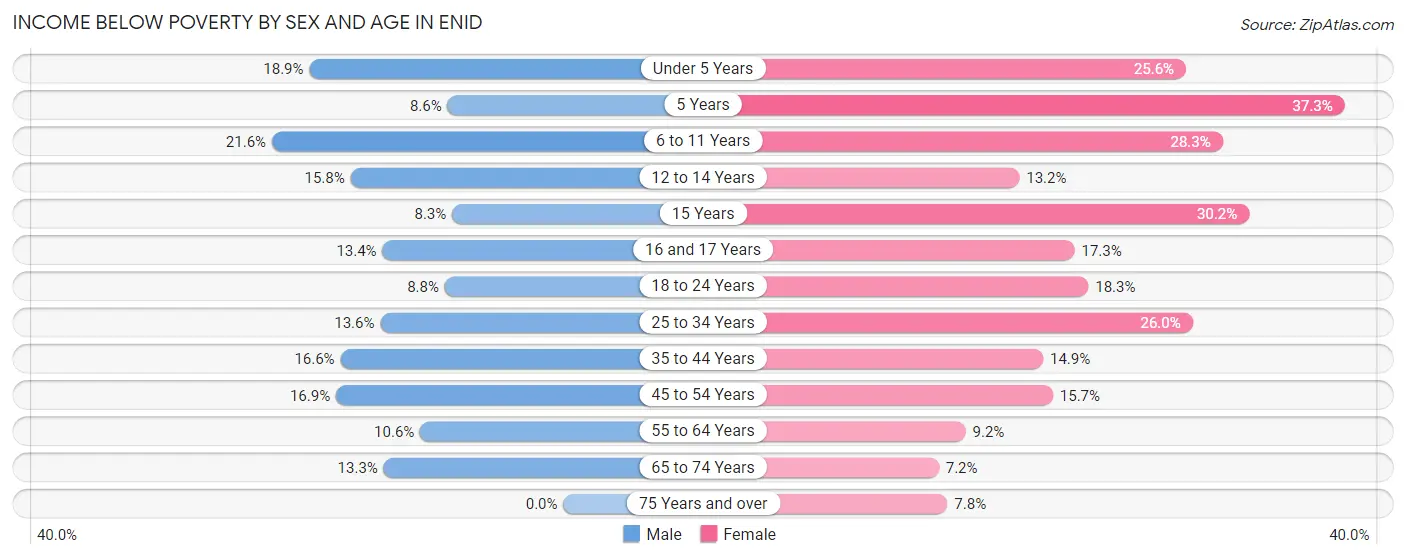
| Age Bracket | Male | Female |
| Under 5 Years | 304 (18.9%) | 467 (25.6%) |
| 5 Years | 19 (8.6%) | 112 (37.3%) |
| 6 to 11 Years | 521 (21.6%) | 620 (28.3%) |
| 12 to 14 Years | 162 (15.8%) | 116 (13.2%) |
| 15 Years | 44 (8.3%) | 140 (30.2%) |
| 16 and 17 Years | 90 (13.4%) | 118 (17.3%) |
| 18 to 24 Years | 215 (8.8%) | 371 (18.3%) |
| 25 to 34 Years | 499 (13.6%) | 930 (26.0%) |
| 35 to 44 Years | 558 (16.6%) | 442 (14.9%) |
| 45 to 54 Years | 423 (16.9%) | 365 (15.7%) |
| 55 to 64 Years | 303 (10.6%) | 288 (9.2%) |
| 65 to 74 Years | 273 (13.3%) | 141 (7.2%) |
| 75 Years and over | 0 (0.0%) | 170 (7.8%) |
| Total | 3,411 (13.9%) | 4,280 (17.5%) |
Income Above Poverty by Sex and Age in Enid
According to the poverty statistics in Enid, males aged 75 years and over and females aged 65 to 74 years are the age groups that are most secure financially, with 100.0% of males and 92.8% of females in these age groups living above the poverty line.
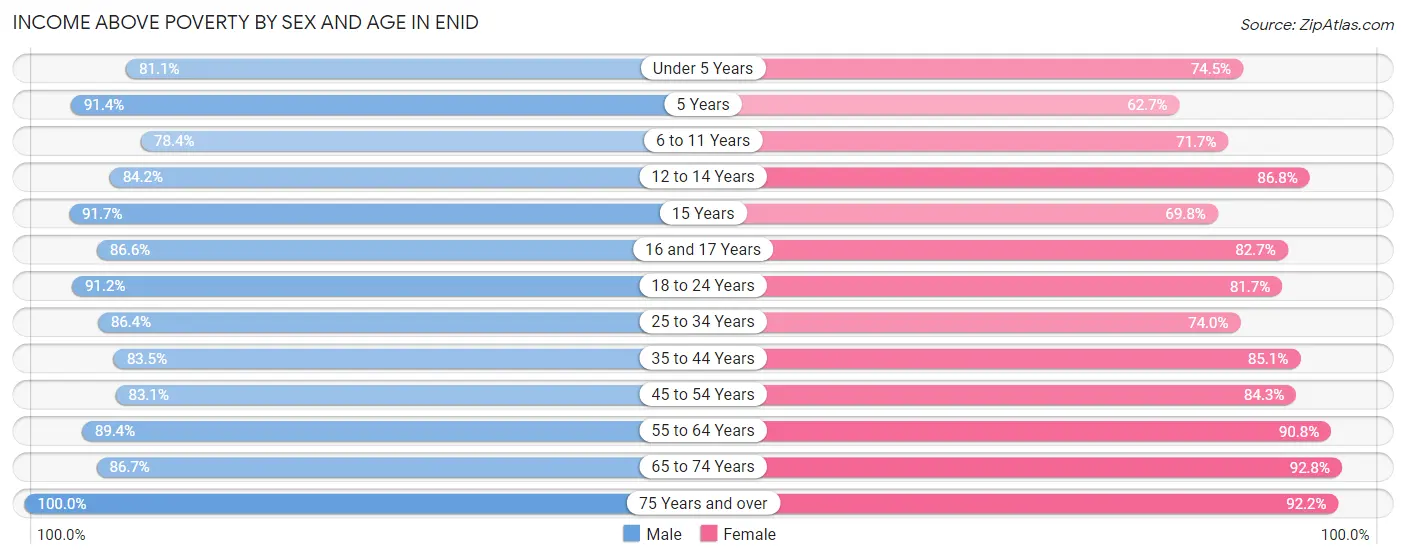
| Age Bracket | Male | Female |
| Under 5 Years | 1,308 (81.1%) | 1,361 (74.5%) |
| 5 Years | 202 (91.4%) | 188 (62.7%) |
| 6 to 11 Years | 1,887 (78.4%) | 1,573 (71.7%) |
| 12 to 14 Years | 863 (84.2%) | 764 (86.8%) |
| 15 Years | 489 (91.7%) | 323 (69.8%) |
| 16 and 17 Years | 580 (86.6%) | 565 (82.7%) |
| 18 to 24 Years | 2,229 (91.2%) | 1,656 (81.7%) |
| 25 to 34 Years | 3,172 (86.4%) | 2,642 (74.0%) |
| 35 to 44 Years | 2,813 (83.5%) | 2,516 (85.1%) |
| 45 to 54 Years | 2,083 (83.1%) | 1,965 (84.3%) |
| 55 to 64 Years | 2,548 (89.4%) | 2,845 (90.8%) |
| 65 to 74 Years | 1,774 (86.7%) | 1,817 (92.8%) |
| 75 Years and over | 1,203 (100.0%) | 1,998 (92.2%) |
| Total | 21,151 (86.1%) | 20,213 (82.5%) |
Income Below Poverty Among Married-Couple Families in Enid
The poverty statistics for married-couple families in Enid show that 7.4% or 668 of the total 8,981 families live below the poverty line. Families with 5 or more children have the highest poverty rate of 17.6%, comprising of 19 families. On the other hand, families with 1 or 2 children have the lowest poverty rate of 3.7%, which includes 85 families.
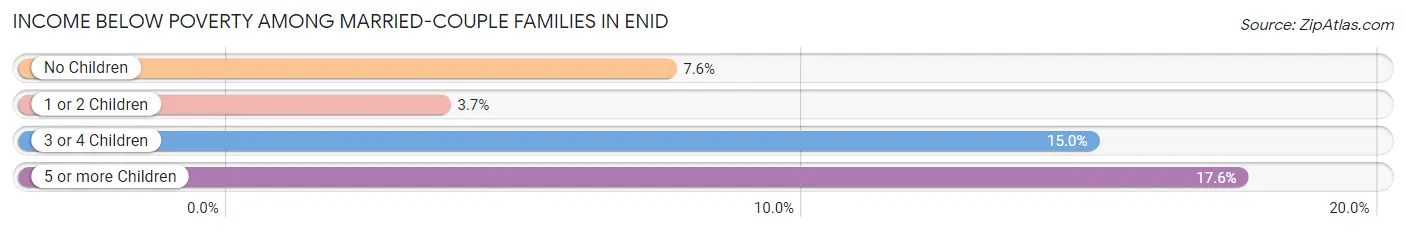
| Children | Above Poverty | Below Poverty |
| No Children | 5,292 (92.4%) | 437 (7.6%) |
| 1 or 2 Children | 2,212 (96.3%) | 85 (3.7%) |
| 3 or 4 Children | 720 (85.0%) | 127 (15.0%) |
| 5 or more Children | 89 (82.4%) | 19 (17.6%) |
| Total | 8,313 (92.6%) | 668 (7.4%) |
Income Below Poverty Among Single-Parent Households in Enid
According to the poverty data in Enid, 14.7% or 148 single-father households and 33.3% or 734 single-mother households are living below the poverty line. Among single-father households, those with 1 or 2 children have the highest poverty rate, with 87 households (16.7%) experiencing poverty. Likewise, among single-mother households, those with 5 or more children have the highest poverty rate, with 181 households (74.2%) falling below the poverty line.
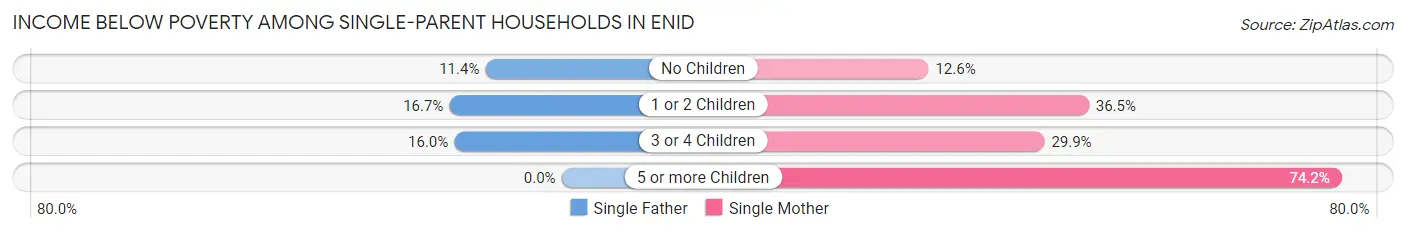
| Children | Single Father | Single Mother |
| No Children | 41 (11.4%) | 77 (12.6%) |
| 1 or 2 Children | 87 (16.7%) | 397 (36.5%) |
| 3 or 4 Children | 20 (16.0%) | 79 (29.9%) |
| 5 or more Children | 0 (0.0%) | 181 (74.2%) |
| Total | 148 (14.7%) | 734 (33.3%) |
Income Below Poverty Among Married-Couple vs Single-Parent Households in Enid
The poverty data for Enid shows that 668 of the married-couple family households (7.4%) and 882 of the single-parent households (27.5%) are living below the poverty level. Within the married-couple family households, those with 5 or more children have the highest poverty rate, with 19 households (17.6%) falling below the poverty line. Among the single-parent households, those with 5 or more children have the highest poverty rate, with 181 household (74.2%) living below poverty.

| Children | Married-Couple Families | Single-Parent Households |
| No Children | 437 (7.6%) | 118 (12.2%) |
| 1 or 2 Children | 85 (3.7%) | 484 (30.1%) |
| 3 or 4 Children | 127 (15.0%) | 99 (25.5%) |
| 5 or more Children | 19 (17.6%) | 181 (74.2%) |
| Total | 668 (7.4%) | 882 (27.5%) |
Race in Enid
The most populous races in Enid are White / Caucasian (37,945 | 74.5%), Hispanic or Latino (7,932 | 15.6%), and Two or more Races (4,621 | 9.1%).
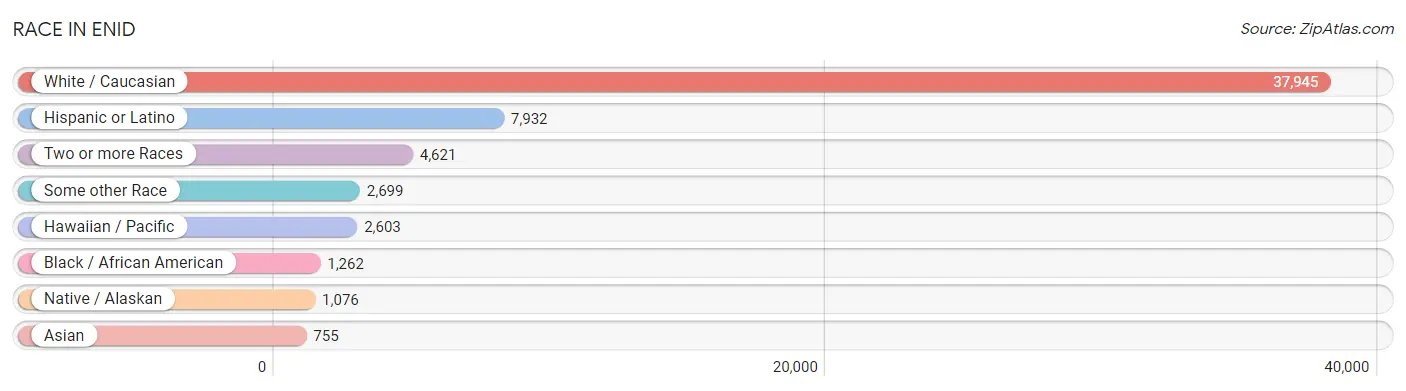
| Race | # Population | % Population |
| Asian | 755 | 1.5% |
| Black / African American | 1,262 | 2.5% |
| Hawaiian / Pacific | 2,603 | 5.1% |
| Hispanic or Latino | 7,932 | 15.6% |
| Native / Alaskan | 1,076 | 2.1% |
| White / Caucasian | 37,945 | 74.5% |
| Two or more Races | 4,621 | 9.1% |
| Some other Race | 2,699 | 5.3% |
| Total | 50,961 | 100.0% |
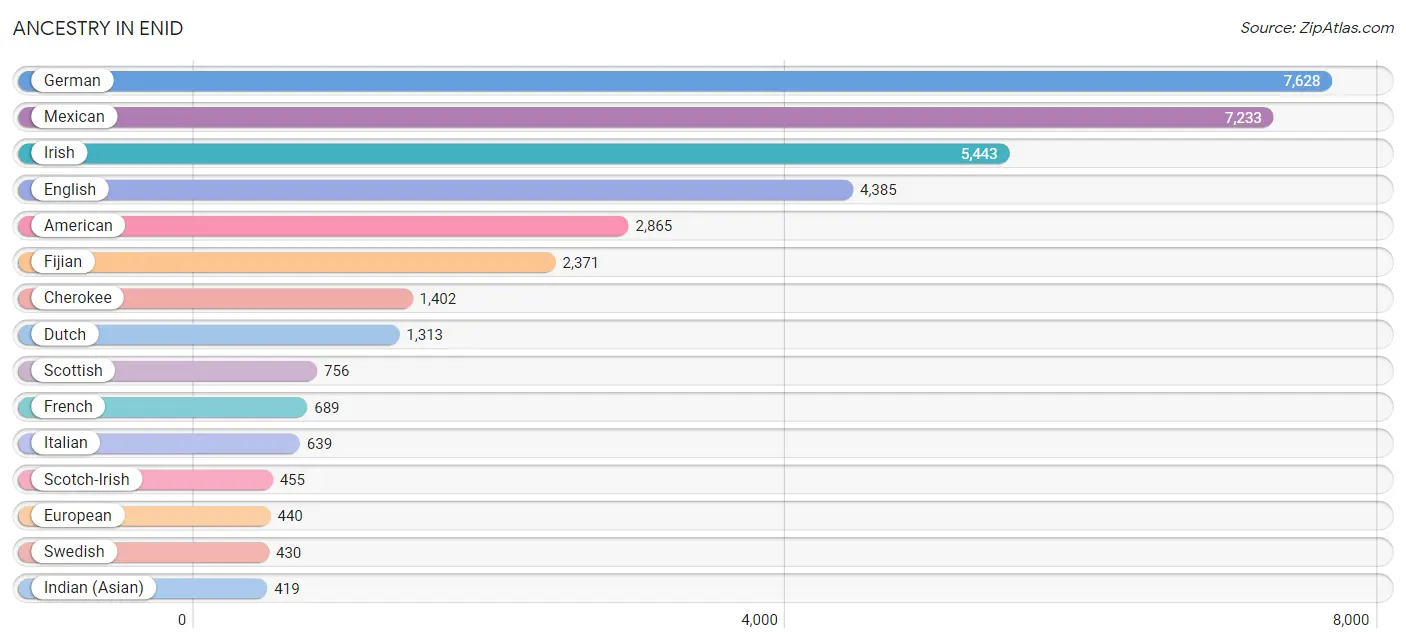
Ancestry in Enid
The most populous ancestries reported in Enid are German (7,628 | 15.0%), Mexican (7,233 | 14.2%), Irish (5,443 | 10.7%), English (4,385 | 8.6%), and American (2,865 | 5.6%), together accounting for 54.1% of all Enid residents.
| Ancestry | # Population | % Population |
| Afghan | 18 | 0.0% |
| African | 44 | 0.1% |
| American | 2,865 | 5.6% |
| Apache | 9 | 0.0% |
| Arab | 280 | 0.5% |
| Arapaho | 18 | 0.0% |
| Australian | 40 | 0.1% |
| Austrian | 3 | 0.0% |
| Bangladeshi | 98 | 0.2% |
| Belgian | 19 | 0.0% |
| Bhutanese | 130 | 0.3% |
| Blackfeet | 28 | 0.1% |
| British | 136 | 0.3% |
| Bulgarian | 36 | 0.1% |
| Burmese | 71 | 0.1% |
| Celtic | 41 | 0.1% |
| Central American | 358 | 0.7% |
| Central American Indian | 2 | 0.0% |
| Cherokee | 1,402 | 2.8% |
| Cheyenne | 23 | 0.1% |
| Chickasaw | 66 | 0.1% |
| Choctaw | 205 | 0.4% |
| Colombian | 14 | 0.0% |
| Comanche | 36 | 0.1% |
| Costa Rican | 40 | 0.1% |
| Creek | 43 | 0.1% |
| Crow | 5 | 0.0% |
| Cuban | 11 | 0.0% |
| Czech | 408 | 0.8% |
| Czechoslovakian | 92 | 0.2% |
| Danish | 41 | 0.1% |
| Dutch | 1,313 | 2.6% |
| Eastern European | 48 | 0.1% |
| English | 4,385 | 8.6% |
| European | 440 | 0.9% |
| Fijian | 2,371 | 4.6% |
| Filipino | 47 | 0.1% |
| Finnish | 3 | 0.0% |
| French | 689 | 1.3% |
| French Canadian | 126 | 0.3% |
| German | 7,628 | 15.0% |
| Greek | 73 | 0.1% |
| Guatemalan | 210 | 0.4% |
| Guyanese | 19 | 0.0% |
| Hungarian | 3 | 0.0% |
| Indian (Asian) | 419 | 0.8% |
| Iranian | 36 | 0.1% |
| Irish | 5,443 | 10.7% |
| Iroquois | 8 | 0.0% |
| Italian | 639 | 1.3% |
| Jamaican | 56 | 0.1% |
| Kiowa | 72 | 0.1% |
| Korean | 82 | 0.2% |
| Lebanese | 208 | 0.4% |
| Lithuanian | 14 | 0.0% |
| Macedonian | 6 | 0.0% |
| Maltese | 22 | 0.0% |
| Marshallese | 279 | 0.5% |
| Mexican | 7,233 | 14.2% |
| Mexican American Indian | 246 | 0.5% |
| Moroccan | 6 | 0.0% |
| Native Hawaiian | 63 | 0.1% |
| Navajo | 154 | 0.3% |
| Nicaraguan | 39 | 0.1% |
| Nigerian | 56 | 0.1% |
| Northern European | 32 | 0.1% |
| Norwegian | 390 | 0.8% |
| Osage | 13 | 0.0% |
| Ottawa | 2 | 0.0% |
| Pakistani | 16 | 0.0% |
| Paraguayan | 14 | 0.0% |
| Pennsylvania German | 84 | 0.2% |
| Pima | 108 | 0.2% |
| Polish | 296 | 0.6% |
| Portuguese | 12 | 0.0% |
| Potawatomi | 4 | 0.0% |
| Pueblo | 8 | 0.0% |
| Puerto Rican | 172 | 0.3% |
| Russian | 171 | 0.3% |
| Salvadoran | 69 | 0.1% |
| Scandinavian | 110 | 0.2% |
| Scotch-Irish | 455 | 0.9% |
| Scottish | 756 | 1.5% |
| Seminole | 10 | 0.0% |
| Serbian | 29 | 0.1% |
| Sioux | 70 | 0.1% |
| South African | 9 | 0.0% |
| South American | 28 | 0.1% |
| Spaniard | 8 | 0.0% |
| Sri Lankan | 35 | 0.1% |
| Subsaharan African | 109 | 0.2% |
| Swedish | 430 | 0.8% |
| Swiss | 149 | 0.3% |
| Syrian | 66 | 0.1% |
| Thai | 110 | 0.2% |
| Turkish | 14 | 0.0% |
| Ukrainian | 18 | 0.0% |
| Welsh | 258 | 0.5% |
| West Indian | 8 | 0.0% | View All 99 Rows |
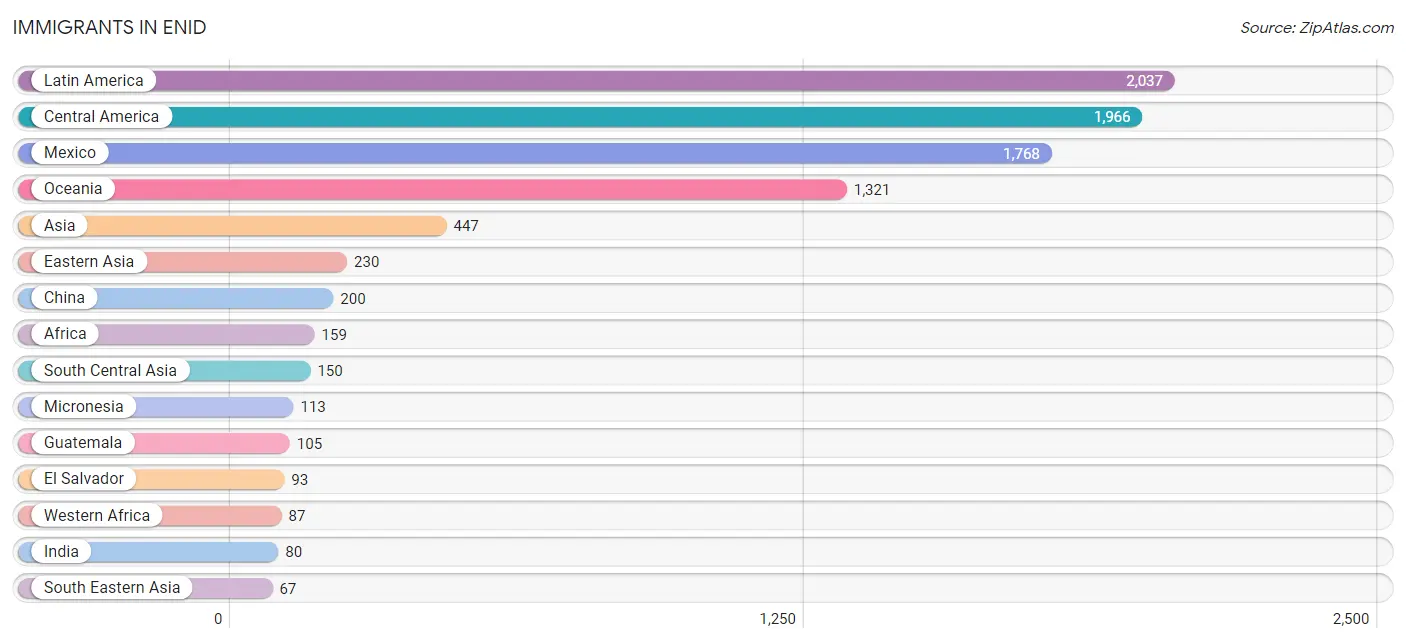
Immigrants in Enid
The most numerous immigrant groups reported in Enid came from Latin America (2,037 | 4.0%), Central America (1,966 | 3.9%), Mexico (1,768 | 3.5%), Oceania (1,321 | 2.6%), and Asia (447 | 0.9%), together accounting for 14.8% of all Enid residents.
| Immigration Origin | # Population | % Population |
| Afghanistan | 33 | 0.1% |
| Africa | 159 | 0.3% |
| Asia | 447 | 0.9% |
| Australia | 13 | 0.0% |
| Brazil | 9 | 0.0% |
| Caribbean | 34 | 0.1% |
| Central America | 1,966 | 3.9% |
| China | 200 | 0.4% |
| Colombia | 14 | 0.0% |
| Eastern Asia | 230 | 0.4% |
| Eastern Europe | 10 | 0.0% |
| El Salvador | 93 | 0.2% |
| England | 19 | 0.0% |
| Europe | 56 | 0.1% |
| Germany | 27 | 0.1% |
| Ghana | 24 | 0.1% |
| Guatemala | 105 | 0.2% |
| Hong Kong | 18 | 0.0% |
| India | 80 | 0.2% |
| Iran | 34 | 0.1% |
| Jamaica | 34 | 0.1% |
| Japan | 4 | 0.0% |
| Korea | 26 | 0.1% |
| Laos | 16 | 0.0% |
| Latin America | 2,037 | 4.0% |
| Mexico | 1,768 | 3.5% |
| Micronesia | 113 | 0.2% |
| Morocco | 6 | 0.0% |
| Nigeria | 56 | 0.1% |
| Northern Africa | 6 | 0.0% |
| Northern Europe | 19 | 0.0% |
| Oceania | 1,321 | 2.6% |
| Pakistan | 3 | 0.0% |
| Philippines | 13 | 0.0% |
| Russia | 10 | 0.0% |
| South Africa | 66 | 0.1% |
| South America | 37 | 0.1% |
| South Central Asia | 150 | 0.3% |
| South Eastern Asia | 67 | 0.1% |
| Thailand | 37 | 0.1% |
| Vietnam | 1 | 0.0% |
| Western Africa | 87 | 0.2% |
| Western Europe | 27 | 0.1% | View All 43 Rows |
Sex and Age in Enid
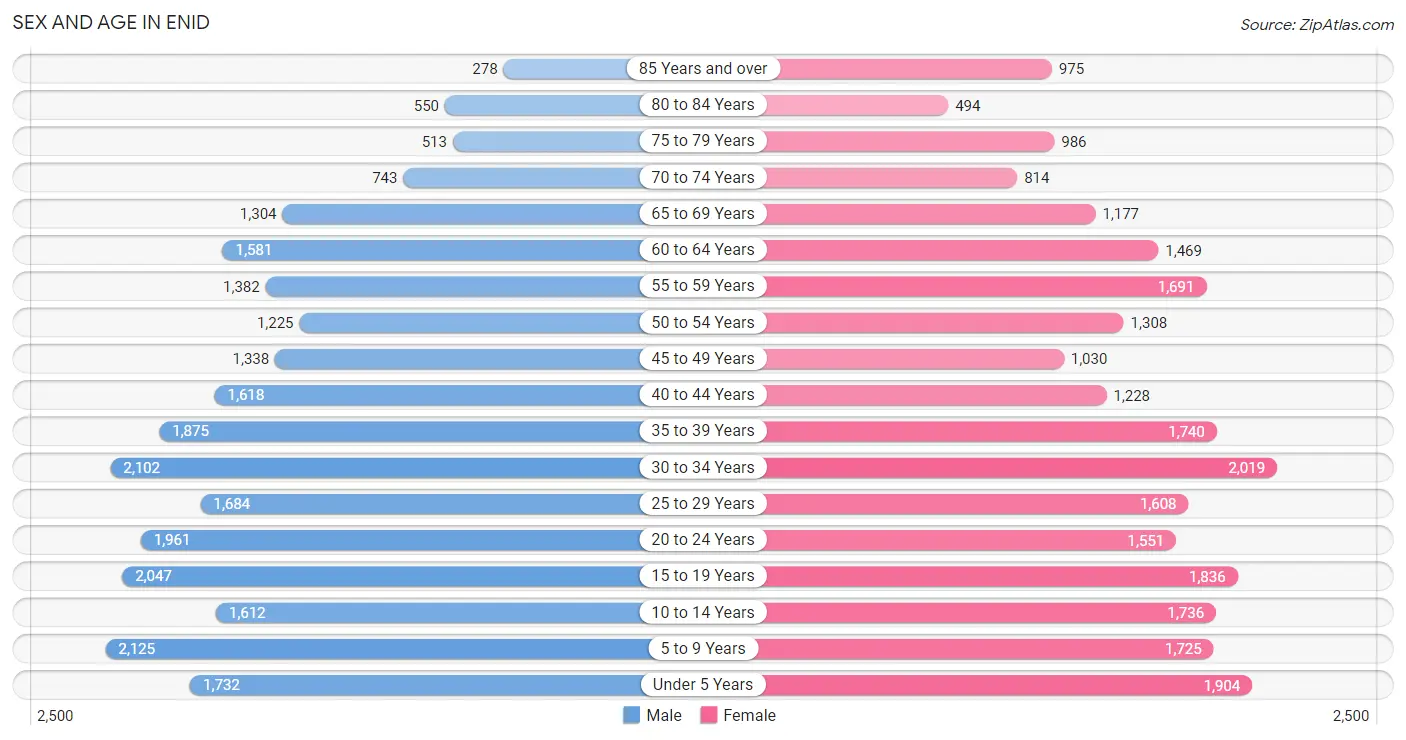
Sex and Age in Enid
The most populous age groups in Enid are 5 to 9 Years (2,125 | 8.3%) for men and 30 to 34 Years (2,019 | 8.0%) for women.
| Age Bracket | Male | Female |
| Under 5 Years | 1,732 (6.8%) | 1,904 (7.5%) |
| 5 to 9 Years | 2,125 (8.3%) | 1,725 (6.8%) |
| 10 to 14 Years | 1,612 (6.3%) | 1,736 (6.9%) |
| 15 to 19 Years | 2,047 (8.0%) | 1,836 (7.3%) |
| 20 to 24 Years | 1,961 (7.6%) | 1,551 (6.1%) |
| 25 to 29 Years | 1,684 (6.6%) | 1,608 (6.4%) |
| 30 to 34 Years | 2,102 (8.2%) | 2,019 (8.0%) |
| 35 to 39 Years | 1,875 (7.3%) | 1,740 (6.9%) |
| 40 to 44 Years | 1,618 (6.3%) | 1,228 (4.9%) |
| 45 to 49 Years | 1,338 (5.2%) | 1,030 (4.1%) |
| 50 to 54 Years | 1,225 (4.8%) | 1,308 (5.2%) |
| 55 to 59 Years | 1,382 (5.4%) | 1,691 (6.7%) |
| 60 to 64 Years | 1,581 (6.2%) | 1,469 (5.8%) |
| 65 to 69 Years | 1,304 (5.1%) | 1,177 (4.6%) |
| 70 to 74 Years | 743 (2.9%) | 814 (3.2%) |
| 75 to 79 Years | 513 (2.0%) | 986 (3.9%) |
| 80 to 84 Years | 550 (2.1%) | 494 (1.9%) |
| 85 Years and over | 278 (1.1%) | 975 (3.9%) |
| Total | 25,670 (100.0%) | 25,291 (100.0%) |
Families and Households in Enid
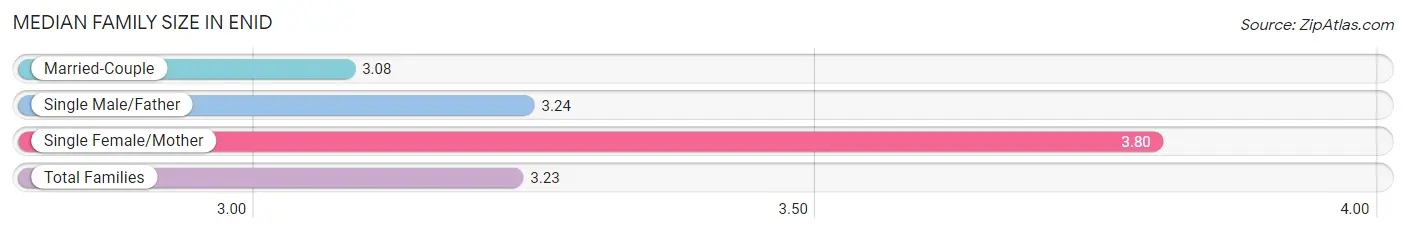
Median Family Size in Enid
The median family size in Enid is 3.23 persons per family, with single female/mother families (2,204 | 18.1%) accounting for the largest median family size of 3.8 persons per family. On the other hand, married-couple families (8,981 | 73.7%) represent the smallest median family size with 3.08 persons per family.
| Family Type | # Families | Family Size |
| Married-Couple | 8,981 (73.7%) | 3.08 |
| Single Male/Father | 1,006 (8.3%) | 3.24 |
| Single Female/Mother | 2,204 (18.1%) | 3.80 |
| Total Families | 12,191 (100.0%) | 3.23 |
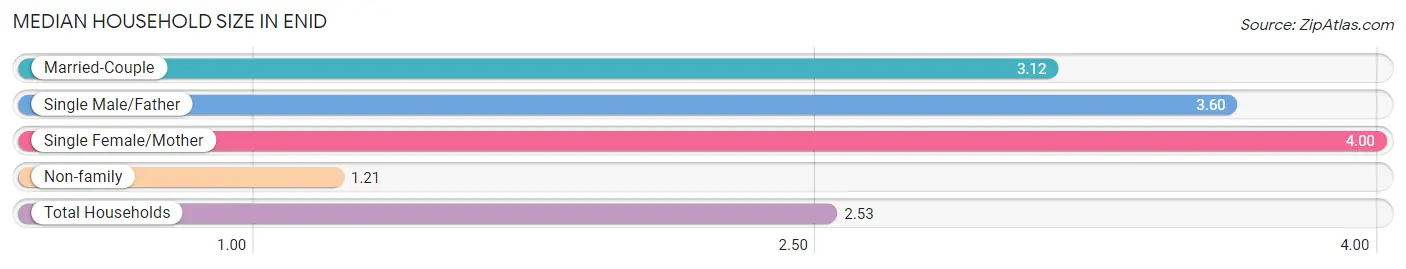
Median Household Size in Enid
The median household size in Enid is 2.53 persons per household, with single female/mother households (2,204 | 11.3%) accounting for the largest median household size of 4 persons per household. non-family households (7,265 | 37.3%) represent the smallest median household size with 1.21 persons per household.
| Household Type | # Households | Household Size |
| Married-Couple | 8,981 (46.2%) | 3.12 |
| Single Male/Father | 1,006 (5.2%) | 3.60 |
| Single Female/Mother | 2,204 (11.3%) | 4.00 |
| Non-family | 7,265 (37.3%) | 1.21 |
| Total Households | 19,456 (100.0%) | 2.53 |
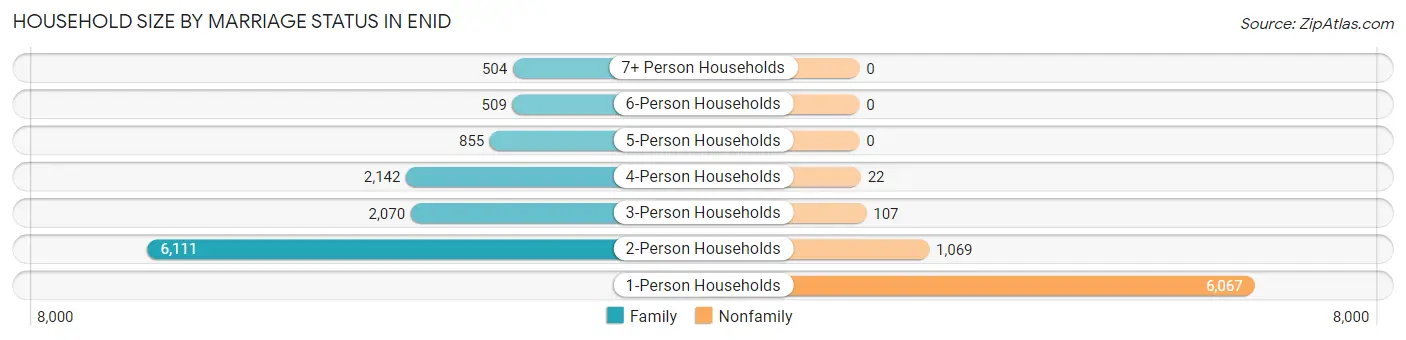
Household Size by Marriage Status in Enid
Out of a total of 19,456 households in Enid, 12,191 (62.7%) are family households, while 7,265 (37.3%) are nonfamily households. The most numerous type of family households are 2-person households, comprising 6,111, and the most common type of nonfamily households are 1-person households, comprising 6,067.
| Household Size | Family Households | Nonfamily Households |
| 1-Person Households | - | 6,067 (31.2%) |
| 2-Person Households | 6,111 (31.4%) | 1,069 (5.5%) |
| 3-Person Households | 2,070 (10.6%) | 107 (0.5%) |
| 4-Person Households | 2,142 (11.0%) | 22 (0.1%) |
| 5-Person Households | 855 (4.4%) | 0 (0.0%) |
| 6-Person Households | 509 (2.6%) | 0 (0.0%) |
| 7+ Person Households | 504 (2.6%) | 0 (0.0%) |
| Total | 12,191 (62.7%) | 7,265 (37.3%) |
Female Fertility in Enid
Fertility by Age in Enid
Average fertility rate in Enid is 71.0 births per 1,000 women. Women in the age bracket of 15 to 19 years have the highest fertility rate with 84.0 births per 1,000 women. Women in the age bracket of 20 to 34 years acount for 51.8% of all women with births.
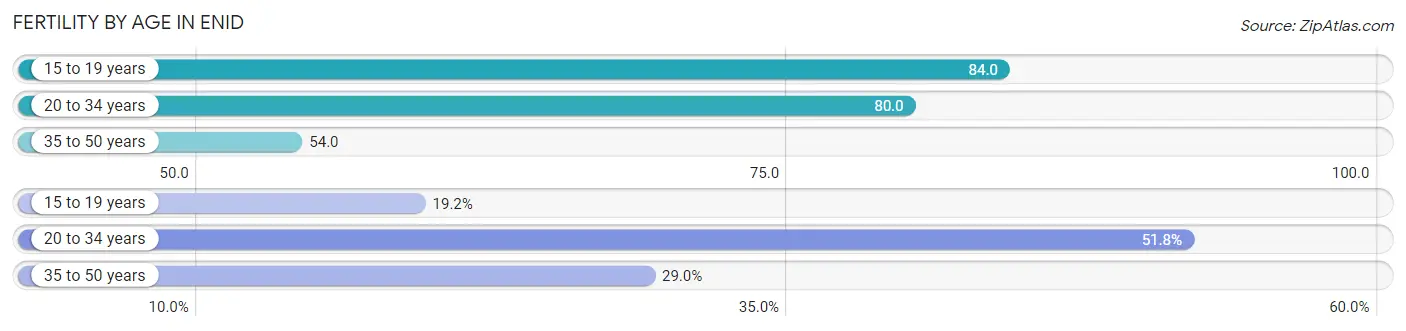
| Age Bracket | Women with Births | Births / 1,000 Women |
| 15 to 19 years | 154 (19.2%) | 84.0 |
| 20 to 34 years | 415 (51.8%) | 80.0 |
| 35 to 50 years | 232 (29.0%) | 54.0 |
| Total | 801 (100.0%) | 71.0 |
Fertility by Age by Marriage Status in Enid
77.5% of women with births (801) in Enid are married. The highest percentage of unmarried women with births falls into 20 to 34 years age bracket with 35.2% of them unmarried at the time of birth, while the lowest percentage of unmarried women with births belong to 35 to 50 years age bracket with 0.0% of them unmarried.
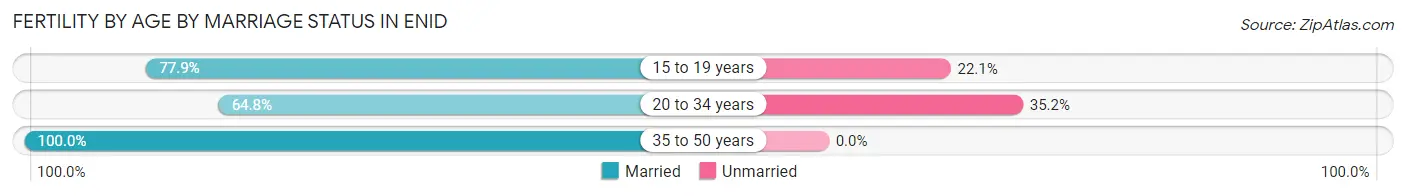
| Age Bracket | Married | Unmarried |
| 15 to 19 years | 120 (77.9%) | 34 (22.1%) |
| 20 to 34 years | 269 (64.8%) | 146 (35.2%) |
| 35 to 50 years | 232 (100.0%) | 0 (0.0%) |
| Total | 621 (77.5%) | 180 (22.5%) |
Fertility by Education in Enid
Average fertility rate in Enid is 71.0 births per 1,000 women. Women with the education attainment of graduate degree have the highest fertility rate of 130.0 births per 1,000 women, while women with the education attainment of college or associate's degree have the lowest fertility at 52.0 births per 1,000 women. Women with the education attainment of high school diploma represent 28.1% of all women with births.
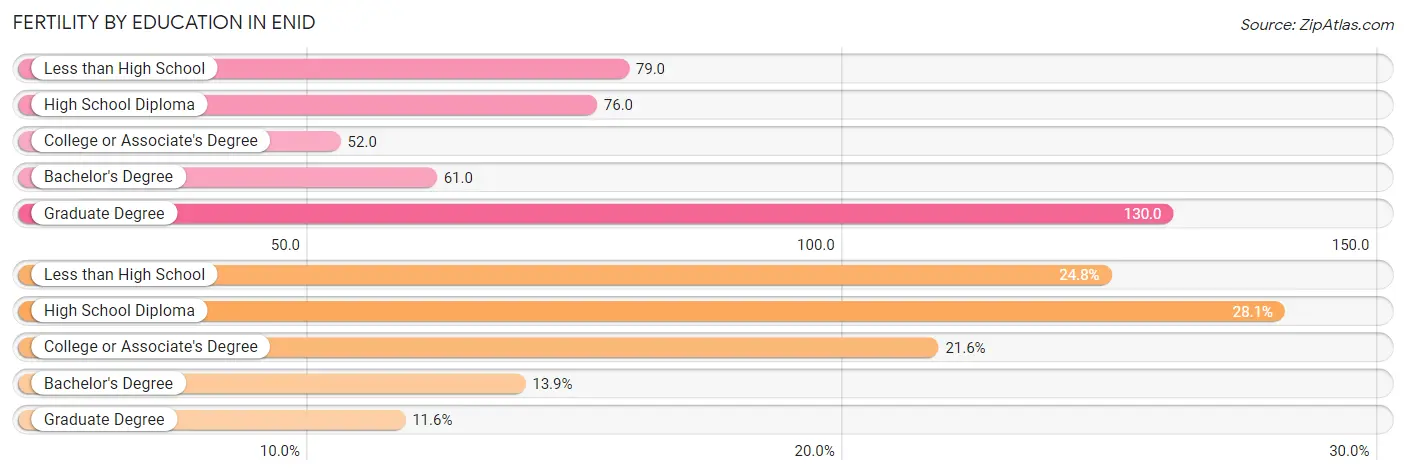
| Educational Attainment | Women with Births | Births / 1,000 Women |
| Less than High School | 199 (24.8%) | 79.0 |
| High School Diploma | 225 (28.1%) | 76.0 |
| College or Associate's Degree | 173 (21.6%) | 52.0 |
| Bachelor's Degree | 111 (13.9%) | 61.0 |
| Graduate Degree | 93 (11.6%) | 130.0 |
| Total | 801 (100.0%) | 71.0 |
Fertility by Education by Marriage Status in Enid
22.5% of women with births in Enid are unmarried. Women with the educational attainment of bachelor's degree are most likely to be married with 100.0% of them married at childbirth, while women with the educational attainment of college or associate's degree are least likely to be married with 51.4% of them unmarried at childbirth.
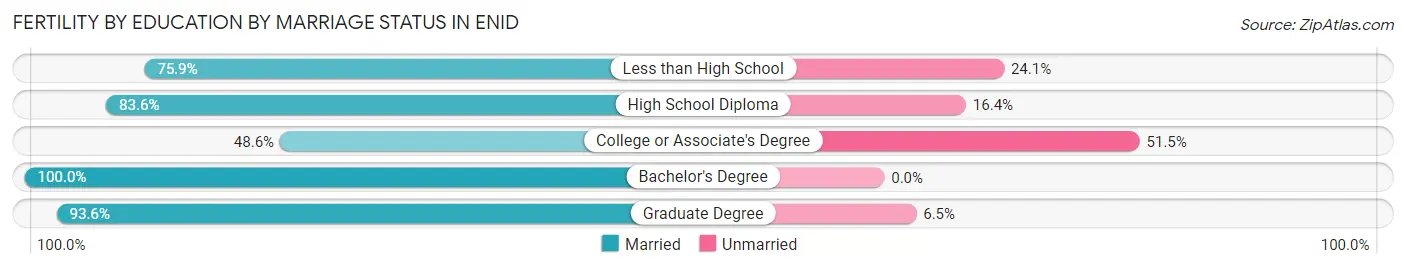
| Educational Attainment | Married | Unmarried |
| Less than High School | 151 (75.9%) | 48 (24.1%) |
| High School Diploma | 188 (83.6%) | 37 (16.4%) |
| College or Associate's Degree | 84 (48.5%) | 89 (51.4%) |
| Bachelor's Degree | 111 (100.0%) | 0 (0.0%) |
| Graduate Degree | 87 (93.5%) | 6 (6.5%) |
| Total | 621 (77.5%) | 180 (22.5%) |
Employment Characteristics in Enid
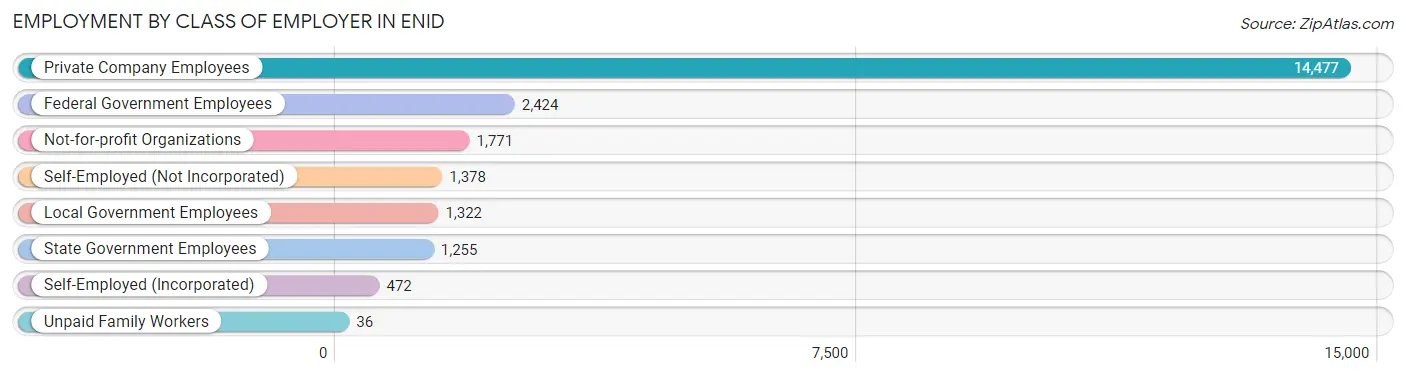
Employment by Class of Employer in Enid
Among the 23,135 employed individuals in Enid, private company employees (14,477 | 62.6%), federal government employees (2,424 | 10.5%), and not-for-profit organizations (1,771 | 7.7%) make up the most common classes of employment.
| Employer Class | # Employees | % Employees |
| Private Company Employees | 14,477 | 62.6% |
| Self-Employed (Incorporated) | 472 | 2.0% |
| Self-Employed (Not Incorporated) | 1,378 | 6.0% |
| Not-for-profit Organizations | 1,771 | 7.7% |
| Local Government Employees | 1,322 | 5.7% |
| State Government Employees | 1,255 | 5.4% |
| Federal Government Employees | 2,424 | 10.5% |
| Unpaid Family Workers | 36 | 0.2% |
| Total | 23,135 | 100.0% |
Employment Status by Age in Enid
According to the labor force statistics for Enid, out of the total population over 16 years of age (39,122), 63.9% or 24,999 individuals are in the labor force, with 4.7% or 1,175 of them unemployed. The age group with the highest labor force participation rate is 20 to 24 years, with 88.4% or 3,105 individuals in the labor force. Within the labor force, the 75 years and over age range has the highest percentage of unemployed individuals, with 8.6% or 28 of them being unemployed.
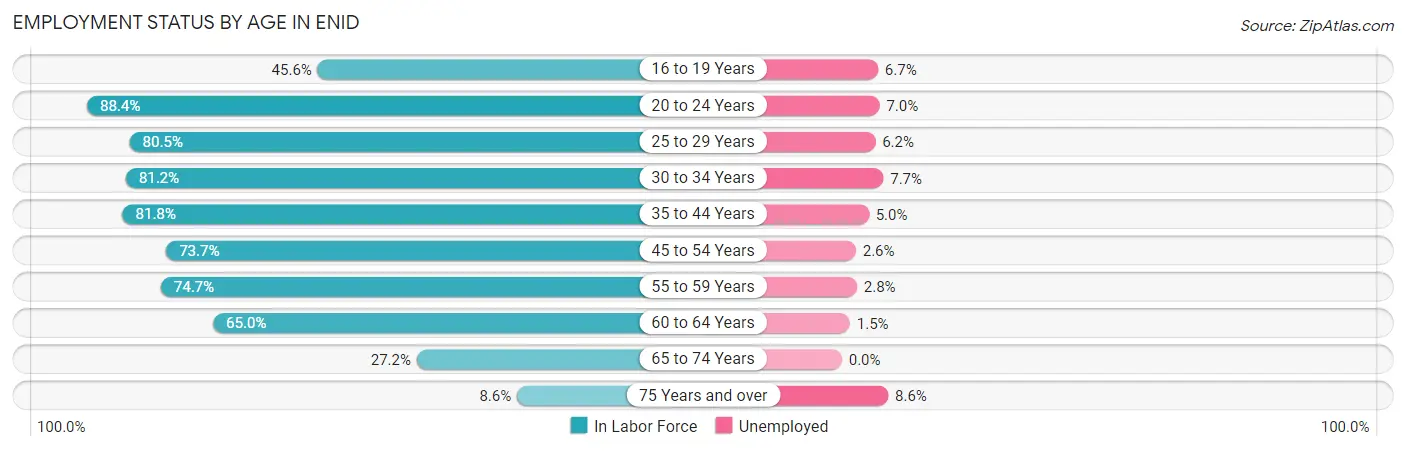
| Age Bracket | In Labor Force | Unemployed |
| 16 to 19 Years | 1,312 (45.6%) | 88 (6.7%) |
| 20 to 24 Years | 3,105 (88.4%) | 217 (7.0%) |
| 25 to 29 Years | 2,650 (80.5%) | 164 (6.2%) |
| 30 to 34 Years | 3,346 (81.2%) | 258 (7.7%) |
| 35 to 44 Years | 5,285 (81.8%) | 264 (5.0%) |
| 45 to 54 Years | 3,612 (73.7%) | 94 (2.6%) |
| 55 to 59 Years | 2,296 (74.7%) | 64 (2.8%) |
| 60 to 64 Years | 1,982 (65.0%) | 30 (1.5%) |
| 65 to 74 Years | 1,098 (27.2%) | 0 (0.0%) |
| 75 Years and over | 326 (8.6%) | 28 (8.6%) |
| Total | 24,999 (63.9%) | 1,175 (4.7%) |
Employment Status by Educational Attainment in Enid
According to labor force statistics for Enid, 77.0% of individuals (19,171) out of the total population between 25 and 64 years of age (24,898) are in the labor force, with 4.5% or 863 of them being unemployed. The group with the highest labor force participation rate are those with the educational attainment of bachelor's degree or higher, with 88.1% or 4,805 individuals in the labor force. Within the labor force, individuals with less than high school education have the highest percentage of unemployment, with 14.4% or 365 of them being unemployed.
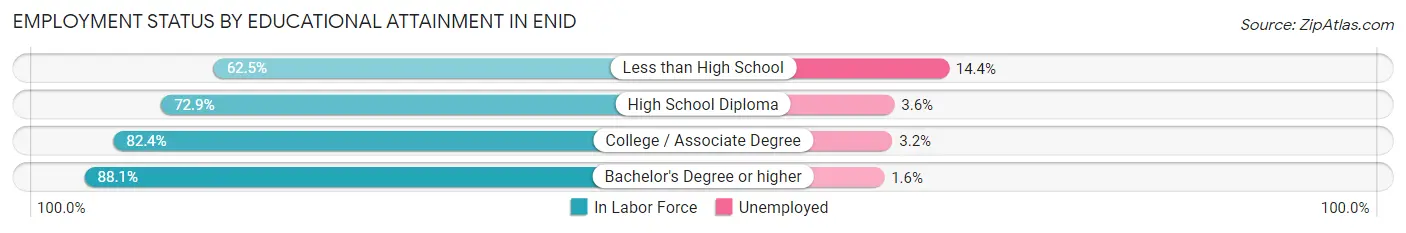
| Educational Attainment | In Labor Force | Unemployed |
| Less than High School | 2,538 (62.5%) | 585 (14.4%) |
| High School Diploma | 6,472 (72.9%) | 320 (3.6%) |
| College / Associate Degree | 5,360 (82.4%) | 208 (3.2%) |
| Bachelor's Degree or higher | 4,805 (88.1%) | 87 (1.6%) |
| Total | 19,171 (77.0%) | 1,120 (4.5%) |
Employment Occupations by Sex in Enid
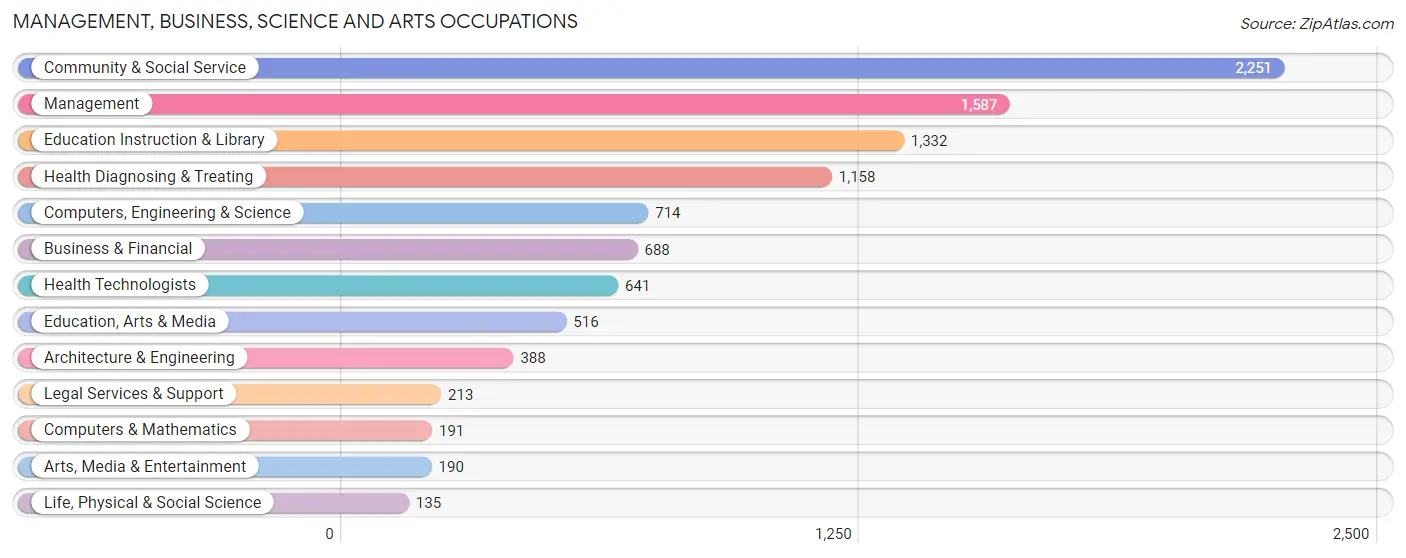
Management, Business, Science and Arts Occupations
The most common Management, Business, Science and Arts occupations in Enid are Community & Social Service (2,251 | 9.9%), Management (1,587 | 7.0%), Education Instruction & Library (1,332 | 5.9%), Health Diagnosing & Treating (1,158 | 5.1%), and Computers, Engineering & Science (714 | 3.2%).
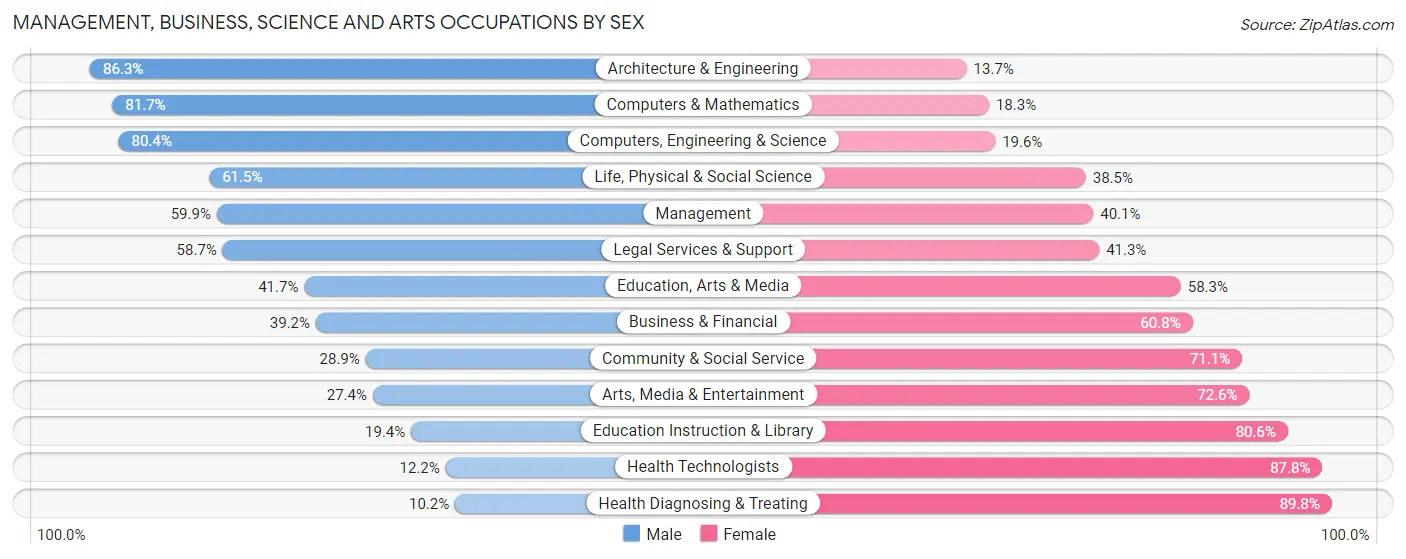
Management, Business, Science and Arts Occupations by Sex
Within the Management, Business, Science and Arts occupations in Enid, the most male-oriented occupations are Architecture & Engineering (86.3%), Computers & Mathematics (81.7%), and Computers, Engineering & Science (80.4%), while the most female-oriented occupations are Health Diagnosing & Treating (89.8%), Health Technologists (87.8%), and Education Instruction & Library (80.6%).
| Occupation | Male | Female |
| Management | 951 (59.9%) | 636 (40.1%) |
| Business & Financial | 270 (39.2%) | 418 (60.8%) |
| Computers, Engineering & Science | 574 (80.4%) | 140 (19.6%) |
| Computers & Mathematics | 156 (81.7%) | 35 (18.3%) |
| Architecture & Engineering | 335 (86.3%) | 53 (13.7%) |
| Life, Physical & Social Science | 83 (61.5%) | 52 (38.5%) |
| Community & Social Service | 650 (28.9%) | 1,601 (71.1%) |
| Education, Arts & Media | 215 (41.7%) | 301 (58.3%) |
| Legal Services & Support | 125 (58.7%) | 88 (41.3%) |
| Education Instruction & Library | 258 (19.4%) | 1,074 (80.6%) |
| Arts, Media & Entertainment | 52 (27.4%) | 138 (72.6%) |
| Health Diagnosing & Treating | 118 (10.2%) | 1,040 (89.8%) |
| Health Technologists | 78 (12.2%) | 563 (87.8%) |
| Total (Category) | 2,563 (40.1%) | 3,835 (59.9%) |
| Total (Overall) | 11,966 (52.8%) | 10,674 (47.1%) |
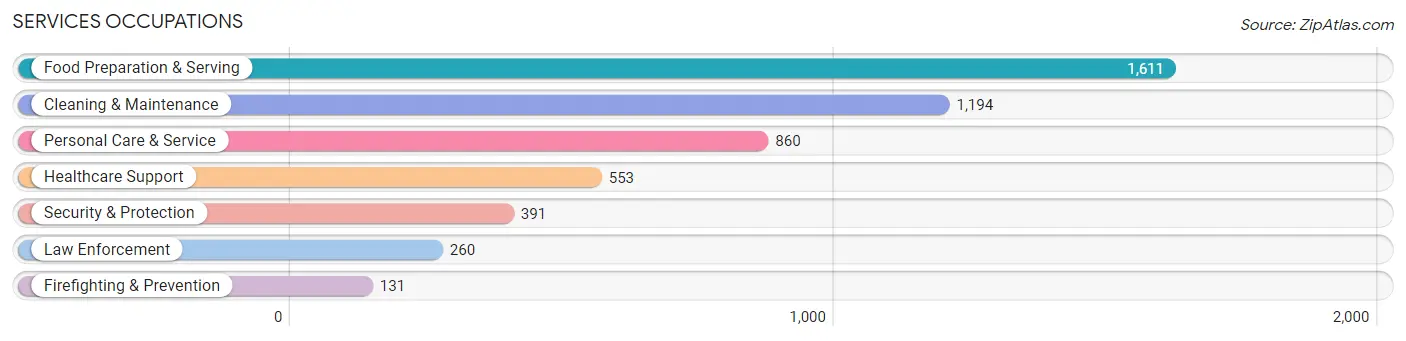
Services Occupations
The most common Services occupations in Enid are Food Preparation & Serving (1,611 | 7.1%), Cleaning & Maintenance (1,194 | 5.3%), Personal Care & Service (860 | 3.8%), Healthcare Support (553 | 2.4%), and Security & Protection (391 | 1.7%).
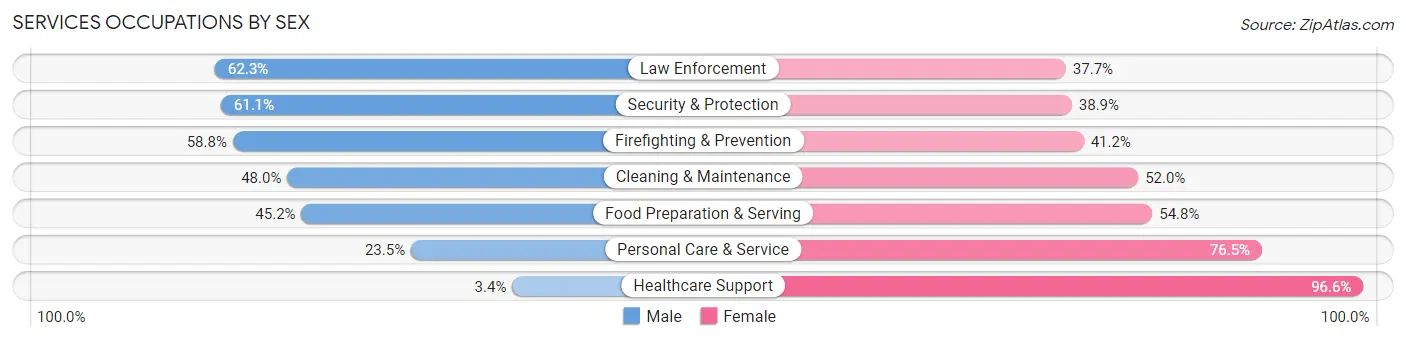
Services Occupations by Sex
Within the Services occupations in Enid, the most male-oriented occupations are Law Enforcement (62.3%), Security & Protection (61.1%), and Firefighting & Prevention (58.8%), while the most female-oriented occupations are Healthcare Support (96.6%), Personal Care & Service (76.5%), and Food Preparation & Serving (54.8%).
| Occupation | Male | Female |
| Healthcare Support | 19 (3.4%) | 534 (96.6%) |
| Security & Protection | 239 (61.1%) | 152 (38.9%) |
| Firefighting & Prevention | 77 (58.8%) | 54 (41.2%) |
| Law Enforcement | 162 (62.3%) | 98 (37.7%) |
| Food Preparation & Serving | 728 (45.2%) | 883 (54.8%) |
| Cleaning & Maintenance | 573 (48.0%) | 621 (52.0%) |
| Personal Care & Service | 202 (23.5%) | 658 (76.5%) |
| Total (Category) | 1,761 (38.2%) | 2,848 (61.8%) |
| Total (Overall) | 11,966 (52.8%) | 10,674 (47.1%) |
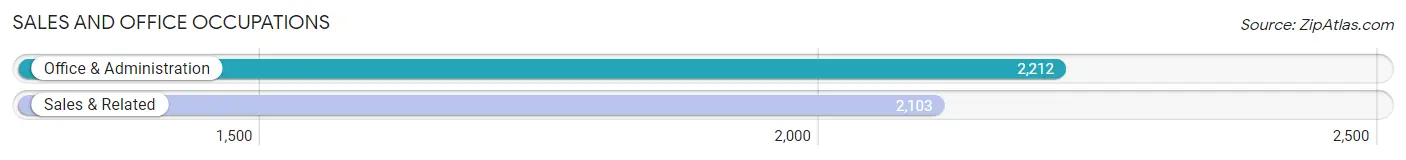
Sales and Office Occupations
The most common Sales and Office occupations in Enid are Office & Administration (2,212 | 9.8%), and Sales & Related (2,103 | 9.3%).
Sales and Office Occupations by Sex
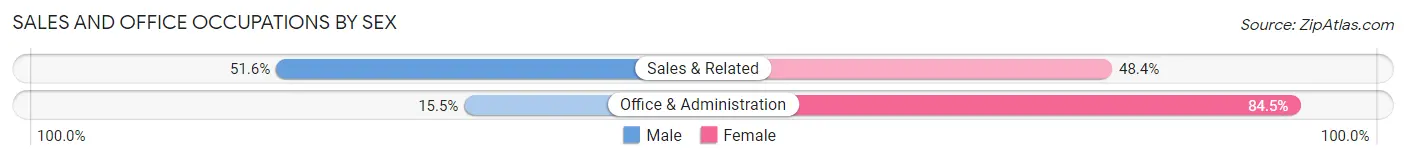
| Occupation | Male | Female |
| Sales & Related | 1,086 (51.6%) | 1,017 (48.4%) |
| Office & Administration | 342 (15.5%) | 1,870 (84.5%) |
| Total (Category) | 1,428 (33.1%) | 2,887 (66.9%) |
| Total (Overall) | 11,966 (52.8%) | 10,674 (47.1%) |
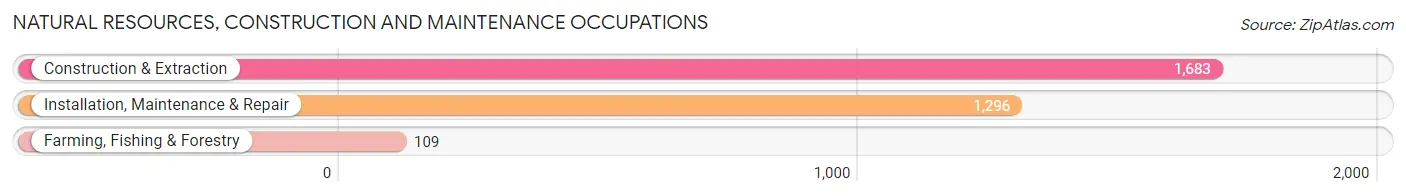
Natural Resources, Construction and Maintenance Occupations
The most common Natural Resources, Construction and Maintenance occupations in Enid are Construction & Extraction (1,683 | 7.4%), Installation, Maintenance & Repair (1,296 | 5.7%), and Farming, Fishing & Forestry (109 | 0.5%).
Natural Resources, Construction and Maintenance Occupations by Sex
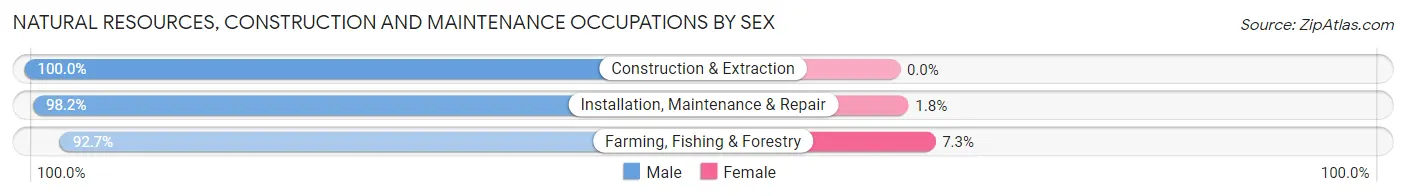
| Occupation | Male | Female |
| Farming, Fishing & Forestry | 101 (92.7%) | 8 (7.3%) |
| Construction & Extraction | 1,683 (100.0%) | 0 (0.0%) |
| Installation, Maintenance & Repair | 1,273 (98.2%) | 23 (1.8%) |
| Total (Category) | 3,057 (99.0%) | 31 (1.0%) |
| Total (Overall) | 11,966 (52.8%) | 10,674 (47.1%) |
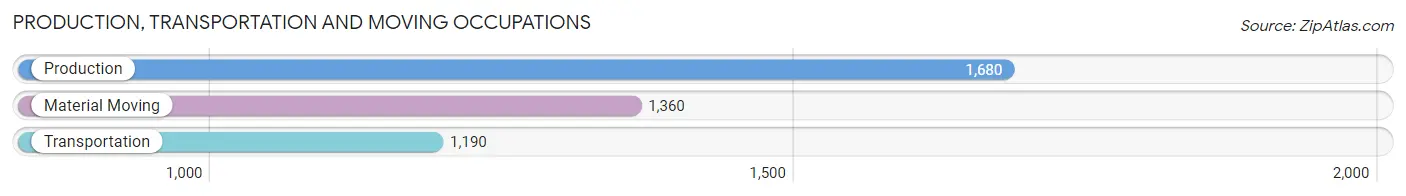
Production, Transportation and Moving Occupations
The most common Production, Transportation and Moving occupations in Enid are Production (1,680 | 7.4%), Material Moving (1,360 | 6.0%), and Transportation (1,190 | 5.3%).
Production, Transportation and Moving Occupations by Sex
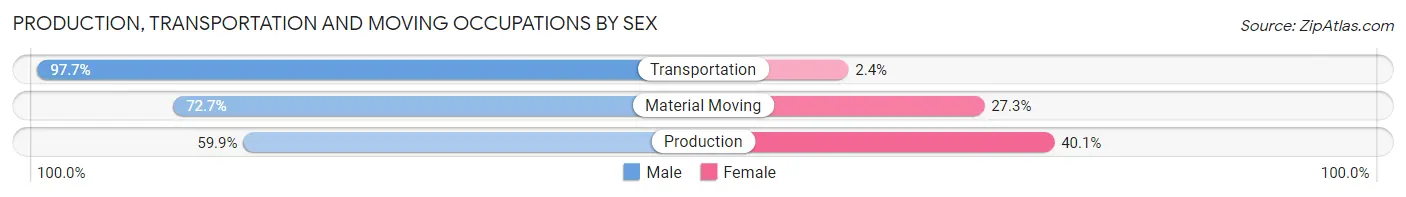
| Occupation | Male | Female |
| Production | 1,006 (59.9%) | 674 (40.1%) |
| Transportation | 1,162 (97.7%) | 28 (2.4%) |
| Material Moving | 989 (72.7%) | 371 (27.3%) |
| Total (Category) | 3,157 (74.6%) | 1,073 (25.4%) |
| Total (Overall) | 11,966 (52.8%) | 10,674 (47.1%) |
Employment Industries by Sex in Enid
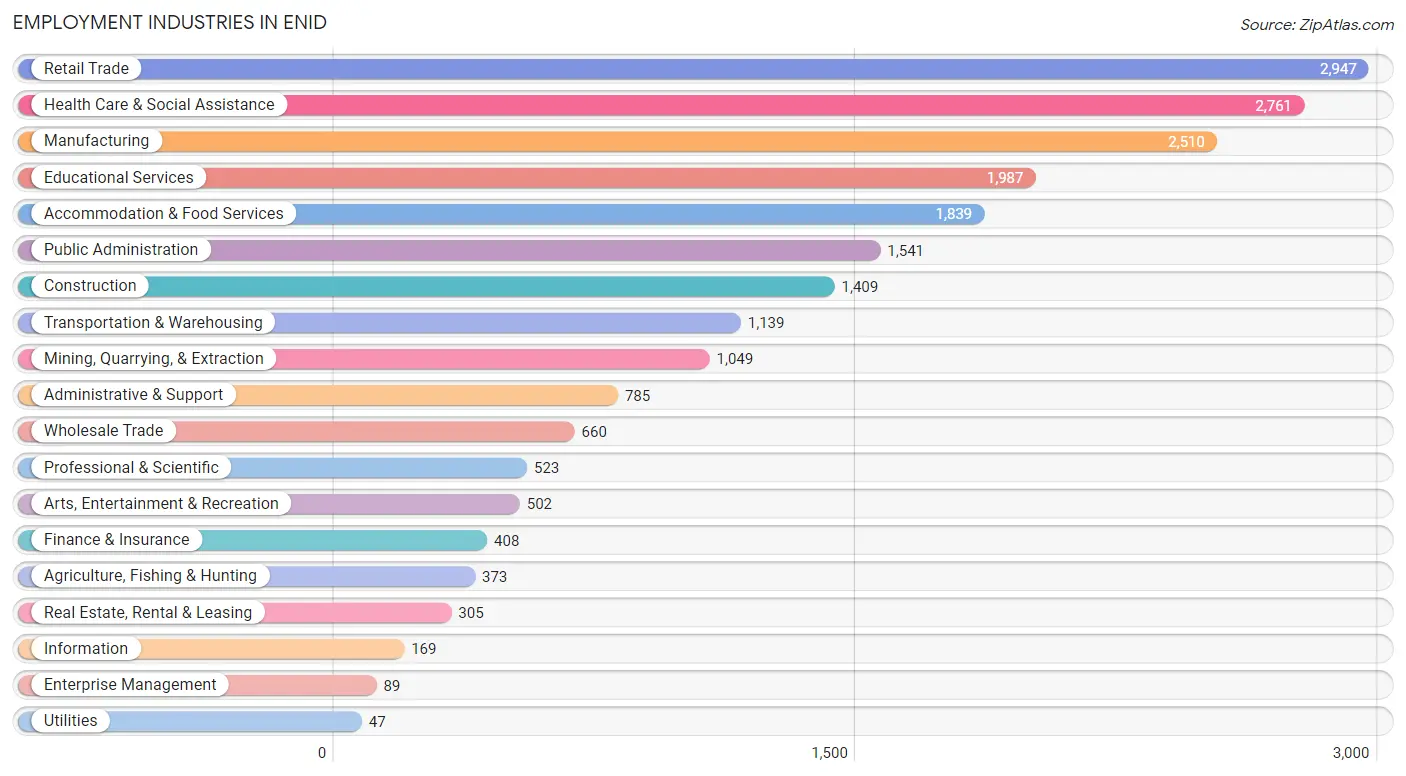
Employment Industries in Enid
The major employment industries in Enid include Retail Trade (2,947 | 13.0%), Health Care & Social Assistance (2,761 | 12.2%), Manufacturing (2,510 | 11.1%), Educational Services (1,987 | 8.8%), and Accommodation & Food Services (1,839 | 8.1%).
Employment Industries by Sex in Enid
The Enid industries that see more men than women are Utilities (100.0%), Mining, Quarrying, & Extraction (94.2%), and Transportation & Warehousing (92.4%), whereas the industries that tend to have a higher number of women are Enterprise Management (100.0%), Finance & Insurance (92.2%), and Health Care & Social Assistance (88.5%).
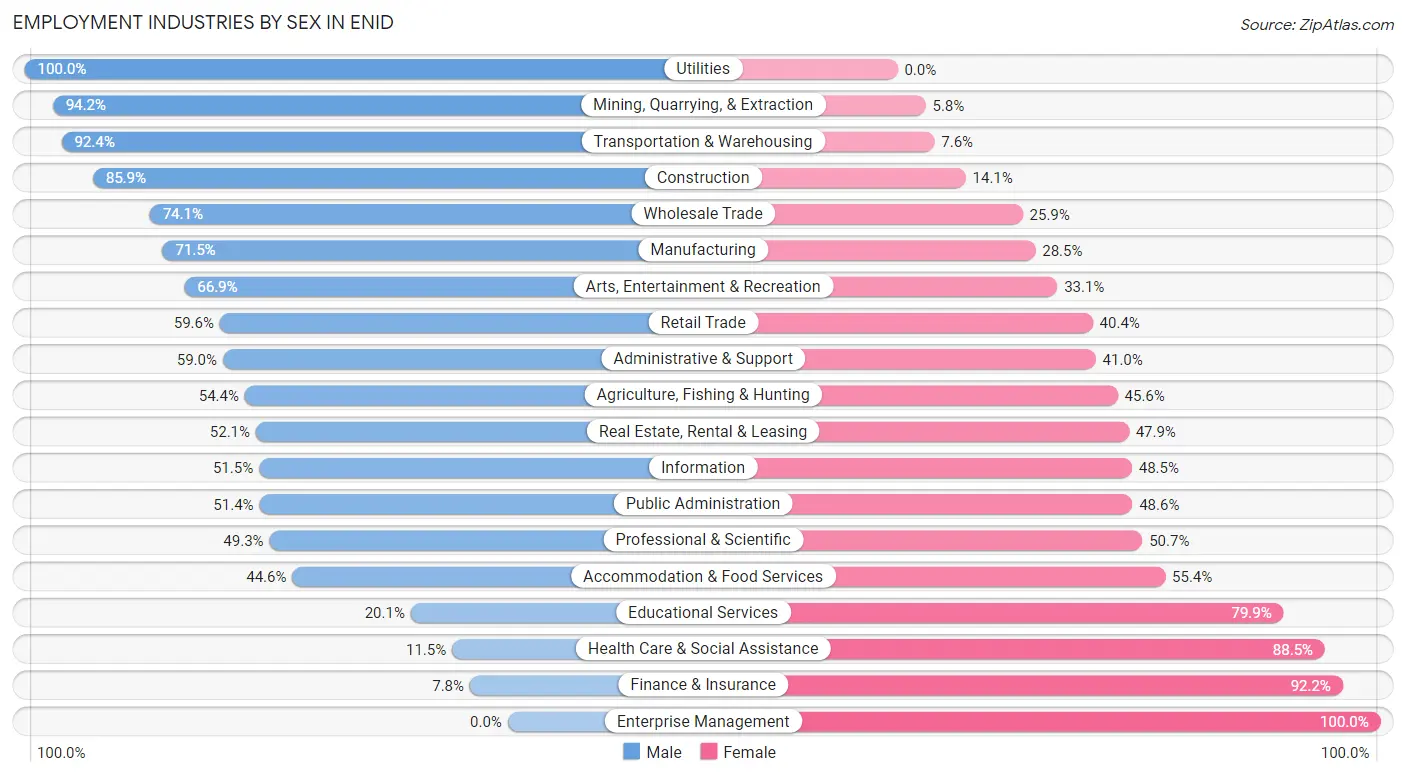
| Industry | Male | Female |
| Agriculture, Fishing & Hunting | 203 (54.4%) | 170 (45.6%) |
| Mining, Quarrying, & Extraction | 988 (94.2%) | 61 (5.8%) |
| Construction | 1,210 (85.9%) | 199 (14.1%) |
| Manufacturing | 1,794 (71.5%) | 716 (28.5%) |
| Wholesale Trade | 489 (74.1%) | 171 (25.9%) |
| Retail Trade | 1,756 (59.6%) | 1,191 (40.4%) |
| Transportation & Warehousing | 1,052 (92.4%) | 87 (7.6%) |
| Utilities | 47 (100.0%) | 0 (0.0%) |
| Information | 87 (51.5%) | 82 (48.5%) |
| Finance & Insurance | 32 (7.8%) | 376 (92.2%) |
| Real Estate, Rental & Leasing | 159 (52.1%) | 146 (47.9%) |
| Professional & Scientific | 258 (49.3%) | 265 (50.7%) |
| Enterprise Management | 0 (0.0%) | 89 (100.0%) |
| Administrative & Support | 463 (59.0%) | 322 (41.0%) |
| Educational Services | 399 (20.1%) | 1,588 (79.9%) |
| Health Care & Social Assistance | 318 (11.5%) | 2,443 (88.5%) |
| Arts, Entertainment & Recreation | 336 (66.9%) | 166 (33.1%) |
| Accommodation & Food Services | 820 (44.6%) | 1,019 (55.4%) |
| Public Administration | 792 (51.4%) | 749 (48.6%) |
| Total | 11,966 (52.8%) | 10,674 (47.1%) |
Education in Enid
School Enrollment in Enid
The most common levels of schooling among the 12,963 students in Enid are elementary school (3,394 | 26.2%), high school (3,354 | 25.9%), and middle school (2,470 | 19.1%).
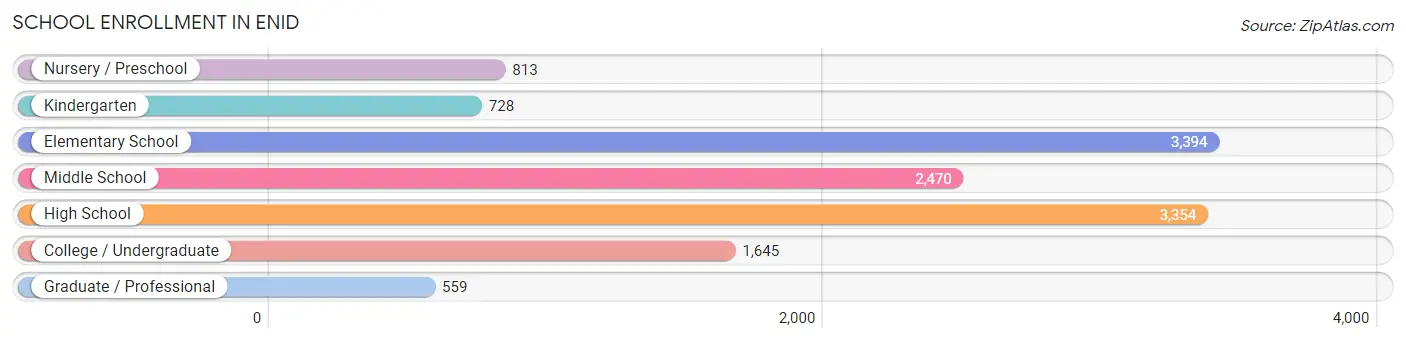
| School Level | # Students | % Students |
| Nursery / Preschool | 813 | 6.3% |
| Kindergarten | 728 | 5.6% |
| Elementary School | 3,394 | 26.2% |
| Middle School | 2,470 | 19.1% |
| High School | 3,354 | 25.9% |
| College / Undergraduate | 1,645 | 12.7% |
| Graduate / Professional | 559 | 4.3% |
| Total | 12,963 | 100.0% |
School Enrollment by Age by Funding Source in Enid
Out of a total of 12,963 students who are enrolled in schools in Enid, 1,581 (12.2%) attend a private institution, while the remaining 11,382 (87.8%) are enrolled in public schools. The age group of 35 years and over has the highest likelihood of being enrolled in private schools, with 184 (30.7% in the age bracket) enrolled. Conversely, the age group of 15 to 17 year olds has the lowest likelihood of being enrolled in a private school, with 2,163 (92.2% in the age bracket) attending a public institution.
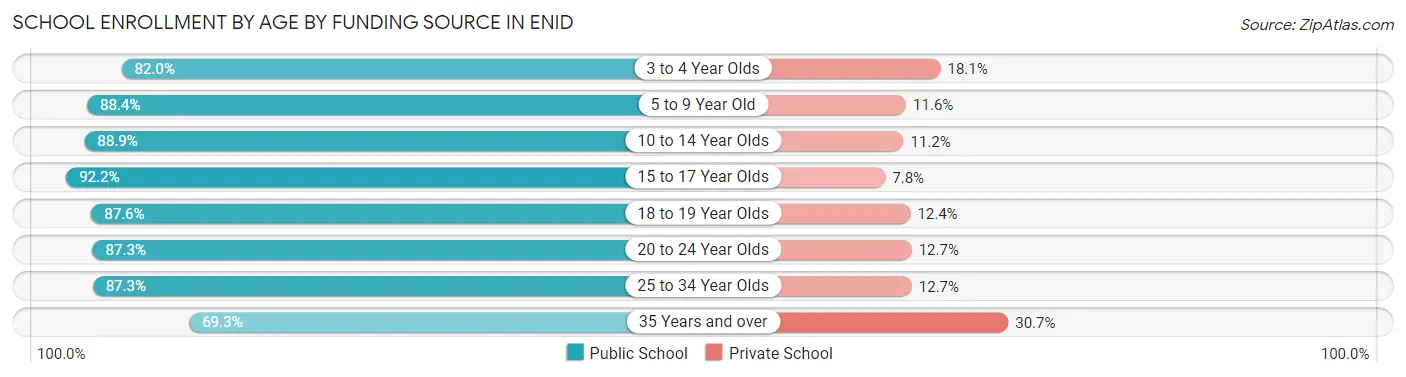
| Age Bracket | Public School | Private School |
| 3 to 4 Year Olds | 522 (82.0%) | 115 (18.0%) |
| 5 to 9 Year Old | 3,316 (88.4%) | 437 (11.6%) |
| 10 to 14 Year Olds | 2,902 (88.8%) | 364 (11.2%) |
| 15 to 17 Year Olds | 2,163 (92.2%) | 182 (7.8%) |
| 18 to 19 Year Olds | 957 (87.6%) | 136 (12.4%) |
| 20 to 24 Year Olds | 682 (87.3%) | 99 (12.7%) |
| 25 to 34 Year Olds | 426 (87.3%) | 62 (12.7%) |
| 35 Years and over | 416 (69.3%) | 184 (30.7%) |
| Total | 11,382 (87.8%) | 1,581 (12.2%) |
Educational Attainment by Field of Study in Enid
Education (1,618 | 19.5%), business (1,614 | 19.4%), science & technology (842 | 10.1%), arts & humanities (771 | 9.3%), and social sciences (686 | 8.3%) are the most common fields of study among 8,304 individuals in Enid who have obtained a bachelor's degree or higher.
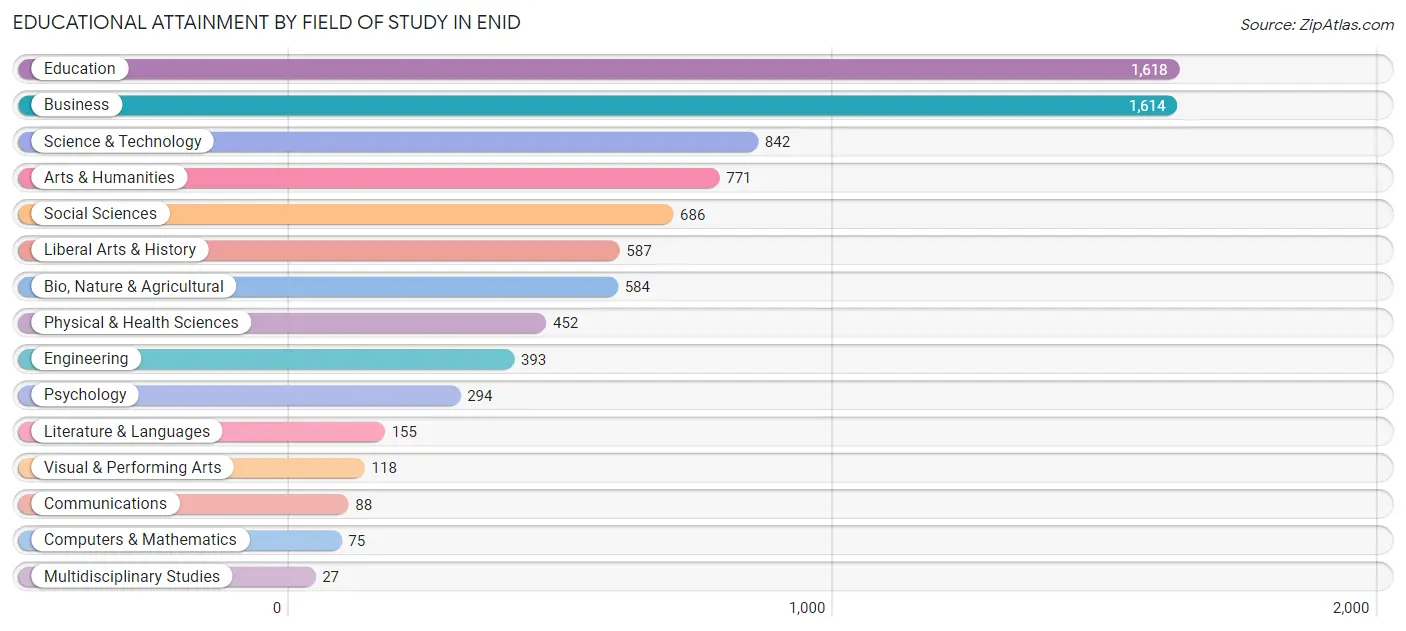
| Field of Study | # Graduates | % Graduates |
| Computers & Mathematics | 75 | 0.9% |
| Bio, Nature & Agricultural | 584 | 7.0% |
| Physical & Health Sciences | 452 | 5.4% |
| Psychology | 294 | 3.5% |
| Social Sciences | 686 | 8.3% |
| Engineering | 393 | 4.7% |
| Multidisciplinary Studies | 27 | 0.3% |
| Science & Technology | 842 | 10.1% |
| Business | 1,614 | 19.4% |
| Education | 1,618 | 19.5% |
| Literature & Languages | 155 | 1.9% |
| Liberal Arts & History | 587 | 7.1% |
| Visual & Performing Arts | 118 | 1.4% |
| Communications | 88 | 1.1% |
| Arts & Humanities | 771 | 9.3% |
| Total | 8,304 | 100.0% |
Transportation & Commute in Enid
Vehicle Availability by Sex in Enid
The most prevalent vehicle ownership categories in Enid are males with 2 vehicles (5,242, accounting for 42.7%) and females with 2 vehicles (3,955, making up 50.3%).
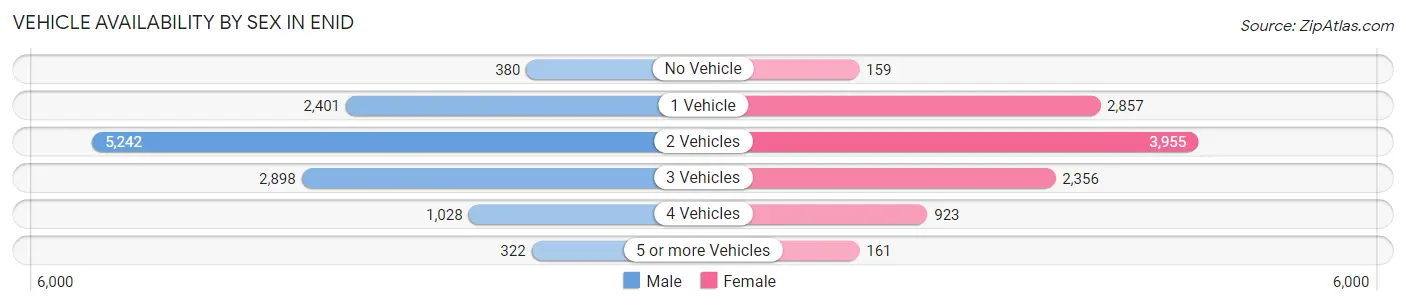
| Vehicles Available | Male | Female |
| No Vehicle | 380 (3.1%) | 159 (1.5%) |
| 1 Vehicle | 2,401 (19.6%) | 2,857 (27.4%) |
| 2 Vehicles | 5,242 (42.7%) | 3,955 (38.0%) |
| 3 Vehicles | 2,898 (23.6%) | 2,356 (22.6%) |
| 4 Vehicles | 1,028 (8.4%) | 923 (8.9%) |
| 5 or more Vehicles | 322 (2.6%) | 161 (1.5%) |
| Total | 12,271 (100.0%) | 10,411 (100.0%) |
Commute Time in Enid
The most frequently occuring commute durations in Enid are 10 to 14 minutes (6,025 commuters, 27.1%), 5 to 9 minutes (5,285 commuters, 23.8%), and 15 to 19 minutes (4,856 commuters, 21.8%).
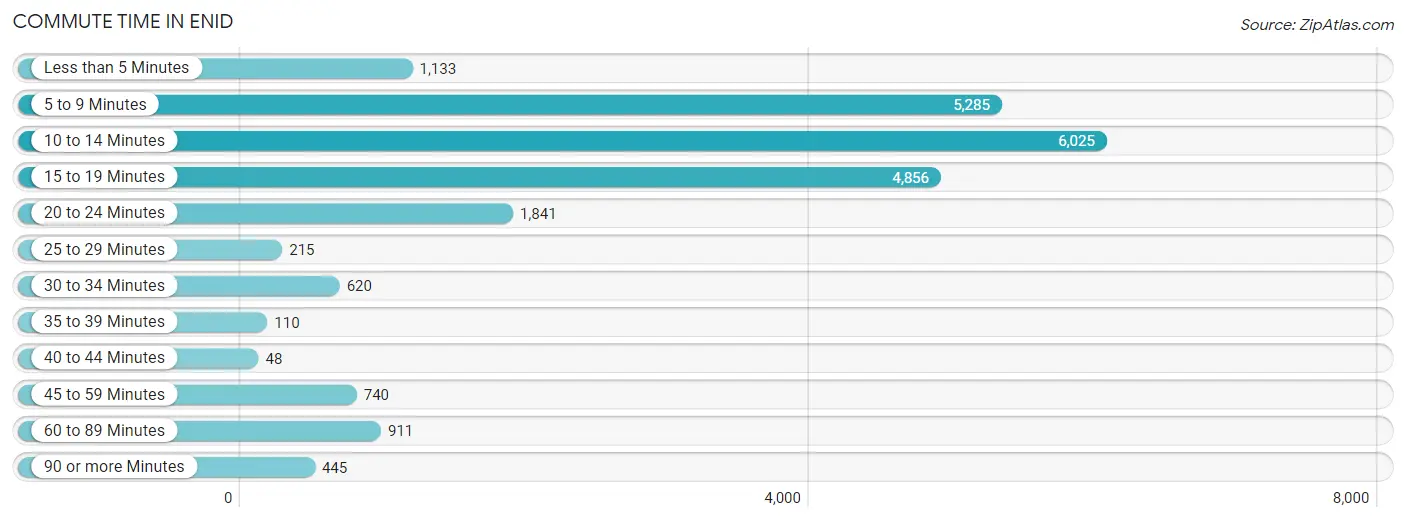
| Commute Time | # Commuters | % Commuters |
| Less than 5 Minutes | 1,133 | 5.1% |
| 5 to 9 Minutes | 5,285 | 23.8% |
| 10 to 14 Minutes | 6,025 | 27.1% |
| 15 to 19 Minutes | 4,856 | 21.8% |
| 20 to 24 Minutes | 1,841 | 8.3% |
| 25 to 29 Minutes | 215 | 1.0% |
| 30 to 34 Minutes | 620 | 2.8% |
| 35 to 39 Minutes | 110 | 0.5% |
| 40 to 44 Minutes | 48 | 0.2% |
| 45 to 59 Minutes | 740 | 3.3% |
| 60 to 89 Minutes | 911 | 4.1% |
| 90 or more Minutes | 445 | 2.0% |
Commute Time by Sex in Enid
The most common commute times in Enid are 10 to 14 minutes (2,904 commuters, 23.8%) for males and 10 to 14 minutes (3,121 commuters, 31.2%) for females.
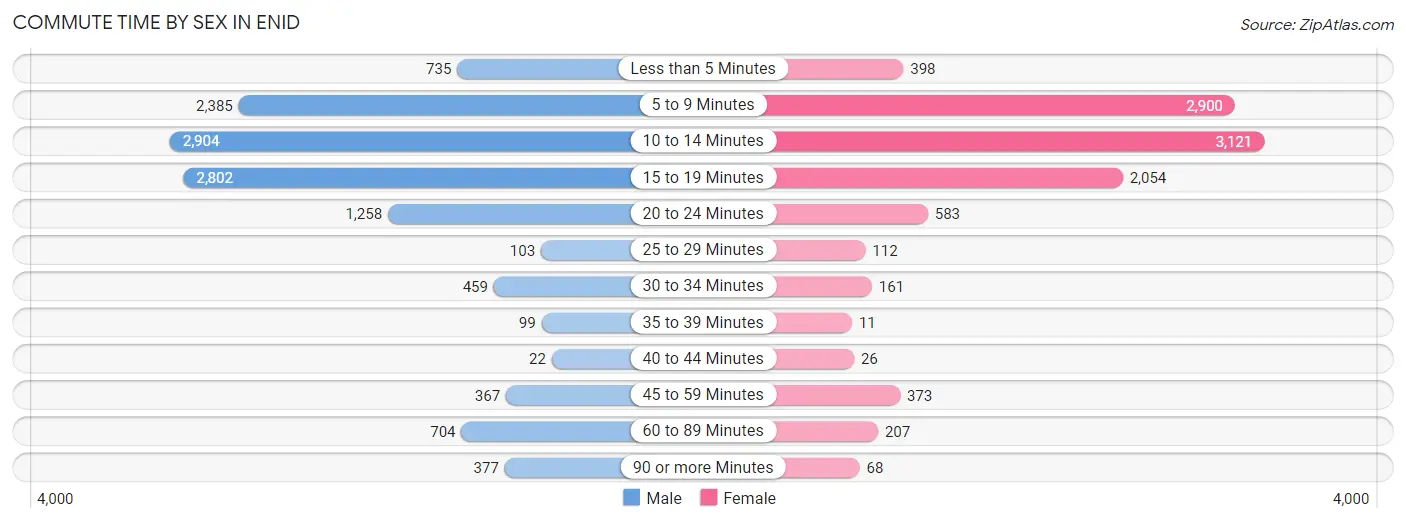
| Commute Time | Male | Female |
| Less than 5 Minutes | 735 (6.0%) | 398 (4.0%) |
| 5 to 9 Minutes | 2,385 (19.5%) | 2,900 (29.0%) |
| 10 to 14 Minutes | 2,904 (23.8%) | 3,121 (31.2%) |
| 15 to 19 Minutes | 2,802 (22.9%) | 2,054 (20.5%) |
| 20 to 24 Minutes | 1,258 (10.3%) | 583 (5.8%) |
| 25 to 29 Minutes | 103 (0.8%) | 112 (1.1%) |
| 30 to 34 Minutes | 459 (3.8%) | 161 (1.6%) |
| 35 to 39 Minutes | 99 (0.8%) | 11 (0.1%) |
| 40 to 44 Minutes | 22 (0.2%) | 26 (0.3%) |
| 45 to 59 Minutes | 367 (3.0%) | 373 (3.7%) |
| 60 to 89 Minutes | 704 (5.8%) | 207 (2.1%) |
| 90 or more Minutes | 377 (3.1%) | 68 (0.7%) |
Time of Departure to Work by Sex in Enid
The most frequent times of departure to work in Enid are 7:00 AM to 7:29 AM (1,817, 14.9%) for males and 7:30 AM to 7:59 AM (1,874, 18.7%) for females.
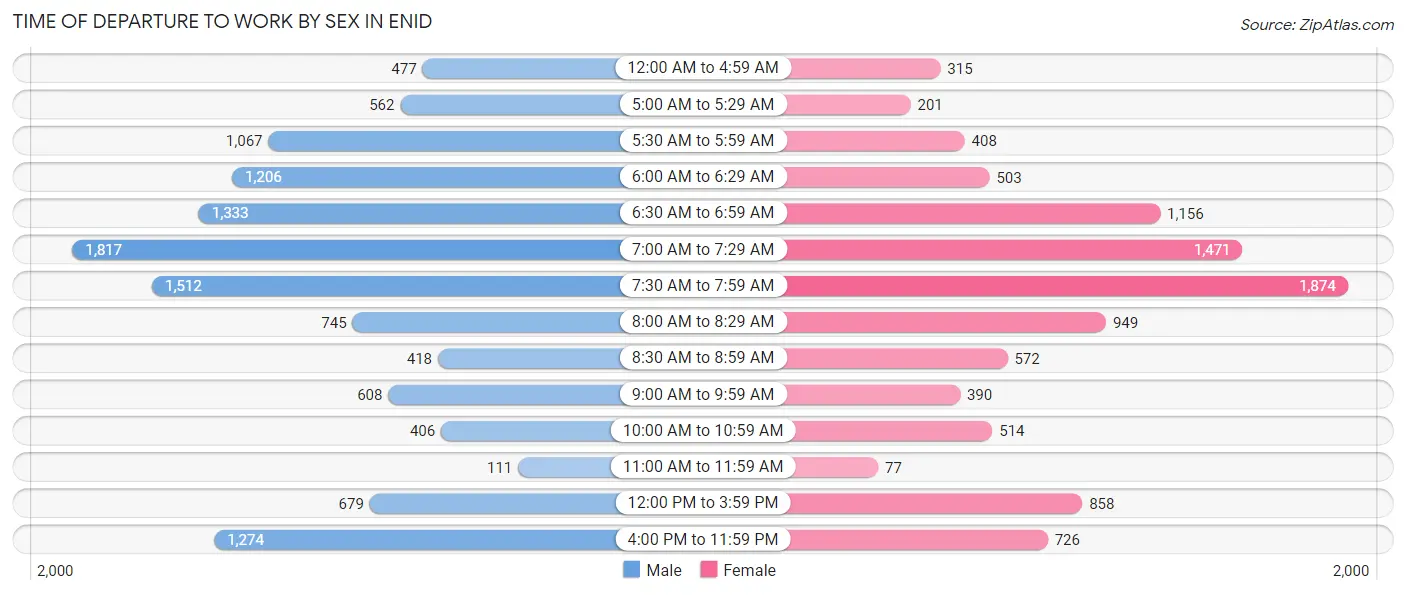
| Time of Departure | Male | Female |
| 12:00 AM to 4:59 AM | 477 (3.9%) | 315 (3.2%) |
| 5:00 AM to 5:29 AM | 562 (4.6%) | 201 (2.0%) |
| 5:30 AM to 5:59 AM | 1,067 (8.7%) | 408 (4.1%) |
| 6:00 AM to 6:29 AM | 1,206 (9.9%) | 503 (5.0%) |
| 6:30 AM to 6:59 AM | 1,333 (10.9%) | 1,156 (11.5%) |
| 7:00 AM to 7:29 AM | 1,817 (14.9%) | 1,471 (14.7%) |
| 7:30 AM to 7:59 AM | 1,512 (12.4%) | 1,874 (18.7%) |
| 8:00 AM to 8:29 AM | 745 (6.1%) | 949 (9.5%) |
| 8:30 AM to 8:59 AM | 418 (3.4%) | 572 (5.7%) |
| 9:00 AM to 9:59 AM | 608 (5.0%) | 390 (3.9%) |
| 10:00 AM to 10:59 AM | 406 (3.3%) | 514 (5.1%) |
| 11:00 AM to 11:59 AM | 111 (0.9%) | 77 (0.8%) |
| 12:00 PM to 3:59 PM | 679 (5.6%) | 858 (8.6%) |
| 4:00 PM to 11:59 PM | 1,274 (10.4%) | 726 (7.2%) |
| Total | 12,215 (100.0%) | 10,014 (100.0%) |
Housing Occupancy in Enid
Occupancy by Ownership in Enid
Of the total 19,456 dwellings in Enid, owner-occupied units account for 11,820 (60.8%), while renter-occupied units make up 7,636 (39.3%).
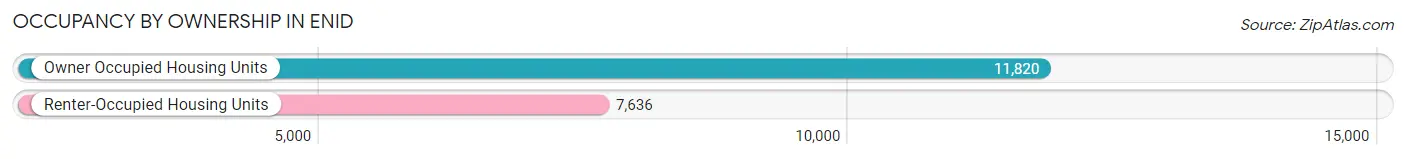
| Occupancy | # Housing Units | % Housing Units |
| Owner Occupied Housing Units | 11,820 | 60.8% |
| Renter-Occupied Housing Units | 7,636 | 39.3% |
| Total Occupied Housing Units | 19,456 | 100.0% |
Occupancy by Household Size in Enid
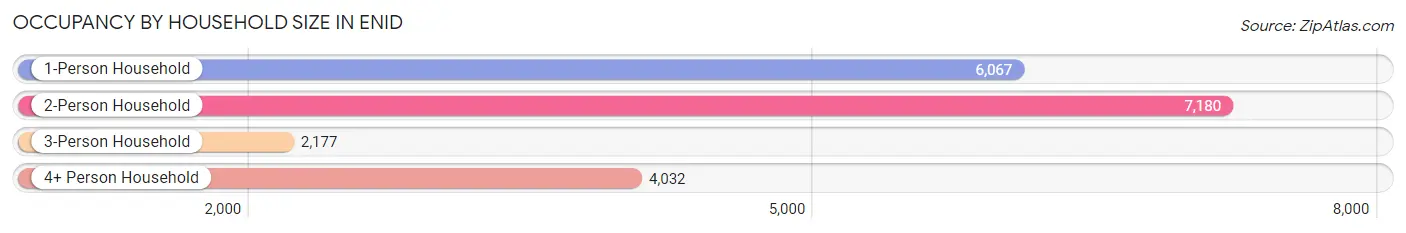
| Household Size | # Housing Units | % Housing Units |
| 1-Person Household | 6,067 | 31.2% |
| 2-Person Household | 7,180 | 36.9% |
| 3-Person Household | 2,177 | 11.2% |
| 4+ Person Household | 4,032 | 20.7% |
| Total Housing Units | 19,456 | 100.0% |
Occupancy by Ownership by Household Size in Enid
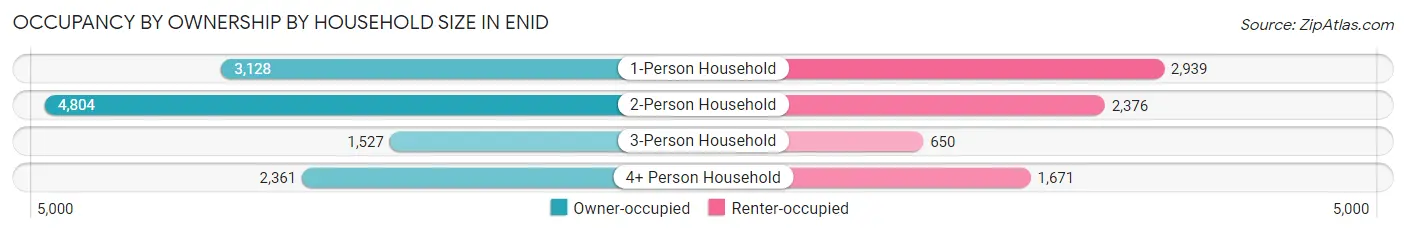
| Household Size | Owner-occupied | Renter-occupied |
| 1-Person Household | 3,128 (51.6%) | 2,939 (48.4%) |
| 2-Person Household | 4,804 (66.9%) | 2,376 (33.1%) |
| 3-Person Household | 1,527 (70.1%) | 650 (29.9%) |
| 4+ Person Household | 2,361 (58.6%) | 1,671 (41.4%) |
| Total Housing Units | 11,820 (60.8%) | 7,636 (39.3%) |
Occupancy by Educational Attainment in Enid
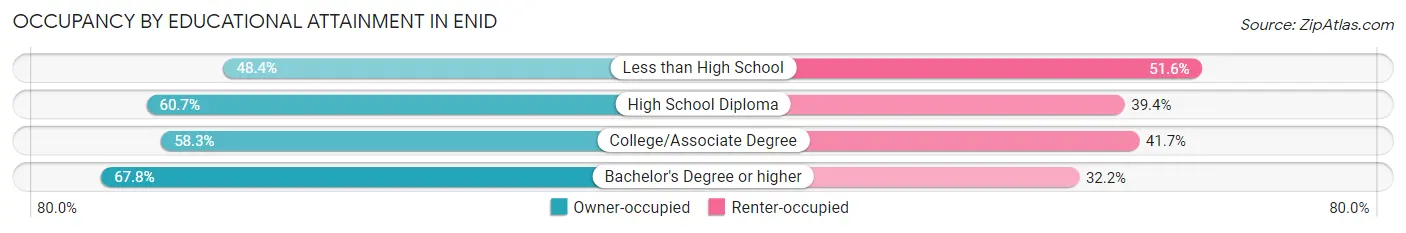
| Household Size | Owner-occupied | Renter-occupied |
| Less than High School | 922 (48.4%) | 982 (51.6%) |
| High School Diploma | 4,090 (60.7%) | 2,654 (39.4%) |
| College/Associate Degree | 3,212 (58.3%) | 2,295 (41.7%) |
| Bachelor's Degree or higher | 3,596 (67.8%) | 1,705 (32.2%) |
Occupancy by Age of Householder in Enid
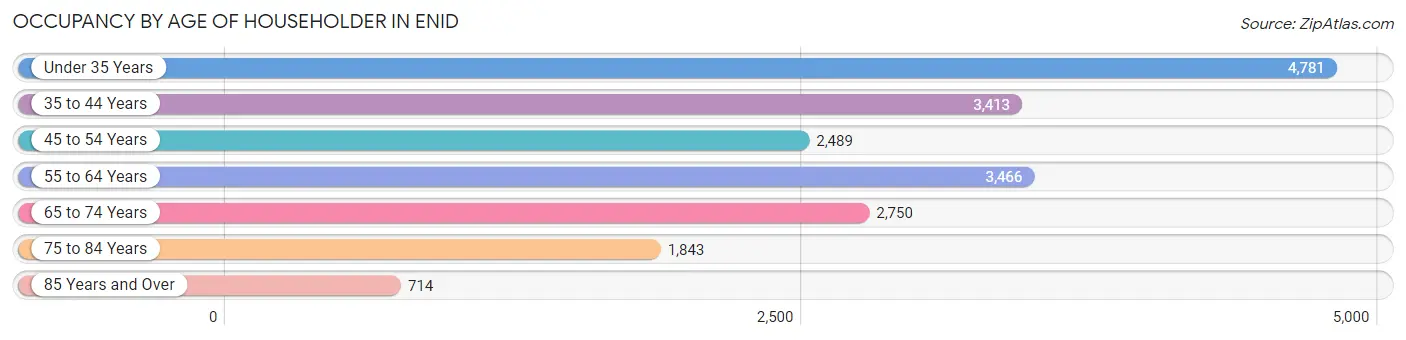
| Age Bracket | # Households | % Households |
| Under 35 Years | 4,781 | 24.6% |
| 35 to 44 Years | 3,413 | 17.5% |
| 45 to 54 Years | 2,489 | 12.8% |
| 55 to 64 Years | 3,466 | 17.8% |
| 65 to 74 Years | 2,750 | 14.1% |
| 75 to 84 Years | 1,843 | 9.5% |
| 85 Years and Over | 714 | 3.7% |
| Total | 19,456 | 100.0% |
Housing Finances in Enid
Median Income by Occupancy in Enid
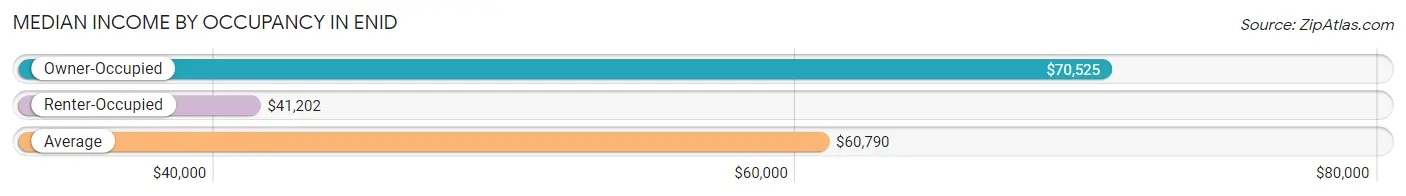
| Occupancy Type | # Households | Median Income |
| Owner-Occupied | 11,820 (60.8%) | $70,525 |
| Renter-Occupied | 7,636 (39.3%) | $41,202 |
| Average | 19,456 (100.0%) | $60,790 |
Occupancy by Householder Income Bracket in Enid
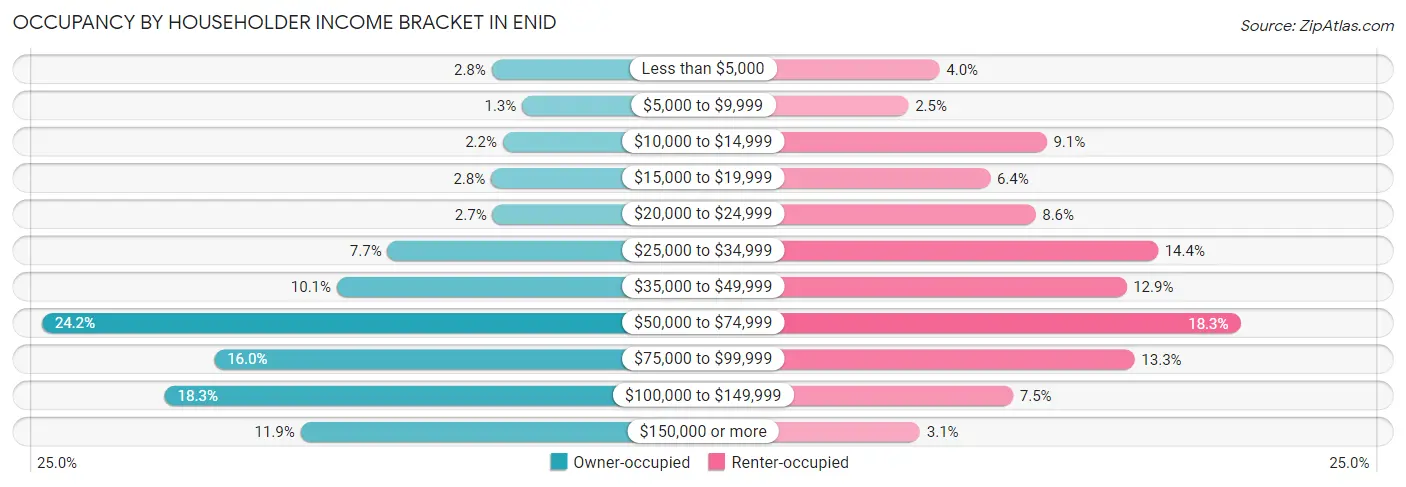
| Income Bracket | Owner-occupied | Renter-occupied |
| Less than $5,000 | 326 (2.8%) | 305 (4.0%) |
| $5,000 to $9,999 | 155 (1.3%) | 192 (2.5%) |
| $10,000 to $14,999 | 263 (2.2%) | 694 (9.1%) |
| $15,000 to $19,999 | 330 (2.8%) | 489 (6.4%) |
| $20,000 to $24,999 | 322 (2.7%) | 654 (8.6%) |
| $25,000 to $34,999 | 912 (7.7%) | 1,099 (14.4%) |
| $35,000 to $49,999 | 1,197 (10.1%) | 984 (12.9%) |
| $50,000 to $74,999 | 2,858 (24.2%) | 1,399 (18.3%) |
| $75,000 to $99,999 | 1,888 (16.0%) | 1,014 (13.3%) |
| $100,000 to $149,999 | 2,167 (18.3%) | 572 (7.5%) |
| $150,000 or more | 1,402 (11.9%) | 234 (3.1%) |
| Total | 11,820 (100.0%) | 7,636 (100.0%) |
Monthly Housing Cost Tiers in Enid
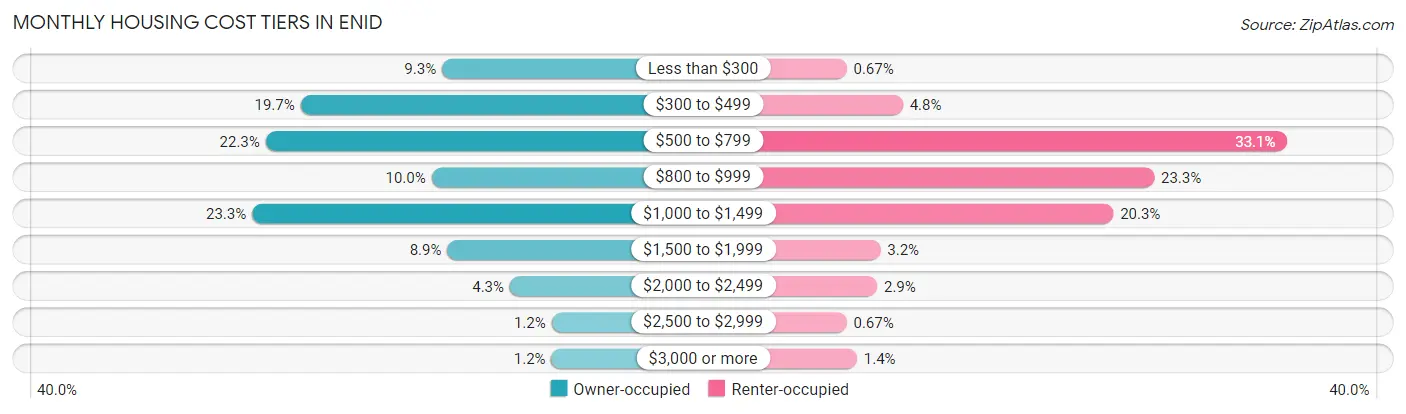
| Monthly Cost | Owner-occupied | Renter-occupied |
| Less than $300 | 1,095 (9.3%) | 51 (0.7%) |
| $300 to $499 | 2,326 (19.7%) | 367 (4.8%) |
| $500 to $799 | 2,630 (22.3%) | 2,530 (33.1%) |
| $800 to $999 | 1,186 (10.0%) | 1,781 (23.3%) |
| $1,000 to $1,499 | 2,748 (23.3%) | 1,551 (20.3%) |
| $1,500 to $1,999 | 1,049 (8.9%) | 241 (3.2%) |
| $2,000 to $2,499 | 503 (4.3%) | 223 (2.9%) |
| $2,500 to $2,999 | 141 (1.2%) | 51 (0.7%) |
| $3,000 or more | 142 (1.2%) | 109 (1.4%) |
| Total | 11,820 (100.0%) | 7,636 (100.0%) |
Physical Housing Characteristics in Enid
Housing Structures in Enid
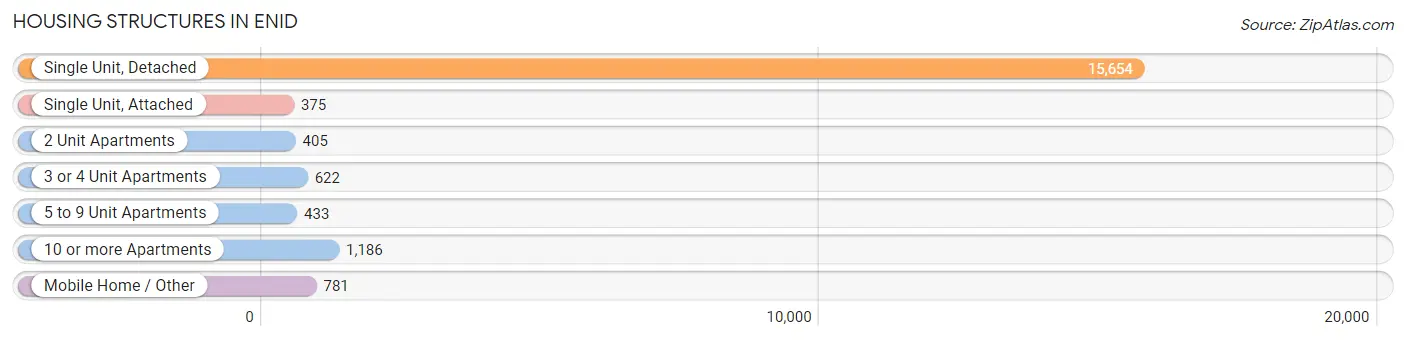
| Structure Type | # Housing Units | % Housing Units |
| Single Unit, Detached | 15,654 | 80.5% |
| Single Unit, Attached | 375 | 1.9% |
| 2 Unit Apartments | 405 | 2.1% |
| 3 or 4 Unit Apartments | 622 | 3.2% |
| 5 to 9 Unit Apartments | 433 | 2.2% |
| 10 or more Apartments | 1,186 | 6.1% |
| Mobile Home / Other | 781 | 4.0% |
| Total | 19,456 | 100.0% |
Housing Structures by Occupancy in Enid
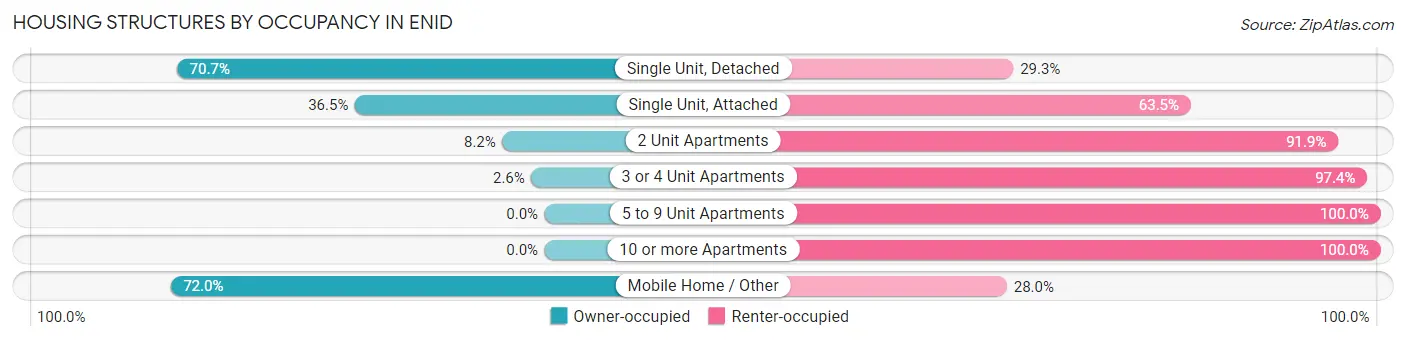
| Structure Type | Owner-occupied | Renter-occupied |
| Single Unit, Detached | 11,072 (70.7%) | 4,582 (29.3%) |
| Single Unit, Attached | 137 (36.5%) | 238 (63.5%) |
| 2 Unit Apartments | 33 (8.2%) | 372 (91.8%) |
| 3 or 4 Unit Apartments | 16 (2.6%) | 606 (97.4%) |
| 5 to 9 Unit Apartments | 0 (0.0%) | 433 (100.0%) |
| 10 or more Apartments | 0 (0.0%) | 1,186 (100.0%) |
| Mobile Home / Other | 562 (72.0%) | 219 (28.0%) |
| Total | 11,820 (60.8%) | 7,636 (39.3%) |
Housing Structures by Number of Rooms in Enid
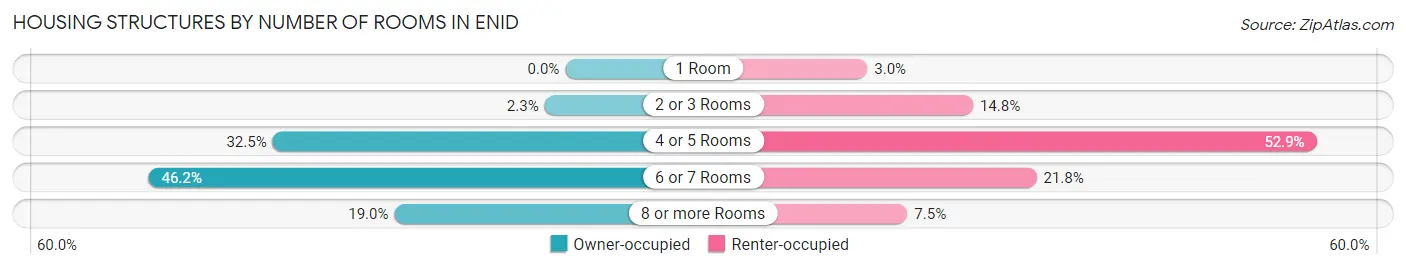
| Number of Rooms | Owner-occupied | Renter-occupied |
| 1 Room | 0 (0.0%) | 232 (3.0%) |
| 2 or 3 Rooms | 272 (2.3%) | 1,128 (14.8%) |
| 4 or 5 Rooms | 3,840 (32.5%) | 4,038 (52.9%) |
| 6 or 7 Rooms | 5,466 (46.2%) | 1,666 (21.8%) |
| 8 or more Rooms | 2,242 (19.0%) | 572 (7.5%) |
| Total | 11,820 (100.0%) | 7,636 (100.0%) |
Housing Structure by Heating Type in Enid
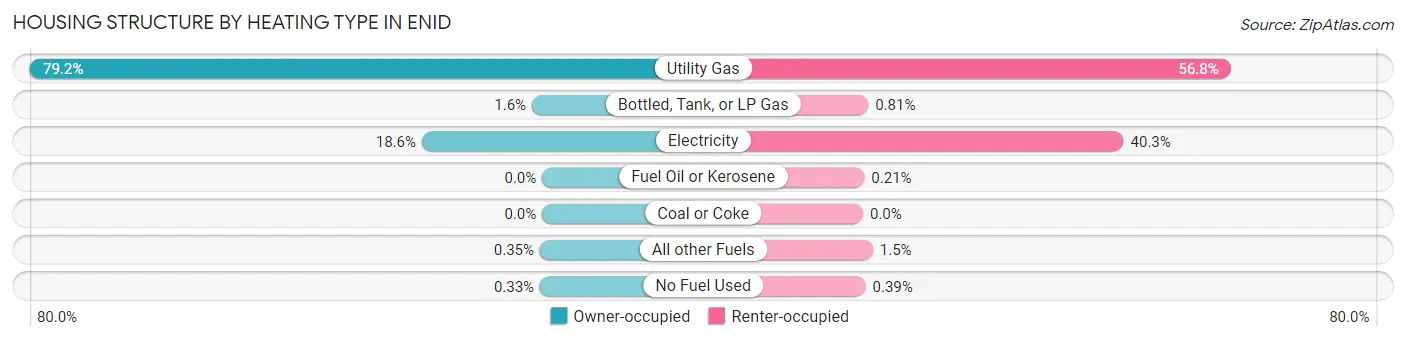
| Heating Type | Owner-occupied | Renter-occupied |
| Utility Gas | 9,356 (79.1%) | 4,337 (56.8%) |
| Bottled, Tank, or LP Gas | 186 (1.6%) | 62 (0.8%) |
| Electricity | 2,198 (18.6%) | 3,076 (40.3%) |
| Fuel Oil or Kerosene | 0 (0.0%) | 16 (0.2%) |
| Coal or Coke | 0 (0.0%) | 0 (0.0%) |
| All other Fuels | 41 (0.4%) | 115 (1.5%) |
| No Fuel Used | 39 (0.3%) | 30 (0.4%) |
| Total | 11,820 (100.0%) | 7,636 (100.0%) |
Household Vehicle Usage in Enid
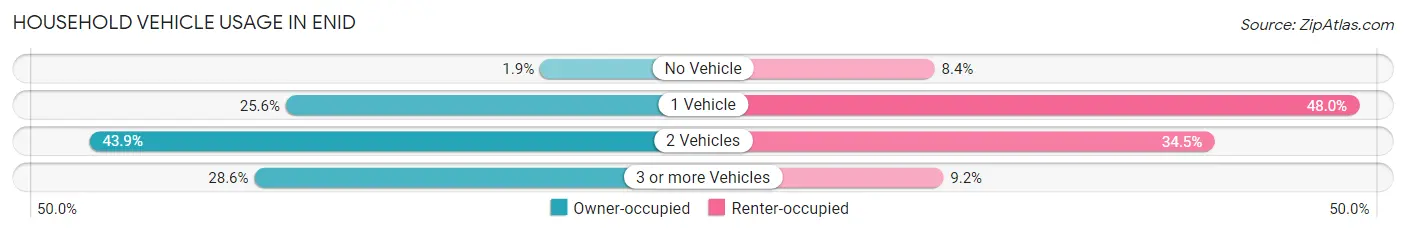
| Vehicles per Household | Owner-occupied | Renter-occupied |
| No Vehicle | 223 (1.9%) | 639 (8.4%) |
| 1 Vehicle | 3,028 (25.6%) | 3,664 (48.0%) |
| 2 Vehicles | 5,194 (43.9%) | 2,631 (34.5%) |
| 3 or more Vehicles | 3,375 (28.5%) | 702 (9.2%) |
| Total | 11,820 (100.0%) | 7,636 (100.0%) |
Real Estate & Mortgages in Enid
Real Estate and Mortgage Overview in Enid
| Characteristic | Without Mortgage | With Mortgage |
| Housing Units | 5,796 | 6,024 |
| Median Property Value | $130,500 | $141,600 |
| Median Household Income | $65,595 | $752 |
| Monthly Housing Costs | $472 | $142 |
| Real Estate Taxes | $1,157 | $308 |
Property Value by Mortgage Status in Enid
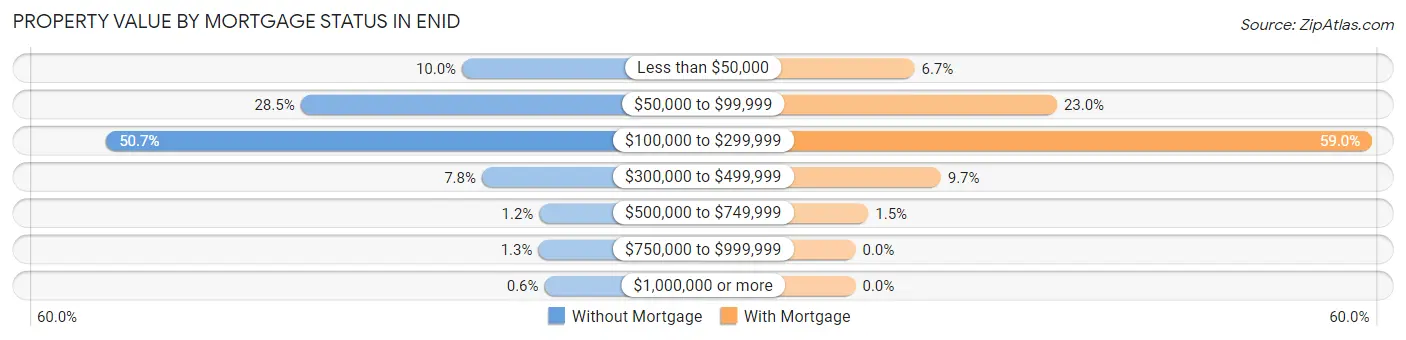
| Property Value | Without Mortgage | With Mortgage |
| Less than $50,000 | 581 (10.0%) | 406 (6.7%) |
| $50,000 to $99,999 | 1,650 (28.5%) | 1,387 (23.0%) |
| $100,000 to $299,999 | 2,937 (50.7%) | 3,556 (59.0%) |
| $300,000 to $499,999 | 449 (7.7%) | 587 (9.7%) |
| $500,000 to $749,999 | 69 (1.2%) | 88 (1.5%) |
| $750,000 to $999,999 | 75 (1.3%) | 0 (0.0%) |
| $1,000,000 or more | 35 (0.6%) | 0 (0.0%) |
| Total | 5,796 (100.0%) | 6,024 (100.0%) |
Household Income by Mortgage Status in Enid
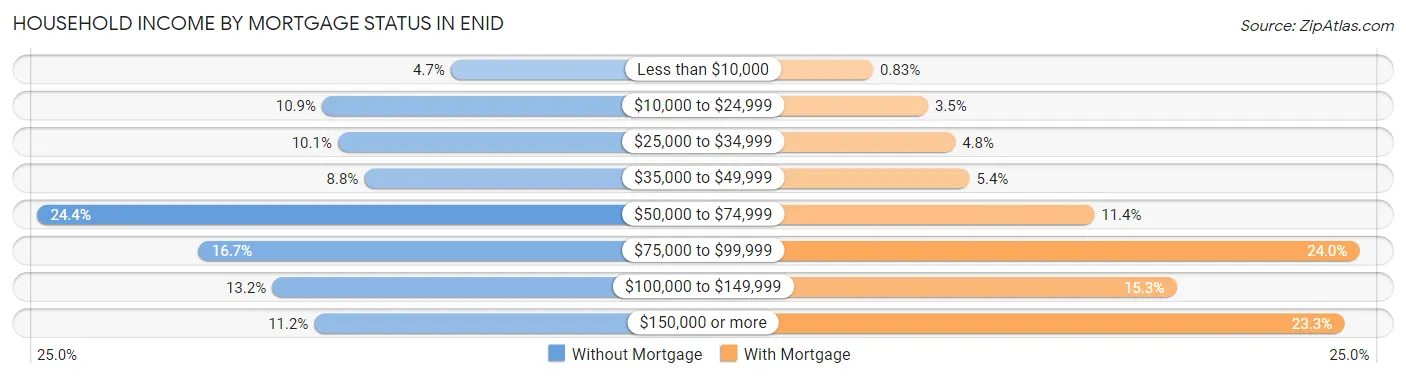
| Household Income | Without Mortgage | With Mortgage |
| Less than $10,000 | 273 (4.7%) | 50 (0.8%) |
| $10,000 to $24,999 | 629 (10.8%) | 208 (3.5%) |
| $25,000 to $34,999 | 585 (10.1%) | 286 (4.8%) |
| $35,000 to $49,999 | 512 (8.8%) | 327 (5.4%) |
| $50,000 to $74,999 | 1,413 (24.4%) | 685 (11.4%) |
| $75,000 to $99,999 | 968 (16.7%) | 1,445 (24.0%) |
| $100,000 to $149,999 | 766 (13.2%) | 920 (15.3%) |
| $150,000 or more | 650 (11.2%) | 1,401 (23.3%) |
| Total | 5,796 (100.0%) | 6,024 (100.0%) |
Property Value to Household Income Ratio in Enid
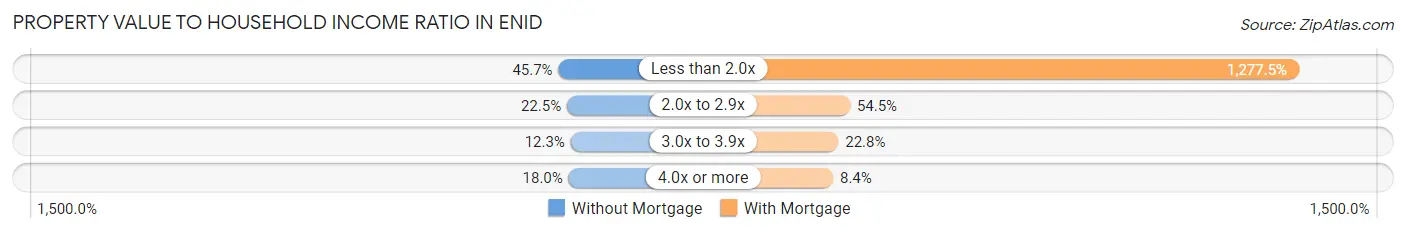
| Value-to-Income Ratio | Without Mortgage | With Mortgage |
| Less than 2.0x | 2,651 (45.7%) | 76,955 (1,277.5%) |
| 2.0x to 2.9x | 1,301 (22.5%) | 3,285 (54.5%) |
| 3.0x to 3.9x | 715 (12.3%) | 1,372 (22.8%) |
| 4.0x or more | 1,043 (18.0%) | 508 (8.4%) |
| Total | 5,796 (100.0%) | 6,024 (100.0%) |
Real Estate Taxes by Mortgage Status in Enid
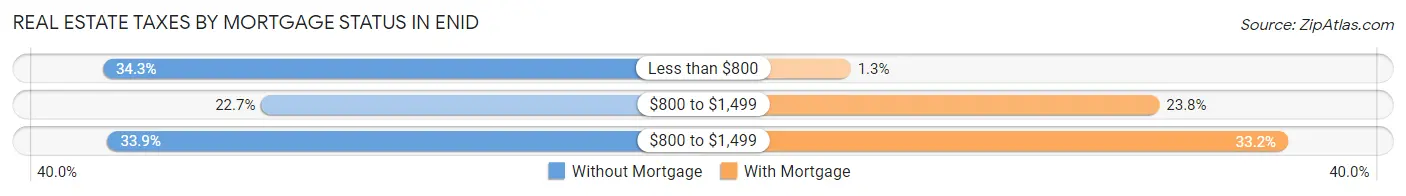
| Property Taxes | Without Mortgage | With Mortgage |
| Less than $800 | 1,986 (34.3%) | 78 (1.3%) |
| $800 to $1,499 | 1,316 (22.7%) | 1,436 (23.8%) |
| $800 to $1,499 | 1,967 (33.9%) | 2,002 (33.2%) |
| Total | 5,796 (100.0%) | 6,024 (100.0%) |
Health & Disability in Enid
Health Insurance Coverage by Age in Enid
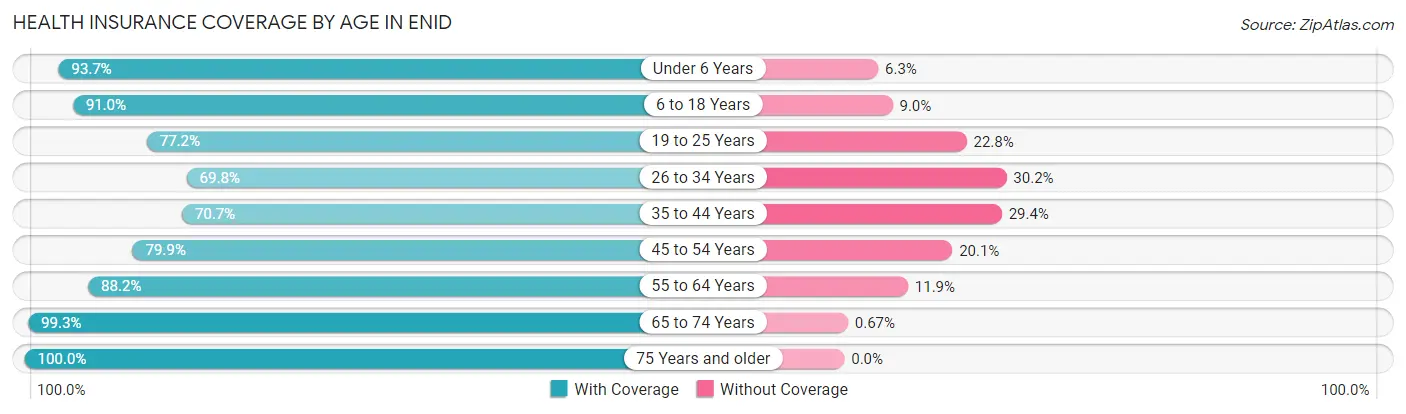
| Age Bracket | With Coverage | Without Coverage |
| Under 6 Years | 3,950 (93.7%) | 266 (6.3%) |
| 6 to 18 Years | 8,699 (91.0%) | 859 (9.0%) |
| 19 to 25 Years | 3,383 (77.2%) | 999 (22.8%) |
| 26 to 34 Years | 4,226 (69.8%) | 1,831 (30.2%) |
| 35 to 44 Years | 4,407 (70.7%) | 1,831 (29.3%) |
| 45 to 54 Years | 3,842 (79.9%) | 968 (20.1%) |
| 55 to 64 Years | 5,275 (88.1%) | 709 (11.8%) |
| 65 to 74 Years | 3,978 (99.3%) | 27 (0.7%) |
| 75 Years and older | 3,371 (100.0%) | 0 (0.0%) |
| Total | 41,131 (84.6%) | 7,490 (15.4%) |
Health Insurance Coverage by Citizenship Status in Enid
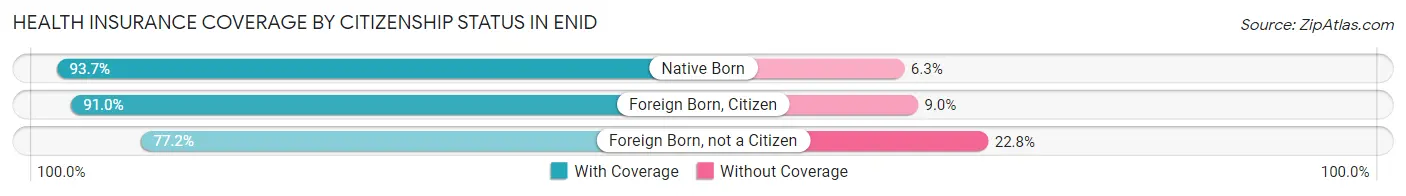
| Citizenship Status | With Coverage | Without Coverage |
| Native Born | 3,950 (93.7%) | 266 (6.3%) |
| Foreign Born, Citizen | 8,699 (91.0%) | 859 (9.0%) |
| Foreign Born, not a Citizen | 3,383 (77.2%) | 999 (22.8%) |
Health Insurance Coverage by Household Income in Enid
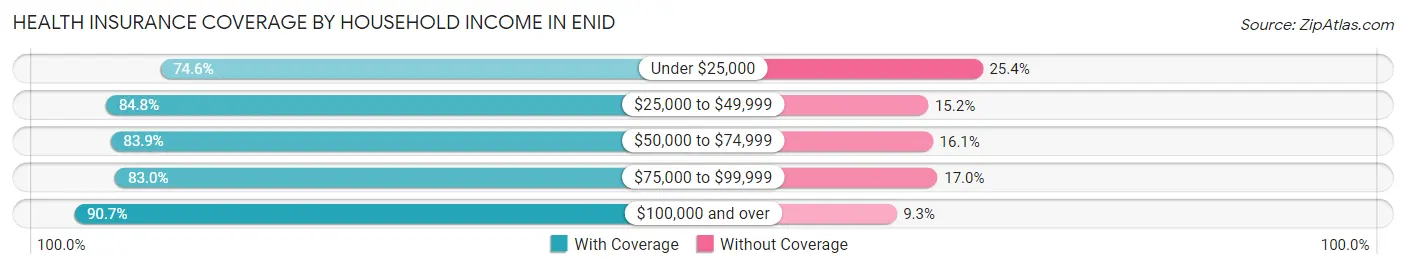
| Household Income | With Coverage | Without Coverage |
| Under $25,000 | 5,077 (74.6%) | 1,730 (25.4%) |
| $25,000 to $49,999 | 7,948 (84.8%) | 1,426 (15.2%) |
| $50,000 to $74,999 | 8,127 (83.9%) | 1,557 (16.1%) |
| $75,000 to $99,999 | 7,060 (83.0%) | 1,442 (17.0%) |
| $100,000 and over | 12,646 (90.7%) | 1,290 (9.3%) |
Public vs Private Health Insurance Coverage by Age in Enid
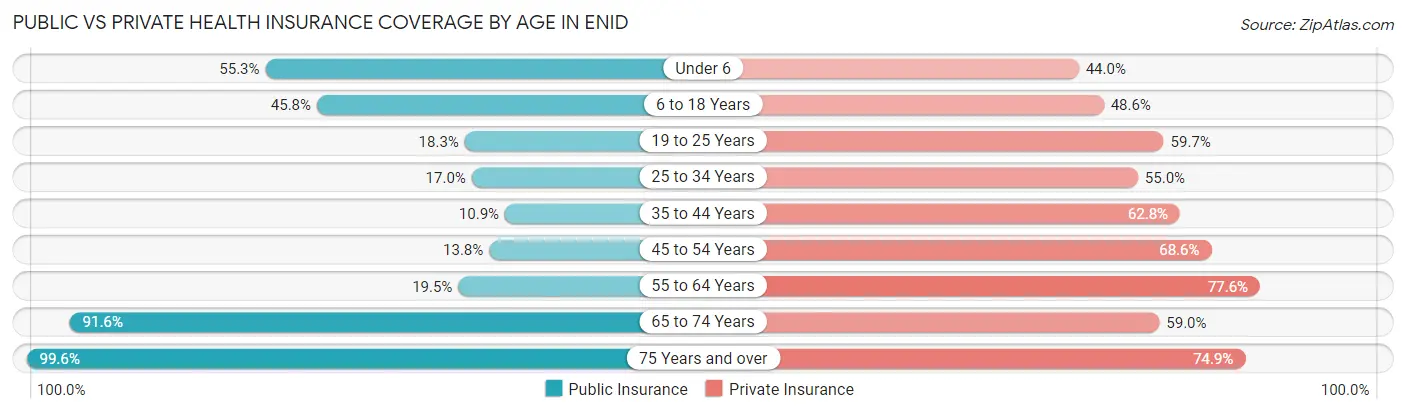
| Age Bracket | Public Insurance | Private Insurance |
| Under 6 | 2,332 (55.3%) | 1,854 (44.0%) |
| 6 to 18 Years | 4,373 (45.8%) | 4,646 (48.6%) |
| 19 to 25 Years | 803 (18.3%) | 2,618 (59.7%) |
| 25 to 34 Years | 1,031 (17.0%) | 3,329 (55.0%) |
| 35 to 44 Years | 677 (10.8%) | 3,915 (62.8%) |
| 45 to 54 Years | 663 (13.8%) | 3,299 (68.6%) |
| 55 to 64 Years | 1,168 (19.5%) | 4,644 (77.6%) |
| 65 to 74 Years | 3,670 (91.6%) | 2,361 (59.0%) |
| 75 Years and over | 3,359 (99.6%) | 2,524 (74.9%) |
| Total | 18,076 (37.2%) | 29,190 (60.0%) |
Disability Status by Sex by Age in Enid
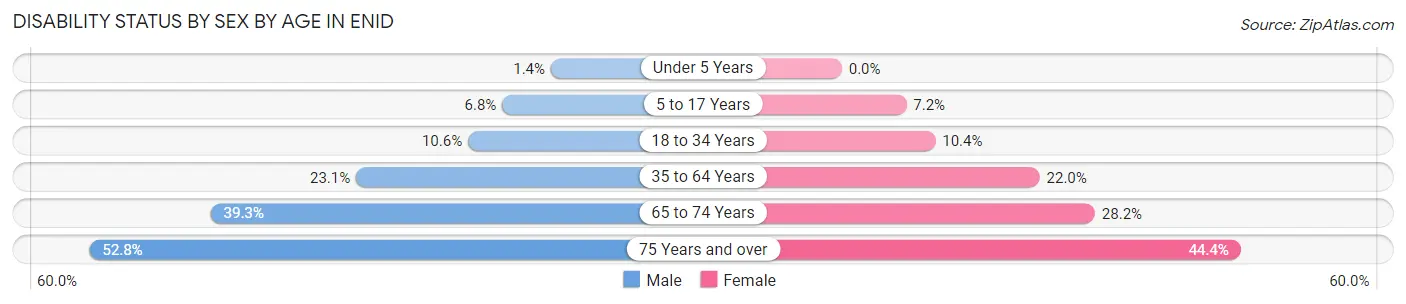
| Age Bracket | Male | Female |
| Under 5 Years | 24 (1.4%) | 0 (0.0%) |
| 5 to 17 Years | 335 (6.8%) | 331 (7.2%) |
| 18 to 34 Years | 585 (10.6%) | 578 (10.4%) |
| 35 to 64 Years | 1,990 (23.1%) | 1,853 (22.0%) |
| 65 to 74 Years | 804 (39.3%) | 552 (28.2%) |
| 75 Years and over | 635 (52.8%) | 963 (44.4%) |
Disability Class by Sex by Age in Enid
Disability Class: Hearing Difficulty
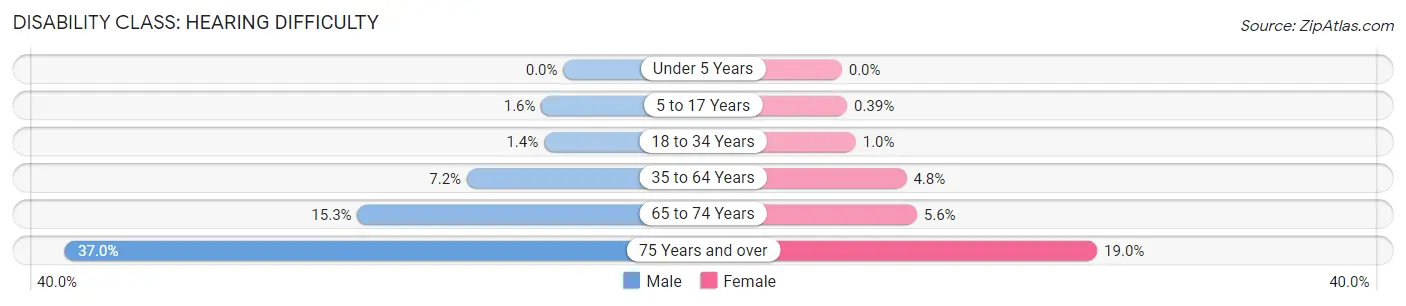
| Age Bracket | Male | Female |
| Under 5 Years | 0 (0.0%) | 0 (0.0%) |
| 5 to 17 Years | 80 (1.6%) | 18 (0.4%) |
| 18 to 34 Years | 79 (1.4%) | 58 (1.0%) |
| 35 to 64 Years | 617 (7.2%) | 404 (4.8%) |
| 65 to 74 Years | 313 (15.3%) | 109 (5.6%) |
| 75 Years and over | 445 (37.0%) | 411 (19.0%) |
Disability Class: Vision Difficulty
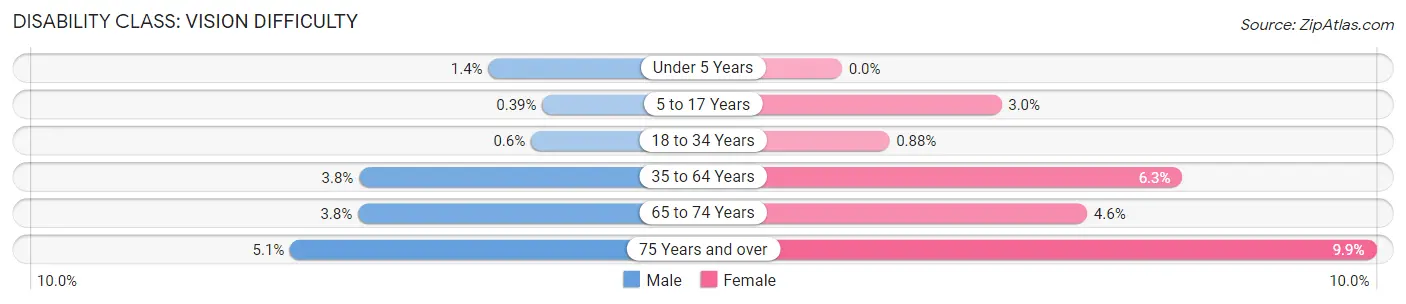
| Age Bracket | Male | Female |
| Under 5 Years | 24 (1.4%) | 0 (0.0%) |
| 5 to 17 Years | 19 (0.4%) | 136 (3.0%) |
| 18 to 34 Years | 33 (0.6%) | 49 (0.9%) |
| 35 to 64 Years | 327 (3.8%) | 532 (6.3%) |
| 65 to 74 Years | 78 (3.8%) | 89 (4.5%) |
| 75 Years and over | 61 (5.1%) | 215 (9.9%) |
Disability Class: Cognitive Difficulty
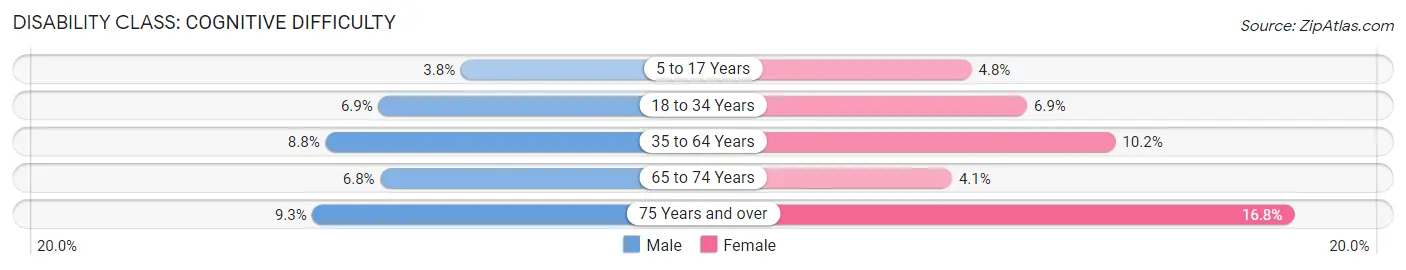
| Age Bracket | Male | Female |
| 5 to 17 Years | 187 (3.8%) | 222 (4.8%) |
| 18 to 34 Years | 378 (6.9%) | 382 (6.9%) |
| 35 to 64 Years | 761 (8.8%) | 855 (10.2%) |
| 65 to 74 Years | 139 (6.8%) | 80 (4.1%) |
| 75 Years and over | 112 (9.3%) | 364 (16.8%) |
Disability Class: Ambulatory Difficulty
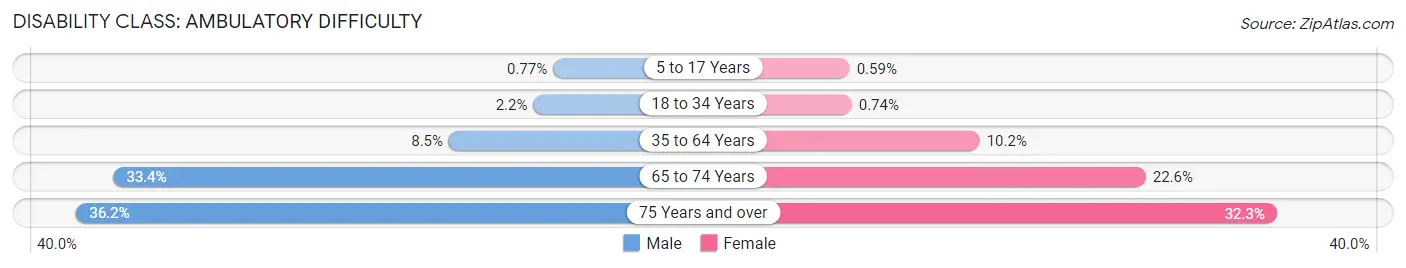
| Age Bracket | Male | Female |
| 5 to 17 Years | 38 (0.8%) | 27 (0.6%) |
| 18 to 34 Years | 123 (2.2%) | 41 (0.7%) |
| 35 to 64 Years | 733 (8.5%) | 861 (10.2%) |
| 65 to 74 Years | 684 (33.4%) | 442 (22.6%) |
| 75 Years and over | 435 (36.2%) | 700 (32.3%) |
Disability Class: Self-Care Difficulty
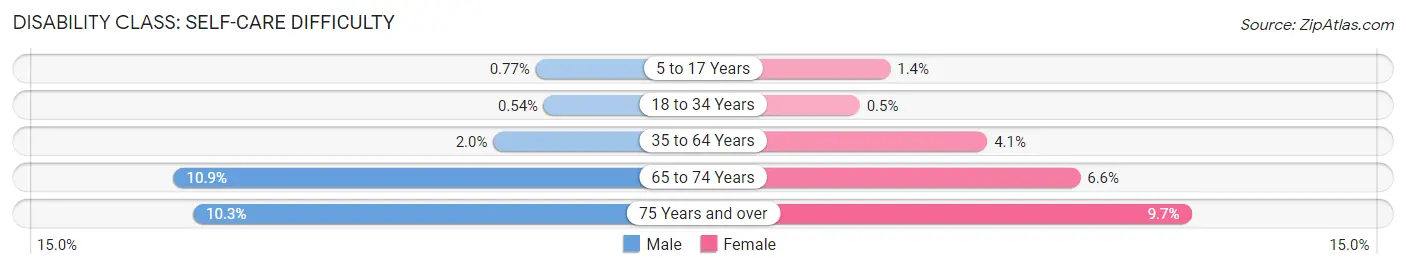
| Age Bracket | Male | Female |
| 5 to 17 Years | 38 (0.8%) | 62 (1.3%) |
| 18 to 34 Years | 30 (0.5%) | 28 (0.5%) |
| 35 to 64 Years | 168 (1.9%) | 341 (4.1%) |
| 65 to 74 Years | 222 (10.8%) | 130 (6.6%) |
| 75 Years and over | 124 (10.3%) | 211 (9.7%) |
Technology Access in Enid
Computing Device Access in Enid
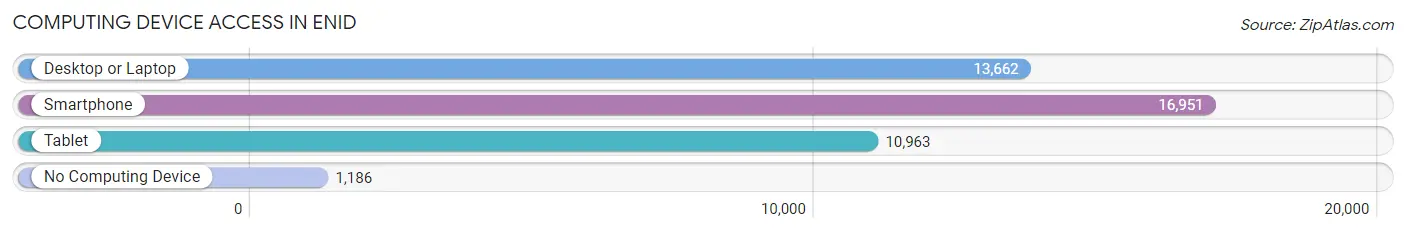
| Device Type | # Households | % Households |
| Desktop or Laptop | 13,662 | 70.2% |
| Smartphone | 16,951 | 87.1% |
| Tablet | 10,963 | 56.4% |
| No Computing Device | 1,186 | 6.1% |
| Total | 19,456 | 100.0% |
Internet Access in Enid
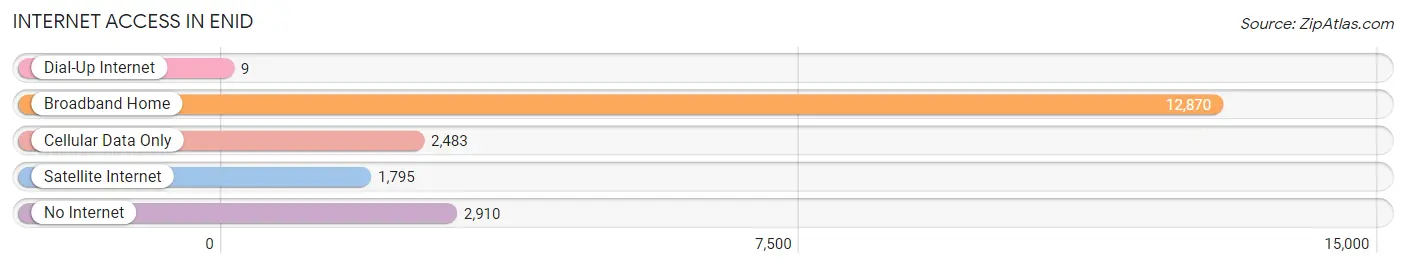
| Internet Type | # Households | % Households |
| Dial-Up Internet | 9 | 0.1% |
| Broadband Home | 12,870 | 66.1% |
| Cellular Data Only | 2,483 | 12.8% |
| Satellite Internet | 1,795 | 9.2% |
| No Internet | 2,910 | 15.0% |
| Total | 19,456 | 100.0% |
Enid Summary
Enid, Oklahoma is a city located in Garfield County in the north-central part of the state. It is the county seat and the largest city in the county. The city was founded in 1893 and was named after Enid, a character in Alfred Lord Tennyson’s Idylls of the King. Enid is located in the Red Bed Plains region of Oklahoma, which is characterized by flat terrain and red-colored soil.
Geography
Enid is located in the Red Bed Plains region of Oklahoma, which is characterized by flat terrain and red-colored soil. The city is situated in the center of Garfield County and is bordered by the towns of Kremlin, Waukomis, and Lahoma. The city is located at the intersection of US Highway 81 and US Highway 412. The city is located approximately 80 miles north of Oklahoma City and is part of the Enid Metropolitan Statistical Area.
The city has a total area of 28.2 square miles, of which 28.1 square miles is land and 0.1 square miles is water. The city is located at an elevation of 1,200 feet above sea level. The climate in Enid is characterized by hot, humid summers and cold, dry winters.
Economy
Enid’s economy is largely based on agriculture and manufacturing. The city is home to several large agricultural companies, including Cargill, Tyson Foods, and ConAgra Foods. The city is also home to several manufacturing companies, including Enid Manufacturing, Enid Plastics, and Enid Tool & Die.
The city is also home to Vance Air Force Base, which is the largest employer in the city. The base is home to the 71st Flying Training Wing and is responsible for training pilots for the United States Air Force.
Demographics
As of the 2010 census, the population of Enid was 49,379. The racial makeup of the city was 79.2% White, 8.3% African American, 0.7% Native American, 1.2% Asian, 0.1% Pacific Islander, and 8.5% from other races. The median household income in Enid was $41,945, and the median family income was $50,945.
The city is home to several educational institutions, including Northern Oklahoma College, Autry Technology Center, and Enid Public Schools. The city is also home to several churches, including First United Methodist Church, First Christian Church, and St. Mary’s Catholic Church.
History
Enid was founded in 1893 by railroad workers who were constructing the Atchison, Topeka and Santa Fe Railway. The city was named after Enid, a character in Alfred Lord Tennyson’s Idylls of the King. The city quickly grew and became a major agricultural center in the region.
In the early 20th century, Enid was home to several oil and gas companies, including Phillips Petroleum and Skelly Oil. The city was also home to several manufacturing companies, including Enid Manufacturing, Enid Plastics, and Enid Tool & Die.
In 1941, Vance Air Force Base was established in Enid. The base is home to the 71st Flying Training Wing and is responsible for training pilots for the United States Air Force.
Enid has continued to grow and develop over the years. The city is home to several educational institutions, churches, and businesses. The city is also home to several cultural attractions, including the Cherokee Strip Regional Heritage Center and the Enid Symphony Orchestra.
Common Questions
What is Per Capita Income in Enid?
Per Capita income in Enid is $30,253.
What is the Median Family Income in Enid?
Median Family Income in Enid is $72,115.
What is the Median Household income in Enid?
Median Household Income in Enid is $60,790.
What is Income or Wage Gap in Enid?
Income or Wage Gap in Enid is 29.4%.
Women in Enid earn 70.6 cents for every dollar earned by a man.
What is Family Income Deficit in Enid?
Family Income Deficit in Enid is $10,739.
Families that are below poverty line in Enid earn $10,739 less on average than the poverty threshold level.
What is Inequality or Gini Index in Enid?
Inequality or Gini Index in Enid is 0.44.
What is the Total Population of Enid?
Total Population of Enid is 50,961.
What is the Total Male Population of Enid?
Total Male Population of Enid is 25,670.
What is the Total Female Population of Enid?
Total Female Population of Enid is 25,291.
What is the Ratio of Males per 100 Females in Enid?
There are 101.50 Males per 100 Females in Enid.
What is the Ratio of Females per 100 Males in Enid?
There are 98.52 Females per 100 Males in Enid.
What is the Median Population Age in Enid?
Median Population Age in Enid is 34.8 Years.
What is the Average Family Size in Enid
Average Family Size in Enid is 3.2 People.
What is the Average Household Size in Enid
Average Household Size in Enid is 2.5 People.
How Large is the Labor Force in Enid?
There are 24,999 People in the Labor Forcein in Enid.
What is the Percentage of People in the Labor Force in Enid?
63.9% of People are in the Labor Force in Enid.
What is the Unemployment Rate in Enid?
Unemployment Rate in Enid is 4.7%.