Hammond, IN Map & Demographics
Hammond Map
Hammond Overview
$26,109
PER CAPITA INCOME
$62,225
AVG FAMILY INCOME
$52,368
AVG HOUSEHOLD INCOME
34.5%
WAGE / INCOME GAP [ % ]
65.5¢/ $1
WAGE / INCOME GAP [ $ ]
$11,648
FAMILY INCOME DEFICIT
0.43
INEQUALITY / GINI INDEX
77,390
TOTAL POPULATION
38,035
MALE POPULATION
39,355
FEMALE POPULATION
96.65
MALES / 100 FEMALES
103.47
FEMALES / 100 MALES
36.5
MEDIAN AGE
3.4
AVG FAMILY SIZE
2.6
AVG HOUSEHOLD SIZE
37,385
LABOR FORCE [ PEOPLE ]
60.6%
PERCENT IN LABOR FORCE
6.3%
UNEMPLOYMENT RATE
Hammond Area Codes
Income in Hammond
Income Overview in Hammond
Per Capita Income in Hammond is $26,109, while median incomes of families and households are $62,225 and $52,368 respectively.
| Characteristic | Number | Measure |
| Per Capita Income | 77,390 | $26,109 |
| Median Family Income | 18,123 | $62,225 |
| Mean Family Income | 18,123 | $77,327 |
| Median Household Income | 29,348 | $52,368 |
| Mean Household Income | 29,348 | $66,236 |
| Income Deficit | 18,123 | $11,648 |
| Wage / Income Gap (%) | 77,390 | 34.52% |
| Wage / Income Gap ($) | 77,390 | 65.48¢ per $1 |
| Gini / Inequality Index | 77,390 | 0.43 |
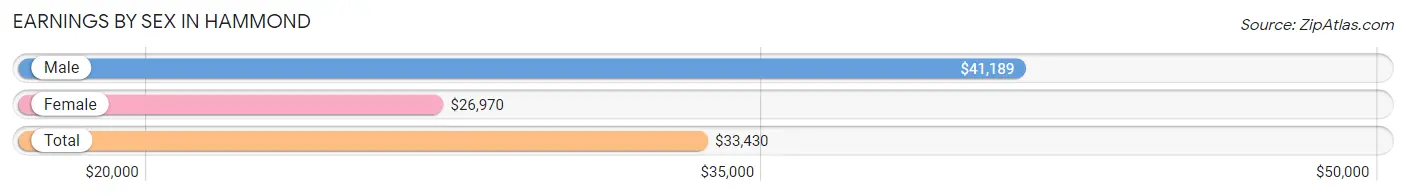
Earnings by Sex in Hammond
Average Earnings in Hammond are $33,430, $41,189 for men and $26,970 for women, a difference of 34.5%.
| Sex | Number | Average Earnings |
| Male | 20,302 (52.3%) | $41,189 |
| Female | 18,534 (47.7%) | $26,970 |
| Total | 38,836 (100.0%) | $33,430 |
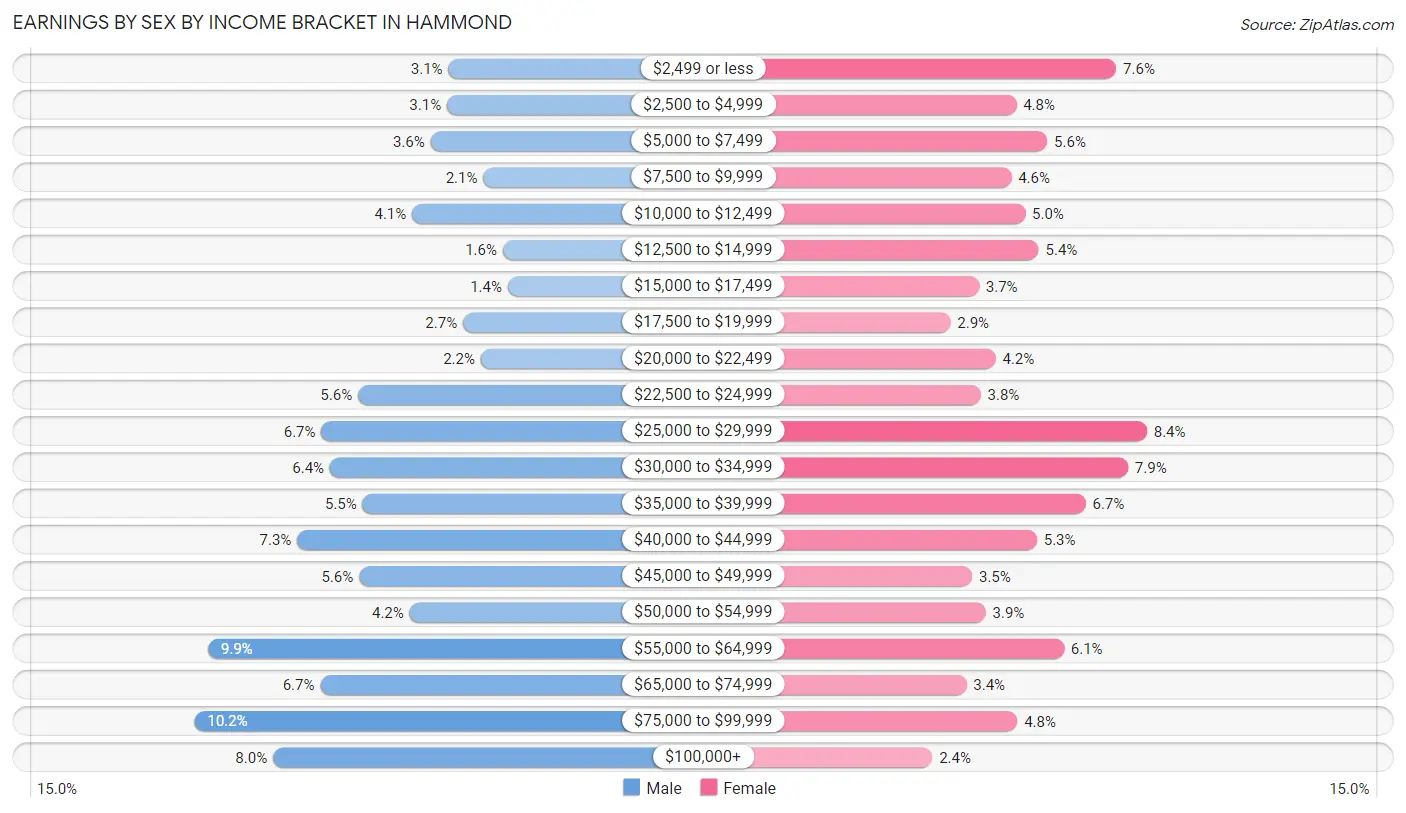
Earnings by Sex by Income Bracket in Hammond
The most common earnings brackets in Hammond are $75,000 to $99,999 for men (2,077 | 10.2%) and $25,000 to $29,999 for women (1,563 | 8.4%).
| Income | Male | Female |
| $2,499 or less | 627 (3.1%) | 1,403 (7.6%) |
| $2,500 to $4,999 | 635 (3.1%) | 883 (4.8%) |
| $5,000 to $7,499 | 729 (3.6%) | 1,044 (5.6%) |
| $7,500 to $9,999 | 428 (2.1%) | 857 (4.6%) |
| $10,000 to $12,499 | 834 (4.1%) | 929 (5.0%) |
| $12,500 to $14,999 | 316 (1.6%) | 999 (5.4%) |
| $15,000 to $17,499 | 288 (1.4%) | 687 (3.7%) |
| $17,500 to $19,999 | 545 (2.7%) | 540 (2.9%) |
| $20,000 to $22,499 | 443 (2.2%) | 775 (4.2%) |
| $22,500 to $24,999 | 1,144 (5.6%) | 696 (3.8%) |
| $25,000 to $29,999 | 1,353 (6.7%) | 1,563 (8.4%) |
| $30,000 to $34,999 | 1,304 (6.4%) | 1,464 (7.9%) |
| $35,000 to $39,999 | 1,117 (5.5%) | 1,244 (6.7%) |
| $40,000 to $44,999 | 1,491 (7.3%) | 989 (5.3%) |
| $45,000 to $49,999 | 1,136 (5.6%) | 652 (3.5%) |
| $50,000 to $54,999 | 849 (4.2%) | 723 (3.9%) |
| $55,000 to $64,999 | 2,000 (9.9%) | 1,131 (6.1%) |
| $65,000 to $74,999 | 1,358 (6.7%) | 623 (3.4%) |
| $75,000 to $99,999 | 2,077 (10.2%) | 888 (4.8%) |
| $100,000+ | 1,628 (8.0%) | 444 (2.4%) |
| Total | 20,302 (100.0%) | 18,534 (100.0%) |
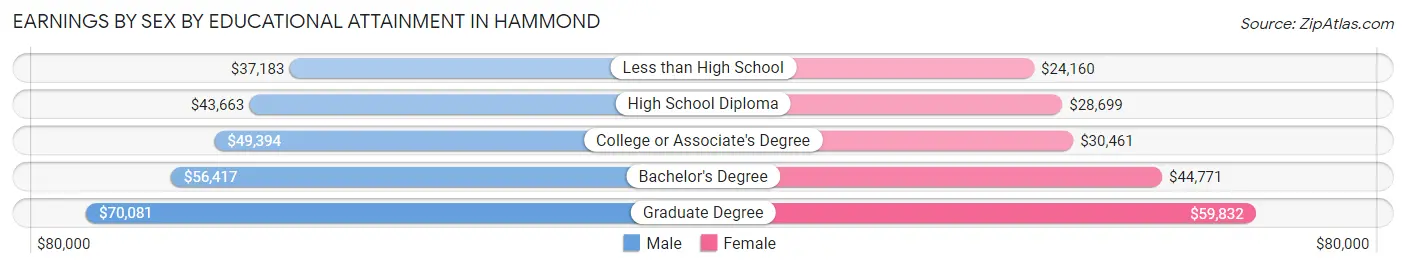
Earnings by Sex by Educational Attainment in Hammond
Average earnings in Hammond are $46,077 for men and $31,771 for women, a difference of 31.0%. Men with an educational attainment of graduate degree enjoy the highest average annual earnings of $70,081, while those with less than high school education earn the least with $37,183. Women with an educational attainment of graduate degree earn the most with the average annual earnings of $59,832, while those with less than high school education have the smallest earnings of $24,160.
| Educational Attainment | Male Income | Female Income |
| Less than High School | $37,183 | $24,160 |
| High School Diploma | $43,663 | $28,699 |
| College or Associate's Degree | $49,394 | $30,461 |
| Bachelor's Degree | $56,417 | $44,771 |
| Graduate Degree | $70,081 | $59,832 |
| Total | $46,077 | $31,771 |
Family Income in Hammond
Family Income Brackets in Hammond
According to the Hammond family income data, there are 3,715 families falling into the $50,000 to $74,999 income range, which is the most common income bracket and makes up 20.5% of all families. Conversely, the $10,000 to $14,999 income bracket is the least frequent group with only 544 families (3.0%) belonging to this category.
| Income Bracket | # Families | % Families |
| Less than $10,000 | 1,015 | 5.6% |
| $10,000 to $14,999 | 544 | 3.0% |
| $15,000 to $24,999 | 1,468 | 8.1% |
| $25,000 to $34,999 | 1,269 | 7.0% |
| $35,000 to $49,999 | 2,628 | 14.5% |
| $50,000 to $74,999 | 3,715 | 20.5% |
| $75,000 to $99,999 | 3,081 | 17.0% |
| $100,000 to $149,999 | 2,990 | 16.5% |
| $150,000 to $199,999 | 761 | 4.2% |
| $200,000+ | 652 | 3.6% |
Family Income by Famaliy Size in Hammond
7+ person families (451 | 2.5%) account for the highest median family income in Hammond with $96,688 per family, while 2-person families (8,090 | 44.6%) have the highest median income of $29,104 per family member.
| Income Bracket | # Families | Median Income |
| 2-Person Families | 8,090 (44.6%) | $58,208 |
| 3-Person Families | 4,070 (22.5%) | $60,968 |
| 4-Person Families | 3,046 (16.8%) | $71,196 |
| 5-Person Families | 1,733 (9.6%) | $70,064 |
| 6-Person Families | 733 (4.0%) | $83,560 |
| 7+ Person Families | 451 (2.5%) | $96,688 |
| Total | 18,123 (100.0%) | $62,225 |
Family Income by Number of Earners in Hammond
The median family income in Hammond is $62,225, with families comprising 3+ earners (2,186) having the highest median family income of $121,092, while families with no earners (2,599) have the lowest median family income of $30,785, accounting for 12.1% and 14.3% of families, respectively.
| Number of Earners | # Families | Median Income |
| No Earners | 2,599 (14.3%) | $30,785 |
| 1 Earner | 7,246 (40.0%) | $44,961 |
| 2 Earners | 6,092 (33.6%) | $89,025 |
| 3+ Earners | 2,186 (12.1%) | $121,092 |
| Total | 18,123 (100.0%) | $62,225 |
Household Income in Hammond
Household Income Brackets in Hammond
With 5,429 households falling in the category, the $50,000 to $74,999 income range is the most frequent in Hammond, accounting for 18.5% of all households. In contrast, only 763 households (2.6%) fall into the $200,000+ income bracket, making it the least populous group.
| Income Bracket | # Households | % Households |
| Less than $10,000 | 2,465 | 8.4% |
| $10,000 to $14,999 | 1,291 | 4.4% |
| $15,000 to $24,999 | 2,759 | 9.4% |
| $25,000 to $34,999 | 2,759 | 9.4% |
| $35,000 to $49,999 | 4,784 | 16.3% |
| $50,000 to $74,999 | 5,429 | 18.5% |
| $75,000 to $99,999 | 4,432 | 15.1% |
| $100,000 to $149,999 | 3,727 | 12.7% |
| $150,000 to $199,999 | 968 | 3.3% |
| $200,000+ | 763 | 2.6% |
Household Income by Householder Age in Hammond
The median household income in Hammond is $52,368, with the highest median household income of $61,575 found in the 45 to 64 years age bracket for the primary householder. A total of 11,378 households (38.8%) fall into this category. Meanwhile, the 15 to 24 years age bracket for the primary householder has the lowest median household income of $37,855, with 1,061 households (3.6%) in this group.
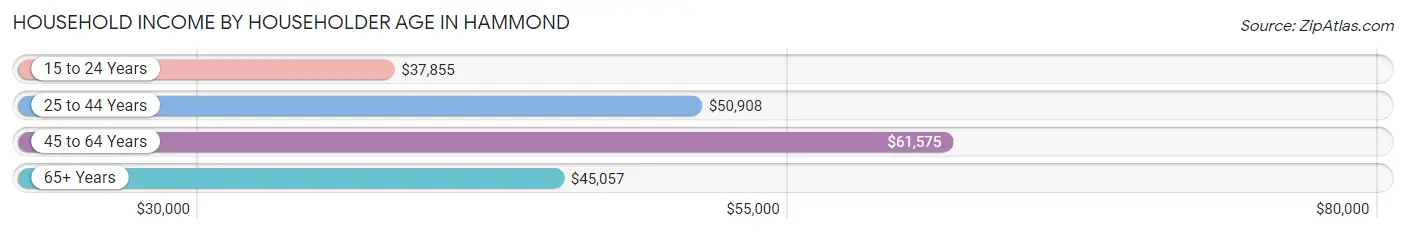
| Income Bracket | # Households | Median Income |
| 15 to 24 Years | 1,061 (3.6%) | $37,855 |
| 25 to 44 Years | 10,311 (35.1%) | $50,908 |
| 45 to 64 Years | 11,378 (38.8%) | $61,575 |
| 65+ Years | 6,598 (22.5%) | $45,057 |
| Total | 29,348 (100.0%) | $52,368 |
Poverty in Hammond
Income Below Poverty by Sex and Age in Hammond
With 17.7% poverty level for males and 22.0% for females among the residents of Hammond, 5 year old males and 5 year old females are the most vulnerable to poverty, with 245 males (58.1%) and 102 females (47.0%) in their respective age groups living below the poverty level.
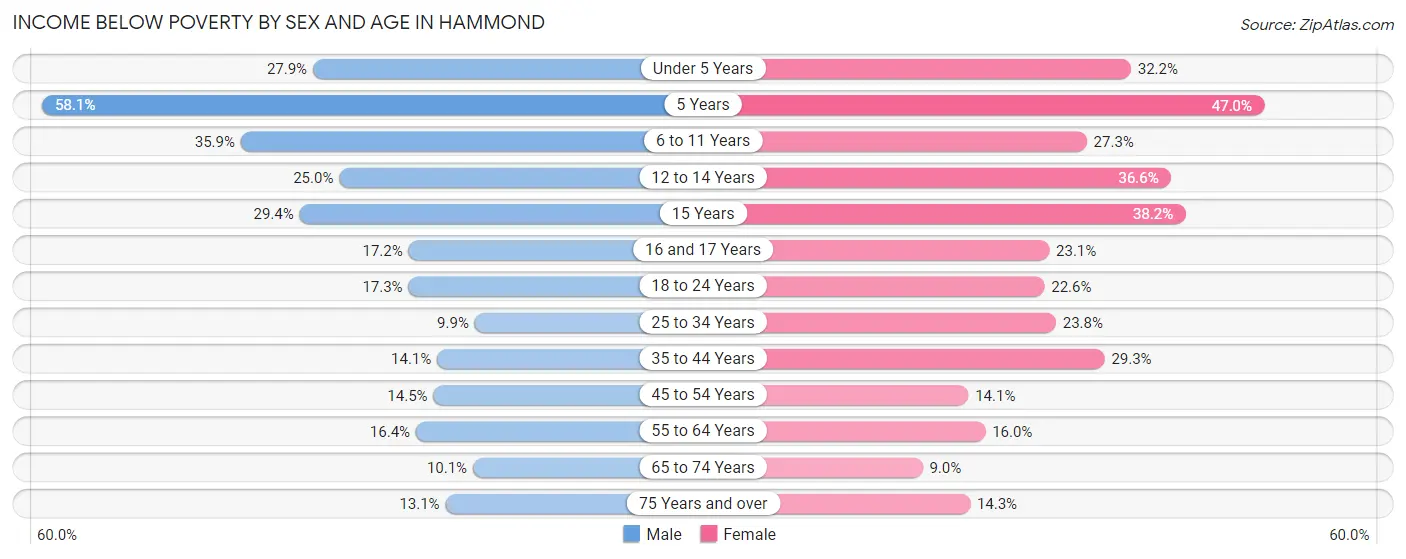
| Age Bracket | Male | Female |
| Under 5 Years | 658 (27.9%) | 542 (32.2%) |
| 5 Years | 245 (58.1%) | 102 (47.0%) |
| 6 to 11 Years | 1,056 (35.9%) | 906 (27.3%) |
| 12 to 14 Years | 466 (25.0%) | 573 (36.6%) |
| 15 Years | 171 (29.4%) | 203 (38.2%) |
| 16 and 17 Years | 185 (17.2%) | 315 (23.1%) |
| 18 to 24 Years | 664 (17.2%) | 861 (22.6%) |
| 25 to 34 Years | 563 (9.9%) | 1,148 (23.8%) |
| 35 to 44 Years | 697 (14.1%) | 1,810 (29.2%) |
| 45 to 54 Years | 607 (14.5%) | 611 (14.1%) |
| 55 to 64 Years | 877 (16.4%) | 839 (16.0%) |
| 65 to 74 Years | 287 (10.1%) | 291 (9.0%) |
| 75 Years and over | 202 (13.1%) | 364 (14.3%) |
| Total | 6,678 (17.7%) | 8,565 (22.0%) |
Income Above Poverty by Sex and Age in Hammond
According to the poverty statistics in Hammond, males aged 25 to 34 years and females aged 65 to 74 years are the age groups that are most secure financially, with 90.1% of males and 91.0% of females in these age groups living above the poverty line.
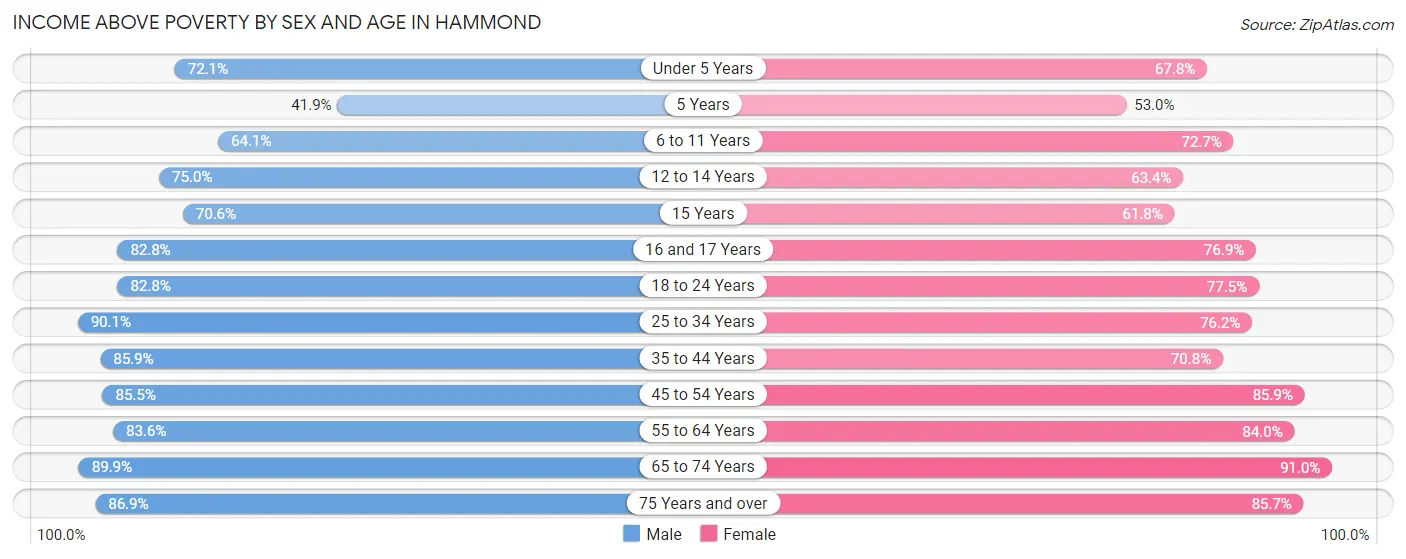
| Age Bracket | Male | Female |
| Under 5 Years | 1,701 (72.1%) | 1,142 (67.8%) |
| 5 Years | 177 (41.9%) | 115 (53.0%) |
| 6 to 11 Years | 1,884 (64.1%) | 2,416 (72.7%) |
| 12 to 14 Years | 1,401 (75.0%) | 992 (63.4%) |
| 15 Years | 411 (70.6%) | 328 (61.8%) |
| 16 and 17 Years | 888 (82.8%) | 1,049 (76.9%) |
| 18 to 24 Years | 3,186 (82.8%) | 2,958 (77.4%) |
| 25 to 34 Years | 5,139 (90.1%) | 3,669 (76.2%) |
| 35 to 44 Years | 4,262 (85.9%) | 4,379 (70.8%) |
| 45 to 54 Years | 3,589 (85.5%) | 3,728 (85.9%) |
| 55 to 64 Years | 4,464 (83.6%) | 4,415 (84.0%) |
| 65 to 74 Years | 2,564 (89.9%) | 2,948 (91.0%) |
| 75 Years and over | 1,337 (86.9%) | 2,187 (85.7%) |
| Total | 31,003 (82.3%) | 30,326 (78.0%) |
Income Below Poverty Among Married-Couple Families in Hammond
The poverty statistics for married-couple families in Hammond show that 9.3% or 973 of the total 10,482 families live below the poverty line. Families with 5 or more children have the highest poverty rate of 100.0%, comprising of 52 families. On the other hand, families with no children have the lowest poverty rate of 4.3%, which includes 256 families.
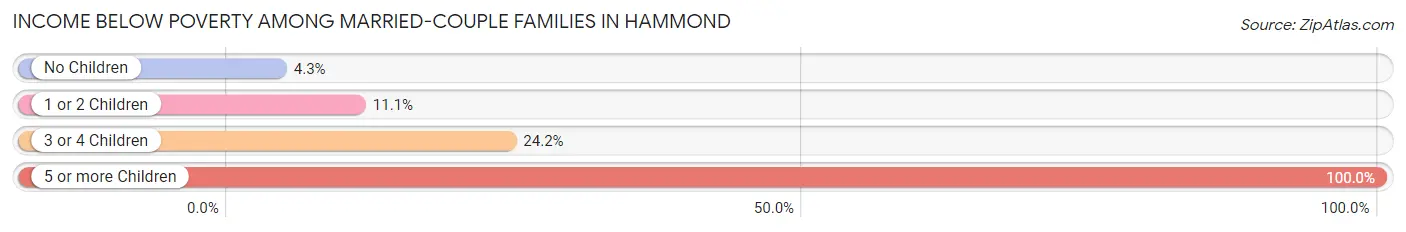
| Children | Above Poverty | Below Poverty |
| No Children | 5,768 (95.8%) | 256 (4.3%) |
| 1 or 2 Children | 2,731 (88.9%) | 342 (11.1%) |
| 3 or 4 Children | 1,010 (75.8%) | 323 (24.2%) |
| 5 or more Children | 0 (0.0%) | 52 (100.0%) |
| Total | 9,509 (90.7%) | 973 (9.3%) |
Income Below Poverty Among Single-Parent Households in Hammond
According to the poverty data in Hammond, 14.1% or 293 single-father households and 28.4% or 1,579 single-mother households are living below the poverty line. Among single-father households, those with 3 or 4 children have the highest poverty rate, with 36 households (27.1%) experiencing poverty. Likewise, among single-mother households, those with 5 or more children have the highest poverty rate, with 85 households (79.4%) falling below the poverty line.
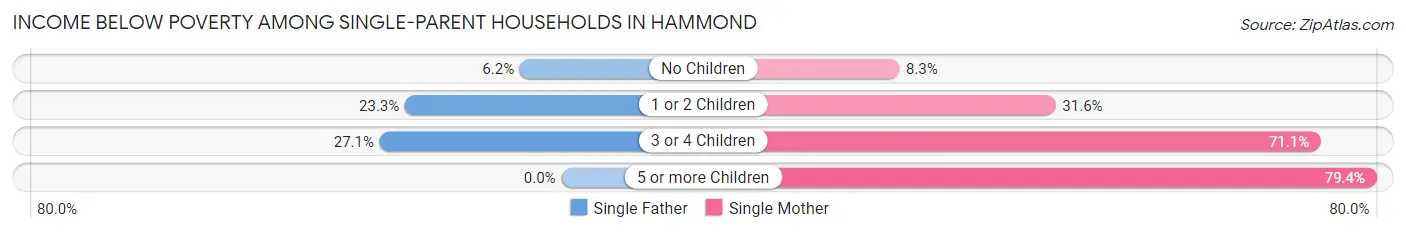
| Children | Single Father | Single Mother |
| No Children | 68 (6.2%) | 165 (8.3%) |
| 1 or 2 Children | 189 (23.3%) | 903 (31.6%) |
| 3 or 4 Children | 36 (27.1%) | 426 (71.1%) |
| 5 or more Children | 0 (0.0%) | 85 (79.4%) |
| Total | 293 (14.1%) | 1,579 (28.4%) |
Income Below Poverty Among Married-Couple vs Single-Parent Households in Hammond
The poverty data for Hammond shows that 973 of the married-couple family households (9.3%) and 1,872 of the single-parent households (24.5%) are living below the poverty level. Within the married-couple family households, those with 5 or more children have the highest poverty rate, with 52 households (100.0%) falling below the poverty line. Among the single-parent households, those with 3 or 4 children have the highest poverty rate, with 462 household (63.1%) living below poverty.
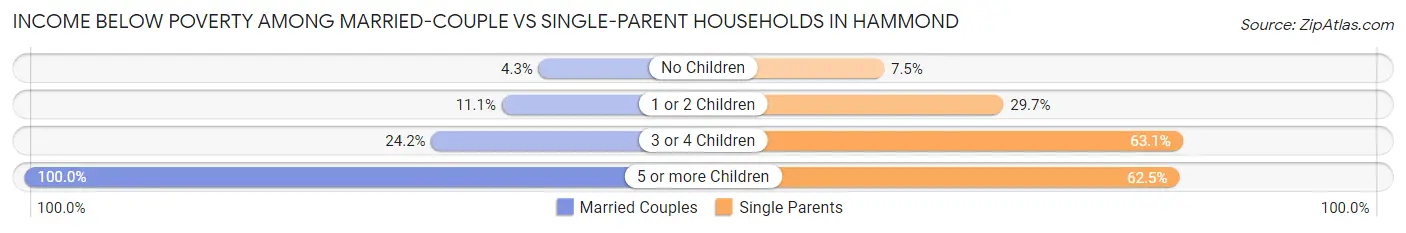
| Children | Married-Couple Families | Single-Parent Households |
| No Children | 256 (4.3%) | 233 (7.5%) |
| 1 or 2 Children | 342 (11.1%) | 1,092 (29.7%) |
| 3 or 4 Children | 323 (24.2%) | 462 (63.1%) |
| 5 or more Children | 52 (100.0%) | 85 (62.5%) |
| Total | 973 (9.3%) | 1,872 (24.5%) |
Race in Hammond
The most populous races in Hammond are White / Caucasian (32,898 | 42.5%), Hispanic or Latino (31,255 | 40.4%), and Some other Race (19,417 | 25.1%).
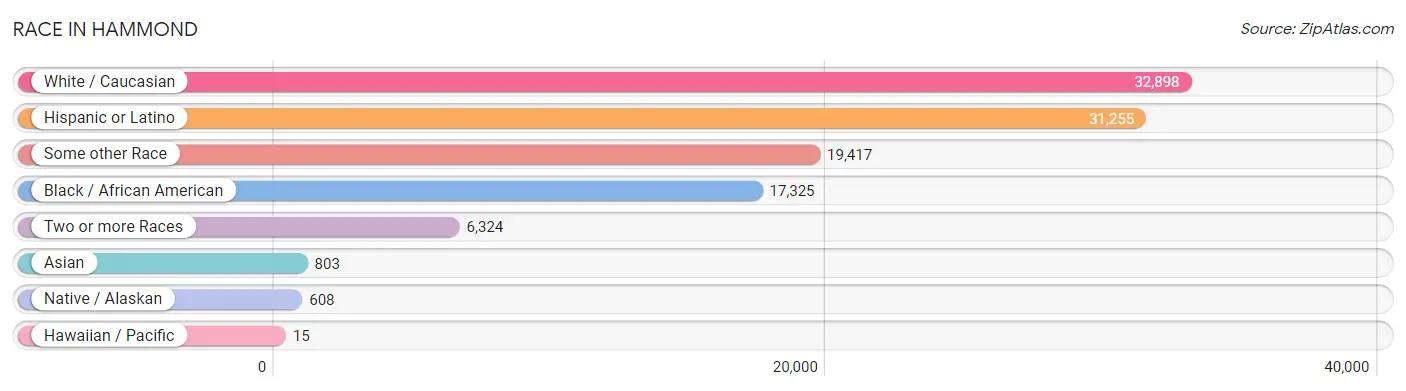
| Race | # Population | % Population |
| Asian | 803 | 1.0% |
| Black / African American | 17,325 | 22.4% |
| Hawaiian / Pacific | 15 | 0.0% |
| Hispanic or Latino | 31,255 | 40.4% |
| Native / Alaskan | 608 | 0.8% |
| White / Caucasian | 32,898 | 42.5% |
| Two or more Races | 6,324 | 8.2% |
| Some other Race | 19,417 | 25.1% |
| Total | 77,390 | 100.0% |
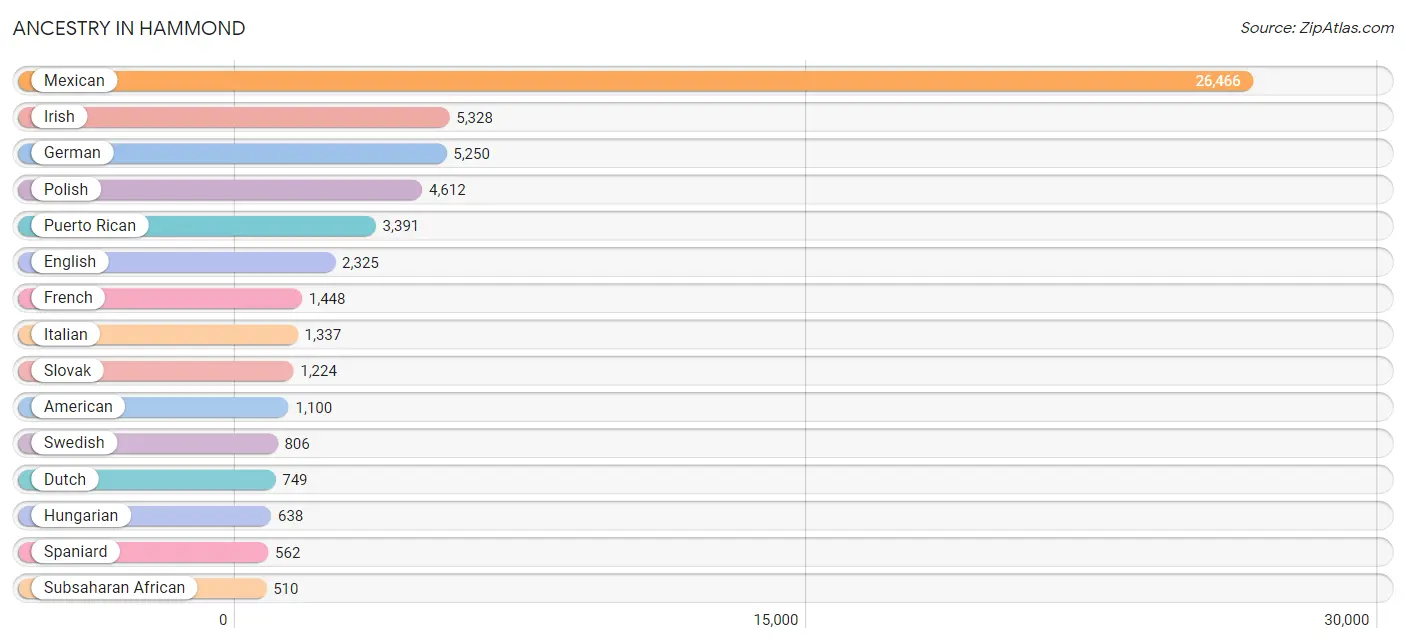
Ancestry in Hammond
The most populous ancestries reported in Hammond are Mexican (26,466 | 34.2%), Irish (5,328 | 6.9%), German (5,250 | 6.8%), Polish (4,612 | 6.0%), and Puerto Rican (3,391 | 4.4%), together accounting for 58.2% of all Hammond residents.
| Ancestry | # Population | % Population |
| African | 275 | 0.4% |
| American | 1,100 | 1.4% |
| Apache | 34 | 0.0% |
| Arab | 169 | 0.2% |
| Argentinean | 50 | 0.1% |
| Australian | 2 | 0.0% |
| Austrian | 79 | 0.1% |
| Belgian | 13 | 0.0% |
| Bhutanese | 43 | 0.1% |
| Blackfeet | 32 | 0.0% |
| Brazilian | 14 | 0.0% |
| British | 40 | 0.1% |
| Bulgarian | 1 | 0.0% |
| Burmese | 190 | 0.3% |
| Canadian | 63 | 0.1% |
| Central American | 299 | 0.4% |
| Central American Indian | 110 | 0.1% |
| Cherokee | 96 | 0.1% |
| Chickasaw | 5 | 0.0% |
| Chippewa | 13 | 0.0% |
| Choctaw | 13 | 0.0% |
| Colombian | 57 | 0.1% |
| Costa Rican | 29 | 0.0% |
| Croatian | 205 | 0.3% |
| Cuban | 61 | 0.1% |
| Czech | 245 | 0.3% |
| Czechoslovakian | 88 | 0.1% |
| Danish | 8 | 0.0% |
| Dominican | 70 | 0.1% |
| Dutch | 749 | 1.0% |
| Eastern European | 76 | 0.1% |
| Ecuadorian | 19 | 0.0% |
| English | 2,325 | 3.0% |
| European | 479 | 0.6% |
| Finnish | 10 | 0.0% |
| French | 1,448 | 1.9% |
| French Canadian | 25 | 0.0% |
| German | 5,250 | 6.8% |
| Ghanaian | 46 | 0.1% |
| Greek | 391 | 0.5% |
| Guamanian / Chamorro | 24 | 0.0% |
| Guatemalan | 121 | 0.2% |
| Haitian | 46 | 0.1% |
| Honduran | 90 | 0.1% |
| Hungarian | 638 | 0.8% |
| Indian (Asian) | 172 | 0.2% |
| Irish | 5,328 | 6.9% |
| Italian | 1,337 | 1.7% |
| Jamaican | 33 | 0.0% |
| Jordanian | 10 | 0.0% |
| Korean | 467 | 0.6% |
| Lithuanian | 91 | 0.1% |
| Lumbee | 75 | 0.1% |
| Macedonian | 170 | 0.2% |
| Mexican | 26,466 | 34.2% |
| Mexican American Indian | 393 | 0.5% |
| Moroccan | 11 | 0.0% |
| Native Hawaiian | 35 | 0.1% |
| Navajo | 1 | 0.0% |
| Nigerian | 181 | 0.2% |
| Northern European | 7 | 0.0% |
| Norwegian | 193 | 0.3% |
| Pakistani | 54 | 0.1% |
| Palestinian | 57 | 0.1% |
| Pennsylvania German | 4 | 0.0% |
| Polish | 4,612 | 6.0% |
| Portuguese | 44 | 0.1% |
| Potawatomi | 20 | 0.0% |
| Pueblo | 4 | 0.0% |
| Puerto Rican | 3,391 | 4.4% |
| Romanian | 100 | 0.1% |
| Russian | 228 | 0.3% |
| Salvadoran | 59 | 0.1% |
| Samoan | 7 | 0.0% |
| Scandinavian | 1 | 0.0% |
| Scotch-Irish | 209 | 0.3% |
| Scottish | 357 | 0.5% |
| Serbian | 202 | 0.3% |
| Sioux | 16 | 0.0% |
| Slavic | 8 | 0.0% |
| Slovak | 1,224 | 1.6% |
| South American | 126 | 0.2% |
| Spaniard | 562 | 0.7% |
| Spanish | 104 | 0.1% |
| Spanish American Indian | 18 | 0.0% |
| Subsaharan African | 510 | 0.7% |
| Swedish | 806 | 1.0% |
| Swiss | 105 | 0.1% |
| Thai | 213 | 0.3% |
| Turkish | 19 | 0.0% |
| Ukrainian | 119 | 0.2% |
| Welsh | 103 | 0.1% |
| Yugoslavian | 10 | 0.0% | View All 93 Rows |
Immigrants in Hammond
The most numerous immigrant groups reported in Hammond came from Latin America (7,262 | 9.4%), Central America (7,126 | 9.2%), Mexico (6,851 | 8.8%), Asia (660 | 0.9%), and Africa (341 | 0.4%), together accounting for 28.7% of all Hammond residents.
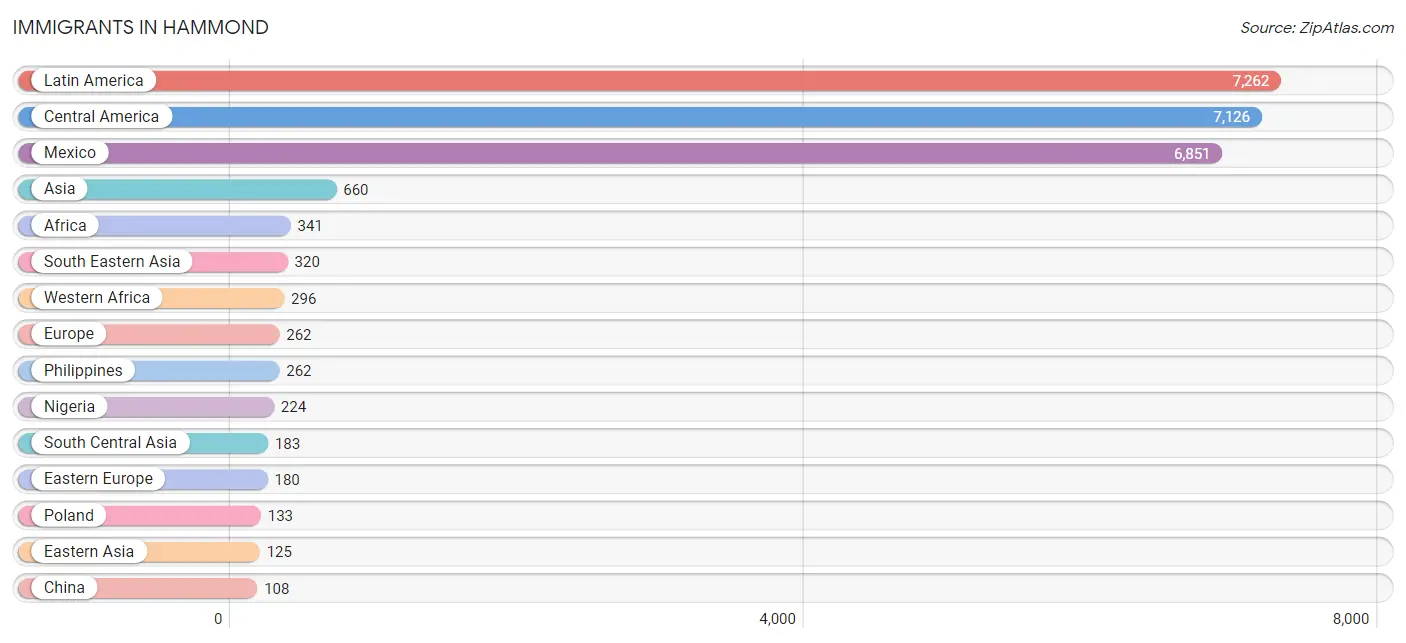
| Immigration Origin | # Population | % Population |
| Africa | 341 | 0.4% |
| Asia | 660 | 0.9% |
| Australia | 2 | 0.0% |
| Bangladesh | 30 | 0.0% |
| Brazil | 14 | 0.0% |
| Canada | 72 | 0.1% |
| Caribbean | 75 | 0.1% |
| Central America | 7,126 | 9.2% |
| China | 108 | 0.1% |
| Colombia | 47 | 0.1% |
| Costa Rica | 21 | 0.0% |
| Croatia | 1 | 0.0% |
| Czechoslovakia | 7 | 0.0% |
| Dominican Republic | 23 | 0.0% |
| Eastern Asia | 125 | 0.2% |
| Eastern Europe | 180 | 0.2% |
| El Salvador | 68 | 0.1% |
| Europe | 262 | 0.3% |
| Germany | 66 | 0.1% |
| Ghana | 54 | 0.1% |
| Guatemala | 103 | 0.1% |
| Haiti | 46 | 0.1% |
| Honduras | 75 | 0.1% |
| Hungary | 26 | 0.0% |
| India | 88 | 0.1% |
| Indonesia | 47 | 0.1% |
| Israel | 4 | 0.0% |
| Jamaica | 6 | 0.0% |
| Japan | 3 | 0.0% |
| Jordan | 10 | 0.0% |
| Korea | 14 | 0.0% |
| Latin America | 7,262 | 9.4% |
| Mexico | 6,851 | 8.8% |
| Morocco | 45 | 0.1% |
| Nicaragua | 8 | 0.0% |
| Nigeria | 224 | 0.3% |
| Northern Africa | 45 | 0.1% |
| Oceania | 2 | 0.0% |
| Pakistan | 65 | 0.1% |
| Philippines | 262 | 0.3% |
| Poland | 133 | 0.2% |
| Romania | 13 | 0.0% |
| South America | 61 | 0.1% |
| South Central Asia | 183 | 0.2% |
| South Eastern Asia | 320 | 0.4% |
| Southern Europe | 16 | 0.0% |
| Spain | 16 | 0.0% |
| Taiwan | 17 | 0.0% |
| Thailand | 11 | 0.0% |
| Western Africa | 296 | 0.4% |
| Western Asia | 14 | 0.0% |
| Western Europe | 66 | 0.1% | View All 52 Rows |
Sex and Age in Hammond
Sex and Age in Hammond
The most populous age groups in Hammond are 25 to 29 Years (3,238 | 8.5%) for men and 15 to 19 Years (3,363 | 8.6%) for women.
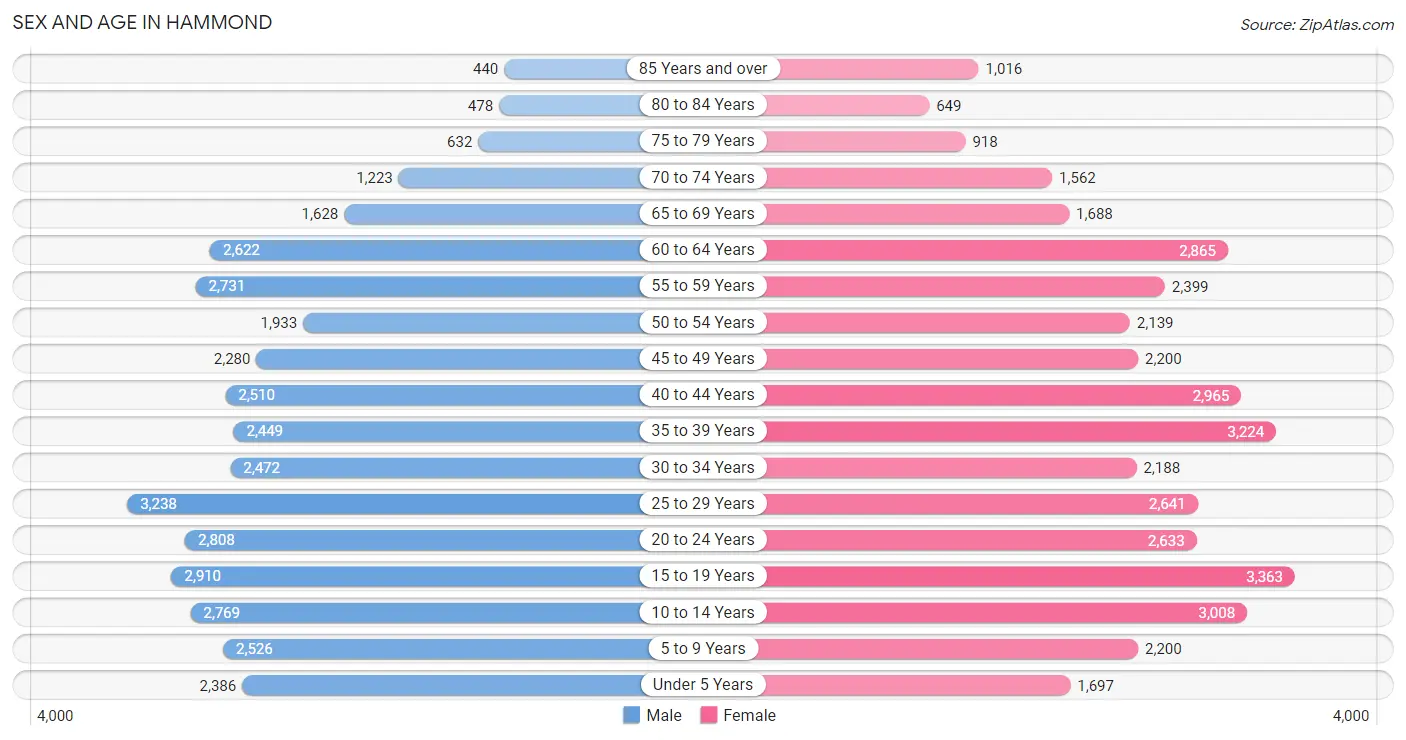
| Age Bracket | Male | Female |
| Under 5 Years | 2,386 (6.3%) | 1,697 (4.3%) |
| 5 to 9 Years | 2,526 (6.6%) | 2,200 (5.6%) |
| 10 to 14 Years | 2,769 (7.3%) | 3,008 (7.6%) |
| 15 to 19 Years | 2,910 (7.6%) | 3,363 (8.6%) |
| 20 to 24 Years | 2,808 (7.4%) | 2,633 (6.7%) |
| 25 to 29 Years | 3,238 (8.5%) | 2,641 (6.7%) |
| 30 to 34 Years | 2,472 (6.5%) | 2,188 (5.6%) |
| 35 to 39 Years | 2,449 (6.4%) | 3,224 (8.2%) |
| 40 to 44 Years | 2,510 (6.6%) | 2,965 (7.5%) |
| 45 to 49 Years | 2,280 (6.0%) | 2,200 (5.6%) |
| 50 to 54 Years | 1,933 (5.1%) | 2,139 (5.4%) |
| 55 to 59 Years | 2,731 (7.2%) | 2,399 (6.1%) |
| 60 to 64 Years | 2,622 (6.9%) | 2,865 (7.3%) |
| 65 to 69 Years | 1,628 (4.3%) | 1,688 (4.3%) |
| 70 to 74 Years | 1,223 (3.2%) | 1,562 (4.0%) |
| 75 to 79 Years | 632 (1.7%) | 918 (2.3%) |
| 80 to 84 Years | 478 (1.3%) | 649 (1.7%) |
| 85 Years and over | 440 (1.2%) | 1,016 (2.6%) |
| Total | 38,035 (100.0%) | 39,355 (100.0%) |
Families and Households in Hammond
Median Family Size in Hammond
The median family size in Hammond is 3.35 persons per family, with married-couple families (10,482 | 57.8%) accounting for the largest median family size of 3.42 persons per family. On the other hand, single male/father families (2,074 | 11.4%) represent the smallest median family size with 3.06 persons per family.
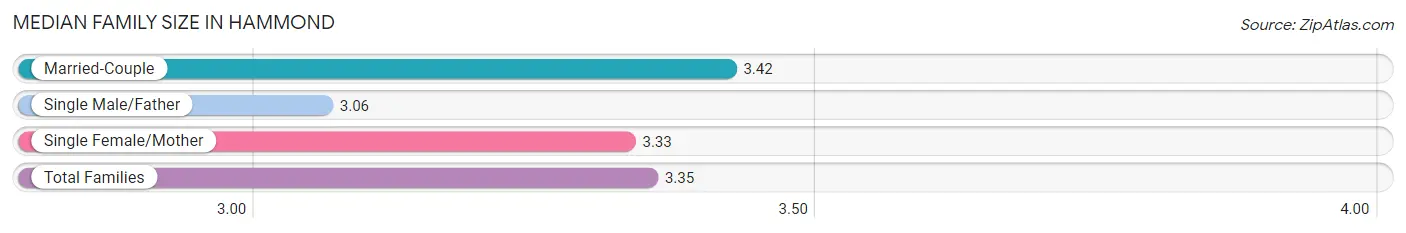
| Family Type | # Families | Family Size |
| Married-Couple | 10,482 (57.8%) | 3.42 |
| Single Male/Father | 2,074 (11.4%) | 3.06 |
| Single Female/Mother | 5,567 (30.7%) | 3.33 |
| Total Families | 18,123 (100.0%) | 3.35 |
Median Household Size in Hammond
The median household size in Hammond is 2.61 persons per household, with single female/mother households (5,567 | 19.0%) accounting for the largest median household size of 3.57 persons per household. non-family households (11,225 | 38.3%) represent the smallest median household size with 1.21 persons per household.
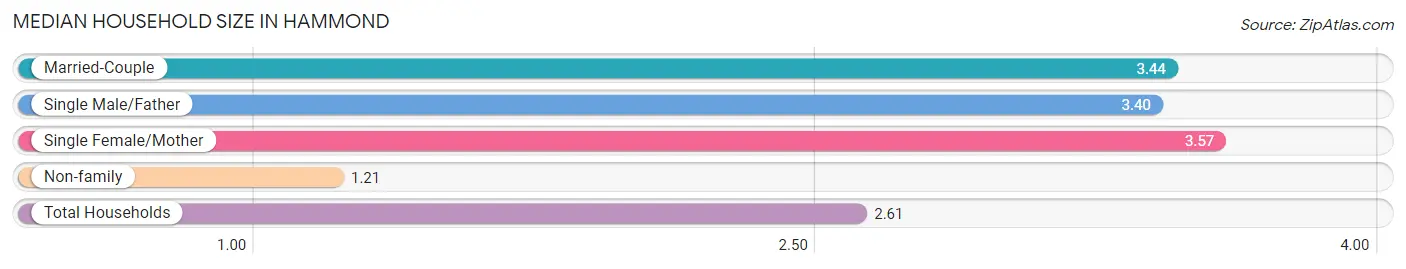
| Household Type | # Households | Household Size |
| Married-Couple | 10,482 (35.7%) | 3.44 |
| Single Male/Father | 2,074 (7.1%) | 3.40 |
| Single Female/Mother | 5,567 (19.0%) | 3.57 |
| Non-family | 11,225 (38.3%) | 1.21 |
| Total Households | 29,348 (100.0%) | 2.61 |
Household Size by Marriage Status in Hammond
Out of a total of 29,348 households in Hammond, 18,123 (61.8%) are family households, while 11,225 (38.3%) are nonfamily households. The most numerous type of family households are 2-person households, comprising 7,463, and the most common type of nonfamily households are 1-person households, comprising 9,338.
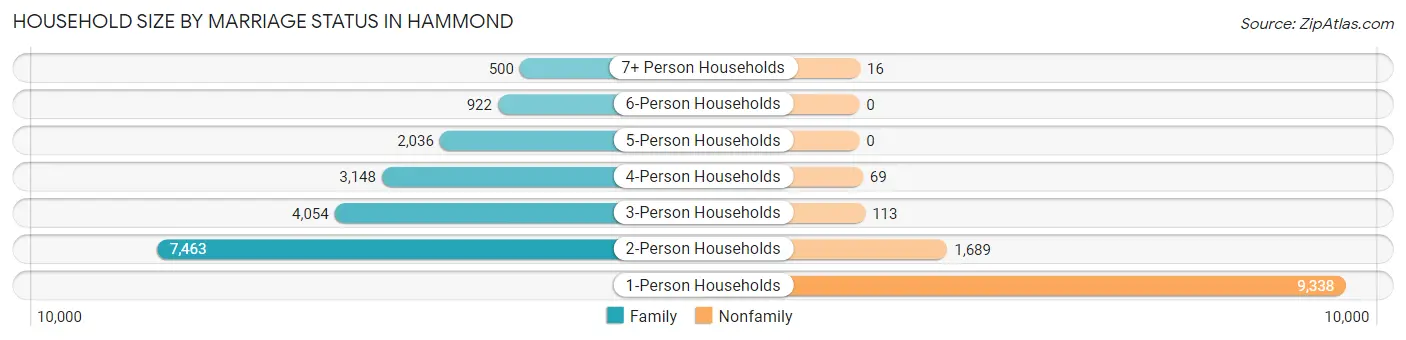
| Household Size | Family Households | Nonfamily Households |
| 1-Person Households | - | 9,338 (31.8%) |
| 2-Person Households | 7,463 (25.4%) | 1,689 (5.8%) |
| 3-Person Households | 4,054 (13.8%) | 113 (0.4%) |
| 4-Person Households | 3,148 (10.7%) | 69 (0.2%) |
| 5-Person Households | 2,036 (6.9%) | 0 (0.0%) |
| 6-Person Households | 922 (3.1%) | 0 (0.0%) |
| 7+ Person Households | 500 (1.7%) | 16 (0.1%) |
| Total | 18,123 (61.8%) | 11,225 (38.3%) |
Female Fertility in Hammond
Fertility by Age in Hammond
Average fertility rate in Hammond is 64.0 births per 1,000 women. Women in the age bracket of 20 to 34 years have the highest fertility rate with 121.0 births per 1,000 women. Women in the age bracket of 20 to 34 years acount for 71.7% of all women with births.
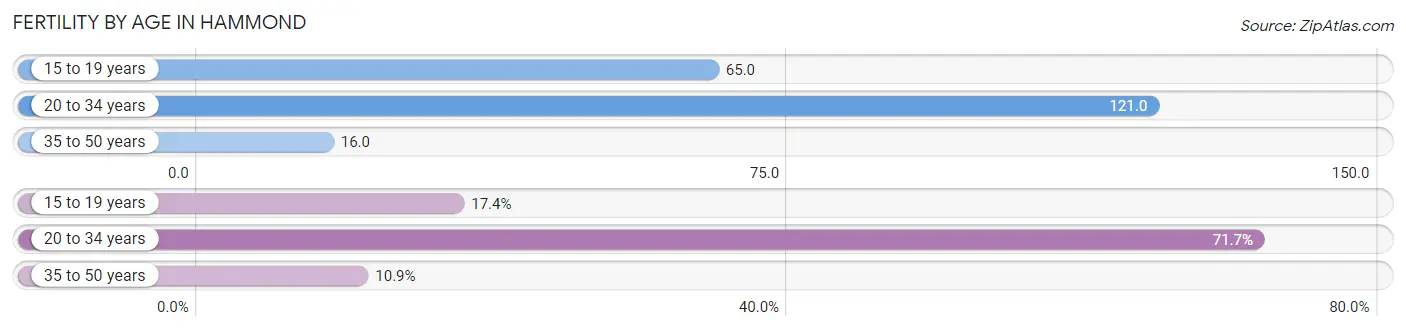
| Age Bracket | Women with Births | Births / 1,000 Women |
| 15 to 19 years | 219 (17.4%) | 65.0 |
| 20 to 34 years | 903 (71.7%) | 121.0 |
| 35 to 50 years | 137 (10.9%) | 16.0 |
| Total | 1,259 (100.0%) | 64.0 |
Fertility by Age by Marriage Status in Hammond
28.9% of women with births (1,259) in Hammond are married. The highest percentage of unmarried women with births falls into 15 to 19 years age bracket with 92.7% of them unmarried at the time of birth, while the lowest percentage of unmarried women with births belong to 35 to 50 years age bracket with 54.7% of them unmarried.
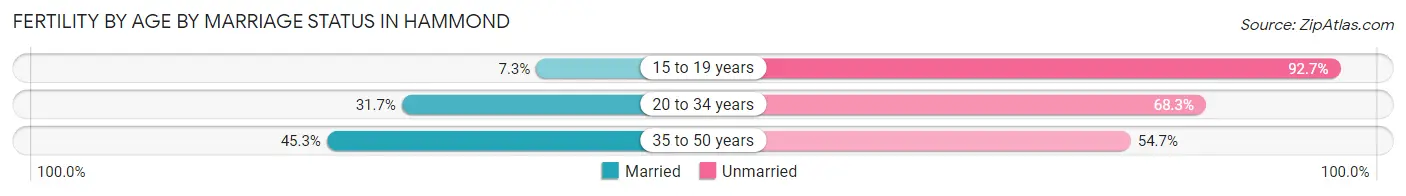
| Age Bracket | Married | Unmarried |
| 15 to 19 years | 16 (7.3%) | 203 (92.7%) |
| 20 to 34 years | 286 (31.7%) | 617 (68.3%) |
| 35 to 50 years | 62 (45.3%) | 75 (54.7%) |
| Total | 364 (28.9%) | 895 (71.1%) |
Fertility by Education in Hammond
Average fertility rate in Hammond is 64.0 births per 1,000 women. Women with the education attainment of high school diploma have the highest fertility rate of 79.0 births per 1,000 women, while women with the education attainment of less than high school have the lowest fertility at 37.0 births per 1,000 women. Women with the education attainment of high school diploma represent 39.9% of all women with births.
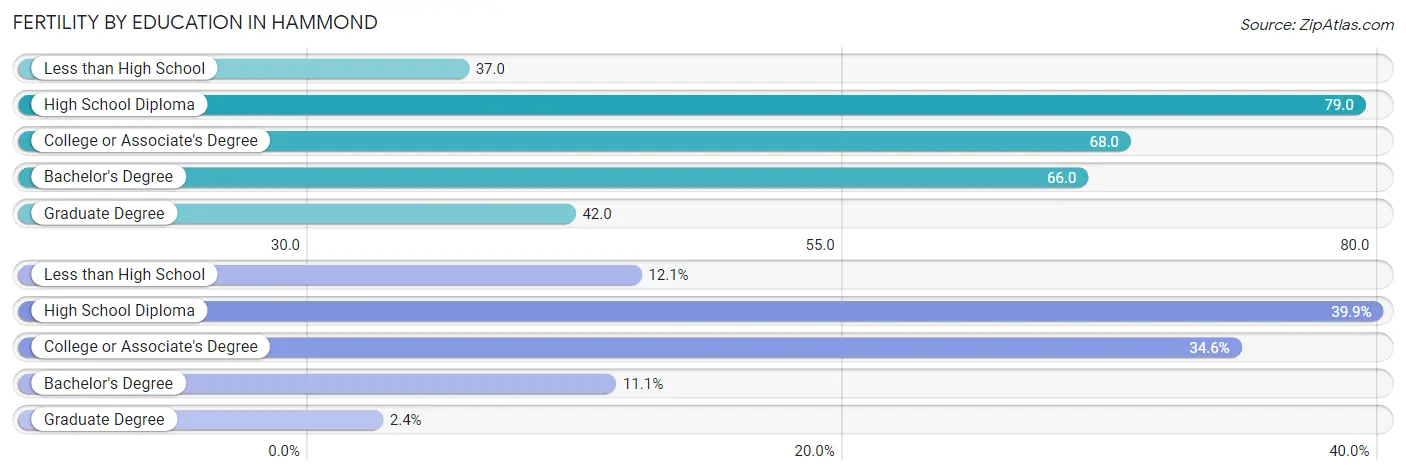
| Educational Attainment | Women with Births | Births / 1,000 Women |
| Less than High School | 152 (12.1%) | 37.0 |
| High School Diploma | 502 (39.9%) | 79.0 |
| College or Associate's Degree | 435 (34.5%) | 68.0 |
| Bachelor's Degree | 140 (11.1%) | 66.0 |
| Graduate Degree | 30 (2.4%) | 42.0 |
| Total | 1,259 (100.0%) | 64.0 |
Fertility by Education by Marriage Status in Hammond
71.1% of women with births in Hammond are unmarried. Women with the educational attainment of graduate degree are most likely to be married with 100.0% of them married at childbirth, while women with the educational attainment of less than high school are least likely to be married with 92.8% of them unmarried at childbirth.
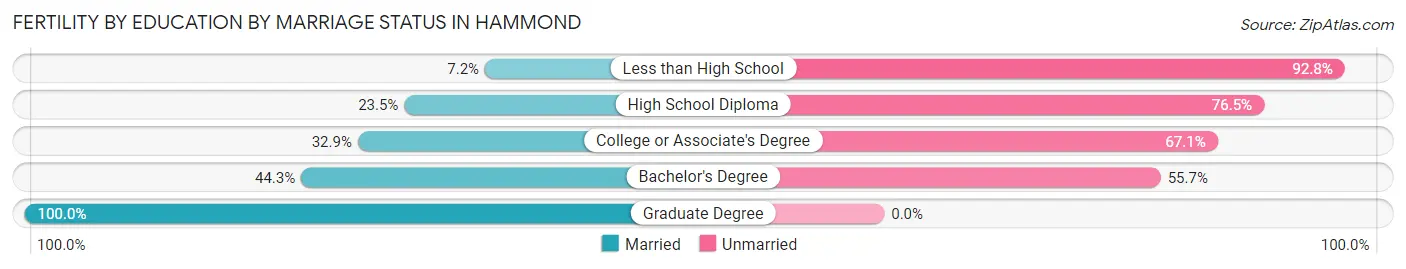
| Educational Attainment | Married | Unmarried |
| Less than High School | 11 (7.2%) | 141 (92.8%) |
| High School Diploma | 118 (23.5%) | 384 (76.5%) |
| College or Associate's Degree | 143 (32.9%) | 292 (67.1%) |
| Bachelor's Degree | 62 (44.3%) | 78 (55.7%) |
| Graduate Degree | 30 (100.0%) | 0 (0.0%) |
| Total | 364 (28.9%) | 895 (71.1%) |
Employment Characteristics in Hammond
Employment by Class of Employer in Hammond
Among the 33,844 employed individuals in Hammond, private company employees (25,557 | 75.5%), not-for-profit organizations (2,901 | 8.6%), and local government employees (1,863 | 5.5%) make up the most common classes of employment.
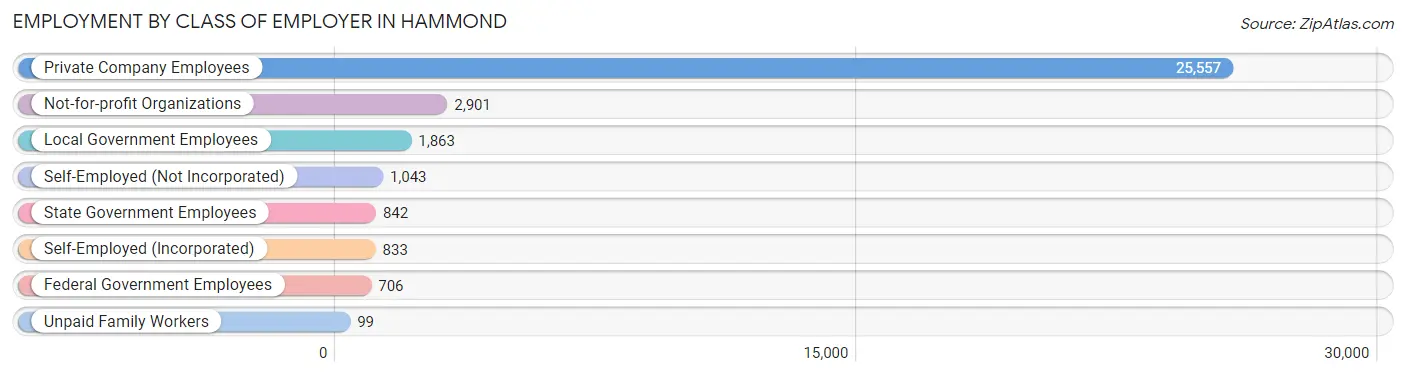
| Employer Class | # Employees | % Employees |
| Private Company Employees | 25,557 | 75.5% |
| Self-Employed (Incorporated) | 833 | 2.5% |
| Self-Employed (Not Incorporated) | 1,043 | 3.1% |
| Not-for-profit Organizations | 2,901 | 8.6% |
| Local Government Employees | 1,863 | 5.5% |
| State Government Employees | 842 | 2.5% |
| Federal Government Employees | 706 | 2.1% |
| Unpaid Family Workers | 99 | 0.3% |
| Total | 33,844 | 100.0% |
Employment Status by Age in Hammond
According to the labor force statistics for Hammond, out of the total population over 16 years of age (61,691), 60.6% or 37,385 individuals are in the labor force, with 6.3% or 2,355 of them unemployed. The age group with the highest labor force participation rate is 25 to 29 years, with 82.4% or 4,844 individuals in the labor force. Within the labor force, the 20 to 24 years age range has the highest percentage of unemployed individuals, with 12.4% or 508 of them being unemployed.
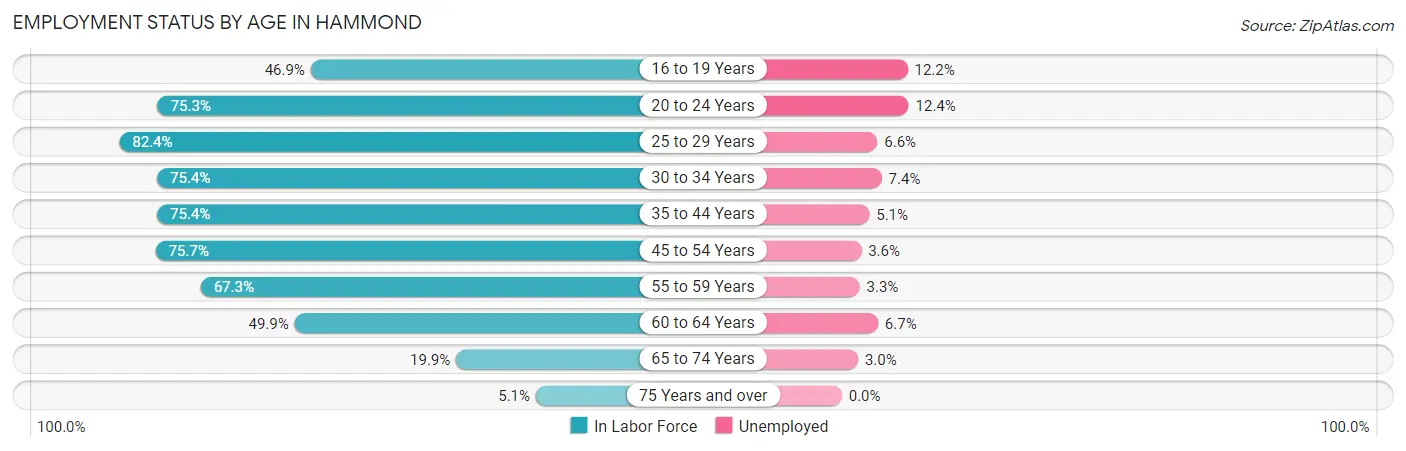
| Age Bracket | In Labor Force | Unemployed |
| 16 to 19 Years | 2,420 (46.9%) | 295 (12.2%) |
| 20 to 24 Years | 4,097 (75.3%) | 508 (12.4%) |
| 25 to 29 Years | 4,844 (82.4%) | 320 (6.6%) |
| 30 to 34 Years | 3,514 (75.4%) | 260 (7.4%) |
| 35 to 44 Years | 8,406 (75.4%) | 429 (5.1%) |
| 45 to 54 Years | 6,474 (75.7%) | 233 (3.6%) |
| 55 to 59 Years | 3,452 (67.3%) | 114 (3.3%) |
| 60 to 64 Years | 2,738 (49.9%) | 183 (6.7%) |
| 65 to 74 Years | 1,214 (19.9%) | 36 (3.0%) |
| 75 Years and over | 211 (5.1%) | 0 (0.0%) |
| Total | 37,385 (60.6%) | 2,355 (6.3%) |
Employment Status by Educational Attainment in Hammond
According to labor force statistics for Hammond, 72.1% of individuals (29,457) out of the total population between 25 and 64 years of age (40,856) are in the labor force, with 5.2% or 1,532 of them being unemployed. The group with the highest labor force participation rate are those with the educational attainment of bachelor's degree or higher, with 86.5% or 5,697 individuals in the labor force. Within the labor force, individuals with less than high school education have the highest percentage of unemployment, with 11.7% or 407 of them being unemployed.
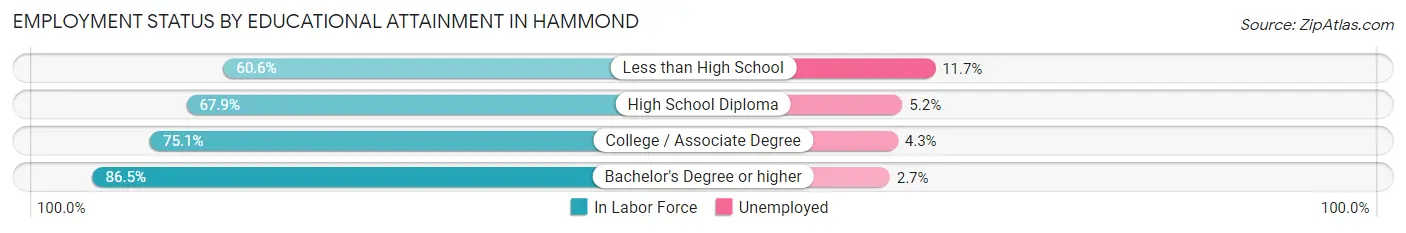
| Educational Attainment | In Labor Force | Unemployed |
| Less than High School | 3,480 (60.6%) | 672 (11.7%) |
| High School Diploma | 11,001 (67.9%) | 843 (5.2%) |
| College / Associate Degree | 9,256 (75.1%) | 530 (4.3%) |
| Bachelor's Degree or higher | 5,697 (86.5%) | 178 (2.7%) |
| Total | 29,457 (72.1%) | 2,125 (5.2%) |
Employment Occupations by Sex in Hammond
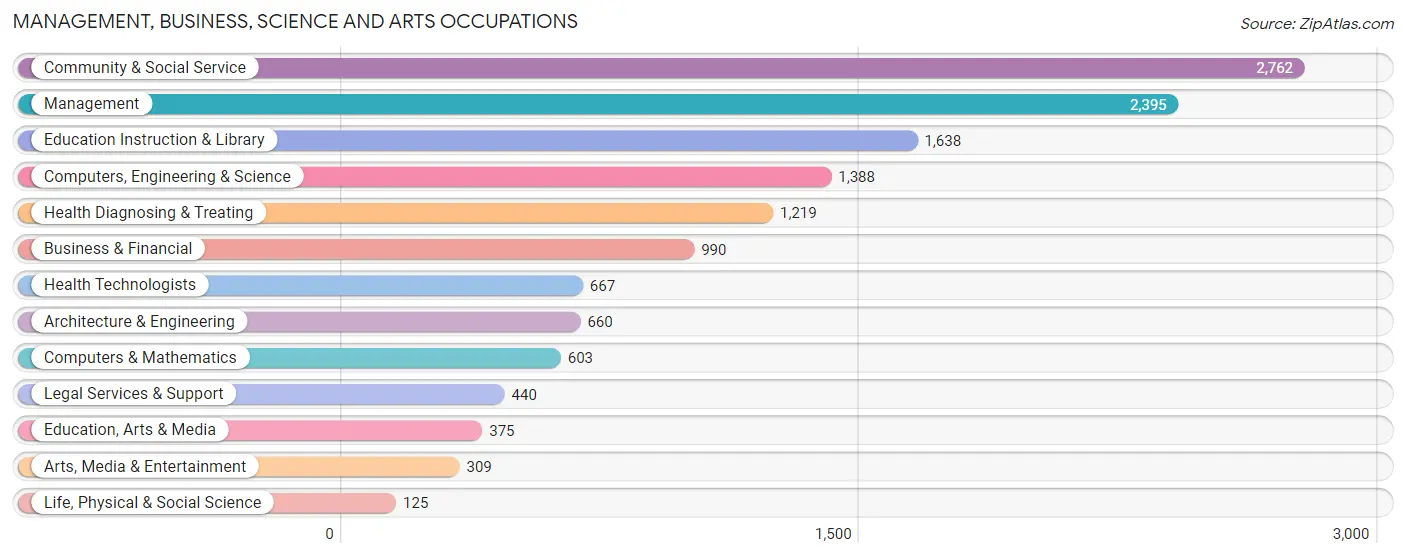
Management, Business, Science and Arts Occupations
The most common Management, Business, Science and Arts occupations in Hammond are Community & Social Service (2,762 | 7.9%), Management (2,395 | 6.8%), Education Instruction & Library (1,638 | 4.7%), Computers, Engineering & Science (1,388 | 4.0%), and Health Diagnosing & Treating (1,219 | 3.5%).
Management, Business, Science and Arts Occupations by Sex
Within the Management, Business, Science and Arts occupations in Hammond, the most male-oriented occupations are Architecture & Engineering (83.9%), Computers, Engineering & Science (76.5%), and Computers & Mathematics (71.8%), while the most female-oriented occupations are Health Technologists (88.8%), Legal Services & Support (88.6%), and Health Diagnosing & Treating (87.7%).
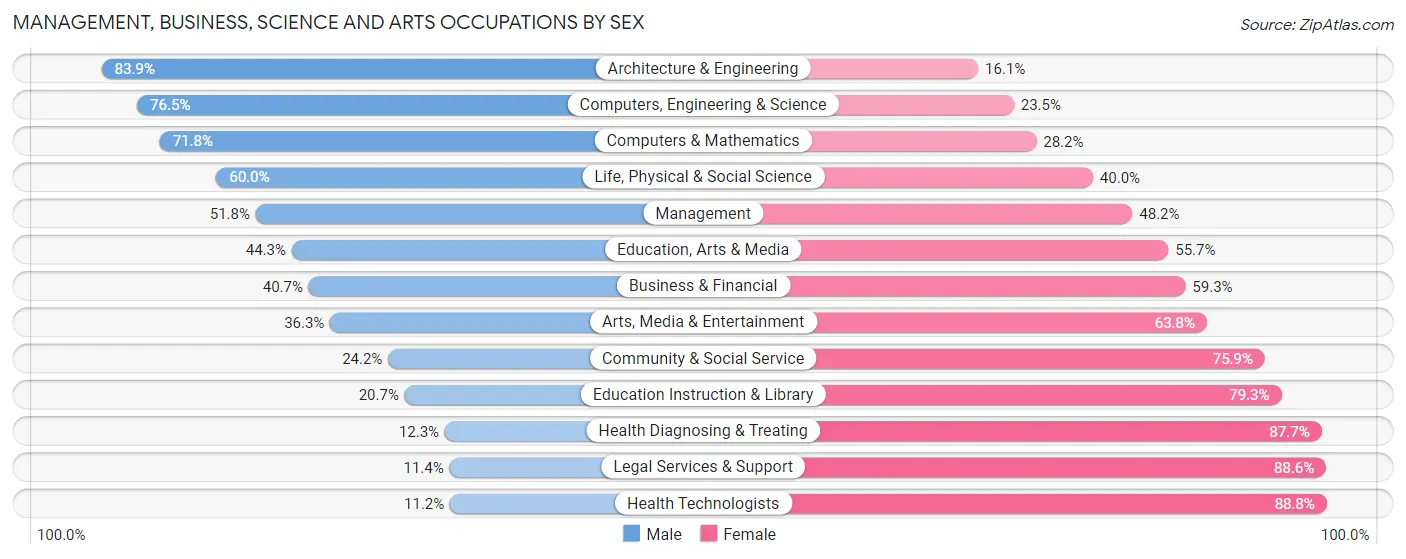
| Occupation | Male | Female |
| Management | 1,240 (51.8%) | 1,155 (48.2%) |
| Business & Financial | 403 (40.7%) | 587 (59.3%) |
| Computers, Engineering & Science | 1,062 (76.5%) | 326 (23.5%) |
| Computers & Mathematics | 433 (71.8%) | 170 (28.2%) |
| Architecture & Engineering | 554 (83.9%) | 106 (16.1%) |
| Life, Physical & Social Science | 75 (60.0%) | 50 (40.0%) |
| Community & Social Service | 667 (24.1%) | 2,095 (75.8%) |
| Education, Arts & Media | 166 (44.3%) | 209 (55.7%) |
| Legal Services & Support | 50 (11.4%) | 390 (88.6%) |
| Education Instruction & Library | 339 (20.7%) | 1,299 (79.3%) |
| Arts, Media & Entertainment | 112 (36.2%) | 197 (63.7%) |
| Health Diagnosing & Treating | 150 (12.3%) | 1,069 (87.7%) |
| Health Technologists | 75 (11.2%) | 592 (88.8%) |
| Total (Category) | 3,522 (40.2%) | 5,232 (59.8%) |
| Total (Overall) | 18,322 (52.3%) | 16,689 (47.7%) |
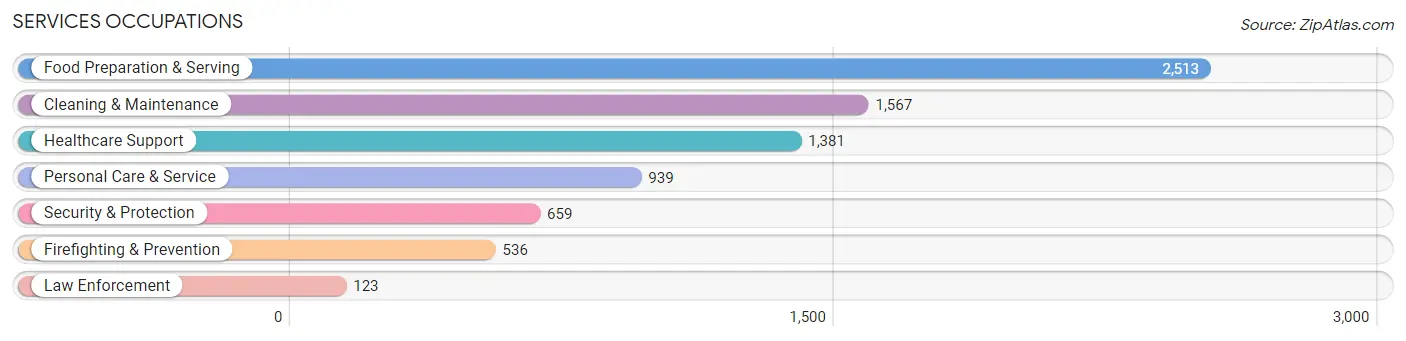
Services Occupations
The most common Services occupations in Hammond are Food Preparation & Serving (2,513 | 7.2%), Cleaning & Maintenance (1,567 | 4.5%), Healthcare Support (1,381 | 3.9%), Personal Care & Service (939 | 2.7%), and Security & Protection (659 | 1.9%).
Services Occupations by Sex
Within the Services occupations in Hammond, the most male-oriented occupations are Law Enforcement (76.4%), Security & Protection (75.6%), and Firefighting & Prevention (75.4%), while the most female-oriented occupations are Healthcare Support (90.1%), Personal Care & Service (77.5%), and Food Preparation & Serving (52.7%).
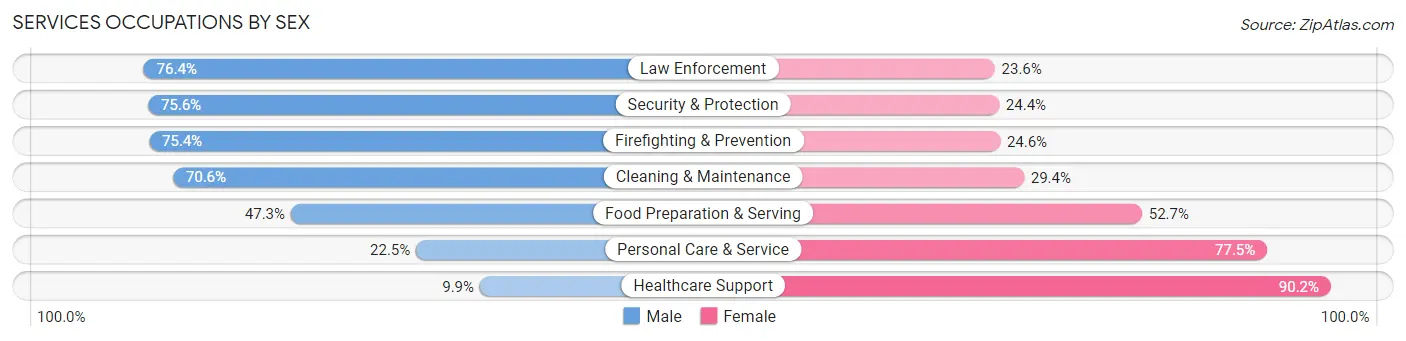
| Occupation | Male | Female |
| Healthcare Support | 136 (9.9%) | 1,245 (90.1%) |
| Security & Protection | 498 (75.6%) | 161 (24.4%) |
| Firefighting & Prevention | 404 (75.4%) | 132 (24.6%) |
| Law Enforcement | 94 (76.4%) | 29 (23.6%) |
| Food Preparation & Serving | 1,188 (47.3%) | 1,325 (52.7%) |
| Cleaning & Maintenance | 1,107 (70.6%) | 460 (29.4%) |
| Personal Care & Service | 211 (22.5%) | 728 (77.5%) |
| Total (Category) | 3,140 (44.5%) | 3,919 (55.5%) |
| Total (Overall) | 18,322 (52.3%) | 16,689 (47.7%) |
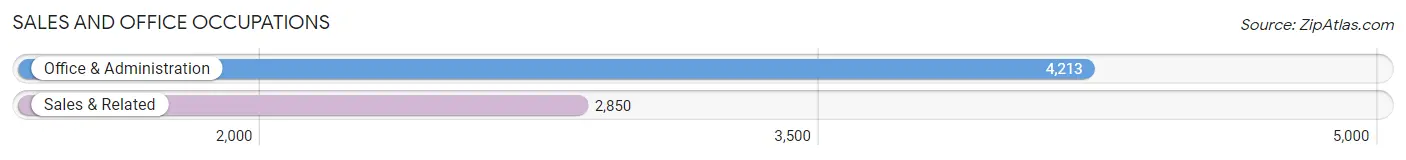
Sales and Office Occupations
The most common Sales and Office occupations in Hammond are Office & Administration (4,213 | 12.0%), and Sales & Related (2,850 | 8.1%).
Sales and Office Occupations by Sex
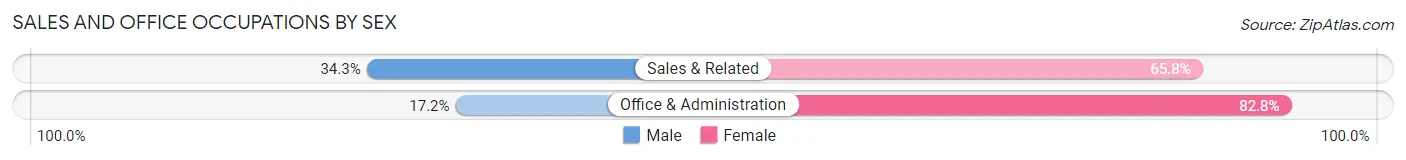
| Occupation | Male | Female |
| Sales & Related | 976 (34.3%) | 1,874 (65.7%) |
| Office & Administration | 723 (17.2%) | 3,490 (82.8%) |
| Total (Category) | 1,699 (24.0%) | 5,364 (75.9%) |
| Total (Overall) | 18,322 (52.3%) | 16,689 (47.7%) |
Natural Resources, Construction and Maintenance Occupations
The most common Natural Resources, Construction and Maintenance occupations in Hammond are Construction & Extraction (1,882 | 5.4%), Installation, Maintenance & Repair (1,472 | 4.2%), and Farming, Fishing & Forestry (58 | 0.2%).
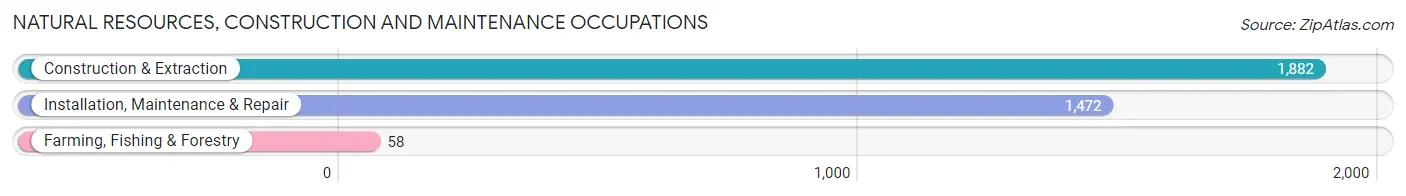
Natural Resources, Construction and Maintenance Occupations by Sex
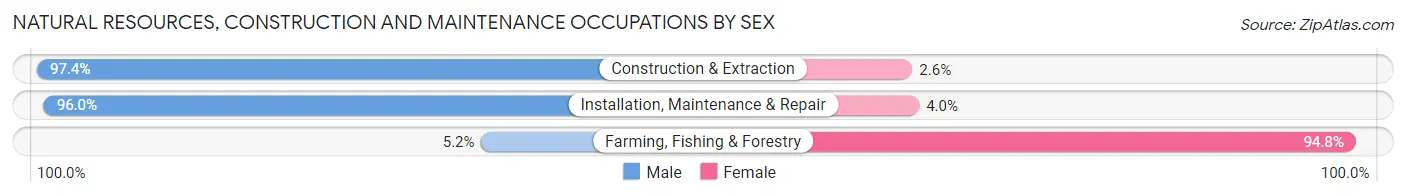
| Occupation | Male | Female |
| Farming, Fishing & Forestry | 3 (5.2%) | 55 (94.8%) |
| Construction & Extraction | 1,833 (97.4%) | 49 (2.6%) |
| Installation, Maintenance & Repair | 1,413 (96.0%) | 59 (4.0%) |
| Total (Category) | 3,249 (95.2%) | 163 (4.8%) |
| Total (Overall) | 18,322 (52.3%) | 16,689 (47.7%) |
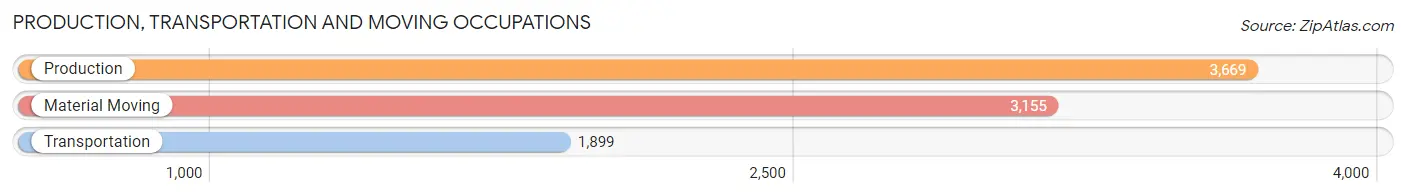
Production, Transportation and Moving Occupations
The most common Production, Transportation and Moving occupations in Hammond are Production (3,669 | 10.5%), Material Moving (3,155 | 9.0%), and Transportation (1,899 | 5.4%).
Production, Transportation and Moving Occupations by Sex
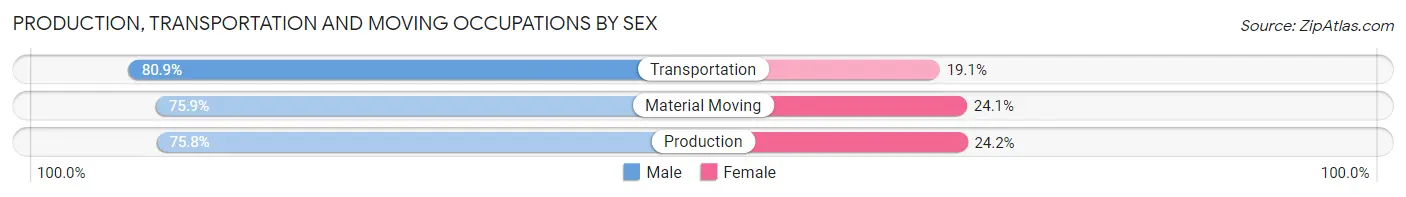
| Occupation | Male | Female |
| Production | 2,781 (75.8%) | 888 (24.2%) |
| Transportation | 1,536 (80.9%) | 363 (19.1%) |
| Material Moving | 2,395 (75.9%) | 760 (24.1%) |
| Total (Category) | 6,712 (76.9%) | 2,011 (23.1%) |
| Total (Overall) | 18,322 (52.3%) | 16,689 (47.7%) |
Employment Industries by Sex in Hammond
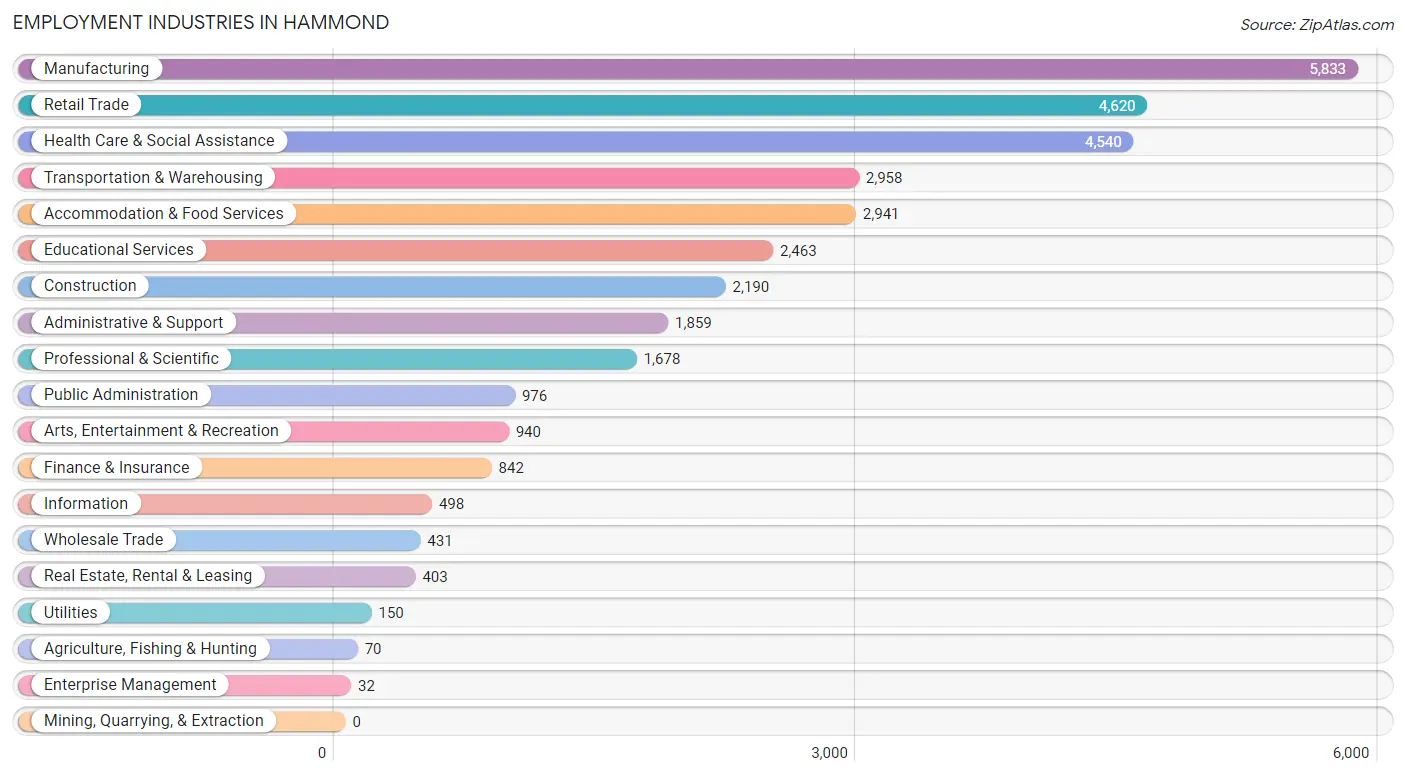
Employment Industries in Hammond
The major employment industries in Hammond include Manufacturing (5,833 | 16.7%), Retail Trade (4,620 | 13.2%), Health Care & Social Assistance (4,540 | 13.0%), Transportation & Warehousing (2,958 | 8.5%), and Accommodation & Food Services (2,941 | 8.4%).
Employment Industries by Sex in Hammond
The Hammond industries that see more men than women are Construction (93.8%), Utilities (80.7%), and Manufacturing (80.7%), whereas the industries that tend to have a higher number of women are Enterprise Management (100.0%), Health Care & Social Assistance (86.9%), and Finance & Insurance (81.2%).
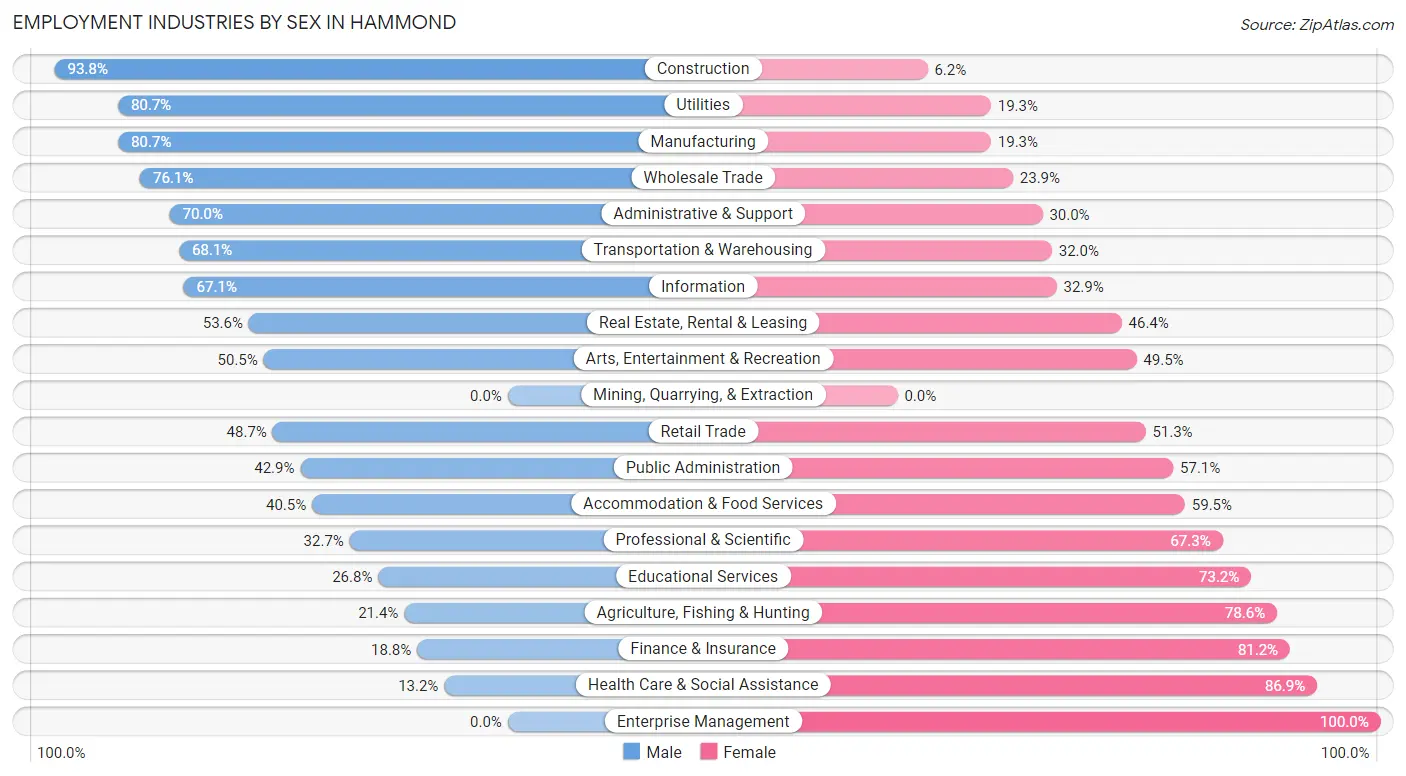
| Industry | Male | Female |
| Agriculture, Fishing & Hunting | 15 (21.4%) | 55 (78.6%) |
| Mining, Quarrying, & Extraction | 0 (0.0%) | 0 (0.0%) |
| Construction | 2,054 (93.8%) | 136 (6.2%) |
| Manufacturing | 4,705 (80.7%) | 1,128 (19.3%) |
| Wholesale Trade | 328 (76.1%) | 103 (23.9%) |
| Retail Trade | 2,248 (48.7%) | 2,372 (51.3%) |
| Transportation & Warehousing | 2,013 (68.0%) | 945 (32.0%) |
| Utilities | 121 (80.7%) | 29 (19.3%) |
| Information | 334 (67.1%) | 164 (32.9%) |
| Finance & Insurance | 158 (18.8%) | 684 (81.2%) |
| Real Estate, Rental & Leasing | 216 (53.6%) | 187 (46.4%) |
| Professional & Scientific | 549 (32.7%) | 1,129 (67.3%) |
| Enterprise Management | 0 (0.0%) | 32 (100.0%) |
| Administrative & Support | 1,301 (70.0%) | 558 (30.0%) |
| Educational Services | 660 (26.8%) | 1,803 (73.2%) |
| Health Care & Social Assistance | 597 (13.2%) | 3,943 (86.9%) |
| Arts, Entertainment & Recreation | 475 (50.5%) | 465 (49.5%) |
| Accommodation & Food Services | 1,191 (40.5%) | 1,750 (59.5%) |
| Public Administration | 419 (42.9%) | 557 (57.1%) |
| Total | 18,322 (52.3%) | 16,689 (47.7%) |
Education in Hammond
School Enrollment in Hammond
The most common levels of schooling among the 19,754 students in Hammond are high school (5,112 | 25.9%), middle school (4,476 | 22.7%), and elementary school (4,011 | 20.3%).
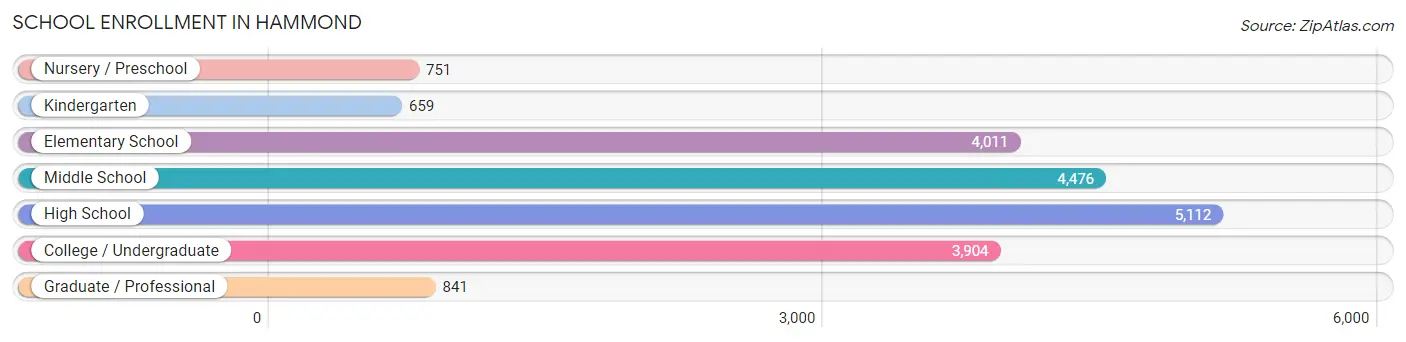
| School Level | # Students | % Students |
| Nursery / Preschool | 751 | 3.8% |
| Kindergarten | 659 | 3.3% |
| Elementary School | 4,011 | 20.3% |
| Middle School | 4,476 | 22.7% |
| High School | 5,112 | 25.9% |
| College / Undergraduate | 3,904 | 19.8% |
| Graduate / Professional | 841 | 4.3% |
| Total | 19,754 | 100.0% |
School Enrollment by Age by Funding Source in Hammond
Out of a total of 19,754 students who are enrolled in schools in Hammond, 3,931 (19.9%) attend a private institution, while the remaining 15,823 (80.1%) are enrolled in public schools. The age group of 25 to 34 year olds has the highest likelihood of being enrolled in private schools, with 419 (47.6% in the age bracket) enrolled. Conversely, the age group of 15 to 17 year olds has the lowest likelihood of being enrolled in a private school, with 3,040 (89.6% in the age bracket) attending a public institution.
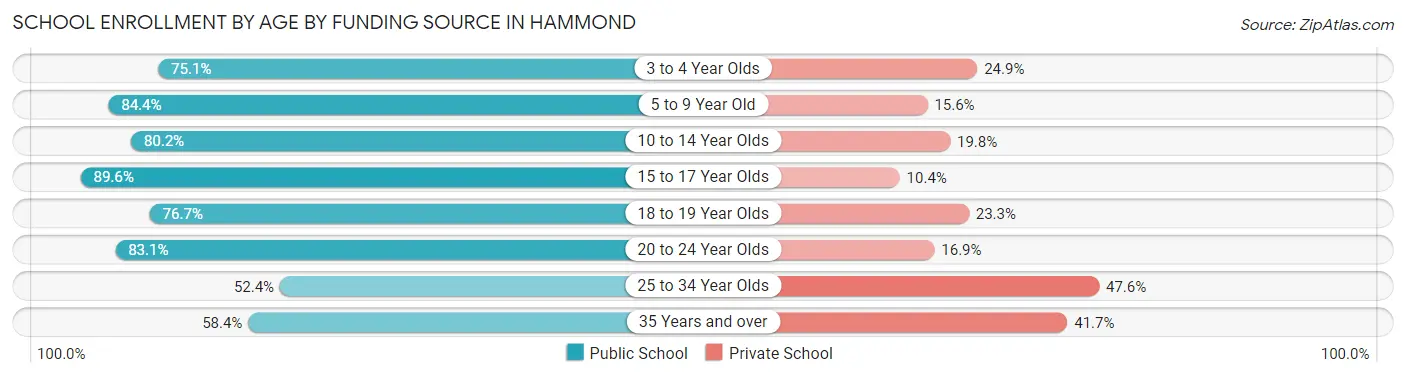
| Age Bracket | Public School | Private School |
| 3 to 4 Year Olds | 456 (75.1%) | 151 (24.9%) |
| 5 to 9 Year Old | 3,653 (84.4%) | 675 (15.6%) |
| 10 to 14 Year Olds | 4,474 (80.2%) | 1,105 (19.8%) |
| 15 to 17 Year Olds | 3,040 (89.6%) | 354 (10.4%) |
| 18 to 19 Year Olds | 1,547 (76.7%) | 470 (23.3%) |
| 20 to 24 Year Olds | 1,604 (83.1%) | 326 (16.9%) |
| 25 to 34 Year Olds | 462 (52.4%) | 419 (47.6%) |
| 35 Years and over | 594 (58.4%) | 424 (41.6%) |
| Total | 15,823 (80.1%) | 3,931 (19.9%) |
Educational Attainment by Field of Study in Hammond
Business (2,074 | 24.6%), education (1,225 | 14.5%), science & technology (961 | 11.4%), psychology (679 | 8.0%), and liberal arts & history (534 | 6.3%) are the most common fields of study among 8,446 individuals in Hammond who have obtained a bachelor's degree or higher.
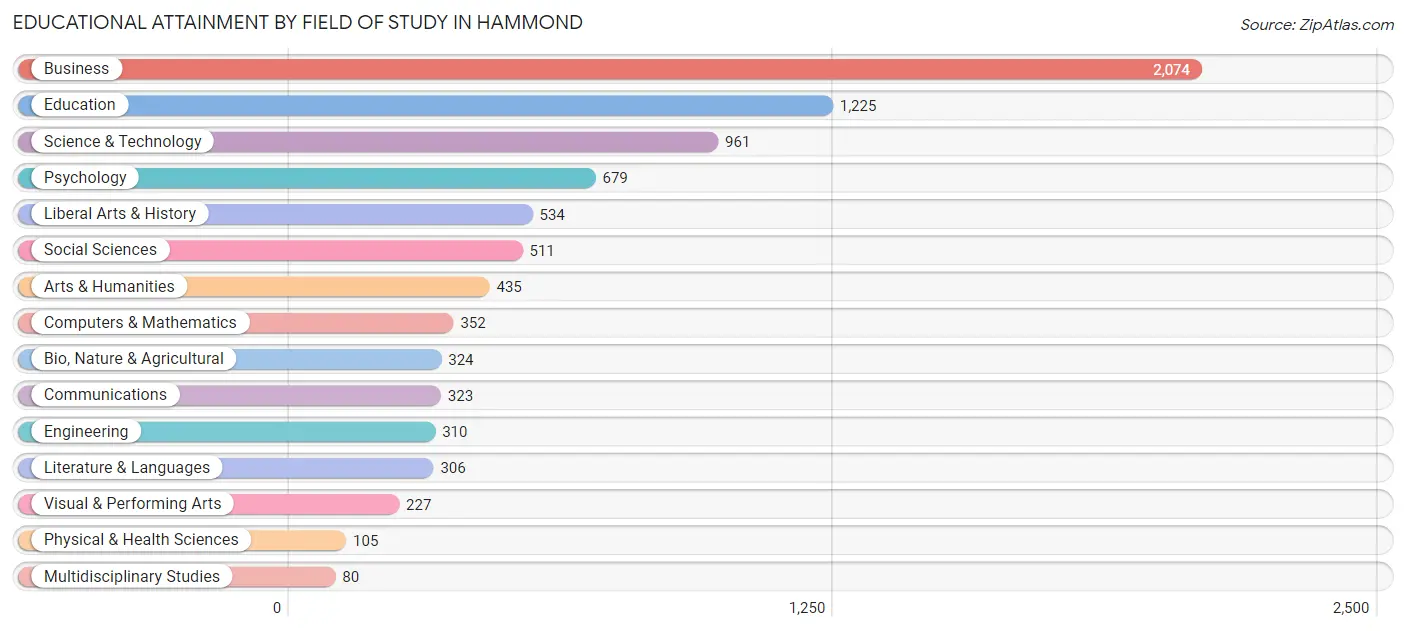
| Field of Study | # Graduates | % Graduates |
| Computers & Mathematics | 352 | 4.2% |
| Bio, Nature & Agricultural | 324 | 3.8% |
| Physical & Health Sciences | 105 | 1.2% |
| Psychology | 679 | 8.0% |
| Social Sciences | 511 | 6.0% |
| Engineering | 310 | 3.7% |
| Multidisciplinary Studies | 80 | 0.9% |
| Science & Technology | 961 | 11.4% |
| Business | 2,074 | 24.6% |
| Education | 1,225 | 14.5% |
| Literature & Languages | 306 | 3.6% |
| Liberal Arts & History | 534 | 6.3% |
| Visual & Performing Arts | 227 | 2.7% |
| Communications | 323 | 3.8% |
| Arts & Humanities | 435 | 5.1% |
| Total | 8,446 | 100.0% |
Transportation & Commute in Hammond
Vehicle Availability by Sex in Hammond
The most prevalent vehicle ownership categories in Hammond are males with 2 vehicles (7,791, accounting for 44.2%) and females with 2 vehicles (6,029, making up 48.9%).
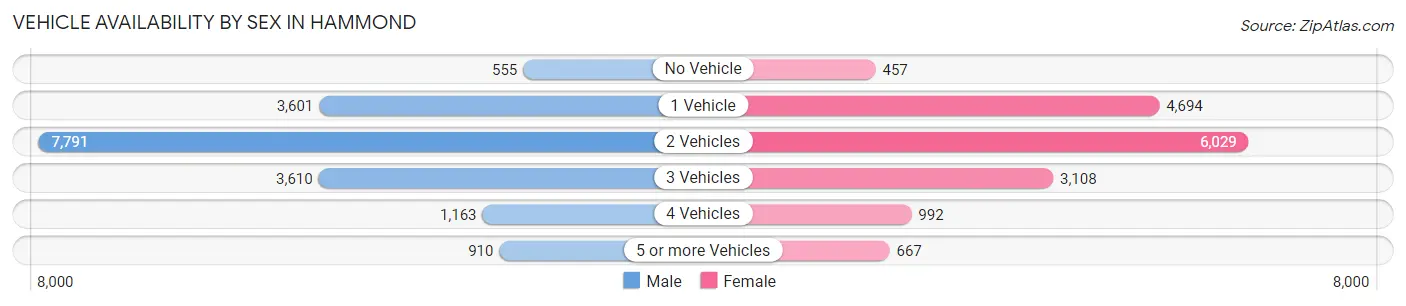
| Vehicles Available | Male | Female |
| No Vehicle | 555 (3.2%) | 457 (2.9%) |
| 1 Vehicle | 3,601 (20.4%) | 4,694 (29.4%) |
| 2 Vehicles | 7,791 (44.2%) | 6,029 (37.8%) |
| 3 Vehicles | 3,610 (20.5%) | 3,108 (19.5%) |
| 4 Vehicles | 1,163 (6.6%) | 992 (6.2%) |
| 5 or more Vehicles | 910 (5.2%) | 667 (4.2%) |
| Total | 17,630 (100.0%) | 15,947 (100.0%) |
Commute Time in Hammond
The most frequently occuring commute durations in Hammond are 15 to 19 minutes (5,349 commuters, 16.7%), 20 to 24 minutes (5,121 commuters, 16.0%), and 10 to 14 minutes (4,682 commuters, 14.6%).
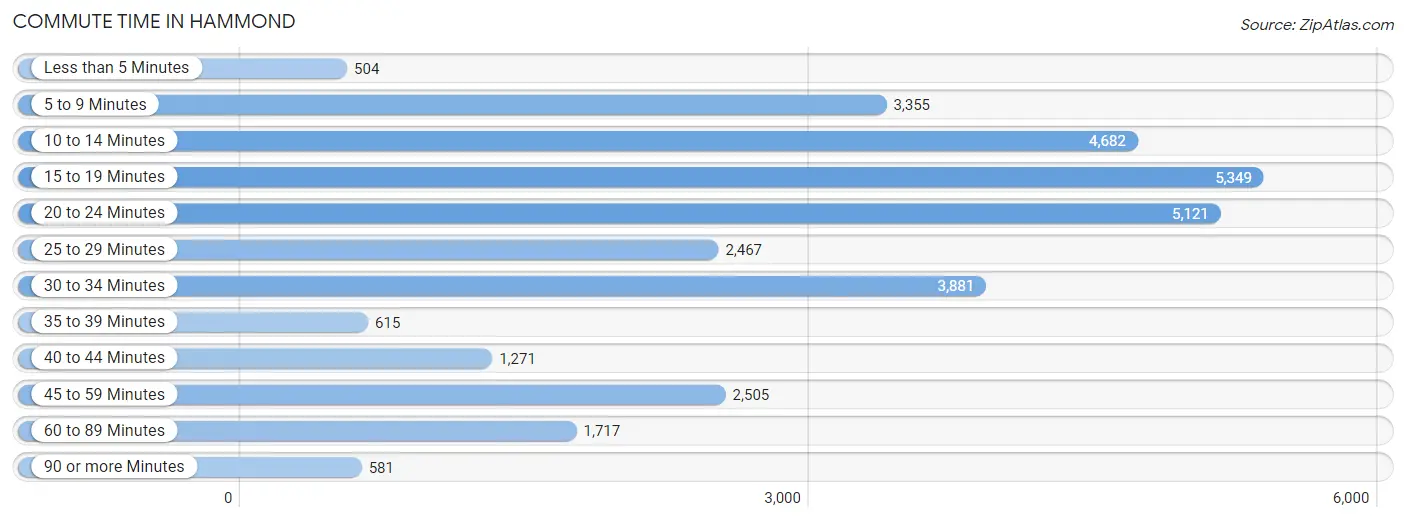
| Commute Time | # Commuters | % Commuters |
| Less than 5 Minutes | 504 | 1.6% |
| 5 to 9 Minutes | 3,355 | 10.5% |
| 10 to 14 Minutes | 4,682 | 14.6% |
| 15 to 19 Minutes | 5,349 | 16.7% |
| 20 to 24 Minutes | 5,121 | 16.0% |
| 25 to 29 Minutes | 2,467 | 7.7% |
| 30 to 34 Minutes | 3,881 | 12.1% |
| 35 to 39 Minutes | 615 | 1.9% |
| 40 to 44 Minutes | 1,271 | 4.0% |
| 45 to 59 Minutes | 2,505 | 7.8% |
| 60 to 89 Minutes | 1,717 | 5.4% |
| 90 or more Minutes | 581 | 1.8% |
Commute Time by Sex in Hammond
The most common commute times in Hammond are 20 to 24 minutes (3,071 commuters, 18.1%) for males and 15 to 19 minutes (2,775 commuters, 18.4%) for females.
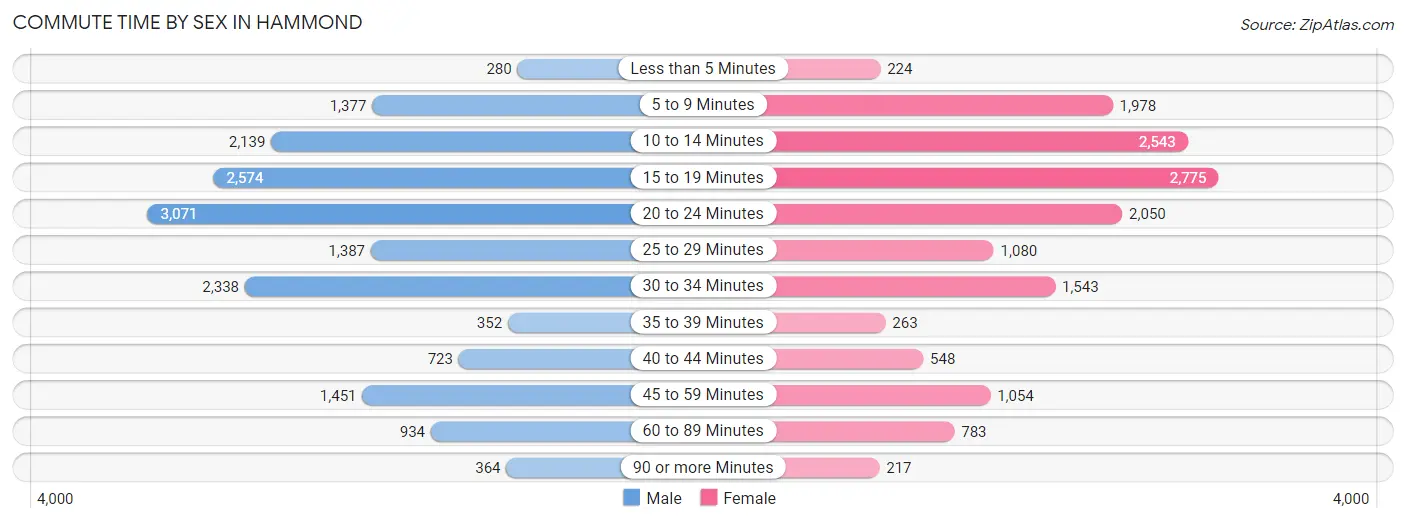
| Commute Time | Male | Female |
| Less than 5 Minutes | 280 (1.7%) | 224 (1.5%) |
| 5 to 9 Minutes | 1,377 (8.1%) | 1,978 (13.1%) |
| 10 to 14 Minutes | 2,139 (12.6%) | 2,543 (16.9%) |
| 15 to 19 Minutes | 2,574 (15.1%) | 2,775 (18.4%) |
| 20 to 24 Minutes | 3,071 (18.1%) | 2,050 (13.6%) |
| 25 to 29 Minutes | 1,387 (8.2%) | 1,080 (7.2%) |
| 30 to 34 Minutes | 2,338 (13.8%) | 1,543 (10.2%) |
| 35 to 39 Minutes | 352 (2.1%) | 263 (1.8%) |
| 40 to 44 Minutes | 723 (4.3%) | 548 (3.6%) |
| 45 to 59 Minutes | 1,451 (8.5%) | 1,054 (7.0%) |
| 60 to 89 Minutes | 934 (5.5%) | 783 (5.2%) |
| 90 or more Minutes | 364 (2.1%) | 217 (1.4%) |
Time of Departure to Work by Sex in Hammond
The most frequent times of departure to work in Hammond are 6:00 AM to 6:29 AM (2,045, 12.0%) for males and 7:00 AM to 7:29 AM (2,280, 15.1%) for females.
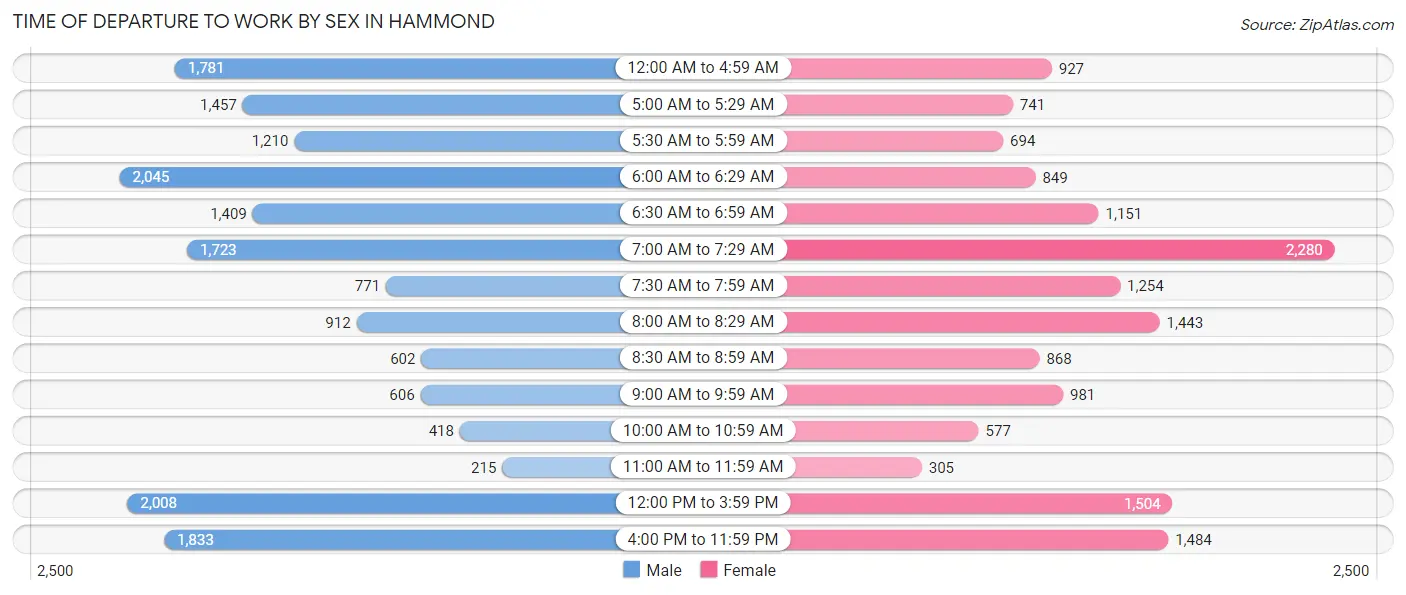
| Time of Departure | Male | Female |
| 12:00 AM to 4:59 AM | 1,781 (10.5%) | 927 (6.2%) |
| 5:00 AM to 5:29 AM | 1,457 (8.6%) | 741 (4.9%) |
| 5:30 AM to 5:59 AM | 1,210 (7.1%) | 694 (4.6%) |
| 6:00 AM to 6:29 AM | 2,045 (12.0%) | 849 (5.6%) |
| 6:30 AM to 6:59 AM | 1,409 (8.3%) | 1,151 (7.6%) |
| 7:00 AM to 7:29 AM | 1,723 (10.1%) | 2,280 (15.1%) |
| 7:30 AM to 7:59 AM | 771 (4.5%) | 1,254 (8.3%) |
| 8:00 AM to 8:29 AM | 912 (5.4%) | 1,443 (9.6%) |
| 8:30 AM to 8:59 AM | 602 (3.5%) | 868 (5.8%) |
| 9:00 AM to 9:59 AM | 606 (3.6%) | 981 (6.5%) |
| 10:00 AM to 10:59 AM | 418 (2.5%) | 577 (3.8%) |
| 11:00 AM to 11:59 AM | 215 (1.3%) | 305 (2.0%) |
| 12:00 PM to 3:59 PM | 2,008 (11.8%) | 1,504 (10.0%) |
| 4:00 PM to 11:59 PM | 1,833 (10.8%) | 1,484 (9.9%) |
| Total | 16,990 (100.0%) | 15,058 (100.0%) |
Housing Occupancy in Hammond
Occupancy by Ownership in Hammond
Of the total 29,348 dwellings in Hammond, owner-occupied units account for 18,358 (62.5%), while renter-occupied units make up 10,990 (37.4%).
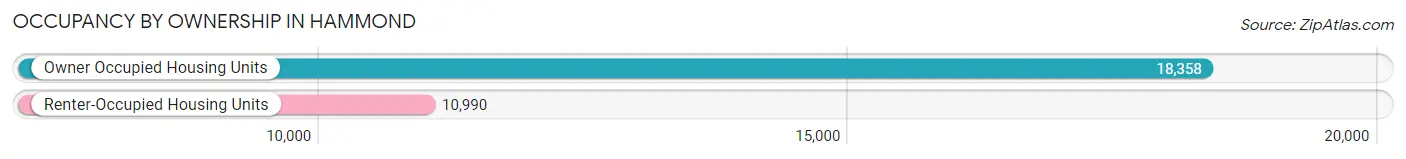
| Occupancy | # Housing Units | % Housing Units |
| Owner Occupied Housing Units | 18,358 | 62.5% |
| Renter-Occupied Housing Units | 10,990 | 37.4% |
| Total Occupied Housing Units | 29,348 | 100.0% |
Occupancy by Household Size in Hammond
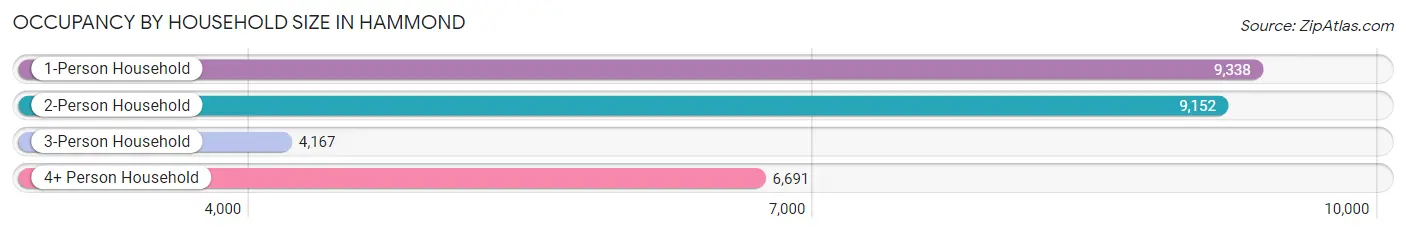
| Household Size | # Housing Units | % Housing Units |
| 1-Person Household | 9,338 | 31.8% |
| 2-Person Household | 9,152 | 31.2% |
| 3-Person Household | 4,167 | 14.2% |
| 4+ Person Household | 6,691 | 22.8% |
| Total Housing Units | 29,348 | 100.0% |
Occupancy by Ownership by Household Size in Hammond
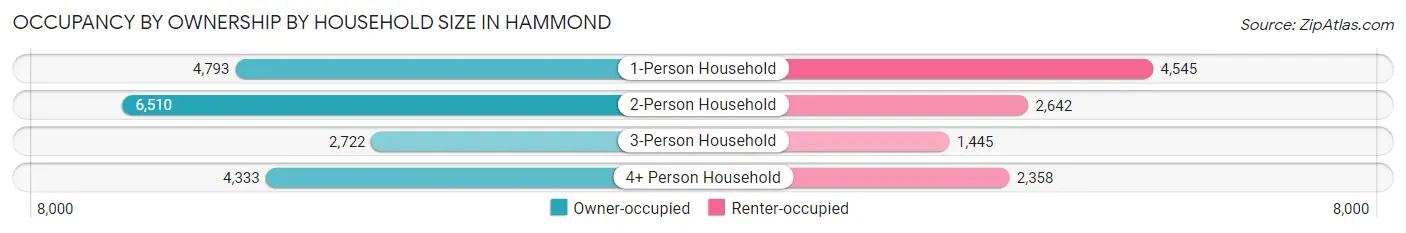
| Household Size | Owner-occupied | Renter-occupied |
| 1-Person Household | 4,793 (51.3%) | 4,545 (48.7%) |
| 2-Person Household | 6,510 (71.1%) | 2,642 (28.9%) |
| 3-Person Household | 2,722 (65.3%) | 1,445 (34.7%) |
| 4+ Person Household | 4,333 (64.8%) | 2,358 (35.2%) |
| Total Housing Units | 18,358 (62.5%) | 10,990 (37.4%) |
Occupancy by Educational Attainment in Hammond
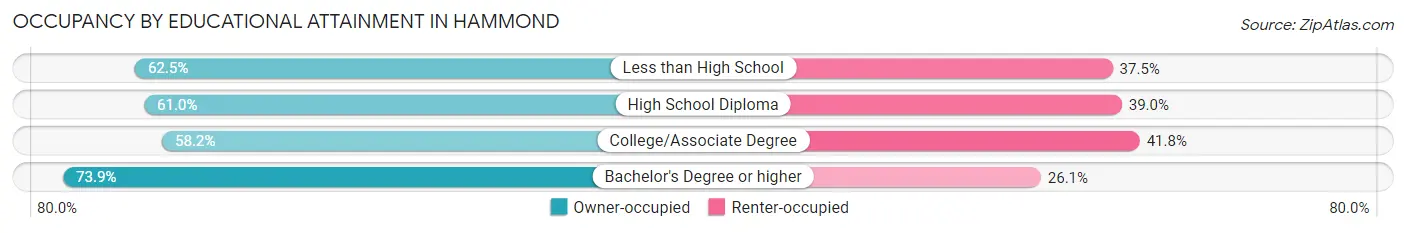
| Household Size | Owner-occupied | Renter-occupied |
| Less than High School | 2,336 (62.5%) | 1,402 (37.5%) |
| High School Diploma | 7,146 (61.0%) | 4,561 (39.0%) |
| College/Associate Degree | 5,180 (58.2%) | 3,720 (41.8%) |
| Bachelor's Degree or higher | 3,696 (73.9%) | 1,307 (26.1%) |
Occupancy by Age of Householder in Hammond
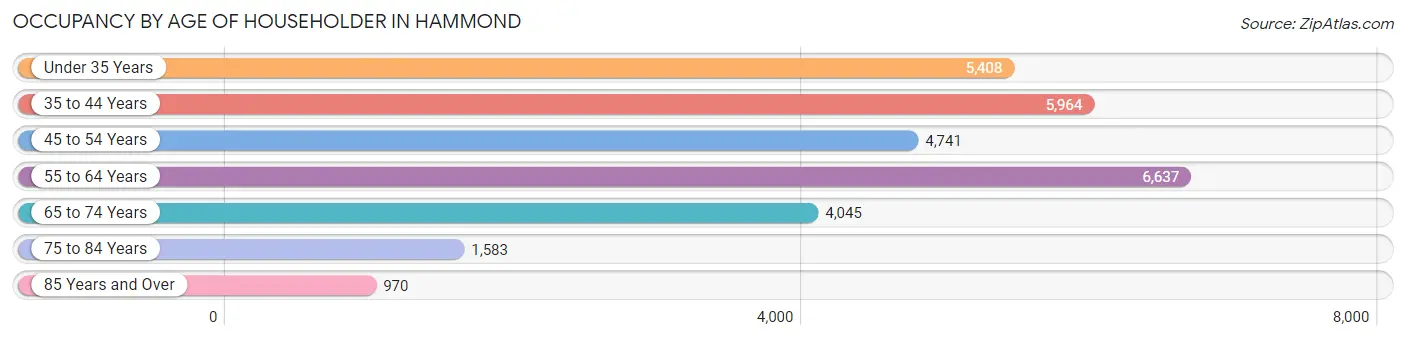
| Age Bracket | # Households | % Households |
| Under 35 Years | 5,408 | 18.4% |
| 35 to 44 Years | 5,964 | 20.3% |
| 45 to 54 Years | 4,741 | 16.2% |
| 55 to 64 Years | 6,637 | 22.6% |
| 65 to 74 Years | 4,045 | 13.8% |
| 75 to 84 Years | 1,583 | 5.4% |
| 85 Years and Over | 970 | 3.3% |
| Total | 29,348 | 100.0% |
Housing Finances in Hammond
Median Income by Occupancy in Hammond
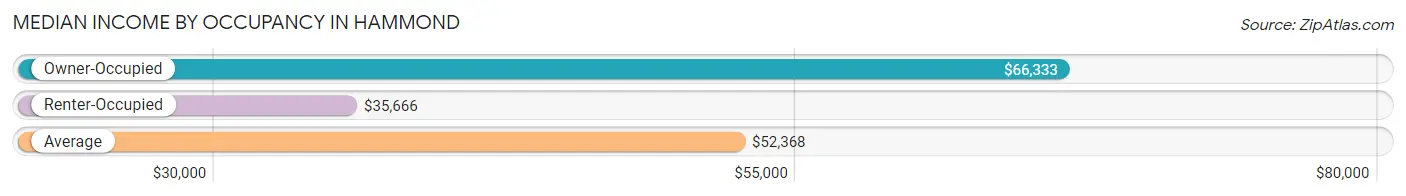
| Occupancy Type | # Households | Median Income |
| Owner-Occupied | 18,358 (62.5%) | $66,333 |
| Renter-Occupied | 10,990 (37.4%) | $35,666 |
| Average | 29,348 (100.0%) | $52,368 |
Occupancy by Householder Income Bracket in Hammond
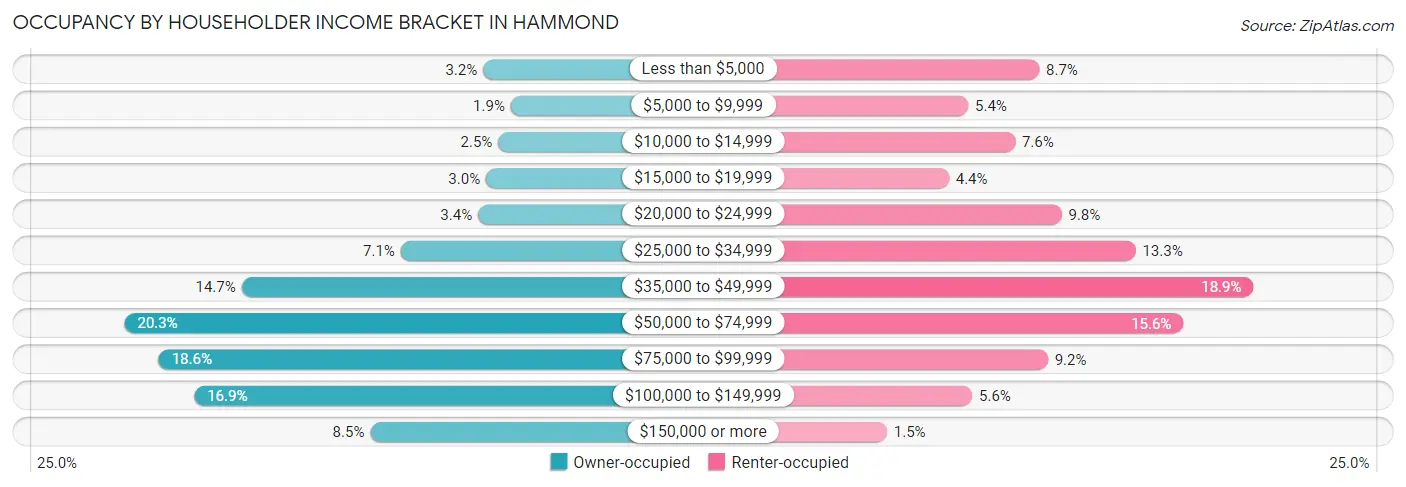
| Income Bracket | Owner-occupied | Renter-occupied |
| Less than $5,000 | 582 (3.2%) | 960 (8.7%) |
| $5,000 to $9,999 | 339 (1.8%) | 589 (5.4%) |
| $10,000 to $14,999 | 450 (2.5%) | 834 (7.6%) |
| $15,000 to $19,999 | 557 (3.0%) | 488 (4.4%) |
| $20,000 to $24,999 | 626 (3.4%) | 1,078 (9.8%) |
| $25,000 to $34,999 | 1,302 (7.1%) | 1,465 (13.3%) |
| $35,000 to $49,999 | 2,694 (14.7%) | 2,082 (18.9%) |
| $50,000 to $74,999 | 3,717 (20.3%) | 1,714 (15.6%) |
| $75,000 to $99,999 | 3,417 (18.6%) | 1,006 (9.1%) |
| $100,000 to $149,999 | 3,106 (16.9%) | 610 (5.6%) |
| $150,000 or more | 1,568 (8.5%) | 164 (1.5%) |
| Total | 18,358 (100.0%) | 10,990 (100.0%) |
Monthly Housing Cost Tiers in Hammond
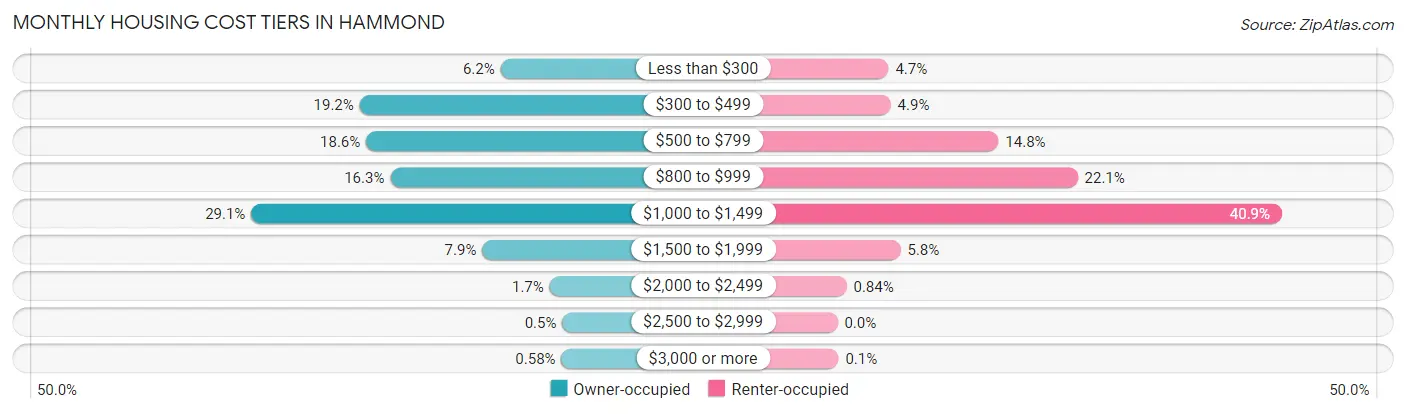
| Monthly Cost | Owner-occupied | Renter-occupied |
| Less than $300 | 1,135 (6.2%) | 517 (4.7%) |
| $300 to $499 | 3,518 (19.2%) | 539 (4.9%) |
| $500 to $799 | 3,407 (18.6%) | 1,629 (14.8%) |
| $800 to $999 | 3,000 (16.3%) | 2,430 (22.1%) |
| $1,000 to $1,499 | 5,350 (29.1%) | 4,496 (40.9%) |
| $1,500 to $1,999 | 1,444 (7.9%) | 638 (5.8%) |
| $2,000 to $2,499 | 306 (1.7%) | 92 (0.8%) |
| $2,500 to $2,999 | 92 (0.5%) | 0 (0.0%) |
| $3,000 or more | 106 (0.6%) | 11 (0.1%) |
| Total | 18,358 (100.0%) | 10,990 (100.0%) |
Physical Housing Characteristics in Hammond
Housing Structures in Hammond
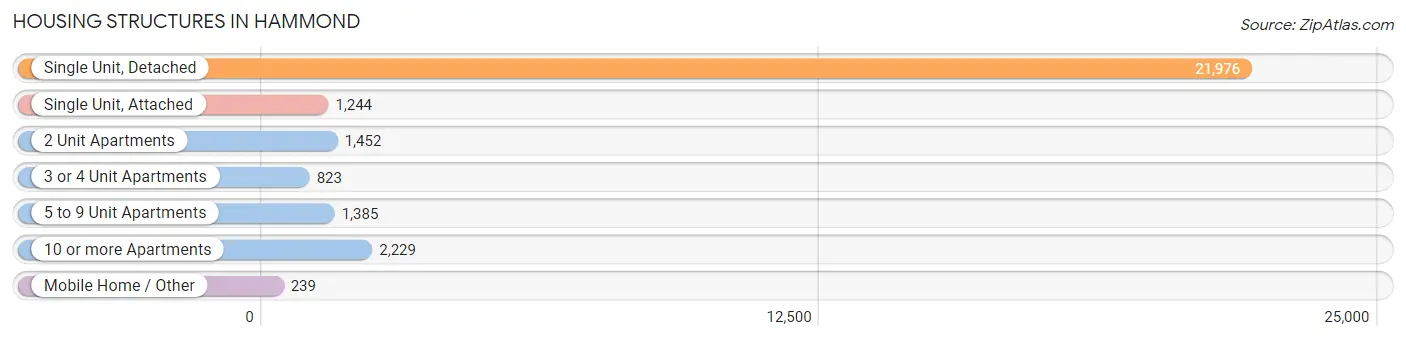
| Structure Type | # Housing Units | % Housing Units |
| Single Unit, Detached | 21,976 | 74.9% |
| Single Unit, Attached | 1,244 | 4.2% |
| 2 Unit Apartments | 1,452 | 5.0% |
| 3 or 4 Unit Apartments | 823 | 2.8% |
| 5 to 9 Unit Apartments | 1,385 | 4.7% |
| 10 or more Apartments | 2,229 | 7.6% |
| Mobile Home / Other | 239 | 0.8% |
| Total | 29,348 | 100.0% |
Housing Structures by Occupancy in Hammond
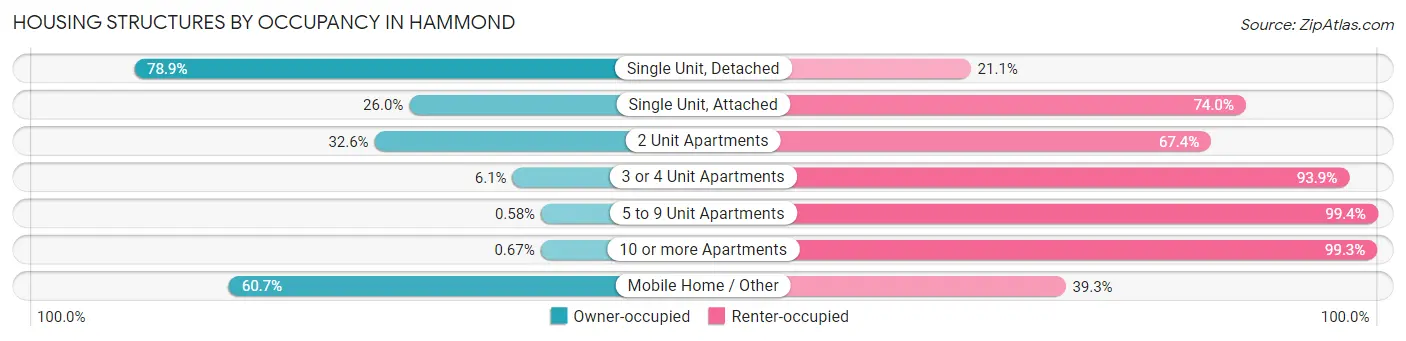
| Structure Type | Owner-occupied | Renter-occupied |
| Single Unit, Detached | 17,343 (78.9%) | 4,633 (21.1%) |
| Single Unit, Attached | 323 (26.0%) | 921 (74.0%) |
| 2 Unit Apartments | 474 (32.6%) | 978 (67.4%) |
| 3 or 4 Unit Apartments | 50 (6.1%) | 773 (93.9%) |
| 5 to 9 Unit Apartments | 8 (0.6%) | 1,377 (99.4%) |
| 10 or more Apartments | 15 (0.7%) | 2,214 (99.3%) |
| Mobile Home / Other | 145 (60.7%) | 94 (39.3%) |
| Total | 18,358 (62.5%) | 10,990 (37.4%) |
Housing Structures by Number of Rooms in Hammond
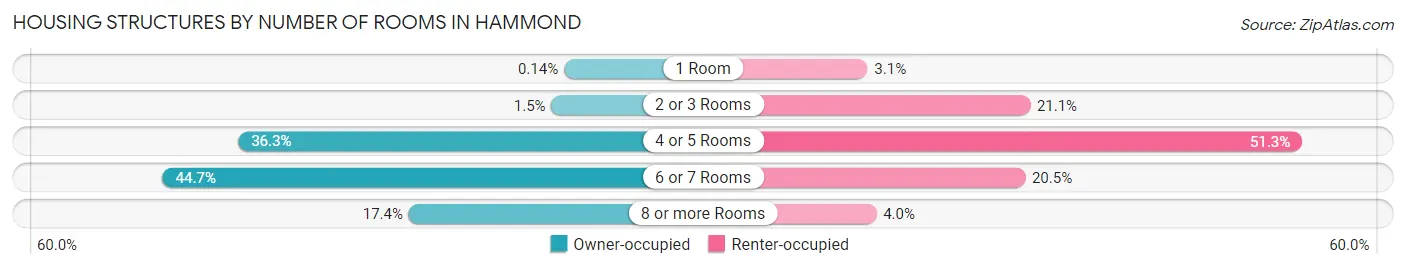
| Number of Rooms | Owner-occupied | Renter-occupied |
| 1 Room | 26 (0.1%) | 335 (3.0%) |
| 2 or 3 Rooms | 280 (1.5%) | 2,318 (21.1%) |
| 4 or 5 Rooms | 6,662 (36.3%) | 5,637 (51.3%) |
| 6 or 7 Rooms | 8,203 (44.7%) | 2,257 (20.5%) |
| 8 or more Rooms | 3,187 (17.4%) | 443 (4.0%) |
| Total | 18,358 (100.0%) | 10,990 (100.0%) |
Housing Structure by Heating Type in Hammond
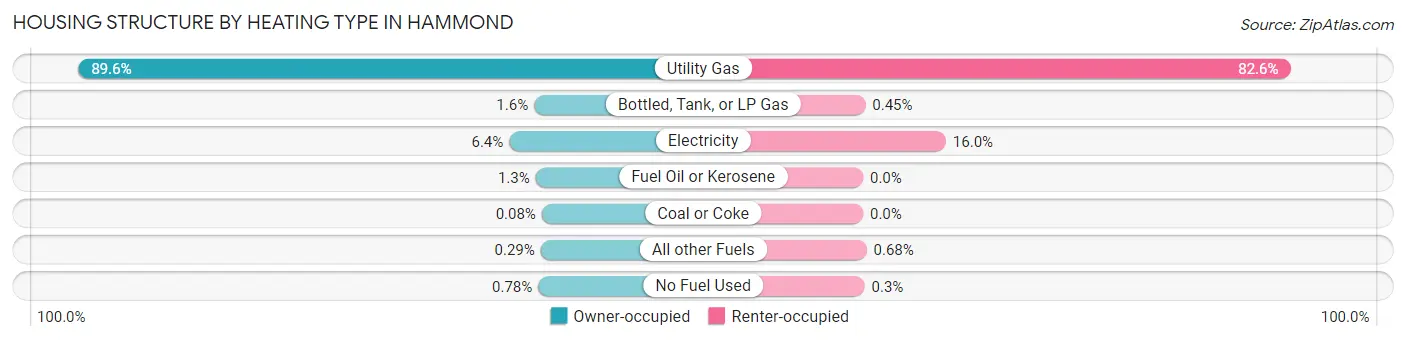
| Heating Type | Owner-occupied | Renter-occupied |
| Utility Gas | 16,454 (89.6%) | 9,072 (82.6%) |
| Bottled, Tank, or LP Gas | 289 (1.6%) | 50 (0.4%) |
| Electricity | 1,170 (6.4%) | 1,760 (16.0%) |
| Fuel Oil or Kerosene | 234 (1.3%) | 0 (0.0%) |
| Coal or Coke | 14 (0.1%) | 0 (0.0%) |
| All other Fuels | 54 (0.3%) | 75 (0.7%) |
| No Fuel Used | 143 (0.8%) | 33 (0.3%) |
| Total | 18,358 (100.0%) | 10,990 (100.0%) |
Household Vehicle Usage in Hammond
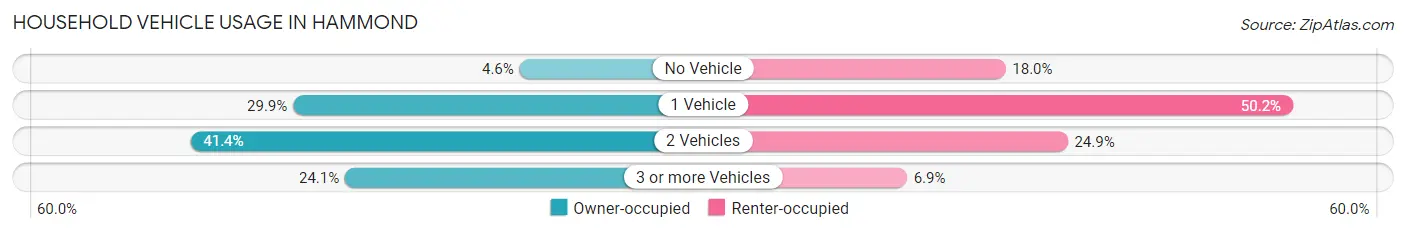
| Vehicles per Household | Owner-occupied | Renter-occupied |
| No Vehicle | 835 (4.5%) | 1,975 (18.0%) |
| 1 Vehicle | 5,493 (29.9%) | 5,515 (50.2%) |
| 2 Vehicles | 7,606 (41.4%) | 2,740 (24.9%) |
| 3 or more Vehicles | 4,424 (24.1%) | 760 (6.9%) |
| Total | 18,358 (100.0%) | 10,990 (100.0%) |
Real Estate & Mortgages in Hammond
Real Estate and Mortgage Overview in Hammond
| Characteristic | Without Mortgage | With Mortgage |
| Housing Units | 7,388 | 10,970 |
| Median Property Value | $118,400 | $135,700 |
| Median Household Income | $52,184 | $1,245 |
| Monthly Housing Costs | $457 | $106 |
| Real Estate Taxes | $1,309 | $170 |
Property Value by Mortgage Status in Hammond
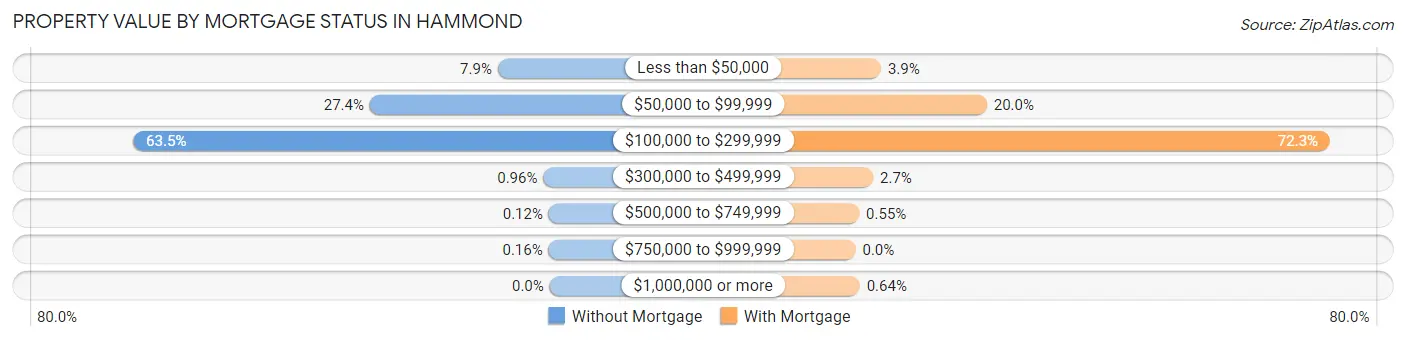
| Property Value | Without Mortgage | With Mortgage |
| Less than $50,000 | 584 (7.9%) | 424 (3.9%) |
| $50,000 to $99,999 | 2,024 (27.4%) | 2,194 (20.0%) |
| $100,000 to $299,999 | 4,688 (63.4%) | 7,929 (72.3%) |
| $300,000 to $499,999 | 71 (1.0%) | 293 (2.7%) |
| $500,000 to $749,999 | 9 (0.1%) | 60 (0.5%) |
| $750,000 to $999,999 | 12 (0.2%) | 0 (0.0%) |
| $1,000,000 or more | 0 (0.0%) | 70 (0.6%) |
| Total | 7,388 (100.0%) | 10,970 (100.0%) |
Household Income by Mortgage Status in Hammond
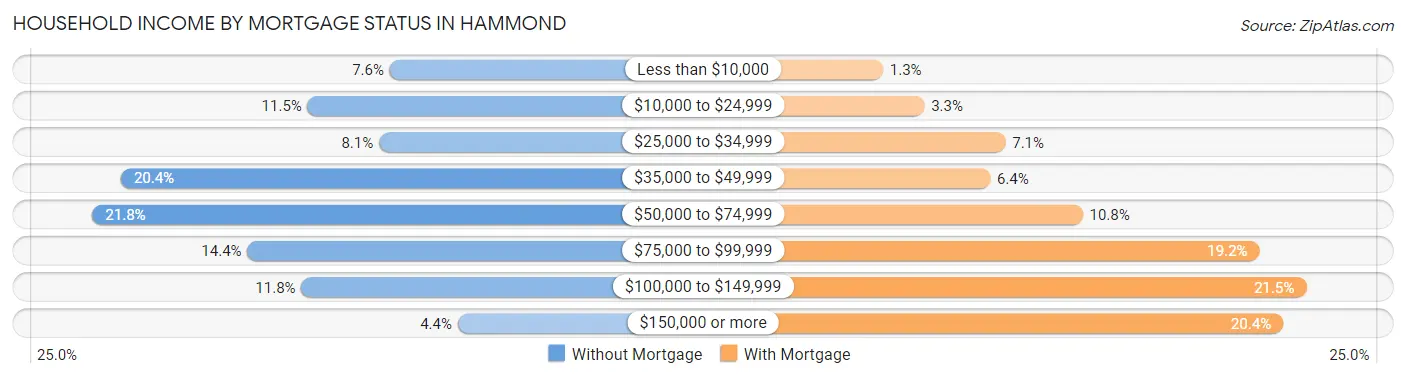
| Household Income | Without Mortgage | With Mortgage |
| Less than $10,000 | 562 (7.6%) | 143 (1.3%) |
| $10,000 to $24,999 | 851 (11.5%) | 359 (3.3%) |
| $25,000 to $34,999 | 600 (8.1%) | 782 (7.1%) |
| $35,000 to $49,999 | 1,508 (20.4%) | 702 (6.4%) |
| $50,000 to $74,999 | 1,608 (21.8%) | 1,186 (10.8%) |
| $75,000 to $99,999 | 1,063 (14.4%) | 2,109 (19.2%) |
| $100,000 to $149,999 | 873 (11.8%) | 2,354 (21.5%) |
| $150,000 or more | 323 (4.4%) | 2,233 (20.4%) |
| Total | 7,388 (100.0%) | 10,970 (100.0%) |
Property Value to Household Income Ratio in Hammond
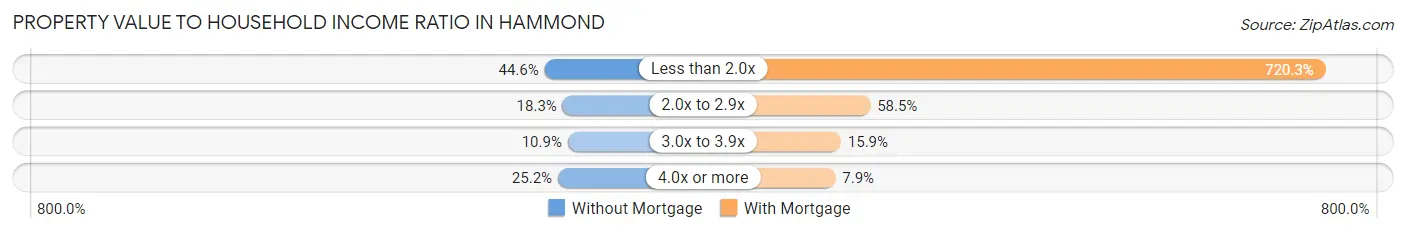
| Value-to-Income Ratio | Without Mortgage | With Mortgage |
| Less than 2.0x | 3,291 (44.6%) | 79,012 (720.3%) |
| 2.0x to 2.9x | 1,350 (18.3%) | 6,421 (58.5%) |
| 3.0x to 3.9x | 806 (10.9%) | 1,742 (15.9%) |
| 4.0x or more | 1,859 (25.2%) | 863 (7.9%) |
| Total | 7,388 (100.0%) | 10,970 (100.0%) |
Real Estate Taxes by Mortgage Status in Hammond
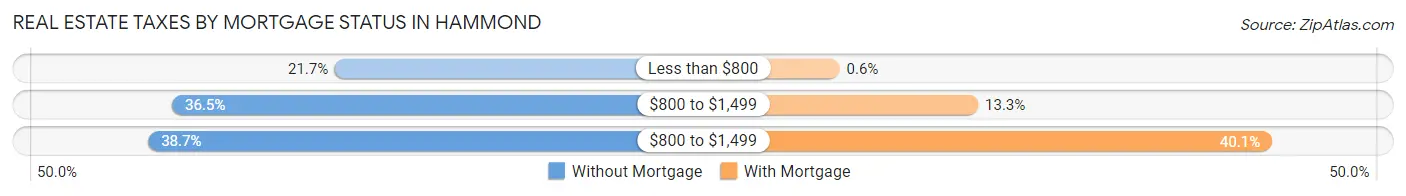
| Property Taxes | Without Mortgage | With Mortgage |
| Less than $800 | 1,606 (21.7%) | 66 (0.6%) |
| $800 to $1,499 | 2,699 (36.5%) | 1,454 (13.3%) |
| $800 to $1,499 | 2,860 (38.7%) | 4,398 (40.1%) |
| Total | 7,388 (100.0%) | 10,970 (100.0%) |
Health & Disability in Hammond
Health Insurance Coverage by Age in Hammond
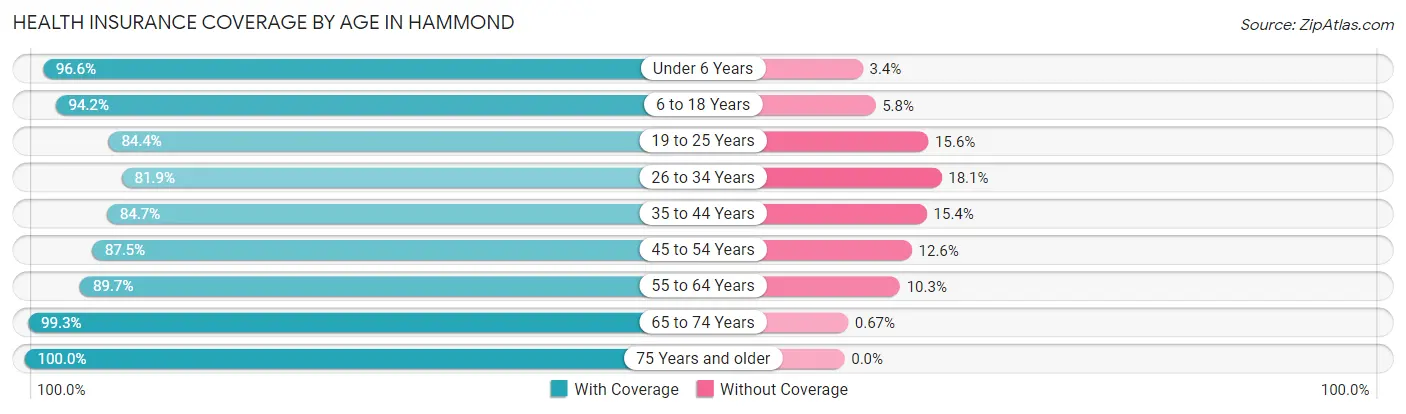
| Age Bracket | With Coverage | Without Coverage |
| Under 6 Years | 4,574 (96.6%) | 161 (3.4%) |
| 6 to 18 Years | 14,023 (94.2%) | 858 (5.8%) |
| 19 to 25 Years | 6,850 (84.4%) | 1,270 (15.6%) |
| 26 to 34 Years | 7,443 (81.9%) | 1,643 (18.1%) |
| 35 to 44 Years | 9,437 (84.7%) | 1,711 (15.3%) |
| 45 to 54 Years | 7,467 (87.5%) | 1,072 (12.6%) |
| 55 to 64 Years | 9,500 (89.7%) | 1,095 (10.3%) |
| 65 to 74 Years | 6,049 (99.3%) | 41 (0.7%) |
| 75 Years and older | 4,090 (100.0%) | 0 (0.0%) |
| Total | 69,433 (89.8%) | 7,851 (10.2%) |
Health Insurance Coverage by Citizenship Status in Hammond
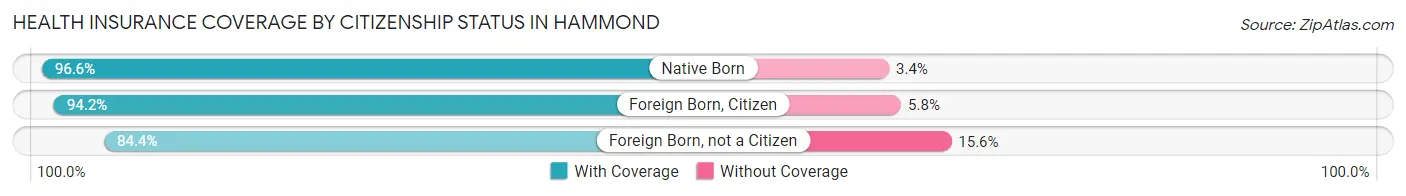
| Citizenship Status | With Coverage | Without Coverage |
| Native Born | 4,574 (96.6%) | 161 (3.4%) |
| Foreign Born, Citizen | 14,023 (94.2%) | 858 (5.8%) |
| Foreign Born, not a Citizen | 6,850 (84.4%) | 1,270 (15.6%) |
Health Insurance Coverage by Household Income in Hammond
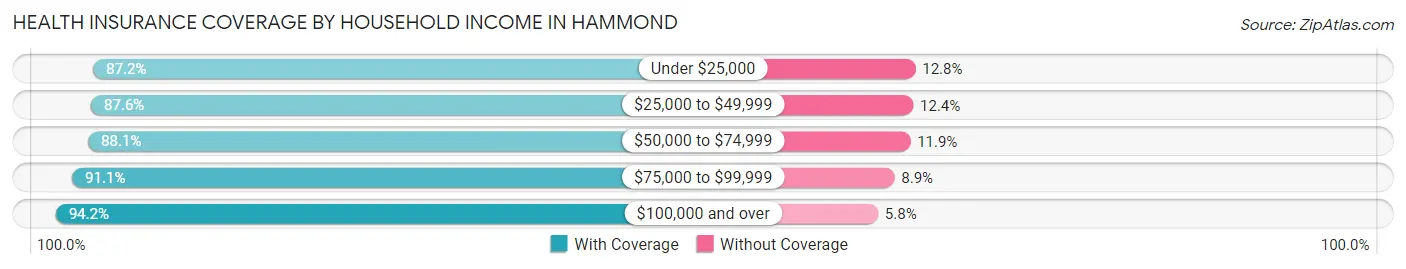
| Household Income | With Coverage | Without Coverage |
| Under $25,000 | 10,304 (87.2%) | 1,517 (12.8%) |
| $25,000 to $49,999 | 16,150 (87.6%) | 2,293 (12.4%) |
| $50,000 to $74,999 | 13,037 (88.1%) | 1,757 (11.9%) |
| $75,000 to $99,999 | 11,331 (91.1%) | 1,108 (8.9%) |
| $100,000 and over | 17,897 (94.2%) | 1,109 (5.8%) |
Public vs Private Health Insurance Coverage by Age in Hammond
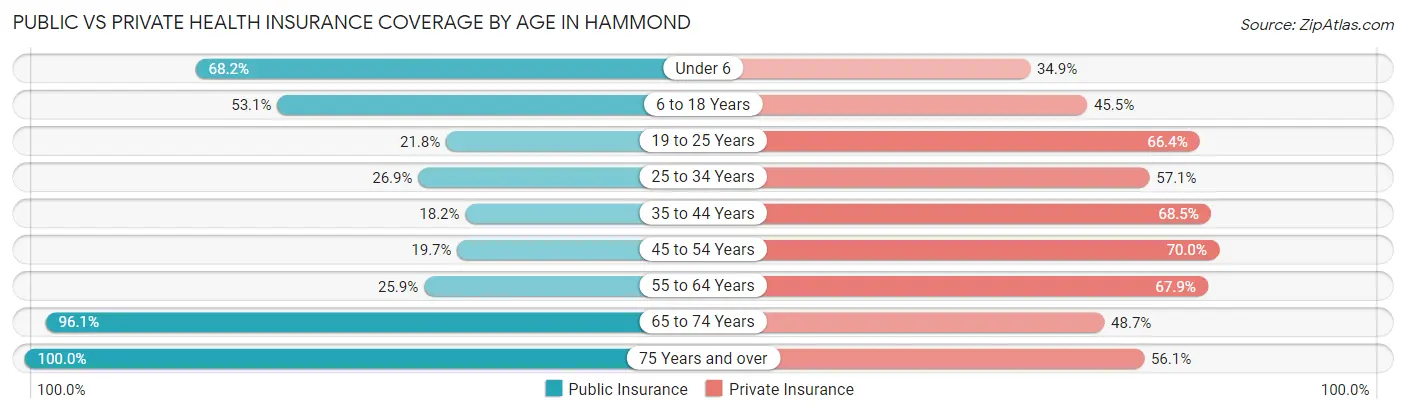
| Age Bracket | Public Insurance | Private Insurance |
| Under 6 | 3,231 (68.2%) | 1,654 (34.9%) |
| 6 to 18 Years | 7,901 (53.1%) | 6,775 (45.5%) |
| 19 to 25 Years | 1,768 (21.8%) | 5,391 (66.4%) |
| 25 to 34 Years | 2,447 (26.9%) | 5,187 (57.1%) |
| 35 to 44 Years | 2,028 (18.2%) | 7,631 (68.4%) |
| 45 to 54 Years | 1,680 (19.7%) | 5,974 (70.0%) |
| 55 to 64 Years | 2,740 (25.9%) | 7,194 (67.9%) |
| 65 to 74 Years | 5,852 (96.1%) | 2,966 (48.7%) |
| 75 Years and over | 4,090 (100.0%) | 2,294 (56.1%) |
| Total | 31,737 (41.1%) | 45,066 (58.3%) |
Disability Status by Sex by Age in Hammond
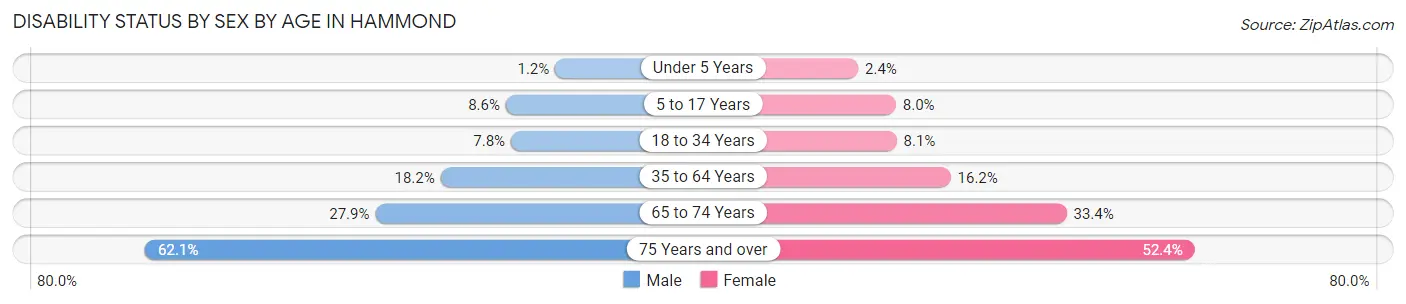
| Age Bracket | Male | Female |
| Under 5 Years | 29 (1.2%) | 41 (2.4%) |
| 5 to 17 Years | 594 (8.6%) | 570 (8.0%) |
| 18 to 34 Years | 759 (7.8%) | 727 (8.1%) |
| 35 to 64 Years | 2,645 (18.2%) | 2,550 (16.2%) |
| 65 to 74 Years | 796 (27.9%) | 1,081 (33.4%) |
| 75 Years and over | 956 (62.1%) | 1,336 (52.4%) |
Disability Class by Sex by Age in Hammond
Disability Class: Hearing Difficulty
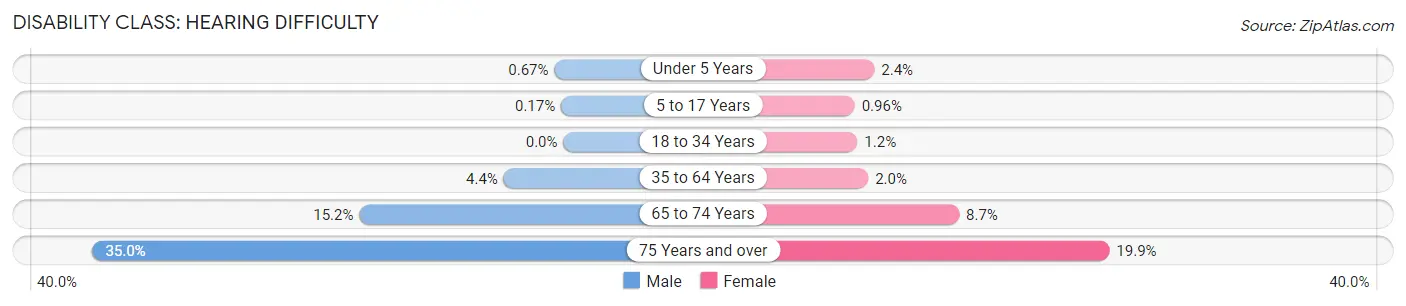
| Age Bracket | Male | Female |
| Under 5 Years | 16 (0.7%) | 41 (2.4%) |
| 5 to 17 Years | 12 (0.2%) | 68 (1.0%) |
| 18 to 34 Years | 0 (0.0%) | 104 (1.2%) |
| 35 to 64 Years | 642 (4.4%) | 310 (2.0%) |
| 65 to 74 Years | 432 (15.1%) | 282 (8.7%) |
| 75 Years and over | 538 (35.0%) | 507 (19.9%) |
Disability Class: Vision Difficulty
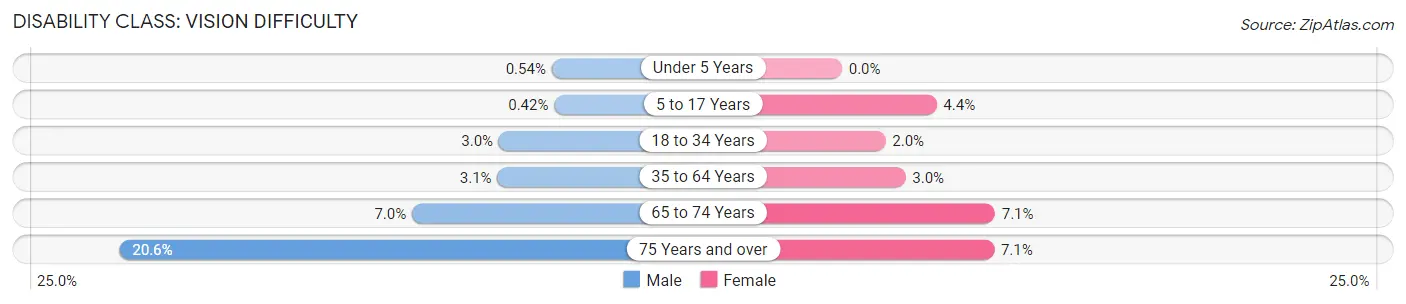
| Age Bracket | Male | Female |
| Under 5 Years | 13 (0.5%) | 0 (0.0%) |
| 5 to 17 Years | 29 (0.4%) | 312 (4.4%) |
| 18 to 34 Years | 292 (3.0%) | 180 (2.0%) |
| 35 to 64 Years | 443 (3.1%) | 466 (2.9%) |
| 65 to 74 Years | 200 (7.0%) | 230 (7.1%) |
| 75 Years and over | 317 (20.6%) | 180 (7.1%) |
Disability Class: Cognitive Difficulty
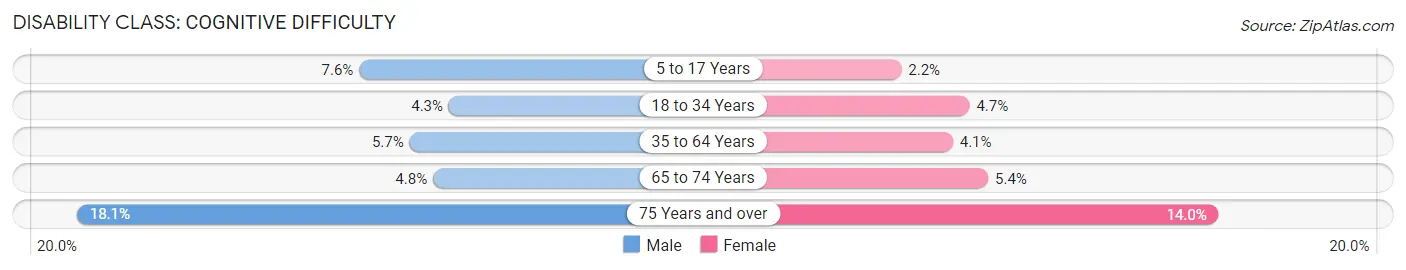
| Age Bracket | Male | Female |
| 5 to 17 Years | 527 (7.6%) | 157 (2.2%) |
| 18 to 34 Years | 415 (4.3%) | 423 (4.7%) |
| 35 to 64 Years | 828 (5.7%) | 651 (4.1%) |
| 65 to 74 Years | 138 (4.8%) | 176 (5.4%) |
| 75 Years and over | 278 (18.1%) | 357 (14.0%) |
Disability Class: Ambulatory Difficulty
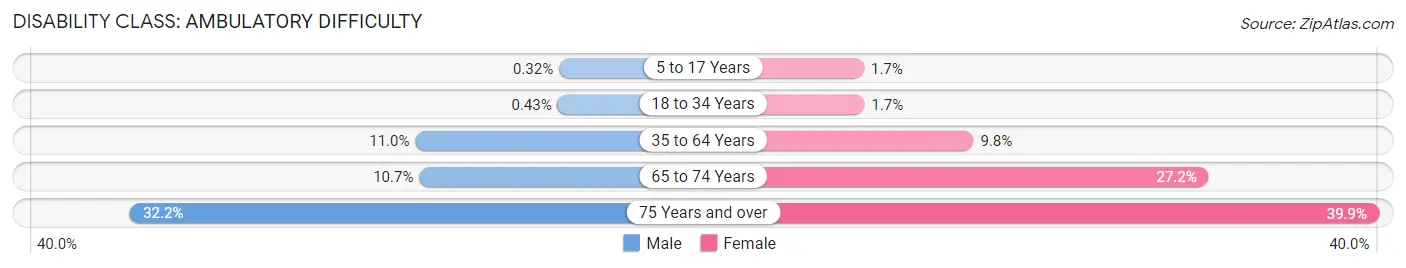
| Age Bracket | Male | Female |
| 5 to 17 Years | 22 (0.3%) | 117 (1.7%) |
| 18 to 34 Years | 42 (0.4%) | 151 (1.7%) |
| 35 to 64 Years | 1,593 (11.0%) | 1,543 (9.8%) |
| 65 to 74 Years | 305 (10.7%) | 882 (27.2%) |
| 75 Years and over | 495 (32.2%) | 1,017 (39.9%) |
Disability Class: Self-Care Difficulty
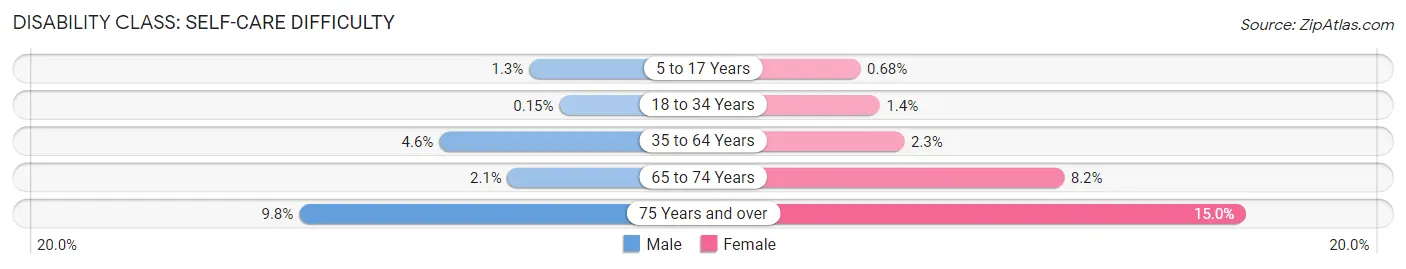
| Age Bracket | Male | Female |
| 5 to 17 Years | 88 (1.3%) | 48 (0.7%) |
| 18 to 34 Years | 15 (0.2%) | 125 (1.4%) |
| 35 to 64 Years | 669 (4.6%) | 365 (2.3%) |
| 65 to 74 Years | 59 (2.1%) | 267 (8.2%) |
| 75 Years and over | 151 (9.8%) | 383 (15.0%) |
Technology Access in Hammond
Computing Device Access in Hammond
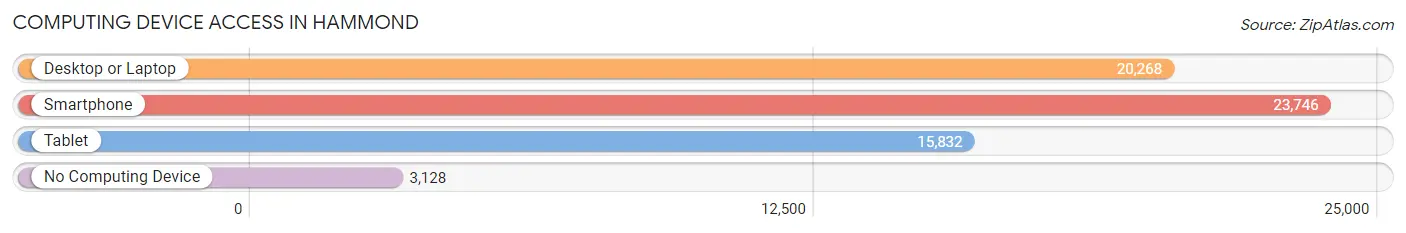
| Device Type | # Households | % Households |
| Desktop or Laptop | 20,268 | 69.1% |
| Smartphone | 23,746 | 80.9% |
| Tablet | 15,832 | 53.9% |
| No Computing Device | 3,128 | 10.7% |
| Total | 29,348 | 100.0% |
Internet Access in Hammond
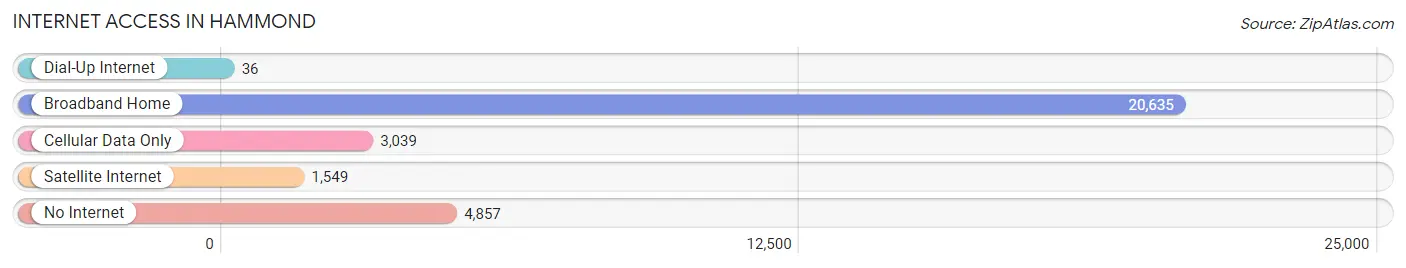
| Internet Type | # Households | % Households |
| Dial-Up Internet | 36 | 0.1% |
| Broadband Home | 20,635 | 70.3% |
| Cellular Data Only | 3,039 | 10.4% |
| Satellite Internet | 1,549 | 5.3% |
| No Internet | 4,857 | 16.6% |
| Total | 29,348 | 100.0% |
Hammond Summary
Hammond, Indiana is a city located in Lake County, Indiana, United States. It is part of the Chicago metropolitan area. The population was 80,830 at the 2010 census, making it the most populous city in Lake County.
History
Hammond was founded in 1869 by George H. Hammond, a meat-packing entrepreneur from Illinois. The city was named after him. Hammond was incorporated as a town in 1883 and as a city in 1918.
In the late 19th century, Hammond was a major center of industry, with many factories and mills. The city was also a major railroad hub, with several railroads running through it.
Geography
Hammond is located at 41°36′40″N 87°29′35″W (41.611111, -87.493056). According to the 2010 census, Hammond has a total area of 20.85 square miles (53.9 km2), of which 20.8 square miles (53.7 km2) is land and 0.05 square miles (0.2 km2) is water.
Economy
Hammond is a major industrial center, with many factories and mills. The city is home to the headquarters of the Whiting Corporation, a manufacturer of industrial machinery. Other major employers in the city include the Hammond-Whiting Metals Corporation, the Hammond-Whiting Steel Corporation, and the Hammond-Whiting Refinery.
The city is also home to several major retail outlets, including the Hammond Square Mall and the Hammond Town Center.
Demographics
As of the 2010 census, there were 80,830 people, 32,945 households, and 20,945 families residing in the city. The population density was 3,878.3 people per square mile (1,494.2/km2). There were 35,936 housing units at an average density of 1,735.3 per square mile (669.7/km2). The racial makeup of the city was 68.2% White, 24.3% African American, 0.3% Native American, 1.3% Asian, 0.1% Pacific Islander, 3.2% from other races, and 2.8% from two or more races. Hispanic or Latino of any race were 8.9% of the population.
There were 32,945 households, out of which 28.3% had children under the age of 18 living with them, 39.2% were married couples living together, 17.3% had a female householder with no husband present, and 38.2% were non-families. 32.2% of all households were made up of individuals, and 11.7% had someone living alone who was 65 years of age or older. The average household size was 2.44 and the average family size was 3.09.
In the city, the population was spread out, with 24.2% under the age of 18, 9.3% from 18 to 24, 28.7% from 25 to 44, 22.6% from 45 to 64, and 15.2% who were 65 years of age or older. The median age was 36 years. For every 100 females, there were 93.2 males. For every 100 females age 18 and over, there were 89.3 males.
The median income for a household in the city was $37,941, and the median income for a family was $45,878. Males had a median income of $35,902 versus $26,521 for females. The per capita income for the city was $19,009. About 10.2% of families and 12.5% of the population were below the poverty line, including 17.2% of those under age 18 and 8.7% of those age 65 or over.
Common Questions
What is Per Capita Income in Hammond?
Per Capita income in Hammond is $26,109.
What is the Median Family Income in Hammond?
Median Family Income in Hammond is $62,225.
What is the Median Household income in Hammond?
Median Household Income in Hammond is $52,368.
What is Income or Wage Gap in Hammond?
Income or Wage Gap in Hammond is 34.5%.
Women in Hammond earn 65.5 cents for every dollar earned by a man.
What is Family Income Deficit in Hammond?
Family Income Deficit in Hammond is $11,648.
Families that are below poverty line in Hammond earn $11,648 less on average than the poverty threshold level.
What is Inequality or Gini Index in Hammond?
Inequality or Gini Index in Hammond is 0.43.
What is the Total Population of Hammond?
Total Population of Hammond is 77,390.
What is the Total Male Population of Hammond?
Total Male Population of Hammond is 38,035.
What is the Total Female Population of Hammond?
Total Female Population of Hammond is 39,355.
What is the Ratio of Males per 100 Females in Hammond?
There are 96.65 Males per 100 Females in Hammond.
What is the Ratio of Females per 100 Males in Hammond?
There are 103.47 Females per 100 Males in Hammond.
What is the Median Population Age in Hammond?
Median Population Age in Hammond is 36.5 Years.
What is the Average Family Size in Hammond
Average Family Size in Hammond is 3.4 People.
What is the Average Household Size in Hammond
Average Household Size in Hammond is 2.6 People.
How Large is the Labor Force in Hammond?
There are 37,385 People in the Labor Forcein in Hammond.
What is the Percentage of People in the Labor Force in Hammond?
60.6% of People are in the Labor Force in Hammond.
What is the Unemployment Rate in Hammond?
Unemployment Rate in Hammond is 6.3%.