Schererville, IN Map & Demographics
Schererville Map
Schererville Overview
$44,383
PER CAPITA INCOME
$104,321
AVG FAMILY INCOME
$79,662
AVG HOUSEHOLD INCOME
35.7%
WAGE / INCOME GAP [ % ]
64.3¢/ $1
WAGE / INCOME GAP [ $ ]
$11,510
FAMILY INCOME DEFICIT
0.43
INEQUALITY / GINI INDEX
29,573
TOTAL POPULATION
14,397
MALE POPULATION
15,176
FEMALE POPULATION
94.87
MALES / 100 FEMALES
105.41
FEMALES / 100 MALES
43.4
MEDIAN AGE
3.0
AVG FAMILY SIZE
2.5
AVG HOUSEHOLD SIZE
15,888
LABOR FORCE [ PEOPLE ]
65.1%
PERCENT IN LABOR FORCE
4.5%
UNEMPLOYMENT RATE
Schererville Zip Codes
Schererville Area Codes
Income in Schererville
Income Overview in Schererville
Per Capita Income in Schererville is $44,383, while median incomes of families and households are $104,321 and $79,662 respectively.
| Characteristic | Number | Measure |
| Per Capita Income | 29,573 | $44,383 |
| Median Family Income | 8,037 | $104,321 |
| Mean Family Income | 8,037 | $128,582 |
| Median Household Income | 11,829 | $79,662 |
| Mean Household Income | 11,829 | $107,794 |
| Income Deficit | 8,037 | $11,510 |
| Wage / Income Gap (%) | 29,573 | 35.73% |
| Wage / Income Gap ($) | 29,573 | 64.27¢ per $1 |
| Gini / Inequality Index | 29,573 | 0.43 |
Earnings by Sex in Schererville
Average Earnings in Schererville are $47,008, $60,348 for men and $38,786 for women, a difference of 35.7%.
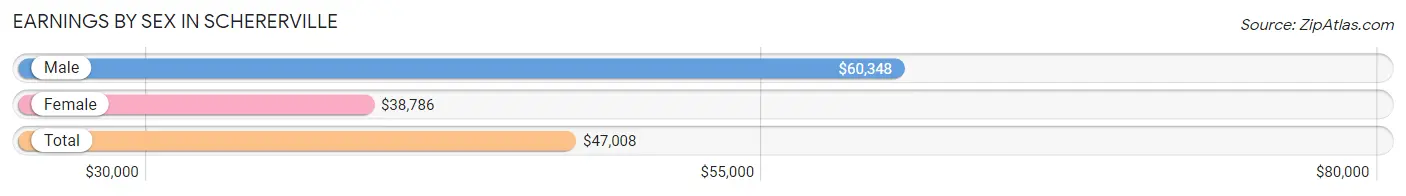
| Sex | Number | Average Earnings |
| Male | 8,341 (51.4%) | $60,348 |
| Female | 7,894 (48.6%) | $38,786 |
| Total | 16,235 (100.0%) | $47,008 |
Earnings by Sex by Income Bracket in Schererville
The most common earnings brackets in Schererville are $100,000+ for men (2,070 | 24.8%) and $45,000 to $49,999 for women (728 | 9.2%).
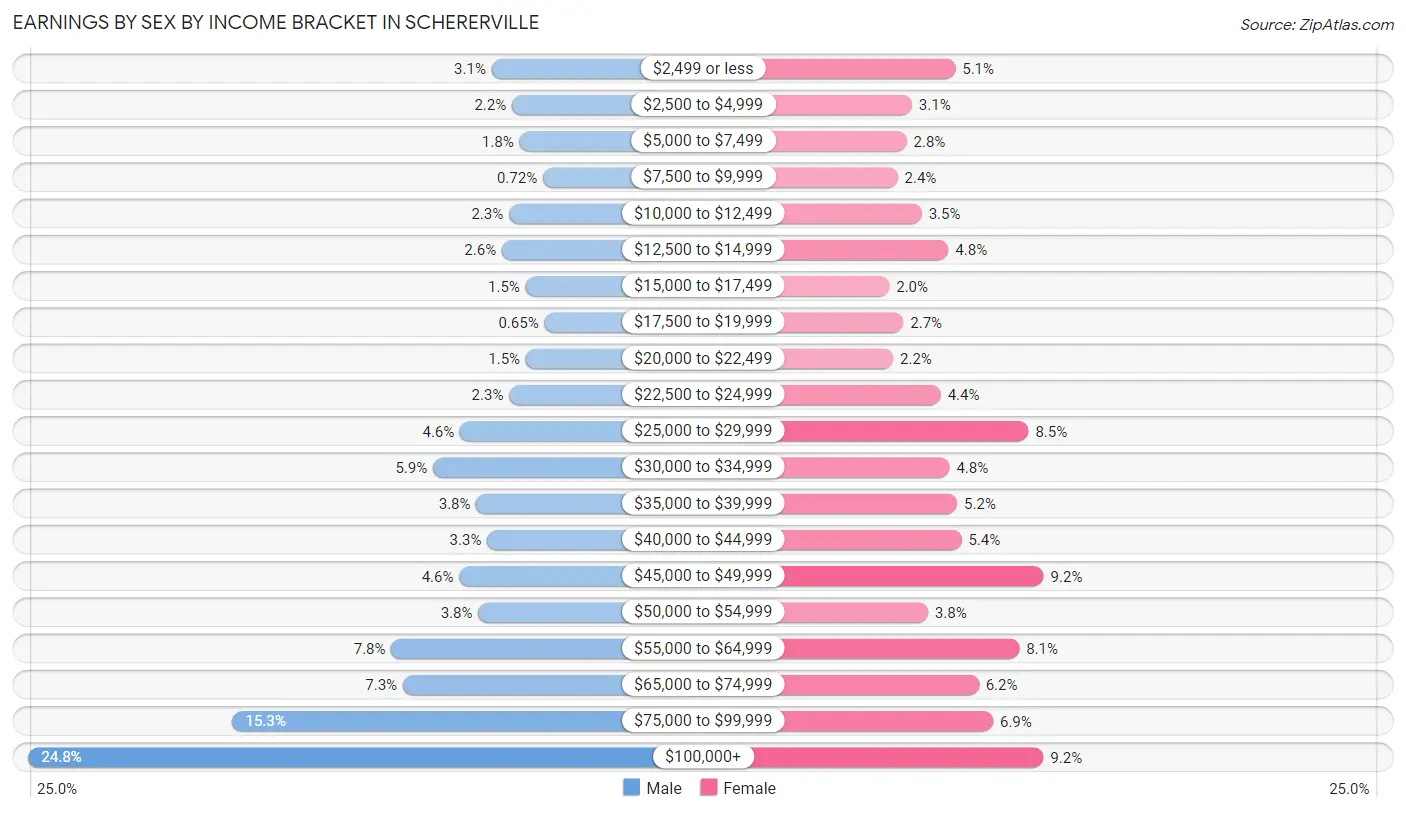
| Income | Male | Female |
| $2,499 or less | 260 (3.1%) | 401 (5.1%) |
| $2,500 to $4,999 | 181 (2.2%) | 241 (3.0%) |
| $5,000 to $7,499 | 152 (1.8%) | 221 (2.8%) |
| $7,500 to $9,999 | 60 (0.7%) | 188 (2.4%) |
| $10,000 to $12,499 | 193 (2.3%) | 277 (3.5%) |
| $12,500 to $14,999 | 220 (2.6%) | 376 (4.8%) |
| $15,000 to $17,499 | 128 (1.5%) | 157 (2.0%) |
| $17,500 to $19,999 | 54 (0.6%) | 209 (2.6%) |
| $20,000 to $22,499 | 127 (1.5%) | 171 (2.2%) |
| $22,500 to $24,999 | 192 (2.3%) | 347 (4.4%) |
| $25,000 to $29,999 | 384 (4.6%) | 672 (8.5%) |
| $30,000 to $34,999 | 490 (5.9%) | 380 (4.8%) |
| $35,000 to $39,999 | 320 (3.8%) | 408 (5.2%) |
| $40,000 to $44,999 | 278 (3.3%) | 424 (5.4%) |
| $45,000 to $49,999 | 387 (4.6%) | 728 (9.2%) |
| $50,000 to $54,999 | 313 (3.7%) | 300 (3.8%) |
| $55,000 to $64,999 | 652 (7.8%) | 638 (8.1%) |
| $65,000 to $74,999 | 607 (7.3%) | 488 (6.2%) |
| $75,000 to $99,999 | 1,273 (15.3%) | 541 (6.9%) |
| $100,000+ | 2,070 (24.8%) | 727 (9.2%) |
| Total | 8,341 (100.0%) | 7,894 (100.0%) |
Earnings by Sex by Educational Attainment in Schererville
Average earnings in Schererville are $71,893 for men and $42,143 for women, a difference of 41.4%. Men with an educational attainment of graduate degree enjoy the highest average annual earnings of $86,250, while those with less than high school education earn the least with $51,188. Women with an educational attainment of graduate degree earn the most with the average annual earnings of $70,507, while those with less than high school education have the smallest earnings of $26,563.
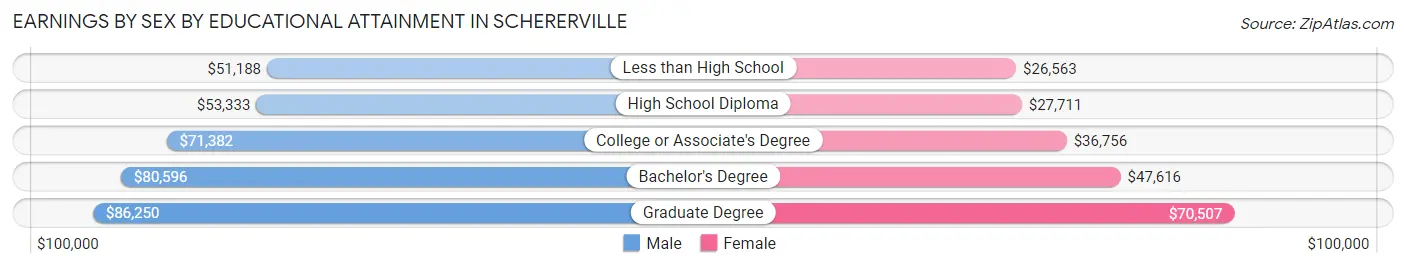
| Educational Attainment | Male Income | Female Income |
| Less than High School | $51,188 | $26,563 |
| High School Diploma | $53,333 | $27,711 |
| College or Associate's Degree | $71,382 | $36,756 |
| Bachelor's Degree | $80,596 | $47,616 |
| Graduate Degree | $86,250 | $70,507 |
| Total | $71,893 | $42,143 |
Family Income in Schererville
Family Income Brackets in Schererville
According to the Schererville family income data, there are 2,082 families falling into the $100,000 to $149,999 income range, which is the most common income bracket and makes up 25.9% of all families. Conversely, the $10,000 to $14,999 income bracket is the least frequent group with only 104 families (1.3%) belonging to this category.
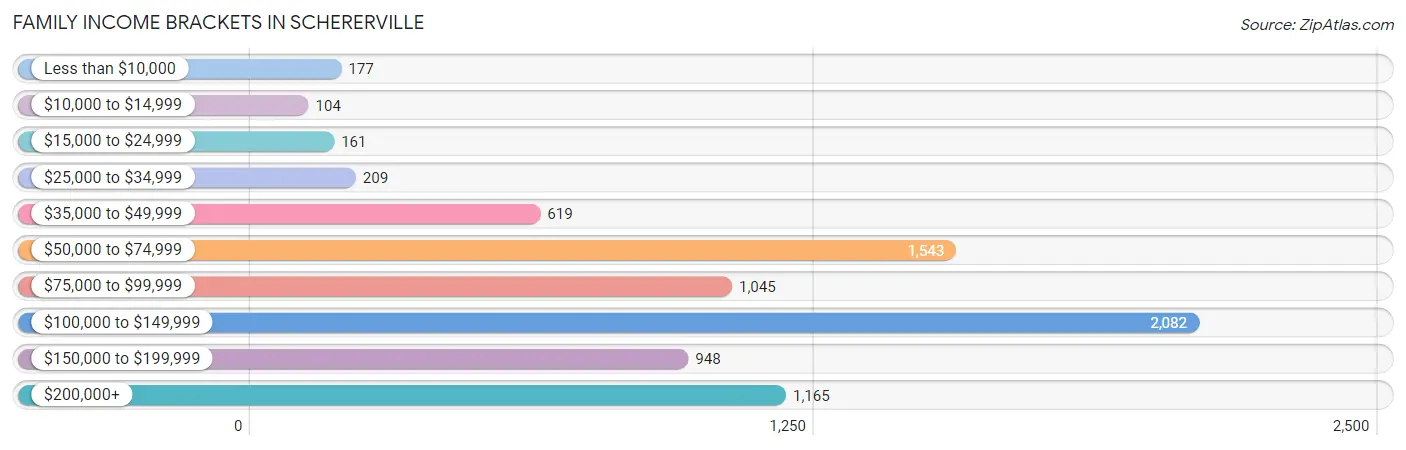
| Income Bracket | # Families | % Families |
| Less than $10,000 | 177 | 2.2% |
| $10,000 to $14,999 | 104 | 1.3% |
| $15,000 to $24,999 | 161 | 2.0% |
| $25,000 to $34,999 | 209 | 2.6% |
| $35,000 to $49,999 | 619 | 7.7% |
| $50,000 to $74,999 | 1,543 | 19.2% |
| $75,000 to $99,999 | 1,045 | 13.0% |
| $100,000 to $149,999 | 2,082 | 25.9% |
| $150,000 to $199,999 | 948 | 11.8% |
| $200,000+ | 1,165 | 14.5% |
Family Income by Famaliy Size in Schererville
7+ person families (40 | 0.5%) account for the highest median family income in Schererville with $250,001 per family, while 2-person families (3,773 | 46.9%) have the highest median income of $42,832 per family member.
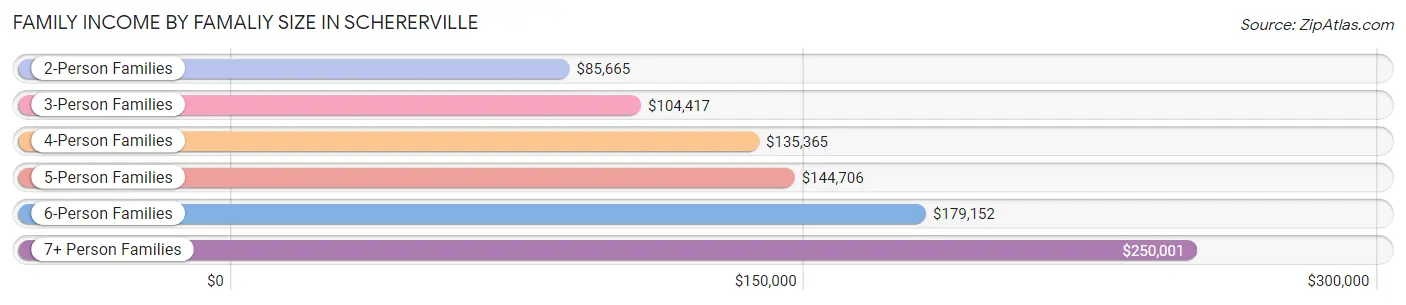
| Income Bracket | # Families | Median Income |
| 2-Person Families | 3,773 (46.9%) | $85,665 |
| 3-Person Families | 1,840 (22.9%) | $104,417 |
| 4-Person Families | 1,825 (22.7%) | $135,365 |
| 5-Person Families | 454 (5.7%) | $144,706 |
| 6-Person Families | 105 (1.3%) | $179,152 |
| 7+ Person Families | 40 (0.5%) | $250,001 |
| Total | 8,037 (100.0%) | $104,321 |
Family Income by Number of Earners in Schererville
The median family income in Schererville is $104,321, with families comprising 3+ earners (1,042) having the highest median family income of $165,156, while families with no earners (1,434) have the lowest median family income of $57,302, accounting for 13.0% and 17.8% of families, respectively.
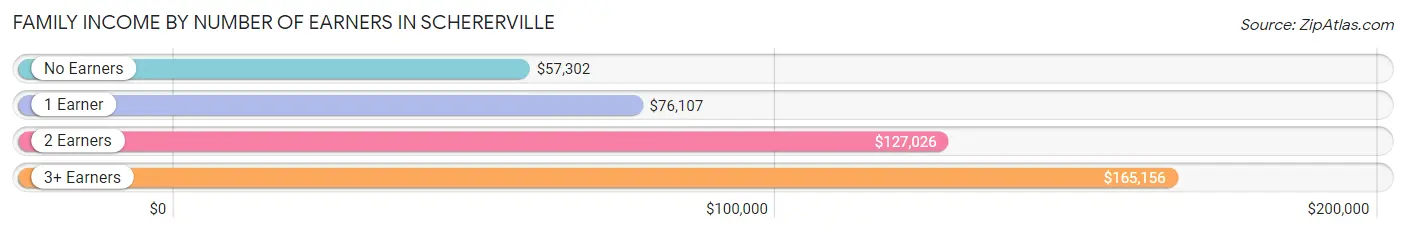
| Number of Earners | # Families | Median Income |
| No Earners | 1,434 (17.8%) | $57,302 |
| 1 Earner | 2,338 (29.1%) | $76,107 |
| 2 Earners | 3,223 (40.1%) | $127,026 |
| 3+ Earners | 1,042 (13.0%) | $165,156 |
| Total | 8,037 (100.0%) | $104,321 |
Household Income in Schererville
Household Income Brackets in Schererville
With 2,555 households falling in the category, the $50,000 to $74,999 income range is the most frequent in Schererville, accounting for 21.6% of all households. In contrast, only 308 households (2.6%) fall into the $10,000 to $14,999 income bracket, making it the least populous group.
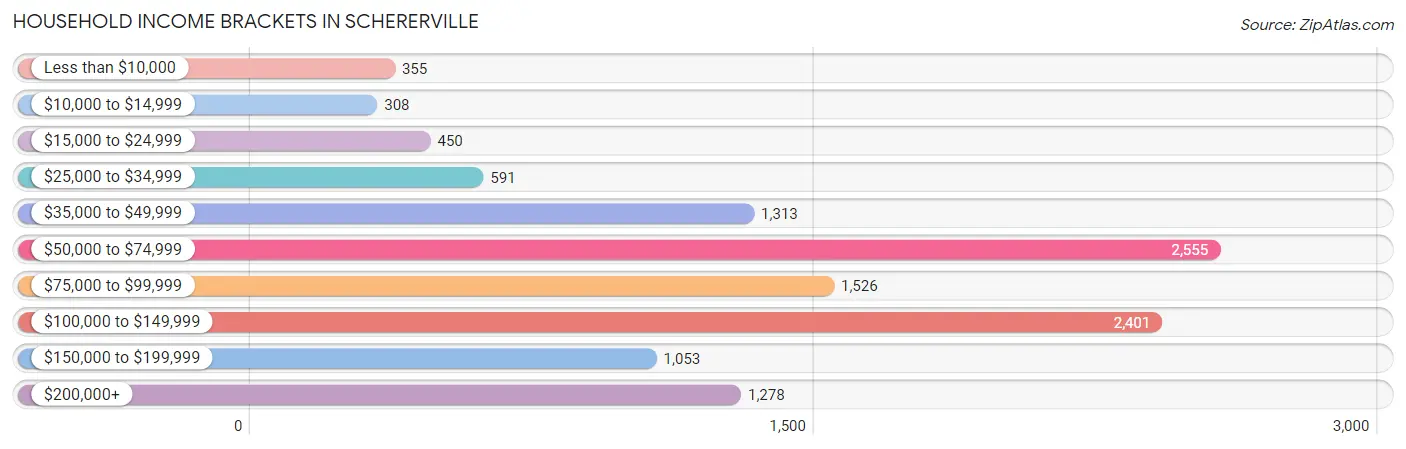
| Income Bracket | # Households | % Households |
| Less than $10,000 | 355 | 3.0% |
| $10,000 to $14,999 | 308 | 2.6% |
| $15,000 to $24,999 | 450 | 3.8% |
| $25,000 to $34,999 | 591 | 5.0% |
| $35,000 to $49,999 | 1,313 | 11.1% |
| $50,000 to $74,999 | 2,555 | 21.6% |
| $75,000 to $99,999 | 1,526 | 12.9% |
| $100,000 to $149,999 | 2,401 | 20.3% |
| $150,000 to $199,999 | 1,053 | 8.9% |
| $200,000+ | 1,278 | 10.8% |
Household Income by Householder Age in Schererville
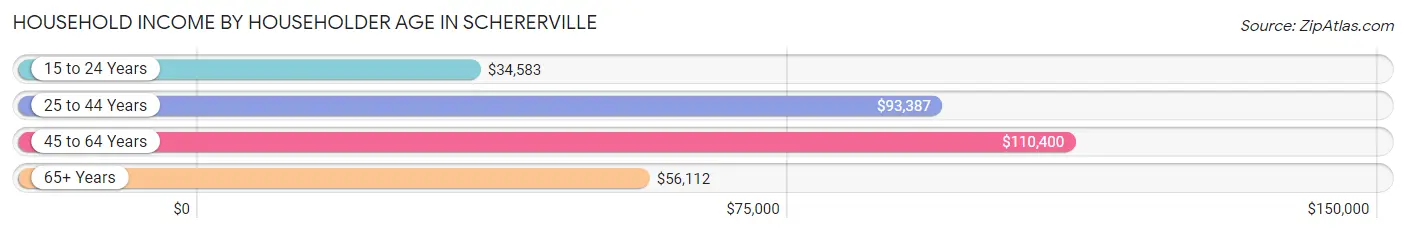
The median household income in Schererville is $79,662, with the highest median household income of $110,400 found in the 45 to 64 years age bracket for the primary householder. A total of 4,562 households (38.6%) fall into this category. Meanwhile, the 15 to 24 years age bracket for the primary householder has the lowest median household income of $34,583, with 183 households (1.5%) in this group.
| Income Bracket | # Households | Median Income |
| 15 to 24 Years | 183 (1.5%) | $34,583 |
| 25 to 44 Years | 3,180 (26.9%) | $93,387 |
| 45 to 64 Years | 4,562 (38.6%) | $110,400 |
| 65+ Years | 3,904 (33.0%) | $56,112 |
| Total | 11,829 (100.0%) | $79,662 |
Poverty in Schererville
Income Below Poverty by Sex and Age in Schererville
With 5.9% poverty level for males and 8.7% for females among the residents of Schererville, under 5 year old males and 25 to 34 year old females are the most vulnerable to poverty, with 105 males (16.0%) and 385 females (25.7%) in their respective age groups living below the poverty level.
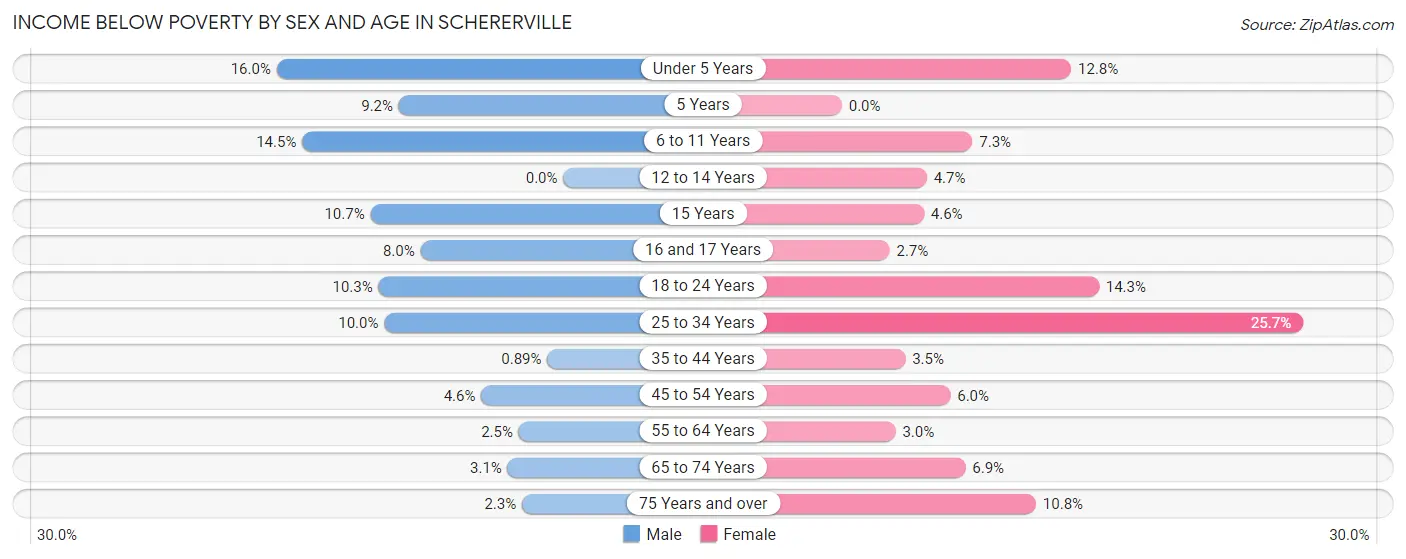
| Age Bracket | Male | Female |
| Under 5 Years | 105 (16.0%) | 125 (12.8%) |
| 5 Years | 12 (9.2%) | 0 (0.0%) |
| 6 to 11 Years | 108 (14.5%) | 70 (7.3%) |
| 12 to 14 Years | 0 (0.0%) | 16 (4.7%) |
| 15 Years | 45 (10.7%) | 9 (4.6%) |
| 16 and 17 Years | 42 (8.0%) | 9 (2.7%) |
| 18 to 24 Years | 115 (10.3%) | 150 (14.3%) |
| 25 to 34 Years | 179 (10.0%) | 385 (25.7%) |
| 35 to 44 Years | 16 (0.9%) | 78 (3.5%) |
| 45 to 54 Years | 94 (4.6%) | 132 (6.0%) |
| 55 to 64 Years | 54 (2.5%) | 55 (3.0%) |
| 65 to 74 Years | 51 (3.1%) | 127 (6.9%) |
| 75 Years and over | 19 (2.3%) | 159 (10.8%) |
| Total | 840 (5.9%) | 1,315 (8.7%) |
Income Above Poverty by Sex and Age in Schererville
According to the poverty statistics in Schererville, males aged 12 to 14 years and females aged 5 years are the age groups that are most secure financially, with 100.0% of males and 100.0% of females in these age groups living above the poverty line.
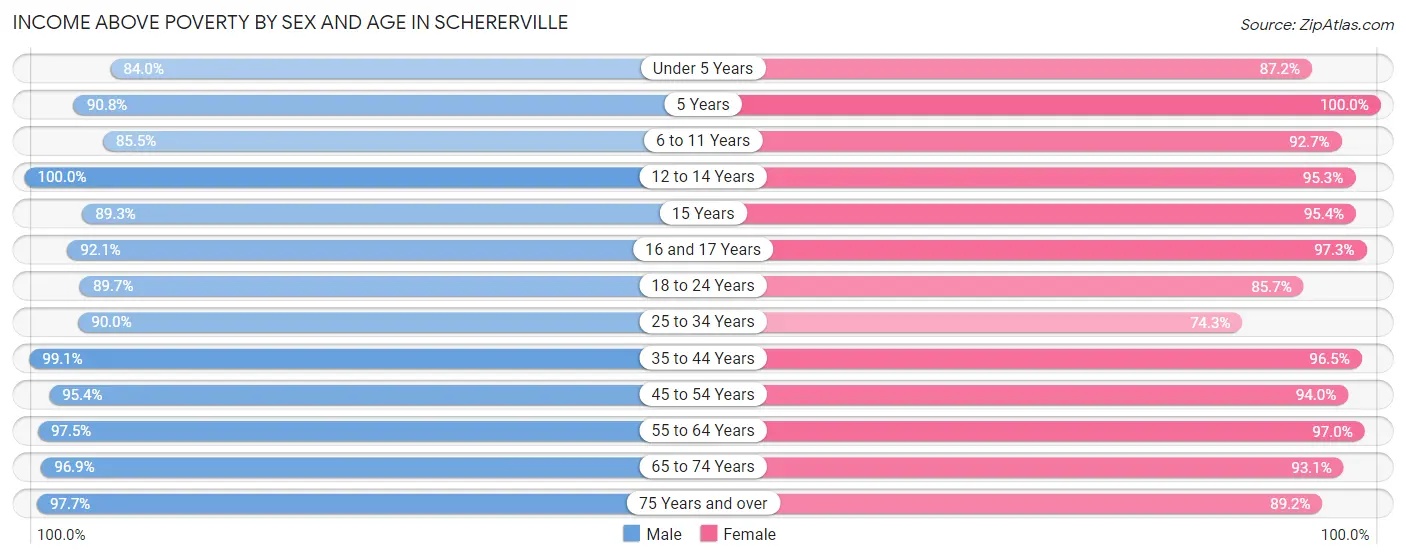
| Age Bracket | Male | Female |
| Under 5 Years | 553 (84.0%) | 854 (87.2%) |
| 5 Years | 119 (90.8%) | 231 (100.0%) |
| 6 to 11 Years | 635 (85.5%) | 893 (92.7%) |
| 12 to 14 Years | 396 (100.0%) | 322 (95.3%) |
| 15 Years | 374 (89.3%) | 188 (95.4%) |
| 16 and 17 Years | 486 (92.0%) | 329 (97.3%) |
| 18 to 24 Years | 1,003 (89.7%) | 898 (85.7%) |
| 25 to 34 Years | 1,616 (90.0%) | 1,114 (74.3%) |
| 35 to 44 Years | 1,790 (99.1%) | 2,133 (96.5%) |
| 45 to 54 Years | 1,962 (95.4%) | 2,052 (94.0%) |
| 55 to 64 Years | 2,123 (97.5%) | 1,784 (97.0%) |
| 65 to 74 Years | 1,593 (96.9%) | 1,720 (93.1%) |
| 75 Years and over | 806 (97.7%) | 1,312 (89.2%) |
| Total | 13,456 (94.1%) | 13,830 (91.3%) |
Income Below Poverty Among Married-Couple Families in Schererville
The poverty statistics for married-couple families in Schererville show that 1.9% or 111 of the total 5,923 families live below the poverty line. Families with 1 or 2 children have the highest poverty rate of 3.9%, comprising of 87 families. On the other hand, families with 3 or 4 children have the lowest poverty rate of 0.0%, which includes 0 families.
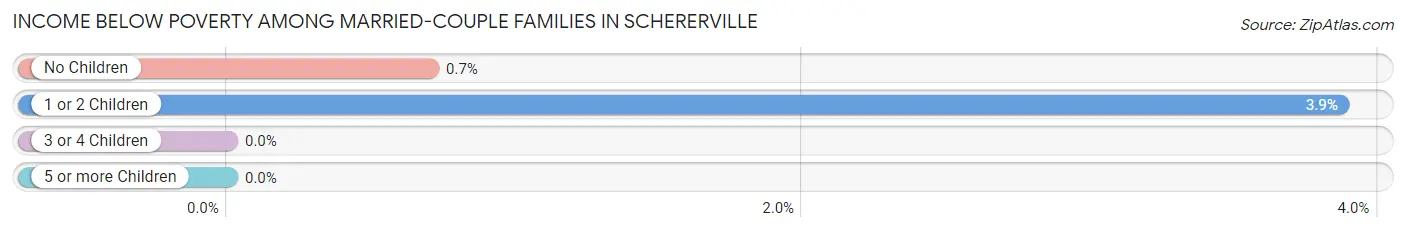
| Children | Above Poverty | Below Poverty |
| No Children | 3,387 (99.3%) | 24 (0.7%) |
| 1 or 2 Children | 2,163 (96.1%) | 87 (3.9%) |
| 3 or 4 Children | 236 (100.0%) | 0 (0.0%) |
| 5 or more Children | 26 (100.0%) | 0 (0.0%) |
| Total | 5,812 (98.1%) | 111 (1.9%) |
Income Below Poverty Among Single-Parent Households in Schererville
According to the poverty data in Schererville, 10.6% or 86 single-father households and 17.8% or 232 single-mother households are living below the poverty line. Among single-father households, those with 1 or 2 children have the highest poverty rate, with 62 households (17.2%) experiencing poverty. Likewise, among single-mother households, those with 3 or 4 children have the highest poverty rate, with 27 households (56.2%) falling below the poverty line.
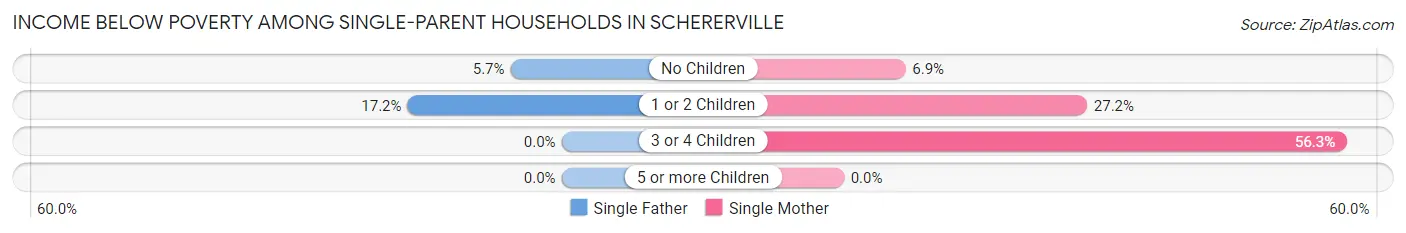
| Children | Single Father | Single Mother |
| No Children | 24 (5.7%) | 46 (6.9%) |
| 1 or 2 Children | 62 (17.2%) | 159 (27.2%) |
| 3 or 4 Children | 0 (0.0%) | 27 (56.2%) |
| 5 or more Children | 0 (0.0%) | 0 (0.0%) |
| Total | 86 (10.6%) | 232 (17.8%) |
Income Below Poverty Among Married-Couple vs Single-Parent Households in Schererville
The poverty data for Schererville shows that 111 of the married-couple family households (1.9%) and 318 of the single-parent households (15.0%) are living below the poverty level. Within the married-couple family households, those with 1 or 2 children have the highest poverty rate, with 87 households (3.9%) falling below the poverty line. Among the single-parent households, those with 3 or 4 children have the highest poverty rate, with 27 household (33.3%) living below poverty.
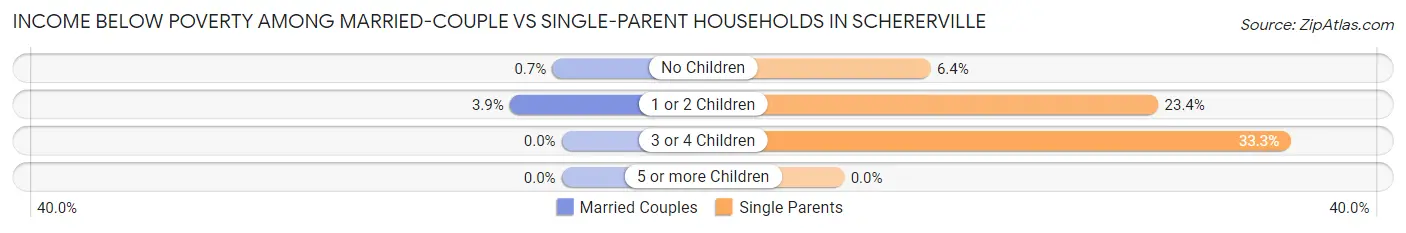
| Children | Married-Couple Families | Single-Parent Households |
| No Children | 24 (0.7%) | 70 (6.4%) |
| 1 or 2 Children | 87 (3.9%) | 221 (23.4%) |
| 3 or 4 Children | 0 (0.0%) | 27 (33.3%) |
| 5 or more Children | 0 (0.0%) | 0 (0.0%) |
| Total | 111 (1.9%) | 318 (15.0%) |
Race in Schererville
The most populous races in Schererville are White / Caucasian (22,750 | 76.9%), Hispanic or Latino (4,512 | 15.3%), and Two or more Races (2,814 | 9.5%).
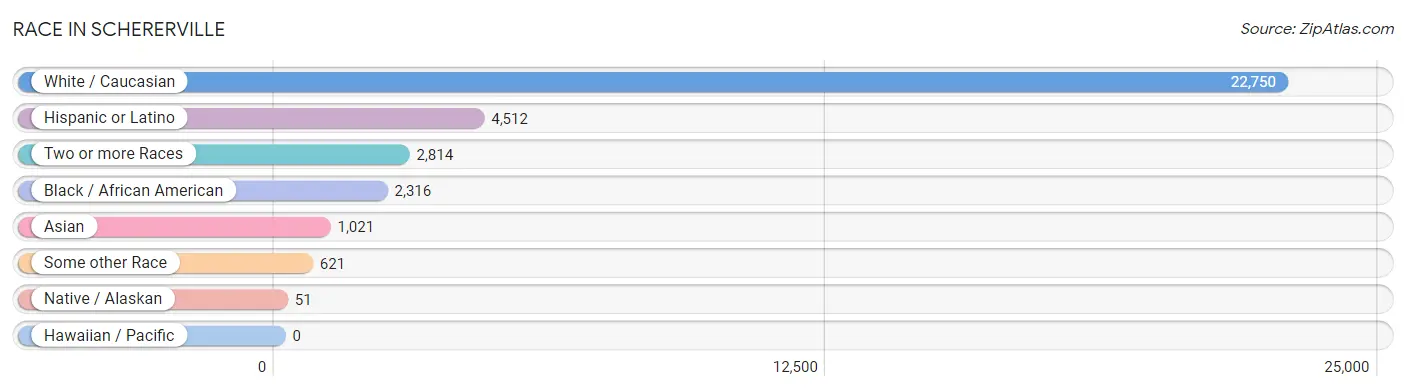
| Race | # Population | % Population |
| Asian | 1,021 | 3.5% |
| Black / African American | 2,316 | 7.8% |
| Hawaiian / Pacific | 0 | 0.0% |
| Hispanic or Latino | 4,512 | 15.3% |
| Native / Alaskan | 51 | 0.2% |
| White / Caucasian | 22,750 | 76.9% |
| Two or more Races | 2,814 | 9.5% |
| Some other Race | 621 | 2.1% |
| Total | 29,573 | 100.0% |
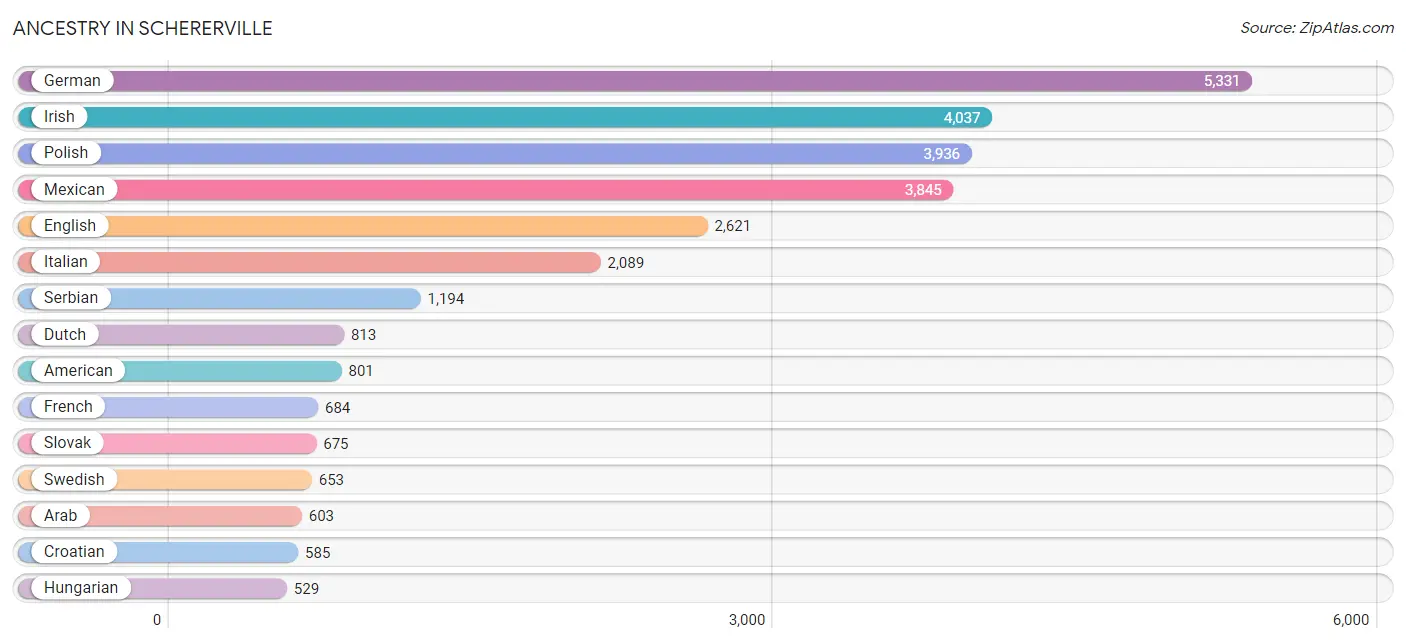
Ancestry in Schererville
The most populous ancestries reported in Schererville are German (5,331 | 18.0%), Irish (4,037 | 13.7%), Polish (3,936 | 13.3%), Mexican (3,845 | 13.0%), and English (2,621 | 8.9%), together accounting for 66.8% of all Schererville residents.
| Ancestry | # Population | % Population |
| African | 9 | 0.0% |
| Albanian | 14 | 0.1% |
| American | 801 | 2.7% |
| Arab | 603 | 2.0% |
| Assyrian / Chaldean / Syriac | 5 | 0.0% |
| Austrian | 17 | 0.1% |
| Blackfeet | 3 | 0.0% |
| British | 46 | 0.2% |
| Bulgarian | 13 | 0.0% |
| Burmese | 95 | 0.3% |
| Canadian | 17 | 0.1% |
| Cape Verdean | 70 | 0.2% |
| Central American | 25 | 0.1% |
| Central American Indian | 27 | 0.1% |
| Cherokee | 30 | 0.1% |
| Chilean | 27 | 0.1% |
| Chippewa | 21 | 0.1% |
| Croatian | 585 | 2.0% |
| Czech | 257 | 0.9% |
| Czechoslovakian | 46 | 0.2% |
| Danish | 141 | 0.5% |
| Dominican | 15 | 0.1% |
| Dutch | 813 | 2.8% |
| Eastern European | 106 | 0.4% |
| English | 2,621 | 8.9% |
| European | 244 | 0.8% |
| Finnish | 17 | 0.1% |
| French | 684 | 2.3% |
| French Canadian | 22 | 0.1% |
| German | 5,331 | 18.0% |
| Greek | 377 | 1.3% |
| Hungarian | 529 | 1.8% |
| Indian (Asian) | 91 | 0.3% |
| Iranian | 10 | 0.0% |
| Irish | 4,037 | 13.7% |
| Italian | 2,089 | 7.1% |
| Jamaican | 27 | 0.1% |
| Jordanian | 103 | 0.4% |
| Korean | 406 | 1.4% |
| Lithuanian | 269 | 0.9% |
| Luxembourger | 14 | 0.1% |
| Macedonian | 201 | 0.7% |
| Mexican | 3,845 | 13.0% |
| Navajo | 11 | 0.0% |
| Nicaraguan | 25 | 0.1% |
| Nigerian | 13 | 0.0% |
| Norwegian | 120 | 0.4% |
| Palestinian | 72 | 0.2% |
| Peruvian | 16 | 0.1% |
| Polish | 3,936 | 13.3% |
| Portuguese | 13 | 0.0% |
| Puerto Rican | 498 | 1.7% |
| Romanian | 84 | 0.3% |
| Russian | 246 | 0.8% |
| Scandinavian | 42 | 0.1% |
| Scotch-Irish | 104 | 0.4% |
| Scottish | 306 | 1.0% |
| Serbian | 1,194 | 4.0% |
| Slavic | 14 | 0.1% |
| Slovak | 675 | 2.3% |
| South African | 15 | 0.1% |
| South American | 43 | 0.2% |
| South American Indian | 27 | 0.1% |
| Spaniard | 70 | 0.2% |
| Spanish | 16 | 0.1% |
| Sri Lankan | 408 | 1.4% |
| Subsaharan African | 121 | 0.4% |
| Swedish | 653 | 2.2% |
| Swiss | 16 | 0.1% |
| Thai | 110 | 0.4% |
| Turkish | 167 | 0.6% |
| Ukrainian | 80 | 0.3% |
| Welsh | 69 | 0.2% |
| Yugoslavian | 133 | 0.4% | View All 74 Rows |
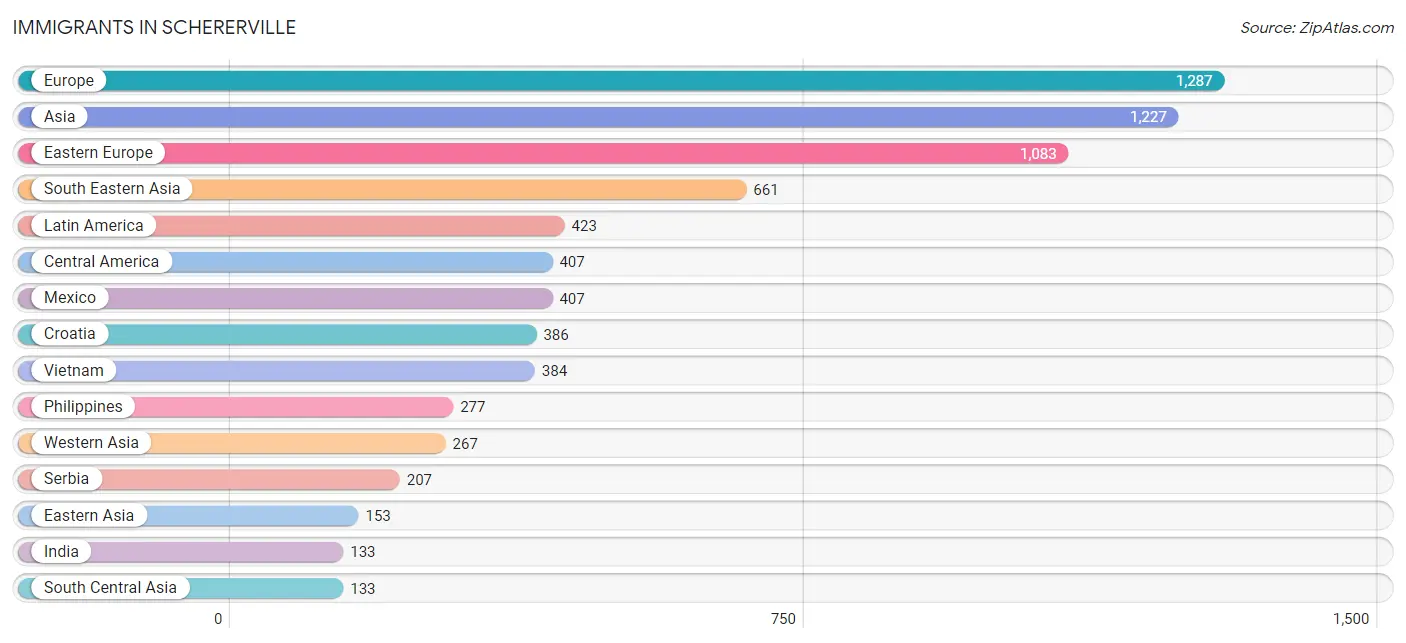
Immigrants in Schererville
The most numerous immigrant groups reported in Schererville came from Europe (1,287 | 4.3%), Asia (1,227 | 4.2%), Eastern Europe (1,083 | 3.7%), South Eastern Asia (661 | 2.2%), and Latin America (423 | 1.4%), together accounting for 15.8% of all Schererville residents.
| Immigration Origin | # Population | % Population |
| Africa | 6 | 0.0% |
| Albania | 14 | 0.1% |
| Asia | 1,227 | 4.2% |
| Bosnia and Herzegovina | 29 | 0.1% |
| Canada | 131 | 0.4% |
| Central America | 407 | 1.4% |
| China | 46 | 0.2% |
| Croatia | 386 | 1.3% |
| Czechoslovakia | 11 | 0.0% |
| Eastern Africa | 6 | 0.0% |
| Eastern Asia | 153 | 0.5% |
| Eastern Europe | 1,083 | 3.7% |
| Europe | 1,287 | 4.3% |
| Germany | 118 | 0.4% |
| Greece | 54 | 0.2% |
| India | 133 | 0.4% |
| Israel | 19 | 0.1% |
| Italy | 19 | 0.1% |
| Jordan | 58 | 0.2% |
| Korea | 107 | 0.4% |
| Kuwait | 71 | 0.2% |
| Latin America | 423 | 1.4% |
| Mexico | 407 | 1.4% |
| North Macedonia | 125 | 0.4% |
| Northern Europe | 13 | 0.0% |
| Peru | 16 | 0.1% |
| Philippines | 277 | 0.9% |
| Poland | 111 | 0.4% |
| Serbia | 207 | 0.7% |
| South America | 16 | 0.1% |
| South Central Asia | 133 | 0.4% |
| South Eastern Asia | 661 | 2.2% |
| Southern Europe | 73 | 0.3% |
| Syria | 99 | 0.3% |
| Taiwan | 7 | 0.0% |
| Turkey | 20 | 0.1% |
| Vietnam | 384 | 1.3% |
| Western Asia | 267 | 0.9% |
| Western Europe | 118 | 0.4% | View All 39 Rows |
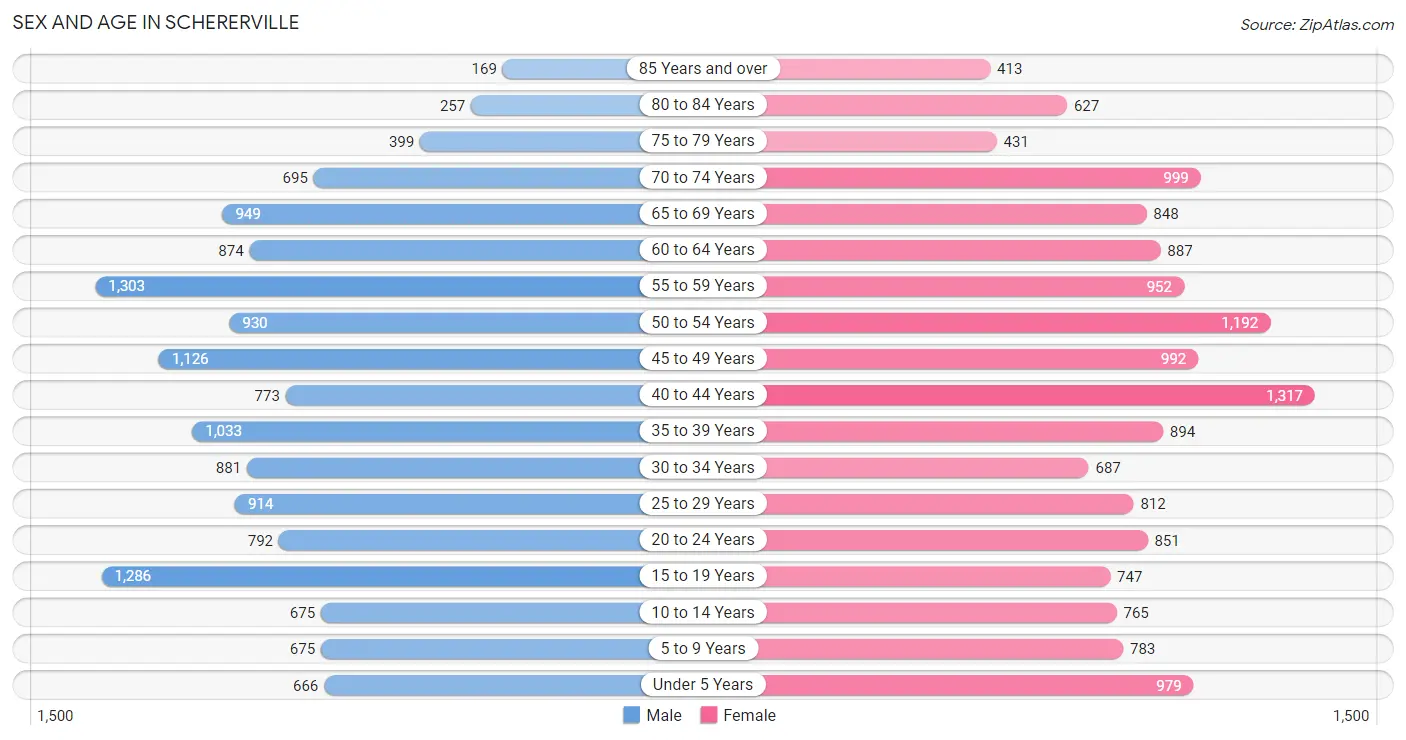
Sex and Age in Schererville
Sex and Age in Schererville
The most populous age groups in Schererville are 55 to 59 Years (1,303 | 9.0%) for men and 40 to 44 Years (1,317 | 8.7%) for women.
| Age Bracket | Male | Female |
| Under 5 Years | 666 (4.6%) | 979 (6.5%) |
| 5 to 9 Years | 675 (4.7%) | 783 (5.2%) |
| 10 to 14 Years | 675 (4.7%) | 765 (5.0%) |
| 15 to 19 Years | 1,286 (8.9%) | 747 (4.9%) |
| 20 to 24 Years | 792 (5.5%) | 851 (5.6%) |
| 25 to 29 Years | 914 (6.4%) | 812 (5.3%) |
| 30 to 34 Years | 881 (6.1%) | 687 (4.5%) |
| 35 to 39 Years | 1,033 (7.2%) | 894 (5.9%) |
| 40 to 44 Years | 773 (5.4%) | 1,317 (8.7%) |
| 45 to 49 Years | 1,126 (7.8%) | 992 (6.5%) |
| 50 to 54 Years | 930 (6.5%) | 1,192 (7.9%) |
| 55 to 59 Years | 1,303 (9.0%) | 952 (6.3%) |
| 60 to 64 Years | 874 (6.1%) | 887 (5.8%) |
| 65 to 69 Years | 949 (6.6%) | 848 (5.6%) |
| 70 to 74 Years | 695 (4.8%) | 999 (6.6%) |
| 75 to 79 Years | 399 (2.8%) | 431 (2.8%) |
| 80 to 84 Years | 257 (1.8%) | 627 (4.1%) |
| 85 Years and over | 169 (1.2%) | 413 (2.7%) |
| Total | 14,397 (100.0%) | 15,176 (100.0%) |
Families and Households in Schererville
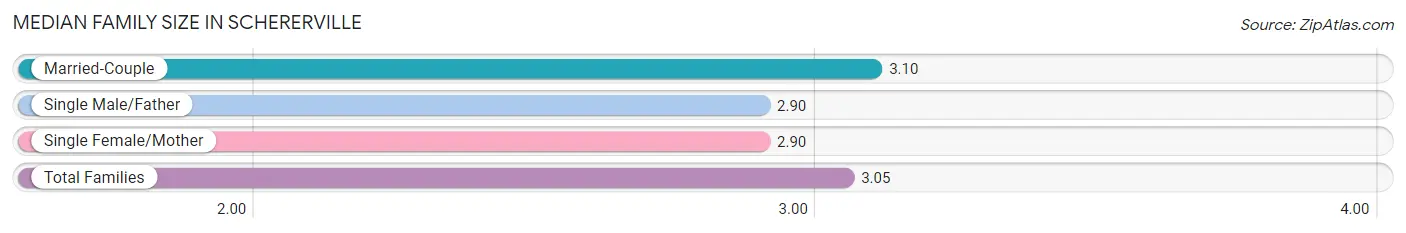
Median Family Size in Schererville
The median family size in Schererville is 3.05 persons per family, with married-couple families (5,923 | 73.7%) accounting for the largest median family size of 3.1 persons per family. On the other hand, single male/father families (813 | 10.1%) represent the smallest median family size with 2.90 persons per family.
| Family Type | # Families | Family Size |
| Married-Couple | 5,923 (73.7%) | 3.10 |
| Single Male/Father | 813 (10.1%) | 2.90 |
| Single Female/Mother | 1,301 (16.2%) | 2.90 |
| Total Families | 8,037 (100.0%) | 3.05 |
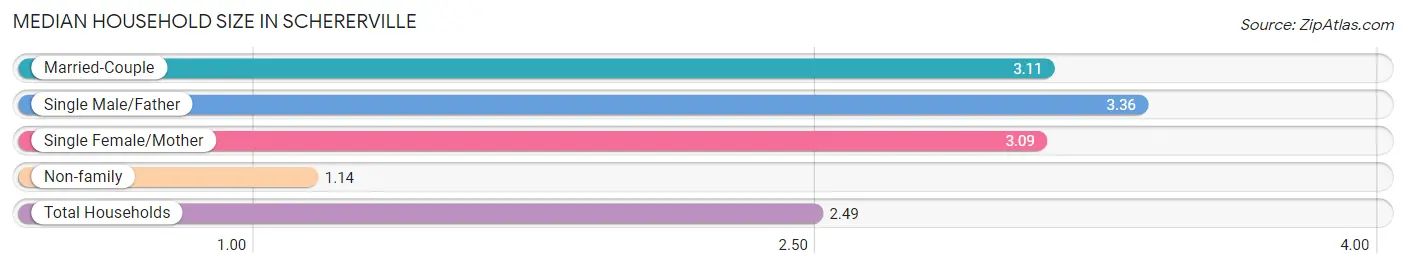
Median Household Size in Schererville
The median household size in Schererville is 2.49 persons per household, with single male/father households (813 | 6.9%) accounting for the largest median household size of 3.36 persons per household. non-family households (3,792 | 32.1%) represent the smallest median household size with 1.14 persons per household.
| Household Type | # Households | Household Size |
| Married-Couple | 5,923 (50.1%) | 3.11 |
| Single Male/Father | 813 (6.9%) | 3.36 |
| Single Female/Mother | 1,301 (11.0%) | 3.09 |
| Non-family | 3,792 (32.1%) | 1.14 |
| Total Households | 11,829 (100.0%) | 2.49 |
Household Size by Marriage Status in Schererville
Out of a total of 11,829 households in Schererville, 8,037 (67.9%) are family households, while 3,792 (32.1%) are nonfamily households. The most numerous type of family households are 2-person households, comprising 3,525, and the most common type of nonfamily households are 1-person households, comprising 3,388.
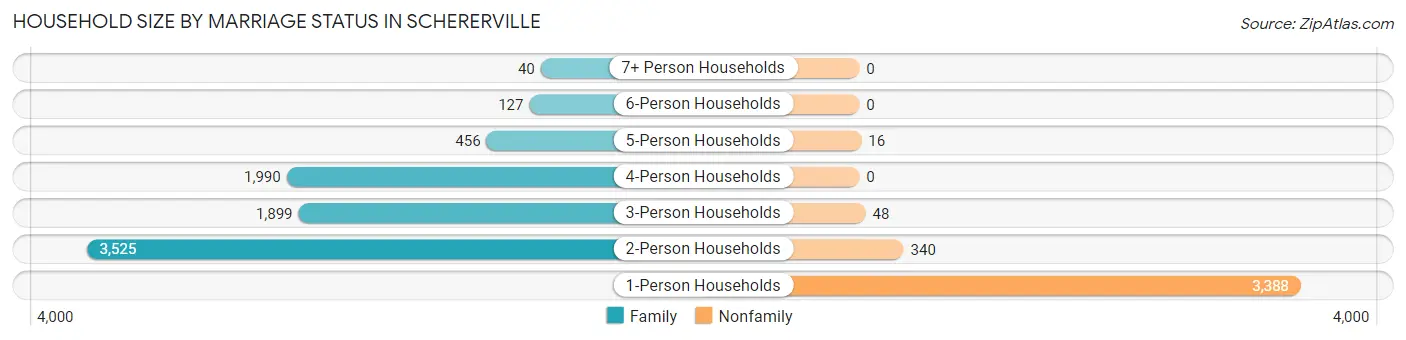
| Household Size | Family Households | Nonfamily Households |
| 1-Person Households | - | 3,388 (28.6%) |
| 2-Person Households | 3,525 (29.8%) | 340 (2.9%) |
| 3-Person Households | 1,899 (16.1%) | 48 (0.4%) |
| 4-Person Households | 1,990 (16.8%) | 0 (0.0%) |
| 5-Person Households | 456 (3.8%) | 16 (0.1%) |
| 6-Person Households | 127 (1.1%) | 0 (0.0%) |
| 7+ Person Households | 40 (0.3%) | 0 (0.0%) |
| Total | 8,037 (67.9%) | 3,792 (32.1%) |
Female Fertility in Schererville
Fertility by Age in Schererville
Average fertility rate in Schererville is 41.0 births per 1,000 women. Women in the age bracket of 20 to 34 years have the highest fertility rate with 89.0 births per 1,000 women. Women in the age bracket of 20 to 34 years acount for 78.0% of all women with births.
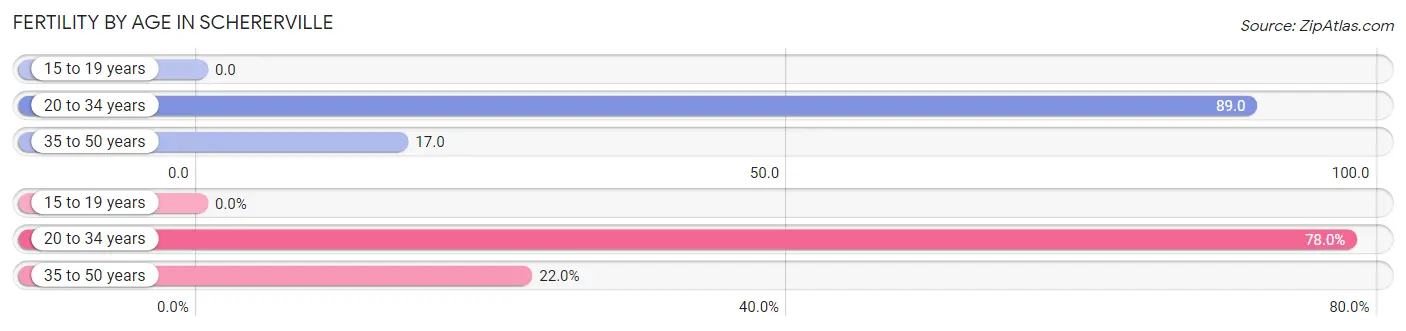
| Age Bracket | Women with Births | Births / 1,000 Women |
| 15 to 19 years | 0 (0.0%) | 0.0 |
| 20 to 34 years | 209 (78.0%) | 89.0 |
| 35 to 50 years | 59 (22.0%) | 17.0 |
| Total | 268 (100.0%) | 41.0 |
Fertility by Age by Marriage Status in Schererville
35.8% of women with births (268) in Schererville are married. The highest percentage of unmarried women with births falls into 20 to 34 years age bracket with 76.1% of them unmarried at the time of birth, while the lowest percentage of unmarried women with births belong to 35 to 50 years age bracket with 22.0% of them unmarried.
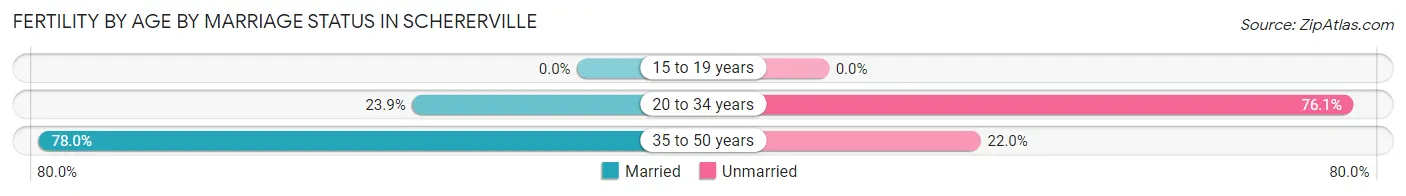
| Age Bracket | Married | Unmarried |
| 15 to 19 years | 0 (0.0%) | 0 (0.0%) |
| 20 to 34 years | 50 (23.9%) | 159 (76.1%) |
| 35 to 50 years | 46 (78.0%) | 13 (22.0%) |
| Total | 96 (35.8%) | 172 (64.2%) |
Fertility by Education in Schererville
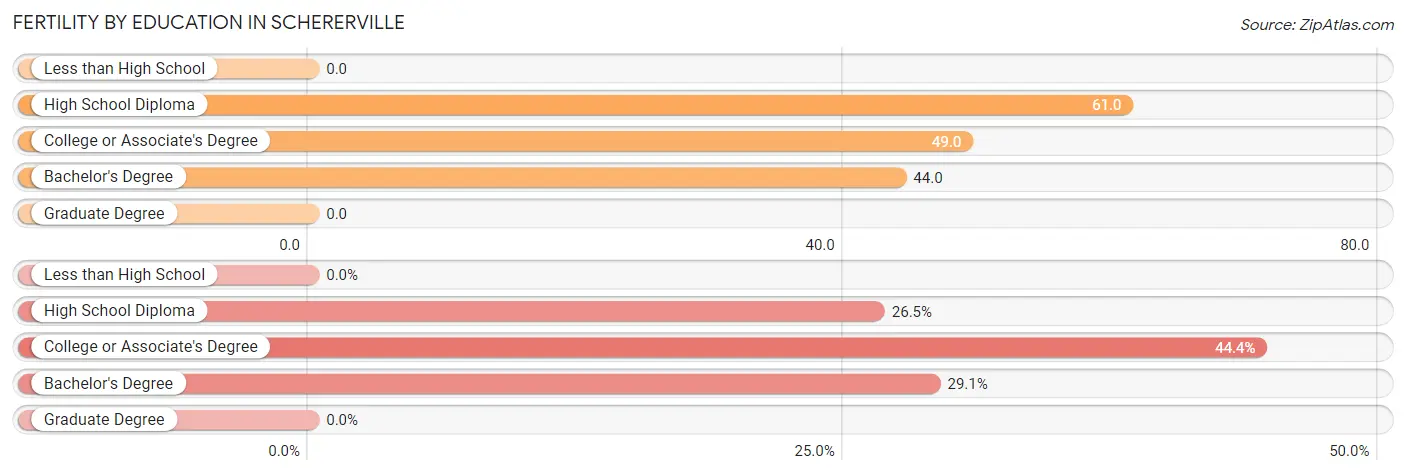
| Educational Attainment | Women with Births | Births / 1,000 Women |
| Less than High School | 0 (0.0%) | 0.0 |
| High School Diploma | 71 (26.5%) | 61.0 |
| College or Associate's Degree | 119 (44.4%) | 49.0 |
| Bachelor's Degree | 78 (29.1%) | 44.0 |
| Graduate Degree | 0 (0.0%) | 0.0 |
| Total | 268 (100.0%) | 41.0 |
Fertility by Education by Marriage Status in Schererville
64.2% of women with births in Schererville are unmarried. Women with the educational attainment of bachelor's degree are most likely to be married with 83.3% of them married at childbirth, while women with the educational attainment of college or associate's degree are least likely to be married with 89.1% of them unmarried at childbirth.
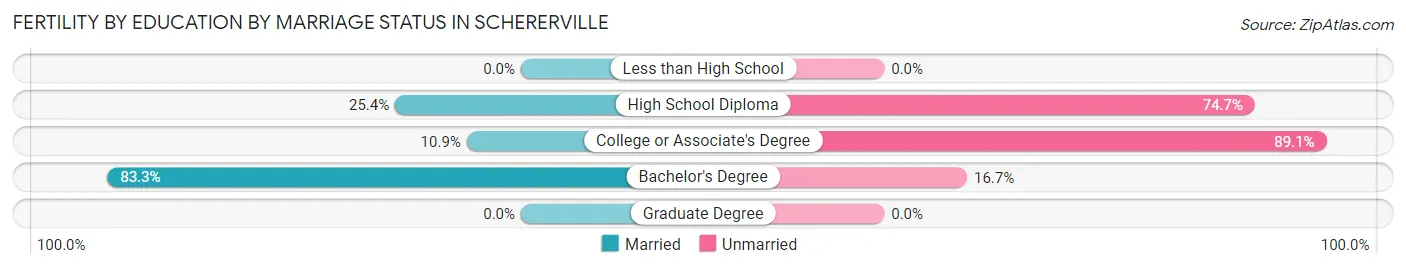
| Educational Attainment | Married | Unmarried |
| Less than High School | 0 (0.0%) | 0 (0.0%) |
| High School Diploma | 18 (25.4%) | 53 (74.7%) |
| College or Associate's Degree | 13 (10.9%) | 106 (89.1%) |
| Bachelor's Degree | 65 (83.3%) | 13 (16.7%) |
| Graduate Degree | 0 (0.0%) | 0 (0.0%) |
| Total | 96 (35.8%) | 172 (64.2%) |
Employment Characteristics in Schererville
Employment by Class of Employer in Schererville
Among the 14,838 employed individuals in Schererville, private company employees (10,488 | 70.7%), not-for-profit organizations (1,303 | 8.8%), and local government employees (1,277 | 8.6%) make up the most common classes of employment.
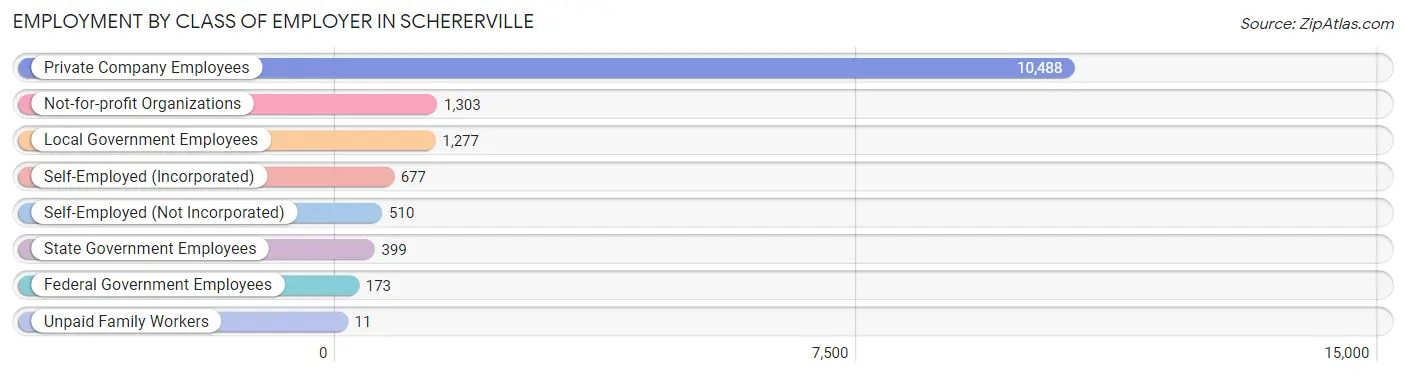
| Employer Class | # Employees | % Employees |
| Private Company Employees | 10,488 | 70.7% |
| Self-Employed (Incorporated) | 677 | 4.6% |
| Self-Employed (Not Incorporated) | 510 | 3.4% |
| Not-for-profit Organizations | 1,303 | 8.8% |
| Local Government Employees | 1,277 | 8.6% |
| State Government Employees | 399 | 2.7% |
| Federal Government Employees | 173 | 1.2% |
| Unpaid Family Workers | 11 | 0.1% |
| Total | 14,838 | 100.0% |
Employment Status by Age in Schererville
According to the labor force statistics for Schererville, out of the total population over 16 years of age (24,406), 65.1% or 15,888 individuals are in the labor force, with 4.5% or 715 of them unemployed. The age group with the highest labor force participation rate is 20 to 24 years, with 91.2% or 1,498 individuals in the labor force. Within the labor force, the 20 to 24 years age range has the highest percentage of unemployed individuals, with 16.1% or 241 of them being unemployed.
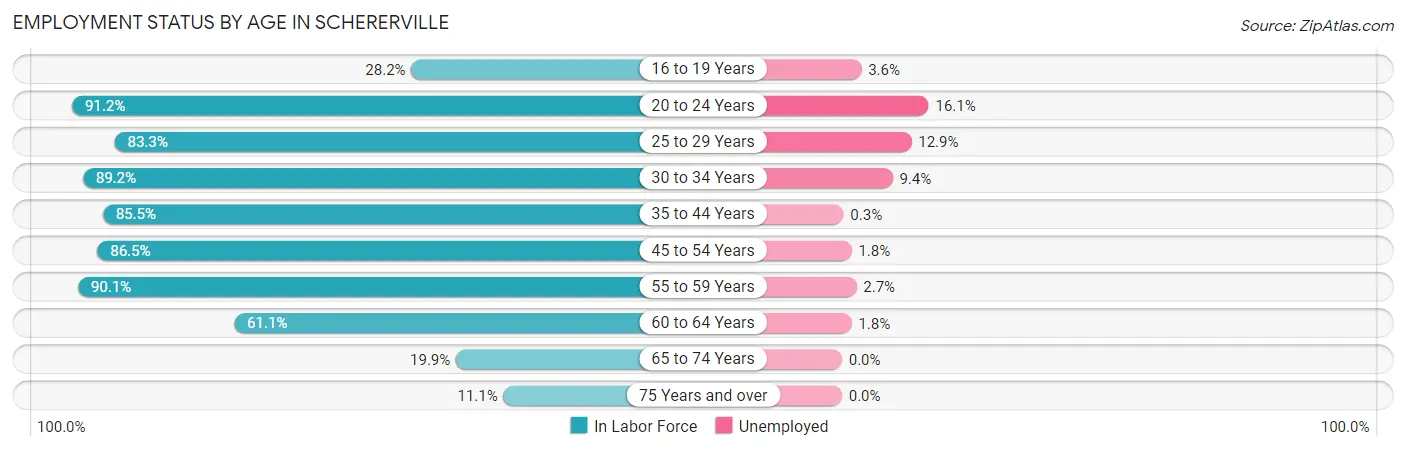
| Age Bracket | In Labor Force | Unemployed |
| 16 to 19 Years | 397 (28.2%) | 14 (3.6%) |
| 20 to 24 Years | 1,498 (91.2%) | 241 (16.1%) |
| 25 to 29 Years | 1,438 (83.3%) | 186 (12.9%) |
| 30 to 34 Years | 1,399 (89.2%) | 132 (9.4%) |
| 35 to 44 Years | 3,435 (85.5%) | 10 (0.3%) |
| 45 to 54 Years | 3,668 (86.5%) | 66 (1.8%) |
| 55 to 59 Years | 2,032 (90.1%) | 55 (2.7%) |
| 60 to 64 Years | 1,076 (61.1%) | 19 (1.8%) |
| 65 to 74 Years | 695 (19.9%) | 0 (0.0%) |
| 75 Years and over | 255 (11.1%) | 0 (0.0%) |
| Total | 15,888 (65.1%) | 715 (4.5%) |
Employment Status by Educational Attainment in Schererville
According to labor force statistics for Schererville, 83.8% of individuals (13,045) out of the total population between 25 and 64 years of age (15,567) are in the labor force, with 3.5% or 457 of them being unemployed. The group with the highest labor force participation rate are those with the educational attainment of bachelor's degree or higher, with 91.1% or 5,377 individuals in the labor force. Within the labor force, individuals with college / associate degree education have the highest percentage of unemployment, with 5.5% or 265 of them being unemployed.
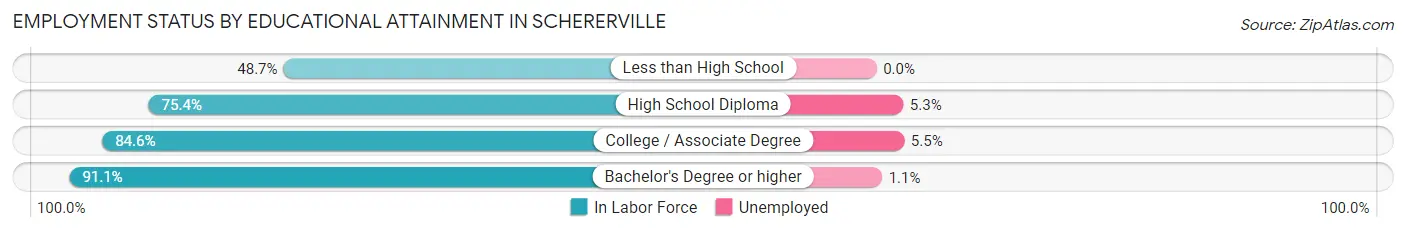
| Educational Attainment | In Labor Force | Unemployed |
| Less than High School | 259 (48.7%) | 0 (0.0%) |
| High School Diploma | 2,590 (75.4%) | 182 (5.3%) |
| College / Associate Degree | 4,821 (84.6%) | 313 (5.5%) |
| Bachelor's Degree or higher | 5,377 (91.1%) | 65 (1.1%) |
| Total | 13,045 (83.8%) | 545 (3.5%) |
Employment Occupations by Sex in Schererville
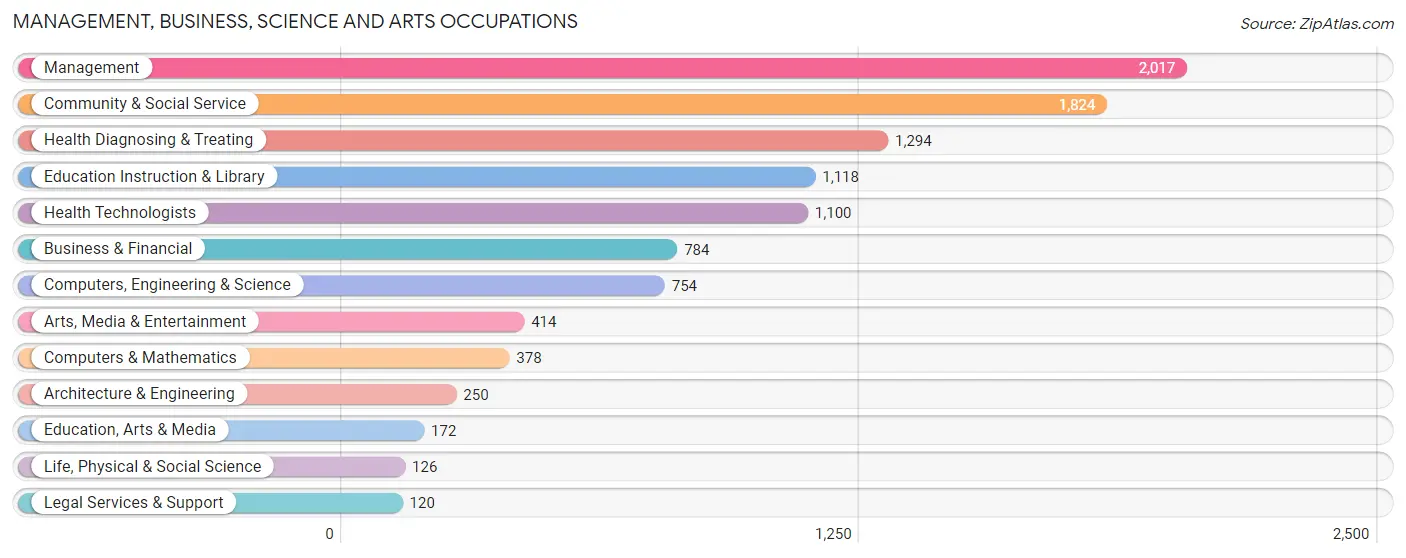
Management, Business, Science and Arts Occupations
The most common Management, Business, Science and Arts occupations in Schererville are Management (2,017 | 13.3%), Community & Social Service (1,824 | 12.0%), Health Diagnosing & Treating (1,294 | 8.5%), Education Instruction & Library (1,118 | 7.4%), and Health Technologists (1,100 | 7.3%).
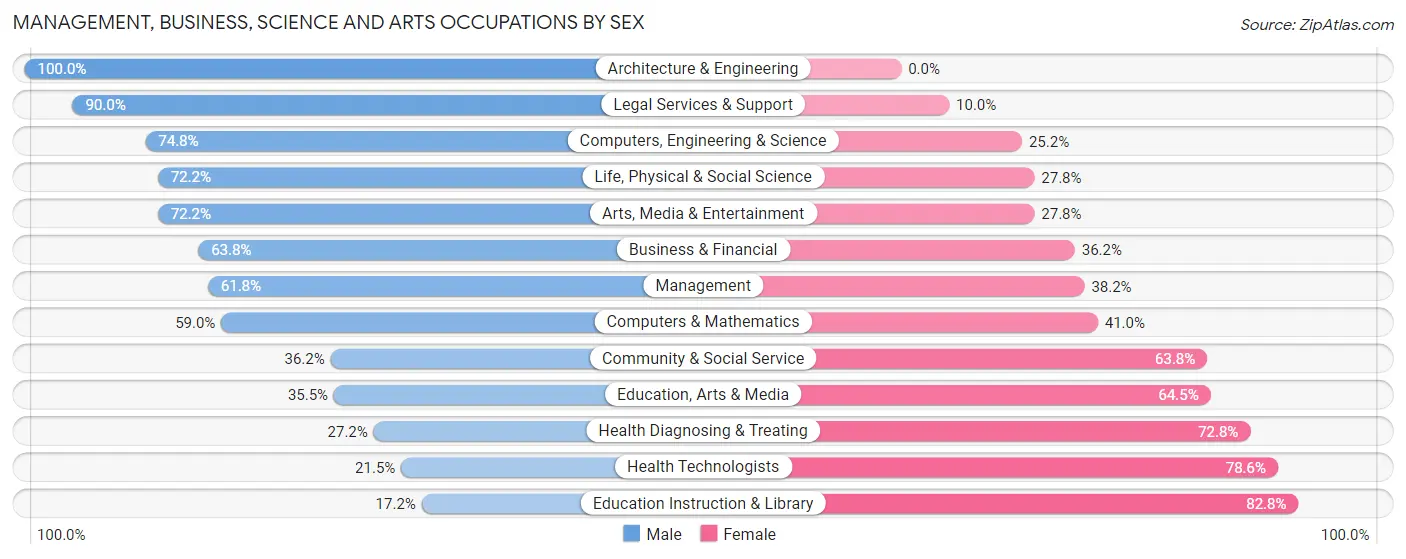
Management, Business, Science and Arts Occupations by Sex
Within the Management, Business, Science and Arts occupations in Schererville, the most male-oriented occupations are Architecture & Engineering (100.0%), Legal Services & Support (90.0%), and Computers, Engineering & Science (74.8%), while the most female-oriented occupations are Education Instruction & Library (82.8%), Health Technologists (78.5%), and Health Diagnosing & Treating (72.8%).
| Occupation | Male | Female |
| Management | 1,246 (61.8%) | 771 (38.2%) |
| Business & Financial | 500 (63.8%) | 284 (36.2%) |
| Computers, Engineering & Science | 564 (74.8%) | 190 (25.2%) |
| Computers & Mathematics | 223 (59.0%) | 155 (41.0%) |
| Architecture & Engineering | 250 (100.0%) | 0 (0.0%) |
| Life, Physical & Social Science | 91 (72.2%) | 35 (27.8%) |
| Community & Social Service | 660 (36.2%) | 1,164 (63.8%) |
| Education, Arts & Media | 61 (35.5%) | 111 (64.5%) |
| Legal Services & Support | 108 (90.0%) | 12 (10.0%) |
| Education Instruction & Library | 192 (17.2%) | 926 (82.8%) |
| Arts, Media & Entertainment | 299 (72.2%) | 115 (27.8%) |
| Health Diagnosing & Treating | 352 (27.2%) | 942 (72.8%) |
| Health Technologists | 236 (21.4%) | 864 (78.5%) |
| Total (Category) | 3,322 (49.8%) | 3,351 (50.2%) |
| Total (Overall) | 7,944 (52.4%) | 7,215 (47.6%) |
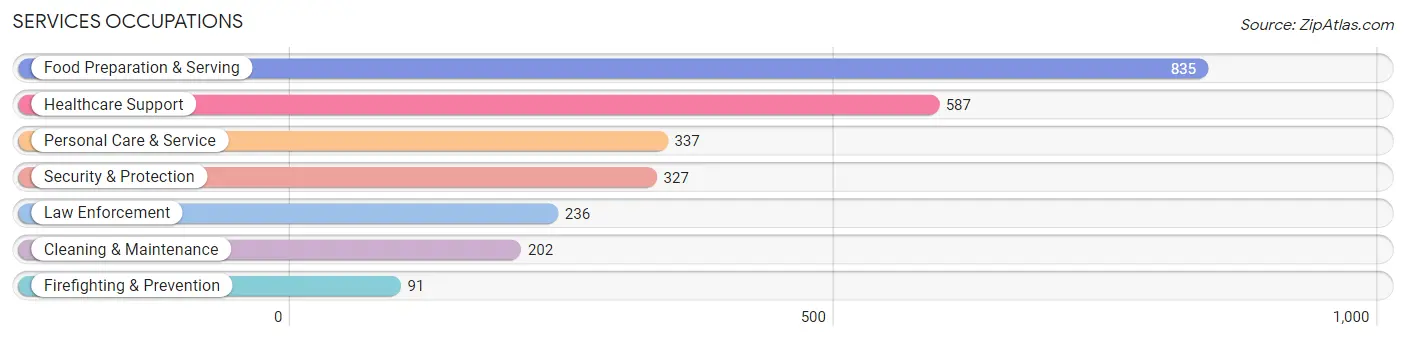
Services Occupations
The most common Services occupations in Schererville are Food Preparation & Serving (835 | 5.5%), Healthcare Support (587 | 3.9%), Personal Care & Service (337 | 2.2%), Security & Protection (327 | 2.2%), and Law Enforcement (236 | 1.6%).
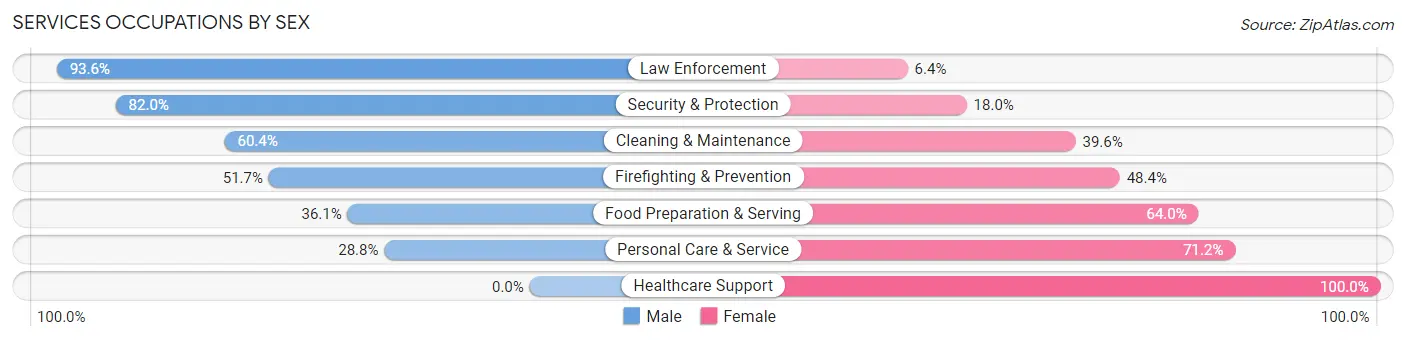
Services Occupations by Sex
Within the Services occupations in Schererville, the most male-oriented occupations are Law Enforcement (93.6%), Security & Protection (82.0%), and Cleaning & Maintenance (60.4%), while the most female-oriented occupations are Healthcare Support (100.0%), Personal Care & Service (71.2%), and Food Preparation & Serving (63.9%).
| Occupation | Male | Female |
| Healthcare Support | 0 (0.0%) | 587 (100.0%) |
| Security & Protection | 268 (82.0%) | 59 (18.0%) |
| Firefighting & Prevention | 47 (51.6%) | 44 (48.3%) |
| Law Enforcement | 221 (93.6%) | 15 (6.4%) |
| Food Preparation & Serving | 301 (36.0%) | 534 (63.9%) |
| Cleaning & Maintenance | 122 (60.4%) | 80 (39.6%) |
| Personal Care & Service | 97 (28.8%) | 240 (71.2%) |
| Total (Category) | 788 (34.4%) | 1,500 (65.6%) |
| Total (Overall) | 7,944 (52.4%) | 7,215 (47.6%) |
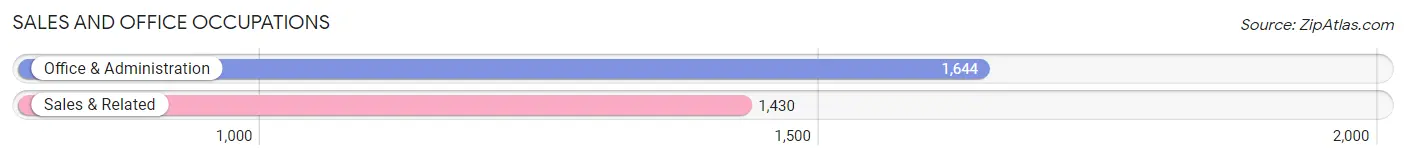
Sales and Office Occupations
The most common Sales and Office occupations in Schererville are Office & Administration (1,644 | 10.8%), and Sales & Related (1,430 | 9.4%).
Sales and Office Occupations by Sex
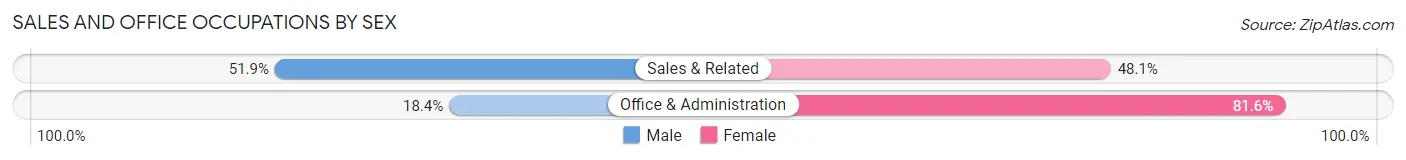
| Occupation | Male | Female |
| Sales & Related | 742 (51.9%) | 688 (48.1%) |
| Office & Administration | 302 (18.4%) | 1,342 (81.6%) |
| Total (Category) | 1,044 (34.0%) | 2,030 (66.0%) |
| Total (Overall) | 7,944 (52.4%) | 7,215 (47.6%) |
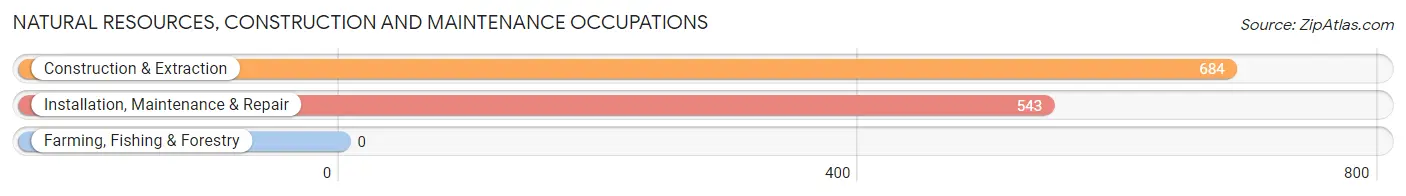
Natural Resources, Construction and Maintenance Occupations
The most common Natural Resources, Construction and Maintenance occupations in Schererville are Construction & Extraction (684 | 4.5%), and Installation, Maintenance & Repair (543 | 3.6%).
Natural Resources, Construction and Maintenance Occupations by Sex
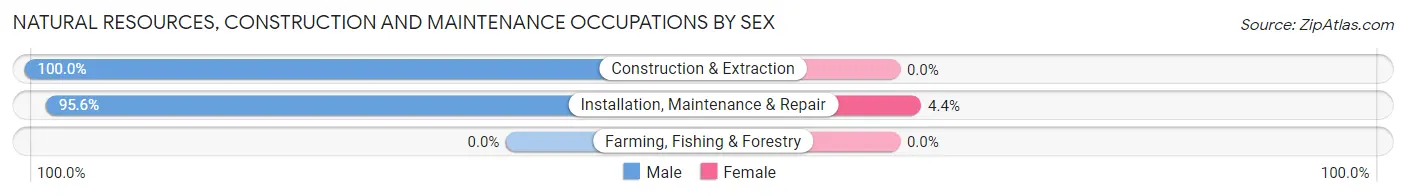
| Occupation | Male | Female |
| Farming, Fishing & Forestry | 0 (0.0%) | 0 (0.0%) |
| Construction & Extraction | 684 (100.0%) | 0 (0.0%) |
| Installation, Maintenance & Repair | 519 (95.6%) | 24 (4.4%) |
| Total (Category) | 1,203 (98.0%) | 24 (2.0%) |
| Total (Overall) | 7,944 (52.4%) | 7,215 (47.6%) |
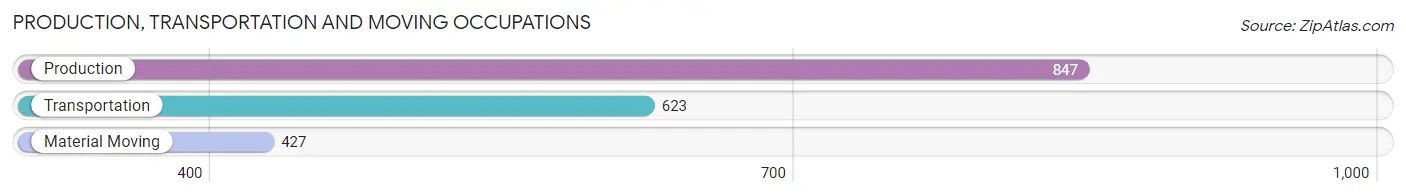
Production, Transportation and Moving Occupations
The most common Production, Transportation and Moving occupations in Schererville are Production (847 | 5.6%), Transportation (623 | 4.1%), and Material Moving (427 | 2.8%).
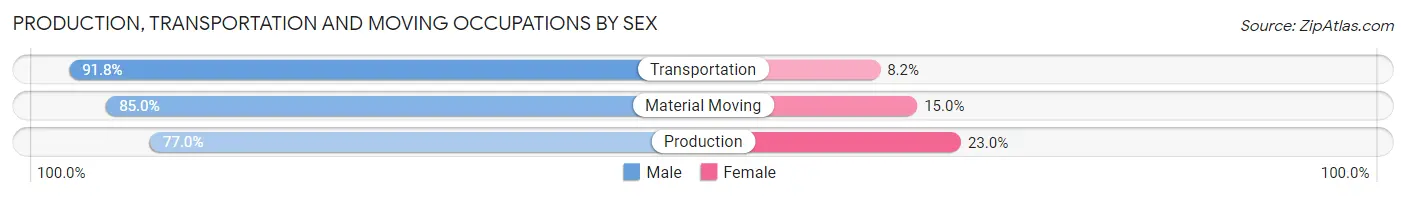
Production, Transportation and Moving Occupations by Sex
| Occupation | Male | Female |
| Production | 652 (77.0%) | 195 (23.0%) |
| Transportation | 572 (91.8%) | 51 (8.2%) |
| Material Moving | 363 (85.0%) | 64 (15.0%) |
| Total (Category) | 1,587 (83.7%) | 310 (16.3%) |
| Total (Overall) | 7,944 (52.4%) | 7,215 (47.6%) |
Employment Industries by Sex in Schererville
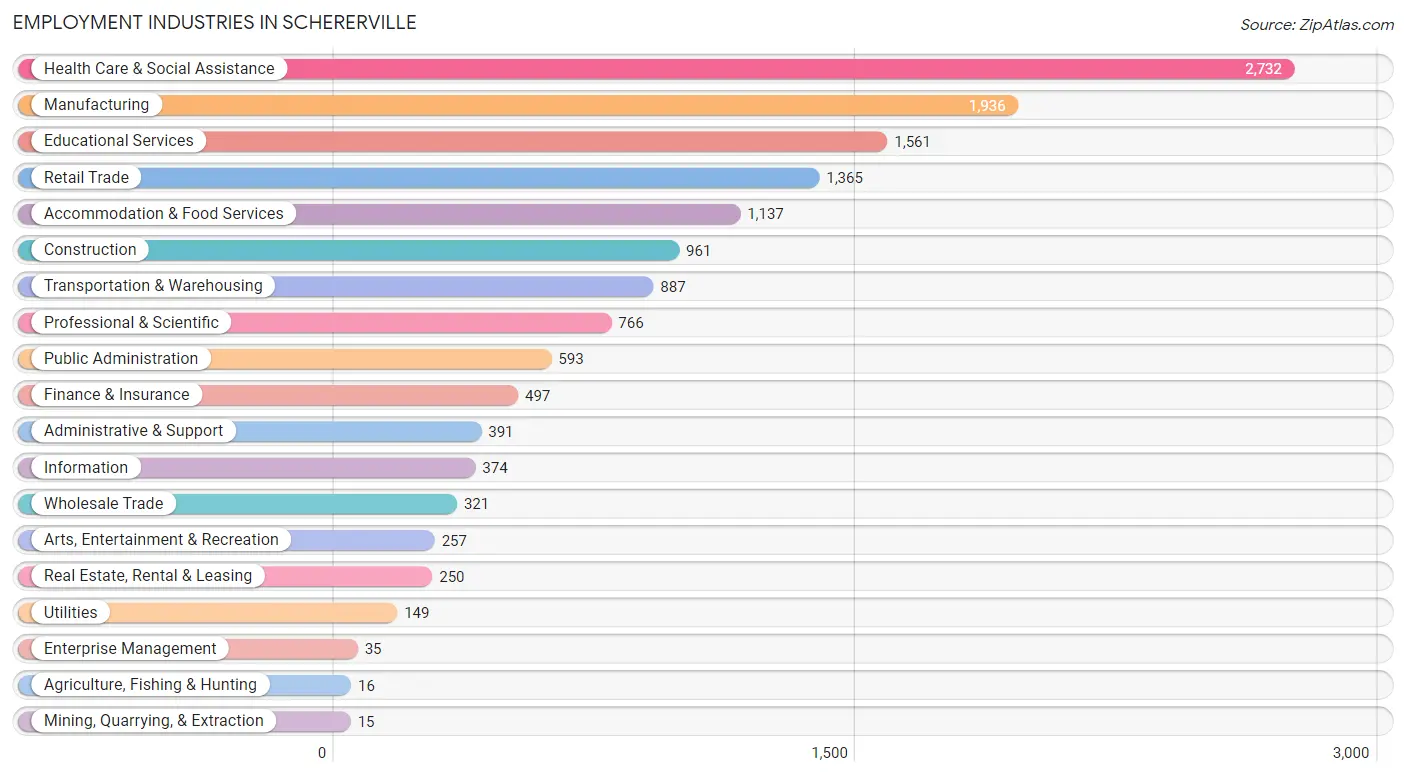
Employment Industries in Schererville
The major employment industries in Schererville include Health Care & Social Assistance (2,732 | 18.0%), Manufacturing (1,936 | 12.8%), Educational Services (1,561 | 10.3%), Retail Trade (1,365 | 9.0%), and Accommodation & Food Services (1,137 | 7.5%).
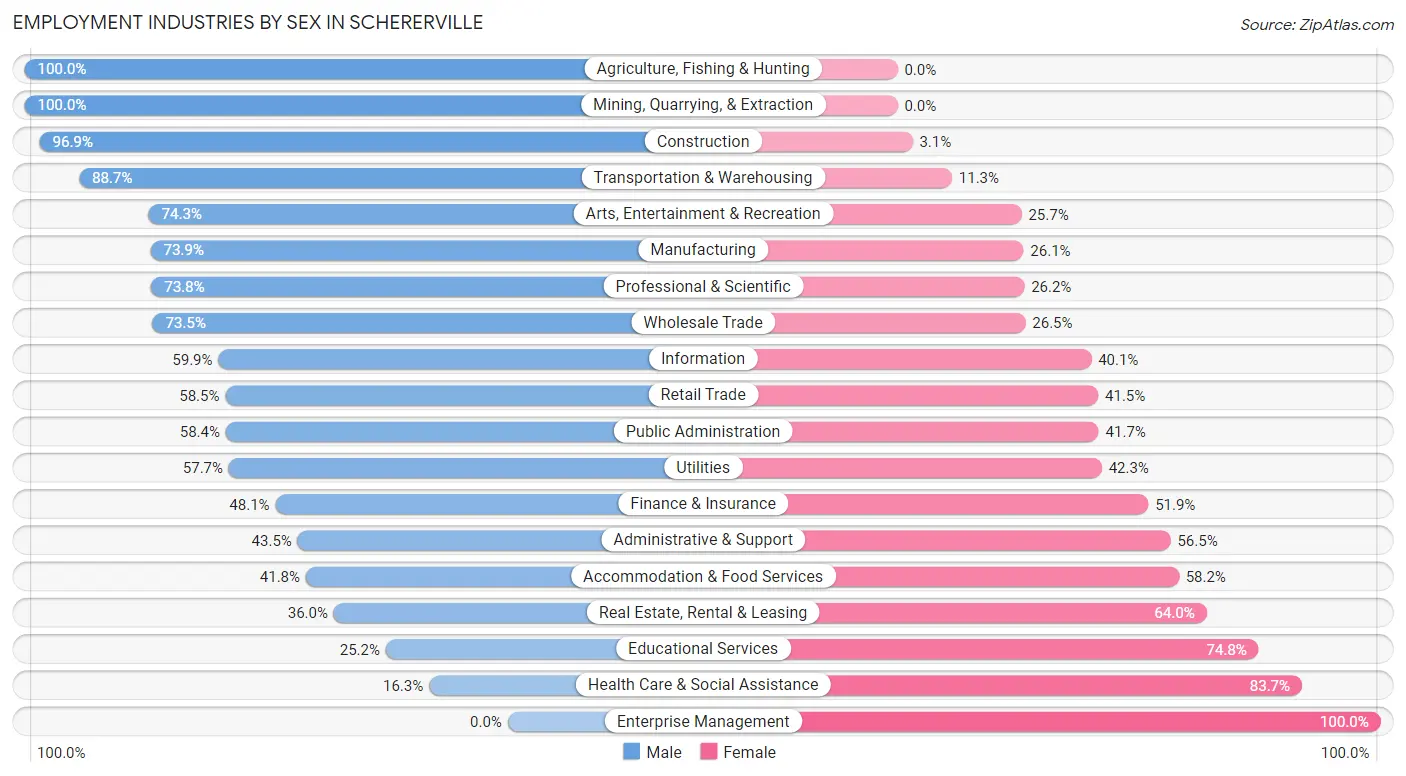
Employment Industries by Sex in Schererville
The Schererville industries that see more men than women are Agriculture, Fishing & Hunting (100.0%), Mining, Quarrying, & Extraction (100.0%), and Construction (96.9%), whereas the industries that tend to have a higher number of women are Enterprise Management (100.0%), Health Care & Social Assistance (83.7%), and Educational Services (74.8%).
| Industry | Male | Female |
| Agriculture, Fishing & Hunting | 16 (100.0%) | 0 (0.0%) |
| Mining, Quarrying, & Extraction | 15 (100.0%) | 0 (0.0%) |
| Construction | 931 (96.9%) | 30 (3.1%) |
| Manufacturing | 1,431 (73.9%) | 505 (26.1%) |
| Wholesale Trade | 236 (73.5%) | 85 (26.5%) |
| Retail Trade | 798 (58.5%) | 567 (41.5%) |
| Transportation & Warehousing | 787 (88.7%) | 100 (11.3%) |
| Utilities | 86 (57.7%) | 63 (42.3%) |
| Information | 224 (59.9%) | 150 (40.1%) |
| Finance & Insurance | 239 (48.1%) | 258 (51.9%) |
| Real Estate, Rental & Leasing | 90 (36.0%) | 160 (64.0%) |
| Professional & Scientific | 565 (73.8%) | 201 (26.2%) |
| Enterprise Management | 0 (0.0%) | 35 (100.0%) |
| Administrative & Support | 170 (43.5%) | 221 (56.5%) |
| Educational Services | 394 (25.2%) | 1,167 (74.8%) |
| Health Care & Social Assistance | 445 (16.3%) | 2,287 (83.7%) |
| Arts, Entertainment & Recreation | 191 (74.3%) | 66 (25.7%) |
| Accommodation & Food Services | 475 (41.8%) | 662 (58.2%) |
| Public Administration | 346 (58.4%) | 247 (41.6%) |
| Total | 7,944 (52.4%) | 7,215 (47.6%) |
Education in Schererville
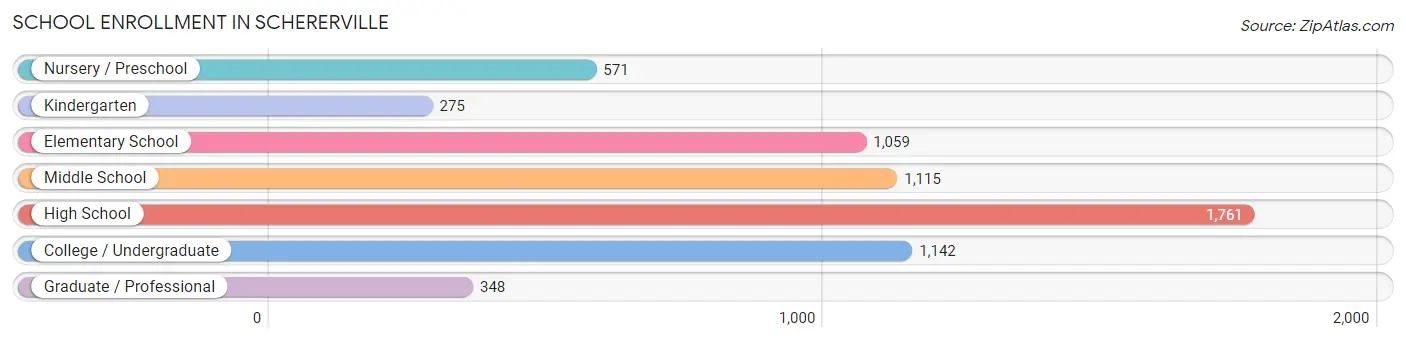
School Enrollment in Schererville
The most common levels of schooling among the 6,271 students in Schererville are high school (1,761 | 28.1%), college / undergraduate (1,142 | 18.2%), and middle school (1,115 | 17.8%).
| School Level | # Students | % Students |
| Nursery / Preschool | 571 | 9.1% |
| Kindergarten | 275 | 4.4% |
| Elementary School | 1,059 | 16.9% |
| Middle School | 1,115 | 17.8% |
| High School | 1,761 | 28.1% |
| College / Undergraduate | 1,142 | 18.2% |
| Graduate / Professional | 348 | 5.6% |
| Total | 6,271 | 100.0% |
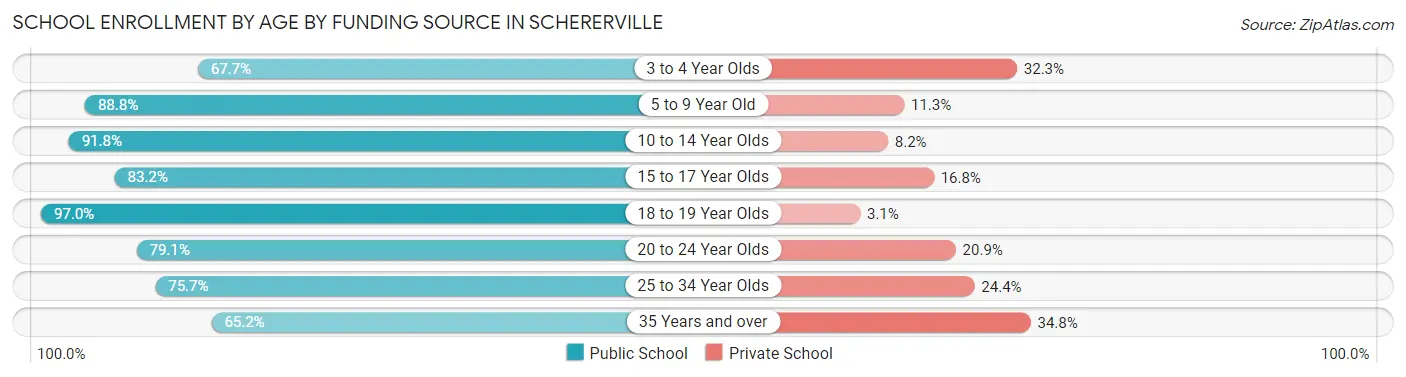
School Enrollment by Age by Funding Source in Schererville
Out of a total of 6,271 students who are enrolled in schools in Schererville, 978 (15.6%) attend a private institution, while the remaining 5,293 (84.4%) are enrolled in public schools. The age group of 35 years and over has the highest likelihood of being enrolled in private schools, with 94 (34.8% in the age bracket) enrolled. Conversely, the age group of 18 to 19 year olds has the lowest likelihood of being enrolled in a private school, with 382 (97.0% in the age bracket) attending a public institution.
| Age Bracket | Public School | Private School |
| 3 to 4 Year Olds | 273 (67.7%) | 130 (32.3%) |
| 5 to 9 Year Old | 1,128 (88.7%) | 143 (11.3%) |
| 10 to 14 Year Olds | 1,293 (91.8%) | 116 (8.2%) |
| 15 to 17 Year Olds | 1,251 (83.2%) | 252 (16.8%) |
| 18 to 19 Year Olds | 382 (97.0%) | 12 (3.0%) |
| 20 to 24 Year Olds | 444 (79.1%) | 117 (20.9%) |
| 25 to 34 Year Olds | 348 (75.6%) | 112 (24.3%) |
| 35 Years and over | 176 (65.2%) | 94 (34.8%) |
| Total | 5,293 (84.4%) | 978 (15.6%) |
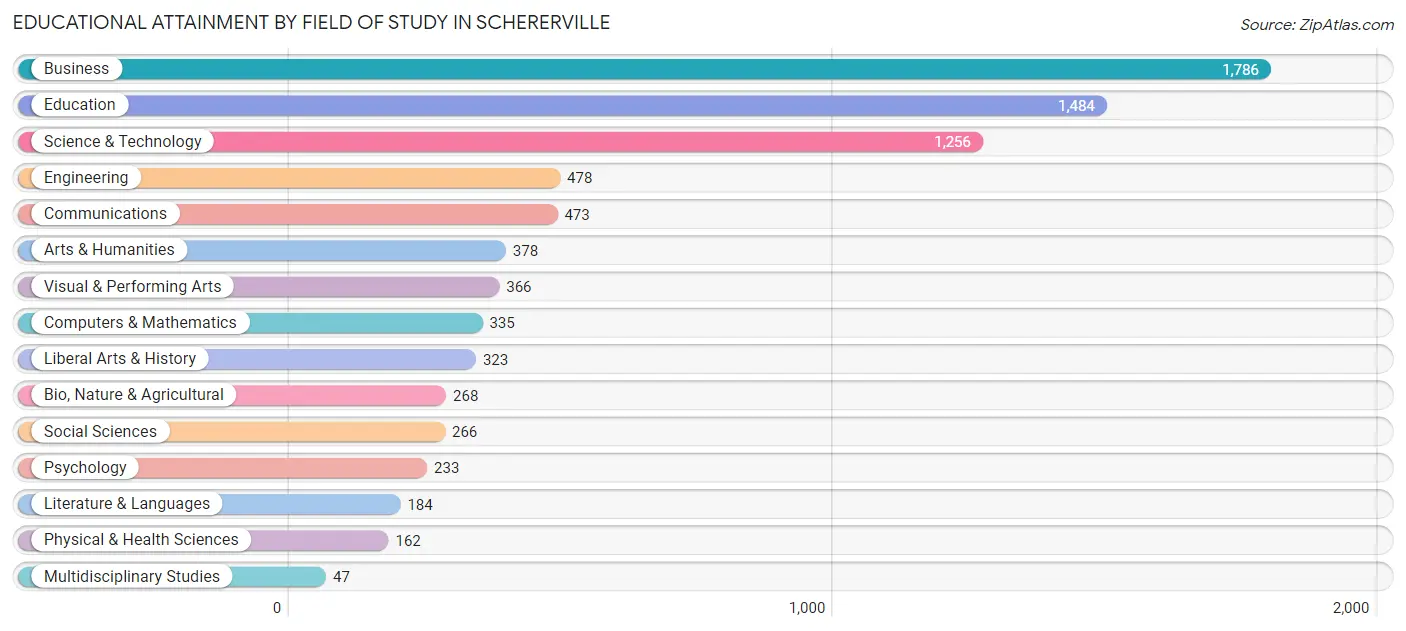
Educational Attainment by Field of Study in Schererville
Business (1,786 | 22.2%), education (1,484 | 18.5%), science & technology (1,256 | 15.6%), engineering (478 | 5.9%), and communications (473 | 5.9%) are the most common fields of study among 8,039 individuals in Schererville who have obtained a bachelor's degree or higher.
| Field of Study | # Graduates | % Graduates |
| Computers & Mathematics | 335 | 4.2% |
| Bio, Nature & Agricultural | 268 | 3.3% |
| Physical & Health Sciences | 162 | 2.0% |
| Psychology | 233 | 2.9% |
| Social Sciences | 266 | 3.3% |
| Engineering | 478 | 5.9% |
| Multidisciplinary Studies | 47 | 0.6% |
| Science & Technology | 1,256 | 15.6% |
| Business | 1,786 | 22.2% |
| Education | 1,484 | 18.5% |
| Literature & Languages | 184 | 2.3% |
| Liberal Arts & History | 323 | 4.0% |
| Visual & Performing Arts | 366 | 4.5% |
| Communications | 473 | 5.9% |
| Arts & Humanities | 378 | 4.7% |
| Total | 8,039 | 100.0% |
Transportation & Commute in Schererville
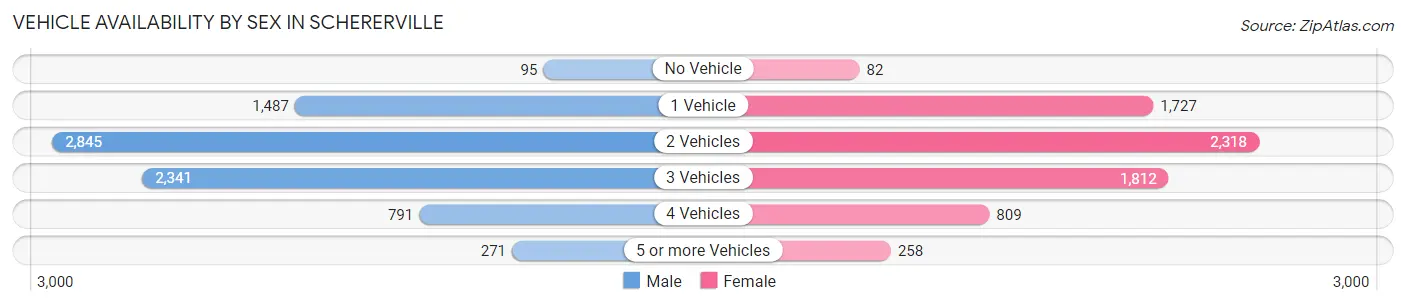
Vehicle Availability by Sex in Schererville
The most prevalent vehicle ownership categories in Schererville are males with 2 vehicles (2,845, accounting for 36.3%) and females with 2 vehicles (2,318, making up 40.6%).
| Vehicles Available | Male | Female |
| No Vehicle | 95 (1.2%) | 82 (1.2%) |
| 1 Vehicle | 1,487 (19.0%) | 1,727 (24.6%) |
| 2 Vehicles | 2,845 (36.3%) | 2,318 (33.1%) |
| 3 Vehicles | 2,341 (29.9%) | 1,812 (25.9%) |
| 4 Vehicles | 791 (10.1%) | 809 (11.6%) |
| 5 or more Vehicles | 271 (3.5%) | 258 (3.7%) |
| Total | 7,830 (100.0%) | 7,006 (100.0%) |
Commute Time in Schererville
The most frequently occuring commute durations in Schererville are 20 to 24 minutes (2,279 commuters, 16.7%), 15 to 19 minutes (1,666 commuters, 12.2%), and 30 to 34 minutes (1,661 commuters, 12.2%).
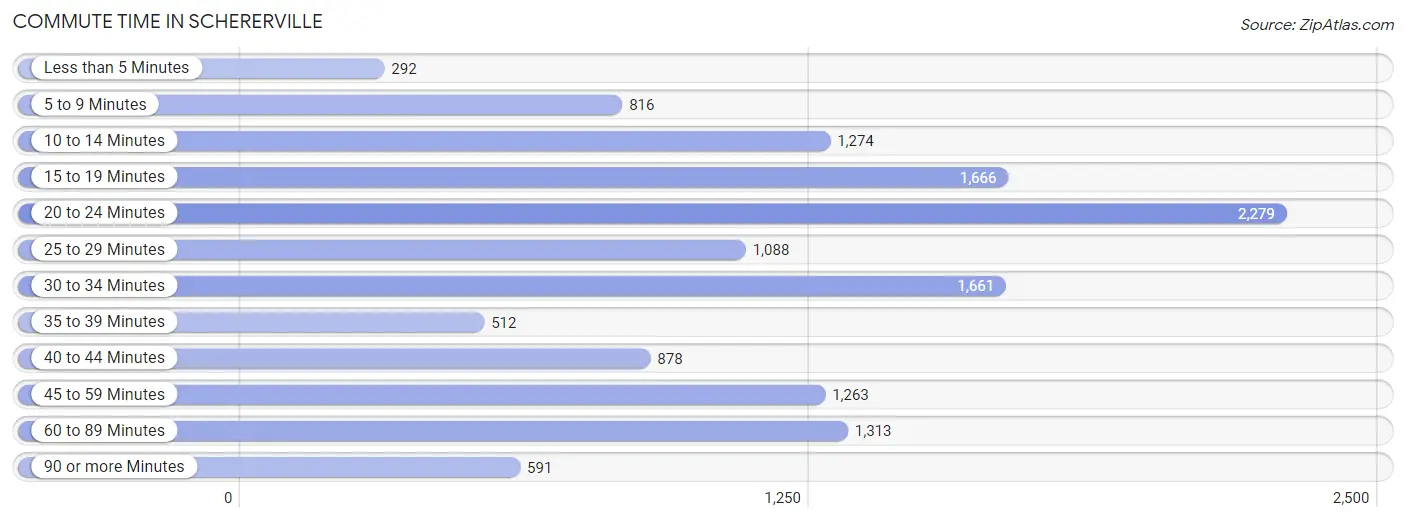
| Commute Time | # Commuters | % Commuters |
| Less than 5 Minutes | 292 | 2.1% |
| 5 to 9 Minutes | 816 | 6.0% |
| 10 to 14 Minutes | 1,274 | 9.3% |
| 15 to 19 Minutes | 1,666 | 12.2% |
| 20 to 24 Minutes | 2,279 | 16.7% |
| 25 to 29 Minutes | 1,088 | 8.0% |
| 30 to 34 Minutes | 1,661 | 12.2% |
| 35 to 39 Minutes | 512 | 3.8% |
| 40 to 44 Minutes | 878 | 6.4% |
| 45 to 59 Minutes | 1,263 | 9.3% |
| 60 to 89 Minutes | 1,313 | 9.6% |
| 90 or more Minutes | 591 | 4.3% |
Commute Time by Sex in Schererville
The most common commute times in Schererville are 20 to 24 minutes (1,125 commuters, 15.7%) for males and 20 to 24 minutes (1,154 commuters, 17.8%) for females.
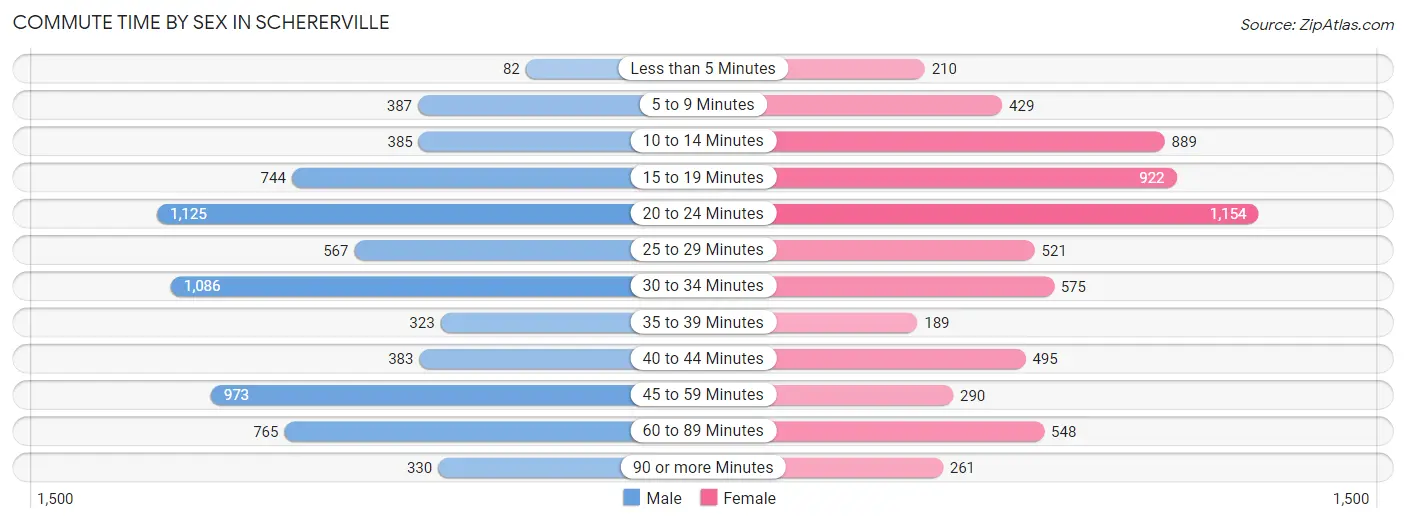
| Commute Time | Male | Female |
| Less than 5 Minutes | 82 (1.1%) | 210 (3.2%) |
| 5 to 9 Minutes | 387 (5.4%) | 429 (6.6%) |
| 10 to 14 Minutes | 385 (5.4%) | 889 (13.7%) |
| 15 to 19 Minutes | 744 (10.4%) | 922 (14.2%) |
| 20 to 24 Minutes | 1,125 (15.7%) | 1,154 (17.8%) |
| 25 to 29 Minutes | 567 (7.9%) | 521 (8.0%) |
| 30 to 34 Minutes | 1,086 (15.2%) | 575 (8.9%) |
| 35 to 39 Minutes | 323 (4.5%) | 189 (2.9%) |
| 40 to 44 Minutes | 383 (5.4%) | 495 (7.6%) |
| 45 to 59 Minutes | 973 (13.6%) | 290 (4.5%) |
| 60 to 89 Minutes | 765 (10.7%) | 548 (8.5%) |
| 90 or more Minutes | 330 (4.6%) | 261 (4.0%) |
Time of Departure to Work by Sex in Schererville
The most frequent times of departure to work in Schererville are 7:00 AM to 7:29 AM (1,028, 14.4%) for males and 8:00 AM to 8:29 AM (904, 13.9%) for females.
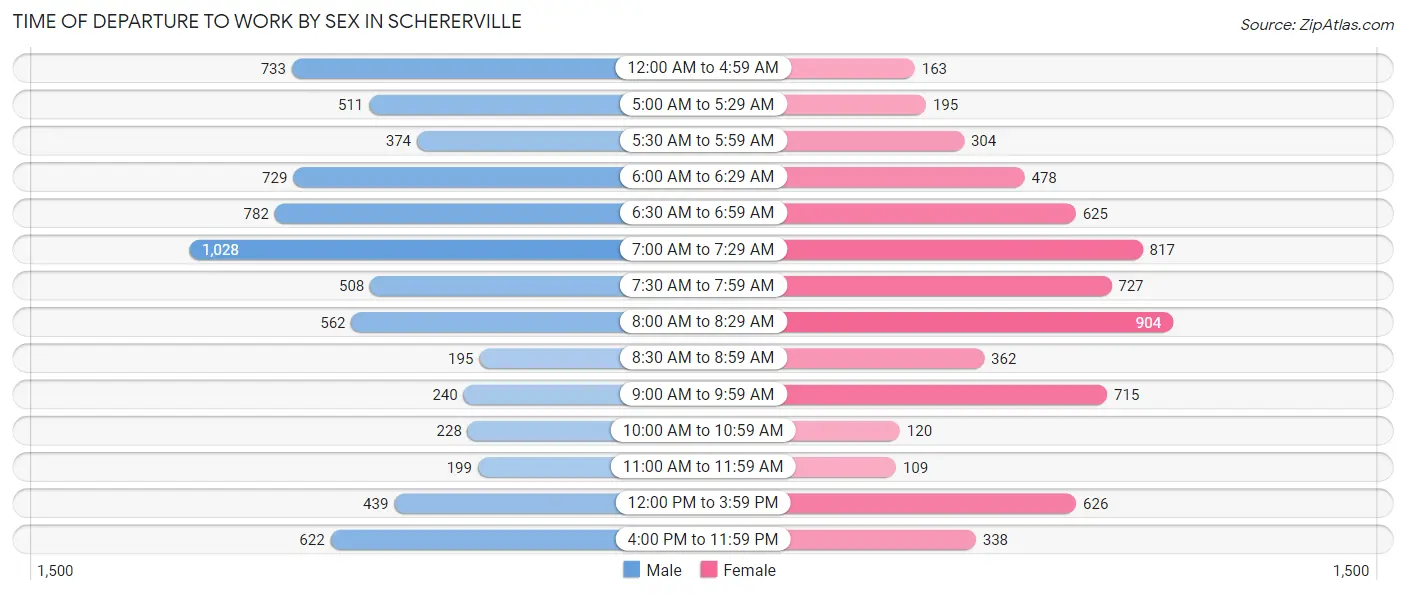
| Time of Departure | Male | Female |
| 12:00 AM to 4:59 AM | 733 (10.2%) | 163 (2.5%) |
| 5:00 AM to 5:29 AM | 511 (7.1%) | 195 (3.0%) |
| 5:30 AM to 5:59 AM | 374 (5.2%) | 304 (4.7%) |
| 6:00 AM to 6:29 AM | 729 (10.2%) | 478 (7.4%) |
| 6:30 AM to 6:59 AM | 782 (10.9%) | 625 (9.6%) |
| 7:00 AM to 7:29 AM | 1,028 (14.4%) | 817 (12.6%) |
| 7:30 AM to 7:59 AM | 508 (7.1%) | 727 (11.2%) |
| 8:00 AM to 8:29 AM | 562 (7.9%) | 904 (13.9%) |
| 8:30 AM to 8:59 AM | 195 (2.7%) | 362 (5.6%) |
| 9:00 AM to 9:59 AM | 240 (3.4%) | 715 (11.0%) |
| 10:00 AM to 10:59 AM | 228 (3.2%) | 120 (1.8%) |
| 11:00 AM to 11:59 AM | 199 (2.8%) | 109 (1.7%) |
| 12:00 PM to 3:59 PM | 439 (6.1%) | 626 (9.7%) |
| 4:00 PM to 11:59 PM | 622 (8.7%) | 338 (5.2%) |
| Total | 7,150 (100.0%) | 6,483 (100.0%) |
Housing Occupancy in Schererville
Occupancy by Ownership in Schererville
Of the total 11,829 dwellings in Schererville, owner-occupied units account for 9,403 (79.5%), while renter-occupied units make up 2,426 (20.5%).
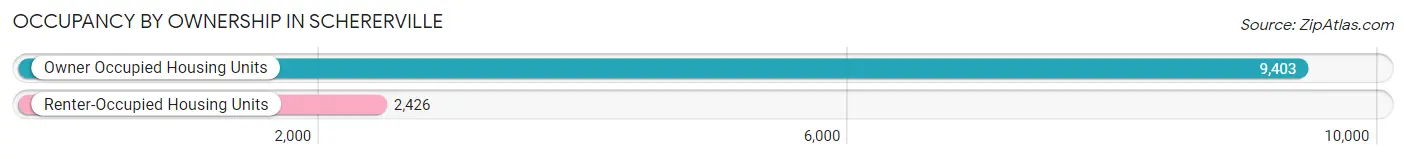
| Occupancy | # Housing Units | % Housing Units |
| Owner Occupied Housing Units | 9,403 | 79.5% |
| Renter-Occupied Housing Units | 2,426 | 20.5% |
| Total Occupied Housing Units | 11,829 | 100.0% |
Occupancy by Household Size in Schererville
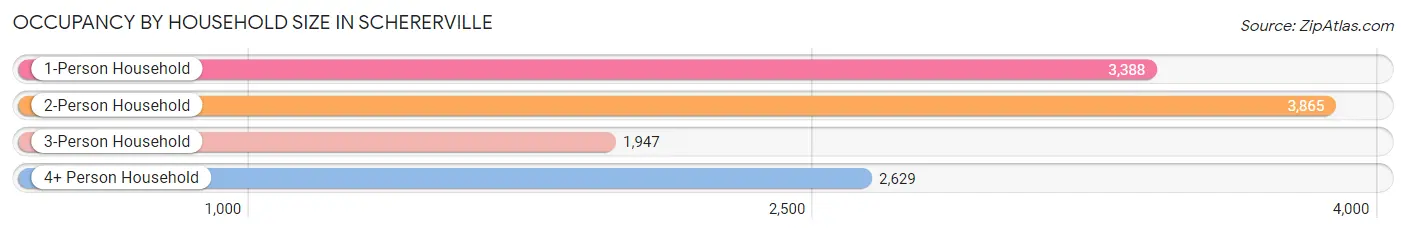
| Household Size | # Housing Units | % Housing Units |
| 1-Person Household | 3,388 | 28.6% |
| 2-Person Household | 3,865 | 32.7% |
| 3-Person Household | 1,947 | 16.5% |
| 4+ Person Household | 2,629 | 22.2% |
| Total Housing Units | 11,829 | 100.0% |
Occupancy by Ownership by Household Size in Schererville
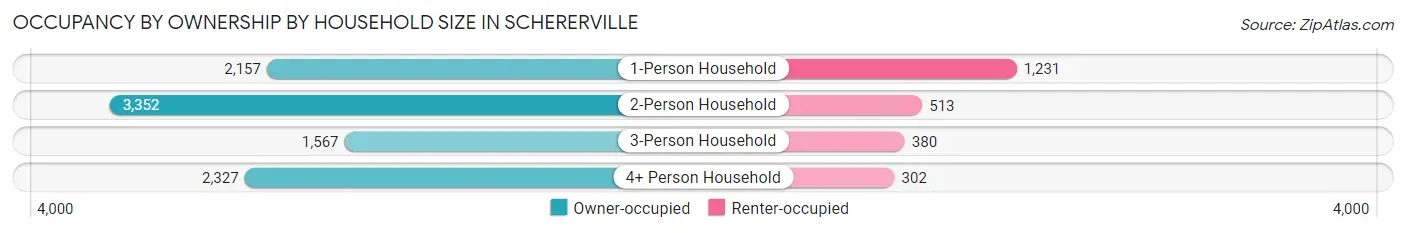
| Household Size | Owner-occupied | Renter-occupied |
| 1-Person Household | 2,157 (63.7%) | 1,231 (36.3%) |
| 2-Person Household | 3,352 (86.7%) | 513 (13.3%) |
| 3-Person Household | 1,567 (80.5%) | 380 (19.5%) |
| 4+ Person Household | 2,327 (88.5%) | 302 (11.5%) |
| Total Housing Units | 9,403 (79.5%) | 2,426 (20.5%) |
Occupancy by Educational Attainment in Schererville
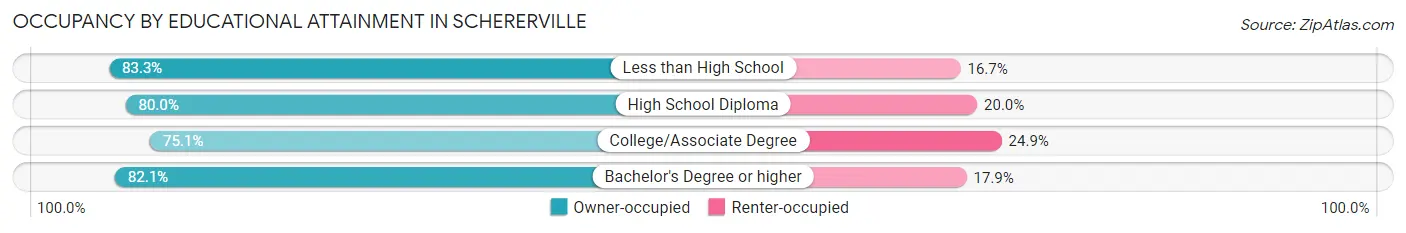
| Household Size | Owner-occupied | Renter-occupied |
| Less than High School | 458 (83.3%) | 92 (16.7%) |
| High School Diploma | 2,334 (80.0%) | 584 (20.0%) |
| College/Associate Degree | 2,723 (75.1%) | 902 (24.9%) |
| Bachelor's Degree or higher | 3,888 (82.1%) | 848 (17.9%) |
Occupancy by Age of Householder in Schererville
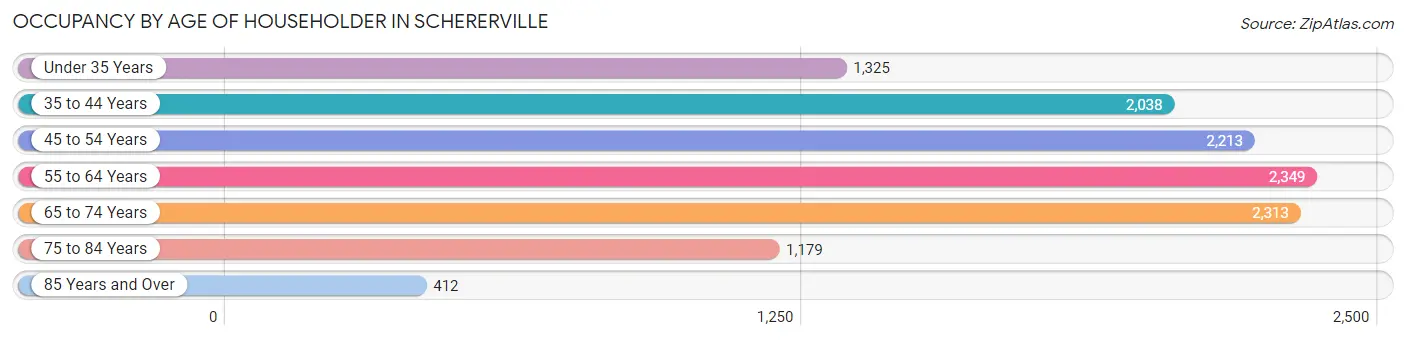
| Age Bracket | # Households | % Households |
| Under 35 Years | 1,325 | 11.2% |
| 35 to 44 Years | 2,038 | 17.2% |
| 45 to 54 Years | 2,213 | 18.7% |
| 55 to 64 Years | 2,349 | 19.9% |
| 65 to 74 Years | 2,313 | 19.6% |
| 75 to 84 Years | 1,179 | 10.0% |
| 85 Years and Over | 412 | 3.5% |
| Total | 11,829 | 100.0% |
Housing Finances in Schererville
Median Income by Occupancy in Schererville
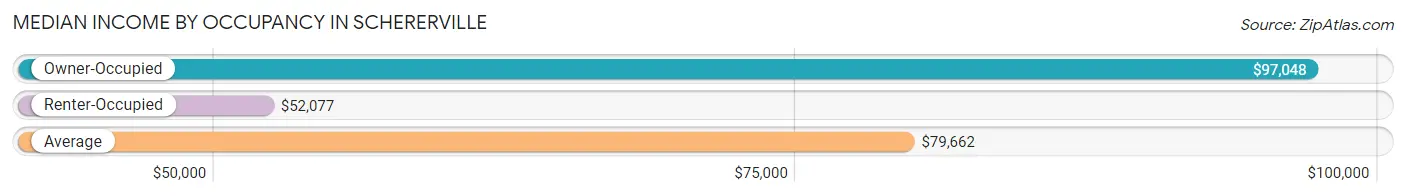
| Occupancy Type | # Households | Median Income |
| Owner-Occupied | 9,403 (79.5%) | $97,048 |
| Renter-Occupied | 2,426 (20.5%) | $52,077 |
| Average | 11,829 (100.0%) | $79,662 |
Occupancy by Householder Income Bracket in Schererville
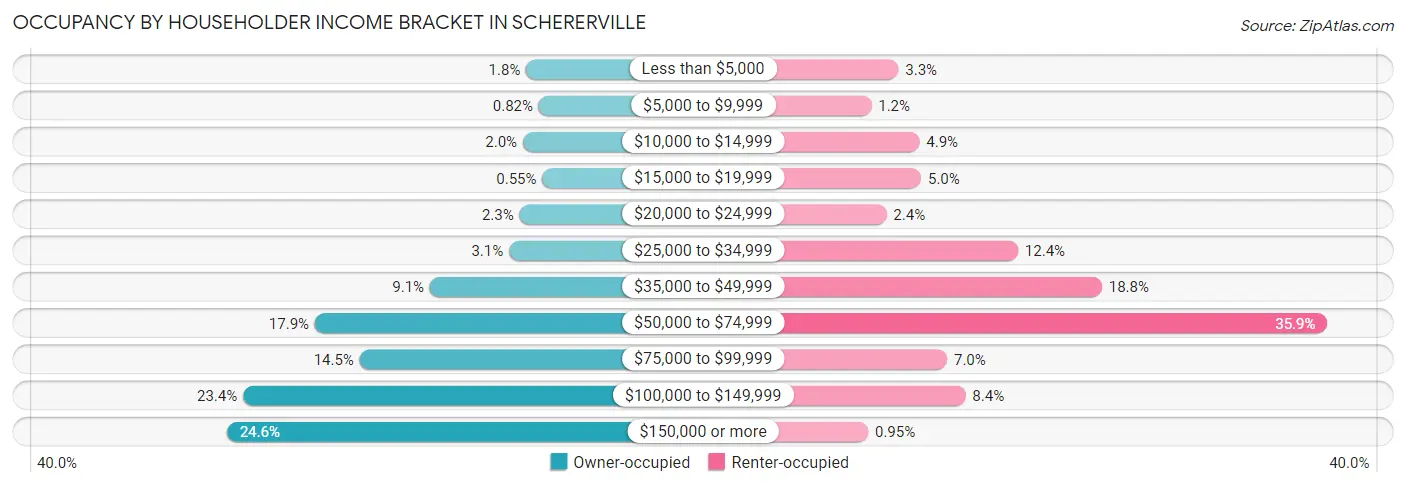
| Income Bracket | Owner-occupied | Renter-occupied |
| Less than $5,000 | 167 (1.8%) | 79 (3.3%) |
| $5,000 to $9,999 | 77 (0.8%) | 29 (1.2%) |
| $10,000 to $14,999 | 191 (2.0%) | 118 (4.9%) |
| $15,000 to $19,999 | 52 (0.5%) | 121 (5.0%) |
| $20,000 to $24,999 | 215 (2.3%) | 57 (2.4%) |
| $25,000 to $34,999 | 291 (3.1%) | 300 (12.4%) |
| $35,000 to $49,999 | 858 (9.1%) | 455 (18.8%) |
| $50,000 to $74,999 | 1,681 (17.9%) | 872 (35.9%) |
| $75,000 to $99,999 | 1,361 (14.5%) | 169 (7.0%) |
| $100,000 to $149,999 | 2,197 (23.4%) | 203 (8.4%) |
| $150,000 or more | 2,313 (24.6%) | 23 (0.9%) |
| Total | 9,403 (100.0%) | 2,426 (100.0%) |
Monthly Housing Cost Tiers in Schererville
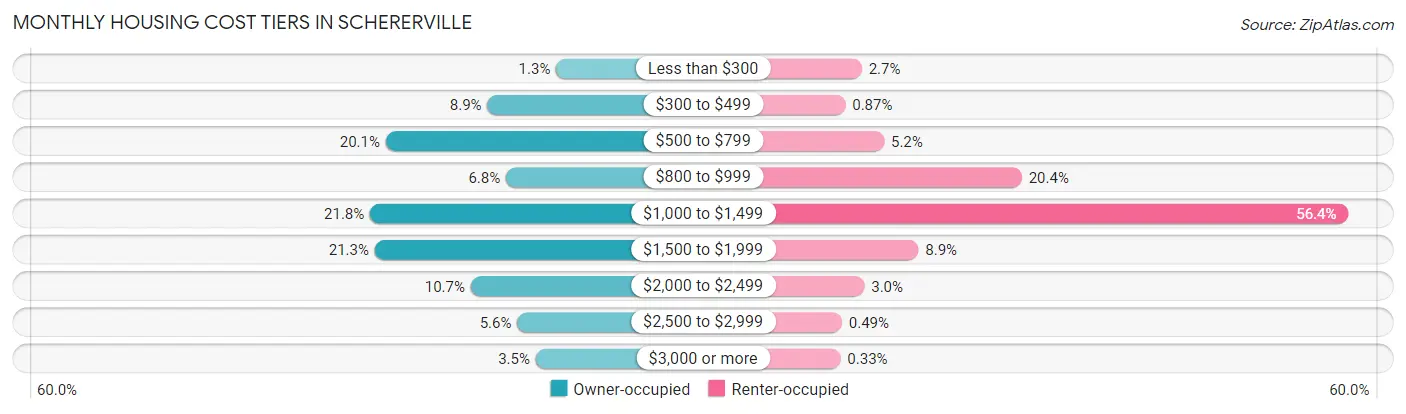
| Monthly Cost | Owner-occupied | Renter-occupied |
| Less than $300 | 119 (1.3%) | 65 (2.7%) |
| $300 to $499 | 834 (8.9%) | 21 (0.9%) |
| $500 to $799 | 1,890 (20.1%) | 125 (5.1%) |
| $800 to $999 | 640 (6.8%) | 494 (20.4%) |
| $1,000 to $1,499 | 2,053 (21.8%) | 1,369 (56.4%) |
| $1,500 to $1,999 | 2,004 (21.3%) | 217 (8.9%) |
| $2,000 to $2,499 | 1,007 (10.7%) | 72 (3.0%) |
| $2,500 to $2,999 | 524 (5.6%) | 12 (0.5%) |
| $3,000 or more | 332 (3.5%) | 8 (0.3%) |
| Total | 9,403 (100.0%) | 2,426 (100.0%) |
Physical Housing Characteristics in Schererville
Housing Structures in Schererville
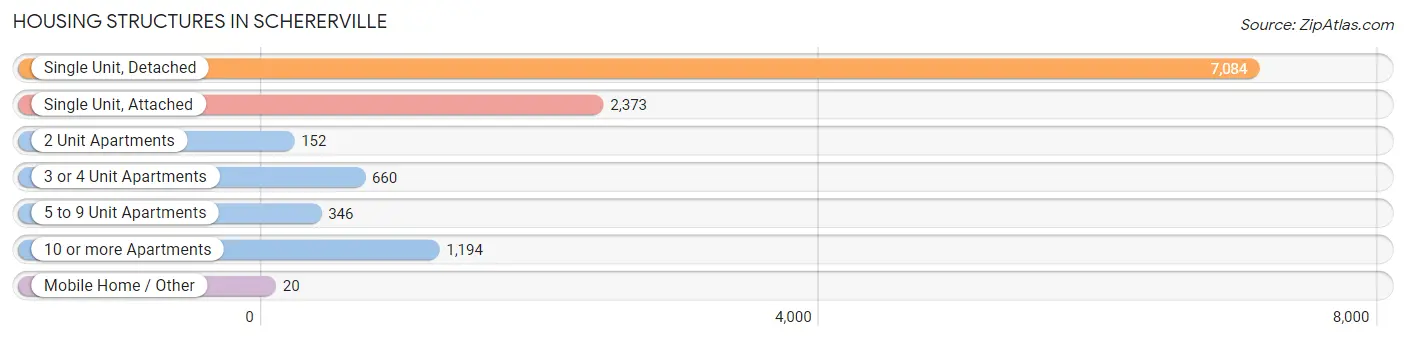
| Structure Type | # Housing Units | % Housing Units |
| Single Unit, Detached | 7,084 | 59.9% |
| Single Unit, Attached | 2,373 | 20.1% |
| 2 Unit Apartments | 152 | 1.3% |
| 3 or 4 Unit Apartments | 660 | 5.6% |
| 5 to 9 Unit Apartments | 346 | 2.9% |
| 10 or more Apartments | 1,194 | 10.1% |
| Mobile Home / Other | 20 | 0.2% |
| Total | 11,829 | 100.0% |
Housing Structures by Occupancy in Schererville
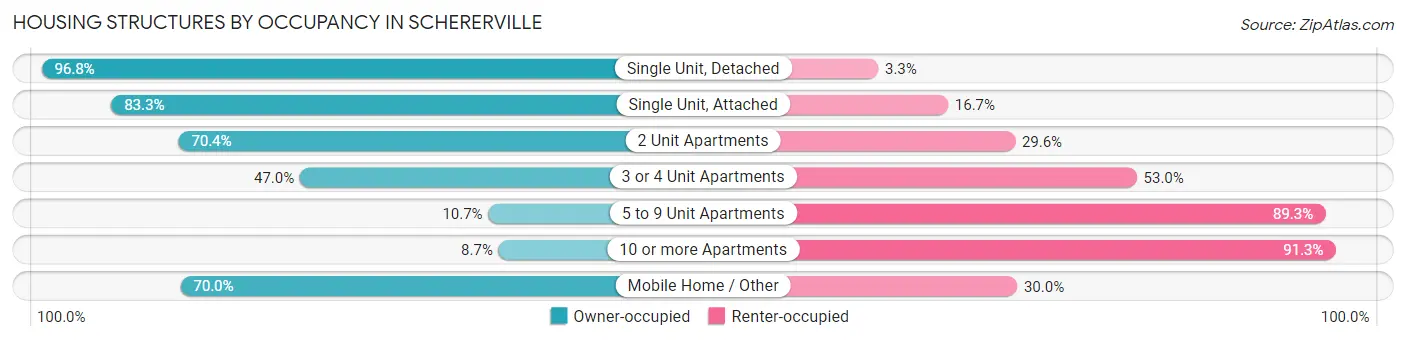
| Structure Type | Owner-occupied | Renter-occupied |
| Single Unit, Detached | 6,854 (96.8%) | 230 (3.3%) |
| Single Unit, Attached | 1,977 (83.3%) | 396 (16.7%) |
| 2 Unit Apartments | 107 (70.4%) | 45 (29.6%) |
| 3 or 4 Unit Apartments | 310 (47.0%) | 350 (53.0%) |
| 5 to 9 Unit Apartments | 37 (10.7%) | 309 (89.3%) |
| 10 or more Apartments | 104 (8.7%) | 1,090 (91.3%) |
| Mobile Home / Other | 14 (70.0%) | 6 (30.0%) |
| Total | 9,403 (79.5%) | 2,426 (20.5%) |
Housing Structures by Number of Rooms in Schererville
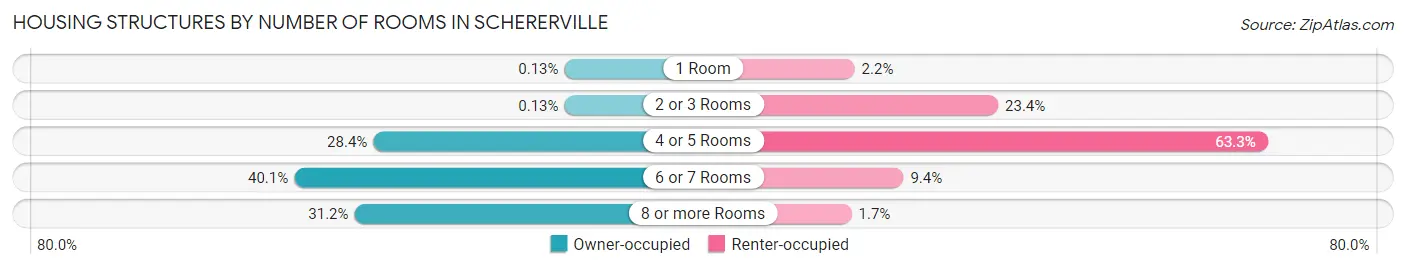
| Number of Rooms | Owner-occupied | Renter-occupied |
| 1 Room | 12 (0.1%) | 53 (2.2%) |
| 2 or 3 Rooms | 12 (0.1%) | 568 (23.4%) |
| 4 or 5 Rooms | 2,672 (28.4%) | 1,535 (63.3%) |
| 6 or 7 Rooms | 3,773 (40.1%) | 228 (9.4%) |
| 8 or more Rooms | 2,934 (31.2%) | 42 (1.7%) |
| Total | 9,403 (100.0%) | 2,426 (100.0%) |
Housing Structure by Heating Type in Schererville
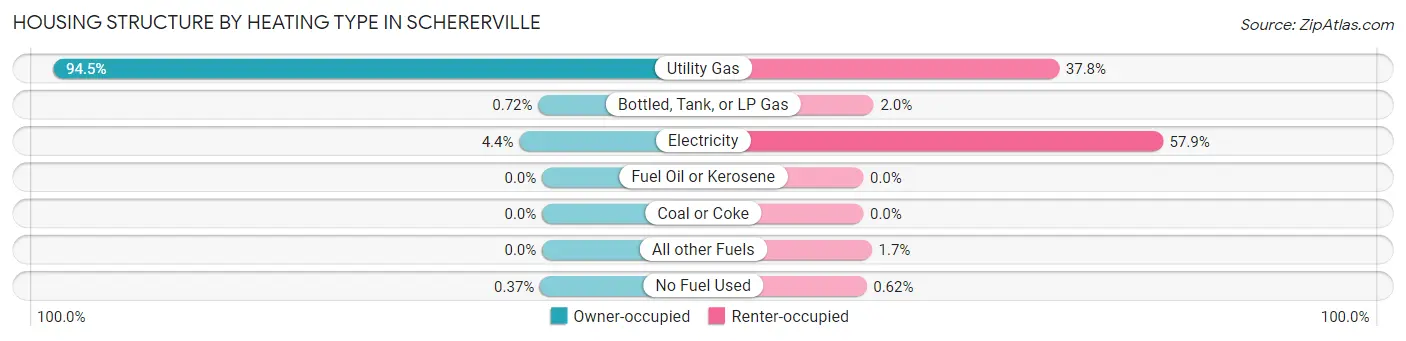
| Heating Type | Owner-occupied | Renter-occupied |
| Utility Gas | 8,886 (94.5%) | 918 (37.8%) |
| Bottled, Tank, or LP Gas | 68 (0.7%) | 49 (2.0%) |
| Electricity | 414 (4.4%) | 1,404 (57.9%) |
| Fuel Oil or Kerosene | 0 (0.0%) | 0 (0.0%) |
| Coal or Coke | 0 (0.0%) | 0 (0.0%) |
| All other Fuels | 0 (0.0%) | 40 (1.7%) |
| No Fuel Used | 35 (0.4%) | 15 (0.6%) |
| Total | 9,403 (100.0%) | 2,426 (100.0%) |
Household Vehicle Usage in Schererville
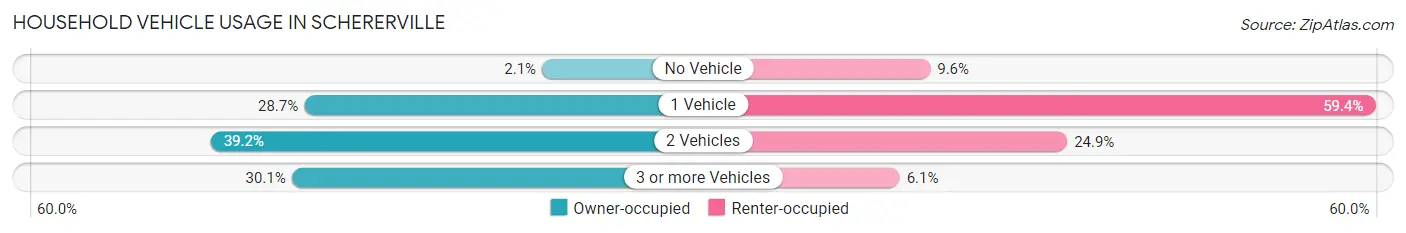
| Vehicles per Household | Owner-occupied | Renter-occupied |
| No Vehicle | 193 (2.1%) | 232 (9.6%) |
| 1 Vehicle | 2,699 (28.7%) | 1,441 (59.4%) |
| 2 Vehicles | 3,681 (39.2%) | 604 (24.9%) |
| 3 or more Vehicles | 2,830 (30.1%) | 149 (6.1%) |
| Total | 9,403 (100.0%) | 2,426 (100.0%) |
Real Estate & Mortgages in Schererville
Real Estate and Mortgage Overview in Schererville
| Characteristic | Without Mortgage | With Mortgage |
| Housing Units | 3,011 | 6,392 |
| Median Property Value | $273,700 | $285,500 |
| Median Household Income | $67,386 | $1,997 |
| Monthly Housing Costs | $567 | $320 |
| Real Estate Taxes | $2,439 | $38 |
Property Value by Mortgage Status in Schererville
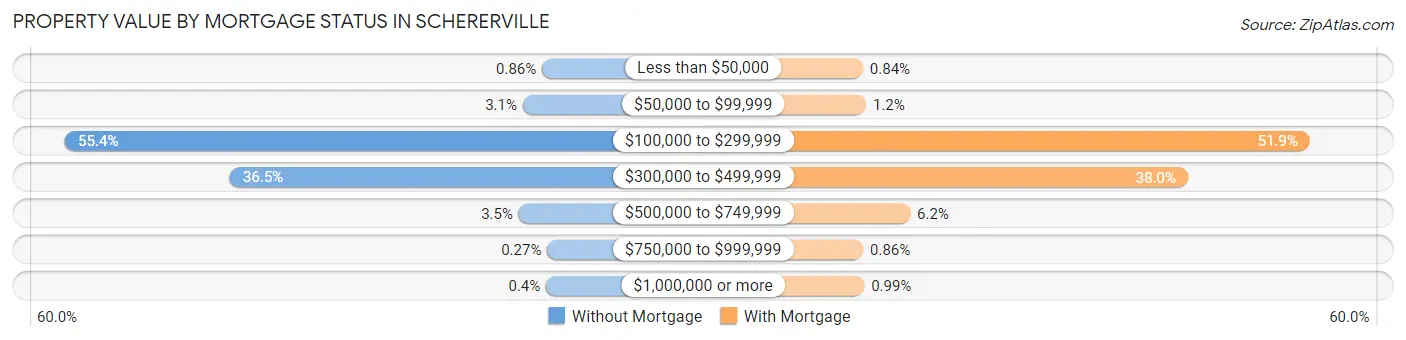
| Property Value | Without Mortgage | With Mortgage |
| Less than $50,000 | 26 (0.9%) | 54 (0.8%) |
| $50,000 to $99,999 | 92 (3.1%) | 77 (1.2%) |
| $100,000 to $299,999 | 1,667 (55.4%) | 3,318 (51.9%) |
| $300,000 to $499,999 | 1,100 (36.5%) | 2,427 (38.0%) |
| $500,000 to $749,999 | 106 (3.5%) | 398 (6.2%) |
| $750,000 to $999,999 | 8 (0.3%) | 55 (0.9%) |
| $1,000,000 or more | 12 (0.4%) | 63 (1.0%) |
| Total | 3,011 (100.0%) | 6,392 (100.0%) |
Household Income by Mortgage Status in Schererville
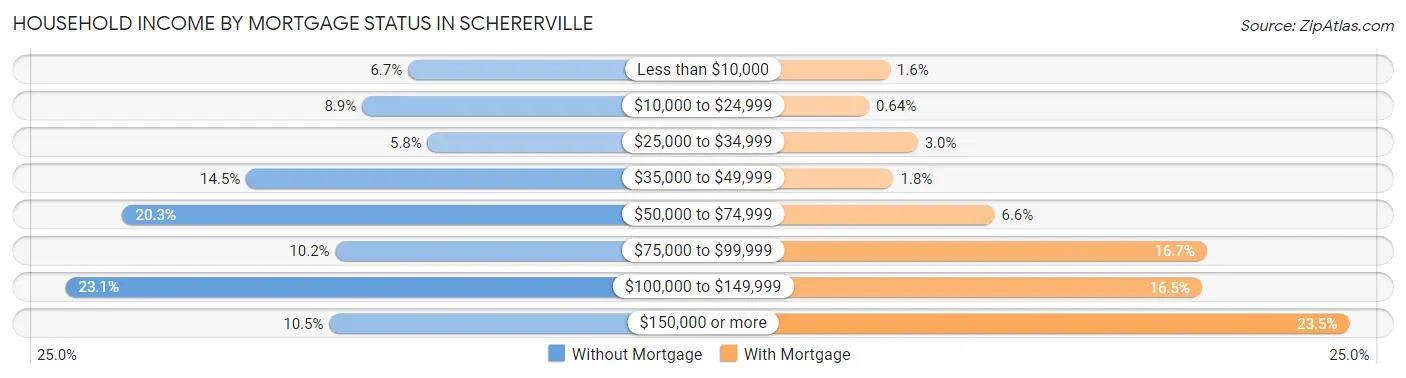
| Household Income | Without Mortgage | With Mortgage |
| Less than $10,000 | 203 (6.7%) | 105 (1.6%) |
| $10,000 to $24,999 | 269 (8.9%) | 41 (0.6%) |
| $25,000 to $34,999 | 175 (5.8%) | 189 (3.0%) |
| $35,000 to $49,999 | 435 (14.4%) | 116 (1.8%) |
| $50,000 to $74,999 | 612 (20.3%) | 423 (6.6%) |
| $75,000 to $99,999 | 307 (10.2%) | 1,069 (16.7%) |
| $100,000 to $149,999 | 694 (23.1%) | 1,054 (16.5%) |
| $150,000 or more | 316 (10.5%) | 1,503 (23.5%) |
| Total | 3,011 (100.0%) | 6,392 (100.0%) |
Property Value to Household Income Ratio in Schererville
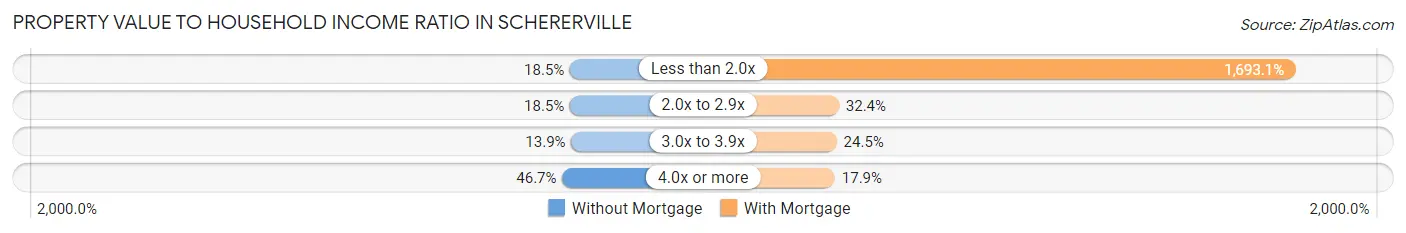
| Value-to-Income Ratio | Without Mortgage | With Mortgage |
| Less than 2.0x | 557 (18.5%) | 108,223 (1,693.1%) |
| 2.0x to 2.9x | 556 (18.5%) | 2,071 (32.4%) |
| 3.0x to 3.9x | 417 (13.9%) | 1,565 (24.5%) |
| 4.0x or more | 1,407 (46.7%) | 1,146 (17.9%) |
| Total | 3,011 (100.0%) | 6,392 (100.0%) |
Real Estate Taxes by Mortgage Status in Schererville
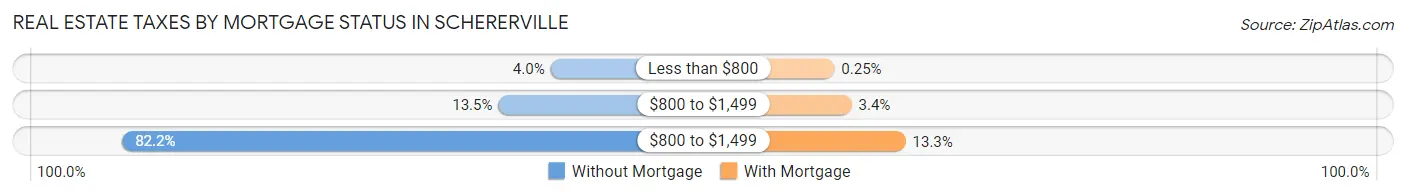
| Property Taxes | Without Mortgage | With Mortgage |
| Less than $800 | 119 (4.0%) | 16 (0.3%) |
| $800 to $1,499 | 406 (13.5%) | 217 (3.4%) |
| $800 to $1,499 | 2,474 (82.2%) | 847 (13.3%) |
| Total | 3,011 (100.0%) | 6,392 (100.0%) |
Health & Disability in Schererville
Health Insurance Coverage by Age in Schererville
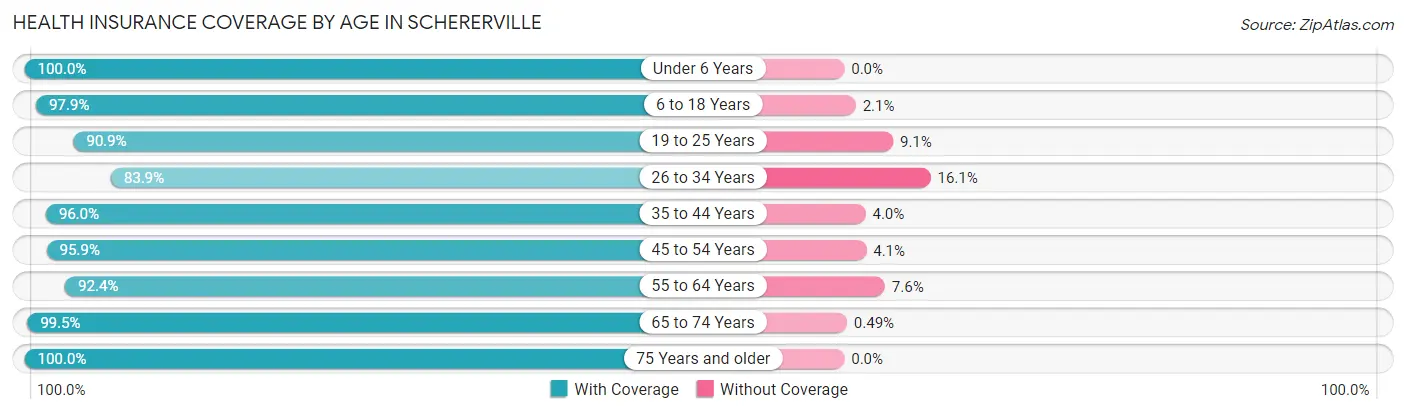
| Age Bracket | With Coverage | Without Coverage |
| Under 6 Years | 2,007 (100.0%) | 0 (0.0%) |
| 6 to 18 Years | 4,085 (97.9%) | 89 (2.1%) |
| 19 to 25 Years | 2,159 (90.9%) | 216 (9.1%) |
| 26 to 34 Years | 2,435 (83.9%) | 467 (16.1%) |
| 35 to 44 Years | 3,858 (96.0%) | 159 (4.0%) |
| 45 to 54 Years | 4,066 (95.9%) | 174 (4.1%) |
| 55 to 64 Years | 3,712 (92.4%) | 304 (7.6%) |
| 65 to 74 Years | 3,474 (99.5%) | 17 (0.5%) |
| 75 Years and older | 2,296 (100.0%) | 0 (0.0%) |
| Total | 28,092 (95.2%) | 1,426 (4.8%) |
Health Insurance Coverage by Citizenship Status in Schererville
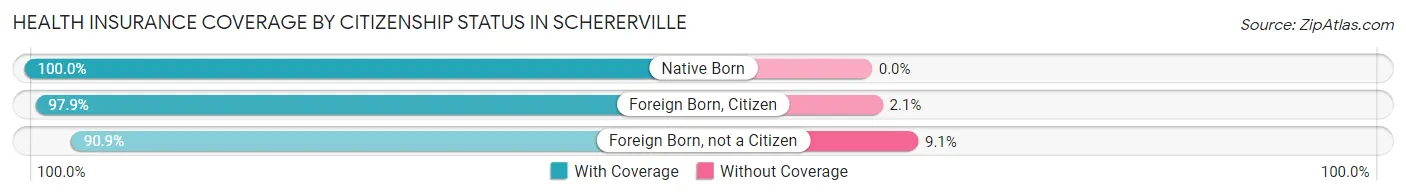
| Citizenship Status | With Coverage | Without Coverage |
| Native Born | 2,007 (100.0%) | 0 (0.0%) |
| Foreign Born, Citizen | 4,085 (97.9%) | 89 (2.1%) |
| Foreign Born, not a Citizen | 2,159 (90.9%) | 216 (9.1%) |
Health Insurance Coverage by Household Income in Schererville
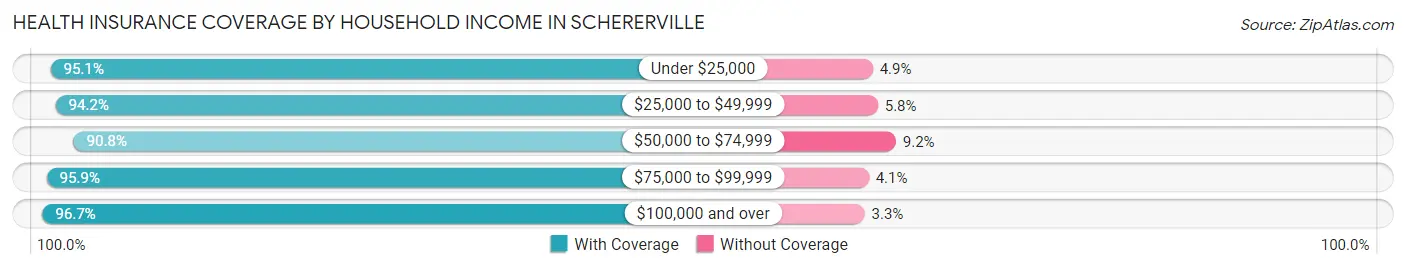
| Household Income | With Coverage | Without Coverage |
| Under $25,000 | 1,802 (95.1%) | 92 (4.9%) |
| $25,000 to $49,999 | 3,276 (94.2%) | 202 (5.8%) |
| $50,000 to $74,999 | 4,584 (90.8%) | 464 (9.2%) |
| $75,000 to $99,999 | 3,756 (95.9%) | 161 (4.1%) |
| $100,000 and over | 14,657 (96.7%) | 507 (3.3%) |
Public vs Private Health Insurance Coverage by Age in Schererville
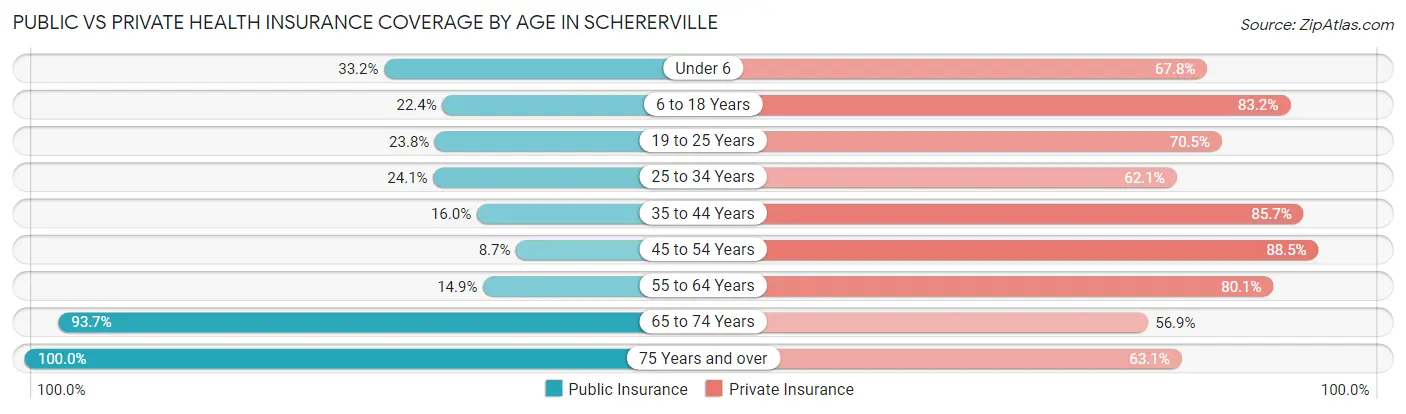
| Age Bracket | Public Insurance | Private Insurance |
| Under 6 | 667 (33.2%) | 1,361 (67.8%) |
| 6 to 18 Years | 936 (22.4%) | 3,473 (83.2%) |
| 19 to 25 Years | 565 (23.8%) | 1,675 (70.5%) |
| 25 to 34 Years | 700 (24.1%) | 1,803 (62.1%) |
| 35 to 44 Years | 644 (16.0%) | 3,443 (85.7%) |
| 45 to 54 Years | 370 (8.7%) | 3,751 (88.5%) |
| 55 to 64 Years | 597 (14.9%) | 3,217 (80.1%) |
| 65 to 74 Years | 3,272 (93.7%) | 1,986 (56.9%) |
| 75 Years and over | 2,295 (100.0%) | 1,448 (63.1%) |
| Total | 10,046 (34.0%) | 22,157 (75.1%) |
Disability Status by Sex by Age in Schererville
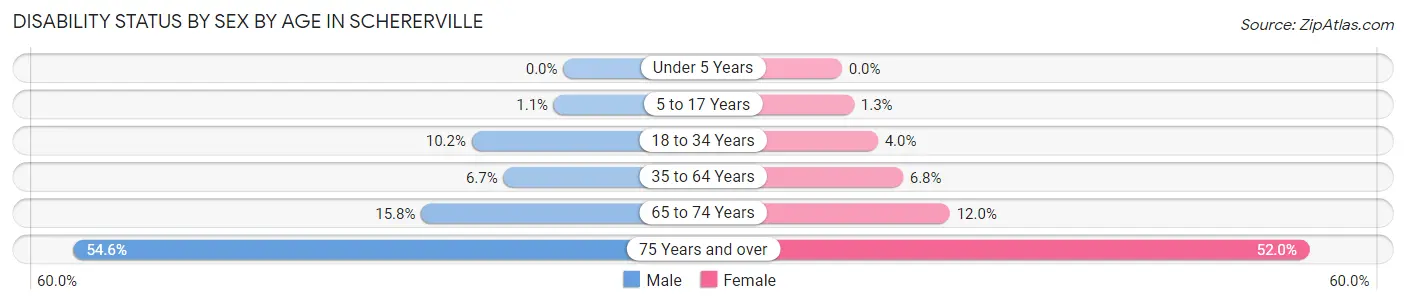
| Age Bracket | Male | Female |
| Under 5 Years | 0 (0.0%) | 0 (0.0%) |
| 5 to 17 Years | 24 (1.1%) | 28 (1.3%) |
| 18 to 34 Years | 296 (10.2%) | 102 (4.0%) |
| 35 to 64 Years | 402 (6.7%) | 423 (6.8%) |
| 65 to 74 Years | 260 (15.8%) | 222 (12.0%) |
| 75 Years and over | 450 (54.5%) | 765 (52.0%) |
Disability Class by Sex by Age in Schererville
Disability Class: Hearing Difficulty
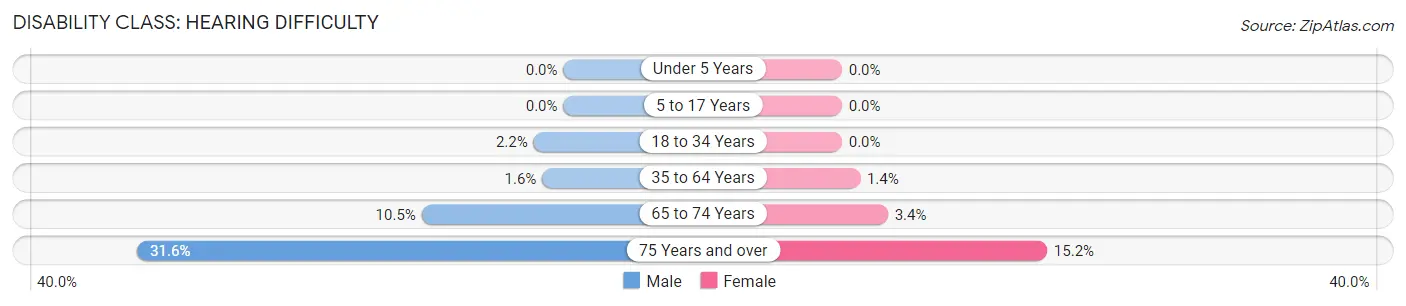
| Age Bracket | Male | Female |
| Under 5 Years | 0 (0.0%) | 0 (0.0%) |
| 5 to 17 Years | 0 (0.0%) | 0 (0.0%) |
| 18 to 34 Years | 64 (2.2%) | 0 (0.0%) |
| 35 to 64 Years | 95 (1.6%) | 84 (1.3%) |
| 65 to 74 Years | 173 (10.5%) | 63 (3.4%) |
| 75 Years and over | 261 (31.6%) | 224 (15.2%) |
Disability Class: Vision Difficulty
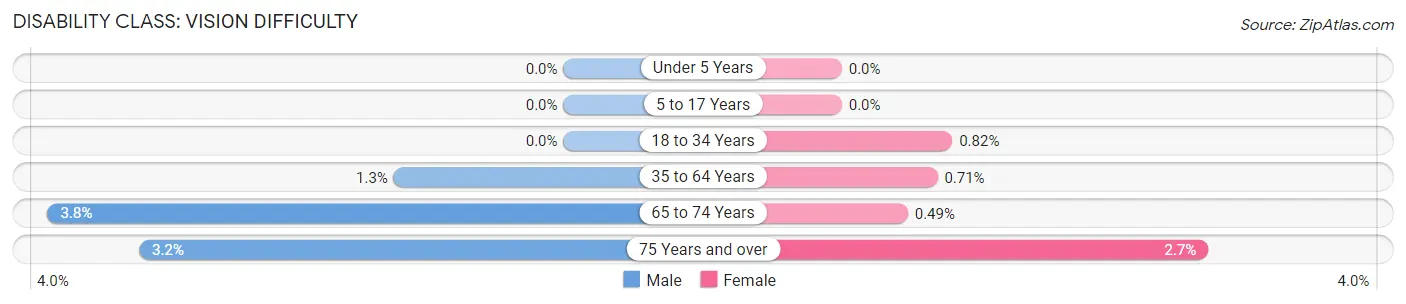
| Age Bracket | Male | Female |
| Under 5 Years | 0 (0.0%) | 0 (0.0%) |
| 5 to 17 Years | 0 (0.0%) | 0 (0.0%) |
| 18 to 34 Years | 0 (0.0%) | 21 (0.8%) |
| 35 to 64 Years | 76 (1.3%) | 44 (0.7%) |
| 65 to 74 Years | 63 (3.8%) | 9 (0.5%) |
| 75 Years and over | 26 (3.2%) | 40 (2.7%) |
Disability Class: Cognitive Difficulty
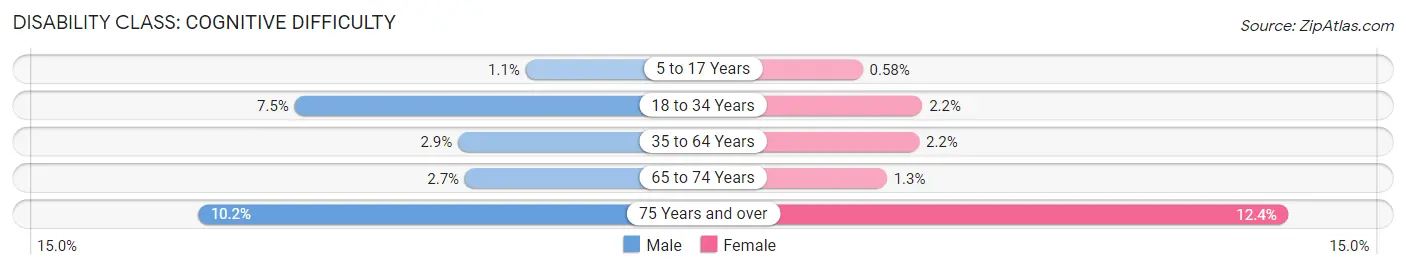
| Age Bracket | Male | Female |
| 5 to 17 Years | 24 (1.1%) | 12 (0.6%) |
| 18 to 34 Years | 217 (7.5%) | 57 (2.2%) |
| 35 to 64 Years | 177 (2.9%) | 134 (2.1%) |
| 65 to 74 Years | 45 (2.7%) | 23 (1.3%) |
| 75 Years and over | 84 (10.2%) | 183 (12.4%) |
Disability Class: Ambulatory Difficulty
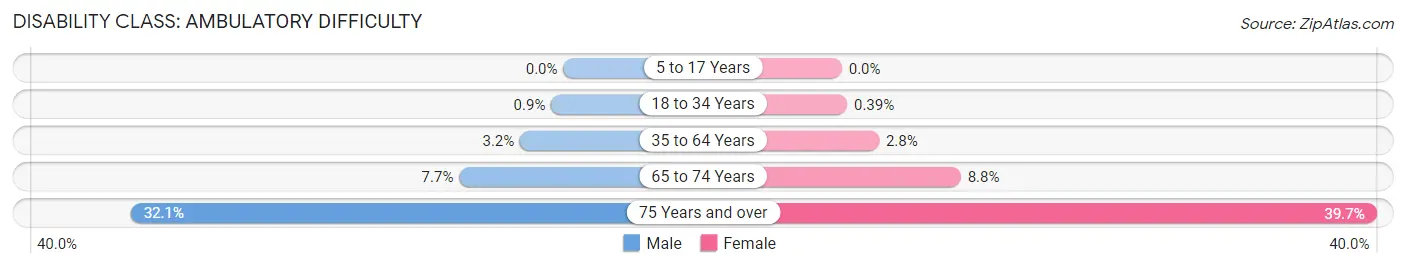
| Age Bracket | Male | Female |
| 5 to 17 Years | 0 (0.0%) | 0 (0.0%) |
| 18 to 34 Years | 26 (0.9%) | 10 (0.4%) |
| 35 to 64 Years | 194 (3.2%) | 172 (2.8%) |
| 65 to 74 Years | 127 (7.7%) | 163 (8.8%) |
| 75 Years and over | 265 (32.1%) | 584 (39.7%) |
Disability Class: Self-Care Difficulty
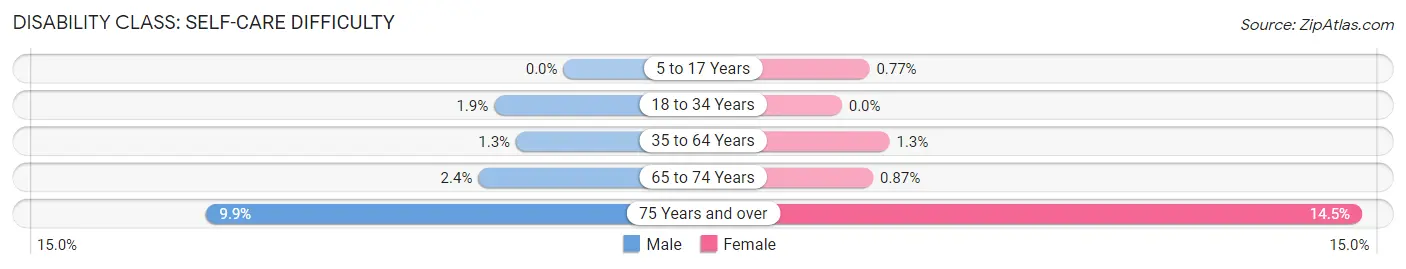
| Age Bracket | Male | Female |
| 5 to 17 Years | 0 (0.0%) | 16 (0.8%) |
| 18 to 34 Years | 56 (1.9%) | 0 (0.0%) |
| 35 to 64 Years | 80 (1.3%) | 83 (1.3%) |
| 65 to 74 Years | 39 (2.4%) | 16 (0.9%) |
| 75 Years and over | 82 (9.9%) | 213 (14.5%) |
Technology Access in Schererville
Computing Device Access in Schererville
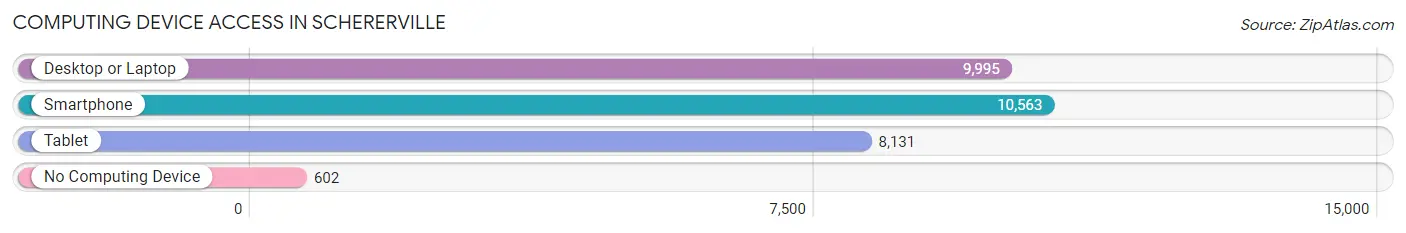
| Device Type | # Households | % Households |
| Desktop or Laptop | 9,995 | 84.5% |
| Smartphone | 10,563 | 89.3% |
| Tablet | 8,131 | 68.7% |
| No Computing Device | 602 | 5.1% |
| Total | 11,829 | 100.0% |
Internet Access in Schererville
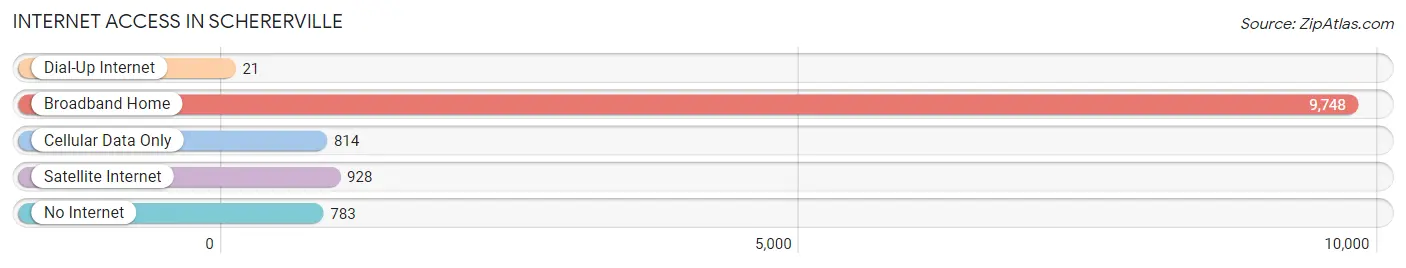
| Internet Type | # Households | % Households |
| Dial-Up Internet | 21 | 0.2% |
| Broadband Home | 9,748 | 82.4% |
| Cellular Data Only | 814 | 6.9% |
| Satellite Internet | 928 | 7.9% |
| No Internet | 783 | 6.6% |
| Total | 11,829 | 100.0% |
Schererville Summary
Schererville, Indiana is a town located in Lake County, Indiana, United States. It is part of the Chicago metropolitan area and is located approximately 25 miles southeast of downtown Chicago. The population of Schererville was 29,243 at the 2010 census, making it the largest town in Lake County.
History
Schererville was founded in 1866 by Nicholas Scherer, a German immigrant who had come to the United States in 1848. He purchased land in the area and began to develop it into a farming community. The town was originally known as Scherer’s Station, but the name was changed to Schererville in 1868.
The town grew slowly over the years, but experienced a surge in population in the 1950s and 1960s due to the growth of the steel industry in nearby Gary, Indiana. The town was incorporated in 1967 and has continued to grow since then.
Geography
Schererville is located in the northwest corner of Lake County, Indiana, at 41°30′N 87°20′W. It is bordered by the towns of St. John to the north, Dyer to the east, Munster to the south, and Crown Point to the west.
The town is situated on the Valparaiso Moraine, a ridge of glacial deposits that runs through the area. The town is located on the Valparaiso Outwash Plain, which is a flat, sandy area that was formed by the melting of the glaciers.
The town is located in the Kankakee River watershed and is drained by the Little Calumet River, which flows through the town.
Economy
Schererville’s economy is largely based on retail and services. The town is home to a number of large retail stores, including Walmart, Target, and Kohl’s. The town also has a number of restaurants, banks, and other businesses.
The town is also home to a number of manufacturing companies, including the Schererville-based company, Steel Dynamics, which produces steel products.
Demographics
As of the 2010 census, the population of Schererville was 29,243. The racial makeup of the town was 87.3% White, 5.3% African American, 0.3% Native American, 2.2% Asian, 0.1% Pacific Islander, 2.3% from other races, and 2.5% from two or more races. Hispanic or Latino of any race were 8.2% of the population.
The median income for a household in the town was $60,945, and the median income for a family was $71,945. The per capita income for the town was $27,945. About 4.2% of families and 5.7% of the population were below the poverty line, including 7.2% of those under age 18 and 4.2% of those age 65 or over.
Common Questions
What is Per Capita Income in Schererville?
Per Capita income in Schererville is $44,383.
What is the Median Family Income in Schererville?
Median Family Income in Schererville is $104,321.
What is the Median Household income in Schererville?
Median Household Income in Schererville is $79,662.
What is Income or Wage Gap in Schererville?
Income or Wage Gap in Schererville is 35.7%.
Women in Schererville earn 64.3 cents for every dollar earned by a man.
What is Family Income Deficit in Schererville?
Family Income Deficit in Schererville is $11,510.
Families that are below poverty line in Schererville earn $11,510 less on average than the poverty threshold level.
What is Inequality or Gini Index in Schererville?
Inequality or Gini Index in Schererville is 0.43.
What is the Total Population of Schererville?
Total Population of Schererville is 29,573.
What is the Total Male Population of Schererville?
Total Male Population of Schererville is 14,397.
What is the Total Female Population of Schererville?
Total Female Population of Schererville is 15,176.
What is the Ratio of Males per 100 Females in Schererville?
There are 94.87 Males per 100 Females in Schererville.
What is the Ratio of Females per 100 Males in Schererville?
There are 105.41 Females per 100 Males in Schererville.
What is the Median Population Age in Schererville?
Median Population Age in Schererville is 43.4 Years.
What is the Average Family Size in Schererville
Average Family Size in Schererville is 3.0 People.
What is the Average Household Size in Schererville
Average Household Size in Schererville is 2.5 People.
How Large is the Labor Force in Schererville?
There are 15,888 People in the Labor Forcein in Schererville.
What is the Percentage of People in the Labor Force in Schererville?
65.1% of People are in the Labor Force in Schererville.
What is the Unemployment Rate in Schererville?
Unemployment Rate in Schererville is 4.5%.