Mount Juliet, TN Map & Demographics
Mount Juliet Map
Mount Juliet Overview
$52,104
PER CAPITA INCOME
$121,452
AVG FAMILY INCOME
$108,066
AVG HOUSEHOLD INCOME
33.1%
WAGE / INCOME GAP [ % ]
66.9¢/ $1
WAGE / INCOME GAP [ $ ]
0.44
INEQUALITY / GINI INDEX
39,525
TOTAL POPULATION
19,732
MALE POPULATION
19,793
FEMALE POPULATION
99.69
MALES / 100 FEMALES
100.31
FEMALES / 100 MALES
39.2
MEDIAN AGE
3.1
AVG FAMILY SIZE
2.7
AVG HOUSEHOLD SIZE
20,981
LABOR FORCE [ PEOPLE ]
69.3%
PERCENT IN LABOR FORCE
3.8%
UNEMPLOYMENT RATE
Mount Juliet Zip Codes
Mount Juliet Area Codes
Income in Mount Juliet
Income Overview in Mount Juliet
Per Capita Income in Mount Juliet is $52,104, while median incomes of families and households are $121,452 and $108,066 respectively.
| Characteristic | Number | Measure |
| Per Capita Income | 39,525 | $52,104 |
| Median Family Income | 11,033 | $121,452 |
| Mean Family Income | 11,033 | $133,267 |
| Median Household Income | 14,446 | $108,066 |
| Mean Household Income | 14,446 | $141,601 |
| Income Deficit | 11,033 | $0 |
| Wage / Income Gap (%) | 39,525 | 33.07% |
| Wage / Income Gap ($) | 39,525 | 66.93¢ per $1 |
| Gini / Inequality Index | 39,525 | 0.44 |
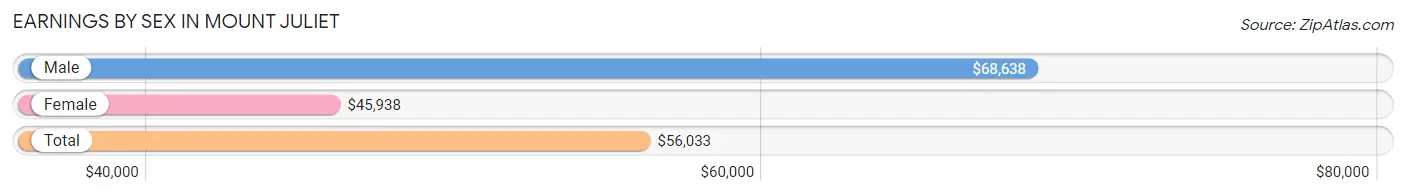
Earnings by Sex in Mount Juliet
Average Earnings in Mount Juliet are $56,033, $68,638 for men and $45,938 for women, a difference of 33.1%.
| Sex | Number | Average Earnings |
| Male | 11,637 (53.6%) | $68,638 |
| Female | 10,091 (46.4%) | $45,938 |
| Total | 21,728 (100.0%) | $56,033 |
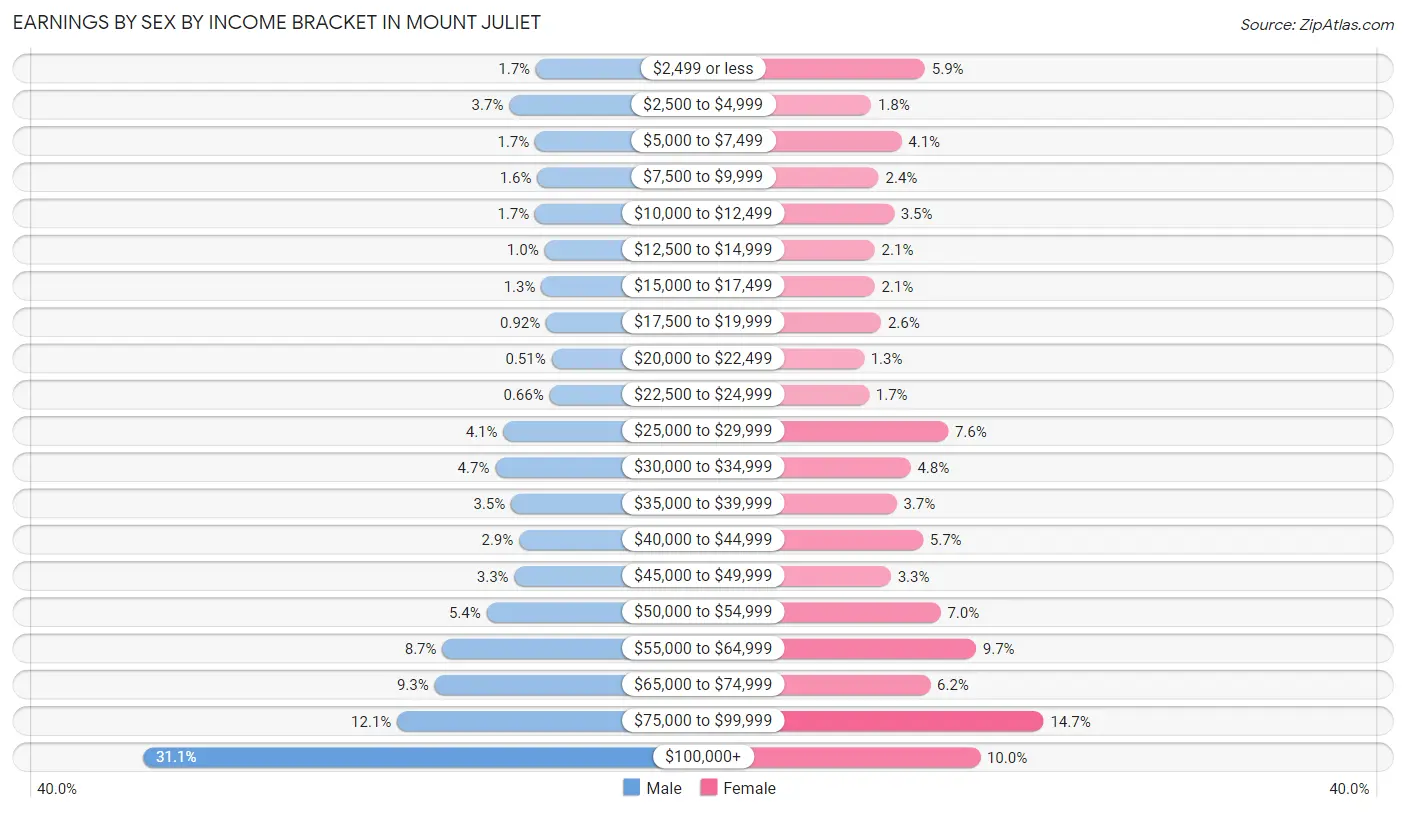
Earnings by Sex by Income Bracket in Mount Juliet
The most common earnings brackets in Mount Juliet are $100,000+ for men (3,622 | 31.1%) and $75,000 to $99,999 for women (1,487 | 14.7%).
| Income | Male | Female |
| $2,499 or less | 196 (1.7%) | 590 (5.9%) |
| $2,500 to $4,999 | 428 (3.7%) | 183 (1.8%) |
| $5,000 to $7,499 | 202 (1.7%) | 413 (4.1%) |
| $7,500 to $9,999 | 184 (1.6%) | 240 (2.4%) |
| $10,000 to $12,499 | 202 (1.7%) | 355 (3.5%) |
| $12,500 to $14,999 | 121 (1.0%) | 211 (2.1%) |
| $15,000 to $17,499 | 149 (1.3%) | 210 (2.1%) |
| $17,500 to $19,999 | 107 (0.9%) | 258 (2.6%) |
| $20,000 to $22,499 | 59 (0.5%) | 128 (1.3%) |
| $22,500 to $24,999 | 77 (0.7%) | 167 (1.7%) |
| $25,000 to $29,999 | 479 (4.1%) | 765 (7.6%) |
| $30,000 to $34,999 | 551 (4.7%) | 481 (4.8%) |
| $35,000 to $39,999 | 412 (3.5%) | 375 (3.7%) |
| $40,000 to $44,999 | 342 (2.9%) | 575 (5.7%) |
| $45,000 to $49,999 | 383 (3.3%) | 332 (3.3%) |
| $50,000 to $54,999 | 626 (5.4%) | 708 (7.0%) |
| $55,000 to $64,999 | 1,011 (8.7%) | 976 (9.7%) |
| $65,000 to $74,999 | 1,080 (9.3%) | 630 (6.2%) |
| $75,000 to $99,999 | 1,406 (12.1%) | 1,487 (14.7%) |
| $100,000+ | 3,622 (31.1%) | 1,007 (10.0%) |
| Total | 11,637 (100.0%) | 10,091 (100.0%) |
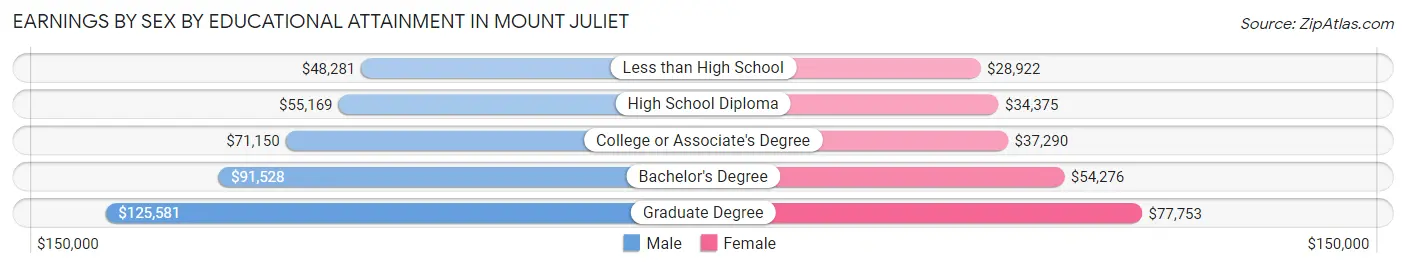
Earnings by Sex by Educational Attainment in Mount Juliet
Average earnings in Mount Juliet are $75,171 for men and $51,207 for women, a difference of 31.9%. Men with an educational attainment of graduate degree enjoy the highest average annual earnings of $125,581, while those with less than high school education earn the least with $48,281. Women with an educational attainment of graduate degree earn the most with the average annual earnings of $77,753, while those with less than high school education have the smallest earnings of $28,922.
| Educational Attainment | Male Income | Female Income |
| Less than High School | $48,281 | $28,922 |
| High School Diploma | $55,169 | $34,375 |
| College or Associate's Degree | $71,150 | $37,290 |
| Bachelor's Degree | $91,528 | $54,276 |
| Graduate Degree | $125,581 | $77,753 |
| Total | $75,171 | $51,207 |
Family Income in Mount Juliet
Family Income Brackets in Mount Juliet
According to the Mount Juliet family income data, there are 2,968 families falling into the $100,000 to $149,999 income range, which is the most common income bracket and makes up 26.9% of all families. Conversely, the $10,000 to $14,999 income bracket is the least frequent group with only 66 families (0.6%) belonging to this category.
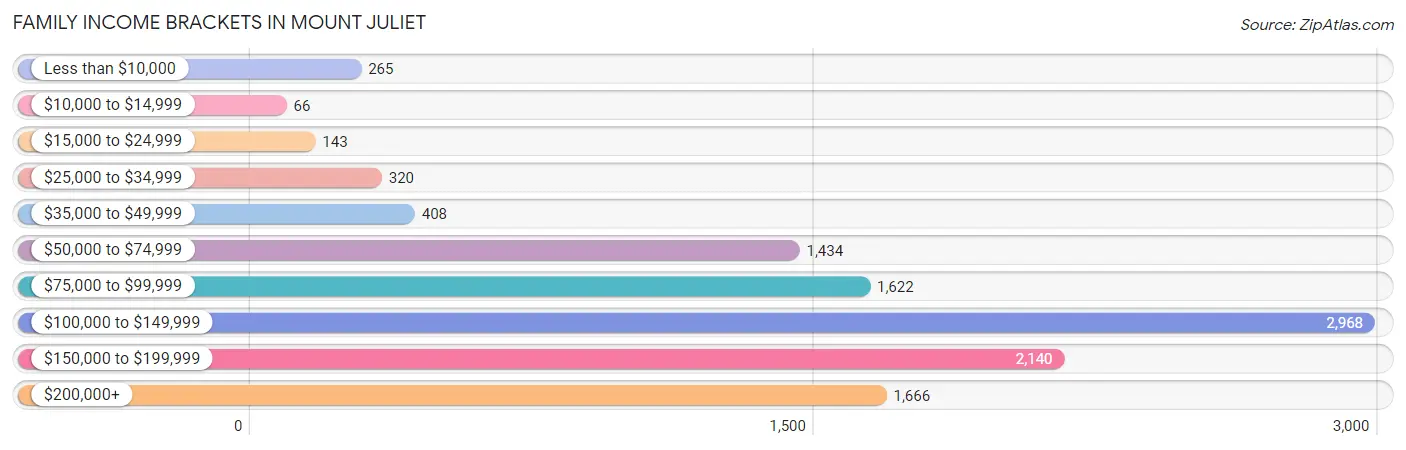
| Income Bracket | # Families | % Families |
| Less than $10,000 | 265 | 2.4% |
| $10,000 to $14,999 | 66 | 0.6% |
| $15,000 to $24,999 | 143 | 1.3% |
| $25,000 to $34,999 | 320 | 2.9% |
| $35,000 to $49,999 | 408 | 3.7% |
| $50,000 to $74,999 | 1,434 | 13.0% |
| $75,000 to $99,999 | 1,622 | 14.7% |
| $100,000 to $149,999 | 2,968 | 26.9% |
| $150,000 to $199,999 | 2,140 | 19.4% |
| $200,000+ | 1,666 | 15.1% |
Family Income by Famaliy Size in Mount Juliet
7+ person families (221 | 2.0%) account for the highest median family income in Mount Juliet with $166,540 per family, while 2-person families (4,824 | 43.7%) have the highest median income of $49,952 per family member.
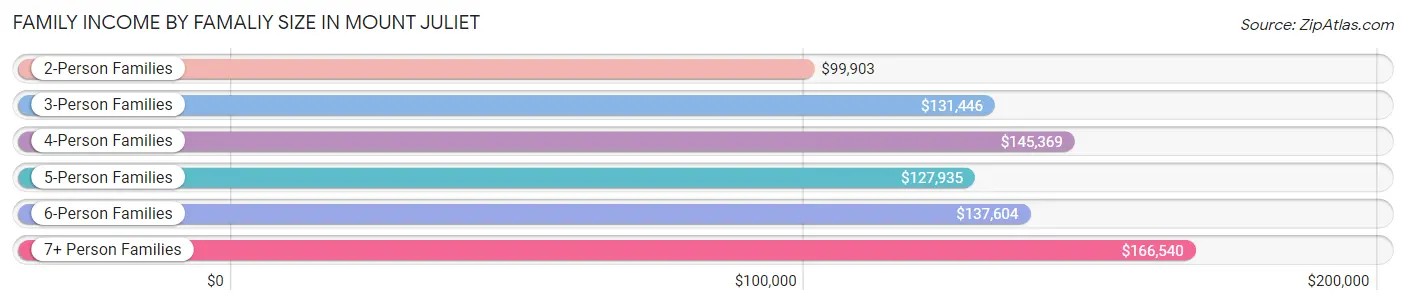
| Income Bracket | # Families | Median Income |
| 2-Person Families | 4,824 (43.7%) | $99,903 |
| 3-Person Families | 2,681 (24.3%) | $131,446 |
| 4-Person Families | 2,091 (19.0%) | $145,369 |
| 5-Person Families | 1,014 (9.2%) | $127,935 |
| 6-Person Families | 202 (1.8%) | $137,604 |
| 7+ Person Families | 221 (2.0%) | $166,540 |
| Total | 11,033 (100.0%) | $121,452 |
Family Income by Number of Earners in Mount Juliet
The median family income in Mount Juliet is $121,452, with families comprising 3+ earners (1,200) having the highest median family income of $158,827, while families with no earners (1,476) have the lowest median family income of $66,319, accounting for 10.9% and 13.4% of families, respectively.
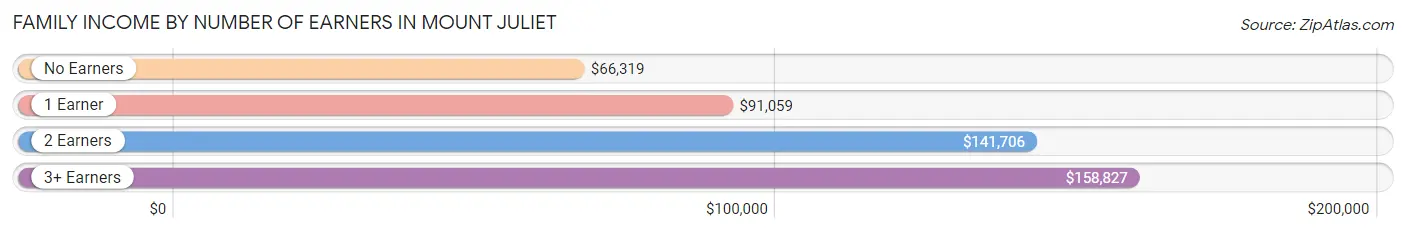
| Number of Earners | # Families | Median Income |
| No Earners | 1,476 (13.4%) | $66,319 |
| 1 Earner | 3,073 (27.9%) | $91,059 |
| 2 Earners | 5,284 (47.9%) | $141,706 |
| 3+ Earners | 1,200 (10.9%) | $158,827 |
| Total | 11,033 (100.0%) | $121,452 |
Household Income in Mount Juliet
Household Income Brackets in Mount Juliet
With 3,467 households falling in the category, the $100,000 to $149,999 income range is the most frequent in Mount Juliet, accounting for 24.0% of all households. In contrast, only 173 households (1.2%) fall into the $10,000 to $14,999 income bracket, making it the least populous group.
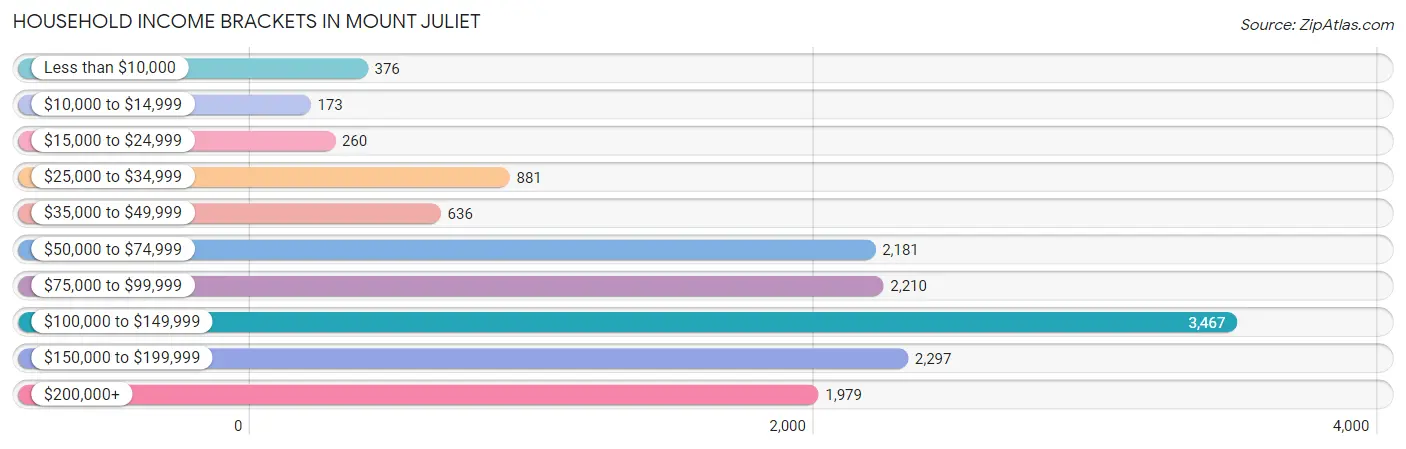
| Income Bracket | # Households | % Households |
| Less than $10,000 | 376 | 2.6% |
| $10,000 to $14,999 | 173 | 1.2% |
| $15,000 to $24,999 | 260 | 1.8% |
| $25,000 to $34,999 | 881 | 6.1% |
| $35,000 to $49,999 | 636 | 4.4% |
| $50,000 to $74,999 | 2,181 | 15.1% |
| $75,000 to $99,999 | 2,210 | 15.3% |
| $100,000 to $149,999 | 3,467 | 24.0% |
| $150,000 to $199,999 | 2,297 | 15.9% |
| $200,000+ | 1,979 | 13.7% |
Household Income by Householder Age in Mount Juliet
The median household income in Mount Juliet is $108,066, with the highest median household income of $125,423 found in the 45 to 64 years age bracket for the primary householder. A total of 5,533 households (38.3%) fall into this category. Meanwhile, the 15 to 24 years age bracket for the primary householder has the lowest median household income of $62,563, with 545 households (3.8%) in this group.
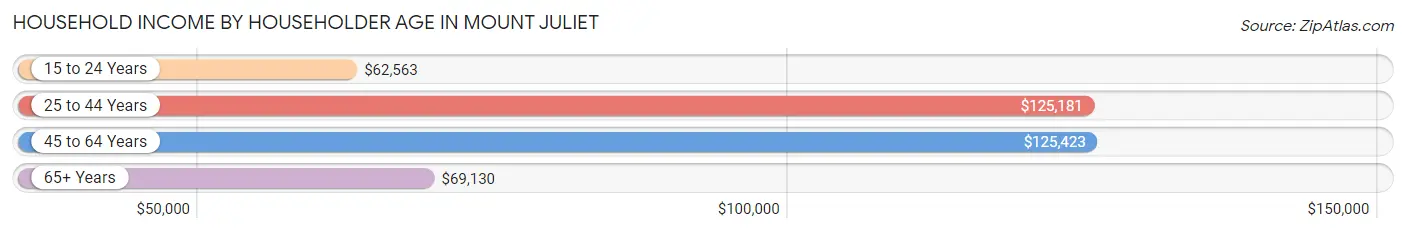
| Income Bracket | # Households | Median Income |
| 15 to 24 Years | 545 (3.8%) | $62,563 |
| 25 to 44 Years | 5,366 (37.1%) | $125,181 |
| 45 to 64 Years | 5,533 (38.3%) | $125,423 |
| 65+ Years | 3,002 (20.8%) | $69,130 |
| Total | 14,446 (100.0%) | $108,066 |
Poverty in Mount Juliet
Income Below Poverty by Sex and Age in Mount Juliet
With 3.8% poverty level for males and 5.8% for females among the residents of Mount Juliet, 5 year old males and 18 to 24 year old females are the most vulnerable to poverty, with 59 males (21.3%) and 235 females (18.4%) in their respective age groups living below the poverty level.
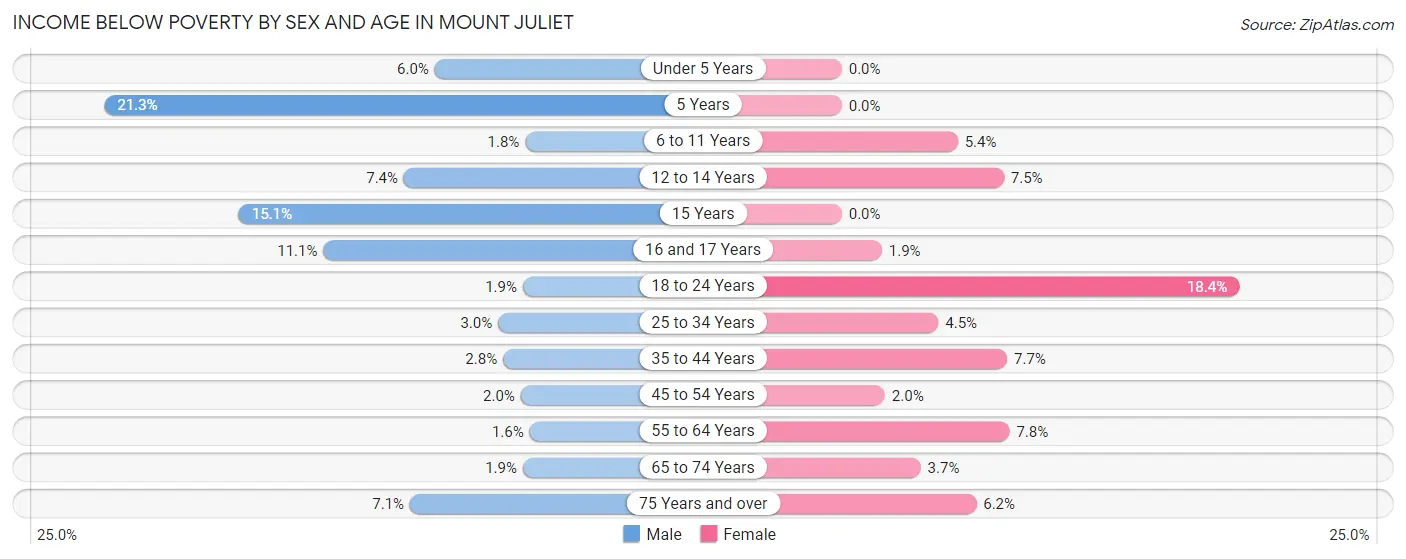
| Age Bracket | Male | Female |
| Under 5 Years | 69 (6.0%) | 0 (0.0%) |
| 5 Years | 59 (21.3%) | 0 (0.0%) |
| 6 to 11 Years | 32 (1.8%) | 87 (5.4%) |
| 12 to 14 Years | 83 (7.4%) | 70 (7.5%) |
| 15 Years | 72 (15.1%) | 0 (0.0%) |
| 16 and 17 Years | 74 (11.1%) | 11 (1.9%) |
| 18 to 24 Years | 31 (1.9%) | 235 (18.4%) |
| 25 to 34 Years | 60 (3.0%) | 92 (4.5%) |
| 35 to 44 Years | 88 (2.8%) | 265 (7.7%) |
| 45 to 54 Years | 57 (2.0%) | 53 (2.0%) |
| 55 to 64 Years | 32 (1.6%) | 192 (7.8%) |
| 65 to 74 Years | 32 (1.9%) | 67 (3.7%) |
| 75 Years and over | 55 (7.1%) | 62 (6.2%) |
| Total | 744 (3.8%) | 1,134 (5.8%) |
Income Above Poverty by Sex and Age in Mount Juliet
According to the poverty statistics in Mount Juliet, males aged 55 to 64 years and females aged under 5 years are the age groups that are most secure financially, with 98.4% of males and 100.0% of females in these age groups living above the poverty line.
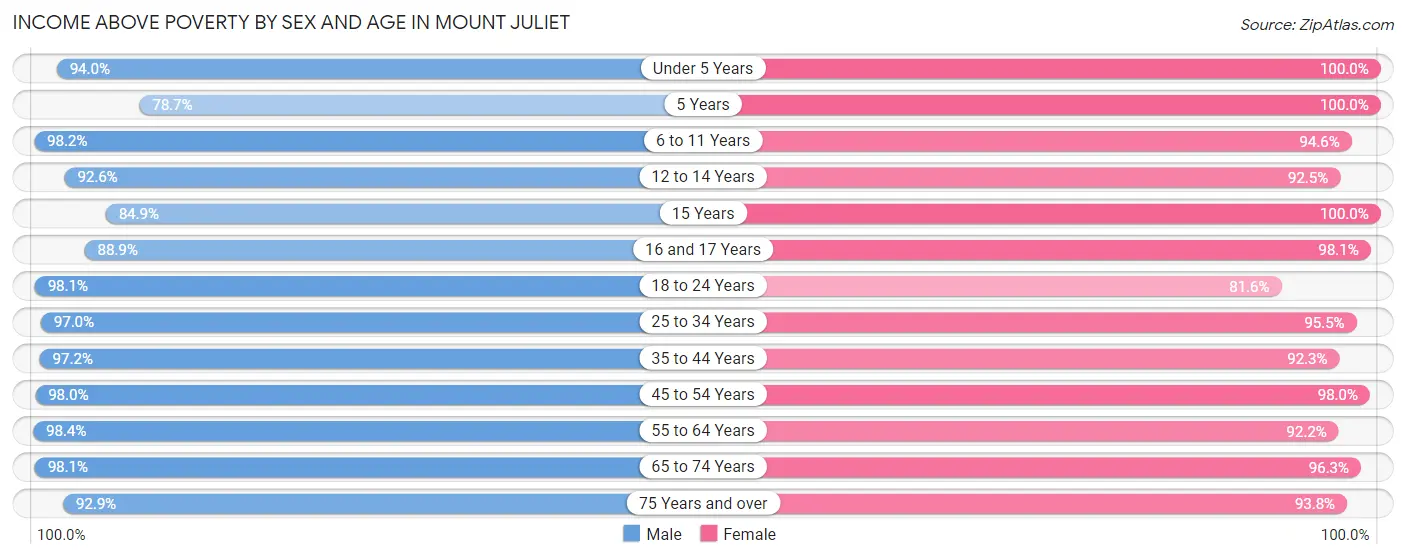
| Age Bracket | Male | Female |
| Under 5 Years | 1,087 (94.0%) | 1,199 (100.0%) |
| 5 Years | 218 (78.7%) | 372 (100.0%) |
| 6 to 11 Years | 1,775 (98.2%) | 1,531 (94.6%) |
| 12 to 14 Years | 1,038 (92.6%) | 861 (92.5%) |
| 15 Years | 406 (84.9%) | 276 (100.0%) |
| 16 and 17 Years | 590 (88.9%) | 581 (98.1%) |
| 18 to 24 Years | 1,618 (98.1%) | 1,040 (81.6%) |
| 25 to 34 Years | 1,920 (97.0%) | 1,960 (95.5%) |
| 35 to 44 Years | 3,058 (97.2%) | 3,188 (92.3%) |
| 45 to 54 Years | 2,824 (98.0%) | 2,603 (98.0%) |
| 55 to 64 Years | 2,005 (98.4%) | 2,275 (92.2%) |
| 65 to 74 Years | 1,667 (98.1%) | 1,762 (96.3%) |
| 75 Years and over | 718 (92.9%) | 931 (93.8%) |
| Total | 18,924 (96.2%) | 18,579 (94.3%) |
Income Below Poverty Among Married-Couple Families in Mount Juliet
The poverty statistics for married-couple families in Mount Juliet show that 1.8% or 164 of the total 9,176 families live below the poverty line. Families with 1 or 2 children have the highest poverty rate of 2.7%, comprising of 101 families. On the other hand, families with 5 or more children have the lowest poverty rate of 0.0%, which includes 0 families.
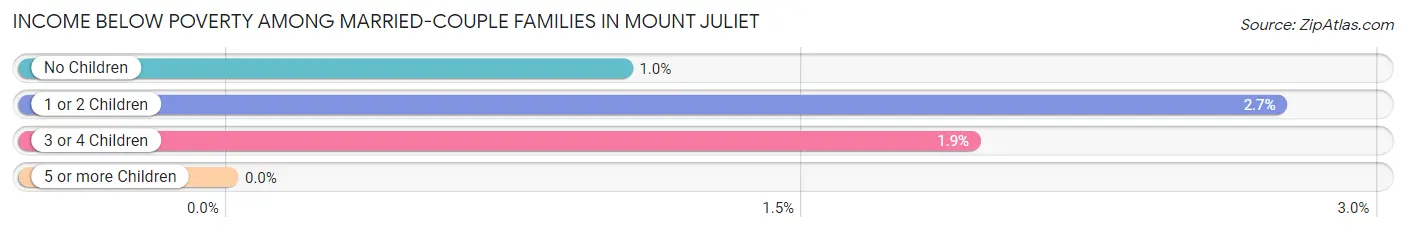
| Children | Above Poverty | Below Poverty |
| No Children | 4,508 (99.0%) | 47 (1.0%) |
| 1 or 2 Children | 3,583 (97.3%) | 101 (2.7%) |
| 3 or 4 Children | 807 (98.1%) | 16 (1.9%) |
| 5 or more Children | 114 (100.0%) | 0 (0.0%) |
| Total | 9,012 (98.2%) | 164 (1.8%) |
Income Below Poverty Among Single-Parent Households in Mount Juliet
According to the poverty data in Mount Juliet, 5.5% or 27 single-father households and 15.7% or 214 single-mother households are living below the poverty line. Among single-father households, those with 1 or 2 children have the highest poverty rate, with 27 households (7.9%) experiencing poverty. Likewise, among single-mother households, those with 1 or 2 children have the highest poverty rate, with 189 households (22.3%) falling below the poverty line.
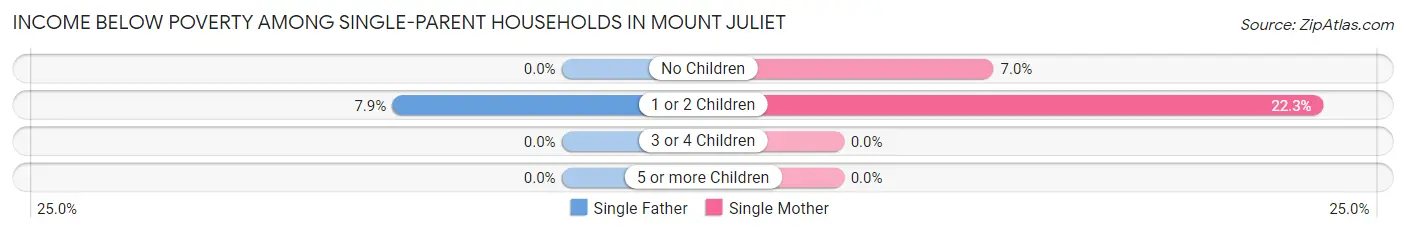
| Children | Single Father | Single Mother |
| No Children | 0 (0.0%) | 25 (7.0%) |
| 1 or 2 Children | 27 (7.9%) | 189 (22.3%) |
| 3 or 4 Children | 0 (0.0%) | 0 (0.0%) |
| 5 or more Children | 0 (0.0%) | 0 (0.0%) |
| Total | 27 (5.5%) | 214 (15.7%) |
Income Below Poverty Among Married-Couple vs Single-Parent Households in Mount Juliet
The poverty data for Mount Juliet shows that 164 of the married-couple family households (1.8%) and 241 of the single-parent households (13.0%) are living below the poverty level. Within the married-couple family households, those with 1 or 2 children have the highest poverty rate, with 101 households (2.7%) falling below the poverty line. Among the single-parent households, those with 1 or 2 children have the highest poverty rate, with 216 household (18.2%) living below poverty.
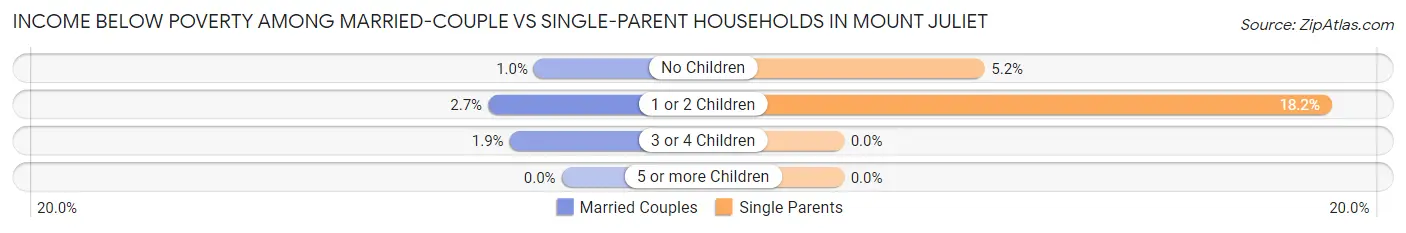
| Children | Married-Couple Families | Single-Parent Households |
| No Children | 47 (1.0%) | 25 (5.2%) |
| 1 or 2 Children | 101 (2.7%) | 216 (18.2%) |
| 3 or 4 Children | 16 (1.9%) | 0 (0.0%) |
| 5 or more Children | 0 (0.0%) | 0 (0.0%) |
| Total | 164 (1.8%) | 241 (13.0%) |
Race in Mount Juliet
The most populous races in Mount Juliet are White / Caucasian (31,411 | 79.5%), Black / African American (3,191 | 8.1%), and Hispanic or Latino (2,667 | 6.8%).
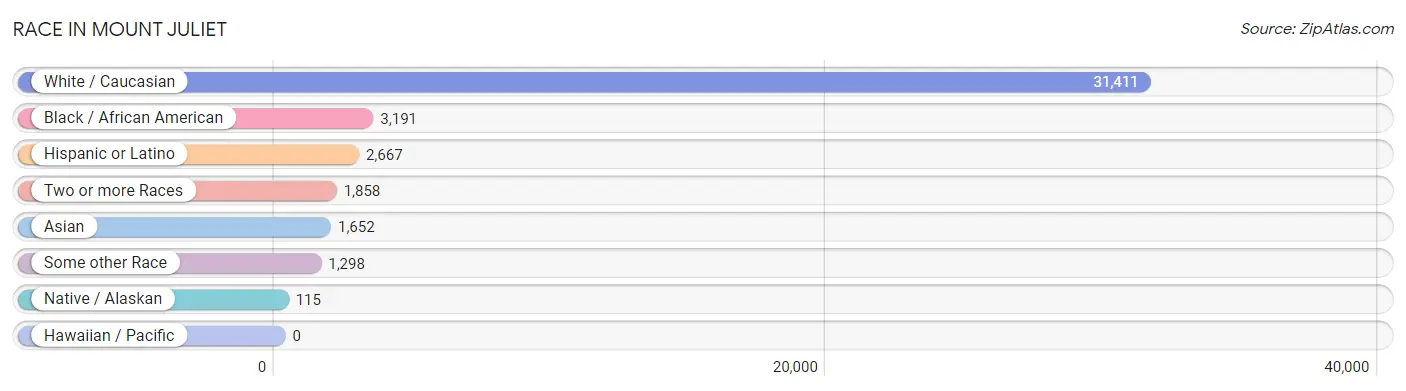
| Race | # Population | % Population |
| Asian | 1,652 | 4.2% |
| Black / African American | 3,191 | 8.1% |
| Hawaiian / Pacific | 0 | 0.0% |
| Hispanic or Latino | 2,667 | 6.8% |
| Native / Alaskan | 115 | 0.3% |
| White / Caucasian | 31,411 | 79.5% |
| Two or more Races | 1,858 | 4.7% |
| Some other Race | 1,298 | 3.3% |
| Total | 39,525 | 100.0% |
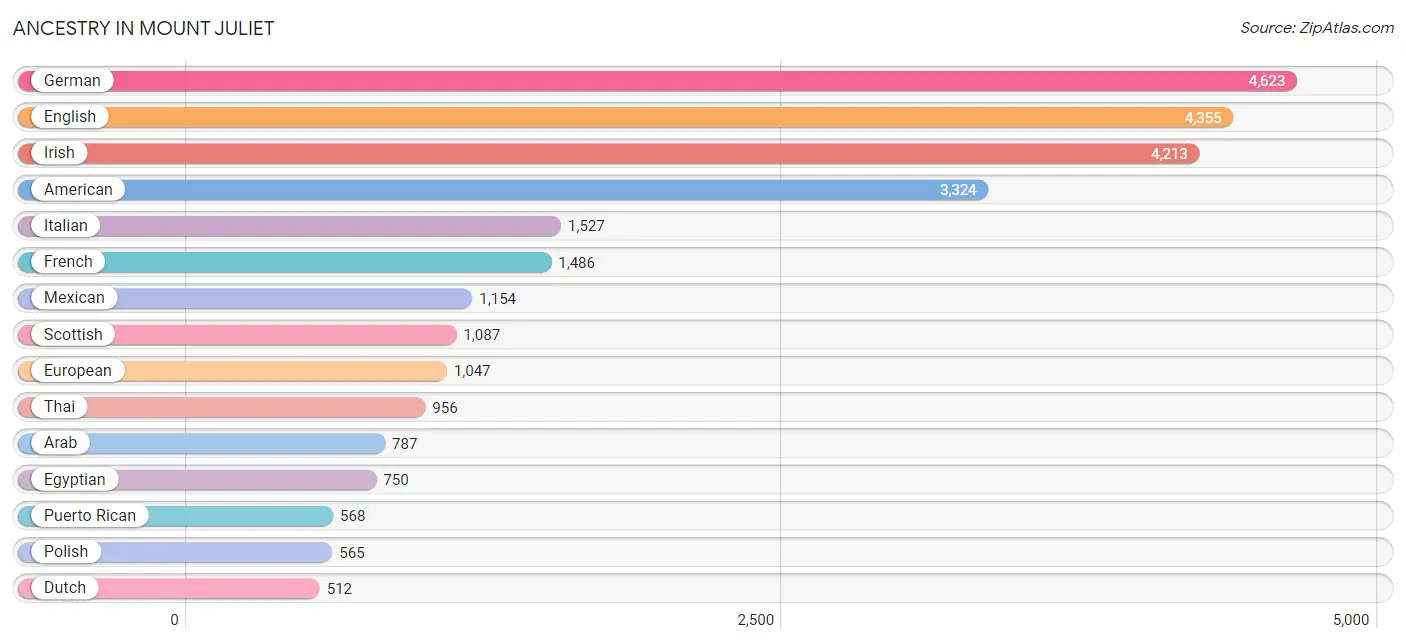
Ancestry in Mount Juliet
The most populous ancestries reported in Mount Juliet are German (4,623 | 11.7%), English (4,355 | 11.0%), Irish (4,213 | 10.7%), American (3,324 | 8.4%), and Italian (1,527 | 3.9%), together accounting for 45.7% of all Mount Juliet residents.
| Ancestry | # Population | % Population |
| African | 56 | 0.1% |
| American | 3,324 | 8.4% |
| Arab | 787 | 2.0% |
| Austrian | 9 | 0.0% |
| Bangladeshi | 47 | 0.1% |
| Bhutanese | 78 | 0.2% |
| Blackfeet | 5 | 0.0% |
| Brazilian | 63 | 0.2% |
| British | 262 | 0.7% |
| Burmese | 143 | 0.4% |
| Canadian | 29 | 0.1% |
| Central American | 194 | 0.5% |
| Cherokee | 127 | 0.3% |
| Chilean | 45 | 0.1% |
| Colombian | 283 | 0.7% |
| Creek | 24 | 0.1% |
| Croatian | 65 | 0.2% |
| Cuban | 5 | 0.0% |
| Czech | 71 | 0.2% |
| Danish | 114 | 0.3% |
| Dutch | 512 | 1.3% |
| Eastern European | 34 | 0.1% |
| Egyptian | 750 | 1.9% |
| English | 4,355 | 11.0% |
| European | 1,047 | 2.6% |
| Filipino | 1 | 0.0% |
| French | 1,486 | 3.8% |
| French Canadian | 46 | 0.1% |
| German | 4,623 | 11.7% |
| Greek | 129 | 0.3% |
| Guatemalan | 117 | 0.3% |
| Haitian | 165 | 0.4% |
| Hungarian | 148 | 0.4% |
| Icelander | 17 | 0.0% |
| Indian (Asian) | 158 | 0.4% |
| Irish | 4,213 | 10.7% |
| Iroquois | 13 | 0.0% |
| Italian | 1,527 | 3.9% |
| Jamaican | 57 | 0.1% |
| Korean | 295 | 0.7% |
| Lebanese | 14 | 0.0% |
| Lithuanian | 9 | 0.0% |
| Malaysian | 97 | 0.3% |
| Mexican | 1,154 | 2.9% |
| Mexican American Indian | 91 | 0.2% |
| Nicaraguan | 32 | 0.1% |
| Nigerian | 20 | 0.1% |
| Northern European | 60 | 0.2% |
| Norwegian | 201 | 0.5% |
| Peruvian | 78 | 0.2% |
| Polish | 565 | 1.4% |
| Portuguese | 112 | 0.3% |
| Potawatomi | 6 | 0.0% |
| Puerto Rican | 568 | 1.4% |
| Russian | 312 | 0.8% |
| Salvadoran | 45 | 0.1% |
| Samoan | 24 | 0.1% |
| Scandinavian | 183 | 0.5% |
| Scotch-Irish | 340 | 0.9% |
| Scottish | 1,087 | 2.8% |
| Serbian | 23 | 0.1% |
| Slovak | 42 | 0.1% |
| South American | 406 | 1.0% |
| Spaniard | 104 | 0.3% |
| Spanish American | 12 | 0.0% |
| Sri Lankan | 39 | 0.1% |
| Subsaharan African | 126 | 0.3% |
| Swedish | 368 | 0.9% |
| Swiss | 72 | 0.2% |
| Thai | 956 | 2.4% |
| Tlingit-Haida | 71 | 0.2% |
| Turkish | 56 | 0.1% |
| Ukrainian | 96 | 0.2% |
| Welsh | 124 | 0.3% |
| Yugoslavian | 53 | 0.1% | View All 75 Rows |
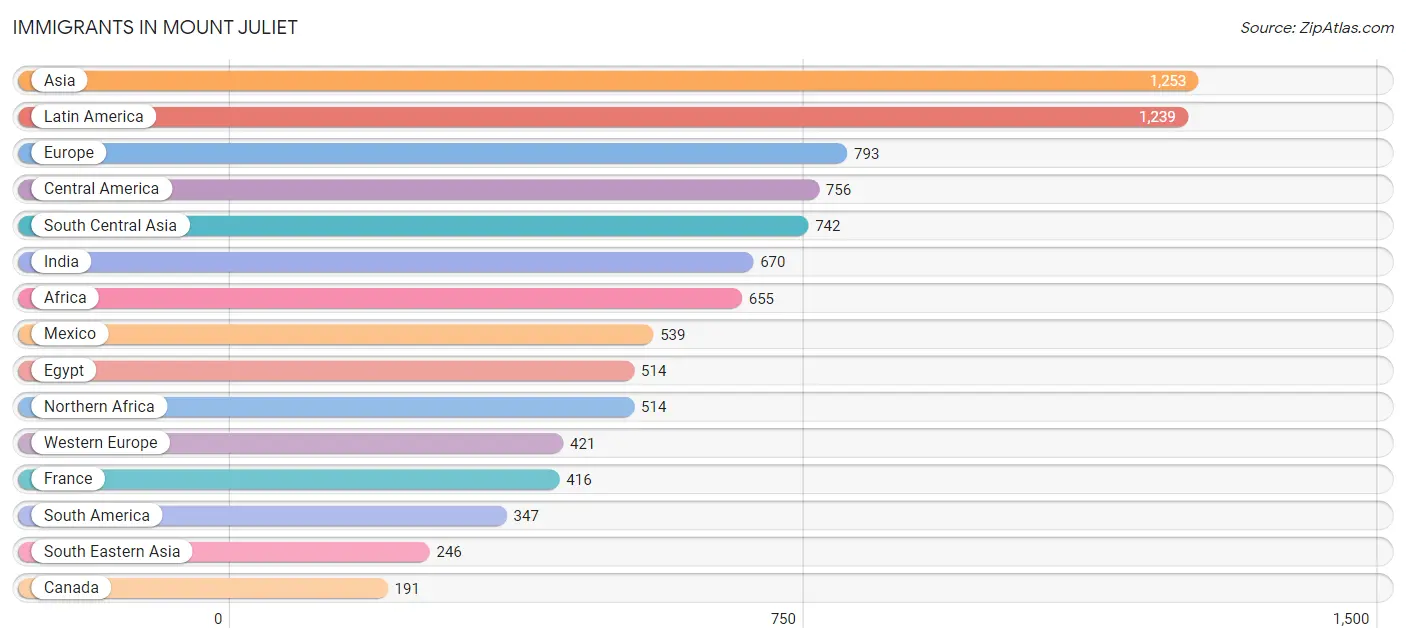
Immigrants in Mount Juliet
The most numerous immigrant groups reported in Mount Juliet came from Asia (1,253 | 3.2%), Latin America (1,239 | 3.1%), Europe (793 | 2.0%), Central America (756 | 1.9%), and South Central Asia (742 | 1.9%), together accounting for 12.1% of all Mount Juliet residents.
| Immigration Origin | # Population | % Population |
| Africa | 655 | 1.7% |
| Asia | 1,253 | 3.2% |
| Bosnia and Herzegovina | 35 | 0.1% |
| Brazil | 20 | 0.1% |
| Canada | 191 | 0.5% |
| Caribbean | 136 | 0.3% |
| Central America | 756 | 1.9% |
| China | 49 | 0.1% |
| Colombia | 170 | 0.4% |
| Dominican Republic | 12 | 0.0% |
| Eastern Africa | 68 | 0.2% |
| Eastern Asia | 138 | 0.4% |
| Eastern Europe | 145 | 0.4% |
| Egypt | 514 | 1.3% |
| El Salvador | 45 | 0.1% |
| England | 58 | 0.2% |
| Ethiopia | 37 | 0.1% |
| Europe | 793 | 2.0% |
| France | 416 | 1.1% |
| Germany | 5 | 0.0% |
| Greece | 111 | 0.3% |
| Guatemala | 117 | 0.3% |
| Guyana | 60 | 0.2% |
| Haiti | 78 | 0.2% |
| India | 670 | 1.7% |
| Iraq | 71 | 0.2% |
| Italy | 16 | 0.0% |
| Jamaica | 46 | 0.1% |
| Japan | 16 | 0.0% |
| Korea | 73 | 0.2% |
| Latin America | 1,239 | 3.1% |
| Mexico | 539 | 1.4% |
| Nepal | 13 | 0.0% |
| Nicaragua | 32 | 0.1% |
| Nigeria | 59 | 0.2% |
| Northern Africa | 514 | 1.3% |
| Northern Europe | 91 | 0.2% |
| Pakistan | 59 | 0.2% |
| Panama | 23 | 0.1% |
| Peru | 66 | 0.2% |
| Philippines | 148 | 0.4% |
| Poland | 13 | 0.0% |
| Russia | 33 | 0.1% |
| Scotland | 4 | 0.0% |
| Singapore | 33 | 0.1% |
| South Africa | 14 | 0.0% |
| South America | 347 | 0.9% |
| South Central Asia | 742 | 1.9% |
| South Eastern Asia | 246 | 0.6% |
| Southern Europe | 136 | 0.3% |
| Spain | 9 | 0.0% |
| Sweden | 17 | 0.0% |
| Taiwan | 1 | 0.0% |
| Turkey | 56 | 0.1% |
| Ukraine | 12 | 0.0% |
| Venezuela | 31 | 0.1% |
| Vietnam | 65 | 0.2% |
| Western Africa | 59 | 0.2% |
| Western Asia | 127 | 0.3% |
| Western Europe | 421 | 1.1% | View All 60 Rows |
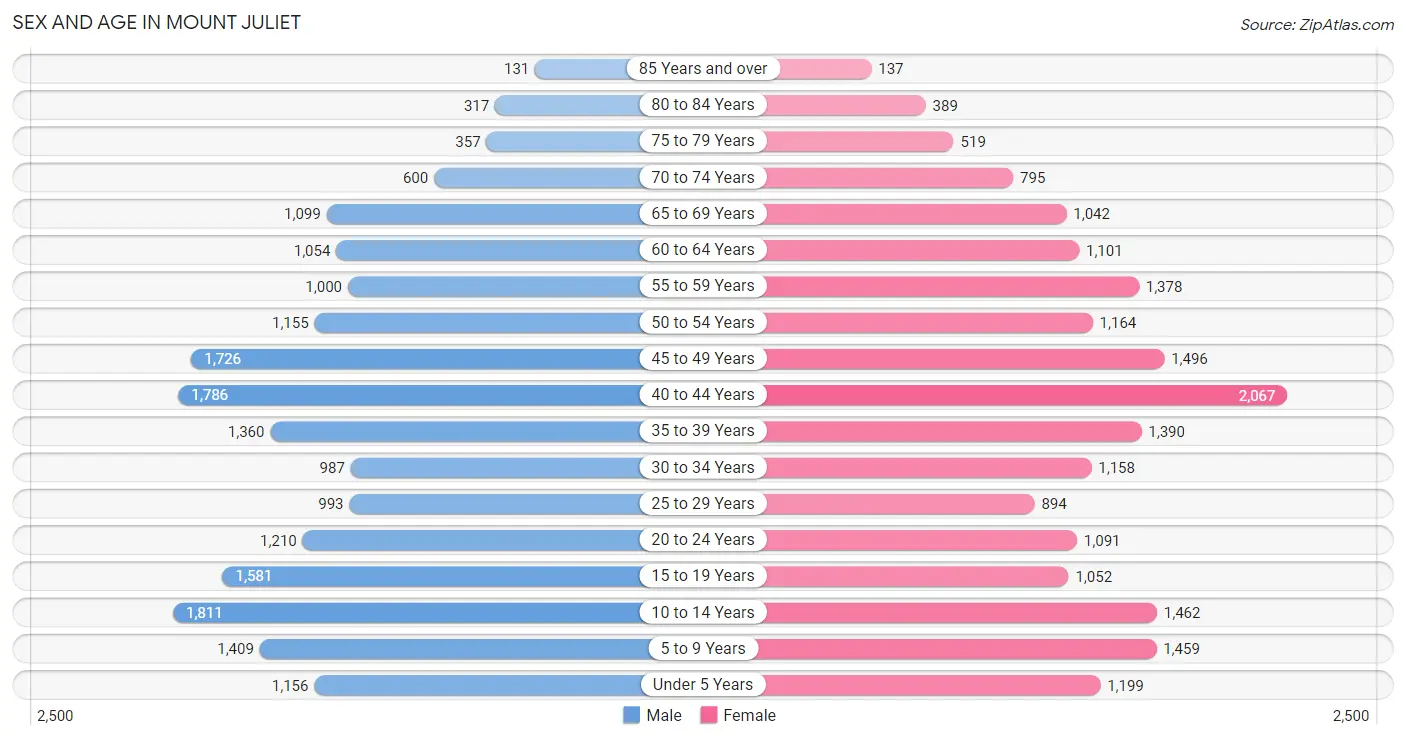
Sex and Age in Mount Juliet
Sex and Age in Mount Juliet
The most populous age groups in Mount Juliet are 10 to 14 Years (1,811 | 9.2%) for men and 40 to 44 Years (2,067 | 10.4%) for women.
| Age Bracket | Male | Female |
| Under 5 Years | 1,156 (5.9%) | 1,199 (6.1%) |
| 5 to 9 Years | 1,409 (7.1%) | 1,459 (7.4%) |
| 10 to 14 Years | 1,811 (9.2%) | 1,462 (7.4%) |
| 15 to 19 Years | 1,581 (8.0%) | 1,052 (5.3%) |
| 20 to 24 Years | 1,210 (6.1%) | 1,091 (5.5%) |
| 25 to 29 Years | 993 (5.0%) | 894 (4.5%) |
| 30 to 34 Years | 987 (5.0%) | 1,158 (5.9%) |
| 35 to 39 Years | 1,360 (6.9%) | 1,390 (7.0%) |
| 40 to 44 Years | 1,786 (9.0%) | 2,067 (10.4%) |
| 45 to 49 Years | 1,726 (8.7%) | 1,496 (7.6%) |
| 50 to 54 Years | 1,155 (5.9%) | 1,164 (5.9%) |
| 55 to 59 Years | 1,000 (5.1%) | 1,378 (7.0%) |
| 60 to 64 Years | 1,054 (5.3%) | 1,101 (5.6%) |
| 65 to 69 Years | 1,099 (5.6%) | 1,042 (5.3%) |
| 70 to 74 Years | 600 (3.0%) | 795 (4.0%) |
| 75 to 79 Years | 357 (1.8%) | 519 (2.6%) |
| 80 to 84 Years | 317 (1.6%) | 389 (2.0%) |
| 85 Years and over | 131 (0.7%) | 137 (0.7%) |
| Total | 19,732 (100.0%) | 19,793 (100.0%) |
Families and Households in Mount Juliet
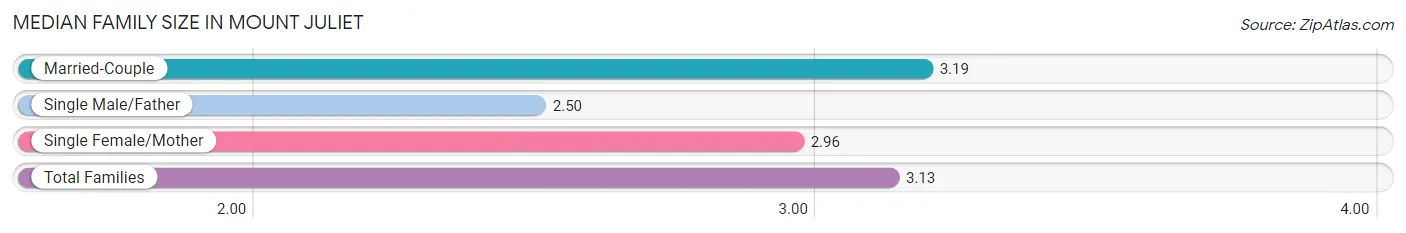
Median Family Size in Mount Juliet
The median family size in Mount Juliet is 3.13 persons per family, with married-couple families (9,176 | 83.2%) accounting for the largest median family size of 3.19 persons per family. On the other hand, single male/father families (492 | 4.5%) represent the smallest median family size with 2.50 persons per family.
| Family Type | # Families | Family Size |
| Married-Couple | 9,176 (83.2%) | 3.19 |
| Single Male/Father | 492 (4.5%) | 2.50 |
| Single Female/Mother | 1,365 (12.4%) | 2.96 |
| Total Families | 11,033 (100.0%) | 3.13 |
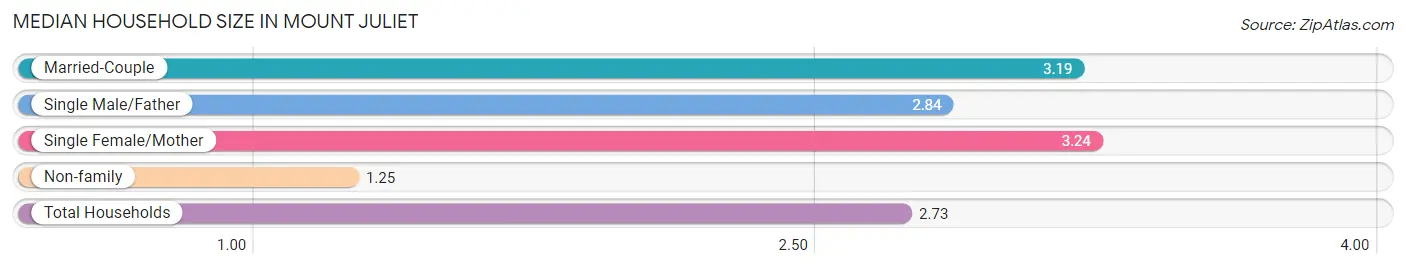
Median Household Size in Mount Juliet
The median household size in Mount Juliet is 2.73 persons per household, with single female/mother households (1,365 | 9.5%) accounting for the largest median household size of 3.24 persons per household. non-family households (3,413 | 23.6%) represent the smallest median household size with 1.25 persons per household.
| Household Type | # Households | Household Size |
| Married-Couple | 9,176 (63.5%) | 3.19 |
| Single Male/Father | 492 (3.4%) | 2.84 |
| Single Female/Mother | 1,365 (9.5%) | 3.24 |
| Non-family | 3,413 (23.6%) | 1.25 |
| Total Households | 14,446 (100.0%) | 2.73 |
Household Size by Marriage Status in Mount Juliet
Out of a total of 14,446 households in Mount Juliet, 11,033 (76.4%) are family households, while 3,413 (23.6%) are nonfamily households. The most numerous type of family households are 2-person households, comprising 4,627, and the most common type of nonfamily households are 1-person households, comprising 2,630.
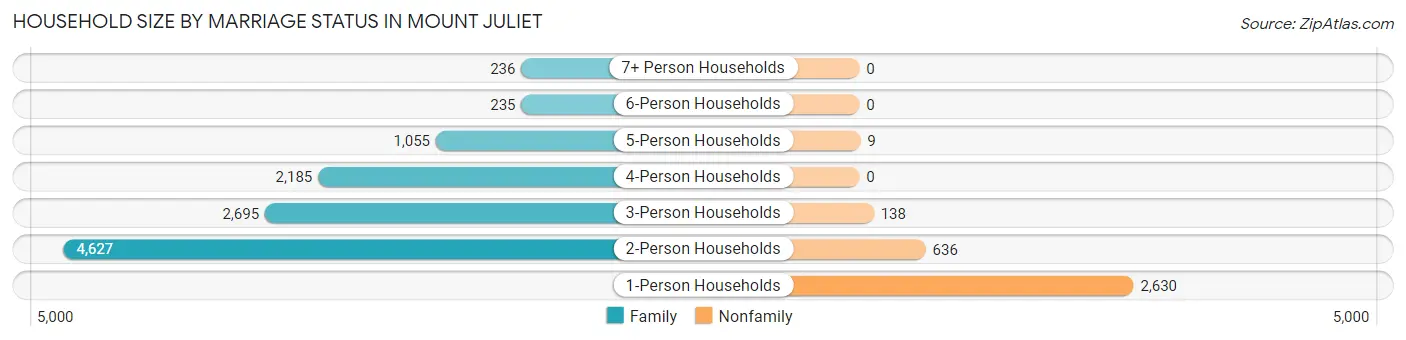
| Household Size | Family Households | Nonfamily Households |
| 1-Person Households | - | 2,630 (18.2%) |
| 2-Person Households | 4,627 (32.0%) | 636 (4.4%) |
| 3-Person Households | 2,695 (18.7%) | 138 (1.0%) |
| 4-Person Households | 2,185 (15.1%) | 0 (0.0%) |
| 5-Person Households | 1,055 (7.3%) | 9 (0.1%) |
| 6-Person Households | 235 (1.6%) | 0 (0.0%) |
| 7+ Person Households | 236 (1.6%) | 0 (0.0%) |
| Total | 11,033 (76.4%) | 3,413 (23.6%) |
Female Fertility in Mount Juliet
Fertility by Age in Mount Juliet
Average fertility rate in Mount Juliet is 43.0 births per 1,000 women. Women in the age bracket of 20 to 34 years have the highest fertility rate with 83.0 births per 1,000 women. Women in the age bracket of 20 to 34 years acount for 63.3% of all women with births.
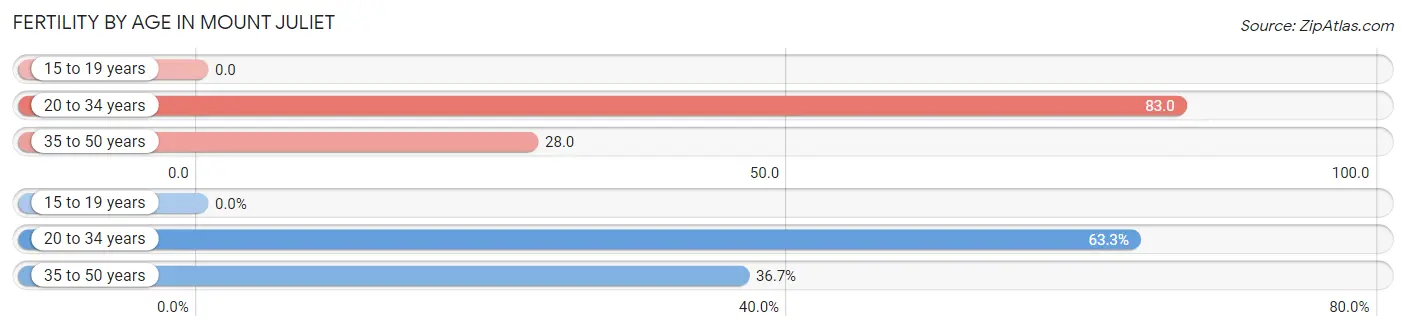
| Age Bracket | Women with Births | Births / 1,000 Women |
| 15 to 19 years | 0 (0.0%) | 0.0 |
| 20 to 34 years | 262 (63.3%) | 83.0 |
| 35 to 50 years | 152 (36.7%) | 28.0 |
| Total | 414 (100.0%) | 43.0 |
Fertility by Age by Marriage Status in Mount Juliet
97.1% of women with births (414) in Mount Juliet are married. The highest percentage of unmarried women with births falls into 20 to 34 years age bracket with 4.6% of them unmarried at the time of birth, while the lowest percentage of unmarried women with births belong to 35 to 50 years age bracket with 0.0% of them unmarried.
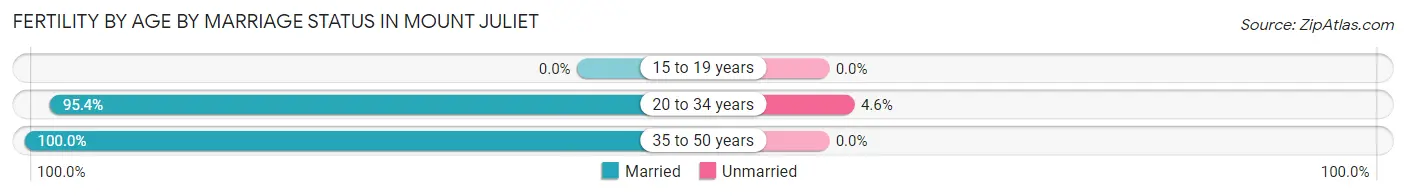
| Age Bracket | Married | Unmarried |
| 15 to 19 years | 0 (0.0%) | 0 (0.0%) |
| 20 to 34 years | 250 (95.4%) | 12 (4.6%) |
| 35 to 50 years | 152 (100.0%) | 0 (0.0%) |
| Total | 402 (97.1%) | 12 (2.9%) |
Fertility by Education in Mount Juliet
Average fertility rate in Mount Juliet is 43.0 births per 1,000 women. Women with the education attainment of bachelor's degree have the highest fertility rate of 73.0 births per 1,000 women, while women with the education attainment of high school diploma have the lowest fertility at 13.0 births per 1,000 women. Women with the education attainment of bachelor's degree represent 52.7% of all women with births.
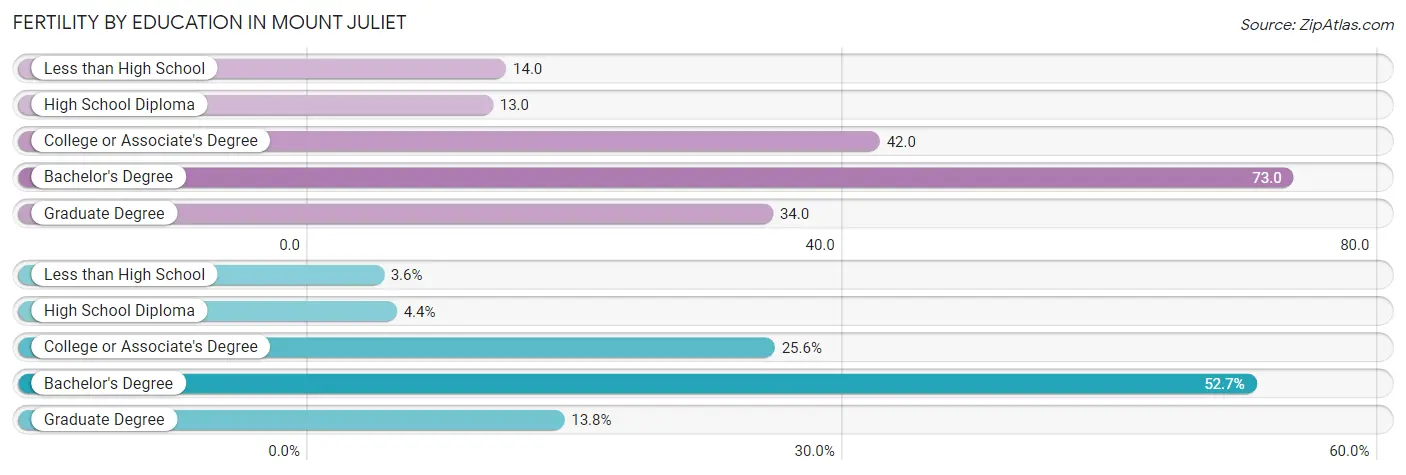
| Educational Attainment | Women with Births | Births / 1,000 Women |
| Less than High School | 15 (3.6%) | 14.0 |
| High School Diploma | 18 (4.3%) | 13.0 |
| College or Associate's Degree | 106 (25.6%) | 42.0 |
| Bachelor's Degree | 218 (52.7%) | 73.0 |
| Graduate Degree | 57 (13.8%) | 34.0 |
| Total | 414 (100.0%) | 43.0 |
Fertility by Education by Marriage Status in Mount Juliet
2.9% of women with births in Mount Juliet are unmarried. Women with the educational attainment of less than high school are most likely to be married with 100.0% of them married at childbirth, while women with the educational attainment of bachelor's degree are least likely to be married with 5.5% of them unmarried at childbirth.
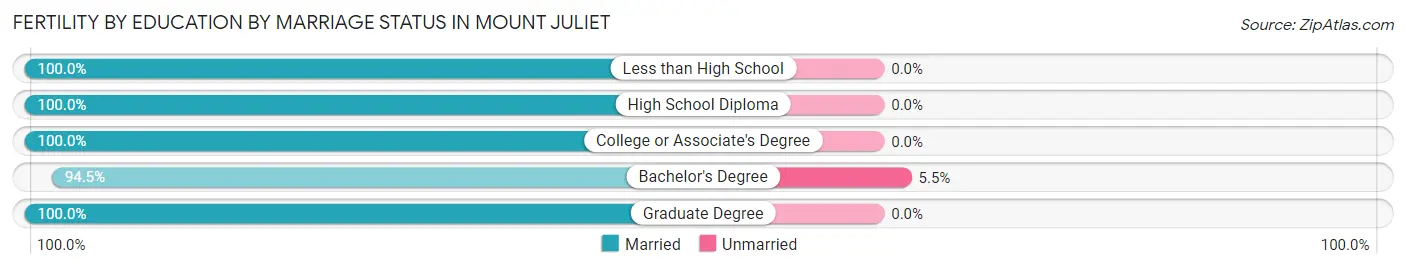
| Educational Attainment | Married | Unmarried |
| Less than High School | 15 (100.0%) | 0 (0.0%) |
| High School Diploma | 18 (100.0%) | 0 (0.0%) |
| College or Associate's Degree | 106 (100.0%) | 0 (0.0%) |
| Bachelor's Degree | 206 (94.5%) | 12 (5.5%) |
| Graduate Degree | 57 (100.0%) | 0 (0.0%) |
| Total | 402 (97.1%) | 12 (2.9%) |
Employment Characteristics in Mount Juliet
Employment by Class of Employer in Mount Juliet
Among the 20,013 employed individuals in Mount Juliet, private company employees (14,419 | 72.1%), not-for-profit organizations (1,382 | 6.9%), and local government employees (1,138 | 5.7%) make up the most common classes of employment.
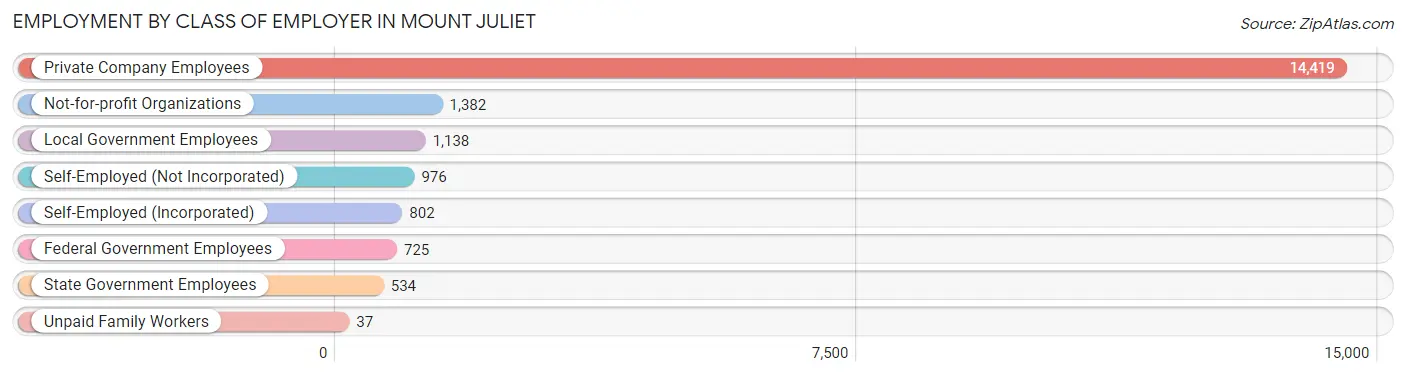
| Employer Class | # Employees | % Employees |
| Private Company Employees | 14,419 | 72.1% |
| Self-Employed (Incorporated) | 802 | 4.0% |
| Self-Employed (Not Incorporated) | 976 | 4.9% |
| Not-for-profit Organizations | 1,382 | 6.9% |
| Local Government Employees | 1,138 | 5.7% |
| State Government Employees | 534 | 2.7% |
| Federal Government Employees | 725 | 3.6% |
| Unpaid Family Workers | 37 | 0.2% |
| Total | 20,013 | 100.0% |
Employment Status by Age in Mount Juliet
According to the labor force statistics for Mount Juliet, out of the total population over 16 years of age (30,275), 69.3% or 20,981 individuals are in the labor force, with 3.8% or 797 of them unemployed. The age group with the highest labor force participation rate is 25 to 29 years, with 94.1% or 1,776 individuals in the labor force. Within the labor force, the 20 to 24 years age range has the highest percentage of unemployed individuals, with 21.5% or 364 of them being unemployed.
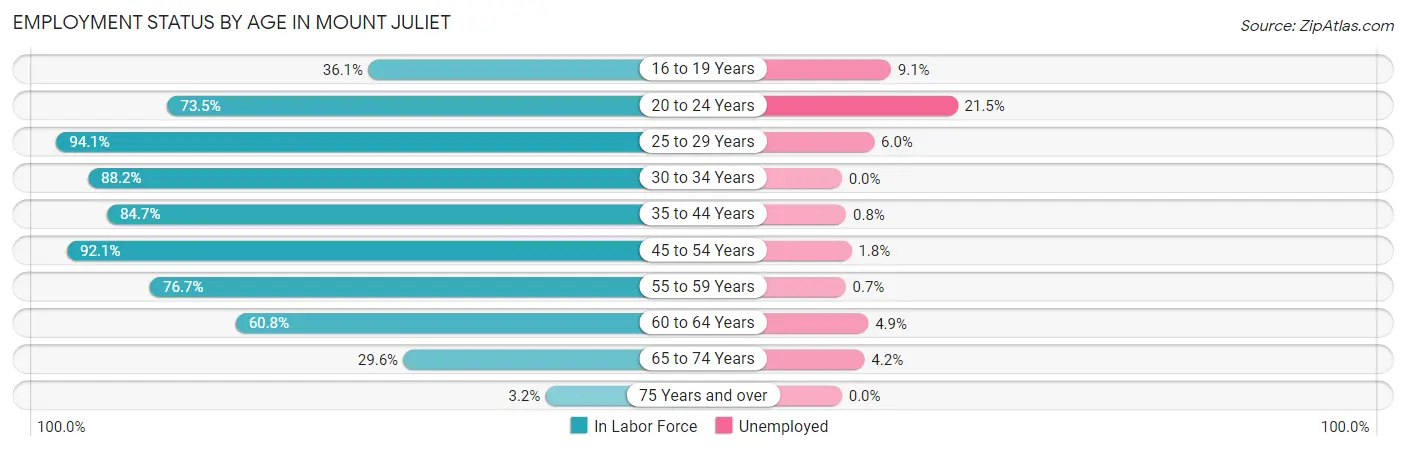
| Age Bracket | In Labor Force | Unemployed |
| 16 to 19 Years | 678 (36.1%) | 62 (9.1%) |
| 20 to 24 Years | 1,691 (73.5%) | 364 (21.5%) |
| 25 to 29 Years | 1,776 (94.1%) | 107 (6.0%) |
| 30 to 34 Years | 1,892 (88.2%) | 0 (0.0%) |
| 35 to 44 Years | 5,593 (84.7%) | 45 (0.8%) |
| 45 to 54 Years | 5,103 (92.1%) | 92 (1.8%) |
| 55 to 59 Years | 1,824 (76.7%) | 13 (0.7%) |
| 60 to 64 Years | 1,310 (60.8%) | 64 (4.9%) |
| 65 to 74 Years | 1,047 (29.6%) | 44 (4.2%) |
| 75 Years and over | 59 (3.2%) | 0 (0.0%) |
| Total | 20,981 (69.3%) | 797 (3.8%) |
Employment Status by Educational Attainment in Mount Juliet
According to labor force statistics for Mount Juliet, 84.5% of individuals (17,499) out of the total population between 25 and 64 years of age (20,709) are in the labor force, with 1.8% or 315 of them being unemployed. The group with the highest labor force participation rate are those with the educational attainment of bachelor's degree or higher, with 90.7% or 9,470 individuals in the labor force. Within the labor force, individuals with less than high school education have the highest percentage of unemployment, with 14.8% or 66 of them being unemployed.
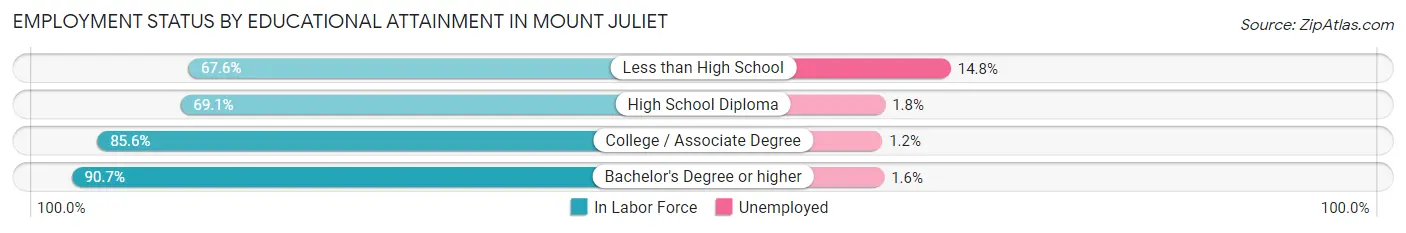
| Educational Attainment | In Labor Force | Unemployed |
| Less than High School | 446 (67.6%) | 98 (14.8%) |
| High School Diploma | 2,708 (69.1%) | 71 (1.8%) |
| College / Associate Degree | 4,870 (85.6%) | 68 (1.2%) |
| Bachelor's Degree or higher | 9,470 (90.7%) | 167 (1.6%) |
| Total | 17,499 (84.5%) | 373 (1.8%) |
Employment Occupations by Sex in Mount Juliet
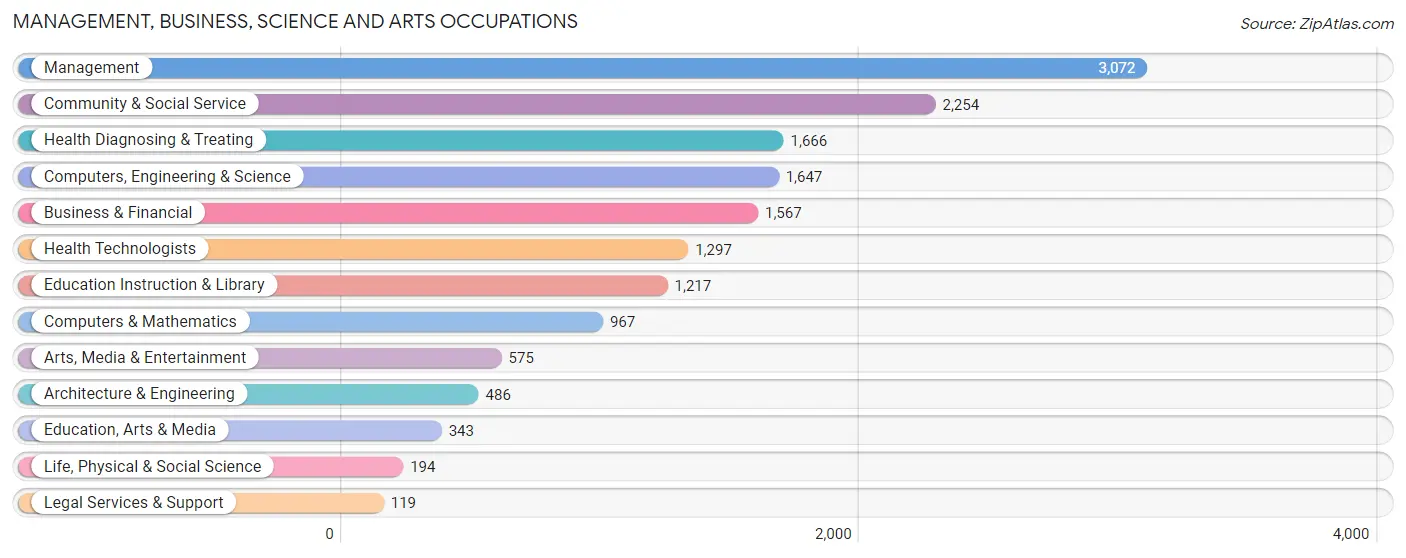
Management, Business, Science and Arts Occupations
The most common Management, Business, Science and Arts occupations in Mount Juliet are Management (3,072 | 15.2%), Community & Social Service (2,254 | 11.2%), Health Diagnosing & Treating (1,666 | 8.3%), Computers, Engineering & Science (1,647 | 8.2%), and Business & Financial (1,567 | 7.8%).
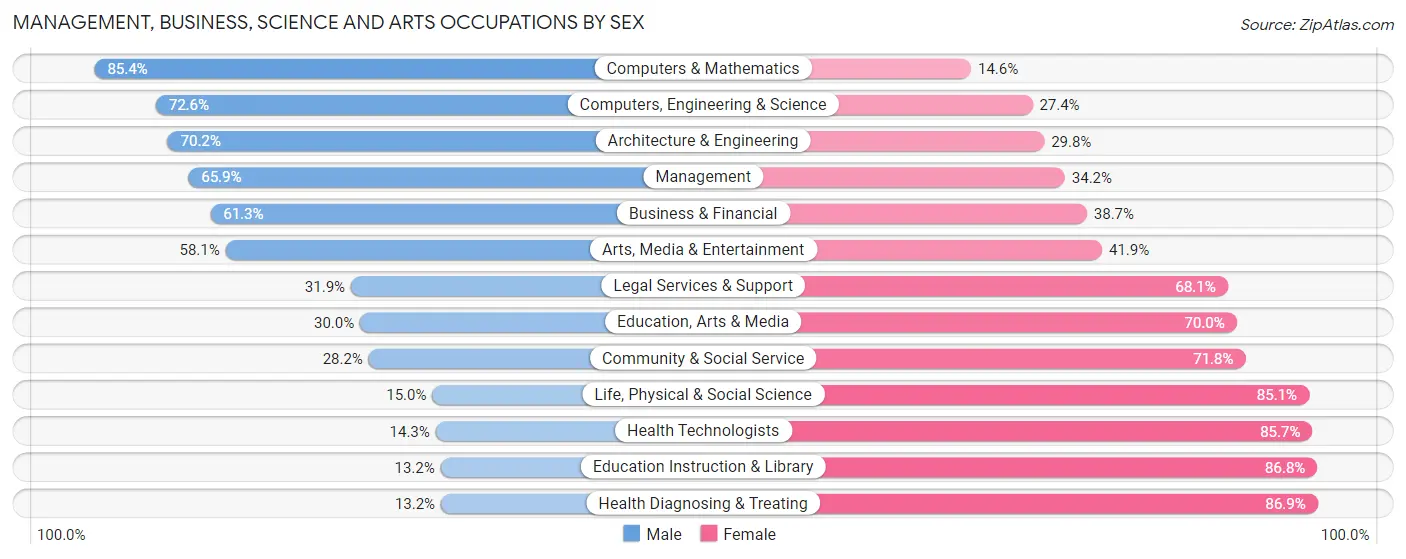
Management, Business, Science and Arts Occupations by Sex
Within the Management, Business, Science and Arts occupations in Mount Juliet, the most male-oriented occupations are Computers & Mathematics (85.4%), Computers, Engineering & Science (72.6%), and Architecture & Engineering (70.2%), while the most female-oriented occupations are Health Diagnosing & Treating (86.9%), Education Instruction & Library (86.8%), and Health Technologists (85.7%).
| Occupation | Male | Female |
| Management | 2,023 (65.8%) | 1,049 (34.2%) |
| Business & Financial | 960 (61.3%) | 607 (38.7%) |
| Computers, Engineering & Science | 1,196 (72.6%) | 451 (27.4%) |
| Computers & Mathematics | 826 (85.4%) | 141 (14.6%) |
| Architecture & Engineering | 341 (70.2%) | 145 (29.8%) |
| Life, Physical & Social Science | 29 (14.9%) | 165 (85.1%) |
| Community & Social Service | 636 (28.2%) | 1,618 (71.8%) |
| Education, Arts & Media | 103 (30.0%) | 240 (70.0%) |
| Legal Services & Support | 38 (31.9%) | 81 (68.1%) |
| Education Instruction & Library | 161 (13.2%) | 1,056 (86.8%) |
| Arts, Media & Entertainment | 334 (58.1%) | 241 (41.9%) |
| Health Diagnosing & Treating | 219 (13.2%) | 1,447 (86.9%) |
| Health Technologists | 185 (14.3%) | 1,112 (85.7%) |
| Total (Category) | 5,034 (49.3%) | 5,172 (50.7%) |
| Total (Overall) | 10,983 (54.4%) | 9,189 (45.6%) |
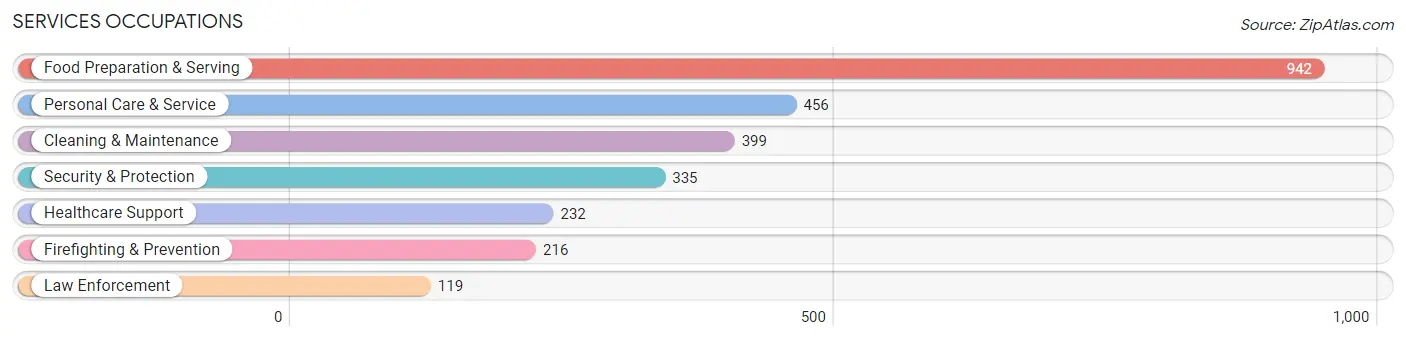
Services Occupations
The most common Services occupations in Mount Juliet are Food Preparation & Serving (942 | 4.7%), Personal Care & Service (456 | 2.3%), Cleaning & Maintenance (399 | 2.0%), Security & Protection (335 | 1.7%), and Healthcare Support (232 | 1.1%).
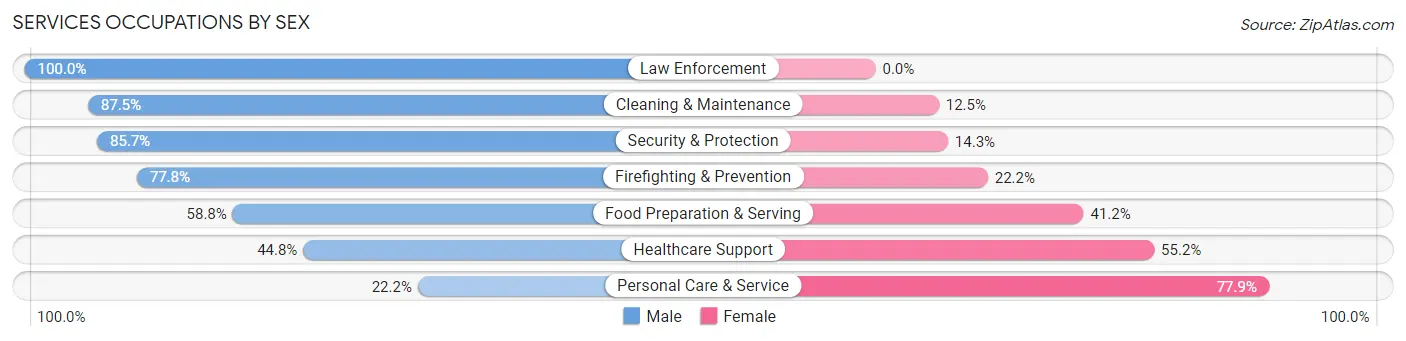
Services Occupations by Sex
Within the Services occupations in Mount Juliet, the most male-oriented occupations are Law Enforcement (100.0%), Cleaning & Maintenance (87.5%), and Security & Protection (85.7%), while the most female-oriented occupations are Personal Care & Service (77.8%), Healthcare Support (55.2%), and Food Preparation & Serving (41.2%).
| Occupation | Male | Female |
| Healthcare Support | 104 (44.8%) | 128 (55.2%) |
| Security & Protection | 287 (85.7%) | 48 (14.3%) |
| Firefighting & Prevention | 168 (77.8%) | 48 (22.2%) |
| Law Enforcement | 119 (100.0%) | 0 (0.0%) |
| Food Preparation & Serving | 554 (58.8%) | 388 (41.2%) |
| Cleaning & Maintenance | 349 (87.5%) | 50 (12.5%) |
| Personal Care & Service | 101 (22.2%) | 355 (77.8%) |
| Total (Category) | 1,395 (59.0%) | 969 (41.0%) |
| Total (Overall) | 10,983 (54.4%) | 9,189 (45.6%) |
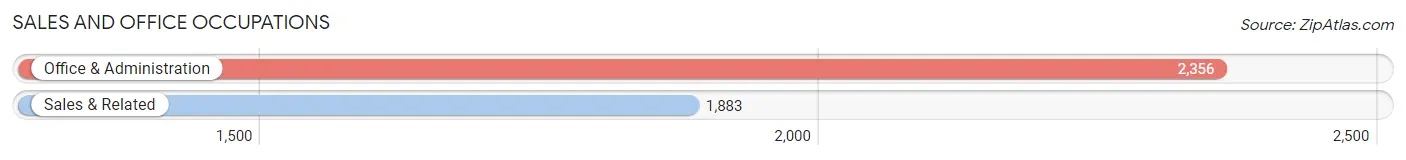
Sales and Office Occupations
The most common Sales and Office occupations in Mount Juliet are Office & Administration (2,356 | 11.7%), and Sales & Related (1,883 | 9.3%).
Sales and Office Occupations by Sex
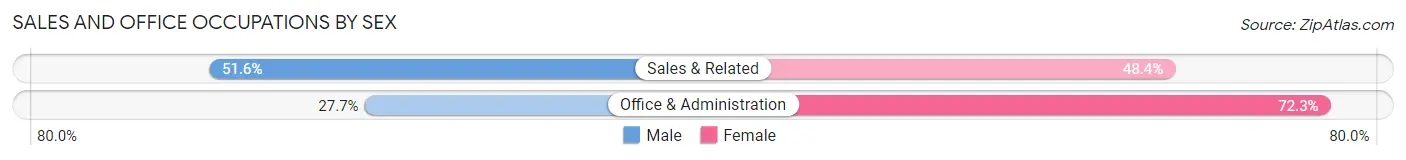
| Occupation | Male | Female |
| Sales & Related | 972 (51.6%) | 911 (48.4%) |
| Office & Administration | 653 (27.7%) | 1,703 (72.3%) |
| Total (Category) | 1,625 (38.3%) | 2,614 (61.7%) |
| Total (Overall) | 10,983 (54.4%) | 9,189 (45.6%) |
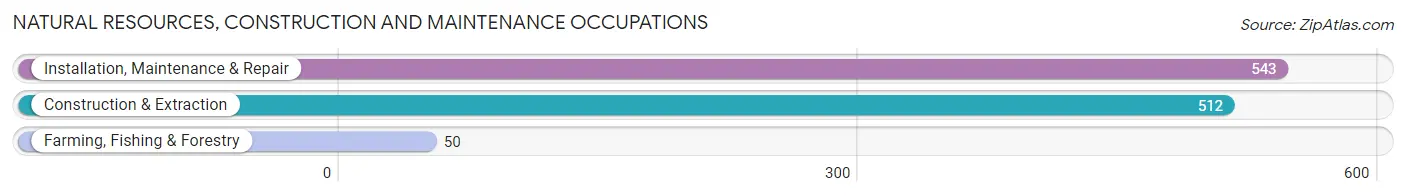
Natural Resources, Construction and Maintenance Occupations
The most common Natural Resources, Construction and Maintenance occupations in Mount Juliet are Installation, Maintenance & Repair (543 | 2.7%), Construction & Extraction (512 | 2.5%), and Farming, Fishing & Forestry (50 | 0.3%).
Natural Resources, Construction and Maintenance Occupations by Sex
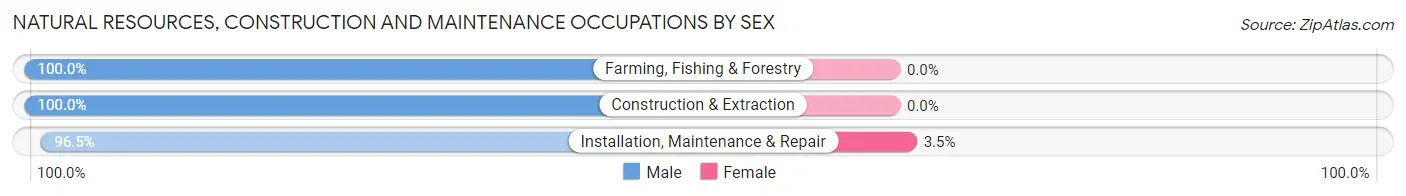
| Occupation | Male | Female |
| Farming, Fishing & Forestry | 50 (100.0%) | 0 (0.0%) |
| Construction & Extraction | 512 (100.0%) | 0 (0.0%) |
| Installation, Maintenance & Repair | 524 (96.5%) | 19 (3.5%) |
| Total (Category) | 1,086 (98.3%) | 19 (1.7%) |
| Total (Overall) | 10,983 (54.4%) | 9,189 (45.6%) |
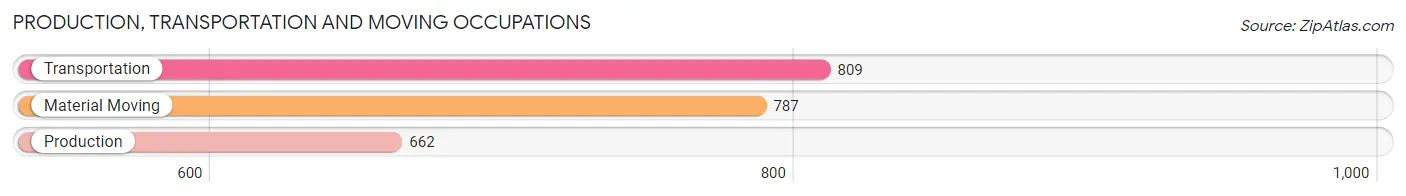
Production, Transportation and Moving Occupations
The most common Production, Transportation and Moving occupations in Mount Juliet are Transportation (809 | 4.0%), Material Moving (787 | 3.9%), and Production (662 | 3.3%).
Production, Transportation and Moving Occupations by Sex
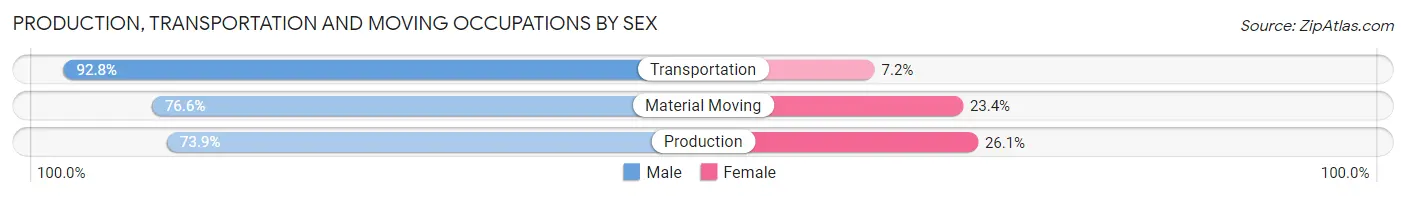
| Occupation | Male | Female |
| Production | 489 (73.9%) | 173 (26.1%) |
| Transportation | 751 (92.8%) | 58 (7.2%) |
| Material Moving | 603 (76.6%) | 184 (23.4%) |
| Total (Category) | 1,843 (81.6%) | 415 (18.4%) |
| Total (Overall) | 10,983 (54.4%) | 9,189 (45.6%) |
Employment Industries by Sex in Mount Juliet
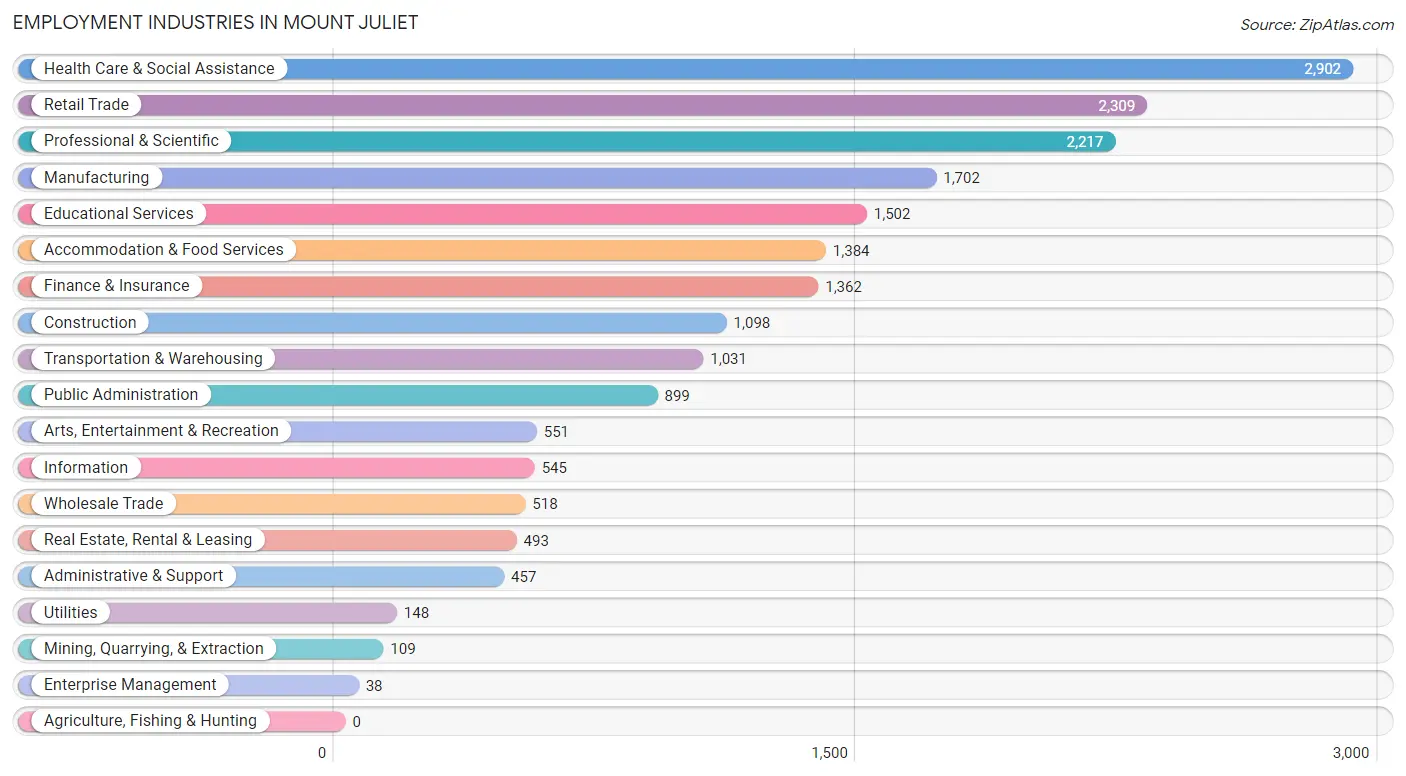
Employment Industries in Mount Juliet
The major employment industries in Mount Juliet include Health Care & Social Assistance (2,902 | 14.4%), Retail Trade (2,309 | 11.5%), Professional & Scientific (2,217 | 11.0%), Manufacturing (1,702 | 8.4%), and Educational Services (1,502 | 7.4%).
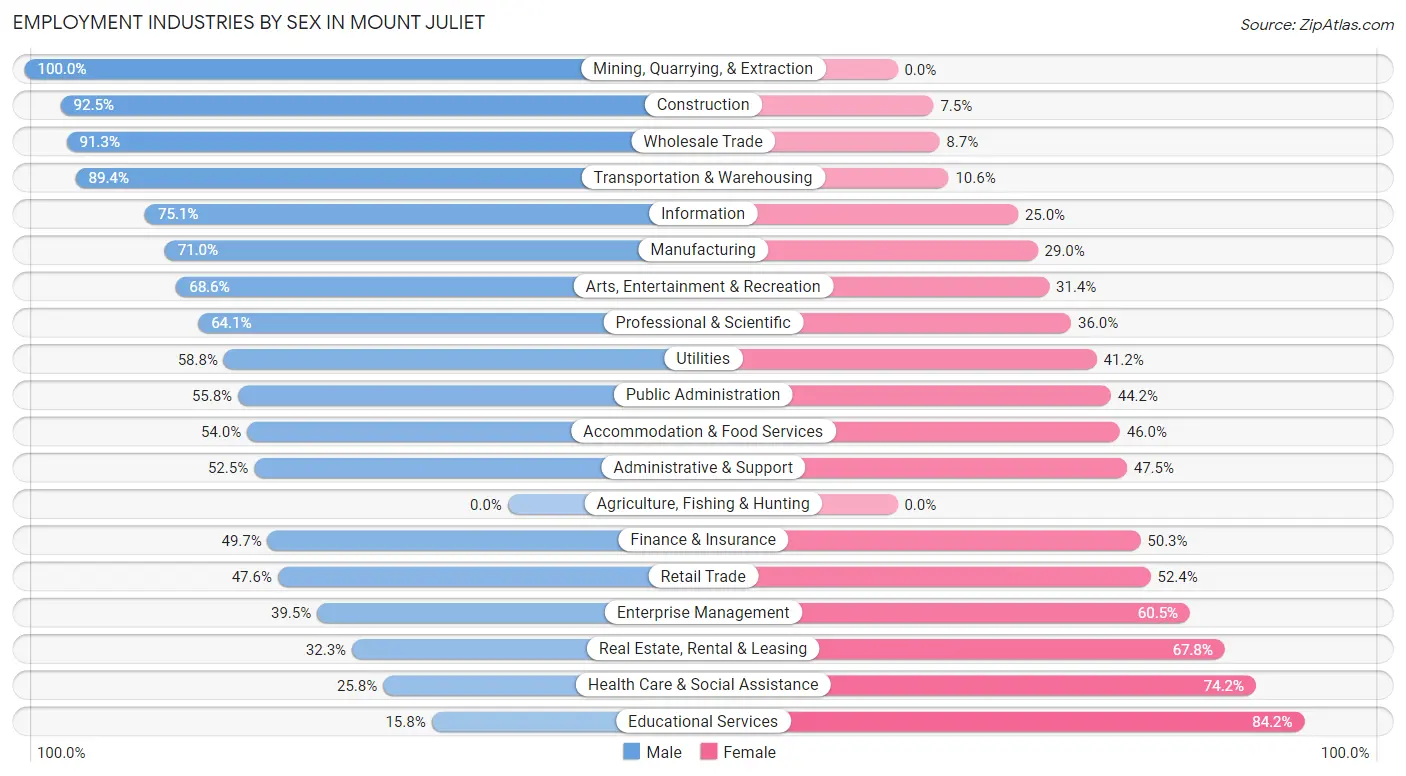
Employment Industries by Sex in Mount Juliet
The Mount Juliet industries that see more men than women are Mining, Quarrying, & Extraction (100.0%), Construction (92.5%), and Wholesale Trade (91.3%), whereas the industries that tend to have a higher number of women are Educational Services (84.2%), Health Care & Social Assistance (74.2%), and Real Estate, Rental & Leasing (67.7%).
| Industry | Male | Female |
| Agriculture, Fishing & Hunting | 0 (0.0%) | 0 (0.0%) |
| Mining, Quarrying, & Extraction | 109 (100.0%) | 0 (0.0%) |
| Construction | 1,016 (92.5%) | 82 (7.5%) |
| Manufacturing | 1,208 (71.0%) | 494 (29.0%) |
| Wholesale Trade | 473 (91.3%) | 45 (8.7%) |
| Retail Trade | 1,099 (47.6%) | 1,210 (52.4%) |
| Transportation & Warehousing | 922 (89.4%) | 109 (10.6%) |
| Utilities | 87 (58.8%) | 61 (41.2%) |
| Information | 409 (75.0%) | 136 (24.9%) |
| Finance & Insurance | 677 (49.7%) | 685 (50.3%) |
| Real Estate, Rental & Leasing | 159 (32.3%) | 334 (67.7%) |
| Professional & Scientific | 1,420 (64.0%) | 797 (35.9%) |
| Enterprise Management | 15 (39.5%) | 23 (60.5%) |
| Administrative & Support | 240 (52.5%) | 217 (47.5%) |
| Educational Services | 237 (15.8%) | 1,265 (84.2%) |
| Health Care & Social Assistance | 749 (25.8%) | 2,153 (74.2%) |
| Arts, Entertainment & Recreation | 378 (68.6%) | 173 (31.4%) |
| Accommodation & Food Services | 747 (54.0%) | 637 (46.0%) |
| Public Administration | 502 (55.8%) | 397 (44.2%) |
| Total | 10,983 (54.4%) | 9,189 (45.6%) |
Education in Mount Juliet
School Enrollment in Mount Juliet
The most common levels of schooling among the 10,774 students in Mount Juliet are high school (2,978 | 27.6%), middle school (2,366 | 22.0%), and elementary school (2,252 | 20.9%).
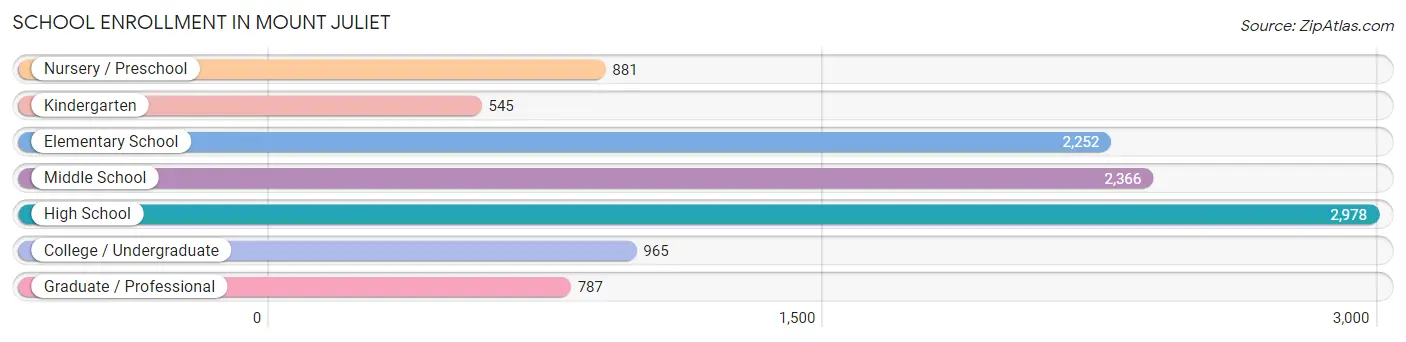
| School Level | # Students | % Students |
| Nursery / Preschool | 881 | 8.2% |
| Kindergarten | 545 | 5.1% |
| Elementary School | 2,252 | 20.9% |
| Middle School | 2,366 | 22.0% |
| High School | 2,978 | 27.6% |
| College / Undergraduate | 965 | 9.0% |
| Graduate / Professional | 787 | 7.3% |
| Total | 10,774 | 100.0% |
School Enrollment by Age by Funding Source in Mount Juliet
Out of a total of 10,774 students who are enrolled in schools in Mount Juliet, 2,036 (18.9%) attend a private institution, while the remaining 8,738 (81.1%) are enrolled in public schools. The age group of 3 to 4 year olds has the highest likelihood of being enrolled in private schools, with 417 (63.5% in the age bracket) enrolled. Conversely, the age group of 15 to 17 year olds has the lowest likelihood of being enrolled in a private school, with 1,845 (92.9% in the age bracket) attending a public institution.
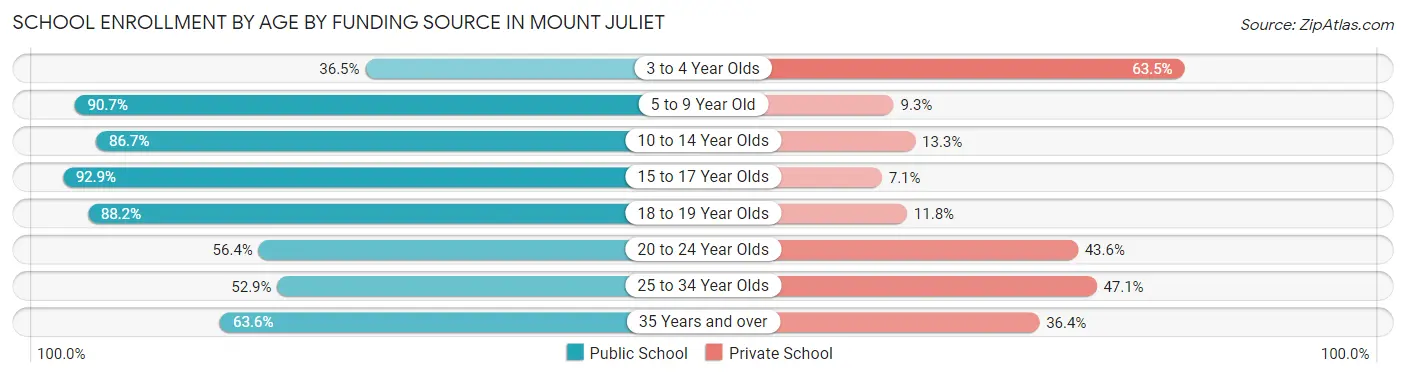
| Age Bracket | Public School | Private School |
| 3 to 4 Year Olds | 240 (36.5%) | 417 (63.5%) |
| 5 to 9 Year Old | 2,486 (90.7%) | 255 (9.3%) |
| 10 to 14 Year Olds | 2,684 (86.7%) | 412 (13.3%) |
| 15 to 17 Year Olds | 1,845 (92.9%) | 141 (7.1%) |
| 18 to 19 Year Olds | 457 (88.2%) | 61 (11.8%) |
| 20 to 24 Year Olds | 529 (56.4%) | 409 (43.6%) |
| 25 to 34 Year Olds | 163 (52.9%) | 145 (47.1%) |
| 35 Years and over | 337 (63.6%) | 193 (36.4%) |
| Total | 8,738 (81.1%) | 2,036 (18.9%) |
Educational Attainment by Field of Study in Mount Juliet
Business (2,787 | 20.5%), science & technology (1,840 | 13.5%), education (1,490 | 11.0%), engineering (1,161 | 8.6%), and computers & mathematics (990 | 7.3%) are the most common fields of study among 13,585 individuals in Mount Juliet who have obtained a bachelor's degree or higher.
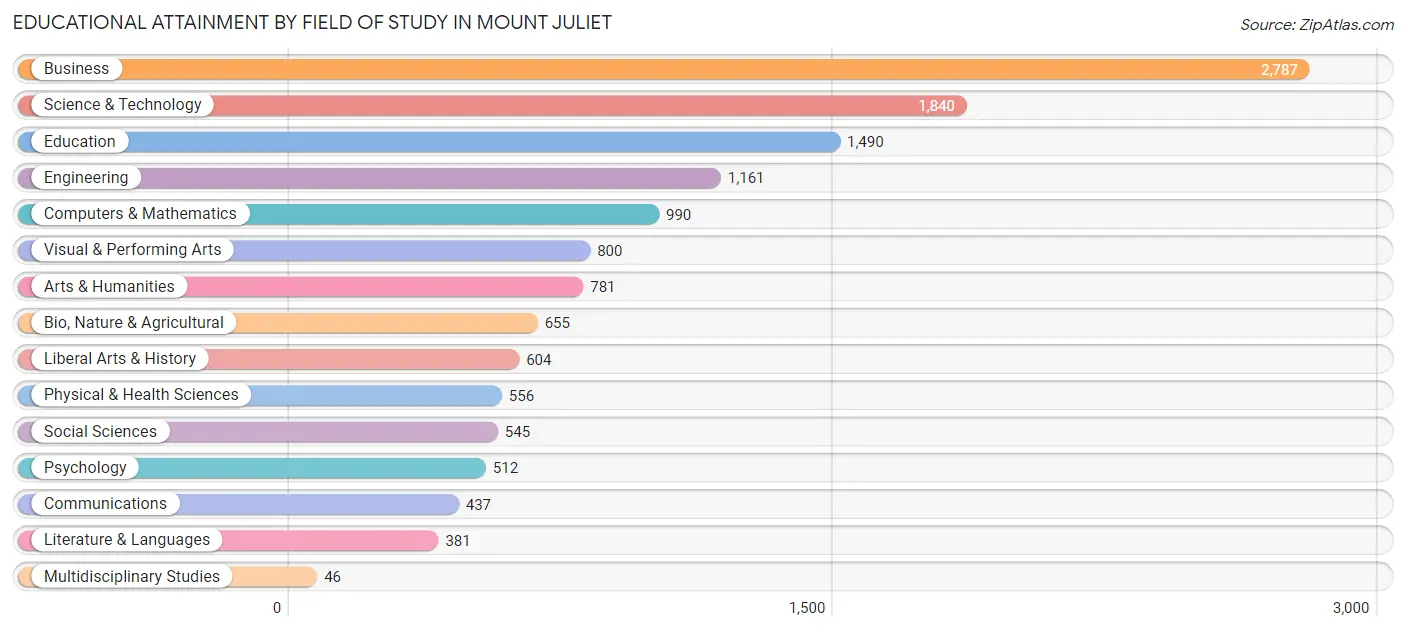
| Field of Study | # Graduates | % Graduates |
| Computers & Mathematics | 990 | 7.3% |
| Bio, Nature & Agricultural | 655 | 4.8% |
| Physical & Health Sciences | 556 | 4.1% |
| Psychology | 512 | 3.8% |
| Social Sciences | 545 | 4.0% |
| Engineering | 1,161 | 8.6% |
| Multidisciplinary Studies | 46 | 0.3% |
| Science & Technology | 1,840 | 13.5% |
| Business | 2,787 | 20.5% |
| Education | 1,490 | 11.0% |
| Literature & Languages | 381 | 2.8% |
| Liberal Arts & History | 604 | 4.4% |
| Visual & Performing Arts | 800 | 5.9% |
| Communications | 437 | 3.2% |
| Arts & Humanities | 781 | 5.8% |
| Total | 13,585 | 100.0% |
Transportation & Commute in Mount Juliet
Vehicle Availability by Sex in Mount Juliet
The most prevalent vehicle ownership categories in Mount Juliet are males with 2 vehicles (5,182, accounting for 47.2%) and females with 2 vehicles (4,336, making up 57.4%).
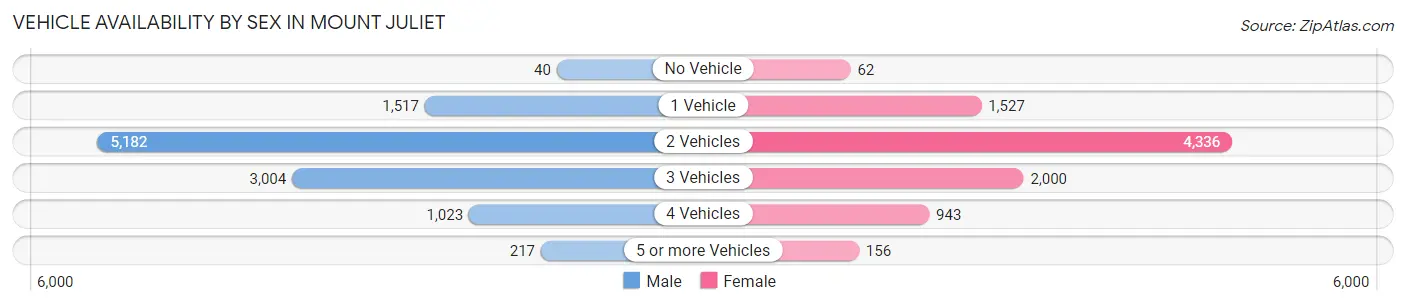
| Vehicles Available | Male | Female |
| No Vehicle | 40 (0.4%) | 62 (0.7%) |
| 1 Vehicle | 1,517 (13.8%) | 1,527 (16.9%) |
| 2 Vehicles | 5,182 (47.2%) | 4,336 (48.0%) |
| 3 Vehicles | 3,004 (27.4%) | 2,000 (22.2%) |
| 4 Vehicles | 1,023 (9.3%) | 943 (10.4%) |
| 5 or more Vehicles | 217 (2.0%) | 156 (1.7%) |
| Total | 10,983 (100.0%) | 9,024 (100.0%) |
Commute Time in Mount Juliet
The most frequently occuring commute durations in Mount Juliet are 30 to 34 minutes (4,082 commuters, 24.6%), 45 to 59 minutes (2,764 commuters, 16.7%), and 20 to 24 minutes (1,895 commuters, 11.4%).
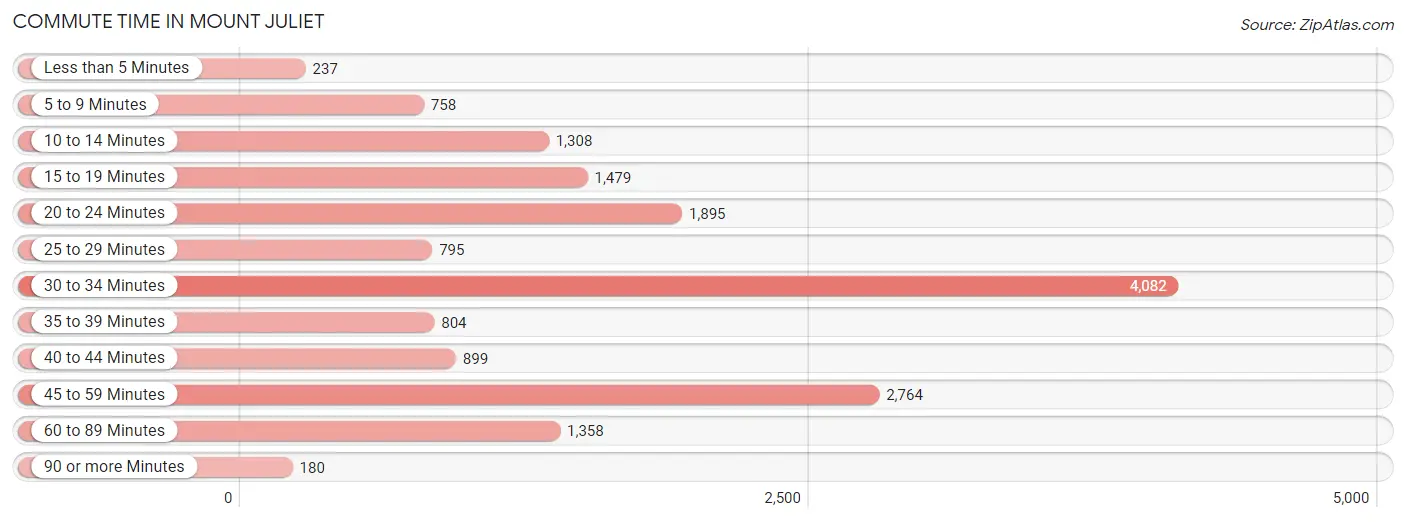
| Commute Time | # Commuters | % Commuters |
| Less than 5 Minutes | 237 | 1.4% |
| 5 to 9 Minutes | 758 | 4.6% |
| 10 to 14 Minutes | 1,308 | 7.9% |
| 15 to 19 Minutes | 1,479 | 8.9% |
| 20 to 24 Minutes | 1,895 | 11.4% |
| 25 to 29 Minutes | 795 | 4.8% |
| 30 to 34 Minutes | 4,082 | 24.6% |
| 35 to 39 Minutes | 804 | 4.9% |
| 40 to 44 Minutes | 899 | 5.4% |
| 45 to 59 Minutes | 2,764 | 16.7% |
| 60 to 89 Minutes | 1,358 | 8.2% |
| 90 or more Minutes | 180 | 1.1% |
Commute Time by Sex in Mount Juliet
The most common commute times in Mount Juliet are 30 to 34 minutes (2,653 commuters, 29.1%) for males and 30 to 34 minutes (1,429 commuters, 19.2%) for females.
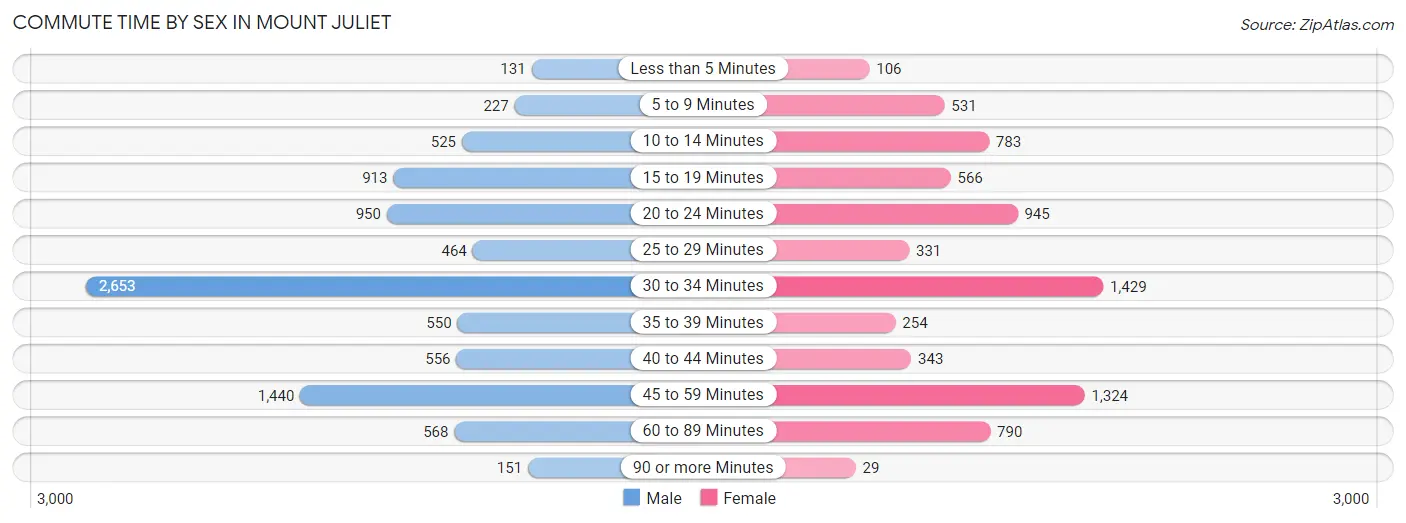
| Commute Time | Male | Female |
| Less than 5 Minutes | 131 (1.4%) | 106 (1.4%) |
| 5 to 9 Minutes | 227 (2.5%) | 531 (7.1%) |
| 10 to 14 Minutes | 525 (5.8%) | 783 (10.5%) |
| 15 to 19 Minutes | 913 (10.0%) | 566 (7.6%) |
| 20 to 24 Minutes | 950 (10.4%) | 945 (12.7%) |
| 25 to 29 Minutes | 464 (5.1%) | 331 (4.4%) |
| 30 to 34 Minutes | 2,653 (29.1%) | 1,429 (19.2%) |
| 35 to 39 Minutes | 550 (6.0%) | 254 (3.4%) |
| 40 to 44 Minutes | 556 (6.1%) | 343 (4.6%) |
| 45 to 59 Minutes | 1,440 (15.8%) | 1,324 (17.8%) |
| 60 to 89 Minutes | 568 (6.2%) | 790 (10.6%) |
| 90 or more Minutes | 151 (1.7%) | 29 (0.4%) |
Time of Departure to Work by Sex in Mount Juliet
The most frequent times of departure to work in Mount Juliet are 6:00 AM to 6:29 AM (1,498, 16.4%) for males and 6:30 AM to 6:59 AM (1,566, 21.1%) for females.
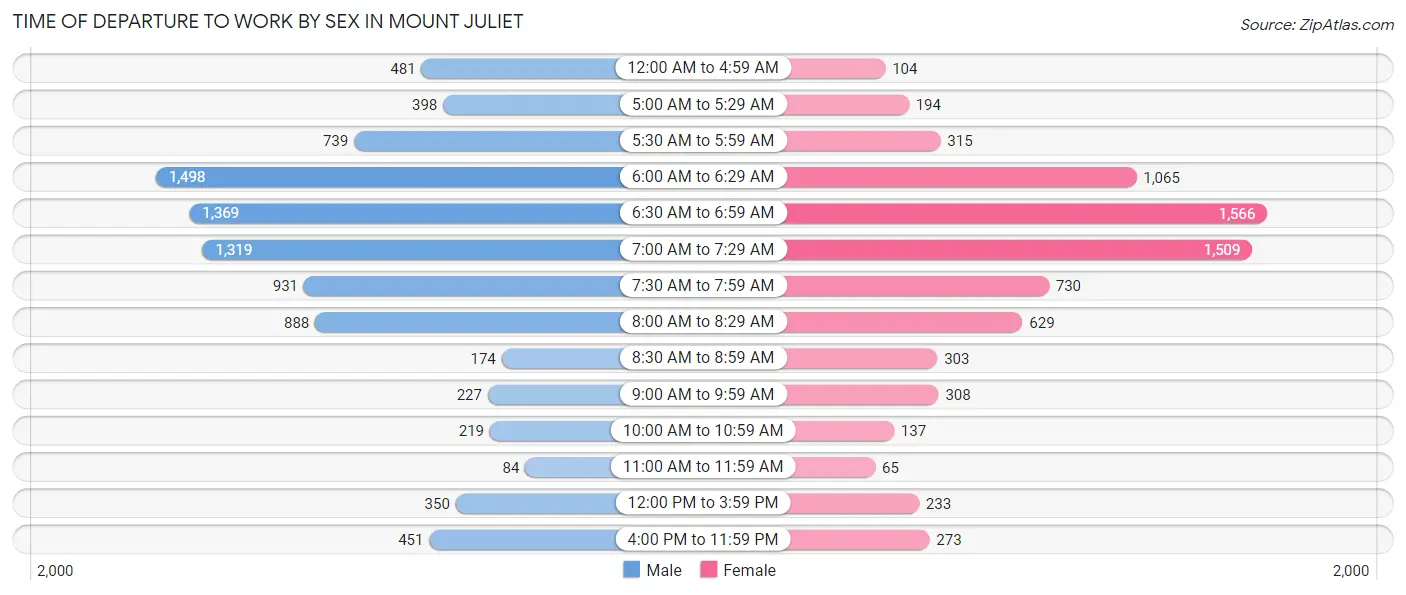
| Time of Departure | Male | Female |
| 12:00 AM to 4:59 AM | 481 (5.3%) | 104 (1.4%) |
| 5:00 AM to 5:29 AM | 398 (4.4%) | 194 (2.6%) |
| 5:30 AM to 5:59 AM | 739 (8.1%) | 315 (4.2%) |
| 6:00 AM to 6:29 AM | 1,498 (16.4%) | 1,065 (14.3%) |
| 6:30 AM to 6:59 AM | 1,369 (15.0%) | 1,566 (21.1%) |
| 7:00 AM to 7:29 AM | 1,319 (14.4%) | 1,509 (20.3%) |
| 7:30 AM to 7:59 AM | 931 (10.2%) | 730 (9.8%) |
| 8:00 AM to 8:29 AM | 888 (9.7%) | 629 (8.5%) |
| 8:30 AM to 8:59 AM | 174 (1.9%) | 303 (4.1%) |
| 9:00 AM to 9:59 AM | 227 (2.5%) | 308 (4.1%) |
| 10:00 AM to 10:59 AM | 219 (2.4%) | 137 (1.8%) |
| 11:00 AM to 11:59 AM | 84 (0.9%) | 65 (0.9%) |
| 12:00 PM to 3:59 PM | 350 (3.8%) | 233 (3.1%) |
| 4:00 PM to 11:59 PM | 451 (4.9%) | 273 (3.7%) |
| Total | 9,128 (100.0%) | 7,431 (100.0%) |
Housing Occupancy in Mount Juliet
Occupancy by Ownership in Mount Juliet
Of the total 14,446 dwellings in Mount Juliet, owner-occupied units account for 10,950 (75.8%), while renter-occupied units make up 3,496 (24.2%).
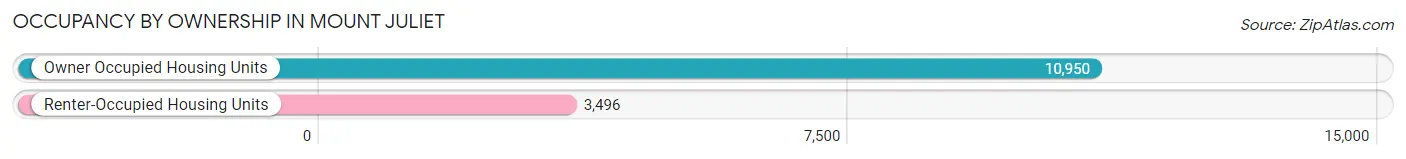
| Occupancy | # Housing Units | % Housing Units |
| Owner Occupied Housing Units | 10,950 | 75.8% |
| Renter-Occupied Housing Units | 3,496 | 24.2% |
| Total Occupied Housing Units | 14,446 | 100.0% |
Occupancy by Household Size in Mount Juliet
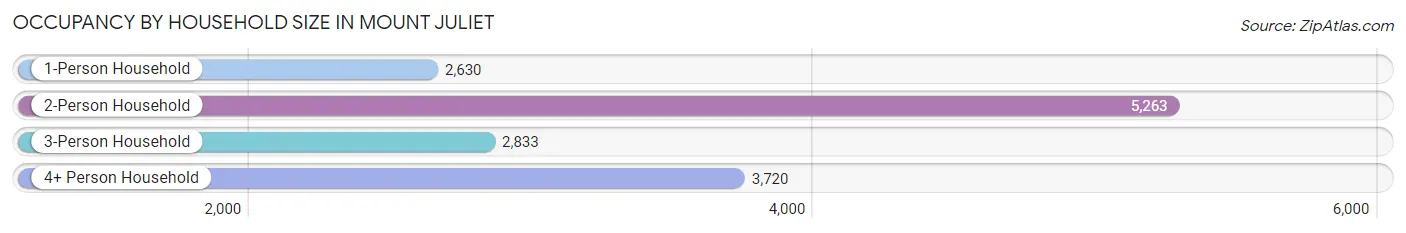
| Household Size | # Housing Units | % Housing Units |
| 1-Person Household | 2,630 | 18.2% |
| 2-Person Household | 5,263 | 36.4% |
| 3-Person Household | 2,833 | 19.6% |
| 4+ Person Household | 3,720 | 25.8% |
| Total Housing Units | 14,446 | 100.0% |
Occupancy by Ownership by Household Size in Mount Juliet
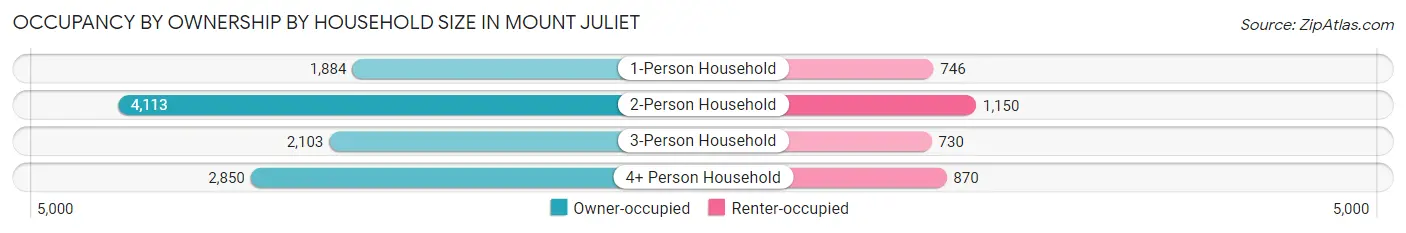
| Household Size | Owner-occupied | Renter-occupied |
| 1-Person Household | 1,884 (71.6%) | 746 (28.4%) |
| 2-Person Household | 4,113 (78.1%) | 1,150 (21.8%) |
| 3-Person Household | 2,103 (74.2%) | 730 (25.8%) |
| 4+ Person Household | 2,850 (76.6%) | 870 (23.4%) |
| Total Housing Units | 10,950 (75.8%) | 3,496 (24.2%) |
Occupancy by Educational Attainment in Mount Juliet
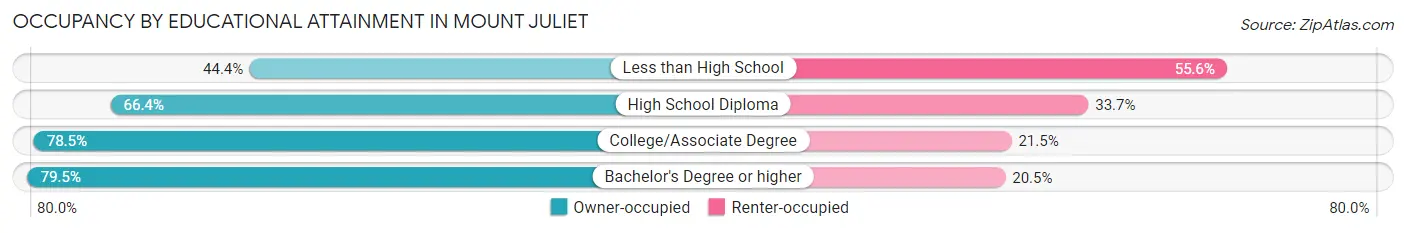
| Household Size | Owner-occupied | Renter-occupied |
| Less than High School | 186 (44.4%) | 233 (55.6%) |
| High School Diploma | 1,773 (66.3%) | 899 (33.7%) |
| College/Associate Degree | 3,107 (78.5%) | 849 (21.5%) |
| Bachelor's Degree or higher | 5,884 (79.5%) | 1,515 (20.5%) |
Occupancy by Age of Householder in Mount Juliet
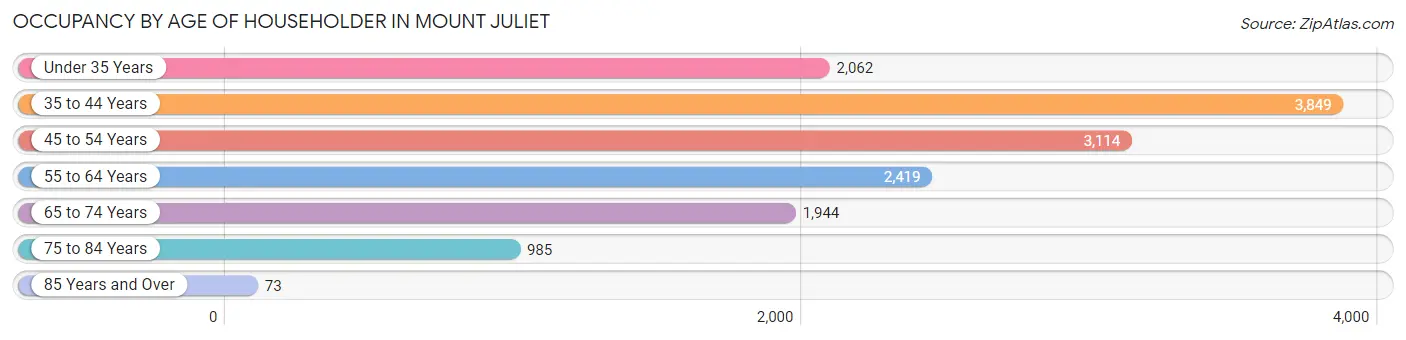
| Age Bracket | # Households | % Households |
| Under 35 Years | 2,062 | 14.3% |
| 35 to 44 Years | 3,849 | 26.6% |
| 45 to 54 Years | 3,114 | 21.6% |
| 55 to 64 Years | 2,419 | 16.8% |
| 65 to 74 Years | 1,944 | 13.5% |
| 75 to 84 Years | 985 | 6.8% |
| 85 Years and Over | 73 | 0.5% |
| Total | 14,446 | 100.0% |
Housing Finances in Mount Juliet
Median Income by Occupancy in Mount Juliet
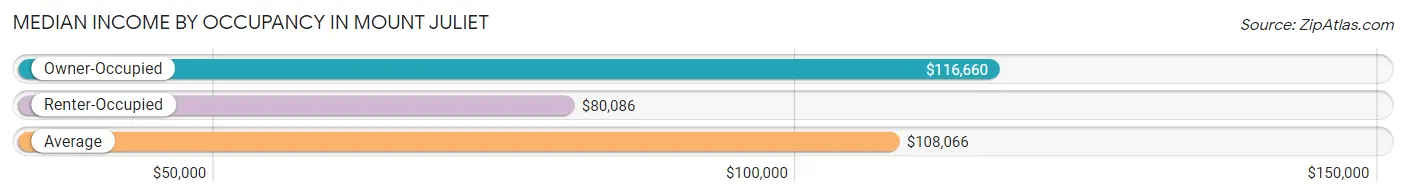
| Occupancy Type | # Households | Median Income |
| Owner-Occupied | 10,950 (75.8%) | $116,660 |
| Renter-Occupied | 3,496 (24.2%) | $80,086 |
| Average | 14,446 (100.0%) | $108,066 |
Occupancy by Householder Income Bracket in Mount Juliet
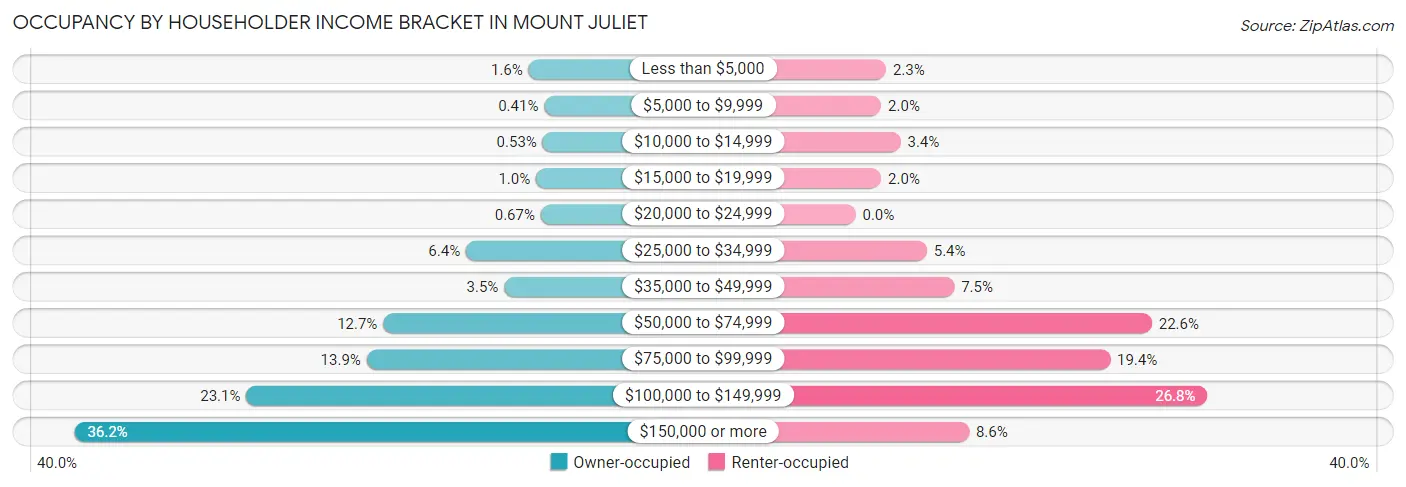
| Income Bracket | Owner-occupied | Renter-occupied |
| Less than $5,000 | 175 (1.6%) | 81 (2.3%) |
| $5,000 to $9,999 | 45 (0.4%) | 68 (1.9%) |
| $10,000 to $14,999 | 58 (0.5%) | 120 (3.4%) |
| $15,000 to $19,999 | 113 (1.0%) | 68 (1.9%) |
| $20,000 to $24,999 | 73 (0.7%) | 0 (0.0%) |
| $25,000 to $34,999 | 698 (6.4%) | 190 (5.4%) |
| $35,000 to $49,999 | 379 (3.5%) | 263 (7.5%) |
| $50,000 to $74,999 | 1,388 (12.7%) | 789 (22.6%) |
| $75,000 to $99,999 | 1,526 (13.9%) | 678 (19.4%) |
| $100,000 to $149,999 | 2,531 (23.1%) | 937 (26.8%) |
| $150,000 or more | 3,964 (36.2%) | 302 (8.6%) |
| Total | 10,950 (100.0%) | 3,496 (100.0%) |
Monthly Housing Cost Tiers in Mount Juliet
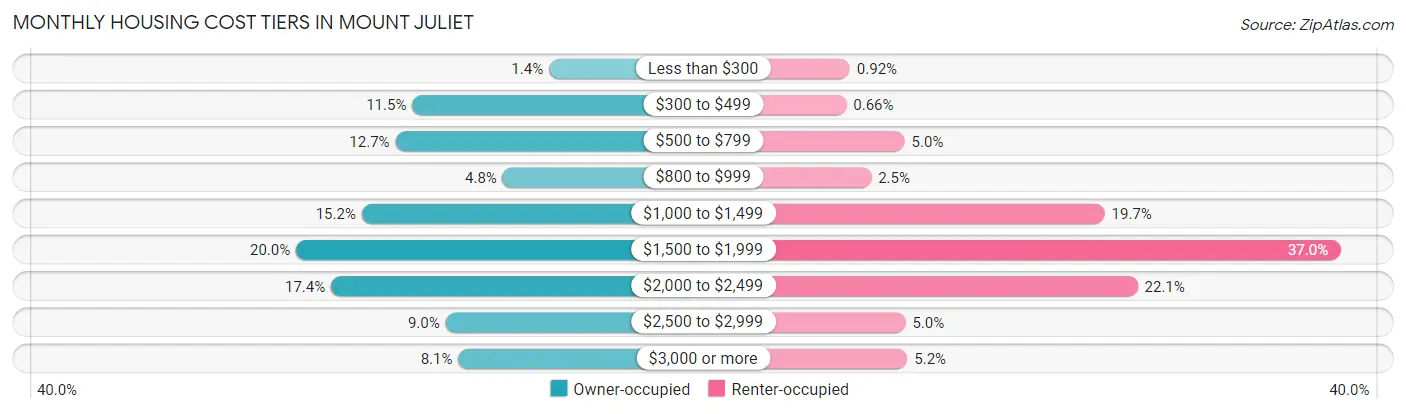
| Monthly Cost | Owner-occupied | Renter-occupied |
| Less than $300 | 151 (1.4%) | 32 (0.9%) |
| $300 to $499 | 1,254 (11.5%) | 23 (0.7%) |
| $500 to $799 | 1,390 (12.7%) | 173 (5.0%) |
| $800 to $999 | 525 (4.8%) | 87 (2.5%) |
| $1,000 to $1,499 | 1,661 (15.2%) | 688 (19.7%) |
| $1,500 to $1,999 | 2,191 (20.0%) | 1,294 (37.0%) |
| $2,000 to $2,499 | 1,909 (17.4%) | 773 (22.1%) |
| $2,500 to $2,999 | 986 (9.0%) | 175 (5.0%) |
| $3,000 or more | 883 (8.1%) | 180 (5.1%) |
| Total | 10,950 (100.0%) | 3,496 (100.0%) |
Physical Housing Characteristics in Mount Juliet
Housing Structures in Mount Juliet
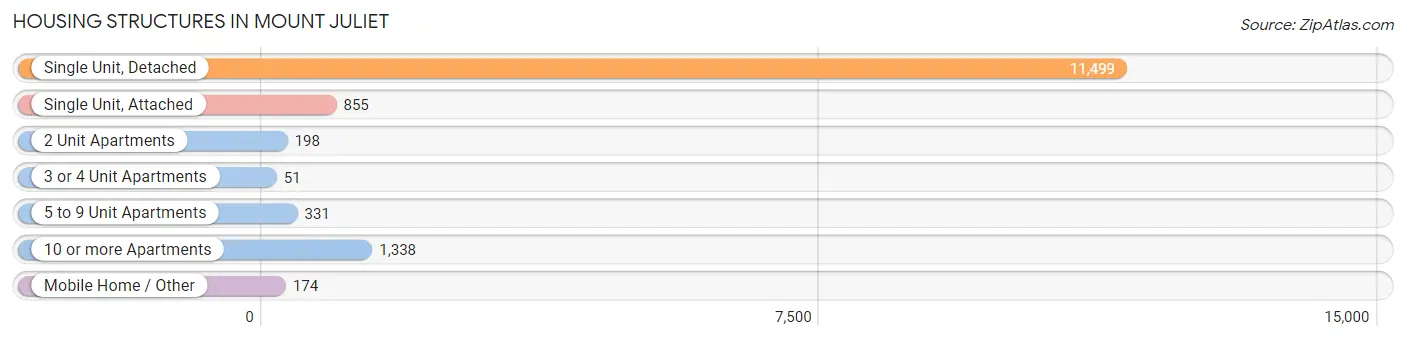
| Structure Type | # Housing Units | % Housing Units |
| Single Unit, Detached | 11,499 | 79.6% |
| Single Unit, Attached | 855 | 5.9% |
| 2 Unit Apartments | 198 | 1.4% |
| 3 or 4 Unit Apartments | 51 | 0.4% |
| 5 to 9 Unit Apartments | 331 | 2.3% |
| 10 or more Apartments | 1,338 | 9.3% |
| Mobile Home / Other | 174 | 1.2% |
| Total | 14,446 | 100.0% |
Housing Structures by Occupancy in Mount Juliet
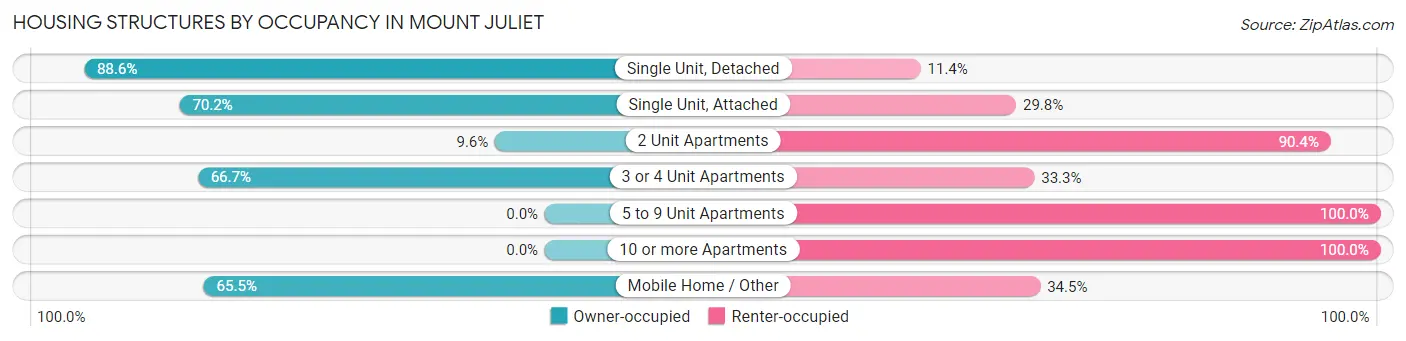
| Structure Type | Owner-occupied | Renter-occupied |
| Single Unit, Detached | 10,183 (88.6%) | 1,316 (11.4%) |
| Single Unit, Attached | 600 (70.2%) | 255 (29.8%) |
| 2 Unit Apartments | 19 (9.6%) | 179 (90.4%) |
| 3 or 4 Unit Apartments | 34 (66.7%) | 17 (33.3%) |
| 5 to 9 Unit Apartments | 0 (0.0%) | 331 (100.0%) |
| 10 or more Apartments | 0 (0.0%) | 1,338 (100.0%) |
| Mobile Home / Other | 114 (65.5%) | 60 (34.5%) |
| Total | 10,950 (75.8%) | 3,496 (24.2%) |
Housing Structures by Number of Rooms in Mount Juliet
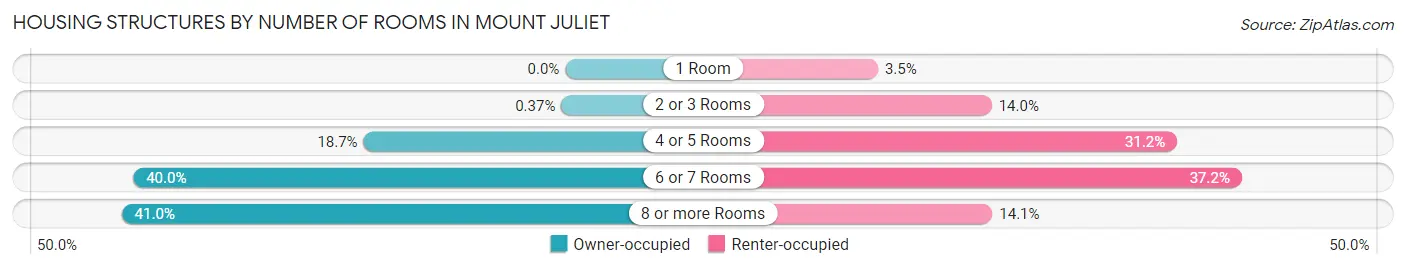
| Number of Rooms | Owner-occupied | Renter-occupied |
| 1 Room | 0 (0.0%) | 123 (3.5%) |
| 2 or 3 Rooms | 41 (0.4%) | 491 (14.0%) |
| 4 or 5 Rooms | 2,043 (18.7%) | 1,090 (31.2%) |
| 6 or 7 Rooms | 4,374 (40.0%) | 1,299 (37.2%) |
| 8 or more Rooms | 4,492 (41.0%) | 493 (14.1%) |
| Total | 10,950 (100.0%) | 3,496 (100.0%) |
Housing Structure by Heating Type in Mount Juliet
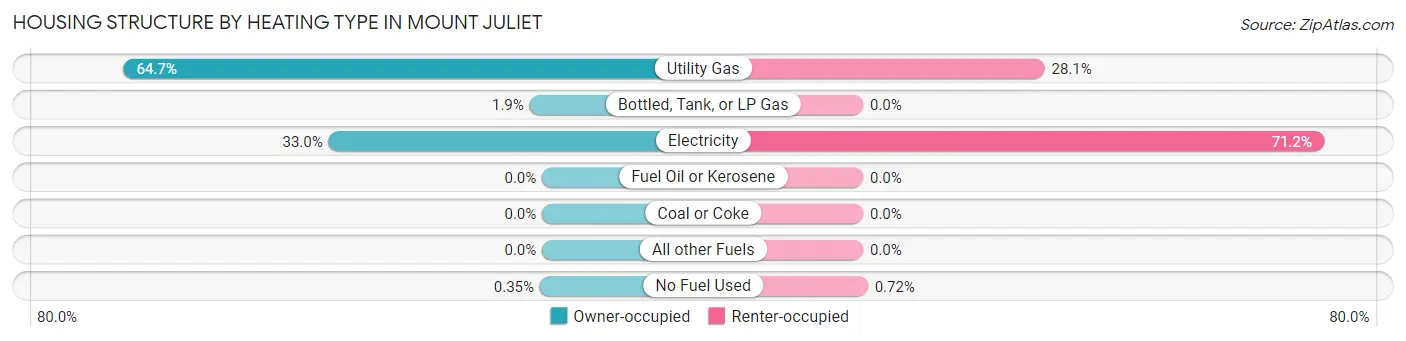
| Heating Type | Owner-occupied | Renter-occupied |
| Utility Gas | 7,086 (64.7%) | 981 (28.1%) |
| Bottled, Tank, or LP Gas | 211 (1.9%) | 0 (0.0%) |
| Electricity | 3,615 (33.0%) | 2,490 (71.2%) |
| Fuel Oil or Kerosene | 0 (0.0%) | 0 (0.0%) |
| Coal or Coke | 0 (0.0%) | 0 (0.0%) |
| All other Fuels | 0 (0.0%) | 0 (0.0%) |
| No Fuel Used | 38 (0.4%) | 25 (0.7%) |
| Total | 10,950 (100.0%) | 3,496 (100.0%) |
Household Vehicle Usage in Mount Juliet
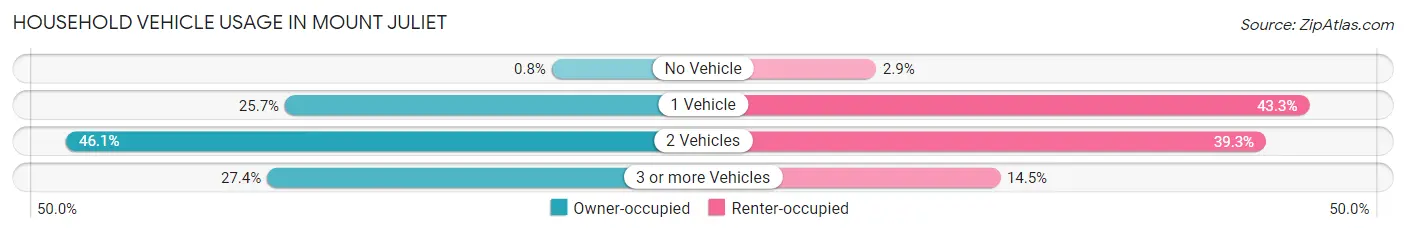
| Vehicles per Household | Owner-occupied | Renter-occupied |
| No Vehicle | 88 (0.8%) | 101 (2.9%) |
| 1 Vehicle | 2,814 (25.7%) | 1,515 (43.3%) |
| 2 Vehicles | 5,051 (46.1%) | 1,374 (39.3%) |
| 3 or more Vehicles | 2,997 (27.4%) | 506 (14.5%) |
| Total | 10,950 (100.0%) | 3,496 (100.0%) |
Real Estate & Mortgages in Mount Juliet
Real Estate and Mortgage Overview in Mount Juliet
| Characteristic | Without Mortgage | With Mortgage |
| Housing Units | 2,858 | 8,092 |
| Median Property Value | $380,100 | $381,900 |
| Median Household Income | $98,506 | $3,119 |
| Monthly Housing Costs | $511 | $883 |
| Real Estate Taxes | $1,800 | $198 |
Property Value by Mortgage Status in Mount Juliet
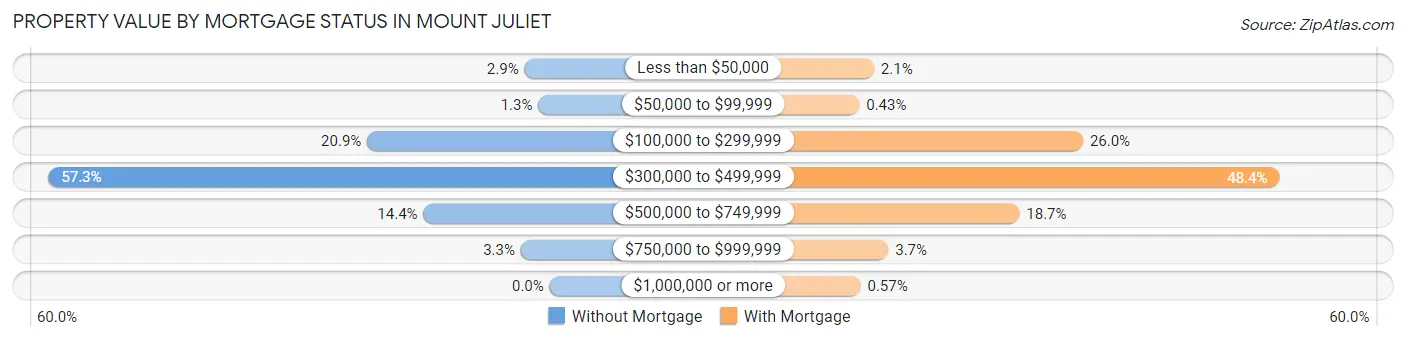
| Property Value | Without Mortgage | With Mortgage |
| Less than $50,000 | 82 (2.9%) | 170 (2.1%) |
| $50,000 to $99,999 | 37 (1.3%) | 35 (0.4%) |
| $100,000 to $299,999 | 596 (20.8%) | 2,103 (26.0%) |
| $300,000 to $499,999 | 1,637 (57.3%) | 3,920 (48.4%) |
| $500,000 to $749,999 | 412 (14.4%) | 1,515 (18.7%) |
| $750,000 to $999,999 | 94 (3.3%) | 303 (3.7%) |
| $1,000,000 or more | 0 (0.0%) | 46 (0.6%) |
| Total | 2,858 (100.0%) | 8,092 (100.0%) |
Household Income by Mortgage Status in Mount Juliet
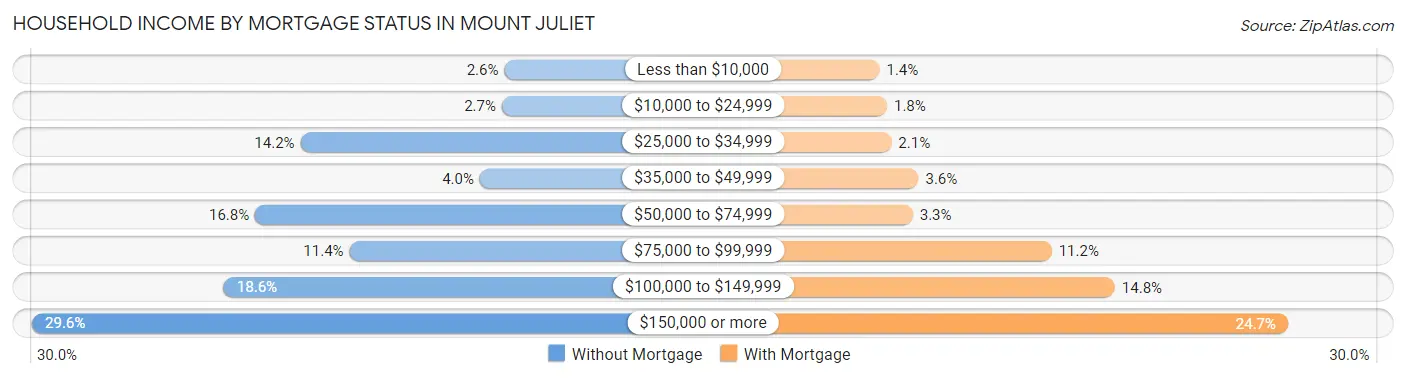
| Household Income | Without Mortgage | With Mortgage |
| Less than $10,000 | 74 (2.6%) | 111 (1.4%) |
| $10,000 to $24,999 | 78 (2.7%) | 146 (1.8%) |
| $25,000 to $34,999 | 407 (14.2%) | 166 (2.1%) |
| $35,000 to $49,999 | 114 (4.0%) | 291 (3.6%) |
| $50,000 to $74,999 | 481 (16.8%) | 265 (3.3%) |
| $75,000 to $99,999 | 327 (11.4%) | 907 (11.2%) |
| $100,000 to $149,999 | 532 (18.6%) | 1,199 (14.8%) |
| $150,000 or more | 845 (29.6%) | 1,999 (24.7%) |
| Total | 2,858 (100.0%) | 8,092 (100.0%) |
Property Value to Household Income Ratio in Mount Juliet
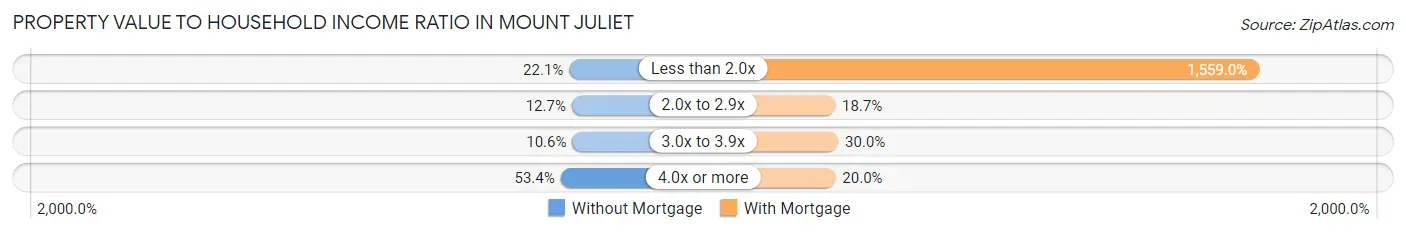
| Value-to-Income Ratio | Without Mortgage | With Mortgage |
| Less than 2.0x | 631 (22.1%) | 126,154 (1,559.0%) |
| 2.0x to 2.9x | 364 (12.7%) | 1,512 (18.7%) |
| 3.0x to 3.9x | 302 (10.6%) | 2,427 (30.0%) |
| 4.0x or more | 1,526 (53.4%) | 1,617 (20.0%) |
| Total | 2,858 (100.0%) | 8,092 (100.0%) |
Real Estate Taxes by Mortgage Status in Mount Juliet
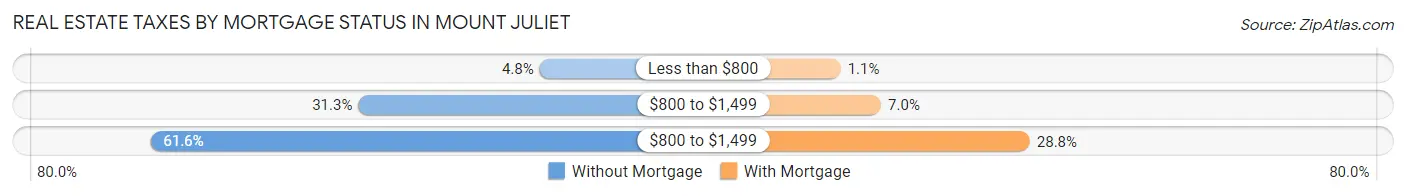
| Property Taxes | Without Mortgage | With Mortgage |
| Less than $800 | 136 (4.8%) | 91 (1.1%) |
| $800 to $1,499 | 893 (31.2%) | 569 (7.0%) |
| $800 to $1,499 | 1,761 (61.6%) | 2,327 (28.8%) |
| Total | 2,858 (100.0%) | 8,092 (100.0%) |
Health & Disability in Mount Juliet
Health Insurance Coverage by Age in Mount Juliet
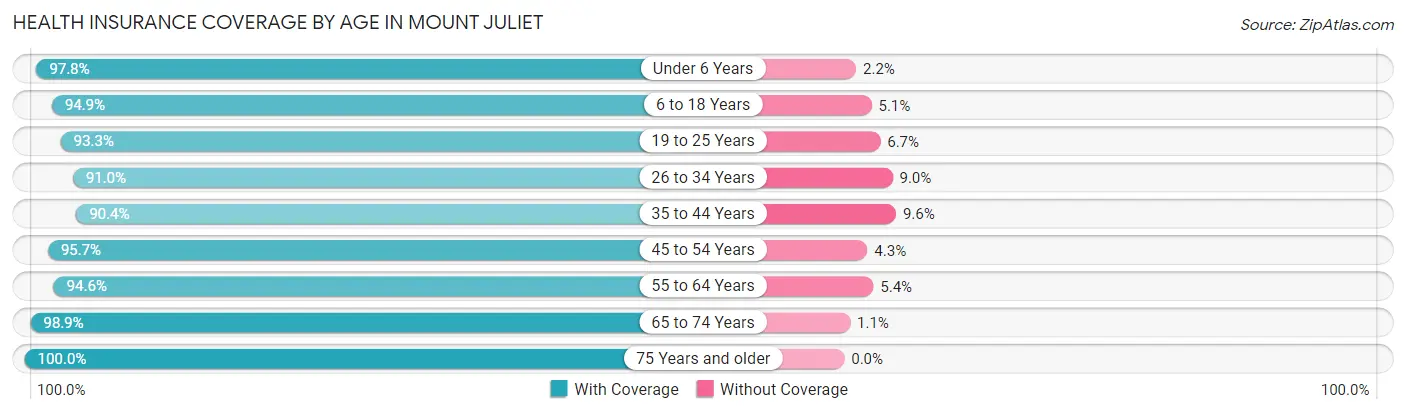
| Age Bracket | With Coverage | Without Coverage |
| Under 6 Years | 2,938 (97.8%) | 66 (2.2%) |
| 6 to 18 Years | 7,462 (94.9%) | 399 (5.1%) |
| 19 to 25 Years | 2,710 (93.3%) | 195 (6.7%) |
| 26 to 34 Years | 3,360 (91.0%) | 332 (9.0%) |
| 35 to 44 Years | 5,963 (90.4%) | 636 (9.6%) |
| 45 to 54 Years | 5,288 (95.7%) | 238 (4.3%) |
| 55 to 64 Years | 4,260 (94.6%) | 244 (5.4%) |
| 65 to 74 Years | 3,490 (98.9%) | 38 (1.1%) |
| 75 Years and older | 1,766 (100.0%) | 0 (0.0%) |
| Total | 37,237 (94.6%) | 2,148 (5.4%) |
Health Insurance Coverage by Citizenship Status in Mount Juliet
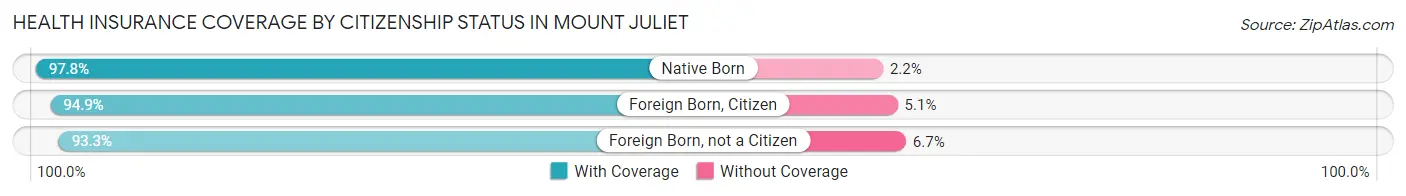
| Citizenship Status | With Coverage | Without Coverage |
| Native Born | 2,938 (97.8%) | 66 (2.2%) |
| Foreign Born, Citizen | 7,462 (94.9%) | 399 (5.1%) |
| Foreign Born, not a Citizen | 2,710 (93.3%) | 195 (6.7%) |
Health Insurance Coverage by Household Income in Mount Juliet
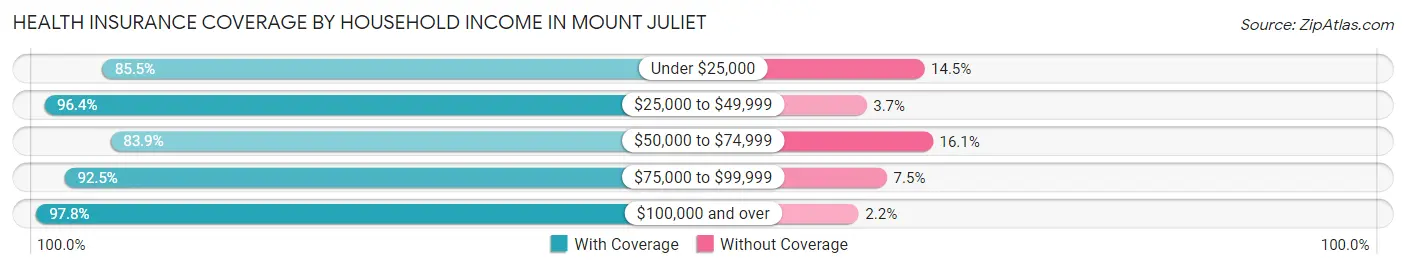
| Household Income | With Coverage | Without Coverage |
| Under $25,000 | 1,417 (85.5%) | 240 (14.5%) |
| $25,000 to $49,999 | 2,350 (96.4%) | 89 (3.6%) |
| $50,000 to $74,999 | 4,594 (83.9%) | 879 (16.1%) |
| $75,000 to $99,999 | 5,052 (92.5%) | 408 (7.5%) |
| $100,000 and over | 23,818 (97.8%) | 532 (2.2%) |
Public vs Private Health Insurance Coverage by Age in Mount Juliet
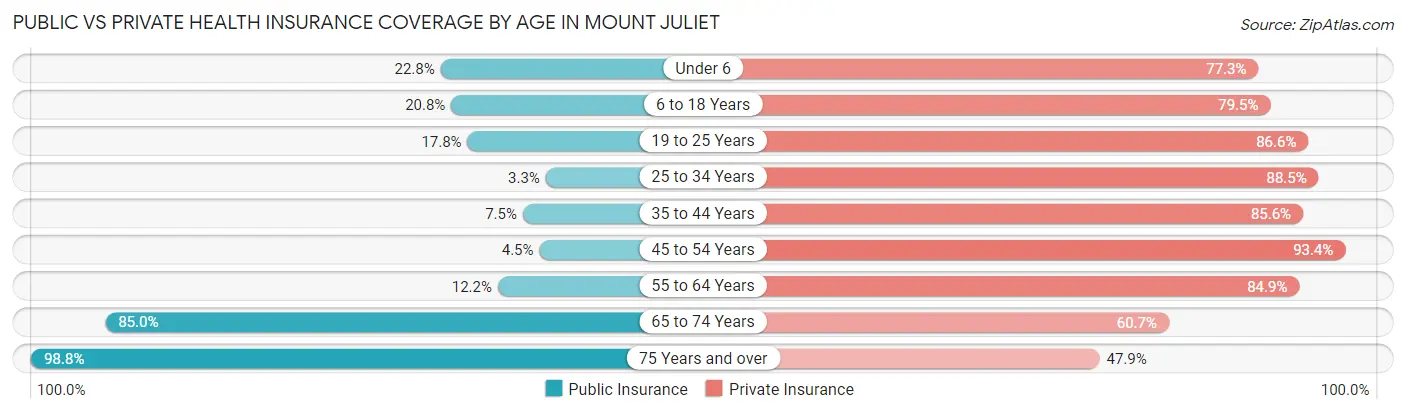
| Age Bracket | Public Insurance | Private Insurance |
| Under 6 | 685 (22.8%) | 2,322 (77.3%) |
| 6 to 18 Years | 1,637 (20.8%) | 6,252 (79.5%) |
| 19 to 25 Years | 517 (17.8%) | 2,515 (86.6%) |
| 25 to 34 Years | 121 (3.3%) | 3,267 (88.5%) |
| 35 to 44 Years | 496 (7.5%) | 5,648 (85.6%) |
| 45 to 54 Years | 246 (4.4%) | 5,163 (93.4%) |
| 55 to 64 Years | 548 (12.2%) | 3,824 (84.9%) |
| 65 to 74 Years | 3,000 (85.0%) | 2,141 (60.7%) |
| 75 Years and over | 1,745 (98.8%) | 845 (47.8%) |
| Total | 8,995 (22.8%) | 31,977 (81.2%) |
Disability Status by Sex by Age in Mount Juliet
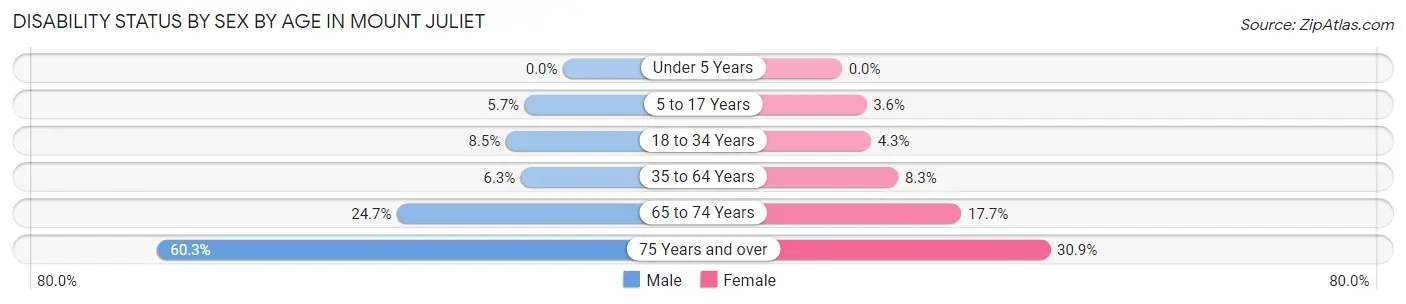
| Age Bracket | Male | Female |
| Under 5 Years | 0 (0.0%) | 0 (0.0%) |
| 5 to 17 Years | 249 (5.7%) | 137 (3.6%) |
| 18 to 34 Years | 309 (8.5%) | 143 (4.3%) |
| 35 to 64 Years | 506 (6.3%) | 714 (8.3%) |
| 65 to 74 Years | 419 (24.7%) | 324 (17.7%) |
| 75 Years and over | 466 (60.3%) | 307 (30.9%) |
Disability Class by Sex by Age in Mount Juliet
Disability Class: Hearing Difficulty
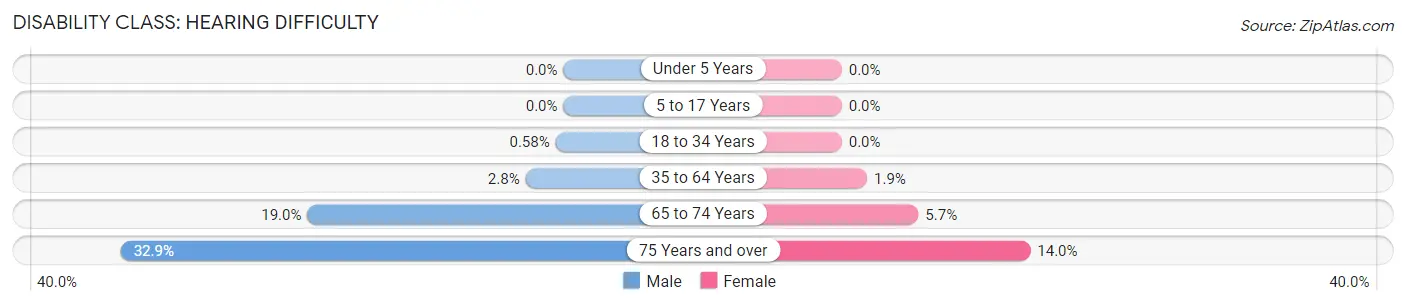
| Age Bracket | Male | Female |
| Under 5 Years | 0 (0.0%) | 0 (0.0%) |
| 5 to 17 Years | 0 (0.0%) | 0 (0.0%) |
| 18 to 34 Years | 21 (0.6%) | 0 (0.0%) |
| 35 to 64 Years | 227 (2.8%) | 161 (1.9%) |
| 65 to 74 Years | 323 (19.0%) | 104 (5.7%) |
| 75 Years and over | 254 (32.9%) | 139 (14.0%) |
Disability Class: Vision Difficulty
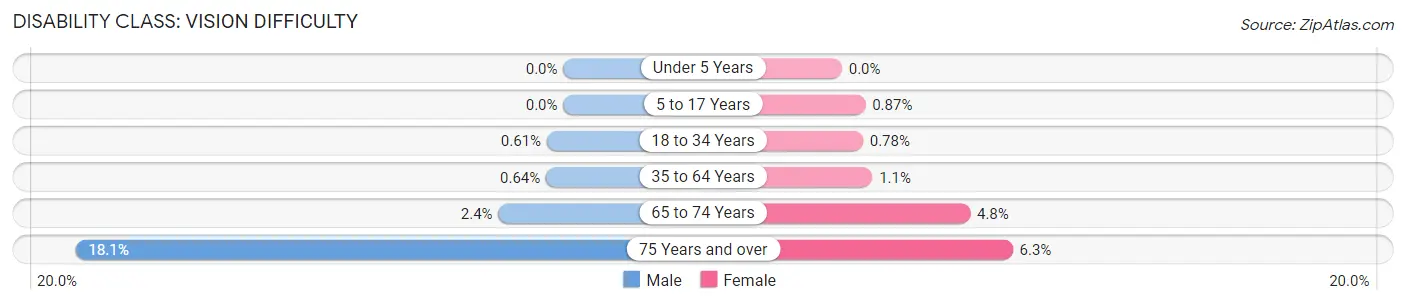
| Age Bracket | Male | Female |
| Under 5 Years | 0 (0.0%) | 0 (0.0%) |
| 5 to 17 Years | 0 (0.0%) | 33 (0.9%) |
| 18 to 34 Years | 22 (0.6%) | 26 (0.8%) |
| 35 to 64 Years | 52 (0.6%) | 97 (1.1%) |
| 65 to 74 Years | 41 (2.4%) | 87 (4.8%) |
| 75 Years and over | 140 (18.1%) | 63 (6.3%) |
Disability Class: Cognitive Difficulty
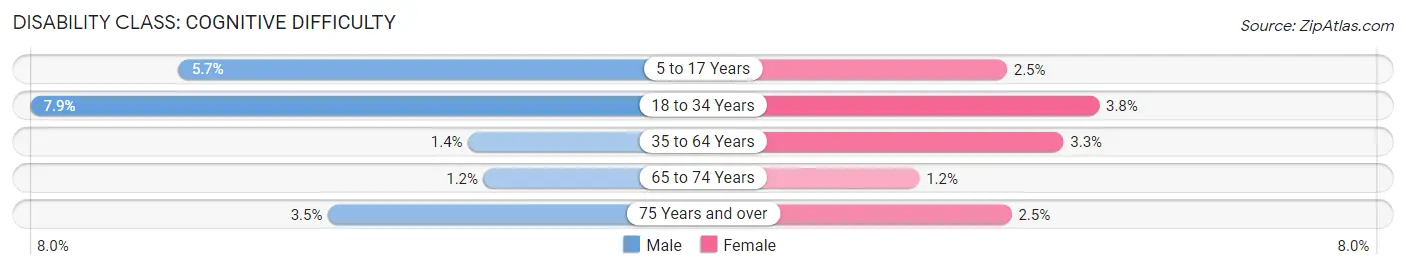
| Age Bracket | Male | Female |
| 5 to 17 Years | 249 (5.7%) | 93 (2.5%) |
| 18 to 34 Years | 287 (7.9%) | 127 (3.8%) |
| 35 to 64 Years | 114 (1.4%) | 282 (3.3%) |
| 65 to 74 Years | 20 (1.2%) | 21 (1.1%) |
| 75 Years and over | 27 (3.5%) | 25 (2.5%) |
Disability Class: Ambulatory Difficulty
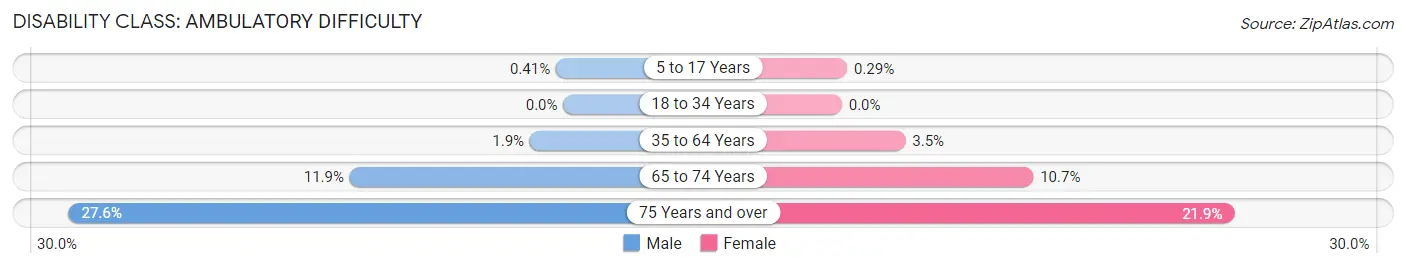
| Age Bracket | Male | Female |
| 5 to 17 Years | 18 (0.4%) | 11 (0.3%) |
| 18 to 34 Years | 0 (0.0%) | 0 (0.0%) |
| 35 to 64 Years | 150 (1.9%) | 303 (3.5%) |
| 65 to 74 Years | 202 (11.9%) | 195 (10.7%) |
| 75 Years and over | 213 (27.6%) | 217 (21.8%) |
Disability Class: Self-Care Difficulty
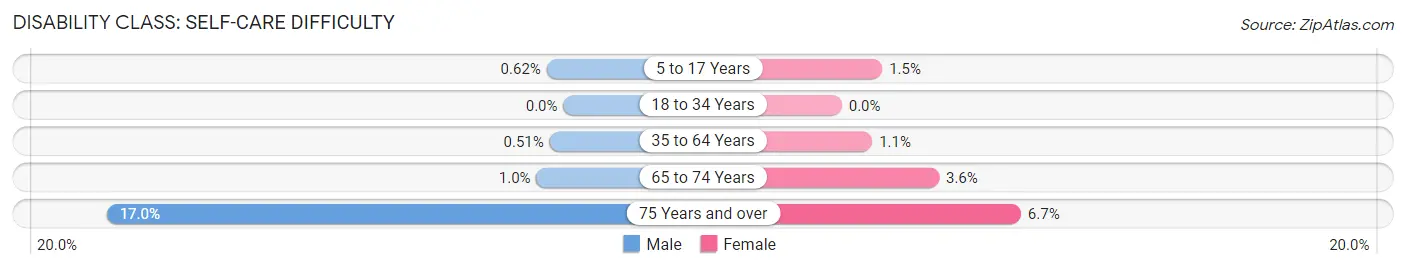
| Age Bracket | Male | Female |
| 5 to 17 Years | 27 (0.6%) | 57 (1.5%) |
| 18 to 34 Years | 0 (0.0%) | 0 (0.0%) |
| 35 to 64 Years | 41 (0.5%) | 97 (1.1%) |
| 65 to 74 Years | 17 (1.0%) | 66 (3.6%) |
| 75 Years and over | 131 (17.0%) | 66 (6.7%) |
Technology Access in Mount Juliet
Computing Device Access in Mount Juliet
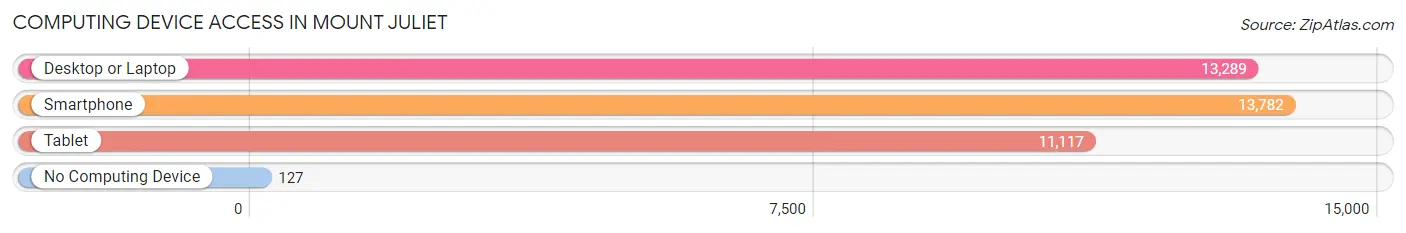
| Device Type | # Households | % Households |
| Desktop or Laptop | 13,289 | 92.0% |
| Smartphone | 13,782 | 95.4% |
| Tablet | 11,117 | 77.0% |
| No Computing Device | 127 | 0.9% |
| Total | 14,446 | 100.0% |
Internet Access in Mount Juliet
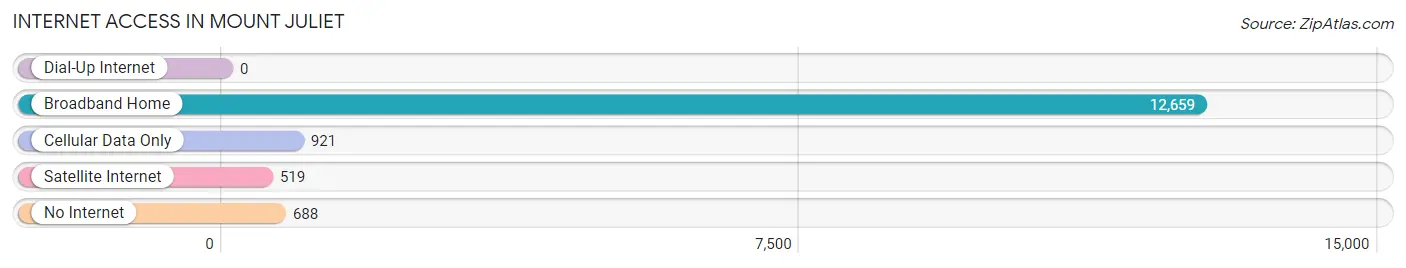
| Internet Type | # Households | % Households |
| Dial-Up Internet | 0 | 0.0% |
| Broadband Home | 12,659 | 87.6% |
| Cellular Data Only | 921 | 6.4% |
| Satellite Internet | 519 | 3.6% |
| No Internet | 688 | 4.8% |
| Total | 14,446 | 100.0% |
Mount Juliet Summary
History
Mount Juliet is a city located in Wilson County, Tennessee. It is located approximately 17 miles east of downtown Nashville and is part of the Nashville metropolitan area. The city was founded in 1835 and was named after the daughter of the original landowner, Major Hugh Wilson. The city was incorporated in 1972 and has since grown to a population of over 28,000 people.
Mount Juliet has a rich history that dates back to the early 1800s. The area was originally inhabited by Native Americans, including the Cherokee and Chickasaw tribes. The first settlers arrived in the area in the late 1700s and early 1800s, and the city was officially founded in 1835. The city was named after Major Hugh Wilson’s daughter, Juliet.
The city was an important stop on the Nashville and Northwestern Railroad, which connected Nashville to the Midwest. The railroad was a major factor in the growth of the city, as it allowed for the transportation of goods and people. The city was also home to several factories, including a cotton mill, a flour mill, and a sawmill.
In the late 1800s, the city was home to a thriving African American community. The city was home to several churches, schools, and businesses that served the African American community. The city was also home to several prominent African American leaders, including Dr. William H. Holt, who was the first African American doctor in the city.
Geography
Mount Juliet is located in Wilson County, Tennessee, approximately 17 miles east of downtown Nashville. The city is part of the Nashville metropolitan area and is located in the Central Basin of Tennessee. The city is situated on the banks of the Cumberland River and is surrounded by rolling hills and lush forests.
The city has a total area of 16.3 square miles, of which 16.2 square miles is land and 0.1 square miles is water. The city is located at an elevation of 645 feet above sea level. The climate in Mount Juliet is humid subtropical, with hot summers and mild winters.
Economy
Mount Juliet has a diverse economy that is driven by a variety of industries. The city is home to several large employers, including Cracker Barrel, Bridgestone, and Wilson County Schools. The city is also home to several small businesses, including restaurants, retail stores, and professional services.
The city is also home to several manufacturing companies, including Bridgestone, which produces tires, and Wilson County Schools, which produces school supplies. The city is also home to several healthcare providers, including Vanderbilt University Medical Center and TriStar Summit Medical Center.
Demographics
As of the 2010 census, the population of Mount Juliet was 28,156. The racial makeup of the city was 84.3% White, 8.3% African American, 0.4% Native American, 2.2% Asian, 0.1% Pacific Islander, 2.2% from other races, and 2.5% from two or more races. Hispanic or Latino of any race were 5.3% of the population.
The median income for a household in the city was $60,945, and the median income for a family was $71,945. The per capita income for the city was $27,945. About 5.3% of families and 7.2% of the population were below the poverty line, including 8.7% of those under age 18 and 6.2% of those age 65 or over.
Common Questions
What is Per Capita Income in Mount Juliet?
Per Capita income in Mount Juliet is $52,104.
What is the Median Family Income in Mount Juliet?
Median Family Income in Mount Juliet is $121,452.
What is the Median Household income in Mount Juliet?
Median Household Income in Mount Juliet is $108,066.
What is Income or Wage Gap in Mount Juliet?
Income or Wage Gap in Mount Juliet is 33.1%.
Women in Mount Juliet earn 66.9 cents for every dollar earned by a man.
What is Inequality or Gini Index in Mount Juliet?
Inequality or Gini Index in Mount Juliet is 0.44.
What is the Total Population of Mount Juliet?
Total Population of Mount Juliet is 39,525.
What is the Total Male Population of Mount Juliet?
Total Male Population of Mount Juliet is 19,732.
What is the Total Female Population of Mount Juliet?
Total Female Population of Mount Juliet is 19,793.
What is the Ratio of Males per 100 Females in Mount Juliet?
There are 99.69 Males per 100 Females in Mount Juliet.
What is the Ratio of Females per 100 Males in Mount Juliet?
There are 100.31 Females per 100 Males in Mount Juliet.
What is the Median Population Age in Mount Juliet?
Median Population Age in Mount Juliet is 39.2 Years.
What is the Average Family Size in Mount Juliet
Average Family Size in Mount Juliet is 3.1 People.
What is the Average Household Size in Mount Juliet
Average Household Size in Mount Juliet is 2.7 People.
How Large is the Labor Force in Mount Juliet?
There are 20,981 People in the Labor Forcein in Mount Juliet.
What is the Percentage of People in the Labor Force in Mount Juliet?
69.3% of People are in the Labor Force in Mount Juliet.
What is the Unemployment Rate in Mount Juliet?
Unemployment Rate in Mount Juliet is 3.8%.