Catalina Foothills, AZ Map & Demographics
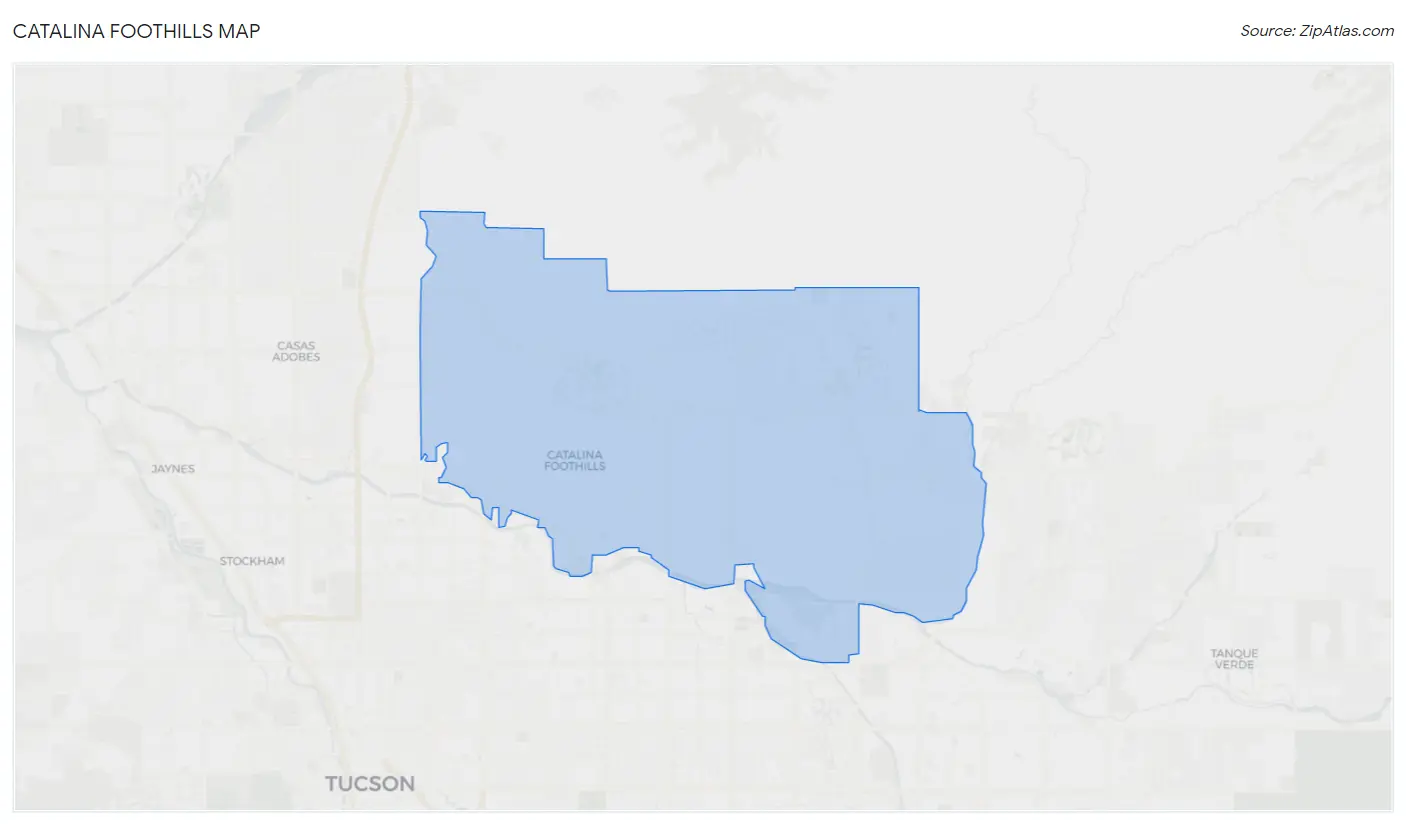
Catalina Foothills Map
Catalina Foothills Overview
$78,842
PER CAPITA INCOME
$161,464
AVG FAMILY INCOME
$110,660
AVG HOUSEHOLD INCOME
35.3%
WAGE / INCOME GAP [ % ]
64.7¢/ $1
WAGE / INCOME GAP [ $ ]
$9,613
FAMILY INCOME DEFICIT
0.49
INEQUALITY / GINI INDEX
50,573
TOTAL POPULATION
24,737
MALE POPULATION
25,836
FEMALE POPULATION
95.75
MALES / 100 FEMALES
104.44
FEMALES / 100 MALES
55.4
MEDIAN AGE
2.7
AVG FAMILY SIZE
2.1
AVG HOUSEHOLD SIZE
24,034
LABOR FORCE [ PEOPLE ]
54.9%
PERCENT IN LABOR FORCE
3.9%
UNEMPLOYMENT RATE
Income in Catalina Foothills
Income Overview in Catalina Foothills
Per Capita Income in Catalina Foothills is $78,842, while median incomes of families and households are $161,464 and $110,660 respectively.
| Characteristic | Number | Measure |
| Per Capita Income | 50,573 | $78,842 |
| Median Family Income | 14,440 | $161,464 |
| Mean Family Income | 14,440 | $213,137 |
| Median Household Income | 23,673 | $110,660 |
| Mean Household Income | 23,673 | $167,417 |
| Income Deficit | 14,440 | $9,613 |
| Wage / Income Gap (%) | 50,573 | 35.33% |
| Wage / Income Gap ($) | 50,573 | 64.67¢ per $1 |
| Gini / Inequality Index | 50,573 | 0.49 |
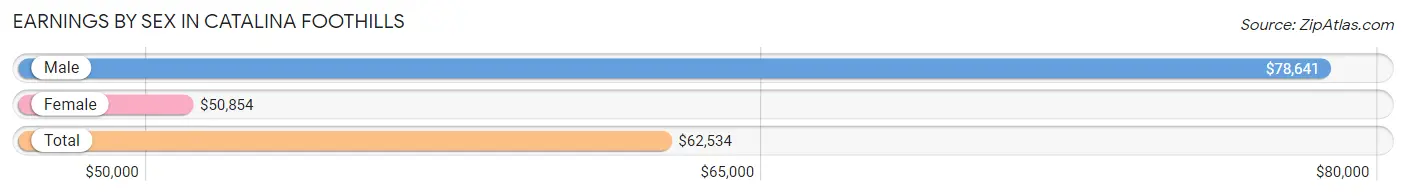
Earnings by Sex in Catalina Foothills
Average Earnings in Catalina Foothills are $62,534, $78,641 for men and $50,854 for women, a difference of 35.3%.
| Sex | Number | Average Earnings |
| Male | 13,679 (54.3%) | $78,641 |
| Female | 11,494 (45.7%) | $50,854 |
| Total | 25,173 (100.0%) | $62,534 |
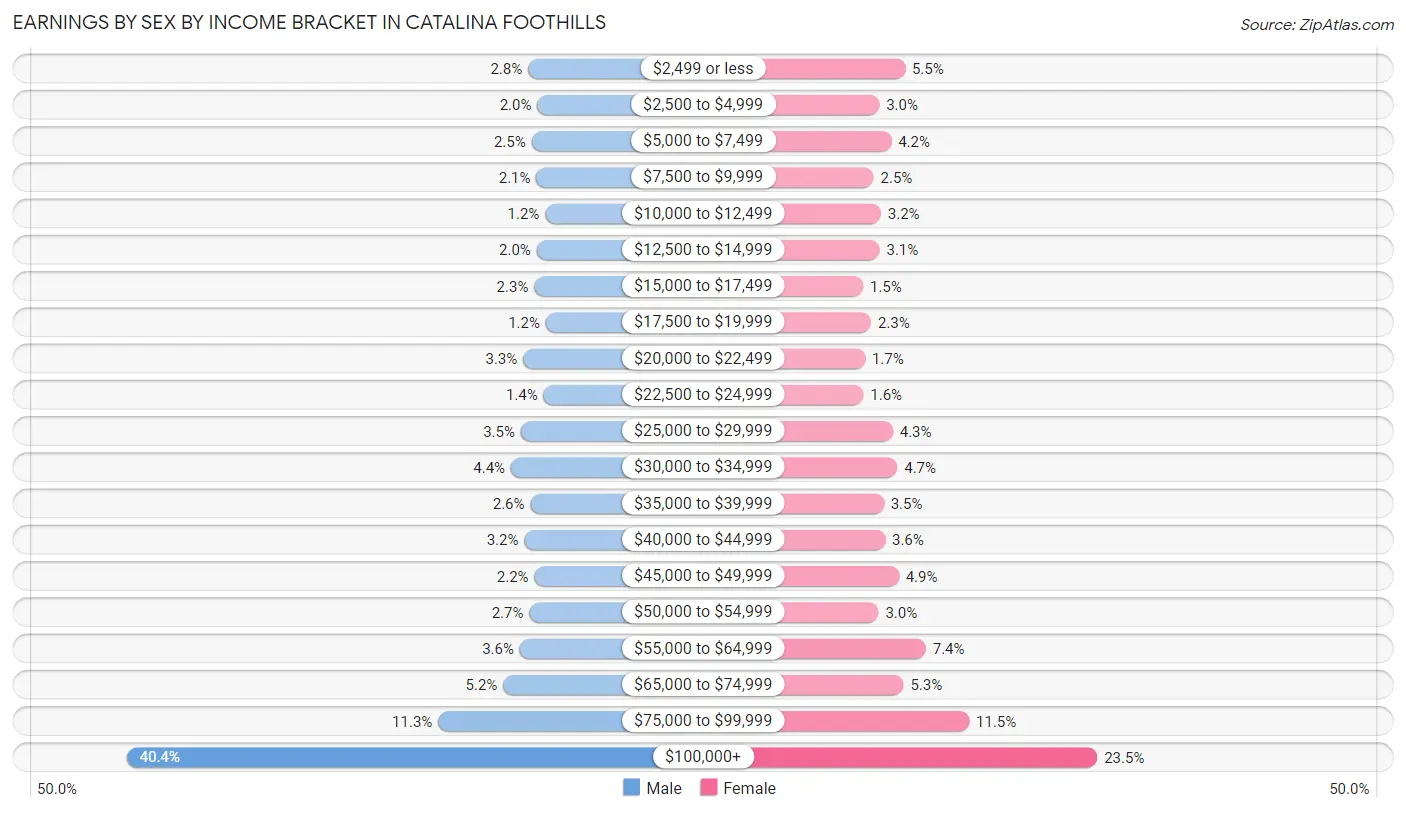
Earnings by Sex by Income Bracket in Catalina Foothills
The most common earnings brackets in Catalina Foothills are $100,000+ for men (5,532 | 40.4%) and $100,000+ for women (2,697 | 23.5%).
| Income | Male | Female |
| $2,499 or less | 389 (2.8%) | 626 (5.4%) |
| $2,500 to $4,999 | 270 (2.0%) | 349 (3.0%) |
| $5,000 to $7,499 | 344 (2.5%) | 478 (4.2%) |
| $7,500 to $9,999 | 282 (2.1%) | 289 (2.5%) |
| $10,000 to $12,499 | 168 (1.2%) | 367 (3.2%) |
| $12,500 to $14,999 | 277 (2.0%) | 353 (3.1%) |
| $15,000 to $17,499 | 309 (2.3%) | 175 (1.5%) |
| $17,500 to $19,999 | 161 (1.2%) | 261 (2.3%) |
| $20,000 to $22,499 | 452 (3.3%) | 195 (1.7%) |
| $22,500 to $24,999 | 190 (1.4%) | 178 (1.5%) |
| $25,000 to $29,999 | 482 (3.5%) | 495 (4.3%) |
| $30,000 to $34,999 | 608 (4.4%) | 544 (4.7%) |
| $35,000 to $39,999 | 359 (2.6%) | 398 (3.5%) |
| $40,000 to $44,999 | 436 (3.2%) | 411 (3.6%) |
| $45,000 to $49,999 | 307 (2.2%) | 559 (4.9%) |
| $50,000 to $54,999 | 372 (2.7%) | 341 (3.0%) |
| $55,000 to $64,999 | 494 (3.6%) | 851 (7.4%) |
| $65,000 to $74,999 | 707 (5.2%) | 610 (5.3%) |
| $75,000 to $99,999 | 1,540 (11.3%) | 1,317 (11.5%) |
| $100,000+ | 5,532 (40.4%) | 2,697 (23.5%) |
| Total | 13,679 (100.0%) | 11,494 (100.0%) |
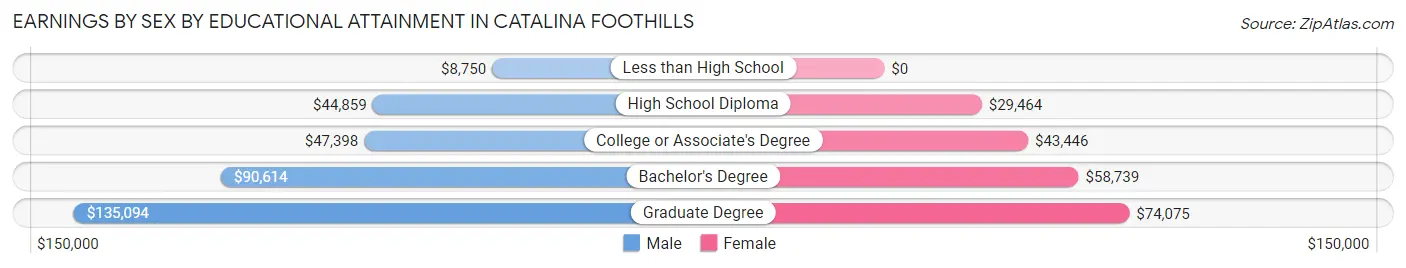
Earnings by Sex by Educational Attainment in Catalina Foothills
Average earnings in Catalina Foothills are $90,398 for men and $58,049 for women, a difference of 35.8%. Men with an educational attainment of graduate degree enjoy the highest average annual earnings of $135,094, while those with less than high school education earn the least with $8,750. Women with an educational attainment of graduate degree earn the most with the average annual earnings of $74,075, while those with high school diploma education have the smallest earnings of $29,464.
| Educational Attainment | Male Income | Female Income |
| Less than High School | $8,750 | $0 |
| High School Diploma | $44,859 | $29,464 |
| College or Associate's Degree | $47,398 | $43,446 |
| Bachelor's Degree | $90,614 | $58,739 |
| Graduate Degree | $135,094 | $74,075 |
| Total | $90,398 | $58,049 |
Family Income in Catalina Foothills
Family Income Brackets in Catalina Foothills
According to the Catalina Foothills family income data, there are 5,559 families falling into the $200,000+ income range, which is the most common income bracket and makes up 38.5% of all families. Conversely, the $10,000 to $14,999 income bracket is the least frequent group with only 72 families (0.5%) belonging to this category.
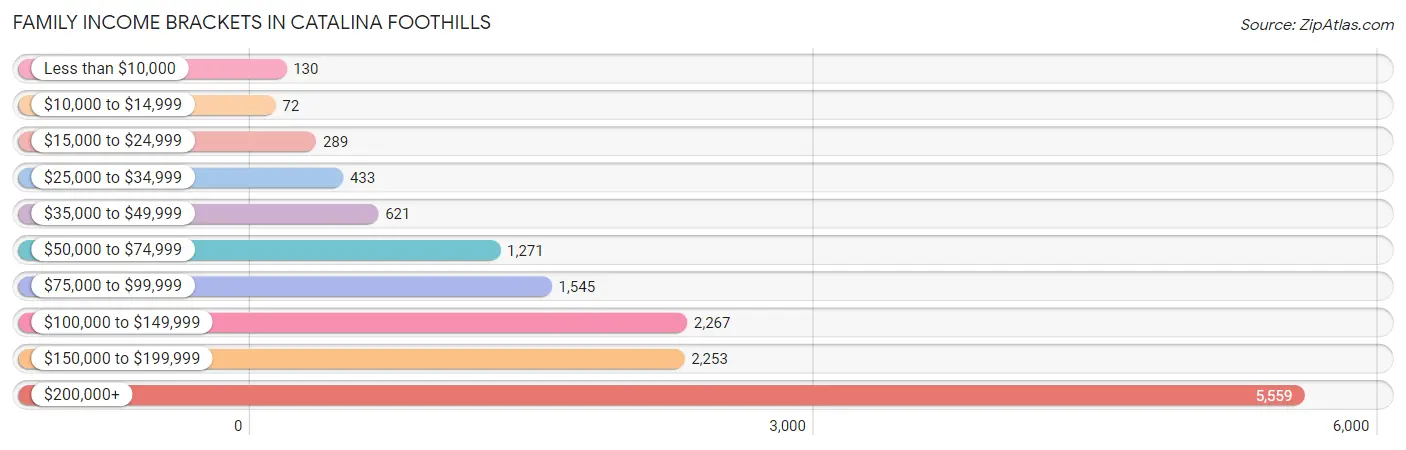
| Income Bracket | # Families | % Families |
| Less than $10,000 | 130 | 0.9% |
| $10,000 to $14,999 | 72 | 0.5% |
| $15,000 to $24,999 | 289 | 2.0% |
| $25,000 to $34,999 | 433 | 3.0% |
| $35,000 to $49,999 | 621 | 4.3% |
| $50,000 to $74,999 | 1,271 | 8.8% |
| $75,000 to $99,999 | 1,545 | 10.7% |
| $100,000 to $149,999 | 2,267 | 15.7% |
| $150,000 to $199,999 | 2,253 | 15.6% |
| $200,000+ | 5,559 | 38.5% |
Family Income by Famaliy Size in Catalina Foothills
7+ person families (46 | 0.3%) account for the highest median family income in Catalina Foothills with $250,001 per family, while 2-person families (9,322 | 64.6%) have the highest median income of $72,561 per family member.
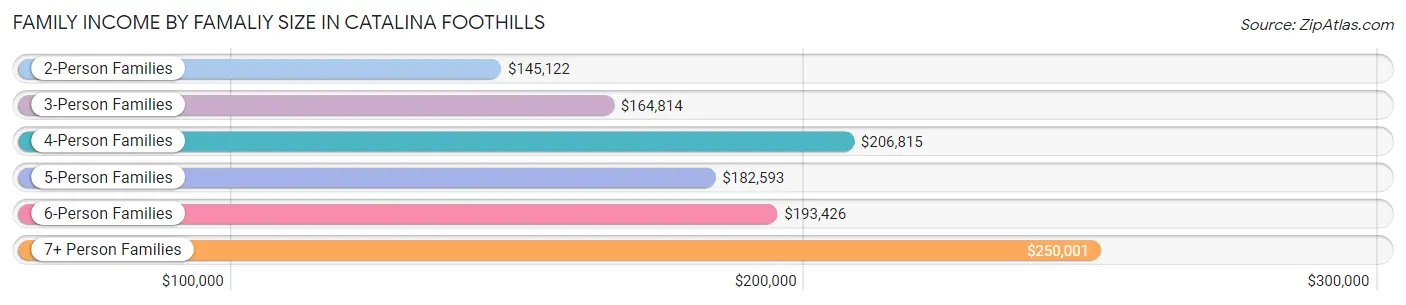
| Income Bracket | # Families | Median Income |
| 2-Person Families | 9,322 (64.6%) | $145,122 |
| 3-Person Families | 2,177 (15.1%) | $164,814 |
| 4-Person Families | 1,951 (13.5%) | $206,815 |
| 5-Person Families | 726 (5.0%) | $182,593 |
| 6-Person Families | 218 (1.5%) | $193,426 |
| 7+ Person Families | 46 (0.3%) | $250,001 |
| Total | 14,440 (100.0%) | $161,464 |
Family Income by Number of Earners in Catalina Foothills
The median family income in Catalina Foothills is $161,464, with families comprising 3+ earners (886) having the highest median family income of $231,964, while families with no earners (3,666) have the lowest median family income of $113,773, accounting for 6.1% and 25.4% of families, respectively.
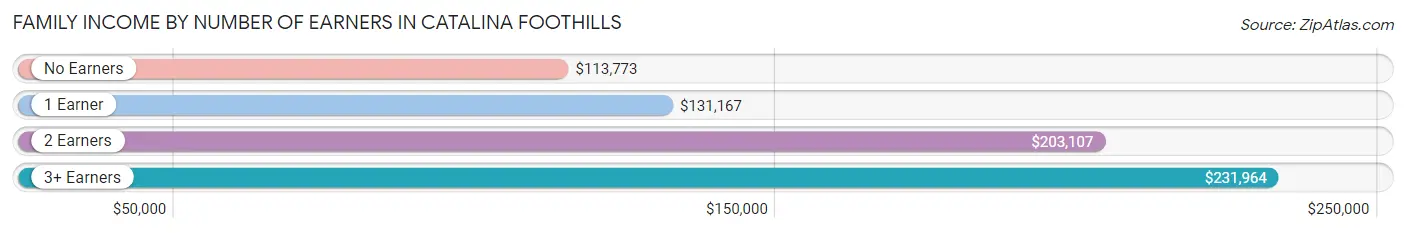
| Number of Earners | # Families | Median Income |
| No Earners | 3,666 (25.4%) | $113,773 |
| 1 Earner | 4,484 (31.0%) | $131,167 |
| 2 Earners | 5,404 (37.4%) | $203,107 |
| 3+ Earners | 886 (6.1%) | $231,964 |
| Total | 14,440 (100.0%) | $161,464 |
Household Income in Catalina Foothills
Household Income Brackets in Catalina Foothills
With 6,605 households falling in the category, the $200,000+ income range is the most frequent in Catalina Foothills, accounting for 27.9% of all households. In contrast, only 473 households (2.0%) fall into the $10,000 to $14,999 income bracket, making it the least populous group.
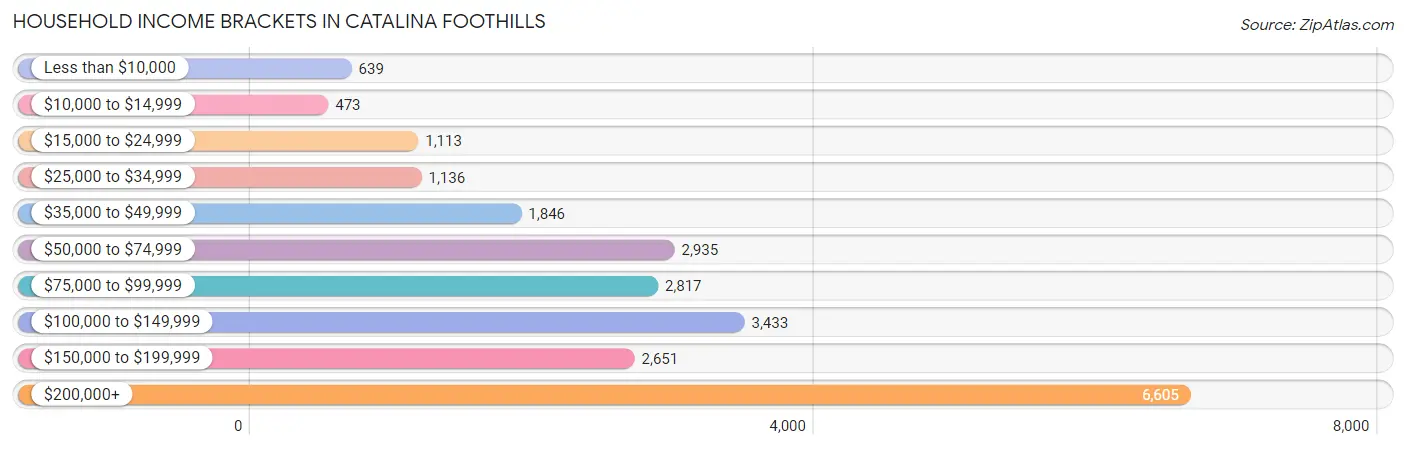
| Income Bracket | # Households | % Households |
| Less than $10,000 | 639 | 2.7% |
| $10,000 to $14,999 | 473 | 2.0% |
| $15,000 to $24,999 | 1,113 | 4.7% |
| $25,000 to $34,999 | 1,136 | 4.8% |
| $35,000 to $49,999 | 1,846 | 7.8% |
| $50,000 to $74,999 | 2,935 | 12.4% |
| $75,000 to $99,999 | 2,817 | 11.9% |
| $100,000 to $149,999 | 3,433 | 14.5% |
| $150,000 to $199,999 | 2,651 | 11.2% |
| $200,000+ | 6,605 | 27.9% |
Household Income by Householder Age in Catalina Foothills
The median household income in Catalina Foothills is $110,660, with the highest median household income of $150,383 found in the 45 to 64 years age bracket for the primary householder. A total of 7,935 households (33.5%) fall into this category. Meanwhile, the 15 to 24 years age bracket for the primary householder has the lowest median household income of $30,319, with 760 households (3.2%) in this group.
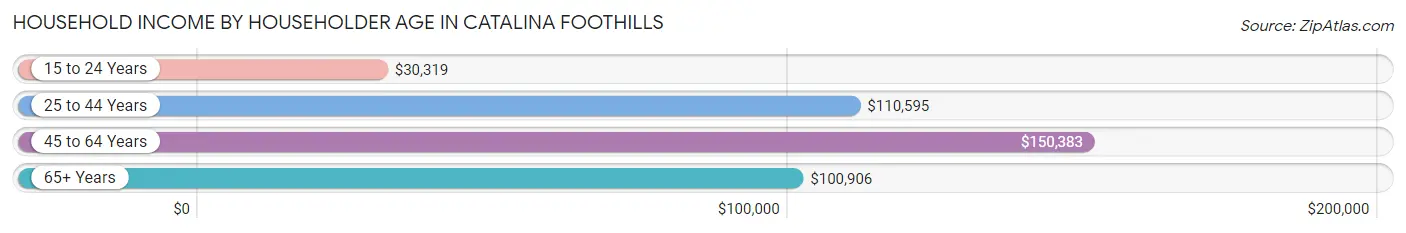
| Income Bracket | # Households | Median Income |
| 15 to 24 Years | 760 (3.2%) | $30,319 |
| 25 to 44 Years | 4,566 (19.3%) | $110,595 |
| 45 to 64 Years | 7,935 (33.5%) | $150,383 |
| 65+ Years | 10,412 (44.0%) | $100,906 |
| Total | 23,673 (100.0%) | $110,660 |
Poverty in Catalina Foothills
Income Below Poverty by Sex and Age in Catalina Foothills
With 3.0% poverty level for males and 4.9% for females among the residents of Catalina Foothills, 18 to 24 year old males and 18 to 24 year old females are the most vulnerable to poverty, with 107 males (6.1%) and 152 females (11.7%) in their respective age groups living below the poverty level.
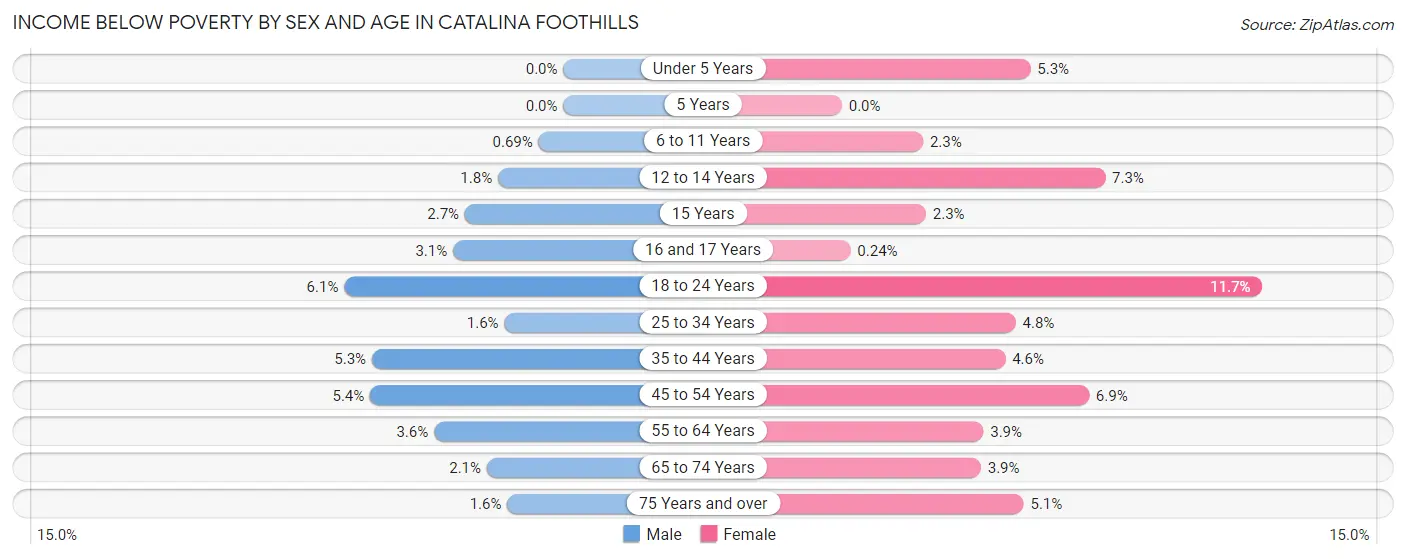
| Age Bracket | Male | Female |
| Under 5 Years | 0 (0.0%) | 40 (5.2%) |
| 5 Years | 0 (0.0%) | 0 (0.0%) |
| 6 to 11 Years | 9 (0.7%) | 34 (2.3%) |
| 12 to 14 Years | 10 (1.8%) | 40 (7.3%) |
| 15 Years | 15 (2.7%) | 9 (2.3%) |
| 16 and 17 Years | 18 (3.1%) | 1 (0.2%) |
| 18 to 24 Years | 107 (6.1%) | 152 (11.7%) |
| 25 to 34 Years | 34 (1.6%) | 83 (4.8%) |
| 35 to 44 Years | 123 (5.3%) | 115 (4.5%) |
| 45 to 54 Years | 143 (5.4%) | 195 (6.9%) |
| 55 to 64 Years | 142 (3.6%) | 180 (3.9%) |
| 65 to 74 Years | 97 (2.1%) | 191 (3.9%) |
| 75 Years and over | 51 (1.6%) | 196 (5.1%) |
| Total | 749 (3.0%) | 1,236 (4.9%) |
Income Above Poverty by Sex and Age in Catalina Foothills
According to the poverty statistics in Catalina Foothills, males aged under 5 years and females aged 5 years are the age groups that are most secure financially, with 100.0% of males and 100.0% of females in these age groups living above the poverty line.
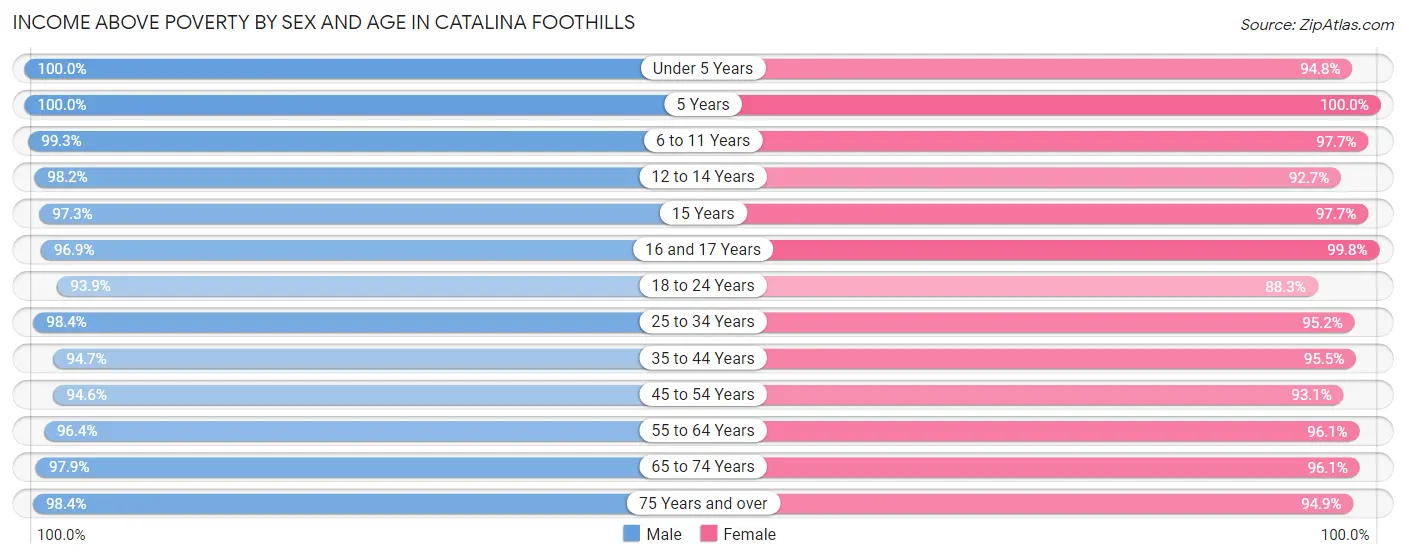
| Age Bracket | Male | Female |
| Under 5 Years | 857 (100.0%) | 722 (94.8%) |
| 5 Years | 165 (100.0%) | 124 (100.0%) |
| 6 to 11 Years | 1,292 (99.3%) | 1,469 (97.7%) |
| 12 to 14 Years | 538 (98.2%) | 506 (92.7%) |
| 15 Years | 532 (97.3%) | 376 (97.7%) |
| 16 and 17 Years | 568 (96.9%) | 410 (99.8%) |
| 18 to 24 Years | 1,647 (93.9%) | 1,146 (88.3%) |
| 25 to 34 Years | 2,039 (98.4%) | 1,633 (95.2%) |
| 35 to 44 Years | 2,185 (94.7%) | 2,413 (95.5%) |
| 45 to 54 Years | 2,514 (94.6%) | 2,638 (93.1%) |
| 55 to 64 Years | 3,801 (96.4%) | 4,393 (96.1%) |
| 65 to 74 Years | 4,456 (97.9%) | 4,749 (96.1%) |
| 75 Years and over | 3,208 (98.4%) | 3,681 (94.9%) |
| Total | 23,802 (97.0%) | 24,260 (95.2%) |
Income Below Poverty Among Married-Couple Families in Catalina Foothills
The poverty statistics for married-couple families in Catalina Foothills show that 1.5% or 189 of the total 12,533 families live below the poverty line. Families with 1 or 2 children have the highest poverty rate of 1.7%, comprising of 44 families. On the other hand, families with 5 or more children have the lowest poverty rate of 0.0%, which includes 0 families.
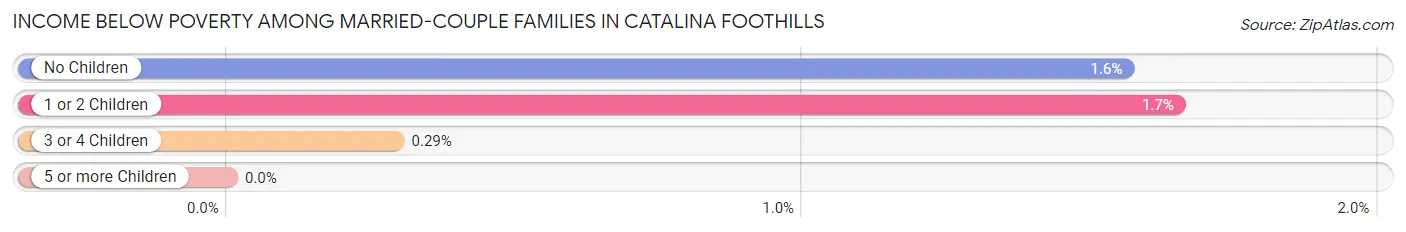
| Children | Above Poverty | Below Poverty |
| No Children | 9,022 (98.4%) | 143 (1.6%) |
| 1 or 2 Children | 2,623 (98.4%) | 44 (1.7%) |
| 3 or 4 Children | 692 (99.7%) | 2 (0.3%) |
| 5 or more Children | 7 (100.0%) | 0 (0.0%) |
| Total | 12,344 (98.5%) | 189 (1.5%) |
Income Below Poverty Among Single-Parent Households in Catalina Foothills
According to the poverty data in Catalina Foothills, 7.0% or 44 single-father households and 6.0% or 77 single-mother households are living below the poverty line. Among single-father households, those with 1 or 2 children have the highest poverty rate, with 33 households (9.3%) experiencing poverty. Likewise, among single-mother households, those with 1 or 2 children have the highest poverty rate, with 63 households (11.4%) falling below the poverty line.
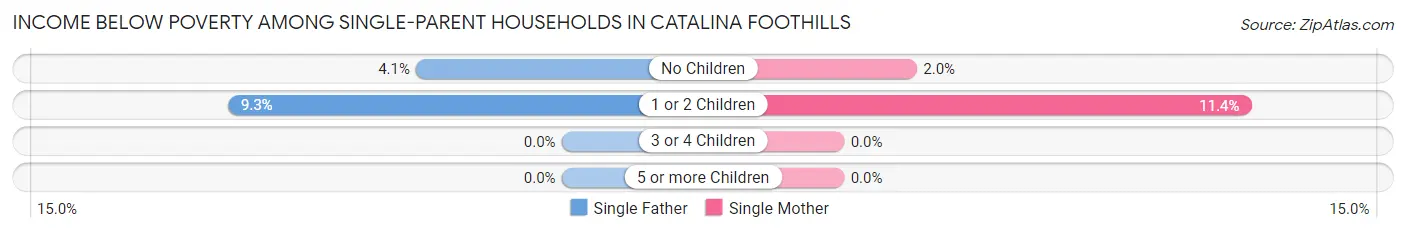
| Children | Single Father | Single Mother |
| No Children | 11 (4.1%) | 14 (2.0%) |
| 1 or 2 Children | 33 (9.3%) | 63 (11.4%) |
| 3 or 4 Children | 0 (0.0%) | 0 (0.0%) |
| 5 or more Children | 0 (0.0%) | 0 (0.0%) |
| Total | 44 (7.0%) | 77 (6.0%) |
Income Below Poverty Among Married-Couple vs Single-Parent Households in Catalina Foothills
The poverty data for Catalina Foothills shows that 189 of the married-couple family households (1.5%) and 121 of the single-parent households (6.4%) are living below the poverty level. Within the married-couple family households, those with 1 or 2 children have the highest poverty rate, with 44 households (1.7%) falling below the poverty line. Among the single-parent households, those with 1 or 2 children have the highest poverty rate, with 96 household (10.6%) living below poverty.
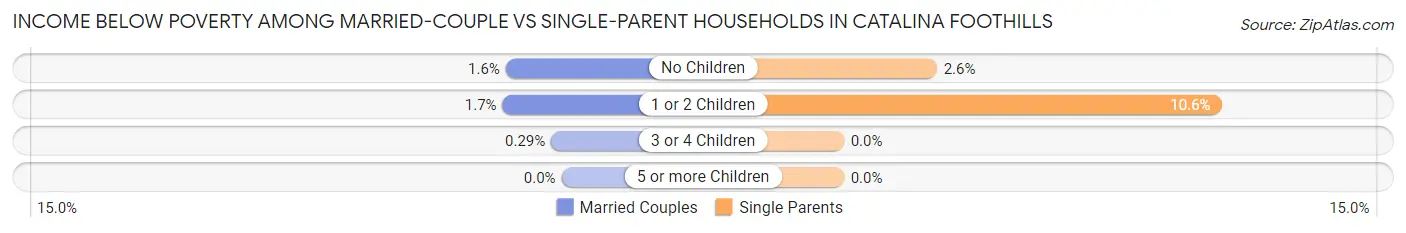
| Children | Married-Couple Families | Single-Parent Households |
| No Children | 143 (1.6%) | 25 (2.6%) |
| 1 or 2 Children | 44 (1.7%) | 96 (10.6%) |
| 3 or 4 Children | 2 (0.3%) | 0 (0.0%) |
| 5 or more Children | 0 (0.0%) | 0 (0.0%) |
| Total | 189 (1.5%) | 121 (6.4%) |
Race in Catalina Foothills
The most populous races in Catalina Foothills are White / Caucasian (40,824 | 80.7%), Hispanic or Latino (6,148 | 12.2%), and Two or more Races (4,541 | 9.0%).
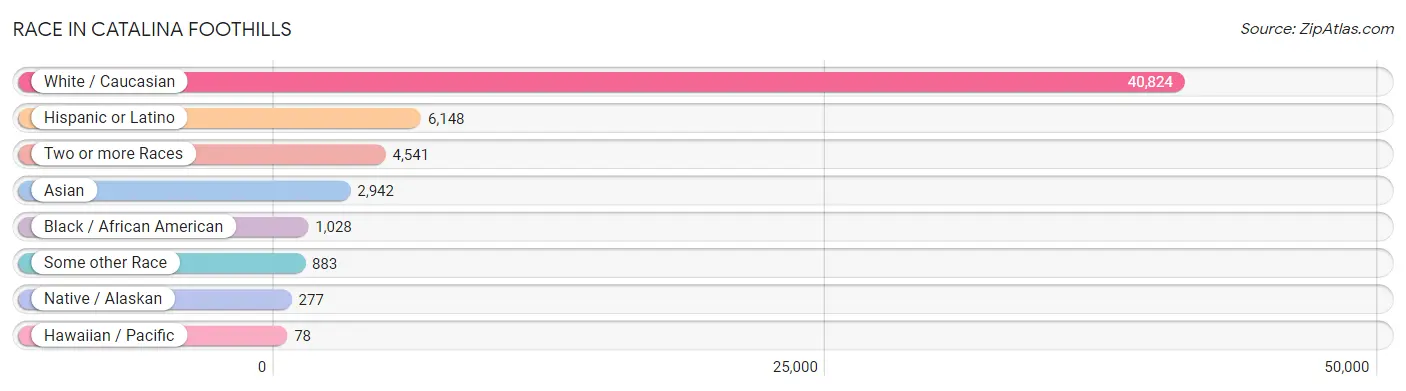
| Race | # Population | % Population |
| Asian | 2,942 | 5.8% |
| Black / African American | 1,028 | 2.0% |
| Hawaiian / Pacific | 78 | 0.2% |
| Hispanic or Latino | 6,148 | 12.2% |
| Native / Alaskan | 277 | 0.5% |
| White / Caucasian | 40,824 | 80.7% |
| Two or more Races | 4,541 | 9.0% |
| Some other Race | 883 | 1.8% |
| Total | 50,573 | 100.0% |
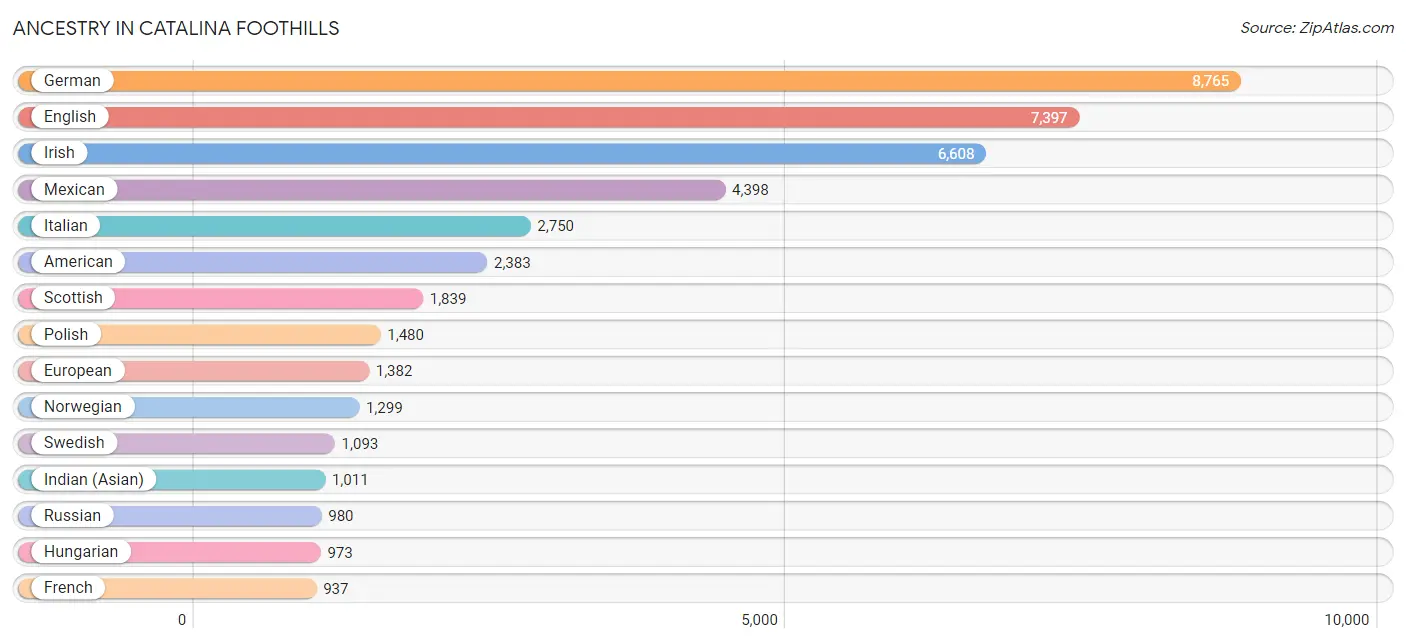
Ancestry in Catalina Foothills
The most populous ancestries reported in Catalina Foothills are German (8,765 | 17.3%), English (7,397 | 14.6%), Irish (6,608 | 13.1%), Mexican (4,398 | 8.7%), and Italian (2,750 | 5.4%), together accounting for 59.2% of all Catalina Foothills residents.
| Ancestry | # Population | % Population |
| African | 18 | 0.0% |
| Albanian | 18 | 0.0% |
| Aleut | 6 | 0.0% |
| Alsatian | 6 | 0.0% |
| American | 2,383 | 4.7% |
| Apache | 71 | 0.1% |
| Arab | 811 | 1.6% |
| Argentinean | 68 | 0.1% |
| Armenian | 83 | 0.2% |
| Australian | 42 | 0.1% |
| Austrian | 234 | 0.5% |
| Basque | 20 | 0.0% |
| Belgian | 72 | 0.1% |
| Bhutanese | 327 | 0.6% |
| Blackfeet | 18 | 0.0% |
| Brazilian | 39 | 0.1% |
| British | 827 | 1.6% |
| Burmese | 638 | 1.3% |
| Canadian | 221 | 0.4% |
| Celtic | 43 | 0.1% |
| Central American | 291 | 0.6% |
| Central American Indian | 223 | 0.4% |
| Cherokee | 113 | 0.2% |
| Chilean | 11 | 0.0% |
| Chinese | 50 | 0.1% |
| Chippewa | 11 | 0.0% |
| Choctaw | 9 | 0.0% |
| Colombian | 116 | 0.2% |
| Comanche | 52 | 0.1% |
| Costa Rican | 10 | 0.0% |
| Creek | 12 | 0.0% |
| Croatian | 106 | 0.2% |
| Cuban | 112 | 0.2% |
| Cypriot | 21 | 0.0% |
| Czech | 340 | 0.7% |
| Czechoslovakian | 58 | 0.1% |
| Danish | 303 | 0.6% |
| Dominican | 41 | 0.1% |
| Dutch | 681 | 1.3% |
| Eastern European | 789 | 1.6% |
| Ecuadorian | 10 | 0.0% |
| Egyptian | 453 | 0.9% |
| English | 7,397 | 14.6% |
| Estonian | 8 | 0.0% |
| Ethiopian | 132 | 0.3% |
| European | 1,382 | 2.7% |
| Finnish | 75 | 0.2% |
| French | 937 | 1.8% |
| French Canadian | 391 | 0.8% |
| German | 8,765 | 17.3% |
| Greek | 280 | 0.5% |
| Guamanian / Chamorro | 28 | 0.1% |
| Haitian | 240 | 0.5% |
| Honduran | 223 | 0.4% |
| Hungarian | 973 | 1.9% |
| Indian (Asian) | 1,011 | 2.0% |
| Iranian | 315 | 0.6% |
| Iraqi | 26 | 0.1% |
| Irish | 6,608 | 13.1% |
| Israeli | 13 | 0.0% |
| Italian | 2,750 | 5.4% |
| Jamaican | 59 | 0.1% |
| Jordanian | 61 | 0.1% |
| Kenyan | 15 | 0.0% |
| Korean | 557 | 1.1% |
| Latvian | 20 | 0.0% |
| Lebanese | 132 | 0.3% |
| Lithuanian | 346 | 0.7% |
| Lumbee | 8 | 0.0% |
| Luxembourger | 20 | 0.0% |
| Mexican | 4,398 | 8.7% |
| Mongolian | 2 | 0.0% |
| Moroccan | 26 | 0.1% |
| Native Hawaiian | 34 | 0.1% |
| Navajo | 133 | 0.3% |
| Nicaraguan | 42 | 0.1% |
| Nigerian | 13 | 0.0% |
| Northern European | 289 | 0.6% |
| Norwegian | 1,299 | 2.6% |
| Pakistani | 100 | 0.2% |
| Pennsylvania German | 25 | 0.1% |
| Peruvian | 18 | 0.0% |
| Polish | 1,480 | 2.9% |
| Portuguese | 557 | 1.1% |
| Puerto Rican | 360 | 0.7% |
| Romanian | 119 | 0.2% |
| Russian | 980 | 1.9% |
| Salvadoran | 16 | 0.0% |
| Samoan | 50 | 0.1% |
| Scandinavian | 485 | 1.0% |
| Scotch-Irish | 579 | 1.1% |
| Scottish | 1,839 | 3.6% |
| Sioux | 21 | 0.0% |
| Slavic | 48 | 0.1% |
| Slovak | 27 | 0.1% |
| Slovene | 49 | 0.1% |
| South American | 333 | 0.7% |
| Spaniard | 245 | 0.5% |
| Spanish | 173 | 0.3% |
| Sri Lankan | 108 | 0.2% |
| Subsaharan African | 213 | 0.4% |
| Swedish | 1,093 | 2.2% |
| Swiss | 418 | 0.8% |
| Syrian | 101 | 0.2% |
| Thai | 817 | 1.6% |
| Tohono O'Odham | 148 | 0.3% |
| Turkish | 120 | 0.2% |
| Ukrainian | 261 | 0.5% |
| Venezuelan | 110 | 0.2% |
| Vietnamese | 3 | 0.0% |
| Welsh | 369 | 0.7% |
| West Indian | 27 | 0.1% |
| Yaqui | 80 | 0.2% |
| Yugoslavian | 15 | 0.0% | View All 114 Rows |
Immigrants in Catalina Foothills
The most numerous immigrant groups reported in Catalina Foothills came from Asia (2,802 | 5.5%), Latin America (1,511 | 3.0%), Europe (1,201 | 2.4%), Eastern Asia (909 | 1.8%), and South Central Asia (885 | 1.8%), together accounting for 14.5% of all Catalina Foothills residents.
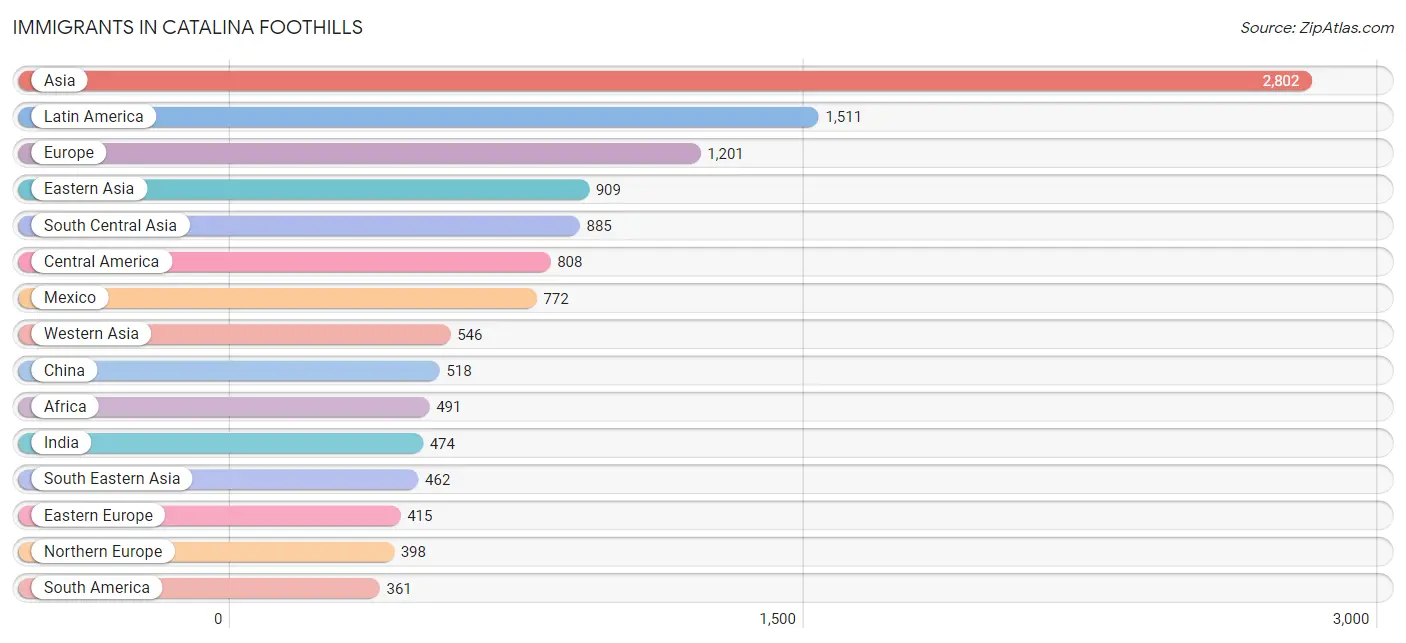
| Immigration Origin | # Population | % Population |
| Africa | 491 | 1.0% |
| Argentina | 64 | 0.1% |
| Armenia | 10 | 0.0% |
| Asia | 2,802 | 5.5% |
| Australia | 94 | 0.2% |
| Austria | 21 | 0.0% |
| Bangladesh | 2 | 0.0% |
| Belgium | 8 | 0.0% |
| Brazil | 82 | 0.2% |
| Canada | 300 | 0.6% |
| Caribbean | 342 | 0.7% |
| Central America | 808 | 1.6% |
| Chile | 5 | 0.0% |
| China | 518 | 1.0% |
| Colombia | 98 | 0.2% |
| Congo | 3 | 0.0% |
| Costa Rica | 10 | 0.0% |
| Cuba | 87 | 0.2% |
| Eastern Africa | 119 | 0.2% |
| Eastern Asia | 909 | 1.8% |
| Eastern Europe | 415 | 0.8% |
| Ecuador | 19 | 0.0% |
| Egypt | 156 | 0.3% |
| England | 200 | 0.4% |
| Ethiopia | 55 | 0.1% |
| Europe | 1,201 | 2.4% |
| France | 30 | 0.1% |
| Germany | 207 | 0.4% |
| Greece | 17 | 0.0% |
| Haiti | 184 | 0.4% |
| Hong Kong | 49 | 0.1% |
| Hungary | 146 | 0.3% |
| India | 474 | 0.9% |
| Indonesia | 8 | 0.0% |
| Iran | 257 | 0.5% |
| Iraq | 121 | 0.2% |
| Ireland | 10 | 0.0% |
| Israel | 103 | 0.2% |
| Italy | 21 | 0.0% |
| Jamaica | 71 | 0.1% |
| Japan | 40 | 0.1% |
| Jordan | 61 | 0.1% |
| Kazakhstan | 6 | 0.0% |
| Kenya | 10 | 0.0% |
| Korea | 351 | 0.7% |
| Kuwait | 12 | 0.0% |
| Latin America | 1,511 | 3.0% |
| Lebanon | 14 | 0.0% |
| Lithuania | 8 | 0.0% |
| Malaysia | 2 | 0.0% |
| Mexico | 772 | 1.5% |
| Middle Africa | 11 | 0.0% |
| Morocco | 39 | 0.1% |
| Netherlands | 29 | 0.1% |
| Nicaragua | 7 | 0.0% |
| Nigeria | 13 | 0.0% |
| Northern Africa | 195 | 0.4% |
| Northern Europe | 398 | 0.8% |
| Oceania | 130 | 0.3% |
| Pakistan | 120 | 0.2% |
| Panama | 19 | 0.0% |
| Philippines | 296 | 0.6% |
| Poland | 48 | 0.1% |
| Portugal | 17 | 0.0% |
| Romania | 25 | 0.1% |
| Russia | 101 | 0.2% |
| Saudi Arabia | 6 | 0.0% |
| Scotland | 43 | 0.1% |
| South Africa | 4 | 0.0% |
| South America | 361 | 0.7% |
| South Central Asia | 885 | 1.8% |
| South Eastern Asia | 462 | 0.9% |
| Southern Europe | 61 | 0.1% |
| Spain | 6 | 0.0% |
| Switzerland | 32 | 0.1% |
| Syria | 83 | 0.2% |
| Taiwan | 26 | 0.1% |
| Thailand | 76 | 0.2% |
| Turkey | 128 | 0.3% |
| Ukraine | 52 | 0.1% |
| Venezuela | 93 | 0.2% |
| Vietnam | 80 | 0.2% |
| Western Africa | 13 | 0.0% |
| Western Asia | 546 | 1.1% |
| Western Europe | 327 | 0.6% |
| Zaire | 8 | 0.0% |
| Zimbabwe | 12 | 0.0% | View All 87 Rows |
Sex and Age in Catalina Foothills
Sex and Age in Catalina Foothills
The most populous age groups in Catalina Foothills are 65 to 69 Years (2,461 | 10.0%) for men and 60 to 64 Years (2,671 | 10.3%) for women.
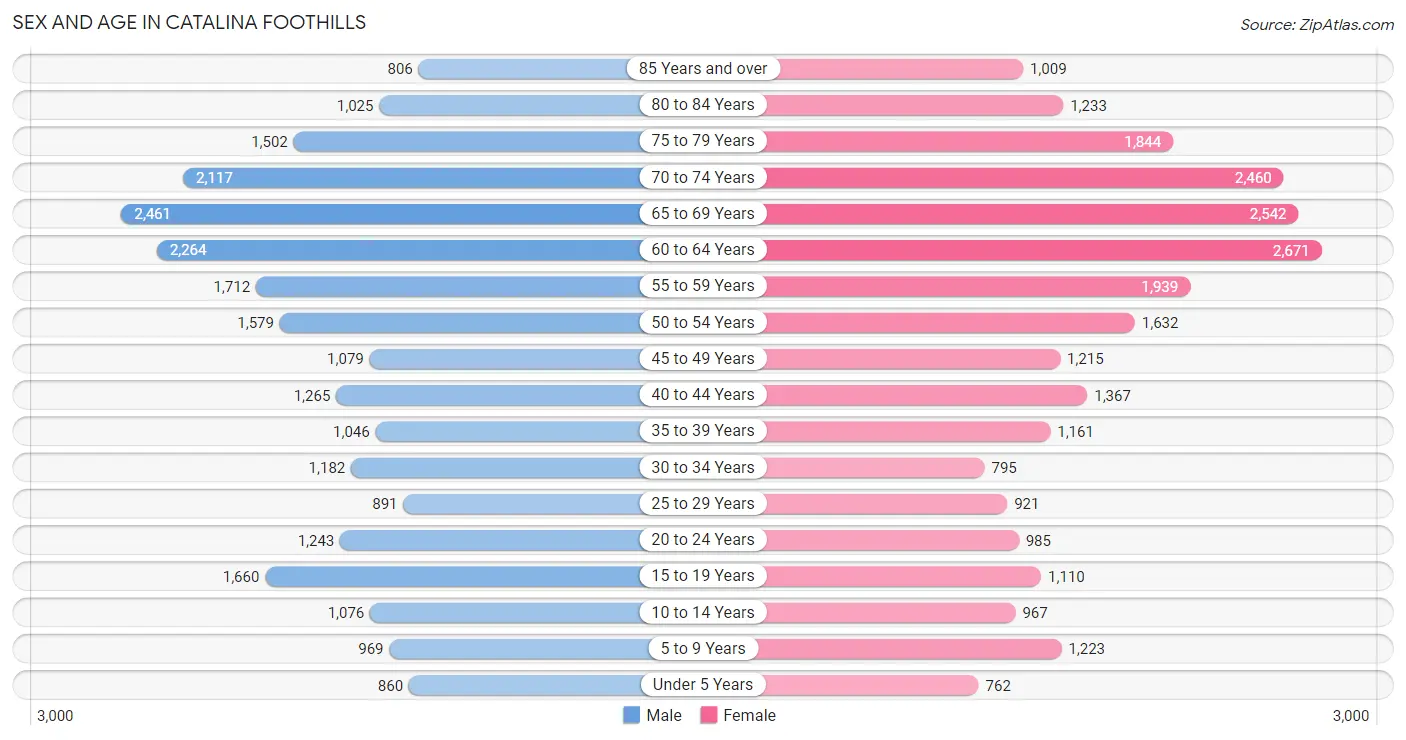
| Age Bracket | Male | Female |
| Under 5 Years | 860 (3.5%) | 762 (2.9%) |
| 5 to 9 Years | 969 (3.9%) | 1,223 (4.7%) |
| 10 to 14 Years | 1,076 (4.3%) | 967 (3.7%) |
| 15 to 19 Years | 1,660 (6.7%) | 1,110 (4.3%) |
| 20 to 24 Years | 1,243 (5.0%) | 985 (3.8%) |
| 25 to 29 Years | 891 (3.6%) | 921 (3.6%) |
| 30 to 34 Years | 1,182 (4.8%) | 795 (3.1%) |
| 35 to 39 Years | 1,046 (4.2%) | 1,161 (4.5%) |
| 40 to 44 Years | 1,265 (5.1%) | 1,367 (5.3%) |
| 45 to 49 Years | 1,079 (4.4%) | 1,215 (4.7%) |
| 50 to 54 Years | 1,579 (6.4%) | 1,632 (6.3%) |
| 55 to 59 Years | 1,712 (6.9%) | 1,939 (7.5%) |
| 60 to 64 Years | 2,264 (9.1%) | 2,671 (10.3%) |
| 65 to 69 Years | 2,461 (10.0%) | 2,542 (9.8%) |
| 70 to 74 Years | 2,117 (8.6%) | 2,460 (9.5%) |
| 75 to 79 Years | 1,502 (6.1%) | 1,844 (7.1%) |
| 80 to 84 Years | 1,025 (4.1%) | 1,233 (4.8%) |
| 85 Years and over | 806 (3.3%) | 1,009 (3.9%) |
| Total | 24,737 (100.0%) | 25,836 (100.0%) |
Families and Households in Catalina Foothills
Median Family Size in Catalina Foothills
The median family size in Catalina Foothills is 2.70 persons per family, with single female/mother families (1,283 | 8.9%) accounting for the largest median family size of 2.72 persons per family. On the other hand, single male/father families (624 | 4.3%) represent the smallest median family size with 2.50 persons per family.
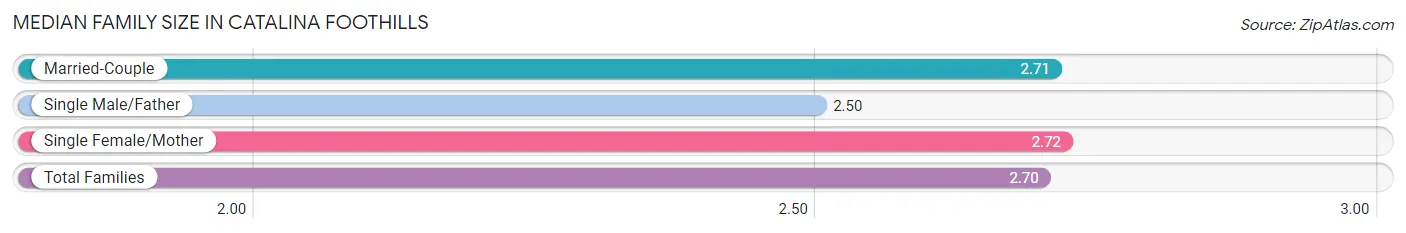
| Family Type | # Families | Family Size |
| Married-Couple | 12,533 (86.8%) | 2.71 |
| Single Male/Father | 624 (4.3%) | 2.50 |
| Single Female/Mother | 1,283 (8.9%) | 2.72 |
| Total Families | 14,440 (100.0%) | 2.70 |
Median Household Size in Catalina Foothills
The median household size in Catalina Foothills is 2.11 persons per household, with single female/mother households (1,283 | 5.4%) accounting for the largest median household size of 2.81 persons per household. non-family households (9,233 | 39.0%) represent the smallest median household size with 1.16 persons per household.
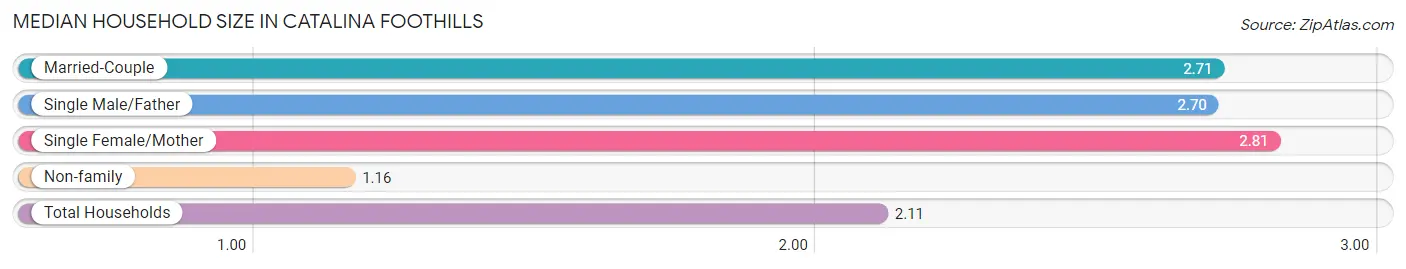
| Household Type | # Households | Household Size |
| Married-Couple | 12,533 (52.9%) | 2.71 |
| Single Male/Father | 624 (2.6%) | 2.70 |
| Single Female/Mother | 1,283 (5.4%) | 2.81 |
| Non-family | 9,233 (39.0%) | 1.16 |
| Total Households | 23,673 (100.0%) | 2.11 |
Household Size by Marriage Status in Catalina Foothills
Out of a total of 23,673 households in Catalina Foothills, 14,440 (61.0%) are family households, while 9,233 (39.0%) are nonfamily households. The most numerous type of family households are 2-person households, comprising 9,131, and the most common type of nonfamily households are 1-person households, comprising 7,780.
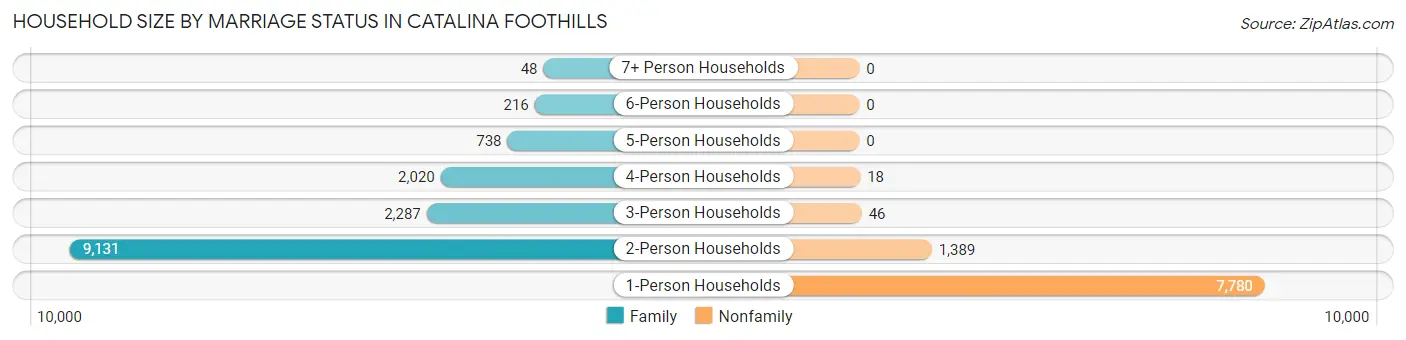
| Household Size | Family Households | Nonfamily Households |
| 1-Person Households | - | 7,780 (32.9%) |
| 2-Person Households | 9,131 (38.6%) | 1,389 (5.9%) |
| 3-Person Households | 2,287 (9.7%) | 46 (0.2%) |
| 4-Person Households | 2,020 (8.5%) | 18 (0.1%) |
| 5-Person Households | 738 (3.1%) | 0 (0.0%) |
| 6-Person Households | 216 (0.9%) | 0 (0.0%) |
| 7+ Person Households | 48 (0.2%) | 0 (0.0%) |
| Total | 14,440 (61.0%) | 9,233 (39.0%) |
Female Fertility in Catalina Foothills
Fertility by Age in Catalina Foothills
Average fertility rate in Catalina Foothills is 42.0 births per 1,000 women. Women in the age bracket of 20 to 34 years have the highest fertility rate with 58.0 births per 1,000 women. Women in the age bracket of 35 to 50 years acount for 53.0% of all women with births.
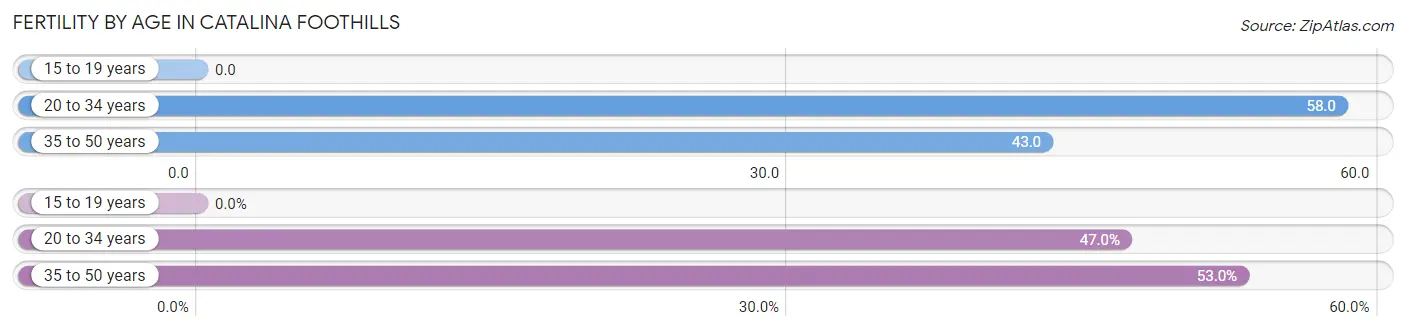
| Age Bracket | Women with Births | Births / 1,000 Women |
| 15 to 19 years | 0 (0.0%) | 0.0 |
| 20 to 34 years | 158 (47.0%) | 58.0 |
| 35 to 50 years | 178 (53.0%) | 43.0 |
| Total | 336 (100.0%) | 42.0 |
Fertility by Age by Marriage Status in Catalina Foothills
73.2% of women with births (336) in Catalina Foothills are married. The highest percentage of unmarried women with births falls into 35 to 50 years age bracket with 29.2% of them unmarried at the time of birth, while the lowest percentage of unmarried women with births belong to 20 to 34 years age bracket with 24.1% of them unmarried.
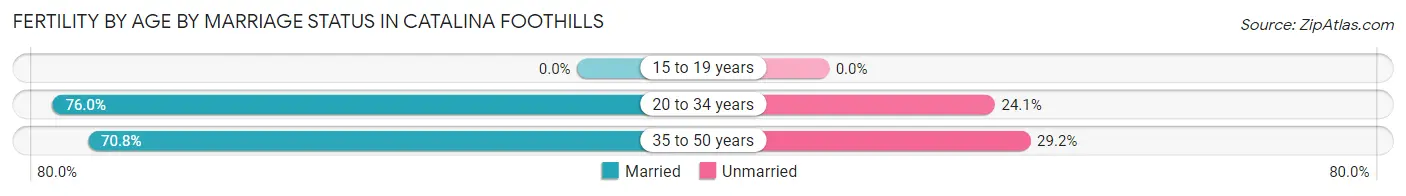
| Age Bracket | Married | Unmarried |
| 15 to 19 years | 0 (0.0%) | 0 (0.0%) |
| 20 to 34 years | 120 (75.9%) | 38 (24.0%) |
| 35 to 50 years | 126 (70.8%) | 52 (29.2%) |
| Total | 246 (73.2%) | 90 (26.8%) |
Fertility by Education in Catalina Foothills
Average fertility rate in Catalina Foothills is 42.0 births per 1,000 women. Women with the education attainment of high school diploma have the highest fertility rate of 57.0 births per 1,000 women, while women with the education attainment of college or associate's degree have the lowest fertility at 37.0 births per 1,000 women. Women with the education attainment of graduate degree represent 29.5% of all women with births.
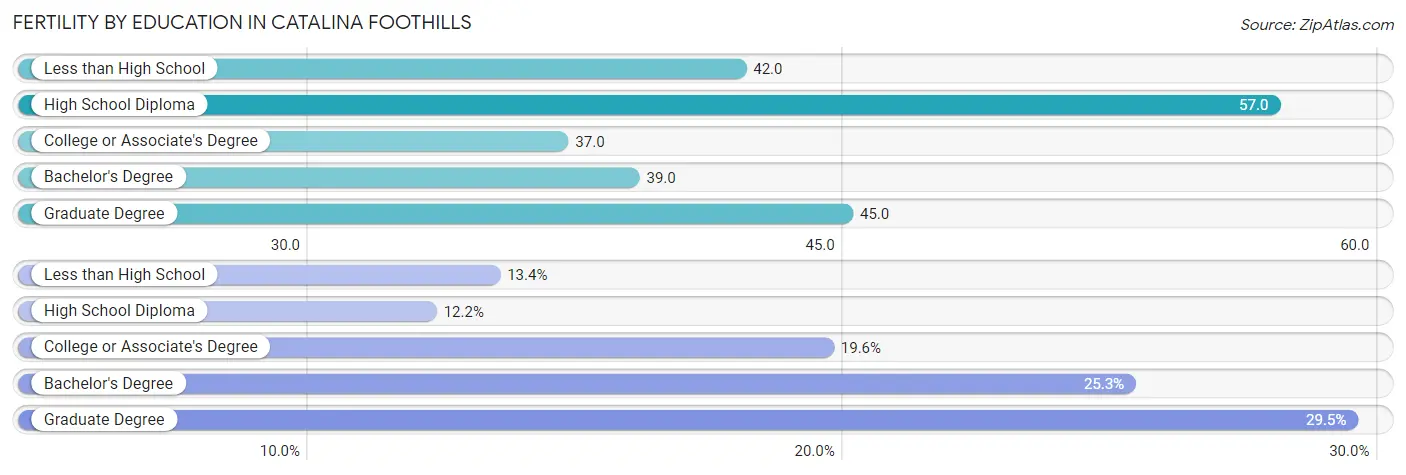
| Educational Attainment | Women with Births | Births / 1,000 Women |
| Less than High School | 45 (13.4%) | 42.0 |
| High School Diploma | 41 (12.2%) | 57.0 |
| College or Associate's Degree | 66 (19.6%) | 37.0 |
| Bachelor's Degree | 85 (25.3%) | 39.0 |
| Graduate Degree | 99 (29.5%) | 45.0 |
| Total | 336 (100.0%) | 42.0 |
Fertility by Education by Marriage Status in Catalina Foothills
26.8% of women with births in Catalina Foothills are unmarried. Women with the educational attainment of bachelor's degree are most likely to be married with 100.0% of them married at childbirth, while women with the educational attainment of less than high school are least likely to be married with 100.0% of them unmarried at childbirth.
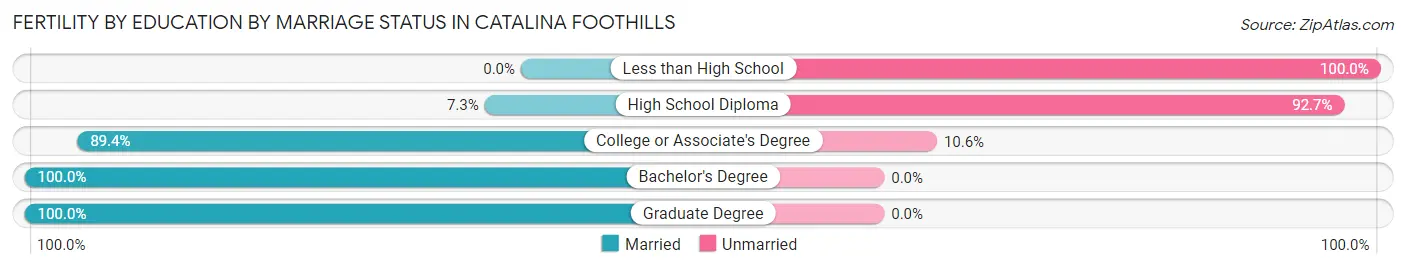
| Educational Attainment | Married | Unmarried |
| Less than High School | 0 (0.0%) | 45 (100.0%) |
| High School Diploma | 3 (7.3%) | 38 (92.7%) |
| College or Associate's Degree | 59 (89.4%) | 7 (10.6%) |
| Bachelor's Degree | 85 (100.0%) | 0 (0.0%) |
| Graduate Degree | 99 (100.0%) | 0 (0.0%) |
| Total | 246 (73.2%) | 90 (26.8%) |
Employment Characteristics in Catalina Foothills
Employment by Class of Employer in Catalina Foothills
Among the 22,851 employed individuals in Catalina Foothills, private company employees (11,690 | 51.2%), not-for-profit organizations (2,458 | 10.8%), and self-employed (incorporated) (2,276 | 10.0%) make up the most common classes of employment.
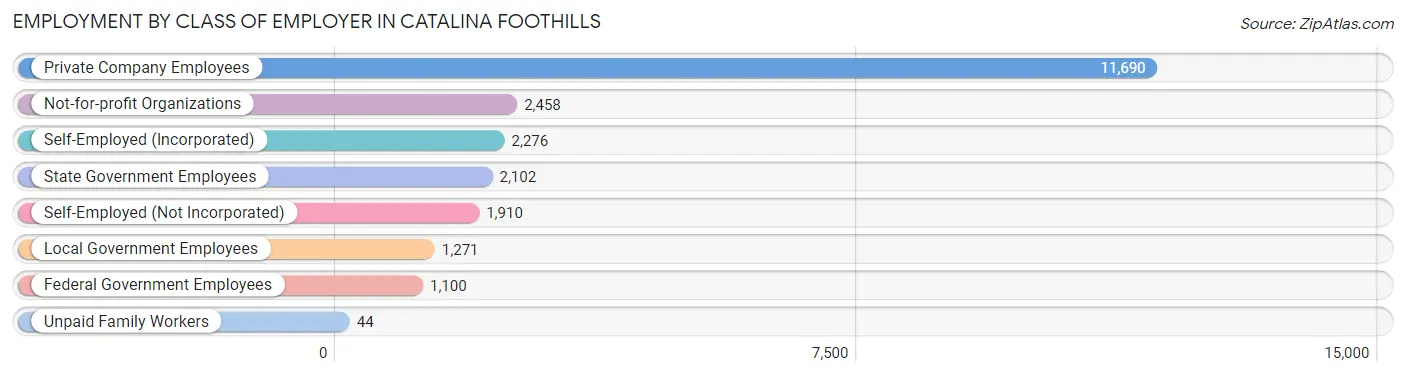
| Employer Class | # Employees | % Employees |
| Private Company Employees | 11,690 | 51.2% |
| Self-Employed (Incorporated) | 2,276 | 10.0% |
| Self-Employed (Not Incorporated) | 1,910 | 8.4% |
| Not-for-profit Organizations | 2,458 | 10.8% |
| Local Government Employees | 1,271 | 5.6% |
| State Government Employees | 2,102 | 9.2% |
| Federal Government Employees | 1,100 | 4.8% |
| Unpaid Family Workers | 44 | 0.2% |
| Total | 22,851 | 100.0% |
Employment Status by Age in Catalina Foothills
According to the labor force statistics for Catalina Foothills, out of the total population over 16 years of age (43,777), 54.9% or 24,034 individuals are in the labor force, with 3.9% or 937 of them unemployed. The age group with the highest labor force participation rate is 25 to 29 years, with 91.8% or 1,663 individuals in the labor force. Within the labor force, the 16 to 19 years age range has the highest percentage of unemployed individuals, with 13.9% or 69 of them being unemployed.
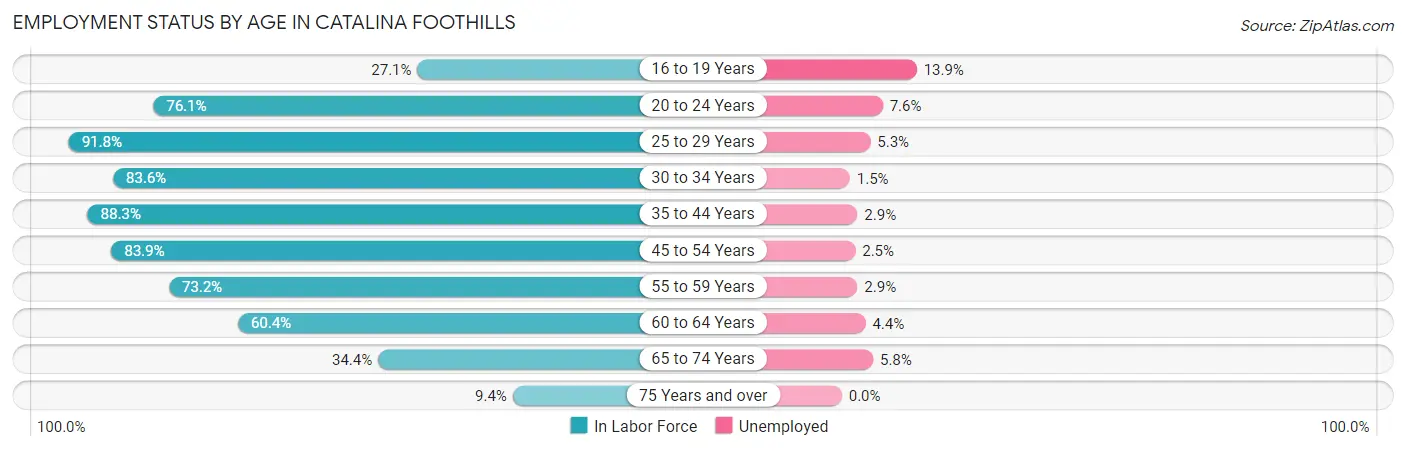
| Age Bracket | In Labor Force | Unemployed |
| 16 to 19 Years | 496 (27.1%) | 69 (13.9%) |
| 20 to 24 Years | 1,696 (76.1%) | 129 (7.6%) |
| 25 to 29 Years | 1,663 (91.8%) | 88 (5.3%) |
| 30 to 34 Years | 1,653 (83.6%) | 25 (1.5%) |
| 35 to 44 Years | 4,273 (88.3%) | 124 (2.9%) |
| 45 to 54 Years | 4,619 (83.9%) | 115 (2.5%) |
| 55 to 59 Years | 2,673 (73.2%) | 78 (2.9%) |
| 60 to 64 Years | 2,981 (60.4%) | 131 (4.4%) |
| 65 to 74 Years | 3,296 (34.4%) | 191 (5.8%) |
| 75 Years and over | 697 (9.4%) | 0 (0.0%) |
| Total | 24,034 (54.9%) | 937 (3.9%) |
Employment Status by Educational Attainment in Catalina Foothills
According to labor force statistics for Catalina Foothills, 78.6% of individuals (17,857) out of the total population between 25 and 64 years of age (22,719) are in the labor force, with 3.2% or 571 of them being unemployed. The group with the highest labor force participation rate are those with the educational attainment of bachelor's degree or higher, with 80.0% or 12,940 individuals in the labor force. Within the labor force, individuals with less than high school education have the highest percentage of unemployment, with 7.1% or 23 of them being unemployed.
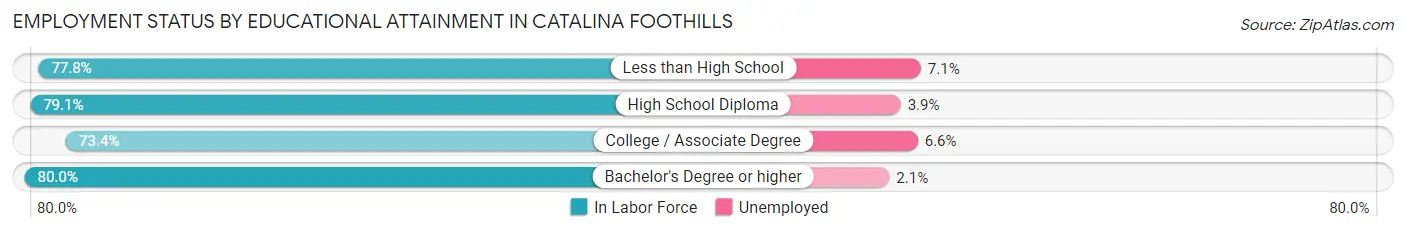
| Educational Attainment | In Labor Force | Unemployed |
| Less than High School | 326 (77.8%) | 30 (7.1%) |
| High School Diploma | 1,356 (79.1%) | 67 (3.9%) |
| College / Associate Degree | 3,238 (73.4%) | 291 (6.6%) |
| Bachelor's Degree or higher | 12,940 (80.0%) | 340 (2.1%) |
| Total | 17,857 (78.6%) | 727 (3.2%) |
Employment Occupations by Sex in Catalina Foothills
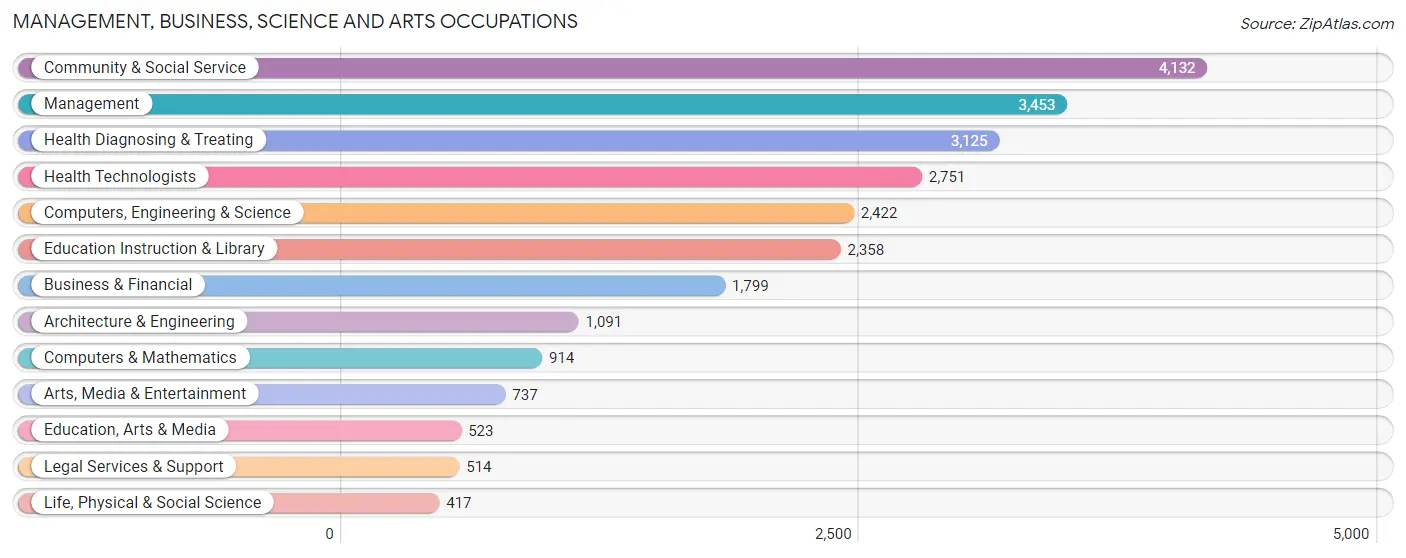
Management, Business, Science and Arts Occupations
The most common Management, Business, Science and Arts occupations in Catalina Foothills are Community & Social Service (4,132 | 18.1%), Management (3,453 | 15.2%), Health Diagnosing & Treating (3,125 | 13.7%), Health Technologists (2,751 | 12.1%), and Computers, Engineering & Science (2,422 | 10.6%).
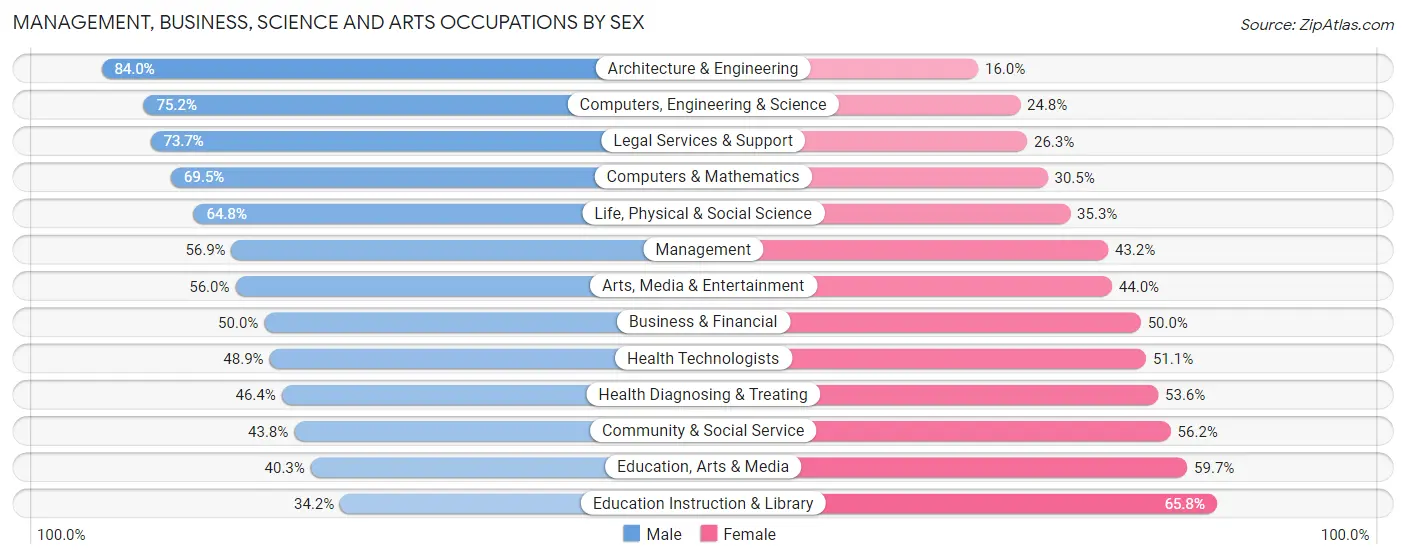
Management, Business, Science and Arts Occupations by Sex
Within the Management, Business, Science and Arts occupations in Catalina Foothills, the most male-oriented occupations are Architecture & Engineering (84.0%), Computers, Engineering & Science (75.2%), and Legal Services & Support (73.7%), while the most female-oriented occupations are Education Instruction & Library (65.8%), Education, Arts & Media (59.7%), and Community & Social Service (56.2%).
| Occupation | Male | Female |
| Management | 1,963 (56.9%) | 1,490 (43.1%) |
| Business & Financial | 900 (50.0%) | 899 (50.0%) |
| Computers, Engineering & Science | 1,821 (75.2%) | 601 (24.8%) |
| Computers & Mathematics | 635 (69.5%) | 279 (30.5%) |
| Architecture & Engineering | 916 (84.0%) | 175 (16.0%) |
| Life, Physical & Social Science | 270 (64.7%) | 147 (35.2%) |
| Community & Social Service | 1,809 (43.8%) | 2,323 (56.2%) |
| Education, Arts & Media | 211 (40.3%) | 312 (59.7%) |
| Legal Services & Support | 379 (73.7%) | 135 (26.3%) |
| Education Instruction & Library | 806 (34.2%) | 1,552 (65.8%) |
| Arts, Media & Entertainment | 413 (56.0%) | 324 (44.0%) |
| Health Diagnosing & Treating | 1,450 (46.4%) | 1,675 (53.6%) |
| Health Technologists | 1,346 (48.9%) | 1,405 (51.1%) |
| Total (Category) | 7,943 (53.2%) | 6,988 (46.8%) |
| Total (Overall) | 12,353 (54.2%) | 10,420 (45.8%) |
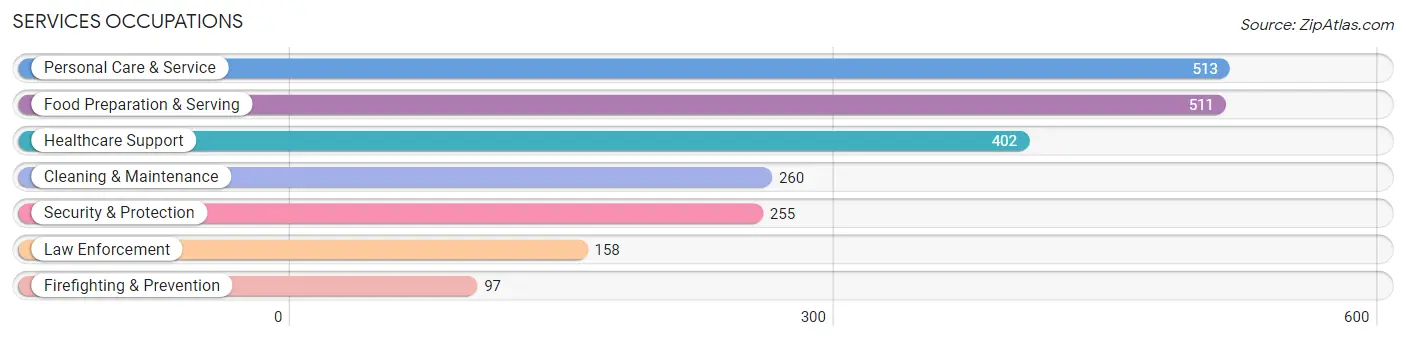
Services Occupations
The most common Services occupations in Catalina Foothills are Personal Care & Service (513 | 2.2%), Food Preparation & Serving (511 | 2.2%), Healthcare Support (402 | 1.8%), Cleaning & Maintenance (260 | 1.1%), and Security & Protection (255 | 1.1%).
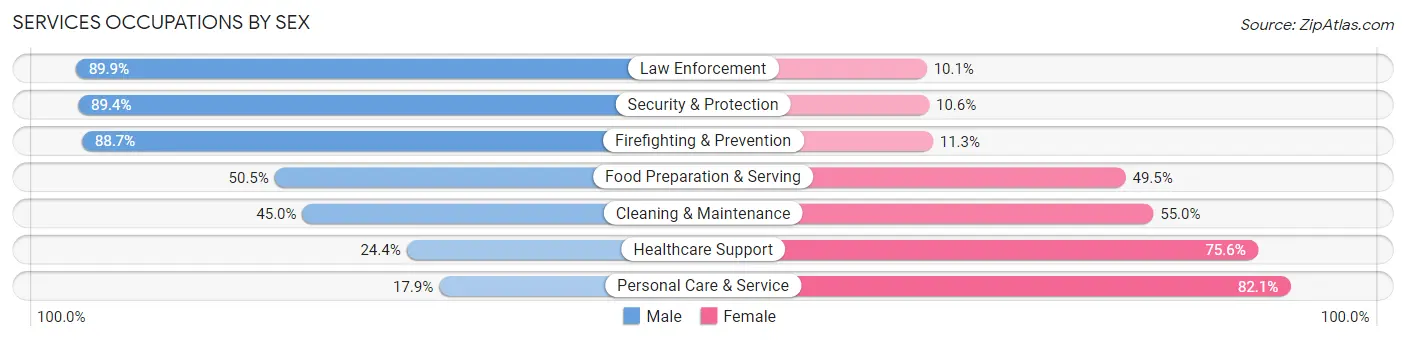
Services Occupations by Sex
Within the Services occupations in Catalina Foothills, the most male-oriented occupations are Law Enforcement (89.9%), Security & Protection (89.4%), and Firefighting & Prevention (88.7%), while the most female-oriented occupations are Personal Care & Service (82.1%), Healthcare Support (75.6%), and Cleaning & Maintenance (55.0%).
| Occupation | Male | Female |
| Healthcare Support | 98 (24.4%) | 304 (75.6%) |
| Security & Protection | 228 (89.4%) | 27 (10.6%) |
| Firefighting & Prevention | 86 (88.7%) | 11 (11.3%) |
| Law Enforcement | 142 (89.9%) | 16 (10.1%) |
| Food Preparation & Serving | 258 (50.5%) | 253 (49.5%) |
| Cleaning & Maintenance | 117 (45.0%) | 143 (55.0%) |
| Personal Care & Service | 92 (17.9%) | 421 (82.1%) |
| Total (Category) | 793 (40.9%) | 1,148 (59.1%) |
| Total (Overall) | 12,353 (54.2%) | 10,420 (45.8%) |
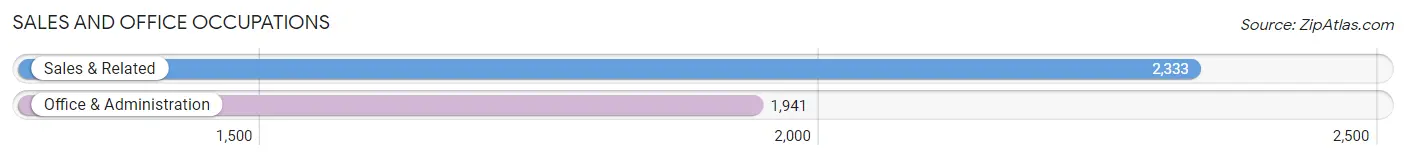
Sales and Office Occupations
The most common Sales and Office occupations in Catalina Foothills are Sales & Related (2,333 | 10.2%), and Office & Administration (1,941 | 8.5%).
Sales and Office Occupations by Sex
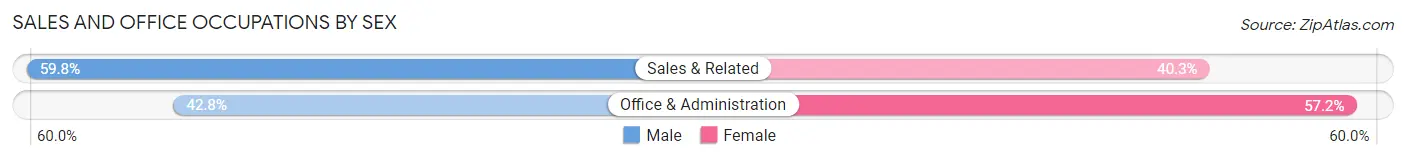
| Occupation | Male | Female |
| Sales & Related | 1,394 (59.8%) | 939 (40.3%) |
| Office & Administration | 831 (42.8%) | 1,110 (57.2%) |
| Total (Category) | 2,225 (52.1%) | 2,049 (47.9%) |
| Total (Overall) | 12,353 (54.2%) | 10,420 (45.8%) |
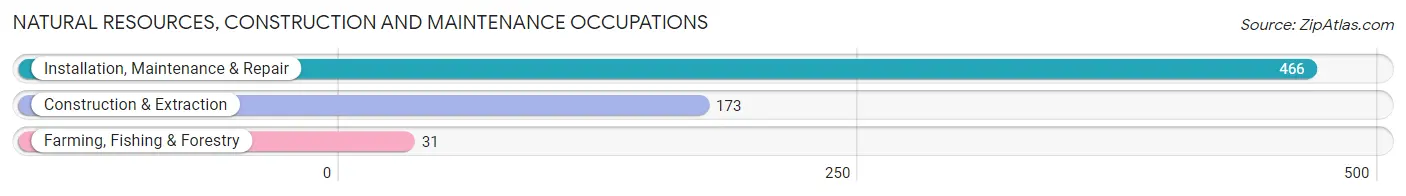
Natural Resources, Construction and Maintenance Occupations
The most common Natural Resources, Construction and Maintenance occupations in Catalina Foothills are Installation, Maintenance & Repair (466 | 2.1%), Construction & Extraction (173 | 0.8%), and Farming, Fishing & Forestry (31 | 0.1%).
Natural Resources, Construction and Maintenance Occupations by Sex
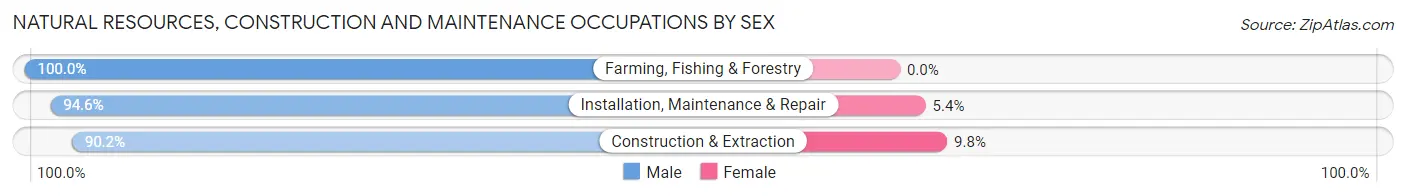
| Occupation | Male | Female |
| Farming, Fishing & Forestry | 31 (100.0%) | 0 (0.0%) |
| Construction & Extraction | 156 (90.2%) | 17 (9.8%) |
| Installation, Maintenance & Repair | 441 (94.6%) | 25 (5.4%) |
| Total (Category) | 628 (93.7%) | 42 (6.3%) |
| Total (Overall) | 12,353 (54.2%) | 10,420 (45.8%) |
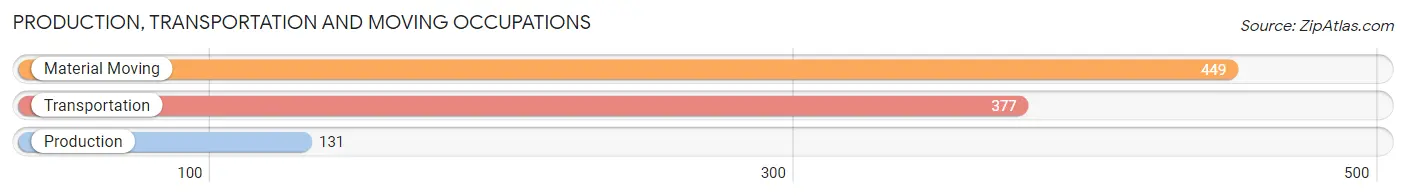
Production, Transportation and Moving Occupations
The most common Production, Transportation and Moving occupations in Catalina Foothills are Material Moving (449 | 2.0%), Transportation (377 | 1.7%), and Production (131 | 0.6%).
Production, Transportation and Moving Occupations by Sex
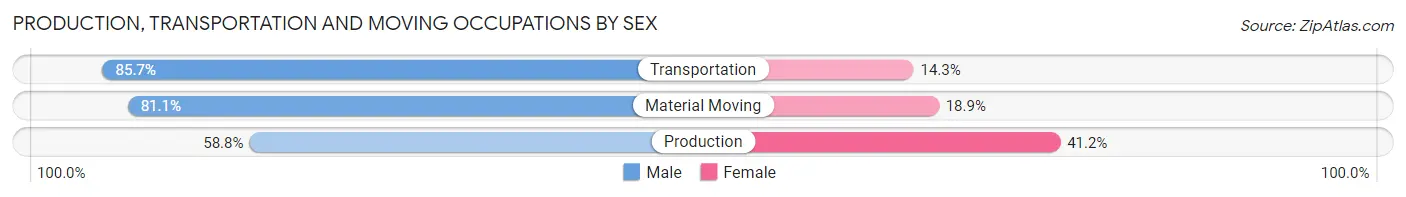
| Occupation | Male | Female |
| Production | 77 (58.8%) | 54 (41.2%) |
| Transportation | 323 (85.7%) | 54 (14.3%) |
| Material Moving | 364 (81.1%) | 85 (18.9%) |
| Total (Category) | 764 (79.8%) | 193 (20.2%) |
| Total (Overall) | 12,353 (54.2%) | 10,420 (45.8%) |
Employment Industries by Sex in Catalina Foothills
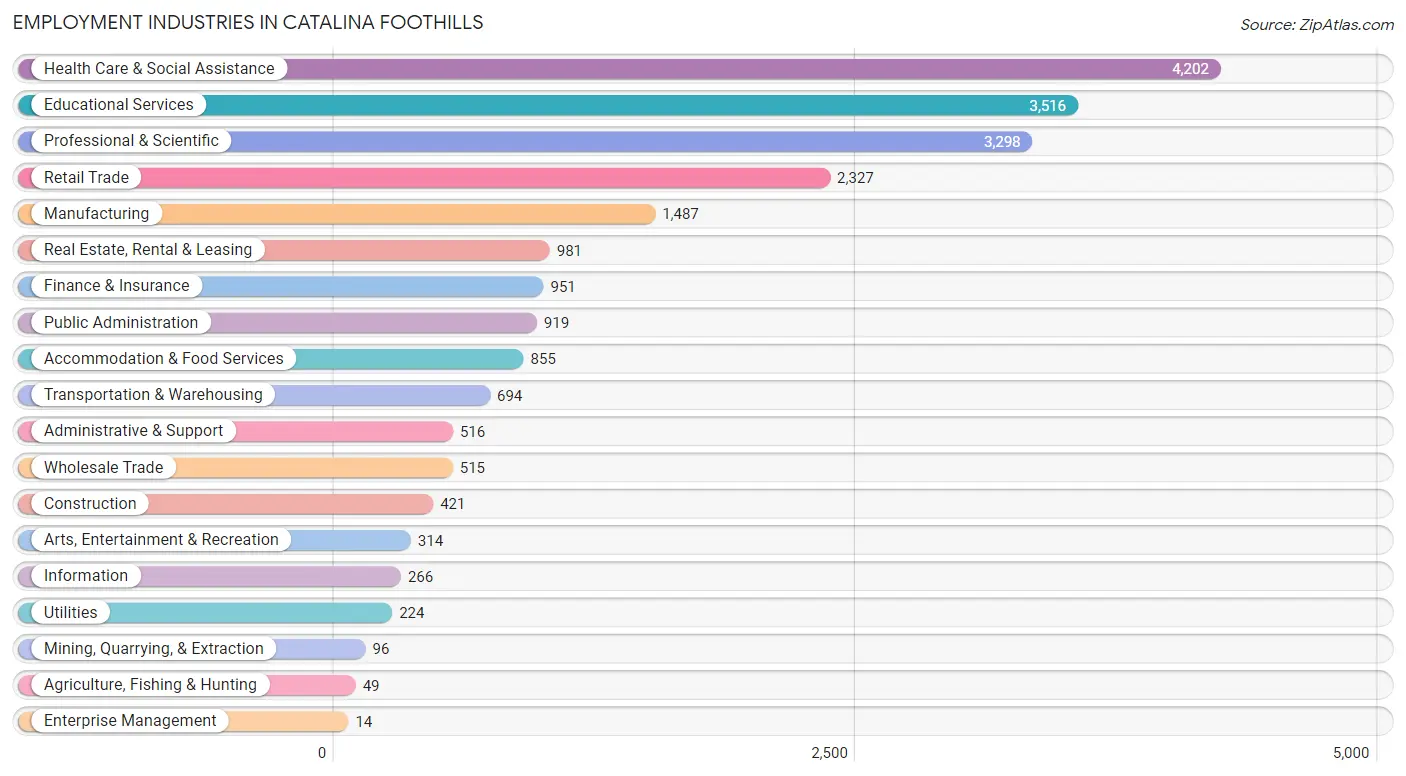
Employment Industries in Catalina Foothills
The major employment industries in Catalina Foothills include Health Care & Social Assistance (4,202 | 18.4%), Educational Services (3,516 | 15.4%), Professional & Scientific (3,298 | 14.5%), Retail Trade (2,327 | 10.2%), and Manufacturing (1,487 | 6.5%).
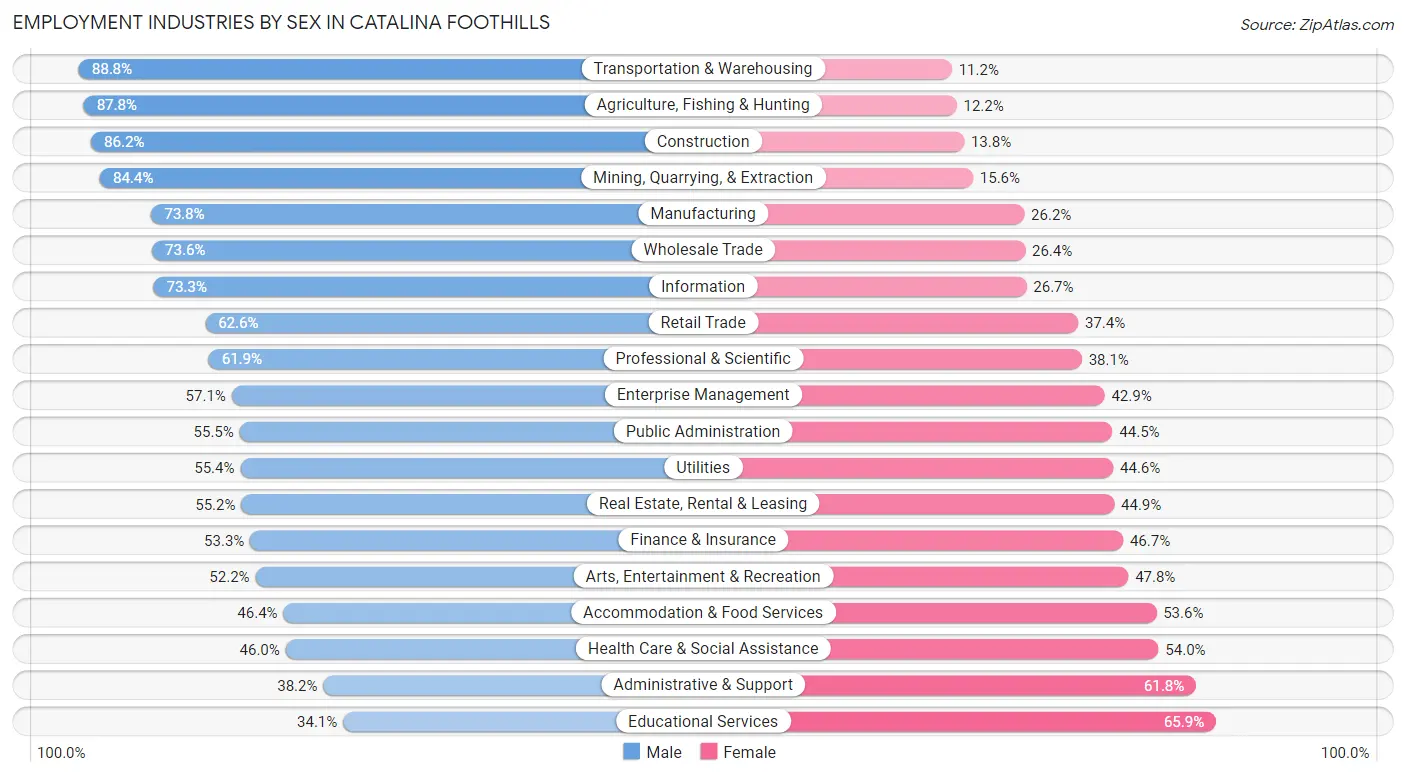
Employment Industries by Sex in Catalina Foothills
The Catalina Foothills industries that see more men than women are Transportation & Warehousing (88.8%), Agriculture, Fishing & Hunting (87.8%), and Construction (86.2%), whereas the industries that tend to have a higher number of women are Educational Services (65.9%), Administrative & Support (61.8%), and Health Care & Social Assistance (54.0%).
| Industry | Male | Female |
| Agriculture, Fishing & Hunting | 43 (87.8%) | 6 (12.2%) |
| Mining, Quarrying, & Extraction | 81 (84.4%) | 15 (15.6%) |
| Construction | 363 (86.2%) | 58 (13.8%) |
| Manufacturing | 1,097 (73.8%) | 390 (26.2%) |
| Wholesale Trade | 379 (73.6%) | 136 (26.4%) |
| Retail Trade | 1,457 (62.6%) | 870 (37.4%) |
| Transportation & Warehousing | 616 (88.8%) | 78 (11.2%) |
| Utilities | 124 (55.4%) | 100 (44.6%) |
| Information | 195 (73.3%) | 71 (26.7%) |
| Finance & Insurance | 507 (53.3%) | 444 (46.7%) |
| Real Estate, Rental & Leasing | 541 (55.1%) | 440 (44.9%) |
| Professional & Scientific | 2,040 (61.9%) | 1,258 (38.1%) |
| Enterprise Management | 8 (57.1%) | 6 (42.9%) |
| Administrative & Support | 197 (38.2%) | 319 (61.8%) |
| Educational Services | 1,198 (34.1%) | 2,318 (65.9%) |
| Health Care & Social Assistance | 1,932 (46.0%) | 2,270 (54.0%) |
| Arts, Entertainment & Recreation | 164 (52.2%) | 150 (47.8%) |
| Accommodation & Food Services | 397 (46.4%) | 458 (53.6%) |
| Public Administration | 510 (55.5%) | 409 (44.5%) |
| Total | 12,353 (54.2%) | 10,420 (45.8%) |
Education in Catalina Foothills
School Enrollment in Catalina Foothills
The most common levels of schooling among the 9,447 students in Catalina Foothills are high school (2,473 | 26.2%), college / undergraduate (2,086 | 22.1%), and elementary school (1,858 | 19.7%).
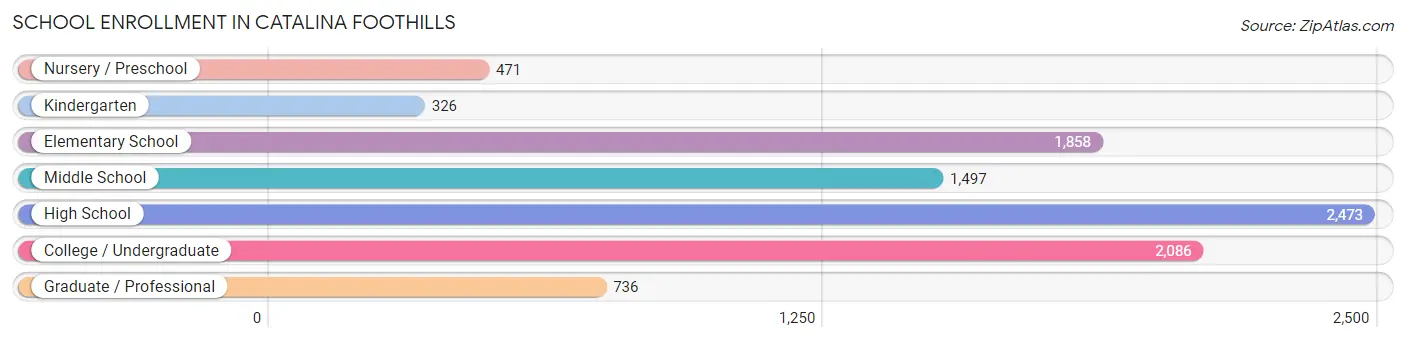
| School Level | # Students | % Students |
| Nursery / Preschool | 471 | 5.0% |
| Kindergarten | 326 | 3.5% |
| Elementary School | 1,858 | 19.7% |
| Middle School | 1,497 | 15.9% |
| High School | 2,473 | 26.2% |
| College / Undergraduate | 2,086 | 22.1% |
| Graduate / Professional | 736 | 7.8% |
| Total | 9,447 | 100.0% |
School Enrollment by Age by Funding Source in Catalina Foothills
Out of a total of 9,447 students who are enrolled in schools in Catalina Foothills, 1,899 (20.1%) attend a private institution, while the remaining 7,548 (79.9%) are enrolled in public schools. The age group of 35 years and over has the highest likelihood of being enrolled in private schools, with 252 (47.9% in the age bracket) enrolled. Conversely, the age group of 25 to 34 year olds has the lowest likelihood of being enrolled in a private school, with 662 (94.3% in the age bracket) attending a public institution.
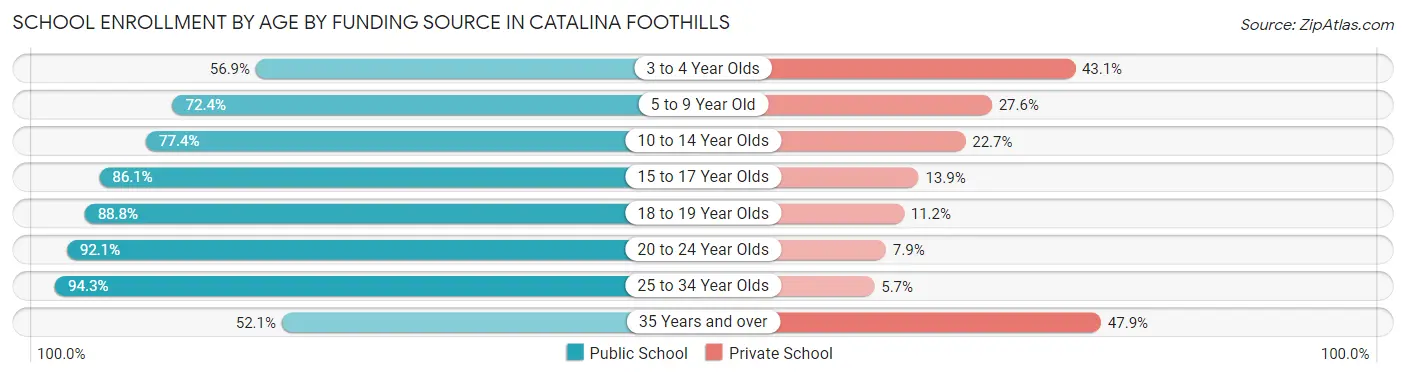
| Age Bracket | Public School | Private School |
| 3 to 4 Year Olds | 218 (56.9%) | 165 (43.1%) |
| 5 to 9 Year Old | 1,447 (72.4%) | 551 (27.6%) |
| 10 to 14 Year Olds | 1,537 (77.3%) | 450 (22.7%) |
| 15 to 17 Year Olds | 1,675 (86.1%) | 271 (13.9%) |
| 18 to 19 Year Olds | 642 (88.8%) | 81 (11.2%) |
| 20 to 24 Year Olds | 1,089 (92.1%) | 93 (7.9%) |
| 25 to 34 Year Olds | 662 (94.3%) | 40 (5.7%) |
| 35 Years and over | 274 (52.1%) | 252 (47.9%) |
| Total | 7,548 (79.9%) | 1,899 (20.1%) |
Educational Attainment by Field of Study in Catalina Foothills
Business (4,877 | 16.0%), science & technology (3,726 | 12.2%), bio, nature & agricultural (3,334 | 11.0%), education (3,089 | 10.2%), and engineering (2,555 | 8.4%) are the most common fields of study among 30,447 individuals in Catalina Foothills who have obtained a bachelor's degree or higher.
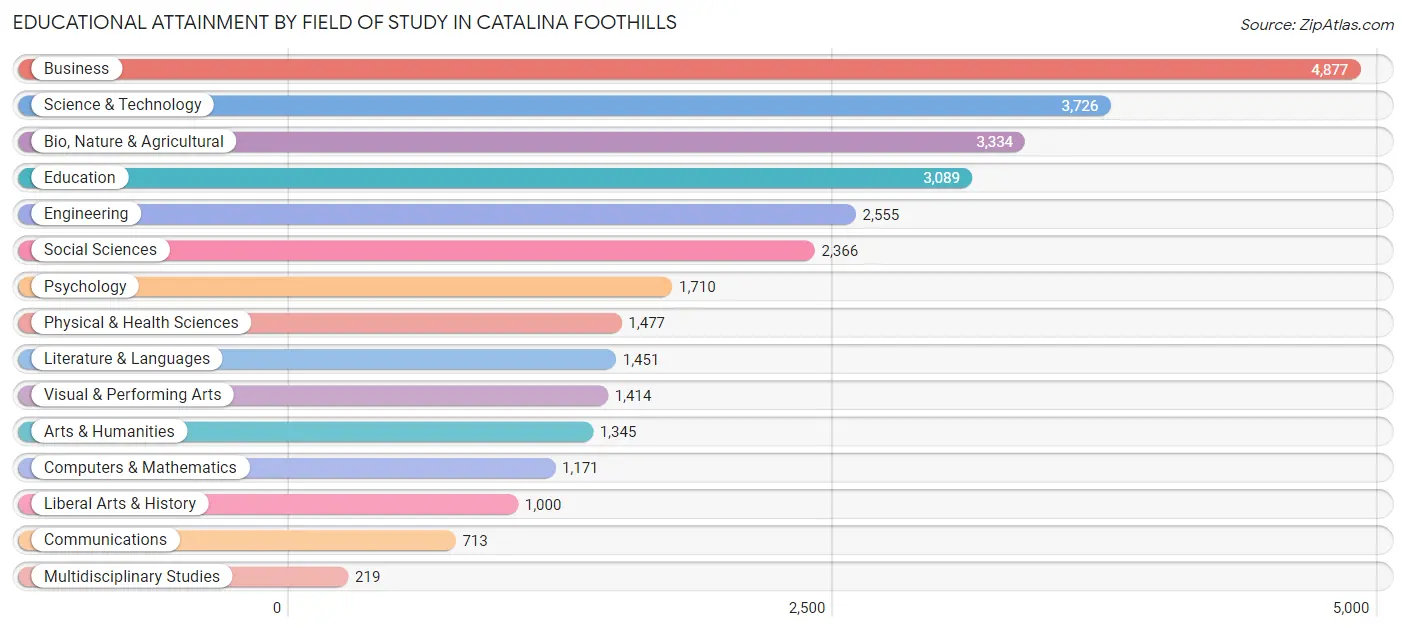
| Field of Study | # Graduates | % Graduates |
| Computers & Mathematics | 1,171 | 3.8% |
| Bio, Nature & Agricultural | 3,334 | 11.0% |
| Physical & Health Sciences | 1,477 | 4.9% |
| Psychology | 1,710 | 5.6% |
| Social Sciences | 2,366 | 7.8% |
| Engineering | 2,555 | 8.4% |
| Multidisciplinary Studies | 219 | 0.7% |
| Science & Technology | 3,726 | 12.2% |
| Business | 4,877 | 16.0% |
| Education | 3,089 | 10.2% |
| Literature & Languages | 1,451 | 4.8% |
| Liberal Arts & History | 1,000 | 3.3% |
| Visual & Performing Arts | 1,414 | 4.6% |
| Communications | 713 | 2.3% |
| Arts & Humanities | 1,345 | 4.4% |
| Total | 30,447 | 100.0% |
Transportation & Commute in Catalina Foothills
Vehicle Availability by Sex in Catalina Foothills
The most prevalent vehicle ownership categories in Catalina Foothills are males with 2 vehicles (5,466, accounting for 43.8%) and females with 2 vehicles (4,478, making up 52.9%).
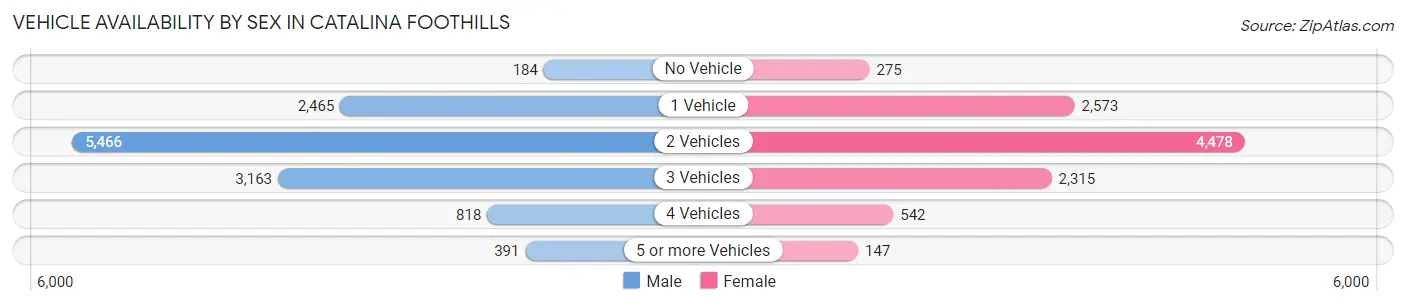
| Vehicles Available | Male | Female |
| No Vehicle | 184 (1.5%) | 275 (2.7%) |
| 1 Vehicle | 2,465 (19.7%) | 2,573 (24.9%) |
| 2 Vehicles | 5,466 (43.8%) | 4,478 (43.3%) |
| 3 Vehicles | 3,163 (25.3%) | 2,315 (22.4%) |
| 4 Vehicles | 818 (6.6%) | 542 (5.2%) |
| 5 or more Vehicles | 391 (3.1%) | 147 (1.4%) |
| Total | 12,487 (100.0%) | 10,330 (100.0%) |
Commute Time in Catalina Foothills
The most frequently occuring commute durations in Catalina Foothills are 15 to 19 minutes (3,902 commuters, 21.0%), 20 to 24 minutes (3,648 commuters, 19.7%), and 30 to 34 minutes (2,920 commuters, 15.7%).
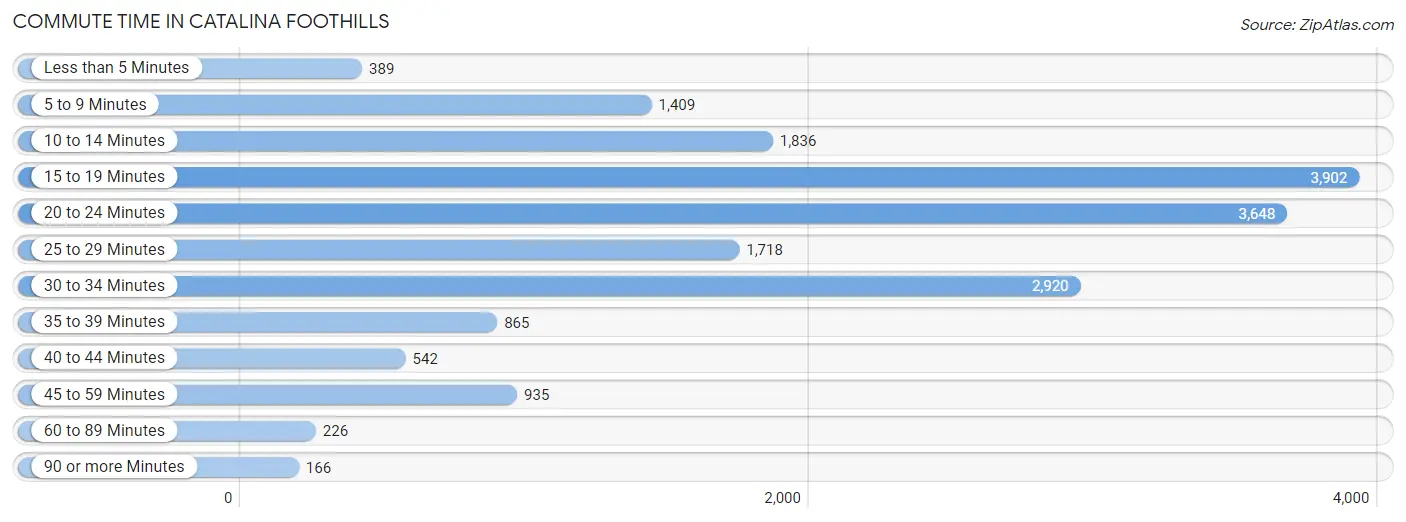
| Commute Time | # Commuters | % Commuters |
| Less than 5 Minutes | 389 | 2.1% |
| 5 to 9 Minutes | 1,409 | 7.6% |
| 10 to 14 Minutes | 1,836 | 9.9% |
| 15 to 19 Minutes | 3,902 | 21.0% |
| 20 to 24 Minutes | 3,648 | 19.7% |
| 25 to 29 Minutes | 1,718 | 9.3% |
| 30 to 34 Minutes | 2,920 | 15.7% |
| 35 to 39 Minutes | 865 | 4.7% |
| 40 to 44 Minutes | 542 | 2.9% |
| 45 to 59 Minutes | 935 | 5.0% |
| 60 to 89 Minutes | 226 | 1.2% |
| 90 or more Minutes | 166 | 0.9% |
Commute Time by Sex in Catalina Foothills
The most common commute times in Catalina Foothills are 15 to 19 minutes (2,284 commuters, 22.2%) for males and 15 to 19 minutes (1,618 commuters, 19.6%) for females.
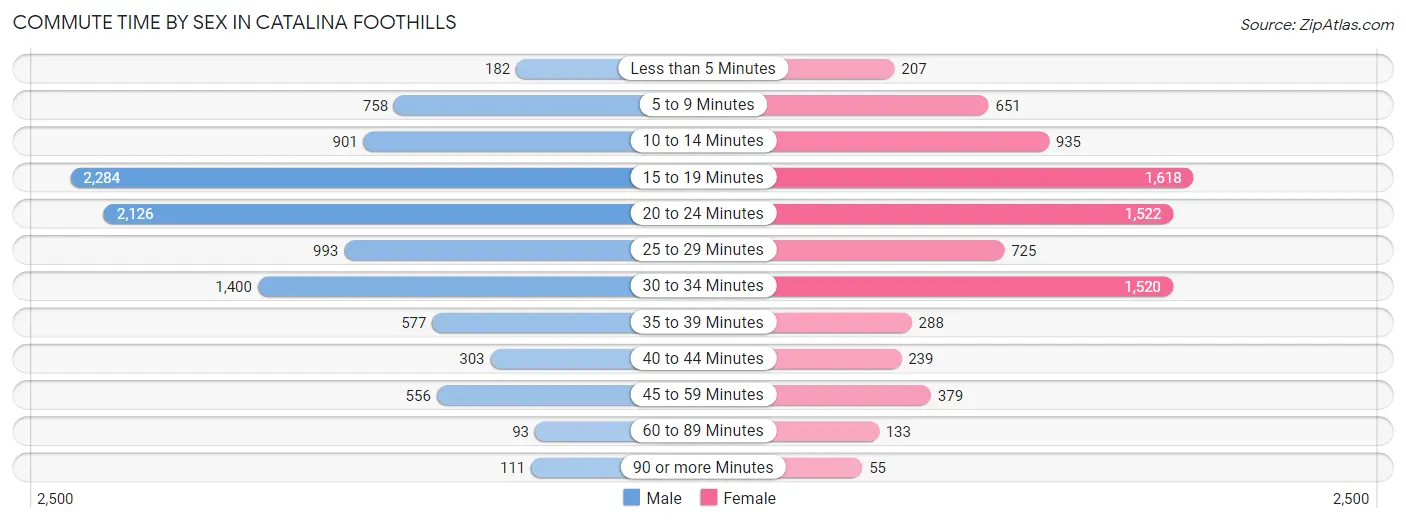
| Commute Time | Male | Female |
| Less than 5 Minutes | 182 (1.8%) | 207 (2.5%) |
| 5 to 9 Minutes | 758 (7.4%) | 651 (7.9%) |
| 10 to 14 Minutes | 901 (8.8%) | 935 (11.3%) |
| 15 to 19 Minutes | 2,284 (22.2%) | 1,618 (19.6%) |
| 20 to 24 Minutes | 2,126 (20.7%) | 1,522 (18.4%) |
| 25 to 29 Minutes | 993 (9.7%) | 725 (8.8%) |
| 30 to 34 Minutes | 1,400 (13.6%) | 1,520 (18.4%) |
| 35 to 39 Minutes | 577 (5.6%) | 288 (3.5%) |
| 40 to 44 Minutes | 303 (2.9%) | 239 (2.9%) |
| 45 to 59 Minutes | 556 (5.4%) | 379 (4.6%) |
| 60 to 89 Minutes | 93 (0.9%) | 133 (1.6%) |
| 90 or more Minutes | 111 (1.1%) | 55 (0.7%) |
Time of Departure to Work by Sex in Catalina Foothills
The most frequent times of departure to work in Catalina Foothills are 7:00 AM to 7:29 AM (1,422, 13.8%) for males and 7:00 AM to 7:29 AM (1,823, 22.0%) for females.
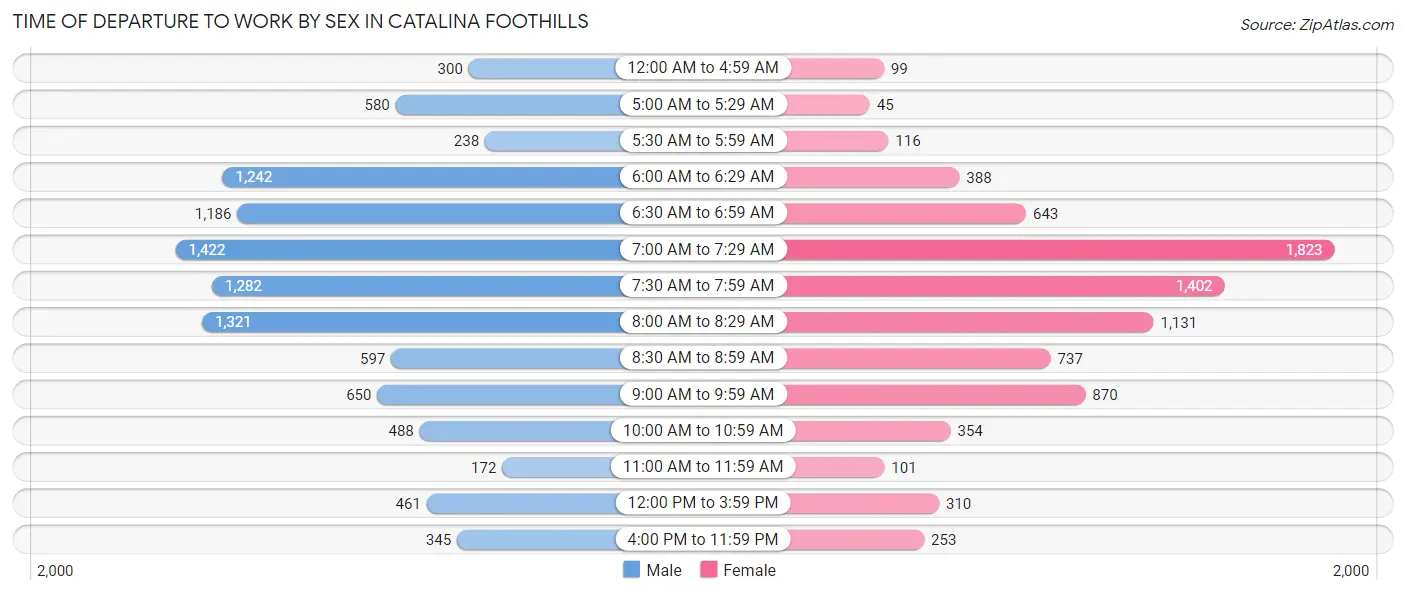
| Time of Departure | Male | Female |
| 12:00 AM to 4:59 AM | 300 (2.9%) | 99 (1.2%) |
| 5:00 AM to 5:29 AM | 580 (5.6%) | 45 (0.5%) |
| 5:30 AM to 5:59 AM | 238 (2.3%) | 116 (1.4%) |
| 6:00 AM to 6:29 AM | 1,242 (12.1%) | 388 (4.7%) |
| 6:30 AM to 6:59 AM | 1,186 (11.5%) | 643 (7.8%) |
| 7:00 AM to 7:29 AM | 1,422 (13.8%) | 1,823 (22.0%) |
| 7:30 AM to 7:59 AM | 1,282 (12.5%) | 1,402 (17.0%) |
| 8:00 AM to 8:29 AM | 1,321 (12.9%) | 1,131 (13.7%) |
| 8:30 AM to 8:59 AM | 597 (5.8%) | 737 (8.9%) |
| 9:00 AM to 9:59 AM | 650 (6.3%) | 870 (10.5%) |
| 10:00 AM to 10:59 AM | 488 (4.8%) | 354 (4.3%) |
| 11:00 AM to 11:59 AM | 172 (1.7%) | 101 (1.2%) |
| 12:00 PM to 3:59 PM | 461 (4.5%) | 310 (3.7%) |
| 4:00 PM to 11:59 PM | 345 (3.4%) | 253 (3.1%) |
| Total | 10,284 (100.0%) | 8,272 (100.0%) |
Housing Occupancy in Catalina Foothills
Occupancy by Ownership in Catalina Foothills
Of the total 23,673 dwellings in Catalina Foothills, owner-occupied units account for 17,567 (74.2%), while renter-occupied units make up 6,106 (25.8%).
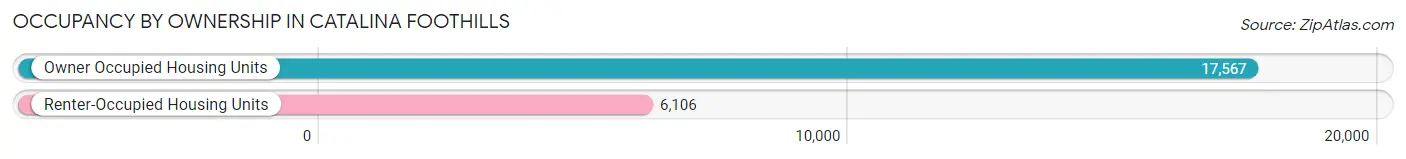
| Occupancy | # Housing Units | % Housing Units |
| Owner Occupied Housing Units | 17,567 | 74.2% |
| Renter-Occupied Housing Units | 6,106 | 25.8% |
| Total Occupied Housing Units | 23,673 | 100.0% |
Occupancy by Household Size in Catalina Foothills
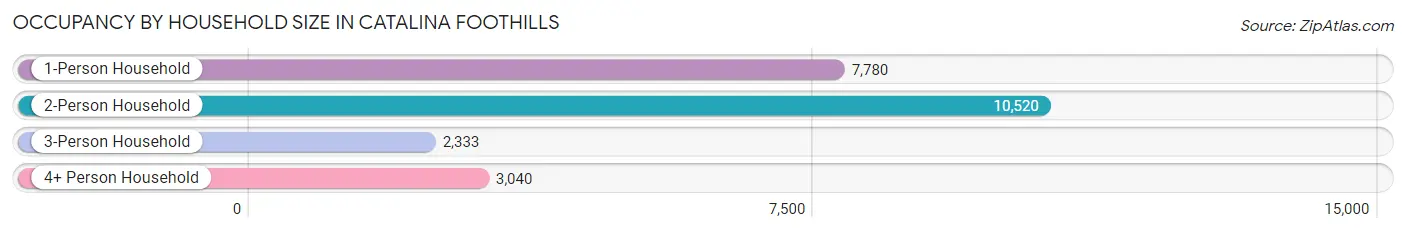
| Household Size | # Housing Units | % Housing Units |
| 1-Person Household | 7,780 | 32.9% |
| 2-Person Household | 10,520 | 44.4% |
| 3-Person Household | 2,333 | 9.9% |
| 4+ Person Household | 3,040 | 12.8% |
| Total Housing Units | 23,673 | 100.0% |
Occupancy by Ownership by Household Size in Catalina Foothills
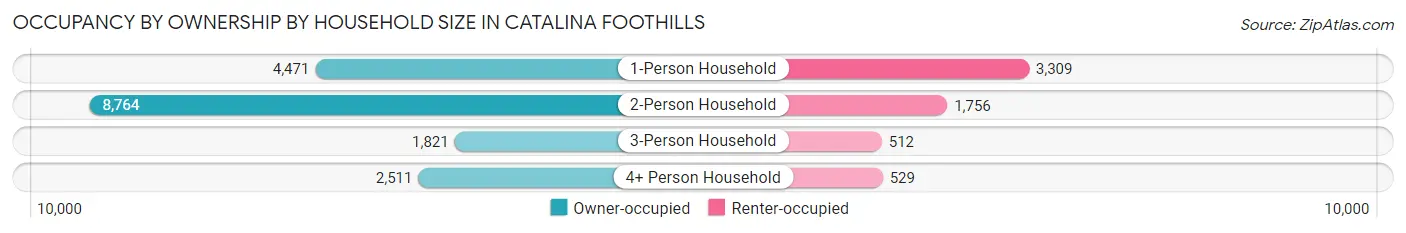
| Household Size | Owner-occupied | Renter-occupied |
| 1-Person Household | 4,471 (57.5%) | 3,309 (42.5%) |
| 2-Person Household | 8,764 (83.3%) | 1,756 (16.7%) |
| 3-Person Household | 1,821 (78.0%) | 512 (22.0%) |
| 4+ Person Household | 2,511 (82.6%) | 529 (17.4%) |
| Total Housing Units | 17,567 (74.2%) | 6,106 (25.8%) |
Occupancy by Educational Attainment in Catalina Foothills
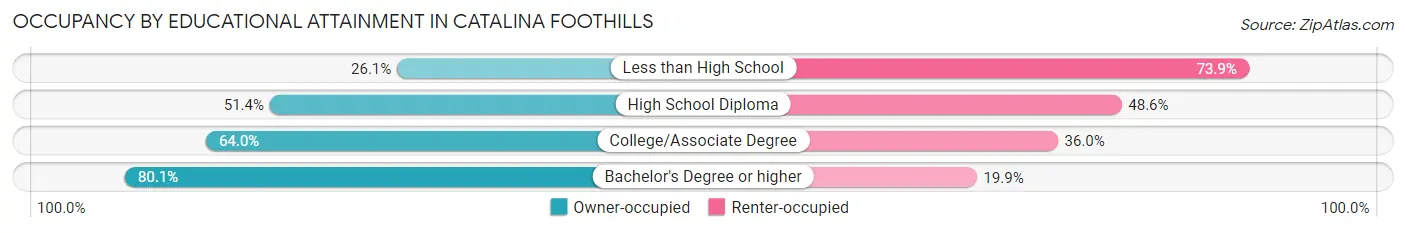
| Household Size | Owner-occupied | Renter-occupied |
| Less than High School | 80 (26.1%) | 226 (73.9%) |
| High School Diploma | 850 (51.4%) | 804 (48.6%) |
| College/Associate Degree | 3,021 (64.0%) | 1,696 (36.0%) |
| Bachelor's Degree or higher | 13,616 (80.1%) | 3,380 (19.9%) |
Occupancy by Age of Householder in Catalina Foothills
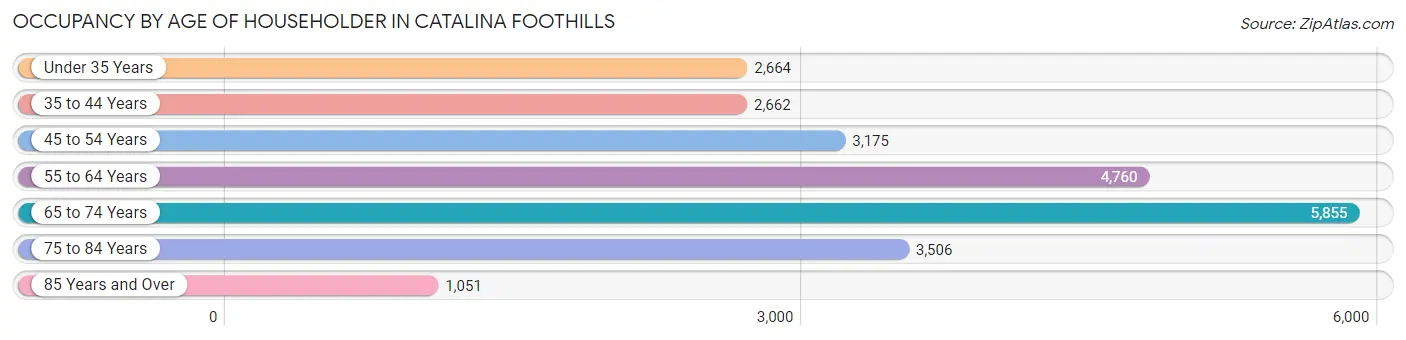
| Age Bracket | # Households | % Households |
| Under 35 Years | 2,664 | 11.3% |
| 35 to 44 Years | 2,662 | 11.2% |
| 45 to 54 Years | 3,175 | 13.4% |
| 55 to 64 Years | 4,760 | 20.1% |
| 65 to 74 Years | 5,855 | 24.7% |
| 75 to 84 Years | 3,506 | 14.8% |
| 85 Years and Over | 1,051 | 4.4% |
| Total | 23,673 | 100.0% |
Housing Finances in Catalina Foothills
Median Income by Occupancy in Catalina Foothills
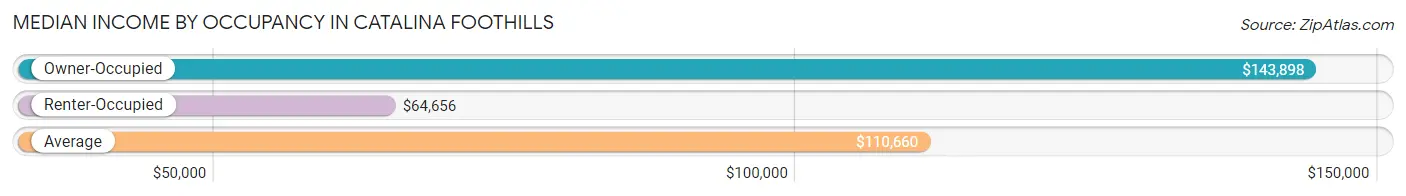
| Occupancy Type | # Households | Median Income |
| Owner-Occupied | 17,567 (74.2%) | $143,898 |
| Renter-Occupied | 6,106 (25.8%) | $64,656 |
| Average | 23,673 (100.0%) | $110,660 |
Occupancy by Householder Income Bracket in Catalina Foothills
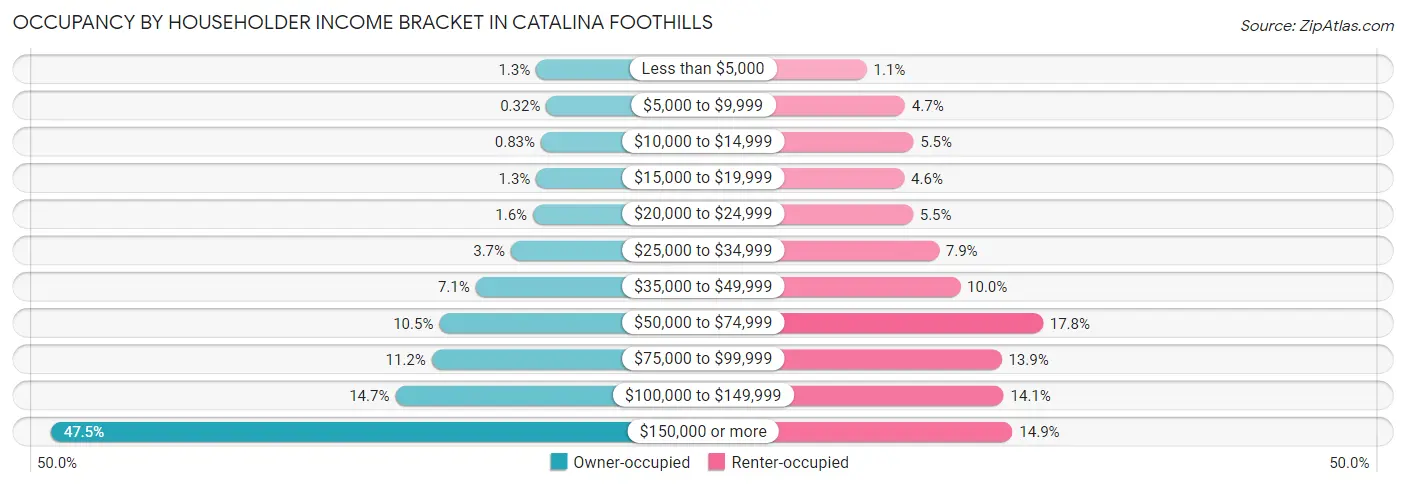
| Income Bracket | Owner-occupied | Renter-occupied |
| Less than $5,000 | 226 (1.3%) | 64 (1.1%) |
| $5,000 to $9,999 | 57 (0.3%) | 287 (4.7%) |
| $10,000 to $14,999 | 146 (0.8%) | 336 (5.5%) |
| $15,000 to $19,999 | 224 (1.3%) | 283 (4.6%) |
| $20,000 to $24,999 | 280 (1.6%) | 333 (5.4%) |
| $25,000 to $34,999 | 648 (3.7%) | 484 (7.9%) |
| $35,000 to $49,999 | 1,238 (7.0%) | 608 (10.0%) |
| $50,000 to $74,999 | 1,847 (10.5%) | 1,089 (17.8%) |
| $75,000 to $99,999 | 1,975 (11.2%) | 849 (13.9%) |
| $100,000 to $149,999 | 2,582 (14.7%) | 861 (14.1%) |
| $150,000 or more | 8,344 (47.5%) | 912 (14.9%) |
| Total | 17,567 (100.0%) | 6,106 (100.0%) |
Monthly Housing Cost Tiers in Catalina Foothills
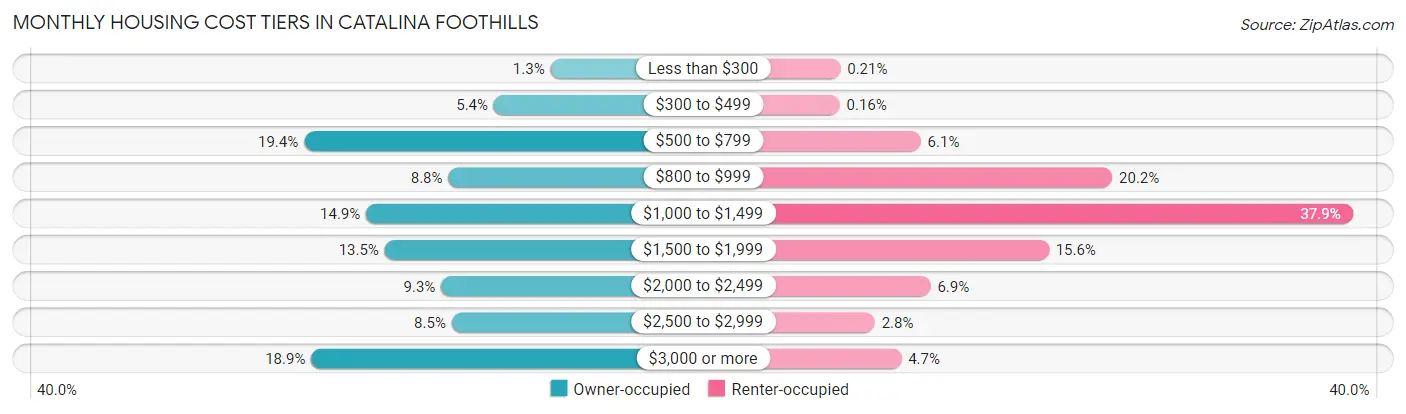
| Monthly Cost | Owner-occupied | Renter-occupied |
| Less than $300 | 223 (1.3%) | 13 (0.2%) |
| $300 to $499 | 956 (5.4%) | 10 (0.2%) |
| $500 to $799 | 3,412 (19.4%) | 374 (6.1%) |
| $800 to $999 | 1,544 (8.8%) | 1,235 (20.2%) |
| $1,000 to $1,499 | 2,609 (14.8%) | 2,316 (37.9%) |
| $1,500 to $1,999 | 2,368 (13.5%) | 950 (15.6%) |
| $2,000 to $2,499 | 1,637 (9.3%) | 418 (6.9%) |
| $2,500 to $2,999 | 1,500 (8.5%) | 168 (2.8%) |
| $3,000 or more | 3,318 (18.9%) | 287 (4.7%) |
| Total | 17,567 (100.0%) | 6,106 (100.0%) |
Physical Housing Characteristics in Catalina Foothills
Housing Structures in Catalina Foothills
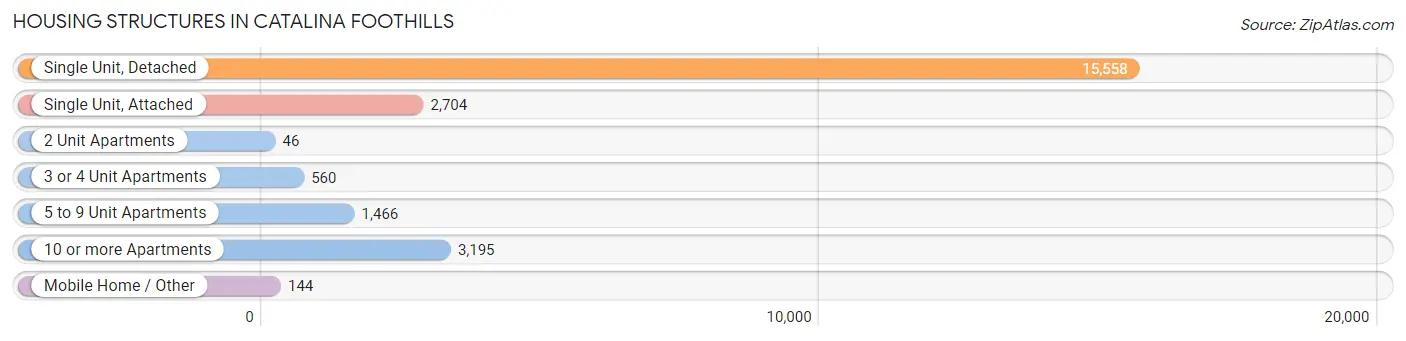
| Structure Type | # Housing Units | % Housing Units |
| Single Unit, Detached | 15,558 | 65.7% |
| Single Unit, Attached | 2,704 | 11.4% |
| 2 Unit Apartments | 46 | 0.2% |
| 3 or 4 Unit Apartments | 560 | 2.4% |
| 5 to 9 Unit Apartments | 1,466 | 6.2% |
| 10 or more Apartments | 3,195 | 13.5% |
| Mobile Home / Other | 144 | 0.6% |
| Total | 23,673 | 100.0% |
Housing Structures by Occupancy in Catalina Foothills
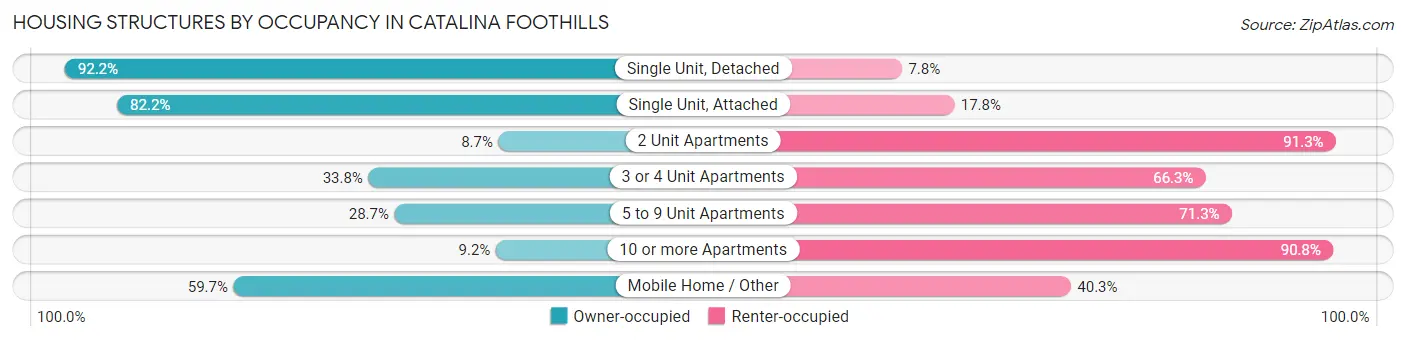
| Structure Type | Owner-occupied | Renter-occupied |
| Single Unit, Detached | 14,351 (92.2%) | 1,207 (7.8%) |
| Single Unit, Attached | 2,222 (82.2%) | 482 (17.8%) |
| 2 Unit Apartments | 4 (8.7%) | 42 (91.3%) |
| 3 or 4 Unit Apartments | 189 (33.8%) | 371 (66.2%) |
| 5 to 9 Unit Apartments | 421 (28.7%) | 1,045 (71.3%) |
| 10 or more Apartments | 294 (9.2%) | 2,901 (90.8%) |
| Mobile Home / Other | 86 (59.7%) | 58 (40.3%) |
| Total | 17,567 (74.2%) | 6,106 (25.8%) |
Housing Structures by Number of Rooms in Catalina Foothills
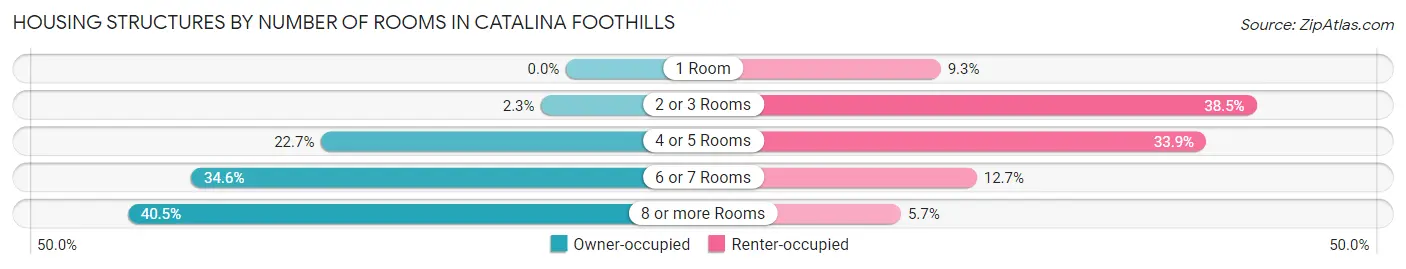
| Number of Rooms | Owner-occupied | Renter-occupied |
| 1 Room | 0 (0.0%) | 569 (9.3%) |
| 2 or 3 Rooms | 404 (2.3%) | 2,352 (38.5%) |
| 4 or 5 Rooms | 3,980 (22.7%) | 2,067 (33.9%) |
| 6 or 7 Rooms | 6,078 (34.6%) | 773 (12.7%) |
| 8 or more Rooms | 7,105 (40.5%) | 345 (5.7%) |
| Total | 17,567 (100.0%) | 6,106 (100.0%) |
Housing Structure by Heating Type in Catalina Foothills
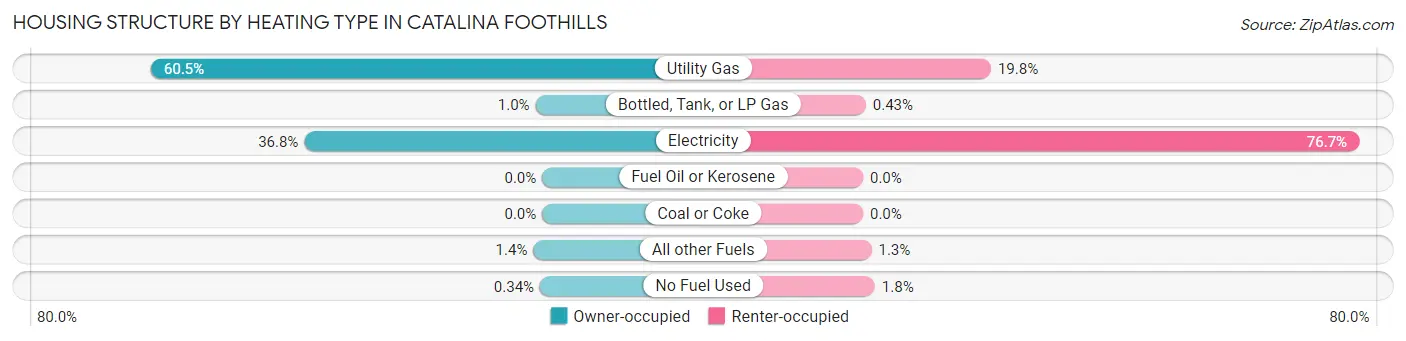
| Heating Type | Owner-occupied | Renter-occupied |
| Utility Gas | 10,625 (60.5%) | 1,208 (19.8%) |
| Bottled, Tank, or LP Gas | 181 (1.0%) | 26 (0.4%) |
| Electricity | 6,461 (36.8%) | 4,680 (76.6%) |
| Fuel Oil or Kerosene | 0 (0.0%) | 0 (0.0%) |
| Coal or Coke | 0 (0.0%) | 0 (0.0%) |
| All other Fuels | 240 (1.4%) | 80 (1.3%) |
| No Fuel Used | 60 (0.3%) | 112 (1.8%) |
| Total | 17,567 (100.0%) | 6,106 (100.0%) |
Household Vehicle Usage in Catalina Foothills
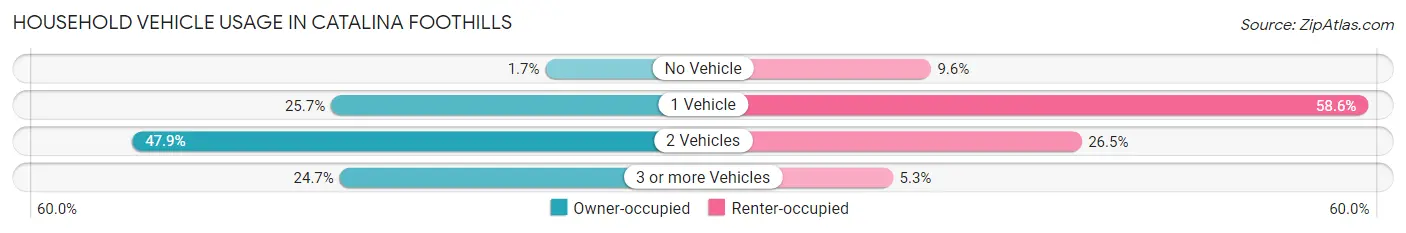
| Vehicles per Household | Owner-occupied | Renter-occupied |
| No Vehicle | 294 (1.7%) | 585 (9.6%) |
| 1 Vehicle | 4,512 (25.7%) | 3,579 (58.6%) |
| 2 Vehicles | 8,421 (47.9%) | 1,616 (26.5%) |
| 3 or more Vehicles | 4,340 (24.7%) | 326 (5.3%) |
| Total | 17,567 (100.0%) | 6,106 (100.0%) |
Real Estate & Mortgages in Catalina Foothills
Real Estate and Mortgage Overview in Catalina Foothills
| Characteristic | Without Mortgage | With Mortgage |
| Housing Units | 8,365 | 9,202 |
| Median Property Value | $545,500 | $571,900 |
| Median Household Income | $116,838 | $4,887 |
| Monthly Housing Costs | $765 | $3,226 |
| Real Estate Taxes | $4,356 | $258 |
Property Value by Mortgage Status in Catalina Foothills
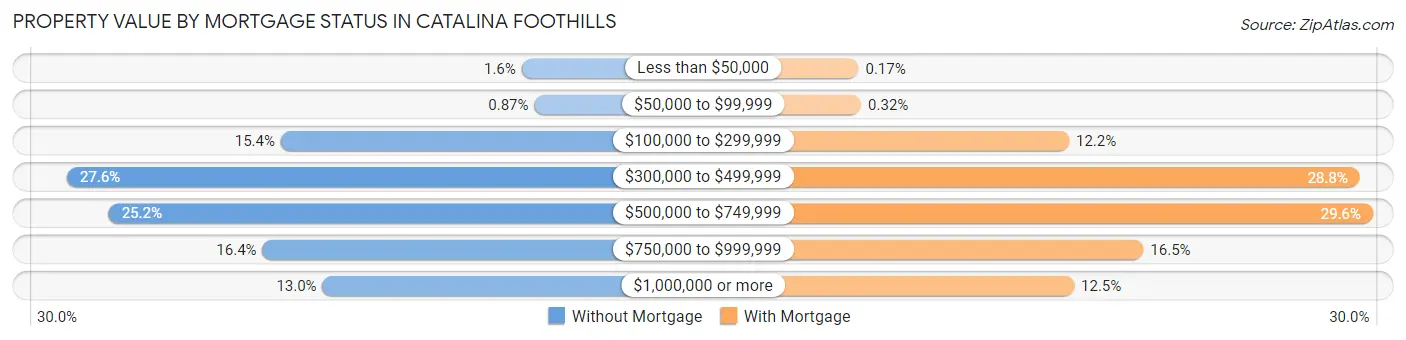
| Property Value | Without Mortgage | With Mortgage |
| Less than $50,000 | 134 (1.6%) | 16 (0.2%) |
| $50,000 to $99,999 | 73 (0.9%) | 29 (0.3%) |
| $100,000 to $299,999 | 1,285 (15.4%) | 1,123 (12.2%) |
| $300,000 to $499,999 | 2,307 (27.6%) | 2,651 (28.8%) |
| $500,000 to $749,999 | 2,107 (25.2%) | 2,720 (29.6%) |
| $750,000 to $999,999 | 1,373 (16.4%) | 1,514 (16.5%) |
| $1,000,000 or more | 1,086 (13.0%) | 1,149 (12.5%) |
| Total | 8,365 (100.0%) | 9,202 (100.0%) |
Household Income by Mortgage Status in Catalina Foothills
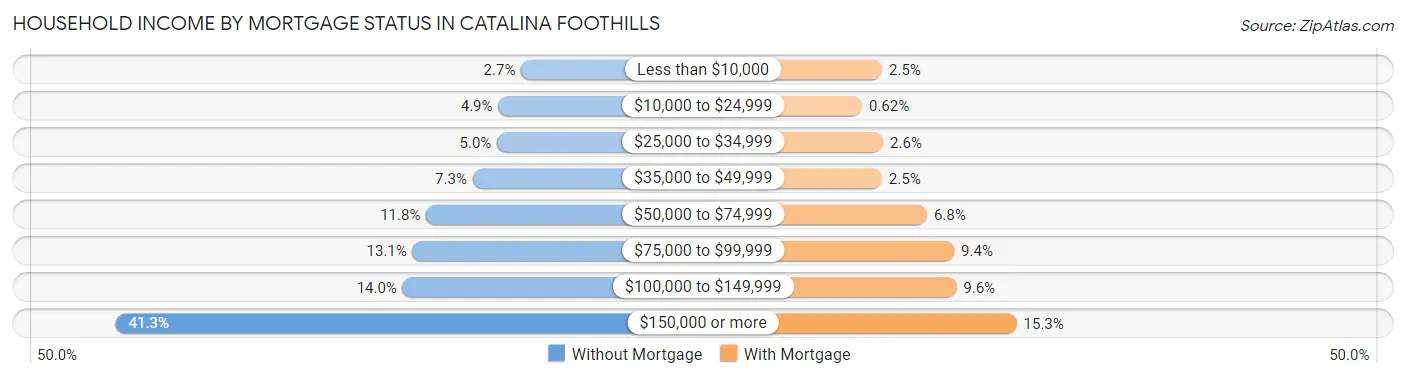
| Household Income | Without Mortgage | With Mortgage |
| Less than $10,000 | 226 (2.7%) | 233 (2.5%) |
| $10,000 to $24,999 | 408 (4.9%) | 57 (0.6%) |
| $25,000 to $34,999 | 417 (5.0%) | 242 (2.6%) |
| $35,000 to $49,999 | 612 (7.3%) | 231 (2.5%) |
| $50,000 to $74,999 | 983 (11.7%) | 626 (6.8%) |
| $75,000 to $99,999 | 1,092 (13.1%) | 864 (9.4%) |
| $100,000 to $149,999 | 1,170 (14.0%) | 883 (9.6%) |
| $150,000 or more | 3,457 (41.3%) | 1,412 (15.3%) |
| Total | 8,365 (100.0%) | 9,202 (100.0%) |
Property Value to Household Income Ratio in Catalina Foothills
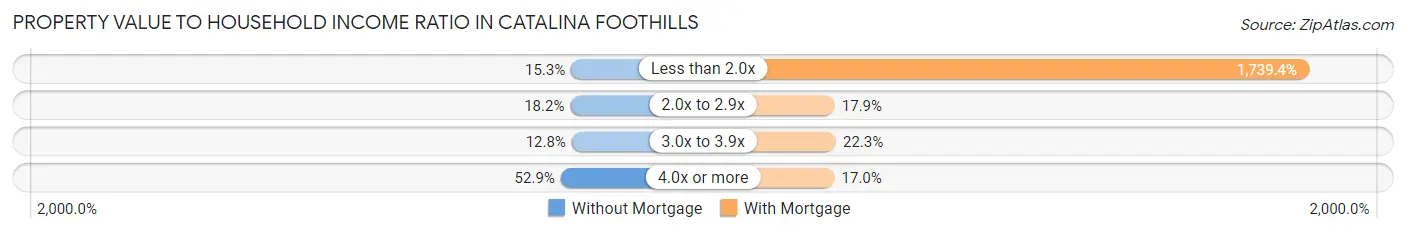
| Value-to-Income Ratio | Without Mortgage | With Mortgage |
| Less than 2.0x | 1,278 (15.3%) | 160,063 (1,739.4%) |
| 2.0x to 2.9x | 1,522 (18.2%) | 1,647 (17.9%) |
| 3.0x to 3.9x | 1,073 (12.8%) | 2,056 (22.3%) |
| 4.0x or more | 4,427 (52.9%) | 1,561 (17.0%) |
| Total | 8,365 (100.0%) | 9,202 (100.0%) |
Real Estate Taxes by Mortgage Status in Catalina Foothills
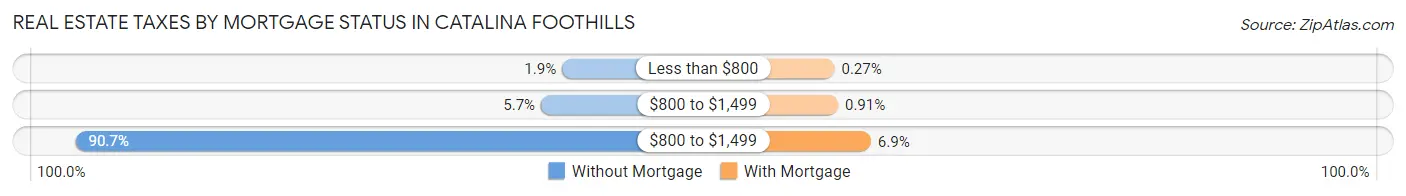
| Property Taxes | Without Mortgage | With Mortgage |
| Less than $800 | 155 (1.8%) | 25 (0.3%) |
| $800 to $1,499 | 477 (5.7%) | 84 (0.9%) |
| $800 to $1,499 | 7,586 (90.7%) | 636 (6.9%) |
| Total | 8,365 (100.0%) | 9,202 (100.0%) |
Health & Disability in Catalina Foothills
Health Insurance Coverage by Age in Catalina Foothills
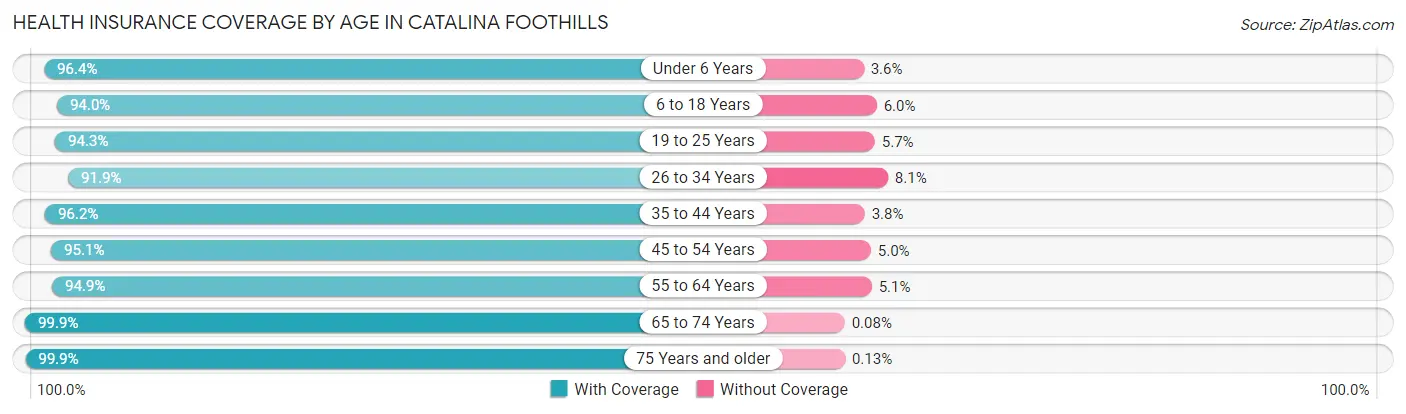
| Age Bracket | With Coverage | Without Coverage |
| Under 6 Years | 1,839 (96.4%) | 69 (3.6%) |
| 6 to 18 Years | 5,910 (94.0%) | 380 (6.0%) |
| 19 to 25 Years | 2,670 (94.3%) | 161 (5.7%) |
| 26 to 34 Years | 3,085 (91.9%) | 273 (8.1%) |
| 35 to 44 Years | 4,592 (96.2%) | 182 (3.8%) |
| 45 to 54 Years | 5,200 (95.1%) | 271 (5.0%) |
| 55 to 64 Years | 8,064 (94.9%) | 435 (5.1%) |
| 65 to 74 Years | 9,485 (99.9%) | 8 (0.1%) |
| 75 Years and older | 7,127 (99.9%) | 9 (0.1%) |
| Total | 47,972 (96.4%) | 1,788 (3.6%) |
Health Insurance Coverage by Citizenship Status in Catalina Foothills
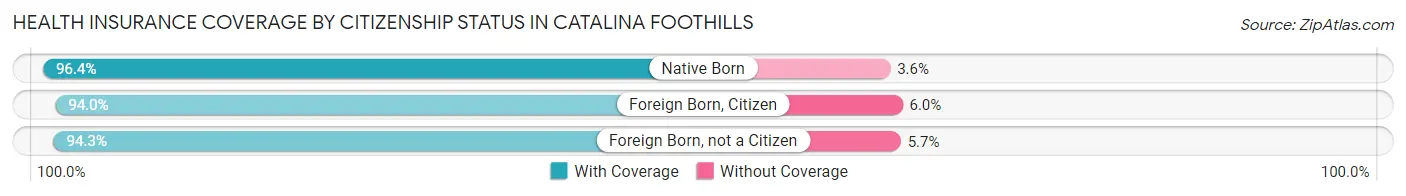
| Citizenship Status | With Coverage | Without Coverage |
| Native Born | 1,839 (96.4%) | 69 (3.6%) |
| Foreign Born, Citizen | 5,910 (94.0%) | 380 (6.0%) |
| Foreign Born, not a Citizen | 2,670 (94.3%) | 161 (5.7%) |
Health Insurance Coverage by Household Income in Catalina Foothills
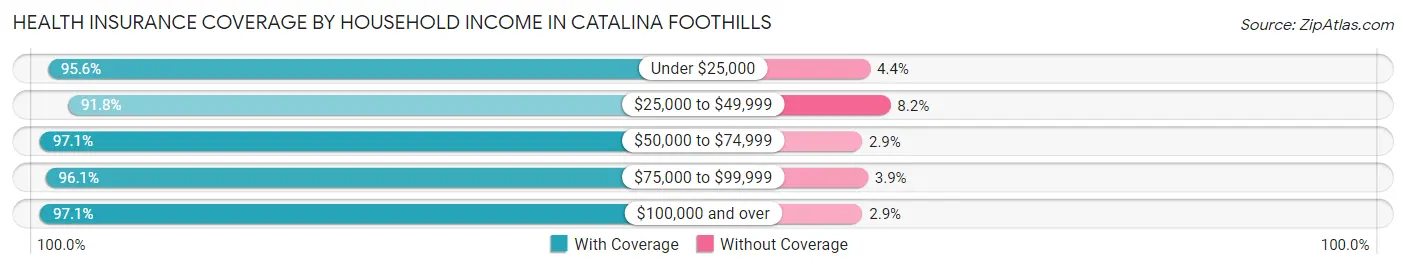
| Household Income | With Coverage | Without Coverage |
| Under $25,000 | 2,741 (95.6%) | 125 (4.4%) |
| $25,000 to $49,999 | 4,101 (91.8%) | 365 (8.2%) |
| $50,000 to $74,999 | 5,396 (97.1%) | 159 (2.9%) |
| $75,000 to $99,999 | 5,240 (96.1%) | 215 (3.9%) |
| $100,000 and over | 30,418 (97.1%) | 912 (2.9%) |
Public vs Private Health Insurance Coverage by Age in Catalina Foothills
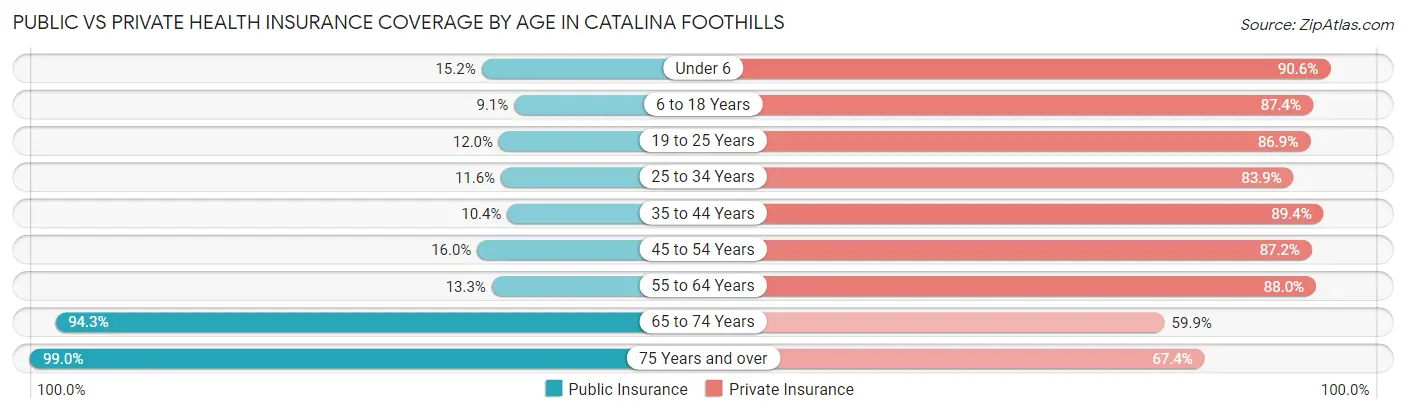
| Age Bracket | Public Insurance | Private Insurance |
| Under 6 | 290 (15.2%) | 1,729 (90.6%) |
| 6 to 18 Years | 575 (9.1%) | 5,499 (87.4%) |
| 19 to 25 Years | 339 (12.0%) | 2,460 (86.9%) |
| 25 to 34 Years | 389 (11.6%) | 2,816 (83.9%) |
| 35 to 44 Years | 497 (10.4%) | 4,268 (89.4%) |
| 45 to 54 Years | 875 (16.0%) | 4,771 (87.2%) |
| 55 to 64 Years | 1,130 (13.3%) | 7,479 (88.0%) |
| 65 to 74 Years | 8,953 (94.3%) | 5,689 (59.9%) |
| 75 Years and over | 7,064 (99.0%) | 4,806 (67.3%) |
| Total | 20,112 (40.4%) | 39,517 (79.4%) |
Disability Status by Sex by Age in Catalina Foothills
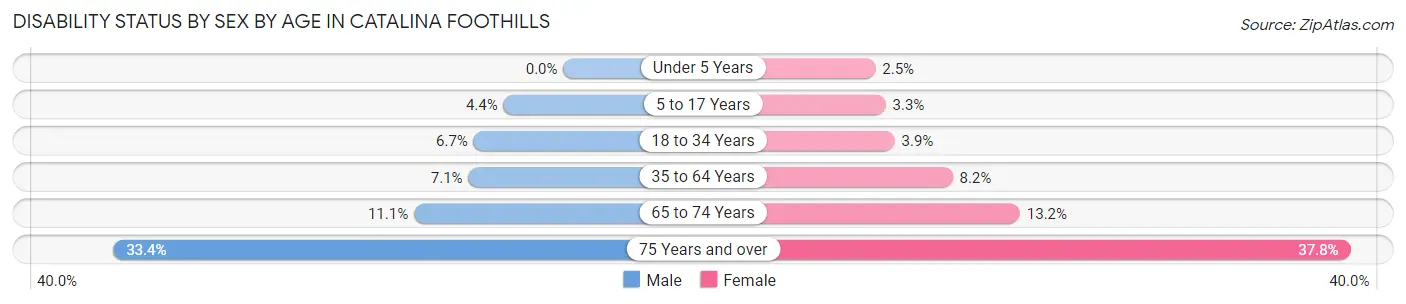
| Age Bracket | Male | Female |
| Under 5 Years | 0 (0.0%) | 19 (2.5%) |
| 5 to 17 Years | 141 (4.4%) | 97 (3.3%) |
| 18 to 34 Years | 241 (6.7%) | 117 (3.9%) |
| 35 to 64 Years | 623 (7.0%) | 814 (8.2%) |
| 65 to 74 Years | 505 (11.1%) | 653 (13.2%) |
| 75 Years and over | 1,089 (33.4%) | 1,464 (37.8%) |
Disability Class by Sex by Age in Catalina Foothills
Disability Class: Hearing Difficulty
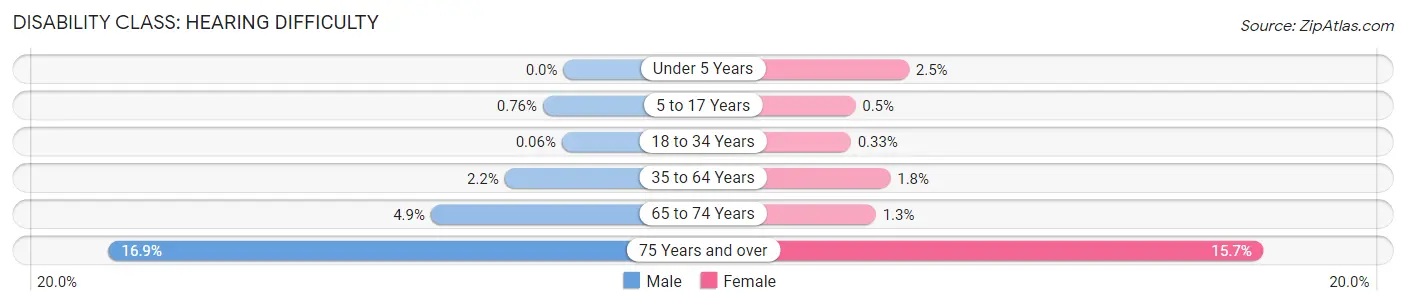
| Age Bracket | Male | Female |
| Under 5 Years | 0 (0.0%) | 19 (2.5%) |
| 5 to 17 Years | 24 (0.8%) | 15 (0.5%) |
| 18 to 34 Years | 2 (0.1%) | 10 (0.3%) |
| 35 to 64 Years | 193 (2.2%) | 178 (1.8%) |
| 65 to 74 Years | 224 (4.9%) | 62 (1.3%) |
| 75 Years and over | 550 (16.9%) | 607 (15.7%) |
Disability Class: Vision Difficulty
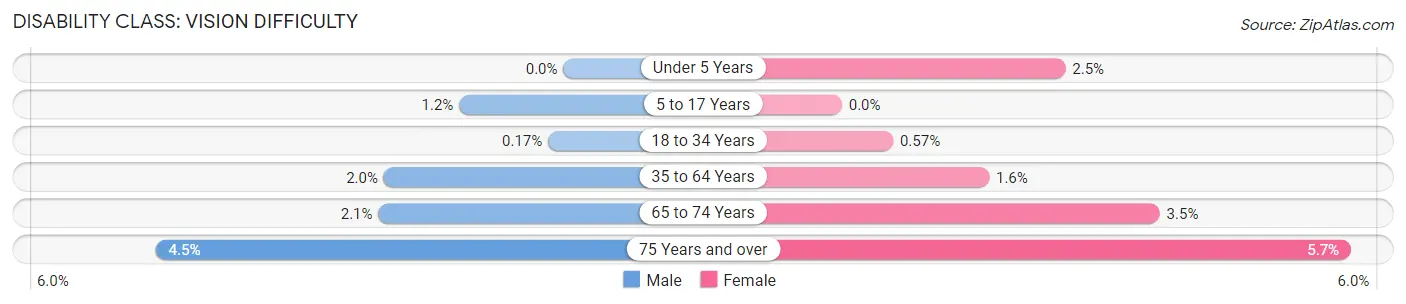
| Age Bracket | Male | Female |
| Under 5 Years | 0 (0.0%) | 19 (2.5%) |
| 5 to 17 Years | 37 (1.2%) | 0 (0.0%) |
| 18 to 34 Years | 6 (0.2%) | 17 (0.6%) |
| 35 to 64 Years | 177 (2.0%) | 162 (1.6%) |
| 65 to 74 Years | 94 (2.1%) | 175 (3.5%) |
| 75 Years and over | 148 (4.5%) | 220 (5.7%) |
Disability Class: Cognitive Difficulty
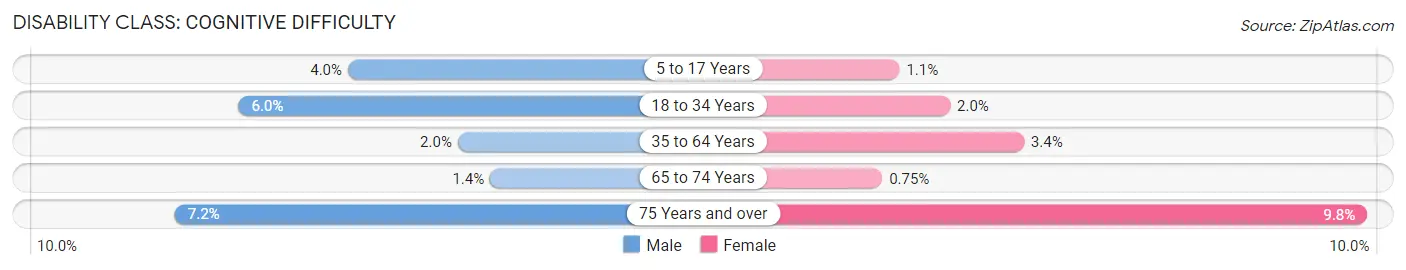
| Age Bracket | Male | Female |
| 5 to 17 Years | 127 (4.0%) | 32 (1.1%) |
| 18 to 34 Years | 218 (6.0%) | 60 (2.0%) |
| 35 to 64 Years | 173 (2.0%) | 335 (3.4%) |
| 65 to 74 Years | 62 (1.4%) | 37 (0.7%) |
| 75 Years and over | 235 (7.2%) | 378 (9.8%) |
Disability Class: Ambulatory Difficulty
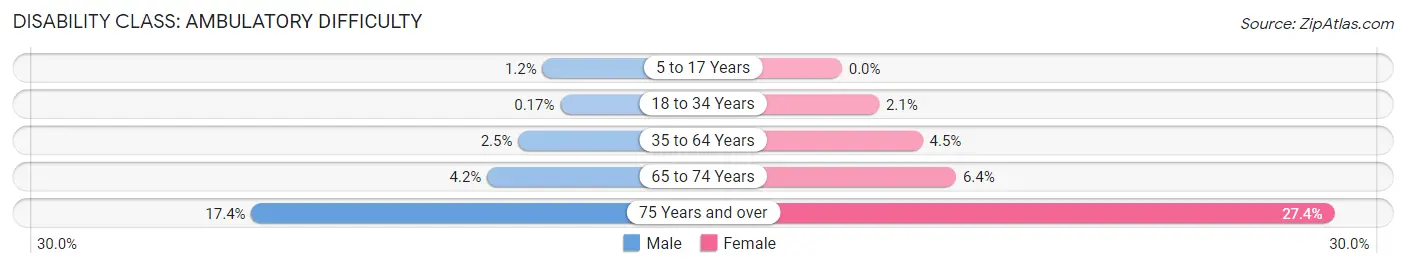
| Age Bracket | Male | Female |
| 5 to 17 Years | 37 (1.2%) | 0 (0.0%) |
| 18 to 34 Years | 6 (0.2%) | 62 (2.1%) |
| 35 to 64 Years | 222 (2.5%) | 446 (4.5%) |
| 65 to 74 Years | 193 (4.2%) | 314 (6.4%) |
| 75 Years and over | 566 (17.4%) | 1,063 (27.4%) |
Disability Class: Self-Care Difficulty
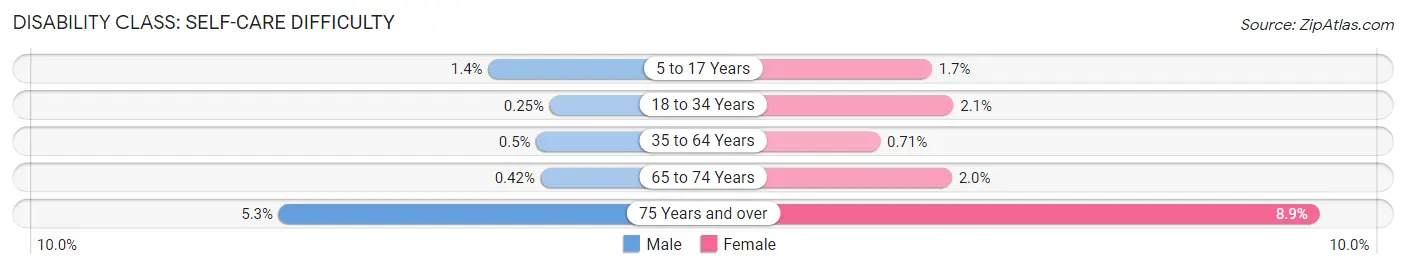
| Age Bracket | Male | Female |
| 5 to 17 Years | 44 (1.4%) | 50 (1.7%) |
| 18 to 34 Years | 9 (0.3%) | 62 (2.1%) |
| 35 to 64 Years | 44 (0.5%) | 70 (0.7%) |
| 65 to 74 Years | 19 (0.4%) | 101 (2.0%) |
| 75 Years and over | 172 (5.3%) | 344 (8.9%) |
Technology Access in Catalina Foothills
Computing Device Access in Catalina Foothills
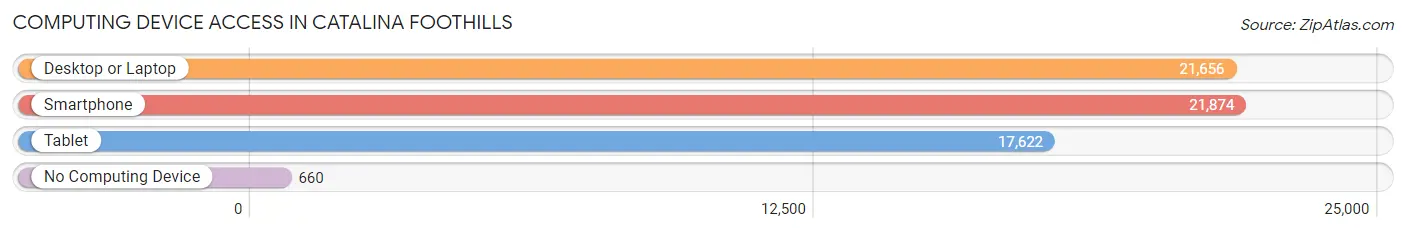
| Device Type | # Households | % Households |
| Desktop or Laptop | 21,656 | 91.5% |
| Smartphone | 21,874 | 92.4% |
| Tablet | 17,622 | 74.4% |
| No Computing Device | 660 | 2.8% |
| Total | 23,673 | 100.0% |
Internet Access in Catalina Foothills
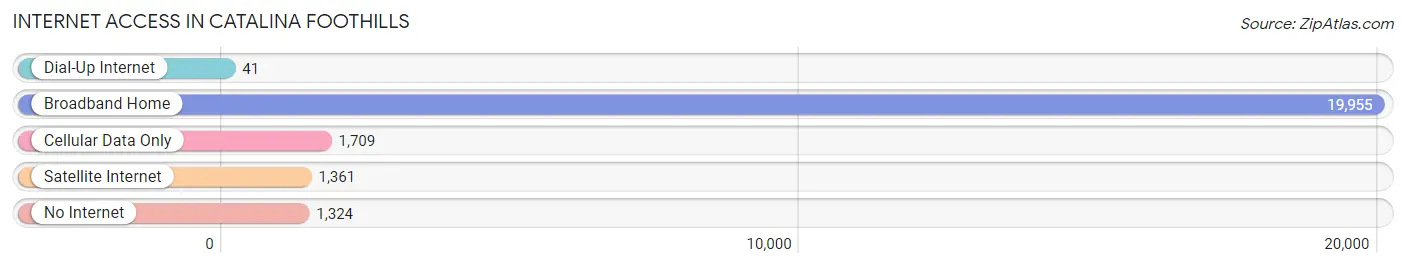
| Internet Type | # Households | % Households |
| Dial-Up Internet | 41 | 0.2% |
| Broadband Home | 19,955 | 84.3% |
| Cellular Data Only | 1,709 | 7.2% |
| Satellite Internet | 1,361 | 5.8% |
| No Internet | 1,324 | 5.6% |
| Total | 23,673 | 100.0% |
Catalina Foothills Summary
Catalina Foothills is a census-designated place (CDP) located in Pima County, Arizona. It is situated in the foothills of the Santa Catalina Mountains, north of Tucson. The area is known for its upscale residential neighborhoods, excellent schools, and proximity to the University of Arizona.
History
The area now known as Catalina Foothills was originally inhabited by the Hohokam people, who lived in the area from around 300 BC to 1450 AD. The area was later settled by Spanish missionaries and ranchers in the late 1700s. The area was part of the San Agustin de Tucson land grant, which was given to the family of Don Ignacio Pesqueira in 1821.
In the early 1900s, the area was developed as a residential area for wealthy Tucsonans. The area was incorporated as a town in the 1950s, but was later annexed by the City of Tucson in 1975.
Geography
Catalina Foothills is located in the foothills of the Santa Catalina Mountains, north of Tucson. The area is bordered by the towns of Oro Valley to the north, Marana to the west, and Tucson to the south and east. The area is characterized by rolling hills and desert vegetation.
The area has a total area of 16.3 square miles, of which 16.2 square miles is land and 0.1 square miles is water. The elevation of the area is 2,637 feet above sea level.
Economy
The economy of Catalina Foothills is largely driven by the tourism industry. The area is home to several resorts, golf courses, and other attractions. The area is also home to several corporate headquarters, including Raytheon, Honeywell, and IBM.
The area is also home to several shopping centers, including La Encantada, Foothills Mall, and Park Place Mall.
Demographics
As of the 2010 census, the population of Catalina Foothills was 50,796. The racial makeup of the area was 87.3% White, 4.2% Asian, 3.2% African American, 2.2% Native American, and 2.1% from other races. The median household income was $90,945, and the median family income was $103,945.
The area is home to a large number of retirees, with 25.3% of the population over the age of 65. The area is also home to a large number of college-educated residents, with 57.2% of the population having a bachelor's degree or higher.
Conclusion
Catalina Foothills is a census-designated place located in Pima County, Arizona. It is situated in the foothills of the Santa Catalina Mountains, north of Tucson. The area is known for its upscale residential neighborhoods, excellent schools, and proximity to the University of Arizona. The economy of the area is largely driven by the tourism industry, and the area is home to several corporate headquarters. The population of the area is largely white, with a median household income of $90,945. The area is also home to a large number of retirees and college-educated residents.
Common Questions
What is Per Capita Income in Catalina Foothills?
Per Capita income in Catalina Foothills is $78,842.
What is the Median Family Income in Catalina Foothills?
Median Family Income in Catalina Foothills is $161,464.
What is the Median Household income in Catalina Foothills?
Median Household Income in Catalina Foothills is $110,660.
What is Income or Wage Gap in Catalina Foothills?
Income or Wage Gap in Catalina Foothills is 35.3%.
Women in Catalina Foothills earn 64.7 cents for every dollar earned by a man.
What is Family Income Deficit in Catalina Foothills?
Family Income Deficit in Catalina Foothills is $9,613.
Families that are below poverty line in Catalina Foothills earn $9,613 less on average than the poverty threshold level.
What is Inequality or Gini Index in Catalina Foothills?
Inequality or Gini Index in Catalina Foothills is 0.49.
What is the Total Population of Catalina Foothills?
Total Population of Catalina Foothills is 50,573.
What is the Total Male Population of Catalina Foothills?
Total Male Population of Catalina Foothills is 24,737.
What is the Total Female Population of Catalina Foothills?
Total Female Population of Catalina Foothills is 25,836.
What is the Ratio of Males per 100 Females in Catalina Foothills?
There are 95.75 Males per 100 Females in Catalina Foothills.
What is the Ratio of Females per 100 Males in Catalina Foothills?
There are 104.44 Females per 100 Males in Catalina Foothills.
What is the Median Population Age in Catalina Foothills?
Median Population Age in Catalina Foothills is 55.4 Years.
What is the Average Family Size in Catalina Foothills
Average Family Size in Catalina Foothills is 2.7 People.
What is the Average Household Size in Catalina Foothills
Average Household Size in Catalina Foothills is 2.1 People.
How Large is the Labor Force in Catalina Foothills?
There are 24,034 People in the Labor Forcein in Catalina Foothills.
What is the Percentage of People in the Labor Force in Catalina Foothills?
54.9% of People are in the Labor Force in Catalina Foothills.
What is the Unemployment Rate in Catalina Foothills?
Unemployment Rate in Catalina Foothills is 3.9%.