Alpharetta, GA Map & Demographics
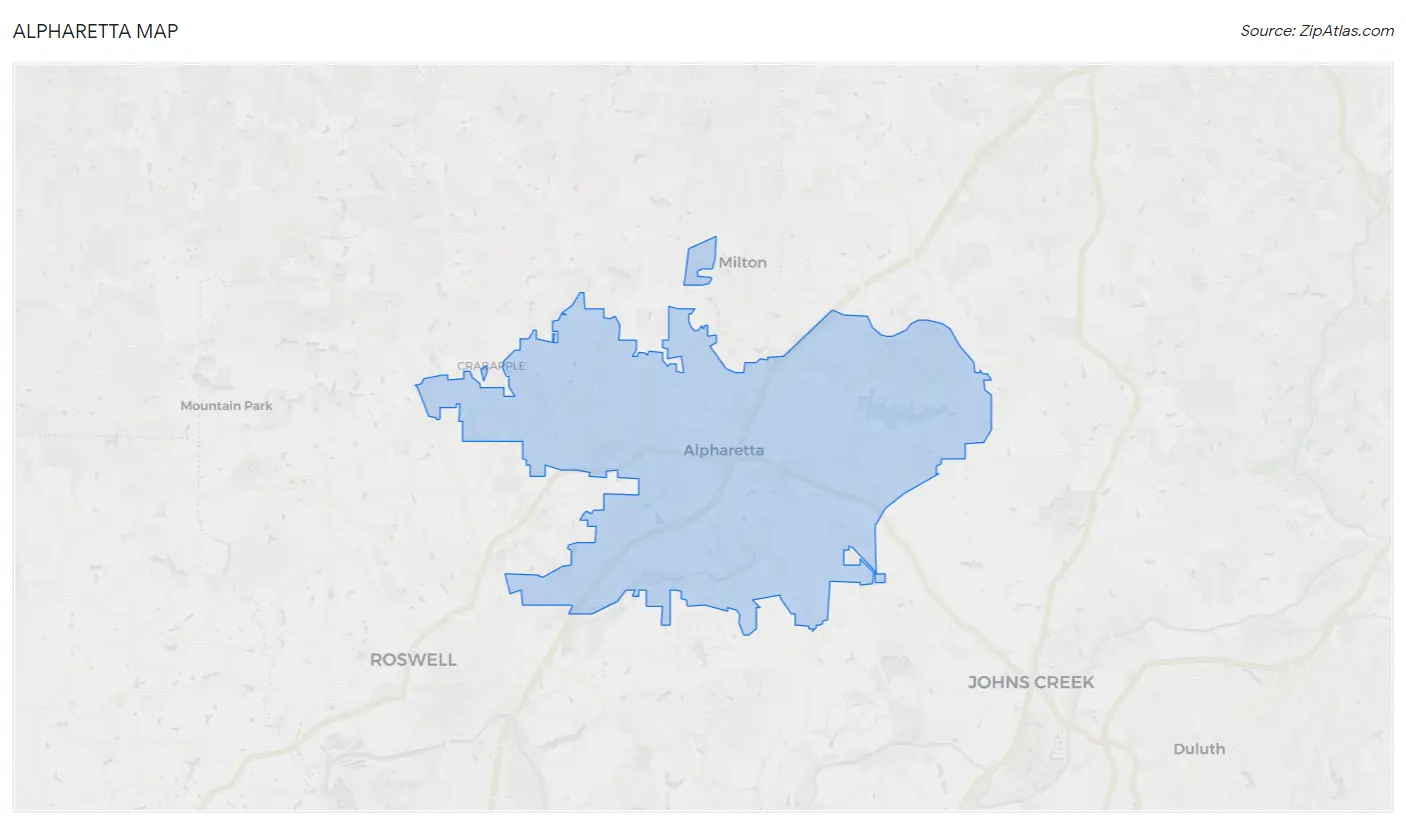
Alpharetta Map
Alpharetta Overview
$68,391
PER CAPITA INCOME
$176,705
AVG FAMILY INCOME
$141,402
AVG HOUSEHOLD INCOME
43.2%
WAGE / INCOME GAP [ % ]
56.8¢/ $1
WAGE / INCOME GAP [ $ ]
$10,663
FAMILY INCOME DEFICIT
0.46
INEQUALITY / GINI INDEX
65,884
TOTAL POPULATION
33,265
MALE POPULATION
32,619
FEMALE POPULATION
101.98
MALES / 100 FEMALES
98.06
FEMALES / 100 MALES
40.6
MEDIAN AGE
3.2
AVG FAMILY SIZE
2.7
AVG HOUSEHOLD SIZE
36,302
LABOR FORCE [ PEOPLE ]
71.1%
PERCENT IN LABOR FORCE
4.8%
UNEMPLOYMENT RATE
Alpharetta Area Codes
Income in Alpharetta
Income Overview in Alpharetta
Per Capita Income in Alpharetta is $68,391, while median incomes of families and households are $176,705 and $141,402 respectively.
| Characteristic | Number | Measure |
| Per Capita Income | 65,884 | $68,391 |
| Median Family Income | 18,028 | $176,705 |
| Mean Family Income | 18,028 | $214,451 |
| Median Household Income | 24,093 | $141,402 |
| Mean Household Income | 24,093 | $188,051 |
| Income Deficit | 18,028 | $10,663 |
| Wage / Income Gap (%) | 65,884 | 43.17% |
| Wage / Income Gap ($) | 65,884 | 56.83¢ per $1 |
| Gini / Inequality Index | 65,884 | 0.46 |
Earnings by Sex in Alpharetta
Average Earnings in Alpharetta are $77,149, $99,401 for men and $56,489 for women, a difference of 43.2%.
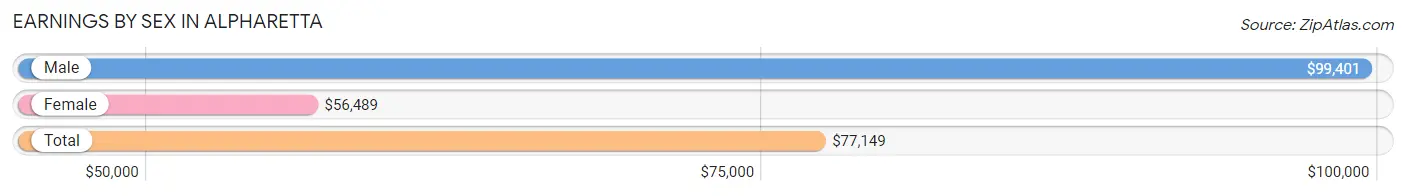
| Sex | Number | Average Earnings |
| Male | 20,342 (54.4%) | $99,401 |
| Female | 17,053 (45.6%) | $56,489 |
| Total | 37,395 (100.0%) | $77,149 |
Earnings by Sex by Income Bracket in Alpharetta
The most common earnings brackets in Alpharetta are $100,000+ for men (10,120 | 49.7%) and $100,000+ for women (4,845 | 28.4%).
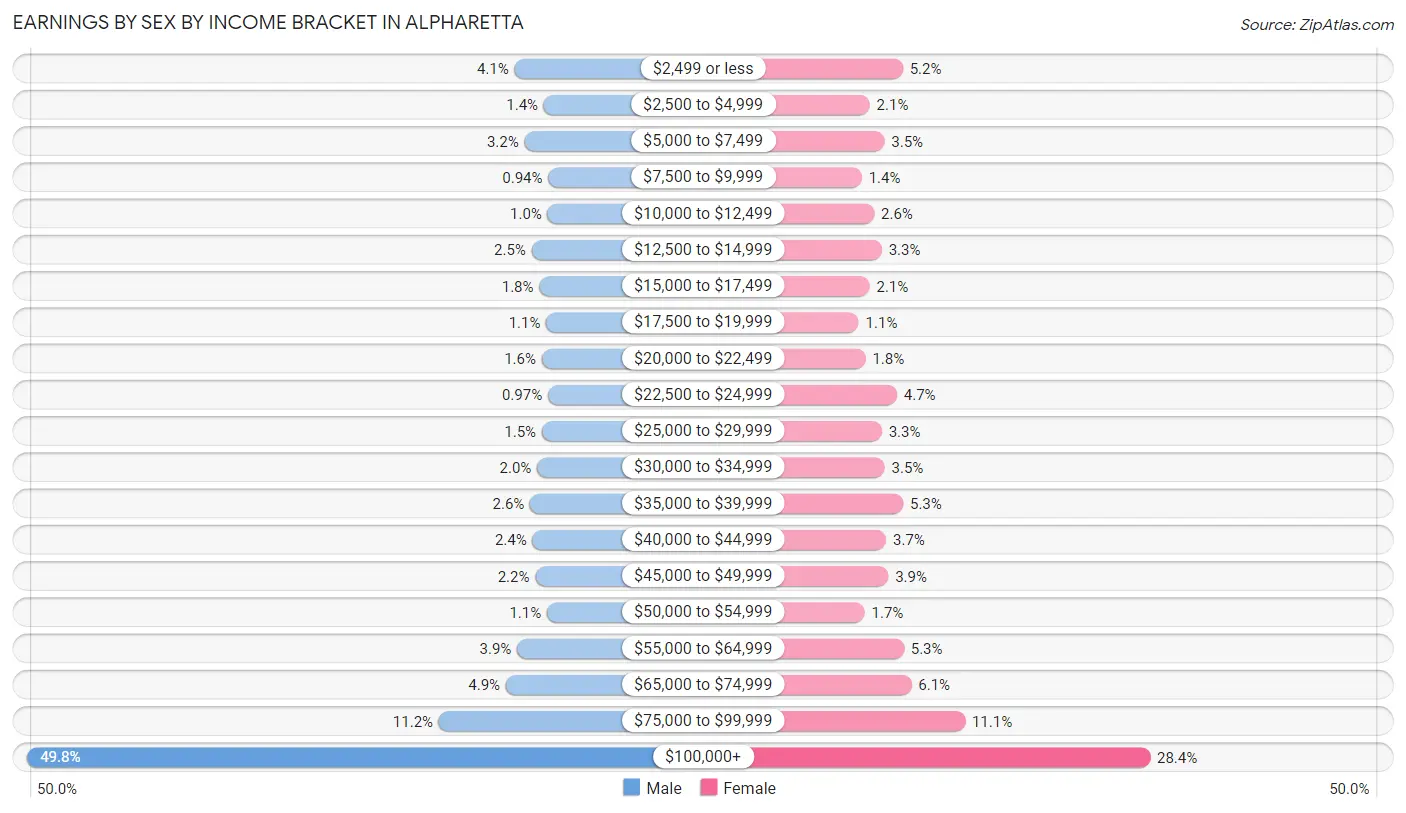
| Income | Male | Female |
| $2,499 or less | 835 (4.1%) | 893 (5.2%) |
| $2,500 to $4,999 | 275 (1.3%) | 365 (2.1%) |
| $5,000 to $7,499 | 644 (3.2%) | 600 (3.5%) |
| $7,500 to $9,999 | 191 (0.9%) | 238 (1.4%) |
| $10,000 to $12,499 | 204 (1.0%) | 437 (2.6%) |
| $12,500 to $14,999 | 509 (2.5%) | 558 (3.3%) |
| $15,000 to $17,499 | 362 (1.8%) | 363 (2.1%) |
| $17,500 to $19,999 | 229 (1.1%) | 190 (1.1%) |
| $20,000 to $22,499 | 316 (1.5%) | 299 (1.8%) |
| $22,500 to $24,999 | 197 (1.0%) | 799 (4.7%) |
| $25,000 to $29,999 | 314 (1.5%) | 557 (3.3%) |
| $30,000 to $34,999 | 402 (2.0%) | 604 (3.5%) |
| $35,000 to $39,999 | 537 (2.6%) | 899 (5.3%) |
| $40,000 to $44,999 | 493 (2.4%) | 628 (3.7%) |
| $45,000 to $49,999 | 439 (2.2%) | 662 (3.9%) |
| $50,000 to $54,999 | 216 (1.1%) | 285 (1.7%) |
| $55,000 to $64,999 | 785 (3.9%) | 911 (5.3%) |
| $65,000 to $74,999 | 998 (4.9%) | 1,032 (6.0%) |
| $75,000 to $99,999 | 2,276 (11.2%) | 1,888 (11.1%) |
| $100,000+ | 10,120 (49.7%) | 4,845 (28.4%) |
| Total | 20,342 (100.0%) | 17,053 (100.0%) |
Earnings by Sex by Educational Attainment in Alpharetta
Average earnings in Alpharetta are $109,447 for men and $67,430 for women, a difference of 38.4%. Men with an educational attainment of graduate degree enjoy the highest average annual earnings of $145,594, while those with less than high school education earn the least with $22,039. Women with an educational attainment of graduate degree earn the most with the average annual earnings of $107,979, while those with less than high school education have the smallest earnings of $25,843.
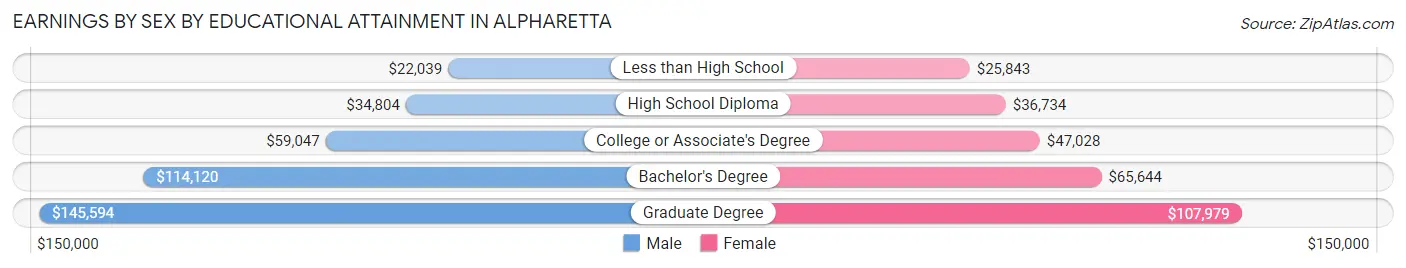
| Educational Attainment | Male Income | Female Income |
| Less than High School | $22,039 | $25,843 |
| High School Diploma | $34,804 | $36,734 |
| College or Associate's Degree | $59,047 | $47,028 |
| Bachelor's Degree | $114,120 | $65,644 |
| Graduate Degree | $145,594 | $107,979 |
| Total | $109,447 | $67,430 |
Family Income in Alpharetta
Family Income Brackets in Alpharetta
According to the Alpharetta family income data, there are 7,932 families falling into the $200,000+ income range, which is the most common income bracket and makes up 44.0% of all families. Conversely, the $10,000 to $14,999 income bracket is the least frequent group with only 54 families (0.3%) belonging to this category.
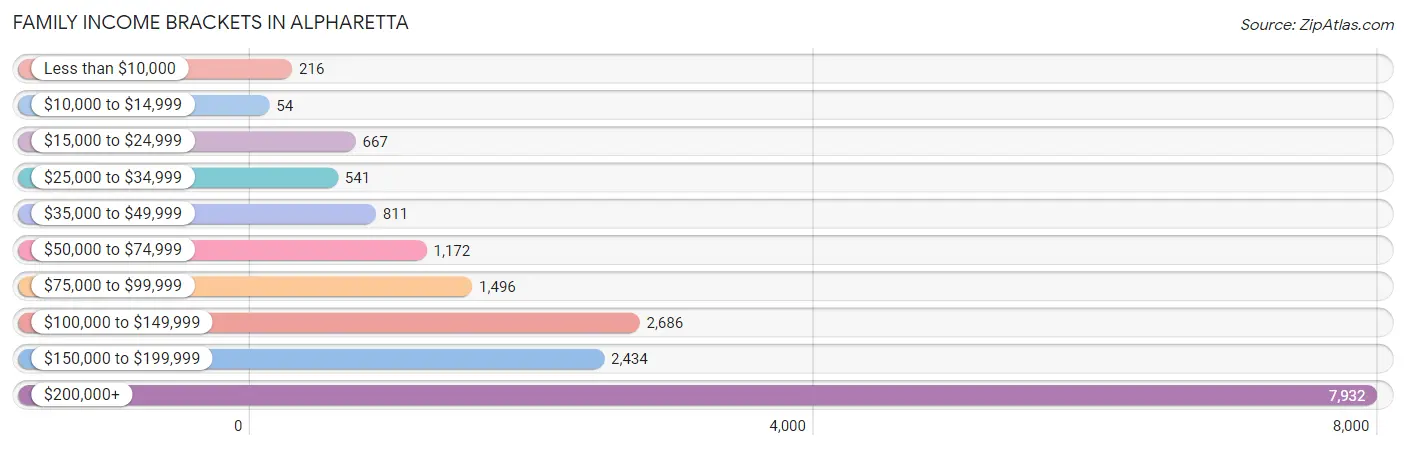
| Income Bracket | # Families | % Families |
| Less than $10,000 | 216 | 1.2% |
| $10,000 to $14,999 | 54 | 0.3% |
| $15,000 to $24,999 | 667 | 3.7% |
| $25,000 to $34,999 | 541 | 3.0% |
| $35,000 to $49,999 | 811 | 4.5% |
| $50,000 to $74,999 | 1,172 | 6.5% |
| $75,000 to $99,999 | 1,496 | 8.3% |
| $100,000 to $149,999 | 2,686 | 14.9% |
| $150,000 to $199,999 | 2,434 | 13.5% |
| $200,000+ | 7,932 | 44.0% |
Family Income by Famaliy Size in Alpharetta
5-person families (1,644 | 9.1%) account for the highest median family income in Alpharetta with $250,001 per family, while 2-person families (6,836 | 37.9%) have the highest median income of $68,419 per family member.
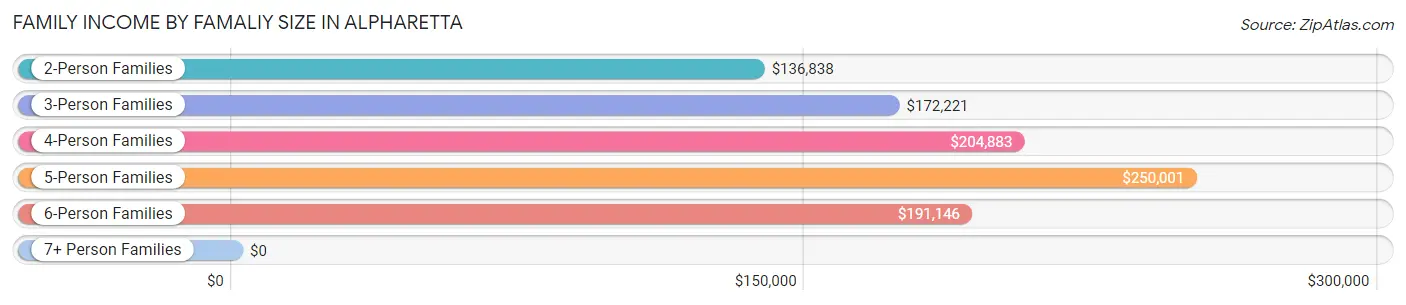
| Income Bracket | # Families | Median Income |
| 2-Person Families | 6,836 (37.9%) | $136,838 |
| 3-Person Families | 4,757 (26.4%) | $172,221 |
| 4-Person Families | 4,237 (23.5%) | $204,883 |
| 5-Person Families | 1,644 (9.1%) | $250,001 |
| 6-Person Families | 361 (2.0%) | $191,146 |
| 7+ Person Families | 193 (1.1%) | $0 |
| Total | 18,028 (100.0%) | $176,705 |
Family Income by Number of Earners in Alpharetta
The median family income in Alpharetta is $176,705, with families comprising 3+ earners (2,542) having the highest median family income of $235,557, while families with no earners (1,306) have the lowest median family income of $39,242, accounting for 14.1% and 7.2% of families, respectively.
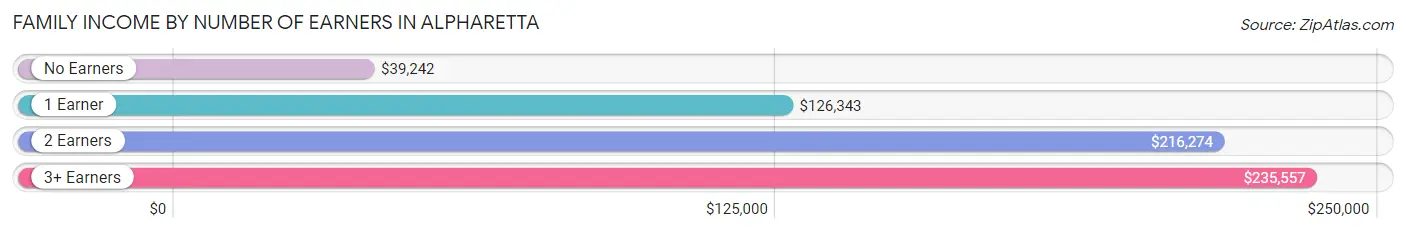
| Number of Earners | # Families | Median Income |
| No Earners | 1,306 (7.2%) | $39,242 |
| 1 Earner | 5,805 (32.2%) | $126,343 |
| 2 Earners | 8,375 (46.5%) | $216,274 |
| 3+ Earners | 2,542 (14.1%) | $235,557 |
| Total | 18,028 (100.0%) | $176,705 |
Household Income in Alpharetta
Household Income Brackets in Alpharetta
With 8,505 households falling in the category, the $200,000+ income range is the most frequent in Alpharetta, accounting for 35.3% of all households. In contrast, only 193 households (0.8%) fall into the $10,000 to $14,999 income bracket, making it the least populous group.
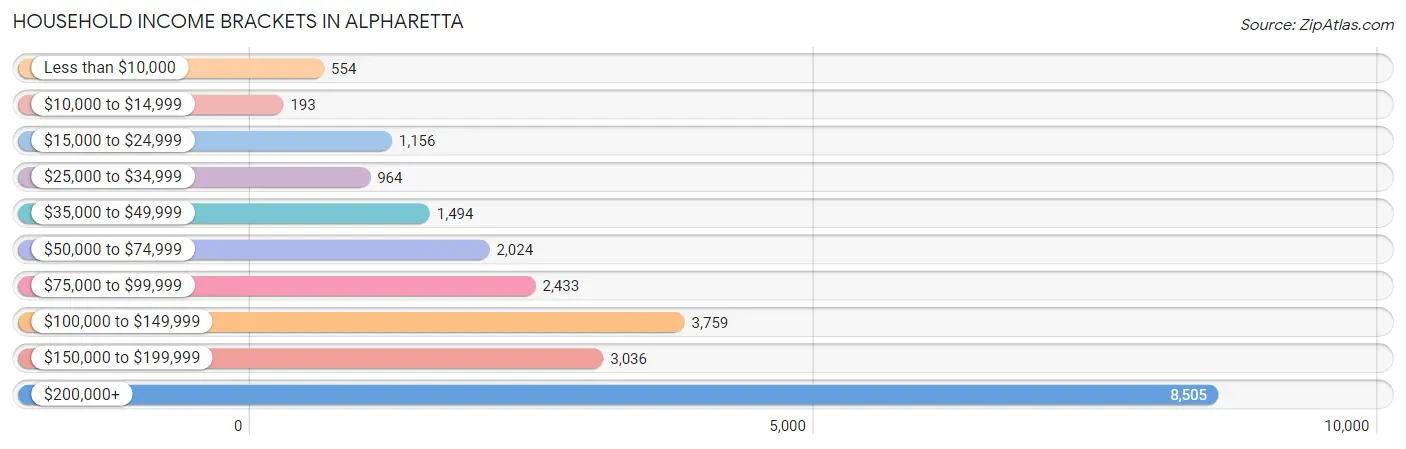
| Income Bracket | # Households | % Households |
| Less than $10,000 | 554 | 2.3% |
| $10,000 to $14,999 | 193 | 0.8% |
| $15,000 to $24,999 | 1,156 | 4.8% |
| $25,000 to $34,999 | 964 | 4.0% |
| $35,000 to $49,999 | 1,494 | 6.2% |
| $50,000 to $74,999 | 2,024 | 8.4% |
| $75,000 to $99,999 | 2,433 | 10.1% |
| $100,000 to $149,999 | 3,759 | 15.6% |
| $150,000 to $199,999 | 3,036 | 12.6% |
| $200,000+ | 8,505 | 35.3% |
Household Income by Householder Age in Alpharetta
The median household income in Alpharetta is $141,402, with the highest median household income of $186,000 found in the 45 to 64 years age bracket for the primary householder. A total of 12,188 households (50.6%) fall into this category. Meanwhile, the 15 to 24 years age bracket for the primary householder has the lowest median household income of $44,675, with 319 households (1.3%) in this group.
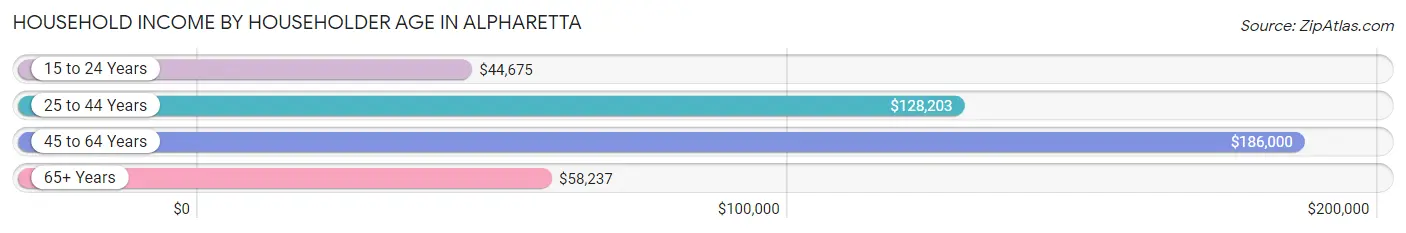
| Income Bracket | # Households | Median Income |
| 15 to 24 Years | 319 (1.3%) | $44,675 |
| 25 to 44 Years | 7,637 (31.7%) | $128,203 |
| 45 to 64 Years | 12,188 (50.6%) | $186,000 |
| 65+ Years | 3,949 (16.4%) | $58,237 |
| Total | 24,093 (100.0%) | $141,402 |
Poverty in Alpharetta
Income Below Poverty by Sex and Age in Alpharetta
With 5.9% poverty level for males and 4.2% for females among the residents of Alpharetta, 18 to 24 year old males and 18 to 24 year old females are the most vulnerable to poverty, with 491 males (19.6%) and 130 females (7.3%) in their respective age groups living below the poverty level.
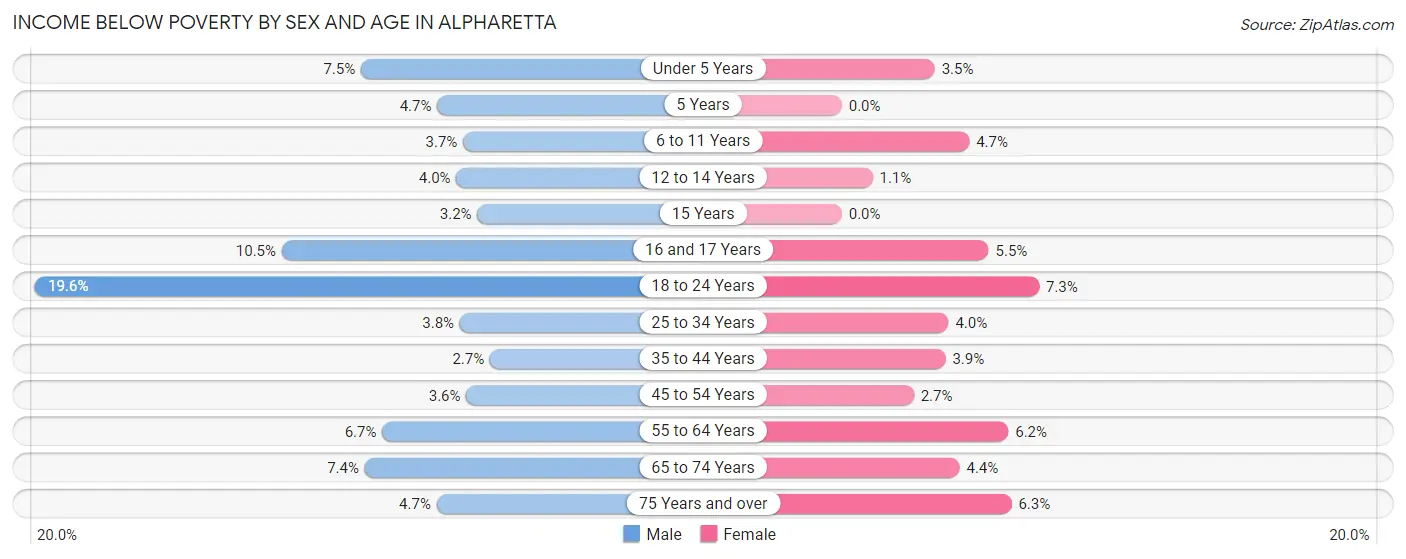
| Age Bracket | Male | Female |
| Under 5 Years | 122 (7.5%) | 66 (3.5%) |
| 5 Years | 19 (4.7%) | 0 (0.0%) |
| 6 to 11 Years | 131 (3.7%) | 118 (4.7%) |
| 12 to 14 Years | 66 (4.0%) | 19 (1.1%) |
| 15 Years | 18 (3.2%) | 0 (0.0%) |
| 16 and 17 Years | 92 (10.4%) | 55 (5.4%) |
| 18 to 24 Years | 491 (19.6%) | 130 (7.3%) |
| 25 to 34 Years | 119 (3.8%) | 138 (4.0%) |
| 35 to 44 Years | 130 (2.7%) | 192 (3.8%) |
| 45 to 54 Years | 202 (3.6%) | 155 (2.7%) |
| 55 to 64 Years | 362 (6.7%) | 281 (6.2%) |
| 65 to 74 Years | 117 (7.4%) | 98 (4.4%) |
| 75 Years and over | 67 (4.7%) | 103 (6.3%) |
| Total | 1,936 (5.9%) | 1,355 (4.2%) |
Income Above Poverty by Sex and Age in Alpharetta
According to the poverty statistics in Alpharetta, males aged 35 to 44 years and females aged 5 years are the age groups that are most secure financially, with 97.3% of males and 100.0% of females in these age groups living above the poverty line.
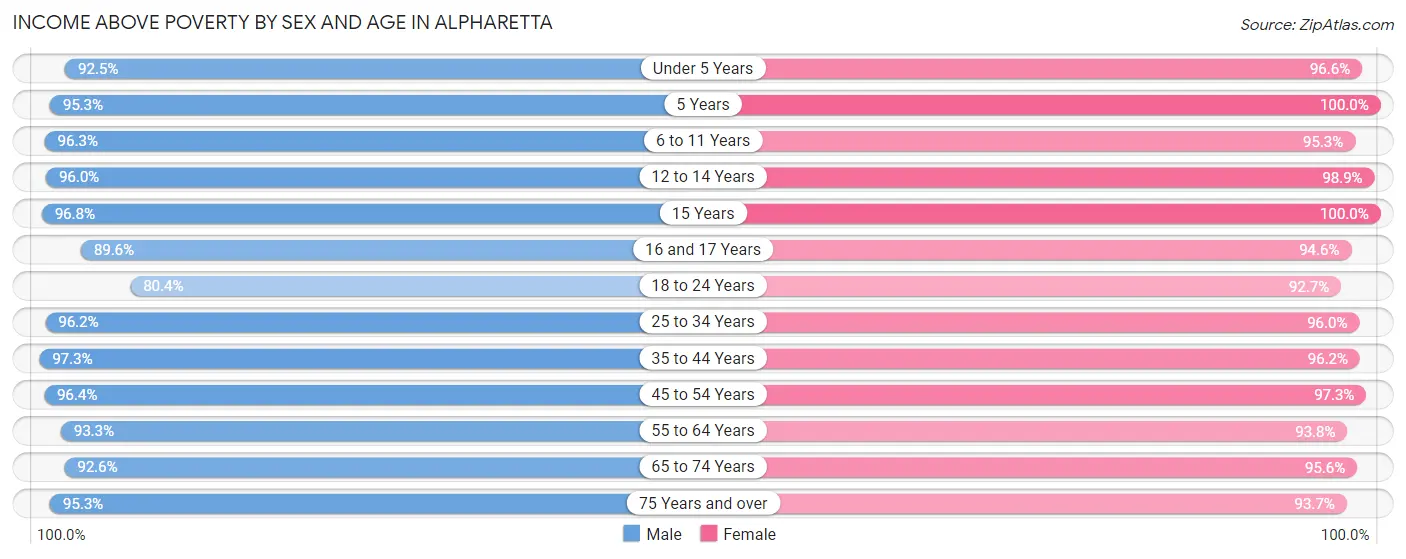
| Age Bracket | Male | Female |
| Under 5 Years | 1,502 (92.5%) | 1,847 (96.6%) |
| 5 Years | 387 (95.3%) | 452 (100.0%) |
| 6 to 11 Years | 3,387 (96.3%) | 2,377 (95.3%) |
| 12 to 14 Years | 1,597 (96.0%) | 1,641 (98.9%) |
| 15 Years | 546 (96.8%) | 423 (100.0%) |
| 16 and 17 Years | 788 (89.5%) | 955 (94.6%) |
| 18 to 24 Years | 2,013 (80.4%) | 1,645 (92.7%) |
| 25 to 34 Years | 2,983 (96.2%) | 3,350 (96.0%) |
| 35 to 44 Years | 4,650 (97.3%) | 4,792 (96.2%) |
| 45 to 54 Years | 5,410 (96.4%) | 5,641 (97.3%) |
| 55 to 64 Years | 5,026 (93.3%) | 4,268 (93.8%) |
| 65 to 74 Years | 1,471 (92.6%) | 2,147 (95.6%) |
| 75 Years and over | 1,358 (95.3%) | 1,533 (93.7%) |
| Total | 31,118 (94.1%) | 31,071 (95.8%) |
Income Below Poverty Among Married-Couple Families in Alpharetta
The poverty statistics for married-couple families in Alpharetta show that 2.2% or 348 of the total 15,523 families live below the poverty line. Families with 3 or 4 children have the highest poverty rate of 3.6%, comprising of 40 families. On the other hand, families with 5 or more children have the lowest poverty rate of 0.0%, which includes 0 families.
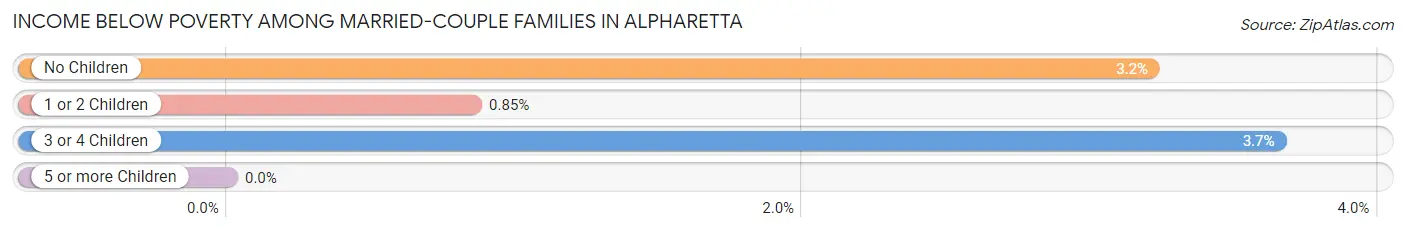
| Children | Above Poverty | Below Poverty |
| No Children | 7,623 (96.8%) | 253 (3.2%) |
| 1 or 2 Children | 6,382 (99.2%) | 55 (0.9%) |
| 3 or 4 Children | 1,057 (96.4%) | 40 (3.6%) |
| 5 or more Children | 113 (100.0%) | 0 (0.0%) |
| Total | 15,175 (97.8%) | 348 (2.2%) |
Income Below Poverty Among Single-Parent Households in Alpharetta
According to the poverty data in Alpharetta, 15.9% or 103 single-father households and 9.2% or 172 single-mother households are living below the poverty line. Among single-father households, those with no children have the highest poverty rate, with 61 households (20.0%) experiencing poverty. Likewise, among single-mother households, those with 3 or 4 children have the highest poverty rate, with 63 households (33.3%) falling below the poverty line.
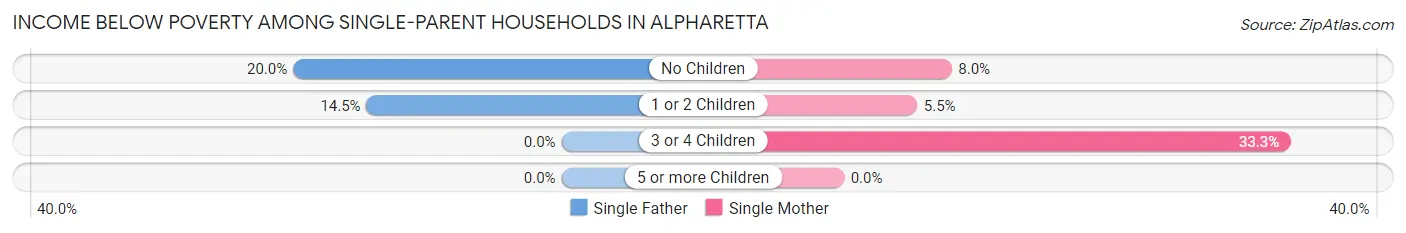
| Children | Single Father | Single Mother |
| No Children | 61 (20.0%) | 56 (8.0%) |
| 1 or 2 Children | 42 (14.5%) | 53 (5.4%) |
| 3 or 4 Children | 0 (0.0%) | 63 (33.3%) |
| 5 or more Children | 0 (0.0%) | 0 (0.0%) |
| Total | 103 (15.9%) | 172 (9.2%) |
Income Below Poverty Among Married-Couple vs Single-Parent Households in Alpharetta
The poverty data for Alpharetta shows that 348 of the married-couple family households (2.2%) and 275 of the single-parent households (11.0%) are living below the poverty level. Within the married-couple family households, those with 3 or 4 children have the highest poverty rate, with 40 households (3.6%) falling below the poverty line. Among the single-parent households, those with 3 or 4 children have the highest poverty rate, with 63 household (26.1%) living below poverty.
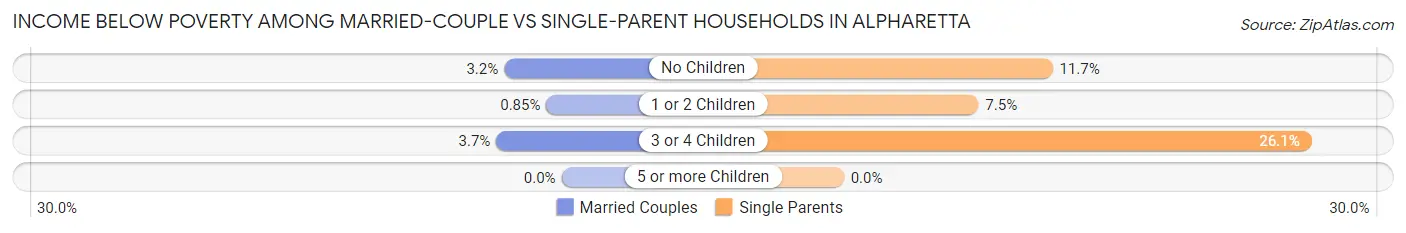
| Children | Married-Couple Families | Single-Parent Households |
| No Children | 253 (3.2%) | 117 (11.7%) |
| 1 or 2 Children | 55 (0.9%) | 95 (7.5%) |
| 3 or 4 Children | 40 (3.6%) | 63 (26.1%) |
| 5 or more Children | 0 (0.0%) | 0 (0.0%) |
| Total | 348 (2.2%) | 275 (11.0%) |
Race in Alpharetta
The most populous races in Alpharetta are White / Caucasian (38,222 | 58.0%), Asian (14,562 | 22.1%), and Black / African American (7,432 | 11.3%).
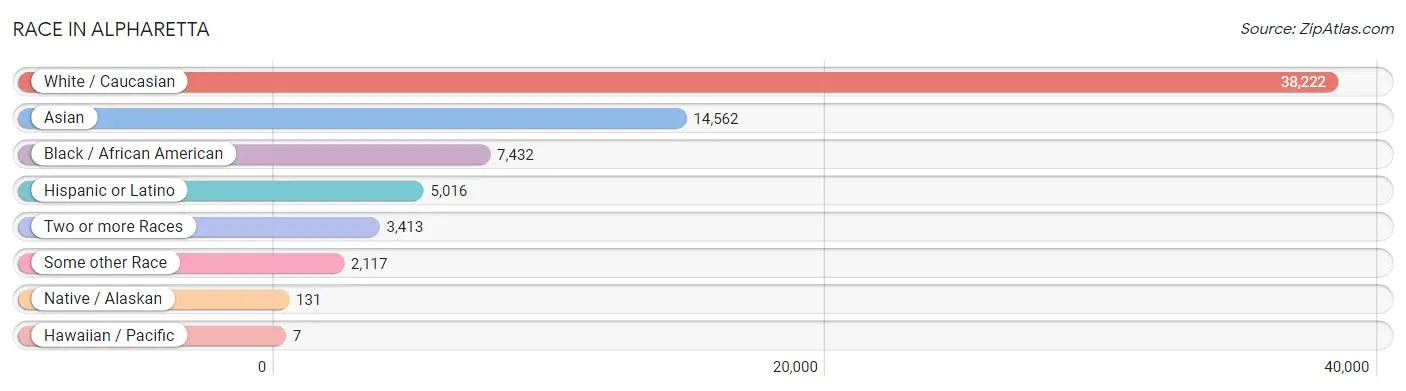
| Race | # Population | % Population |
| Asian | 14,562 | 22.1% |
| Black / African American | 7,432 | 11.3% |
| Hawaiian / Pacific | 7 | 0.0% |
| Hispanic or Latino | 5,016 | 7.6% |
| Native / Alaskan | 131 | 0.2% |
| White / Caucasian | 38,222 | 58.0% |
| Two or more Races | 3,413 | 5.2% |
| Some other Race | 2,117 | 3.2% |
| Total | 65,884 | 100.0% |
Ancestry in Alpharetta
The most populous ancestries reported in Alpharetta are Thai (9,622 | 14.6%), English (7,576 | 11.5%), German (6,276 | 9.5%), Irish (5,530 | 8.4%), and American (3,567 | 5.4%), together accounting for 49.4% of all Alpharetta residents.
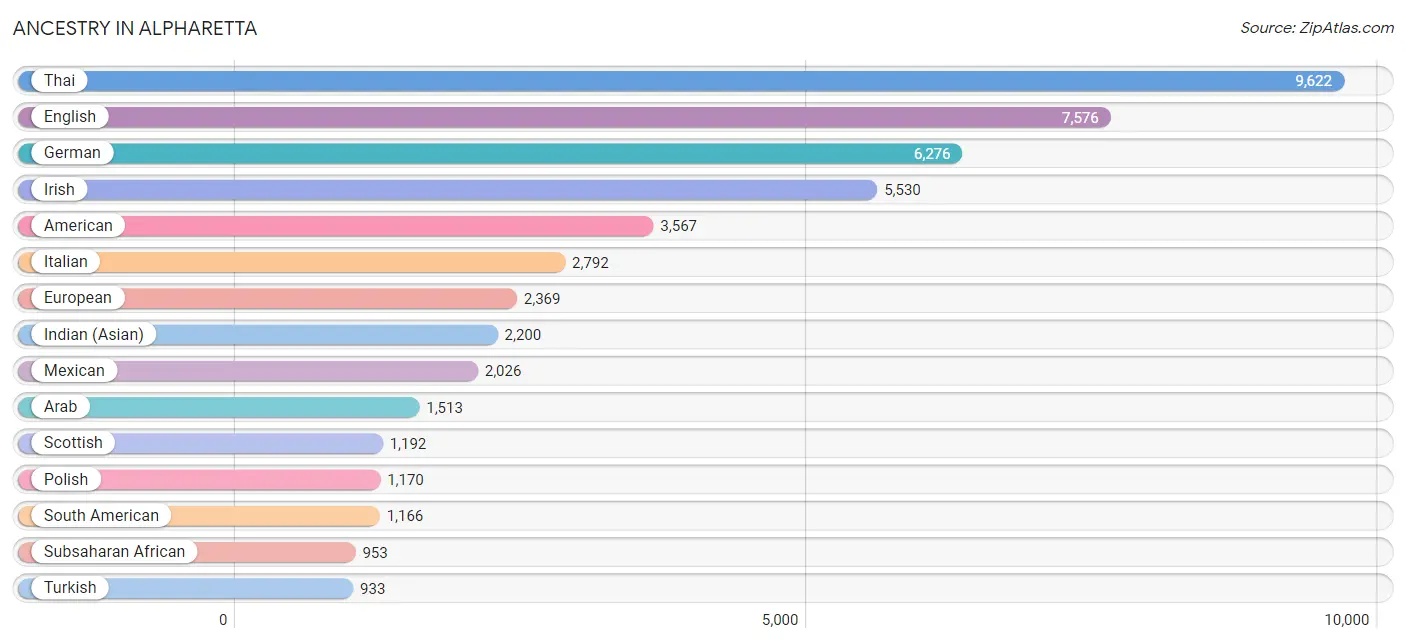
| Ancestry | # Population | % Population |
| African | 565 | 0.9% |
| American | 3,567 | 5.4% |
| Arab | 1,513 | 2.3% |
| Argentinean | 336 | 0.5% |
| Armenian | 55 | 0.1% |
| Austrian | 50 | 0.1% |
| Belgian | 29 | 0.0% |
| Belizean | 6 | 0.0% |
| Bermudan | 31 | 0.1% |
| Bhutanese | 260 | 0.4% |
| Bolivian | 16 | 0.0% |
| Brazilian | 237 | 0.4% |
| British | 390 | 0.6% |
| Bulgarian | 43 | 0.1% |
| Burmese | 890 | 1.3% |
| Canadian | 140 | 0.2% |
| Celtic | 66 | 0.1% |
| Central American | 393 | 0.6% |
| Cherokee | 151 | 0.2% |
| Chilean | 28 | 0.0% |
| Colombian | 346 | 0.5% |
| Costa Rican | 11 | 0.0% |
| Creek | 6 | 0.0% |
| Croatian | 33 | 0.1% |
| Cuban | 515 | 0.8% |
| Czech | 112 | 0.2% |
| Czechoslovakian | 73 | 0.1% |
| Danish | 145 | 0.2% |
| Dominican | 97 | 0.2% |
| Dutch | 414 | 0.6% |
| Eastern European | 521 | 0.8% |
| Ecuadorian | 7 | 0.0% |
| Egyptian | 541 | 0.8% |
| English | 7,576 | 11.5% |
| Estonian | 12 | 0.0% |
| European | 2,369 | 3.6% |
| Filipino | 391 | 0.6% |
| Finnish | 54 | 0.1% |
| French | 801 | 1.2% |
| French Canadian | 219 | 0.3% |
| German | 6,276 | 9.5% |
| Ghanaian | 107 | 0.2% |
| Greek | 273 | 0.4% |
| Guamanian / Chamorro | 7 | 0.0% |
| Haitian | 48 | 0.1% |
| Honduran | 259 | 0.4% |
| Hungarian | 208 | 0.3% |
| Indian (Asian) | 2,200 | 3.3% |
| Iranian | 545 | 0.8% |
| Iraqi | 24 | 0.0% |
| Irish | 5,530 | 8.4% |
| Israeli | 377 | 0.6% |
| Italian | 2,792 | 4.2% |
| Jamaican | 30 | 0.1% |
| Jordanian | 10 | 0.0% |
| Kenyan | 34 | 0.1% |
| Korean | 577 | 0.9% |
| Laotian | 74 | 0.1% |
| Latvian | 12 | 0.0% |
| Lebanese | 56 | 0.1% |
| Lithuanian | 82 | 0.1% |
| Mexican | 2,026 | 3.1% |
| Mexican American Indian | 145 | 0.2% |
| Mongolian | 32 | 0.1% |
| Native Hawaiian | 34 | 0.1% |
| Nicaraguan | 17 | 0.0% |
| Nigerian | 61 | 0.1% |
| Northern European | 208 | 0.3% |
| Norwegian | 447 | 0.7% |
| Okinawan | 55 | 0.1% |
| Pakistani | 49 | 0.1% |
| Panamanian | 66 | 0.1% |
| Peruvian | 175 | 0.3% |
| Polish | 1,170 | 1.8% |
| Portuguese | 113 | 0.2% |
| Puerto Rican | 515 | 0.8% |
| Romanian | 237 | 0.4% |
| Russian | 585 | 0.9% |
| Salvadoran | 40 | 0.1% |
| Samoan | 30 | 0.1% |
| Scandinavian | 50 | 0.1% |
| Scotch-Irish | 922 | 1.4% |
| Scottish | 1,192 | 1.8% |
| Serbian | 13 | 0.0% |
| Sierra Leonean | 24 | 0.0% |
| Sioux | 1 | 0.0% |
| Slavic | 26 | 0.0% |
| Slovak | 103 | 0.2% |
| South African | 63 | 0.1% |
| South American | 1,166 | 1.8% |
| South American Indian | 18 | 0.0% |
| Spaniard | 193 | 0.3% |
| Spanish | 33 | 0.1% |
| Sri Lankan | 370 | 0.6% |
| Subsaharan African | 953 | 1.5% |
| Swedish | 367 | 0.6% |
| Swiss | 52 | 0.1% |
| Syrian | 308 | 0.5% |
| Thai | 9,622 | 14.6% |
| Trinidadian and Tobagonian | 21 | 0.0% |
| Turkish | 933 | 1.4% |
| Ugandan | 27 | 0.0% |
| Ukrainian | 331 | 0.5% |
| Uruguayan | 24 | 0.0% |
| Venezuelan | 219 | 0.3% |
| Welsh | 404 | 0.6% |
| West Indian | 15 | 0.0% |
| Yugoslavian | 42 | 0.1% | View All 108 Rows |
Immigrants in Alpharetta
The most numerous immigrant groups reported in Alpharetta came from Asia (12,468 | 18.9%), South Central Asia (7,729 | 11.7%), India (6,809 | 10.3%), Latin America (2,865 | 4.3%), and Eastern Asia (2,517 | 3.8%), together accounting for 49.1% of all Alpharetta residents.
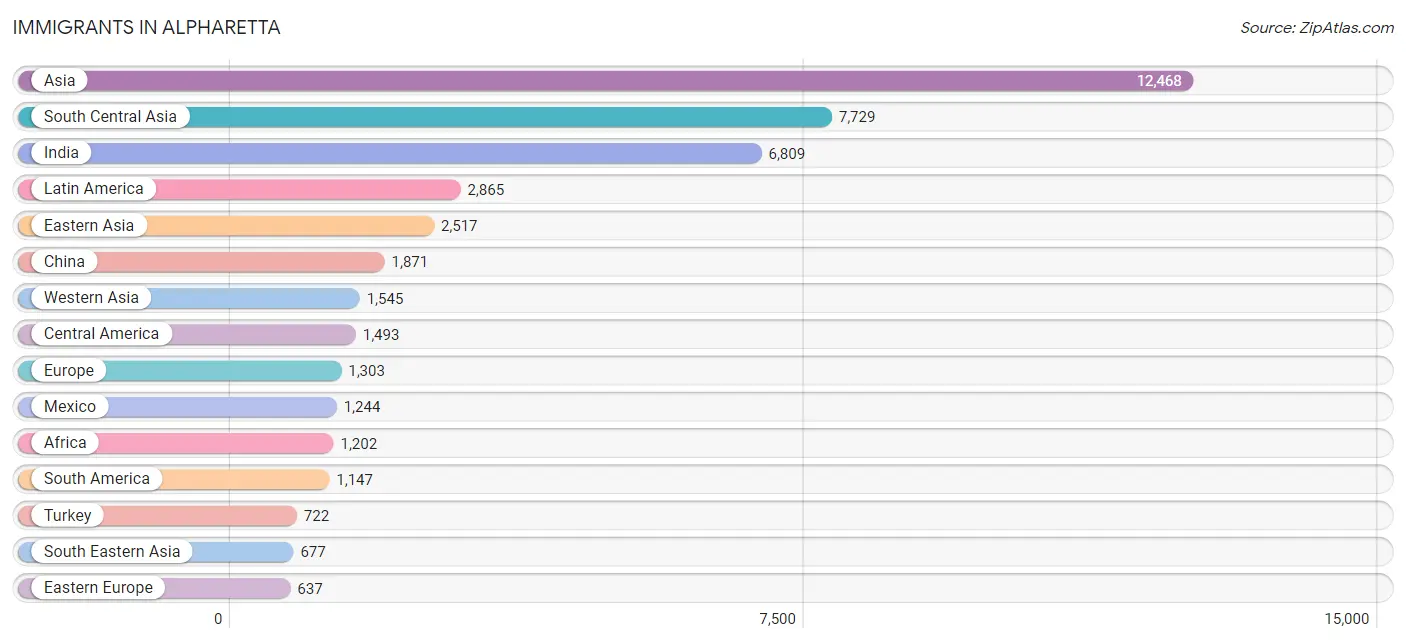
| Immigration Origin | # Population | % Population |
| Africa | 1,202 | 1.8% |
| Argentina | 228 | 0.4% |
| Asia | 12,468 | 18.9% |
| Australia | 58 | 0.1% |
| Bangladesh | 136 | 0.2% |
| Belarus | 28 | 0.0% |
| Brazil | 302 | 0.5% |
| Bulgaria | 25 | 0.0% |
| Cameroon | 1 | 0.0% |
| Canada | 443 | 0.7% |
| Caribbean | 225 | 0.3% |
| Central America | 1,493 | 2.3% |
| Chile | 49 | 0.1% |
| China | 1,871 | 2.8% |
| Colombia | 236 | 0.4% |
| Costa Rica | 11 | 0.0% |
| Cuba | 87 | 0.1% |
| Czechoslovakia | 52 | 0.1% |
| Dominica | 13 | 0.0% |
| Dominican Republic | 38 | 0.1% |
| Eastern Africa | 87 | 0.1% |
| Eastern Asia | 2,517 | 3.8% |
| Eastern Europe | 637 | 1.0% |
| Ecuador | 7 | 0.0% |
| Egypt | 285 | 0.4% |
| El Salvador | 60 | 0.1% |
| England | 23 | 0.0% |
| Europe | 1,303 | 2.0% |
| France | 8 | 0.0% |
| Germany | 267 | 0.4% |
| Ghana | 82 | 0.1% |
| Greece | 49 | 0.1% |
| Guyana | 20 | 0.0% |
| Haiti | 47 | 0.1% |
| Honduras | 155 | 0.2% |
| Hong Kong | 102 | 0.2% |
| Hungary | 9 | 0.0% |
| India | 6,809 | 10.3% |
| Indonesia | 43 | 0.1% |
| Iran | 229 | 0.4% |
| Ireland | 23 | 0.0% |
| Israel | 514 | 0.8% |
| Italy | 3 | 0.0% |
| Jamaica | 12 | 0.0% |
| Japan | 64 | 0.1% |
| Jordan | 10 | 0.0% |
| Kazakhstan | 10 | 0.0% |
| Kenya | 34 | 0.1% |
| Korea | 582 | 0.9% |
| Kuwait | 13 | 0.0% |
| Laos | 56 | 0.1% |
| Latin America | 2,865 | 4.3% |
| Mexico | 1,244 | 1.9% |
| Middle Africa | 1 | 0.0% |
| Morocco | 8 | 0.0% |
| Netherlands | 33 | 0.1% |
| Nicaragua | 10 | 0.0% |
| Nigeria | 122 | 0.2% |
| Northern Africa | 373 | 0.6% |
| Northern Europe | 264 | 0.4% |
| Oceania | 58 | 0.1% |
| Pakistan | 478 | 0.7% |
| Panama | 13 | 0.0% |
| Peru | 66 | 0.1% |
| Philippines | 285 | 0.4% |
| Poland | 78 | 0.1% |
| Romania | 121 | 0.2% |
| Russia | 38 | 0.1% |
| Scotland | 30 | 0.1% |
| Serbia | 13 | 0.0% |
| Sierra Leone | 30 | 0.1% |
| Singapore | 66 | 0.1% |
| South Africa | 355 | 0.5% |
| South America | 1,147 | 1.7% |
| South Central Asia | 7,729 | 11.7% |
| South Eastern Asia | 677 | 1.0% |
| Southern Europe | 91 | 0.1% |
| Spain | 39 | 0.1% |
| Sri Lanka | 67 | 0.1% |
| Sweden | 8 | 0.0% |
| Switzerland | 3 | 0.0% |
| Syria | 169 | 0.3% |
| Taiwan | 304 | 0.5% |
| Thailand | 12 | 0.0% |
| Trinidad and Tobago | 28 | 0.0% |
| Turkey | 722 | 1.1% |
| Uganda | 27 | 0.0% |
| Ukraine | 248 | 0.4% |
| Uruguay | 43 | 0.1% |
| Venezuela | 184 | 0.3% |
| Vietnam | 215 | 0.3% |
| Western Africa | 386 | 0.6% |
| Western Asia | 1,545 | 2.4% |
| Western Europe | 311 | 0.5% |
| Zimbabwe | 10 | 0.0% | View All 95 Rows |
Sex and Age in Alpharetta
Sex and Age in Alpharetta
The most populous age groups in Alpharetta are 50 to 54 Years (3,106 | 9.3%) for men and 50 to 54 Years (3,003 | 9.2%) for women.
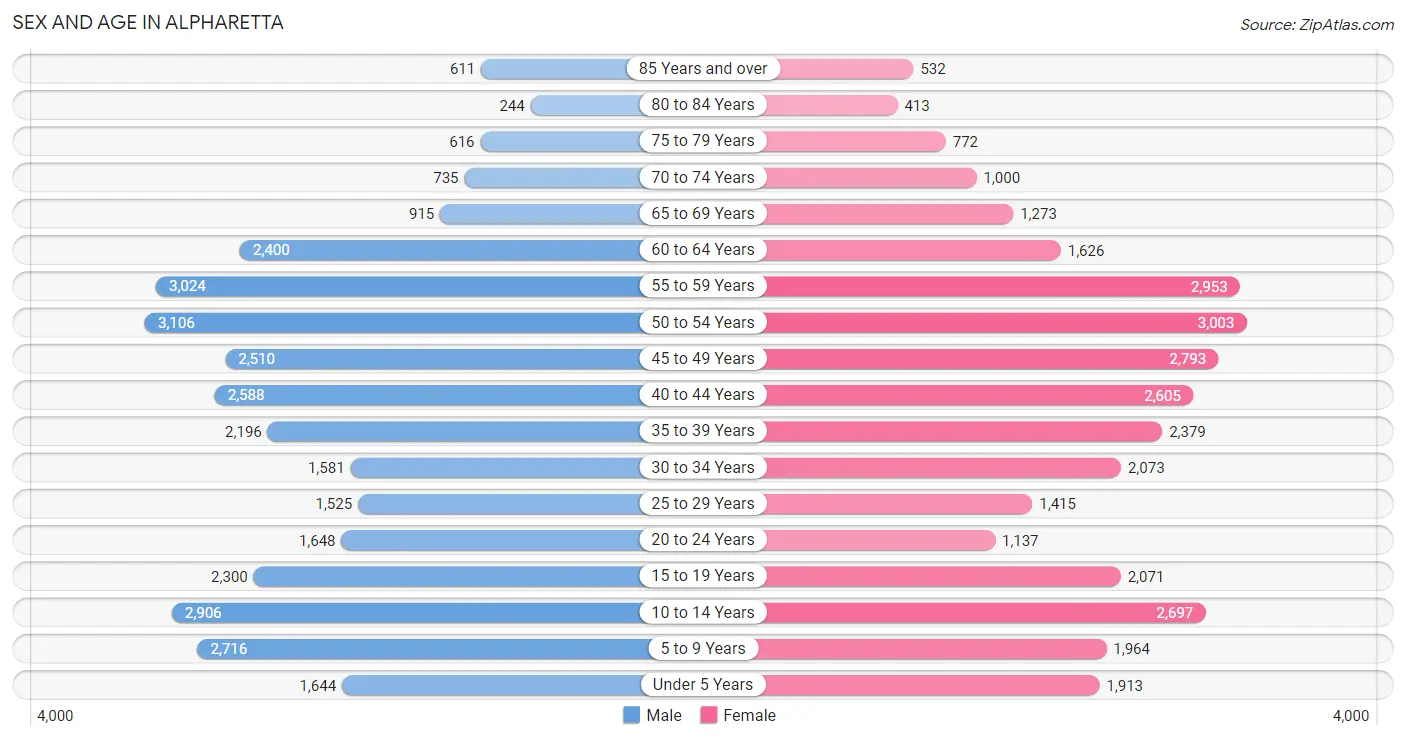
| Age Bracket | Male | Female |
| Under 5 Years | 1,644 (4.9%) | 1,913 (5.9%) |
| 5 to 9 Years | 2,716 (8.2%) | 1,964 (6.0%) |
| 10 to 14 Years | 2,906 (8.7%) | 2,697 (8.3%) |
| 15 to 19 Years | 2,300 (6.9%) | 2,071 (6.4%) |
| 20 to 24 Years | 1,648 (5.0%) | 1,137 (3.5%) |
| 25 to 29 Years | 1,525 (4.6%) | 1,415 (4.3%) |
| 30 to 34 Years | 1,581 (4.8%) | 2,073 (6.4%) |
| 35 to 39 Years | 2,196 (6.6%) | 2,379 (7.3%) |
| 40 to 44 Years | 2,588 (7.8%) | 2,605 (8.0%) |
| 45 to 49 Years | 2,510 (7.5%) | 2,793 (8.6%) |
| 50 to 54 Years | 3,106 (9.3%) | 3,003 (9.2%) |
| 55 to 59 Years | 3,024 (9.1%) | 2,953 (9.0%) |
| 60 to 64 Years | 2,400 (7.2%) | 1,626 (5.0%) |
| 65 to 69 Years | 915 (2.8%) | 1,273 (3.9%) |
| 70 to 74 Years | 735 (2.2%) | 1,000 (3.1%) |
| 75 to 79 Years | 616 (1.8%) | 772 (2.4%) |
| 80 to 84 Years | 244 (0.7%) | 413 (1.3%) |
| 85 Years and over | 611 (1.8%) | 532 (1.6%) |
| Total | 33,265 (100.0%) | 32,619 (100.0%) |
Families and Households in Alpharetta
Median Family Size in Alpharetta
The median family size in Alpharetta is 3.17 persons per family, with single female/mother families (1,859 | 10.3%) accounting for the largest median family size of 3.2 persons per family. On the other hand, single male/father families (646 | 3.6%) represent the smallest median family size with 2.73 persons per family.
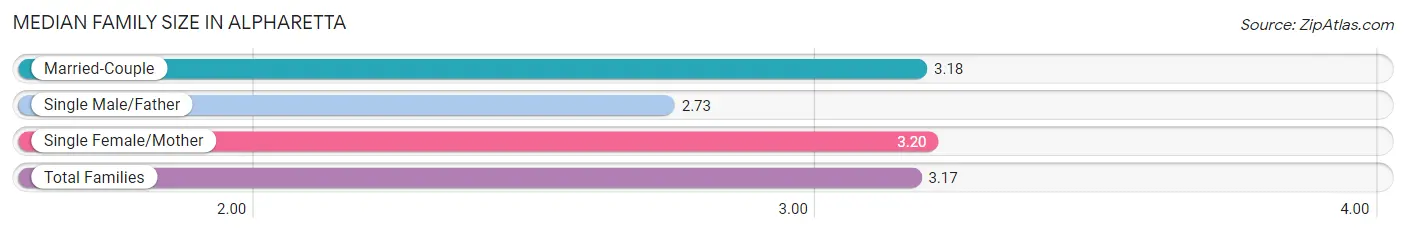
| Family Type | # Families | Family Size |
| Married-Couple | 15,523 (86.1%) | 3.18 |
| Single Male/Father | 646 (3.6%) | 2.73 |
| Single Female/Mother | 1,859 (10.3%) | 3.20 |
| Total Families | 18,028 (100.0%) | 3.17 |
Median Household Size in Alpharetta
The median household size in Alpharetta is 2.72 persons per household, with single female/mother households (1,859 | 7.7%) accounting for the largest median household size of 3.4 persons per household. non-family households (6,065 | 25.2%) represent the smallest median household size with 1.24 persons per household.
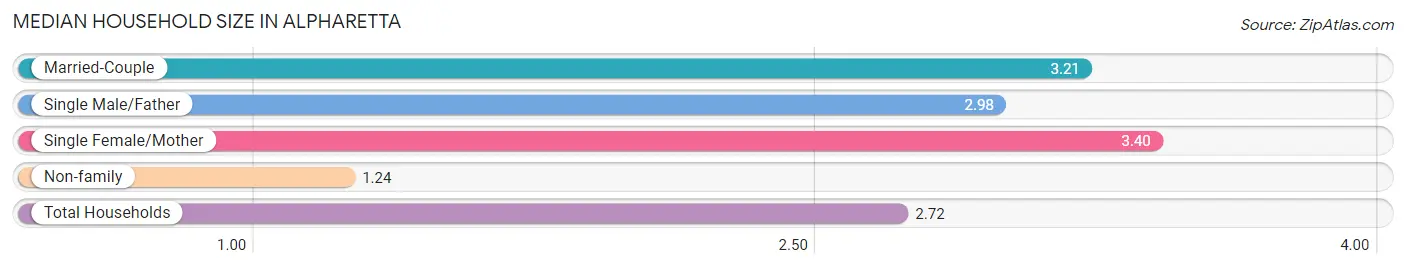
| Household Type | # Households | Household Size |
| Married-Couple | 15,523 (64.4%) | 3.21 |
| Single Male/Father | 646 (2.7%) | 2.98 |
| Single Female/Mother | 1,859 (7.7%) | 3.40 |
| Non-family | 6,065 (25.2%) | 1.24 |
| Total Households | 24,093 (100.0%) | 2.72 |
Household Size by Marriage Status in Alpharetta
Out of a total of 24,093 households in Alpharetta, 18,028 (74.8%) are family households, while 6,065 (25.2%) are nonfamily households. The most numerous type of family households are 2-person households, comprising 6,407, and the most common type of nonfamily households are 1-person households, comprising 4,809.
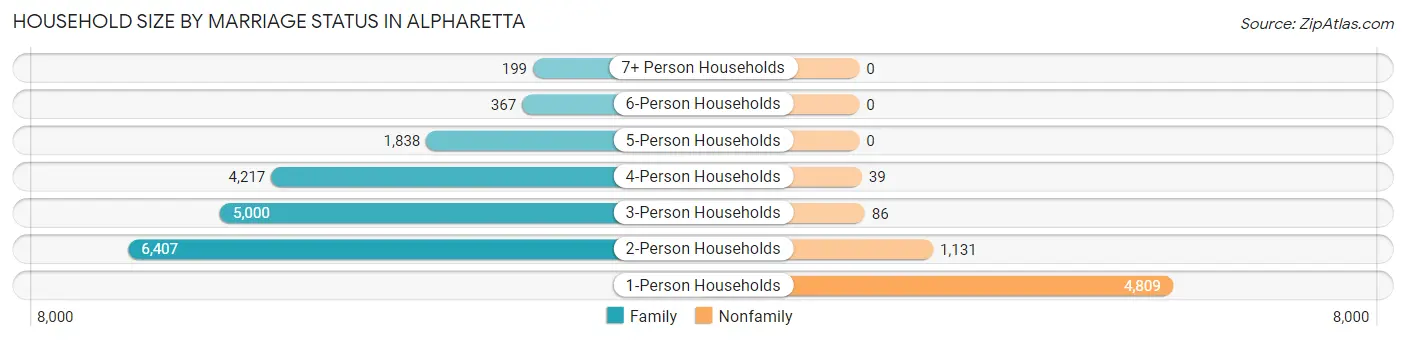
| Household Size | Family Households | Nonfamily Households |
| 1-Person Households | - | 4,809 (20.0%) |
| 2-Person Households | 6,407 (26.6%) | 1,131 (4.7%) |
| 3-Person Households | 5,000 (20.7%) | 86 (0.4%) |
| 4-Person Households | 4,217 (17.5%) | 39 (0.2%) |
| 5-Person Households | 1,838 (7.6%) | 0 (0.0%) |
| 6-Person Households | 367 (1.5%) | 0 (0.0%) |
| 7+ Person Households | 199 (0.8%) | 0 (0.0%) |
| Total | 18,028 (74.8%) | 6,065 (25.2%) |
Female Fertility in Alpharetta
Fertility by Age in Alpharetta
Average fertility rate in Alpharetta is 40.0 births per 1,000 women. Women in the age bracket of 20 to 34 years have the highest fertility rate with 68.0 births per 1,000 women. Women in the age bracket of 20 to 34 years acount for 52.4% of all women with births.
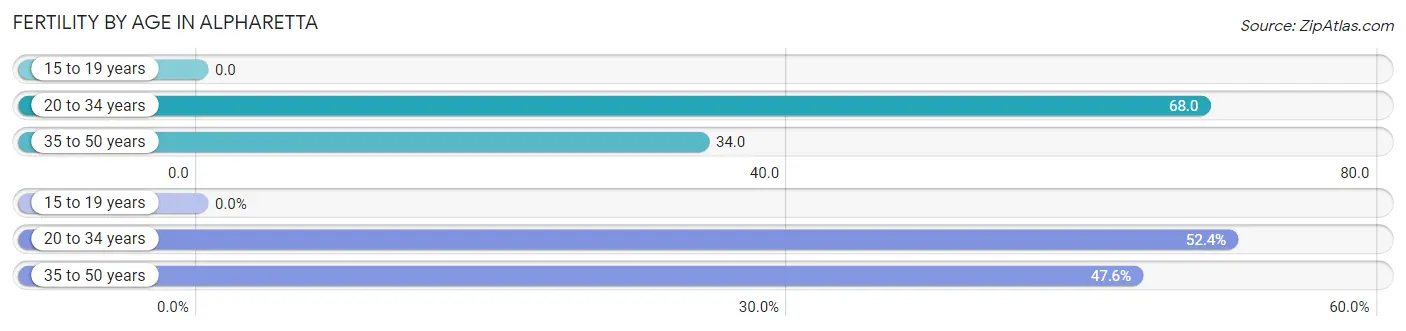
| Age Bracket | Women with Births | Births / 1,000 Women |
| 15 to 19 years | 0 (0.0%) | 0.0 |
| 20 to 34 years | 314 (52.4%) | 68.0 |
| 35 to 50 years | 285 (47.6%) | 34.0 |
| Total | 599 (100.0%) | 40.0 |
Fertility by Age by Marriage Status in Alpharetta
96.7% of women with births (599) in Alpharetta are married. The highest percentage of unmarried women with births falls into 20 to 34 years age bracket with 6.4% of them unmarried at the time of birth, while the lowest percentage of unmarried women with births belong to 35 to 50 years age bracket with 0.0% of them unmarried.
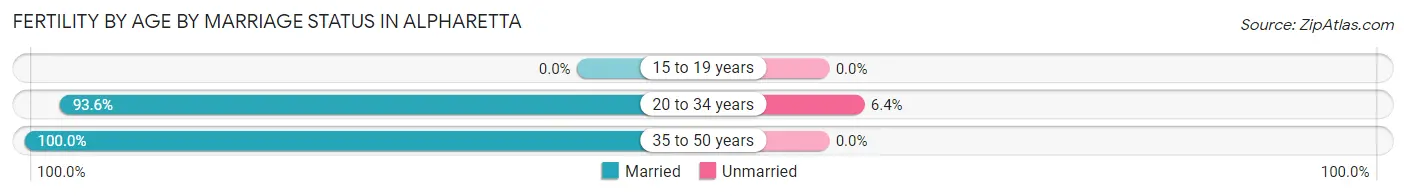
| Age Bracket | Married | Unmarried |
| 15 to 19 years | 0 (0.0%) | 0 (0.0%) |
| 20 to 34 years | 294 (93.6%) | 20 (6.4%) |
| 35 to 50 years | 285 (100.0%) | 0 (0.0%) |
| Total | 579 (96.7%) | 20 (3.3%) |
Fertility by Education in Alpharetta
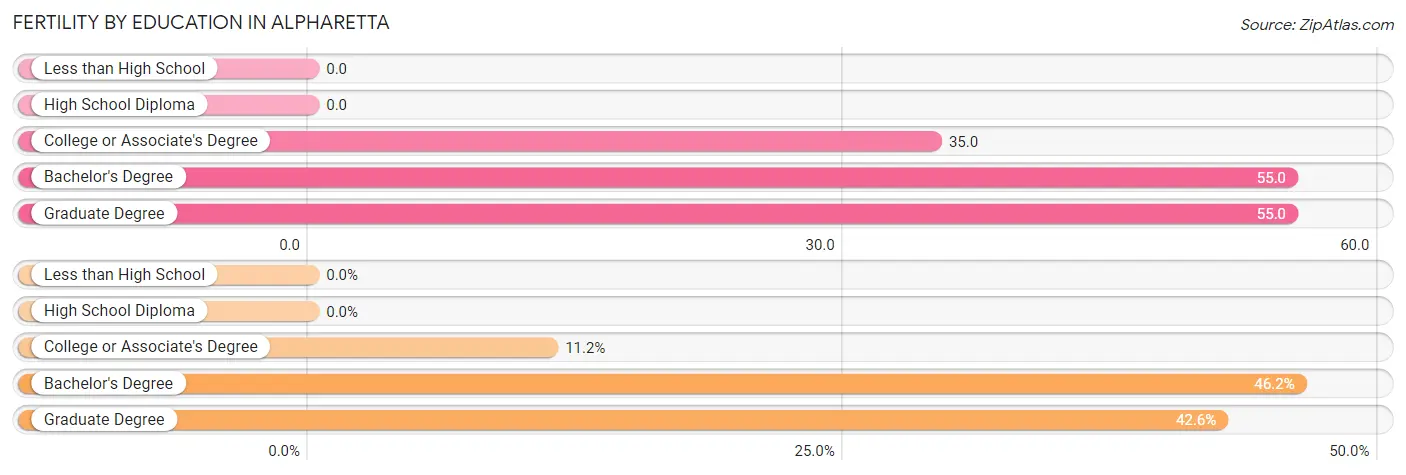
| Educational Attainment | Women with Births | Births / 1,000 Women |
| Less than High School | 0 (0.0%) | 0.0 |
| High School Diploma | 0 (0.0%) | 0.0 |
| College or Associate's Degree | 67 (11.2%) | 35.0 |
| Bachelor's Degree | 277 (46.2%) | 55.0 |
| Graduate Degree | 255 (42.6%) | 55.0 |
| Total | 599 (100.0%) | 40.0 |
Fertility by Education by Marriage Status in Alpharetta
3.3% of women with births in Alpharetta are unmarried. Women with the educational attainment of graduate degree are most likely to be married with 100.0% of them married at childbirth, while women with the educational attainment of college or associate's degree are least likely to be married with 19.4% of them unmarried at childbirth.
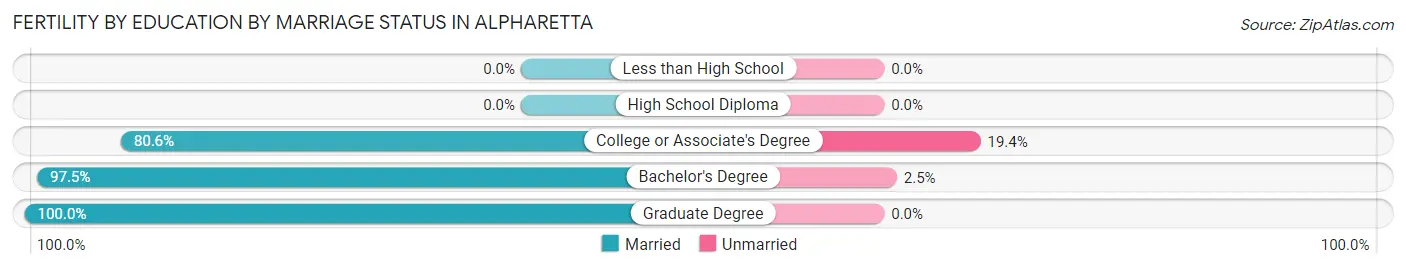
| Educational Attainment | Married | Unmarried |
| Less than High School | 0 (0.0%) | 0 (0.0%) |
| High School Diploma | 0 (0.0%) | 0 (0.0%) |
| College or Associate's Degree | 54 (80.6%) | 13 (19.4%) |
| Bachelor's Degree | 270 (97.5%) | 7 (2.5%) |
| Graduate Degree | 255 (100.0%) | 0 (0.0%) |
| Total | 579 (96.7%) | 20 (3.3%) |
Employment Characteristics in Alpharetta
Employment by Class of Employer in Alpharetta
Among the 34,120 employed individuals in Alpharetta, private company employees (25,812 | 75.6%), not-for-profit organizations (2,348 | 6.9%), and self-employed (incorporated) (2,183 | 6.4%) make up the most common classes of employment.
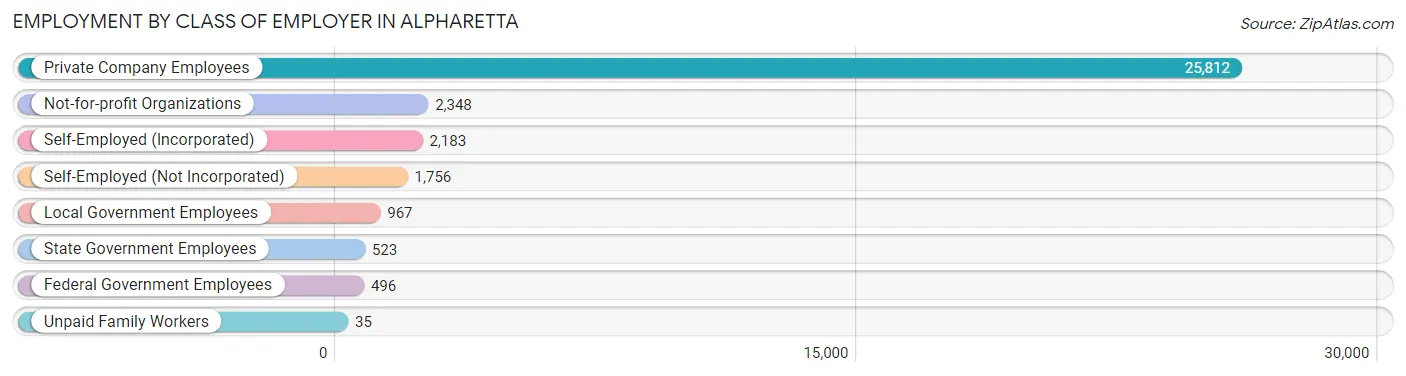
| Employer Class | # Employees | % Employees |
| Private Company Employees | 25,812 | 75.6% |
| Self-Employed (Incorporated) | 2,183 | 6.4% |
| Self-Employed (Not Incorporated) | 1,756 | 5.1% |
| Not-for-profit Organizations | 2,348 | 6.9% |
| Local Government Employees | 967 | 2.8% |
| State Government Employees | 523 | 1.5% |
| Federal Government Employees | 496 | 1.5% |
| Unpaid Family Workers | 35 | 0.1% |
| Total | 34,120 | 100.0% |
Employment Status by Age in Alpharetta
According to the labor force statistics for Alpharetta, out of the total population over 16 years of age (51,057), 71.1% or 36,302 individuals are in the labor force, with 4.8% or 1,742 of them unemployed. The age group with the highest labor force participation rate is 45 to 54 years, with 88.3% or 10,077 individuals in the labor force. Within the labor force, the 20 to 24 years age range has the highest percentage of unemployed individuals, with 18.6% or 424 of them being unemployed.
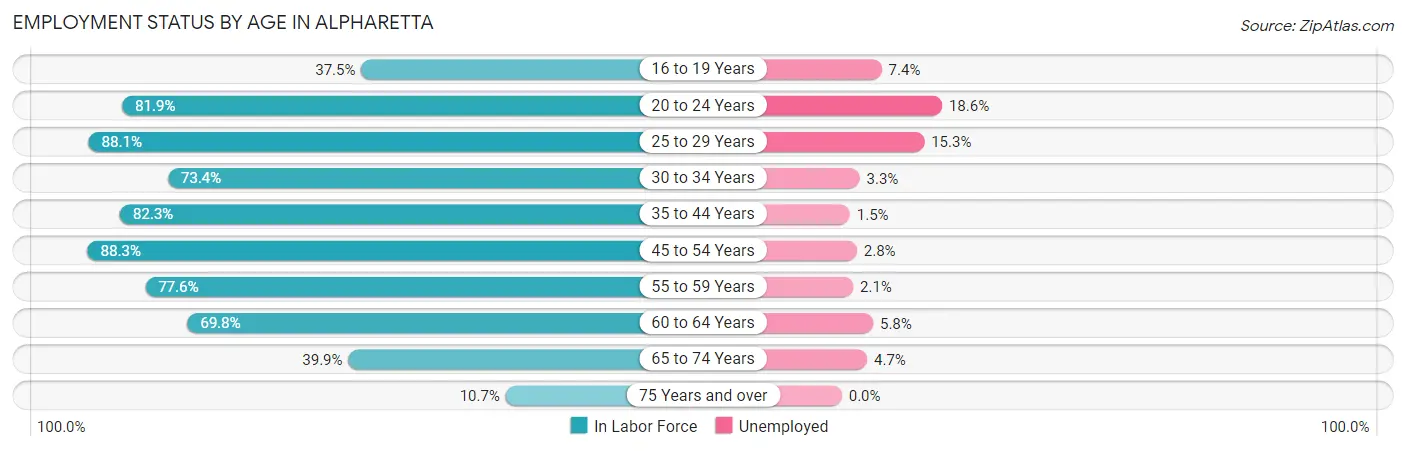
| Age Bracket | In Labor Force | Unemployed |
| 16 to 19 Years | 1,269 (37.5%) | 94 (7.4%) |
| 20 to 24 Years | 2,281 (81.9%) | 424 (18.6%) |
| 25 to 29 Years | 2,590 (88.1%) | 396 (15.3%) |
| 30 to 34 Years | 2,682 (73.4%) | 89 (3.3%) |
| 35 to 44 Years | 8,039 (82.3%) | 121 (1.5%) |
| 45 to 54 Years | 10,077 (88.3%) | 282 (2.8%) |
| 55 to 59 Years | 4,638 (77.6%) | 97 (2.1%) |
| 60 to 64 Years | 2,810 (69.8%) | 163 (5.8%) |
| 65 to 74 Years | 1,565 (39.9%) | 74 (4.7%) |
| 75 Years and over | 341 (10.7%) | 0 (0.0%) |
| Total | 36,302 (71.1%) | 1,742 (4.8%) |
Employment Status by Educational Attainment in Alpharetta
According to labor force statistics for Alpharetta, 81.7% of individuals (30,864) out of the total population between 25 and 64 years of age (37,777) are in the labor force, with 3.7% or 1,142 of them being unemployed. The group with the highest labor force participation rate are those with the educational attainment of bachelor's degree or higher, with 83.7% or 23,843 individuals in the labor force. Within the labor force, individuals with less than high school education have the highest percentage of unemployment, with 19.4% or 146 of them being unemployed.
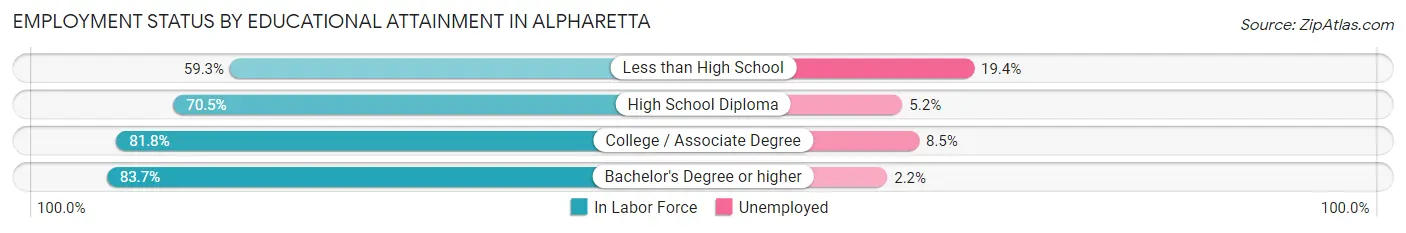
| Educational Attainment | In Labor Force | Unemployed |
| Less than High School | 753 (59.3%) | 246 (19.4%) |
| High School Diploma | 1,845 (70.5%) | 136 (5.2%) |
| College / Associate Degree | 4,421 (81.8%) | 459 (8.5%) |
| Bachelor's Degree or higher | 23,843 (83.7%) | 627 (2.2%) |
| Total | 30,864 (81.7%) | 1,398 (3.7%) |
Employment Occupations by Sex in Alpharetta
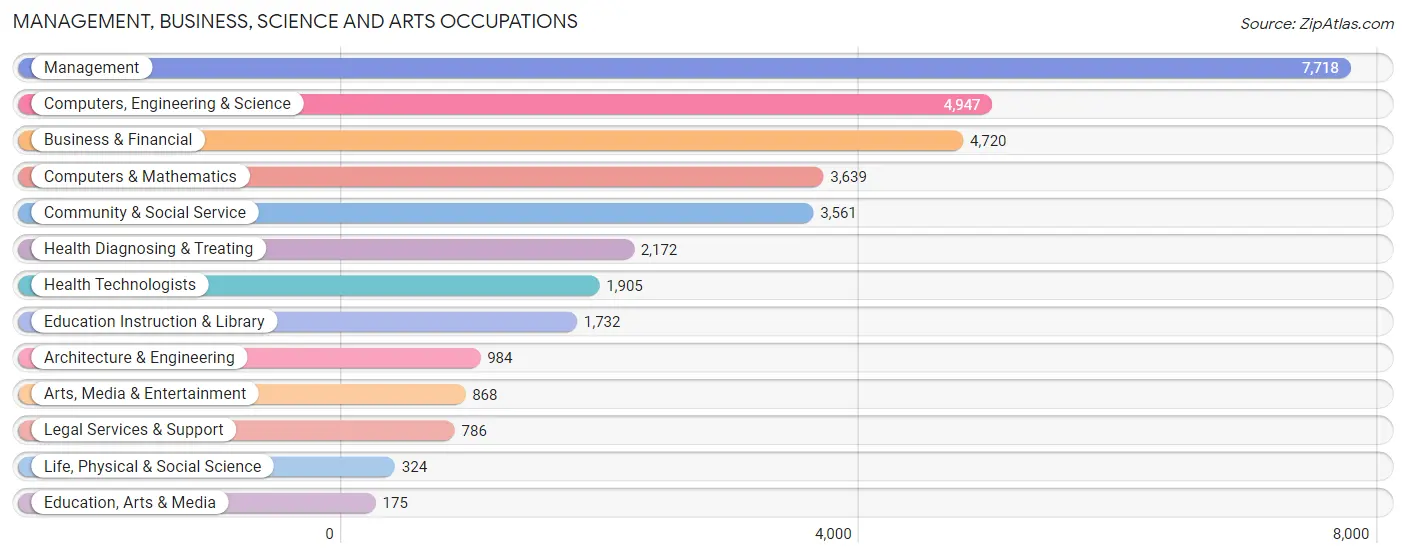
Management, Business, Science and Arts Occupations
The most common Management, Business, Science and Arts occupations in Alpharetta are Management (7,718 | 22.4%), Computers, Engineering & Science (4,947 | 14.4%), Business & Financial (4,720 | 13.7%), Computers & Mathematics (3,639 | 10.6%), and Community & Social Service (3,561 | 10.3%).
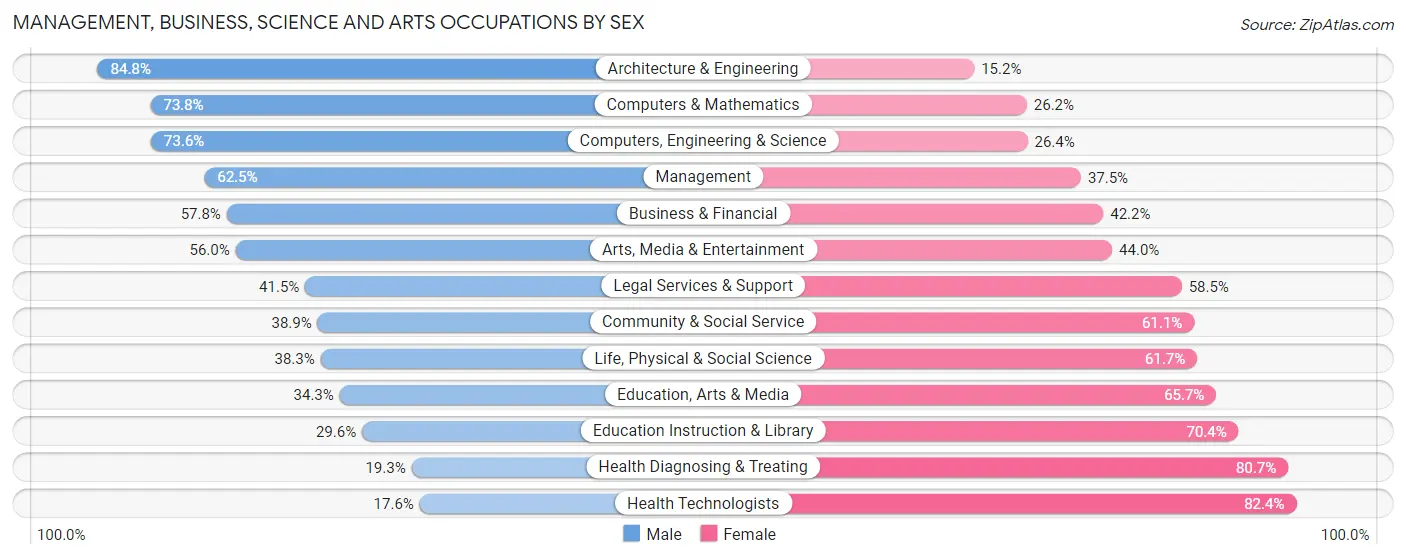
Management, Business, Science and Arts Occupations by Sex
Within the Management, Business, Science and Arts occupations in Alpharetta, the most male-oriented occupations are Architecture & Engineering (84.8%), Computers & Mathematics (73.8%), and Computers, Engineering & Science (73.6%), while the most female-oriented occupations are Health Technologists (82.4%), Health Diagnosing & Treating (80.7%), and Education Instruction & Library (70.4%).
| Occupation | Male | Female |
| Management | 4,824 (62.5%) | 2,894 (37.5%) |
| Business & Financial | 2,730 (57.8%) | 1,990 (42.2%) |
| Computers, Engineering & Science | 3,643 (73.6%) | 1,304 (26.4%) |
| Computers & Mathematics | 2,685 (73.8%) | 954 (26.2%) |
| Architecture & Engineering | 834 (84.8%) | 150 (15.2%) |
| Life, Physical & Social Science | 124 (38.3%) | 200 (61.7%) |
| Community & Social Service | 1,385 (38.9%) | 2,176 (61.1%) |
| Education, Arts & Media | 60 (34.3%) | 115 (65.7%) |
| Legal Services & Support | 326 (41.5%) | 460 (58.5%) |
| Education Instruction & Library | 513 (29.6%) | 1,219 (70.4%) |
| Arts, Media & Entertainment | 486 (56.0%) | 382 (44.0%) |
| Health Diagnosing & Treating | 419 (19.3%) | 1,753 (80.7%) |
| Health Technologists | 335 (17.6%) | 1,570 (82.4%) |
| Total (Category) | 13,001 (56.2%) | 10,117 (43.8%) |
| Total (Overall) | 18,926 (54.9%) | 15,532 (45.1%) |
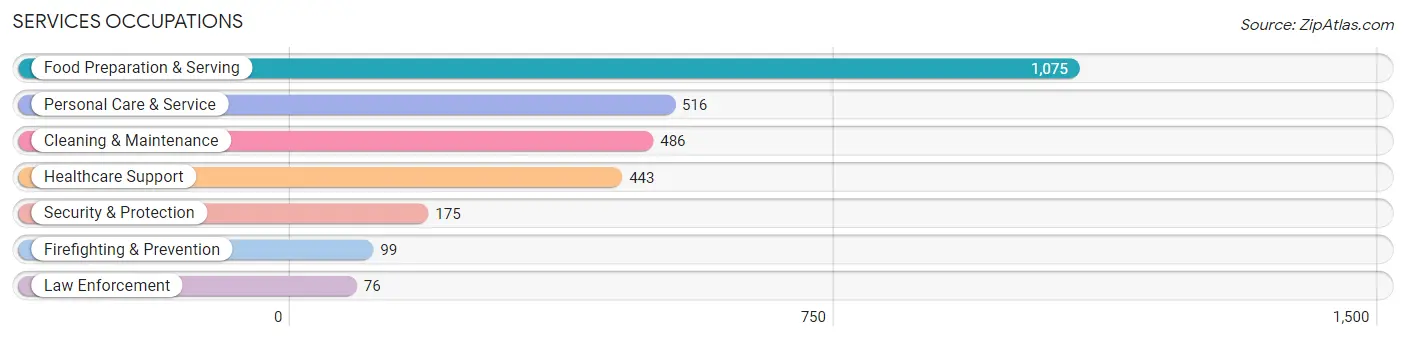
Services Occupations
The most common Services occupations in Alpharetta are Food Preparation & Serving (1,075 | 3.1%), Personal Care & Service (516 | 1.5%), Cleaning & Maintenance (486 | 1.4%), Healthcare Support (443 | 1.3%), and Security & Protection (175 | 0.5%).
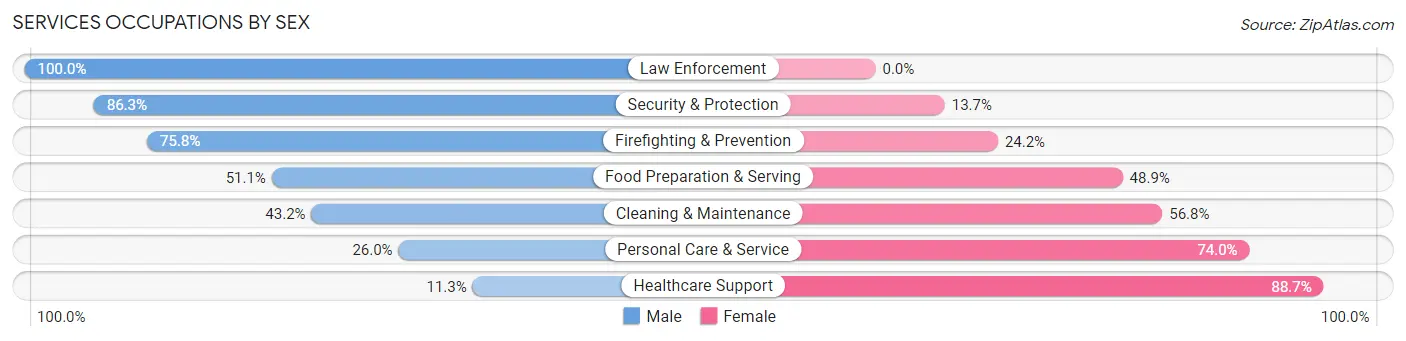
Services Occupations by Sex
Within the Services occupations in Alpharetta, the most male-oriented occupations are Law Enforcement (100.0%), Security & Protection (86.3%), and Firefighting & Prevention (75.8%), while the most female-oriented occupations are Healthcare Support (88.7%), Personal Care & Service (74.0%), and Cleaning & Maintenance (56.8%).
| Occupation | Male | Female |
| Healthcare Support | 50 (11.3%) | 393 (88.7%) |
| Security & Protection | 151 (86.3%) | 24 (13.7%) |
| Firefighting & Prevention | 75 (75.8%) | 24 (24.2%) |
| Law Enforcement | 76 (100.0%) | 0 (0.0%) |
| Food Preparation & Serving | 549 (51.1%) | 526 (48.9%) |
| Cleaning & Maintenance | 210 (43.2%) | 276 (56.8%) |
| Personal Care & Service | 134 (26.0%) | 382 (74.0%) |
| Total (Category) | 1,094 (40.6%) | 1,601 (59.4%) |
| Total (Overall) | 18,926 (54.9%) | 15,532 (45.1%) |
Sales and Office Occupations
The most common Sales and Office occupations in Alpharetta are Sales & Related (3,715 | 10.8%), and Office & Administration (2,869 | 8.3%).
Sales and Office Occupations by Sex
| Occupation | Male | Female |
| Sales & Related | 2,230 (60.0%) | 1,485 (40.0%) |
| Office & Administration | 1,042 (36.3%) | 1,827 (63.7%) |
| Total (Category) | 3,272 (49.7%) | 3,312 (50.3%) |
| Total (Overall) | 18,926 (54.9%) | 15,532 (45.1%) |
Natural Resources, Construction and Maintenance Occupations
The most common Natural Resources, Construction and Maintenance occupations in Alpharetta are Construction & Extraction (568 | 1.7%), Installation, Maintenance & Repair (205 | 0.6%), and Farming, Fishing & Forestry (22 | 0.1%).
Natural Resources, Construction and Maintenance Occupations by Sex
| Occupation | Male | Female |
| Farming, Fishing & Forestry | 22 (100.0%) | 0 (0.0%) |
| Construction & Extraction | 559 (98.4%) | 9 (1.6%) |
| Installation, Maintenance & Repair | 205 (100.0%) | 0 (0.0%) |
| Total (Category) | 786 (98.9%) | 9 (1.1%) |
| Total (Overall) | 18,926 (54.9%) | 15,532 (45.1%) |
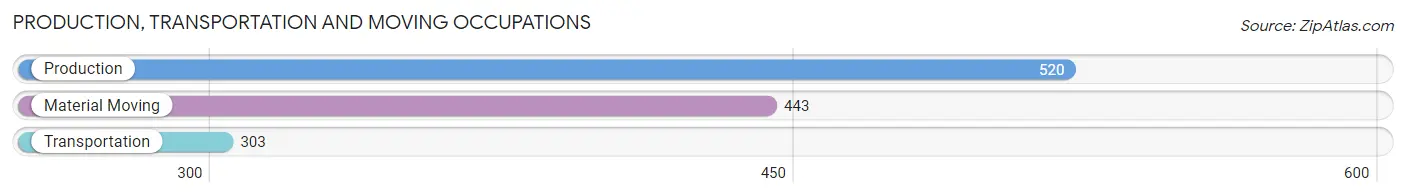
Production, Transportation and Moving Occupations
The most common Production, Transportation and Moving occupations in Alpharetta are Production (520 | 1.5%), Material Moving (443 | 1.3%), and Transportation (303 | 0.9%).
Production, Transportation and Moving Occupations by Sex
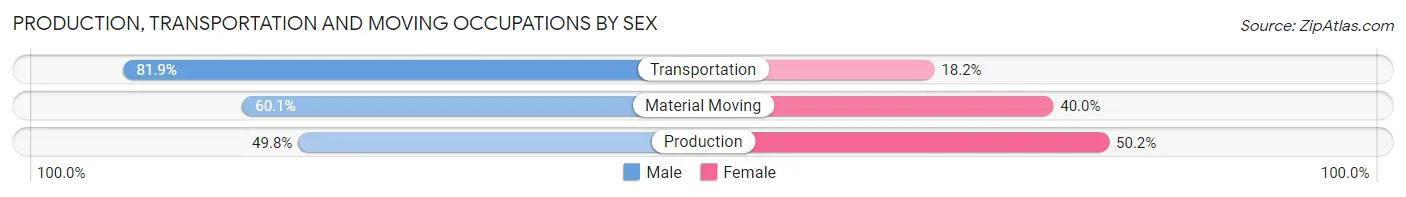
| Occupation | Male | Female |
| Production | 259 (49.8%) | 261 (50.2%) |
| Transportation | 248 (81.9%) | 55 (18.1%) |
| Material Moving | 266 (60.1%) | 177 (40.0%) |
| Total (Category) | 773 (61.1%) | 493 (38.9%) |
| Total (Overall) | 18,926 (54.9%) | 15,532 (45.1%) |
Employment Industries by Sex in Alpharetta
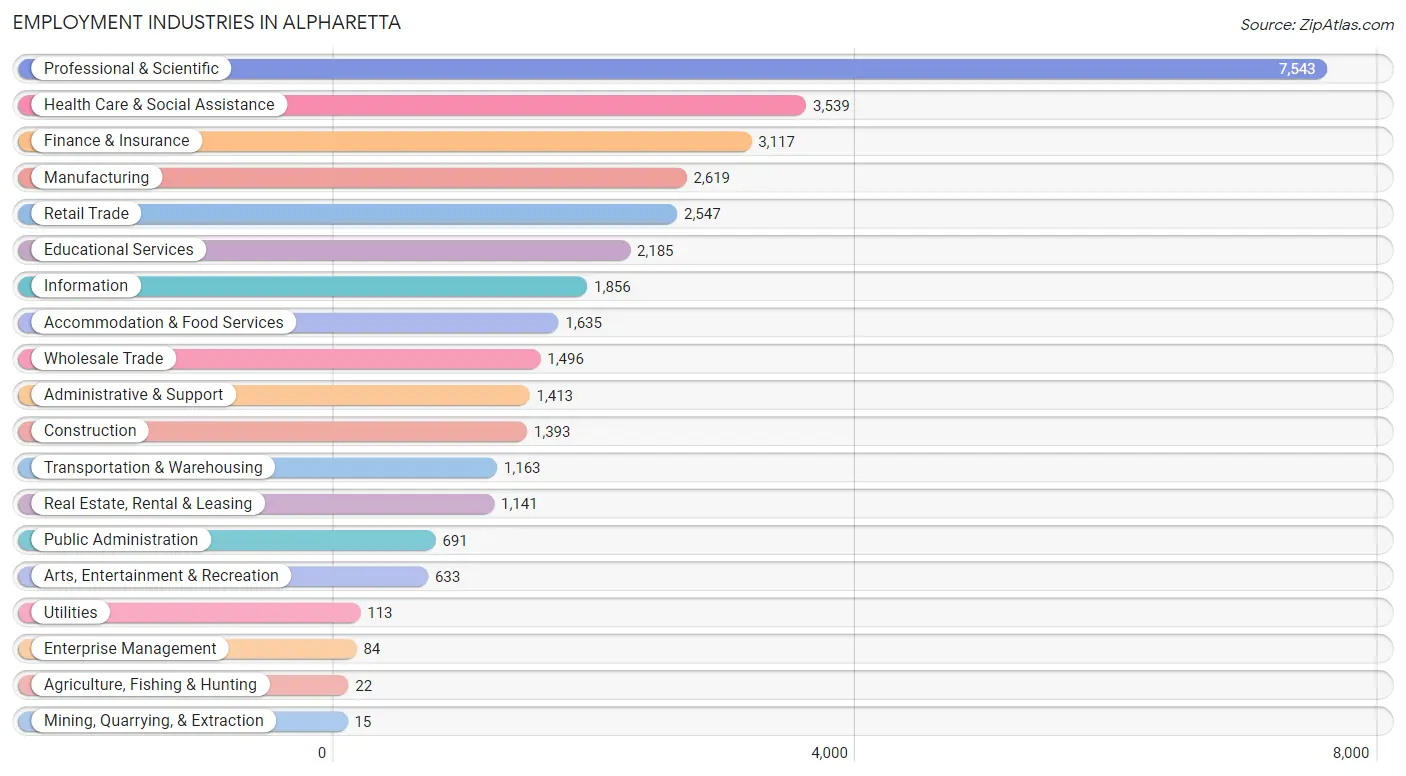
Employment Industries in Alpharetta
The major employment industries in Alpharetta include Professional & Scientific (7,543 | 21.9%), Health Care & Social Assistance (3,539 | 10.3%), Finance & Insurance (3,117 | 9.0%), Manufacturing (2,619 | 7.6%), and Retail Trade (2,547 | 7.4%).
Employment Industries by Sex in Alpharetta
The Alpharetta industries that see more men than women are Agriculture, Fishing & Hunting (100.0%), Mining, Quarrying, & Extraction (100.0%), and Construction (86.2%), whereas the industries that tend to have a higher number of women are Health Care & Social Assistance (81.9%), Educational Services (66.4%), and Accommodation & Food Services (54.3%).
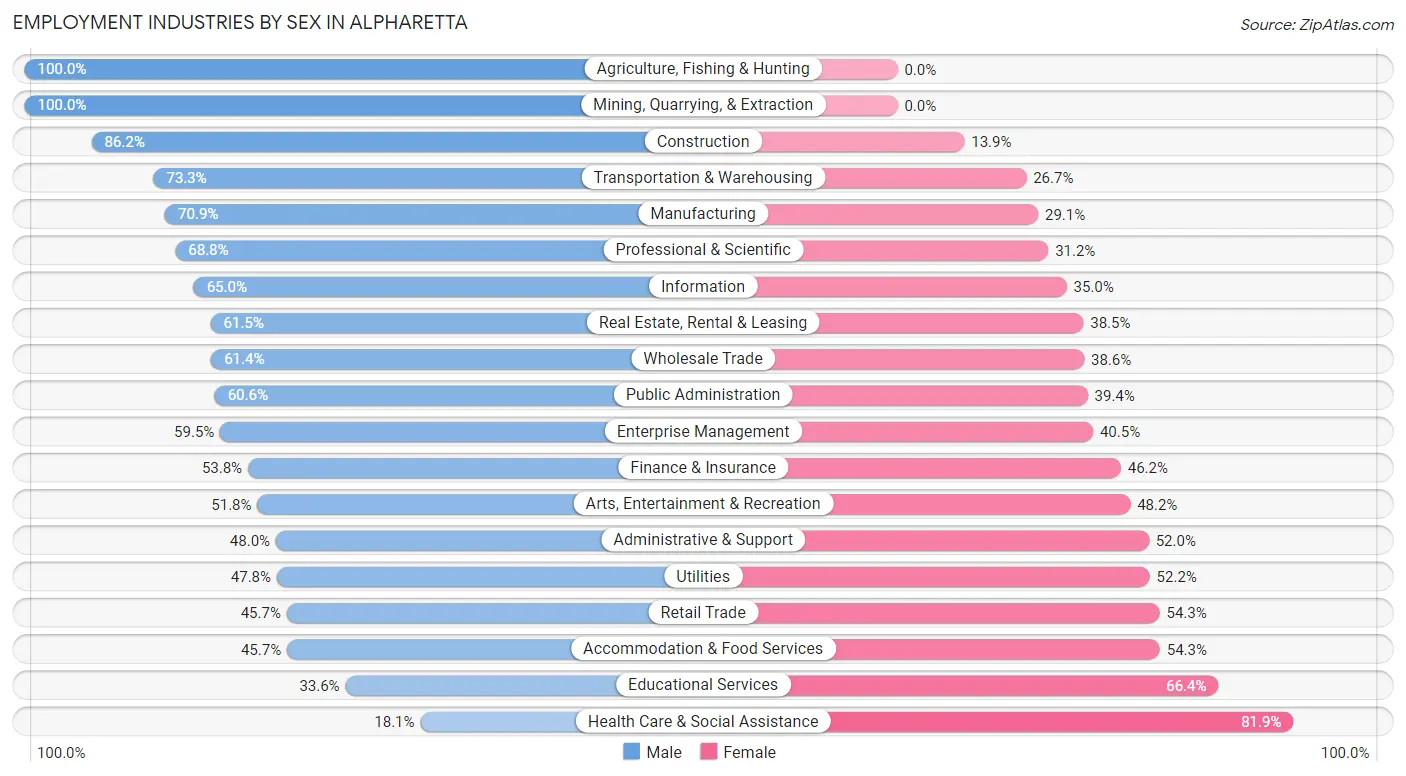
| Industry | Male | Female |
| Agriculture, Fishing & Hunting | 22 (100.0%) | 0 (0.0%) |
| Mining, Quarrying, & Extraction | 15 (100.0%) | 0 (0.0%) |
| Construction | 1,200 (86.2%) | 193 (13.9%) |
| Manufacturing | 1,857 (70.9%) | 762 (29.1%) |
| Wholesale Trade | 918 (61.4%) | 578 (38.6%) |
| Retail Trade | 1,165 (45.7%) | 1,382 (54.3%) |
| Transportation & Warehousing | 853 (73.3%) | 310 (26.7%) |
| Utilities | 54 (47.8%) | 59 (52.2%) |
| Information | 1,206 (65.0%) | 650 (35.0%) |
| Finance & Insurance | 1,676 (53.8%) | 1,441 (46.2%) |
| Real Estate, Rental & Leasing | 702 (61.5%) | 439 (38.5%) |
| Professional & Scientific | 5,189 (68.8%) | 2,354 (31.2%) |
| Enterprise Management | 50 (59.5%) | 34 (40.5%) |
| Administrative & Support | 678 (48.0%) | 735 (52.0%) |
| Educational Services | 734 (33.6%) | 1,451 (66.4%) |
| Health Care & Social Assistance | 640 (18.1%) | 2,899 (81.9%) |
| Arts, Entertainment & Recreation | 328 (51.8%) | 305 (48.2%) |
| Accommodation & Food Services | 747 (45.7%) | 888 (54.3%) |
| Public Administration | 419 (60.6%) | 272 (39.4%) |
| Total | 18,926 (54.9%) | 15,532 (45.1%) |
Education in Alpharetta
School Enrollment in Alpharetta
The most common levels of schooling among the 18,018 students in Alpharetta are middle school (4,118 | 22.9%), high school (4,027 | 22.4%), and elementary school (3,922 | 21.8%).
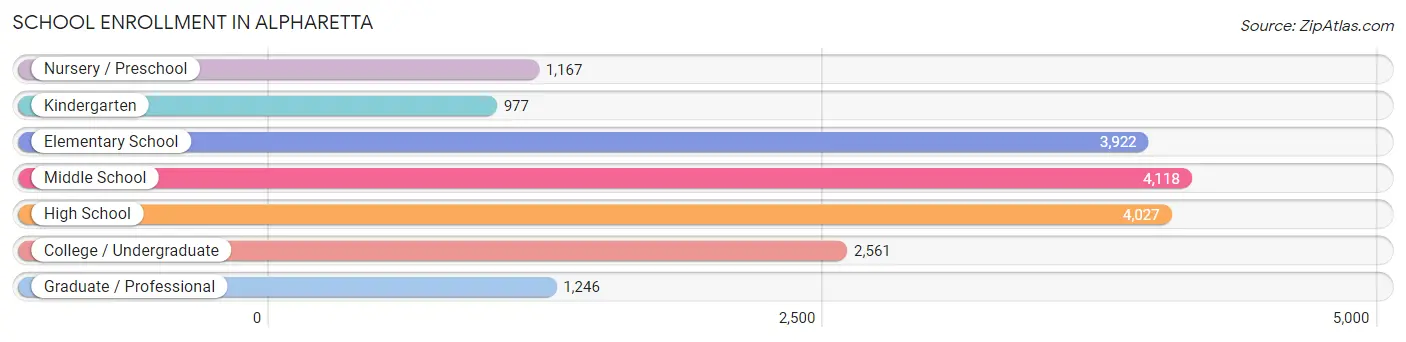
| School Level | # Students | % Students |
| Nursery / Preschool | 1,167 | 6.5% |
| Kindergarten | 977 | 5.4% |
| Elementary School | 3,922 | 21.8% |
| Middle School | 4,118 | 22.9% |
| High School | 4,027 | 22.4% |
| College / Undergraduate | 2,561 | 14.2% |
| Graduate / Professional | 1,246 | 6.9% |
| Total | 18,018 | 100.0% |
School Enrollment by Age by Funding Source in Alpharetta
Out of a total of 18,018 students who are enrolled in schools in Alpharetta, 3,550 (19.7%) attend a private institution, while the remaining 14,468 (80.3%) are enrolled in public schools. The age group of 3 to 4 year olds has the highest likelihood of being enrolled in private schools, with 588 (75.1% in the age bracket) enrolled. Conversely, the age group of 15 to 17 year olds has the lowest likelihood of being enrolled in a private school, with 2,589 (90.5% in the age bracket) attending a public institution.
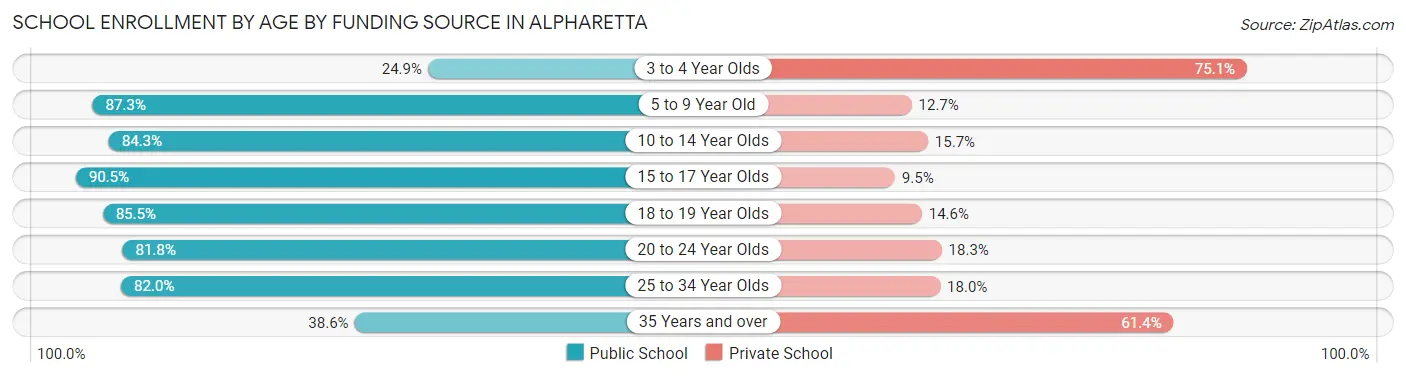
| Age Bracket | Public School | Private School |
| 3 to 4 Year Olds | 195 (24.9%) | 588 (75.1%) |
| 5 to 9 Year Old | 3,995 (87.3%) | 579 (12.7%) |
| 10 to 14 Year Olds | 4,546 (84.3%) | 846 (15.7%) |
| 15 to 17 Year Olds | 2,589 (90.5%) | 273 (9.5%) |
| 18 to 19 Year Olds | 1,139 (85.5%) | 194 (14.5%) |
| 20 to 24 Year Olds | 918 (81.8%) | 205 (18.2%) |
| 25 to 34 Year Olds | 639 (82.0%) | 140 (18.0%) |
| 35 Years and over | 452 (38.6%) | 720 (61.4%) |
| Total | 14,468 (80.3%) | 3,550 (19.7%) |
Educational Attainment by Field of Study in Alpharetta
Business (9,222 | 26.8%), engineering (5,863 | 17.0%), computers & mathematics (3,015 | 8.7%), science & technology (2,553 | 7.4%), and social sciences (2,347 | 6.8%) are the most common fields of study among 34,441 individuals in Alpharetta who have obtained a bachelor's degree or higher.
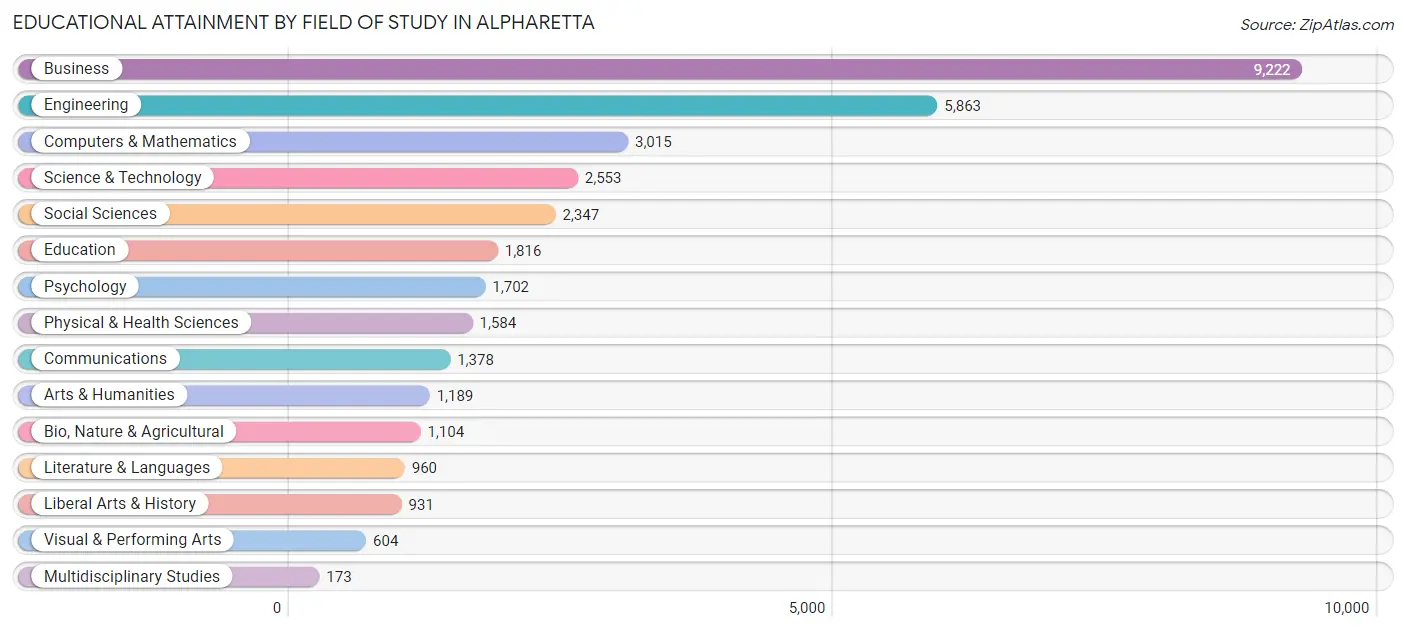
| Field of Study | # Graduates | % Graduates |
| Computers & Mathematics | 3,015 | 8.7% |
| Bio, Nature & Agricultural | 1,104 | 3.2% |
| Physical & Health Sciences | 1,584 | 4.6% |
| Psychology | 1,702 | 4.9% |
| Social Sciences | 2,347 | 6.8% |
| Engineering | 5,863 | 17.0% |
| Multidisciplinary Studies | 173 | 0.5% |
| Science & Technology | 2,553 | 7.4% |
| Business | 9,222 | 26.8% |
| Education | 1,816 | 5.3% |
| Literature & Languages | 960 | 2.8% |
| Liberal Arts & History | 931 | 2.7% |
| Visual & Performing Arts | 604 | 1.8% |
| Communications | 1,378 | 4.0% |
| Arts & Humanities | 1,189 | 3.5% |
| Total | 34,441 | 100.0% |
Transportation & Commute in Alpharetta
Vehicle Availability by Sex in Alpharetta
The most prevalent vehicle ownership categories in Alpharetta are males with 2 vehicles (9,184, accounting for 48.7%) and females with 2 vehicles (7,375, making up 60.2%).
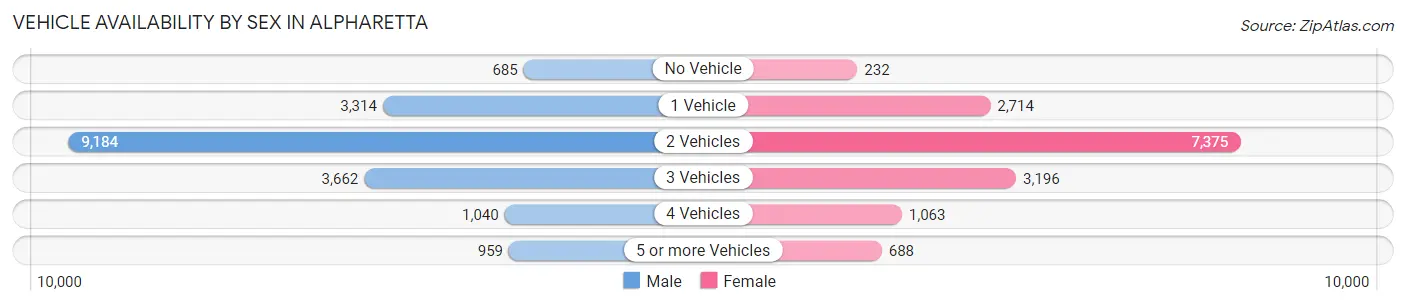
| Vehicles Available | Male | Female |
| No Vehicle | 685 (3.6%) | 232 (1.5%) |
| 1 Vehicle | 3,314 (17.6%) | 2,714 (17.8%) |
| 2 Vehicles | 9,184 (48.7%) | 7,375 (48.3%) |
| 3 Vehicles | 3,662 (19.4%) | 3,196 (20.9%) |
| 4 Vehicles | 1,040 (5.5%) | 1,063 (7.0%) |
| 5 or more Vehicles | 959 (5.1%) | 688 (4.5%) |
| Total | 18,844 (100.0%) | 15,268 (100.0%) |
Commute Time in Alpharetta
The most frequently occuring commute durations in Alpharetta are 15 to 19 minutes (3,926 commuters, 16.6%), 10 to 14 minutes (3,734 commuters, 15.8%), and 45 to 59 minutes (2,870 commuters, 12.1%).
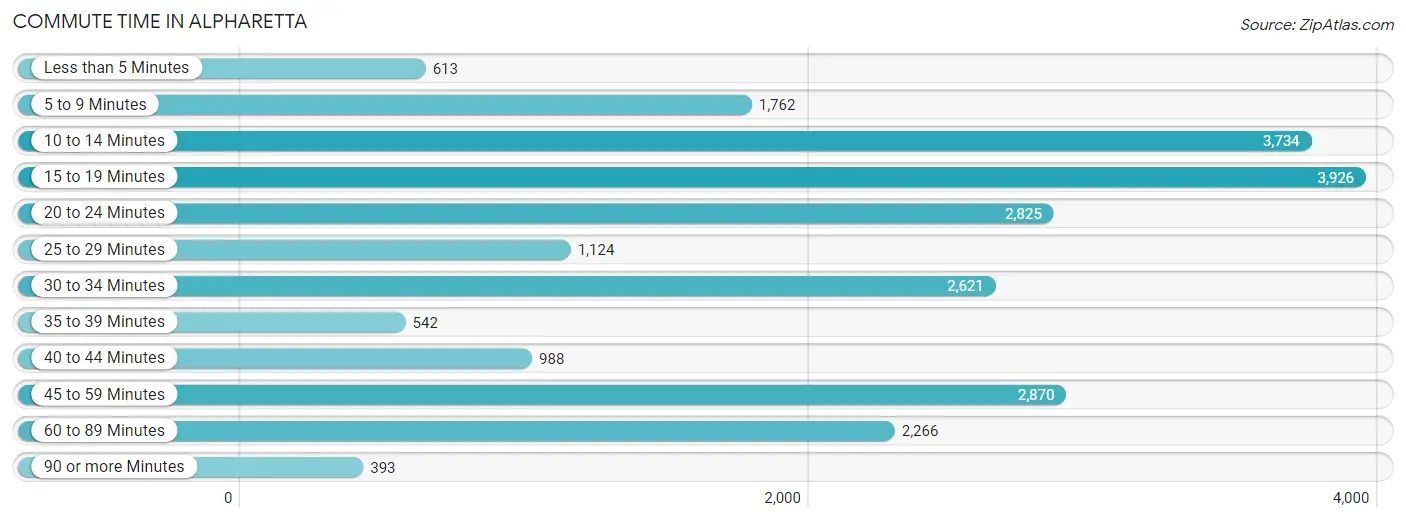
| Commute Time | # Commuters | % Commuters |
| Less than 5 Minutes | 613 | 2.6% |
| 5 to 9 Minutes | 1,762 | 7.4% |
| 10 to 14 Minutes | 3,734 | 15.8% |
| 15 to 19 Minutes | 3,926 | 16.6% |
| 20 to 24 Minutes | 2,825 | 11.9% |
| 25 to 29 Minutes | 1,124 | 4.8% |
| 30 to 34 Minutes | 2,621 | 11.1% |
| 35 to 39 Minutes | 542 | 2.3% |
| 40 to 44 Minutes | 988 | 4.2% |
| 45 to 59 Minutes | 2,870 | 12.1% |
| 60 to 89 Minutes | 2,266 | 9.6% |
| 90 or more Minutes | 393 | 1.7% |
Commute Time by Sex in Alpharetta
The most common commute times in Alpharetta are 10 to 14 minutes (2,211 commuters, 17.1%) for males and 15 to 19 minutes (1,930 commuters, 18.0%) for females.
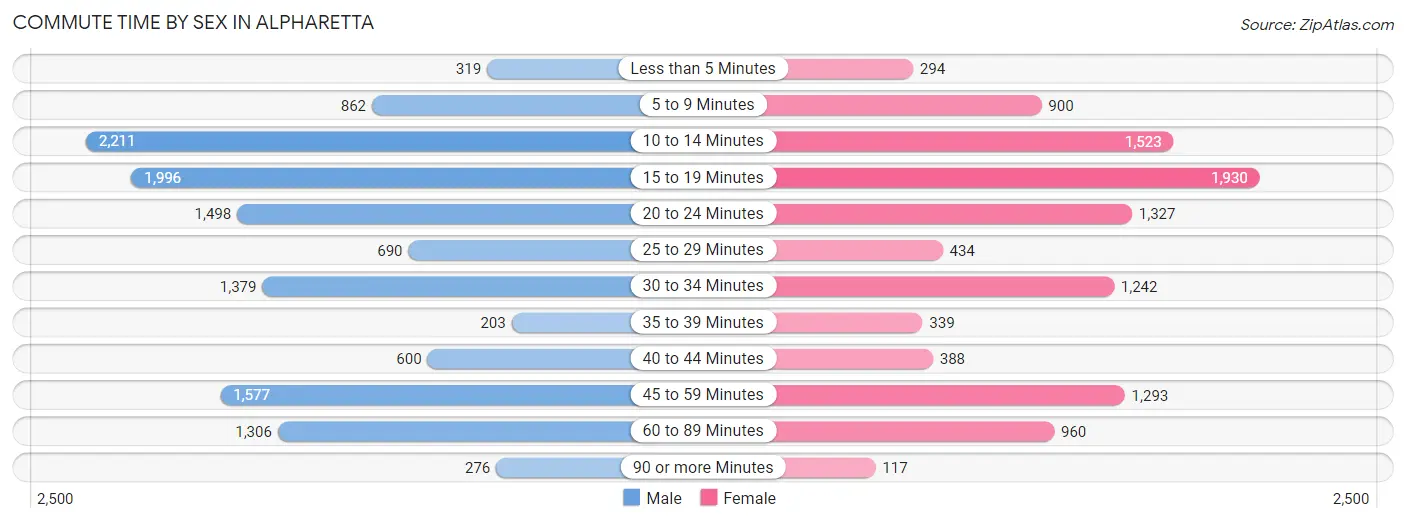
| Commute Time | Male | Female |
| Less than 5 Minutes | 319 (2.5%) | 294 (2.7%) |
| 5 to 9 Minutes | 862 (6.7%) | 900 (8.4%) |
| 10 to 14 Minutes | 2,211 (17.1%) | 1,523 (14.2%) |
| 15 to 19 Minutes | 1,996 (15.4%) | 1,930 (18.0%) |
| 20 to 24 Minutes | 1,498 (11.6%) | 1,327 (12.3%) |
| 25 to 29 Minutes | 690 (5.3%) | 434 (4.0%) |
| 30 to 34 Minutes | 1,379 (10.7%) | 1,242 (11.6%) |
| 35 to 39 Minutes | 203 (1.6%) | 339 (3.2%) |
| 40 to 44 Minutes | 600 (4.6%) | 388 (3.6%) |
| 45 to 59 Minutes | 1,577 (12.2%) | 1,293 (12.0%) |
| 60 to 89 Minutes | 1,306 (10.1%) | 960 (8.9%) |
| 90 or more Minutes | 276 (2.1%) | 117 (1.1%) |
Time of Departure to Work by Sex in Alpharetta
The most frequent times of departure to work in Alpharetta are 8:00 AM to 8:29 AM (3,150, 24.4%) for males and 7:30 AM to 7:59 AM (1,719, 16.0%) for females.
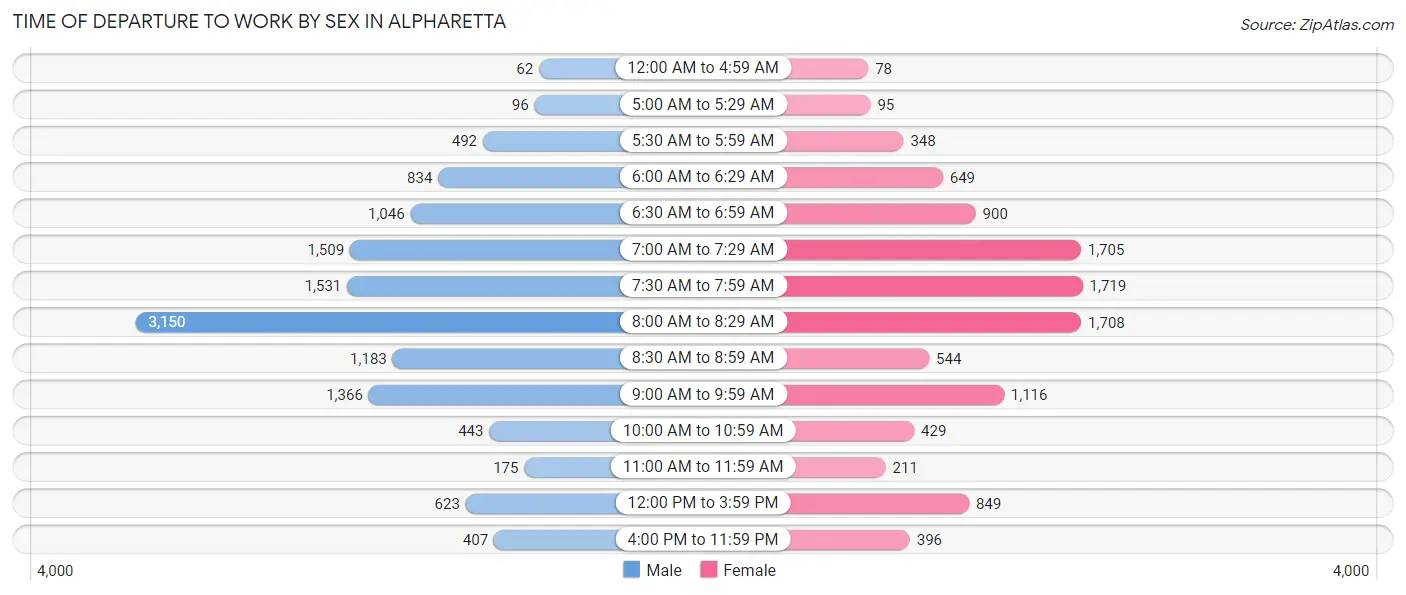
| Time of Departure | Male | Female |
| 12:00 AM to 4:59 AM | 62 (0.5%) | 78 (0.7%) |
| 5:00 AM to 5:29 AM | 96 (0.7%) | 95 (0.9%) |
| 5:30 AM to 5:59 AM | 492 (3.8%) | 348 (3.2%) |
| 6:00 AM to 6:29 AM | 834 (6.5%) | 649 (6.0%) |
| 6:30 AM to 6:59 AM | 1,046 (8.1%) | 900 (8.4%) |
| 7:00 AM to 7:29 AM | 1,509 (11.7%) | 1,705 (15.9%) |
| 7:30 AM to 7:59 AM | 1,531 (11.8%) | 1,719 (16.0%) |
| 8:00 AM to 8:29 AM | 3,150 (24.4%) | 1,708 (15.9%) |
| 8:30 AM to 8:59 AM | 1,183 (9.2%) | 544 (5.1%) |
| 9:00 AM to 9:59 AM | 1,366 (10.6%) | 1,116 (10.4%) |
| 10:00 AM to 10:59 AM | 443 (3.4%) | 429 (4.0%) |
| 11:00 AM to 11:59 AM | 175 (1.3%) | 211 (2.0%) |
| 12:00 PM to 3:59 PM | 623 (4.8%) | 849 (7.9%) |
| 4:00 PM to 11:59 PM | 407 (3.2%) | 396 (3.7%) |
| Total | 12,917 (100.0%) | 10,747 (100.0%) |
Housing Occupancy in Alpharetta
Occupancy by Ownership in Alpharetta
Of the total 24,093 dwellings in Alpharetta, owner-occupied units account for 16,200 (67.2%), while renter-occupied units make up 7,893 (32.8%).
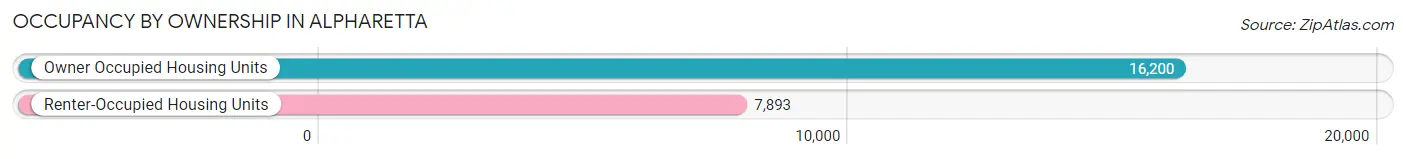
| Occupancy | # Housing Units | % Housing Units |
| Owner Occupied Housing Units | 16,200 | 67.2% |
| Renter-Occupied Housing Units | 7,893 | 32.8% |
| Total Occupied Housing Units | 24,093 | 100.0% |
Occupancy by Household Size in Alpharetta
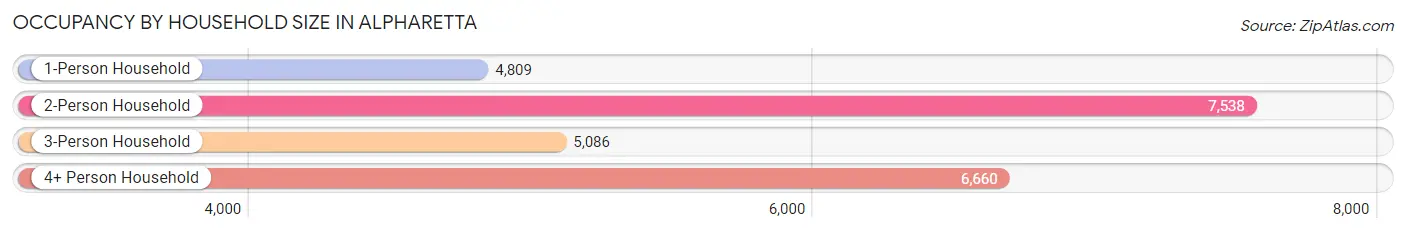
| Household Size | # Housing Units | % Housing Units |
| 1-Person Household | 4,809 | 20.0% |
| 2-Person Household | 7,538 | 31.3% |
| 3-Person Household | 5,086 | 21.1% |
| 4+ Person Household | 6,660 | 27.6% |
| Total Housing Units | 24,093 | 100.0% |
Occupancy by Ownership by Household Size in Alpharetta
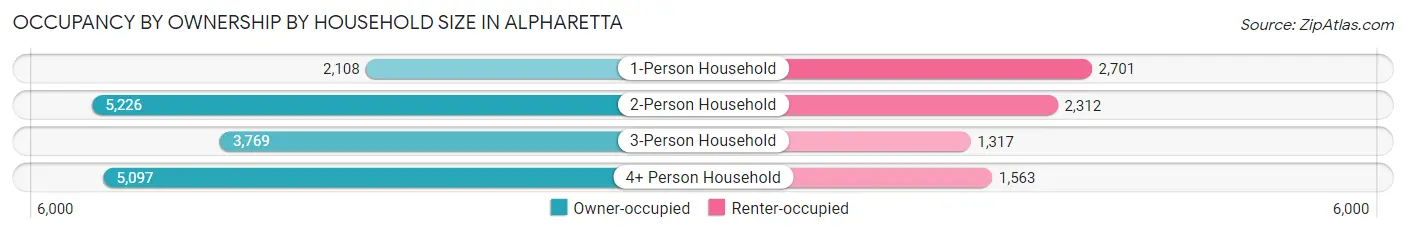
| Household Size | Owner-occupied | Renter-occupied |
| 1-Person Household | 2,108 (43.8%) | 2,701 (56.2%) |
| 2-Person Household | 5,226 (69.3%) | 2,312 (30.7%) |
| 3-Person Household | 3,769 (74.1%) | 1,317 (25.9%) |
| 4+ Person Household | 5,097 (76.5%) | 1,563 (23.5%) |
| Total Housing Units | 16,200 (67.2%) | 7,893 (32.8%) |
Occupancy by Educational Attainment in Alpharetta
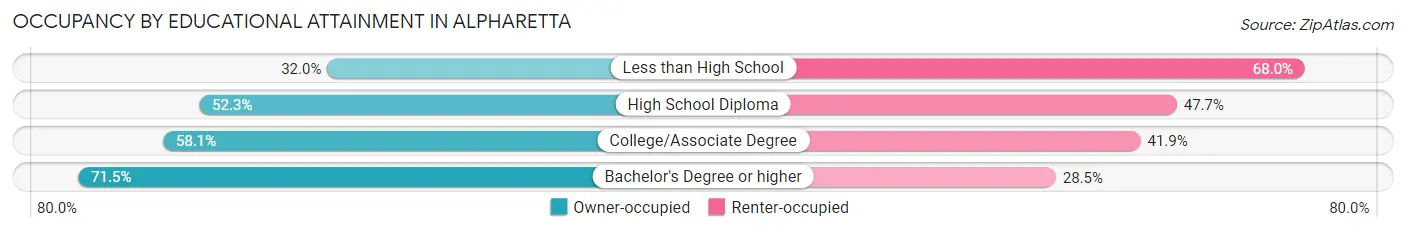
| Household Size | Owner-occupied | Renter-occupied |
| Less than High School | 200 (32.0%) | 425 (68.0%) |
| High School Diploma | 789 (52.3%) | 719 (47.7%) |
| College/Associate Degree | 2,130 (58.1%) | 1,538 (41.9%) |
| Bachelor's Degree or higher | 13,081 (71.5%) | 5,211 (28.5%) |
Occupancy by Age of Householder in Alpharetta
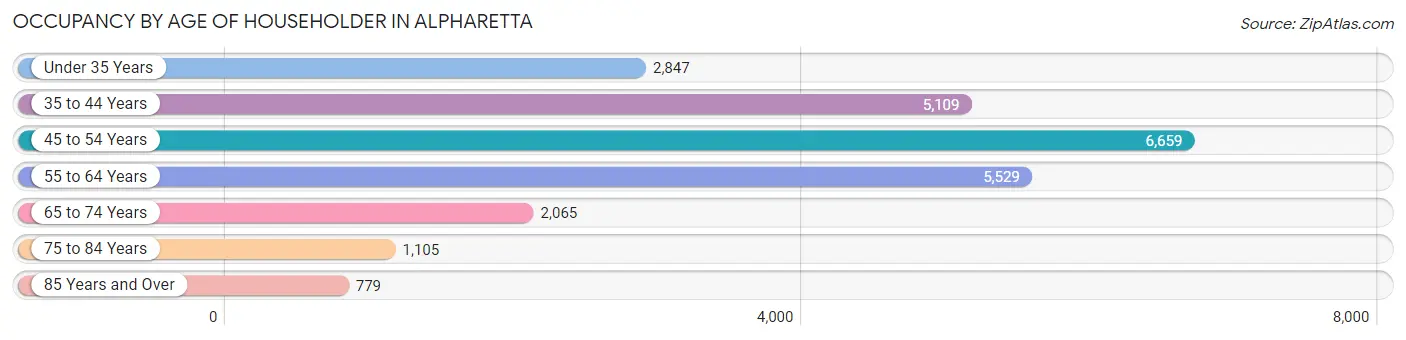
| Age Bracket | # Households | % Households |
| Under 35 Years | 2,847 | 11.8% |
| 35 to 44 Years | 5,109 | 21.2% |
| 45 to 54 Years | 6,659 | 27.6% |
| 55 to 64 Years | 5,529 | 23.0% |
| 65 to 74 Years | 2,065 | 8.6% |
| 75 to 84 Years | 1,105 | 4.6% |
| 85 Years and Over | 779 | 3.2% |
| Total | 24,093 | 100.0% |
Housing Finances in Alpharetta
Median Income by Occupancy in Alpharetta
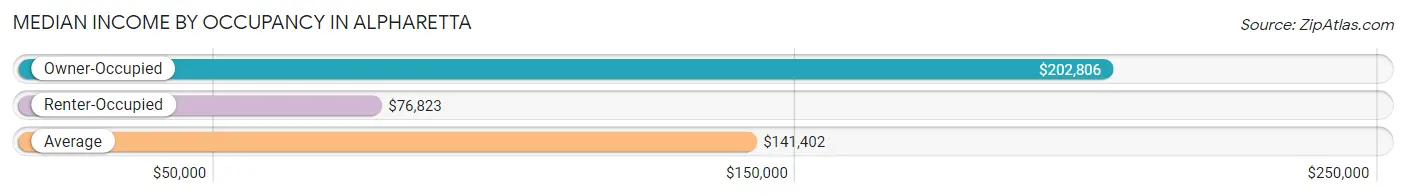
| Occupancy Type | # Households | Median Income |
| Owner-Occupied | 16,200 (67.2%) | $202,806 |
| Renter-Occupied | 7,893 (32.8%) | $76,823 |
| Average | 24,093 (100.0%) | $141,402 |
Occupancy by Householder Income Bracket in Alpharetta
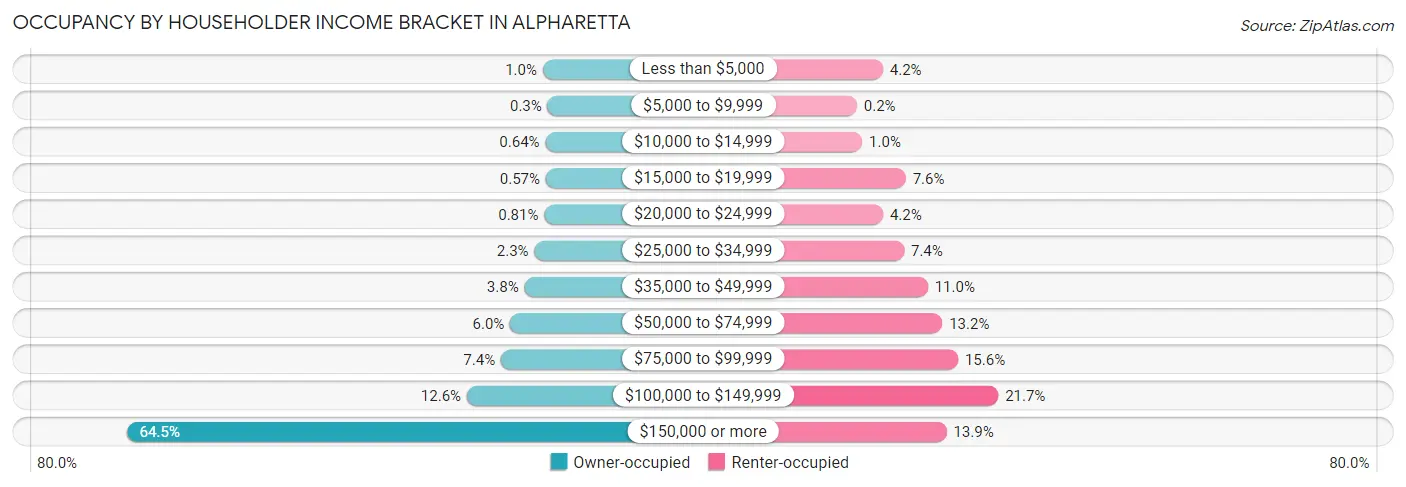
| Income Bracket | Owner-occupied | Renter-occupied |
| Less than $5,000 | 168 (1.0%) | 328 (4.2%) |
| $5,000 to $9,999 | 49 (0.3%) | 16 (0.2%) |
| $10,000 to $14,999 | 103 (0.6%) | 80 (1.0%) |
| $15,000 to $19,999 | 93 (0.6%) | 603 (7.6%) |
| $20,000 to $24,999 | 132 (0.8%) | 330 (4.2%) |
| $25,000 to $34,999 | 375 (2.3%) | 583 (7.4%) |
| $35,000 to $49,999 | 621 (3.8%) | 868 (11.0%) |
| $50,000 to $74,999 | 973 (6.0%) | 1,043 (13.2%) |
| $75,000 to $99,999 | 1,201 (7.4%) | 1,232 (15.6%) |
| $100,000 to $149,999 | 2,042 (12.6%) | 1,716 (21.7%) |
| $150,000 or more | 10,443 (64.5%) | 1,094 (13.9%) |
| Total | 16,200 (100.0%) | 7,893 (100.0%) |
Monthly Housing Cost Tiers in Alpharetta
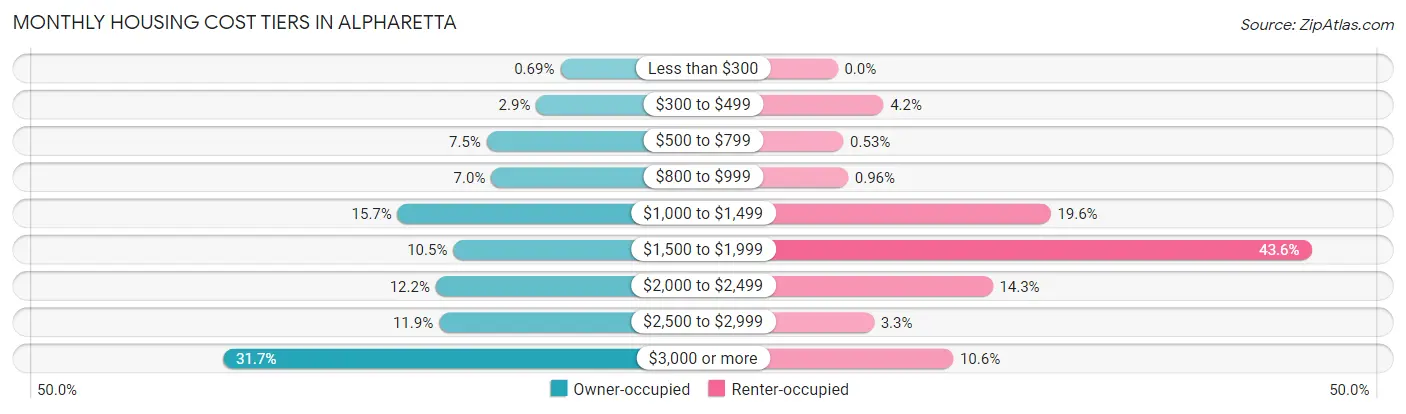
| Monthly Cost | Owner-occupied | Renter-occupied |
| Less than $300 | 111 (0.7%) | 0 (0.0%) |
| $300 to $499 | 469 (2.9%) | 333 (4.2%) |
| $500 to $799 | 1,208 (7.5%) | 42 (0.5%) |
| $800 to $999 | 1,140 (7.0%) | 76 (1.0%) |
| $1,000 to $1,499 | 2,537 (15.7%) | 1,548 (19.6%) |
| $1,500 to $1,999 | 1,707 (10.5%) | 3,443 (43.6%) |
| $2,000 to $2,499 | 1,969 (12.1%) | 1,126 (14.3%) |
| $2,500 to $2,999 | 1,919 (11.8%) | 264 (3.3%) |
| $3,000 or more | 5,140 (31.7%) | 840 (10.6%) |
| Total | 16,200 (100.0%) | 7,893 (100.0%) |
Physical Housing Characteristics in Alpharetta
Housing Structures in Alpharetta
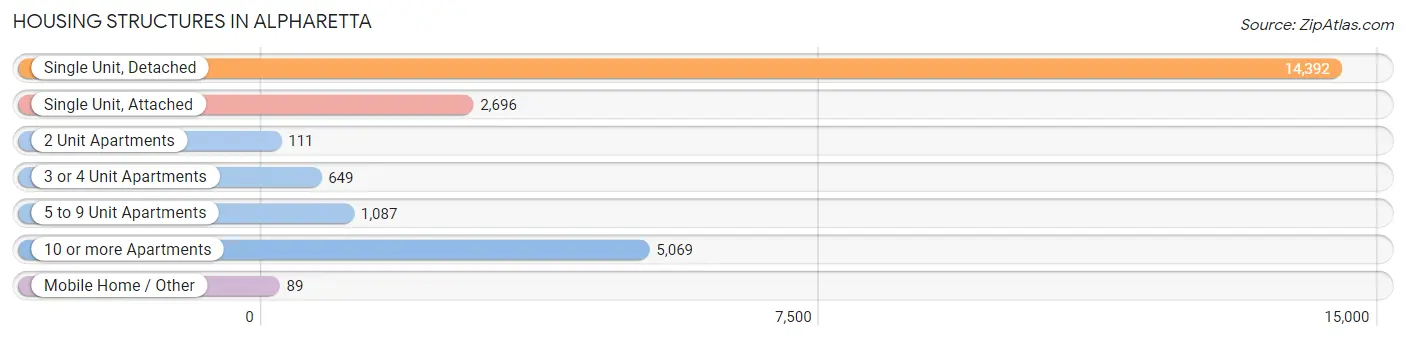
| Structure Type | # Housing Units | % Housing Units |
| Single Unit, Detached | 14,392 | 59.7% |
| Single Unit, Attached | 2,696 | 11.2% |
| 2 Unit Apartments | 111 | 0.5% |
| 3 or 4 Unit Apartments | 649 | 2.7% |
| 5 to 9 Unit Apartments | 1,087 | 4.5% |
| 10 or more Apartments | 5,069 | 21.0% |
| Mobile Home / Other | 89 | 0.4% |
| Total | 24,093 | 100.0% |
Housing Structures by Occupancy in Alpharetta
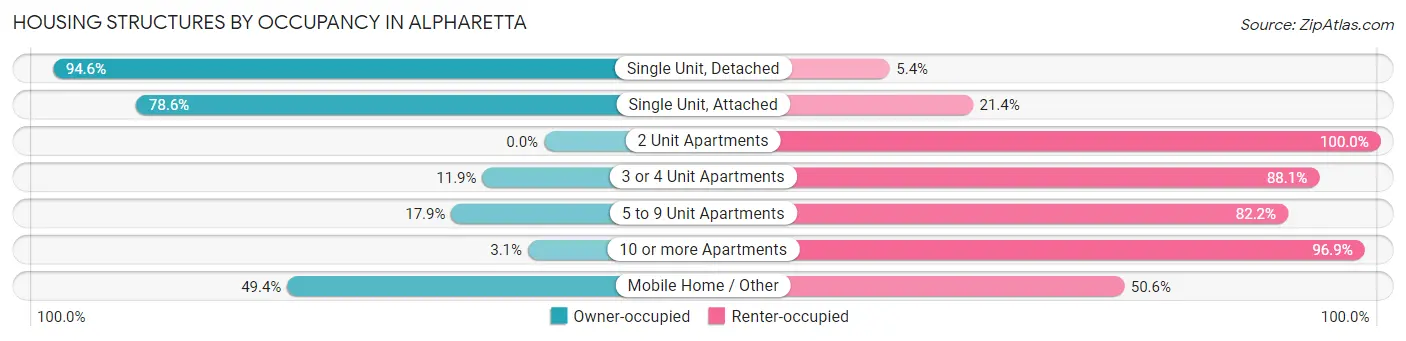
| Structure Type | Owner-occupied | Renter-occupied |
| Single Unit, Detached | 13,610 (94.6%) | 782 (5.4%) |
| Single Unit, Attached | 2,118 (78.6%) | 578 (21.4%) |
| 2 Unit Apartments | 0 (0.0%) | 111 (100.0%) |
| 3 or 4 Unit Apartments | 77 (11.9%) | 572 (88.1%) |
| 5 to 9 Unit Apartments | 194 (17.8%) | 893 (82.2%) |
| 10 or more Apartments | 157 (3.1%) | 4,912 (96.9%) |
| Mobile Home / Other | 44 (49.4%) | 45 (50.6%) |
| Total | 16,200 (67.2%) | 7,893 (32.8%) |
Housing Structures by Number of Rooms in Alpharetta
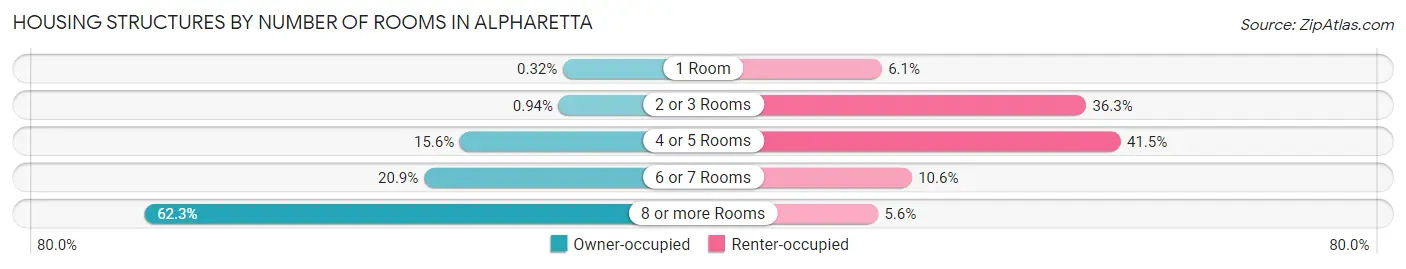
| Number of Rooms | Owner-occupied | Renter-occupied |
| 1 Room | 52 (0.3%) | 482 (6.1%) |
| 2 or 3 Rooms | 153 (0.9%) | 2,868 (36.3%) |
| 4 or 5 Rooms | 2,521 (15.6%) | 3,272 (41.4%) |
| 6 or 7 Rooms | 3,382 (20.9%) | 833 (10.5%) |
| 8 or more Rooms | 10,092 (62.3%) | 438 (5.6%) |
| Total | 16,200 (100.0%) | 7,893 (100.0%) |
Housing Structure by Heating Type in Alpharetta
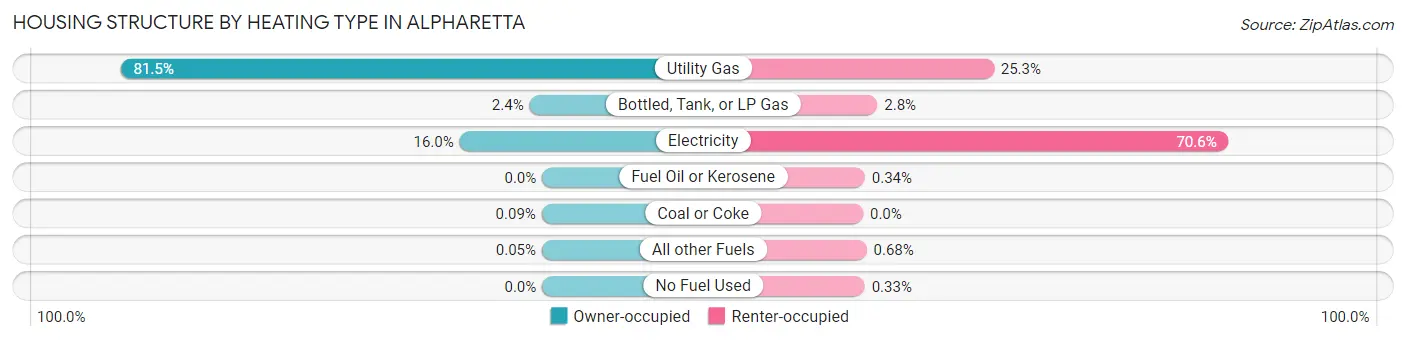
| Heating Type | Owner-occupied | Renter-occupied |
| Utility Gas | 13,197 (81.5%) | 1,994 (25.3%) |
| Bottled, Tank, or LP Gas | 396 (2.4%) | 219 (2.8%) |
| Electricity | 2,585 (16.0%) | 5,573 (70.6%) |
| Fuel Oil or Kerosene | 0 (0.0%) | 27 (0.3%) |
| Coal or Coke | 14 (0.1%) | 0 (0.0%) |
| All other Fuels | 8 (0.1%) | 54 (0.7%) |
| No Fuel Used | 0 (0.0%) | 26 (0.3%) |
| Total | 16,200 (100.0%) | 7,893 (100.0%) |
Household Vehicle Usage in Alpharetta
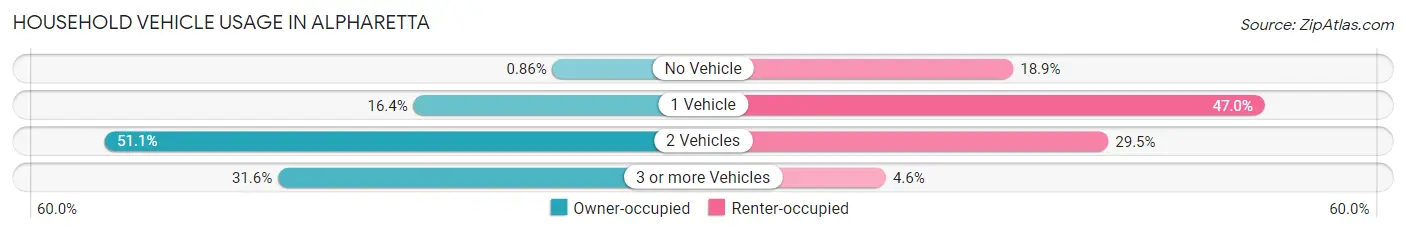
| Vehicles per Household | Owner-occupied | Renter-occupied |
| No Vehicle | 139 (0.9%) | 1,489 (18.9%) |
| 1 Vehicle | 2,662 (16.4%) | 3,712 (47.0%) |
| 2 Vehicles | 8,278 (51.1%) | 2,329 (29.5%) |
| 3 or more Vehicles | 5,121 (31.6%) | 363 (4.6%) |
| Total | 16,200 (100.0%) | 7,893 (100.0%) |
Real Estate & Mortgages in Alpharetta
Real Estate and Mortgage Overview in Alpharetta
| Characteristic | Without Mortgage | With Mortgage |
| Housing Units | 4,150 | 12,050 |
| Median Property Value | $543,000 | $567,600 |
| Median Household Income | $161,742 | $8,247 |
| Monthly Housing Costs | $878 | $5,140 |
| Real Estate Taxes | $4,800 | $67 |
Property Value by Mortgage Status in Alpharetta
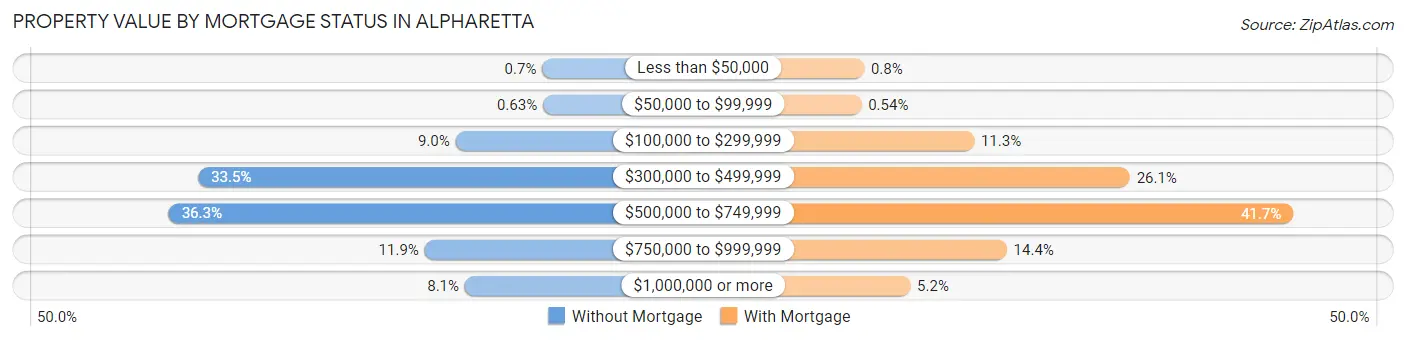
| Property Value | Without Mortgage | With Mortgage |
| Less than $50,000 | 29 (0.7%) | 96 (0.8%) |
| $50,000 to $99,999 | 26 (0.6%) | 65 (0.5%) |
| $100,000 to $299,999 | 372 (9.0%) | 1,359 (11.3%) |
| $300,000 to $499,999 | 1,389 (33.5%) | 3,146 (26.1%) |
| $500,000 to $749,999 | 1,505 (36.3%) | 5,023 (41.7%) |
| $750,000 to $999,999 | 494 (11.9%) | 1,734 (14.4%) |
| $1,000,000 or more | 335 (8.1%) | 627 (5.2%) |
| Total | 4,150 (100.0%) | 12,050 (100.0%) |
Household Income by Mortgage Status in Alpharetta
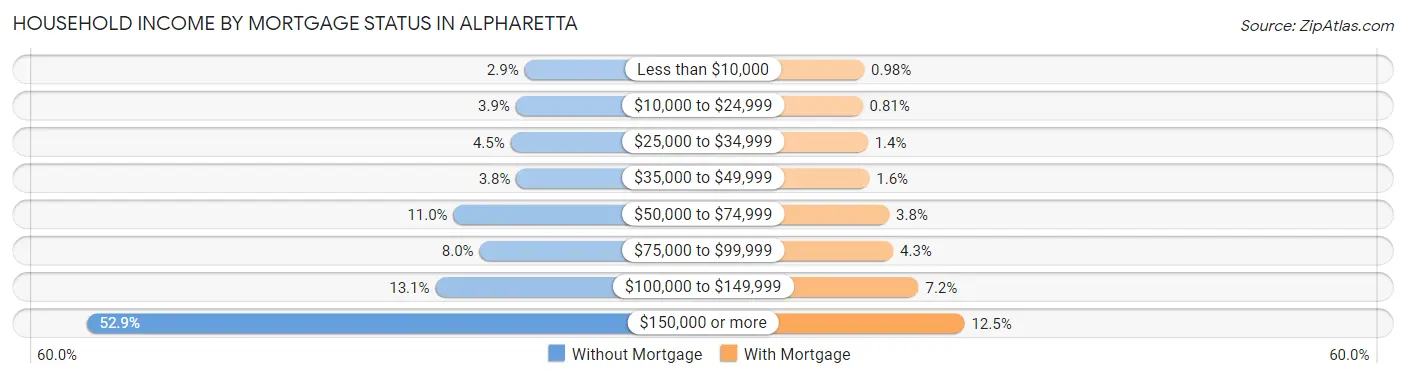
| Household Income | Without Mortgage | With Mortgage |
| Less than $10,000 | 119 (2.9%) | 118 (1.0%) |
| $10,000 to $24,999 | 161 (3.9%) | 98 (0.8%) |
| $25,000 to $34,999 | 185 (4.5%) | 167 (1.4%) |
| $35,000 to $49,999 | 158 (3.8%) | 190 (1.6%) |
| $50,000 to $74,999 | 456 (11.0%) | 463 (3.8%) |
| $75,000 to $99,999 | 333 (8.0%) | 517 (4.3%) |
| $100,000 to $149,999 | 542 (13.1%) | 868 (7.2%) |
| $150,000 or more | 2,196 (52.9%) | 1,500 (12.4%) |
| Total | 4,150 (100.0%) | 12,050 (100.0%) |
Property Value to Household Income Ratio in Alpharetta
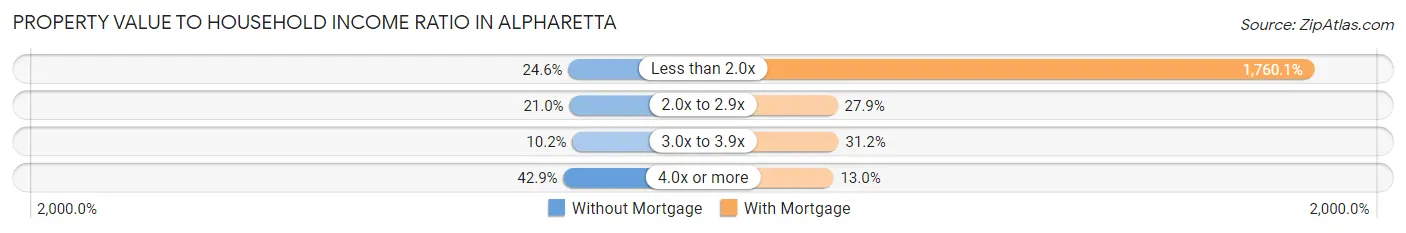
| Value-to-Income Ratio | Without Mortgage | With Mortgage |
| Less than 2.0x | 1,022 (24.6%) | 212,087 (1,760.1%) |
| 2.0x to 2.9x | 870 (21.0%) | 3,366 (27.9%) |
| 3.0x to 3.9x | 422 (10.2%) | 3,763 (31.2%) |
| 4.0x or more | 1,781 (42.9%) | 1,561 (13.0%) |
| Total | 4,150 (100.0%) | 12,050 (100.0%) |
Real Estate Taxes by Mortgage Status in Alpharetta
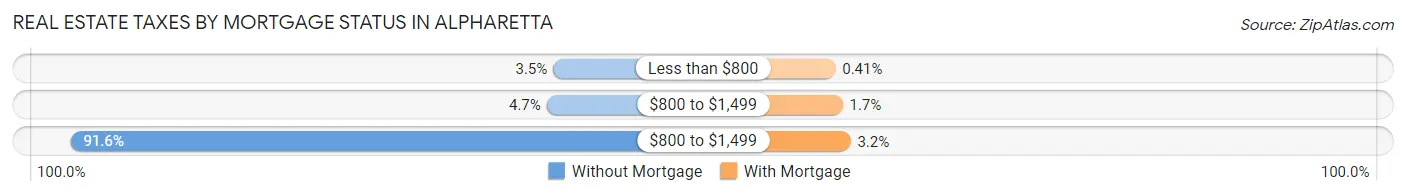
| Property Taxes | Without Mortgage | With Mortgage |
| Less than $800 | 144 (3.5%) | 49 (0.4%) |
| $800 to $1,499 | 193 (4.6%) | 208 (1.7%) |
| $800 to $1,499 | 3,802 (91.6%) | 383 (3.2%) |
| Total | 4,150 (100.0%) | 12,050 (100.0%) |
Health & Disability in Alpharetta
Health Insurance Coverage by Age in Alpharetta
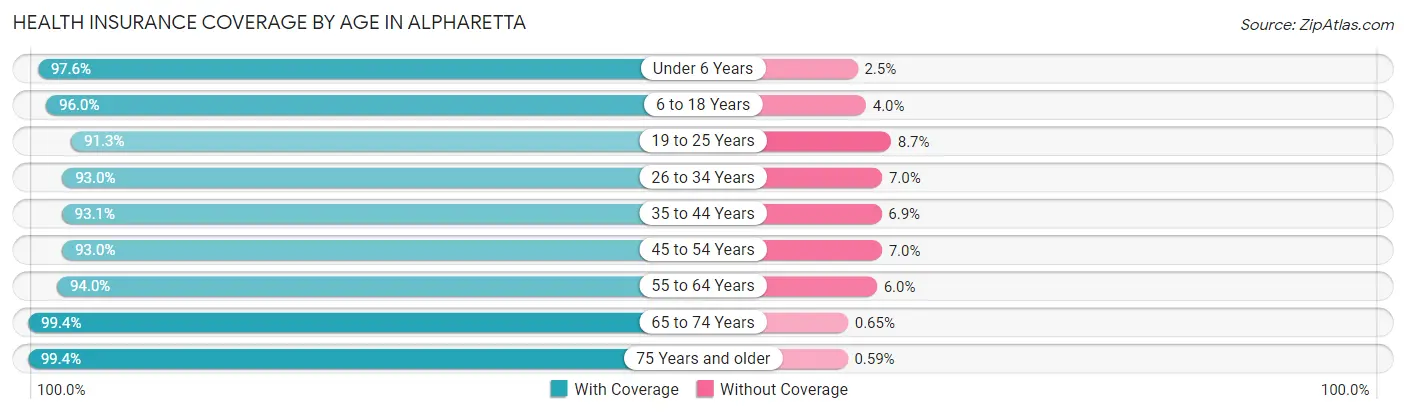
| Age Bracket | With Coverage | Without Coverage |
| Under 6 Years | 4,307 (97.6%) | 108 (2.5%) |
| 6 to 18 Years | 12,474 (96.0%) | 521 (4.0%) |
| 19 to 25 Years | 3,654 (91.3%) | 347 (8.7%) |
| 26 to 34 Years | 5,655 (93.0%) | 427 (7.0%) |
| 35 to 44 Years | 9,072 (93.1%) | 673 (6.9%) |
| 45 to 54 Years | 10,612 (93.0%) | 796 (7.0%) |
| 55 to 64 Years | 9,337 (94.0%) | 600 (6.0%) |
| 65 to 74 Years | 3,808 (99.4%) | 25 (0.6%) |
| 75 Years and older | 3,043 (99.4%) | 18 (0.6%) |
| Total | 61,962 (94.6%) | 3,515 (5.4%) |
Health Insurance Coverage by Citizenship Status in Alpharetta
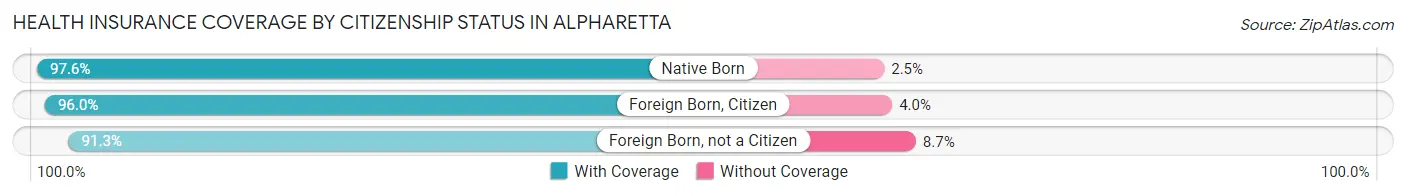
| Citizenship Status | With Coverage | Without Coverage |
| Native Born | 4,307 (97.6%) | 108 (2.5%) |
| Foreign Born, Citizen | 12,474 (96.0%) | 521 (4.0%) |
| Foreign Born, not a Citizen | 3,654 (91.3%) | 347 (8.7%) |
Health Insurance Coverage by Household Income in Alpharetta
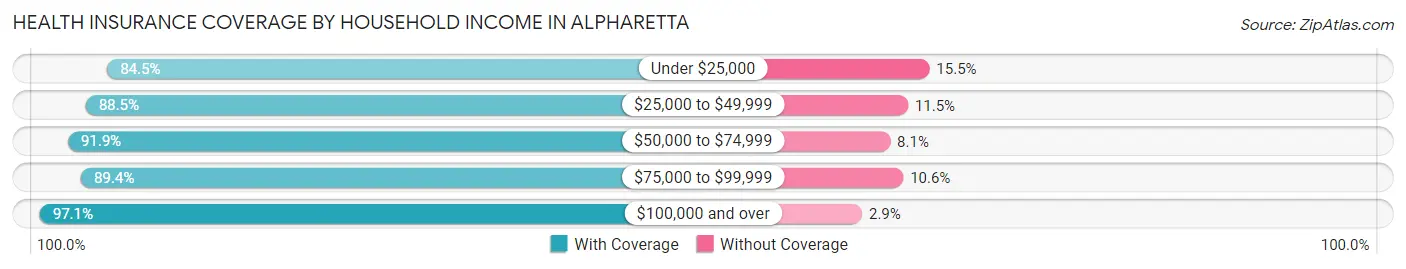
| Household Income | With Coverage | Without Coverage |
| Under $25,000 | 3,051 (84.5%) | 559 (15.5%) |
| $25,000 to $49,999 | 5,105 (88.5%) | 661 (11.5%) |
| $50,000 to $74,999 | 4,073 (91.9%) | 360 (8.1%) |
| $75,000 to $99,999 | 5,109 (89.4%) | 604 (10.6%) |
| $100,000 and over | 44,587 (97.1%) | 1,314 (2.9%) |
Public vs Private Health Insurance Coverage by Age in Alpharetta
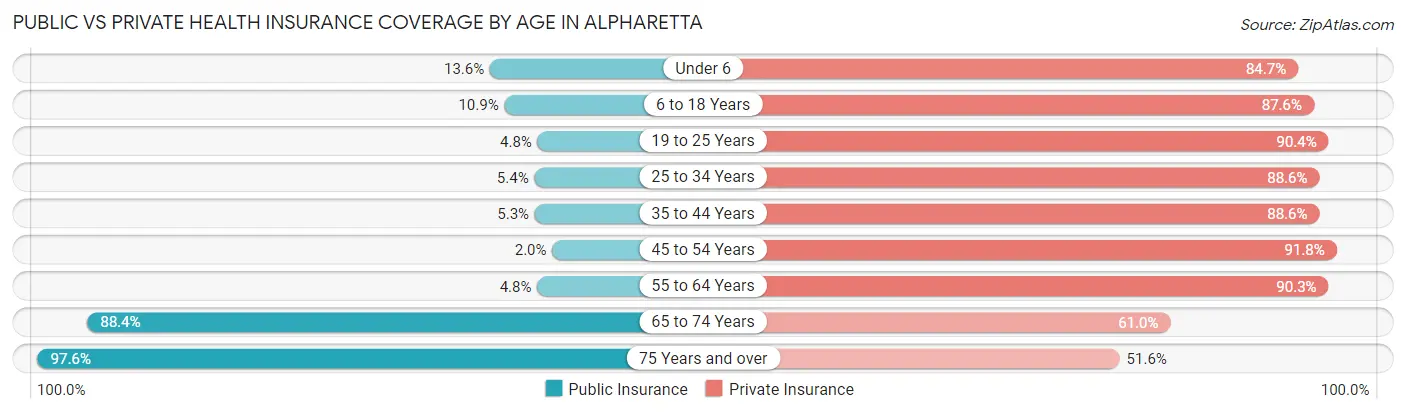
| Age Bracket | Public Insurance | Private Insurance |
| Under 6 | 601 (13.6%) | 3,738 (84.7%) |
| 6 to 18 Years | 1,420 (10.9%) | 11,383 (87.6%) |
| 19 to 25 Years | 191 (4.8%) | 3,615 (90.3%) |
| 25 to 34 Years | 326 (5.4%) | 5,390 (88.6%) |
| 35 to 44 Years | 515 (5.3%) | 8,638 (88.6%) |
| 45 to 54 Years | 233 (2.0%) | 10,477 (91.8%) |
| 55 to 64 Years | 480 (4.8%) | 8,975 (90.3%) |
| 65 to 74 Years | 3,387 (88.4%) | 2,337 (61.0%) |
| 75 Years and over | 2,987 (97.6%) | 1,579 (51.6%) |
| Total | 10,140 (15.5%) | 56,132 (85.7%) |
Disability Status by Sex by Age in Alpharetta
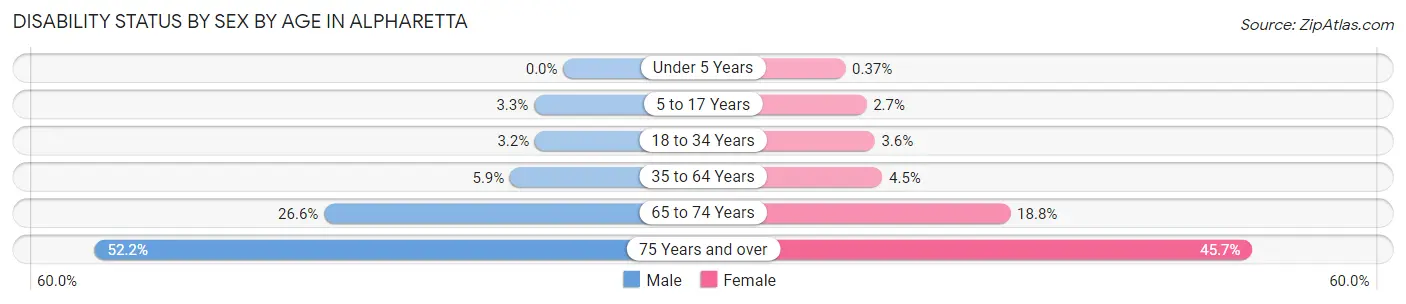
| Age Bracket | Male | Female |
| Under 5 Years | 0 (0.0%) | 7 (0.4%) |
| 5 to 17 Years | 230 (3.3%) | 166 (2.7%) |
| 18 to 34 Years | 174 (3.2%) | 191 (3.6%) |
| 35 to 64 Years | 934 (5.9%) | 688 (4.5%) |
| 65 to 74 Years | 423 (26.6%) | 421 (18.8%) |
| 75 Years and over | 744 (52.2%) | 748 (45.7%) |
Disability Class by Sex by Age in Alpharetta
Disability Class: Hearing Difficulty
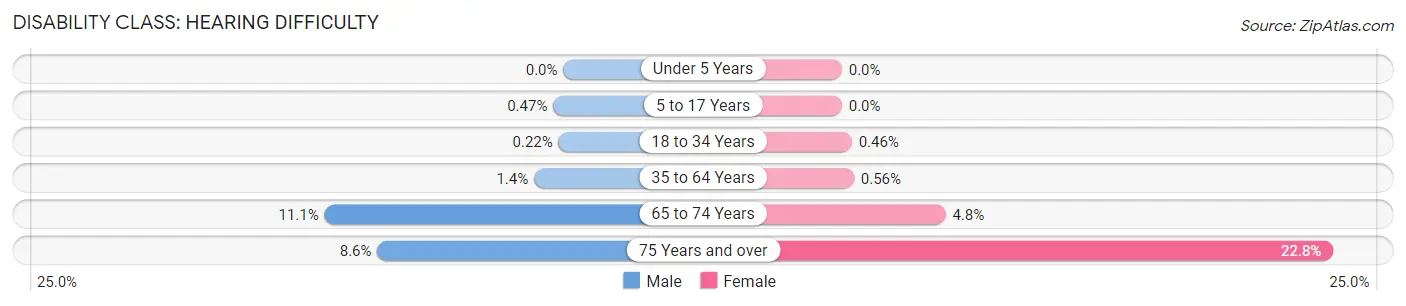
| Age Bracket | Male | Female |
| Under 5 Years | 0 (0.0%) | 0 (0.0%) |
| 5 to 17 Years | 33 (0.5%) | 0 (0.0%) |
| 18 to 34 Years | 12 (0.2%) | 24 (0.5%) |
| 35 to 64 Years | 214 (1.4%) | 86 (0.6%) |
| 65 to 74 Years | 176 (11.1%) | 108 (4.8%) |
| 75 Years and over | 123 (8.6%) | 373 (22.8%) |
Disability Class: Vision Difficulty
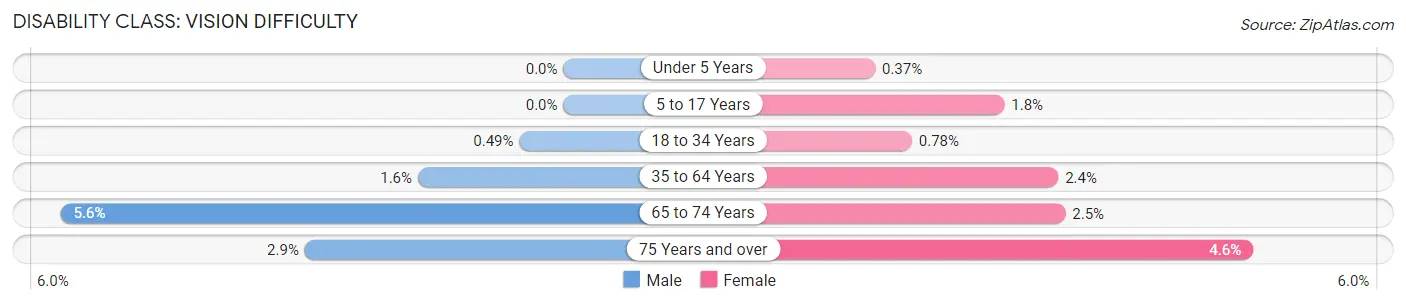
| Age Bracket | Male | Female |
| Under 5 Years | 0 (0.0%) | 7 (0.4%) |
| 5 to 17 Years | 0 (0.0%) | 110 (1.8%) |
| 18 to 34 Years | 27 (0.5%) | 41 (0.8%) |
| 35 to 64 Years | 256 (1.6%) | 370 (2.4%) |
| 65 to 74 Years | 89 (5.6%) | 56 (2.5%) |
| 75 Years and over | 41 (2.9%) | 75 (4.6%) |
Disability Class: Cognitive Difficulty
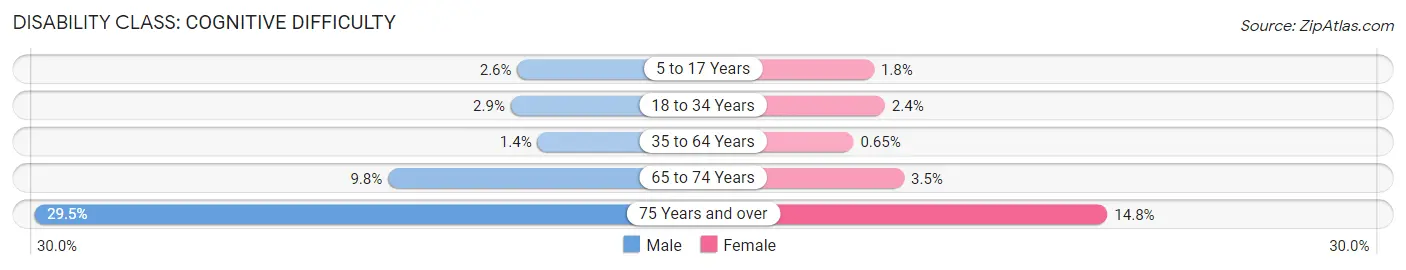
| Age Bracket | Male | Female |
| 5 to 17 Years | 181 (2.6%) | 109 (1.8%) |
| 18 to 34 Years | 162 (2.9%) | 126 (2.4%) |
| 35 to 64 Years | 227 (1.4%) | 100 (0.6%) |
| 65 to 74 Years | 155 (9.8%) | 78 (3.5%) |
| 75 Years and over | 420 (29.5%) | 242 (14.8%) |
Disability Class: Ambulatory Difficulty
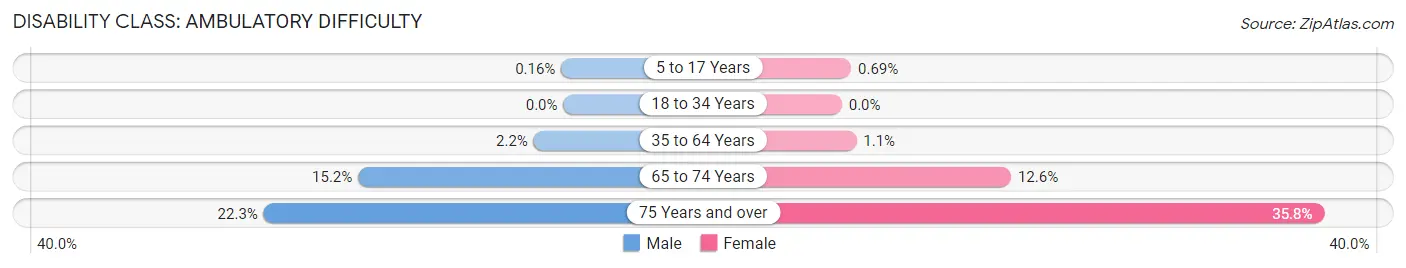
| Age Bracket | Male | Female |
| 5 to 17 Years | 11 (0.2%) | 42 (0.7%) |
| 18 to 34 Years | 0 (0.0%) | 0 (0.0%) |
| 35 to 64 Years | 347 (2.2%) | 165 (1.1%) |
| 65 to 74 Years | 242 (15.2%) | 282 (12.6%) |
| 75 Years and over | 317 (22.3%) | 586 (35.8%) |
Disability Class: Self-Care Difficulty
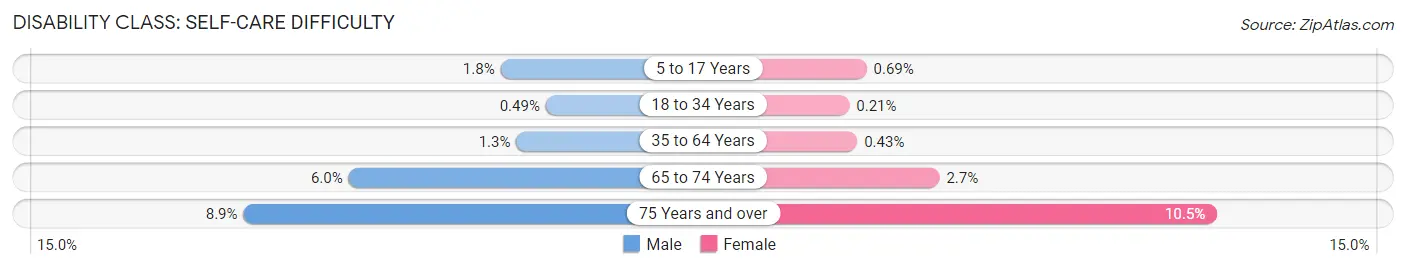
| Age Bracket | Male | Female |
| 5 to 17 Years | 124 (1.8%) | 42 (0.7%) |
| 18 to 34 Years | 27 (0.5%) | 11 (0.2%) |
| 35 to 64 Years | 207 (1.3%) | 66 (0.4%) |
| 65 to 74 Years | 95 (6.0%) | 61 (2.7%) |
| 75 Years and over | 127 (8.9%) | 171 (10.4%) |
Technology Access in Alpharetta
Computing Device Access in Alpharetta
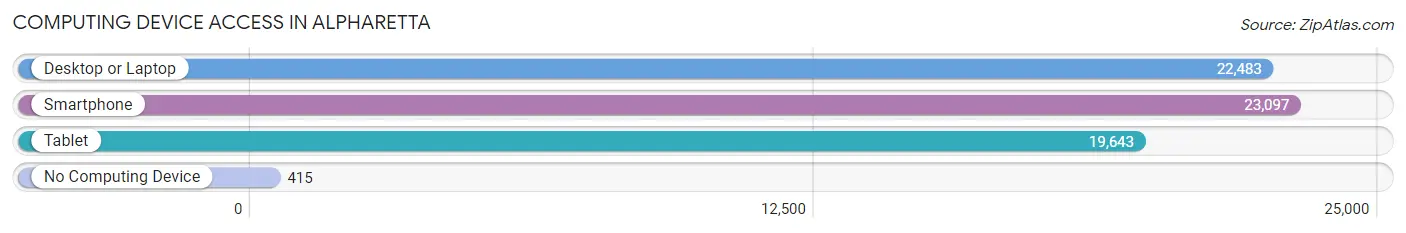
| Device Type | # Households | % Households |
| Desktop or Laptop | 22,483 | 93.3% |
| Smartphone | 23,097 | 95.9% |
| Tablet | 19,643 | 81.5% |
| No Computing Device | 415 | 1.7% |
| Total | 24,093 | 100.0% |
Internet Access in Alpharetta
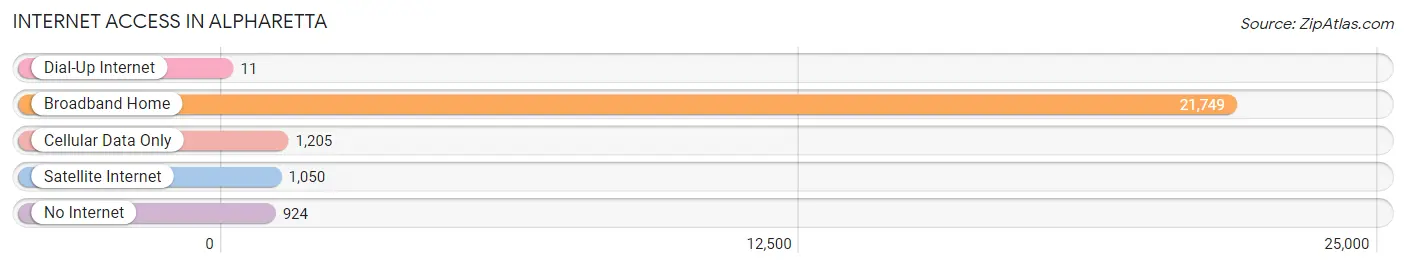
| Internet Type | # Households | % Households |
| Dial-Up Internet | 11 | 0.1% |
| Broadband Home | 21,749 | 90.3% |
| Cellular Data Only | 1,205 | 5.0% |
| Satellite Internet | 1,050 | 4.4% |
| No Internet | 924 | 3.8% |
| Total | 24,093 | 100.0% |
Alpharetta Summary
Alpharetta, Georgia is a city located in the northern part of Fulton County, Georgia, United States. It is a suburb of Atlanta and is part of the Atlanta metropolitan area. As of the 2010 census, Alpharetta had a population of 57,551.
History
The area that is now Alpharetta was originally inhabited by the Cherokee Indians. The first European settlers arrived in the area in the late 1700s. The area was known as New Prospect Camp Ground and was a popular stop for travelers on the old Federal Road. In 1858, the town of Alpharetta was officially incorporated. The town was named after the Greek word for “first town”.
In the late 1800s, Alpharetta was a small farming community. The town was known for its peach orchards and cotton fields. In the early 1900s, Alpharetta began to grow as a suburb of Atlanta. The town was connected to Atlanta by the Georgia Railroad in 1906.
In the 1950s, Alpharetta began to experience rapid growth. The population of the town increased from 1,000 in 1950 to over 10,000 by 1970. This growth was due to the expansion of the Atlanta metropolitan area and the development of the area as a bedroom community for Atlanta.
Geography
Alpharetta is located in northern Fulton County, Georgia, United States. It is a suburb of Atlanta and is part of the Atlanta metropolitan area. The city is located at the intersection of Georgia State Route 400 and Georgia State Route 9.
The city has a total area of 27.2 square miles, of which 26.9 square miles is land and 0.3 square miles is water. The city is located in the Piedmont region of Georgia and is surrounded by rolling hills. The city is located in the Chattahoochee River watershed.
Economy
Alpharetta is a major economic center in the Atlanta metropolitan area. The city is home to several corporate headquarters, including AT&T Mobility, Cox Communications, and Verizon Wireless. The city is also home to several technology companies, including IBM, Microsoft, and Oracle.
The city is also home to several shopping centers, including North Point Mall, Avalon, and The Forum. The city is also home to several restaurants, bars, and entertainment venues.
Demographics
As of the 2010 census, Alpharetta had a population of 57,551. The racial makeup of the city was 68.2% White, 16.3% African American, 0.3% Native American, 8.2% Asian, 0.1% Pacific Islander, 3.2% from other races, and 3.0% from two or more races. Hispanic or Latino of any race were 8.7% of the population.
The median income for a household in the city was $87,811, and the median income for a family was $103,817. The per capita income for the city was $41,945. About 4.2% of families and 5.7% of the population were below the poverty line, including 6.7% of those under age 18 and 4.2% of those age 65 or over.
Common Questions
What is Per Capita Income in Alpharetta?
Per Capita income in Alpharetta is $68,391.
What is the Median Family Income in Alpharetta?
Median Family Income in Alpharetta is $176,705.
What is the Median Household income in Alpharetta?
Median Household Income in Alpharetta is $141,402.
What is Income or Wage Gap in Alpharetta?
Income or Wage Gap in Alpharetta is 43.2%.
Women in Alpharetta earn 56.8 cents for every dollar earned by a man.
What is Family Income Deficit in Alpharetta?
Family Income Deficit in Alpharetta is $10,663.
Families that are below poverty line in Alpharetta earn $10,663 less on average than the poverty threshold level.
What is Inequality or Gini Index in Alpharetta?
Inequality or Gini Index in Alpharetta is 0.46.
What is the Total Population of Alpharetta?
Total Population of Alpharetta is 65,884.
What is the Total Male Population of Alpharetta?
Total Male Population of Alpharetta is 33,265.
What is the Total Female Population of Alpharetta?
Total Female Population of Alpharetta is 32,619.
What is the Ratio of Males per 100 Females in Alpharetta?
There are 101.98 Males per 100 Females in Alpharetta.
What is the Ratio of Females per 100 Males in Alpharetta?
There are 98.06 Females per 100 Males in Alpharetta.
What is the Median Population Age in Alpharetta?
Median Population Age in Alpharetta is 40.6 Years.
What is the Average Family Size in Alpharetta
Average Family Size in Alpharetta is 3.2 People.
What is the Average Household Size in Alpharetta
Average Household Size in Alpharetta is 2.7 People.
How Large is the Labor Force in Alpharetta?
There are 36,302 People in the Labor Forcein in Alpharetta.
What is the Percentage of People in the Labor Force in Alpharetta?
71.1% of People are in the Labor Force in Alpharetta.
What is the Unemployment Rate in Alpharetta?
Unemployment Rate in Alpharetta is 4.8%.