Kenner, LA Map & Demographics
Kenner Map
Kenner Overview
$35,300
PER CAPITA INCOME
$78,792
AVG FAMILY INCOME
$60,557
AVG HOUSEHOLD INCOME
31.4%
WAGE / INCOME GAP [ % ]
68.6¢/ $1
WAGE / INCOME GAP [ $ ]
$10,923
FAMILY INCOME DEFICIT
0.48
INEQUALITY / GINI INDEX
65,785
TOTAL POPULATION
30,762
MALE POPULATION
35,023
FEMALE POPULATION
87.83
MALES / 100 FEMALES
113.85
FEMALES / 100 MALES
38.4
MEDIAN AGE
3.2
AVG FAMILY SIZE
2.5
AVG HOUSEHOLD SIZE
34,649
LABOR FORCE [ PEOPLE ]
66.5%
PERCENT IN LABOR FORCE
5.7%
UNEMPLOYMENT RATE
Kenner Area Codes
Income in Kenner
Income Overview in Kenner
Per Capita Income in Kenner is $35,300, while median incomes of families and households are $78,792 and $60,557 respectively.
| Characteristic | Number | Measure |
| Per Capita Income | 65,785 | $35,300 |
| Median Family Income | 16,623 | $78,792 |
| Mean Family Income | 16,623 | $104,238 |
| Median Household Income | 26,172 | $60,557 |
| Mean Household Income | 26,172 | $87,875 |
| Income Deficit | 16,623 | $10,923 |
| Wage / Income Gap (%) | 65,785 | 31.38% |
| Wage / Income Gap ($) | 65,785 | 68.62¢ per $1 |
| Gini / Inequality Index | 65,785 | 0.48 |
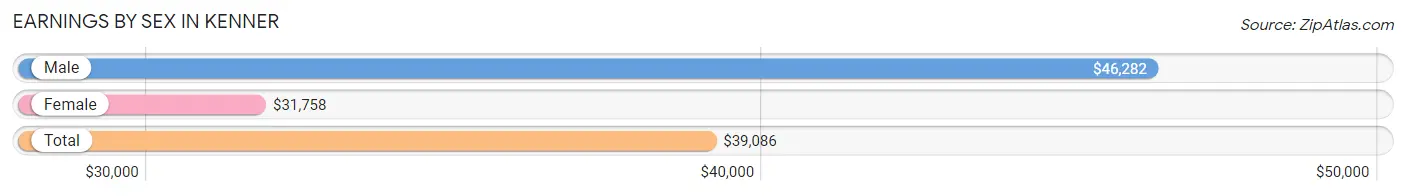
Earnings by Sex in Kenner
Average Earnings in Kenner are $39,086, $46,282 for men and $31,758 for women, a difference of 31.4%.
| Sex | Number | Average Earnings |
| Male | 18,410 (52.1%) | $46,282 |
| Female | 16,908 (47.9%) | $31,758 |
| Total | 35,318 (100.0%) | $39,086 |
Earnings by Sex by Income Bracket in Kenner
The most common earnings brackets in Kenner are $100,000+ for men (2,845 | 15.4%) and $55,000 to $64,999 for women (1,489 | 8.8%).
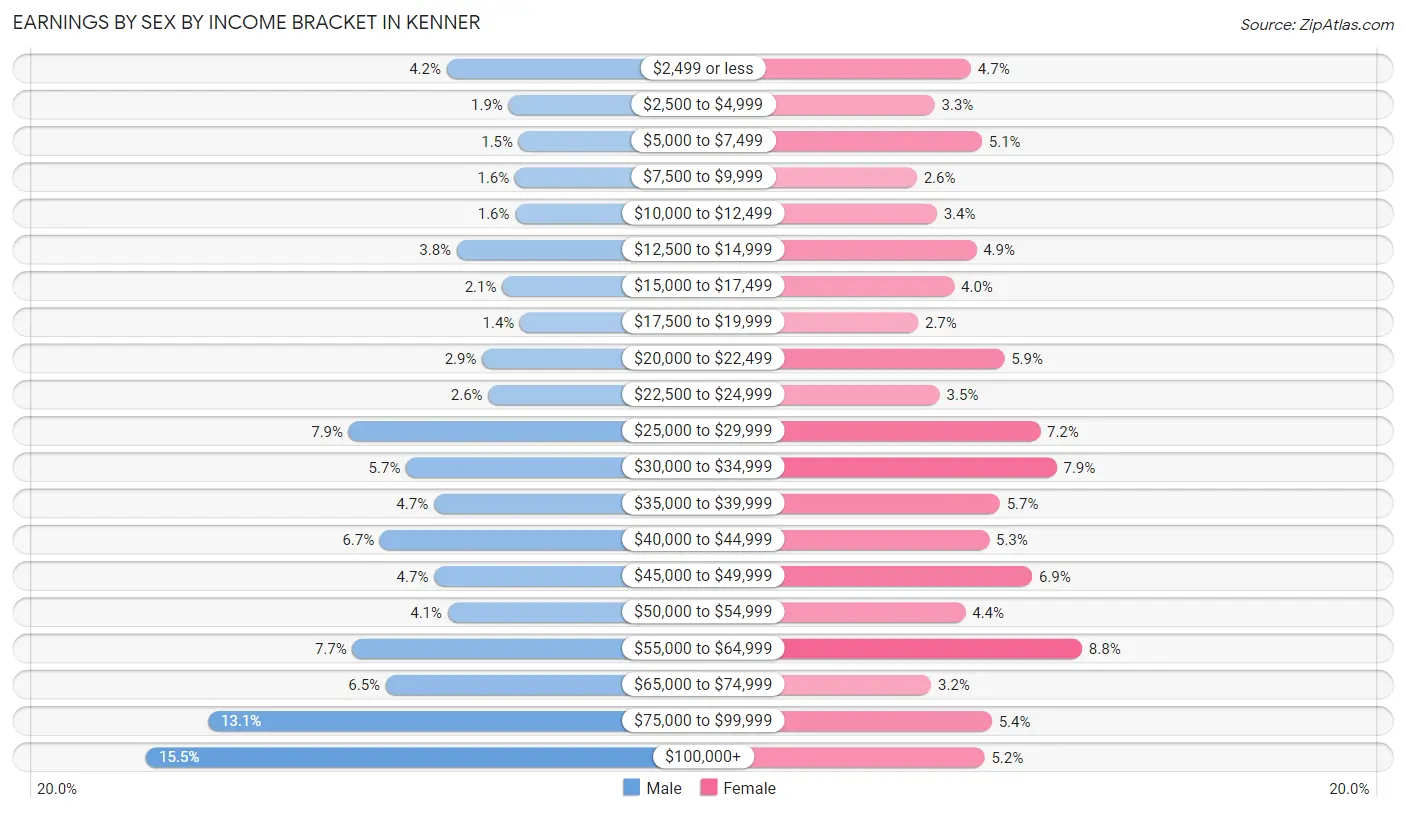
| Income | Male | Female |
| $2,499 or less | 769 (4.2%) | 786 (4.6%) |
| $2,500 to $4,999 | 343 (1.9%) | 557 (3.3%) |
| $5,000 to $7,499 | 273 (1.5%) | 855 (5.1%) |
| $7,500 to $9,999 | 299 (1.6%) | 443 (2.6%) |
| $10,000 to $12,499 | 297 (1.6%) | 569 (3.4%) |
| $12,500 to $14,999 | 699 (3.8%) | 820 (4.9%) |
| $15,000 to $17,499 | 387 (2.1%) | 680 (4.0%) |
| $17,500 to $19,999 | 264 (1.4%) | 452 (2.7%) |
| $20,000 to $22,499 | 525 (2.9%) | 997 (5.9%) |
| $22,500 to $24,999 | 483 (2.6%) | 588 (3.5%) |
| $25,000 to $29,999 | 1,446 (7.9%) | 1,224 (7.2%) |
| $30,000 to $34,999 | 1,049 (5.7%) | 1,329 (7.9%) |
| $35,000 to $39,999 | 858 (4.7%) | 969 (5.7%) |
| $40,000 to $44,999 | 1,229 (6.7%) | 901 (5.3%) |
| $45,000 to $49,999 | 856 (4.6%) | 1,174 (6.9%) |
| $50,000 to $54,999 | 762 (4.1%) | 750 (4.4%) |
| $55,000 to $64,999 | 1,419 (7.7%) | 1,489 (8.8%) |
| $65,000 to $74,999 | 1,190 (6.5%) | 535 (3.2%) |
| $75,000 to $99,999 | 2,417 (13.1%) | 918 (5.4%) |
| $100,000+ | 2,845 (15.4%) | 872 (5.2%) |
| Total | 18,410 (100.0%) | 16,908 (100.0%) |
Earnings by Sex by Educational Attainment in Kenner
Average earnings in Kenner are $50,108 for men and $33,853 for women, a difference of 32.4%. Men with an educational attainment of graduate degree enjoy the highest average annual earnings of $80,313, while those with less than high school education earn the least with $31,642. Women with an educational attainment of bachelor's degree earn the most with the average annual earnings of $52,596, while those with less than high school education have the smallest earnings of $21,058.
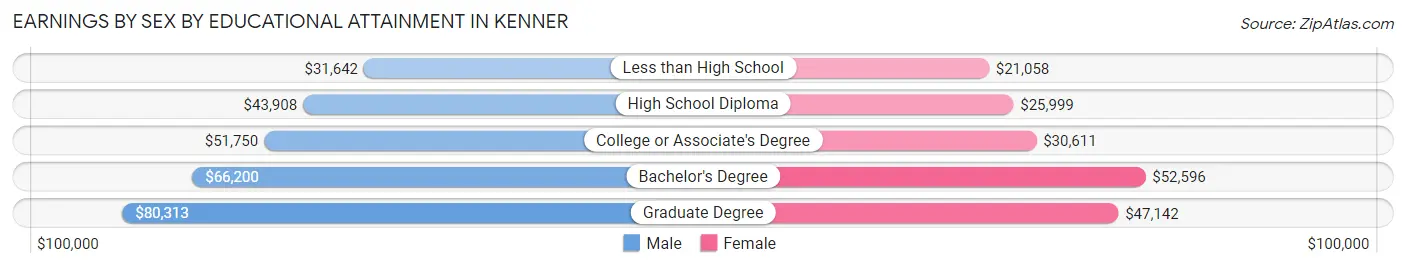
| Educational Attainment | Male Income | Female Income |
| Less than High School | $31,642 | $21,058 |
| High School Diploma | $43,908 | $25,999 |
| College or Associate's Degree | $51,750 | $30,611 |
| Bachelor's Degree | $66,200 | $52,596 |
| Graduate Degree | $80,313 | $47,142 |
| Total | $50,108 | $33,853 |
Family Income in Kenner
Family Income Brackets in Kenner
According to the Kenner family income data, there are 3,042 families falling into the $100,000 to $149,999 income range, which is the most common income bracket and makes up 18.3% of all families. Conversely, the $10,000 to $14,999 income bracket is the least frequent group with only 366 families (2.2%) belonging to this category.
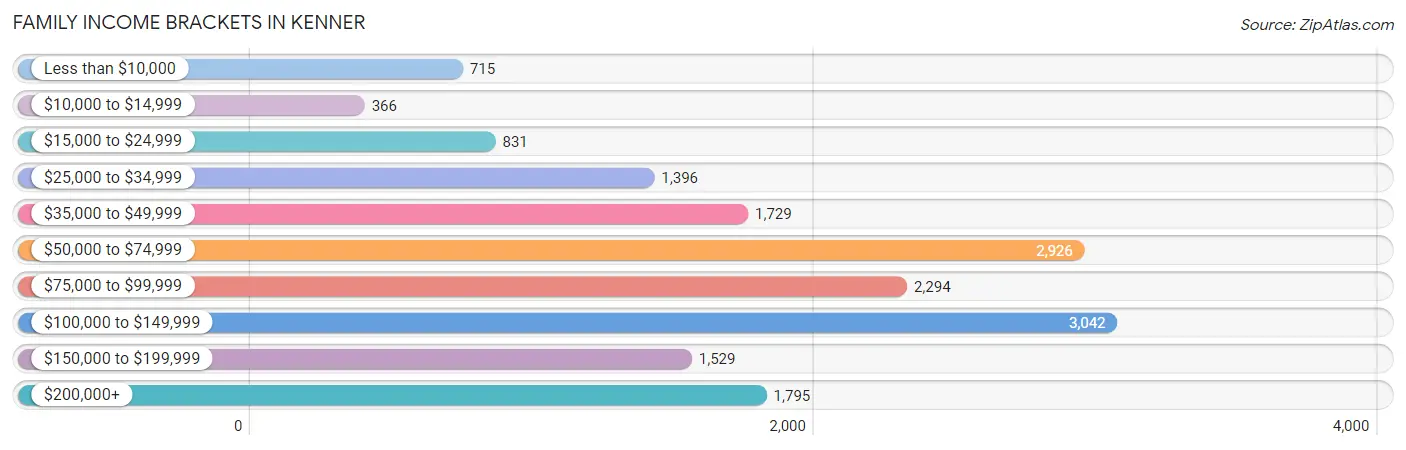
| Income Bracket | # Families | % Families |
| Less than $10,000 | 715 | 4.3% |
| $10,000 to $14,999 | 366 | 2.2% |
| $15,000 to $24,999 | 831 | 5.0% |
| $25,000 to $34,999 | 1,396 | 8.4% |
| $35,000 to $49,999 | 1,729 | 10.4% |
| $50,000 to $74,999 | 2,926 | 17.6% |
| $75,000 to $99,999 | 2,294 | 13.8% |
| $100,000 to $149,999 | 3,042 | 18.3% |
| $150,000 to $199,999 | 1,529 | 9.2% |
| $200,000+ | 1,795 | 10.8% |
Family Income by Famaliy Size in Kenner
7+ person families (327 | 2.0%) account for the highest median family income in Kenner with $100,886 per family, while 2-person families (7,440 | 44.8%) have the highest median income of $33,817 per family member.
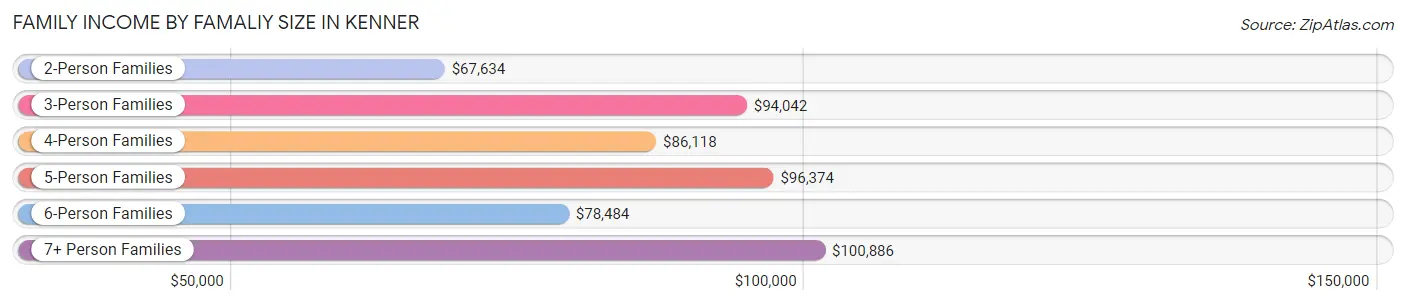
| Income Bracket | # Families | Median Income |
| 2-Person Families | 7,440 (44.8%) | $67,634 |
| 3-Person Families | 3,902 (23.5%) | $94,042 |
| 4-Person Families | 3,355 (20.2%) | $86,118 |
| 5-Person Families | 1,355 (8.2%) | $96,374 |
| 6-Person Families | 244 (1.5%) | $78,484 |
| 7+ Person Families | 327 (2.0%) | $100,886 |
| Total | 16,623 (100.0%) | $78,792 |
Family Income by Number of Earners in Kenner
The median family income in Kenner is $78,792, with families comprising 3+ earners (2,440) having the highest median family income of $130,440, while families with no earners (1,986) have the lowest median family income of $34,423, accounting for 14.7% and 11.9% of families, respectively.
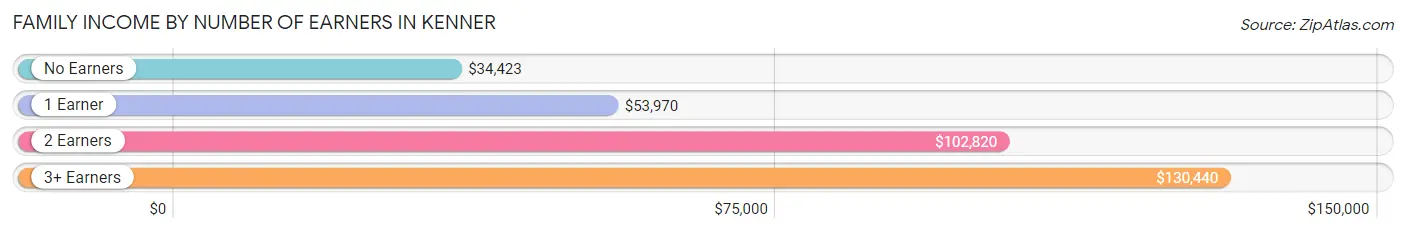
| Number of Earners | # Families | Median Income |
| No Earners | 1,986 (11.9%) | $34,423 |
| 1 Earner | 5,833 (35.1%) | $53,970 |
| 2 Earners | 6,364 (38.3%) | $102,820 |
| 3+ Earners | 2,440 (14.7%) | $130,440 |
| Total | 16,623 (100.0%) | $78,792 |
Household Income in Kenner
Household Income Brackets in Kenner
With 4,920 households falling in the category, the $50,000 to $74,999 income range is the most frequent in Kenner, accounting for 18.8% of all households. In contrast, only 1,073 households (4.1%) fall into the $10,000 to $14,999 income bracket, making it the least populous group.
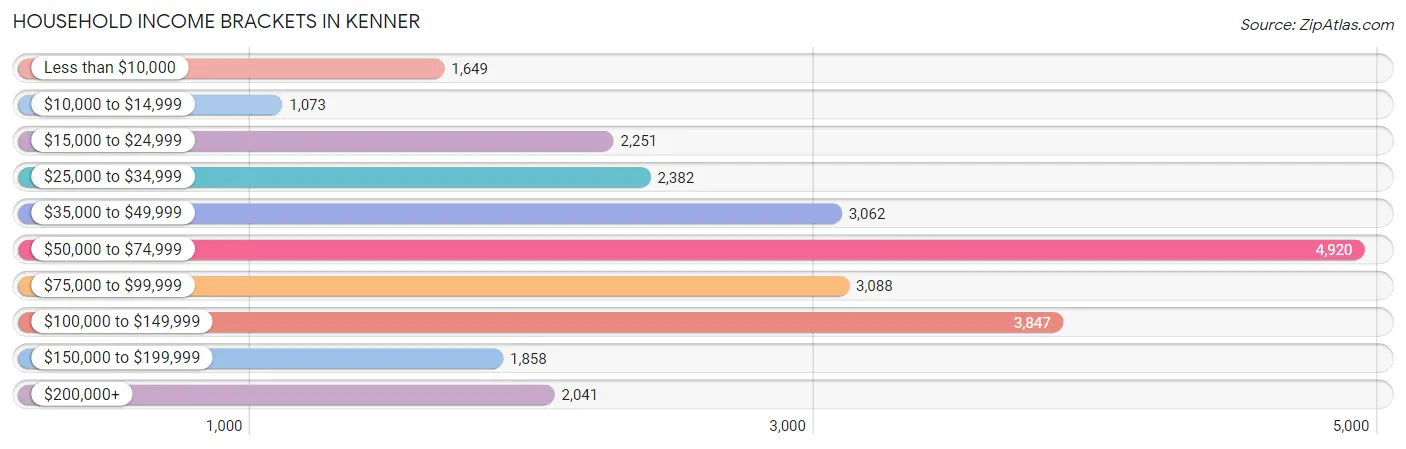
| Income Bracket | # Households | % Households |
| Less than $10,000 | 1,649 | 6.3% |
| $10,000 to $14,999 | 1,073 | 4.1% |
| $15,000 to $24,999 | 2,251 | 8.6% |
| $25,000 to $34,999 | 2,382 | 9.1% |
| $35,000 to $49,999 | 3,062 | 11.7% |
| $50,000 to $74,999 | 4,920 | 18.8% |
| $75,000 to $99,999 | 3,088 | 11.8% |
| $100,000 to $149,999 | 3,847 | 14.7% |
| $150,000 to $199,999 | 1,858 | 7.1% |
| $200,000+ | 2,041 | 7.8% |
Household Income by Householder Age in Kenner
The median household income in Kenner is $60,557, with the highest median household income of $82,968 found in the 45 to 64 years age bracket for the primary householder. A total of 9,787 households (37.4%) fall into this category. Meanwhile, the 65+ years age bracket for the primary householder has the lowest median household income of $49,223, with 7,042 households (26.9%) in this group.
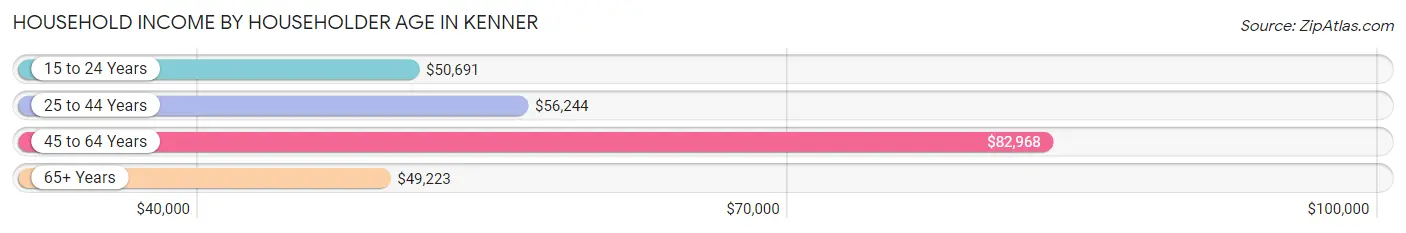
| Income Bracket | # Households | Median Income |
| 15 to 24 Years | 927 (3.5%) | $50,691 |
| 25 to 44 Years | 8,416 (32.2%) | $56,244 |
| 45 to 64 Years | 9,787 (37.4%) | $82,968 |
| 65+ Years | 7,042 (26.9%) | $49,223 |
| Total | 26,172 (100.0%) | $60,557 |
Poverty in Kenner
Income Below Poverty by Sex and Age in Kenner
With 13.5% poverty level for males and 15.8% for females among the residents of Kenner, 15 year old males and 15 year old females are the most vulnerable to poverty, with 162 males (32.7%) and 194 females (38.3%) in their respective age groups living below the poverty level.
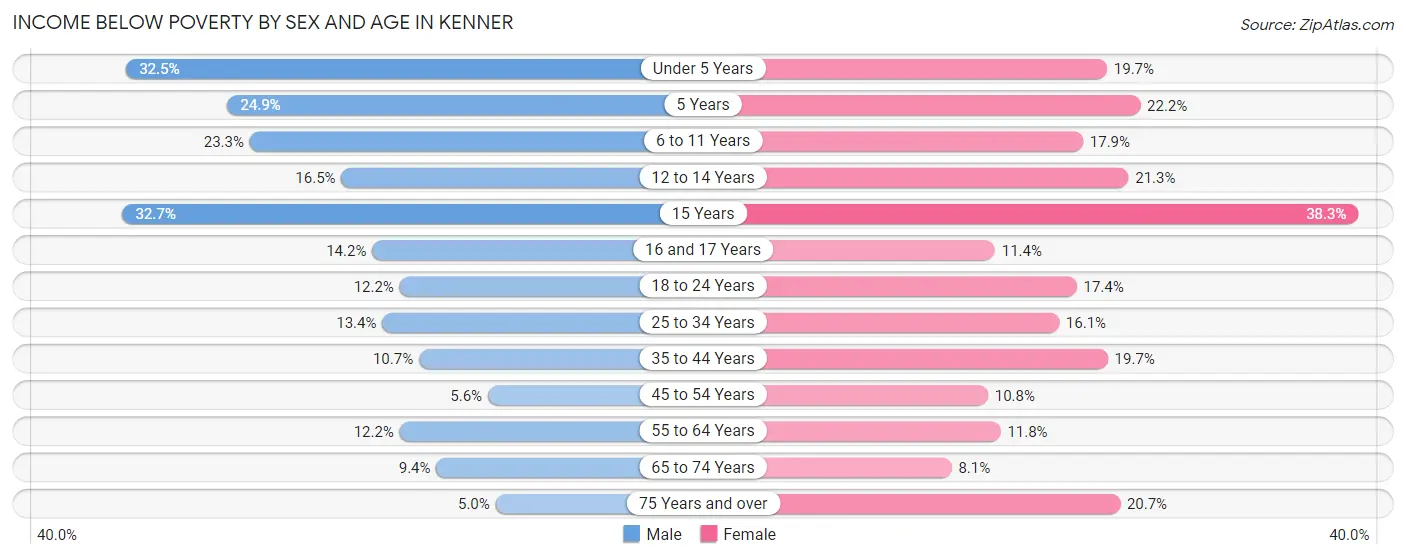
| Age Bracket | Male | Female |
| Under 5 Years | 685 (32.5%) | 461 (19.7%) |
| 5 Years | 99 (24.9%) | 105 (22.2%) |
| 6 to 11 Years | 495 (23.3%) | 499 (17.9%) |
| 12 to 14 Years | 211 (16.5%) | 207 (21.3%) |
| 15 Years | 162 (32.7%) | 194 (38.3%) |
| 16 and 17 Years | 101 (14.2%) | 90 (11.4%) |
| 18 to 24 Years | 245 (12.1%) | 484 (17.4%) |
| 25 to 34 Years | 555 (13.4%) | 777 (16.1%) |
| 35 to 44 Years | 472 (10.7%) | 901 (19.7%) |
| 45 to 54 Years | 240 (5.6%) | 431 (10.8%) |
| 55 to 64 Years | 482 (12.1%) | 486 (11.8%) |
| 65 to 74 Years | 297 (9.4%) | 331 (8.1%) |
| 75 Years and over | 79 (5.0%) | 502 (20.6%) |
| Total | 4,123 (13.5%) | 5,468 (15.8%) |
Income Above Poverty by Sex and Age in Kenner
According to the poverty statistics in Kenner, males aged 75 years and over and females aged 65 to 74 years are the age groups that are most secure financially, with 95.0% of males and 91.9% of females in these age groups living above the poverty line.
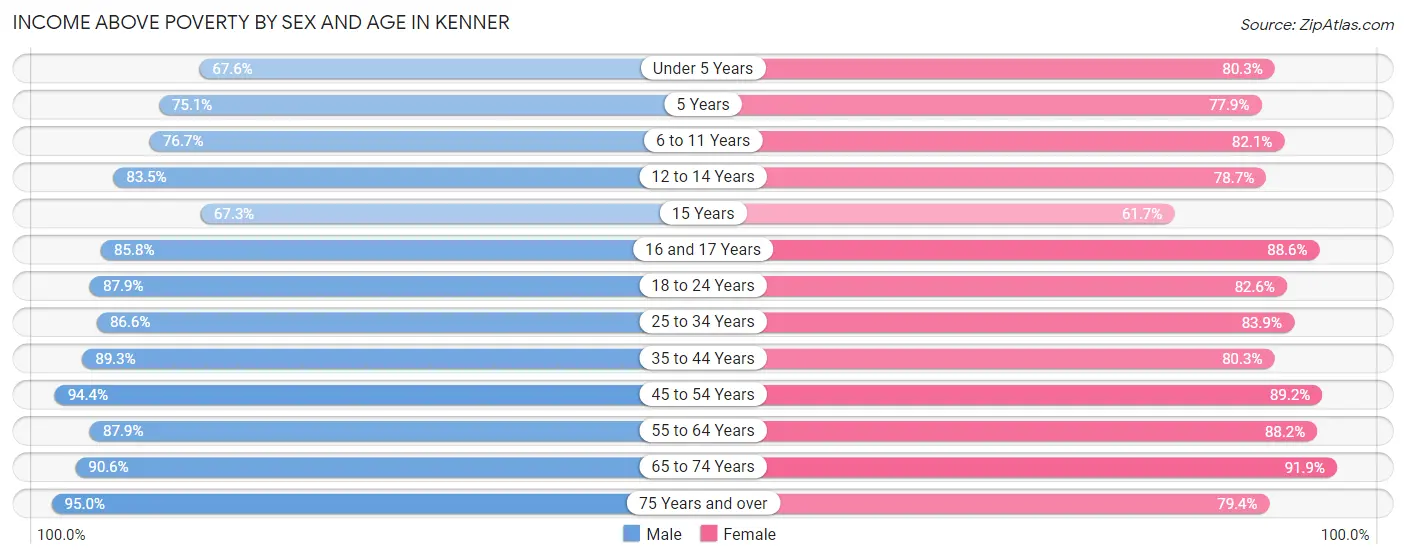
| Age Bracket | Male | Female |
| Under 5 Years | 1,426 (67.5%) | 1,881 (80.3%) |
| 5 Years | 298 (75.1%) | 369 (77.8%) |
| 6 to 11 Years | 1,631 (76.7%) | 2,288 (82.1%) |
| 12 to 14 Years | 1,069 (83.5%) | 766 (78.7%) |
| 15 Years | 333 (67.3%) | 312 (61.7%) |
| 16 and 17 Years | 611 (85.8%) | 702 (88.6%) |
| 18 to 24 Years | 1,772 (87.8%) | 2,293 (82.6%) |
| 25 to 34 Years | 3,573 (86.6%) | 4,042 (83.9%) |
| 35 to 44 Years | 3,931 (89.3%) | 3,664 (80.3%) |
| 45 to 54 Years | 4,045 (94.4%) | 3,544 (89.2%) |
| 55 to 64 Years | 3,486 (87.8%) | 3,639 (88.2%) |
| 65 to 74 Years | 2,852 (90.6%) | 3,734 (91.9%) |
| 75 Years and over | 1,493 (95.0%) | 1,929 (79.3%) |
| Total | 26,520 (86.6%) | 29,163 (84.2%) |
Income Below Poverty Among Married-Couple Families in Kenner
The poverty statistics for married-couple families in Kenner show that 7.2% or 804 of the total 11,207 families live below the poverty line. Families with 5 or more children have the highest poverty rate of 41.2%, comprising of 40 families. On the other hand, families with no children have the lowest poverty rate of 3.3%, which includes 215 families.
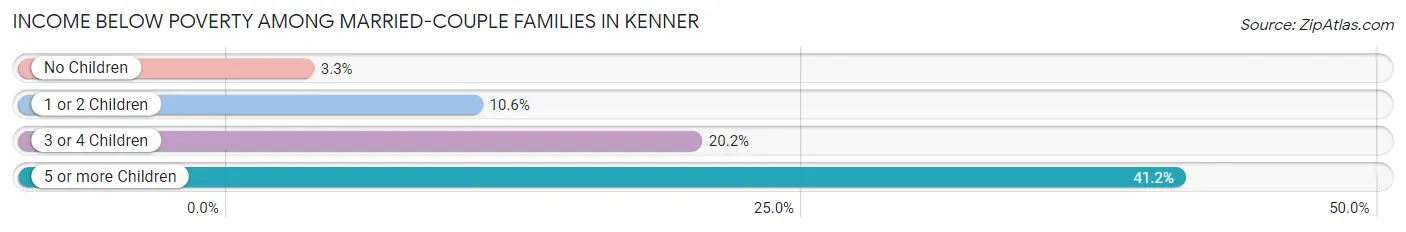
| Children | Above Poverty | Below Poverty |
| No Children | 6,296 (96.7%) | 215 (3.3%) |
| 1 or 2 Children | 3,552 (89.4%) | 423 (10.6%) |
| 3 or 4 Children | 498 (79.8%) | 126 (20.2%) |
| 5 or more Children | 57 (58.8%) | 40 (41.2%) |
| Total | 10,403 (92.8%) | 804 (7.2%) |
Income Below Poverty Among Single-Parent Households in Kenner
According to the poverty data in Kenner, 15.4% or 223 single-father households and 21.5% or 855 single-mother households are living below the poverty line. Among single-father households, those with 3 or 4 children have the highest poverty rate, with 34 households (44.2%) experiencing poverty. Likewise, among single-mother households, those with 5 or more children have the highest poverty rate, with 68 households (100.0%) falling below the poverty line.
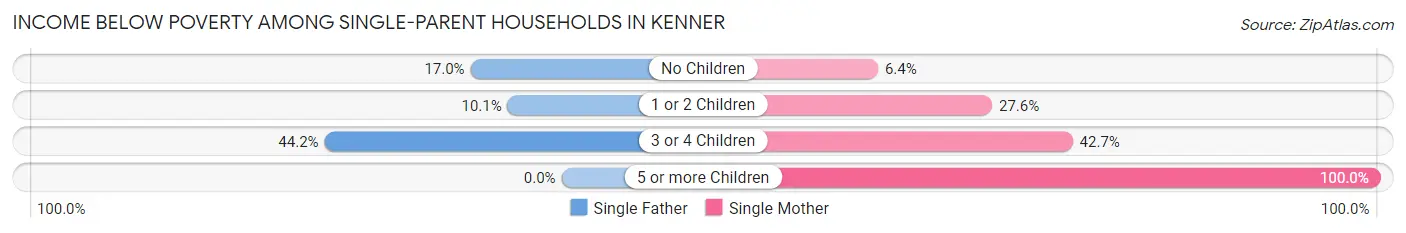
| Children | Single Father | Single Mother |
| No Children | 126 (17.0%) | 103 (6.4%) |
| 1 or 2 Children | 63 (10.1%) | 539 (27.6%) |
| 3 or 4 Children | 34 (44.2%) | 145 (42.6%) |
| 5 or more Children | 0 (0.0%) | 68 (100.0%) |
| Total | 223 (15.4%) | 855 (21.5%) |
Income Below Poverty Among Married-Couple vs Single-Parent Households in Kenner
The poverty data for Kenner shows that 804 of the married-couple family households (7.2%) and 1,078 of the single-parent households (19.9%) are living below the poverty level. Within the married-couple family households, those with 5 or more children have the highest poverty rate, with 40 households (41.2%) falling below the poverty line. Among the single-parent households, those with 5 or more children have the highest poverty rate, with 68 household (100.0%) living below poverty.
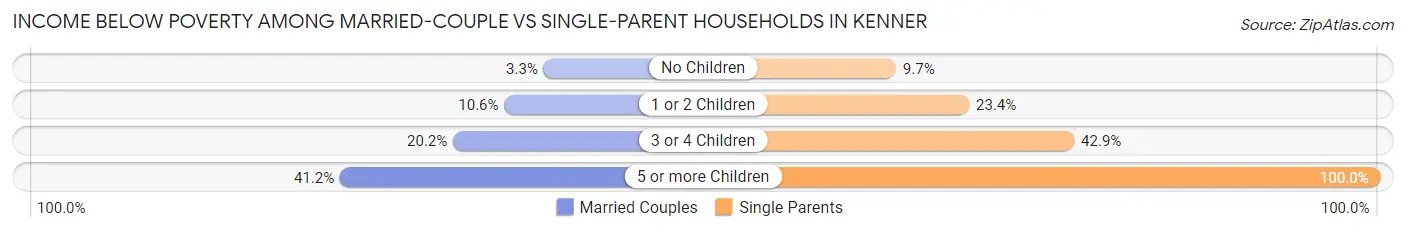
| Children | Married-Couple Families | Single-Parent Households |
| No Children | 215 (3.3%) | 229 (9.7%) |
| 1 or 2 Children | 423 (10.6%) | 602 (23.4%) |
| 3 or 4 Children | 126 (20.2%) | 179 (42.9%) |
| 5 or more Children | 40 (41.2%) | 68 (100.0%) |
| Total | 804 (7.2%) | 1,078 (19.9%) |
Race in Kenner
The most populous races in Kenner are White / Caucasian (38,466 | 58.5%), Hispanic or Latino (16,781 | 25.5%), and Black / African American (11,886 | 18.1%).
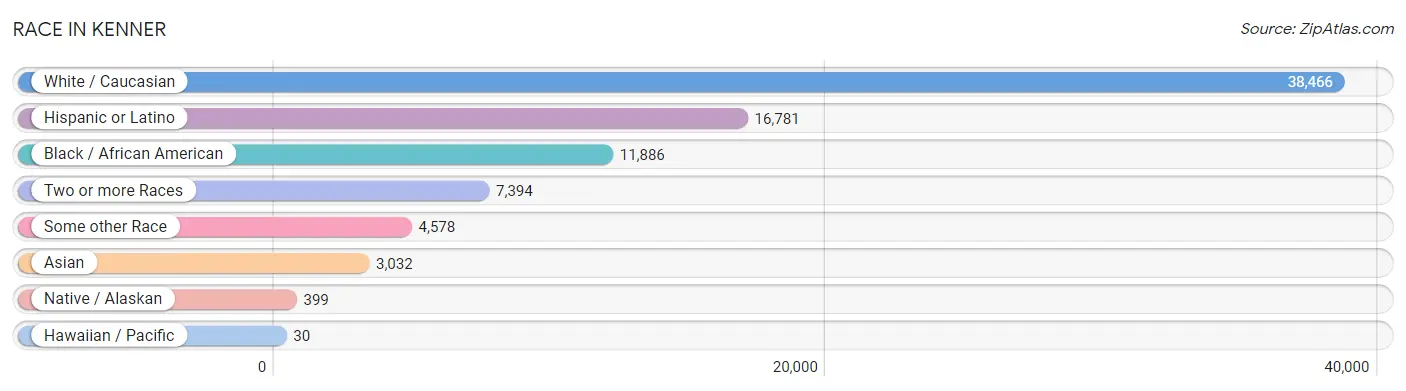
| Race | # Population | % Population |
| Asian | 3,032 | 4.6% |
| Black / African American | 11,886 | 18.1% |
| Hawaiian / Pacific | 30 | 0.1% |
| Hispanic or Latino | 16,781 | 25.5% |
| Native / Alaskan | 399 | 0.6% |
| White / Caucasian | 38,466 | 58.5% |
| Two or more Races | 7,394 | 11.2% |
| Some other Race | 4,578 | 7.0% |
| Total | 65,785 | 100.0% |
Ancestry in Kenner
The most populous ancestries reported in Kenner are Central American (9,145 | 13.9%), Italian (6,601 | 10.0%), Honduran (6,255 | 9.5%), French (5,941 | 9.0%), and German (5,587 | 8.5%), together accounting for 51.0% of all Kenner residents.
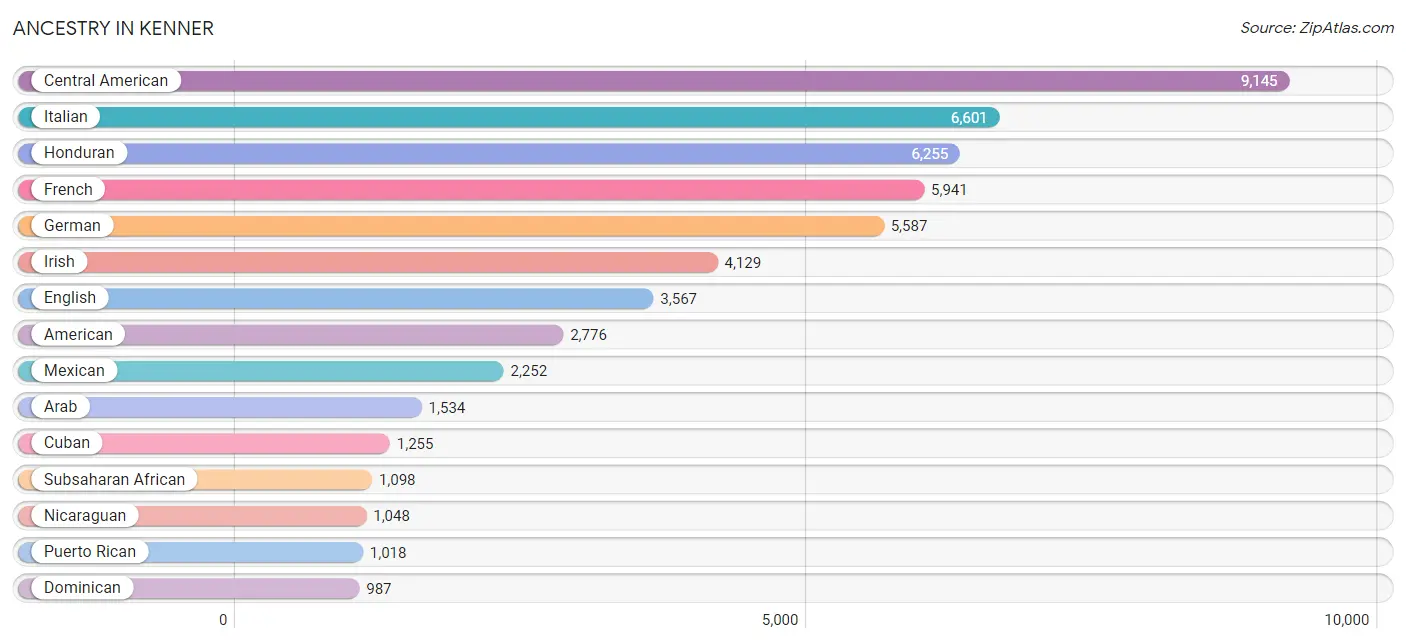
| Ancestry | # Population | % Population |
| African | 644 | 1.0% |
| Alsatian | 12 | 0.0% |
| American | 2,776 | 4.2% |
| Arab | 1,534 | 2.3% |
| Argentinean | 5 | 0.0% |
| Austrian | 28 | 0.0% |
| Belgian | 21 | 0.0% |
| Belizean | 79 | 0.1% |
| Bhutanese | 541 | 0.8% |
| Bolivian | 196 | 0.3% |
| Brazilian | 52 | 0.1% |
| British | 158 | 0.2% |
| Bulgarian | 28 | 0.0% |
| Cajun | 147 | 0.2% |
| Canadian | 19 | 0.0% |
| Central American | 9,145 | 13.9% |
| Central American Indian | 54 | 0.1% |
| Cherokee | 44 | 0.1% |
| Chickasaw | 40 | 0.1% |
| Choctaw | 1 | 0.0% |
| Colombian | 52 | 0.1% |
| Costa Rican | 169 | 0.3% |
| Cree | 31 | 0.1% |
| Cuban | 1,255 | 1.9% |
| Czech | 17 | 0.0% |
| Czechoslovakian | 19 | 0.0% |
| Danish | 9 | 0.0% |
| Dominican | 987 | 1.5% |
| Dutch | 147 | 0.2% |
| Eastern European | 15 | 0.0% |
| Ecuadorian | 233 | 0.4% |
| Egyptian | 480 | 0.7% |
| English | 3,567 | 5.4% |
| Ethiopian | 130 | 0.2% |
| European | 527 | 0.8% |
| Filipino | 74 | 0.1% |
| French | 5,941 | 9.0% |
| French Canadian | 494 | 0.7% |
| German | 5,587 | 8.5% |
| Greek | 67 | 0.1% |
| Guatemalan | 671 | 1.0% |
| Haitian | 20 | 0.0% |
| Honduran | 6,255 | 9.5% |
| Houma | 106 | 0.2% |
| Indian (Asian) | 794 | 1.2% |
| Iranian | 198 | 0.3% |
| Irish | 4,129 | 6.3% |
| Israeli | 35 | 0.1% |
| Italian | 6,601 | 10.0% |
| Jamaican | 27 | 0.0% |
| Japanese | 70 | 0.1% |
| Jordanian | 252 | 0.4% |
| Korean | 90 | 0.1% |
| Lebanese | 101 | 0.2% |
| Malaysian | 43 | 0.1% |
| Mexican | 2,252 | 3.4% |
| Mexican American Indian | 59 | 0.1% |
| Navajo | 52 | 0.1% |
| Nicaraguan | 1,048 | 1.6% |
| Nigerian | 180 | 0.3% |
| Norwegian | 80 | 0.1% |
| Pakistani | 54 | 0.1% |
| Palestinian | 332 | 0.5% |
| Panamanian | 2 | 0.0% |
| Peruvian | 230 | 0.4% |
| Polish | 167 | 0.3% |
| Puerto Rican | 1,018 | 1.5% |
| Romanian | 114 | 0.2% |
| Russian | 207 | 0.3% |
| Salvadoran | 815 | 1.2% |
| Scandinavian | 48 | 0.1% |
| Scotch-Irish | 286 | 0.4% |
| Scottish | 461 | 0.7% |
| Sioux | 4 | 0.0% |
| Slovene | 80 | 0.1% |
| Somali | 68 | 0.1% |
| South American | 806 | 1.2% |
| Spaniard | 203 | 0.3% |
| Spanish | 175 | 0.3% |
| Spanish American Indian | 58 | 0.1% |
| Sri Lankan | 922 | 1.4% |
| Subsaharan African | 1,098 | 1.7% |
| Swedish | 63 | 0.1% |
| Swiss | 46 | 0.1% |
| Syrian | 66 | 0.1% |
| Thai | 270 | 0.4% |
| Turkish | 30 | 0.1% |
| Ukrainian | 59 | 0.1% |
| Venezuelan | 75 | 0.1% |
| Vietnamese | 25 | 0.0% |
| Welsh | 71 | 0.1% |
| West Indian | 28 | 0.0% |
| Yugoslavian | 38 | 0.1% | View All 93 Rows |
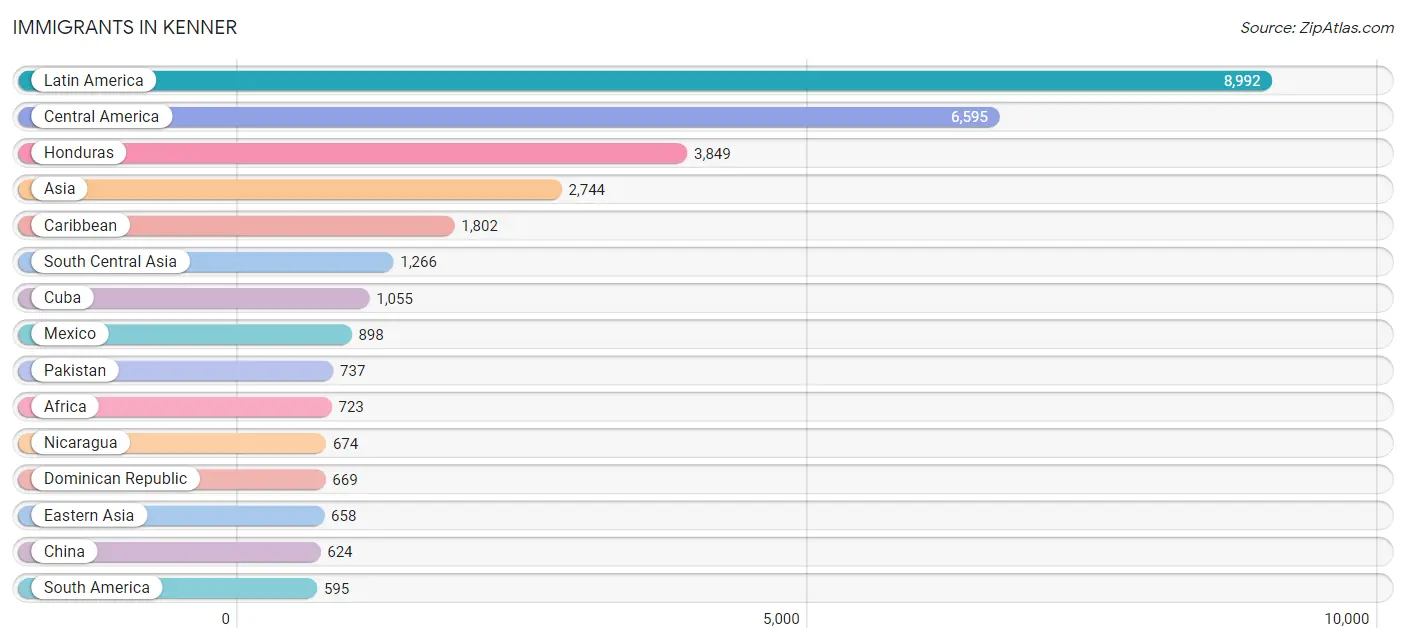
Immigrants in Kenner
The most numerous immigrant groups reported in Kenner came from Latin America (8,992 | 13.7%), Central America (6,595 | 10.0%), Honduras (3,849 | 5.9%), Asia (2,744 | 4.2%), and Caribbean (1,802 | 2.7%), together accounting for 36.5% of all Kenner residents.
| Immigration Origin | # Population | % Population |
| Africa | 723 | 1.1% |
| Argentina | 5 | 0.0% |
| Asia | 2,744 | 4.2% |
| Bangladesh | 14 | 0.0% |
| Belize | 26 | 0.0% |
| Bolivia | 23 | 0.0% |
| Brazil | 195 | 0.3% |
| Bulgaria | 26 | 0.0% |
| Cambodia | 19 | 0.0% |
| Canada | 37 | 0.1% |
| Caribbean | 1,802 | 2.7% |
| Central America | 6,595 | 10.0% |
| China | 624 | 0.9% |
| Colombia | 33 | 0.1% |
| Costa Rica | 31 | 0.1% |
| Cuba | 1,055 | 1.6% |
| Dominica | 23 | 0.0% |
| Dominican Republic | 669 | 1.0% |
| Eastern Africa | 107 | 0.2% |
| Eastern Asia | 658 | 1.0% |
| Eastern Europe | 164 | 0.3% |
| Ecuador | 151 | 0.2% |
| Egypt | 316 | 0.5% |
| El Salvador | 535 | 0.8% |
| England | 5 | 0.0% |
| Ethiopia | 56 | 0.1% |
| Europe | 380 | 0.6% |
| France | 13 | 0.0% |
| Germany | 3 | 0.0% |
| Greece | 16 | 0.0% |
| Guatemala | 582 | 0.9% |
| Honduras | 3,849 | 5.9% |
| Hong Kong | 13 | 0.0% |
| India | 172 | 0.3% |
| Iran | 224 | 0.3% |
| Iraq | 80 | 0.1% |
| Italy | 23 | 0.0% |
| Jamaica | 42 | 0.1% |
| Japan | 34 | 0.1% |
| Jordan | 70 | 0.1% |
| Kazakhstan | 9 | 0.0% |
| Kenya | 17 | 0.0% |
| Laos | 43 | 0.1% |
| Latin America | 8,992 | 13.7% |
| Latvia | 17 | 0.0% |
| Lebanon | 70 | 0.1% |
| Mexico | 898 | 1.4% |
| Moldova | 110 | 0.2% |
| Nepal | 70 | 0.1% |
| Netherlands | 25 | 0.0% |
| Nicaragua | 674 | 1.0% |
| Nigeria | 37 | 0.1% |
| Northern Africa | 494 | 0.7% |
| Northern Europe | 55 | 0.1% |
| Norway | 12 | 0.0% |
| Pakistan | 737 | 1.1% |
| Peru | 157 | 0.2% |
| Philippines | 18 | 0.0% |
| Russia | 11 | 0.0% |
| Scotland | 8 | 0.0% |
| Senegal | 11 | 0.0% |
| Somalia | 9 | 0.0% |
| South America | 595 | 0.9% |
| South Central Asia | 1,266 | 1.9% |
| South Eastern Asia | 488 | 0.7% |
| Southern Europe | 120 | 0.2% |
| Spain | 81 | 0.1% |
| Sri Lanka | 40 | 0.1% |
| Syria | 37 | 0.1% |
| Taiwan | 231 | 0.4% |
| Turkey | 18 | 0.0% |
| Venezuela | 31 | 0.1% |
| Vietnam | 408 | 0.6% |
| Western Africa | 72 | 0.1% |
| Western Asia | 275 | 0.4% |
| Western Europe | 41 | 0.1% | View All 76 Rows |
Sex and Age in Kenner
Sex and Age in Kenner
The most populous age groups in Kenner are 35 to 39 Years (2,721 | 8.8%) for men and 35 to 39 Years (2,698 | 7.7%) for women.
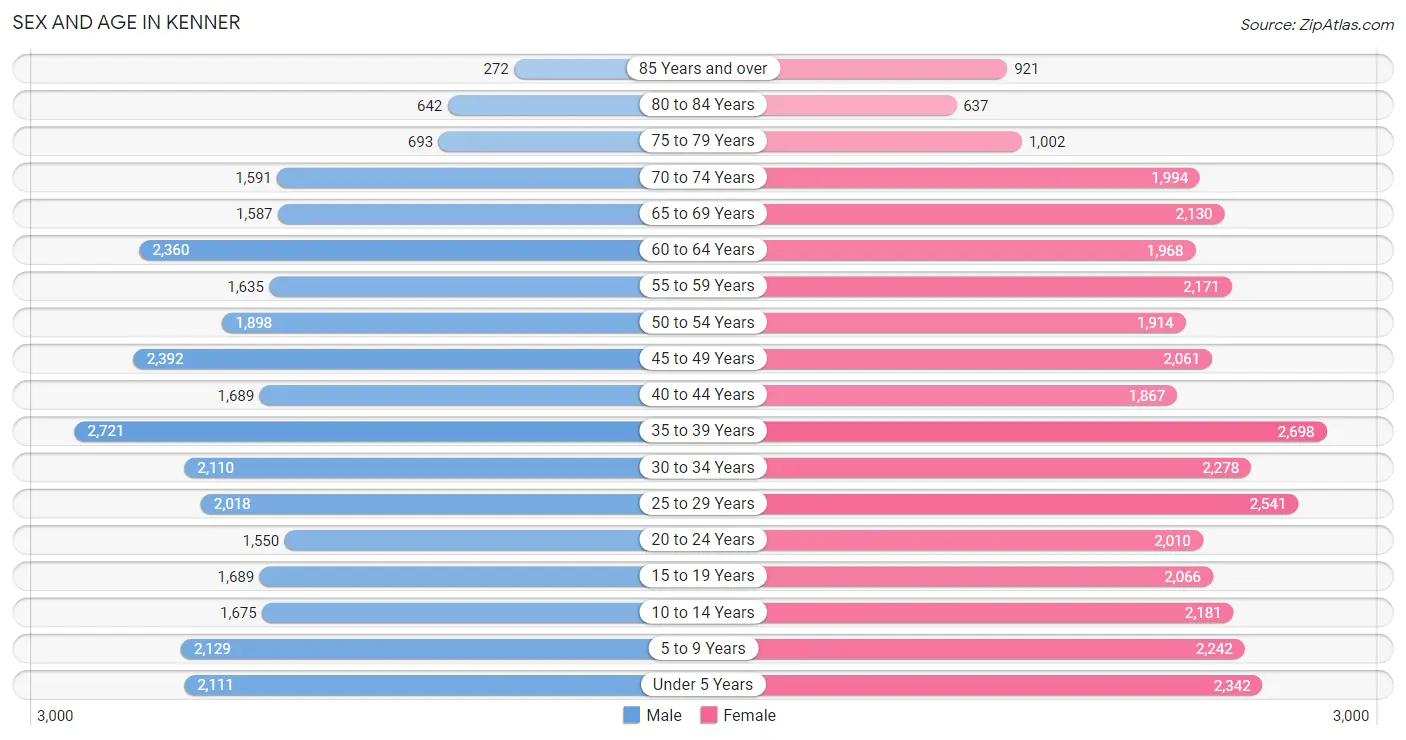
| Age Bracket | Male | Female |
| Under 5 Years | 2,111 (6.9%) | 2,342 (6.7%) |
| 5 to 9 Years | 2,129 (6.9%) | 2,242 (6.4%) |
| 10 to 14 Years | 1,675 (5.4%) | 2,181 (6.2%) |
| 15 to 19 Years | 1,689 (5.5%) | 2,066 (5.9%) |
| 20 to 24 Years | 1,550 (5.0%) | 2,010 (5.7%) |
| 25 to 29 Years | 2,018 (6.6%) | 2,541 (7.3%) |
| 30 to 34 Years | 2,110 (6.9%) | 2,278 (6.5%) |
| 35 to 39 Years | 2,721 (8.8%) | 2,698 (7.7%) |
| 40 to 44 Years | 1,689 (5.5%) | 1,867 (5.3%) |
| 45 to 49 Years | 2,392 (7.8%) | 2,061 (5.9%) |
| 50 to 54 Years | 1,898 (6.2%) | 1,914 (5.5%) |
| 55 to 59 Years | 1,635 (5.3%) | 2,171 (6.2%) |
| 60 to 64 Years | 2,360 (7.7%) | 1,968 (5.6%) |
| 65 to 69 Years | 1,587 (5.2%) | 2,130 (6.1%) |
| 70 to 74 Years | 1,591 (5.2%) | 1,994 (5.7%) |
| 75 to 79 Years | 693 (2.2%) | 1,002 (2.9%) |
| 80 to 84 Years | 642 (2.1%) | 637 (1.8%) |
| 85 Years and over | 272 (0.9%) | 921 (2.6%) |
| Total | 30,762 (100.0%) | 35,023 (100.0%) |
Families and Households in Kenner
Median Family Size in Kenner
The median family size in Kenner is 3.19 persons per family, with single female/mother families (3,969 | 23.9%) accounting for the largest median family size of 3.33 persons per family. On the other hand, single male/father families (1,447 | 8.7%) represent the smallest median family size with 2.76 persons per family.
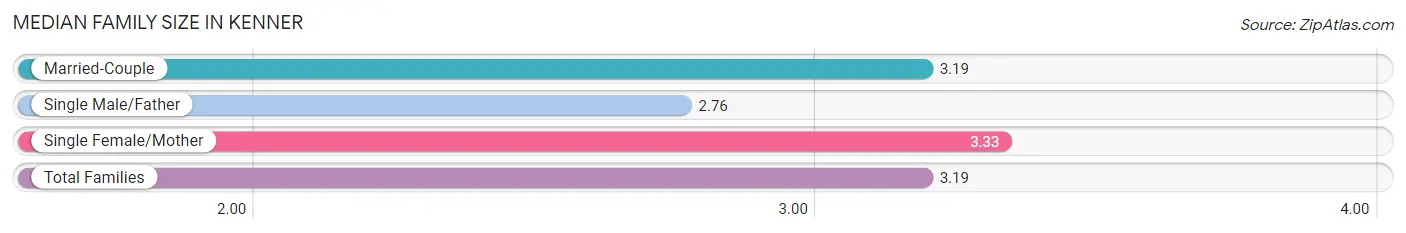
| Family Type | # Families | Family Size |
| Married-Couple | 11,207 (67.4%) | 3.19 |
| Single Male/Father | 1,447 (8.7%) | 2.76 |
| Single Female/Mother | 3,969 (23.9%) | 3.33 |
| Total Families | 16,623 (100.0%) | 3.19 |
Median Household Size in Kenner
The median household size in Kenner is 2.50 persons per household, with single female/mother households (3,969 | 15.2%) accounting for the largest median household size of 3.43 persons per household. non-family households (9,549 | 36.5%) represent the smallest median household size with 1.20 persons per household.
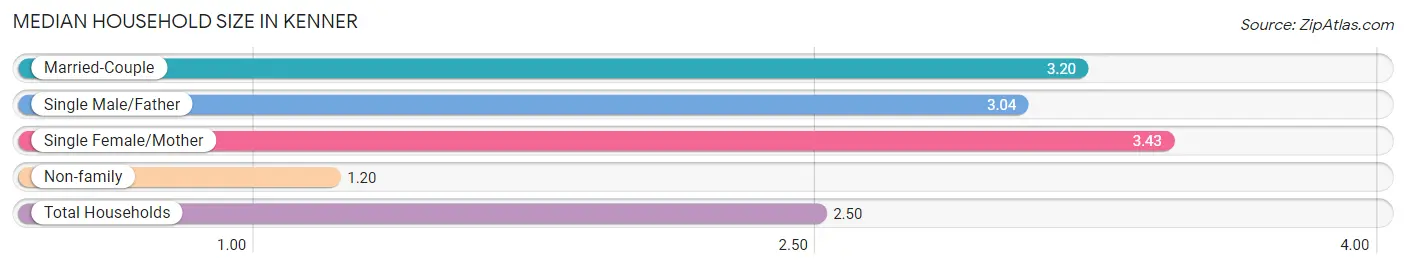
| Household Type | # Households | Household Size |
| Married-Couple | 11,207 (42.8%) | 3.20 |
| Single Male/Father | 1,447 (5.5%) | 3.04 |
| Single Female/Mother | 3,969 (15.2%) | 3.43 |
| Non-family | 9,549 (36.5%) | 1.20 |
| Total Households | 26,172 (100.0%) | 2.50 |
Household Size by Marriage Status in Kenner
Out of a total of 26,172 households in Kenner, 16,623 (63.5%) are family households, while 9,549 (36.5%) are nonfamily households. The most numerous type of family households are 2-person households, comprising 6,902, and the most common type of nonfamily households are 1-person households, comprising 8,293.
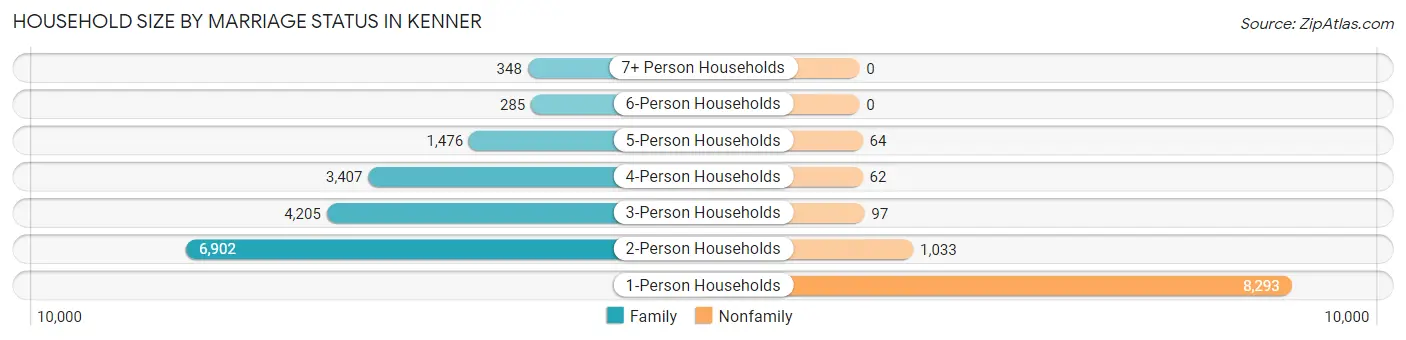
| Household Size | Family Households | Nonfamily Households |
| 1-Person Households | - | 8,293 (31.7%) |
| 2-Person Households | 6,902 (26.4%) | 1,033 (4.0%) |
| 3-Person Households | 4,205 (16.1%) | 97 (0.4%) |
| 4-Person Households | 3,407 (13.0%) | 62 (0.2%) |
| 5-Person Households | 1,476 (5.6%) | 64 (0.2%) |
| 6-Person Households | 285 (1.1%) | 0 (0.0%) |
| 7+ Person Households | 348 (1.3%) | 0 (0.0%) |
| Total | 16,623 (63.5%) | 9,549 (36.5%) |
Female Fertility in Kenner
Fertility by Age in Kenner
Average fertility rate in Kenner is 42.0 births per 1,000 women. Women in the age bracket of 20 to 34 years have the highest fertility rate with 73.0 births per 1,000 women. Women in the age bracket of 20 to 34 years acount for 73.5% of all women with births.
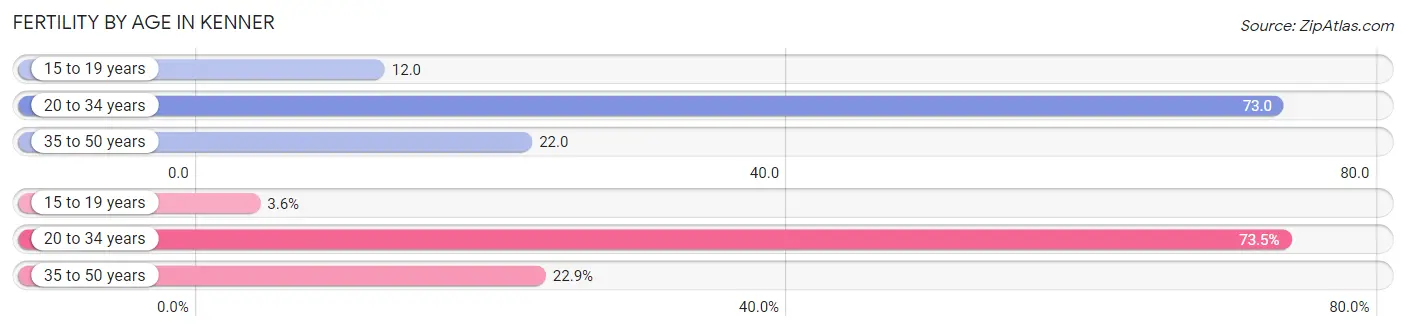
| Age Bracket | Women with Births | Births / 1,000 Women |
| 15 to 19 years | 24 (3.5%) | 12.0 |
| 20 to 34 years | 497 (73.5%) | 73.0 |
| 35 to 50 years | 155 (22.9%) | 22.0 |
| Total | 676 (100.0%) | 42.0 |
Fertility by Age by Marriage Status in Kenner
56.2% of women with births (676) in Kenner are married. The highest percentage of unmarried women with births falls into 35 to 50 years age bracket with 61.3% of them unmarried at the time of birth, while the lowest percentage of unmarried women with births belong to 15 to 19 years age bracket with 0.0% of them unmarried.
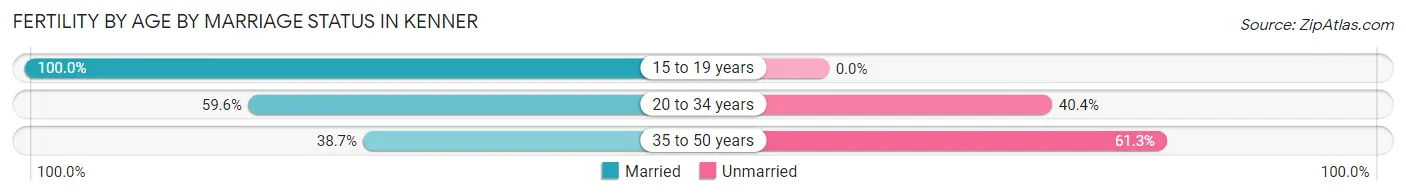
| Age Bracket | Married | Unmarried |
| 15 to 19 years | 24 (100.0%) | 0 (0.0%) |
| 20 to 34 years | 296 (59.6%) | 201 (40.4%) |
| 35 to 50 years | 60 (38.7%) | 95 (61.3%) |
| Total | 380 (56.2%) | 296 (43.8%) |
Fertility by Education in Kenner
Average fertility rate in Kenner is 42.0 births per 1,000 women. Women with the education attainment of high school diploma have the highest fertility rate of 72.0 births per 1,000 women, while women with the education attainment of bachelor's degree have the lowest fertility at 18.0 births per 1,000 women. Women with the education attainment of high school diploma represent 35.5% of all women with births.
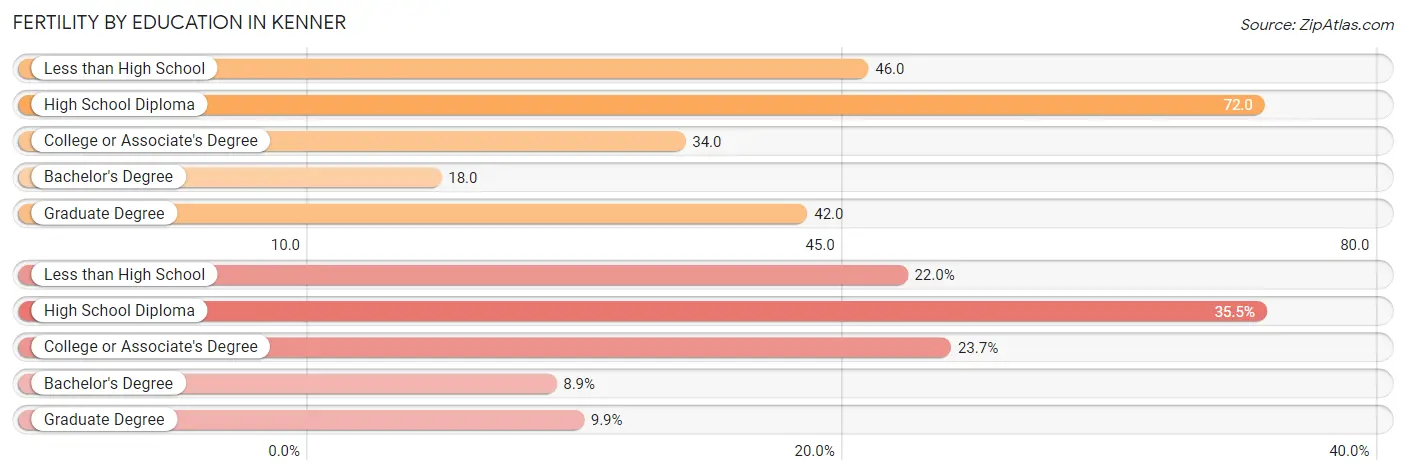
| Educational Attainment | Women with Births | Births / 1,000 Women |
| Less than High School | 149 (22.0%) | 46.0 |
| High School Diploma | 240 (35.5%) | 72.0 |
| College or Associate's Degree | 160 (23.7%) | 34.0 |
| Bachelor's Degree | 60 (8.9%) | 18.0 |
| Graduate Degree | 67 (9.9%) | 42.0 |
| Total | 676 (100.0%) | 42.0 |
Fertility by Education by Marriage Status in Kenner
43.8% of women with births in Kenner are unmarried. Women with the educational attainment of bachelor's degree are most likely to be married with 100.0% of them married at childbirth, while women with the educational attainment of college or associate's degree are least likely to be married with 76.2% of them unmarried at childbirth.
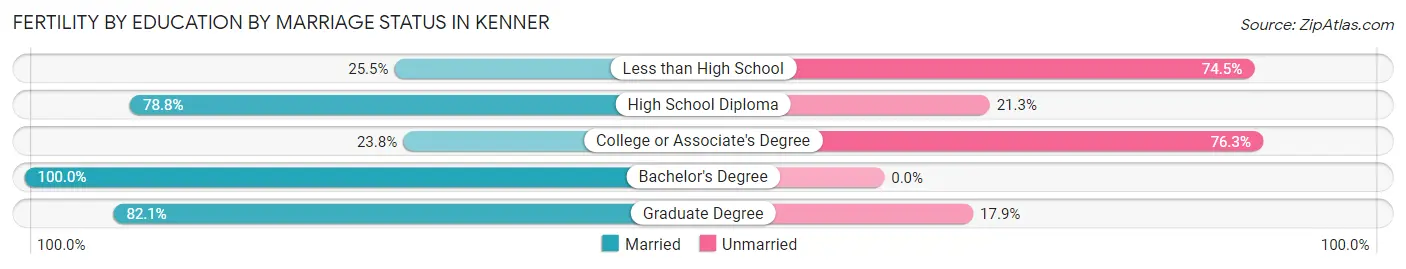
| Educational Attainment | Married | Unmarried |
| Less than High School | 38 (25.5%) | 111 (74.5%) |
| High School Diploma | 189 (78.7%) | 51 (21.2%) |
| College or Associate's Degree | 38 (23.7%) | 122 (76.2%) |
| Bachelor's Degree | 60 (100.0%) | 0 (0.0%) |
| Graduate Degree | 55 (82.1%) | 12 (17.9%) |
| Total | 380 (56.2%) | 296 (43.8%) |
Employment Characteristics in Kenner
Employment by Class of Employer in Kenner
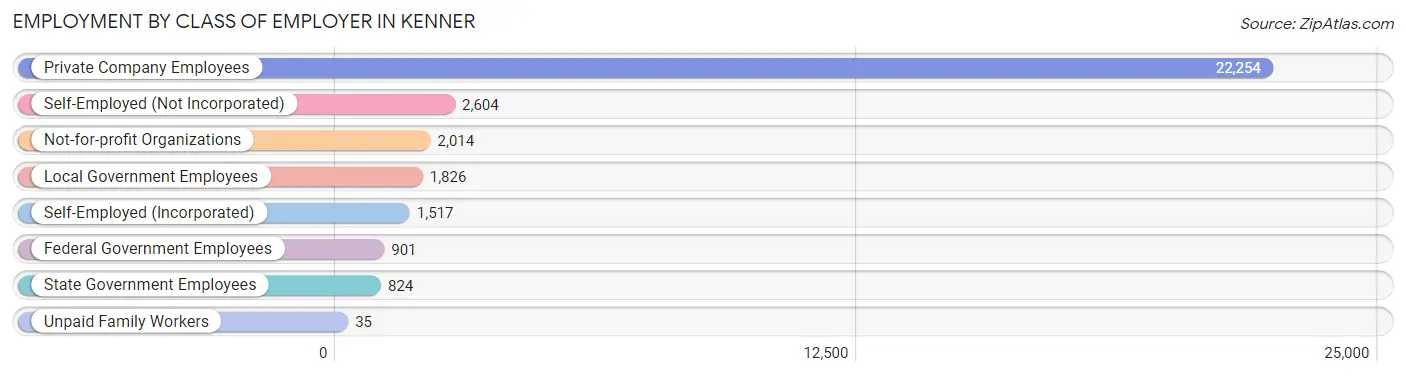
Among the 31,975 employed individuals in Kenner, private company employees (22,254 | 69.6%), self-employed (not incorporated) (2,604 | 8.1%), and not-for-profit organizations (2,014 | 6.3%) make up the most common classes of employment.
| Employer Class | # Employees | % Employees |
| Private Company Employees | 22,254 | 69.6% |
| Self-Employed (Incorporated) | 1,517 | 4.7% |
| Self-Employed (Not Incorporated) | 2,604 | 8.1% |
| Not-for-profit Organizations | 2,014 | 6.3% |
| Local Government Employees | 1,826 | 5.7% |
| State Government Employees | 824 | 2.6% |
| Federal Government Employees | 901 | 2.8% |
| Unpaid Family Workers | 35 | 0.1% |
| Total | 31,975 | 100.0% |
Employment Status by Age in Kenner
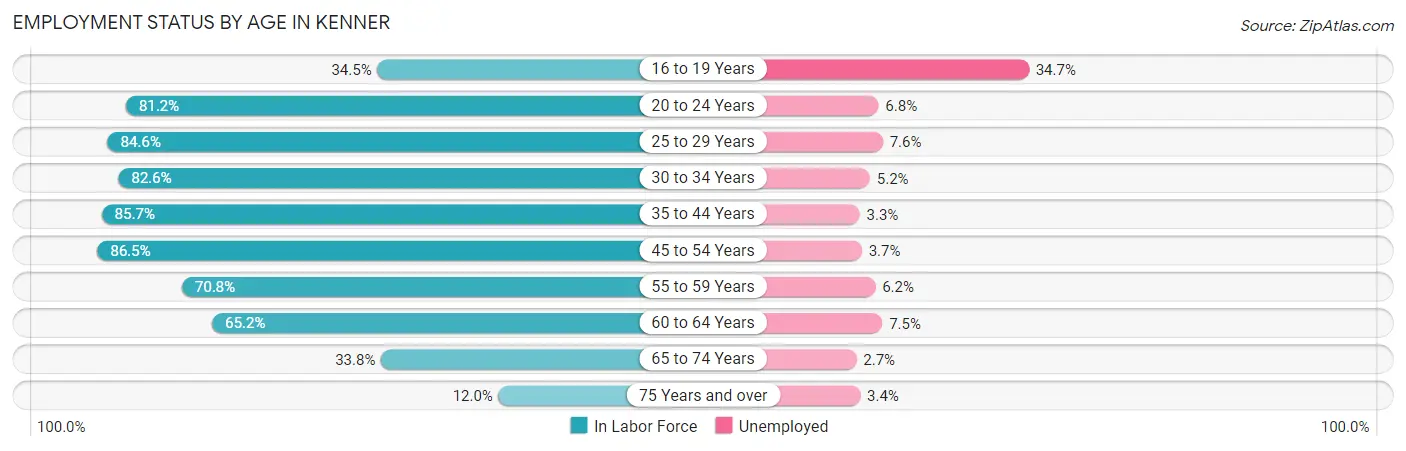
According to the labor force statistics for Kenner, out of the total population over 16 years of age (52,104), 66.5% or 34,649 individuals are in the labor force, with 5.7% or 1,975 of them unemployed. The age group with the highest labor force participation rate is 45 to 54 years, with 86.5% or 7,149 individuals in the labor force. Within the labor force, the 16 to 19 years age range has the highest percentage of unemployed individuals, with 34.7% or 330 of them being unemployed.
| Age Bracket | In Labor Force | Unemployed |
| 16 to 19 Years | 950 (34.5%) | 330 (34.7%) |
| 20 to 24 Years | 2,891 (81.2%) | 197 (6.8%) |
| 25 to 29 Years | 3,857 (84.6%) | 293 (7.6%) |
| 30 to 34 Years | 3,624 (82.6%) | 188 (5.2%) |
| 35 to 44 Years | 7,692 (85.7%) | 254 (3.3%) |
| 45 to 54 Years | 7,149 (86.5%) | 265 (3.7%) |
| 55 to 59 Years | 2,695 (70.8%) | 167 (6.2%) |
| 60 to 64 Years | 2,822 (65.2%) | 212 (7.5%) |
| 65 to 74 Years | 2,468 (33.8%) | 67 (2.7%) |
| 75 Years and over | 500 (12.0%) | 17 (3.4%) |
| Total | 34,649 (66.5%) | 1,975 (5.7%) |
Employment Status by Educational Attainment in Kenner
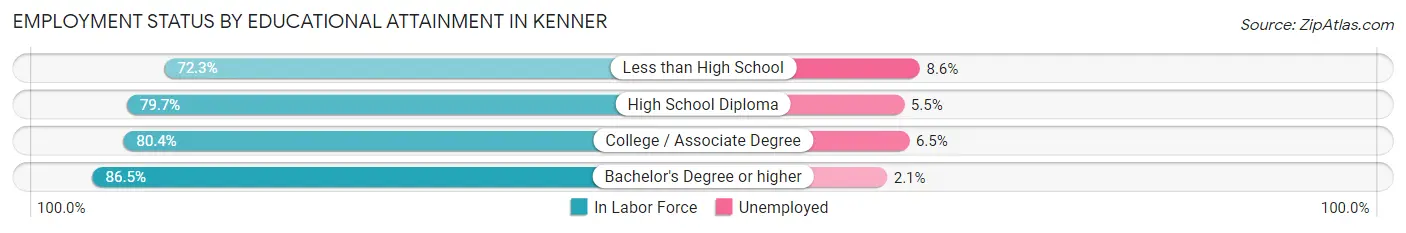
According to labor force statistics for Kenner, 81.1% of individuals (27,834) out of the total population between 25 and 64 years of age (34,321) are in the labor force, with 4.9% or 1,364 of them being unemployed. The group with the highest labor force participation rate are those with the educational attainment of bachelor's degree or higher, with 86.5% or 9,561 individuals in the labor force. Within the labor force, individuals with less than high school education have the highest percentage of unemployment, with 8.6% or 277 of them being unemployed.
| Educational Attainment | In Labor Force | Unemployed |
| Less than High School | 3,217 (72.3%) | 383 (8.6%) |
| High School Diploma | 7,161 (79.7%) | 494 (5.5%) |
| College / Associate Degree | 7,907 (80.4%) | 639 (6.5%) |
| Bachelor's Degree or higher | 9,561 (86.5%) | 232 (2.1%) |
| Total | 27,834 (81.1%) | 1,682 (4.9%) |
Employment Occupations by Sex in Kenner
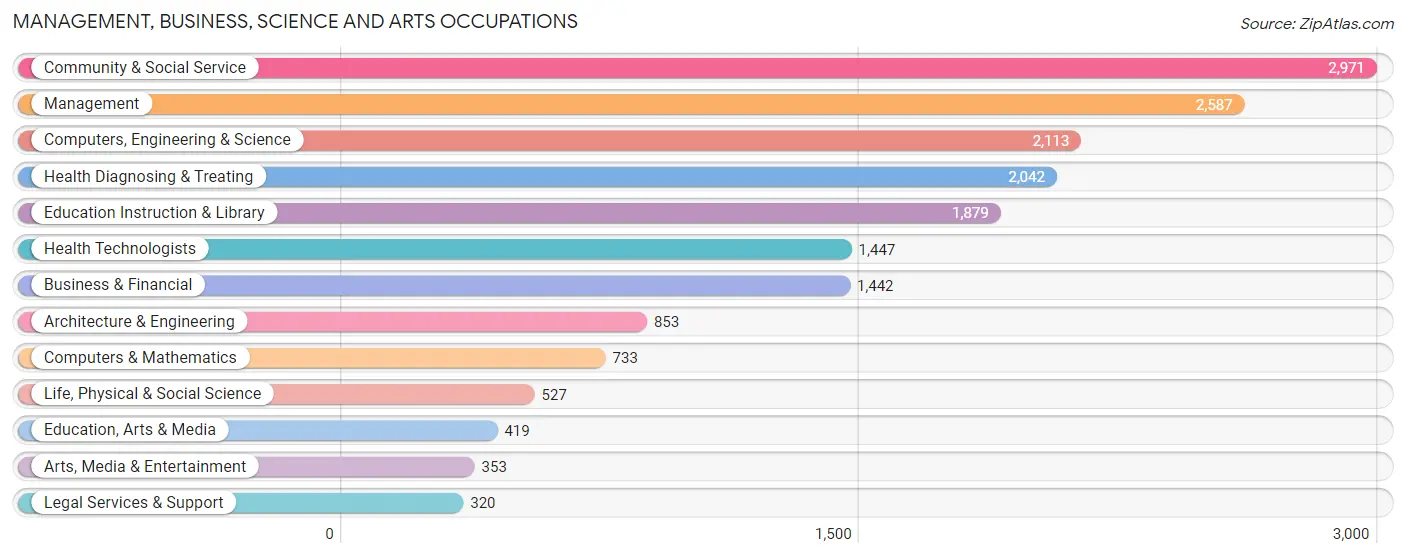
Management, Business, Science and Arts Occupations
The most common Management, Business, Science and Arts occupations in Kenner are Community & Social Service (2,971 | 9.2%), Management (2,587 | 8.0%), Computers, Engineering & Science (2,113 | 6.5%), Health Diagnosing & Treating (2,042 | 6.3%), and Education Instruction & Library (1,879 | 5.8%).
Management, Business, Science and Arts Occupations by Sex
Within the Management, Business, Science and Arts occupations in Kenner, the most male-oriented occupations are Life, Physical & Social Science (81.0%), Computers & Mathematics (75.8%), and Computers, Engineering & Science (74.9%), while the most female-oriented occupations are Education Instruction & Library (78.2%), Community & Social Service (71.3%), and Education, Arts & Media (69.9%).
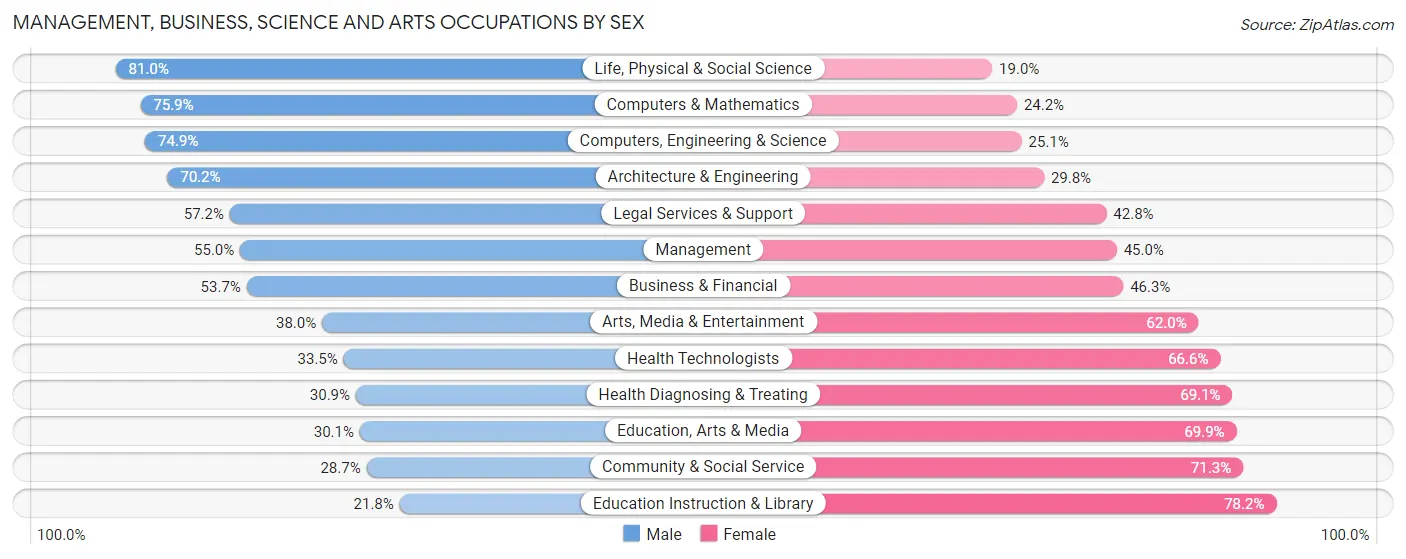
| Occupation | Male | Female |
| Management | 1,424 (55.0%) | 1,163 (45.0%) |
| Business & Financial | 774 (53.7%) | 668 (46.3%) |
| Computers, Engineering & Science | 1,582 (74.9%) | 531 (25.1%) |
| Computers & Mathematics | 556 (75.8%) | 177 (24.1%) |
| Architecture & Engineering | 599 (70.2%) | 254 (29.8%) |
| Life, Physical & Social Science | 427 (81.0%) | 100 (19.0%) |
| Community & Social Service | 852 (28.7%) | 2,119 (71.3%) |
| Education, Arts & Media | 126 (30.1%) | 293 (69.9%) |
| Legal Services & Support | 183 (57.2%) | 137 (42.8%) |
| Education Instruction & Library | 409 (21.8%) | 1,470 (78.2%) |
| Arts, Media & Entertainment | 134 (38.0%) | 219 (62.0%) |
| Health Diagnosing & Treating | 631 (30.9%) | 1,411 (69.1%) |
| Health Technologists | 484 (33.5%) | 963 (66.5%) |
| Total (Category) | 5,263 (47.2%) | 5,892 (52.8%) |
| Total (Overall) | 17,074 (52.8%) | 15,289 (47.2%) |
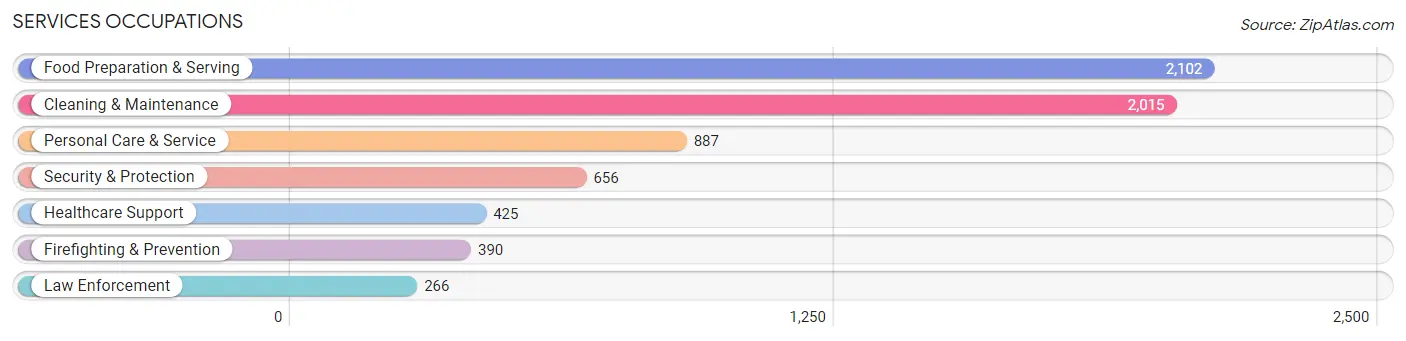
Services Occupations
The most common Services occupations in Kenner are Food Preparation & Serving (2,102 | 6.5%), Cleaning & Maintenance (2,015 | 6.2%), Personal Care & Service (887 | 2.7%), Security & Protection (656 | 2.0%), and Healthcare Support (425 | 1.3%).
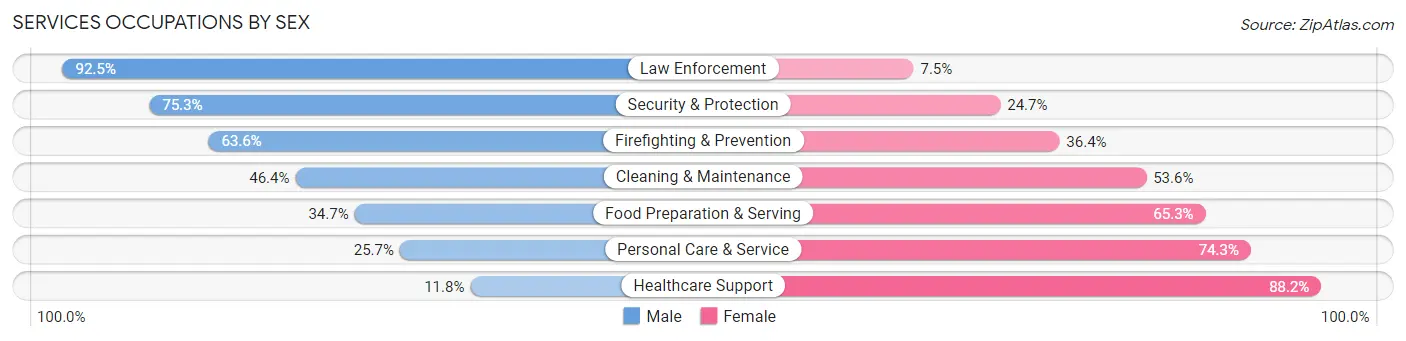
Services Occupations by Sex
Within the Services occupations in Kenner, the most male-oriented occupations are Law Enforcement (92.5%), Security & Protection (75.3%), and Firefighting & Prevention (63.6%), while the most female-oriented occupations are Healthcare Support (88.2%), Personal Care & Service (74.3%), and Food Preparation & Serving (65.3%).
| Occupation | Male | Female |
| Healthcare Support | 50 (11.8%) | 375 (88.2%) |
| Security & Protection | 494 (75.3%) | 162 (24.7%) |
| Firefighting & Prevention | 248 (63.6%) | 142 (36.4%) |
| Law Enforcement | 246 (92.5%) | 20 (7.5%) |
| Food Preparation & Serving | 729 (34.7%) | 1,373 (65.3%) |
| Cleaning & Maintenance | 935 (46.4%) | 1,080 (53.6%) |
| Personal Care & Service | 228 (25.7%) | 659 (74.3%) |
| Total (Category) | 2,436 (40.0%) | 3,649 (60.0%) |
| Total (Overall) | 17,074 (52.8%) | 15,289 (47.2%) |
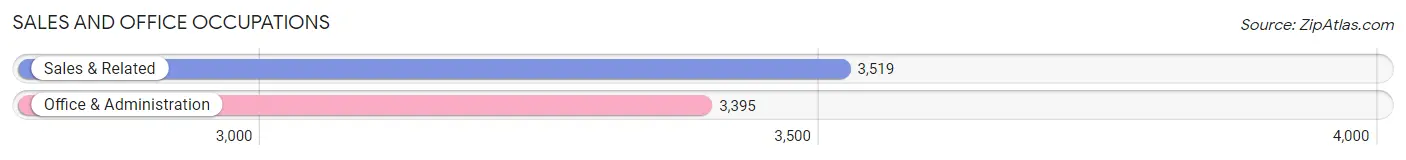
Sales and Office Occupations
The most common Sales and Office occupations in Kenner are Sales & Related (3,519 | 10.9%), and Office & Administration (3,395 | 10.5%).
Sales and Office Occupations by Sex
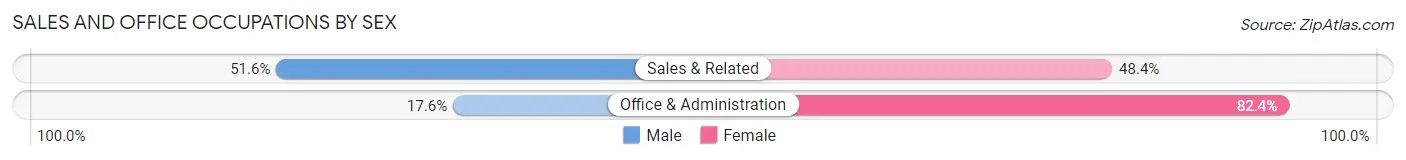
| Occupation | Male | Female |
| Sales & Related | 1,816 (51.6%) | 1,703 (48.4%) |
| Office & Administration | 598 (17.6%) | 2,797 (82.4%) |
| Total (Category) | 2,414 (34.9%) | 4,500 (65.1%) |
| Total (Overall) | 17,074 (52.8%) | 15,289 (47.2%) |
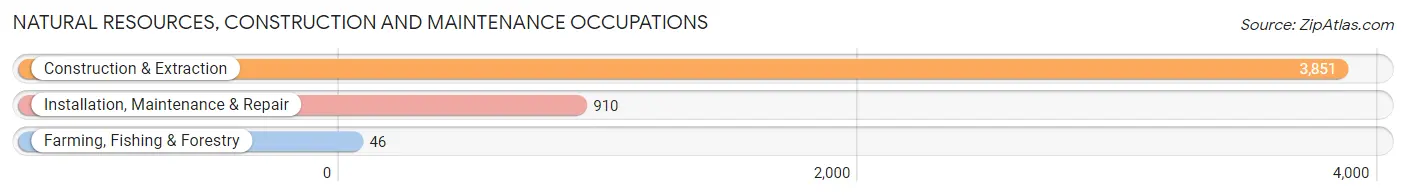
Natural Resources, Construction and Maintenance Occupations
The most common Natural Resources, Construction and Maintenance occupations in Kenner are Construction & Extraction (3,851 | 11.9%), Installation, Maintenance & Repair (910 | 2.8%), and Farming, Fishing & Forestry (46 | 0.1%).
Natural Resources, Construction and Maintenance Occupations by Sex
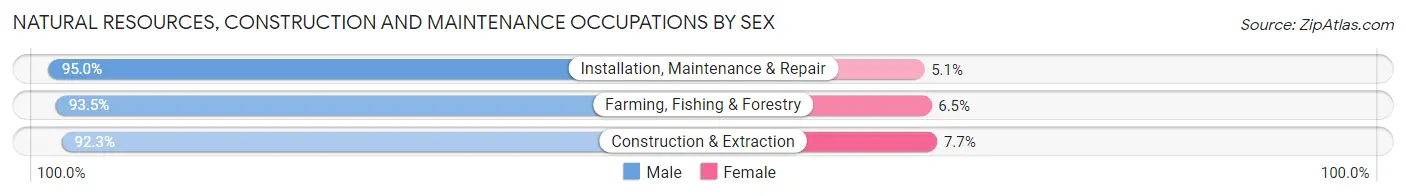
| Occupation | Male | Female |
| Farming, Fishing & Forestry | 43 (93.5%) | 3 (6.5%) |
| Construction & Extraction | 3,554 (92.3%) | 297 (7.7%) |
| Installation, Maintenance & Repair | 864 (95.0%) | 46 (5.1%) |
| Total (Category) | 4,461 (92.8%) | 346 (7.2%) |
| Total (Overall) | 17,074 (52.8%) | 15,289 (47.2%) |
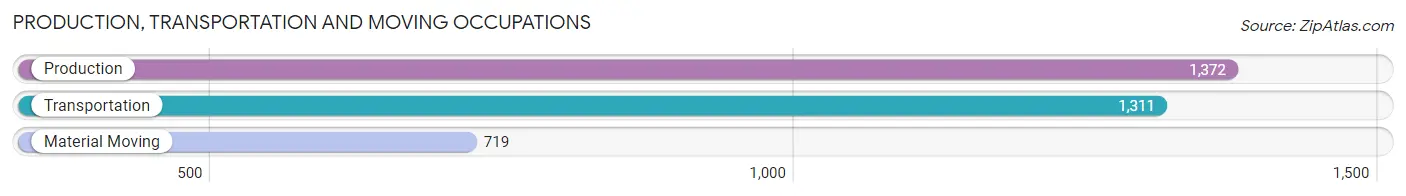
Production, Transportation and Moving Occupations
The most common Production, Transportation and Moving occupations in Kenner are Production (1,372 | 4.2%), Transportation (1,311 | 4.1%), and Material Moving (719 | 2.2%).
Production, Transportation and Moving Occupations by Sex
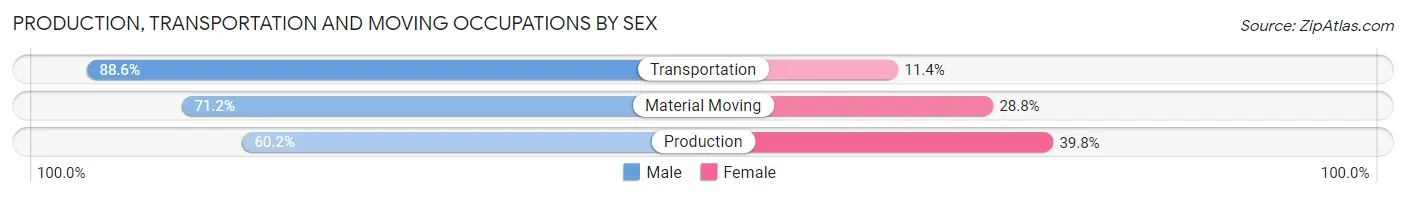
| Occupation | Male | Female |
| Production | 826 (60.2%) | 546 (39.8%) |
| Transportation | 1,162 (88.6%) | 149 (11.4%) |
| Material Moving | 512 (71.2%) | 207 (28.8%) |
| Total (Category) | 2,500 (73.5%) | 902 (26.5%) |
| Total (Overall) | 17,074 (52.8%) | 15,289 (47.2%) |
Employment Industries by Sex in Kenner
Employment Industries in Kenner
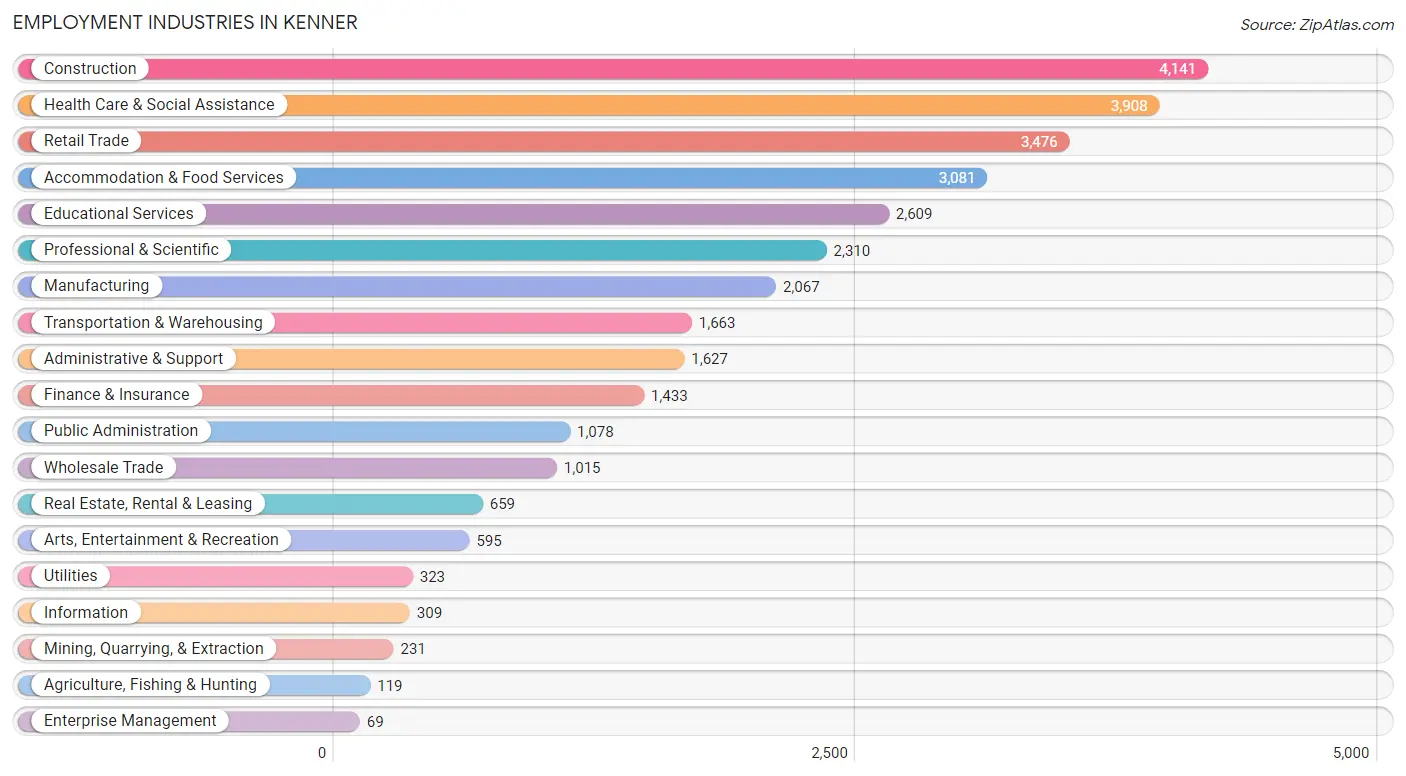
The major employment industries in Kenner include Construction (4,141 | 12.8%), Health Care & Social Assistance (3,908 | 12.1%), Retail Trade (3,476 | 10.7%), Accommodation & Food Services (3,081 | 9.5%), and Educational Services (2,609 | 8.1%).
Employment Industries by Sex in Kenner
The Kenner industries that see more men than women are Mining, Quarrying, & Extraction (91.3%), Information (91.3%), and Construction (86.0%), whereas the industries that tend to have a higher number of women are Enterprise Management (100.0%), Health Care & Social Assistance (78.4%), and Educational Services (78.3%).
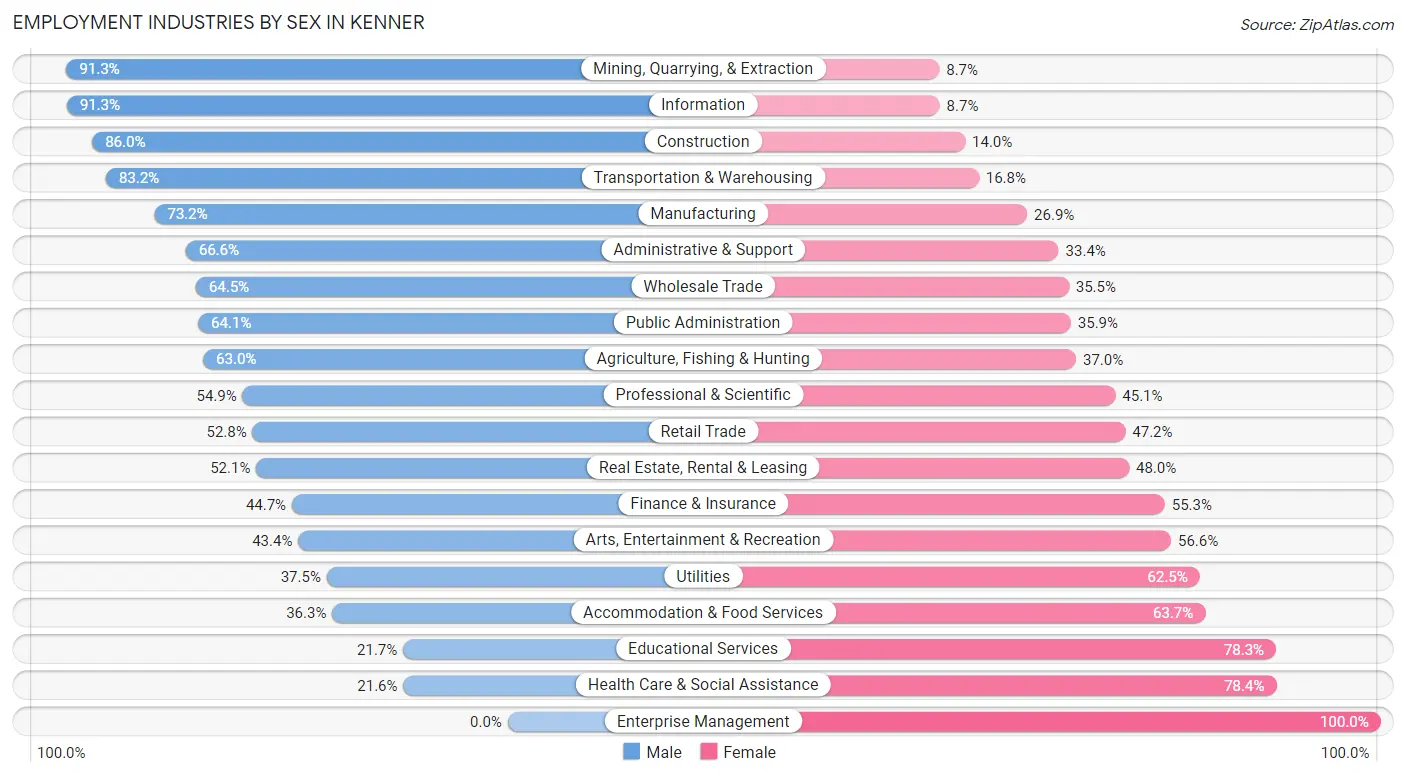
| Industry | Male | Female |
| Agriculture, Fishing & Hunting | 75 (63.0%) | 44 (37.0%) |
| Mining, Quarrying, & Extraction | 211 (91.3%) | 20 (8.7%) |
| Construction | 3,561 (86.0%) | 580 (14.0%) |
| Manufacturing | 1,512 (73.2%) | 555 (26.9%) |
| Wholesale Trade | 655 (64.5%) | 360 (35.5%) |
| Retail Trade | 1,836 (52.8%) | 1,640 (47.2%) |
| Transportation & Warehousing | 1,383 (83.2%) | 280 (16.8%) |
| Utilities | 121 (37.5%) | 202 (62.5%) |
| Information | 282 (91.3%) | 27 (8.7%) |
| Finance & Insurance | 640 (44.7%) | 793 (55.3%) |
| Real Estate, Rental & Leasing | 343 (52.0%) | 316 (47.9%) |
| Professional & Scientific | 1,268 (54.9%) | 1,042 (45.1%) |
| Enterprise Management | 0 (0.0%) | 69 (100.0%) |
| Administrative & Support | 1,084 (66.6%) | 543 (33.4%) |
| Educational Services | 565 (21.7%) | 2,044 (78.3%) |
| Health Care & Social Assistance | 844 (21.6%) | 3,064 (78.4%) |
| Arts, Entertainment & Recreation | 258 (43.4%) | 337 (56.6%) |
| Accommodation & Food Services | 1,119 (36.3%) | 1,962 (63.7%) |
| Public Administration | 691 (64.1%) | 387 (35.9%) |
| Total | 17,074 (52.8%) | 15,289 (47.2%) |
Education in Kenner
School Enrollment in Kenner
The most common levels of schooling among the 14,700 students in Kenner are high school (3,346 | 22.8%), elementary school (3,332 | 22.7%), and middle school (2,959 | 20.1%).
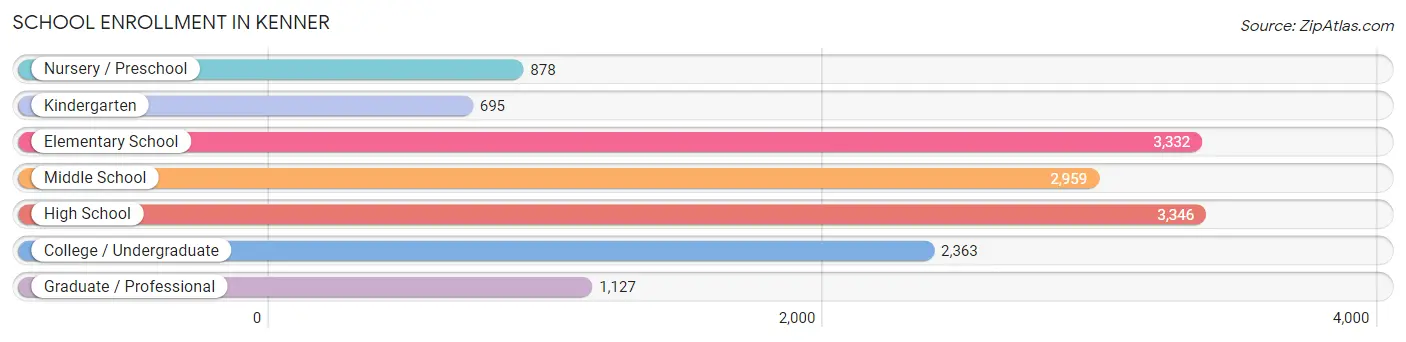
| School Level | # Students | % Students |
| Nursery / Preschool | 878 | 6.0% |
| Kindergarten | 695 | 4.7% |
| Elementary School | 3,332 | 22.7% |
| Middle School | 2,959 | 20.1% |
| High School | 3,346 | 22.8% |
| College / Undergraduate | 2,363 | 16.1% |
| Graduate / Professional | 1,127 | 7.7% |
| Total | 14,700 | 100.0% |
School Enrollment by Age by Funding Source in Kenner
Out of a total of 14,700 students who are enrolled in schools in Kenner, 4,145 (28.2%) attend a private institution, while the remaining 10,555 (71.8%) are enrolled in public schools. The age group of 25 to 34 year olds has the highest likelihood of being enrolled in private schools, with 382 (42.2% in the age bracket) enrolled. Conversely, the age group of 20 to 24 year olds has the lowest likelihood of being enrolled in a private school, with 1,115 (82.0% in the age bracket) attending a public institution.
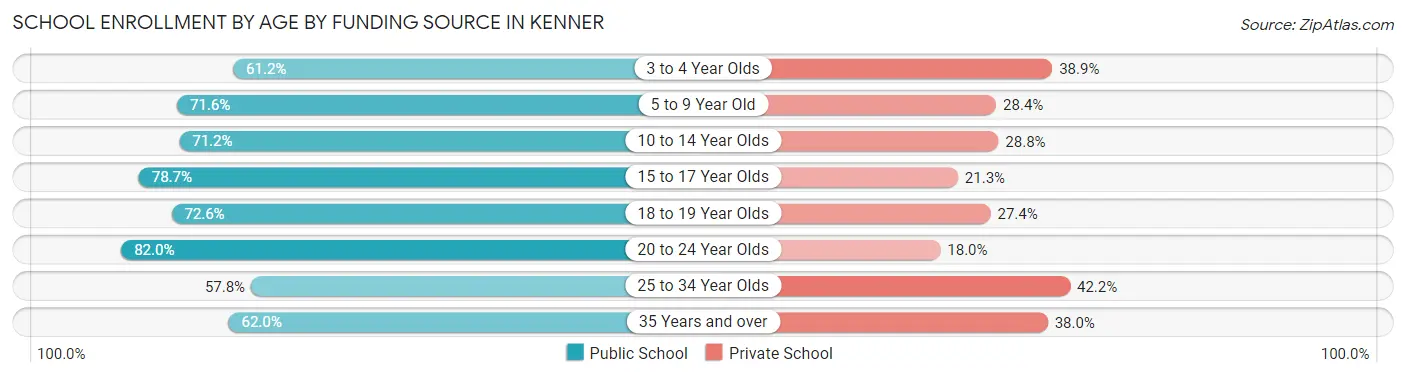
| Age Bracket | Public School | Private School |
| 3 to 4 Year Olds | 329 (61.2%) | 209 (38.9%) |
| 5 to 9 Year Old | 2,952 (71.6%) | 1,171 (28.4%) |
| 10 to 14 Year Olds | 2,593 (71.2%) | 1,050 (28.8%) |
| 15 to 17 Year Olds | 1,883 (78.7%) | 509 (21.3%) |
| 18 to 19 Year Olds | 515 (72.6%) | 194 (27.4%) |
| 20 to 24 Year Olds | 1,115 (82.0%) | 245 (18.0%) |
| 25 to 34 Year Olds | 524 (57.8%) | 382 (42.2%) |
| 35 Years and over | 638 (62.0%) | 391 (38.0%) |
| Total | 10,555 (71.8%) | 4,145 (28.2%) |
Educational Attainment by Field of Study in Kenner
Business (3,697 | 25.2%), education (1,893 | 12.9%), engineering (1,666 | 11.4%), science & technology (1,469 | 10.0%), and psychology (1,023 | 7.0%) are the most common fields of study among 14,654 individuals in Kenner who have obtained a bachelor's degree or higher.
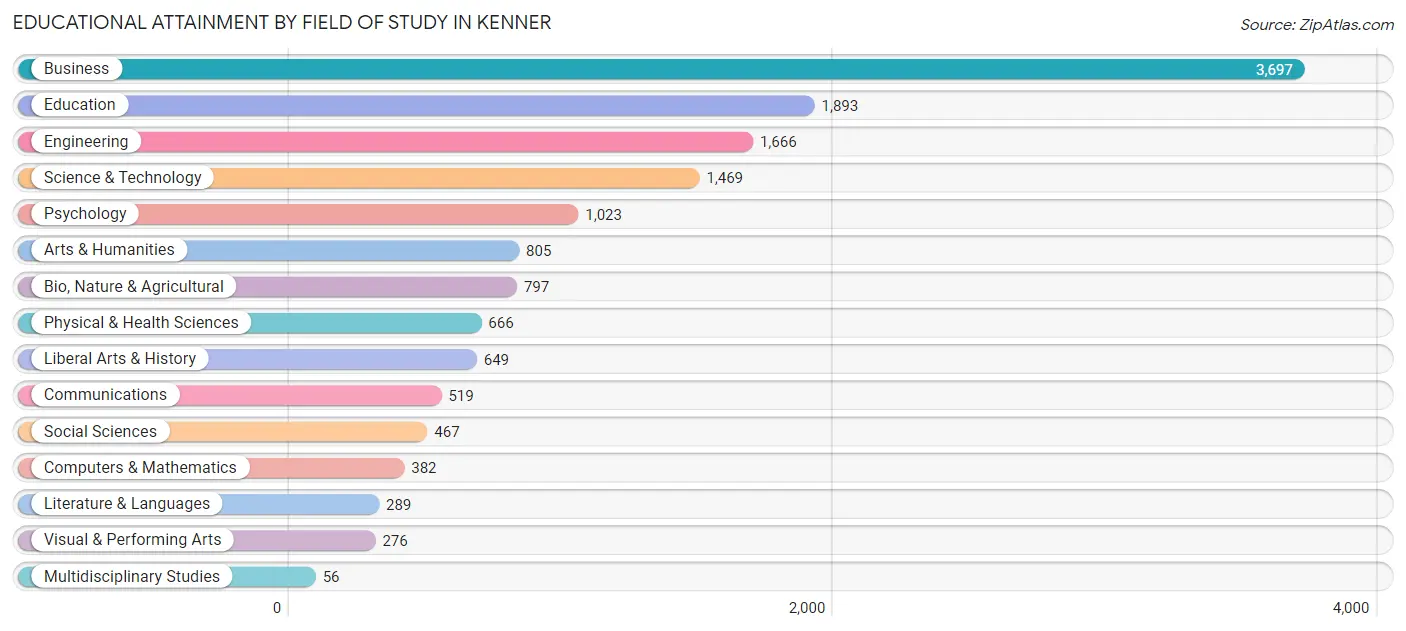
| Field of Study | # Graduates | % Graduates |
| Computers & Mathematics | 382 | 2.6% |
| Bio, Nature & Agricultural | 797 | 5.4% |
| Physical & Health Sciences | 666 | 4.5% |
| Psychology | 1,023 | 7.0% |
| Social Sciences | 467 | 3.2% |
| Engineering | 1,666 | 11.4% |
| Multidisciplinary Studies | 56 | 0.4% |
| Science & Technology | 1,469 | 10.0% |
| Business | 3,697 | 25.2% |
| Education | 1,893 | 12.9% |
| Literature & Languages | 289 | 2.0% |
| Liberal Arts & History | 649 | 4.4% |
| Visual & Performing Arts | 276 | 1.9% |
| Communications | 519 | 3.5% |
| Arts & Humanities | 805 | 5.5% |
| Total | 14,654 | 100.0% |
Transportation & Commute in Kenner
Vehicle Availability by Sex in Kenner
The most prevalent vehicle ownership categories in Kenner are males with 2 vehicles (8,085, accounting for 47.8%) and females with 2 vehicles (5,987, making up 53.8%).
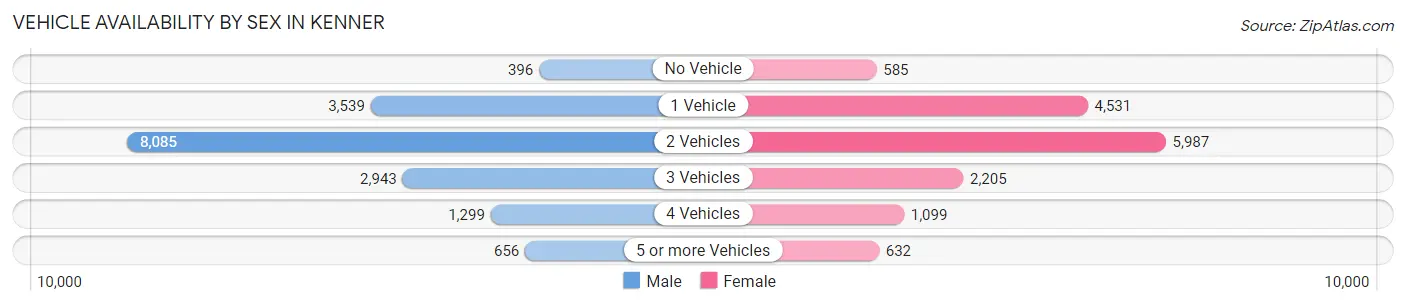
| Vehicles Available | Male | Female |
| No Vehicle | 396 (2.3%) | 585 (3.9%) |
| 1 Vehicle | 3,539 (20.9%) | 4,531 (30.1%) |
| 2 Vehicles | 8,085 (47.8%) | 5,987 (39.8%) |
| 3 Vehicles | 2,943 (17.4%) | 2,205 (14.7%) |
| 4 Vehicles | 1,299 (7.7%) | 1,099 (7.3%) |
| 5 or more Vehicles | 656 (3.9%) | 632 (4.2%) |
| Total | 16,918 (100.0%) | 15,039 (100.0%) |
Commute Time in Kenner
The most frequently occuring commute durations in Kenner are 30 to 34 minutes (6,191 commuters, 20.1%), 20 to 24 minutes (5,556 commuters, 18.1%), and 15 to 19 minutes (4,859 commuters, 15.8%).
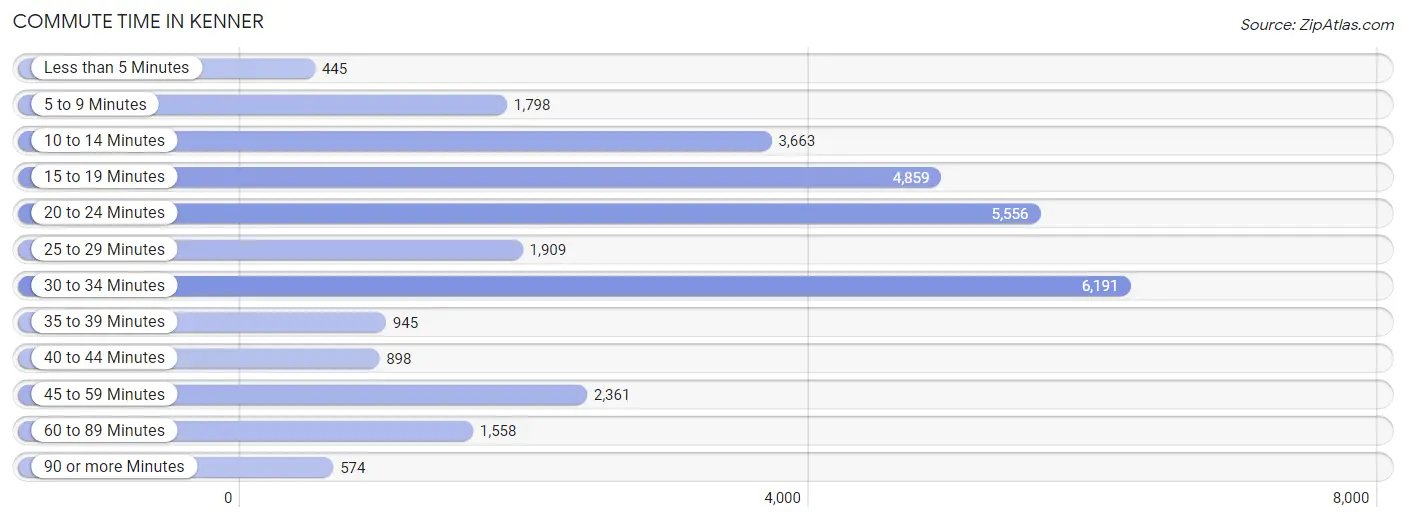
| Commute Time | # Commuters | % Commuters |
| Less than 5 Minutes | 445 | 1.5% |
| 5 to 9 Minutes | 1,798 | 5.9% |
| 10 to 14 Minutes | 3,663 | 11.9% |
| 15 to 19 Minutes | 4,859 | 15.8% |
| 20 to 24 Minutes | 5,556 | 18.1% |
| 25 to 29 Minutes | 1,909 | 6.2% |
| 30 to 34 Minutes | 6,191 | 20.1% |
| 35 to 39 Minutes | 945 | 3.1% |
| 40 to 44 Minutes | 898 | 2.9% |
| 45 to 59 Minutes | 2,361 | 7.7% |
| 60 to 89 Minutes | 1,558 | 5.1% |
| 90 or more Minutes | 574 | 1.9% |
Commute Time by Sex in Kenner
The most common commute times in Kenner are 30 to 34 minutes (3,749 commuters, 23.1%) for males and 15 to 19 minutes (2,656 commuters, 18.3%) for females.
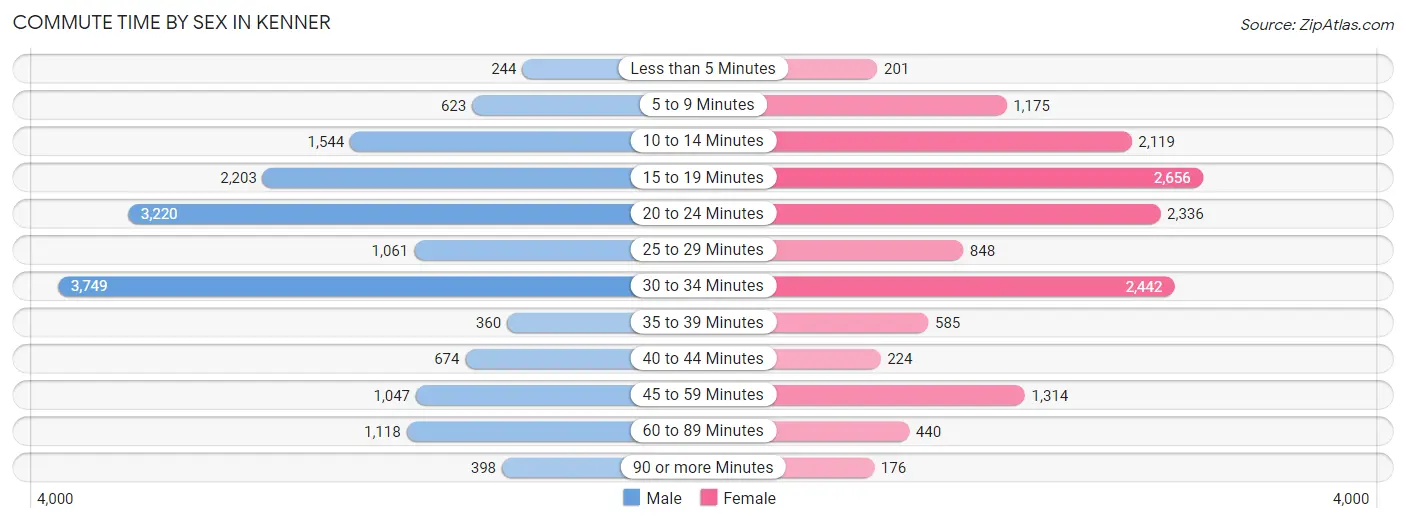
| Commute Time | Male | Female |
| Less than 5 Minutes | 244 (1.5%) | 201 (1.4%) |
| 5 to 9 Minutes | 623 (3.8%) | 1,175 (8.1%) |
| 10 to 14 Minutes | 1,544 (9.5%) | 2,119 (14.6%) |
| 15 to 19 Minutes | 2,203 (13.6%) | 2,656 (18.3%) |
| 20 to 24 Minutes | 3,220 (19.8%) | 2,336 (16.1%) |
| 25 to 29 Minutes | 1,061 (6.5%) | 848 (5.8%) |
| 30 to 34 Minutes | 3,749 (23.1%) | 2,442 (16.8%) |
| 35 to 39 Minutes | 360 (2.2%) | 585 (4.0%) |
| 40 to 44 Minutes | 674 (4.2%) | 224 (1.5%) |
| 45 to 59 Minutes | 1,047 (6.5%) | 1,314 (9.0%) |
| 60 to 89 Minutes | 1,118 (6.9%) | 440 (3.0%) |
| 90 or more Minutes | 398 (2.5%) | 176 (1.2%) |
Time of Departure to Work by Sex in Kenner
The most frequent times of departure to work in Kenner are 7:00 AM to 7:29 AM (2,280, 14.0%) for males and 7:00 AM to 7:29 AM (2,432, 16.8%) for females.
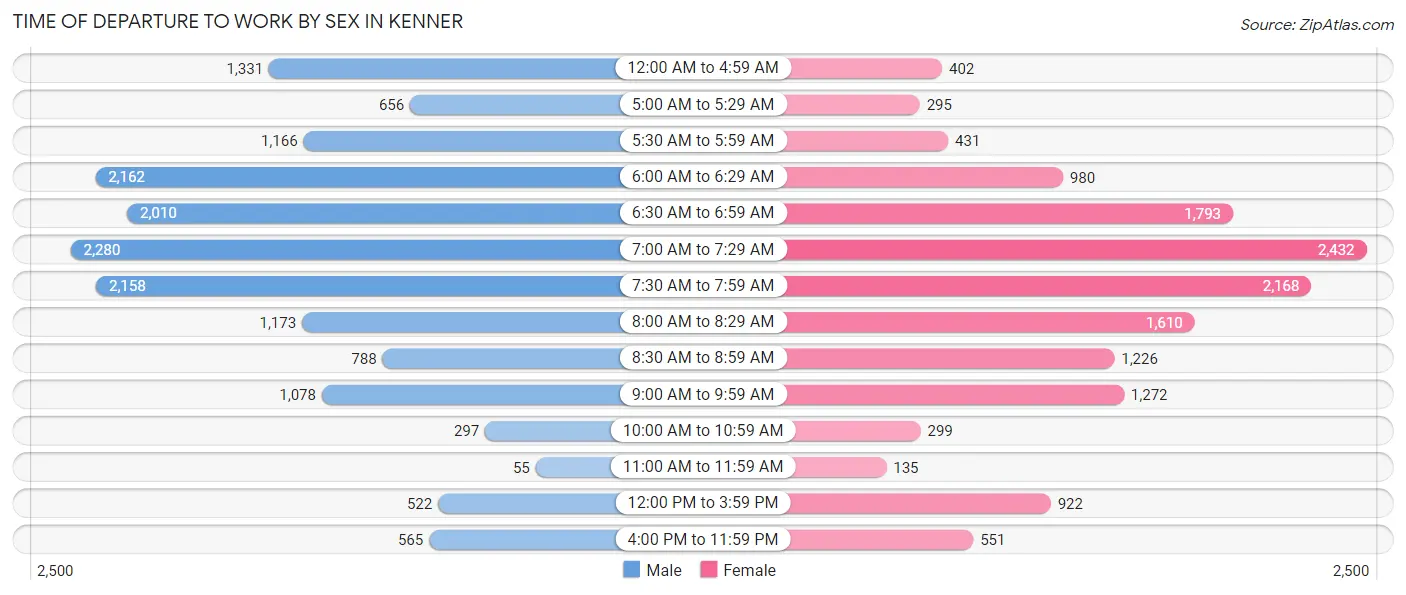
| Time of Departure | Male | Female |
| 12:00 AM to 4:59 AM | 1,331 (8.2%) | 402 (2.8%) |
| 5:00 AM to 5:29 AM | 656 (4.0%) | 295 (2.0%) |
| 5:30 AM to 5:59 AM | 1,166 (7.2%) | 431 (3.0%) |
| 6:00 AM to 6:29 AM | 2,162 (13.3%) | 980 (6.8%) |
| 6:30 AM to 6:59 AM | 2,010 (12.4%) | 1,793 (12.3%) |
| 7:00 AM to 7:29 AM | 2,280 (14.0%) | 2,432 (16.8%) |
| 7:30 AM to 7:59 AM | 2,158 (13.3%) | 2,168 (14.9%) |
| 8:00 AM to 8:29 AM | 1,173 (7.2%) | 1,610 (11.1%) |
| 8:30 AM to 8:59 AM | 788 (4.9%) | 1,226 (8.5%) |
| 9:00 AM to 9:59 AM | 1,078 (6.6%) | 1,272 (8.8%) |
| 10:00 AM to 10:59 AM | 297 (1.8%) | 299 (2.1%) |
| 11:00 AM to 11:59 AM | 55 (0.3%) | 135 (0.9%) |
| 12:00 PM to 3:59 PM | 522 (3.2%) | 922 (6.4%) |
| 4:00 PM to 11:59 PM | 565 (3.5%) | 551 (3.8%) |
| Total | 16,241 (100.0%) | 14,516 (100.0%) |
Housing Occupancy in Kenner
Occupancy by Ownership in Kenner
Of the total 26,172 dwellings in Kenner, owner-occupied units account for 15,790 (60.3%), while renter-occupied units make up 10,382 (39.7%).
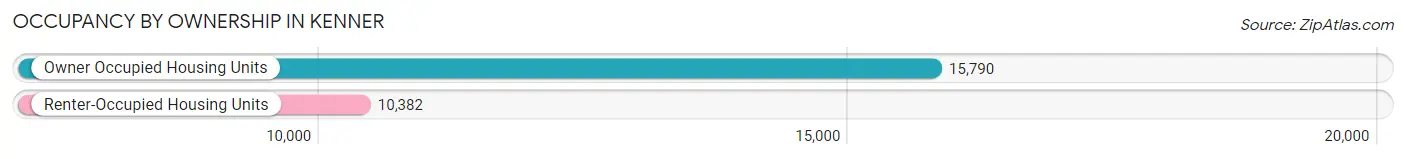
| Occupancy | # Housing Units | % Housing Units |
| Owner Occupied Housing Units | 15,790 | 60.3% |
| Renter-Occupied Housing Units | 10,382 | 39.7% |
| Total Occupied Housing Units | 26,172 | 100.0% |
Occupancy by Household Size in Kenner
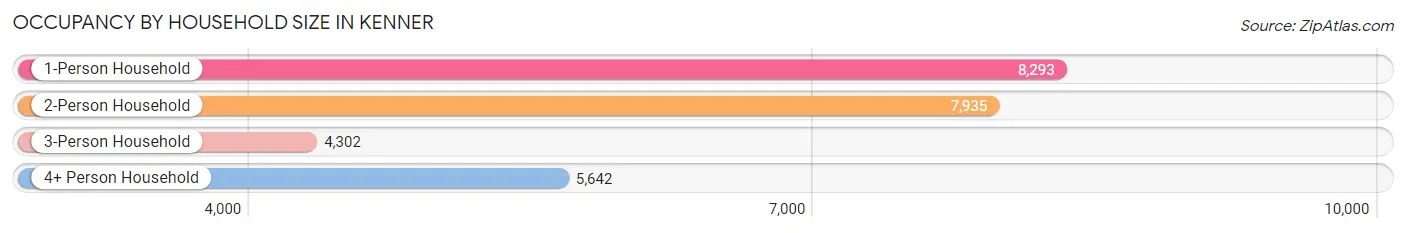
| Household Size | # Housing Units | % Housing Units |
| 1-Person Household | 8,293 | 31.7% |
| 2-Person Household | 7,935 | 30.3% |
| 3-Person Household | 4,302 | 16.4% |
| 4+ Person Household | 5,642 | 21.6% |
| Total Housing Units | 26,172 | 100.0% |
Occupancy by Ownership by Household Size in Kenner
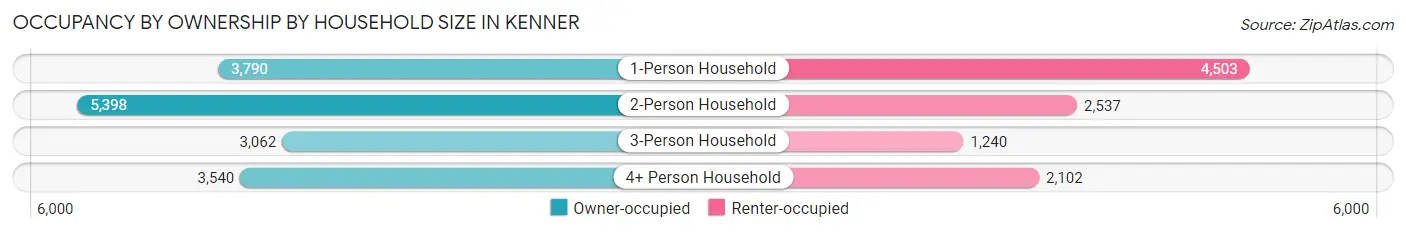
| Household Size | Owner-occupied | Renter-occupied |
| 1-Person Household | 3,790 (45.7%) | 4,503 (54.3%) |
| 2-Person Household | 5,398 (68.0%) | 2,537 (32.0%) |
| 3-Person Household | 3,062 (71.2%) | 1,240 (28.8%) |
| 4+ Person Household | 3,540 (62.7%) | 2,102 (37.3%) |
| Total Housing Units | 15,790 (60.3%) | 10,382 (39.7%) |
Occupancy by Educational Attainment in Kenner
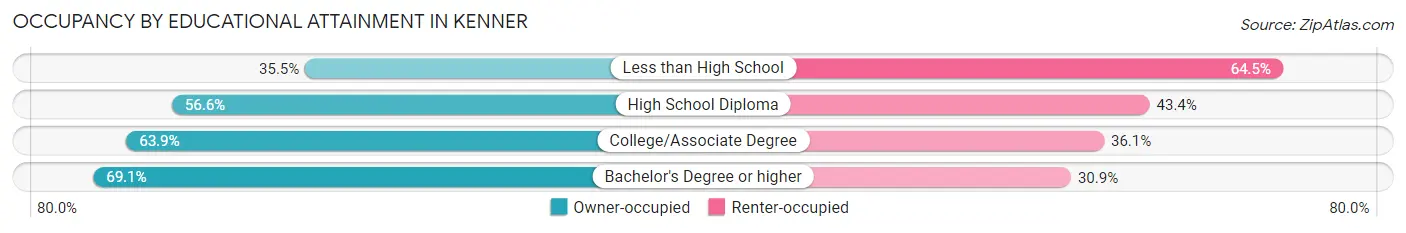
| Household Size | Owner-occupied | Renter-occupied |
| Less than High School | 1,143 (35.5%) | 2,076 (64.5%) |
| High School Diploma | 3,707 (56.6%) | 2,839 (43.4%) |
| College/Associate Degree | 4,838 (63.9%) | 2,738 (36.1%) |
| Bachelor's Degree or higher | 6,102 (69.1%) | 2,729 (30.9%) |
Occupancy by Age of Householder in Kenner
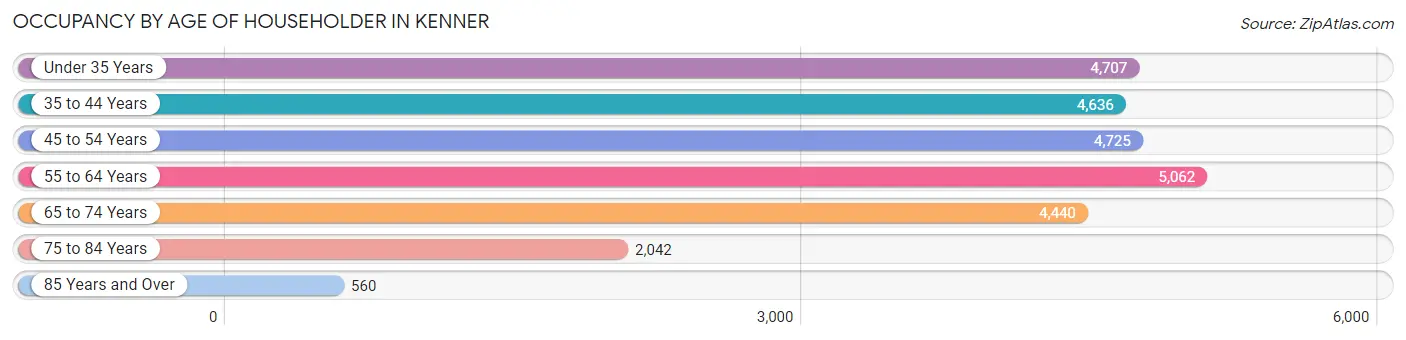
| Age Bracket | # Households | % Households |
| Under 35 Years | 4,707 | 18.0% |
| 35 to 44 Years | 4,636 | 17.7% |
| 45 to 54 Years | 4,725 | 18.0% |
| 55 to 64 Years | 5,062 | 19.3% |
| 65 to 74 Years | 4,440 | 17.0% |
| 75 to 84 Years | 2,042 | 7.8% |
| 85 Years and Over | 560 | 2.1% |
| Total | 26,172 | 100.0% |
Housing Finances in Kenner
Median Income by Occupancy in Kenner
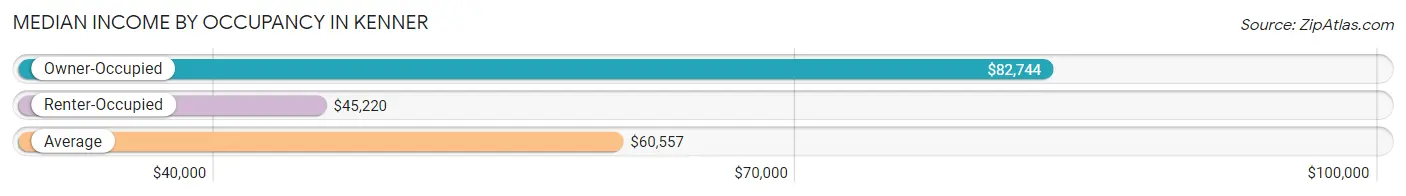
| Occupancy Type | # Households | Median Income |
| Owner-Occupied | 15,790 (60.3%) | $82,744 |
| Renter-Occupied | 10,382 (39.7%) | $45,220 |
| Average | 26,172 (100.0%) | $60,557 |
Occupancy by Householder Income Bracket in Kenner
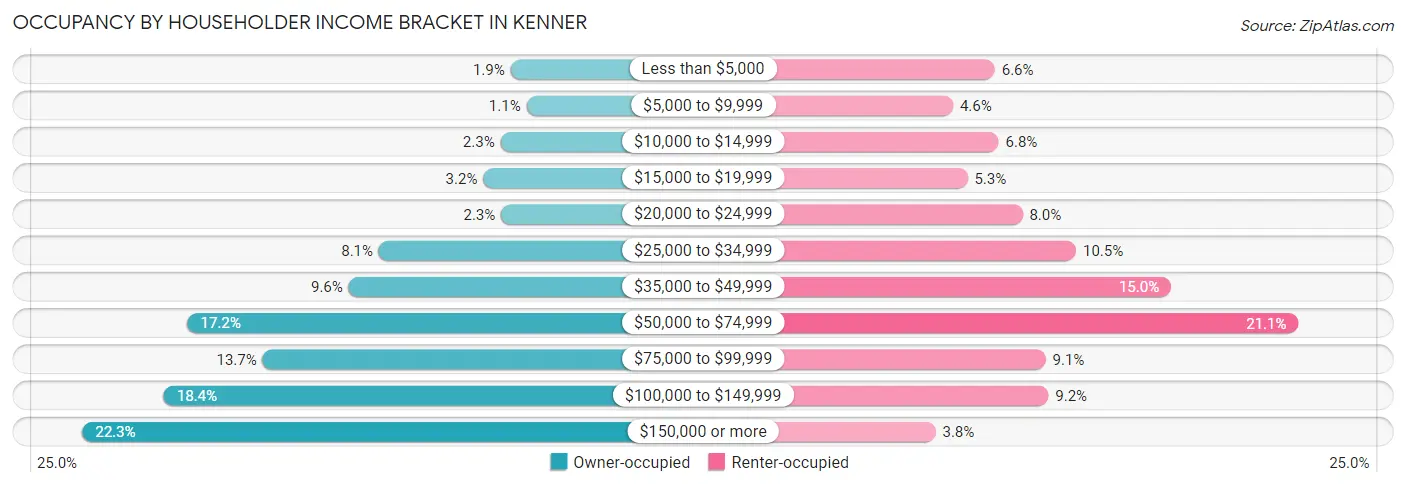
| Income Bracket | Owner-occupied | Renter-occupied |
| Less than $5,000 | 293 (1.9%) | 688 (6.6%) |
| $5,000 to $9,999 | 174 (1.1%) | 482 (4.6%) |
| $10,000 to $14,999 | 370 (2.3%) | 707 (6.8%) |
| $15,000 to $19,999 | 499 (3.2%) | 553 (5.3%) |
| $20,000 to $24,999 | 365 (2.3%) | 825 (8.0%) |
| $25,000 to $34,999 | 1,284 (8.1%) | 1,090 (10.5%) |
| $35,000 to $49,999 | 1,511 (9.6%) | 1,559 (15.0%) |
| $50,000 to $74,999 | 2,722 (17.2%) | 2,189 (21.1%) |
| $75,000 to $99,999 | 2,158 (13.7%) | 940 (9.0%) |
| $100,000 to $149,999 | 2,900 (18.4%) | 953 (9.2%) |
| $150,000 or more | 3,514 (22.3%) | 396 (3.8%) |
| Total | 15,790 (100.0%) | 10,382 (100.0%) |
Monthly Housing Cost Tiers in Kenner
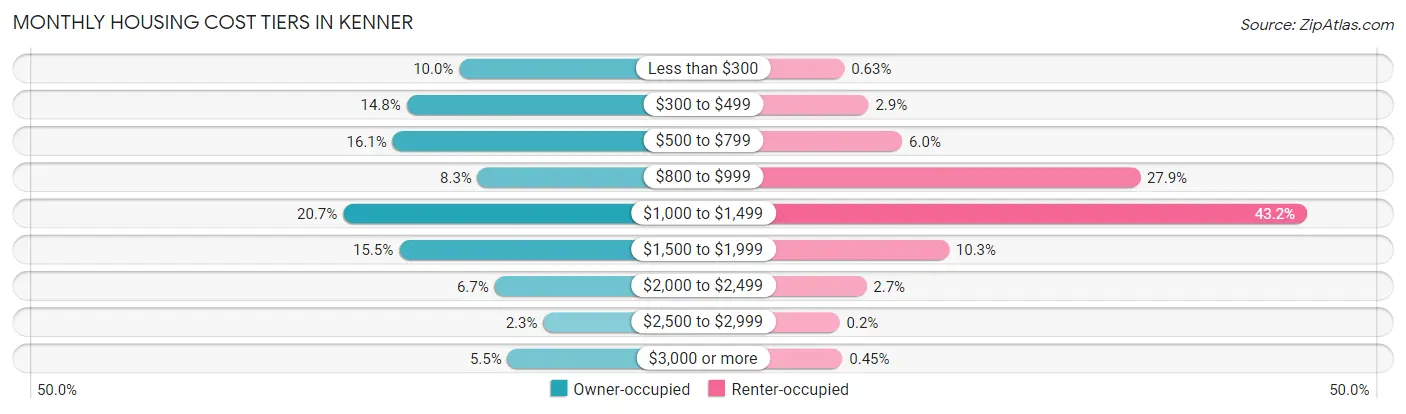
| Monthly Cost | Owner-occupied | Renter-occupied |
| Less than $300 | 1,578 (10.0%) | 65 (0.6%) |
| $300 to $499 | 2,344 (14.8%) | 297 (2.9%) |
| $500 to $799 | 2,546 (16.1%) | 619 (6.0%) |
| $800 to $999 | 1,309 (8.3%) | 2,891 (27.9%) |
| $1,000 to $1,499 | 3,265 (20.7%) | 4,487 (43.2%) |
| $1,500 to $1,999 | 2,452 (15.5%) | 1,065 (10.3%) |
| $2,000 to $2,499 | 1,065 (6.7%) | 276 (2.7%) |
| $2,500 to $2,999 | 356 (2.2%) | 21 (0.2%) |
| $3,000 or more | 875 (5.5%) | 47 (0.4%) |
| Total | 15,790 (100.0%) | 10,382 (100.0%) |
Physical Housing Characteristics in Kenner
Housing Structures in Kenner
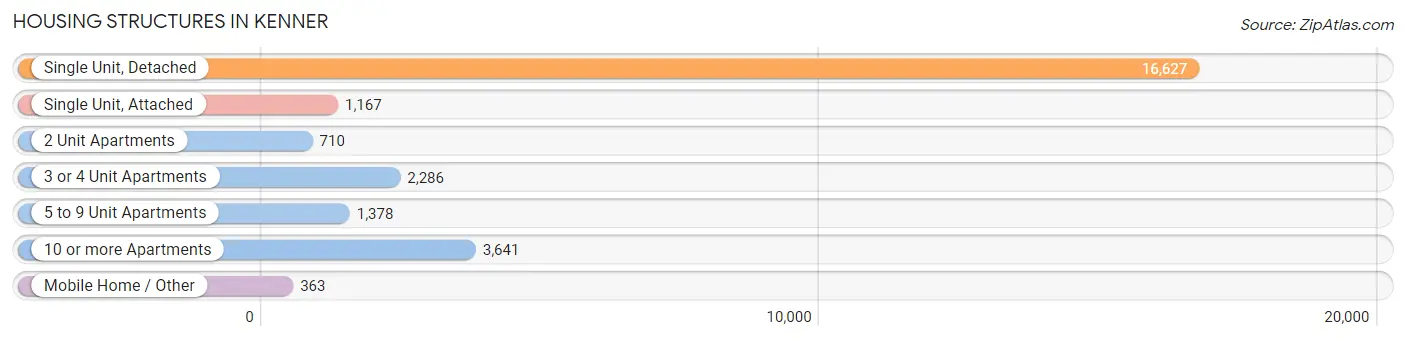
| Structure Type | # Housing Units | % Housing Units |
| Single Unit, Detached | 16,627 | 63.5% |
| Single Unit, Attached | 1,167 | 4.5% |
| 2 Unit Apartments | 710 | 2.7% |
| 3 or 4 Unit Apartments | 2,286 | 8.7% |
| 5 to 9 Unit Apartments | 1,378 | 5.3% |
| 10 or more Apartments | 3,641 | 13.9% |
| Mobile Home / Other | 363 | 1.4% |
| Total | 26,172 | 100.0% |
Housing Structures by Occupancy in Kenner
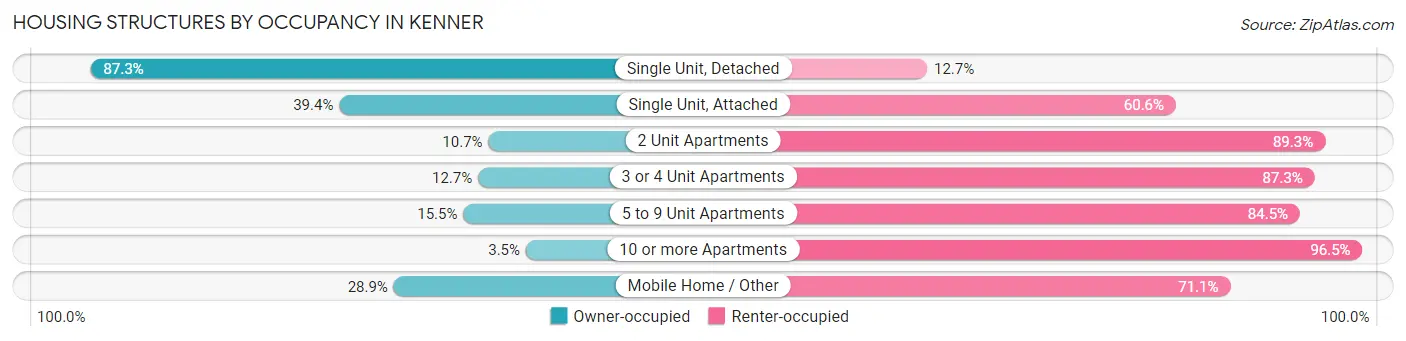
| Structure Type | Owner-occupied | Renter-occupied |
| Single Unit, Detached | 14,518 (87.3%) | 2,109 (12.7%) |
| Single Unit, Attached | 460 (39.4%) | 707 (60.6%) |
| 2 Unit Apartments | 76 (10.7%) | 634 (89.3%) |
| 3 or 4 Unit Apartments | 290 (12.7%) | 1,996 (87.3%) |
| 5 to 9 Unit Apartments | 214 (15.5%) | 1,164 (84.5%) |
| 10 or more Apartments | 127 (3.5%) | 3,514 (96.5%) |
| Mobile Home / Other | 105 (28.9%) | 258 (71.1%) |
| Total | 15,790 (60.3%) | 10,382 (39.7%) |
Housing Structures by Number of Rooms in Kenner
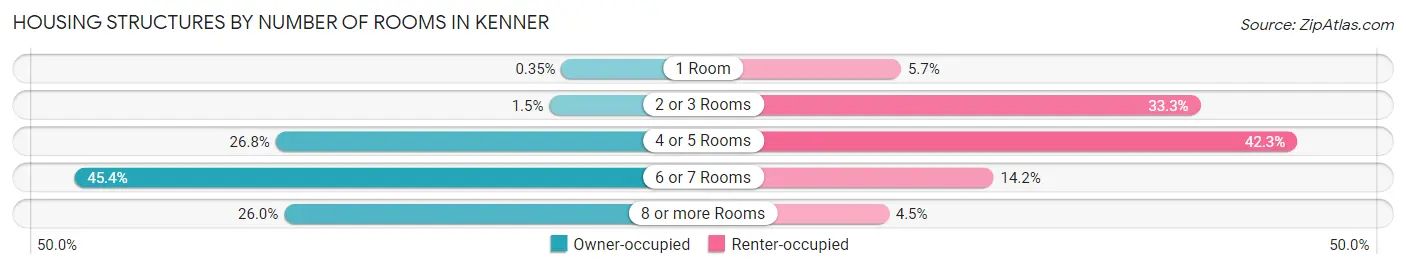
| Number of Rooms | Owner-occupied | Renter-occupied |
| 1 Room | 56 (0.4%) | 587 (5.7%) |
| 2 or 3 Rooms | 232 (1.5%) | 3,461 (33.3%) |
| 4 or 5 Rooms | 4,228 (26.8%) | 4,390 (42.3%) |
| 6 or 7 Rooms | 7,169 (45.4%) | 1,475 (14.2%) |
| 8 or more Rooms | 4,105 (26.0%) | 469 (4.5%) |
| Total | 15,790 (100.0%) | 10,382 (100.0%) |
Housing Structure by Heating Type in Kenner
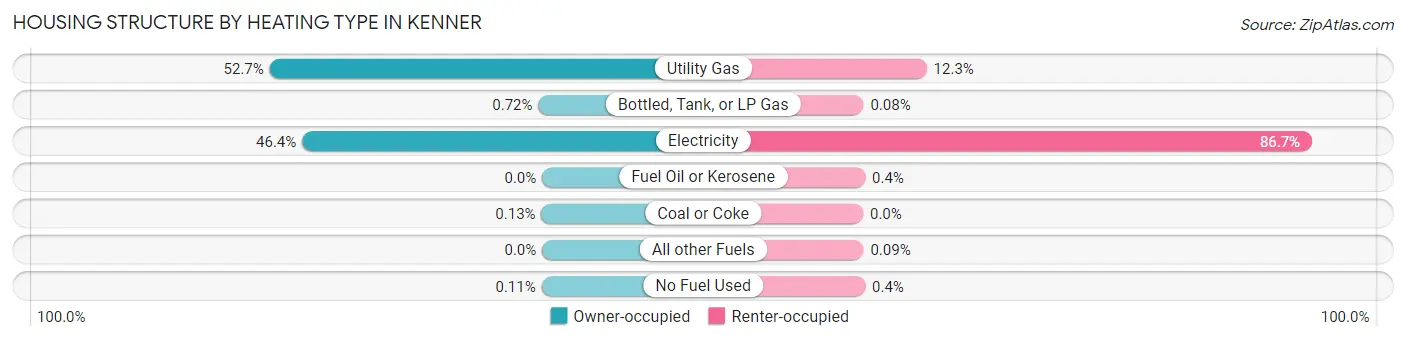
| Heating Type | Owner-occupied | Renter-occupied |
| Utility Gas | 8,315 (52.7%) | 1,276 (12.3%) |
| Bottled, Tank, or LP Gas | 114 (0.7%) | 8 (0.1%) |
| Electricity | 7,323 (46.4%) | 9,005 (86.7%) |
| Fuel Oil or Kerosene | 0 (0.0%) | 42 (0.4%) |
| Coal or Coke | 21 (0.1%) | 0 (0.0%) |
| All other Fuels | 0 (0.0%) | 9 (0.1%) |
| No Fuel Used | 17 (0.1%) | 42 (0.4%) |
| Total | 15,790 (100.0%) | 10,382 (100.0%) |
Household Vehicle Usage in Kenner

| Vehicles per Household | Owner-occupied | Renter-occupied |
| No Vehicle | 366 (2.3%) | 1,564 (15.1%) |
| 1 Vehicle | 4,546 (28.8%) | 5,617 (54.1%) |
| 2 Vehicles | 7,395 (46.8%) | 2,495 (24.0%) |
| 3 or more Vehicles | 3,483 (22.1%) | 706 (6.8%) |
| Total | 15,790 (100.0%) | 10,382 (100.0%) |
Real Estate & Mortgages in Kenner
Real Estate and Mortgage Overview in Kenner
| Characteristic | Without Mortgage | With Mortgage |
| Housing Units | 7,219 | 8,571 |
| Median Property Value | $217,300 | $243,100 |
| Median Household Income | $63,118 | $2,167 |
| Monthly Housing Costs | $480 | $863 |
| Real Estate Taxes | $740 | $715 |
Property Value by Mortgage Status in Kenner
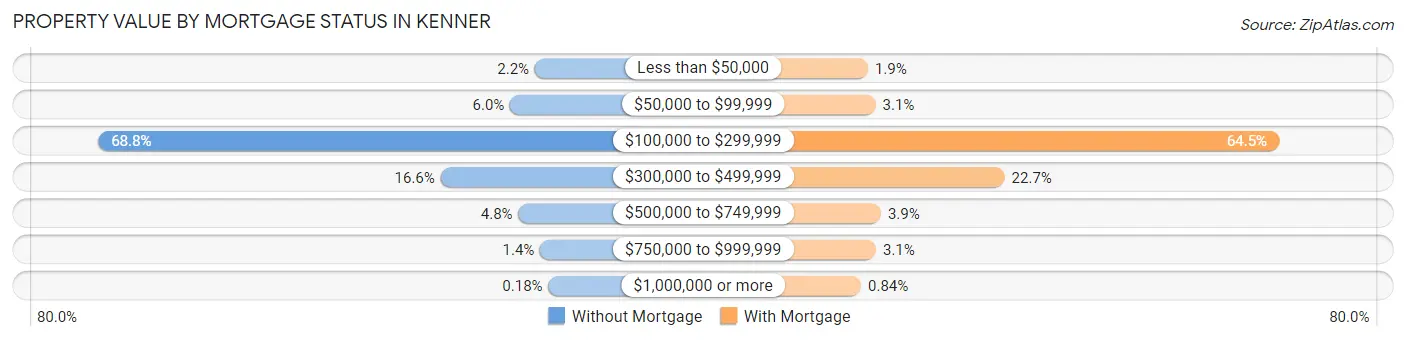
| Property Value | Without Mortgage | With Mortgage |
| Less than $50,000 | 161 (2.2%) | 162 (1.9%) |
| $50,000 to $99,999 | 434 (6.0%) | 262 (3.1%) |
| $100,000 to $299,999 | 4,965 (68.8%) | 5,529 (64.5%) |
| $300,000 to $499,999 | 1,199 (16.6%) | 1,947 (22.7%) |
| $500,000 to $749,999 | 343 (4.8%) | 332 (3.9%) |
| $750,000 to $999,999 | 104 (1.4%) | 267 (3.1%) |
| $1,000,000 or more | 13 (0.2%) | 72 (0.8%) |
| Total | 7,219 (100.0%) | 8,571 (100.0%) |
Household Income by Mortgage Status in Kenner
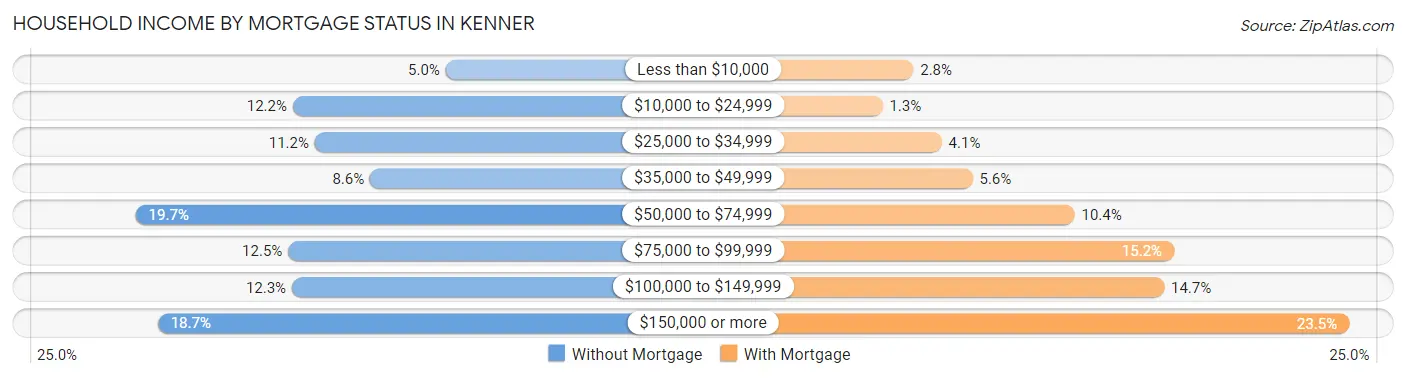
| Household Income | Without Mortgage | With Mortgage |
| Less than $10,000 | 357 (5.0%) | 236 (2.8%) |
| $10,000 to $24,999 | 883 (12.2%) | 110 (1.3%) |
| $25,000 to $34,999 | 807 (11.2%) | 351 (4.1%) |
| $35,000 to $49,999 | 617 (8.6%) | 477 (5.6%) |
| $50,000 to $74,999 | 1,423 (19.7%) | 894 (10.4%) |
| $75,000 to $99,999 | 899 (12.4%) | 1,299 (15.2%) |
| $100,000 to $149,999 | 886 (12.3%) | 1,259 (14.7%) |
| $150,000 or more | 1,347 (18.7%) | 2,014 (23.5%) |
| Total | 7,219 (100.0%) | 8,571 (100.0%) |
Property Value to Household Income Ratio in Kenner
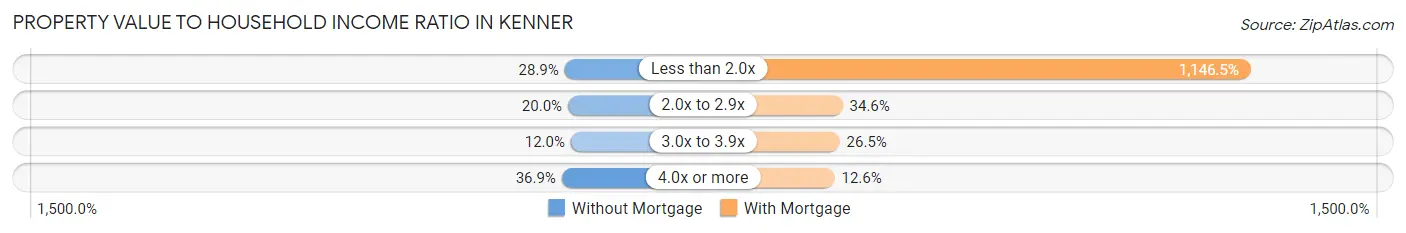
| Value-to-Income Ratio | Without Mortgage | With Mortgage |
| Less than 2.0x | 2,084 (28.9%) | 98,270 (1,146.5%) |
| 2.0x to 2.9x | 1,441 (20.0%) | 2,968 (34.6%) |
| 3.0x to 3.9x | 869 (12.0%) | 2,273 (26.5%) |
| 4.0x or more | 2,665 (36.9%) | 1,077 (12.6%) |
| Total | 7,219 (100.0%) | 8,571 (100.0%) |
Real Estate Taxes by Mortgage Status in Kenner
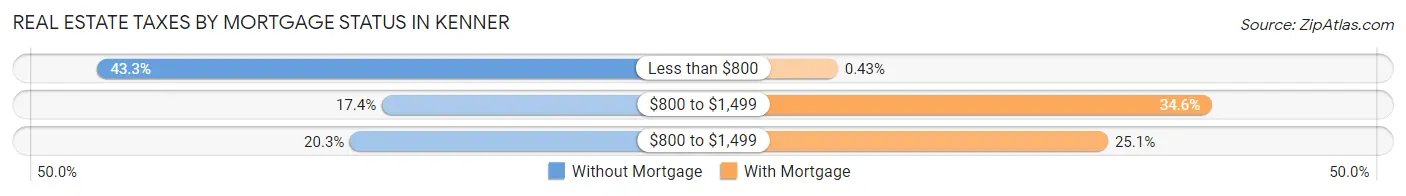
| Property Taxes | Without Mortgage | With Mortgage |
| Less than $800 | 3,129 (43.3%) | 37 (0.4%) |
| $800 to $1,499 | 1,253 (17.4%) | 2,966 (34.6%) |
| $800 to $1,499 | 1,463 (20.3%) | 2,152 (25.1%) |
| Total | 7,219 (100.0%) | 8,571 (100.0%) |
Health & Disability in Kenner
Health Insurance Coverage by Age in Kenner
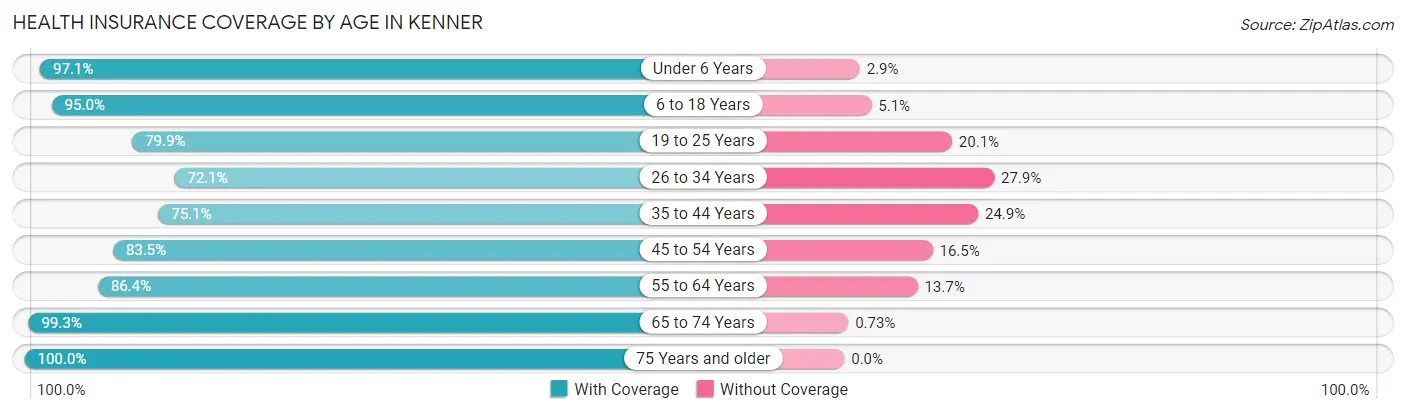
| Age Bracket | With Coverage | Without Coverage |
| Under 6 Years | 5,170 (97.1%) | 154 (2.9%) |
| 6 to 18 Years | 9,992 (95.0%) | 531 (5.1%) |
| 19 to 25 Years | 4,034 (79.9%) | 1,013 (20.1%) |
| 26 to 34 Years | 5,602 (72.1%) | 2,170 (27.9%) |
| 35 to 44 Years | 6,692 (75.1%) | 2,223 (24.9%) |
| 45 to 54 Years | 6,894 (83.5%) | 1,358 (16.5%) |
| 55 to 64 Years | 6,988 (86.4%) | 1,105 (13.7%) |
| 65 to 74 Years | 7,161 (99.3%) | 53 (0.7%) |
| 75 Years and older | 4,003 (100.0%) | 0 (0.0%) |
| Total | 56,536 (86.8%) | 8,607 (13.2%) |
Health Insurance Coverage by Citizenship Status in Kenner
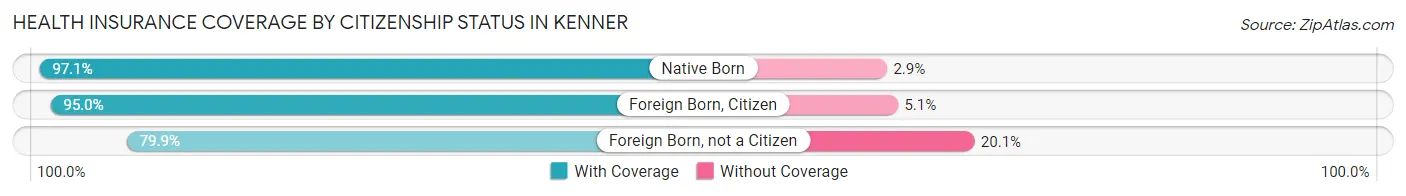
| Citizenship Status | With Coverage | Without Coverage |
| Native Born | 5,170 (97.1%) | 154 (2.9%) |
| Foreign Born, Citizen | 9,992 (95.0%) | 531 (5.1%) |
| Foreign Born, not a Citizen | 4,034 (79.9%) | 1,013 (20.1%) |
Health Insurance Coverage by Household Income in Kenner
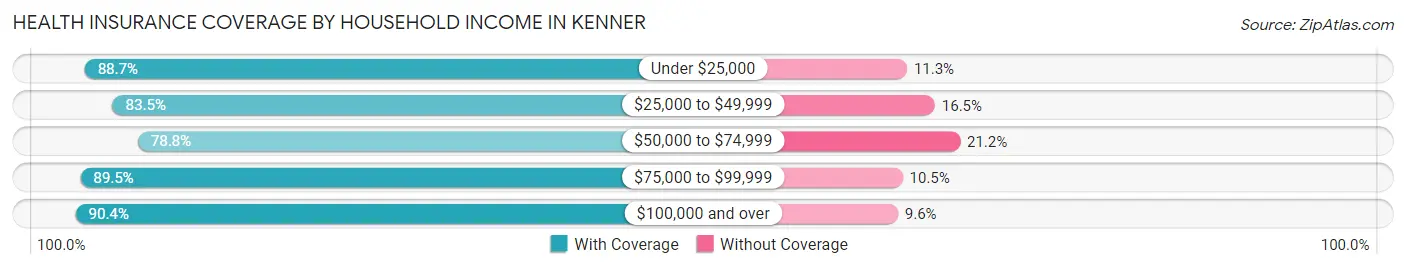
| Household Income | With Coverage | Without Coverage |
| Under $25,000 | 7,809 (88.7%) | 992 (11.3%) |
| $25,000 to $49,999 | 10,299 (83.5%) | 2,035 (16.5%) |
| $50,000 to $74,999 | 8,823 (78.8%) | 2,377 (21.2%) |
| $75,000 to $99,999 | 7,673 (89.5%) | 896 (10.5%) |
| $100,000 and over | 21,796 (90.4%) | 2,304 (9.6%) |
Public vs Private Health Insurance Coverage by Age in Kenner
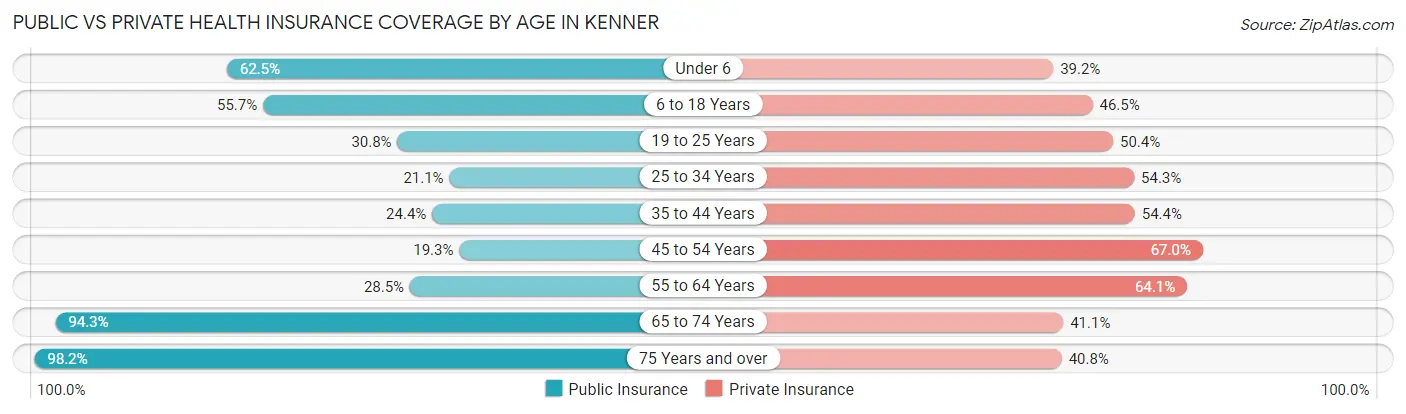
| Age Bracket | Public Insurance | Private Insurance |
| Under 6 | 3,326 (62.5%) | 2,089 (39.2%) |
| 6 to 18 Years | 5,865 (55.7%) | 4,897 (46.5%) |
| 19 to 25 Years | 1,554 (30.8%) | 2,541 (50.3%) |
| 25 to 34 Years | 1,643 (21.1%) | 4,217 (54.3%) |
| 35 to 44 Years | 2,171 (24.3%) | 4,848 (54.4%) |
| 45 to 54 Years | 1,594 (19.3%) | 5,528 (67.0%) |
| 55 to 64 Years | 2,304 (28.5%) | 5,187 (64.1%) |
| 65 to 74 Years | 6,801 (94.3%) | 2,965 (41.1%) |
| 75 Years and over | 3,930 (98.2%) | 1,634 (40.8%) |
| Total | 29,188 (44.8%) | 33,906 (52.0%) |
Disability Status by Sex by Age in Kenner
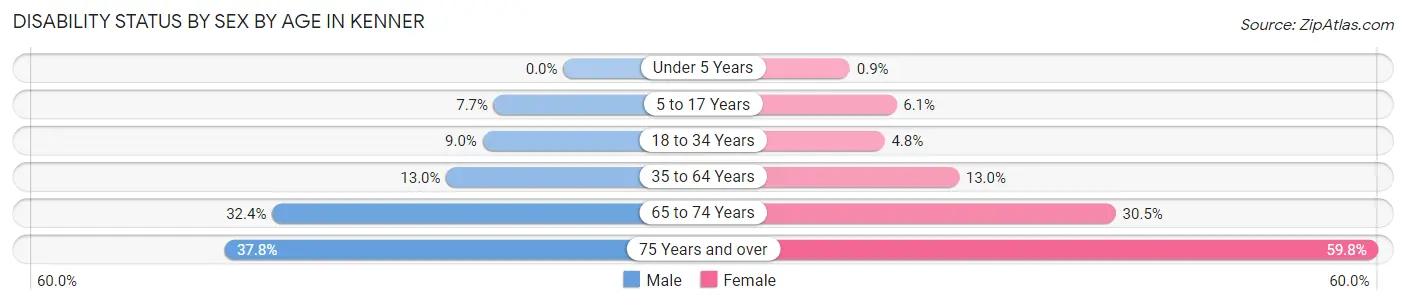
| Age Bracket | Male | Female |
| Under 5 Years | 0 (0.0%) | 21 (0.9%) |
| 5 to 17 Years | 388 (7.7%) | 347 (6.1%) |
| 18 to 34 Years | 532 (9.0%) | 359 (4.8%) |
| 35 to 64 Years | 1,641 (13.0%) | 1,650 (13.0%) |
| 65 to 74 Years | 1,021 (32.4%) | 1,240 (30.5%) |
| 75 Years and over | 594 (37.8%) | 1,453 (59.8%) |
Disability Class by Sex by Age in Kenner
Disability Class: Hearing Difficulty
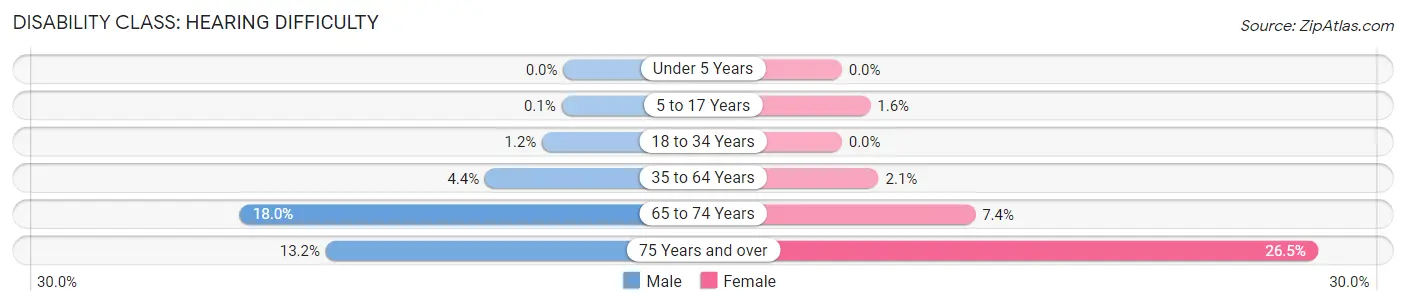
| Age Bracket | Male | Female |
| Under 5 Years | 0 (0.0%) | 0 (0.0%) |
| 5 to 17 Years | 5 (0.1%) | 91 (1.6%) |
| 18 to 34 Years | 70 (1.2%) | 0 (0.0%) |
| 35 to 64 Years | 549 (4.4%) | 260 (2.1%) |
| 65 to 74 Years | 567 (18.0%) | 302 (7.4%) |
| 75 Years and over | 208 (13.2%) | 644 (26.5%) |
Disability Class: Vision Difficulty
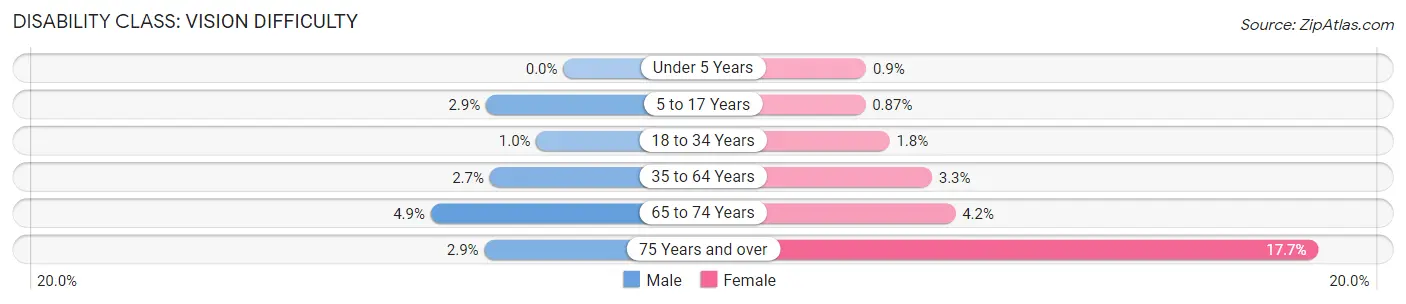
| Age Bracket | Male | Female |
| Under 5 Years | 0 (0.0%) | 21 (0.9%) |
| 5 to 17 Years | 144 (2.9%) | 50 (0.9%) |
| 18 to 34 Years | 59 (1.0%) | 134 (1.8%) |
| 35 to 64 Years | 344 (2.7%) | 423 (3.3%) |
| 65 to 74 Years | 155 (4.9%) | 171 (4.2%) |
| 75 Years and over | 46 (2.9%) | 430 (17.7%) |
Disability Class: Cognitive Difficulty
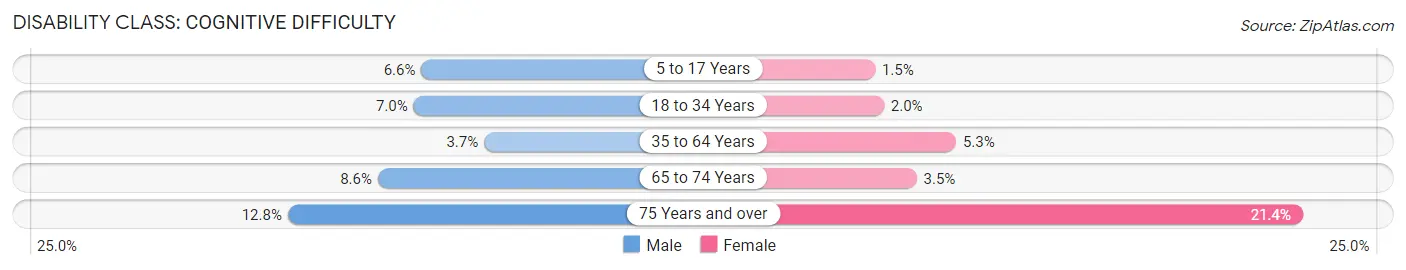
| Age Bracket | Male | Female |
| 5 to 17 Years | 330 (6.6%) | 88 (1.5%) |
| 18 to 34 Years | 412 (7.0%) | 147 (1.9%) |
| 35 to 64 Years | 463 (3.7%) | 671 (5.3%) |
| 65 to 74 Years | 271 (8.6%) | 141 (3.5%) |
| 75 Years and over | 201 (12.8%) | 520 (21.4%) |
Disability Class: Ambulatory Difficulty
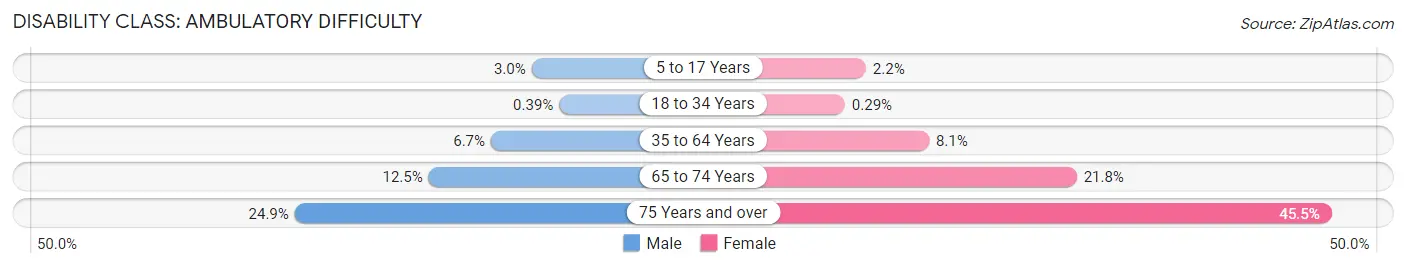
| Age Bracket | Male | Female |
| 5 to 17 Years | 148 (2.9%) | 128 (2.2%) |
| 18 to 34 Years | 23 (0.4%) | 22 (0.3%) |
| 35 to 64 Years | 848 (6.7%) | 1,025 (8.1%) |
| 65 to 74 Years | 394 (12.5%) | 886 (21.8%) |
| 75 Years and over | 392 (24.9%) | 1,105 (45.5%) |
Disability Class: Self-Care Difficulty
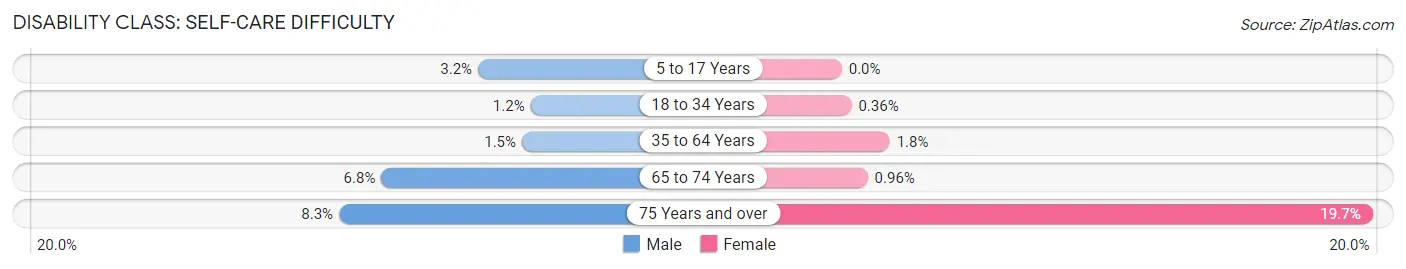
| Age Bracket | Male | Female |
| 5 to 17 Years | 159 (3.2%) | 0 (0.0%) |
| 18 to 34 Years | 72 (1.2%) | 27 (0.4%) |
| 35 to 64 Years | 194 (1.5%) | 225 (1.8%) |
| 65 to 74 Years | 213 (6.8%) | 39 (1.0%) |
| 75 Years and over | 131 (8.3%) | 479 (19.7%) |
Technology Access in Kenner
Computing Device Access in Kenner
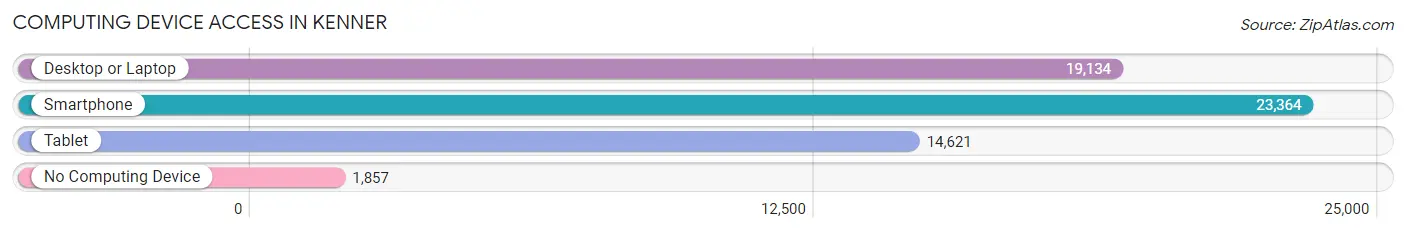
| Device Type | # Households | % Households |
| Desktop or Laptop | 19,134 | 73.1% |
| Smartphone | 23,364 | 89.3% |
| Tablet | 14,621 | 55.9% |
| No Computing Device | 1,857 | 7.1% |
| Total | 26,172 | 100.0% |
Internet Access in Kenner
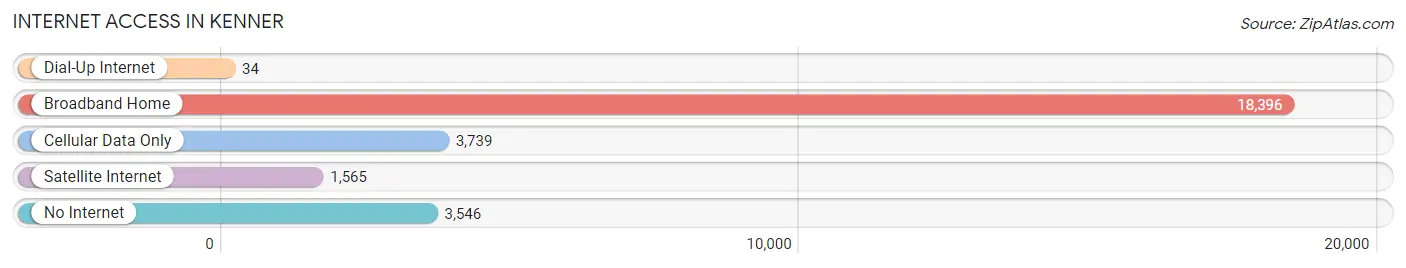
| Internet Type | # Households | % Households |
| Dial-Up Internet | 34 | 0.1% |
| Broadband Home | 18,396 | 70.3% |
| Cellular Data Only | 3,739 | 14.3% |
| Satellite Internet | 1,565 | 6.0% |
| No Internet | 3,546 | 13.6% |
| Total | 26,172 | 100.0% |
Kenner Summary
Kenner, Louisiana is a city located in Jefferson Parish, Louisiana, United States. It is the sixth-largest city in the state, with a population of 66,702 as of the 2010 census. Kenner is located on the south shore of Lake Pontchartrain, just south of New Orleans. It is part of the New Orleans–Metairie–Kenner Metropolitan Statistical Area.
History
Kenner was founded in 1855 by Minor Kenner, a wealthy landowner from New Orleans. He purchased land along the Mississippi River and built a plantation, which he named Kenner Plantation. The plantation was destroyed during the Civil War, but Minor Kenner rebuilt it and opened a post office in 1871. The town was officially incorporated in 1883.
In the early 20th century, Kenner was a popular tourist destination, with many hotels and resorts. The city was also home to a large amusement park, Pontchartrain Beach, which operated from 1928 to 1983.
Geography
Kenner is located at 30°1′N 90°15′W (30.0167, -90.25). According to the United States Census Bureau, the city has a total area of 24.2 square miles (62.7 km2), of which 23.7 square miles (61.3 km2) is land and 0.5 square miles (1.3 km2) (2.09%) is water.
Economy
Kenner is home to Louis Armstrong New Orleans International Airport, which is the primary airport for the New Orleans metropolitan area. The airport is a major economic driver for the city, providing jobs and economic activity.
Kenner is also home to several major corporations, including Ochsner Health System, Entergy, and Zatarain's. The city is also home to several shopping centers, including Esplanade Mall and Chateau Village Shopping Center.
Demographics
As of the 2010 census, Kenner had a population of 66,702. The racial makeup of the city was 57.2% White, 33.3% African American, 0.3% Native American, 2.2% Asian, 0.1% Pacific Islander, 4.2% from other races, and 2.7% from two or more races. Hispanic or Latino of any race were 11.2% of the population.
The median income for a household in the city was $45,945, and the median income for a family was $54,828. Males had a median income of $41,845 versus $31,935 for females. The per capita income for the city was $22,845. About 11.2% of families and 14.2% of the population were below the poverty line, including 19.2% of those under age 18 and 10.2% of those age 65 or over.
Common Questions
What is Per Capita Income in Kenner?
Per Capita income in Kenner is $35,300.
What is the Median Family Income in Kenner?
Median Family Income in Kenner is $78,792.
What is the Median Household income in Kenner?
Median Household Income in Kenner is $60,557.
What is Income or Wage Gap in Kenner?
Income or Wage Gap in Kenner is 31.4%.
Women in Kenner earn 68.6 cents for every dollar earned by a man.
What is Family Income Deficit in Kenner?
Family Income Deficit in Kenner is $10,923.
Families that are below poverty line in Kenner earn $10,923 less on average than the poverty threshold level.
What is Inequality or Gini Index in Kenner?
Inequality or Gini Index in Kenner is 0.48.
What is the Total Population of Kenner?
Total Population of Kenner is 65,785.
What is the Total Male Population of Kenner?
Total Male Population of Kenner is 30,762.
What is the Total Female Population of Kenner?
Total Female Population of Kenner is 35,023.
What is the Ratio of Males per 100 Females in Kenner?
There are 87.83 Males per 100 Females in Kenner.
What is the Ratio of Females per 100 Males in Kenner?
There are 113.85 Females per 100 Males in Kenner.
What is the Median Population Age in Kenner?
Median Population Age in Kenner is 38.4 Years.
What is the Average Family Size in Kenner
Average Family Size in Kenner is 3.2 People.
What is the Average Household Size in Kenner
Average Household Size in Kenner is 2.5 People.
How Large is the Labor Force in Kenner?
There are 34,649 People in the Labor Forcein in Kenner.
What is the Percentage of People in the Labor Force in Kenner?
66.5% of People are in the Labor Force in Kenner.
What is the Unemployment Rate in Kenner?
Unemployment Rate in Kenner is 5.7%.