Trinity, FL Map & Demographics
Trinity Map
Trinity Overview
$49,506
PER CAPITA INCOME
$116,311
AVG FAMILY INCOME
$106,862
AVG HOUSEHOLD INCOME
23.8%
WAGE / INCOME GAP [ % ]
76.2¢/ $1
WAGE / INCOME GAP [ $ ]
0.41
INEQUALITY / GINI INDEX
18,672
TOTAL POPULATION
9,077
MALE POPULATION
9,595
FEMALE POPULATION
94.60
MALES / 100 FEMALES
105.71
FEMALES / 100 MALES
43.7
MEDIAN AGE
3.1
AVG FAMILY SIZE
2.7
AVG HOUSEHOLD SIZE
8,525
LABOR FORCE [ PEOPLE ]
58.6%
PERCENT IN LABOR FORCE
4.2%
UNEMPLOYMENT RATE
Trinity Area Codes
Income in Trinity
Income Overview in Trinity
Per Capita Income in Trinity is $49,506, while median incomes of families and households are $116,311 and $106,862 respectively.
| Characteristic | Number | Measure |
| Per Capita Income | 18,672 | $49,506 |
| Median Family Income | 5,259 | $116,311 |
| Mean Family Income | 5,259 | $140,511 |
| Median Household Income | 6,852 | $106,862 |
| Mean Household Income | 6,852 | $131,725 |
| Income Deficit | 5,259 | $0 |
| Wage / Income Gap (%) | 18,672 | 23.81% |
| Wage / Income Gap ($) | 18,672 | 76.19¢ per $1 |
| Gini / Inequality Index | 18,672 | 0.41 |
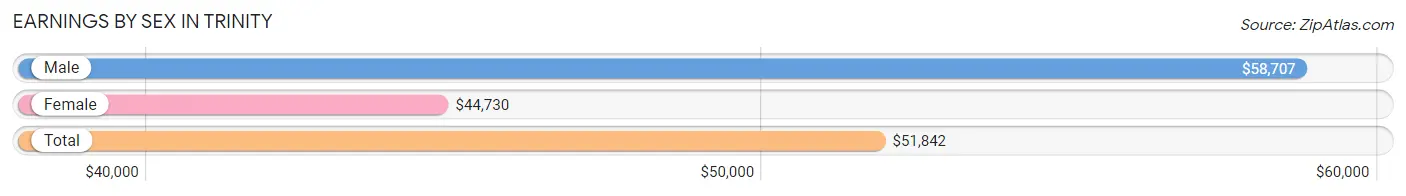
Earnings by Sex in Trinity
Average Earnings in Trinity are $51,842, $58,707 for men and $44,730 for women, a difference of 23.8%.
| Sex | Number | Average Earnings |
| Male | 5,119 (55.8%) | $58,707 |
| Female | 4,062 (44.2%) | $44,730 |
| Total | 9,181 (100.0%) | $51,842 |
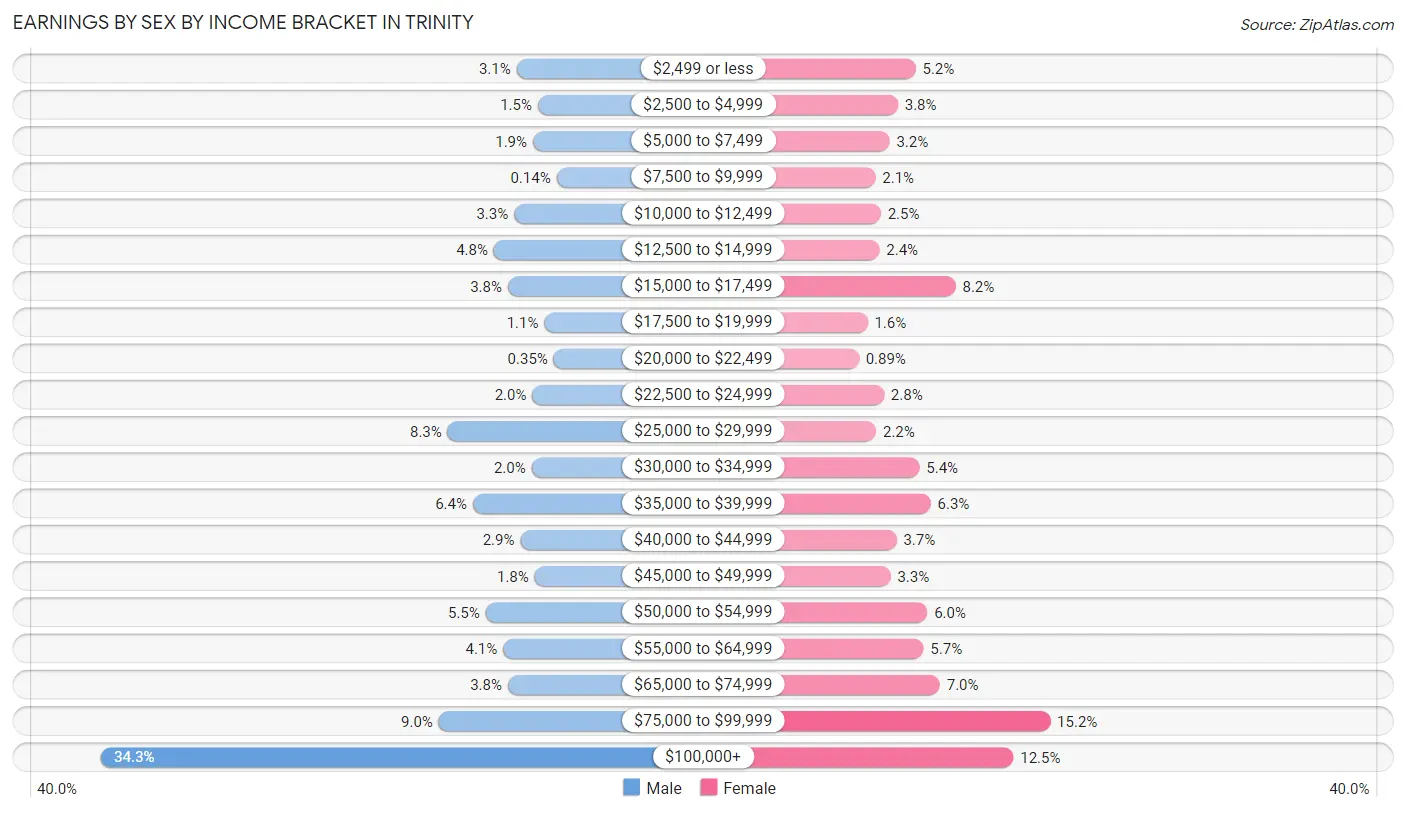
Earnings by Sex by Income Bracket in Trinity
The most common earnings brackets in Trinity are $100,000+ for men (1,754 | 34.3%) and $75,000 to $99,999 for women (619 | 15.2%).
| Income | Male | Female |
| $2,499 or less | 160 (3.1%) | 209 (5.1%) |
| $2,500 to $4,999 | 79 (1.5%) | 155 (3.8%) |
| $5,000 to $7,499 | 98 (1.9%) | 130 (3.2%) |
| $7,500 to $9,999 | 7 (0.1%) | 87 (2.1%) |
| $10,000 to $12,499 | 170 (3.3%) | 103 (2.5%) |
| $12,500 to $14,999 | 248 (4.8%) | 99 (2.4%) |
| $15,000 to $17,499 | 194 (3.8%) | 331 (8.2%) |
| $17,500 to $19,999 | 54 (1.1%) | 63 (1.5%) |
| $20,000 to $22,499 | 18 (0.4%) | 36 (0.9%) |
| $22,500 to $24,999 | 100 (1.9%) | 113 (2.8%) |
| $25,000 to $29,999 | 425 (8.3%) | 89 (2.2%) |
| $30,000 to $34,999 | 103 (2.0%) | 221 (5.4%) |
| $35,000 to $39,999 | 328 (6.4%) | 255 (6.3%) |
| $40,000 to $44,999 | 146 (2.9%) | 151 (3.7%) |
| $45,000 to $49,999 | 91 (1.8%) | 133 (3.3%) |
| $50,000 to $54,999 | 279 (5.4%) | 245 (6.0%) |
| $55,000 to $64,999 | 212 (4.1%) | 233 (5.7%) |
| $65,000 to $74,999 | 194 (3.8%) | 283 (7.0%) |
| $75,000 to $99,999 | 459 (9.0%) | 619 (15.2%) |
| $100,000+ | 1,754 (34.3%) | 507 (12.5%) |
| Total | 5,119 (100.0%) | 4,062 (100.0%) |
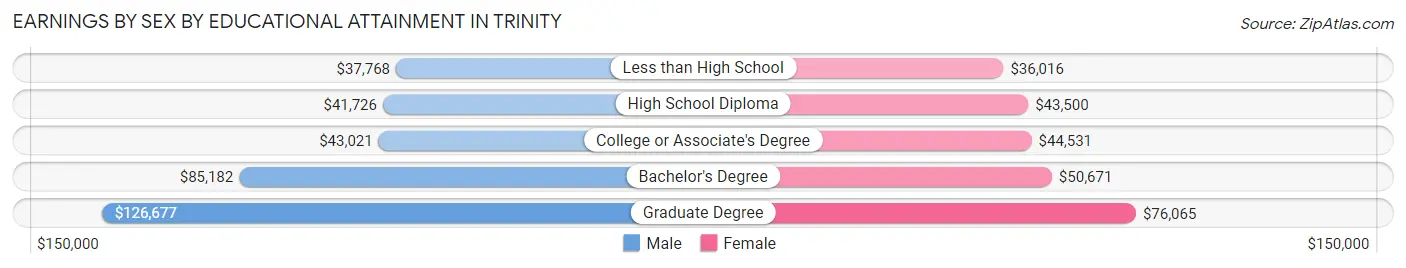
Earnings by Sex by Educational Attainment in Trinity
Average earnings in Trinity are $67,851 for men and $53,377 for women, a difference of 21.3%. Men with an educational attainment of graduate degree enjoy the highest average annual earnings of $126,677, while those with less than high school education earn the least with $37,768. Women with an educational attainment of graduate degree earn the most with the average annual earnings of $76,065, while those with less than high school education have the smallest earnings of $36,016.
| Educational Attainment | Male Income | Female Income |
| Less than High School | $37,768 | $36,016 |
| High School Diploma | $41,726 | $43,500 |
| College or Associate's Degree | $43,021 | $44,531 |
| Bachelor's Degree | $85,182 | $50,671 |
| Graduate Degree | $126,677 | $76,065 |
| Total | $67,851 | $53,377 |
Family Income in Trinity
Family Income Brackets in Trinity
According to the Trinity family income data, there are 1,278 families falling into the $100,000 to $149,999 income range, which is the most common income bracket and makes up 24.3% of all families. Conversely, the $10,000 to $14,999 income bracket is the least frequent group with only 32 families (0.6%) belonging to this category.
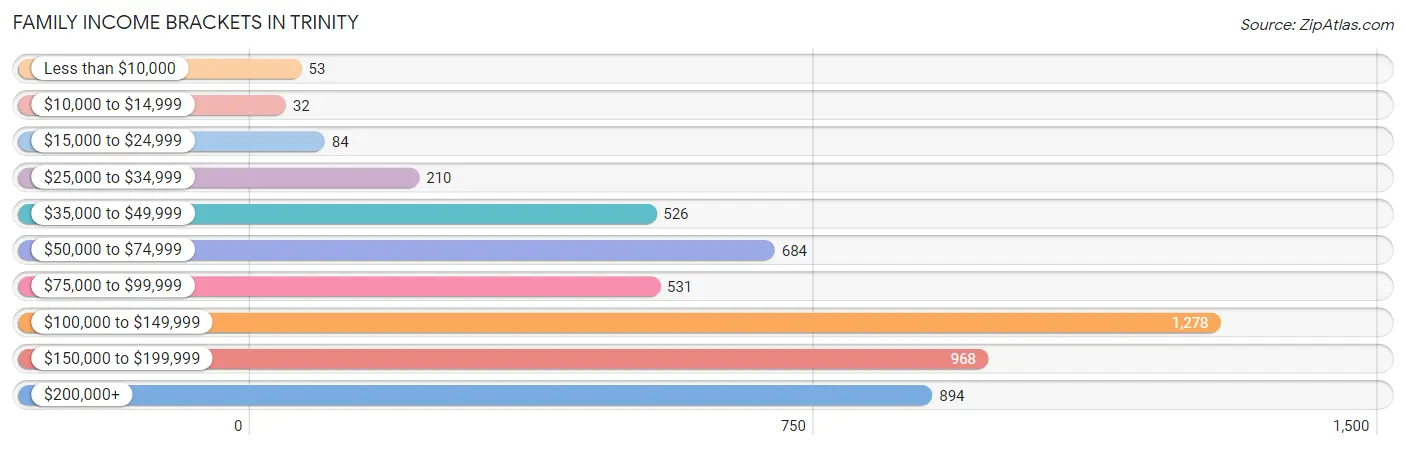
| Income Bracket | # Families | % Families |
| Less than $10,000 | 53 | 1.0% |
| $10,000 to $14,999 | 32 | 0.6% |
| $15,000 to $24,999 | 84 | 1.6% |
| $25,000 to $34,999 | 210 | 4.0% |
| $35,000 to $49,999 | 526 | 10.0% |
| $50,000 to $74,999 | 684 | 13.0% |
| $75,000 to $99,999 | 531 | 10.1% |
| $100,000 to $149,999 | 1,278 | 24.3% |
| $150,000 to $199,999 | 968 | 18.4% |
| $200,000+ | 894 | 17.0% |
Family Income by Famaliy Size in Trinity
6-person families (80 | 1.5%) account for the highest median family income in Trinity with $248,421 per family, while 2-person families (2,341 | 44.5%) have the highest median income of $48,125 per family member.
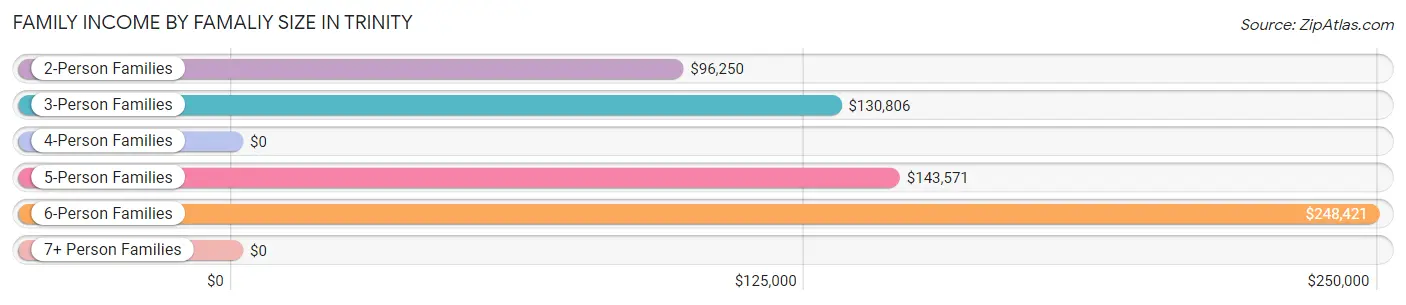
| Income Bracket | # Families | Median Income |
| 2-Person Families | 2,341 (44.5%) | $96,250 |
| 3-Person Families | 1,207 (23.0%) | $130,806 |
| 4-Person Families | 965 (18.3%) | $0 |
| 5-Person Families | 604 (11.5%) | $143,571 |
| 6-Person Families | 80 (1.5%) | $248,421 |
| 7+ Person Families | 62 (1.2%) | $0 |
| Total | 5,259 (100.0%) | $116,311 |
Family Income by Number of Earners in Trinity
The median family income in Trinity is $116,311, with families comprising 3+ earners (543) having the highest median family income of $144,583, while families with no earners (1,153) have the lowest median family income of $68,952, accounting for 10.3% and 21.9% of families, respectively.
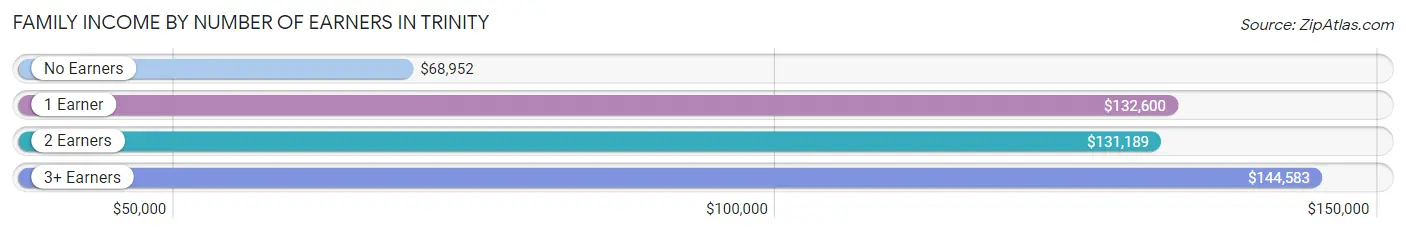
| Number of Earners | # Families | Median Income |
| No Earners | 1,153 (21.9%) | $68,952 |
| 1 Earner | 1,306 (24.8%) | $132,600 |
| 2 Earners | 2,257 (42.9%) | $131,189 |
| 3+ Earners | 543 (10.3%) | $144,583 |
| Total | 5,259 (100.0%) | $116,311 |
Household Income in Trinity
Household Income Brackets in Trinity
With 1,473 households falling in the category, the $100,000 to $149,999 income range is the most frequent in Trinity, accounting for 21.5% of all households. In contrast, only 41 households (0.6%) fall into the $10,000 to $14,999 income bracket, making it the least populous group.
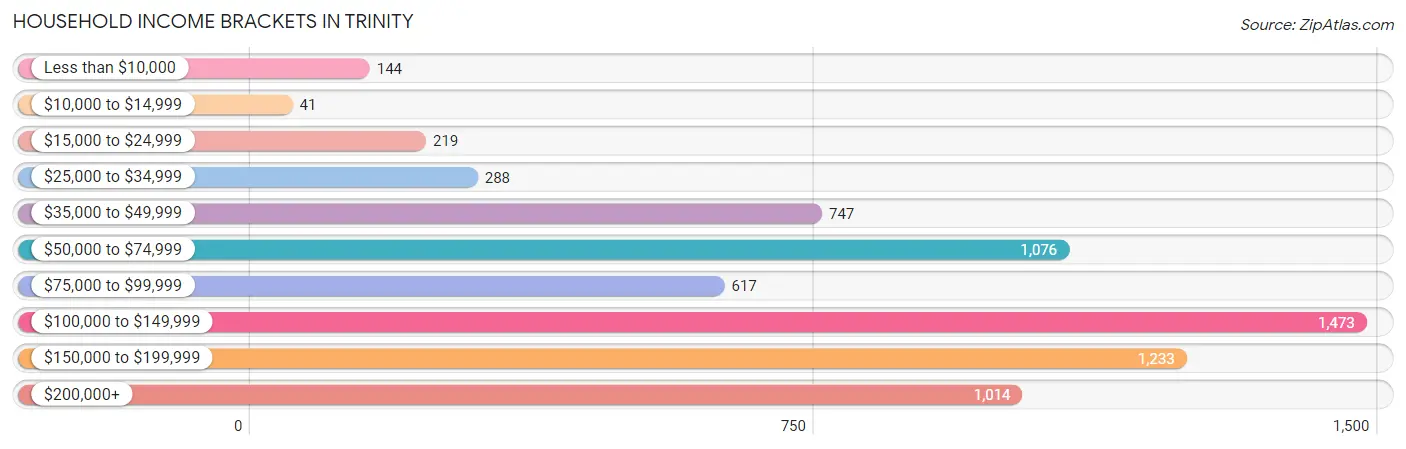
| Income Bracket | # Households | % Households |
| Less than $10,000 | 144 | 2.1% |
| $10,000 to $14,999 | 41 | 0.6% |
| $15,000 to $24,999 | 219 | 3.2% |
| $25,000 to $34,999 | 288 | 4.2% |
| $35,000 to $49,999 | 747 | 10.9% |
| $50,000 to $74,999 | 1,076 | 15.7% |
| $75,000 to $99,999 | 617 | 9.0% |
| $100,000 to $149,999 | 1,473 | 21.5% |
| $150,000 to $199,999 | 1,233 | 18.0% |
| $200,000+ | 1,014 | 14.8% |
Household Income by Householder Age in Trinity
The median household income in Trinity is $106,862, with the highest median household income of $135,625 found in the 45 to 64 years age bracket for the primary householder. A total of 2,770 households (40.4%) fall into this category. Meanwhile, the 15 to 24 years age bracket for the primary householder has the lowest median household income of $0, with 36 households (0.5%) in this group.
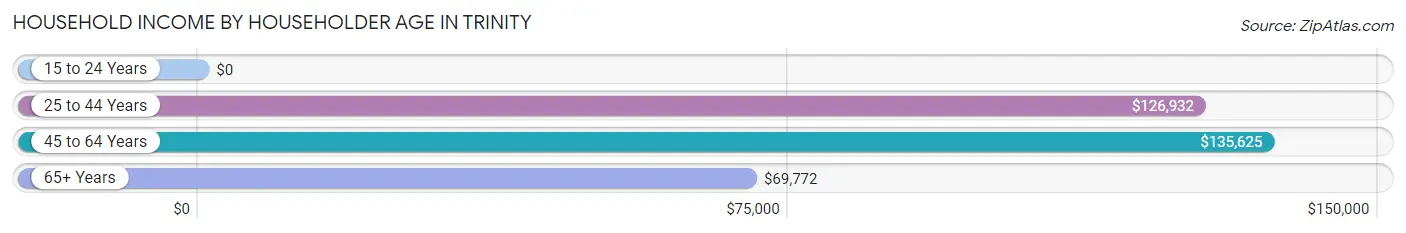
| Income Bracket | # Households | Median Income |
| 15 to 24 Years | 36 (0.5%) | $0 |
| 25 to 44 Years | 1,705 (24.9%) | $126,932 |
| 45 to 64 Years | 2,770 (40.4%) | $135,625 |
| 65+ Years | 2,341 (34.2%) | $69,772 |
| Total | 6,852 (100.0%) | $106,862 |
Poverty in Trinity
Income Below Poverty by Sex and Age in Trinity
With 8.5% poverty level for males and 9.2% for females among the residents of Trinity, 6 to 11 year old males and 5 year old females are the most vulnerable to poverty, with 387 males (51.1%) and 41 females (32.5%) in their respective age groups living below the poverty level.
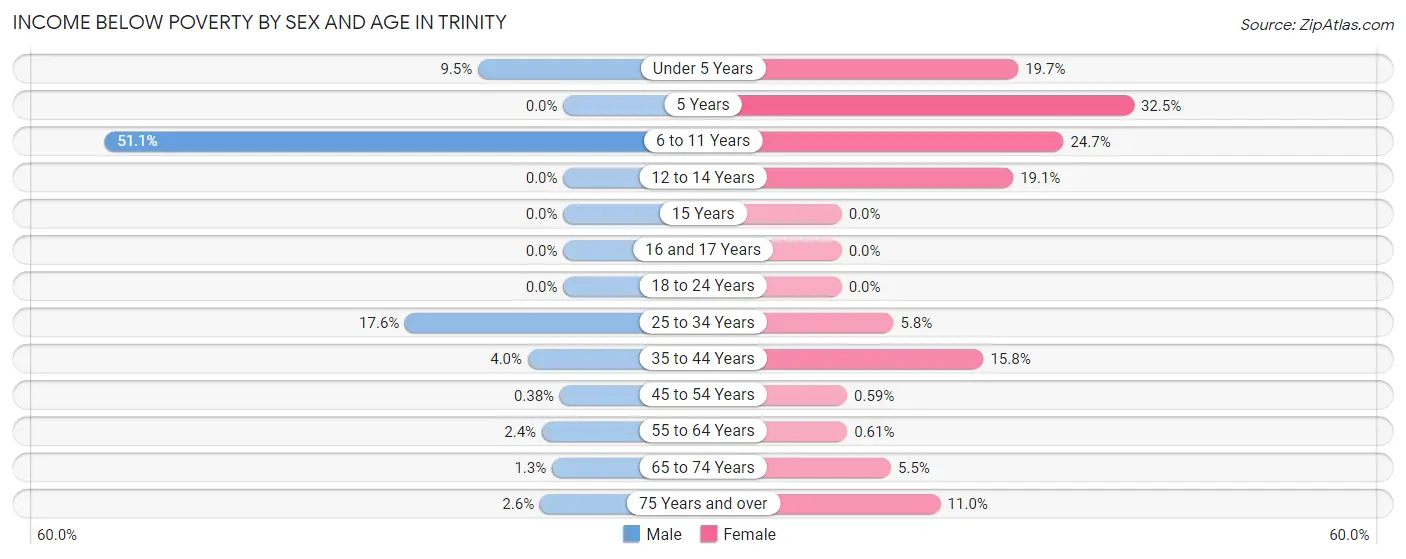
| Age Bracket | Male | Female |
| Under 5 Years | 57 (9.5%) | 133 (19.7%) |
| 5 Years | 0 (0.0%) | 41 (32.5%) |
| 6 to 11 Years | 387 (51.1%) | 196 (24.7%) |
| 12 to 14 Years | 0 (0.0%) | 71 (19.1%) |
| 15 Years | 0 (0.0%) | 0 (0.0%) |
| 16 and 17 Years | 0 (0.0%) | 0 (0.0%) |
| 18 to 24 Years | 0 (0.0%) | 0 (0.0%) |
| 25 to 34 Years | 224 (17.6%) | 52 (5.8%) |
| 35 to 44 Years | 34 (4.0%) | 179 (15.8%) |
| 45 to 54 Years | 6 (0.4%) | 7 (0.6%) |
| 55 to 64 Years | 22 (2.4%) | 6 (0.6%) |
| 65 to 74 Years | 11 (1.3%) | 60 (5.5%) |
| 75 Years and over | 28 (2.6%) | 139 (11.0%) |
| Total | 769 (8.5%) | 884 (9.2%) |
Income Above Poverty by Sex and Age in Trinity
According to the poverty statistics in Trinity, males aged 5 years and females aged 15 years are the age groups that are most secure financially, with 100.0% of males and 100.0% of females in these age groups living above the poverty line.
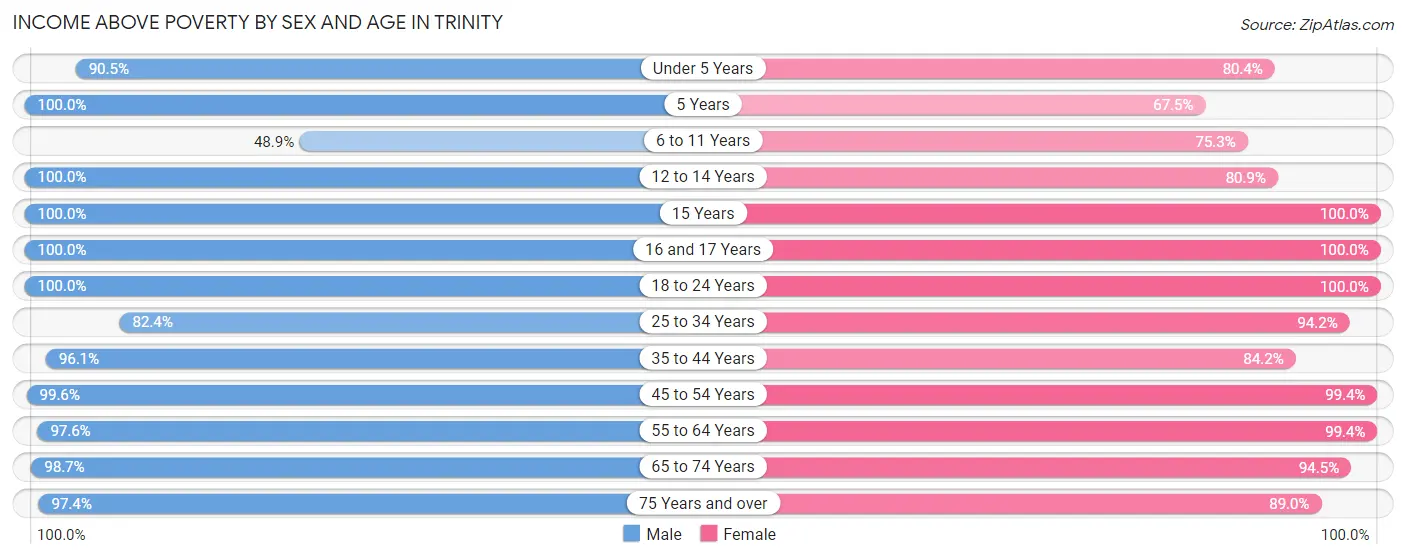
| Age Bracket | Male | Female |
| Under 5 Years | 543 (90.5%) | 544 (80.3%) |
| 5 Years | 75 (100.0%) | 85 (67.5%) |
| 6 to 11 Years | 370 (48.9%) | 598 (75.3%) |
| 12 to 14 Years | 428 (100.0%) | 301 (80.9%) |
| 15 Years | 112 (100.0%) | 163 (100.0%) |
| 16 and 17 Years | 96 (100.0%) | 335 (100.0%) |
| 18 to 24 Years | 395 (100.0%) | 567 (100.0%) |
| 25 to 34 Years | 1,047 (82.4%) | 850 (94.2%) |
| 35 to 44 Years | 827 (96.1%) | 955 (84.2%) |
| 45 to 54 Years | 1,581 (99.6%) | 1,171 (99.4%) |
| 55 to 64 Years | 900 (97.6%) | 985 (99.4%) |
| 65 to 74 Years | 865 (98.7%) | 1,033 (94.5%) |
| 75 Years and over | 1,049 (97.4%) | 1,124 (89.0%) |
| Total | 8,288 (91.5%) | 8,711 (90.8%) |
Income Below Poverty Among Married-Couple Families in Trinity
The poverty statistics for married-couple families in Trinity show that 2.5% or 117 of the total 4,621 families live below the poverty line. Families with 5 or more children have the highest poverty rate of 50.0%, comprising of 31 families. On the other hand, families with 3 or 4 children have the lowest poverty rate of 0.0%, which includes 0 families.
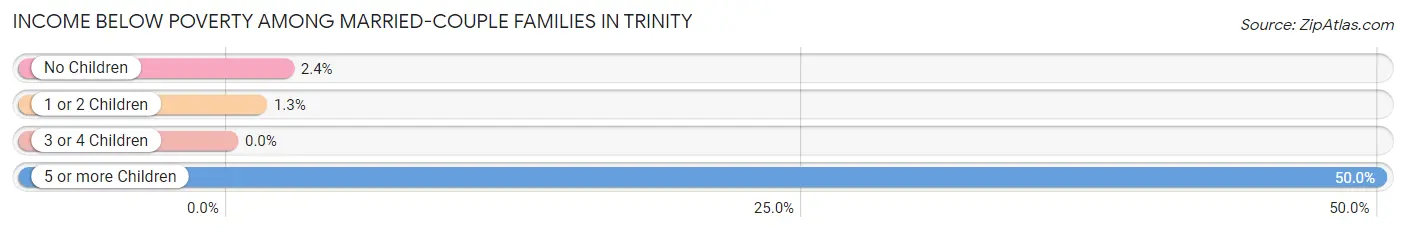
| Children | Above Poverty | Below Poverty |
| No Children | 2,610 (97.6%) | 65 (2.4%) |
| 1 or 2 Children | 1,646 (98.7%) | 21 (1.3%) |
| 3 or 4 Children | 217 (100.0%) | 0 (0.0%) |
| 5 or more Children | 31 (50.0%) | 31 (50.0%) |
| Total | 4,504 (97.5%) | 117 (2.5%) |
Income Below Poverty Among Single-Parent Households in Trinity
According to the poverty data in Trinity, 12.2% or 14 single-father households and 31.9% or 167 single-mother households are living below the poverty line. Among single-father households, those with 1 or 2 children have the highest poverty rate, with 14 households (24.1%) experiencing poverty. Likewise, among single-mother households, those with 3 or 4 children have the highest poverty rate, with 167 households (100.0%) falling below the poverty line.
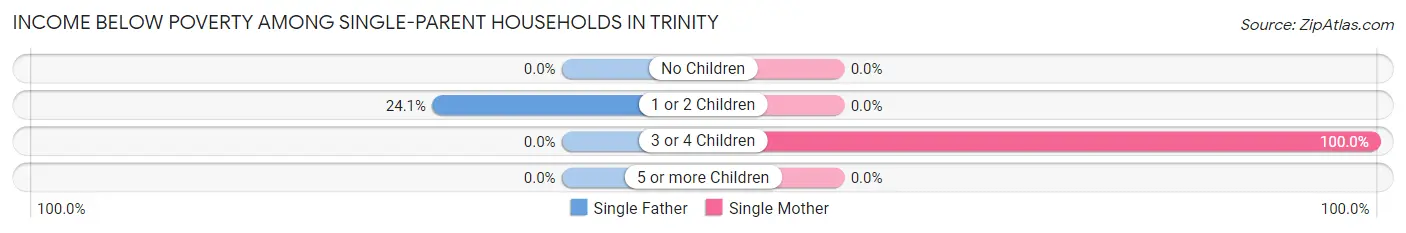
| Children | Single Father | Single Mother |
| No Children | 0 (0.0%) | 0 (0.0%) |
| 1 or 2 Children | 14 (24.1%) | 0 (0.0%) |
| 3 or 4 Children | 0 (0.0%) | 167 (100.0%) |
| 5 or more Children | 0 (0.0%) | 0 (0.0%) |
| Total | 14 (12.2%) | 167 (31.9%) |
Income Below Poverty Among Married-Couple vs Single-Parent Households in Trinity
The poverty data for Trinity shows that 117 of the married-couple family households (2.5%) and 181 of the single-parent households (28.4%) are living below the poverty level. Within the married-couple family households, those with 5 or more children have the highest poverty rate, with 31 households (50.0%) falling below the poverty line. Among the single-parent households, those with 3 or 4 children have the highest poverty rate, with 167 household (100.0%) living below poverty.
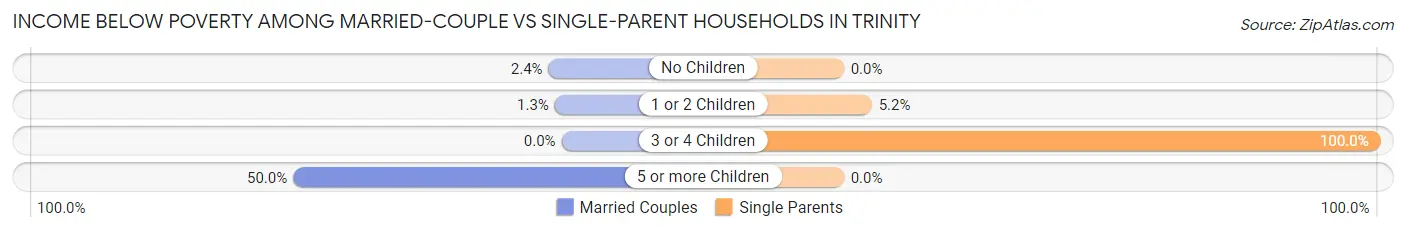
| Children | Married-Couple Families | Single-Parent Households |
| No Children | 65 (2.4%) | 0 (0.0%) |
| 1 or 2 Children | 21 (1.3%) | 14 (5.2%) |
| 3 or 4 Children | 0 (0.0%) | 167 (100.0%) |
| 5 or more Children | 31 (50.0%) | 0 (0.0%) |
| Total | 117 (2.5%) | 181 (28.4%) |
Race in Trinity
The most populous races in Trinity are White / Caucasian (16,389 | 87.8%), Hispanic or Latino (1,419 | 7.6%), and Two or more Races (1,168 | 6.3%).
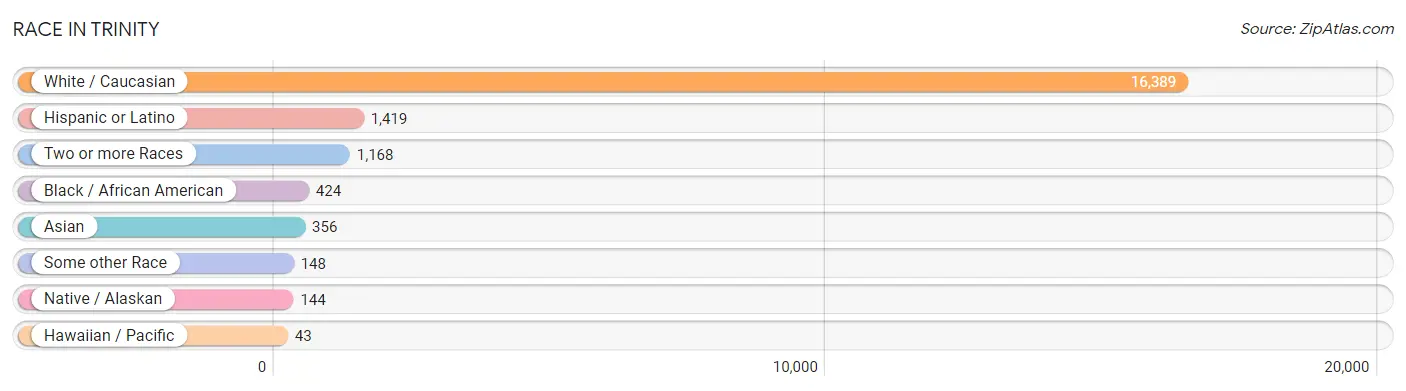
| Race | # Population | % Population |
| Asian | 356 | 1.9% |
| Black / African American | 424 | 2.3% |
| Hawaiian / Pacific | 43 | 0.2% |
| Hispanic or Latino | 1,419 | 7.6% |
| Native / Alaskan | 144 | 0.8% |
| White / Caucasian | 16,389 | 87.8% |
| Two or more Races | 1,168 | 6.3% |
| Some other Race | 148 | 0.8% |
| Total | 18,672 | 100.0% |
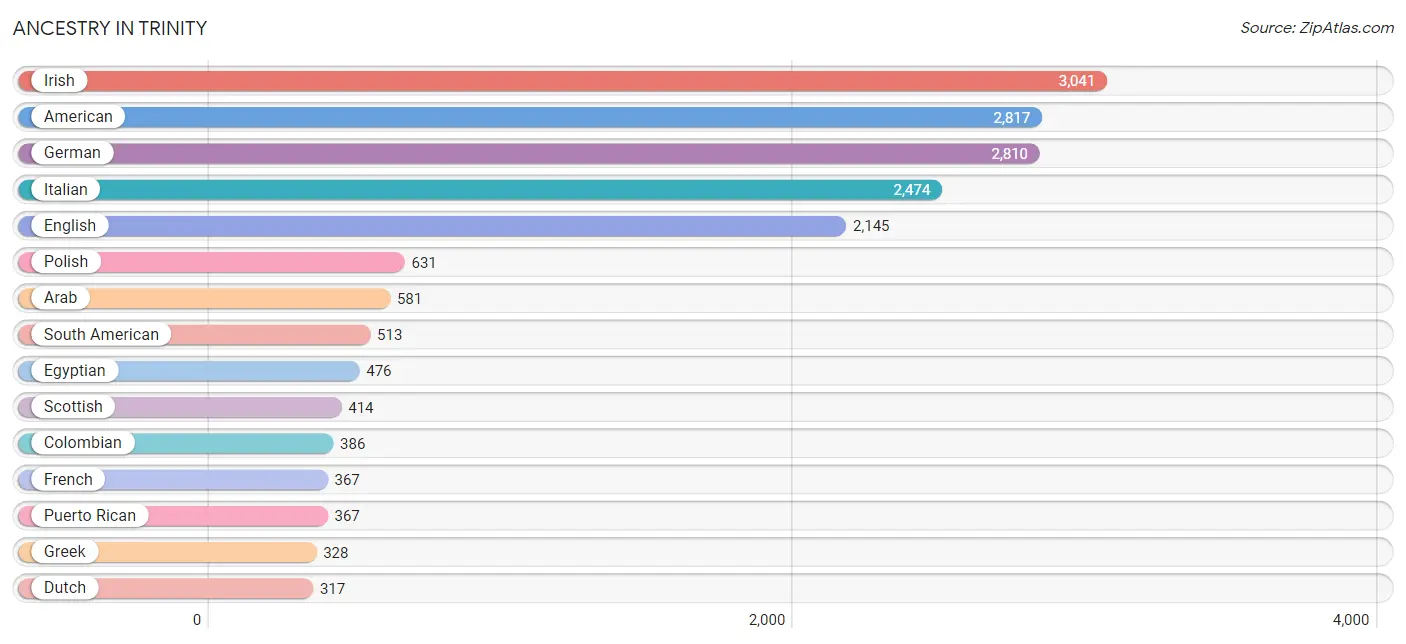
Ancestry in Trinity
The most populous ancestries reported in Trinity are Irish (3,041 | 16.3%), American (2,817 | 15.1%), German (2,810 | 15.0%), Italian (2,474 | 13.3%), and English (2,145 | 11.5%), together accounting for 71.2% of all Trinity residents.
| Ancestry | # Population | % Population |
| African | 130 | 0.7% |
| American | 2,817 | 15.1% |
| Arab | 581 | 3.1% |
| Argentinean | 22 | 0.1% |
| Armenian | 26 | 0.1% |
| Austrian | 104 | 0.6% |
| Belgian | 56 | 0.3% |
| Bhutanese | 8 | 0.0% |
| Brazilian | 111 | 0.6% |
| British | 72 | 0.4% |
| Burmese | 141 | 0.8% |
| Canadian | 179 | 1.0% |
| Central American | 85 | 0.5% |
| Central American Indian | 34 | 0.2% |
| Cherokee | 23 | 0.1% |
| Chippewa | 73 | 0.4% |
| Colombian | 386 | 2.1% |
| Costa Rican | 79 | 0.4% |
| Cuban | 279 | 1.5% |
| Czech | 148 | 0.8% |
| Danish | 308 | 1.7% |
| Dominican | 14 | 0.1% |
| Dutch | 317 | 1.7% |
| Eastern European | 35 | 0.2% |
| Ecuadorian | 7 | 0.0% |
| Egyptian | 476 | 2.5% |
| English | 2,145 | 11.5% |
| Estonian | 5 | 0.0% |
| European | 292 | 1.6% |
| Finnish | 65 | 0.4% |
| French | 367 | 2.0% |
| French Canadian | 171 | 0.9% |
| German | 2,810 | 15.0% |
| Greek | 328 | 1.8% |
| Guyanese | 41 | 0.2% |
| Honduran | 6 | 0.0% |
| Hungarian | 107 | 0.6% |
| Indian (Asian) | 59 | 0.3% |
| Irish | 3,041 | 16.3% |
| Iroquois | 33 | 0.2% |
| Israeli | 17 | 0.1% |
| Italian | 2,474 | 13.3% |
| Jamaican | 24 | 0.1% |
| Korean | 119 | 0.6% |
| Lebanese | 105 | 0.6% |
| Lithuanian | 24 | 0.1% |
| Mexican | 49 | 0.3% |
| Native Hawaiian | 28 | 0.2% |
| Northern European | 19 | 0.1% |
| Norwegian | 72 | 0.4% |
| Paraguayan | 14 | 0.1% |
| Peruvian | 30 | 0.2% |
| Polish | 631 | 3.4% |
| Portuguese | 63 | 0.3% |
| Puerto Rican | 367 | 2.0% |
| Romanian | 12 | 0.1% |
| Russian | 188 | 1.0% |
| Scandinavian | 190 | 1.0% |
| Scotch-Irish | 87 | 0.5% |
| Scottish | 414 | 2.2% |
| Seminole | 35 | 0.2% |
| Serbian | 19 | 0.1% |
| Slavic | 12 | 0.1% |
| Slovak | 28 | 0.2% |
| Slovene | 9 | 0.1% |
| South American | 513 | 2.8% |
| Spaniard | 35 | 0.2% |
| Spanish | 61 | 0.3% |
| Sri Lankan | 21 | 0.1% |
| Subsaharan African | 130 | 0.7% |
| Swedish | 88 | 0.5% |
| Swiss | 39 | 0.2% |
| Thai | 210 | 1.1% |
| Trinidadian and Tobagonian | 15 | 0.1% |
| Ukrainian | 122 | 0.6% |
| Venezuelan | 54 | 0.3% |
| Welsh | 35 | 0.2% | View All 77 Rows |
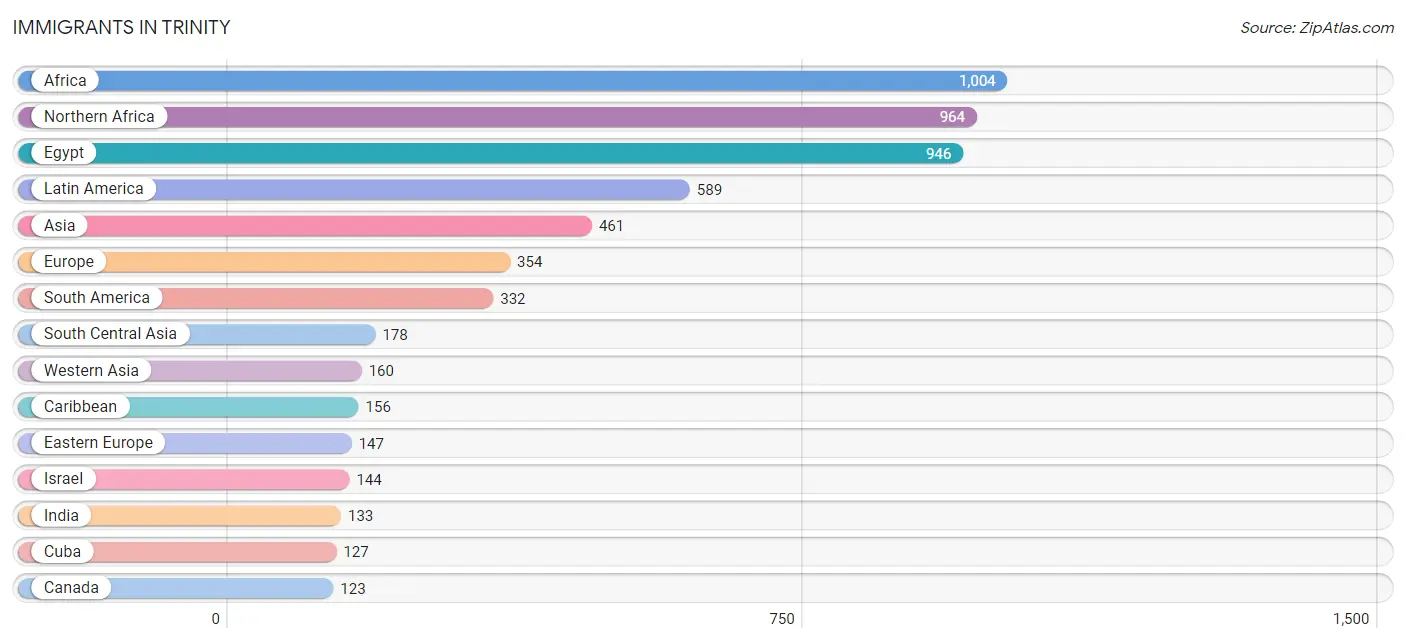
Immigrants in Trinity
The most numerous immigrant groups reported in Trinity came from Africa (1,004 | 5.4%), Northern Africa (964 | 5.2%), Egypt (946 | 5.1%), Latin America (589 | 3.2%), and Asia (461 | 2.5%), together accounting for 21.2% of all Trinity residents.
| Immigration Origin | # Population | % Population |
| Africa | 1,004 | 5.4% |
| Asia | 461 | 2.5% |
| Azores | 15 | 0.1% |
| Brazil | 100 | 0.5% |
| Canada | 123 | 0.7% |
| Caribbean | 156 | 0.8% |
| Central America | 101 | 0.5% |
| China | 15 | 0.1% |
| Colombia | 107 | 0.6% |
| Costa Rica | 61 | 0.3% |
| Croatia | 11 | 0.1% |
| Cuba | 127 | 0.7% |
| Eastern Asia | 52 | 0.3% |
| Eastern Europe | 147 | 0.8% |
| Ecuador | 3 | 0.0% |
| Egypt | 946 | 5.1% |
| England | 19 | 0.1% |
| Europe | 354 | 1.9% |
| Fiji | 6 | 0.0% |
| Germany | 55 | 0.3% |
| Guyana | 24 | 0.1% |
| Honduras | 6 | 0.0% |
| Hungary | 23 | 0.1% |
| India | 133 | 0.7% |
| Ireland | 29 | 0.2% |
| Israel | 144 | 0.8% |
| Italy | 54 | 0.3% |
| Jamaica | 24 | 0.1% |
| Korea | 37 | 0.2% |
| Latin America | 589 | 3.2% |
| Latvia | 10 | 0.1% |
| Lebanon | 16 | 0.1% |
| Mexico | 12 | 0.1% |
| Northern Africa | 964 | 5.2% |
| Northern Europe | 83 | 0.4% |
| Oceania | 6 | 0.0% |
| Pakistan | 45 | 0.2% |
| Panama | 22 | 0.1% |
| Peru | 30 | 0.2% |
| Philippines | 50 | 0.3% |
| Poland | 24 | 0.1% |
| Portugal | 15 | 0.1% |
| Russia | 57 | 0.3% |
| Sierra Leone | 40 | 0.2% |
| South America | 332 | 1.8% |
| South Central Asia | 178 | 0.9% |
| South Eastern Asia | 71 | 0.4% |
| Southern Europe | 69 | 0.4% |
| Trinidad and Tobago | 5 | 0.0% |
| Ukraine | 22 | 0.1% |
| Venezuela | 54 | 0.3% |
| Vietnam | 21 | 0.1% |
| Western Africa | 40 | 0.2% |
| Western Asia | 160 | 0.9% |
| Western Europe | 55 | 0.3% | View All 55 Rows |
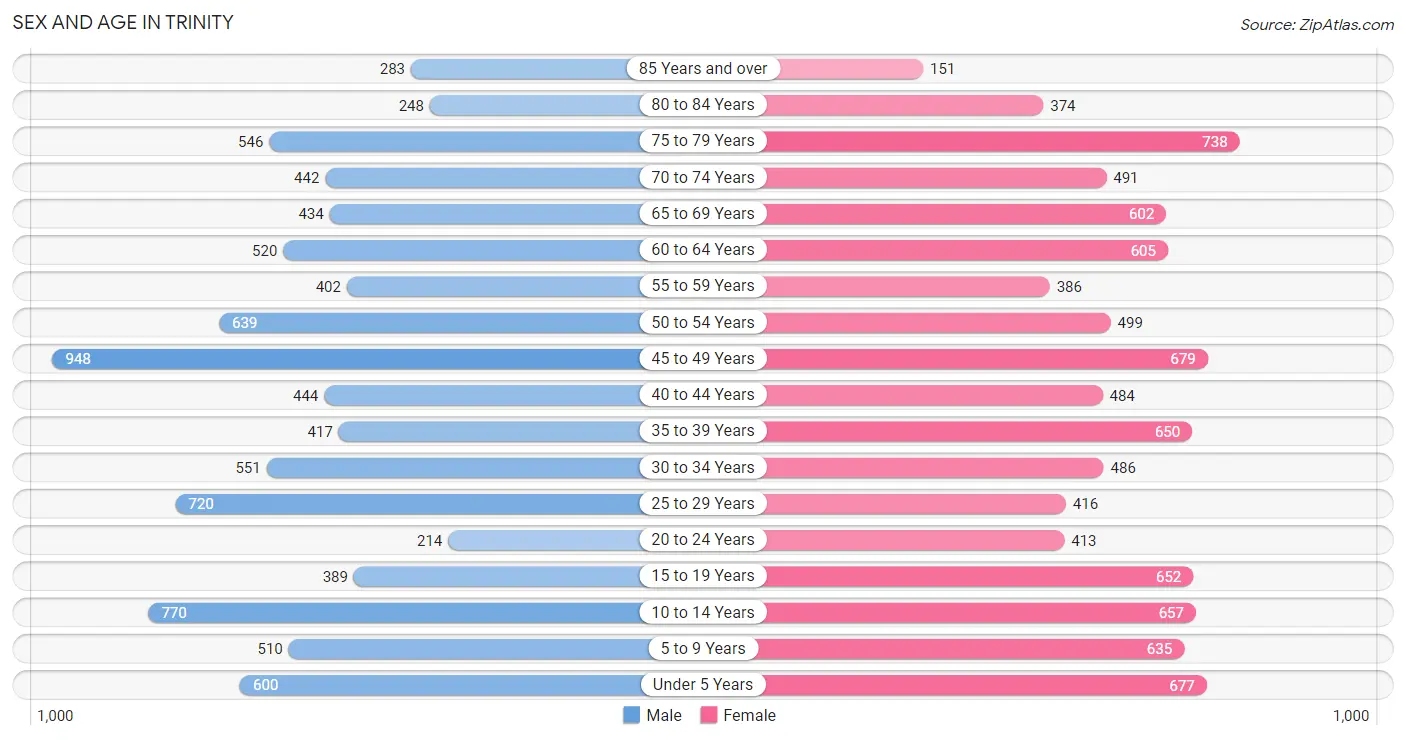
Sex and Age in Trinity
Sex and Age in Trinity
The most populous age groups in Trinity are 45 to 49 Years (948 | 10.4%) for men and 75 to 79 Years (738 | 7.7%) for women.
| Age Bracket | Male | Female |
| Under 5 Years | 600 (6.6%) | 677 (7.1%) |
| 5 to 9 Years | 510 (5.6%) | 635 (6.6%) |
| 10 to 14 Years | 770 (8.5%) | 657 (6.9%) |
| 15 to 19 Years | 389 (4.3%) | 652 (6.8%) |
| 20 to 24 Years | 214 (2.4%) | 413 (4.3%) |
| 25 to 29 Years | 720 (7.9%) | 416 (4.3%) |
| 30 to 34 Years | 551 (6.1%) | 486 (5.1%) |
| 35 to 39 Years | 417 (4.6%) | 650 (6.8%) |
| 40 to 44 Years | 444 (4.9%) | 484 (5.0%) |
| 45 to 49 Years | 948 (10.4%) | 679 (7.1%) |
| 50 to 54 Years | 639 (7.0%) | 499 (5.2%) |
| 55 to 59 Years | 402 (4.4%) | 386 (4.0%) |
| 60 to 64 Years | 520 (5.7%) | 605 (6.3%) |
| 65 to 69 Years | 434 (4.8%) | 602 (6.3%) |
| 70 to 74 Years | 442 (4.9%) | 491 (5.1%) |
| 75 to 79 Years | 546 (6.0%) | 738 (7.7%) |
| 80 to 84 Years | 248 (2.7%) | 374 (3.9%) |
| 85 Years and over | 283 (3.1%) | 151 (1.6%) |
| Total | 9,077 (100.0%) | 9,595 (100.0%) |
Families and Households in Trinity
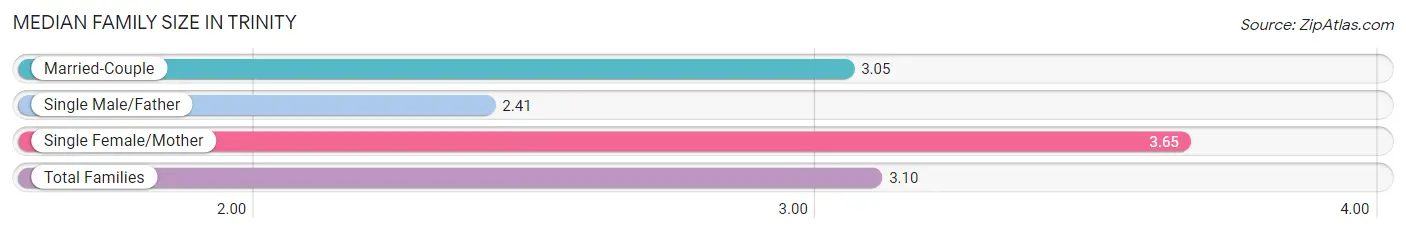
Median Family Size in Trinity
The median family size in Trinity is 3.10 persons per family, with single female/mother families (523 | 9.9%) accounting for the largest median family size of 3.65 persons per family. On the other hand, single male/father families (115 | 2.2%) represent the smallest median family size with 2.41 persons per family.
| Family Type | # Families | Family Size |
| Married-Couple | 4,621 (87.9%) | 3.05 |
| Single Male/Father | 115 (2.2%) | 2.41 |
| Single Female/Mother | 523 (9.9%) | 3.65 |
| Total Families | 5,259 (100.0%) | 3.10 |
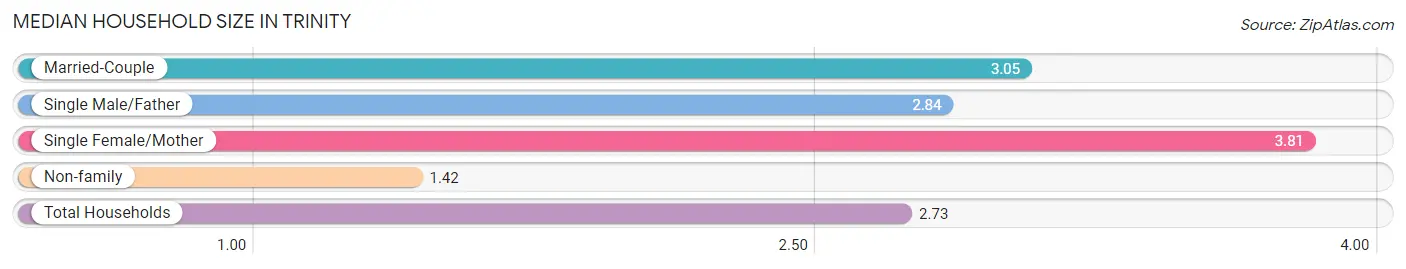
Median Household Size in Trinity
The median household size in Trinity is 2.73 persons per household, with single female/mother households (523 | 7.6%) accounting for the largest median household size of 3.81 persons per household. non-family households (1,593 | 23.3%) represent the smallest median household size with 1.42 persons per household.
| Household Type | # Households | Household Size |
| Married-Couple | 4,621 (67.4%) | 3.05 |
| Single Male/Father | 115 (1.7%) | 2.84 |
| Single Female/Mother | 523 (7.6%) | 3.81 |
| Non-family | 1,593 (23.3%) | 1.42 |
| Total Households | 6,852 (100.0%) | 2.73 |
Household Size by Marriage Status in Trinity
Out of a total of 6,852 households in Trinity, 5,259 (76.7%) are family households, while 1,593 (23.3%) are nonfamily households. The most numerous type of family households are 2-person households, comprising 2,316, and the most common type of nonfamily households are 1-person households, comprising 1,116.
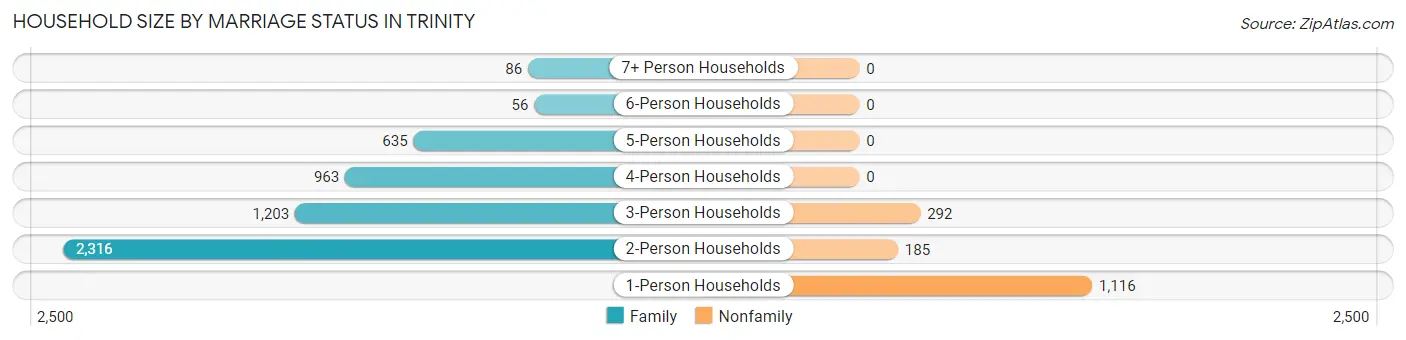
| Household Size | Family Households | Nonfamily Households |
| 1-Person Households | - | 1,116 (16.3%) |
| 2-Person Households | 2,316 (33.8%) | 185 (2.7%) |
| 3-Person Households | 1,203 (17.6%) | 292 (4.3%) |
| 4-Person Households | 963 (14.1%) | 0 (0.0%) |
| 5-Person Households | 635 (9.3%) | 0 (0.0%) |
| 6-Person Households | 56 (0.8%) | 0 (0.0%) |
| 7+ Person Households | 86 (1.3%) | 0 (0.0%) |
| Total | 5,259 (76.7%) | 1,593 (23.3%) |
Female Fertility in Trinity
Fertility by Age in Trinity
Average fertility rate in Trinity is 131.0 births per 1,000 women. Women in the age bracket of 20 to 34 years have the highest fertility rate with 234.0 births per 1,000 women. Women in the age bracket of 20 to 34 years acount for 60.9% of all women with births.
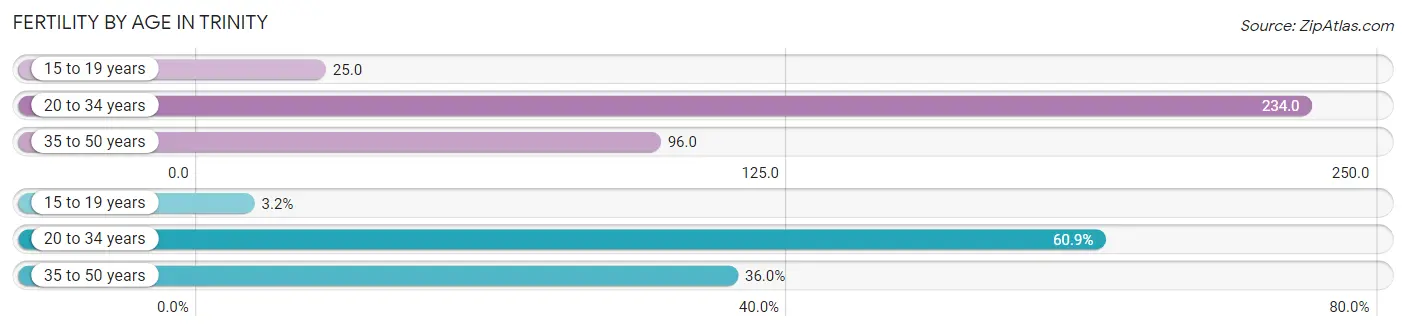
| Age Bracket | Women with Births | Births / 1,000 Women |
| 15 to 19 years | 16 (3.2%) | 25.0 |
| 20 to 34 years | 308 (60.9%) | 234.0 |
| 35 to 50 years | 182 (36.0%) | 96.0 |
| Total | 506 (100.0%) | 131.0 |
Fertility by Age by Marriage Status in Trinity
52.8% of women with births (506) in Trinity are married. The highest percentage of unmarried women with births falls into 15 to 19 years age bracket with 100.0% of them unmarried at the time of birth, while the lowest percentage of unmarried women with births belong to 20 to 34 years age bracket with 32.5% of them unmarried.
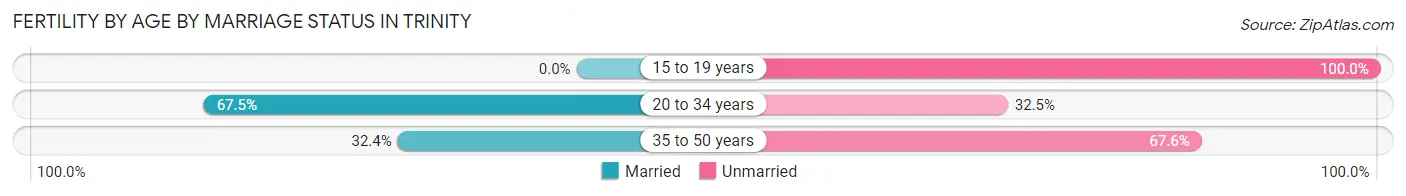
| Age Bracket | Married | Unmarried |
| 15 to 19 years | 0 (0.0%) | 16 (100.0%) |
| 20 to 34 years | 208 (67.5%) | 100 (32.5%) |
| 35 to 50 years | 59 (32.4%) | 123 (67.6%) |
| Total | 267 (52.8%) | 239 (47.2%) |
Fertility by Education in Trinity
Average fertility rate in Trinity is 131.0 births per 1,000 women. Women with the education attainment of bachelor's degree have the highest fertility rate of 203.0 births per 1,000 women, while women with the education attainment of graduate degree have the lowest fertility at 21.0 births per 1,000 women. Women with the education attainment of bachelor's degree represent 59.1% of all women with births.
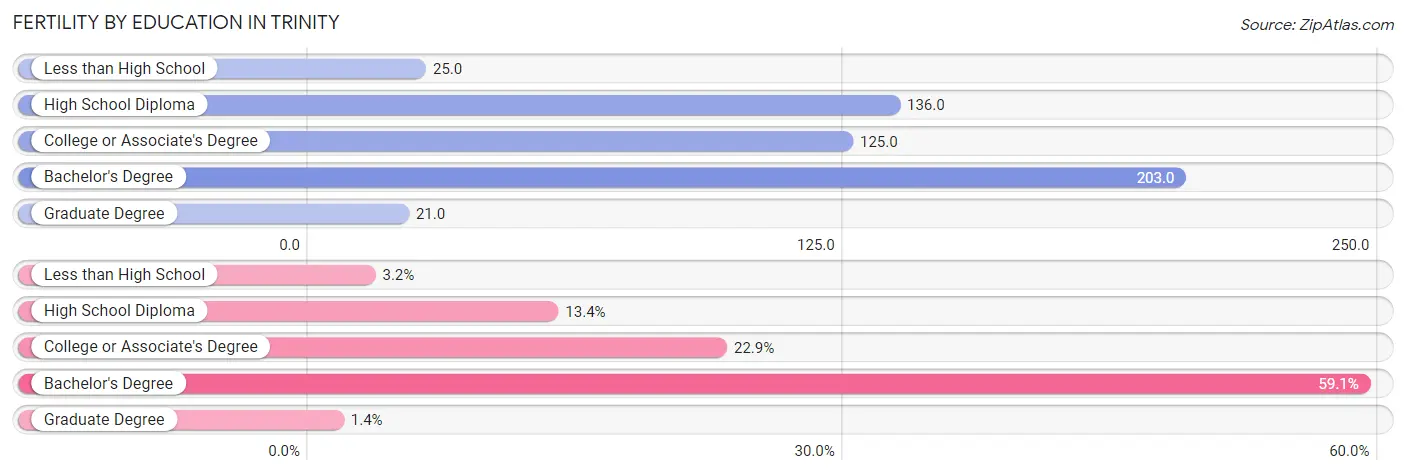
| Educational Attainment | Women with Births | Births / 1,000 Women |
| Less than High School | 16 (3.2%) | 25.0 |
| High School Diploma | 68 (13.4%) | 136.0 |
| College or Associate's Degree | 116 (22.9%) | 125.0 |
| Bachelor's Degree | 299 (59.1%) | 203.0 |
| Graduate Degree | 7 (1.4%) | 21.0 |
| Total | 506 (100.0%) | 131.0 |
Fertility by Education by Marriage Status in Trinity
47.2% of women with births in Trinity are unmarried. Women with the educational attainment of graduate degree are most likely to be married with 100.0% of them married at childbirth, while women with the educational attainment of less than high school are least likely to be married with 100.0% of them unmarried at childbirth.
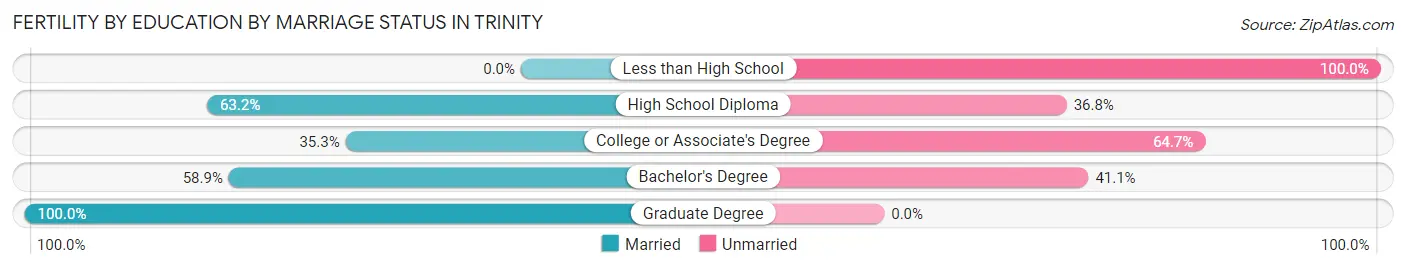
| Educational Attainment | Married | Unmarried |
| Less than High School | 0 (0.0%) | 16 (100.0%) |
| High School Diploma | 43 (63.2%) | 25 (36.8%) |
| College or Associate's Degree | 41 (35.3%) | 75 (64.7%) |
| Bachelor's Degree | 176 (58.9%) | 123 (41.1%) |
| Graduate Degree | 7 (100.0%) | 0 (0.0%) |
| Total | 267 (52.8%) | 239 (47.2%) |
Employment Characteristics in Trinity
Employment by Class of Employer in Trinity
Among the 8,110 employed individuals in Trinity, private company employees (5,176 | 63.8%), self-employed (incorporated) (758 | 9.3%), and self-employed (not incorporated) (683 | 8.4%) make up the most common classes of employment.
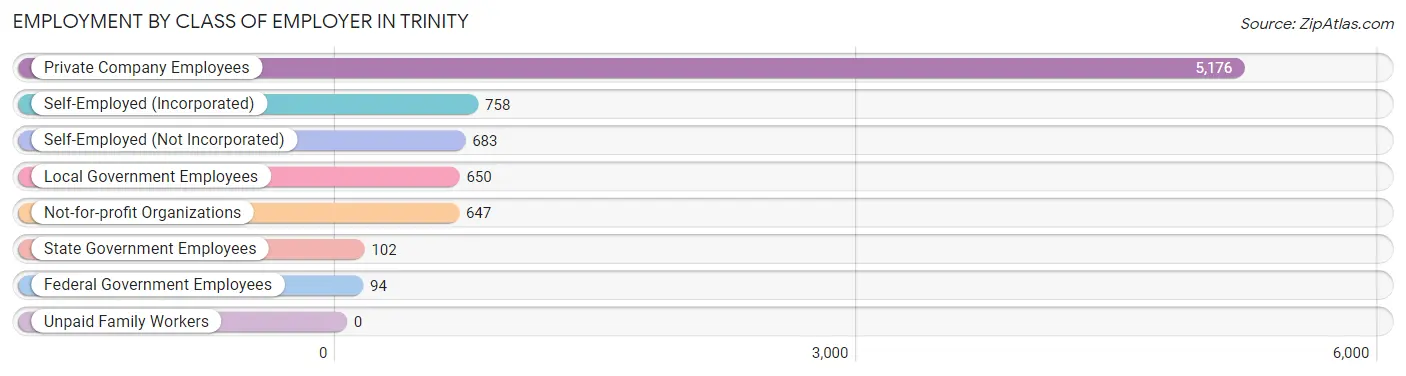
| Employer Class | # Employees | % Employees |
| Private Company Employees | 5,176 | 63.8% |
| Self-Employed (Incorporated) | 758 | 9.3% |
| Self-Employed (Not Incorporated) | 683 | 8.4% |
| Not-for-profit Organizations | 647 | 8.0% |
| Local Government Employees | 650 | 8.0% |
| State Government Employees | 102 | 1.3% |
| Federal Government Employees | 94 | 1.2% |
| Unpaid Family Workers | 0 | 0.0% |
| Total | 8,110 | 100.0% |
Employment Status by Age in Trinity
According to the labor force statistics for Trinity, out of the total population over 16 years of age (14,548), 58.6% or 8,525 individuals are in the labor force, with 4.2% or 358 of them unemployed. The age group with the highest labor force participation rate is 20 to 24 years, with 95.4% or 598 individuals in the labor force. Within the labor force, the 25 to 29 years age range has the highest percentage of unemployed individuals, with 19.7% or 186 of them being unemployed.
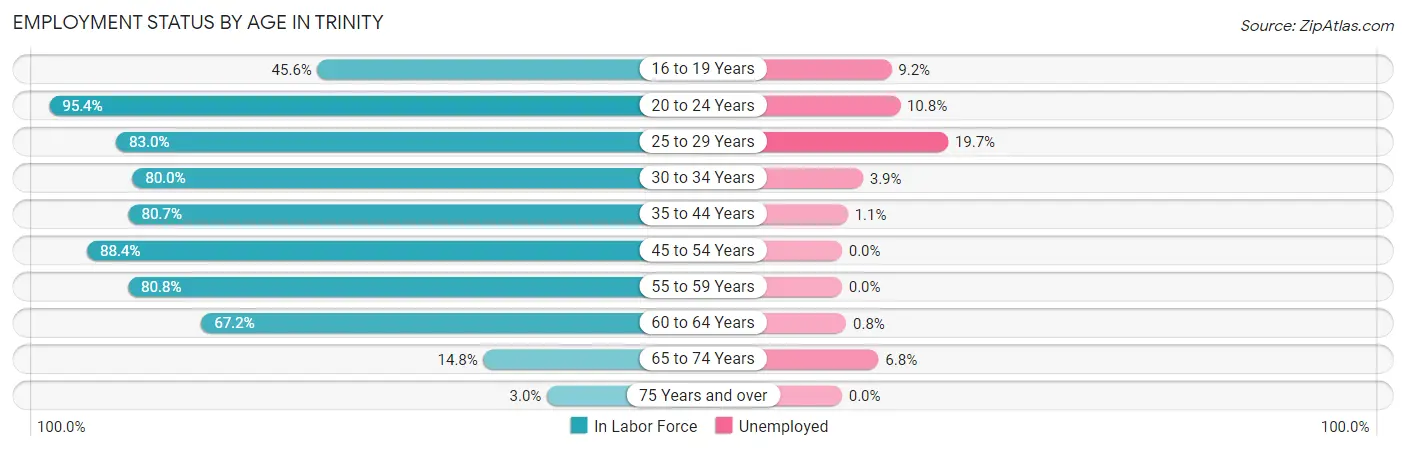
| Age Bracket | In Labor Force | Unemployed |
| 16 to 19 Years | 349 (45.6%) | 32 (9.2%) |
| 20 to 24 Years | 598 (95.4%) | 65 (10.8%) |
| 25 to 29 Years | 943 (83.0%) | 186 (19.7%) |
| 30 to 34 Years | 830 (80.0%) | 32 (3.9%) |
| 35 to 44 Years | 1,610 (80.7%) | 18 (1.1%) |
| 45 to 54 Years | 2,444 (88.4%) | 0 (0.0%) |
| 55 to 59 Years | 637 (80.8%) | 0 (0.0%) |
| 60 to 64 Years | 756 (67.2%) | 6 (0.8%) |
| 65 to 74 Years | 291 (14.8%) | 20 (6.8%) |
| 75 Years and over | 70 (3.0%) | 0 (0.0%) |
| Total | 8,525 (58.6%) | 358 (4.2%) |
Employment Status by Educational Attainment in Trinity
According to labor force statistics for Trinity, 81.6% of individuals (7,218) out of the total population between 25 and 64 years of age (8,846) are in the labor force, with 3.3% or 238 of them being unemployed. The group with the highest labor force participation rate are those with the educational attainment of bachelor's degree or higher, with 86.2% or 3,957 individuals in the labor force. Within the labor force, individuals with college / associate degree education have the highest percentage of unemployment, with 7.0% or 172 of them being unemployed.
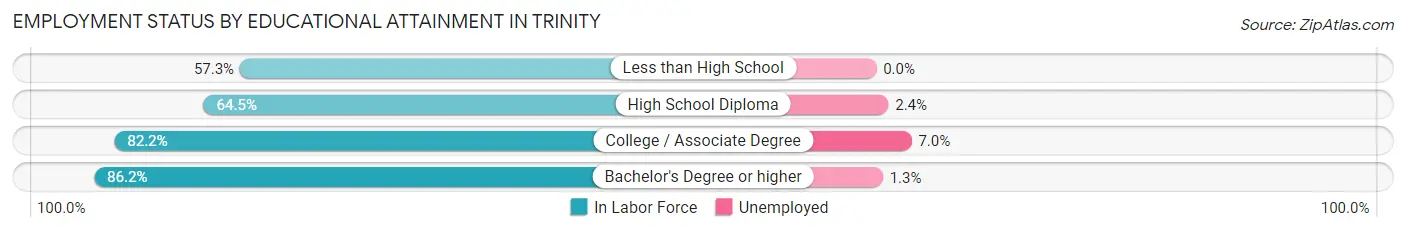
| Educational Attainment | In Labor Force | Unemployed |
| Less than High School | 90 (57.3%) | 0 (0.0%) |
| High School Diploma | 720 (64.5%) | 27 (2.4%) |
| College / Associate Degree | 2,451 (82.2%) | 209 (7.0%) |
| Bachelor's Degree or higher | 3,957 (86.2%) | 60 (1.3%) |
| Total | 7,218 (81.6%) | 292 (3.3%) |
Employment Occupations by Sex in Trinity
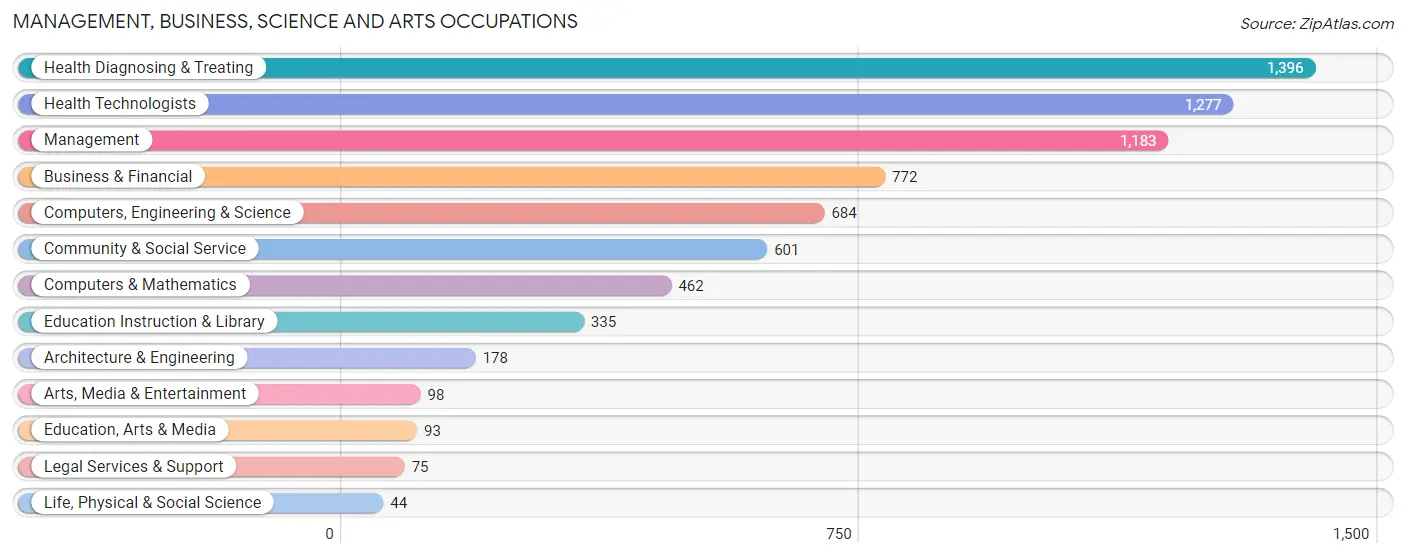
Management, Business, Science and Arts Occupations
The most common Management, Business, Science and Arts occupations in Trinity are Health Diagnosing & Treating (1,396 | 17.1%), Health Technologists (1,277 | 15.7%), Management (1,183 | 14.5%), Business & Financial (772 | 9.5%), and Computers, Engineering & Science (684 | 8.4%).
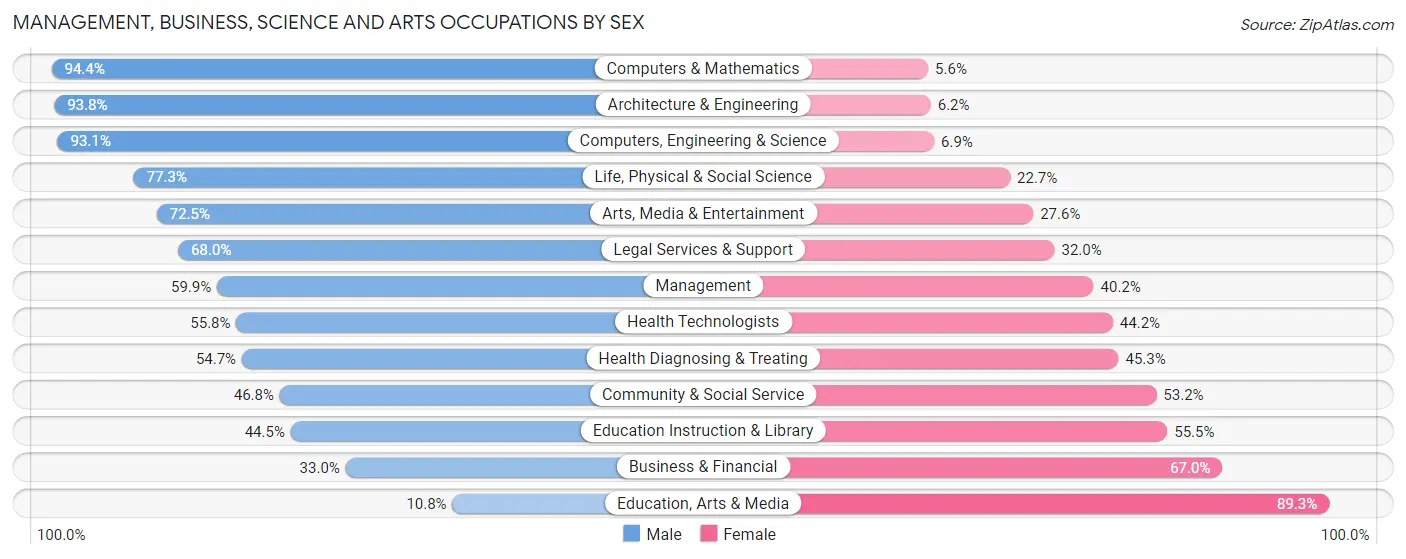
Management, Business, Science and Arts Occupations by Sex
Within the Management, Business, Science and Arts occupations in Trinity, the most male-oriented occupations are Computers & Mathematics (94.4%), Architecture & Engineering (93.8%), and Computers, Engineering & Science (93.1%), while the most female-oriented occupations are Education, Arts & Media (89.2%), Business & Financial (67.0%), and Education Instruction & Library (55.5%).
| Occupation | Male | Female |
| Management | 708 (59.9%) | 475 (40.2%) |
| Business & Financial | 255 (33.0%) | 517 (67.0%) |
| Computers, Engineering & Science | 637 (93.1%) | 47 (6.9%) |
| Computers & Mathematics | 436 (94.4%) | 26 (5.6%) |
| Architecture & Engineering | 167 (93.8%) | 11 (6.2%) |
| Life, Physical & Social Science | 34 (77.3%) | 10 (22.7%) |
| Community & Social Service | 281 (46.8%) | 320 (53.2%) |
| Education, Arts & Media | 10 (10.7%) | 83 (89.2%) |
| Legal Services & Support | 51 (68.0%) | 24 (32.0%) |
| Education Instruction & Library | 149 (44.5%) | 186 (55.5%) |
| Arts, Media & Entertainment | 71 (72.5%) | 27 (27.6%) |
| Health Diagnosing & Treating | 763 (54.7%) | 633 (45.3%) |
| Health Technologists | 713 (55.8%) | 564 (44.2%) |
| Total (Category) | 2,644 (57.0%) | 1,992 (43.0%) |
| Total (Overall) | 4,522 (55.5%) | 3,625 (44.5%) |
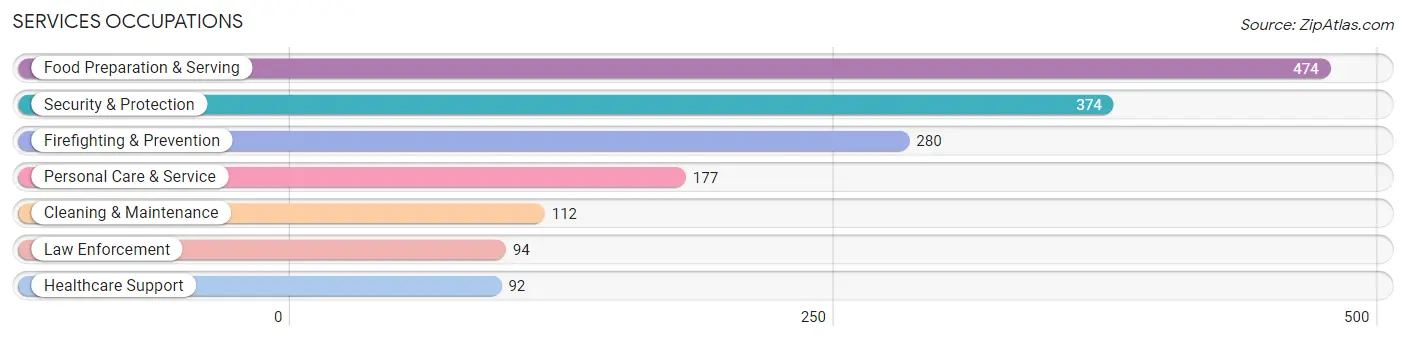
Services Occupations
The most common Services occupations in Trinity are Food Preparation & Serving (474 | 5.8%), Security & Protection (374 | 4.6%), Firefighting & Prevention (280 | 3.4%), Personal Care & Service (177 | 2.2%), and Cleaning & Maintenance (112 | 1.4%).
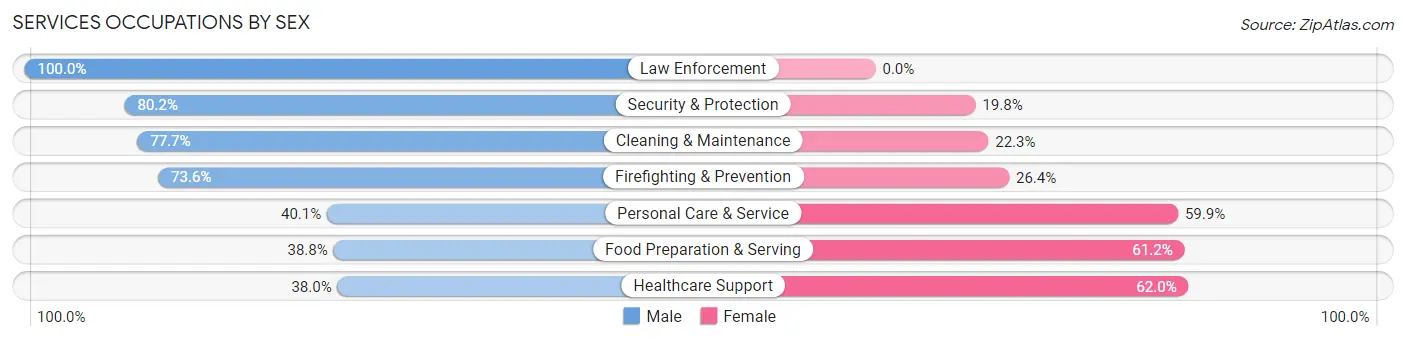
Services Occupations by Sex
Within the Services occupations in Trinity, the most male-oriented occupations are Law Enforcement (100.0%), Security & Protection (80.2%), and Cleaning & Maintenance (77.7%), while the most female-oriented occupations are Healthcare Support (62.0%), Food Preparation & Serving (61.2%), and Personal Care & Service (59.9%).
| Occupation | Male | Female |
| Healthcare Support | 35 (38.0%) | 57 (62.0%) |
| Security & Protection | 300 (80.2%) | 74 (19.8%) |
| Firefighting & Prevention | 206 (73.6%) | 74 (26.4%) |
| Law Enforcement | 94 (100.0%) | 0 (0.0%) |
| Food Preparation & Serving | 184 (38.8%) | 290 (61.2%) |
| Cleaning & Maintenance | 87 (77.7%) | 25 (22.3%) |
| Personal Care & Service | 71 (40.1%) | 106 (59.9%) |
| Total (Category) | 677 (55.1%) | 552 (44.9%) |
| Total (Overall) | 4,522 (55.5%) | 3,625 (44.5%) |
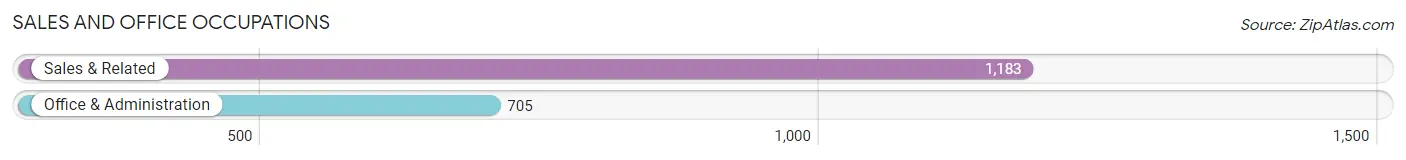
Sales and Office Occupations
The most common Sales and Office occupations in Trinity are Sales & Related (1,183 | 14.5%), and Office & Administration (705 | 8.6%).
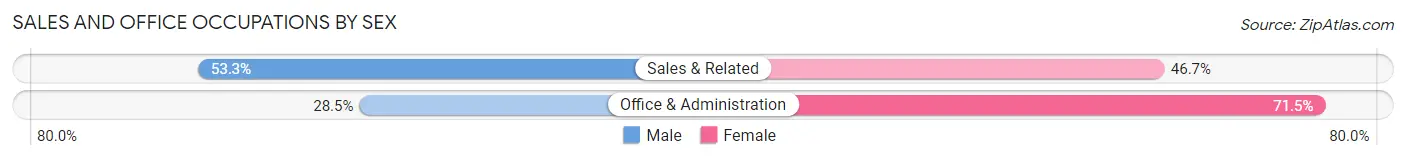
Sales and Office Occupations by Sex
| Occupation | Male | Female |
| Sales & Related | 631 (53.3%) | 552 (46.7%) |
| Office & Administration | 201 (28.5%) | 504 (71.5%) |
| Total (Category) | 832 (44.1%) | 1,056 (55.9%) |
| Total (Overall) | 4,522 (55.5%) | 3,625 (44.5%) |
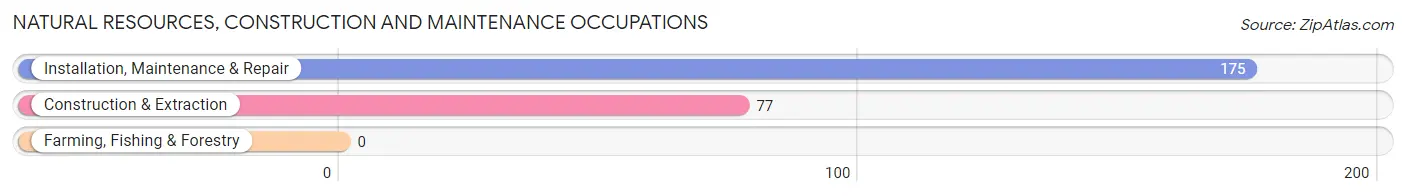
Natural Resources, Construction and Maintenance Occupations
The most common Natural Resources, Construction and Maintenance occupations in Trinity are Installation, Maintenance & Repair (175 | 2.1%), and Construction & Extraction (77 | 0.9%).
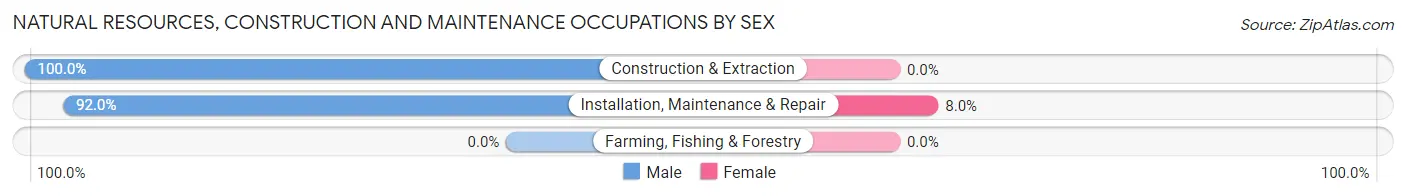
Natural Resources, Construction and Maintenance Occupations by Sex
| Occupation | Male | Female |
| Farming, Fishing & Forestry | 0 (0.0%) | 0 (0.0%) |
| Construction & Extraction | 77 (100.0%) | 0 (0.0%) |
| Installation, Maintenance & Repair | 161 (92.0%) | 14 (8.0%) |
| Total (Category) | 238 (94.4%) | 14 (5.6%) |
| Total (Overall) | 4,522 (55.5%) | 3,625 (44.5%) |
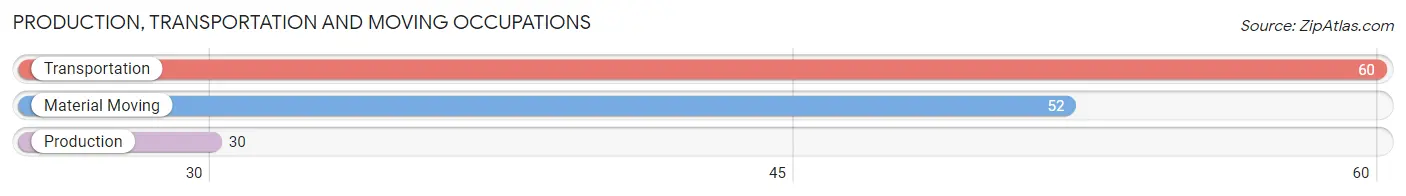
Production, Transportation and Moving Occupations
The most common Production, Transportation and Moving occupations in Trinity are Transportation (60 | 0.7%), Material Moving (52 | 0.6%), and Production (30 | 0.4%).
Production, Transportation and Moving Occupations by Sex
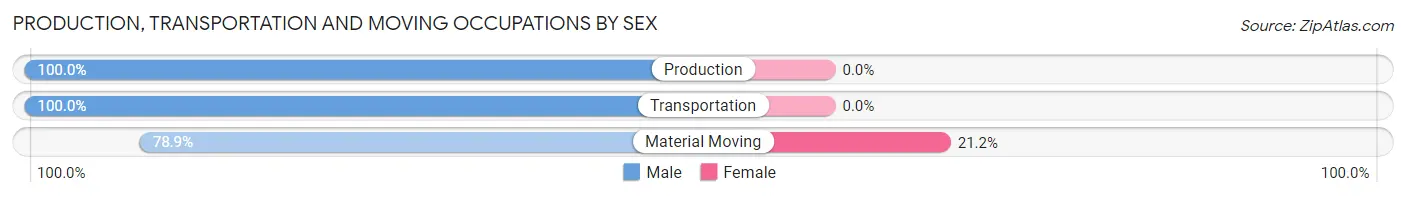
| Occupation | Male | Female |
| Production | 30 (100.0%) | 0 (0.0%) |
| Transportation | 60 (100.0%) | 0 (0.0%) |
| Material Moving | 41 (78.8%) | 11 (21.1%) |
| Total (Category) | 131 (92.2%) | 11 (7.7%) |
| Total (Overall) | 4,522 (55.5%) | 3,625 (44.5%) |
Employment Industries by Sex in Trinity
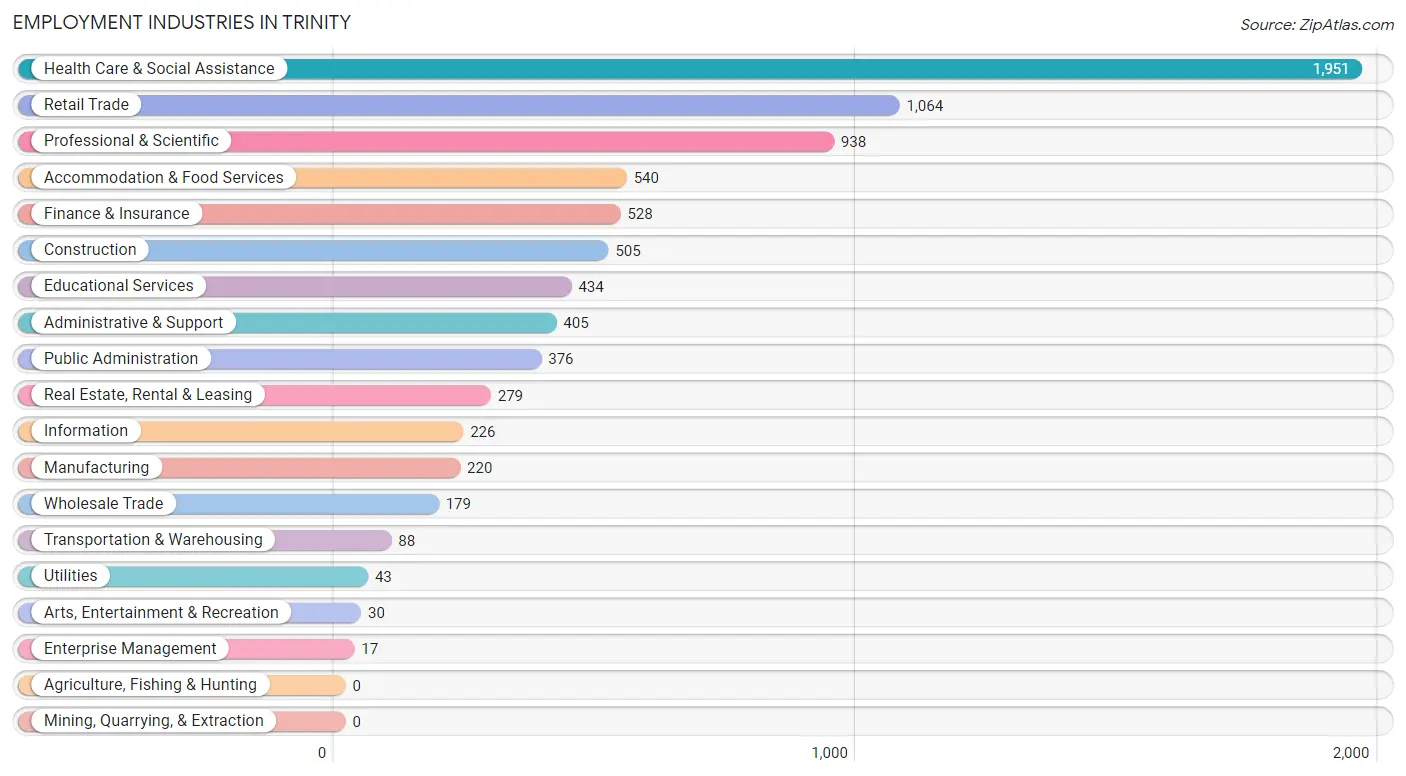
Employment Industries in Trinity
The major employment industries in Trinity include Health Care & Social Assistance (1,951 | 23.9%), Retail Trade (1,064 | 13.1%), Professional & Scientific (938 | 11.5%), Accommodation & Food Services (540 | 6.6%), and Finance & Insurance (528 | 6.5%).
Employment Industries by Sex in Trinity
The Trinity industries that see more men than women are Enterprise Management (100.0%), Construction (90.9%), and Information (89.4%), whereas the industries that tend to have a higher number of women are Real Estate, Rental & Leasing (72.0%), Accommodation & Food Services (70.0%), and Educational Services (65.0%).
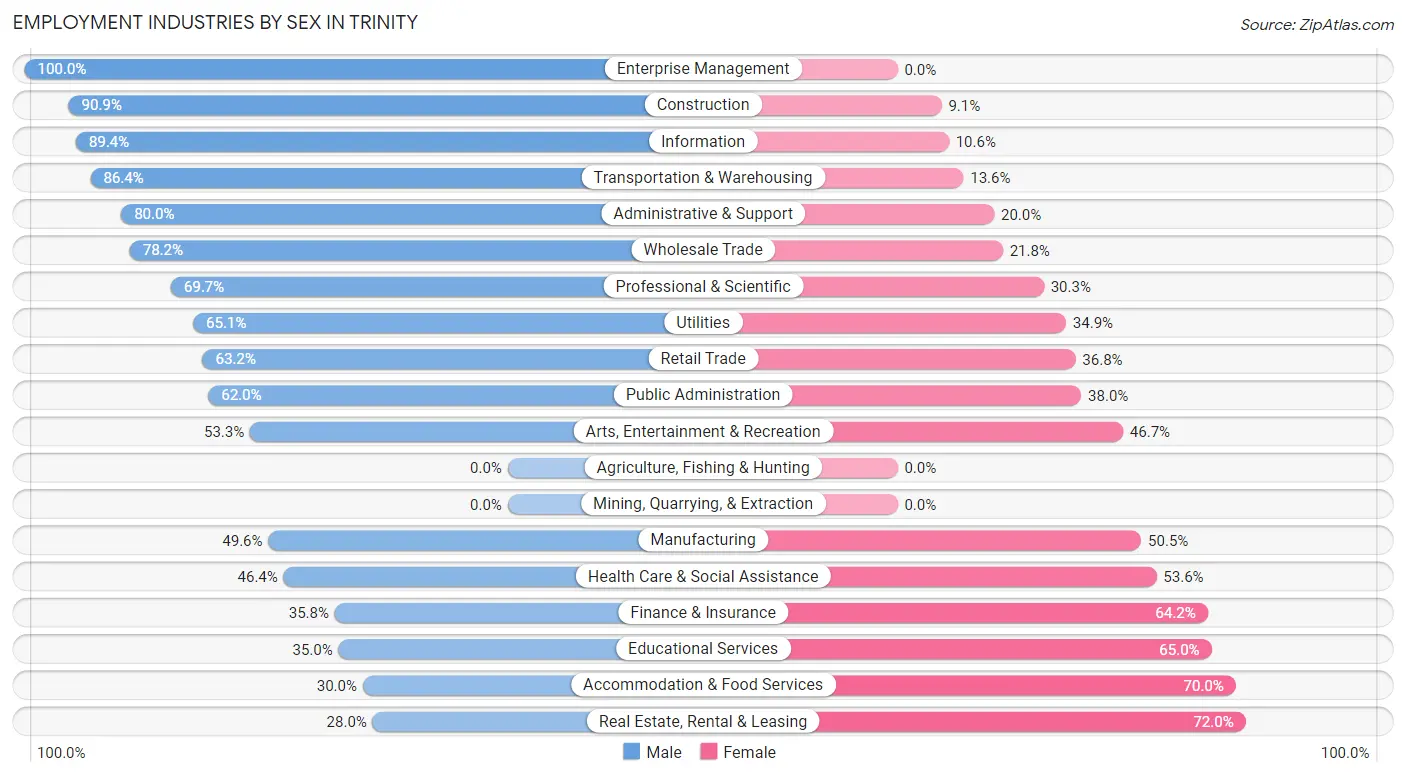
| Industry | Male | Female |
| Agriculture, Fishing & Hunting | 0 (0.0%) | 0 (0.0%) |
| Mining, Quarrying, & Extraction | 0 (0.0%) | 0 (0.0%) |
| Construction | 459 (90.9%) | 46 (9.1%) |
| Manufacturing | 109 (49.5%) | 111 (50.4%) |
| Wholesale Trade | 140 (78.2%) | 39 (21.8%) |
| Retail Trade | 672 (63.2%) | 392 (36.8%) |
| Transportation & Warehousing | 76 (86.4%) | 12 (13.6%) |
| Utilities | 28 (65.1%) | 15 (34.9%) |
| Information | 202 (89.4%) | 24 (10.6%) |
| Finance & Insurance | 189 (35.8%) | 339 (64.2%) |
| Real Estate, Rental & Leasing | 78 (28.0%) | 201 (72.0%) |
| Professional & Scientific | 654 (69.7%) | 284 (30.3%) |
| Enterprise Management | 17 (100.0%) | 0 (0.0%) |
| Administrative & Support | 324 (80.0%) | 81 (20.0%) |
| Educational Services | 152 (35.0%) | 282 (65.0%) |
| Health Care & Social Assistance | 905 (46.4%) | 1,046 (53.6%) |
| Arts, Entertainment & Recreation | 16 (53.3%) | 14 (46.7%) |
| Accommodation & Food Services | 162 (30.0%) | 378 (70.0%) |
| Public Administration | 233 (62.0%) | 143 (38.0%) |
| Total | 4,522 (55.5%) | 3,625 (44.5%) |
Education in Trinity
School Enrollment in Trinity
The most common levels of schooling among the 4,552 students in Trinity are middle school (1,247 | 27.4%), high school (962 | 21.1%), and elementary school (892 | 19.6%).
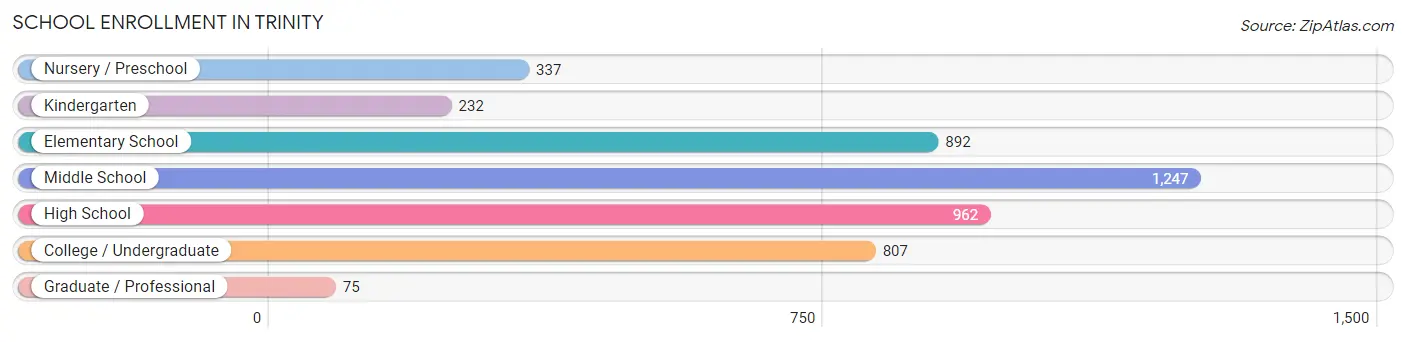
| School Level | # Students | % Students |
| Nursery / Preschool | 337 | 7.4% |
| Kindergarten | 232 | 5.1% |
| Elementary School | 892 | 19.6% |
| Middle School | 1,247 | 27.4% |
| High School | 962 | 21.1% |
| College / Undergraduate | 807 | 17.7% |
| Graduate / Professional | 75 | 1.7% |
| Total | 4,552 | 100.0% |
School Enrollment by Age by Funding Source in Trinity
Out of a total of 4,552 students who are enrolled in schools in Trinity, 797 (17.5%) attend a private institution, while the remaining 3,755 (82.5%) are enrolled in public schools. The age group of 25 to 34 year olds has the highest likelihood of being enrolled in private schools, with 209 (52.9% in the age bracket) enrolled. Conversely, the age group of 10 to 14 year olds has the lowest likelihood of being enrolled in a private school, with 1,290 (90.4% in the age bracket) attending a public institution.
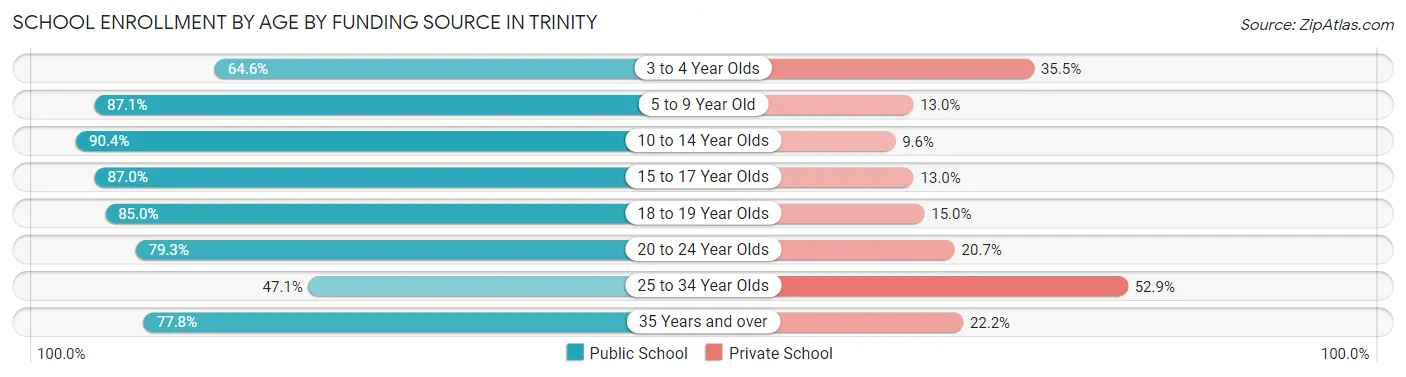
| Age Bracket | Public School | Private School |
| 3 to 4 Year Olds | 173 (64.5%) | 95 (35.4%) |
| 5 to 9 Year Old | 934 (87.1%) | 139 (13.0%) |
| 10 to 14 Year Olds | 1,290 (90.4%) | 137 (9.6%) |
| 15 to 17 Year Olds | 614 (87.0%) | 92 (13.0%) |
| 18 to 19 Year Olds | 249 (85.0%) | 44 (15.0%) |
| 20 to 24 Year Olds | 238 (79.3%) | 62 (20.7%) |
| 25 to 34 Year Olds | 186 (47.1%) | 209 (52.9%) |
| 35 Years and over | 70 (77.8%) | 20 (22.2%) |
| Total | 3,755 (82.5%) | 797 (17.5%) |
Educational Attainment by Field of Study in Trinity
Business (1,470 | 21.6%), science & technology (1,125 | 16.5%), education (1,026 | 15.1%), social sciences (588 | 8.6%), and engineering (577 | 8.5%) are the most common fields of study among 6,814 individuals in Trinity who have obtained a bachelor's degree or higher.
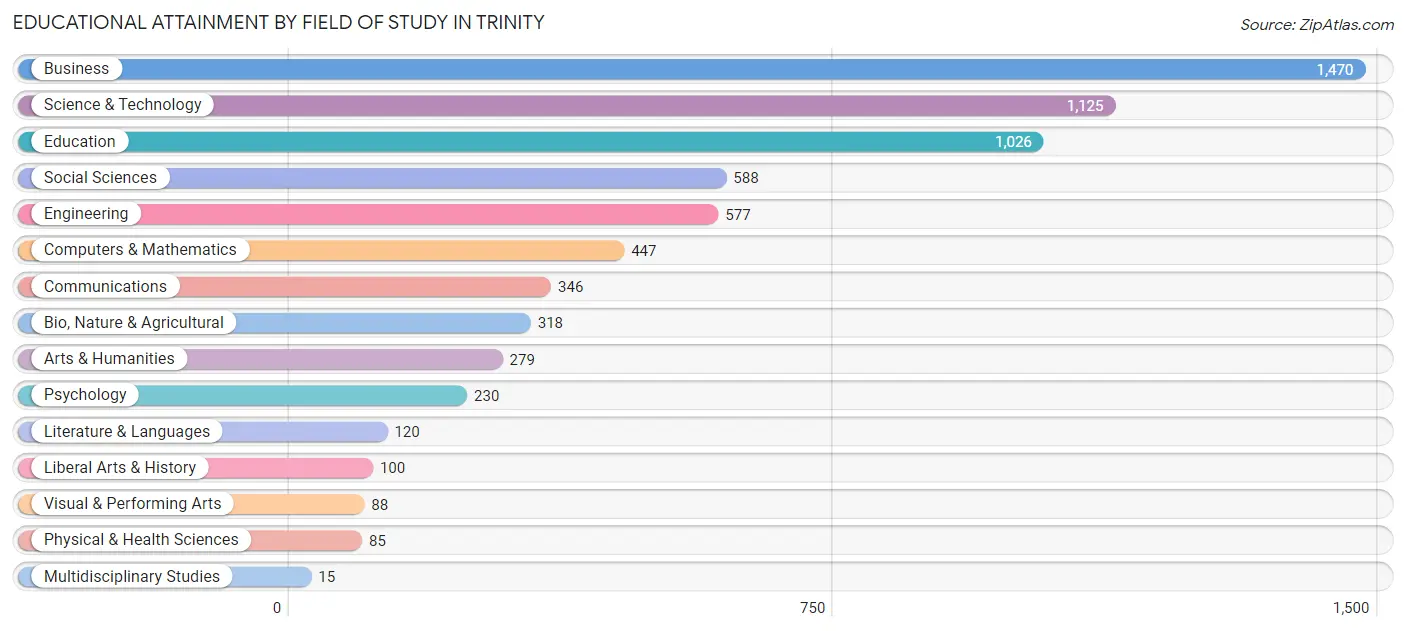
| Field of Study | # Graduates | % Graduates |
| Computers & Mathematics | 447 | 6.6% |
| Bio, Nature & Agricultural | 318 | 4.7% |
| Physical & Health Sciences | 85 | 1.3% |
| Psychology | 230 | 3.4% |
| Social Sciences | 588 | 8.6% |
| Engineering | 577 | 8.5% |
| Multidisciplinary Studies | 15 | 0.2% |
| Science & Technology | 1,125 | 16.5% |
| Business | 1,470 | 21.6% |
| Education | 1,026 | 15.1% |
| Literature & Languages | 120 | 1.8% |
| Liberal Arts & History | 100 | 1.5% |
| Visual & Performing Arts | 88 | 1.3% |
| Communications | 346 | 5.1% |
| Arts & Humanities | 279 | 4.1% |
| Total | 6,814 | 100.0% |
Transportation & Commute in Trinity
Vehicle Availability by Sex in Trinity
The most prevalent vehicle ownership categories in Trinity are males with 2 vehicles (2,003, accounting for 44.1%) and females with 2 vehicles (1,512, making up 56.2%).
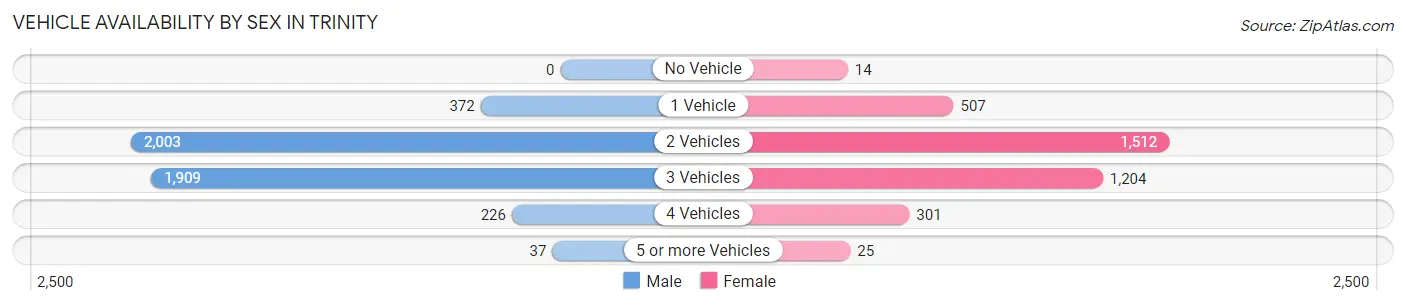
| Vehicles Available | Male | Female |
| No Vehicle | 0 (0.0%) | 14 (0.4%) |
| 1 Vehicle | 372 (8.2%) | 507 (14.2%) |
| 2 Vehicles | 2,003 (44.1%) | 1,512 (42.4%) |
| 3 Vehicles | 1,909 (42.0%) | 1,204 (33.8%) |
| 4 Vehicles | 226 (5.0%) | 301 (8.5%) |
| 5 or more Vehicles | 37 (0.8%) | 25 (0.7%) |
| Total | 4,547 (100.0%) | 3,563 (100.0%) |
Commute Time in Trinity
The most frequently occuring commute durations in Trinity are 45 to 59 minutes (1,042 commuters, 16.9%), 30 to 34 minutes (885 commuters, 14.3%), and 20 to 24 minutes (669 commuters, 10.8%).
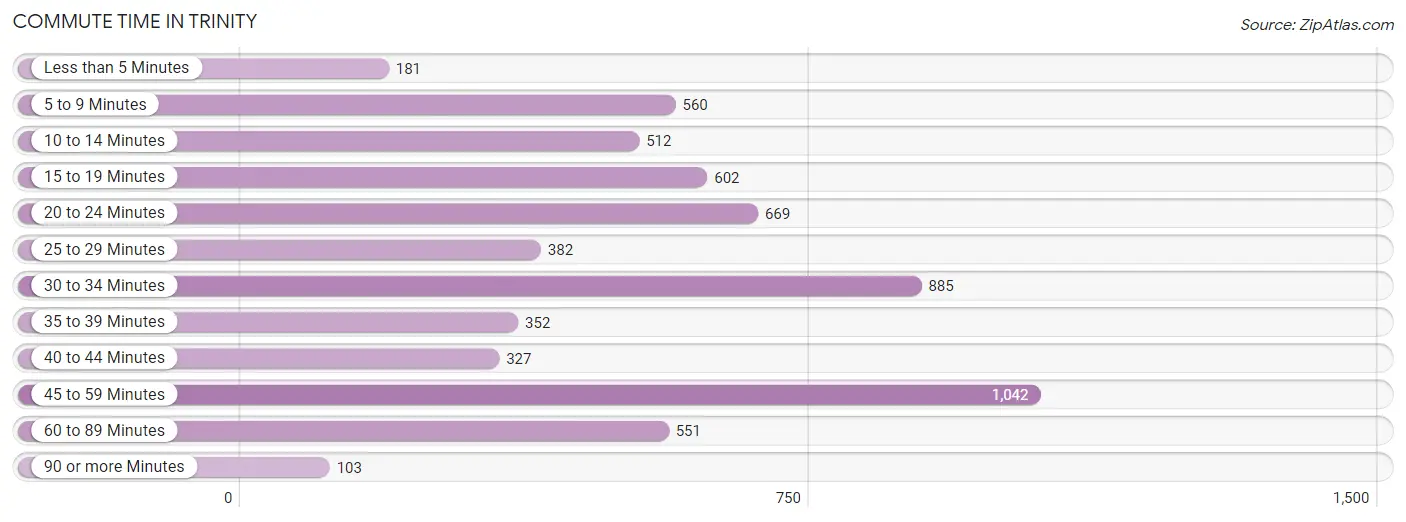
| Commute Time | # Commuters | % Commuters |
| Less than 5 Minutes | 181 | 2.9% |
| 5 to 9 Minutes | 560 | 9.1% |
| 10 to 14 Minutes | 512 | 8.3% |
| 15 to 19 Minutes | 602 | 9.8% |
| 20 to 24 Minutes | 669 | 10.8% |
| 25 to 29 Minutes | 382 | 6.2% |
| 30 to 34 Minutes | 885 | 14.3% |
| 35 to 39 Minutes | 352 | 5.7% |
| 40 to 44 Minutes | 327 | 5.3% |
| 45 to 59 Minutes | 1,042 | 16.9% |
| 60 to 89 Minutes | 551 | 8.9% |
| 90 or more Minutes | 103 | 1.7% |
Commute Time by Sex in Trinity
The most common commute times in Trinity are 45 to 59 minutes (569 commuters, 18.0%) for males and 30 to 34 minutes (545 commuters, 18.1%) for females.
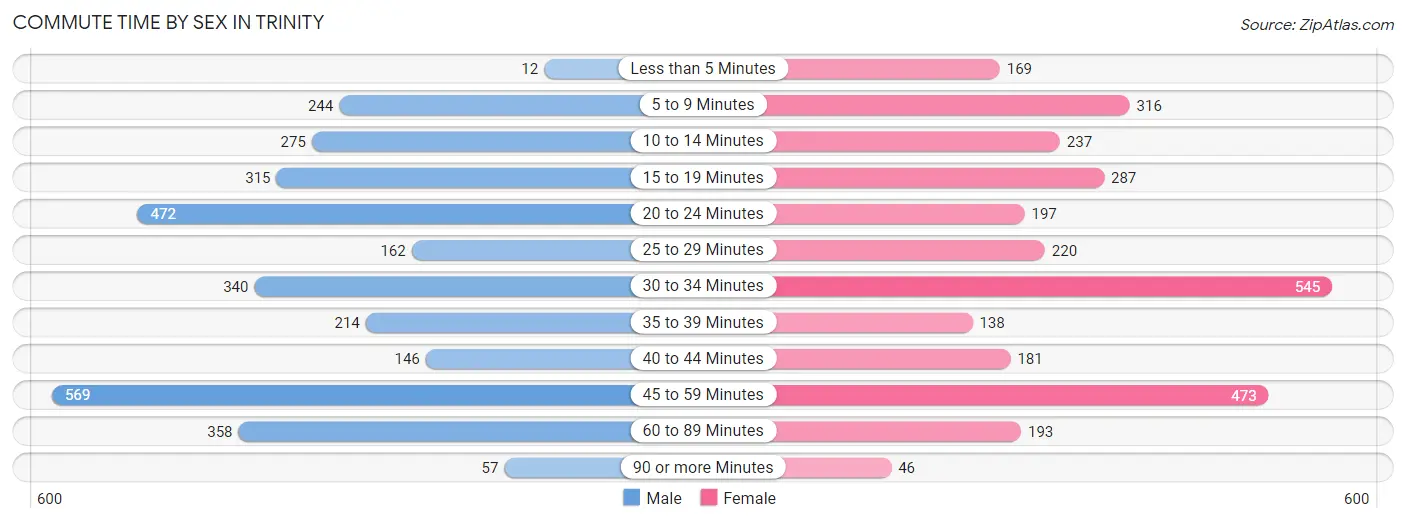
| Commute Time | Male | Female |
| Less than 5 Minutes | 12 (0.4%) | 169 (5.6%) |
| 5 to 9 Minutes | 244 (7.7%) | 316 (10.5%) |
| 10 to 14 Minutes | 275 (8.7%) | 237 (7.9%) |
| 15 to 19 Minutes | 315 (10.0%) | 287 (9.6%) |
| 20 to 24 Minutes | 472 (14.9%) | 197 (6.6%) |
| 25 to 29 Minutes | 162 (5.1%) | 220 (7.3%) |
| 30 to 34 Minutes | 340 (10.7%) | 545 (18.1%) |
| 35 to 39 Minutes | 214 (6.8%) | 138 (4.6%) |
| 40 to 44 Minutes | 146 (4.6%) | 181 (6.0%) |
| 45 to 59 Minutes | 569 (18.0%) | 473 (15.8%) |
| 60 to 89 Minutes | 358 (11.3%) | 193 (6.4%) |
| 90 or more Minutes | 57 (1.8%) | 46 (1.5%) |
Time of Departure to Work by Sex in Trinity
The most frequent times of departure to work in Trinity are 7:30 AM to 7:59 AM (715, 22.6%) for males and 8:00 AM to 8:29 AM (650, 21.6%) for females.
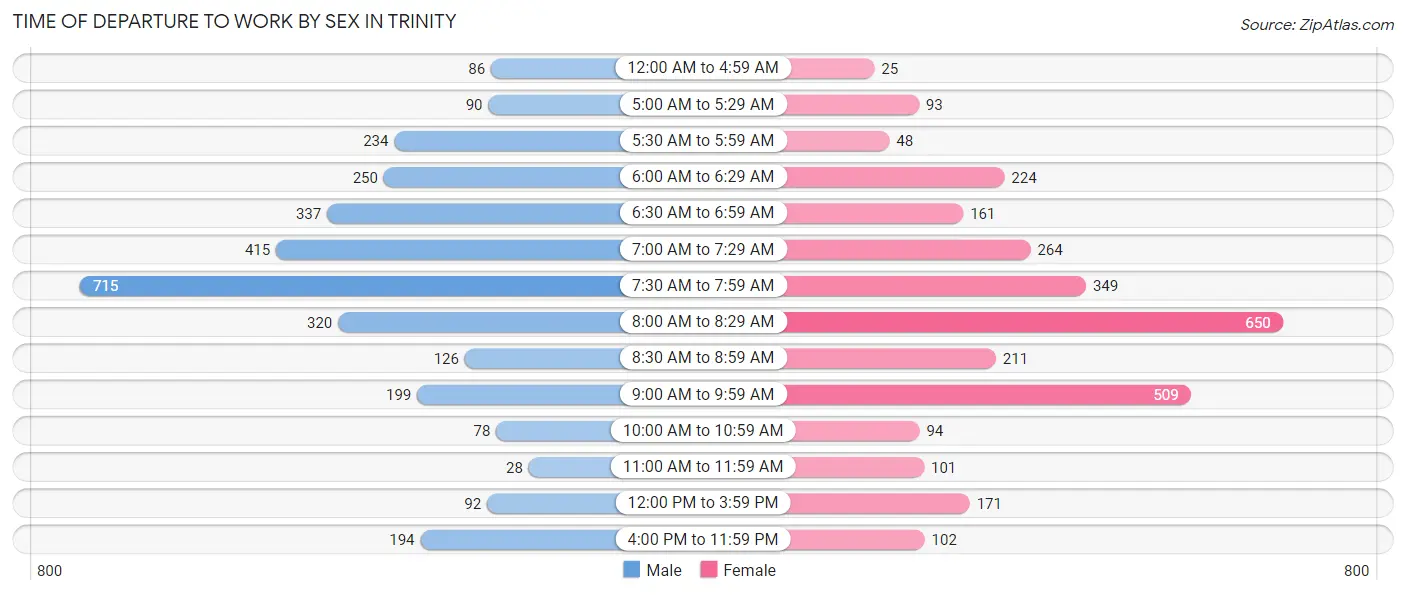
| Time of Departure | Male | Female |
| 12:00 AM to 4:59 AM | 86 (2.7%) | 25 (0.8%) |
| 5:00 AM to 5:29 AM | 90 (2.8%) | 93 (3.1%) |
| 5:30 AM to 5:59 AM | 234 (7.4%) | 48 (1.6%) |
| 6:00 AM to 6:29 AM | 250 (7.9%) | 224 (7.5%) |
| 6:30 AM to 6:59 AM | 337 (10.6%) | 161 (5.4%) |
| 7:00 AM to 7:29 AM | 415 (13.1%) | 264 (8.8%) |
| 7:30 AM to 7:59 AM | 715 (22.6%) | 349 (11.6%) |
| 8:00 AM to 8:29 AM | 320 (10.1%) | 650 (21.6%) |
| 8:30 AM to 8:59 AM | 126 (4.0%) | 211 (7.0%) |
| 9:00 AM to 9:59 AM | 199 (6.3%) | 509 (17.0%) |
| 10:00 AM to 10:59 AM | 78 (2.5%) | 94 (3.1%) |
| 11:00 AM to 11:59 AM | 28 (0.9%) | 101 (3.4%) |
| 12:00 PM to 3:59 PM | 92 (2.9%) | 171 (5.7%) |
| 4:00 PM to 11:59 PM | 194 (6.1%) | 102 (3.4%) |
| Total | 3,164 (100.0%) | 3,002 (100.0%) |
Housing Occupancy in Trinity
Occupancy by Ownership in Trinity
Of the total 6,852 dwellings in Trinity, owner-occupied units account for 5,904 (86.2%), while renter-occupied units make up 948 (13.8%).
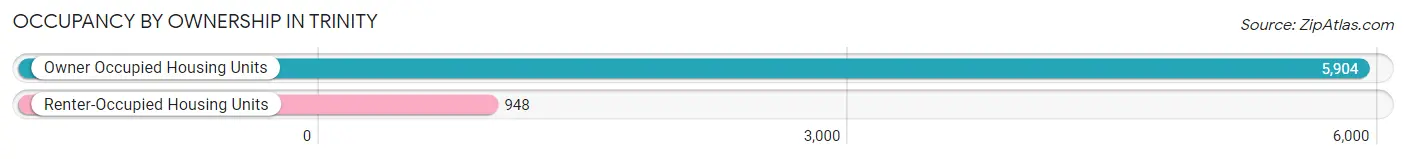
| Occupancy | # Housing Units | % Housing Units |
| Owner Occupied Housing Units | 5,904 | 86.2% |
| Renter-Occupied Housing Units | 948 | 13.8% |
| Total Occupied Housing Units | 6,852 | 100.0% |
Occupancy by Household Size in Trinity
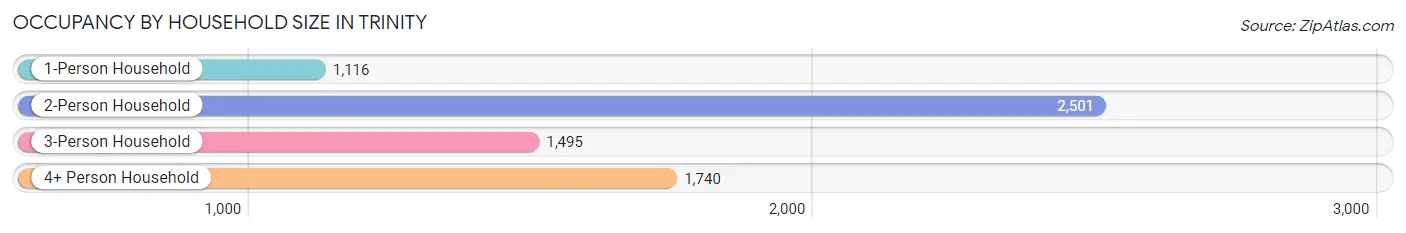
| Household Size | # Housing Units | % Housing Units |
| 1-Person Household | 1,116 | 16.3% |
| 2-Person Household | 2,501 | 36.5% |
| 3-Person Household | 1,495 | 21.8% |
| 4+ Person Household | 1,740 | 25.4% |
| Total Housing Units | 6,852 | 100.0% |
Occupancy by Ownership by Household Size in Trinity
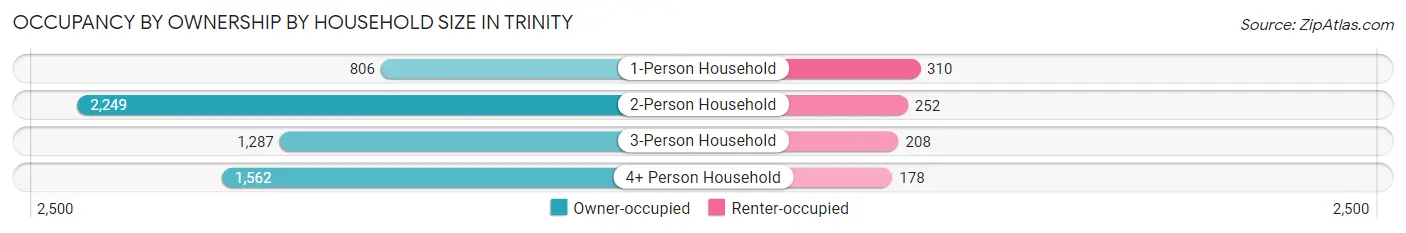
| Household Size | Owner-occupied | Renter-occupied |
| 1-Person Household | 806 (72.2%) | 310 (27.8%) |
| 2-Person Household | 2,249 (89.9%) | 252 (10.1%) |
| 3-Person Household | 1,287 (86.1%) | 208 (13.9%) |
| 4+ Person Household | 1,562 (89.8%) | 178 (10.2%) |
| Total Housing Units | 5,904 (86.2%) | 948 (13.8%) |
Occupancy by Educational Attainment in Trinity
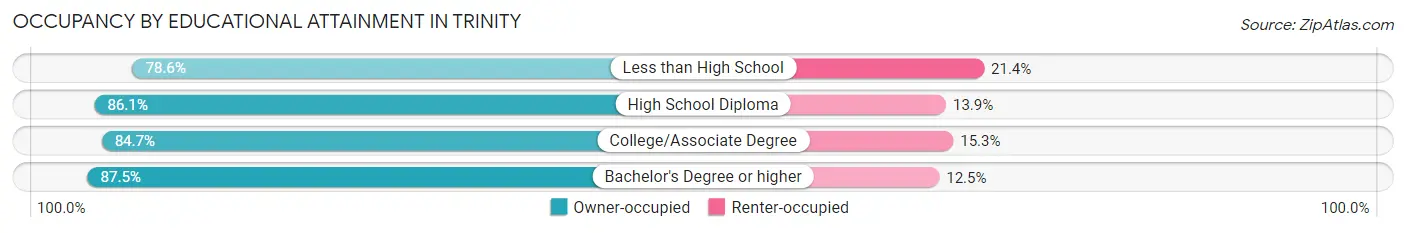
| Household Size | Owner-occupied | Renter-occupied |
| Less than High School | 169 (78.6%) | 46 (21.4%) |
| High School Diploma | 752 (86.1%) | 121 (13.9%) |
| College/Associate Degree | 1,823 (84.7%) | 329 (15.3%) |
| Bachelor's Degree or higher | 3,160 (87.5%) | 452 (12.5%) |
Occupancy by Age of Householder in Trinity
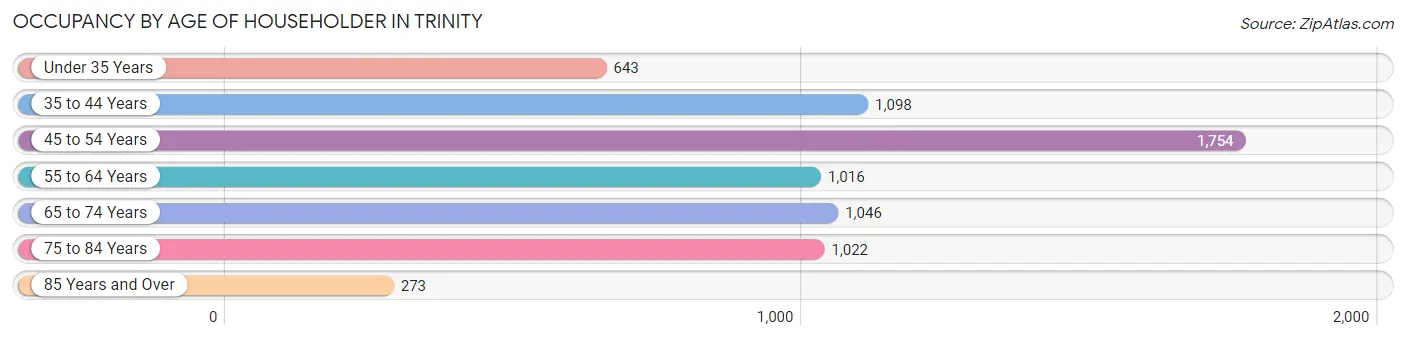
| Age Bracket | # Households | % Households |
| Under 35 Years | 643 | 9.4% |
| 35 to 44 Years | 1,098 | 16.0% |
| 45 to 54 Years | 1,754 | 25.6% |
| 55 to 64 Years | 1,016 | 14.8% |
| 65 to 74 Years | 1,046 | 15.3% |
| 75 to 84 Years | 1,022 | 14.9% |
| 85 Years and Over | 273 | 4.0% |
| Total | 6,852 | 100.0% |
Housing Finances in Trinity
Median Income by Occupancy in Trinity
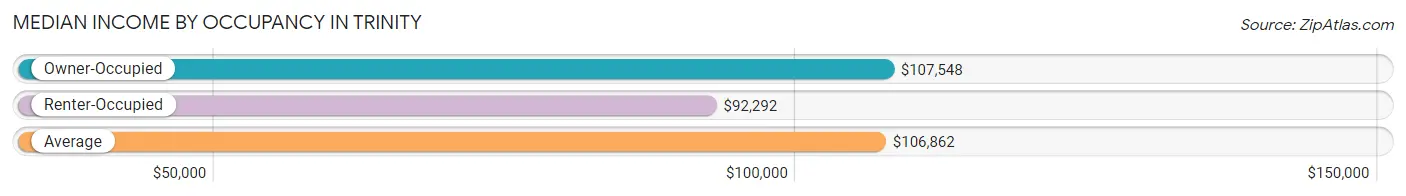
| Occupancy Type | # Households | Median Income |
| Owner-Occupied | 5,904 (86.2%) | $107,548 |
| Renter-Occupied | 948 (13.8%) | $92,292 |
| Average | 6,852 (100.0%) | $106,862 |
Occupancy by Householder Income Bracket in Trinity
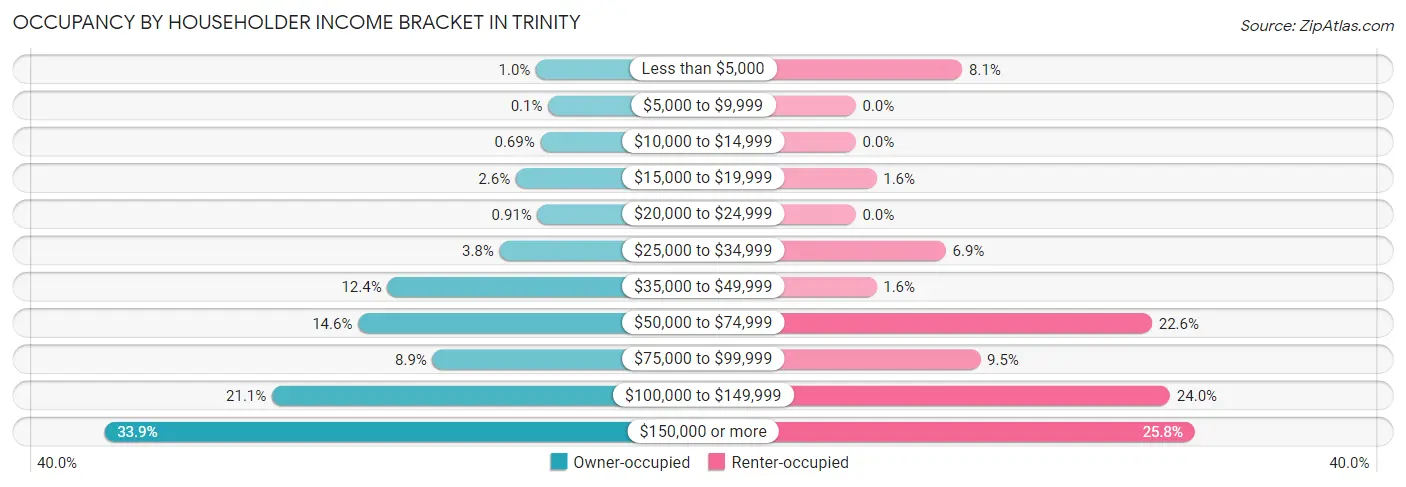
| Income Bracket | Owner-occupied | Renter-occupied |
| Less than $5,000 | 60 (1.0%) | 77 (8.1%) |
| $5,000 to $9,999 | 6 (0.1%) | 0 (0.0%) |
| $10,000 to $14,999 | 41 (0.7%) | 0 (0.0%) |
| $15,000 to $19,999 | 151 (2.6%) | 15 (1.6%) |
| $20,000 to $24,999 | 54 (0.9%) | 0 (0.0%) |
| $25,000 to $34,999 | 225 (3.8%) | 65 (6.9%) |
| $35,000 to $49,999 | 729 (12.3%) | 15 (1.6%) |
| $50,000 to $74,999 | 861 (14.6%) | 214 (22.6%) |
| $75,000 to $99,999 | 526 (8.9%) | 90 (9.5%) |
| $100,000 to $149,999 | 1,248 (21.1%) | 227 (23.9%) |
| $150,000 or more | 2,003 (33.9%) | 245 (25.8%) |
| Total | 5,904 (100.0%) | 948 (100.0%) |
Monthly Housing Cost Tiers in Trinity
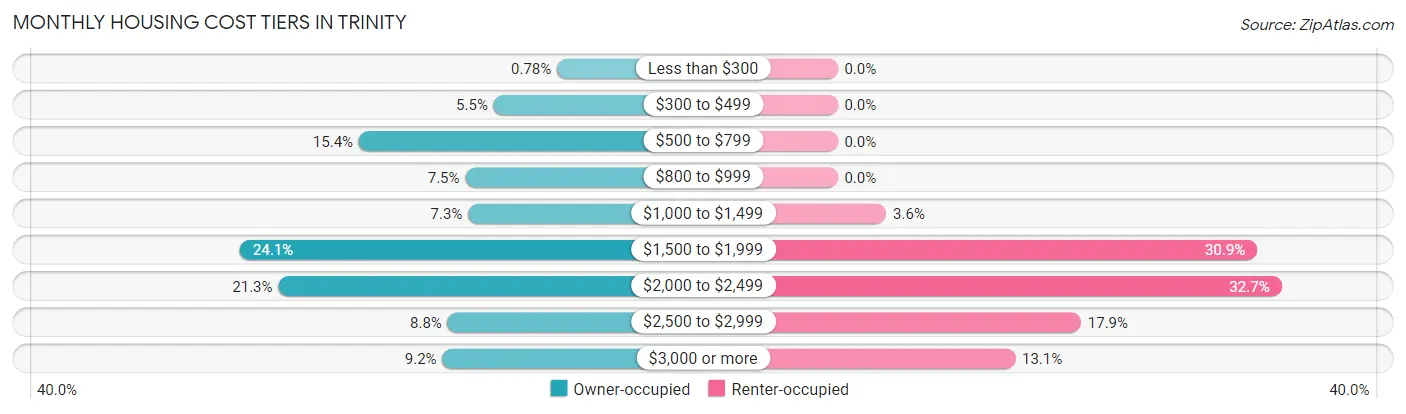
| Monthly Cost | Owner-occupied | Renter-occupied |
| Less than $300 | 46 (0.8%) | 0 (0.0%) |
| $300 to $499 | 322 (5.4%) | 0 (0.0%) |
| $500 to $799 | 908 (15.4%) | 0 (0.0%) |
| $800 to $999 | 445 (7.5%) | 0 (0.0%) |
| $1,000 to $1,499 | 433 (7.3%) | 34 (3.6%) |
| $1,500 to $1,999 | 1,425 (24.1%) | 293 (30.9%) |
| $2,000 to $2,499 | 1,258 (21.3%) | 310 (32.7%) |
| $2,500 to $2,999 | 522 (8.8%) | 170 (17.9%) |
| $3,000 or more | 545 (9.2%) | 124 (13.1%) |
| Total | 5,904 (100.0%) | 948 (100.0%) |
Physical Housing Characteristics in Trinity
Housing Structures in Trinity
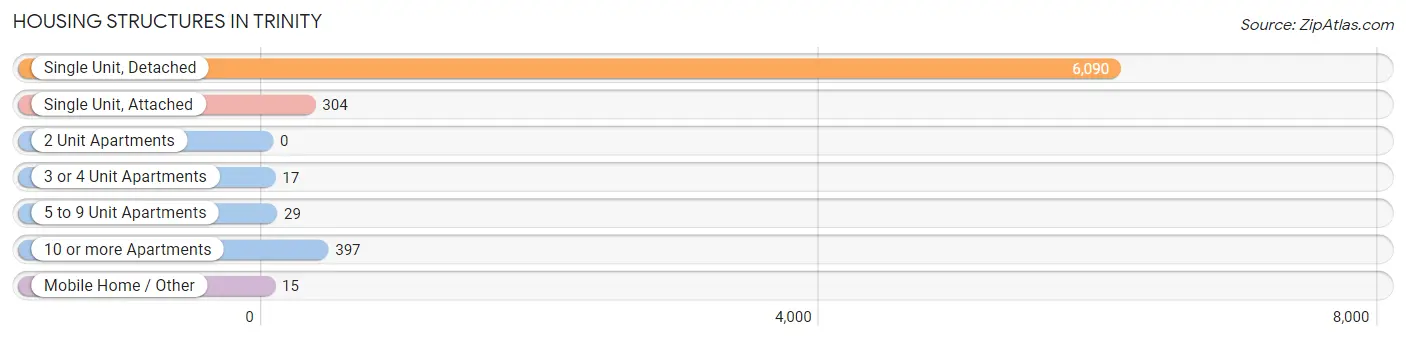
| Structure Type | # Housing Units | % Housing Units |
| Single Unit, Detached | 6,090 | 88.9% |
| Single Unit, Attached | 304 | 4.4% |
| 2 Unit Apartments | 0 | 0.0% |
| 3 or 4 Unit Apartments | 17 | 0.3% |
| 5 to 9 Unit Apartments | 29 | 0.4% |
| 10 or more Apartments | 397 | 5.8% |
| Mobile Home / Other | 15 | 0.2% |
| Total | 6,852 | 100.0% |
Housing Structures by Occupancy in Trinity
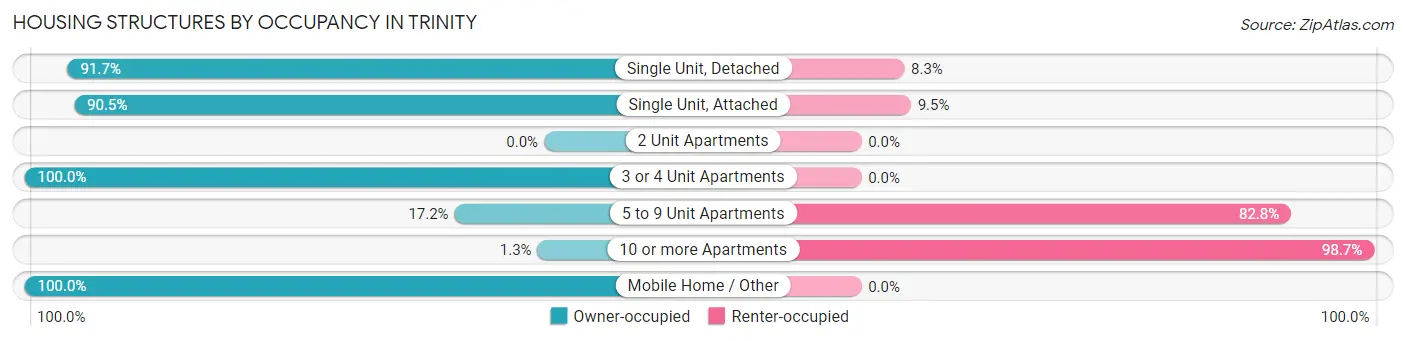
| Structure Type | Owner-occupied | Renter-occupied |
| Single Unit, Detached | 5,587 (91.7%) | 503 (8.3%) |
| Single Unit, Attached | 275 (90.5%) | 29 (9.5%) |
| 2 Unit Apartments | 0 (0.0%) | 0 (0.0%) |
| 3 or 4 Unit Apartments | 17 (100.0%) | 0 (0.0%) |
| 5 to 9 Unit Apartments | 5 (17.2%) | 24 (82.8%) |
| 10 or more Apartments | 5 (1.3%) | 392 (98.7%) |
| Mobile Home / Other | 15 (100.0%) | 0 (0.0%) |
| Total | 5,904 (86.2%) | 948 (13.8%) |
Housing Structures by Number of Rooms in Trinity
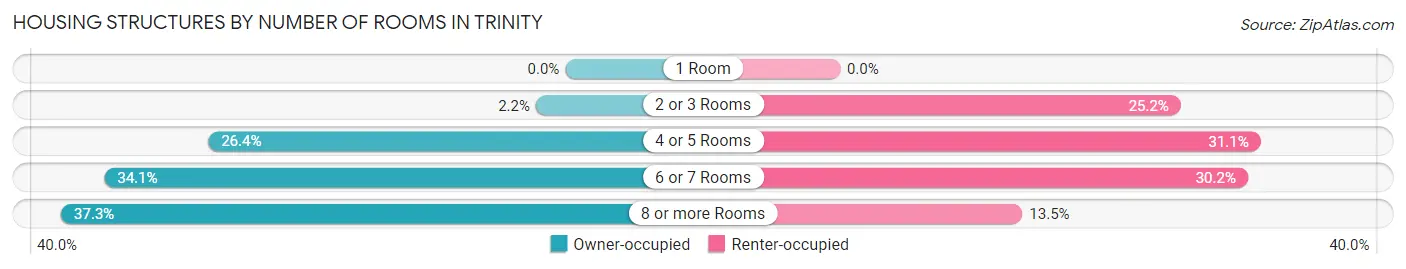
| Number of Rooms | Owner-occupied | Renter-occupied |
| 1 Room | 0 (0.0%) | 0 (0.0%) |
| 2 or 3 Rooms | 129 (2.2%) | 239 (25.2%) |
| 4 or 5 Rooms | 1,559 (26.4%) | 295 (31.1%) |
| 6 or 7 Rooms | 2,013 (34.1%) | 286 (30.2%) |
| 8 or more Rooms | 2,203 (37.3%) | 128 (13.5%) |
| Total | 5,904 (100.0%) | 948 (100.0%) |
Housing Structure by Heating Type in Trinity
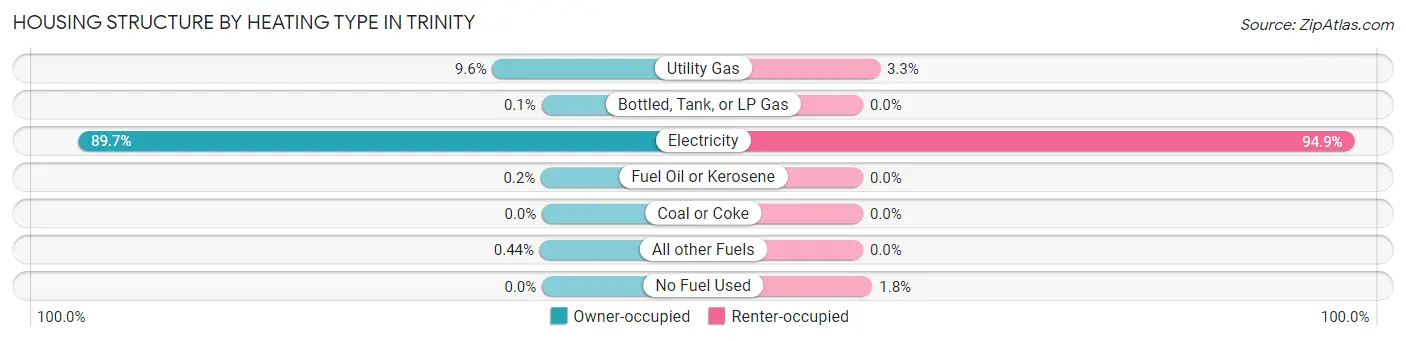
| Heating Type | Owner-occupied | Renter-occupied |
| Utility Gas | 566 (9.6%) | 31 (3.3%) |
| Bottled, Tank, or LP Gas | 6 (0.1%) | 0 (0.0%) |
| Electricity | 5,294 (89.7%) | 900 (94.9%) |
| Fuel Oil or Kerosene | 12 (0.2%) | 0 (0.0%) |
| Coal or Coke | 0 (0.0%) | 0 (0.0%) |
| All other Fuels | 26 (0.4%) | 0 (0.0%) |
| No Fuel Used | 0 (0.0%) | 17 (1.8%) |
| Total | 5,904 (100.0%) | 948 (100.0%) |
Household Vehicle Usage in Trinity
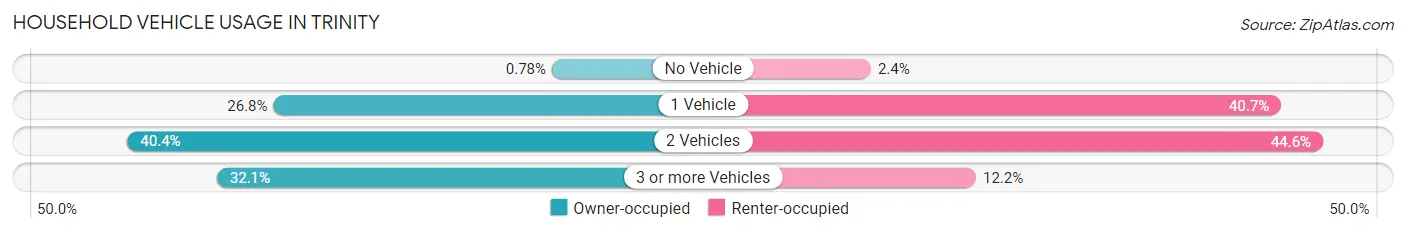
| Vehicles per Household | Owner-occupied | Renter-occupied |
| No Vehicle | 46 (0.8%) | 23 (2.4%) |
| 1 Vehicle | 1,581 (26.8%) | 386 (40.7%) |
| 2 Vehicles | 2,385 (40.4%) | 423 (44.6%) |
| 3 or more Vehicles | 1,892 (32.1%) | 116 (12.2%) |
| Total | 5,904 (100.0%) | 948 (100.0%) |
Real Estate & Mortgages in Trinity
Real Estate and Mortgage Overview in Trinity
| Characteristic | Without Mortgage | With Mortgage |
| Housing Units | 1,787 | 4,117 |
| Median Property Value | $374,900 | $395,700 |
| Median Household Income | $84,120 | $1,684 |
| Monthly Housing Costs | $662 | $545 |
| Real Estate Taxes | $3,291 | $29 |
Property Value by Mortgage Status in Trinity
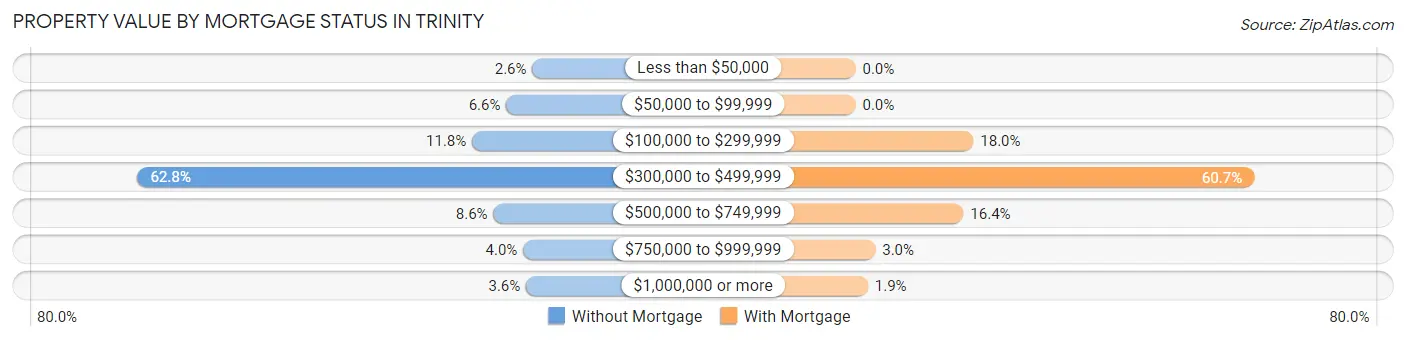
| Property Value | Without Mortgage | With Mortgage |
| Less than $50,000 | 47 (2.6%) | 0 (0.0%) |
| $50,000 to $99,999 | 118 (6.6%) | 0 (0.0%) |
| $100,000 to $299,999 | 211 (11.8%) | 739 (17.9%) |
| $300,000 to $499,999 | 1,122 (62.8%) | 2,500 (60.7%) |
| $500,000 to $749,999 | 153 (8.6%) | 677 (16.4%) |
| $750,000 to $999,999 | 72 (4.0%) | 124 (3.0%) |
| $1,000,000 or more | 64 (3.6%) | 77 (1.9%) |
| Total | 1,787 (100.0%) | 4,117 (100.0%) |
Household Income by Mortgage Status in Trinity
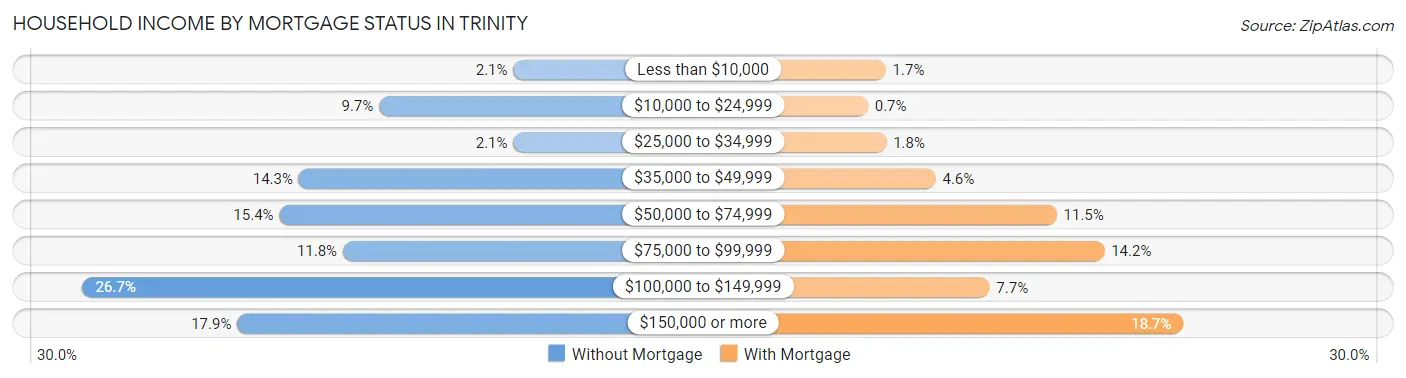
| Household Income | Without Mortgage | With Mortgage |
| Less than $10,000 | 37 (2.1%) | 71 (1.7%) |
| $10,000 to $24,999 | 174 (9.7%) | 29 (0.7%) |
| $25,000 to $34,999 | 37 (2.1%) | 72 (1.8%) |
| $35,000 to $49,999 | 256 (14.3%) | 188 (4.6%) |
| $50,000 to $74,999 | 276 (15.4%) | 473 (11.5%) |
| $75,000 to $99,999 | 211 (11.8%) | 585 (14.2%) |
| $100,000 to $149,999 | 477 (26.7%) | 315 (7.6%) |
| $150,000 or more | 319 (17.8%) | 771 (18.7%) |
| Total | 1,787 (100.0%) | 4,117 (100.0%) |
Property Value to Household Income Ratio in Trinity
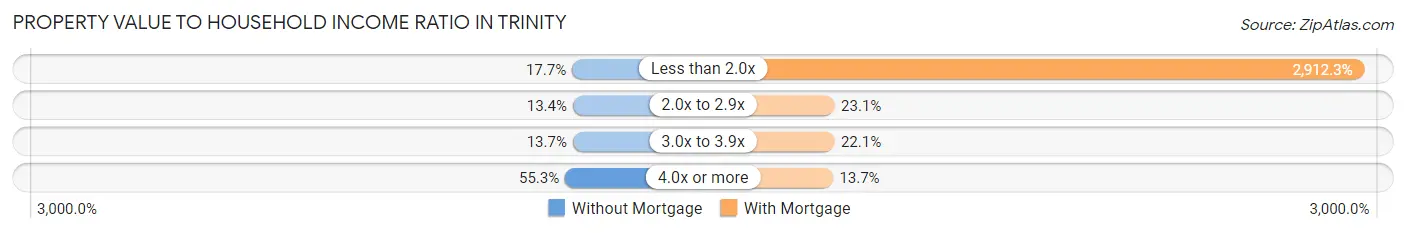
| Value-to-Income Ratio | Without Mortgage | With Mortgage |
| Less than 2.0x | 316 (17.7%) | 119,901 (2,912.3%) |
| 2.0x to 2.9x | 239 (13.4%) | 949 (23.1%) |
| 3.0x to 3.9x | 244 (13.7%) | 911 (22.1%) |
| 4.0x or more | 988 (55.3%) | 564 (13.7%) |
| Total | 1,787 (100.0%) | 4,117 (100.0%) |
Real Estate Taxes by Mortgage Status in Trinity
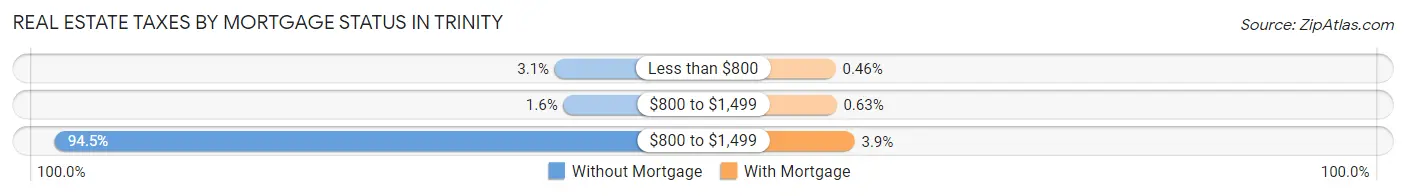
| Property Taxes | Without Mortgage | With Mortgage |
| Less than $800 | 56 (3.1%) | 19 (0.5%) |
| $800 to $1,499 | 28 (1.6%) | 26 (0.6%) |
| $800 to $1,499 | 1,688 (94.5%) | 162 (3.9%) |
| Total | 1,787 (100.0%) | 4,117 (100.0%) |
Health & Disability in Trinity
Health Insurance Coverage by Age in Trinity
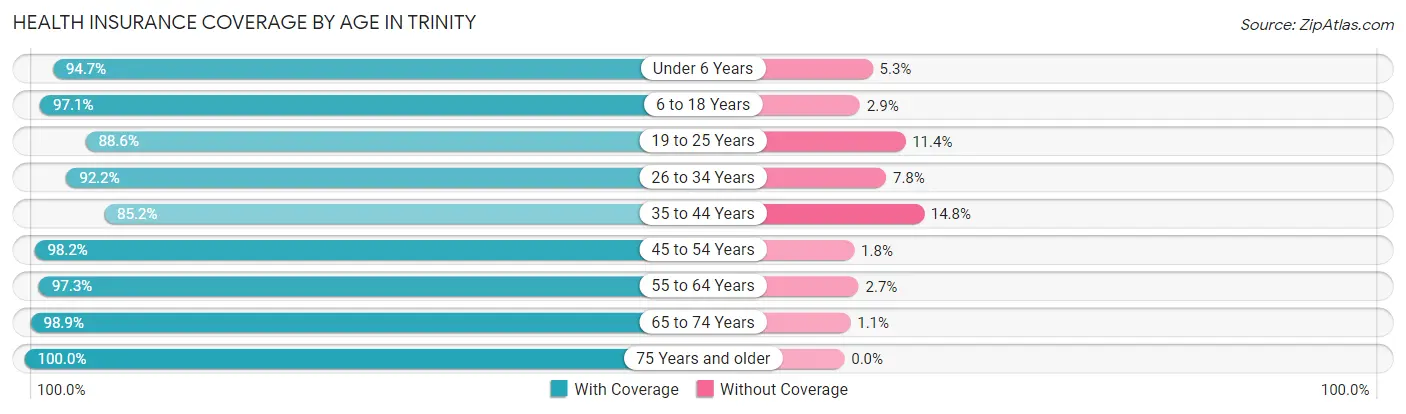
| Age Bracket | With Coverage | Without Coverage |
| Under 6 Years | 1,400 (94.7%) | 78 (5.3%) |
| 6 to 18 Years | 3,234 (97.1%) | 97 (2.9%) |
| 19 to 25 Years | 663 (88.6%) | 85 (11.4%) |
| 26 to 34 Years | 1,956 (92.2%) | 165 (7.8%) |
| 35 to 44 Years | 1,688 (85.2%) | 294 (14.8%) |
| 45 to 54 Years | 2,714 (98.2%) | 51 (1.8%) |
| 55 to 64 Years | 1,862 (97.3%) | 51 (2.7%) |
| 65 to 74 Years | 1,947 (98.9%) | 22 (1.1%) |
| 75 Years and older | 2,340 (100.0%) | 0 (0.0%) |
| Total | 17,804 (95.5%) | 843 (4.5%) |
Health Insurance Coverage by Citizenship Status in Trinity
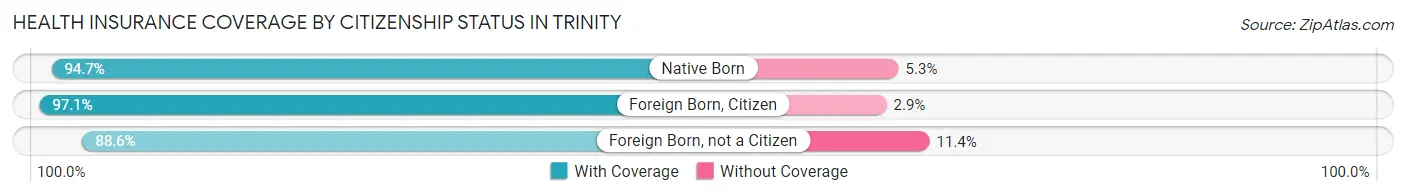
| Citizenship Status | With Coverage | Without Coverage |
| Native Born | 1,400 (94.7%) | 78 (5.3%) |
| Foreign Born, Citizen | 3,234 (97.1%) | 97 (2.9%) |
| Foreign Born, not a Citizen | 663 (88.6%) | 85 (11.4%) |
Health Insurance Coverage by Household Income in Trinity
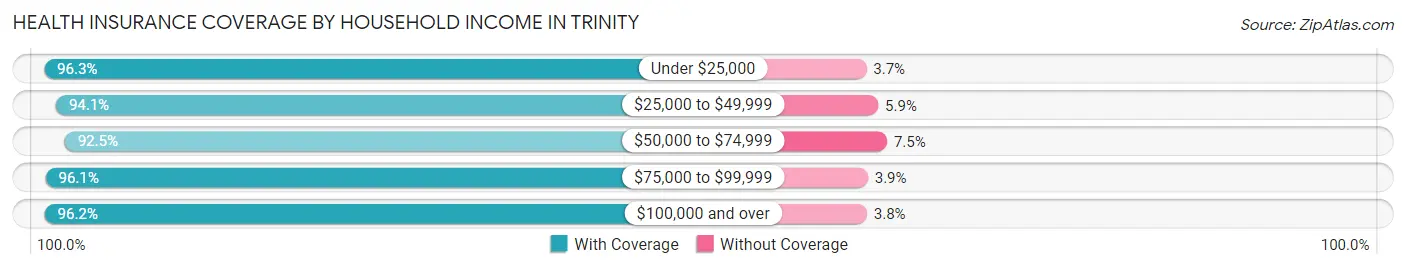
| Household Income | With Coverage | Without Coverage |
| Under $25,000 | 578 (96.3%) | 22 (3.7%) |
| $25,000 to $49,999 | 2,239 (94.1%) | 140 (5.9%) |
| $50,000 to $74,999 | 2,186 (92.5%) | 178 (7.5%) |
| $75,000 to $99,999 | 1,443 (96.1%) | 59 (3.9%) |
| $100,000 and over | 11,358 (96.2%) | 444 (3.8%) |
Public vs Private Health Insurance Coverage by Age in Trinity
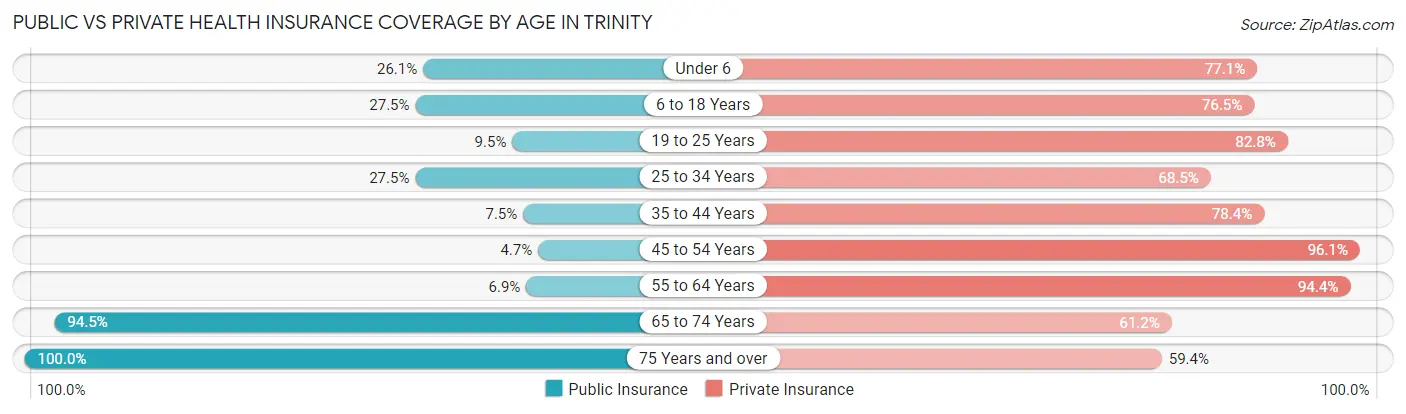
| Age Bracket | Public Insurance | Private Insurance |
| Under 6 | 385 (26.1%) | 1,139 (77.1%) |
| 6 to 18 Years | 915 (27.5%) | 2,549 (76.5%) |
| 19 to 25 Years | 71 (9.5%) | 619 (82.8%) |
| 25 to 34 Years | 583 (27.5%) | 1,452 (68.5%) |
| 35 to 44 Years | 148 (7.5%) | 1,553 (78.4%) |
| 45 to 54 Years | 130 (4.7%) | 2,658 (96.1%) |
| 55 to 64 Years | 132 (6.9%) | 1,805 (94.4%) |
| 65 to 74 Years | 1,860 (94.5%) | 1,205 (61.2%) |
| 75 Years and over | 2,340 (100.0%) | 1,390 (59.4%) |
| Total | 6,564 (35.2%) | 14,370 (77.1%) |
Disability Status by Sex by Age in Trinity
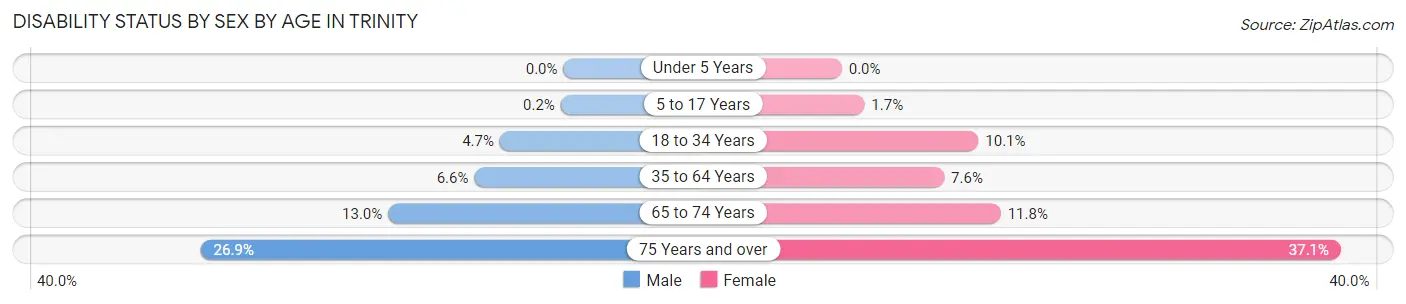
| Age Bracket | Male | Female |
| Under 5 Years | 0 (0.0%) | 0 (0.0%) |
| 5 to 17 Years | 3 (0.2%) | 30 (1.7%) |
| 18 to 34 Years | 78 (4.7%) | 149 (10.1%) |
| 35 to 64 Years | 222 (6.6%) | 251 (7.6%) |
| 65 to 74 Years | 114 (13.0%) | 129 (11.8%) |
| 75 Years and over | 290 (26.9%) | 468 (37.0%) |
Disability Class by Sex by Age in Trinity
Disability Class: Hearing Difficulty
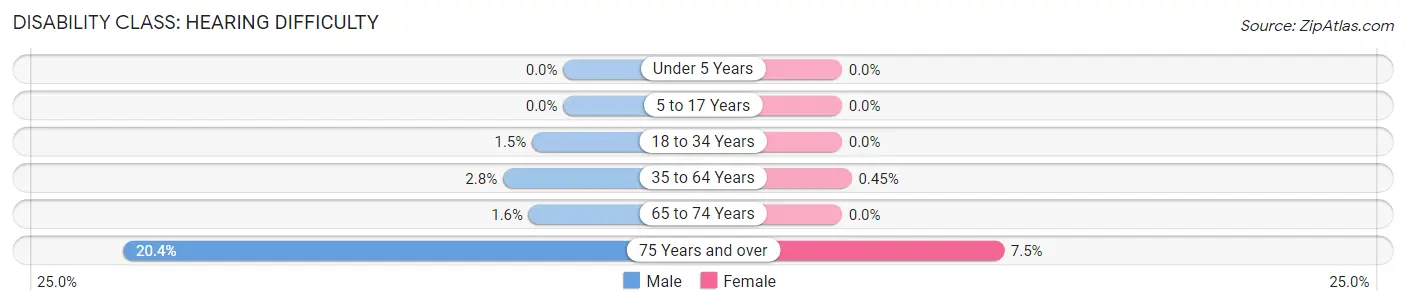
| Age Bracket | Male | Female |
| Under 5 Years | 0 (0.0%) | 0 (0.0%) |
| 5 to 17 Years | 0 (0.0%) | 0 (0.0%) |
| 18 to 34 Years | 24 (1.5%) | 0 (0.0%) |
| 35 to 64 Years | 94 (2.8%) | 15 (0.4%) |
| 65 to 74 Years | 14 (1.6%) | 0 (0.0%) |
| 75 Years and over | 220 (20.4%) | 95 (7.5%) |
Disability Class: Vision Difficulty
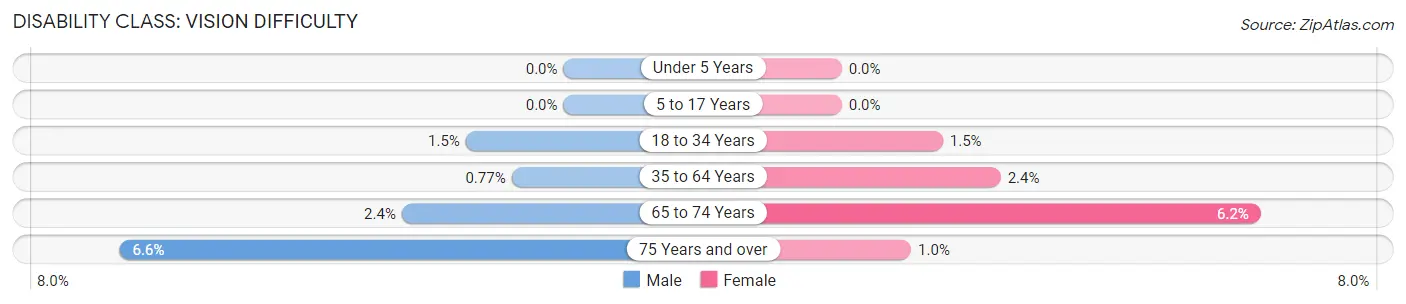
| Age Bracket | Male | Female |
| Under 5 Years | 0 (0.0%) | 0 (0.0%) |
| 5 to 17 Years | 0 (0.0%) | 0 (0.0%) |
| 18 to 34 Years | 24 (1.5%) | 22 (1.5%) |
| 35 to 64 Years | 26 (0.8%) | 78 (2.4%) |
| 65 to 74 Years | 21 (2.4%) | 68 (6.2%) |
| 75 Years and over | 71 (6.6%) | 13 (1.0%) |
Disability Class: Cognitive Difficulty
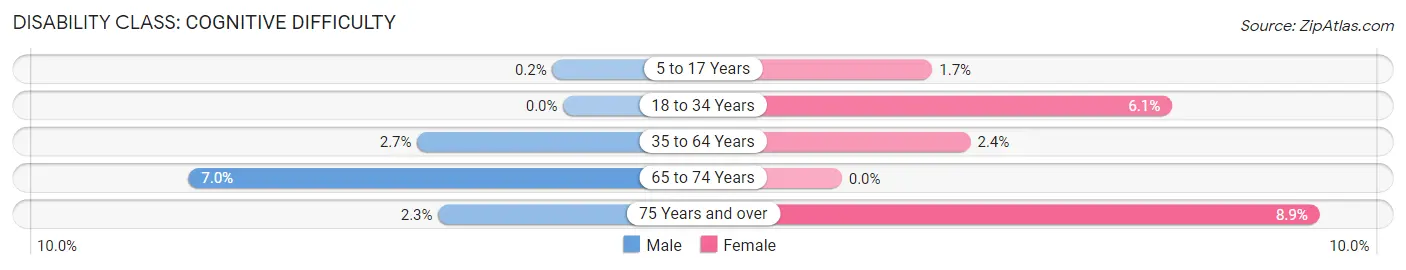
| Age Bracket | Male | Female |
| 5 to 17 Years | 3 (0.2%) | 30 (1.7%) |
| 18 to 34 Years | 0 (0.0%) | 90 (6.1%) |
| 35 to 64 Years | 91 (2.7%) | 79 (2.4%) |
| 65 to 74 Years | 61 (7.0%) | 0 (0.0%) |
| 75 Years and over | 25 (2.3%) | 112 (8.9%) |
Disability Class: Ambulatory Difficulty
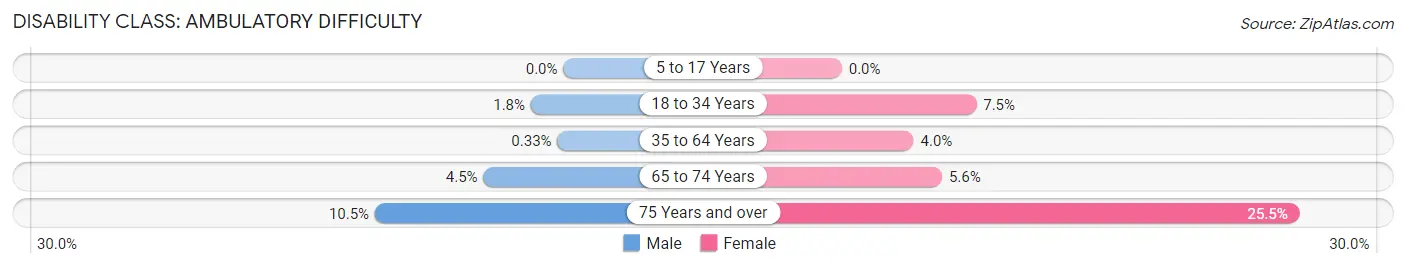
| Age Bracket | Male | Female |
| 5 to 17 Years | 0 (0.0%) | 0 (0.0%) |
| 18 to 34 Years | 30 (1.8%) | 110 (7.5%) |
| 35 to 64 Years | 11 (0.3%) | 132 (4.0%) |
| 65 to 74 Years | 39 (4.4%) | 61 (5.6%) |
| 75 Years and over | 113 (10.5%) | 322 (25.5%) |
Disability Class: Self-Care Difficulty
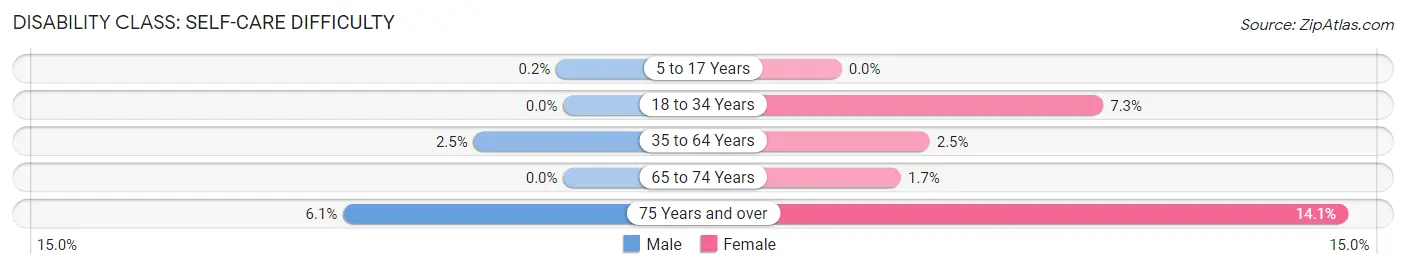
| Age Bracket | Male | Female |
| 5 to 17 Years | 3 (0.2%) | 0 (0.0%) |
| 18 to 34 Years | 0 (0.0%) | 107 (7.3%) |
| 35 to 64 Years | 84 (2.5%) | 81 (2.5%) |
| 65 to 74 Years | 0 (0.0%) | 18 (1.7%) |
| 75 Years and over | 66 (6.1%) | 178 (14.1%) |
Technology Access in Trinity
Computing Device Access in Trinity
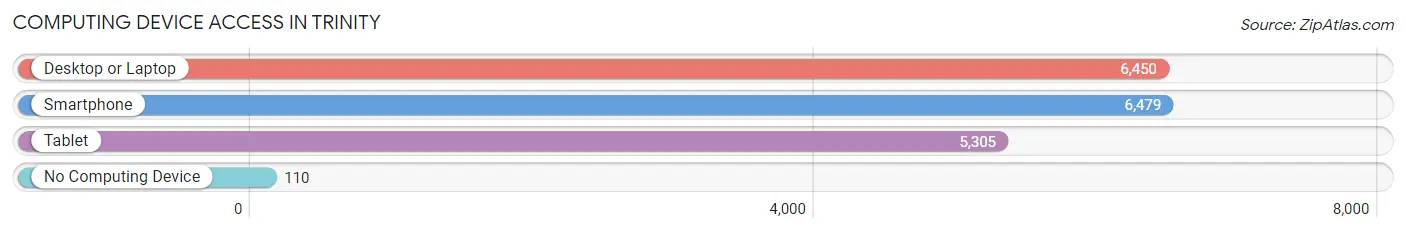
| Device Type | # Households | % Households |
| Desktop or Laptop | 6,450 | 94.1% |
| Smartphone | 6,479 | 94.6% |
| Tablet | 5,305 | 77.4% |
| No Computing Device | 110 | 1.6% |
| Total | 6,852 | 100.0% |
Internet Access in Trinity
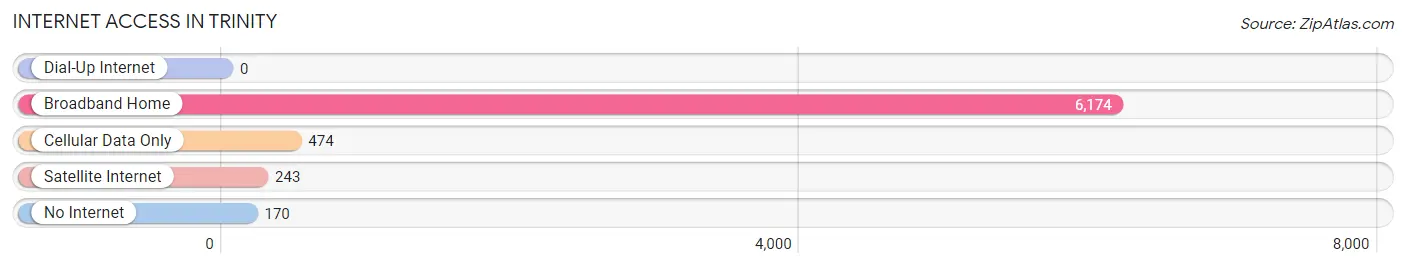
| Internet Type | # Households | % Households |
| Dial-Up Internet | 0 | 0.0% |
| Broadband Home | 6,174 | 90.1% |
| Cellular Data Only | 474 | 6.9% |
| Satellite Internet | 243 | 3.5% |
| No Internet | 170 | 2.5% |
| Total | 6,852 | 100.0% |
Trinity Summary
Trinity, Florida is a census-designated place located in Pasco County, Florida. It is located about 25 miles north of Tampa and is part of the Tampa-St. Petersburg-Clearwater metropolitan area. The population of Trinity was estimated to be around 10,000 in 2020.
Geography
Trinity is located in the northern part of Pasco County, Florida. It is bordered by the cities of New Port Richey to the south, Tarpon Springs to the north, and Holiday to the east. The area is mostly flat and is located on the Gulf Coast. The climate is humid subtropical, with hot, humid summers and mild winters.
Economy
Trinity is a rapidly growing area, with many new businesses and residential developments. The economy is largely based on retail, healthcare, and professional services. The area is home to several large employers, including the Pasco County School District, BayCare Health System, and the Pasco County Sheriff's Office.
Demographics
Trinity is a diverse community, with a population that is approximately 60% white, 20% Hispanic, and 20% African American. The median household income is around $60,000, and the median home value is around $200,000. The area is home to a large number of retirees, as well as young families.
History
Trinity was first settled in the late 19th century by settlers from the nearby city of New Port Richey. The area was originally known as "Trinityville," and was named after the nearby Trinity River. The area was largely rural until the 1950s, when the population began to grow rapidly. The area was incorporated as a town in 1959, and the population continued to grow throughout the 1960s and 1970s. In the 1980s, the area began to experience rapid growth, and the population has continued to grow since then.
Conclusion
Trinity, Florida is a rapidly growing area located in Pasco County, Florida. It is located about 25 miles north of Tampa and is part of the Tampa-St. Petersburg-Clearwater metropolitan area. The population of Trinity was estimated to be around 10,000 in 2020. The economy is largely based on retail, healthcare, and professional services. The area is home to a diverse population, with a median household income of around $60,000 and a median home value of around $200,000. Trinity was first settled in the late 19th century, and the population has continued to grow since then.
Common Questions
What is Per Capita Income in Trinity?
Per Capita income in Trinity is $49,506.
What is the Median Family Income in Trinity?
Median Family Income in Trinity is $116,311.
What is the Median Household income in Trinity?
Median Household Income in Trinity is $106,862.
What is Income or Wage Gap in Trinity?
Income or Wage Gap in Trinity is 23.8%.
Women in Trinity earn 76.2 cents for every dollar earned by a man.
What is Inequality or Gini Index in Trinity?
Inequality or Gini Index in Trinity is 0.41.
What is the Total Population of Trinity?
Total Population of Trinity is 18,672.
What is the Total Male Population of Trinity?
Total Male Population of Trinity is 9,077.
What is the Total Female Population of Trinity?
Total Female Population of Trinity is 9,595.
What is the Ratio of Males per 100 Females in Trinity?
There are 94.60 Males per 100 Females in Trinity.
What is the Ratio of Females per 100 Males in Trinity?
There are 105.71 Females per 100 Males in Trinity.
What is the Median Population Age in Trinity?
Median Population Age in Trinity is 43.7 Years.
What is the Average Family Size in Trinity
Average Family Size in Trinity is 3.1 People.
What is the Average Household Size in Trinity
Average Household Size in Trinity is 2.7 People.
How Large is the Labor Force in Trinity?
There are 8,525 People in the Labor Forcein in Trinity.
What is the Percentage of People in the Labor Force in Trinity?
58.6% of People are in the Labor Force in Trinity.
What is the Unemployment Rate in Trinity?
Unemployment Rate in Trinity is 4.2%.