Bessemer, MI Map & Demographics
Bessemer Map
Bessemer Overview
$27,191
PER CAPITA INCOME
$71,250
AVG FAMILY INCOME
$49,323
AVG HOUSEHOLD INCOME
29.3%
WAGE / INCOME GAP [ % ]
70.7¢/ $1
WAGE / INCOME GAP [ $ ]
0.41
INEQUALITY / GINI INDEX
1,708
TOTAL POPULATION
761
MALE POPULATION
947
FEMALE POPULATION
80.36
MALES / 100 FEMALES
124.44
FEMALES / 100 MALES
50.4
MEDIAN AGE
2.4
AVG FAMILY SIZE
2.0
AVG HOUSEHOLD SIZE
882
LABOR FORCE [ PEOPLE ]
60.3%
PERCENT IN LABOR FORCE
4.4%
UNEMPLOYMENT RATE
Bessemer Zip Codes
Bessemer Area Codes
Income in Bessemer
Income Overview in Bessemer
Per Capita Income in Bessemer is $27,191, while median incomes of families and households are $71,250 and $49,323 respectively.
| Characteristic | Number | Measure |
| Per Capita Income | 1,708 | $27,191 |
| Median Family Income | 543 | $71,250 |
| Mean Family Income | 543 | $76,647 |
| Median Household Income | 831 | $49,323 |
| Mean Household Income | 831 | $62,436 |
| Income Deficit | 543 | $0 |
| Wage / Income Gap (%) | 1,708 | 29.33% |
| Wage / Income Gap ($) | 1,708 | 70.67¢ per $1 |
| Gini / Inequality Index | 1,708 | 0.41 |
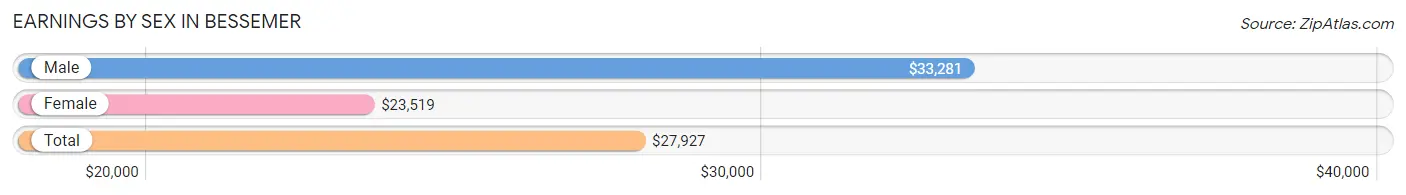
Earnings by Sex in Bessemer
Average Earnings in Bessemer are $27,927, $33,281 for men and $23,519 for women, a difference of 29.3%.
| Sex | Number | Average Earnings |
| Male | 392 (41.5%) | $33,281 |
| Female | 552 (58.5%) | $23,519 |
| Total | 944 (100.0%) | $27,927 |
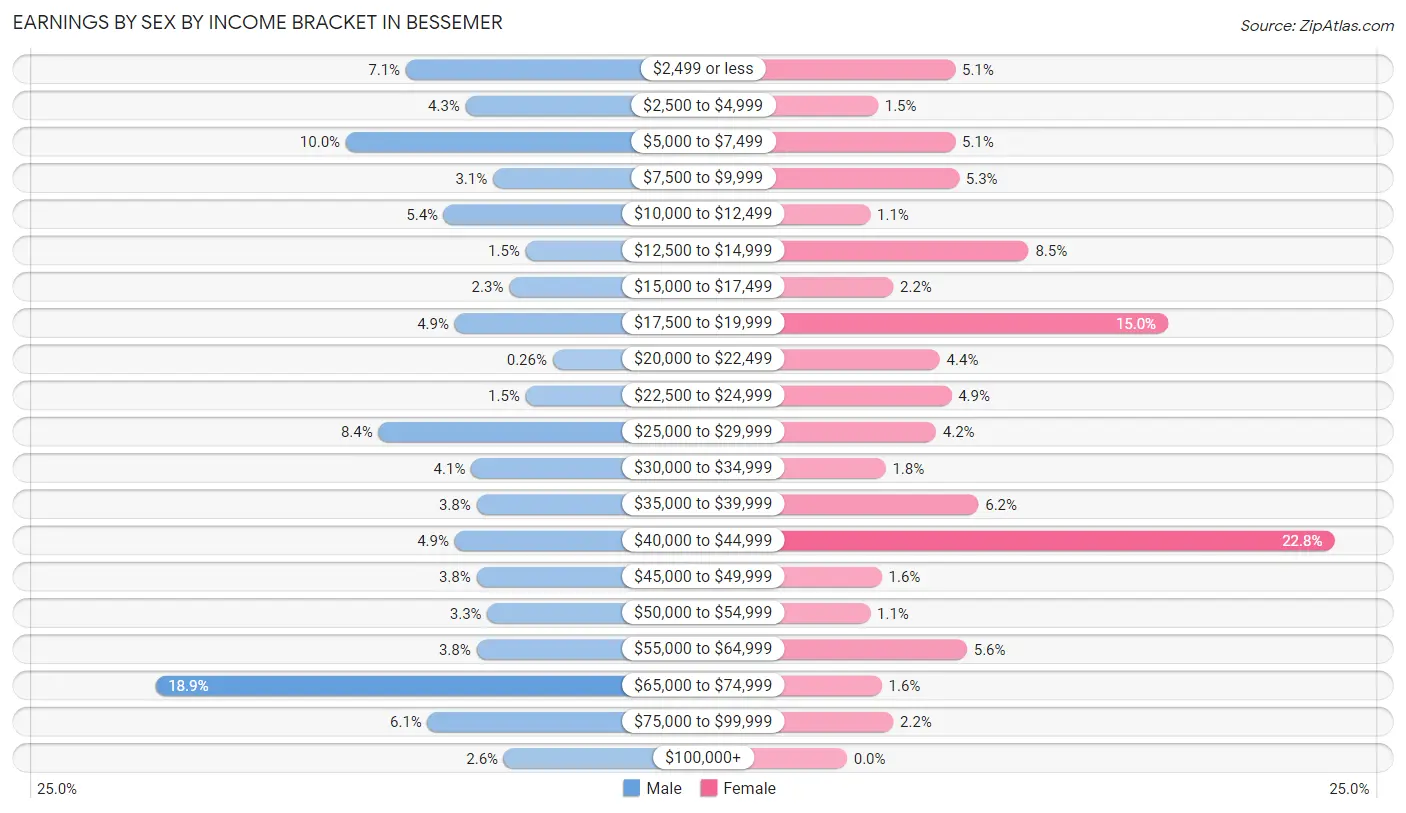
Earnings by Sex by Income Bracket in Bessemer
The most common earnings brackets in Bessemer are $65,000 to $74,999 for men (74 | 18.9%) and $40,000 to $44,999 for women (126 | 22.8%).
| Income | Male | Female |
| $2,499 or less | 28 (7.1%) | 28 (5.1%) |
| $2,500 to $4,999 | 17 (4.3%) | 8 (1.5%) |
| $5,000 to $7,499 | 39 (10.0%) | 28 (5.1%) |
| $7,500 to $9,999 | 12 (3.1%) | 29 (5.2%) |
| $10,000 to $12,499 | 21 (5.4%) | 6 (1.1%) |
| $12,500 to $14,999 | 6 (1.5%) | 47 (8.5%) |
| $15,000 to $17,499 | 9 (2.3%) | 12 (2.2%) |
| $17,500 to $19,999 | 19 (4.9%) | 83 (15.0%) |
| $20,000 to $22,499 | 1 (0.3%) | 24 (4.3%) |
| $22,500 to $24,999 | 6 (1.5%) | 27 (4.9%) |
| $25,000 to $29,999 | 33 (8.4%) | 23 (4.2%) |
| $30,000 to $34,999 | 16 (4.1%) | 10 (1.8%) |
| $35,000 to $39,999 | 15 (3.8%) | 34 (6.2%) |
| $40,000 to $44,999 | 19 (4.9%) | 126 (22.8%) |
| $45,000 to $49,999 | 15 (3.8%) | 9 (1.6%) |
| $50,000 to $54,999 | 13 (3.3%) | 6 (1.1%) |
| $55,000 to $64,999 | 15 (3.8%) | 31 (5.6%) |
| $65,000 to $74,999 | 74 (18.9%) | 9 (1.6%) |
| $75,000 to $99,999 | 24 (6.1%) | 12 (2.2%) |
| $100,000+ | 10 (2.5%) | 0 (0.0%) |
| Total | 392 (100.0%) | 552 (100.0%) |
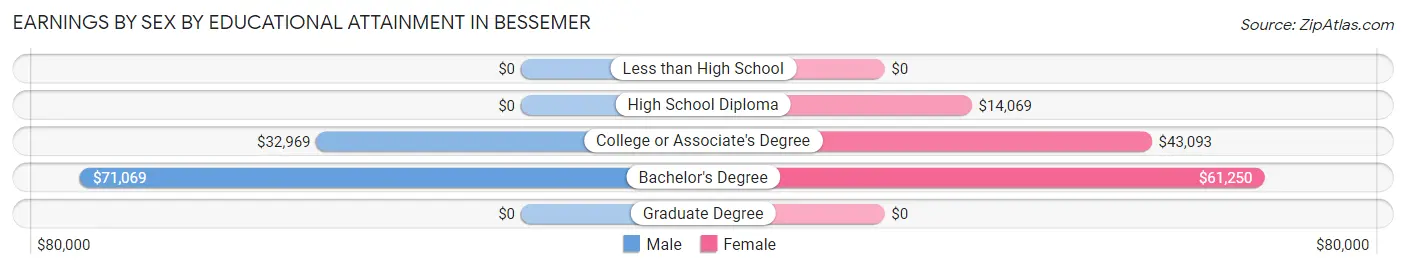
Earnings by Sex by Educational Attainment in Bessemer
Average earnings in Bessemer are $41,364 for men and $37,625 for women, a difference of 9.0%. Men with an educational attainment of bachelor's degree enjoy the highest average annual earnings of $71,069, while those with college or associate's degree education earn the least with $32,969. Women with an educational attainment of bachelor's degree earn the most with the average annual earnings of $61,250, while those with high school diploma education have the smallest earnings of $14,069.
| Educational Attainment | Male Income | Female Income |
| Less than High School | - | - |
| High School Diploma | - | - |
| College or Associate's Degree | $32,969 | $43,093 |
| Bachelor's Degree | $71,069 | $61,250 |
| Graduate Degree | - | - |
| Total | $41,364 | $37,625 |
Family Income in Bessemer
Family Income Brackets in Bessemer
According to the Bessemer family income data, there are 158 families falling into the $100,000 to $149,999 income range, which is the most common income bracket and makes up 29.1% of all families. Conversely, the $200,000+ income bracket is the least frequent group with only 4 families (0.7%) belonging to this category.
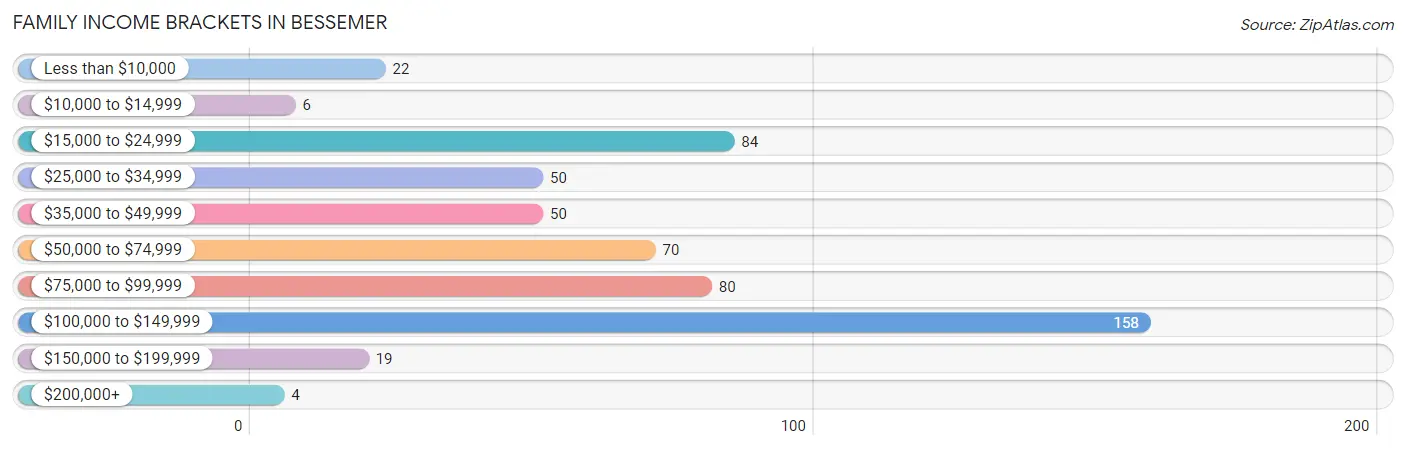
| Income Bracket | # Families | % Families |
| Less than $10,000 | 22 | 4.1% |
| $10,000 to $14,999 | 6 | 1.1% |
| $15,000 to $24,999 | 84 | 15.5% |
| $25,000 to $34,999 | 50 | 9.2% |
| $35,000 to $49,999 | 50 | 9.2% |
| $50,000 to $74,999 | 70 | 12.9% |
| $75,000 to $99,999 | 80 | 14.7% |
| $100,000 to $149,999 | 158 | 29.1% |
| $150,000 to $199,999 | 19 | 3.5% |
| $200,000+ | 4 | 0.7% |
Family Income by Famaliy Size in Bessemer
3-person families (190 | 35.0%) account for the highest median family income in Bessemer with $133,026 per family, while 3-person families (190 | 35.0%) have the highest median income of $44,342 per family member.
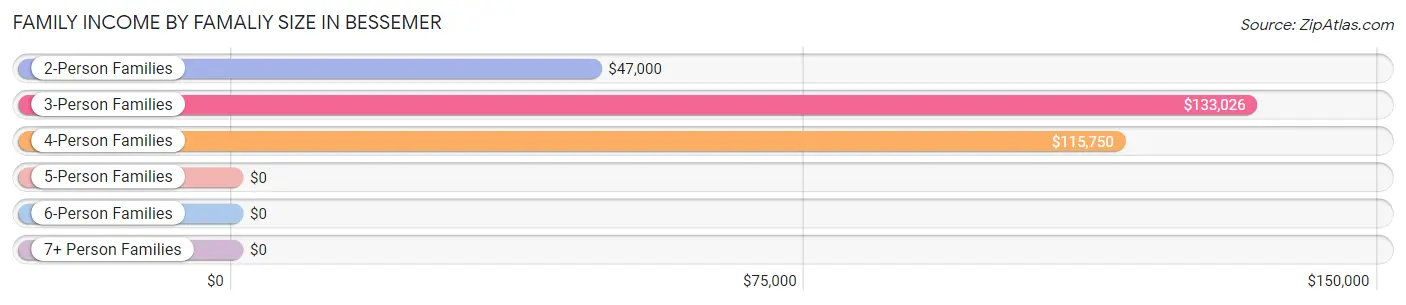
| Income Bracket | # Families | Median Income |
| 2-Person Families | 300 (55.2%) | $47,000 |
| 3-Person Families | 190 (35.0%) | $133,026 |
| 4-Person Families | 30 (5.5%) | $115,750 |
| 5-Person Families | 15 (2.8%) | $0 |
| 6-Person Families | 0 (0.0%) | $0 |
| 7+ Person Families | 8 (1.5%) | $0 |
| Total | 543 (100.0%) | $71,250 |
Family Income by Number of Earners in Bessemer
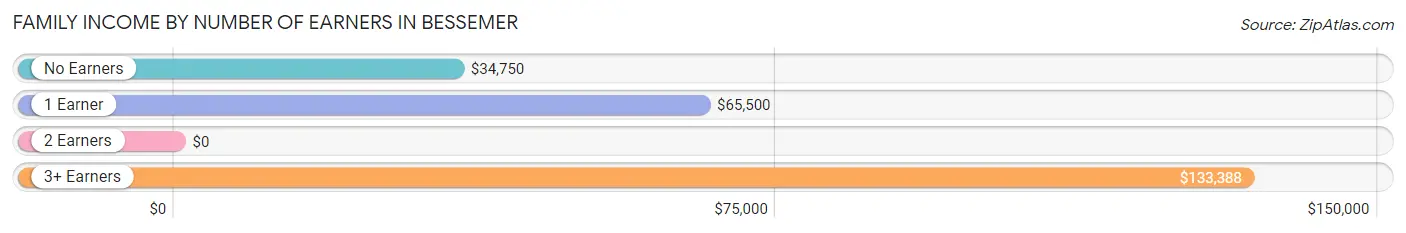
| Number of Earners | # Families | Median Income |
| No Earners | 113 (20.8%) | $34,750 |
| 1 Earner | 136 (25.1%) | $65,500 |
| 2 Earners | 137 (25.2%) | $0 |
| 3+ Earners | 157 (28.9%) | $133,388 |
| Total | 543 (100.0%) | $71,250 |
Household Income in Bessemer
Household Income Brackets in Bessemer
With 162 households falling in the category, the $100,000 to $149,999 income range is the most frequent in Bessemer, accounting for 19.5% of all households. In contrast, only 4 households (0.5%) fall into the $200,000+ income bracket, making it the least populous group.
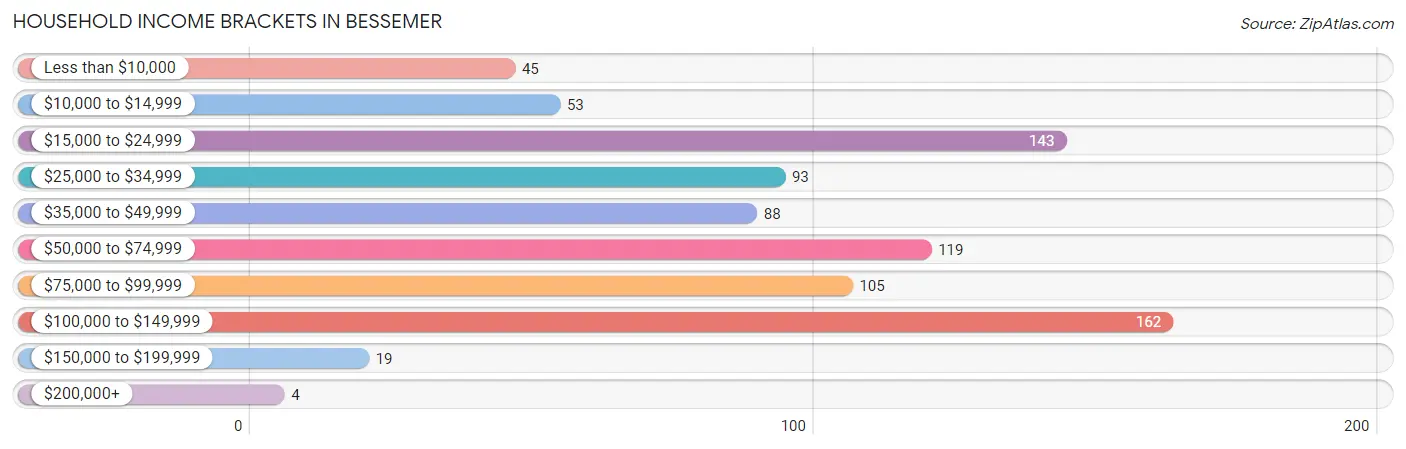
| Income Bracket | # Households | % Households |
| Less than $10,000 | 45 | 5.4% |
| $10,000 to $14,999 | 53 | 6.4% |
| $15,000 to $24,999 | 143 | 17.2% |
| $25,000 to $34,999 | 93 | 11.2% |
| $35,000 to $49,999 | 88 | 10.6% |
| $50,000 to $74,999 | 119 | 14.3% |
| $75,000 to $99,999 | 105 | 12.6% |
| $100,000 to $149,999 | 162 | 19.5% |
| $150,000 to $199,999 | 19 | 2.3% |
| $200,000+ | 4 | 0.5% |
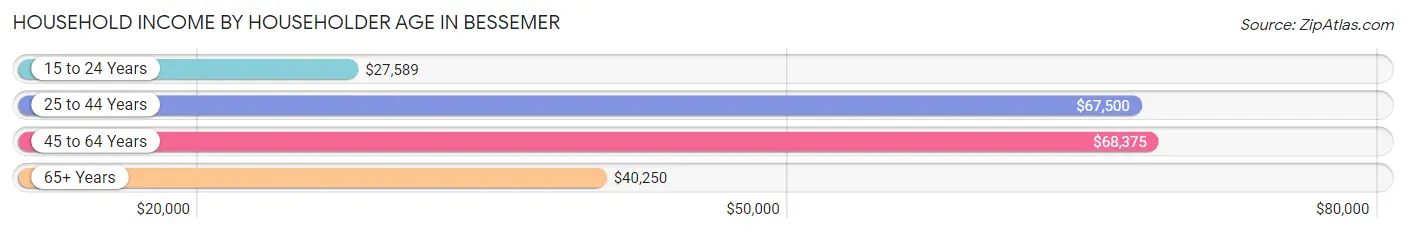
Household Income by Householder Age in Bessemer
The median household income in Bessemer is $49,323, with the highest median household income of $68,375 found in the 45 to 64 years age bracket for the primary householder. A total of 411 households (49.5%) fall into this category. Meanwhile, the 15 to 24 years age bracket for the primary householder has the lowest median household income of $27,589, with 43 households (5.2%) in this group.
| Income Bracket | # Households | Median Income |
| 15 to 24 Years | 43 (5.2%) | $27,589 |
| 25 to 44 Years | 114 (13.7%) | $67,500 |
| 45 to 64 Years | 411 (49.5%) | $68,375 |
| 65+ Years | 263 (31.7%) | $40,250 |
| Total | 831 (100.0%) | $49,323 |
Poverty in Bessemer
Income Below Poverty by Sex and Age in Bessemer
With 18.7% poverty level for males and 18.1% for females among the residents of Bessemer, under 5 year old males and 5 year old females are the most vulnerable to poverty, with 18 males (58.1%) and 10 females (100.0%) in their respective age groups living below the poverty level.
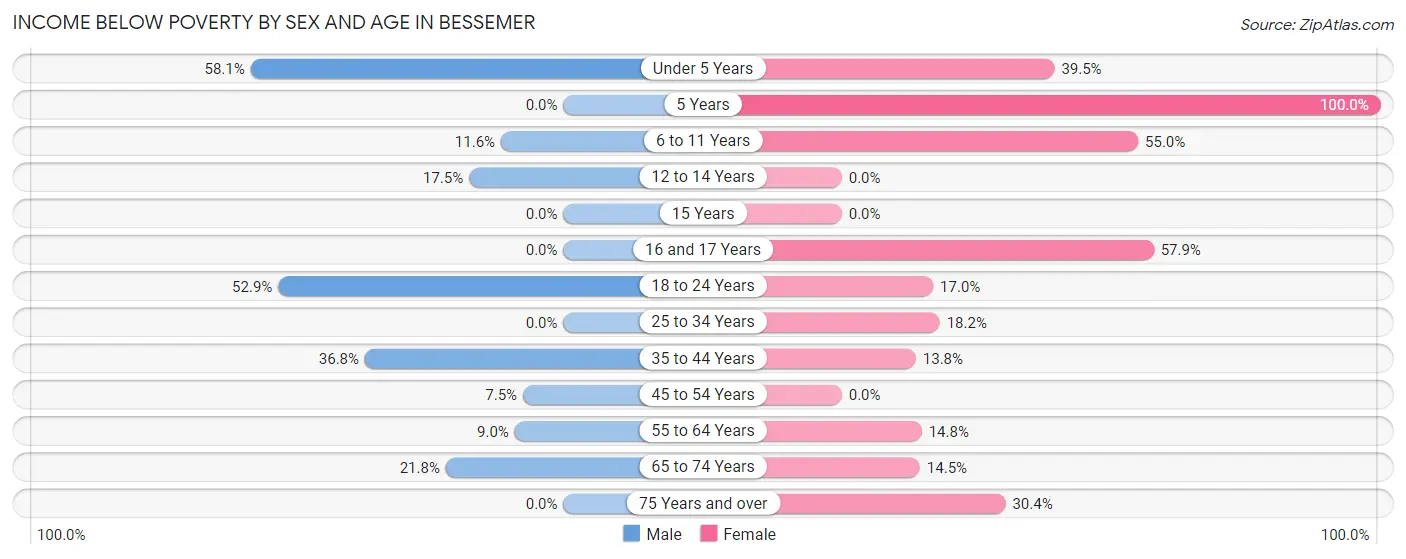
| Age Bracket | Male | Female |
| Under 5 Years | 18 (58.1%) | 15 (39.5%) |
| 5 Years | 0 (0.0%) | 10 (100.0%) |
| 6 to 11 Years | 8 (11.6%) | 22 (55.0%) |
| 12 to 14 Years | 7 (17.5%) | 0 (0.0%) |
| 15 Years | 0 (0.0%) | 0 (0.0%) |
| 16 and 17 Years | 0 (0.0%) | 11 (57.9%) |
| 18 to 24 Years | 27 (52.9%) | 19 (17.0%) |
| 25 to 34 Years | 0 (0.0%) | 12 (18.2%) |
| 35 to 44 Years | 28 (36.8%) | 11 (13.8%) |
| 45 to 54 Years | 6 (7.5%) | 0 (0.0%) |
| 55 to 64 Years | 13 (9.0%) | 27 (14.8%) |
| 65 to 74 Years | 31 (21.8%) | 19 (14.5%) |
| 75 Years and over | 0 (0.0%) | 24 (30.4%) |
| Total | 138 (18.7%) | 170 (18.1%) |
Income Above Poverty by Sex and Age in Bessemer
According to the poverty statistics in Bessemer, males aged 16 and 17 years and females aged 12 to 14 years are the age groups that are most secure financially, with 100.0% of males and 100.0% of females in these age groups living above the poverty line.
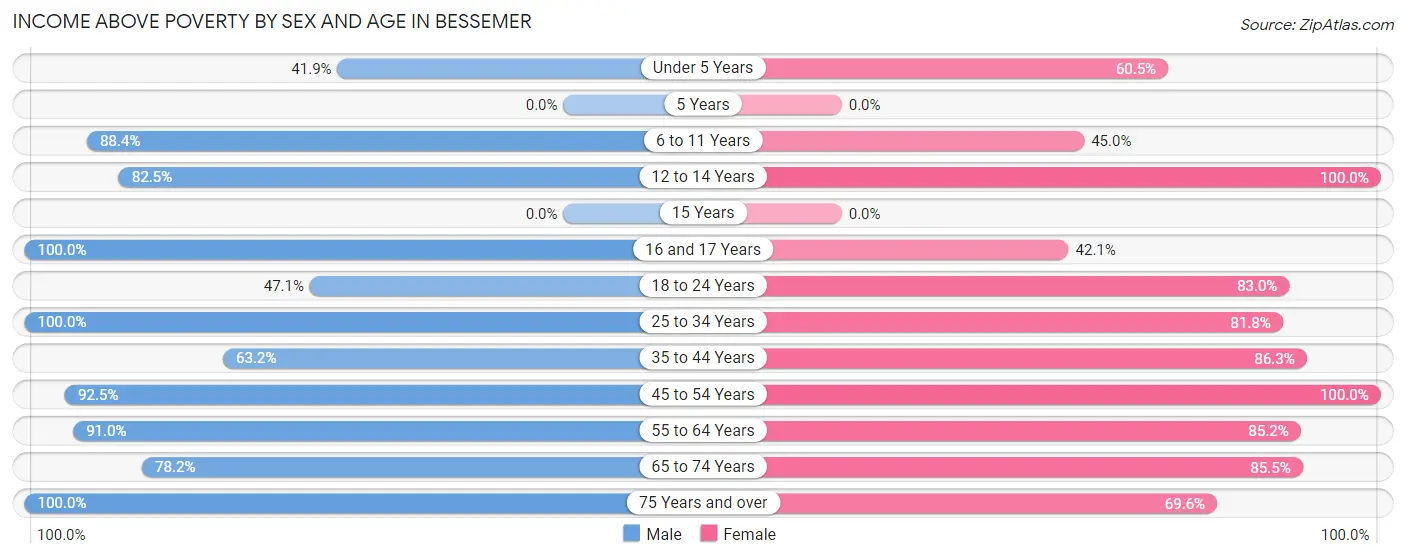
| Age Bracket | Male | Female |
| Under 5 Years | 13 (41.9%) | 23 (60.5%) |
| 5 Years | 0 (0.0%) | 0 (0.0%) |
| 6 to 11 Years | 61 (88.4%) | 18 (45.0%) |
| 12 to 14 Years | 33 (82.5%) | 8 (100.0%) |
| 15 Years | 0 (0.0%) | 0 (0.0%) |
| 16 and 17 Years | 41 (100.0%) | 8 (42.1%) |
| 18 to 24 Years | 24 (47.1%) | 93 (83.0%) |
| 25 to 34 Years | 21 (100.0%) | 54 (81.8%) |
| 35 to 44 Years | 48 (63.2%) | 69 (86.3%) |
| 45 to 54 Years | 74 (92.5%) | 173 (100.0%) |
| 55 to 64 Years | 131 (91.0%) | 155 (85.2%) |
| 65 to 74 Years | 111 (78.2%) | 112 (85.5%) |
| 75 Years and over | 44 (100.0%) | 55 (69.6%) |
| Total | 601 (81.3%) | 768 (81.9%) |
Income Below Poverty Among Married-Couple Families in Bessemer
The poverty statistics for married-couple families in Bessemer show that 10.8% or 44 of the total 408 families live below the poverty line. Families with 3 or 4 children have the highest poverty rate of 100.0%, comprising of 15 families. On the other hand, families with 1 or 2 children have the lowest poverty rate of 0.0%, which includes 0 families.
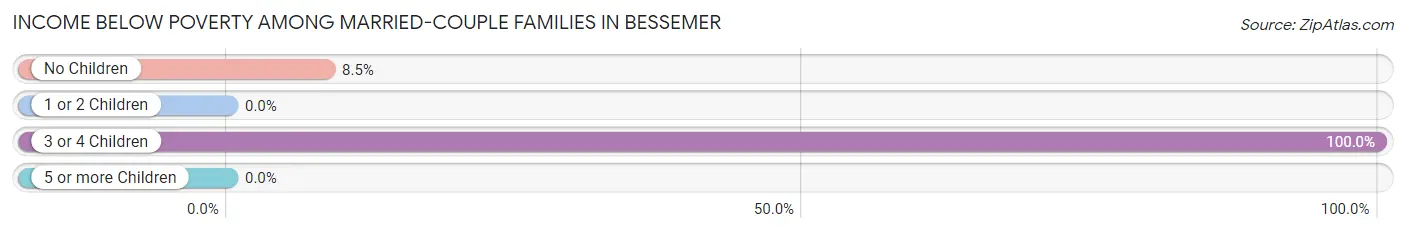
| Children | Above Poverty | Below Poverty |
| No Children | 314 (91.5%) | 29 (8.5%) |
| 1 or 2 Children | 42 (100.0%) | 0 (0.0%) |
| 3 or 4 Children | 0 (0.0%) | 15 (100.0%) |
| 5 or more Children | 8 (100.0%) | 0 (0.0%) |
| Total | 364 (89.2%) | 44 (10.8%) |
Income Below Poverty Among Single-Parent Households in Bessemer
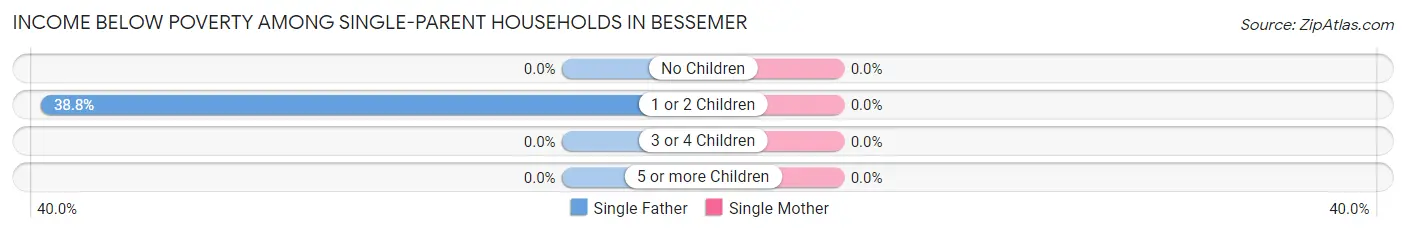
| Children | Single Father | Single Mother |
| No Children | 0 (0.0%) | 0 (0.0%) |
| 1 or 2 Children | 19 (38.8%) | 0 (0.0%) |
| 3 or 4 Children | 0 (0.0%) | 0 (0.0%) |
| 5 or more Children | 0 (0.0%) | 0 (0.0%) |
| Total | 19 (38.8%) | 0 (0.0%) |
Income Below Poverty Among Married-Couple vs Single-Parent Households in Bessemer
The poverty data for Bessemer shows that 44 of the married-couple family households (10.8%) and 19 of the single-parent households (14.1%) are living below the poverty level. Within the married-couple family households, those with 3 or 4 children have the highest poverty rate, with 15 households (100.0%) falling below the poverty line. Among the single-parent households, those with 1 or 2 children have the highest poverty rate, with 19 household (26.8%) living below poverty.
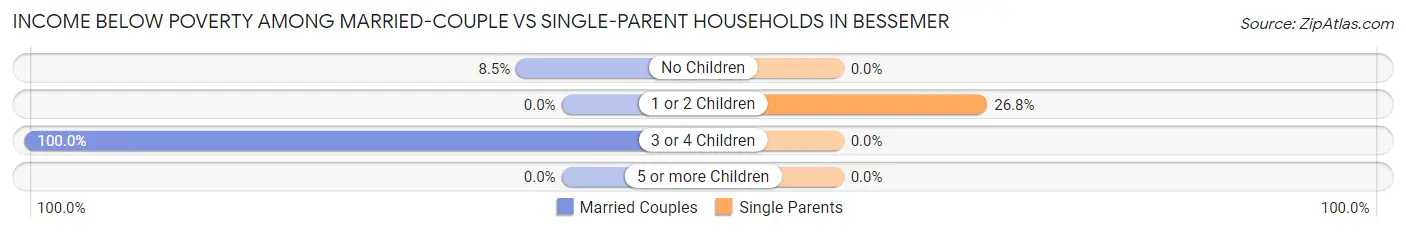
| Children | Married-Couple Families | Single-Parent Households |
| No Children | 29 (8.5%) | 0 (0.0%) |
| 1 or 2 Children | 0 (0.0%) | 19 (26.8%) |
| 3 or 4 Children | 15 (100.0%) | 0 (0.0%) |
| 5 or more Children | 0 (0.0%) | 0 (0.0%) |
| Total | 44 (10.8%) | 19 (14.1%) |
Race in Bessemer
The most populous races in Bessemer are White / Caucasian (1,600 | 93.7%), Two or more Races (78 | 4.6%), and Hispanic or Latino (35 | 2.1%).
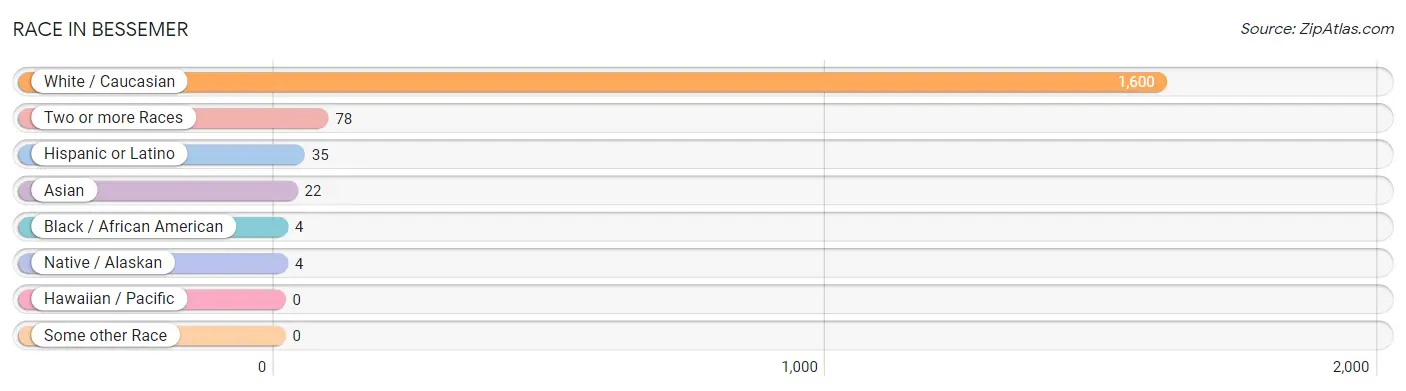
| Race | # Population | % Population |
| Asian | 22 | 1.3% |
| Black / African American | 4 | 0.2% |
| Hawaiian / Pacific | 0 | 0.0% |
| Hispanic or Latino | 35 | 2.1% |
| Native / Alaskan | 4 | 0.2% |
| White / Caucasian | 1,600 | 93.7% |
| Two or more Races | 78 | 4.6% |
| Some other Race | 0 | 0.0% |
| Total | 1,708 | 100.0% |
Ancestry in Bessemer
The most populous ancestries reported in Bessemer are Finnish (492 | 28.8%), English (283 | 16.6%), German (209 | 12.2%), American (176 | 10.3%), and Italian (142 | 8.3%), together accounting for 76.2% of all Bessemer residents.
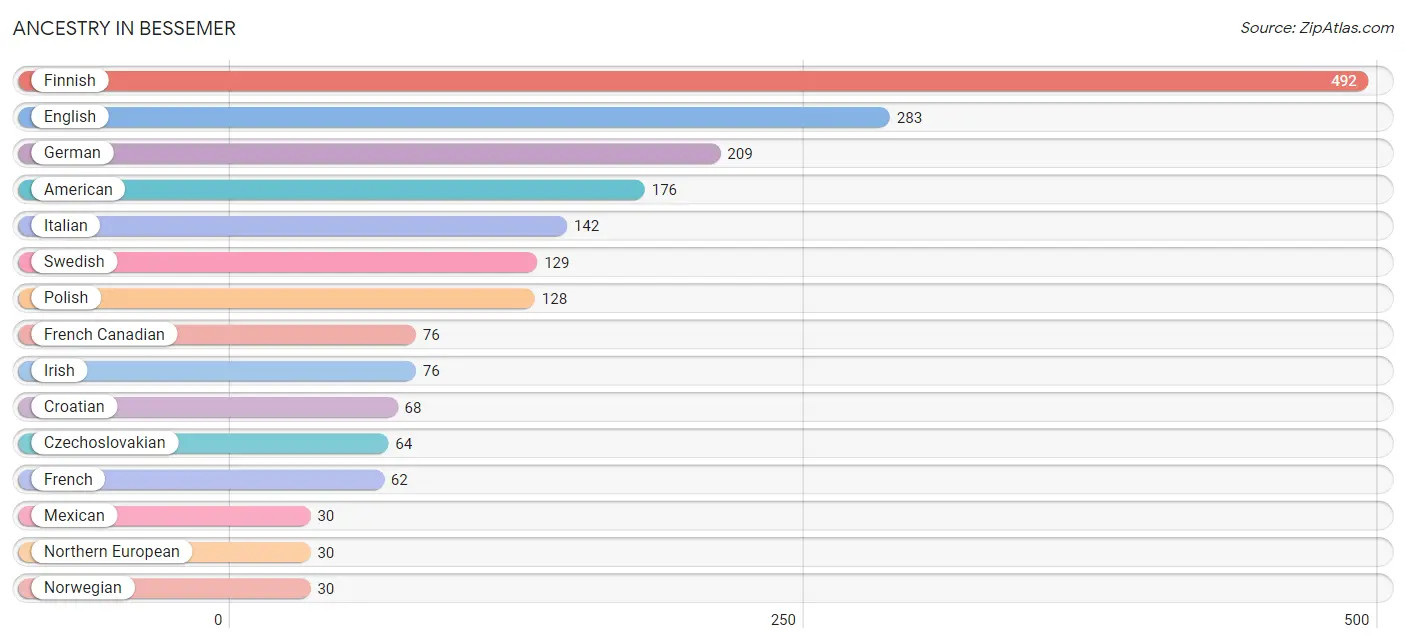
| Ancestry | # Population | % Population |
| American | 176 | 10.3% |
| Austrian | 14 | 0.8% |
| Bhutanese | 1 | 0.1% |
| Central American | 1 | 0.1% |
| Cherokee | 21 | 1.2% |
| Croatian | 68 | 4.0% |
| Czechoslovakian | 64 | 3.7% |
| Dutch | 25 | 1.5% |
| English | 283 | 16.6% |
| European | 13 | 0.8% |
| Finnish | 492 | 28.8% |
| French | 62 | 3.6% |
| French Canadian | 76 | 4.4% |
| German | 209 | 12.2% |
| Greek | 5 | 0.3% |
| Guatemalan | 1 | 0.1% |
| Hungarian | 23 | 1.3% |
| Irish | 76 | 4.4% |
| Iroquois | 13 | 0.8% |
| Italian | 142 | 8.3% |
| Lithuanian | 8 | 0.5% |
| Mexican | 30 | 1.8% |
| Northern European | 30 | 1.8% |
| Norwegian | 30 | 1.8% |
| Pennsylvania German | 23 | 1.3% |
| Polish | 128 | 7.5% |
| Scandinavian | 6 | 0.4% |
| Scotch-Irish | 3 | 0.2% |
| Scottish | 29 | 1.7% |
| Slovak | 15 | 0.9% |
| Sri Lankan | 7 | 0.4% |
| Swedish | 129 | 7.5% |
| Thai | 14 | 0.8% |
| Welsh | 4 | 0.2% |
| Yugoslavian | 5 | 0.3% | View All 35 Rows |
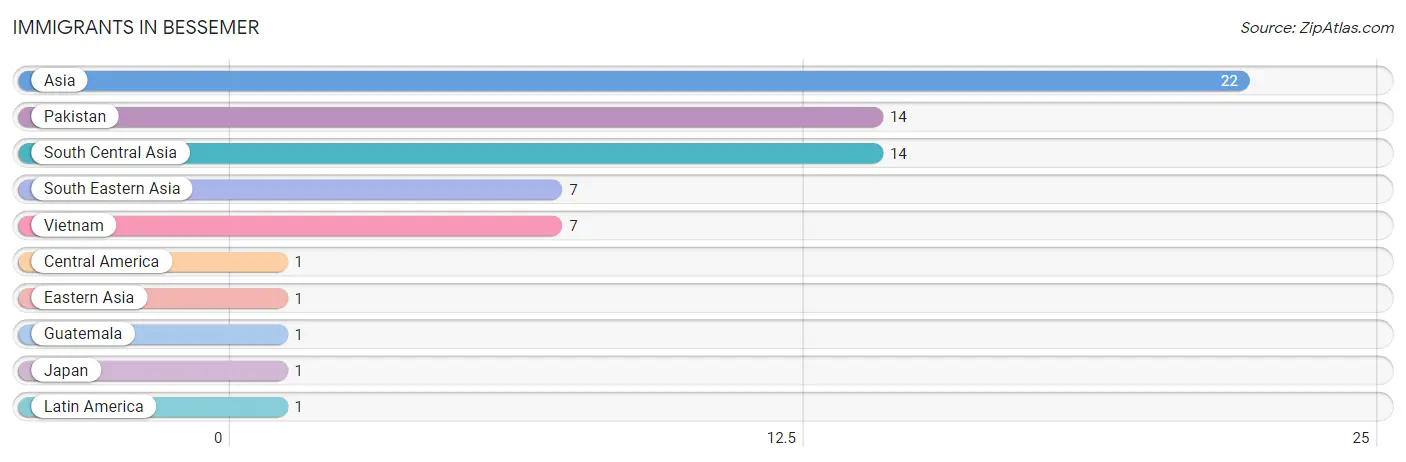
Immigrants in Bessemer
The most numerous immigrant groups reported in Bessemer came from Asia (22 | 1.3%), Pakistan (14 | 0.8%), South Central Asia (14 | 0.8%), South Eastern Asia (7 | 0.4%), and Vietnam (7 | 0.4%), together accounting for 3.7% of all Bessemer residents.
| Immigration Origin | # Population | % Population |
| Asia | 22 | 1.3% |
| Central America | 1 | 0.1% |
| Eastern Asia | 1 | 0.1% |
| Guatemala | 1 | 0.1% |
| Japan | 1 | 0.1% |
| Latin America | 1 | 0.1% |
| Pakistan | 14 | 0.8% |
| South Central Asia | 14 | 0.8% |
| South Eastern Asia | 7 | 0.4% |
| Vietnam | 7 | 0.4% | View All 10 Rows |
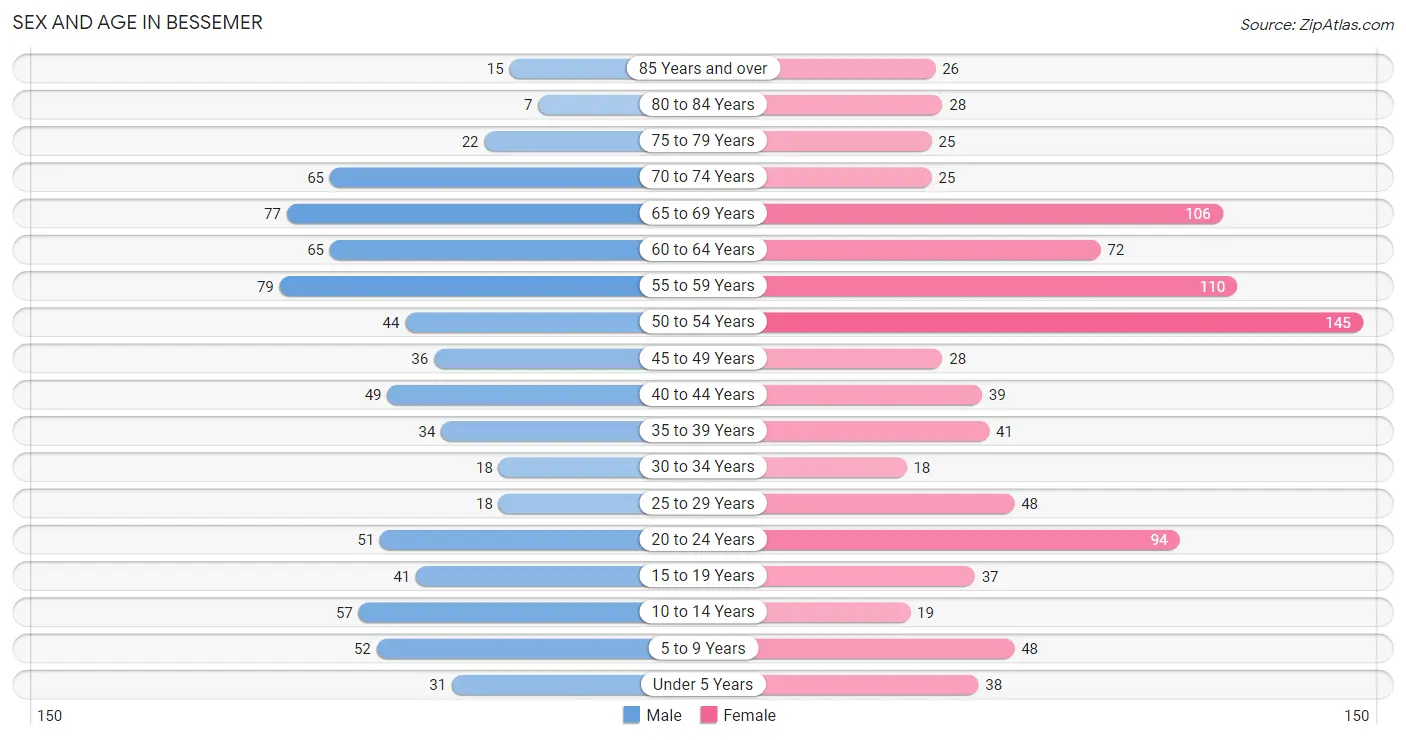
Sex and Age in Bessemer
Sex and Age in Bessemer
The most populous age groups in Bessemer are 55 to 59 Years (79 | 10.4%) for men and 50 to 54 Years (145 | 15.3%) for women.
| Age Bracket | Male | Female |
| Under 5 Years | 31 (4.1%) | 38 (4.0%) |
| 5 to 9 Years | 52 (6.8%) | 48 (5.1%) |
| 10 to 14 Years | 57 (7.5%) | 19 (2.0%) |
| 15 to 19 Years | 41 (5.4%) | 37 (3.9%) |
| 20 to 24 Years | 51 (6.7%) | 94 (9.9%) |
| 25 to 29 Years | 18 (2.4%) | 48 (5.1%) |
| 30 to 34 Years | 18 (2.4%) | 18 (1.9%) |
| 35 to 39 Years | 34 (4.5%) | 41 (4.3%) |
| 40 to 44 Years | 49 (6.4%) | 39 (4.1%) |
| 45 to 49 Years | 36 (4.7%) | 28 (3.0%) |
| 50 to 54 Years | 44 (5.8%) | 145 (15.3%) |
| 55 to 59 Years | 79 (10.4%) | 110 (11.6%) |
| 60 to 64 Years | 65 (8.5%) | 72 (7.6%) |
| 65 to 69 Years | 77 (10.1%) | 106 (11.2%) |
| 70 to 74 Years | 65 (8.5%) | 25 (2.6%) |
| 75 to 79 Years | 22 (2.9%) | 25 (2.6%) |
| 80 to 84 Years | 7 (0.9%) | 28 (3.0%) |
| 85 Years and over | 15 (2.0%) | 26 (2.8%) |
| Total | 761 (100.0%) | 947 (100.0%) |
Families and Households in Bessemer
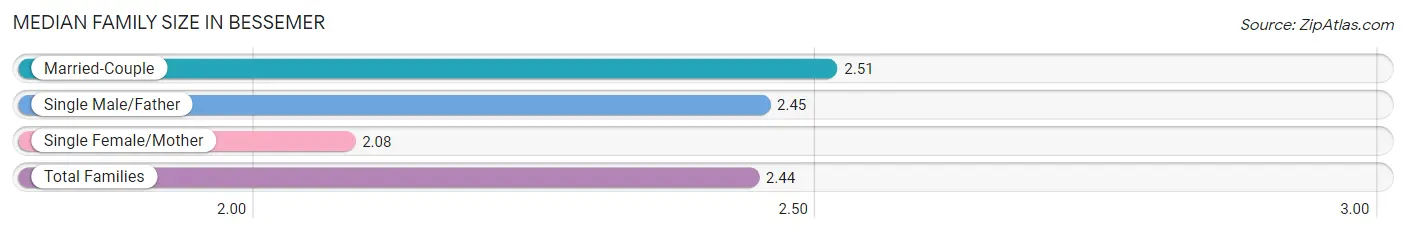
Median Family Size in Bessemer
The median family size in Bessemer is 2.44 persons per family, with married-couple families (408 | 75.1%) accounting for the largest median family size of 2.51 persons per family. On the other hand, single female/mother families (86 | 15.8%) represent the smallest median family size with 2.08 persons per family.
| Family Type | # Families | Family Size |
| Married-Couple | 408 (75.1%) | 2.51 |
| Single Male/Father | 49 (9.0%) | 2.45 |
| Single Female/Mother | 86 (15.8%) | 2.08 |
| Total Families | 543 (100.0%) | 2.44 |
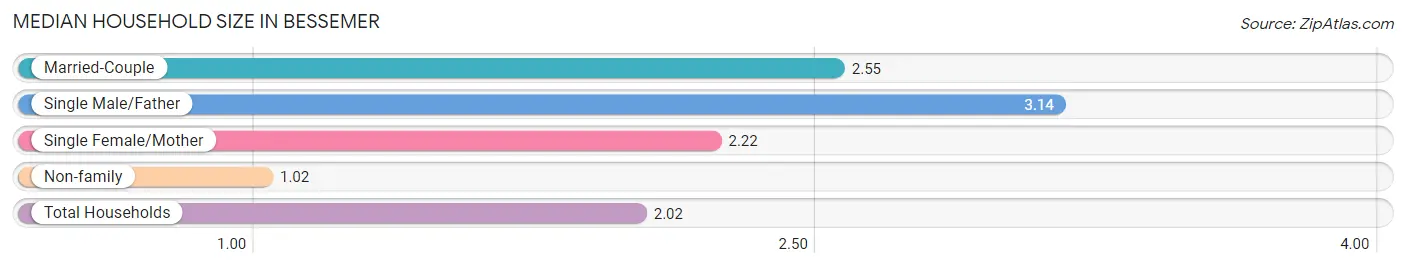
Median Household Size in Bessemer
The median household size in Bessemer is 2.02 persons per household, with single male/father households (49 | 5.9%) accounting for the largest median household size of 3.14 persons per household. non-family households (288 | 34.7%) represent the smallest median household size with 1.02 persons per household.
| Household Type | # Households | Household Size |
| Married-Couple | 408 (49.1%) | 2.55 |
| Single Male/Father | 49 (5.9%) | 3.14 |
| Single Female/Mother | 86 (10.3%) | 2.22 |
| Non-family | 288 (34.7%) | 1.02 |
| Total Households | 831 (100.0%) | 2.02 |
Household Size by Marriage Status in Bessemer
Out of a total of 831 households in Bessemer, 543 (65.3%) are family households, while 288 (34.7%) are nonfamily households. The most numerous type of family households are 2-person households, comprising 265, and the most common type of nonfamily households are 1-person households, comprising 278.
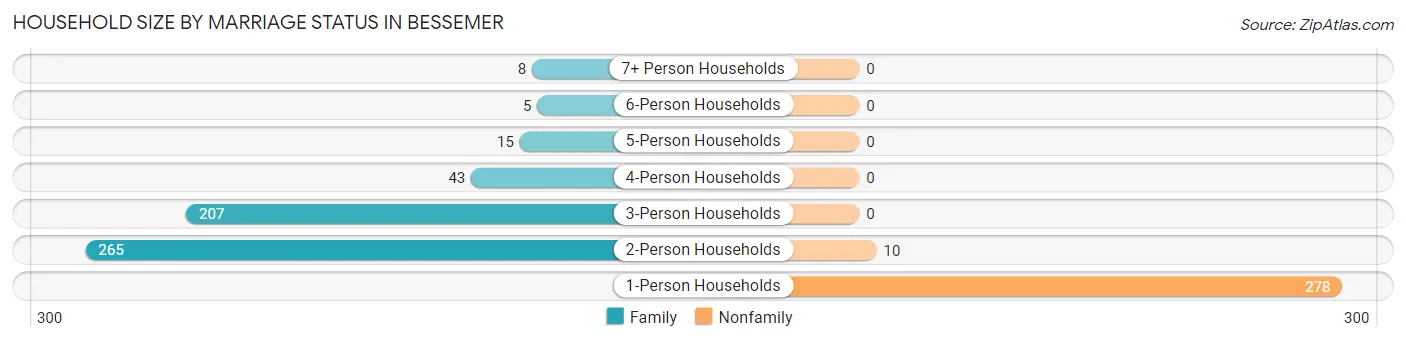
| Household Size | Family Households | Nonfamily Households |
| 1-Person Households | - | 278 (33.5%) |
| 2-Person Households | 265 (31.9%) | 10 (1.2%) |
| 3-Person Households | 207 (24.9%) | 0 (0.0%) |
| 4-Person Households | 43 (5.2%) | 0 (0.0%) |
| 5-Person Households | 15 (1.8%) | 0 (0.0%) |
| 6-Person Households | 5 (0.6%) | 0 (0.0%) |
| 7+ Person Households | 8 (1.0%) | 0 (0.0%) |
| Total | 543 (65.3%) | 288 (34.7%) |
Female Fertility in Bessemer
Fertility by Age in Bessemer
Average fertility rate in Bessemer is 45.0 births per 1,000 women. Women in the age bracket of 20 to 34 years have the highest fertility rate with 119.0 births per 1,000 women. Women in the age bracket of 20 to 34 years acount for 100.0% of all women with births.
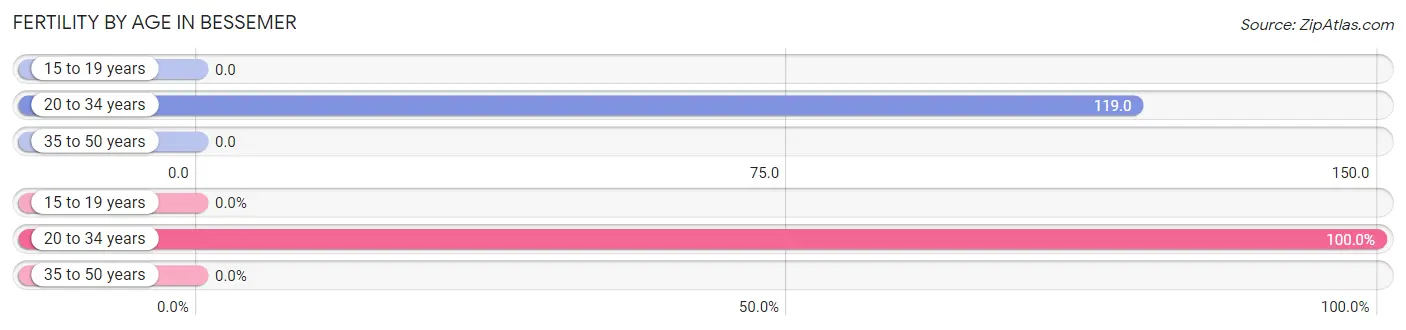
| Age Bracket | Women with Births | Births / 1,000 Women |
| 15 to 19 years | 0 (0.0%) | 0.0 |
| 20 to 34 years | 19 (100.0%) | 119.0 |
| 35 to 50 years | 0 (0.0%) | 0.0 |
| Total | 19 (100.0%) | 45.0 |
Fertility by Age by Marriage Status in Bessemer
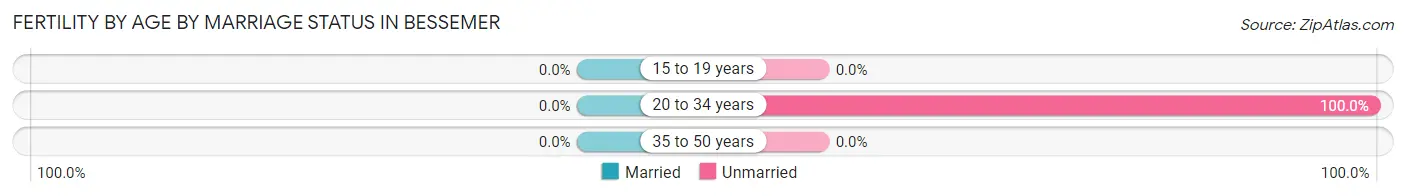
| Age Bracket | Married | Unmarried |
| 15 to 19 years | 0 (0.0%) | 0 (0.0%) |
| 20 to 34 years | 0 (0.0%) | 19 (100.0%) |
| 35 to 50 years | 0 (0.0%) | 0 (0.0%) |
| Total | 0 (0.0%) | 19 (100.0%) |
Fertility by Education in Bessemer
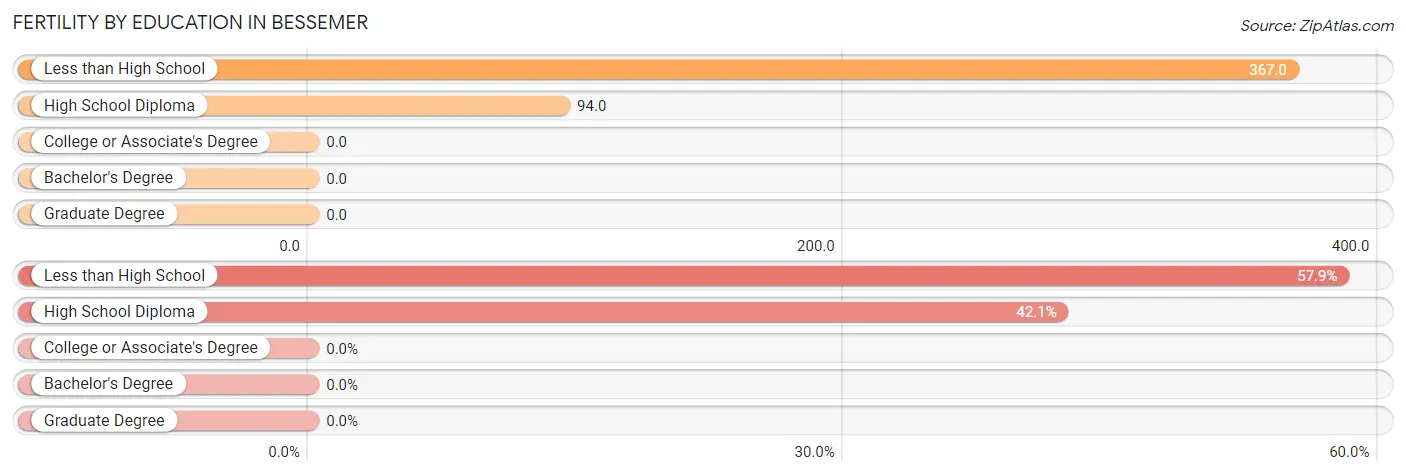
| Educational Attainment | Women with Births | Births / 1,000 Women |
| Less than High School | 11 (57.9%) | 367.0 |
| High School Diploma | 8 (42.1%) | 94.0 |
| College or Associate's Degree | 0 (0.0%) | 0.0 |
| Bachelor's Degree | 0 (0.0%) | 0.0 |
| Graduate Degree | 0 (0.0%) | 0.0 |
| Total | 19 (100.0%) | 45.0 |
Fertility by Education by Marriage Status in Bessemer
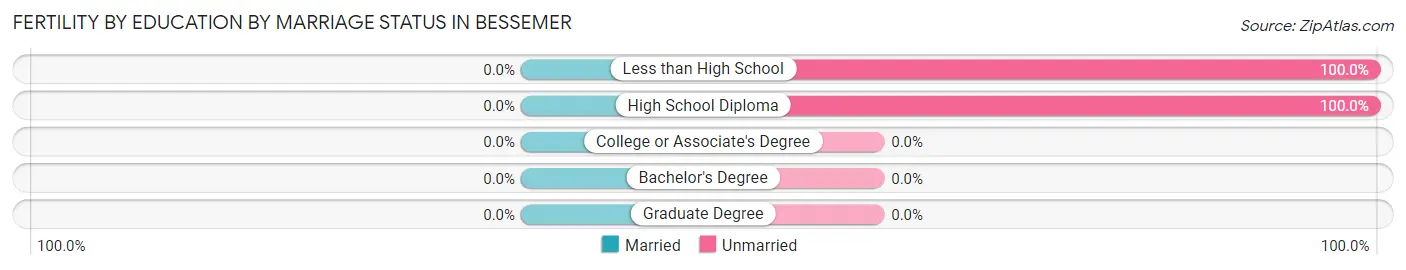
| Educational Attainment | Married | Unmarried |
| Less than High School | 0 (0.0%) | 11 (100.0%) |
| High School Diploma | 0 (0.0%) | 8 (100.0%) |
| College or Associate's Degree | 0 (0.0%) | 0 (0.0%) |
| Bachelor's Degree | 0 (0.0%) | 0 (0.0%) |
| Graduate Degree | 0 (0.0%) | 0 (0.0%) |
| Total | 0 (0.0%) | 19 (100.0%) |
Employment Characteristics in Bessemer
Employment by Class of Employer in Bessemer
Among the 839 employed individuals in Bessemer, private company employees (582 | 69.4%), not-for-profit organizations (75 | 8.9%), and federal government employees (74 | 8.8%) make up the most common classes of employment.
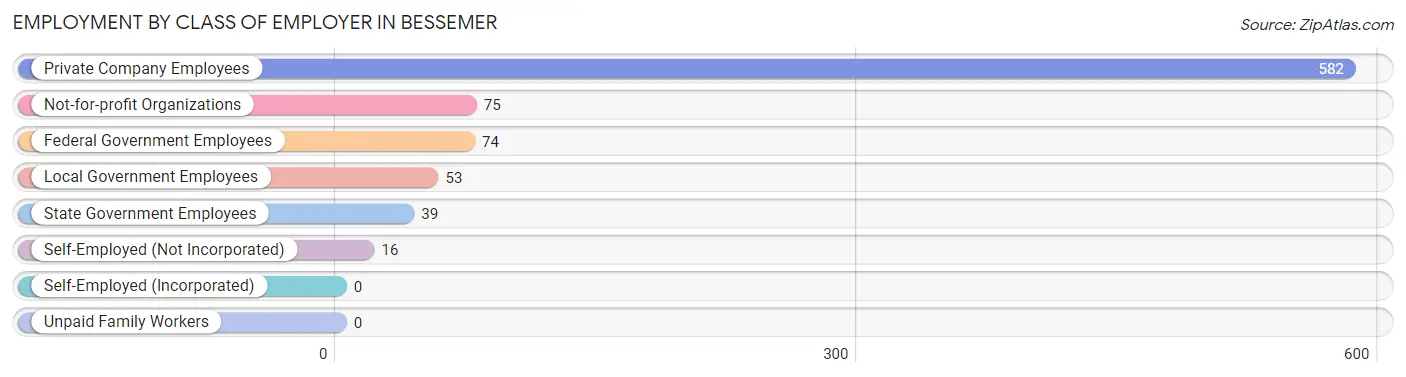
| Employer Class | # Employees | % Employees |
| Private Company Employees | 582 | 69.4% |
| Self-Employed (Incorporated) | 0 | 0.0% |
| Self-Employed (Not Incorporated) | 16 | 1.9% |
| Not-for-profit Organizations | 75 | 8.9% |
| Local Government Employees | 53 | 6.3% |
| State Government Employees | 39 | 4.6% |
| Federal Government Employees | 74 | 8.8% |
| Unpaid Family Workers | 0 | 0.0% |
| Total | 839 | 100.0% |
Employment Status by Age in Bessemer
According to the labor force statistics for Bessemer, out of the total population over 16 years of age (1,463), 60.3% or 882 individuals are in the labor force, with 4.4% or 39 of them unemployed. The age group with the highest labor force participation rate is 45 to 54 years, with 98.4% or 249 individuals in the labor force. Within the labor force, the 16 to 19 years age range has the highest percentage of unemployed individuals, with 17.4% or 8 of them being unemployed.
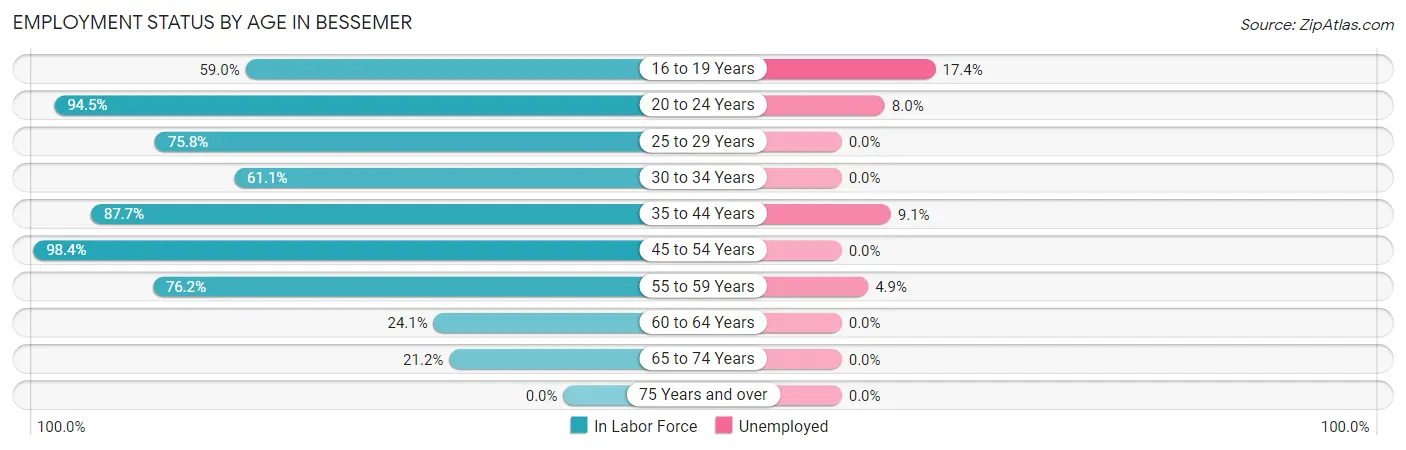
| Age Bracket | In Labor Force | Unemployed |
| 16 to 19 Years | 46 (59.0%) | 8 (17.4%) |
| 20 to 24 Years | 137 (94.5%) | 11 (8.0%) |
| 25 to 29 Years | 50 (75.8%) | 0 (0.0%) |
| 30 to 34 Years | 22 (61.1%) | 0 (0.0%) |
| 35 to 44 Years | 143 (87.7%) | 13 (9.1%) |
| 45 to 54 Years | 249 (98.4%) | 0 (0.0%) |
| 55 to 59 Years | 144 (76.2%) | 7 (4.9%) |
| 60 to 64 Years | 33 (24.1%) | 0 (0.0%) |
| 65 to 74 Years | 58 (21.2%) | 0 (0.0%) |
| 75 Years and over | 0 (0.0%) | 0 (0.0%) |
| Total | 882 (60.3%) | 39 (4.4%) |
Employment Status by Educational Attainment in Bessemer
According to labor force statistics for Bessemer, 75.9% of individuals (641) out of the total population between 25 and 64 years of age (844) are in the labor force, with 3.1% or 20 of them being unemployed. The group with the highest labor force participation rate are those with the educational attainment of college / associate degree, with 78.8% or 287 individuals in the labor force. Within the labor force, individuals with high school diploma education have the highest percentage of unemployment, with 9.9% or 20 of them being unemployed.
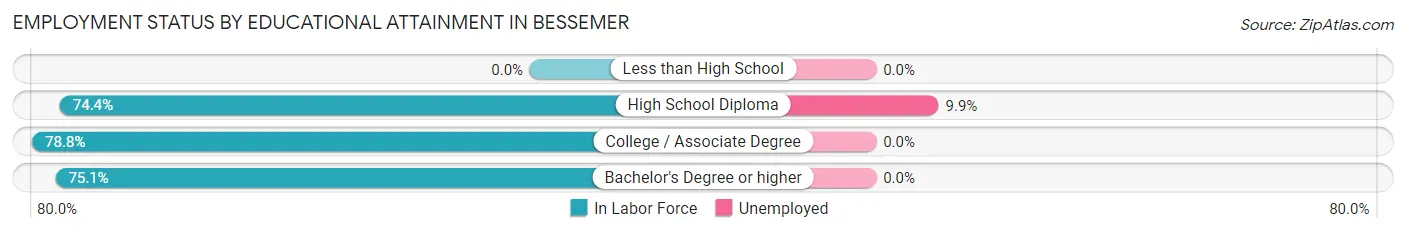
| Educational Attainment | In Labor Force | Unemployed |
| Less than High School | 0 (0.0%) | 0 (0.0%) |
| High School Diploma | 203 (74.4%) | 27 (9.9%) |
| College / Associate Degree | 287 (78.8%) | 0 (0.0%) |
| Bachelor's Degree or higher | 151 (75.1%) | 0 (0.0%) |
| Total | 641 (75.9%) | 26 (3.1%) |
Employment Occupations by Sex in Bessemer
Management, Business, Science and Arts Occupations
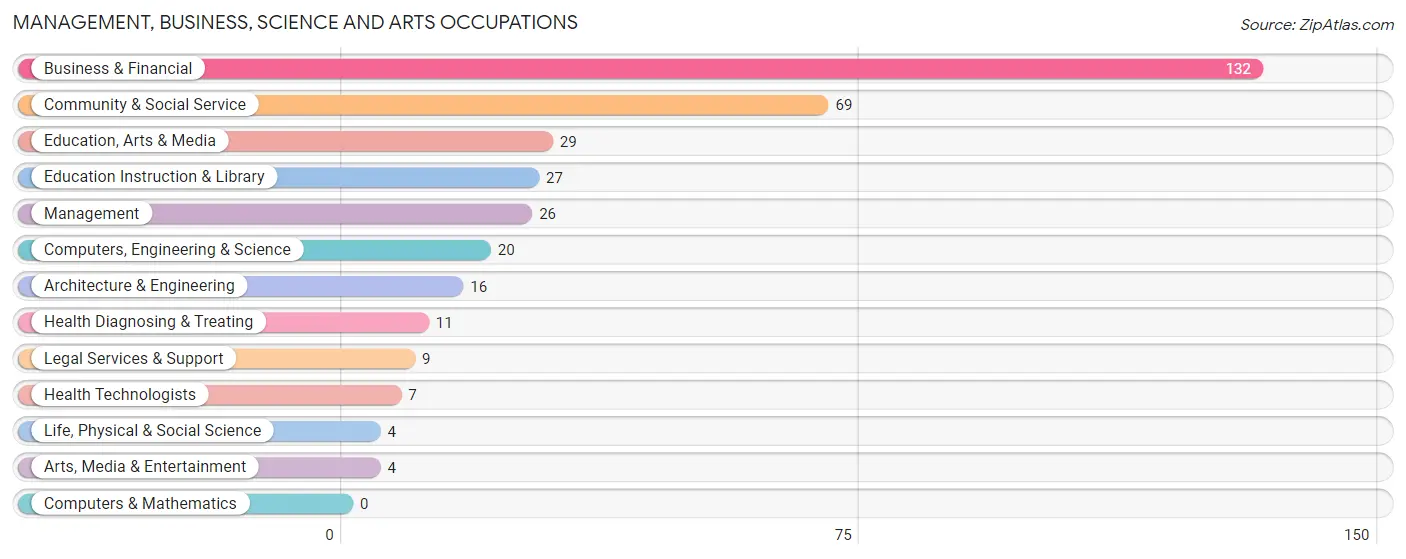
The most common Management, Business, Science and Arts occupations in Bessemer are Business & Financial (132 | 15.7%), Community & Social Service (69 | 8.2%), Education, Arts & Media (29 | 3.4%), Education Instruction & Library (27 | 3.2%), and Management (26 | 3.1%).
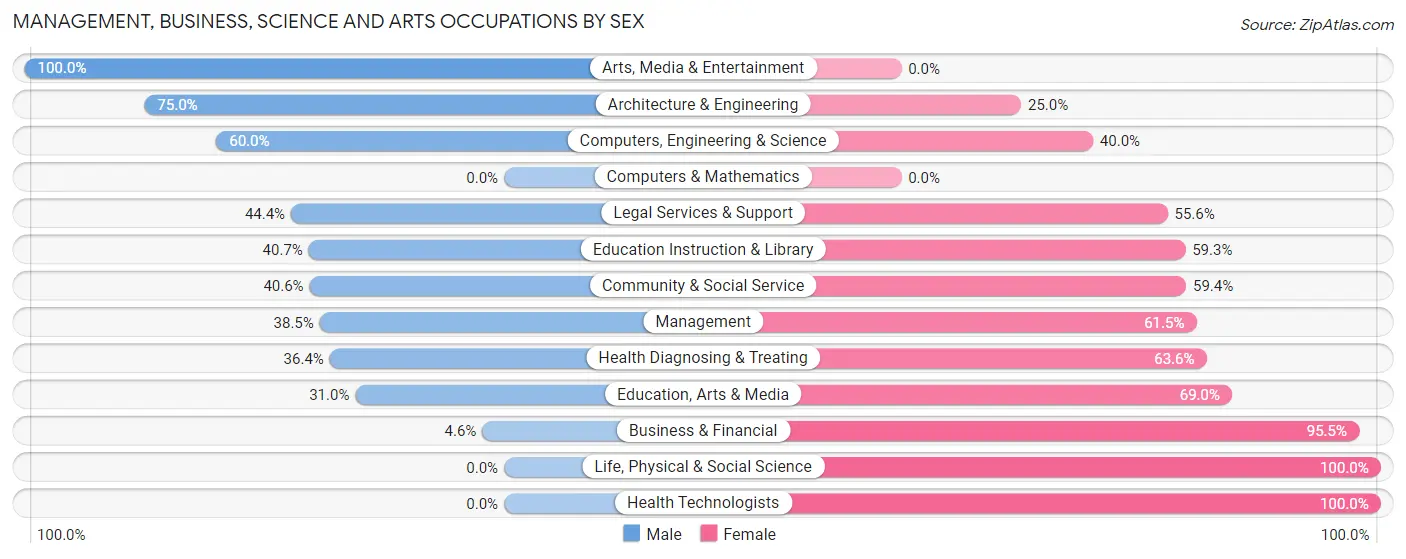
Management, Business, Science and Arts Occupations by Sex
Within the Management, Business, Science and Arts occupations in Bessemer, the most male-oriented occupations are Arts, Media & Entertainment (100.0%), Architecture & Engineering (75.0%), and Computers, Engineering & Science (60.0%), while the most female-oriented occupations are Life, Physical & Social Science (100.0%), Health Technologists (100.0%), and Business & Financial (95.5%).
| Occupation | Male | Female |
| Management | 10 (38.5%) | 16 (61.5%) |
| Business & Financial | 6 (4.5%) | 126 (95.5%) |
| Computers, Engineering & Science | 12 (60.0%) | 8 (40.0%) |
| Computers & Mathematics | 0 (0.0%) | 0 (0.0%) |
| Architecture & Engineering | 12 (75.0%) | 4 (25.0%) |
| Life, Physical & Social Science | 0 (0.0%) | 4 (100.0%) |
| Community & Social Service | 28 (40.6%) | 41 (59.4%) |
| Education, Arts & Media | 9 (31.0%) | 20 (69.0%) |
| Legal Services & Support | 4 (44.4%) | 5 (55.6%) |
| Education Instruction & Library | 11 (40.7%) | 16 (59.3%) |
| Arts, Media & Entertainment | 4 (100.0%) | 0 (0.0%) |
| Health Diagnosing & Treating | 4 (36.4%) | 7 (63.6%) |
| Health Technologists | 0 (0.0%) | 7 (100.0%) |
| Total (Category) | 60 (23.3%) | 198 (76.7%) |
| Total (Overall) | 343 (40.7%) | 500 (59.3%) |
Services Occupations
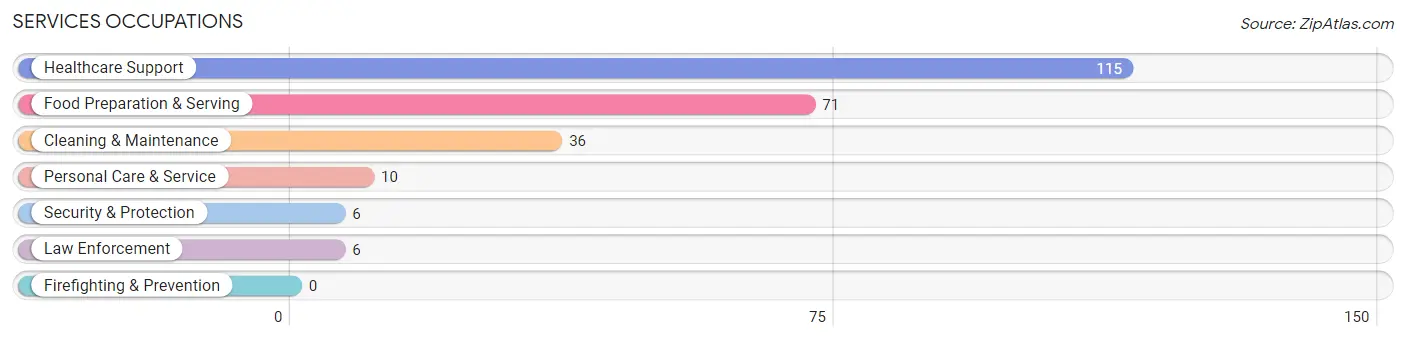
The most common Services occupations in Bessemer are Healthcare Support (115 | 13.6%), Food Preparation & Serving (71 | 8.4%), Cleaning & Maintenance (36 | 4.3%), Personal Care & Service (10 | 1.2%), and Security & Protection (6 | 0.7%).
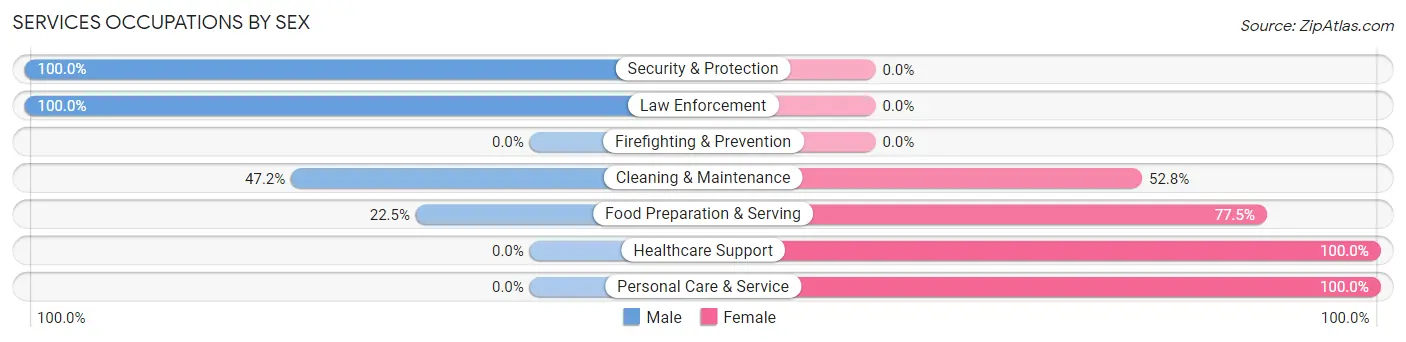
Services Occupations by Sex
Within the Services occupations in Bessemer, the most male-oriented occupations are Security & Protection (100.0%), Law Enforcement (100.0%), and Cleaning & Maintenance (47.2%), while the most female-oriented occupations are Healthcare Support (100.0%), Personal Care & Service (100.0%), and Food Preparation & Serving (77.5%).
| Occupation | Male | Female |
| Healthcare Support | 0 (0.0%) | 115 (100.0%) |
| Security & Protection | 6 (100.0%) | 0 (0.0%) |
| Firefighting & Prevention | 0 (0.0%) | 0 (0.0%) |
| Law Enforcement | 6 (100.0%) | 0 (0.0%) |
| Food Preparation & Serving | 16 (22.5%) | 55 (77.5%) |
| Cleaning & Maintenance | 17 (47.2%) | 19 (52.8%) |
| Personal Care & Service | 0 (0.0%) | 10 (100.0%) |
| Total (Category) | 39 (16.4%) | 199 (83.6%) |
| Total (Overall) | 343 (40.7%) | 500 (59.3%) |
Sales and Office Occupations
The most common Sales and Office occupations in Bessemer are Office & Administration (115 | 13.6%), and Sales & Related (86 | 10.2%).
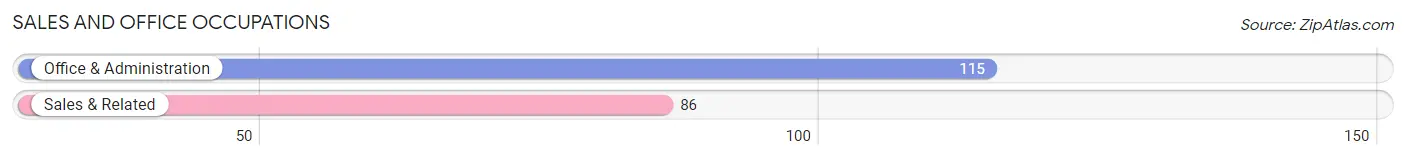
Sales and Office Occupations by Sex
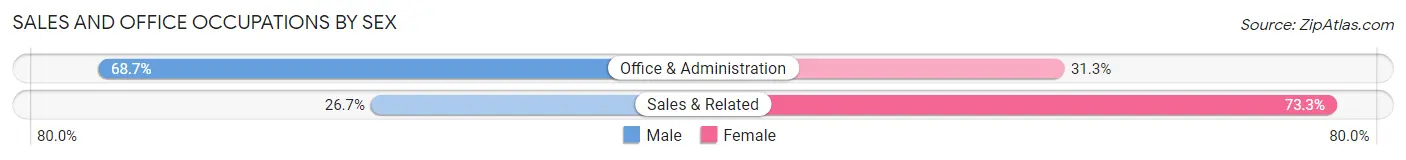
| Occupation | Male | Female |
| Sales & Related | 23 (26.7%) | 63 (73.3%) |
| Office & Administration | 79 (68.7%) | 36 (31.3%) |
| Total (Category) | 102 (50.7%) | 99 (49.2%) |
| Total (Overall) | 343 (40.7%) | 500 (59.3%) |
Natural Resources, Construction and Maintenance Occupations
The most common Natural Resources, Construction and Maintenance occupations in Bessemer are Construction & Extraction (40 | 4.7%), and Installation, Maintenance & Repair (6 | 0.7%).
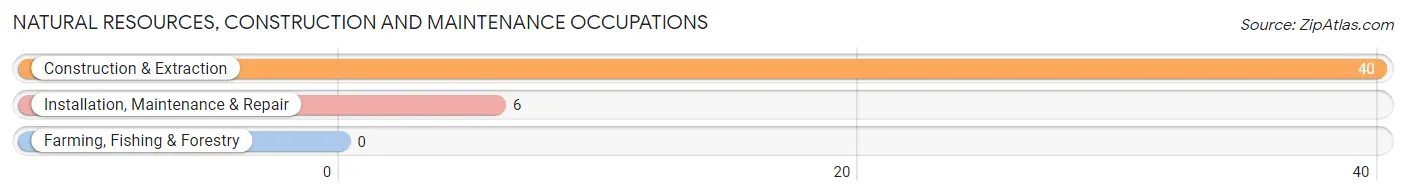
Natural Resources, Construction and Maintenance Occupations by Sex
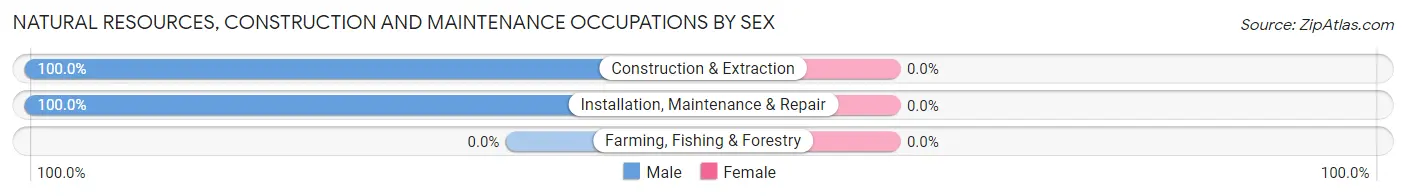
| Occupation | Male | Female |
| Farming, Fishing & Forestry | 0 (0.0%) | 0 (0.0%) |
| Construction & Extraction | 40 (100.0%) | 0 (0.0%) |
| Installation, Maintenance & Repair | 6 (100.0%) | 0 (0.0%) |
| Total (Category) | 46 (100.0%) | 0 (0.0%) |
| Total (Overall) | 343 (40.7%) | 500 (59.3%) |
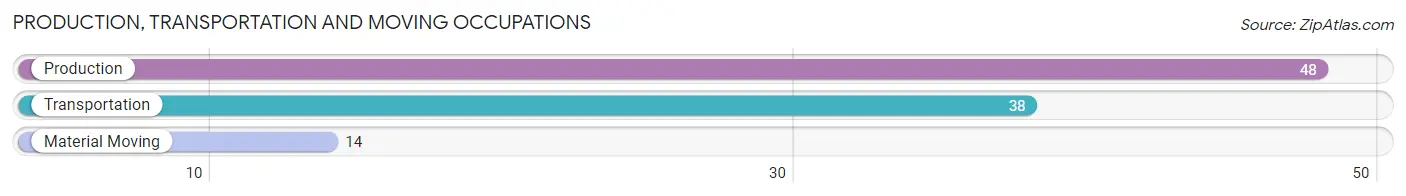
Production, Transportation and Moving Occupations
The most common Production, Transportation and Moving occupations in Bessemer are Production (48 | 5.7%), Transportation (38 | 4.5%), and Material Moving (14 | 1.7%).
Production, Transportation and Moving Occupations by Sex
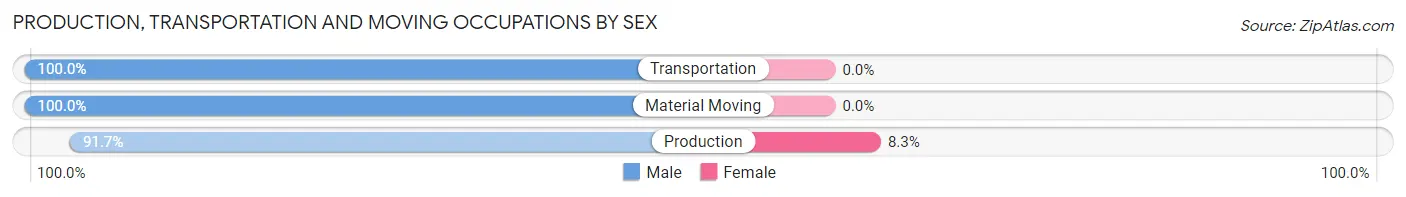
| Occupation | Male | Female |
| Production | 44 (91.7%) | 4 (8.3%) |
| Transportation | 38 (100.0%) | 0 (0.0%) |
| Material Moving | 14 (100.0%) | 0 (0.0%) |
| Total (Category) | 96 (96.0%) | 4 (4.0%) |
| Total (Overall) | 343 (40.7%) | 500 (59.3%) |
Employment Industries by Sex in Bessemer
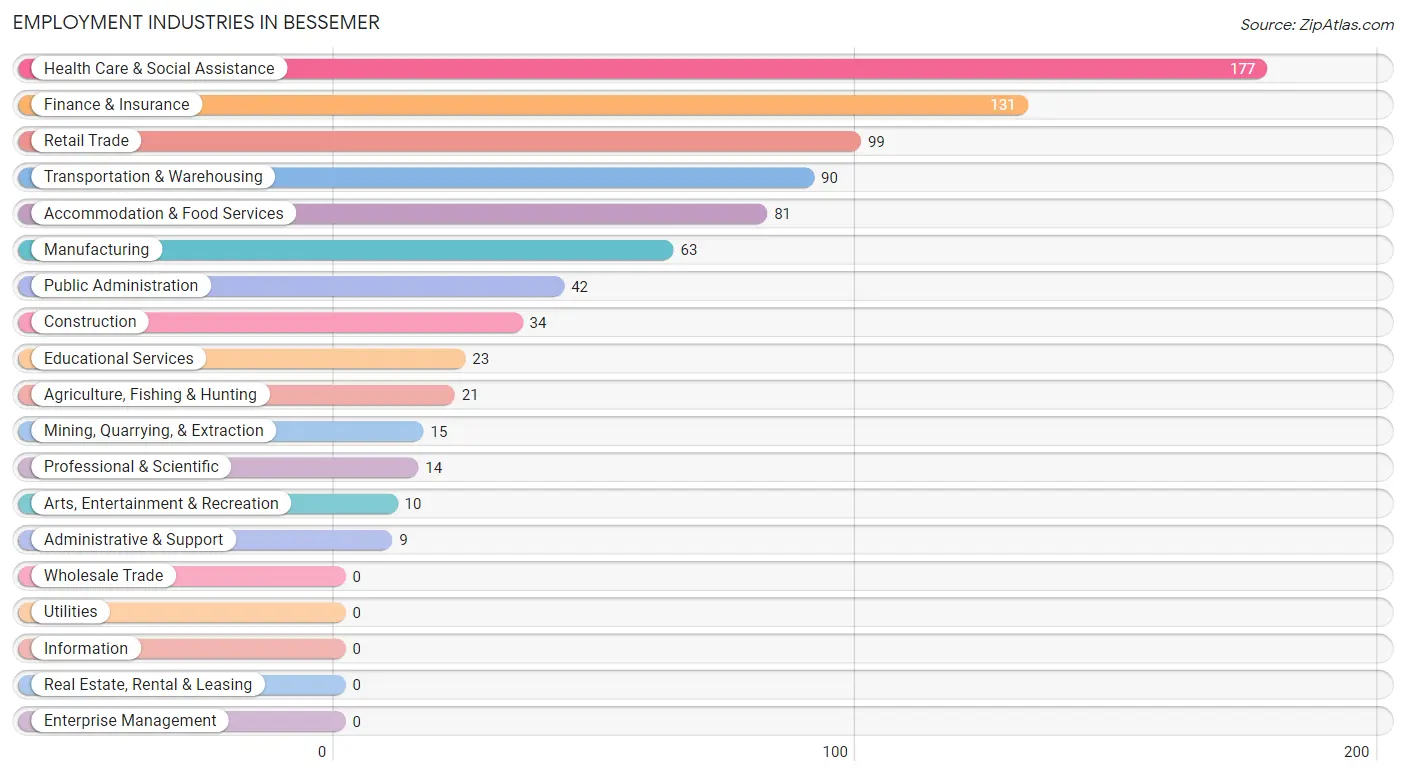
Employment Industries in Bessemer
The major employment industries in Bessemer include Health Care & Social Assistance (177 | 21.0%), Finance & Insurance (131 | 15.5%), Retail Trade (99 | 11.7%), Transportation & Warehousing (90 | 10.7%), and Accommodation & Food Services (81 | 9.6%).
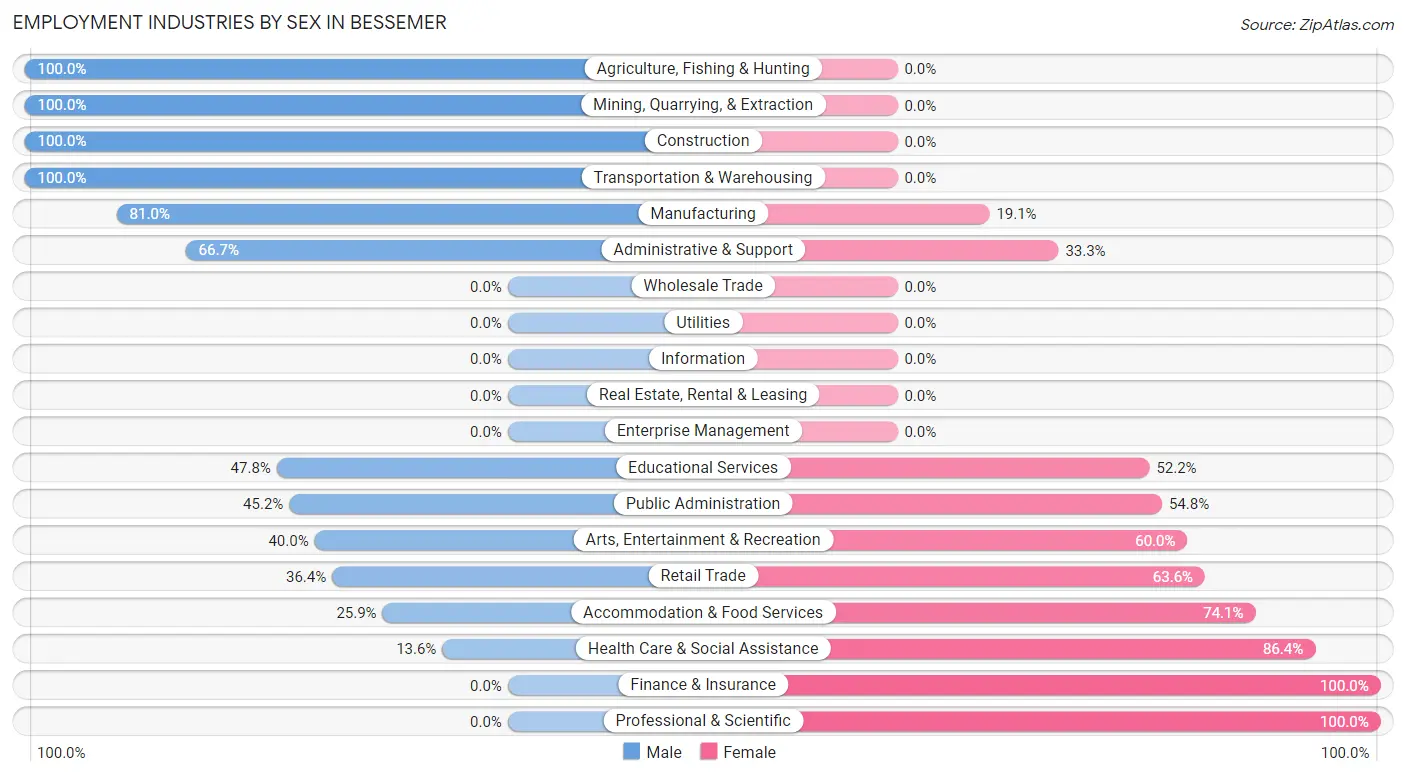
Employment Industries by Sex in Bessemer
The Bessemer industries that see more men than women are Agriculture, Fishing & Hunting (100.0%), Mining, Quarrying, & Extraction (100.0%), and Construction (100.0%), whereas the industries that tend to have a higher number of women are Finance & Insurance (100.0%), Professional & Scientific (100.0%), and Health Care & Social Assistance (86.4%).
| Industry | Male | Female |
| Agriculture, Fishing & Hunting | 21 (100.0%) | 0 (0.0%) |
| Mining, Quarrying, & Extraction | 15 (100.0%) | 0 (0.0%) |
| Construction | 34 (100.0%) | 0 (0.0%) |
| Manufacturing | 51 (80.9%) | 12 (19.1%) |
| Wholesale Trade | 0 (0.0%) | 0 (0.0%) |
| Retail Trade | 36 (36.4%) | 63 (63.6%) |
| Transportation & Warehousing | 90 (100.0%) | 0 (0.0%) |
| Utilities | 0 (0.0%) | 0 (0.0%) |
| Information | 0 (0.0%) | 0 (0.0%) |
| Finance & Insurance | 0 (0.0%) | 131 (100.0%) |
| Real Estate, Rental & Leasing | 0 (0.0%) | 0 (0.0%) |
| Professional & Scientific | 0 (0.0%) | 14 (100.0%) |
| Enterprise Management | 0 (0.0%) | 0 (0.0%) |
| Administrative & Support | 6 (66.7%) | 3 (33.3%) |
| Educational Services | 11 (47.8%) | 12 (52.2%) |
| Health Care & Social Assistance | 24 (13.6%) | 153 (86.4%) |
| Arts, Entertainment & Recreation | 4 (40.0%) | 6 (60.0%) |
| Accommodation & Food Services | 21 (25.9%) | 60 (74.1%) |
| Public Administration | 19 (45.2%) | 23 (54.8%) |
| Total | 343 (40.7%) | 500 (59.3%) |
Education in Bessemer
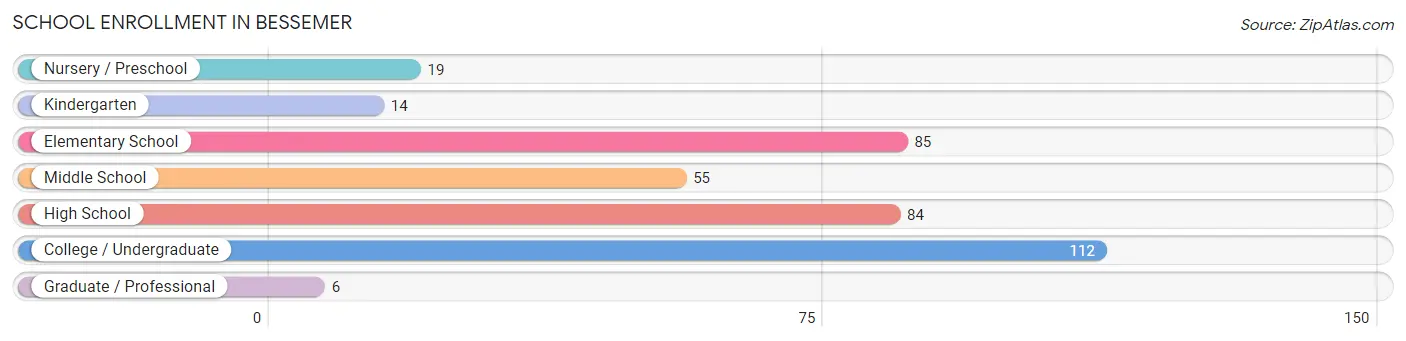
School Enrollment in Bessemer
The most common levels of schooling among the 375 students in Bessemer are college / undergraduate (112 | 29.9%), elementary school (85 | 22.7%), and high school (84 | 22.4%).
| School Level | # Students | % Students |
| Nursery / Preschool | 19 | 5.1% |
| Kindergarten | 14 | 3.7% |
| Elementary School | 85 | 22.7% |
| Middle School | 55 | 14.7% |
| High School | 84 | 22.4% |
| College / Undergraduate | 112 | 29.9% |
| Graduate / Professional | 6 | 1.6% |
| Total | 375 | 100.0% |
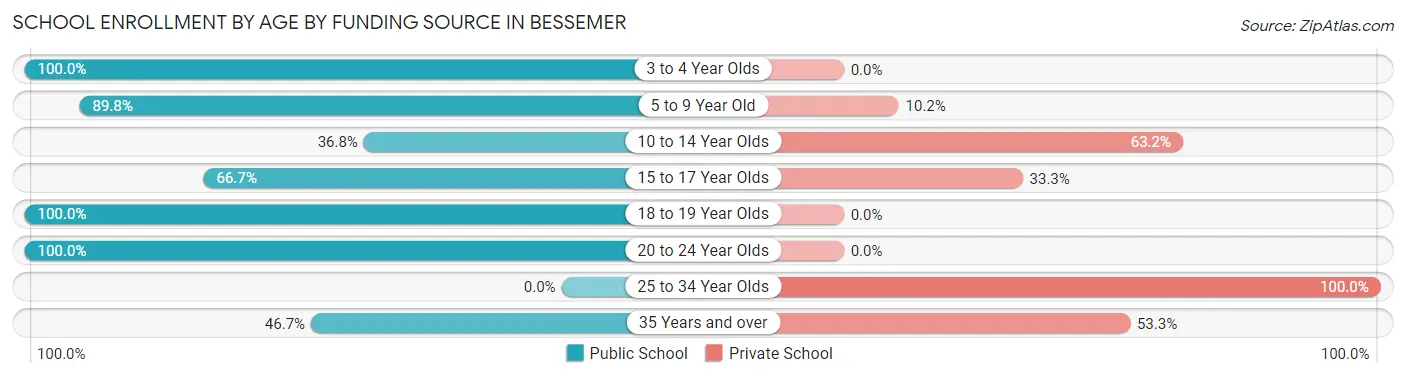
School Enrollment by Age by Funding Source in Bessemer
Out of a total of 375 students who are enrolled in schools in Bessemer, 91 (24.3%) attend a private institution, while the remaining 284 (75.7%) are enrolled in public schools. The age group of 25 to 34 year olds has the highest likelihood of being enrolled in private schools, with 6 (100.0% in the age bracket) enrolled. Conversely, the age group of 3 to 4 year olds has the lowest likelihood of being enrolled in a private school, with 19 (100.0% in the age bracket) attending a public institution.
| Age Bracket | Public School | Private School |
| 3 to 4 Year Olds | 19 (100.0%) | 0 (0.0%) |
| 5 to 9 Year Old | 79 (89.8%) | 9 (10.2%) |
| 10 to 14 Year Olds | 28 (36.8%) | 48 (63.2%) |
| 15 to 17 Year Olds | 40 (66.7%) | 20 (33.3%) |
| 18 to 19 Year Olds | 18 (100.0%) | 0 (0.0%) |
| 20 to 24 Year Olds | 93 (100.0%) | 0 (0.0%) |
| 25 to 34 Year Olds | 0 (0.0%) | 6 (100.0%) |
| 35 Years and over | 7 (46.7%) | 8 (53.3%) |
| Total | 284 (75.7%) | 91 (24.3%) |
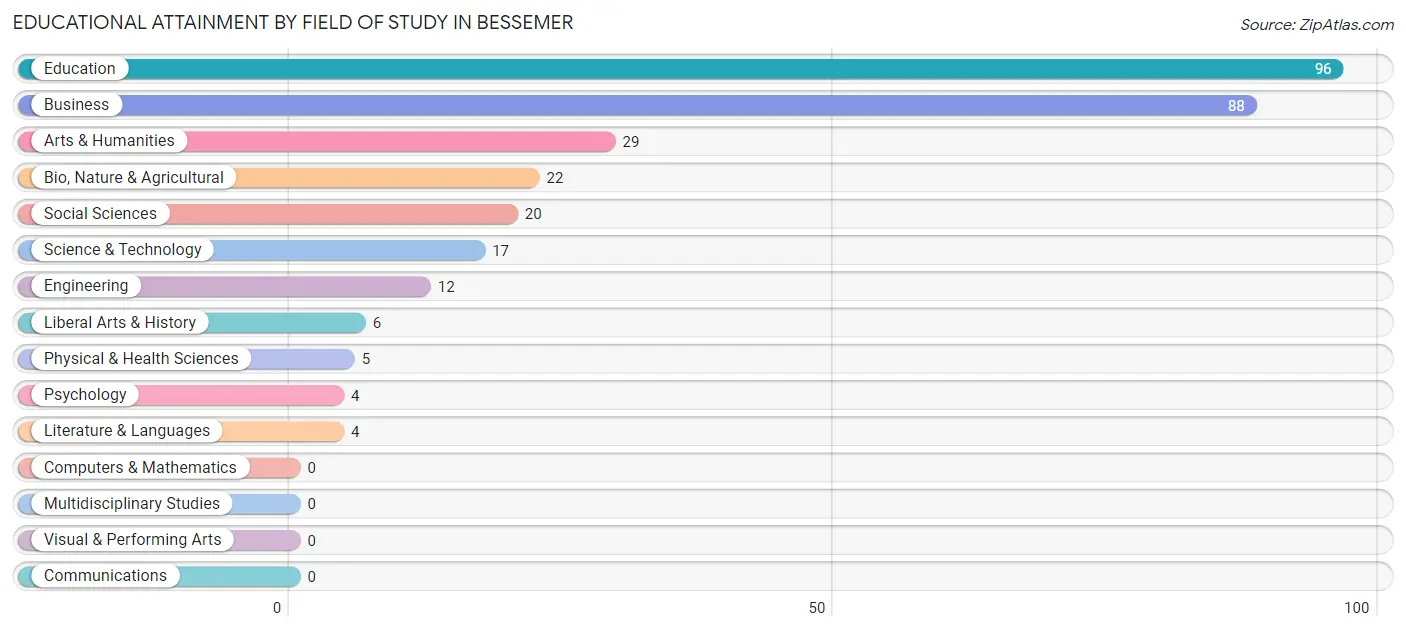
Educational Attainment by Field of Study in Bessemer
Education (96 | 31.7%), business (88 | 29.0%), arts & humanities (29 | 9.6%), bio, nature & agricultural (22 | 7.3%), and social sciences (20 | 6.6%) are the most common fields of study among 303 individuals in Bessemer who have obtained a bachelor's degree or higher.
| Field of Study | # Graduates | % Graduates |
| Computers & Mathematics | 0 | 0.0% |
| Bio, Nature & Agricultural | 22 | 7.3% |
| Physical & Health Sciences | 5 | 1.7% |
| Psychology | 4 | 1.3% |
| Social Sciences | 20 | 6.6% |
| Engineering | 12 | 4.0% |
| Multidisciplinary Studies | 0 | 0.0% |
| Science & Technology | 17 | 5.6% |
| Business | 88 | 29.0% |
| Education | 96 | 31.7% |
| Literature & Languages | 4 | 1.3% |
| Liberal Arts & History | 6 | 2.0% |
| Visual & Performing Arts | 0 | 0.0% |
| Communications | 0 | 0.0% |
| Arts & Humanities | 29 | 9.6% |
| Total | 303 | 100.0% |
Transportation & Commute in Bessemer
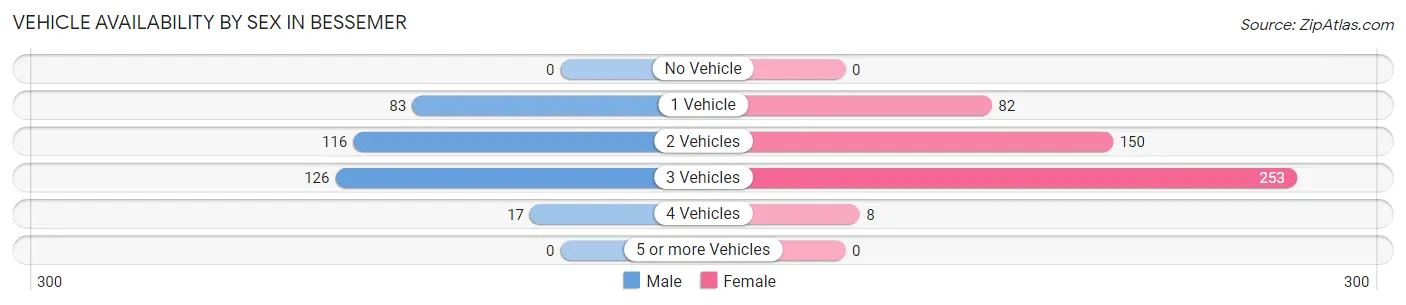
Vehicle Availability by Sex in Bessemer
The most prevalent vehicle ownership categories in Bessemer are males with 3 vehicles (126, accounting for 36.8%) and females with 3 vehicles (253, making up 25.6%).
| Vehicles Available | Male | Female |
| No Vehicle | 0 (0.0%) | 0 (0.0%) |
| 1 Vehicle | 83 (24.3%) | 82 (16.6%) |
| 2 Vehicles | 116 (33.9%) | 150 (30.4%) |
| 3 Vehicles | 126 (36.8%) | 253 (51.3%) |
| 4 Vehicles | 17 (5.0%) | 8 (1.6%) |
| 5 or more Vehicles | 0 (0.0%) | 0 (0.0%) |
| Total | 342 (100.0%) | 493 (100.0%) |
Commute Time in Bessemer
The most frequently occuring commute durations in Bessemer are less than 5 minutes (202 commuters, 28.4%), 10 to 14 minutes (161 commuters, 22.6%), and 15 to 19 minutes (139 commuters, 19.6%).
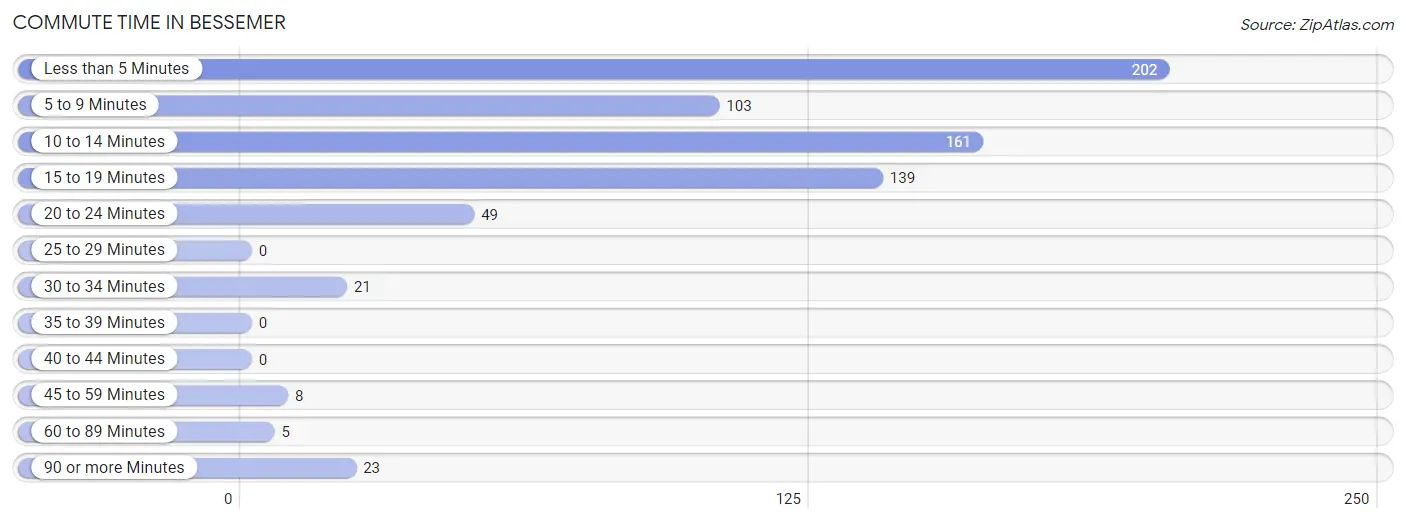
| Commute Time | # Commuters | % Commuters |
| Less than 5 Minutes | 202 | 28.4% |
| 5 to 9 Minutes | 103 | 14.5% |
| 10 to 14 Minutes | 161 | 22.6% |
| 15 to 19 Minutes | 139 | 19.6% |
| 20 to 24 Minutes | 49 | 6.9% |
| 25 to 29 Minutes | 0 | 0.0% |
| 30 to 34 Minutes | 21 | 2.9% |
| 35 to 39 Minutes | 0 | 0.0% |
| 40 to 44 Minutes | 0 | 0.0% |
| 45 to 59 Minutes | 8 | 1.1% |
| 60 to 89 Minutes | 5 | 0.7% |
| 90 or more Minutes | 23 | 3.2% |
Commute Time by Sex in Bessemer
The most common commute times in Bessemer are 10 to 14 minutes (99 commuters, 30.7%) for males and less than 5 minutes (160 commuters, 41.1%) for females.
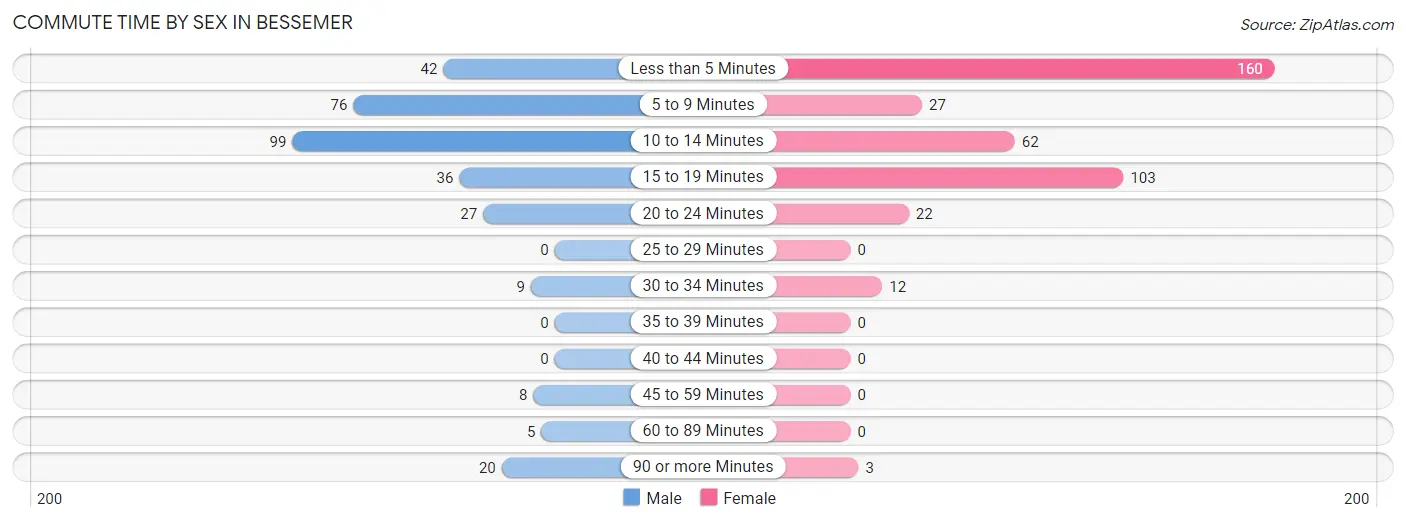
| Commute Time | Male | Female |
| Less than 5 Minutes | 42 (13.0%) | 160 (41.1%) |
| 5 to 9 Minutes | 76 (23.6%) | 27 (6.9%) |
| 10 to 14 Minutes | 99 (30.7%) | 62 (15.9%) |
| 15 to 19 Minutes | 36 (11.2%) | 103 (26.5%) |
| 20 to 24 Minutes | 27 (8.4%) | 22 (5.7%) |
| 25 to 29 Minutes | 0 (0.0%) | 0 (0.0%) |
| 30 to 34 Minutes | 9 (2.8%) | 12 (3.1%) |
| 35 to 39 Minutes | 0 (0.0%) | 0 (0.0%) |
| 40 to 44 Minutes | 0 (0.0%) | 0 (0.0%) |
| 45 to 59 Minutes | 8 (2.5%) | 0 (0.0%) |
| 60 to 89 Minutes | 5 (1.5%) | 0 (0.0%) |
| 90 or more Minutes | 20 (6.2%) | 3 (0.8%) |
Time of Departure to Work by Sex in Bessemer
The most frequent times of departure to work in Bessemer are 6:30 AM to 6:59 AM (62, 19.3%) for males and 7:30 AM to 7:59 AM (143, 36.8%) for females.
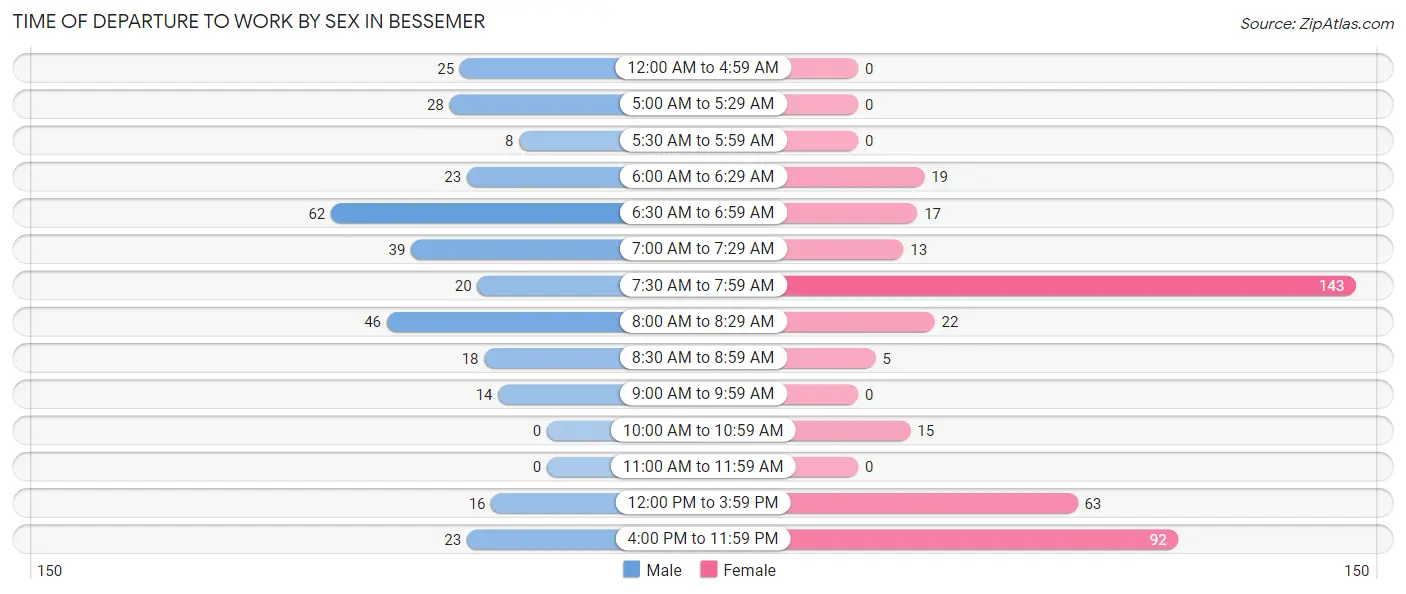
| Time of Departure | Male | Female |
| 12:00 AM to 4:59 AM | 25 (7.8%) | 0 (0.0%) |
| 5:00 AM to 5:29 AM | 28 (8.7%) | 0 (0.0%) |
| 5:30 AM to 5:59 AM | 8 (2.5%) | 0 (0.0%) |
| 6:00 AM to 6:29 AM | 23 (7.1%) | 19 (4.9%) |
| 6:30 AM to 6:59 AM | 62 (19.3%) | 17 (4.4%) |
| 7:00 AM to 7:29 AM | 39 (12.1%) | 13 (3.3%) |
| 7:30 AM to 7:59 AM | 20 (6.2%) | 143 (36.8%) |
| 8:00 AM to 8:29 AM | 46 (14.3%) | 22 (5.7%) |
| 8:30 AM to 8:59 AM | 18 (5.6%) | 5 (1.3%) |
| 9:00 AM to 9:59 AM | 14 (4.3%) | 0 (0.0%) |
| 10:00 AM to 10:59 AM | 0 (0.0%) | 15 (3.9%) |
| 11:00 AM to 11:59 AM | 0 (0.0%) | 0 (0.0%) |
| 12:00 PM to 3:59 PM | 16 (5.0%) | 63 (16.2%) |
| 4:00 PM to 11:59 PM | 23 (7.1%) | 92 (23.6%) |
| Total | 322 (100.0%) | 389 (100.0%) |
Housing Occupancy in Bessemer
Occupancy by Ownership in Bessemer
Of the total 831 dwellings in Bessemer, owner-occupied units account for 645 (77.6%), while renter-occupied units make up 186 (22.4%).
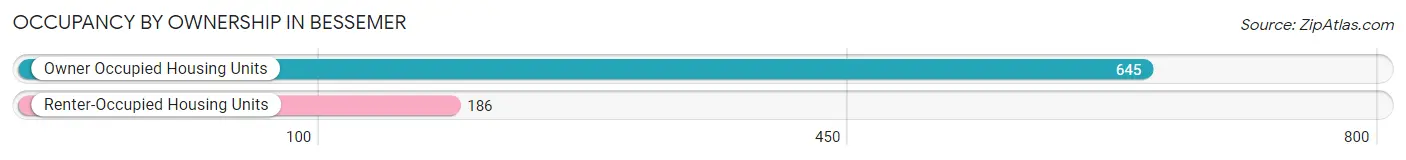
| Occupancy | # Housing Units | % Housing Units |
| Owner Occupied Housing Units | 645 | 77.6% |
| Renter-Occupied Housing Units | 186 | 22.4% |
| Total Occupied Housing Units | 831 | 100.0% |
Occupancy by Household Size in Bessemer
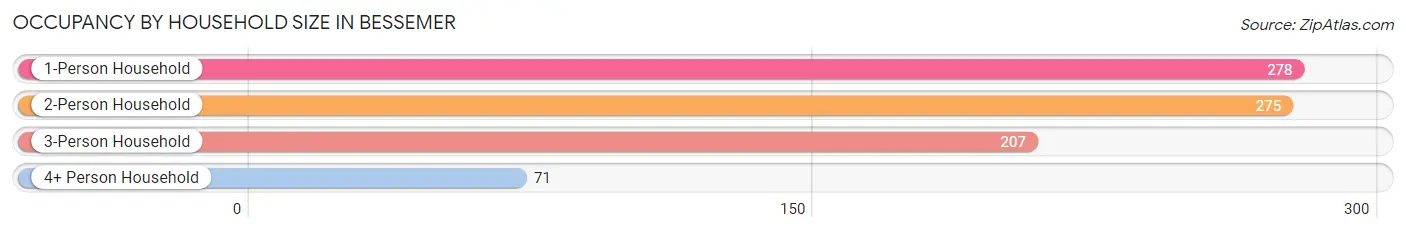
| Household Size | # Housing Units | % Housing Units |
| 1-Person Household | 278 | 33.5% |
| 2-Person Household | 275 | 33.1% |
| 3-Person Household | 207 | 24.9% |
| 4+ Person Household | 71 | 8.5% |
| Total Housing Units | 831 | 100.0% |
Occupancy by Ownership by Household Size in Bessemer
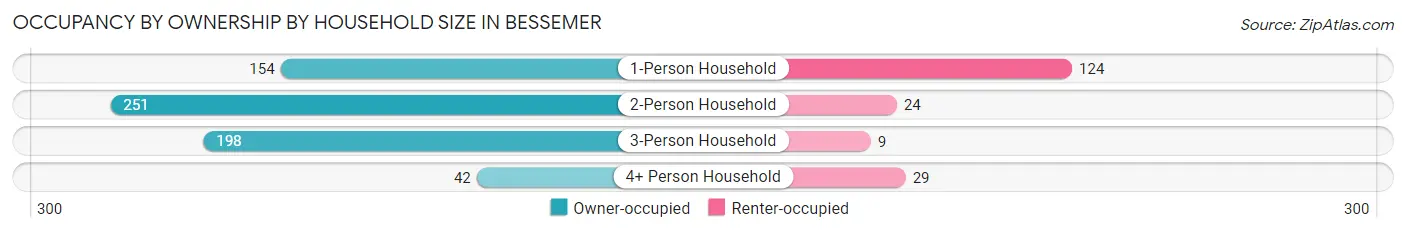
| Household Size | Owner-occupied | Renter-occupied |
| 1-Person Household | 154 (55.4%) | 124 (44.6%) |
| 2-Person Household | 251 (91.3%) | 24 (8.7%) |
| 3-Person Household | 198 (95.7%) | 9 (4.3%) |
| 4+ Person Household | 42 (59.2%) | 29 (40.8%) |
| Total Housing Units | 645 (77.6%) | 186 (22.4%) |
Occupancy by Educational Attainment in Bessemer
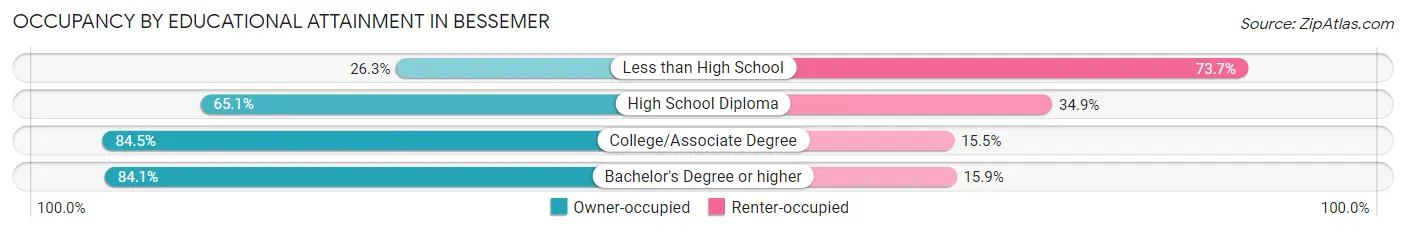
| Household Size | Owner-occupied | Renter-occupied |
| Less than High School | 5 (26.3%) | 14 (73.7%) |
| High School Diploma | 153 (65.1%) | 82 (34.9%) |
| College/Associate Degree | 355 (84.5%) | 65 (15.5%) |
| Bachelor's Degree or higher | 132 (84.1%) | 25 (15.9%) |
Occupancy by Age of Householder in Bessemer
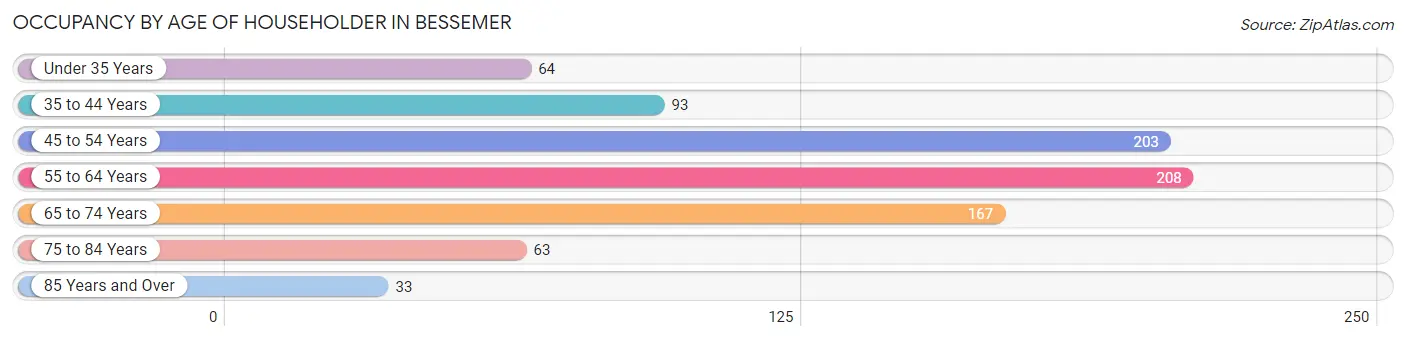
| Age Bracket | # Households | % Households |
| Under 35 Years | 64 | 7.7% |
| 35 to 44 Years | 93 | 11.2% |
| 45 to 54 Years | 203 | 24.4% |
| 55 to 64 Years | 208 | 25.0% |
| 65 to 74 Years | 167 | 20.1% |
| 75 to 84 Years | 63 | 7.6% |
| 85 Years and Over | 33 | 4.0% |
| Total | 831 | 100.0% |
Housing Finances in Bessemer
Median Income by Occupancy in Bessemer
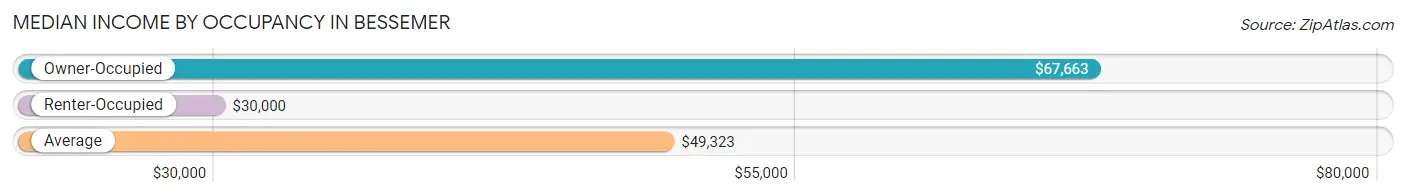
| Occupancy Type | # Households | Median Income |
| Owner-Occupied | 645 (77.6%) | $67,663 |
| Renter-Occupied | 186 (22.4%) | $30,000 |
| Average | 831 (100.0%) | $49,323 |
Occupancy by Householder Income Bracket in Bessemer
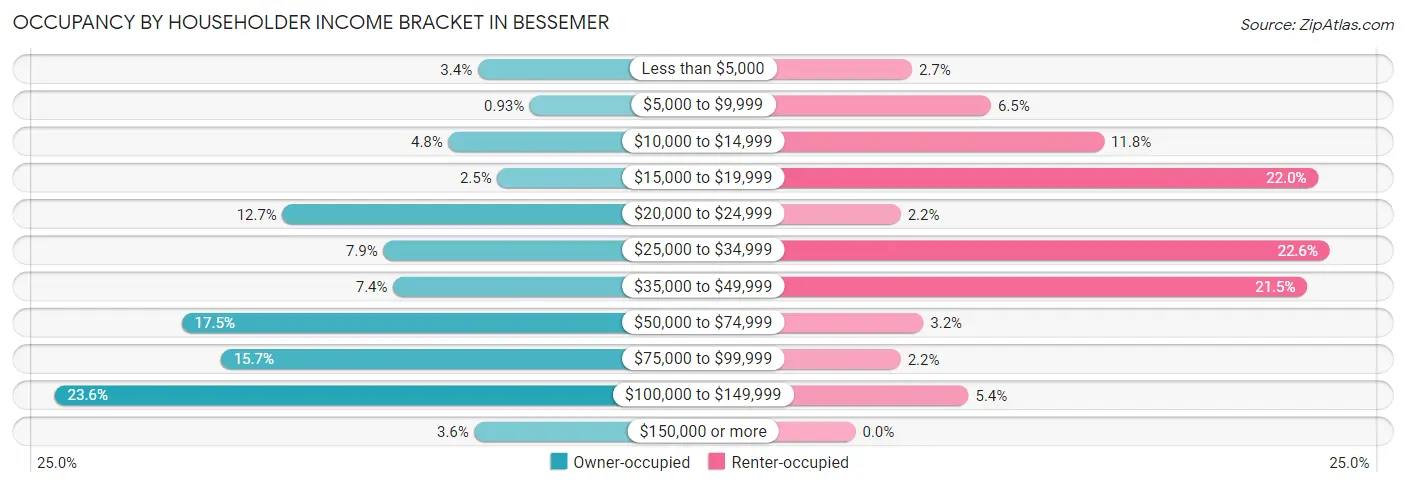
| Income Bracket | Owner-occupied | Renter-occupied |
| Less than $5,000 | 22 (3.4%) | 5 (2.7%) |
| $5,000 to $9,999 | 6 (0.9%) | 12 (6.5%) |
| $10,000 to $14,999 | 31 (4.8%) | 22 (11.8%) |
| $15,000 to $19,999 | 16 (2.5%) | 41 (22.0%) |
| $20,000 to $24,999 | 82 (12.7%) | 4 (2.1%) |
| $25,000 to $34,999 | 51 (7.9%) | 42 (22.6%) |
| $35,000 to $49,999 | 48 (7.4%) | 40 (21.5%) |
| $50,000 to $74,999 | 113 (17.5%) | 6 (3.2%) |
| $75,000 to $99,999 | 101 (15.7%) | 4 (2.1%) |
| $100,000 to $149,999 | 152 (23.6%) | 10 (5.4%) |
| $150,000 or more | 23 (3.6%) | 0 (0.0%) |
| Total | 645 (100.0%) | 186 (100.0%) |
Monthly Housing Cost Tiers in Bessemer
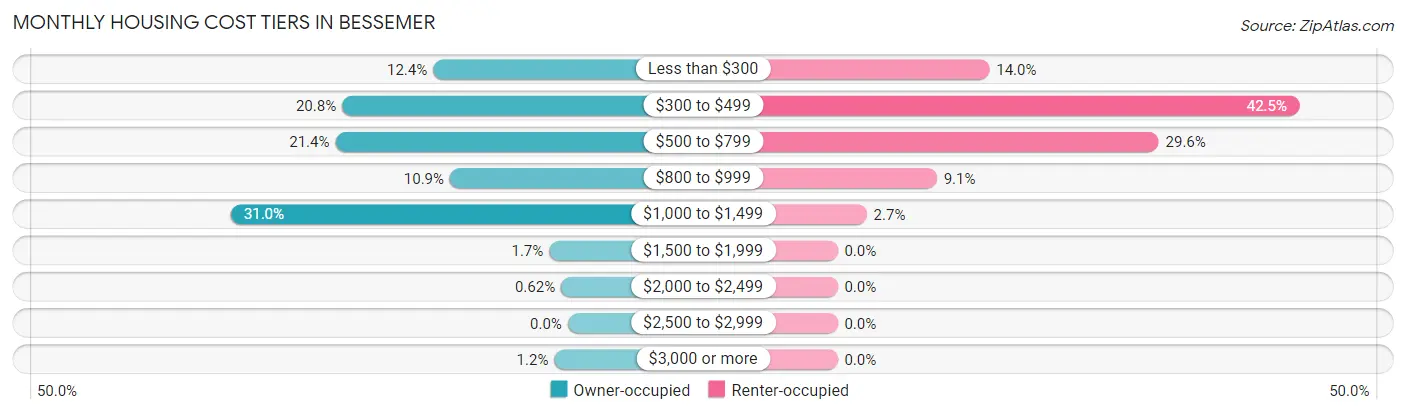
| Monthly Cost | Owner-occupied | Renter-occupied |
| Less than $300 | 80 (12.4%) | 26 (14.0%) |
| $300 to $499 | 134 (20.8%) | 79 (42.5%) |
| $500 to $799 | 138 (21.4%) | 55 (29.6%) |
| $800 to $999 | 70 (10.8%) | 17 (9.1%) |
| $1,000 to $1,499 | 200 (31.0%) | 5 (2.7%) |
| $1,500 to $1,999 | 11 (1.7%) | 0 (0.0%) |
| $2,000 to $2,499 | 4 (0.6%) | 0 (0.0%) |
| $2,500 to $2,999 | 0 (0.0%) | 0 (0.0%) |
| $3,000 or more | 8 (1.2%) | 0 (0.0%) |
| Total | 645 (100.0%) | 186 (100.0%) |
Physical Housing Characteristics in Bessemer
Housing Structures in Bessemer
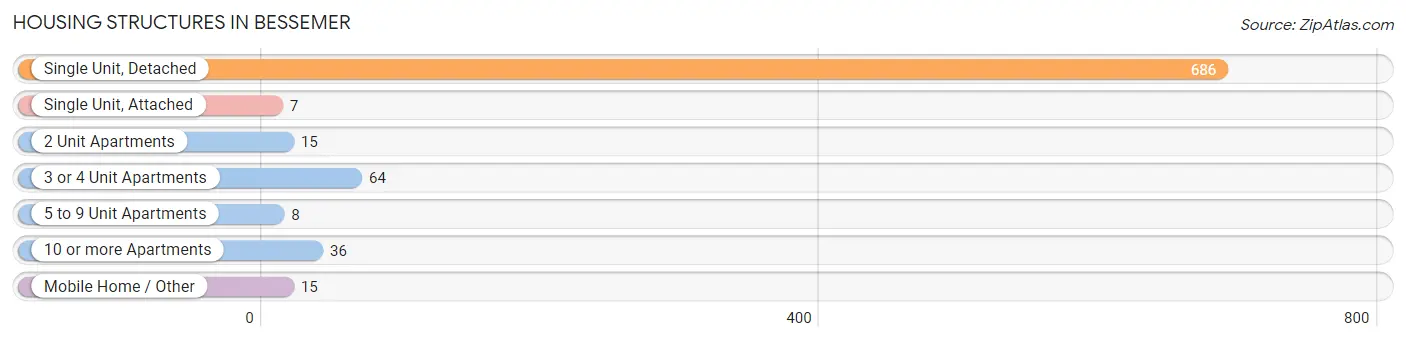
| Structure Type | # Housing Units | % Housing Units |
| Single Unit, Detached | 686 | 82.6% |
| Single Unit, Attached | 7 | 0.8% |
| 2 Unit Apartments | 15 | 1.8% |
| 3 or 4 Unit Apartments | 64 | 7.7% |
| 5 to 9 Unit Apartments | 8 | 1.0% |
| 10 or more Apartments | 36 | 4.3% |
| Mobile Home / Other | 15 | 1.8% |
| Total | 831 | 100.0% |
Housing Structures by Occupancy in Bessemer
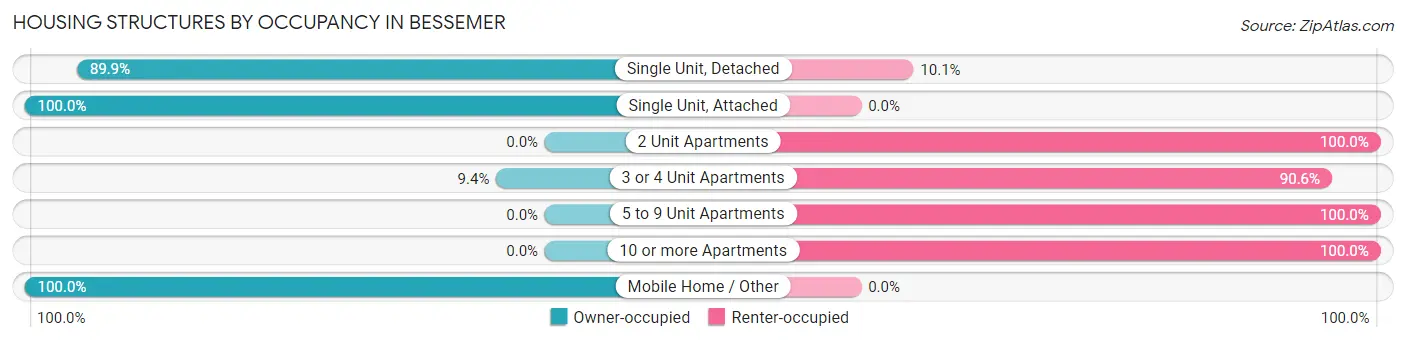
| Structure Type | Owner-occupied | Renter-occupied |
| Single Unit, Detached | 617 (89.9%) | 69 (10.1%) |
| Single Unit, Attached | 7 (100.0%) | 0 (0.0%) |
| 2 Unit Apartments | 0 (0.0%) | 15 (100.0%) |
| 3 or 4 Unit Apartments | 6 (9.4%) | 58 (90.6%) |
| 5 to 9 Unit Apartments | 0 (0.0%) | 8 (100.0%) |
| 10 or more Apartments | 0 (0.0%) | 36 (100.0%) |
| Mobile Home / Other | 15 (100.0%) | 0 (0.0%) |
| Total | 645 (77.6%) | 186 (22.4%) |
Housing Structures by Number of Rooms in Bessemer
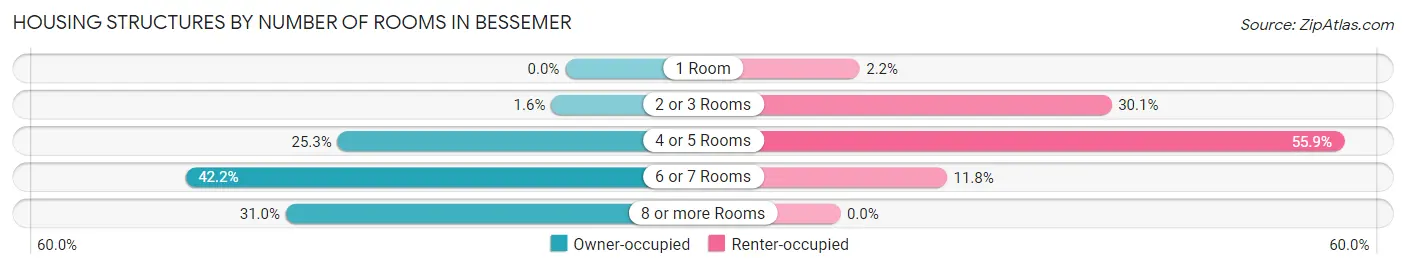
| Number of Rooms | Owner-occupied | Renter-occupied |
| 1 Room | 0 (0.0%) | 4 (2.1%) |
| 2 or 3 Rooms | 10 (1.5%) | 56 (30.1%) |
| 4 or 5 Rooms | 163 (25.3%) | 104 (55.9%) |
| 6 or 7 Rooms | 272 (42.2%) | 22 (11.8%) |
| 8 or more Rooms | 200 (31.0%) | 0 (0.0%) |
| Total | 645 (100.0%) | 186 (100.0%) |
Housing Structure by Heating Type in Bessemer
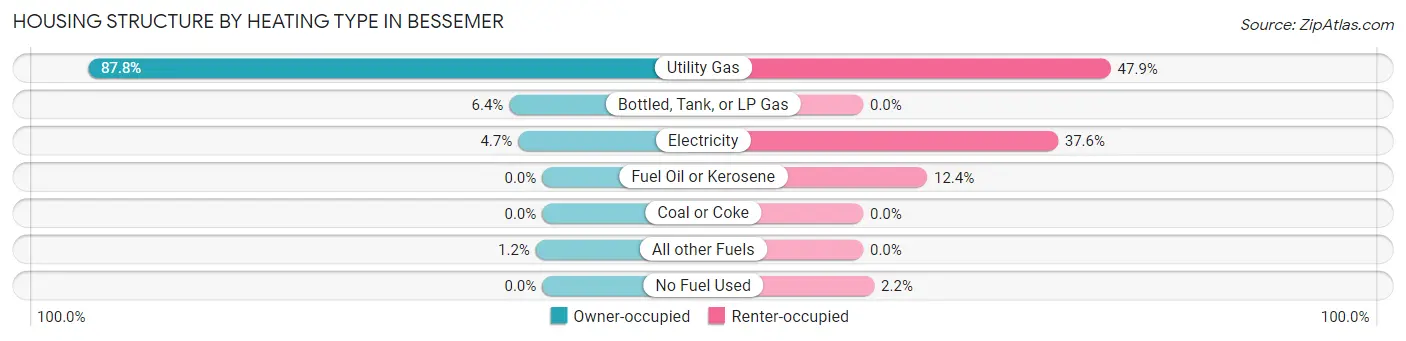
| Heating Type | Owner-occupied | Renter-occupied |
| Utility Gas | 566 (87.7%) | 89 (47.8%) |
| Bottled, Tank, or LP Gas | 41 (6.4%) | 0 (0.0%) |
| Electricity | 30 (4.6%) | 70 (37.6%) |
| Fuel Oil or Kerosene | 0 (0.0%) | 23 (12.4%) |
| Coal or Coke | 0 (0.0%) | 0 (0.0%) |
| All other Fuels | 8 (1.2%) | 0 (0.0%) |
| No Fuel Used | 0 (0.0%) | 4 (2.1%) |
| Total | 645 (100.0%) | 186 (100.0%) |
Household Vehicle Usage in Bessemer
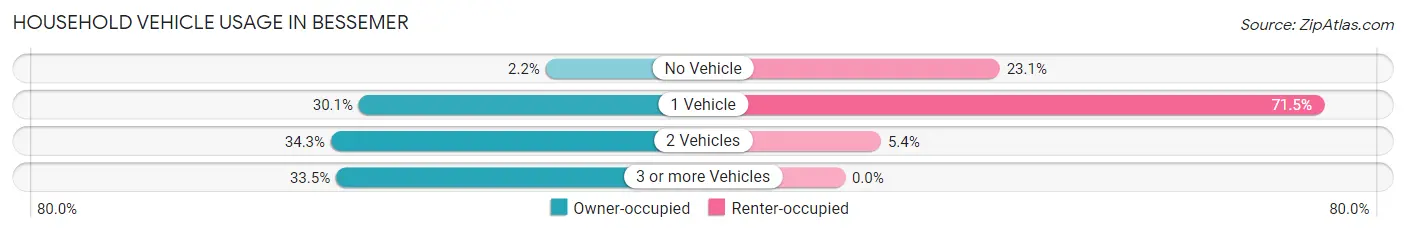
| Vehicles per Household | Owner-occupied | Renter-occupied |
| No Vehicle | 14 (2.2%) | 43 (23.1%) |
| 1 Vehicle | 194 (30.1%) | 133 (71.5%) |
| 2 Vehicles | 221 (34.3%) | 10 (5.4%) |
| 3 or more Vehicles | 216 (33.5%) | 0 (0.0%) |
| Total | 645 (100.0%) | 186 (100.0%) |
Real Estate & Mortgages in Bessemer
Real Estate and Mortgage Overview in Bessemer
| Characteristic | Without Mortgage | With Mortgage |
| Housing Units | 303 | 342 |
| Median Property Value | $49,500 | $141,900 |
| Median Household Income | $59,750 | $12 |
| Monthly Housing Costs | $370 | $8 |
| Real Estate Taxes | $1,209 | $0 |
Property Value by Mortgage Status in Bessemer
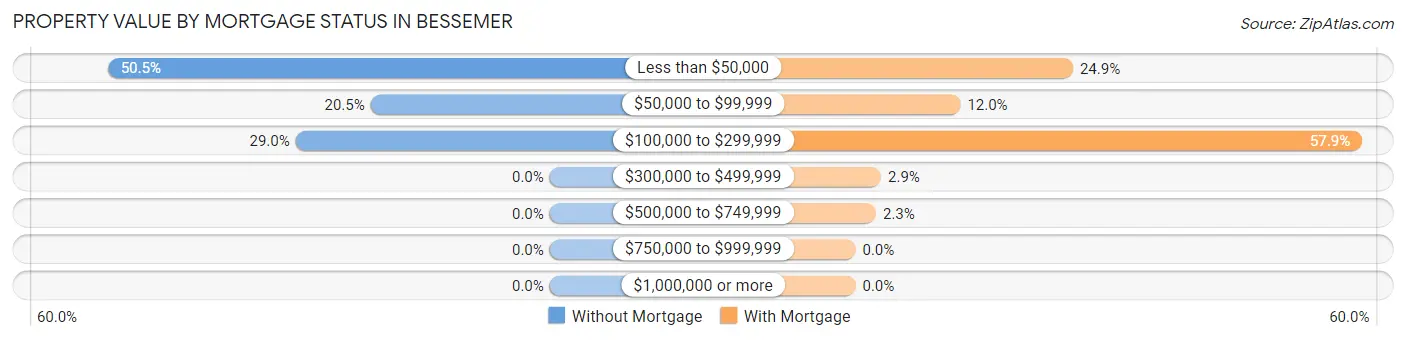
| Property Value | Without Mortgage | With Mortgage |
| Less than $50,000 | 153 (50.5%) | 85 (24.8%) |
| $50,000 to $99,999 | 62 (20.5%) | 41 (12.0%) |
| $100,000 to $299,999 | 88 (29.0%) | 198 (57.9%) |
| $300,000 to $499,999 | 0 (0.0%) | 10 (2.9%) |
| $500,000 to $749,999 | 0 (0.0%) | 8 (2.3%) |
| $750,000 to $999,999 | 0 (0.0%) | 0 (0.0%) |
| $1,000,000 or more | 0 (0.0%) | 0 (0.0%) |
| Total | 303 (100.0%) | 342 (100.0%) |
Household Income by Mortgage Status in Bessemer
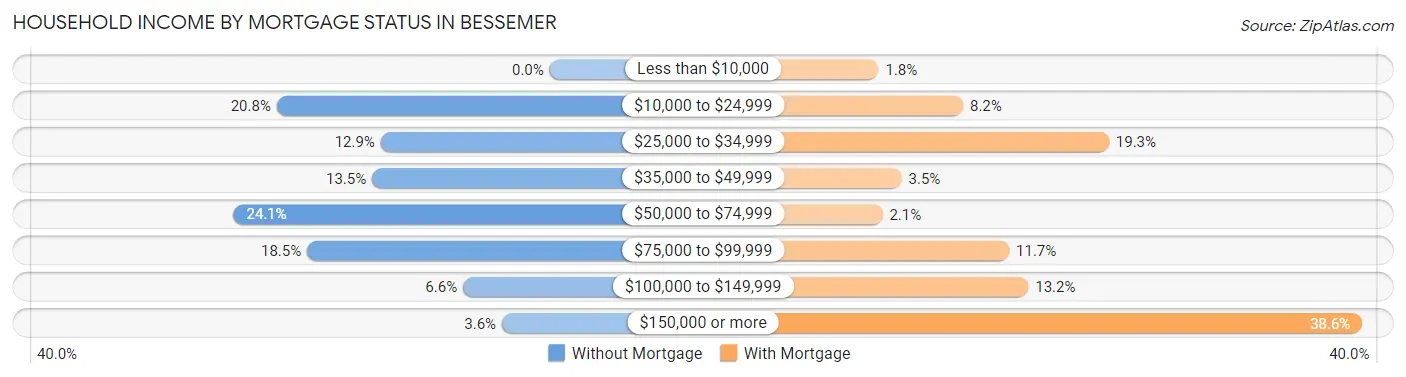
| Household Income | Without Mortgage | With Mortgage |
| Less than $10,000 | 0 (0.0%) | 6 (1.8%) |
| $10,000 to $24,999 | 63 (20.8%) | 28 (8.2%) |
| $25,000 to $34,999 | 39 (12.9%) | 66 (19.3%) |
| $35,000 to $49,999 | 41 (13.5%) | 12 (3.5%) |
| $50,000 to $74,999 | 73 (24.1%) | 7 (2.1%) |
| $75,000 to $99,999 | 56 (18.5%) | 40 (11.7%) |
| $100,000 to $149,999 | 20 (6.6%) | 45 (13.2%) |
| $150,000 or more | 11 (3.6%) | 132 (38.6%) |
| Total | 303 (100.0%) | 342 (100.0%) |
Property Value to Household Income Ratio in Bessemer
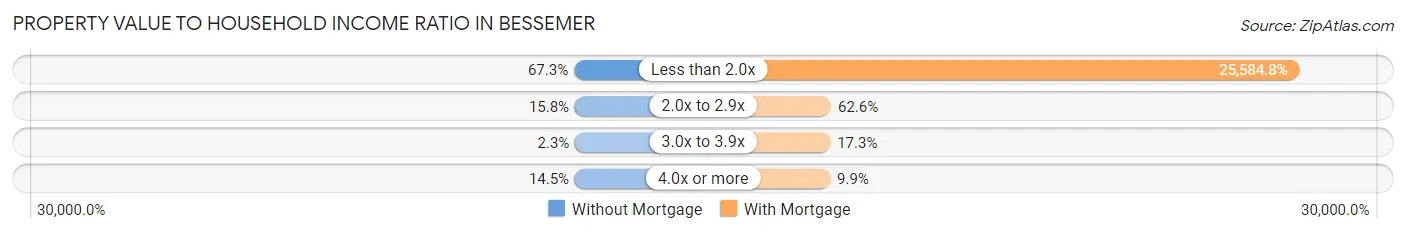
| Value-to-Income Ratio | Without Mortgage | With Mortgage |
| Less than 2.0x | 204 (67.3%) | 87,500 (25,584.8%) |
| 2.0x to 2.9x | 48 (15.8%) | 214 (62.6%) |
| 3.0x to 3.9x | 7 (2.3%) | 59 (17.2%) |
| 4.0x or more | 44 (14.5%) | 34 (9.9%) |
| Total | 303 (100.0%) | 342 (100.0%) |
Real Estate Taxes by Mortgage Status in Bessemer
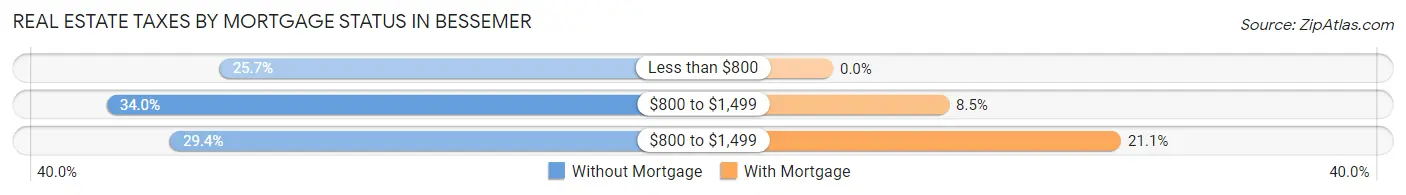
| Property Taxes | Without Mortgage | With Mortgage |
| Less than $800 | 78 (25.7%) | 0 (0.0%) |
| $800 to $1,499 | 103 (34.0%) | 29 (8.5%) |
| $800 to $1,499 | 89 (29.4%) | 72 (21.0%) |
| Total | 303 (100.0%) | 342 (100.0%) |
Health & Disability in Bessemer
Health Insurance Coverage by Age in Bessemer
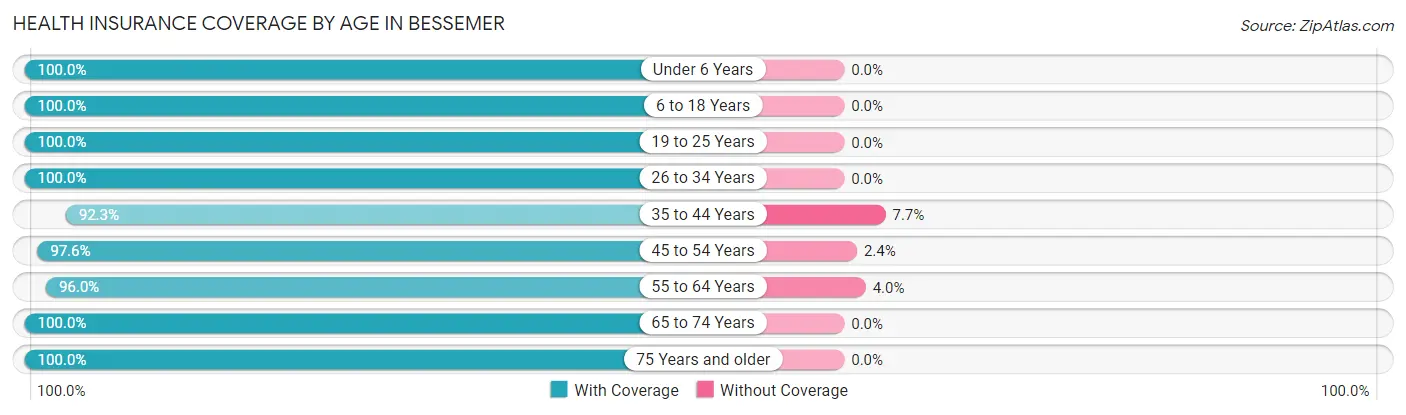
| Age Bracket | With Coverage | Without Coverage |
| Under 6 Years | 83 (100.0%) | 0 (0.0%) |
| 6 to 18 Years | 240 (100.0%) | 0 (0.0%) |
| 19 to 25 Years | 151 (100.0%) | 0 (0.0%) |
| 26 to 34 Years | 81 (100.0%) | 0 (0.0%) |
| 35 to 44 Years | 144 (92.3%) | 12 (7.7%) |
| 45 to 54 Years | 247 (97.6%) | 6 (2.4%) |
| 55 to 64 Years | 313 (96.0%) | 13 (4.0%) |
| 65 to 74 Years | 273 (100.0%) | 0 (0.0%) |
| 75 Years and older | 123 (100.0%) | 0 (0.0%) |
| Total | 1,655 (98.2%) | 31 (1.8%) |
Health Insurance Coverage by Citizenship Status in Bessemer
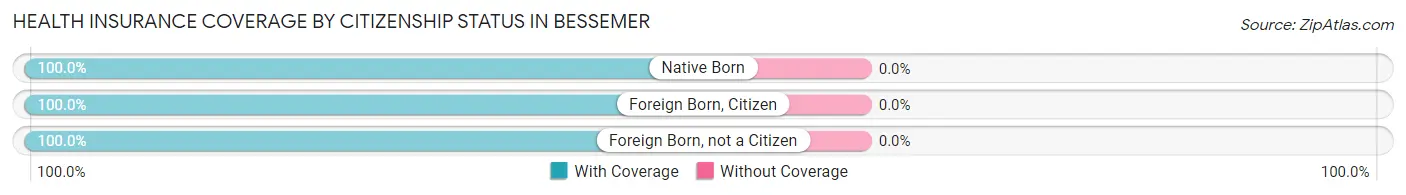
| Citizenship Status | With Coverage | Without Coverage |
| Native Born | 83 (100.0%) | 0 (0.0%) |
| Foreign Born, Citizen | 240 (100.0%) | 0 (0.0%) |
| Foreign Born, not a Citizen | 151 (100.0%) | 0 (0.0%) |
Health Insurance Coverage by Household Income in Bessemer
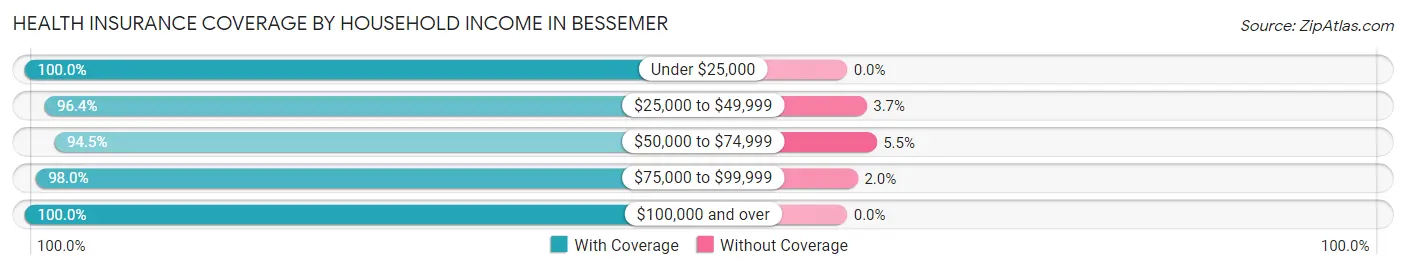
| Household Income | With Coverage | Without Coverage |
| Under $25,000 | 392 (100.0%) | 0 (0.0%) |
| $25,000 to $49,999 | 317 (96.4%) | 12 (3.6%) |
| $50,000 to $74,999 | 223 (94.5%) | 13 (5.5%) |
| $75,000 to $99,999 | 294 (98.0%) | 6 (2.0%) |
| $100,000 and over | 421 (100.0%) | 0 (0.0%) |
Public vs Private Health Insurance Coverage by Age in Bessemer
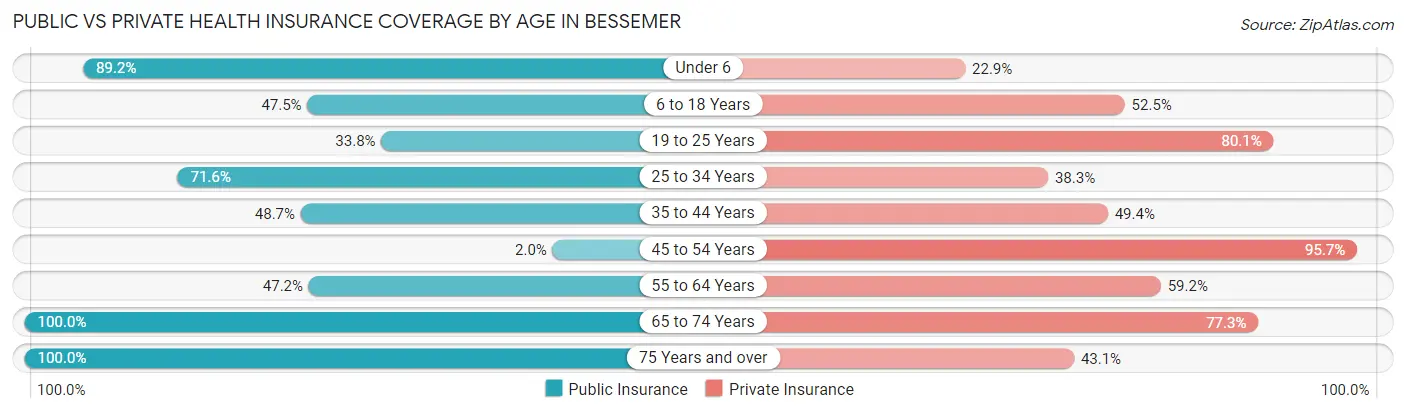
| Age Bracket | Public Insurance | Private Insurance |
| Under 6 | 74 (89.2%) | 19 (22.9%) |
| 6 to 18 Years | 114 (47.5%) | 126 (52.5%) |
| 19 to 25 Years | 51 (33.8%) | 121 (80.1%) |
| 25 to 34 Years | 58 (71.6%) | 31 (38.3%) |
| 35 to 44 Years | 76 (48.7%) | 77 (49.4%) |
| 45 to 54 Years | 5 (2.0%) | 242 (95.7%) |
| 55 to 64 Years | 154 (47.2%) | 193 (59.2%) |
| 65 to 74 Years | 273 (100.0%) | 211 (77.3%) |
| 75 Years and over | 123 (100.0%) | 53 (43.1%) |
| Total | 928 (55.0%) | 1,073 (63.6%) |
Disability Status by Sex by Age in Bessemer
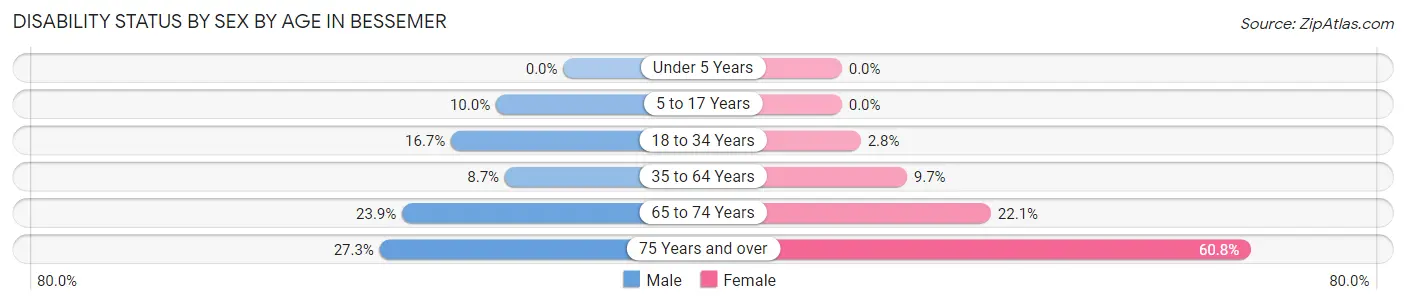
| Age Bracket | Male | Female |
| Under 5 Years | 0 (0.0%) | 0 (0.0%) |
| 5 to 17 Years | 15 (10.0%) | 0 (0.0%) |
| 18 to 34 Years | 12 (16.7%) | 5 (2.8%) |
| 35 to 64 Years | 26 (8.7%) | 42 (9.7%) |
| 65 to 74 Years | 34 (23.9%) | 29 (22.1%) |
| 75 Years and over | 12 (27.3%) | 48 (60.8%) |
Disability Class by Sex by Age in Bessemer
Disability Class: Hearing Difficulty
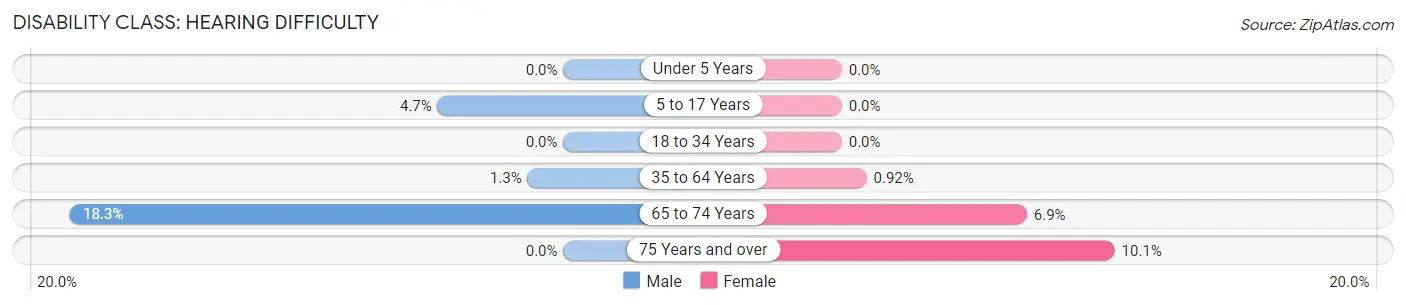
| Age Bracket | Male | Female |
| Under 5 Years | 0 (0.0%) | 0 (0.0%) |
| 5 to 17 Years | 7 (4.7%) | 0 (0.0%) |
| 18 to 34 Years | 0 (0.0%) | 0 (0.0%) |
| 35 to 64 Years | 4 (1.3%) | 4 (0.9%) |
| 65 to 74 Years | 26 (18.3%) | 9 (6.9%) |
| 75 Years and over | 0 (0.0%) | 8 (10.1%) |
Disability Class: Vision Difficulty
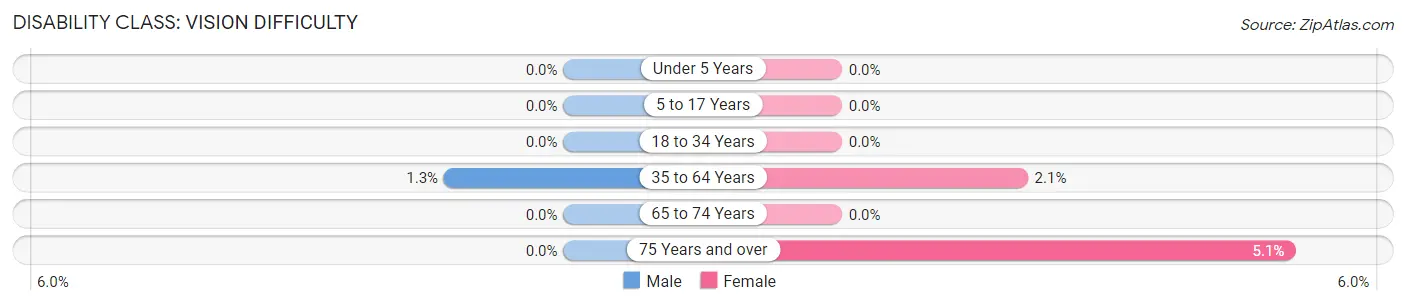
| Age Bracket | Male | Female |
| Under 5 Years | 0 (0.0%) | 0 (0.0%) |
| 5 to 17 Years | 0 (0.0%) | 0 (0.0%) |
| 18 to 34 Years | 0 (0.0%) | 0 (0.0%) |
| 35 to 64 Years | 4 (1.3%) | 9 (2.1%) |
| 65 to 74 Years | 0 (0.0%) | 0 (0.0%) |
| 75 Years and over | 0 (0.0%) | 4 (5.1%) |
Disability Class: Cognitive Difficulty
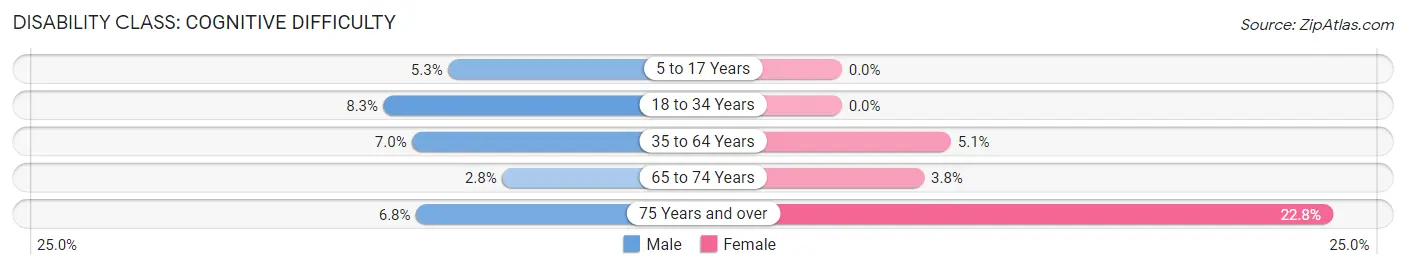
| Age Bracket | Male | Female |
| 5 to 17 Years | 8 (5.3%) | 0 (0.0%) |
| 18 to 34 Years | 6 (8.3%) | 0 (0.0%) |
| 35 to 64 Years | 21 (7.0%) | 22 (5.1%) |
| 65 to 74 Years | 4 (2.8%) | 5 (3.8%) |
| 75 Years and over | 3 (6.8%) | 18 (22.8%) |
Disability Class: Ambulatory Difficulty
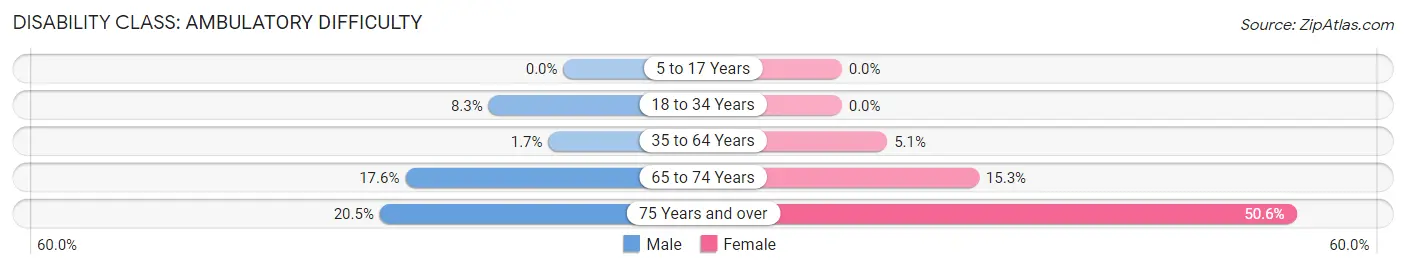
| Age Bracket | Male | Female |
| 5 to 17 Years | 0 (0.0%) | 0 (0.0%) |
| 18 to 34 Years | 6 (8.3%) | 0 (0.0%) |
| 35 to 64 Years | 5 (1.7%) | 22 (5.1%) |
| 65 to 74 Years | 25 (17.6%) | 20 (15.3%) |
| 75 Years and over | 9 (20.4%) | 40 (50.6%) |
Disability Class: Self-Care Difficulty
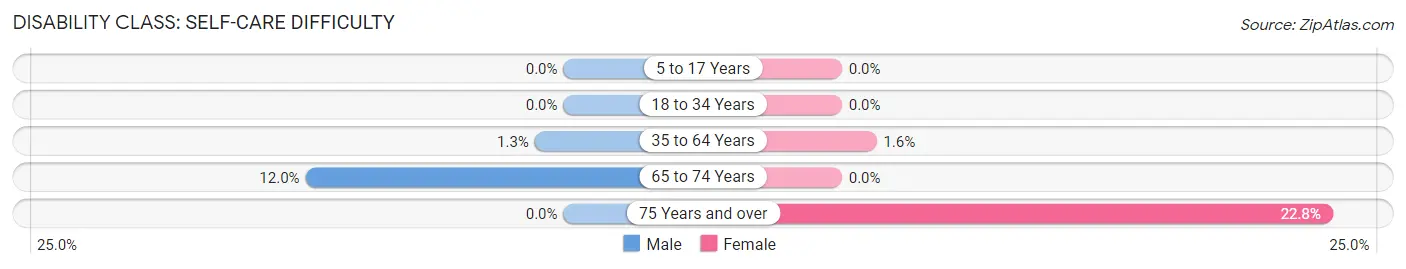
| Age Bracket | Male | Female |
| 5 to 17 Years | 0 (0.0%) | 0 (0.0%) |
| 18 to 34 Years | 0 (0.0%) | 0 (0.0%) |
| 35 to 64 Years | 4 (1.3%) | 7 (1.6%) |
| 65 to 74 Years | 17 (12.0%) | 0 (0.0%) |
| 75 Years and over | 0 (0.0%) | 18 (22.8%) |
Technology Access in Bessemer
Computing Device Access in Bessemer
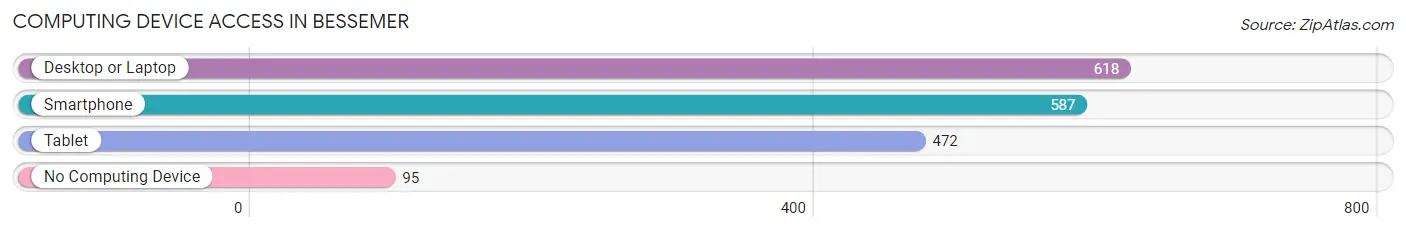
| Device Type | # Households | % Households |
| Desktop or Laptop | 618 | 74.4% |
| Smartphone | 587 | 70.6% |
| Tablet | 472 | 56.8% |
| No Computing Device | 95 | 11.4% |
| Total | 831 | 100.0% |
Internet Access in Bessemer
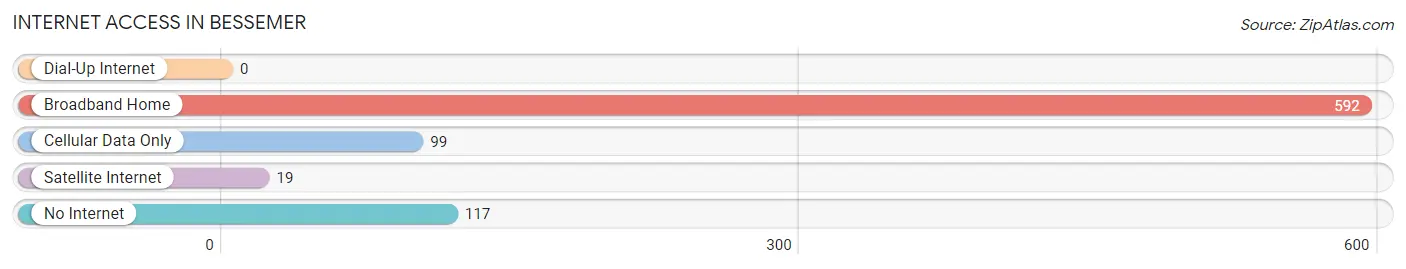
| Internet Type | # Households | % Households |
| Dial-Up Internet | 0 | 0.0% |
| Broadband Home | 592 | 71.2% |
| Cellular Data Only | 99 | 11.9% |
| Satellite Internet | 19 | 2.3% |
| No Internet | 117 | 14.1% |
| Total | 831 | 100.0% |
Bessemer Summary
Bessemer is a city located in Gogebic County, Michigan, United States. The population was 2,914 at the 2010 census. It is the county seat of Gogebic County. The city is situated within Bessemer Township, but is politically independent.
History
Bessemer was founded in 1887 by the Bessemer Land and Iron Company, a subsidiary of the Pittsburgh-based Bessemer Steel Company. The company was founded by Henry Bessemer, an English engineer who invented the Bessemer process for steel production. The company was looking for a suitable location to build a steel mill and chose the area around Bessemer due to its proximity to iron ore deposits and the availability of timber for fuel. The company built a blast furnace and a rolling mill, and the town of Bessemer was born.
The town grew rapidly, and by 1900 it had a population of over 5,000. The steel mill was the largest employer in the area, and the town was home to a variety of other businesses, including a foundry, a machine shop, a lumber mill, and a brickyard.
The steel mill closed in the late 1960s, and the town's population began to decline. The town was hit hard by the recession of the early 1980s, and many businesses closed. The town has since rebounded, and today it is a thriving community with a variety of businesses and industries.
Geography
Bessemer is located at 46°25′N 90°7′W (46.4133, -90.1167). According to the United States Census Bureau, the city has a total area of 2.50 square miles (6.48 km2), all land.
The city is located in the western part of the Upper Peninsula of Michigan, near the Wisconsin border. It is situated on the Montreal River, which forms the border between Michigan and Wisconsin. The city is surrounded by forests and lakes, and is a popular destination for outdoor recreation.
Economy
Bessemer's economy is largely based on tourism and outdoor recreation. The city is home to a variety of businesses, including restaurants, retail stores, and service providers. The city is also home to a number of manufacturing companies, including a paper mill, a foundry, and a machine shop.
The city is also home to a number of educational institutions, including Gogebic Community College and the Bessemer Area School District.
Demographics
As of the census of 2010, there were 2,914 people, 1,213 households, and 745 families residing in the city. The population density was 1,164.8 inhabitants per square mile (450.2/km2). There were 1,413 housing units at an average density of 565.2 per square mile (218.5/km2). The racial makeup of the city was 97.2% White, 0.3% African American, 0.7% Native American, 0.3% Asian, 0.1% Pacific Islander, 0.3% from other races, and 1.2% from two or more races. Hispanic or Latino of any race were 1.2% of the population.
There were 1,213 households, of which 28.7% had children under the age of 18 living with them, 44.2% were married couples living together, 12.7% had a female householder with no husband present, 5.2% had a male householder with no wife present, and 38.0% were non-families. 33.2% of all households were made up of individuals, and 16.2% had someone living alone who was 65 years of age or older. The average household size was 2.30 and the average family size was 2.90.
The median age in the city was 43.2 years. 22.7% of residents were under the age of 18; 8.2% were between the ages of 18 and 24; 22.3% were from 25 to 44; 27.2% were from 45 to 64; and 19.6% were 65 years of age or older. The gender makeup of the city was 48.2% male and 51.8% female.
Conclusion
Bessemer is a city located in Gogebic County, Michigan, United States. The city was founded in 1887 by the Bessemer Land and Iron Company, and was once home to a large steel mill. The city's economy is largely based on tourism and outdoor recreation, and it is home to a variety of businesses, educational institutions, and manufacturing companies. The population of Bessemer was 2,914 at the 2010 census, and the city is home to a diverse population of people from all walks of life.
Common Questions
What is Per Capita Income in Bessemer?
Per Capita income in Bessemer is $27,191.
What is the Median Family Income in Bessemer?
Median Family Income in Bessemer is $71,250.
What is the Median Household income in Bessemer?
Median Household Income in Bessemer is $49,323.
What is Income or Wage Gap in Bessemer?
Income or Wage Gap in Bessemer is 29.3%.
Women in Bessemer earn 70.7 cents for every dollar earned by a man.
What is Inequality or Gini Index in Bessemer?
Inequality or Gini Index in Bessemer is 0.41.
What is the Total Population of Bessemer?
Total Population of Bessemer is 1,708.
What is the Total Male Population of Bessemer?
Total Male Population of Bessemer is 761.
What is the Total Female Population of Bessemer?
Total Female Population of Bessemer is 947.
What is the Ratio of Males per 100 Females in Bessemer?
There are 80.36 Males per 100 Females in Bessemer.
What is the Ratio of Females per 100 Males in Bessemer?
There are 124.44 Females per 100 Males in Bessemer.
What is the Median Population Age in Bessemer?
Median Population Age in Bessemer is 50.4 Years.
What is the Average Family Size in Bessemer
Average Family Size in Bessemer is 2.4 People.
What is the Average Household Size in Bessemer
Average Household Size in Bessemer is 2.0 People.
How Large is the Labor Force in Bessemer?
There are 882 People in the Labor Forcein in Bessemer.
What is the Percentage of People in the Labor Force in Bessemer?
60.3% of People are in the Labor Force in Bessemer.
What is the Unemployment Rate in Bessemer?
Unemployment Rate in Bessemer is 4.4%.