Burton, MI Map & Demographics
Burton Map
Burton Overview
$30,178
PER CAPITA INCOME
$72,202
AVG FAMILY INCOME
$55,698
AVG HOUSEHOLD INCOME
33.1%
WAGE / INCOME GAP [ % ]
66.9¢/ $1
WAGE / INCOME GAP [ $ ]
$10,093
FAMILY INCOME DEFICIT
0.43
INEQUALITY / GINI INDEX
29,568
TOTAL POPULATION
13,663
MALE POPULATION
15,905
FEMALE POPULATION
85.90
MALES / 100 FEMALES
116.41
FEMALES / 100 MALES
42.8
MEDIAN AGE
2.9
AVG FAMILY SIZE
2.4
AVG HOUSEHOLD SIZE
14,339
LABOR FORCE [ PEOPLE ]
59.1%
PERCENT IN LABOR FORCE
7.1%
UNEMPLOYMENT RATE
Burton Area Codes
Income in Burton
Income Overview in Burton
Per Capita Income in Burton is $30,178, while median incomes of families and households are $72,202 and $55,698 respectively.
| Characteristic | Number | Measure |
| Per Capita Income | 29,568 | $30,178 |
| Median Family Income | 7,433 | $72,202 |
| Mean Family Income | 7,433 | $85,416 |
| Median Household Income | 12,522 | $55,698 |
| Mean Household Income | 12,522 | $70,336 |
| Income Deficit | 7,433 | $10,093 |
| Wage / Income Gap (%) | 29,568 | 33.12% |
| Wage / Income Gap ($) | 29,568 | 66.88¢ per $1 |
| Gini / Inequality Index | 29,568 | 0.43 |
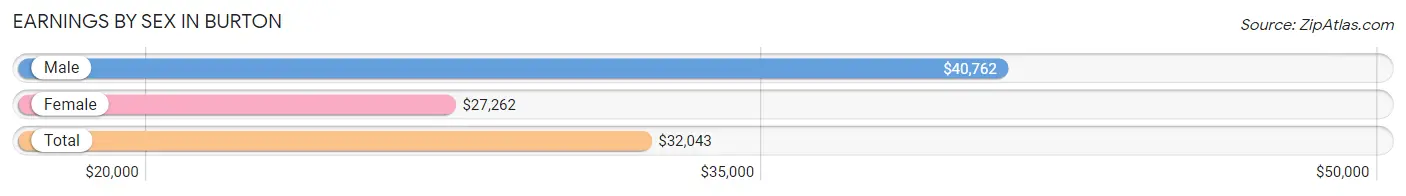
Earnings by Sex in Burton
Average Earnings in Burton are $32,043, $40,762 for men and $27,262 for women, a difference of 33.1%.
| Sex | Number | Average Earnings |
| Male | 7,338 (48.9%) | $40,762 |
| Female | 7,667 (51.1%) | $27,262 |
| Total | 15,005 (100.0%) | $32,043 |
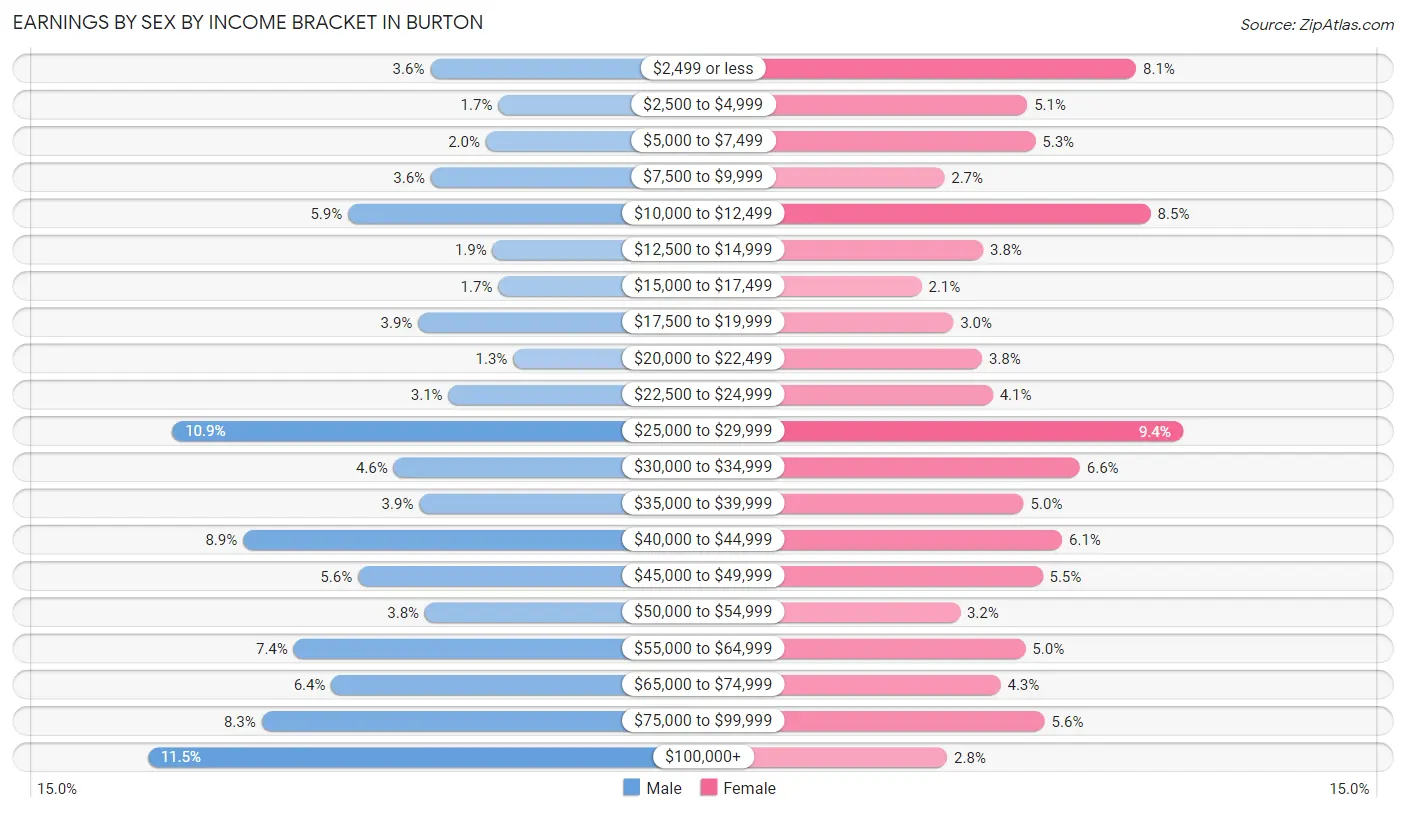
Earnings by Sex by Income Bracket in Burton
The most common earnings brackets in Burton are $100,000+ for men (847 | 11.5%) and $25,000 to $29,999 for women (724 | 9.4%).
| Income | Male | Female |
| $2,499 or less | 264 (3.6%) | 623 (8.1%) |
| $2,500 to $4,999 | 124 (1.7%) | 389 (5.1%) |
| $5,000 to $7,499 | 150 (2.0%) | 406 (5.3%) |
| $7,500 to $9,999 | 263 (3.6%) | 210 (2.7%) |
| $10,000 to $12,499 | 434 (5.9%) | 655 (8.5%) |
| $12,500 to $14,999 | 136 (1.8%) | 294 (3.8%) |
| $15,000 to $17,499 | 124 (1.7%) | 161 (2.1%) |
| $17,500 to $19,999 | 289 (3.9%) | 229 (3.0%) |
| $20,000 to $22,499 | 93 (1.3%) | 291 (3.8%) |
| $22,500 to $24,999 | 227 (3.1%) | 314 (4.1%) |
| $25,000 to $29,999 | 796 (10.8%) | 724 (9.4%) |
| $30,000 to $34,999 | 340 (4.6%) | 502 (6.6%) |
| $35,000 to $39,999 | 287 (3.9%) | 381 (5.0%) |
| $40,000 to $44,999 | 650 (8.9%) | 464 (6.0%) |
| $45,000 to $49,999 | 413 (5.6%) | 422 (5.5%) |
| $50,000 to $54,999 | 275 (3.7%) | 244 (3.2%) |
| $55,000 to $64,999 | 546 (7.4%) | 385 (5.0%) |
| $65,000 to $74,999 | 468 (6.4%) | 331 (4.3%) |
| $75,000 to $99,999 | 612 (8.3%) | 426 (5.6%) |
| $100,000+ | 847 (11.5%) | 216 (2.8%) |
| Total | 7,338 (100.0%) | 7,667 (100.0%) |
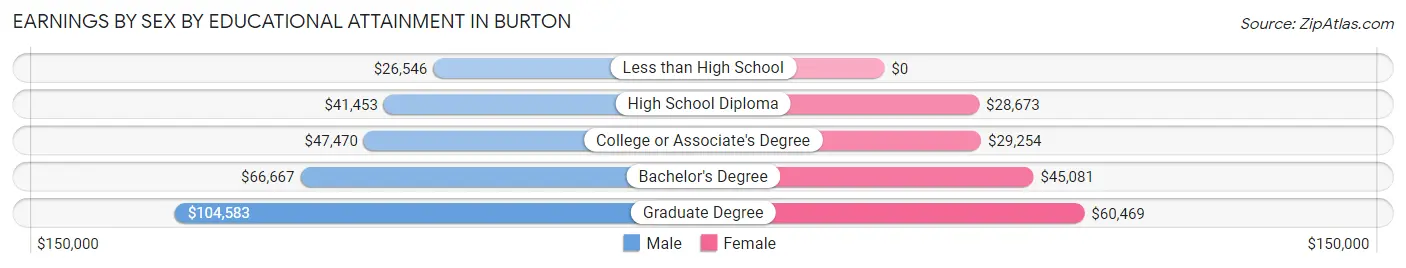
Earnings by Sex by Educational Attainment in Burton
Average earnings in Burton are $43,353 for men and $30,954 for women, a difference of 28.6%. Men with an educational attainment of graduate degree enjoy the highest average annual earnings of $104,583, while those with less than high school education earn the least with $26,546. Women with an educational attainment of graduate degree earn the most with the average annual earnings of $60,469, while those with high school diploma education have the smallest earnings of $28,673.
| Educational Attainment | Male Income | Female Income |
| Less than High School | $26,546 | $0 |
| High School Diploma | $41,453 | $28,673 |
| College or Associate's Degree | $47,470 | $29,254 |
| Bachelor's Degree | $66,667 | $45,081 |
| Graduate Degree | $104,583 | $60,469 |
| Total | $43,353 | $30,954 |
Family Income in Burton
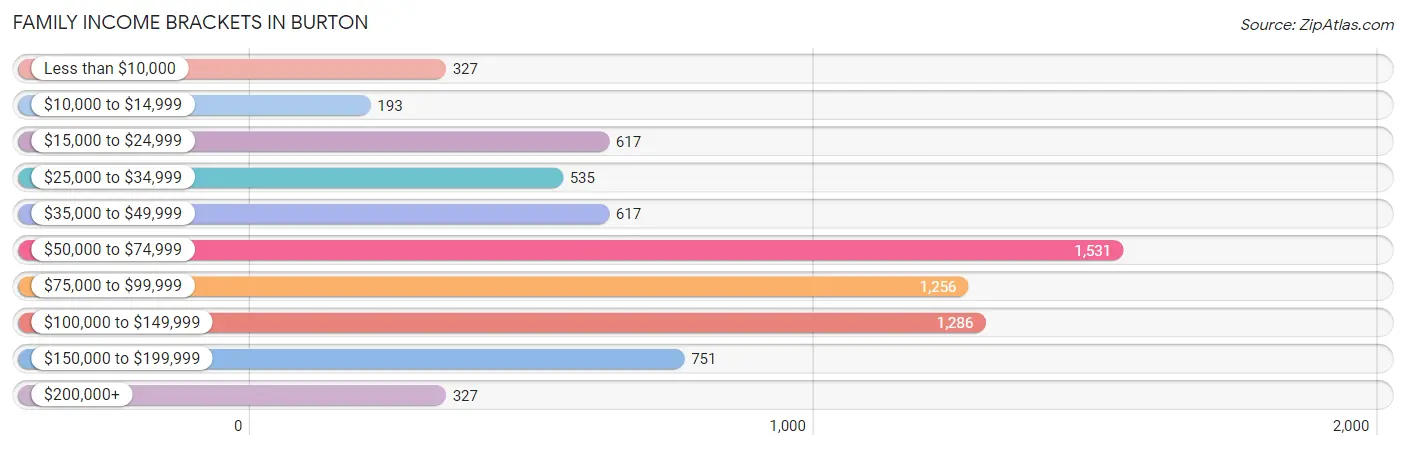
Family Income Brackets in Burton
According to the Burton family income data, there are 1,531 families falling into the $50,000 to $74,999 income range, which is the most common income bracket and makes up 20.6% of all families. Conversely, the $10,000 to $14,999 income bracket is the least frequent group with only 193 families (2.6%) belonging to this category.
| Income Bracket | # Families | % Families |
| Less than $10,000 | 327 | 4.4% |
| $10,000 to $14,999 | 193 | 2.6% |
| $15,000 to $24,999 | 617 | 8.3% |
| $25,000 to $34,999 | 535 | 7.2% |
| $35,000 to $49,999 | 617 | 8.3% |
| $50,000 to $74,999 | 1,531 | 20.6% |
| $75,000 to $99,999 | 1,256 | 16.9% |
| $100,000 to $149,999 | 1,286 | 17.3% |
| $150,000 to $199,999 | 751 | 10.1% |
| $200,000+ | 327 | 4.4% |
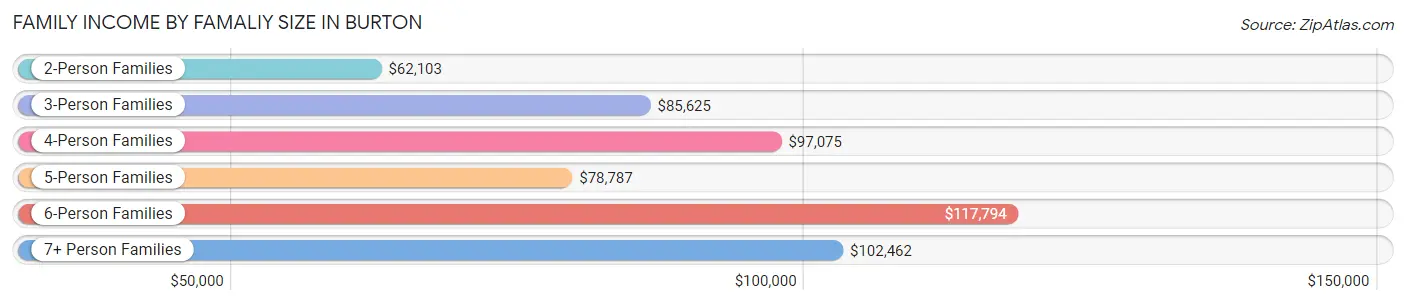
Family Income by Famaliy Size in Burton
6-person families (168 | 2.3%) account for the highest median family income in Burton with $117,794 per family, while 2-person families (4,159 | 55.9%) have the highest median income of $31,052 per family member.
| Income Bracket | # Families | Median Income |
| 2-Person Families | 4,159 (55.9%) | $62,103 |
| 3-Person Families | 1,482 (19.9%) | $85,625 |
| 4-Person Families | 1,072 (14.4%) | $97,075 |
| 5-Person Families | 427 (5.7%) | $78,787 |
| 6-Person Families | 168 (2.3%) | $117,794 |
| 7+ Person Families | 125 (1.7%) | $102,462 |
| Total | 7,433 (100.0%) | $72,202 |
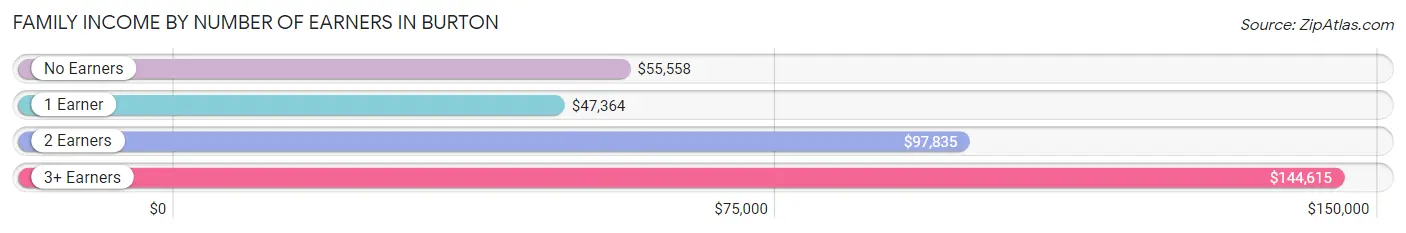
Family Income by Number of Earners in Burton
The median family income in Burton is $72,202, with families comprising 3+ earners (724) having the highest median family income of $144,615, while families with 1 earner (2,750) have the lowest median family income of $47,364, accounting for 9.7% and 37.0% of families, respectively.
| Number of Earners | # Families | Median Income |
| No Earners | 1,376 (18.5%) | $55,558 |
| 1 Earner | 2,750 (37.0%) | $47,364 |
| 2 Earners | 2,583 (34.7%) | $97,835 |
| 3+ Earners | 724 (9.7%) | $144,615 |
| Total | 7,433 (100.0%) | $72,202 |
Household Income in Burton
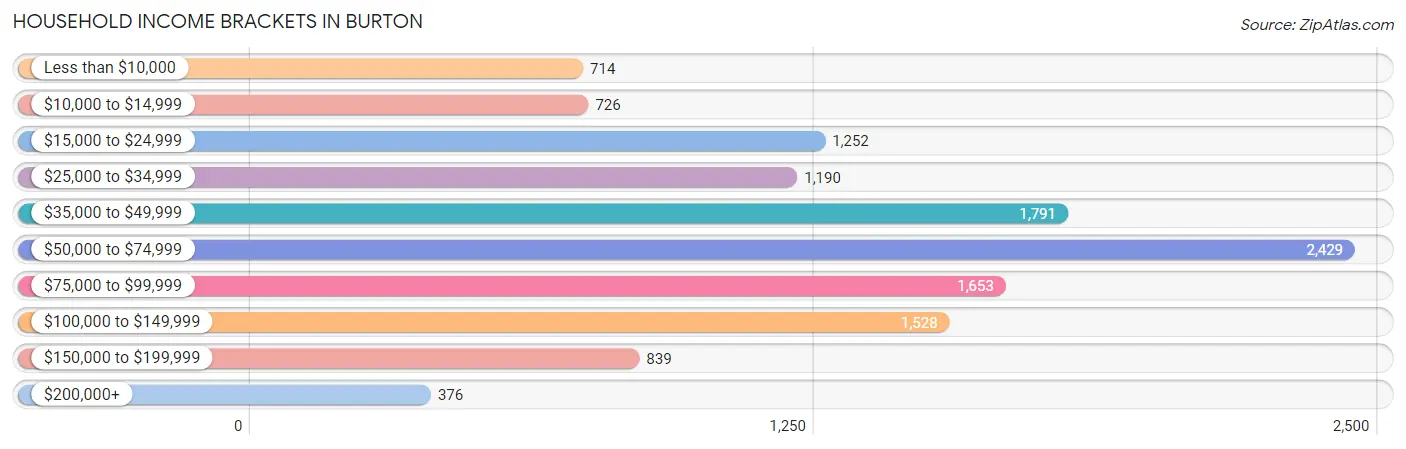
Household Income Brackets in Burton
With 2,429 households falling in the category, the $50,000 to $74,999 income range is the most frequent in Burton, accounting for 19.4% of all households. In contrast, only 376 households (3.0%) fall into the $200,000+ income bracket, making it the least populous group.
| Income Bracket | # Households | % Households |
| Less than $10,000 | 714 | 5.7% |
| $10,000 to $14,999 | 726 | 5.8% |
| $15,000 to $24,999 | 1,252 | 10.0% |
| $25,000 to $34,999 | 1,190 | 9.5% |
| $35,000 to $49,999 | 1,791 | 14.3% |
| $50,000 to $74,999 | 2,429 | 19.4% |
| $75,000 to $99,999 | 1,653 | 13.2% |
| $100,000 to $149,999 | 1,528 | 12.2% |
| $150,000 to $199,999 | 839 | 6.7% |
| $200,000+ | 376 | 3.0% |
Household Income by Householder Age in Burton
The median household income in Burton is $55,698, with the highest median household income of $63,125 found in the 25 to 44 years age bracket for the primary householder. A total of 3,407 households (27.2%) fall into this category. Meanwhile, the 15 to 24 years age bracket for the primary householder has the lowest median household income of $29,386, with 476 households (3.8%) in this group.
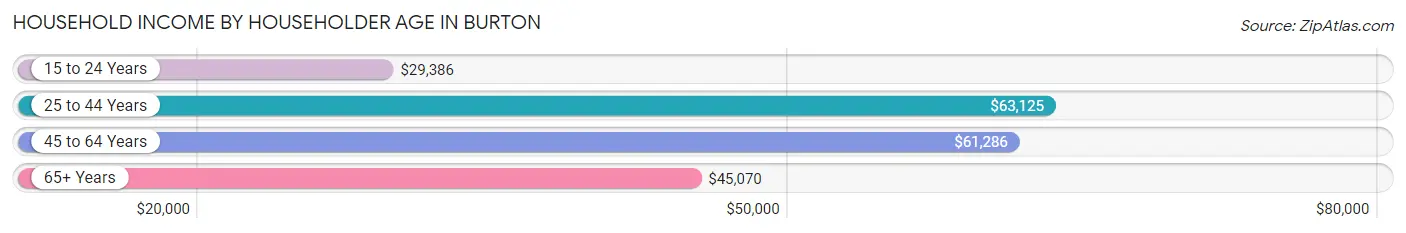
| Income Bracket | # Households | Median Income |
| 15 to 24 Years | 476 (3.8%) | $29,386 |
| 25 to 44 Years | 3,407 (27.2%) | $63,125 |
| 45 to 64 Years | 4,955 (39.6%) | $61,286 |
| 65+ Years | 3,684 (29.4%) | $45,070 |
| Total | 12,522 (100.0%) | $55,698 |
Poverty in Burton
Income Below Poverty by Sex and Age in Burton
With 12.3% poverty level for males and 19.6% for females among the residents of Burton, 5 year old males and under 5 year old females are the most vulnerable to poverty, with 35 males (31.8%) and 382 females (35.9%) in their respective age groups living below the poverty level.
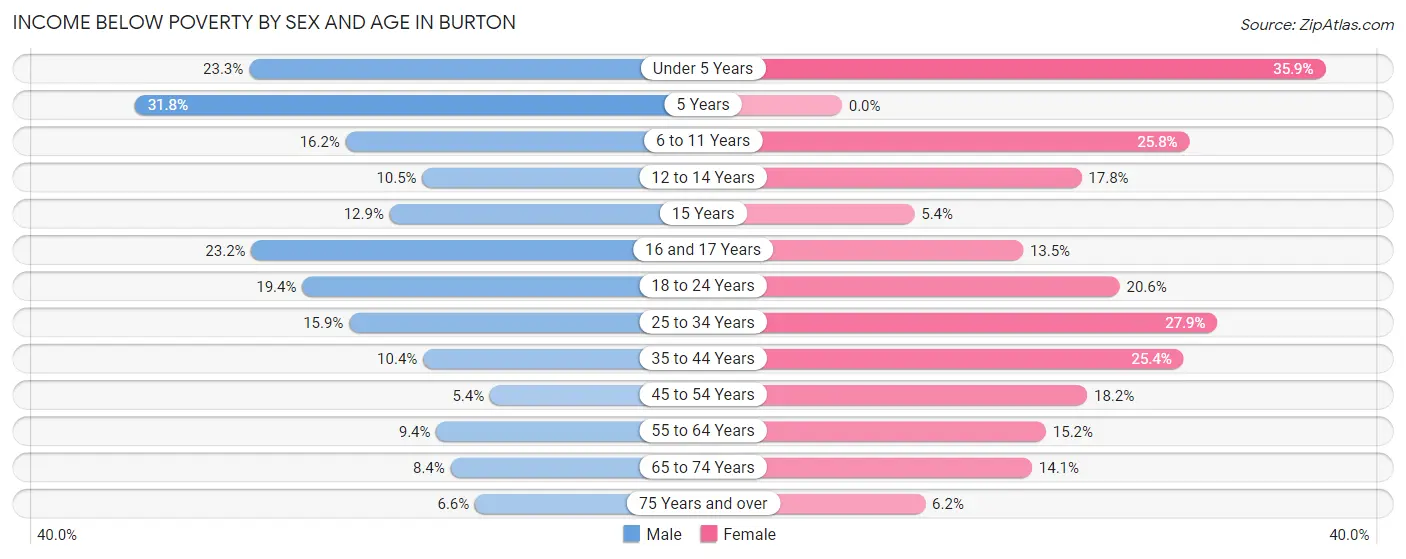
| Age Bracket | Male | Female |
| Under 5 Years | 161 (23.3%) | 382 (35.9%) |
| 5 Years | 35 (31.8%) | 0 (0.0%) |
| 6 to 11 Years | 164 (16.2%) | 247 (25.8%) |
| 12 to 14 Years | 25 (10.5%) | 82 (17.8%) |
| 15 Years | 25 (12.9%) | 10 (5.4%) |
| 16 and 17 Years | 104 (23.2%) | 39 (13.5%) |
| 18 to 24 Years | 242 (19.4%) | 281 (20.6%) |
| 25 to 34 Years | 270 (15.9%) | 544 (27.9%) |
| 35 to 44 Years | 177 (10.4%) | 418 (25.4%) |
| 45 to 54 Years | 114 (5.4%) | 384 (18.2%) |
| 55 to 64 Years | 165 (9.4%) | 354 (15.1%) |
| 65 to 74 Years | 96 (8.4%) | 259 (14.1%) |
| 75 Years and over | 75 (6.6%) | 92 (6.2%) |
| Total | 1,653 (12.3%) | 3,092 (19.6%) |
Income Above Poverty by Sex and Age in Burton
According to the poverty statistics in Burton, males aged 45 to 54 years and females aged 5 years are the age groups that are most secure financially, with 94.6% of males and 100.0% of females in these age groups living above the poverty line.
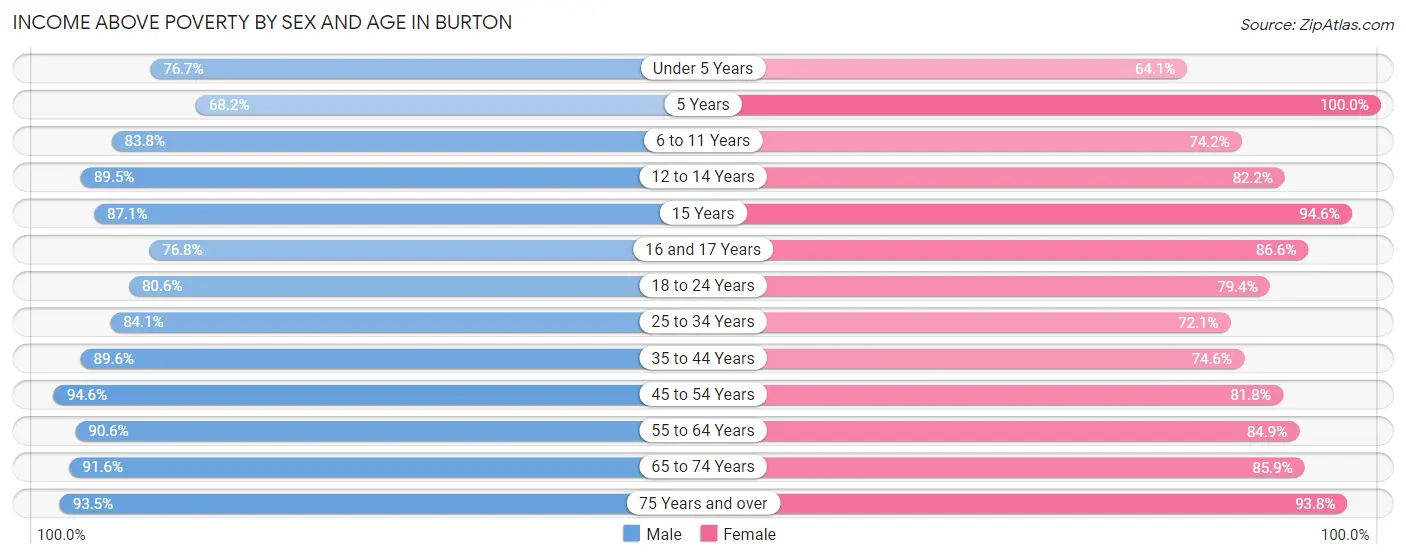
| Age Bracket | Male | Female |
| Under 5 Years | 529 (76.7%) | 682 (64.1%) |
| 5 Years | 75 (68.2%) | 113 (100.0%) |
| 6 to 11 Years | 851 (83.8%) | 710 (74.2%) |
| 12 to 14 Years | 214 (89.5%) | 379 (82.2%) |
| 15 Years | 169 (87.1%) | 176 (94.6%) |
| 16 and 17 Years | 345 (76.8%) | 251 (86.6%) |
| 18 to 24 Years | 1,007 (80.6%) | 1,082 (79.4%) |
| 25 to 34 Years | 1,428 (84.1%) | 1,407 (72.1%) |
| 35 to 44 Years | 1,524 (89.6%) | 1,229 (74.6%) |
| 45 to 54 Years | 1,983 (94.6%) | 1,725 (81.8%) |
| 55 to 64 Years | 1,584 (90.6%) | 1,982 (84.9%) |
| 65 to 74 Years | 1,051 (91.6%) | 1,577 (85.9%) |
| 75 Years and over | 1,070 (93.4%) | 1,395 (93.8%) |
| Total | 11,830 (87.7%) | 12,708 (80.4%) |
Income Below Poverty Among Married-Couple Families in Burton
The poverty statistics for married-couple families in Burton show that 4.5% or 212 of the total 4,679 families live below the poverty line. Families with 3 or 4 children have the highest poverty rate of 16.1%, comprising of 54 families. On the other hand, families with 5 or more children have the lowest poverty rate of 0.0%, which includes 0 families.
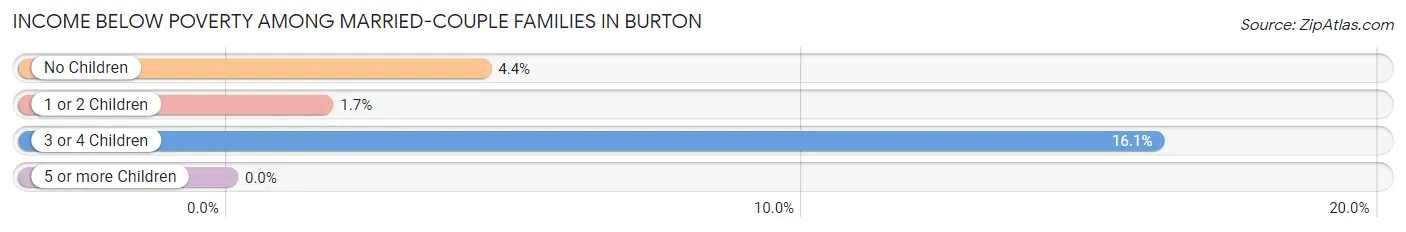
| Children | Above Poverty | Below Poverty |
| No Children | 3,011 (95.6%) | 139 (4.4%) |
| 1 or 2 Children | 1,124 (98.3%) | 19 (1.7%) |
| 3 or 4 Children | 281 (83.9%) | 54 (16.1%) |
| 5 or more Children | 51 (100.0%) | 0 (0.0%) |
| Total | 4,467 (95.5%) | 212 (4.5%) |
Income Below Poverty Among Single-Parent Households in Burton
According to the poverty data in Burton, 12.1% or 78 single-father households and 28.7% or 606 single-mother households are living below the poverty line. Among single-father households, those with 1 or 2 children have the highest poverty rate, with 72 households (18.4%) experiencing poverty. Likewise, among single-mother households, those with 3 or 4 children have the highest poverty rate, with 104 households (54.7%) falling below the poverty line.
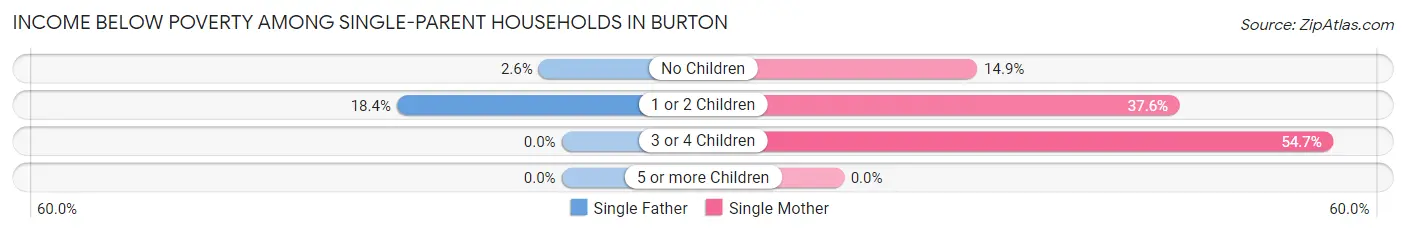
| Children | Single Father | Single Mother |
| No Children | 6 (2.6%) | 144 (14.9%) |
| 1 or 2 Children | 72 (18.4%) | 358 (37.6%) |
| 3 or 4 Children | 0 (0.0%) | 104 (54.7%) |
| 5 or more Children | 0 (0.0%) | 0 (0.0%) |
| Total | 78 (12.1%) | 606 (28.7%) |
Income Below Poverty Among Married-Couple vs Single-Parent Households in Burton
The poverty data for Burton shows that 212 of the married-couple family households (4.5%) and 684 of the single-parent households (24.8%) are living below the poverty level. Within the married-couple family households, those with 3 or 4 children have the highest poverty rate, with 54 households (16.1%) falling below the poverty line. Among the single-parent households, those with 3 or 4 children have the highest poverty rate, with 104 household (49.3%) living below poverty.
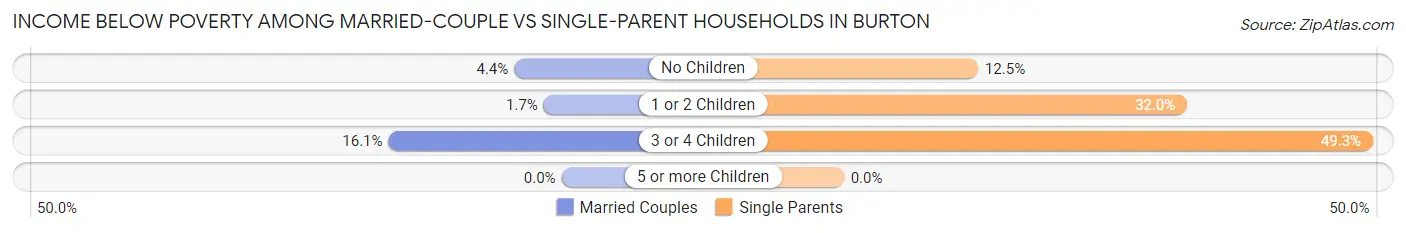
| Children | Married-Couple Families | Single-Parent Households |
| No Children | 139 (4.4%) | 150 (12.5%) |
| 1 or 2 Children | 19 (1.7%) | 430 (32.0%) |
| 3 or 4 Children | 54 (16.1%) | 104 (49.3%) |
| 5 or more Children | 0 (0.0%) | 0 (0.0%) |
| Total | 212 (4.5%) | 684 (24.8%) |
Race in Burton
The most populous races in Burton are White / Caucasian (24,512 | 82.9%), Black / African American (2,865 | 9.7%), and Two or more Races (1,514 | 5.1%).
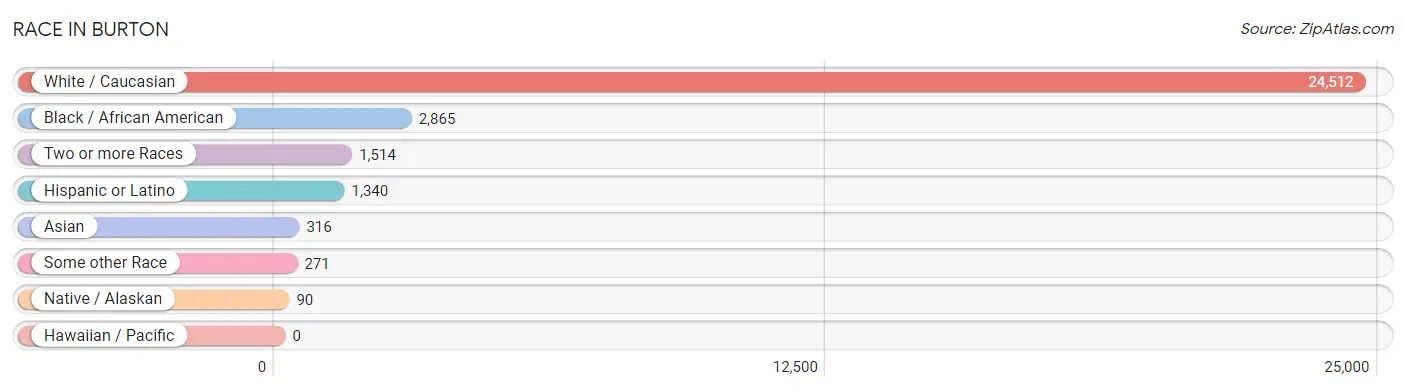
| Race | # Population | % Population |
| Asian | 316 | 1.1% |
| Black / African American | 2,865 | 9.7% |
| Hawaiian / Pacific | 0 | 0.0% |
| Hispanic or Latino | 1,340 | 4.5% |
| Native / Alaskan | 90 | 0.3% |
| White / Caucasian | 24,512 | 82.9% |
| Two or more Races | 1,514 | 5.1% |
| Some other Race | 271 | 0.9% |
| Total | 29,568 | 100.0% |
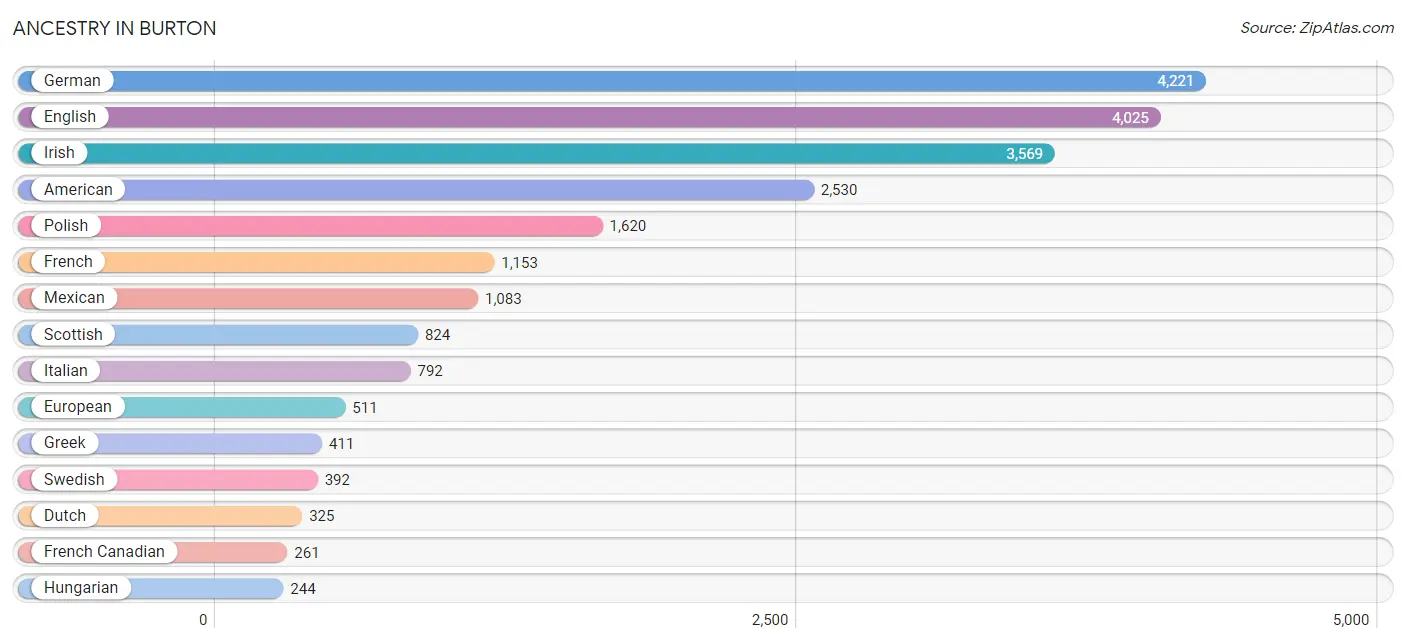
Ancestry in Burton
The most populous ancestries reported in Burton are German (4,221 | 14.3%), English (4,025 | 13.6%), Irish (3,569 | 12.1%), American (2,530 | 8.6%), and Polish (1,620 | 5.5%), together accounting for 54.0% of all Burton residents.
| Ancestry | # Population | % Population |
| African | 120 | 0.4% |
| American | 2,530 | 8.6% |
| Arab | 106 | 0.4% |
| Armenian | 5 | 0.0% |
| Assyrian / Chaldean / Syriac | 28 | 0.1% |
| Austrian | 17 | 0.1% |
| Belgian | 82 | 0.3% |
| Bhutanese | 87 | 0.3% |
| Blackfeet | 11 | 0.0% |
| British | 134 | 0.4% |
| Canadian | 225 | 0.8% |
| Central American | 22 | 0.1% |
| Cherokee | 44 | 0.2% |
| Chippewa | 227 | 0.8% |
| Croatian | 25 | 0.1% |
| Cuban | 8 | 0.0% |
| Czech | 138 | 0.5% |
| Czechoslovakian | 42 | 0.1% |
| Danish | 24 | 0.1% |
| Dutch | 325 | 1.1% |
| Eastern European | 71 | 0.2% |
| Ecuadorian | 38 | 0.1% |
| English | 4,025 | 13.6% |
| European | 511 | 1.7% |
| Finnish | 35 | 0.1% |
| French | 1,153 | 3.9% |
| French American Indian | 19 | 0.1% |
| French Canadian | 261 | 0.9% |
| German | 4,221 | 14.3% |
| Greek | 411 | 1.4% |
| Hungarian | 244 | 0.8% |
| Indian (Asian) | 65 | 0.2% |
| Irish | 3,569 | 12.1% |
| Italian | 792 | 2.7% |
| Korean | 11 | 0.0% |
| Lebanese | 58 | 0.2% |
| Lithuanian | 14 | 0.1% |
| Macedonian | 36 | 0.1% |
| Maltese | 12 | 0.0% |
| Mexican | 1,083 | 3.7% |
| Mexican American Indian | 5 | 0.0% |
| Native Hawaiian | 18 | 0.1% |
| Navajo | 26 | 0.1% |
| Northern European | 5 | 0.0% |
| Norwegian | 115 | 0.4% |
| Ottawa | 19 | 0.1% |
| Panamanian | 11 | 0.0% |
| Pennsylvania German | 11 | 0.0% |
| Polish | 1,620 | 5.5% |
| Portuguese | 11 | 0.0% |
| Puerto Rican | 102 | 0.3% |
| Romanian | 23 | 0.1% |
| Russian | 110 | 0.4% |
| Salvadoran | 11 | 0.0% |
| Scandinavian | 25 | 0.1% |
| Scotch-Irish | 207 | 0.7% |
| Scottish | 824 | 2.8% |
| Shoshone | 25 | 0.1% |
| Slovak | 56 | 0.2% |
| South American | 38 | 0.1% |
| Spaniard | 6 | 0.0% |
| Sri Lankan | 135 | 0.5% |
| Subsaharan African | 120 | 0.4% |
| Swedish | 392 | 1.3% |
| Swiss | 5 | 0.0% |
| Syrian | 38 | 0.1% |
| Thai | 151 | 0.5% |
| Ukrainian | 14 | 0.1% |
| Welsh | 50 | 0.2% |
| Yugoslavian | 7 | 0.0% | View All 70 Rows |
Immigrants in Burton
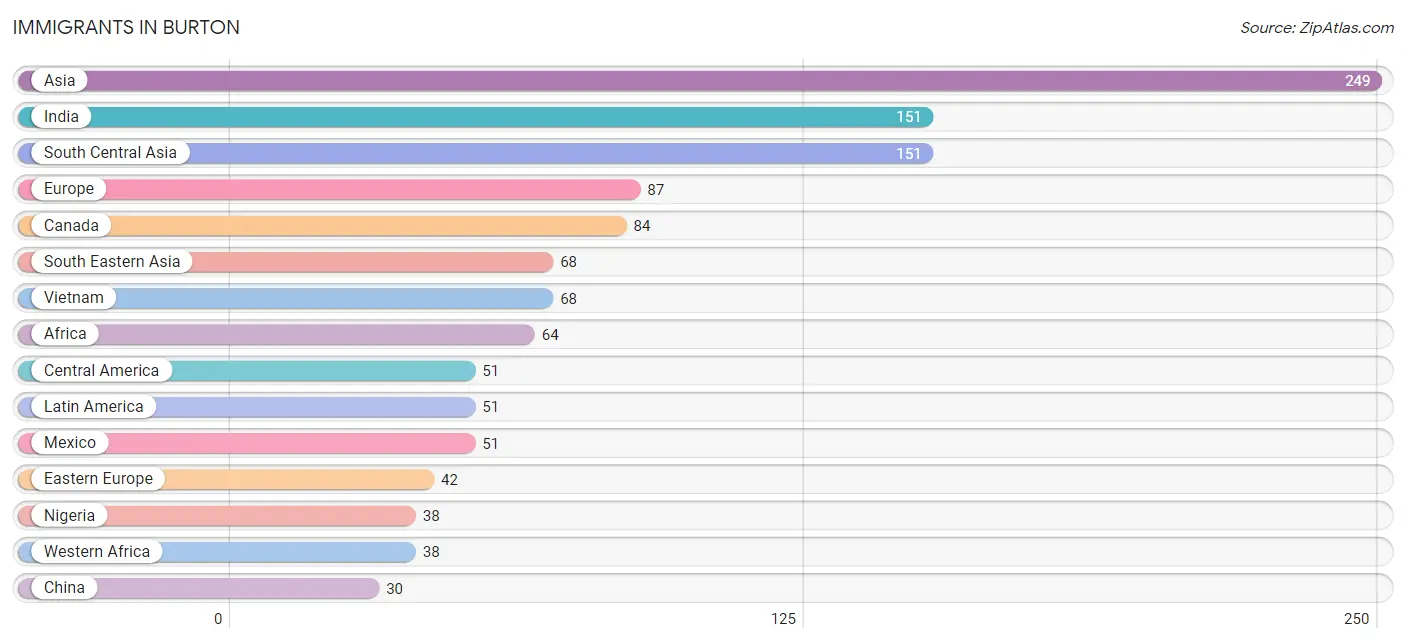
The most numerous immigrant groups reported in Burton came from Asia (249 | 0.8%), India (151 | 0.5%), South Central Asia (151 | 0.5%), Europe (87 | 0.3%), and Canada (84 | 0.3%), together accounting for 2.4% of all Burton residents.
| Immigration Origin | # Population | % Population |
| Africa | 64 | 0.2% |
| Asia | 249 | 0.8% |
| Austria | 8 | 0.0% |
| Canada | 84 | 0.3% |
| Central America | 51 | 0.2% |
| China | 30 | 0.1% |
| Eastern Africa | 26 | 0.1% |
| Eastern Asia | 30 | 0.1% |
| Eastern Europe | 42 | 0.1% |
| Ethiopia | 9 | 0.0% |
| Europe | 87 | 0.3% |
| Germany | 10 | 0.0% |
| Greece | 23 | 0.1% |
| India | 151 | 0.5% |
| Kenya | 17 | 0.1% |
| Latin America | 51 | 0.2% |
| Mexico | 51 | 0.2% |
| Netherlands | 4 | 0.0% |
| Nigeria | 38 | 0.1% |
| Romania | 16 | 0.1% |
| Russia | 14 | 0.1% |
| South Central Asia | 151 | 0.5% |
| South Eastern Asia | 68 | 0.2% |
| Southern Europe | 23 | 0.1% |
| Vietnam | 68 | 0.2% |
| Western Africa | 38 | 0.1% |
| Western Europe | 22 | 0.1% | View All 27 Rows |
Sex and Age in Burton
Sex and Age in Burton
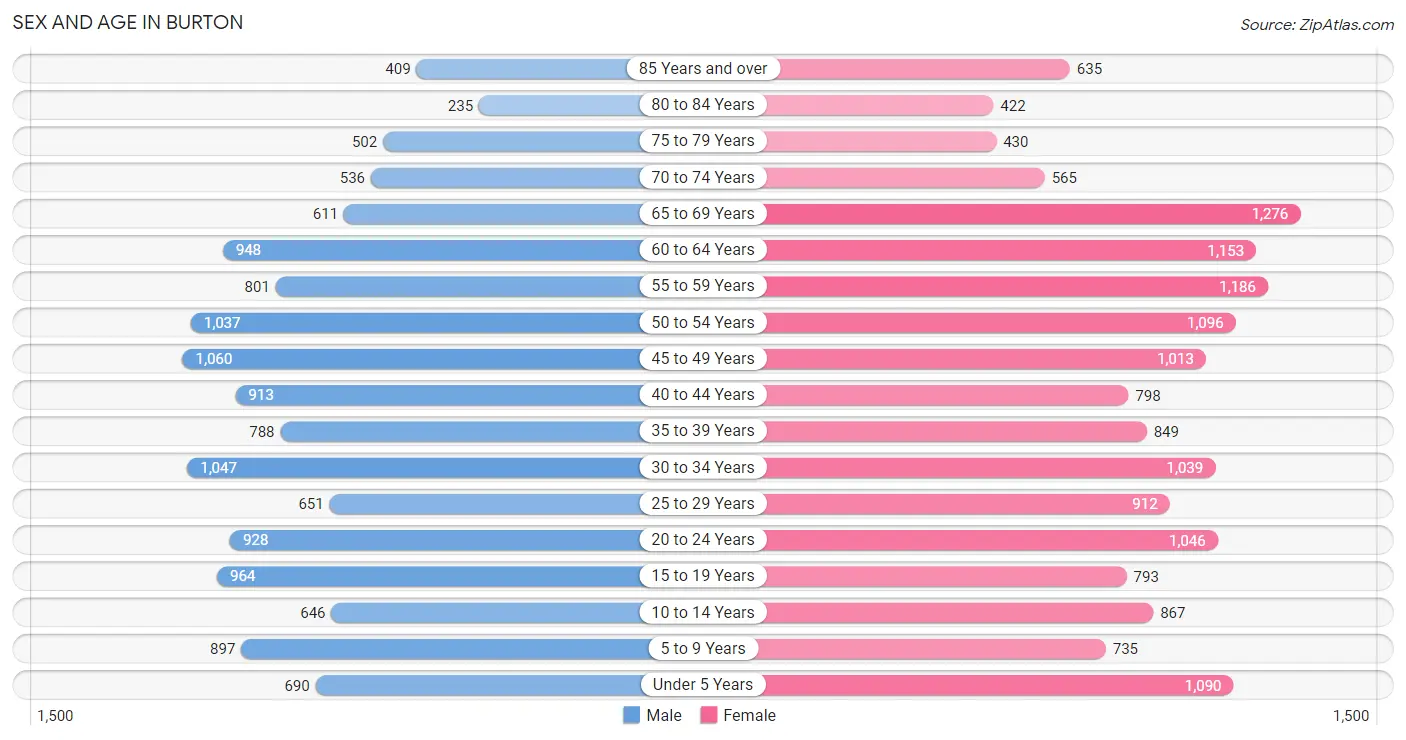
The most populous age groups in Burton are 45 to 49 Years (1,060 | 7.8%) for men and 65 to 69 Years (1,276 | 8.0%) for women.
| Age Bracket | Male | Female |
| Under 5 Years | 690 (5.1%) | 1,090 (6.9%) |
| 5 to 9 Years | 897 (6.6%) | 735 (4.6%) |
| 10 to 14 Years | 646 (4.7%) | 867 (5.4%) |
| 15 to 19 Years | 964 (7.1%) | 793 (5.0%) |
| 20 to 24 Years | 928 (6.8%) | 1,046 (6.6%) |
| 25 to 29 Years | 651 (4.8%) | 912 (5.7%) |
| 30 to 34 Years | 1,047 (7.7%) | 1,039 (6.5%) |
| 35 to 39 Years | 788 (5.8%) | 849 (5.3%) |
| 40 to 44 Years | 913 (6.7%) | 798 (5.0%) |
| 45 to 49 Years | 1,060 (7.8%) | 1,013 (6.4%) |
| 50 to 54 Years | 1,037 (7.6%) | 1,096 (6.9%) |
| 55 to 59 Years | 801 (5.9%) | 1,186 (7.5%) |
| 60 to 64 Years | 948 (6.9%) | 1,153 (7.2%) |
| 65 to 69 Years | 611 (4.5%) | 1,276 (8.0%) |
| 70 to 74 Years | 536 (3.9%) | 565 (3.5%) |
| 75 to 79 Years | 502 (3.7%) | 430 (2.7%) |
| 80 to 84 Years | 235 (1.7%) | 422 (2.6%) |
| 85 Years and over | 409 (3.0%) | 635 (4.0%) |
| Total | 13,663 (100.0%) | 15,905 (100.0%) |
Families and Households in Burton
Median Family Size in Burton
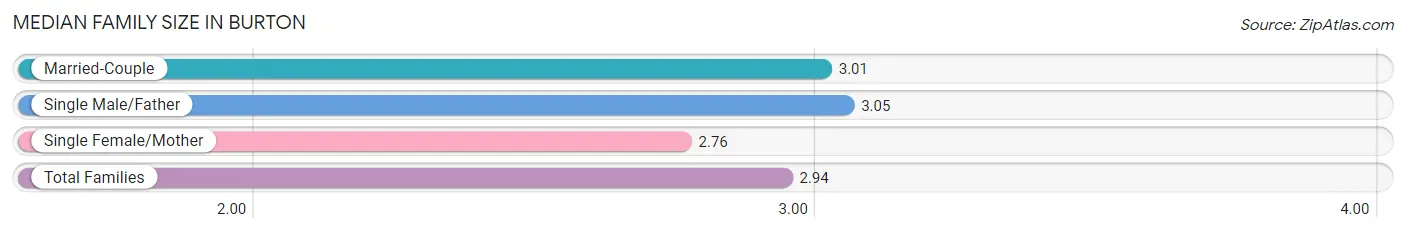
The median family size in Burton is 2.94 persons per family, with single male/father families (646 | 8.7%) accounting for the largest median family size of 3.05 persons per family. On the other hand, single female/mother families (2,108 | 28.4%) represent the smallest median family size with 2.76 persons per family.
| Family Type | # Families | Family Size |
| Married-Couple | 4,679 (62.9%) | 3.01 |
| Single Male/Father | 646 (8.7%) | 3.05 |
| Single Female/Mother | 2,108 (28.4%) | 2.76 |
| Total Families | 7,433 (100.0%) | 2.94 |
Median Household Size in Burton
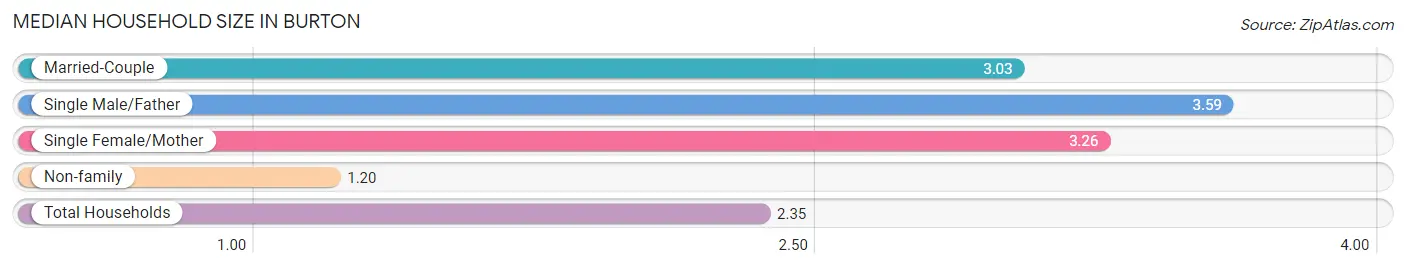
The median household size in Burton is 2.35 persons per household, with single male/father households (646 | 5.2%) accounting for the largest median household size of 3.59 persons per household. non-family households (5,089 | 40.6%) represent the smallest median household size with 1.20 persons per household.
| Household Type | # Households | Household Size |
| Married-Couple | 4,679 (37.4%) | 3.03 |
| Single Male/Father | 646 (5.2%) | 3.59 |
| Single Female/Mother | 2,108 (16.8%) | 3.26 |
| Non-family | 5,089 (40.6%) | 1.20 |
| Total Households | 12,522 (100.0%) | 2.35 |
Household Size by Marriage Status in Burton
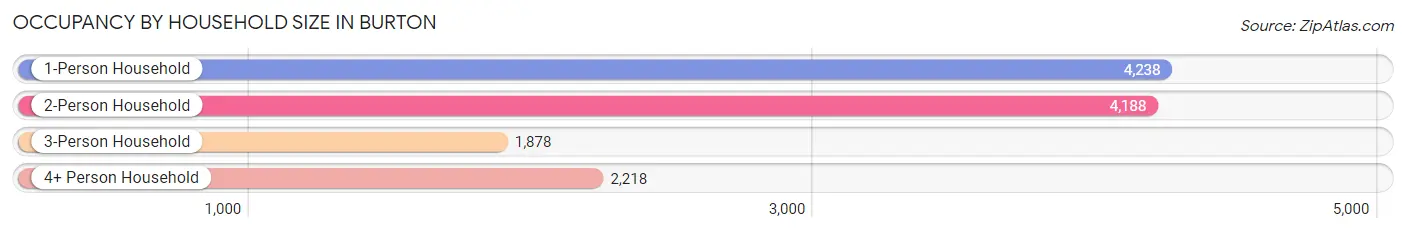
Out of a total of 12,522 households in Burton, 7,433 (59.4%) are family households, while 5,089 (40.6%) are nonfamily households. The most numerous type of family households are 2-person households, comprising 3,395, and the most common type of nonfamily households are 1-person households, comprising 4,238.
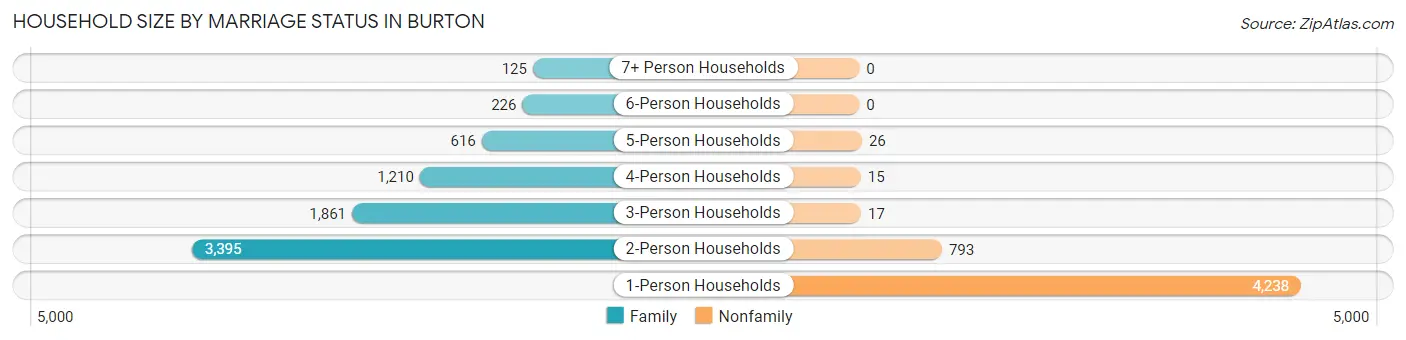
| Household Size | Family Households | Nonfamily Households |
| 1-Person Households | - | 4,238 (33.8%) |
| 2-Person Households | 3,395 (27.1%) | 793 (6.3%) |
| 3-Person Households | 1,861 (14.9%) | 17 (0.1%) |
| 4-Person Households | 1,210 (9.7%) | 15 (0.1%) |
| 5-Person Households | 616 (4.9%) | 26 (0.2%) |
| 6-Person Households | 226 (1.8%) | 0 (0.0%) |
| 7+ Person Households | 125 (1.0%) | 0 (0.0%) |
| Total | 7,433 (59.4%) | 5,089 (40.6%) |
Female Fertility in Burton
Fertility by Age in Burton
Average fertility rate in Burton is 66.0 births per 1,000 women. Women in the age bracket of 20 to 34 years have the highest fertility rate with 119.0 births per 1,000 women. Women in the age bracket of 20 to 34 years acount for 80.9% of all women with births.
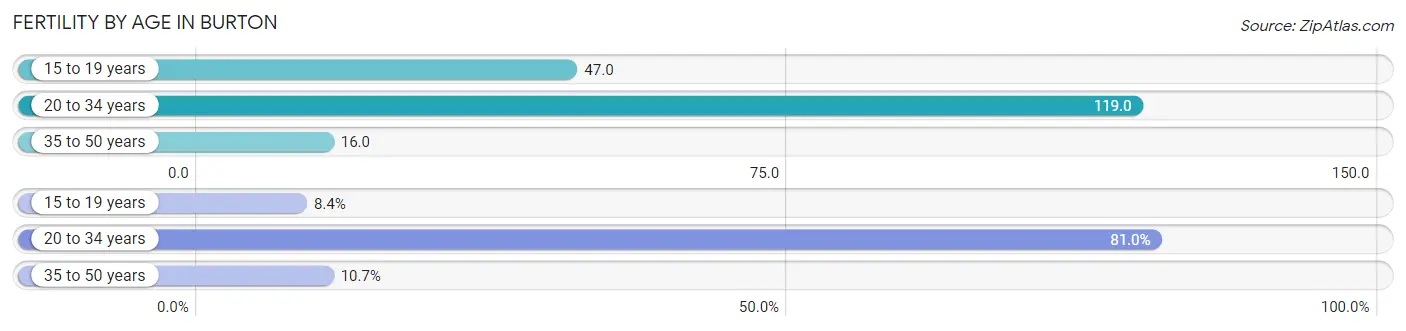
| Age Bracket | Women with Births | Births / 1,000 Women |
| 15 to 19 years | 37 (8.4%) | 47.0 |
| 20 to 34 years | 357 (80.9%) | 119.0 |
| 35 to 50 years | 47 (10.7%) | 16.0 |
| Total | 441 (100.0%) | 66.0 |
Fertility by Age by Marriage Status in Burton
46.0% of women with births (441) in Burton are married. The highest percentage of unmarried women with births falls into 15 to 19 years age bracket with 100.0% of them unmarried at the time of birth, while the lowest percentage of unmarried women with births belong to 35 to 50 years age bracket with 38.3% of them unmarried.
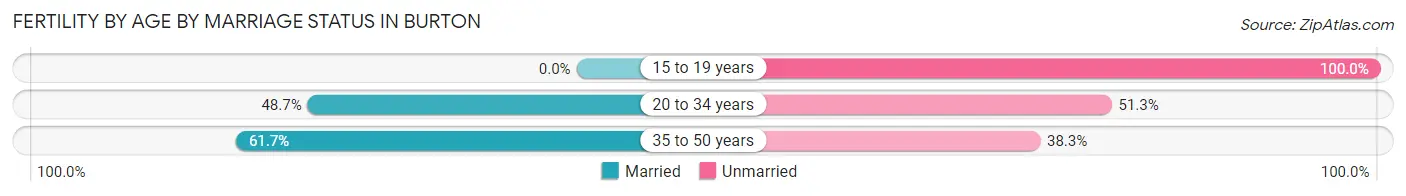
| Age Bracket | Married | Unmarried |
| 15 to 19 years | 0 (0.0%) | 37 (100.0%) |
| 20 to 34 years | 174 (48.7%) | 183 (51.3%) |
| 35 to 50 years | 29 (61.7%) | 18 (38.3%) |
| Total | 203 (46.0%) | 238 (54.0%) |
Fertility by Education in Burton
Average fertility rate in Burton is 66.0 births per 1,000 women. Women with the education attainment of graduate degree have the highest fertility rate of 251.0 births per 1,000 women, while women with the education attainment of college or associate's degree have the lowest fertility at 51.0 births per 1,000 women. Women with the education attainment of college or associate's degree represent 29.9% of all women with births.
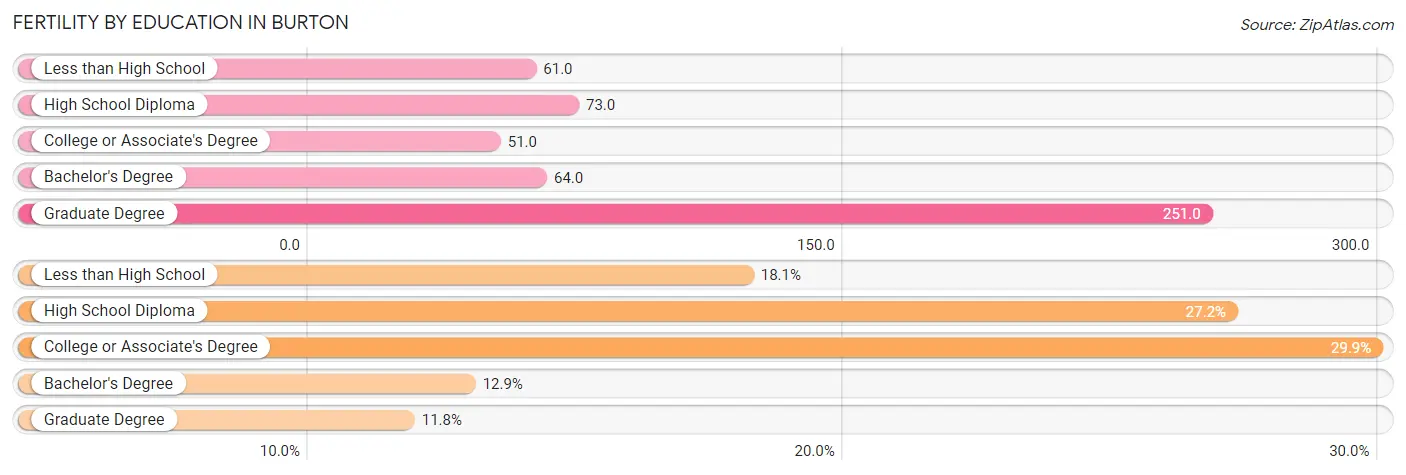
| Educational Attainment | Women with Births | Births / 1,000 Women |
| Less than High School | 80 (18.1%) | 61.0 |
| High School Diploma | 120 (27.2%) | 73.0 |
| College or Associate's Degree | 132 (29.9%) | 51.0 |
| Bachelor's Degree | 57 (12.9%) | 64.0 |
| Graduate Degree | 52 (11.8%) | 251.0 |
| Total | 441 (100.0%) | 66.0 |
Fertility by Education by Marriage Status in Burton
54.0% of women with births in Burton are unmarried. Women with the educational attainment of bachelor's degree are most likely to be married with 100.0% of them married at childbirth, while women with the educational attainment of less than high school are least likely to be married with 100.0% of them unmarried at childbirth.
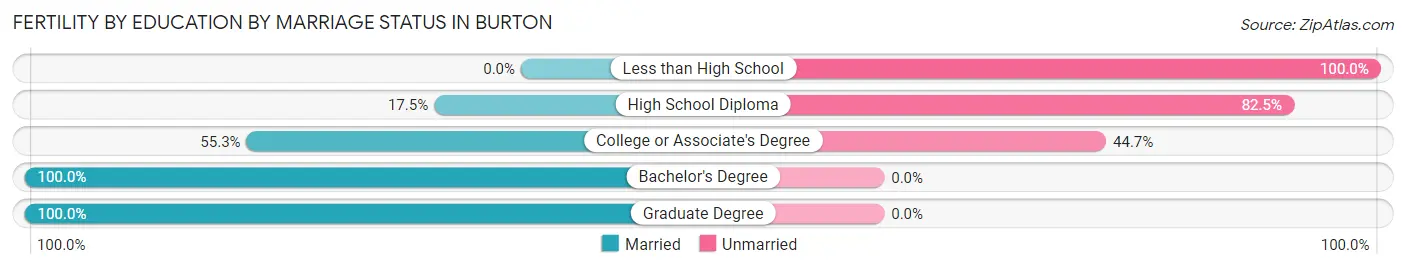
| Educational Attainment | Married | Unmarried |
| Less than High School | 0 (0.0%) | 80 (100.0%) |
| High School Diploma | 21 (17.5%) | 99 (82.5%) |
| College or Associate's Degree | 73 (55.3%) | 59 (44.7%) |
| Bachelor's Degree | 57 (100.0%) | 0 (0.0%) |
| Graduate Degree | 52 (100.0%) | 0 (0.0%) |
| Total | 203 (46.0%) | 238 (54.0%) |
Employment Characteristics in Burton
Employment by Class of Employer in Burton
Among the 13,152 employed individuals in Burton, private company employees (9,632 | 73.2%), not-for-profit organizations (1,005 | 7.6%), and self-employed (not incorporated) (729 | 5.5%) make up the most common classes of employment.
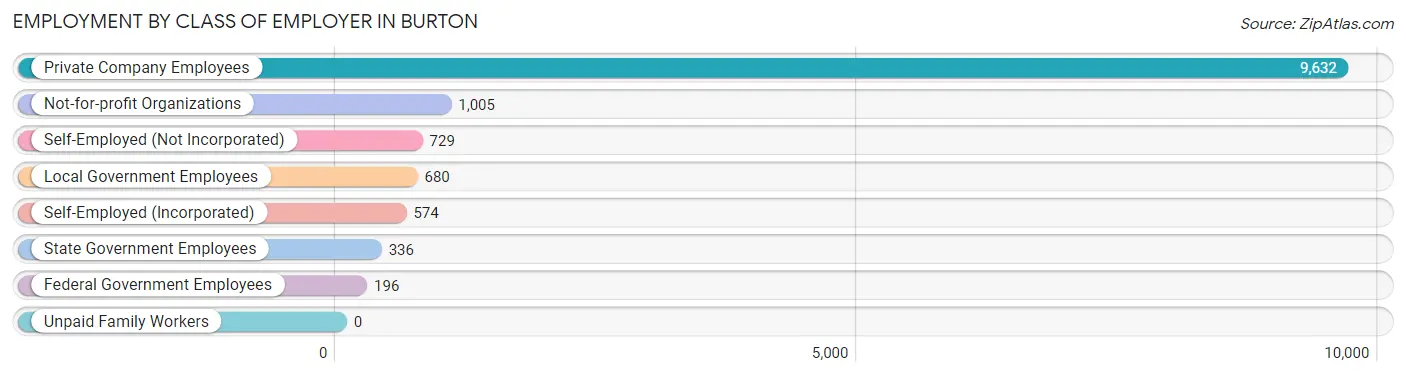
| Employer Class | # Employees | % Employees |
| Private Company Employees | 9,632 | 73.2% |
| Self-Employed (Incorporated) | 574 | 4.4% |
| Self-Employed (Not Incorporated) | 729 | 5.5% |
| Not-for-profit Organizations | 1,005 | 7.6% |
| Local Government Employees | 680 | 5.2% |
| State Government Employees | 336 | 2.5% |
| Federal Government Employees | 196 | 1.5% |
| Unpaid Family Workers | 0 | 0.0% |
| Total | 13,152 | 100.0% |
Employment Status by Age in Burton
According to the labor force statistics for Burton, out of the total population over 16 years of age (24,263), 59.1% or 14,339 individuals are in the labor force, with 7.1% or 1,018 of them unemployed. The age group with the highest labor force participation rate is 35 to 44 years, with 82.0% or 2,745 individuals in the labor force. Within the labor force, the 30 to 34 years age range has the highest percentage of unemployed individuals, with 10.6% or 181 of them being unemployed.
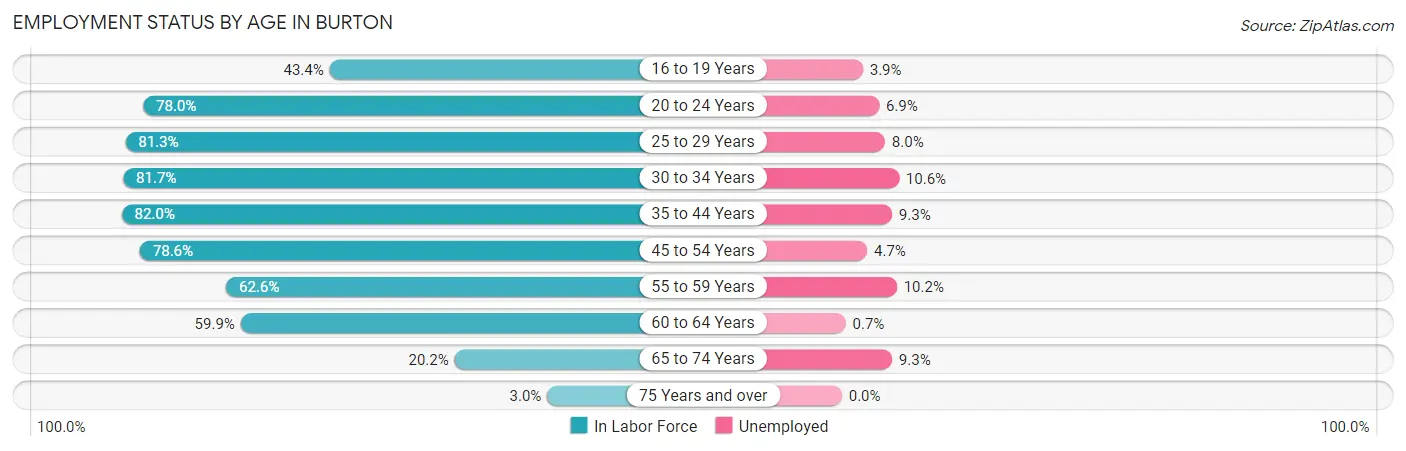
| Age Bracket | In Labor Force | Unemployed |
| 16 to 19 Years | 598 (43.4%) | 23 (3.9%) |
| 20 to 24 Years | 1,540 (78.0%) | 106 (6.9%) |
| 25 to 29 Years | 1,271 (81.3%) | 102 (8.0%) |
| 30 to 34 Years | 1,704 (81.7%) | 181 (10.6%) |
| 35 to 44 Years | 2,745 (82.0%) | 255 (9.3%) |
| 45 to 54 Years | 3,306 (78.6%) | 155 (4.7%) |
| 55 to 59 Years | 1,244 (62.6%) | 127 (10.2%) |
| 60 to 64 Years | 1,258 (59.9%) | 9 (0.7%) |
| 65 to 74 Years | 604 (20.2%) | 56 (9.3%) |
| 75 Years and over | 79 (3.0%) | 0 (0.0%) |
| Total | 14,339 (59.1%) | 1,018 (7.1%) |
Employment Status by Educational Attainment in Burton
According to labor force statistics for Burton, 75.4% of individuals (11,529) out of the total population between 25 and 64 years of age (15,291) are in the labor force, with 7.2% or 830 of them being unemployed. The group with the highest labor force participation rate are those with the educational attainment of bachelor's degree or higher, with 82.9% or 2,202 individuals in the labor force. Within the labor force, individuals with less than high school education have the highest percentage of unemployment, with 11.9% or 91 of them being unemployed.
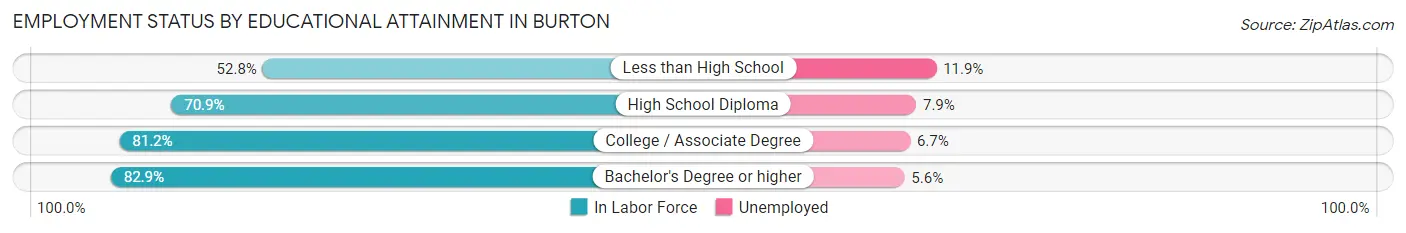
| Educational Attainment | In Labor Force | Unemployed |
| Less than High School | 767 (52.8%) | 173 (11.9%) |
| High School Diploma | 3,583 (70.9%) | 399 (7.9%) |
| College / Associate Degree | 4,978 (81.2%) | 411 (6.7%) |
| Bachelor's Degree or higher | 2,202 (82.9%) | 149 (5.6%) |
| Total | 11,529 (75.4%) | 1,101 (7.2%) |
Employment Occupations by Sex in Burton
Management, Business, Science and Arts Occupations
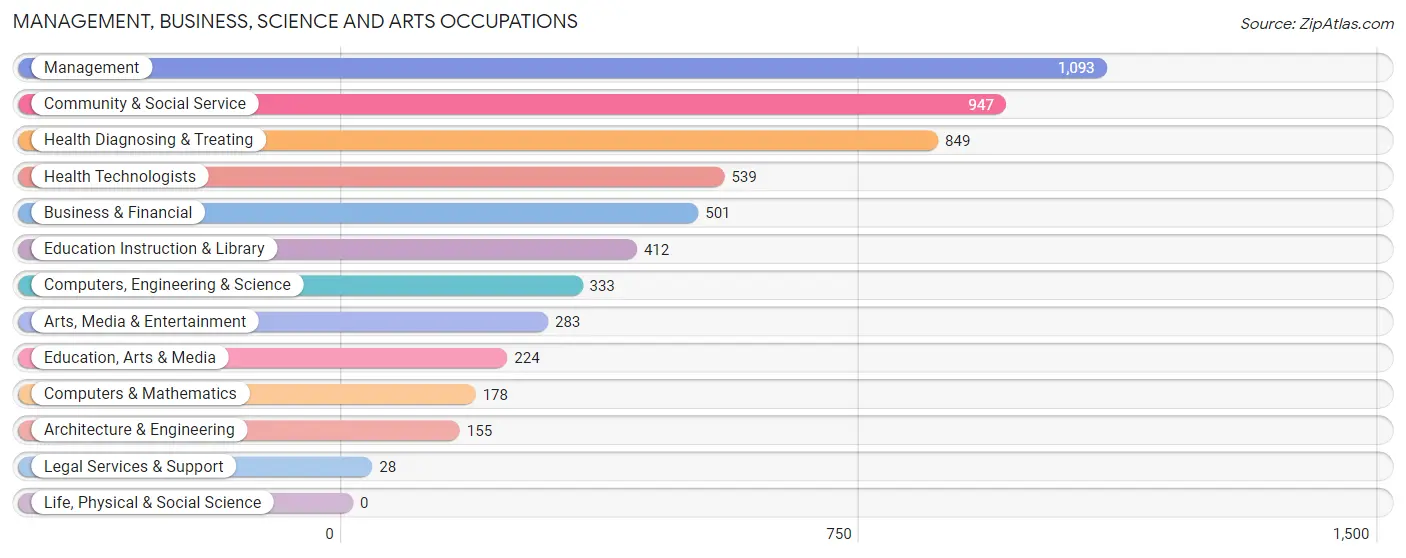
The most common Management, Business, Science and Arts occupations in Burton are Management (1,093 | 8.2%), Community & Social Service (947 | 7.1%), Health Diagnosing & Treating (849 | 6.4%), Health Technologists (539 | 4.1%), and Business & Financial (501 | 3.8%).
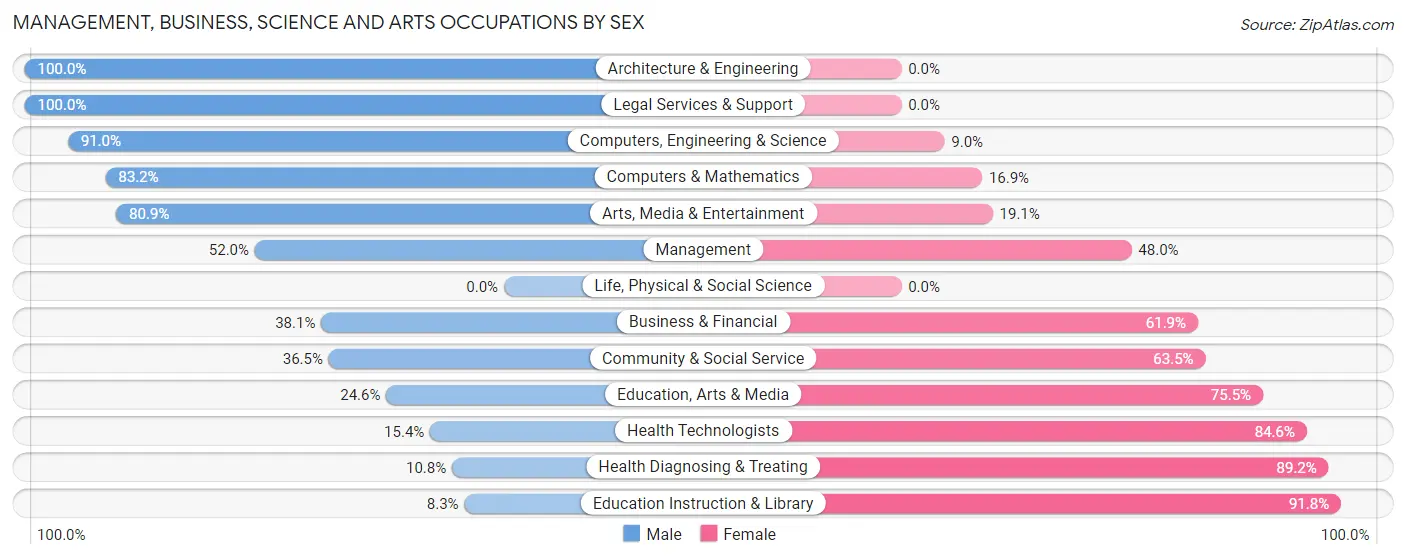
Management, Business, Science and Arts Occupations by Sex
Within the Management, Business, Science and Arts occupations in Burton, the most male-oriented occupations are Architecture & Engineering (100.0%), Legal Services & Support (100.0%), and Computers, Engineering & Science (91.0%), while the most female-oriented occupations are Education Instruction & Library (91.7%), Health Diagnosing & Treating (89.2%), and Health Technologists (84.6%).
| Occupation | Male | Female |
| Management | 568 (52.0%) | 525 (48.0%) |
| Business & Financial | 191 (38.1%) | 310 (61.9%) |
| Computers, Engineering & Science | 303 (91.0%) | 30 (9.0%) |
| Computers & Mathematics | 148 (83.2%) | 30 (16.9%) |
| Architecture & Engineering | 155 (100.0%) | 0 (0.0%) |
| Life, Physical & Social Science | 0 (0.0%) | 0 (0.0%) |
| Community & Social Service | 346 (36.5%) | 601 (63.5%) |
| Education, Arts & Media | 55 (24.5%) | 169 (75.4%) |
| Legal Services & Support | 28 (100.0%) | 0 (0.0%) |
| Education Instruction & Library | 34 (8.3%) | 378 (91.7%) |
| Arts, Media & Entertainment | 229 (80.9%) | 54 (19.1%) |
| Health Diagnosing & Treating | 92 (10.8%) | 757 (89.2%) |
| Health Technologists | 83 (15.4%) | 456 (84.6%) |
| Total (Category) | 1,500 (40.3%) | 2,223 (59.7%) |
| Total (Overall) | 6,752 (50.7%) | 6,563 (49.3%) |
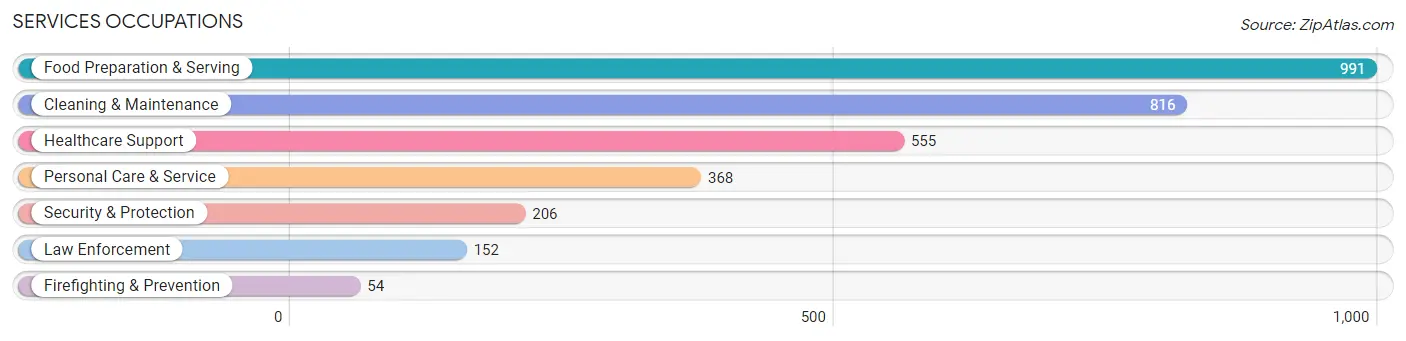
Services Occupations
The most common Services occupations in Burton are Food Preparation & Serving (991 | 7.4%), Cleaning & Maintenance (816 | 6.1%), Healthcare Support (555 | 4.2%), Personal Care & Service (368 | 2.8%), and Security & Protection (206 | 1.5%).
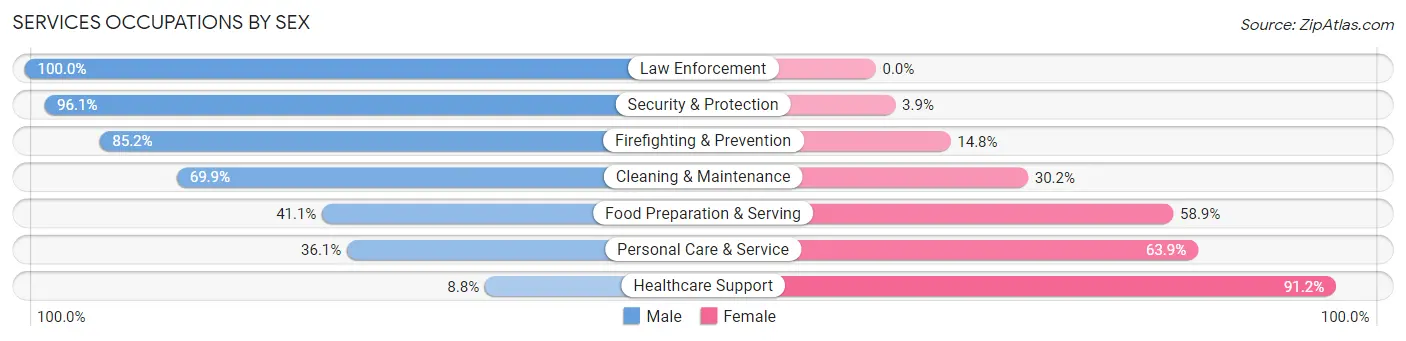
Services Occupations by Sex
Within the Services occupations in Burton, the most male-oriented occupations are Law Enforcement (100.0%), Security & Protection (96.1%), and Firefighting & Prevention (85.2%), while the most female-oriented occupations are Healthcare Support (91.2%), Personal Care & Service (63.9%), and Food Preparation & Serving (58.9%).
| Occupation | Male | Female |
| Healthcare Support | 49 (8.8%) | 506 (91.2%) |
| Security & Protection | 198 (96.1%) | 8 (3.9%) |
| Firefighting & Prevention | 46 (85.2%) | 8 (14.8%) |
| Law Enforcement | 152 (100.0%) | 0 (0.0%) |
| Food Preparation & Serving | 407 (41.1%) | 584 (58.9%) |
| Cleaning & Maintenance | 570 (69.9%) | 246 (30.1%) |
| Personal Care & Service | 133 (36.1%) | 235 (63.9%) |
| Total (Category) | 1,357 (46.2%) | 1,579 (53.8%) |
| Total (Overall) | 6,752 (50.7%) | 6,563 (49.3%) |
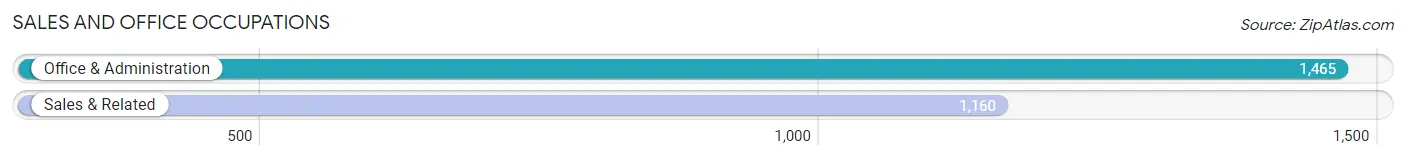
Sales and Office Occupations
The most common Sales and Office occupations in Burton are Office & Administration (1,465 | 11.0%), and Sales & Related (1,160 | 8.7%).
Sales and Office Occupations by Sex
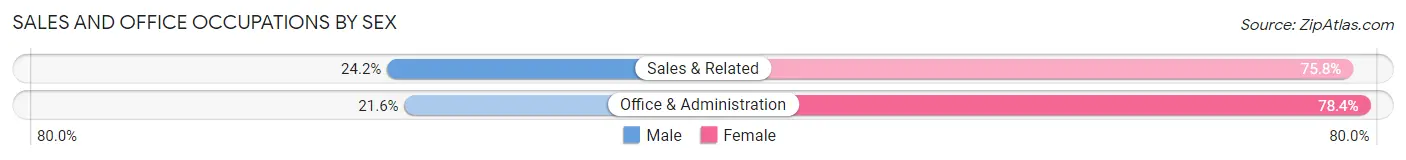
| Occupation | Male | Female |
| Sales & Related | 281 (24.2%) | 879 (75.8%) |
| Office & Administration | 316 (21.6%) | 1,149 (78.4%) |
| Total (Category) | 597 (22.7%) | 2,028 (77.3%) |
| Total (Overall) | 6,752 (50.7%) | 6,563 (49.3%) |
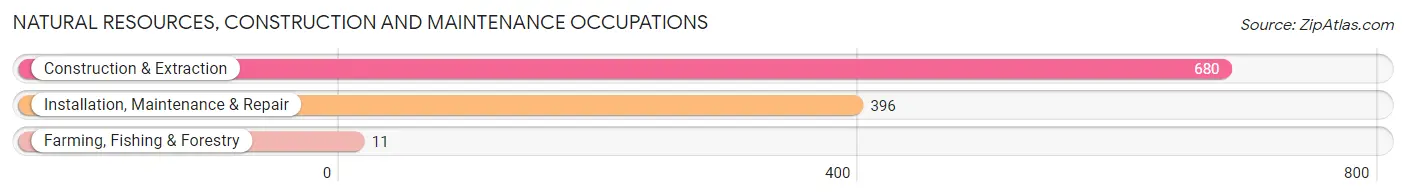
Natural Resources, Construction and Maintenance Occupations
The most common Natural Resources, Construction and Maintenance occupations in Burton are Construction & Extraction (680 | 5.1%), Installation, Maintenance & Repair (396 | 3.0%), and Farming, Fishing & Forestry (11 | 0.1%).
Natural Resources, Construction and Maintenance Occupations by Sex
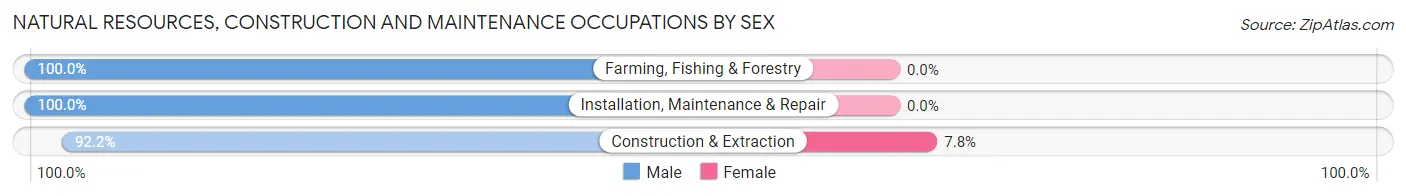
| Occupation | Male | Female |
| Farming, Fishing & Forestry | 11 (100.0%) | 0 (0.0%) |
| Construction & Extraction | 627 (92.2%) | 53 (7.8%) |
| Installation, Maintenance & Repair | 396 (100.0%) | 0 (0.0%) |
| Total (Category) | 1,034 (95.1%) | 53 (4.9%) |
| Total (Overall) | 6,752 (50.7%) | 6,563 (49.3%) |
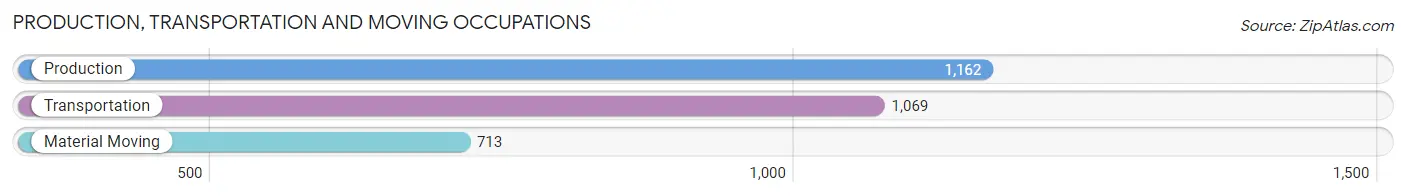
Production, Transportation and Moving Occupations
The most common Production, Transportation and Moving occupations in Burton are Production (1,162 | 8.7%), Transportation (1,069 | 8.0%), and Material Moving (713 | 5.3%).
Production, Transportation and Moving Occupations by Sex
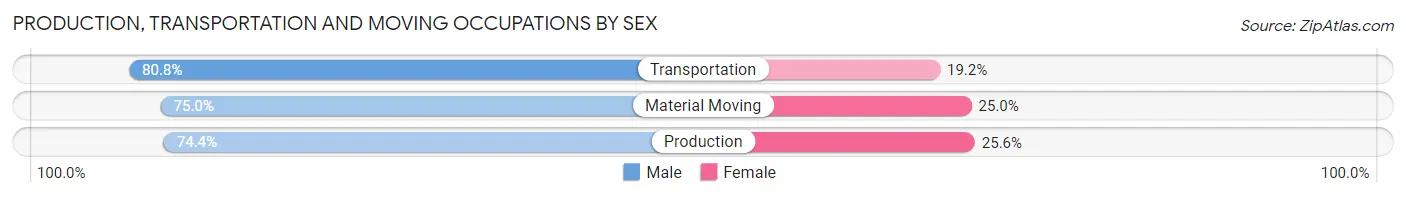
| Occupation | Male | Female |
| Production | 865 (74.4%) | 297 (25.6%) |
| Transportation | 864 (80.8%) | 205 (19.2%) |
| Material Moving | 535 (75.0%) | 178 (25.0%) |
| Total (Category) | 2,264 (76.9%) | 680 (23.1%) |
| Total (Overall) | 6,752 (50.7%) | 6,563 (49.3%) |
Employment Industries by Sex in Burton
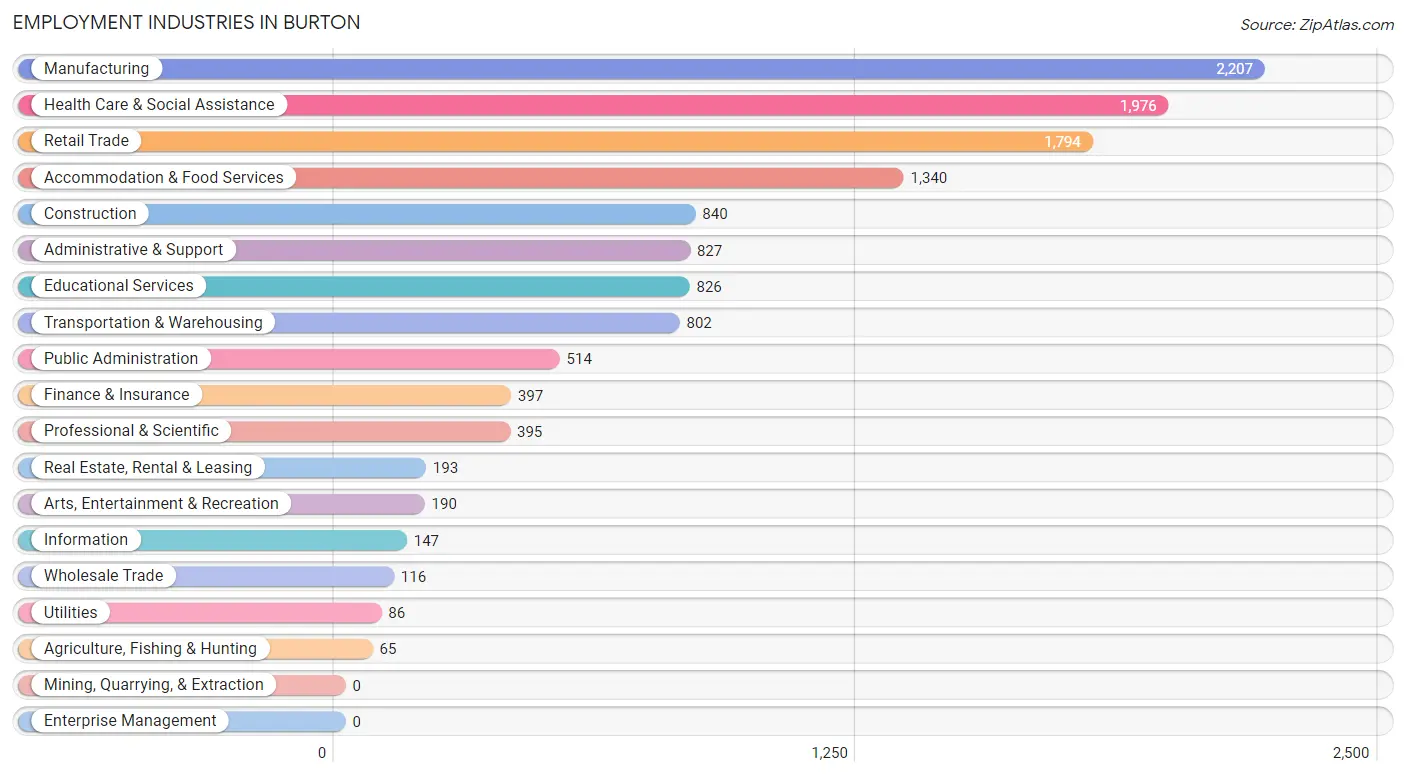
Employment Industries in Burton
The major employment industries in Burton include Manufacturing (2,207 | 16.6%), Health Care & Social Assistance (1,976 | 14.8%), Retail Trade (1,794 | 13.5%), Accommodation & Food Services (1,340 | 10.1%), and Construction (840 | 6.3%).
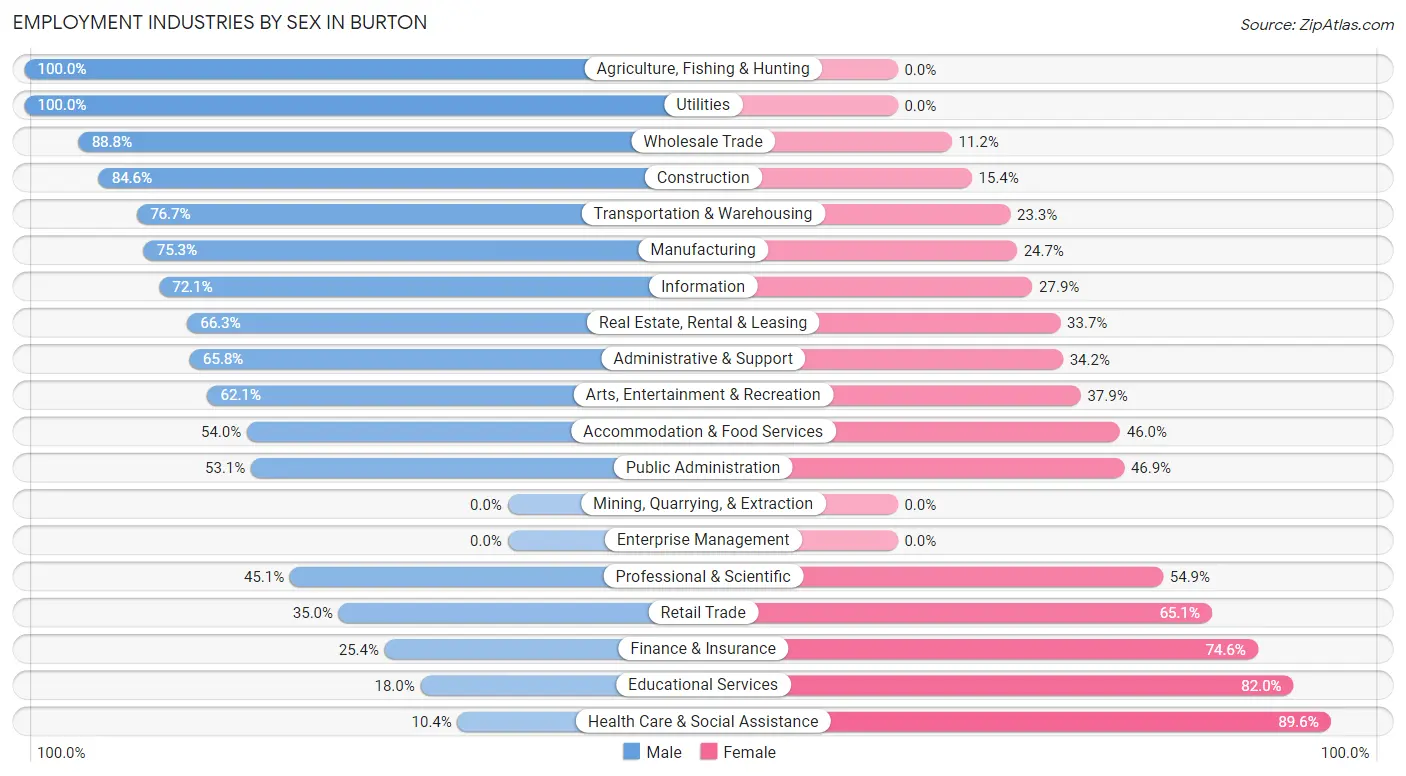
Employment Industries by Sex in Burton
The Burton industries that see more men than women are Agriculture, Fishing & Hunting (100.0%), Utilities (100.0%), and Wholesale Trade (88.8%), whereas the industries that tend to have a higher number of women are Health Care & Social Assistance (89.6%), Educational Services (82.0%), and Finance & Insurance (74.6%).
| Industry | Male | Female |
| Agriculture, Fishing & Hunting | 65 (100.0%) | 0 (0.0%) |
| Mining, Quarrying, & Extraction | 0 (0.0%) | 0 (0.0%) |
| Construction | 711 (84.6%) | 129 (15.4%) |
| Manufacturing | 1,662 (75.3%) | 545 (24.7%) |
| Wholesale Trade | 103 (88.8%) | 13 (11.2%) |
| Retail Trade | 627 (34.9%) | 1,167 (65.0%) |
| Transportation & Warehousing | 615 (76.7%) | 187 (23.3%) |
| Utilities | 86 (100.0%) | 0 (0.0%) |
| Information | 106 (72.1%) | 41 (27.9%) |
| Finance & Insurance | 101 (25.4%) | 296 (74.6%) |
| Real Estate, Rental & Leasing | 128 (66.3%) | 65 (33.7%) |
| Professional & Scientific | 178 (45.1%) | 217 (54.9%) |
| Enterprise Management | 0 (0.0%) | 0 (0.0%) |
| Administrative & Support | 544 (65.8%) | 283 (34.2%) |
| Educational Services | 149 (18.0%) | 677 (82.0%) |
| Health Care & Social Assistance | 205 (10.4%) | 1,771 (89.6%) |
| Arts, Entertainment & Recreation | 118 (62.1%) | 72 (37.9%) |
| Accommodation & Food Services | 723 (54.0%) | 617 (46.0%) |
| Public Administration | 273 (53.1%) | 241 (46.9%) |
| Total | 6,752 (50.7%) | 6,563 (49.3%) |
Education in Burton
School Enrollment in Burton
The most common levels of schooling among the 5,954 students in Burton are high school (1,388 | 23.3%), elementary school (1,314 | 22.1%), and middle school (1,313 | 22.1%).
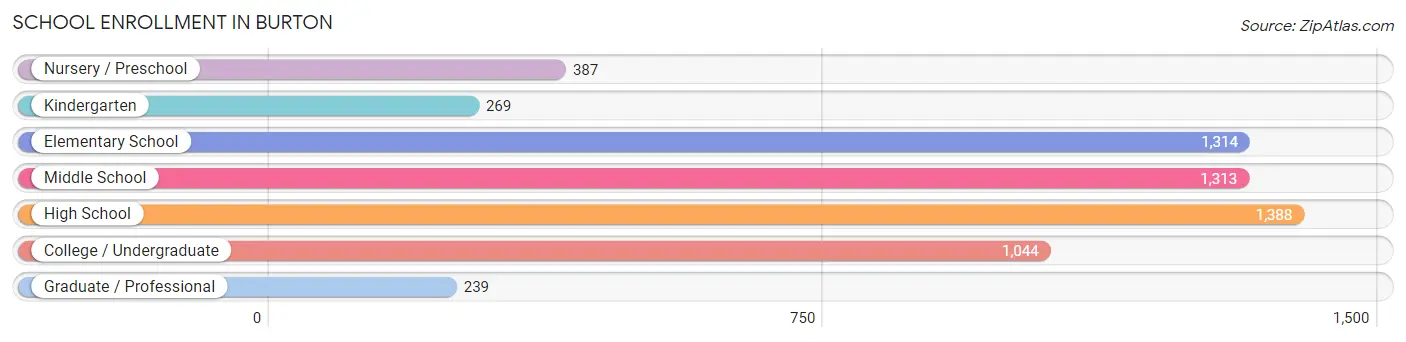
| School Level | # Students | % Students |
| Nursery / Preschool | 387 | 6.5% |
| Kindergarten | 269 | 4.5% |
| Elementary School | 1,314 | 22.1% |
| Middle School | 1,313 | 22.1% |
| High School | 1,388 | 23.3% |
| College / Undergraduate | 1,044 | 17.5% |
| Graduate / Professional | 239 | 4.0% |
| Total | 5,954 | 100.0% |
School Enrollment by Age by Funding Source in Burton
Out of a total of 5,954 students who are enrolled in schools in Burton, 625 (10.5%) attend a private institution, while the remaining 5,329 (89.5%) are enrolled in public schools. The age group of 35 years and over has the highest likelihood of being enrolled in private schools, with 101 (36.3% in the age bracket) enrolled. Conversely, the age group of 10 to 14 year olds has the lowest likelihood of being enrolled in a private school, with 1,484 (98.9% in the age bracket) attending a public institution.
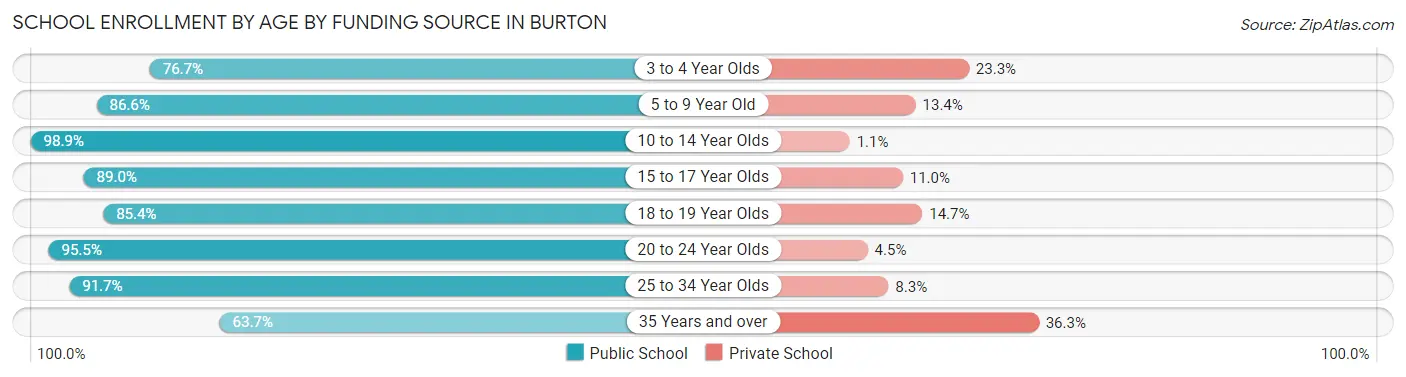
| Age Bracket | Public School | Private School |
| 3 to 4 Year Olds | 230 (76.7%) | 70 (23.3%) |
| 5 to 9 Year Old | 1,357 (86.6%) | 210 (13.4%) |
| 10 to 14 Year Olds | 1,484 (98.9%) | 17 (1.1%) |
| 15 to 17 Year Olds | 986 (89.0%) | 122 (11.0%) |
| 18 to 19 Year Olds | 332 (85.4%) | 57 (14.6%) |
| 20 to 24 Year Olds | 534 (95.5%) | 25 (4.5%) |
| 25 to 34 Year Olds | 231 (91.7%) | 21 (8.3%) |
| 35 Years and over | 177 (63.7%) | 101 (36.3%) |
| Total | 5,329 (89.5%) | 625 (10.5%) |
Educational Attainment by Field of Study in Burton
Education (676 | 19.0%), science & technology (660 | 18.5%), business (545 | 15.3%), arts & humanities (380 | 10.6%), and engineering (243 | 6.8%) are the most common fields of study among 3,567 individuals in Burton who have obtained a bachelor's degree or higher.
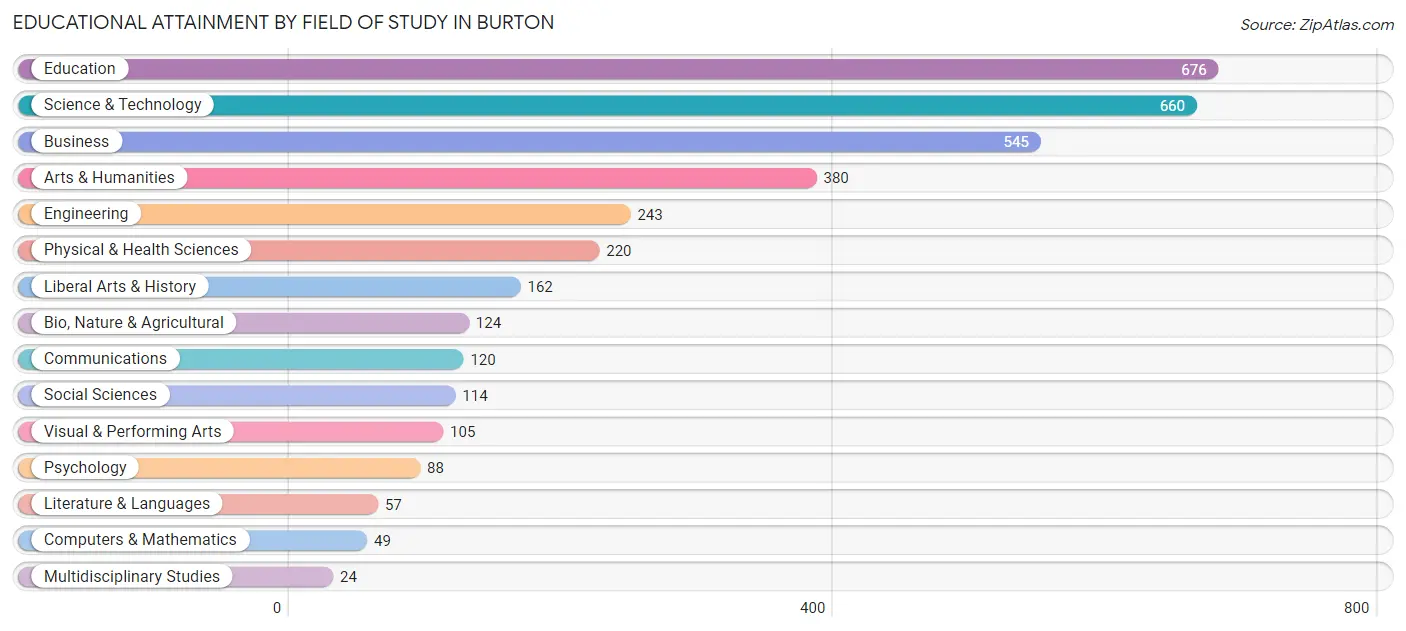
| Field of Study | # Graduates | % Graduates |
| Computers & Mathematics | 49 | 1.4% |
| Bio, Nature & Agricultural | 124 | 3.5% |
| Physical & Health Sciences | 220 | 6.2% |
| Psychology | 88 | 2.5% |
| Social Sciences | 114 | 3.2% |
| Engineering | 243 | 6.8% |
| Multidisciplinary Studies | 24 | 0.7% |
| Science & Technology | 660 | 18.5% |
| Business | 545 | 15.3% |
| Education | 676 | 19.0% |
| Literature & Languages | 57 | 1.6% |
| Liberal Arts & History | 162 | 4.5% |
| Visual & Performing Arts | 105 | 2.9% |
| Communications | 120 | 3.4% |
| Arts & Humanities | 380 | 10.6% |
| Total | 3,567 | 100.0% |
Transportation & Commute in Burton
Vehicle Availability by Sex in Burton
The most prevalent vehicle ownership categories in Burton are males with 2 vehicles (2,997, accounting for 44.9%) and females with 2 vehicles (2,979, making up 46.4%).
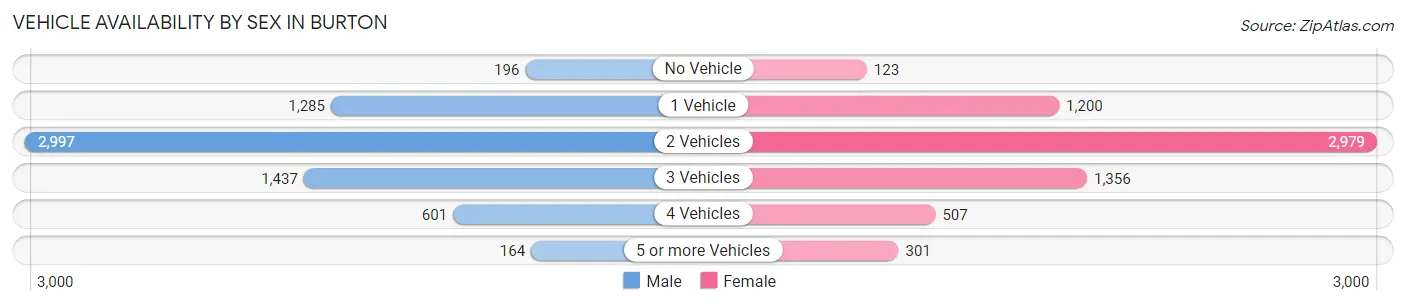
| Vehicles Available | Male | Female |
| No Vehicle | 196 (2.9%) | 123 (1.9%) |
| 1 Vehicle | 1,285 (19.2%) | 1,200 (18.6%) |
| 2 Vehicles | 2,997 (44.9%) | 2,979 (46.1%) |
| 3 Vehicles | 1,437 (21.5%) | 1,356 (21.0%) |
| 4 Vehicles | 601 (9.0%) | 507 (7.8%) |
| 5 or more Vehicles | 164 (2.5%) | 301 (4.7%) |
| Total | 6,680 (100.0%) | 6,466 (100.0%) |
Commute Time in Burton
The most frequently occuring commute durations in Burton are 15 to 19 minutes (2,679 commuters, 21.6%), 10 to 14 minutes (2,028 commuters, 16.4%), and 20 to 24 minutes (1,921 commuters, 15.5%).
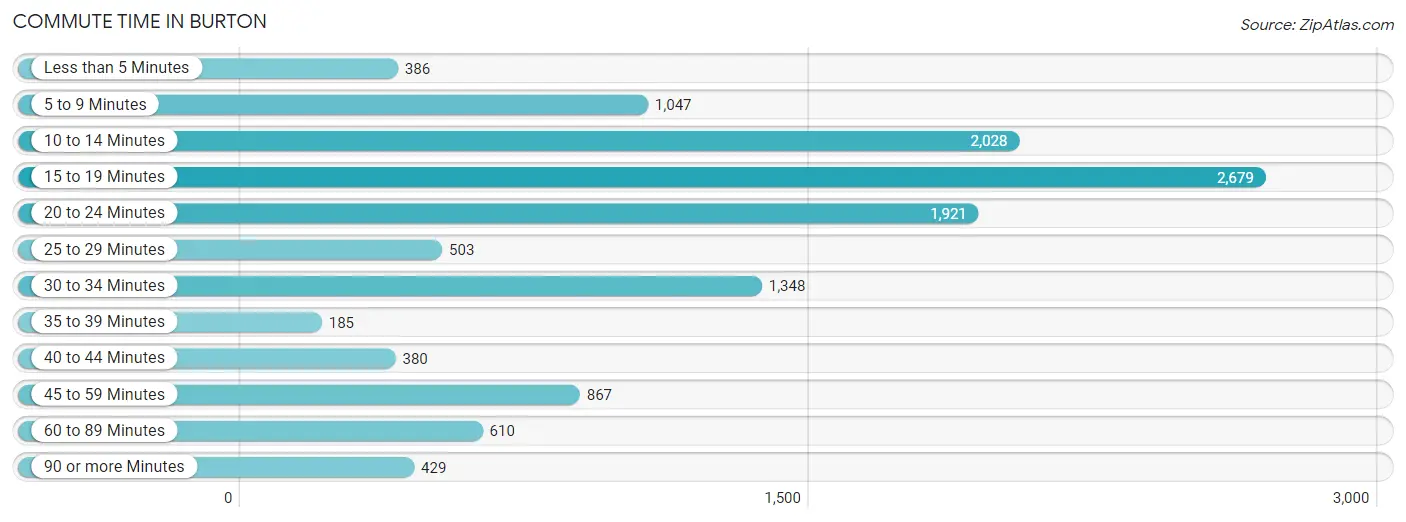
| Commute Time | # Commuters | % Commuters |
| Less than 5 Minutes | 386 | 3.1% |
| 5 to 9 Minutes | 1,047 | 8.5% |
| 10 to 14 Minutes | 2,028 | 16.4% |
| 15 to 19 Minutes | 2,679 | 21.6% |
| 20 to 24 Minutes | 1,921 | 15.5% |
| 25 to 29 Minutes | 503 | 4.1% |
| 30 to 34 Minutes | 1,348 | 10.9% |
| 35 to 39 Minutes | 185 | 1.5% |
| 40 to 44 Minutes | 380 | 3.1% |
| 45 to 59 Minutes | 867 | 7.0% |
| 60 to 89 Minutes | 610 | 4.9% |
| 90 or more Minutes | 429 | 3.5% |
Commute Time by Sex in Burton
The most common commute times in Burton are 15 to 19 minutes (1,484 commuters, 23.1%) for males and 15 to 19 minutes (1,195 commuters, 20.1%) for females.
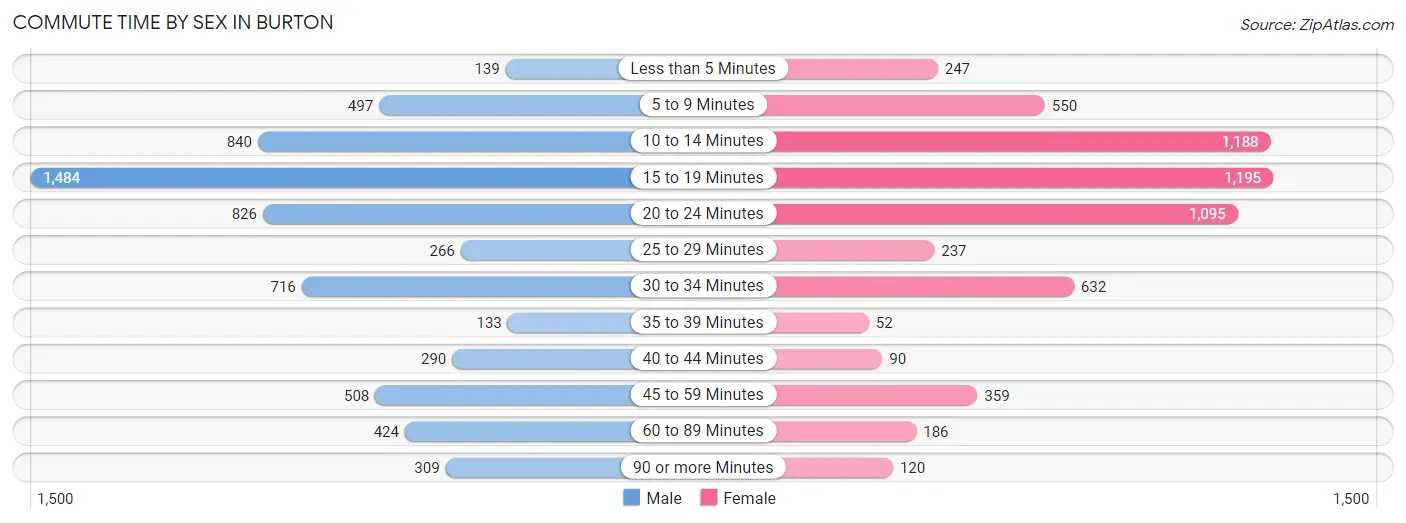
| Commute Time | Male | Female |
| Less than 5 Minutes | 139 (2.2%) | 247 (4.2%) |
| 5 to 9 Minutes | 497 (7.7%) | 550 (9.2%) |
| 10 to 14 Minutes | 840 (13.1%) | 1,188 (20.0%) |
| 15 to 19 Minutes | 1,484 (23.1%) | 1,195 (20.1%) |
| 20 to 24 Minutes | 826 (12.8%) | 1,095 (18.4%) |
| 25 to 29 Minutes | 266 (4.1%) | 237 (4.0%) |
| 30 to 34 Minutes | 716 (11.1%) | 632 (10.6%) |
| 35 to 39 Minutes | 133 (2.1%) | 52 (0.9%) |
| 40 to 44 Minutes | 290 (4.5%) | 90 (1.5%) |
| 45 to 59 Minutes | 508 (7.9%) | 359 (6.0%) |
| 60 to 89 Minutes | 424 (6.6%) | 186 (3.1%) |
| 90 or more Minutes | 309 (4.8%) | 120 (2.0%) |
Time of Departure to Work by Sex in Burton
The most frequent times of departure to work in Burton are 6:30 AM to 6:59 AM (849, 13.2%) for males and 12:00 PM to 3:59 PM (739, 12.4%) for females.
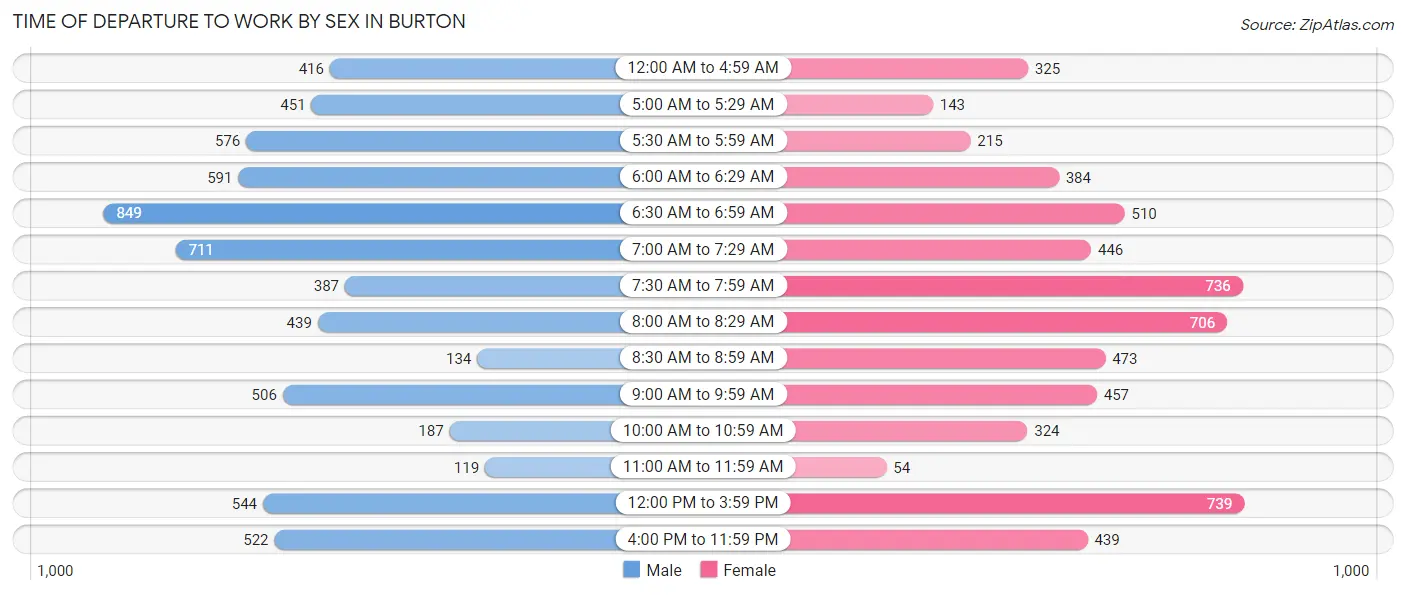
| Time of Departure | Male | Female |
| 12:00 AM to 4:59 AM | 416 (6.5%) | 325 (5.5%) |
| 5:00 AM to 5:29 AM | 451 (7.0%) | 143 (2.4%) |
| 5:30 AM to 5:59 AM | 576 (9.0%) | 215 (3.6%) |
| 6:00 AM to 6:29 AM | 591 (9.2%) | 384 (6.5%) |
| 6:30 AM to 6:59 AM | 849 (13.2%) | 510 (8.6%) |
| 7:00 AM to 7:29 AM | 711 (11.1%) | 446 (7.5%) |
| 7:30 AM to 7:59 AM | 387 (6.0%) | 736 (12.4%) |
| 8:00 AM to 8:29 AM | 439 (6.8%) | 706 (11.9%) |
| 8:30 AM to 8:59 AM | 134 (2.1%) | 473 (8.0%) |
| 9:00 AM to 9:59 AM | 506 (7.9%) | 457 (7.7%) |
| 10:00 AM to 10:59 AM | 187 (2.9%) | 324 (5.4%) |
| 11:00 AM to 11:59 AM | 119 (1.8%) | 54 (0.9%) |
| 12:00 PM to 3:59 PM | 544 (8.5%) | 739 (12.4%) |
| 4:00 PM to 11:59 PM | 522 (8.1%) | 439 (7.4%) |
| Total | 6,432 (100.0%) | 5,951 (100.0%) |
Housing Occupancy in Burton
Occupancy by Ownership in Burton
Of the total 12,522 dwellings in Burton, owner-occupied units account for 9,262 (74.0%), while renter-occupied units make up 3,260 (26.0%).
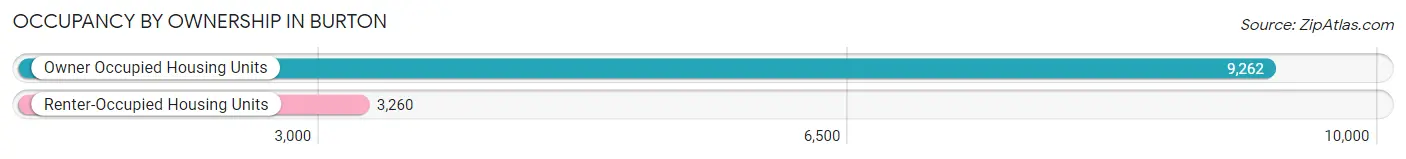
| Occupancy | # Housing Units | % Housing Units |
| Owner Occupied Housing Units | 9,262 | 74.0% |
| Renter-Occupied Housing Units | 3,260 | 26.0% |
| Total Occupied Housing Units | 12,522 | 100.0% |
Occupancy by Household Size in Burton
| Household Size | # Housing Units | % Housing Units |
| 1-Person Household | 4,238 | 33.8% |
| 2-Person Household | 4,188 | 33.5% |
| 3-Person Household | 1,878 | 15.0% |
| 4+ Person Household | 2,218 | 17.7% |
| Total Housing Units | 12,522 | 100.0% |
Occupancy by Ownership by Household Size in Burton
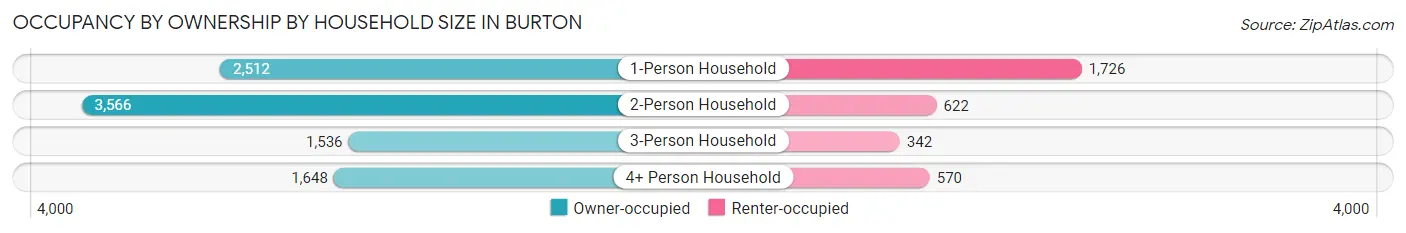
| Household Size | Owner-occupied | Renter-occupied |
| 1-Person Household | 2,512 (59.3%) | 1,726 (40.7%) |
| 2-Person Household | 3,566 (85.2%) | 622 (14.8%) |
| 3-Person Household | 1,536 (81.8%) | 342 (18.2%) |
| 4+ Person Household | 1,648 (74.3%) | 570 (25.7%) |
| Total Housing Units | 9,262 (74.0%) | 3,260 (26.0%) |
Occupancy by Educational Attainment in Burton
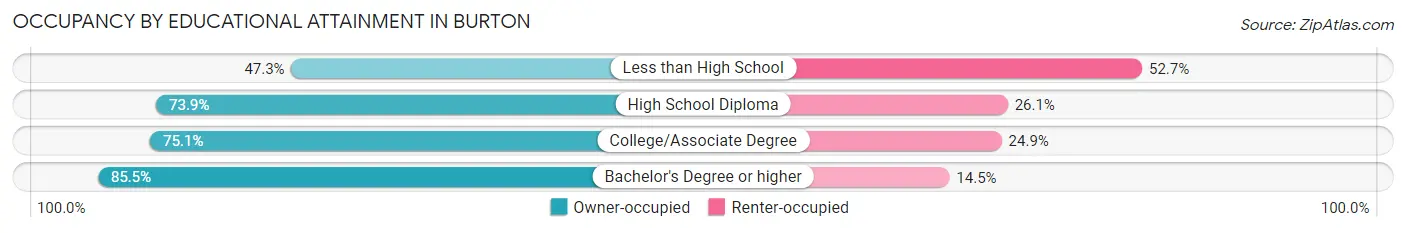
| Household Size | Owner-occupied | Renter-occupied |
| Less than High School | 489 (47.3%) | 545 (52.7%) |
| High School Diploma | 3,432 (73.9%) | 1,211 (26.1%) |
| College/Associate Degree | 3,699 (75.1%) | 1,225 (24.9%) |
| Bachelor's Degree or higher | 1,642 (85.5%) | 279 (14.5%) |
Occupancy by Age of Householder in Burton
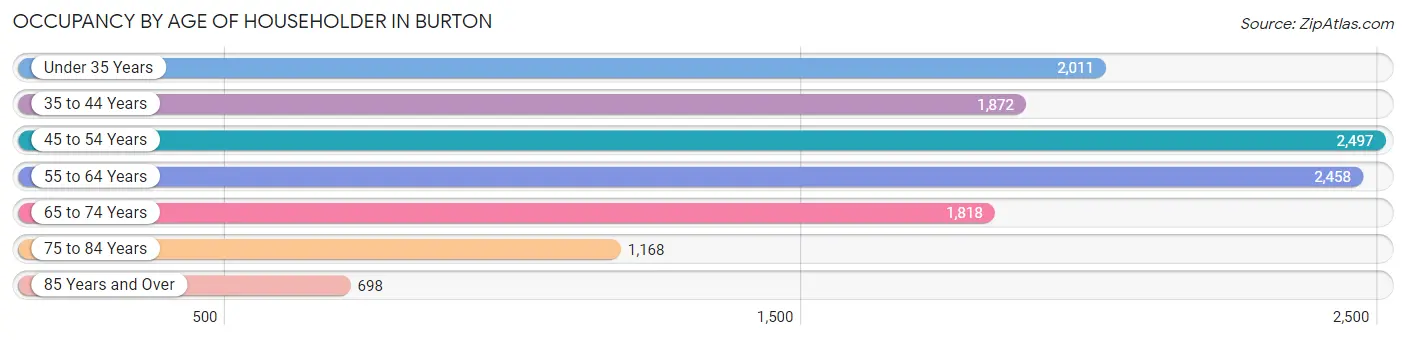
| Age Bracket | # Households | % Households |
| Under 35 Years | 2,011 | 16.1% |
| 35 to 44 Years | 1,872 | 14.9% |
| 45 to 54 Years | 2,497 | 19.9% |
| 55 to 64 Years | 2,458 | 19.6% |
| 65 to 74 Years | 1,818 | 14.5% |
| 75 to 84 Years | 1,168 | 9.3% |
| 85 Years and Over | 698 | 5.6% |
| Total | 12,522 | 100.0% |
Housing Finances in Burton
Median Income by Occupancy in Burton
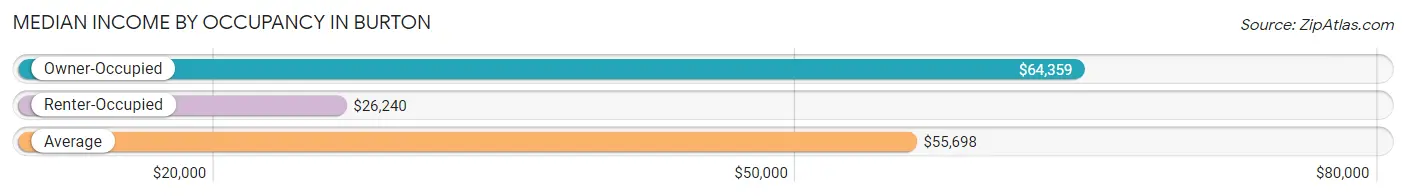
| Occupancy Type | # Households | Median Income |
| Owner-Occupied | 9,262 (74.0%) | $64,359 |
| Renter-Occupied | 3,260 (26.0%) | $26,240 |
| Average | 12,522 (100.0%) | $55,698 |
Occupancy by Householder Income Bracket in Burton
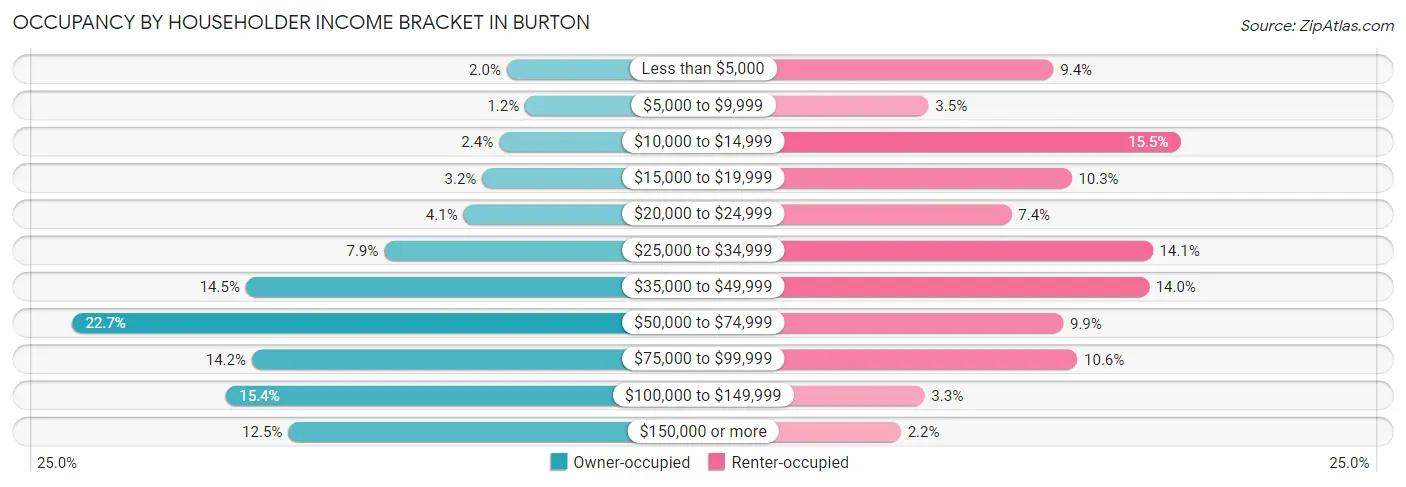
| Income Bracket | Owner-occupied | Renter-occupied |
| Less than $5,000 | 189 (2.0%) | 307 (9.4%) |
| $5,000 to $9,999 | 108 (1.2%) | 113 (3.5%) |
| $10,000 to $14,999 | 223 (2.4%) | 504 (15.5%) |
| $15,000 to $19,999 | 297 (3.2%) | 335 (10.3%) |
| $20,000 to $24,999 | 380 (4.1%) | 242 (7.4%) |
| $25,000 to $34,999 | 730 (7.9%) | 461 (14.1%) |
| $35,000 to $49,999 | 1,340 (14.5%) | 455 (14.0%) |
| $50,000 to $74,999 | 2,104 (22.7%) | 322 (9.9%) |
| $75,000 to $99,999 | 1,313 (14.2%) | 344 (10.5%) |
| $100,000 to $149,999 | 1,425 (15.4%) | 107 (3.3%) |
| $150,000 or more | 1,153 (12.4%) | 70 (2.1%) |
| Total | 9,262 (100.0%) | 3,260 (100.0%) |
Monthly Housing Cost Tiers in Burton
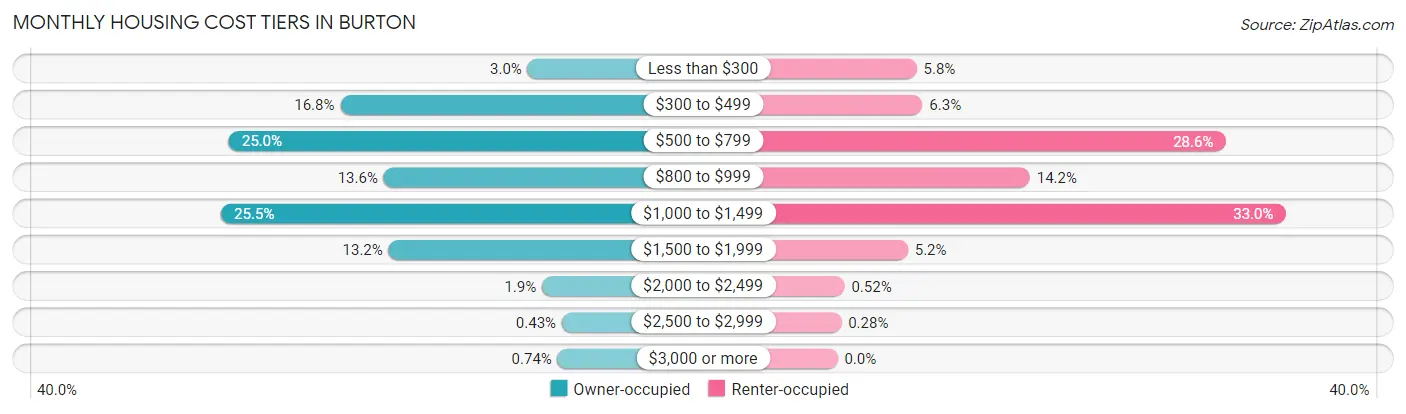
| Monthly Cost | Owner-occupied | Renter-occupied |
| Less than $300 | 273 (2.9%) | 190 (5.8%) |
| $300 to $499 | 1,551 (16.8%) | 204 (6.3%) |
| $500 to $799 | 2,312 (25.0%) | 931 (28.6%) |
| $800 to $999 | 1,255 (13.6%) | 462 (14.2%) |
| $1,000 to $1,499 | 2,365 (25.5%) | 1,075 (33.0%) |
| $1,500 to $1,999 | 1,222 (13.2%) | 169 (5.2%) |
| $2,000 to $2,499 | 175 (1.9%) | 17 (0.5%) |
| $2,500 to $2,999 | 40 (0.4%) | 9 (0.3%) |
| $3,000 or more | 69 (0.7%) | 0 (0.0%) |
| Total | 9,262 (100.0%) | 3,260 (100.0%) |
Physical Housing Characteristics in Burton
Housing Structures in Burton
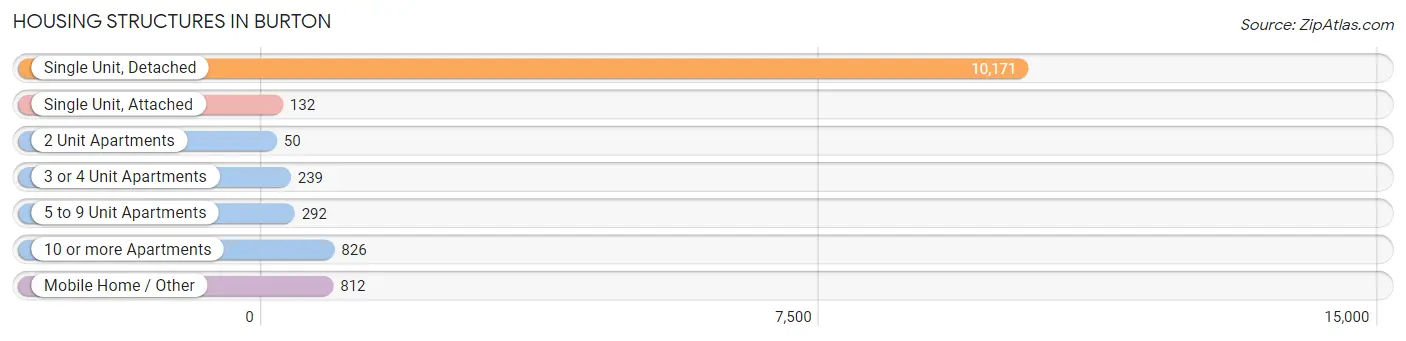
| Structure Type | # Housing Units | % Housing Units |
| Single Unit, Detached | 10,171 | 81.2% |
| Single Unit, Attached | 132 | 1.1% |
| 2 Unit Apartments | 50 | 0.4% |
| 3 or 4 Unit Apartments | 239 | 1.9% |
| 5 to 9 Unit Apartments | 292 | 2.3% |
| 10 or more Apartments | 826 | 6.6% |
| Mobile Home / Other | 812 | 6.5% |
| Total | 12,522 | 100.0% |
Housing Structures by Occupancy in Burton
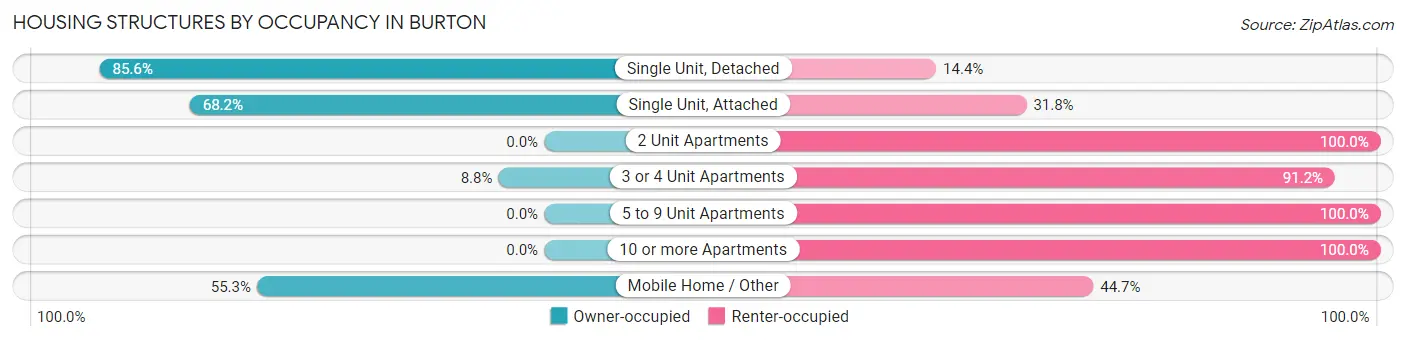
| Structure Type | Owner-occupied | Renter-occupied |
| Single Unit, Detached | 8,702 (85.6%) | 1,469 (14.4%) |
| Single Unit, Attached | 90 (68.2%) | 42 (31.8%) |
| 2 Unit Apartments | 0 (0.0%) | 50 (100.0%) |
| 3 or 4 Unit Apartments | 21 (8.8%) | 218 (91.2%) |
| 5 to 9 Unit Apartments | 0 (0.0%) | 292 (100.0%) |
| 10 or more Apartments | 0 (0.0%) | 826 (100.0%) |
| Mobile Home / Other | 449 (55.3%) | 363 (44.7%) |
| Total | 9,262 (74.0%) | 3,260 (26.0%) |
Housing Structures by Number of Rooms in Burton
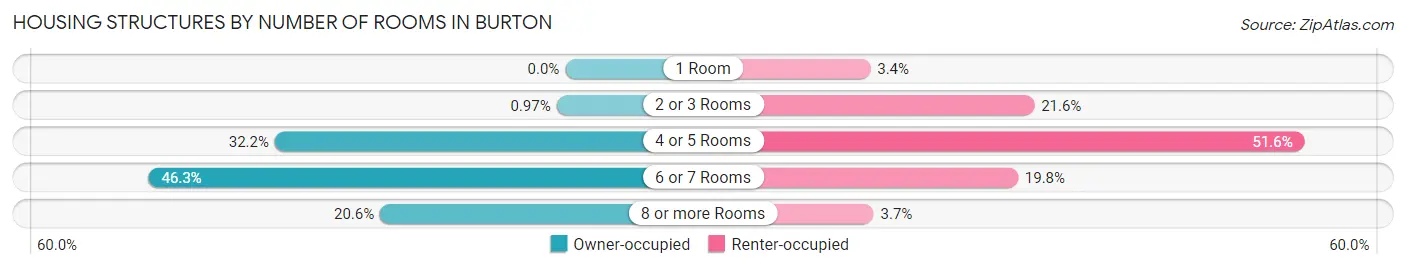
| Number of Rooms | Owner-occupied | Renter-occupied |
| 1 Room | 0 (0.0%) | 110 (3.4%) |
| 2 or 3 Rooms | 90 (1.0%) | 703 (21.6%) |
| 4 or 5 Rooms | 2,985 (32.2%) | 1,681 (51.6%) |
| 6 or 7 Rooms | 4,284 (46.3%) | 644 (19.8%) |
| 8 or more Rooms | 1,903 (20.5%) | 122 (3.7%) |
| Total | 9,262 (100.0%) | 3,260 (100.0%) |
Housing Structure by Heating Type in Burton
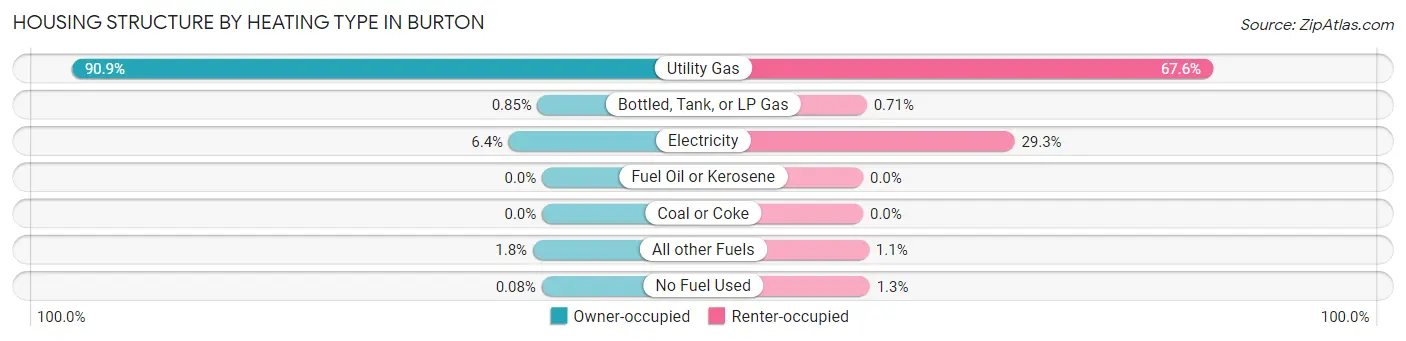
| Heating Type | Owner-occupied | Renter-occupied |
| Utility Gas | 8,418 (90.9%) | 2,204 (67.6%) |
| Bottled, Tank, or LP Gas | 79 (0.9%) | 23 (0.7%) |
| Electricity | 594 (6.4%) | 954 (29.3%) |
| Fuel Oil or Kerosene | 0 (0.0%) | 0 (0.0%) |
| Coal or Coke | 0 (0.0%) | 0 (0.0%) |
| All other Fuels | 164 (1.8%) | 37 (1.1%) |
| No Fuel Used | 7 (0.1%) | 42 (1.3%) |
| Total | 9,262 (100.0%) | 3,260 (100.0%) |
Household Vehicle Usage in Burton
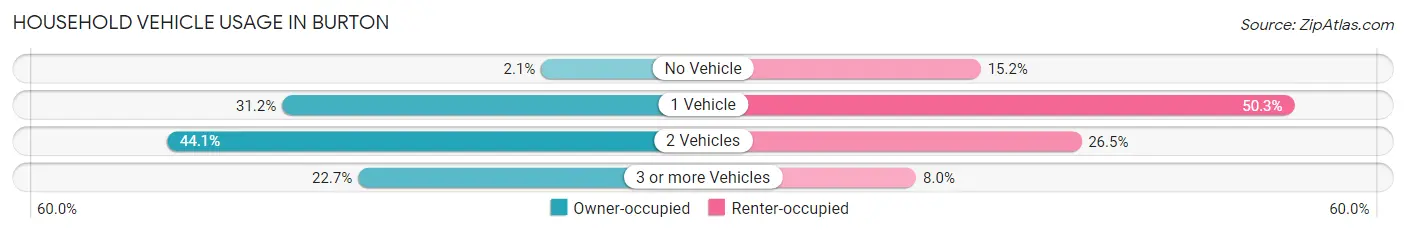
| Vehicles per Household | Owner-occupied | Renter-occupied |
| No Vehicle | 197 (2.1%) | 496 (15.2%) |
| 1 Vehicle | 2,886 (31.2%) | 1,641 (50.3%) |
| 2 Vehicles | 4,081 (44.1%) | 863 (26.5%) |
| 3 or more Vehicles | 2,098 (22.7%) | 260 (8.0%) |
| Total | 9,262 (100.0%) | 3,260 (100.0%) |
Real Estate & Mortgages in Burton
Real Estate and Mortgage Overview in Burton
| Characteristic | Without Mortgage | With Mortgage |
| Housing Units | 3,822 | 5,440 |
| Median Property Value | $107,100 | $136,600 |
| Median Household Income | $42,049 | $833 |
| Monthly Housing Costs | $516 | $69 |
| Real Estate Taxes | $1,822 | $266 |
Property Value by Mortgage Status in Burton
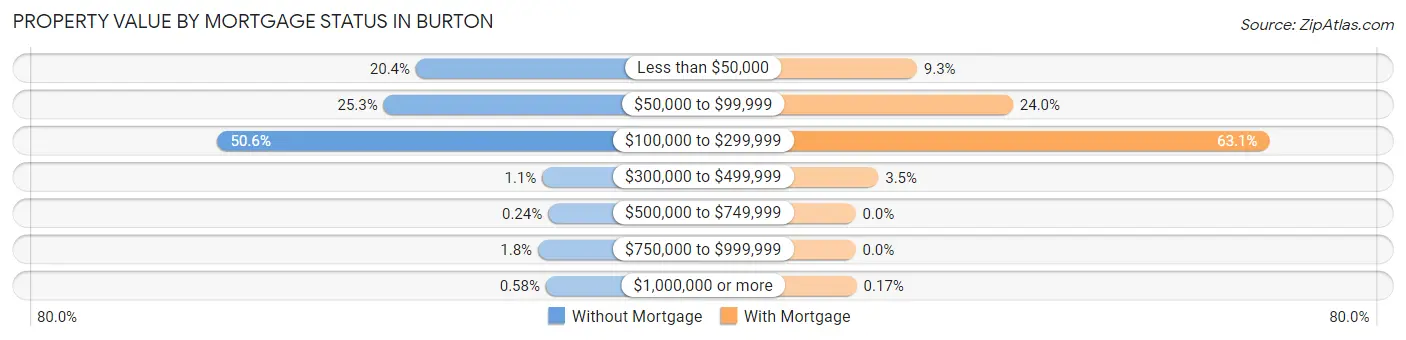
| Property Value | Without Mortgage | With Mortgage |
| Less than $50,000 | 779 (20.4%) | 508 (9.3%) |
| $50,000 to $99,999 | 967 (25.3%) | 1,304 (24.0%) |
| $100,000 to $299,999 | 1,934 (50.6%) | 3,430 (63.0%) |
| $300,000 to $499,999 | 43 (1.1%) | 189 (3.5%) |
| $500,000 to $749,999 | 9 (0.2%) | 0 (0.0%) |
| $750,000 to $999,999 | 68 (1.8%) | 0 (0.0%) |
| $1,000,000 or more | 22 (0.6%) | 9 (0.2%) |
| Total | 3,822 (100.0%) | 5,440 (100.0%) |
Household Income by Mortgage Status in Burton
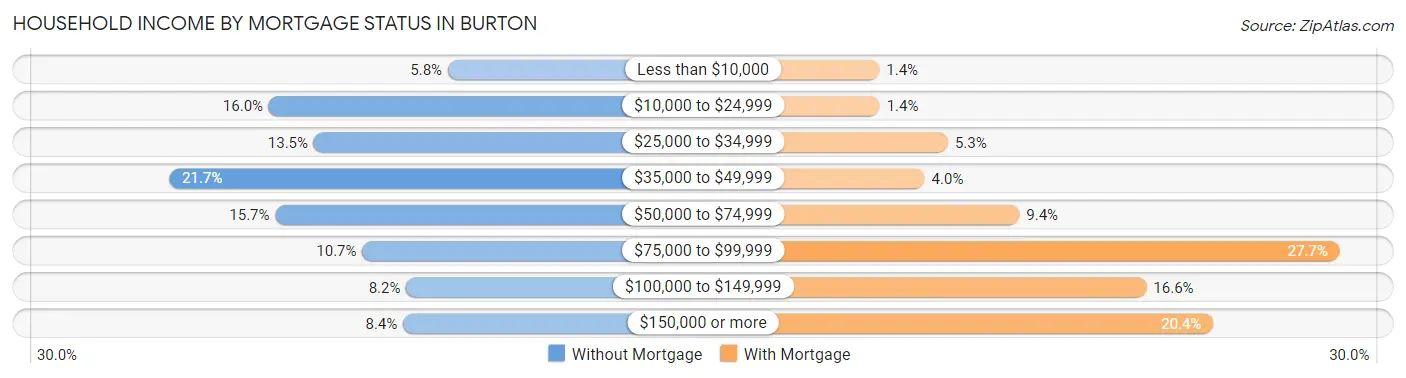
| Household Income | Without Mortgage | With Mortgage |
| Less than $10,000 | 222 (5.8%) | 74 (1.4%) |
| $10,000 to $24,999 | 613 (16.0%) | 75 (1.4%) |
| $25,000 to $34,999 | 515 (13.5%) | 287 (5.3%) |
| $35,000 to $49,999 | 831 (21.7%) | 215 (4.0%) |
| $50,000 to $74,999 | 599 (15.7%) | 509 (9.4%) |
| $75,000 to $99,999 | 409 (10.7%) | 1,505 (27.7%) |
| $100,000 to $149,999 | 313 (8.2%) | 904 (16.6%) |
| $150,000 or more | 320 (8.4%) | 1,112 (20.4%) |
| Total | 3,822 (100.0%) | 5,440 (100.0%) |
Property Value to Household Income Ratio in Burton
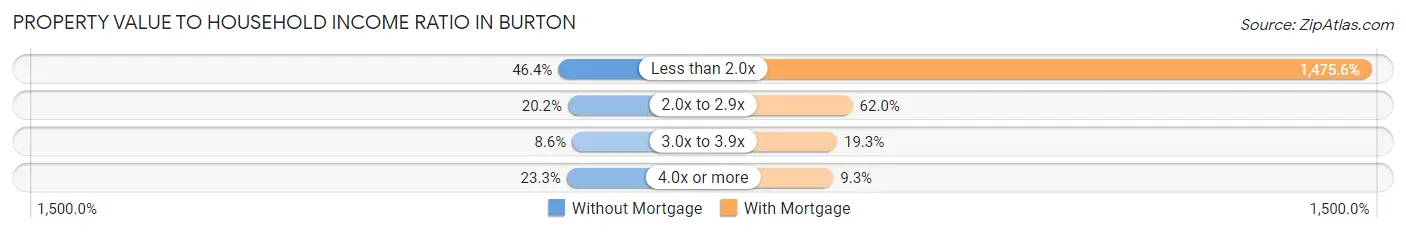
| Value-to-Income Ratio | Without Mortgage | With Mortgage |
| Less than 2.0x | 1,773 (46.4%) | 80,270 (1,475.5%) |
| 2.0x to 2.9x | 770 (20.2%) | 3,370 (62.0%) |
| 3.0x to 3.9x | 330 (8.6%) | 1,052 (19.3%) |
| 4.0x or more | 891 (23.3%) | 504 (9.3%) |
| Total | 3,822 (100.0%) | 5,440 (100.0%) |
Real Estate Taxes by Mortgage Status in Burton
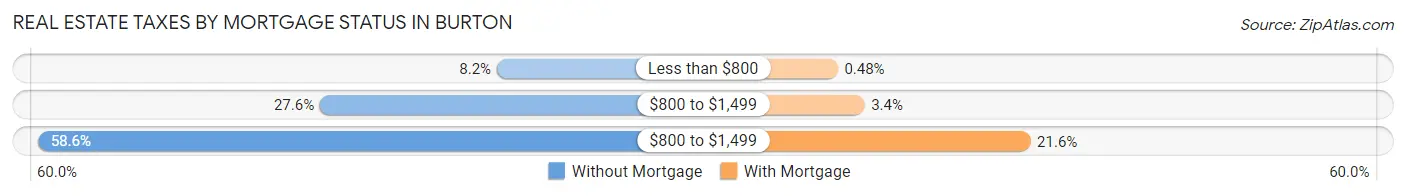
| Property Taxes | Without Mortgage | With Mortgage |
| Less than $800 | 315 (8.2%) | 26 (0.5%) |
| $800 to $1,499 | 1,056 (27.6%) | 186 (3.4%) |
| $800 to $1,499 | 2,238 (58.6%) | 1,175 (21.6%) |
| Total | 3,822 (100.0%) | 5,440 (100.0%) |
Health & Disability in Burton
Health Insurance Coverage by Age in Burton
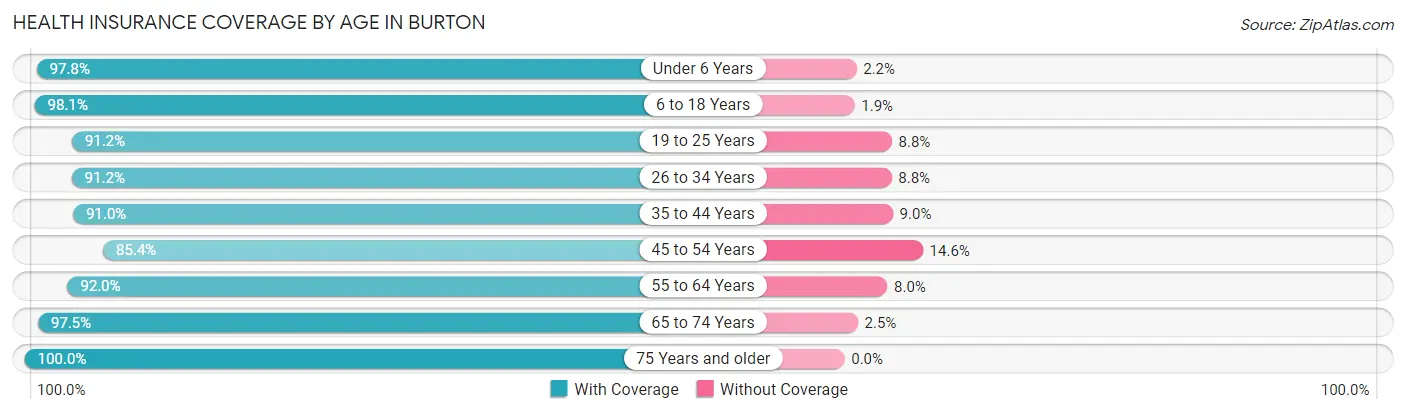
| Age Bracket | With Coverage | Without Coverage |
| Under 6 Years | 1,975 (97.8%) | 45 (2.2%) |
| 6 to 18 Years | 4,311 (98.1%) | 82 (1.9%) |
| 19 to 25 Years | 2,213 (91.2%) | 214 (8.8%) |
| 26 to 34 Years | 3,148 (91.2%) | 303 (8.8%) |
| 35 to 44 Years | 3,046 (91.0%) | 302 (9.0%) |
| 45 to 54 Years | 3,584 (85.4%) | 613 (14.6%) |
| 55 to 64 Years | 3,759 (92.0%) | 326 (8.0%) |
| 65 to 74 Years | 2,909 (97.5%) | 74 (2.5%) |
| 75 Years and older | 2,632 (100.0%) | 0 (0.0%) |
| Total | 27,577 (93.4%) | 1,959 (6.6%) |
Health Insurance Coverage by Citizenship Status in Burton
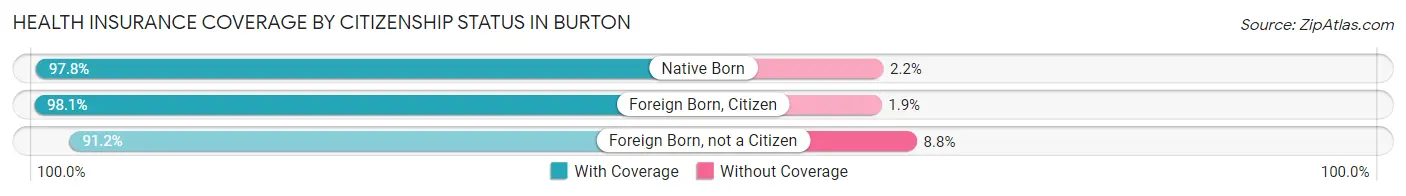
| Citizenship Status | With Coverage | Without Coverage |
| Native Born | 1,975 (97.8%) | 45 (2.2%) |
| Foreign Born, Citizen | 4,311 (98.1%) | 82 (1.9%) |
| Foreign Born, not a Citizen | 2,213 (91.2%) | 214 (8.8%) |
Health Insurance Coverage by Household Income in Burton
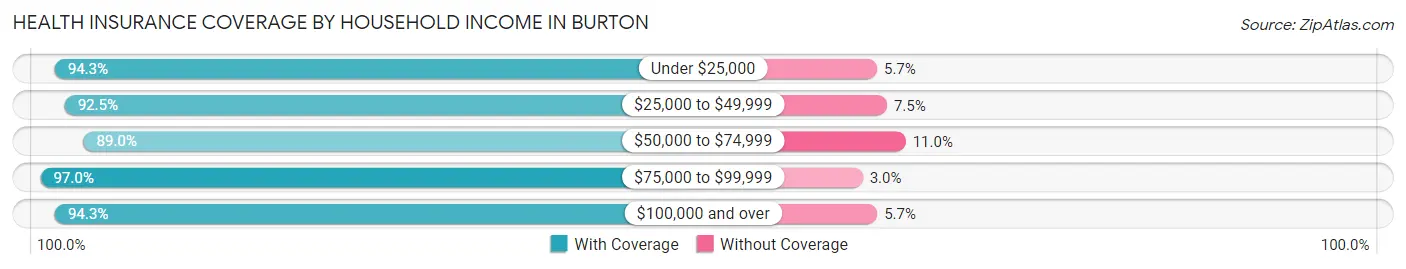
| Household Income | With Coverage | Without Coverage |
| Under $25,000 | 4,393 (94.3%) | 264 (5.7%) |
| $25,000 to $49,999 | 5,097 (92.5%) | 415 (7.5%) |
| $50,000 to $74,999 | 5,174 (89.0%) | 642 (11.0%) |
| $75,000 to $99,999 | 4,784 (97.0%) | 147 (3.0%) |
| $100,000 and over | 8,052 (94.3%) | 487 (5.7%) |
Public vs Private Health Insurance Coverage by Age in Burton
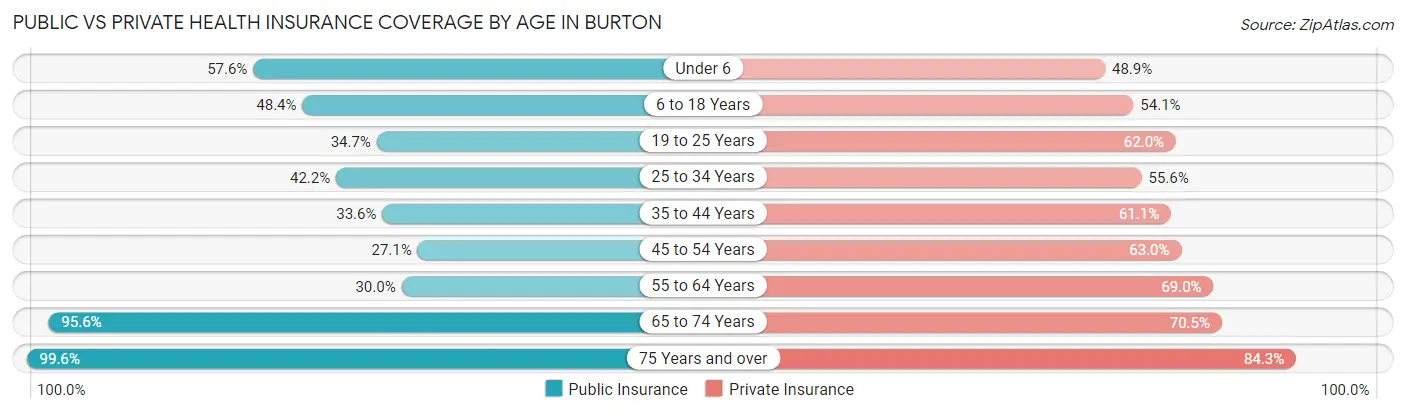
| Age Bracket | Public Insurance | Private Insurance |
| Under 6 | 1,163 (57.6%) | 987 (48.9%) |
| 6 to 18 Years | 2,128 (48.4%) | 2,378 (54.1%) |
| 19 to 25 Years | 841 (34.6%) | 1,505 (62.0%) |
| 25 to 34 Years | 1,456 (42.2%) | 1,920 (55.6%) |
| 35 to 44 Years | 1,125 (33.6%) | 2,046 (61.1%) |
| 45 to 54 Years | 1,136 (27.1%) | 2,645 (63.0%) |
| 55 to 64 Years | 1,227 (30.0%) | 2,818 (69.0%) |
| 65 to 74 Years | 2,851 (95.6%) | 2,104 (70.5%) |
| 75 Years and over | 2,622 (99.6%) | 2,219 (84.3%) |
| Total | 14,549 (49.3%) | 18,622 (63.0%) |
Disability Status by Sex by Age in Burton
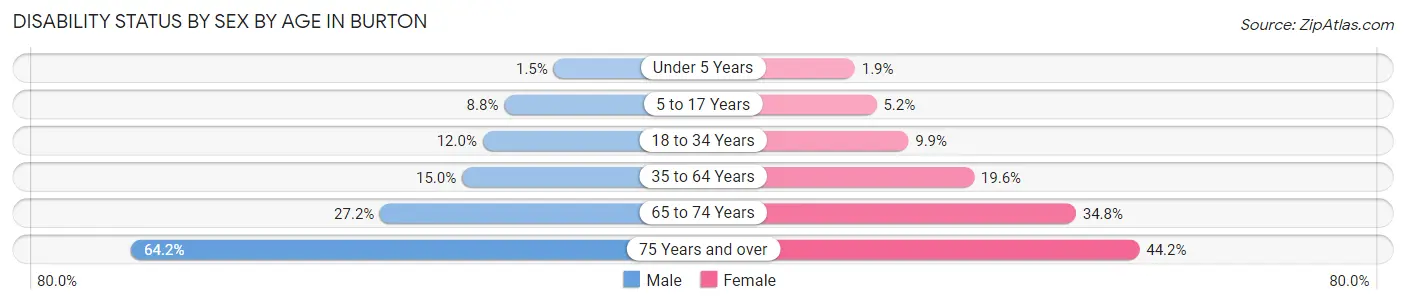
| Age Bracket | Male | Female |
| Under 5 Years | 10 (1.5%) | 21 (1.9%) |
| 5 to 17 Years | 192 (8.8%) | 107 (5.1%) |
| 18 to 34 Years | 351 (12.0%) | 327 (9.9%) |
| 35 to 64 Years | 833 (15.0%) | 1,195 (19.6%) |
| 65 to 74 Years | 312 (27.2%) | 638 (34.7%) |
| 75 Years and over | 735 (64.2%) | 657 (44.2%) |
Disability Class by Sex by Age in Burton
Disability Class: Hearing Difficulty
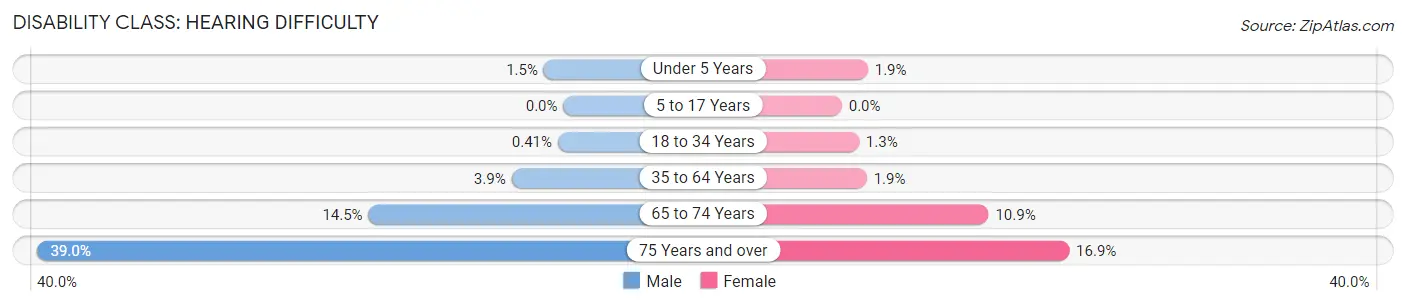
| Age Bracket | Male | Female |
| Under 5 Years | 10 (1.5%) | 21 (1.9%) |
| 5 to 17 Years | 0 (0.0%) | 0 (0.0%) |
| 18 to 34 Years | 12 (0.4%) | 42 (1.3%) |
| 35 to 64 Years | 213 (3.8%) | 113 (1.8%) |
| 65 to 74 Years | 166 (14.5%) | 200 (10.9%) |
| 75 Years and over | 447 (39.0%) | 251 (16.9%) |
Disability Class: Vision Difficulty
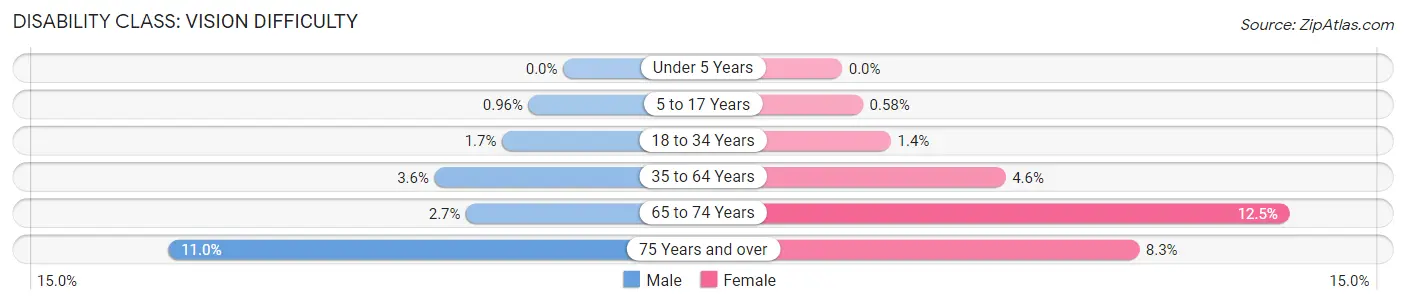
| Age Bracket | Male | Female |
| Under 5 Years | 0 (0.0%) | 0 (0.0%) |
| 5 to 17 Years | 21 (1.0%) | 12 (0.6%) |
| 18 to 34 Years | 50 (1.7%) | 45 (1.4%) |
| 35 to 64 Years | 198 (3.6%) | 277 (4.5%) |
| 65 to 74 Years | 31 (2.7%) | 229 (12.5%) |
| 75 Years and over | 126 (11.0%) | 123 (8.3%) |
Disability Class: Cognitive Difficulty
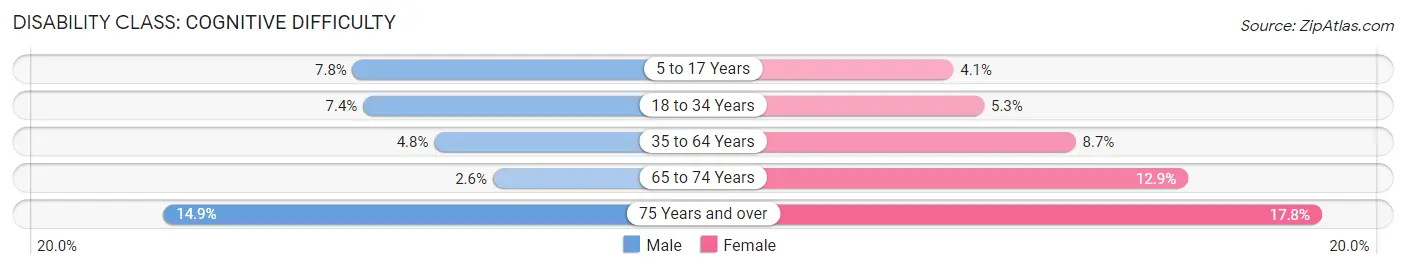
| Age Bracket | Male | Female |
| 5 to 17 Years | 171 (7.8%) | 86 (4.1%) |
| 18 to 34 Years | 218 (7.4%) | 175 (5.3%) |
| 35 to 64 Years | 265 (4.8%) | 529 (8.7%) |
| 65 to 74 Years | 30 (2.6%) | 236 (12.9%) |
| 75 Years and over | 170 (14.8%) | 265 (17.8%) |
Disability Class: Ambulatory Difficulty
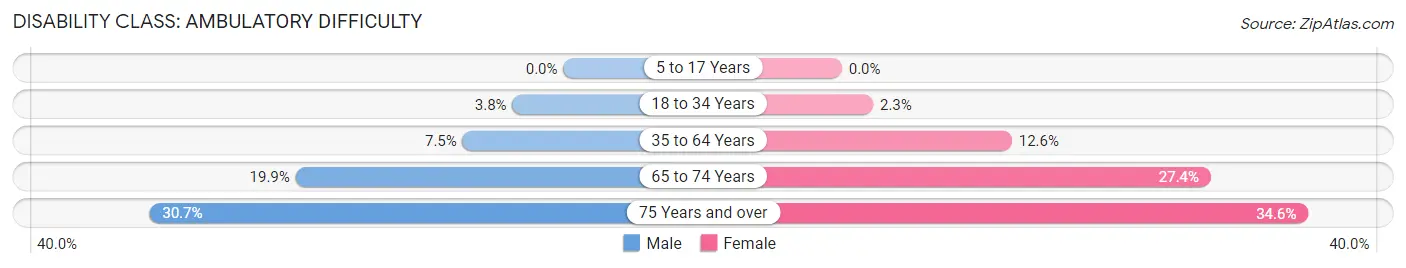
| Age Bracket | Male | Female |
| 5 to 17 Years | 0 (0.0%) | 0 (0.0%) |
| 18 to 34 Years | 111 (3.8%) | 77 (2.3%) |
| 35 to 64 Years | 414 (7.5%) | 769 (12.6%) |
| 65 to 74 Years | 228 (19.9%) | 503 (27.4%) |
| 75 Years and over | 352 (30.7%) | 515 (34.6%) |
Disability Class: Self-Care Difficulty
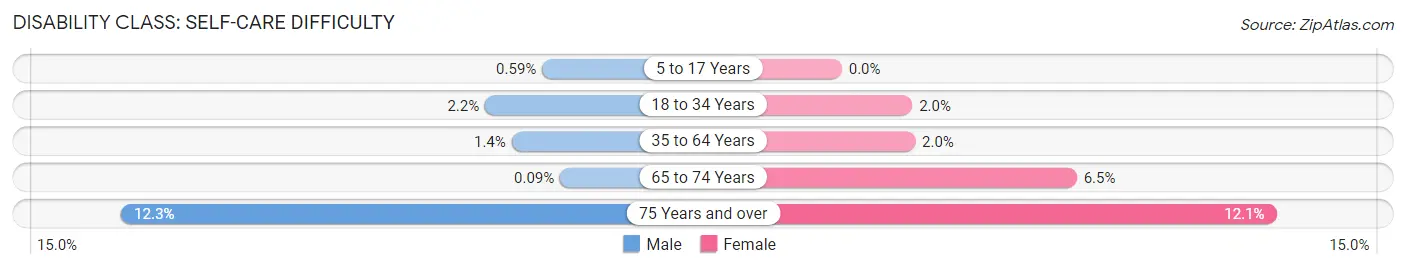
| Age Bracket | Male | Female |
| 5 to 17 Years | 13 (0.6%) | 0 (0.0%) |
| 18 to 34 Years | 64 (2.2%) | 65 (2.0%) |
| 35 to 64 Years | 80 (1.4%) | 124 (2.0%) |
| 65 to 74 Years | 1 (0.1%) | 120 (6.5%) |
| 75 Years and over | 141 (12.3%) | 180 (12.1%) |
Technology Access in Burton
Computing Device Access in Burton
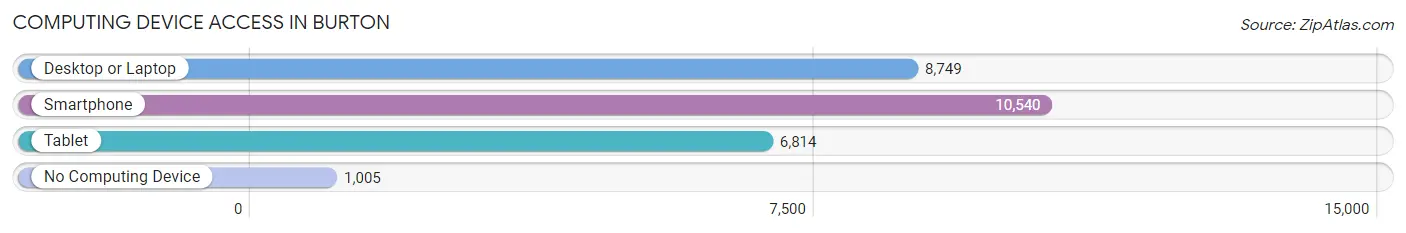
| Device Type | # Households | % Households |
| Desktop or Laptop | 8,749 | 69.9% |
| Smartphone | 10,540 | 84.2% |
| Tablet | 6,814 | 54.4% |
| No Computing Device | 1,005 | 8.0% |
| Total | 12,522 | 100.0% |
Internet Access in Burton
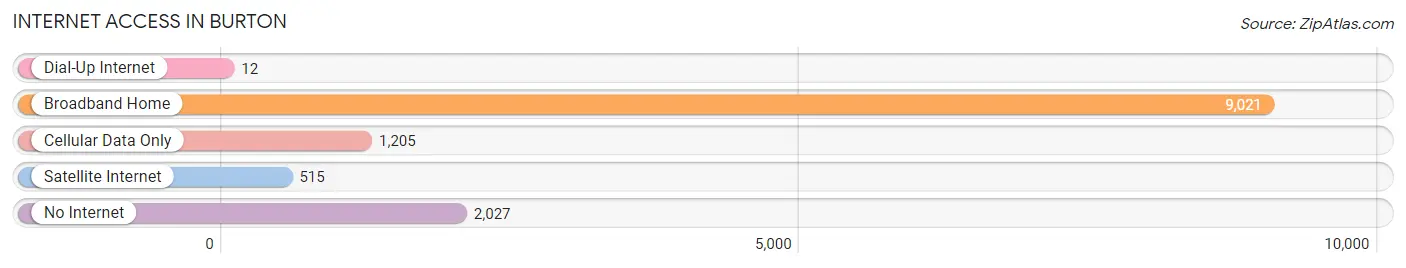
| Internet Type | # Households | % Households |
| Dial-Up Internet | 12 | 0.1% |
| Broadband Home | 9,021 | 72.0% |
| Cellular Data Only | 1,205 | 9.6% |
| Satellite Internet | 515 | 4.1% |
| No Internet | 2,027 | 16.2% |
| Total | 12,522 | 100.0% |
Burton Summary
Burton, Michigan is a city located in Genesee County, Michigan. It is a suburb of Flint, Michigan and is located about 10 miles northwest of the city. The city has a population of approximately 30,000 people and is the second largest city in Genesee County.
History
Burton was first settled in 1836 by a group of settlers from New York. The settlement was originally called Crossroads because of its location at the intersection of two major roads. In 1837, the settlement was renamed Burton in honor of its first postmaster, William Burton. The city was officially incorporated in 1872.
In the late 19th century, Burton was a major center for the lumber industry. The city was home to several sawmills and lumber yards. The city also had a thriving agricultural industry, with many farmers growing wheat, corn, and other crops.
In the early 20th century, Burton began to experience a period of growth and development. The city was home to several factories, including a paper mill, a furniture factory, and a canning factory. The city also had a thriving retail sector, with several stores and shops.
Geography
Burton is located in Genesee County, Michigan. It is situated about 10 miles northwest of Flint, Michigan. The city is located on the Flint River and is surrounded by several small lakes and ponds. The city has a total area of 8.3 square miles, of which 8.2 square miles is land and 0.1 square miles is water.
Economy
Burton’s economy is largely based on manufacturing and retail. The city is home to several factories, including a paper mill, a furniture factory, and a canning factory. The city also has a thriving retail sector, with several stores and shops.
The city is also home to several large employers, including the Genesee County Health Department, the Genesee County Sheriff’s Office, and the Genesee County Parks and Recreation Department.
Demographics
As of the 2010 census, there were 29,999 people, 11,845 households, and 7,945 families residing in the city. The population density was 3,637.2 people per square mile. The racial makeup of the city was 87.2% White, 8.3% African American, 0.4% Native American, 0.7% Asian, 0.1% Pacific Islander, 1.2% from other races, and 2.1% from two or more races. Hispanic or Latino of any race were 3.3% of the population.
The median income for a household in the city was $41,945, and the median income for a family was $50,945. The per capita income for the city was $20,945. About 11.2% of families and 14.2% of the population were below the poverty line, including 19.2% of those under age 18 and 8.2% of those age 65 or over.
Common Questions
What is Per Capita Income in Burton?
Per Capita income in Burton is $30,178.
What is the Median Family Income in Burton?
Median Family Income in Burton is $72,202.
What is the Median Household income in Burton?
Median Household Income in Burton is $55,698.
What is Income or Wage Gap in Burton?
Income or Wage Gap in Burton is 33.1%.
Women in Burton earn 66.9 cents for every dollar earned by a man.
What is Family Income Deficit in Burton?
Family Income Deficit in Burton is $10,093.
Families that are below poverty line in Burton earn $10,093 less on average than the poverty threshold level.
What is Inequality or Gini Index in Burton?
Inequality or Gini Index in Burton is 0.43.
What is the Total Population of Burton?
Total Population of Burton is 29,568.
What is the Total Male Population of Burton?
Total Male Population of Burton is 13,663.
What is the Total Female Population of Burton?
Total Female Population of Burton is 15,905.
What is the Ratio of Males per 100 Females in Burton?
There are 85.90 Males per 100 Females in Burton.
What is the Ratio of Females per 100 Males in Burton?
There are 116.41 Females per 100 Males in Burton.
What is the Median Population Age in Burton?
Median Population Age in Burton is 42.8 Years.
What is the Average Family Size in Burton
Average Family Size in Burton is 2.9 People.
What is the Average Household Size in Burton
Average Household Size in Burton is 2.4 People.
How Large is the Labor Force in Burton?
There are 14,339 People in the Labor Forcein in Burton.
What is the Percentage of People in the Labor Force in Burton?
59.1% of People are in the Labor Force in Burton.
What is the Unemployment Rate in Burton?
Unemployment Rate in Burton is 7.1%.