Cheboygan, MI Map & Demographics
Cheboygan Map
Cheboygan Overview
$24,681
PER CAPITA INCOME
$54,609
AVG FAMILY INCOME
$39,919
AVG HOUSEHOLD INCOME
8.5%
WAGE / INCOME GAP [ % ]
91.5¢/ $1
WAGE / INCOME GAP [ $ ]
$6,861
FAMILY INCOME DEFICIT
0.40
INEQUALITY / GINI INDEX
4,782
TOTAL POPULATION
2,456
MALE POPULATION
2,326
FEMALE POPULATION
105.59
MALES / 100 FEMALES
94.71
FEMALES / 100 MALES
45.4
MEDIAN AGE
3.1
AVG FAMILY SIZE
2.3
AVG HOUSEHOLD SIZE
1,996
LABOR FORCE [ PEOPLE ]
49.7%
PERCENT IN LABOR FORCE
9.5%
UNEMPLOYMENT RATE
Cheboygan Zip Codes
Income in Cheboygan
Income Overview in Cheboygan
Per Capita Income in Cheboygan is $24,681, while median incomes of families and households are $54,609 and $39,919 respectively.
| Characteristic | Number | Measure |
| Per Capita Income | 4,782 | $24,681 |
| Median Family Income | 1,131 | $54,609 |
| Mean Family Income | 1,131 | $68,047 |
| Median Household Income | 1,987 | $39,919 |
| Mean Household Income | 1,987 | $54,450 |
| Income Deficit | 1,131 | $6,861 |
| Wage / Income Gap (%) | 4,782 | 8.50% |
| Wage / Income Gap ($) | 4,782 | 91.50¢ per $1 |
| Gini / Inequality Index | 4,782 | 0.40 |
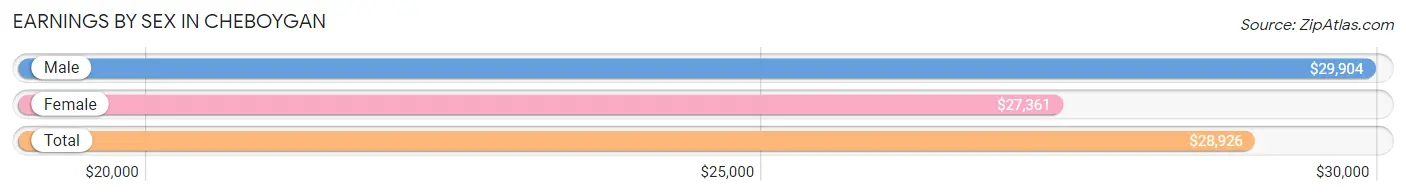
Earnings by Sex in Cheboygan
Average Earnings in Cheboygan are $28,926, $29,904 for men and $27,361 for women, a difference of 8.5%.
| Sex | Number | Average Earnings |
| Male | 1,244 (54.8%) | $29,904 |
| Female | 1,027 (45.2%) | $27,361 |
| Total | 2,271 (100.0%) | $28,926 |
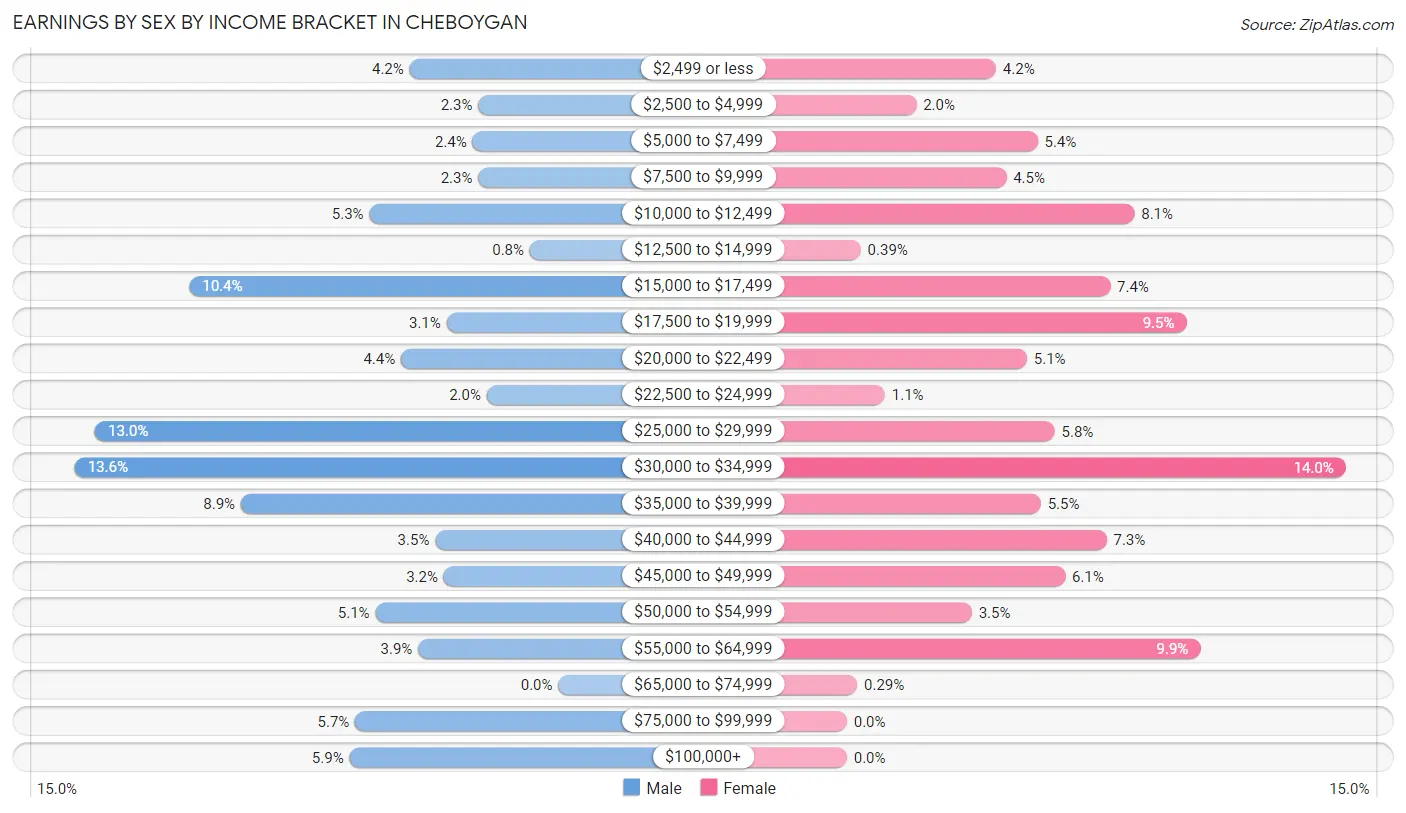
Earnings by Sex by Income Bracket in Cheboygan
The most common earnings brackets in Cheboygan are $30,000 to $34,999 for men (169 | 13.6%) and $30,000 to $34,999 for women (144 | 14.0%).
| Income | Male | Female |
| $2,499 or less | 52 (4.2%) | 43 (4.2%) |
| $2,500 to $4,999 | 28 (2.2%) | 20 (1.9%) |
| $5,000 to $7,499 | 30 (2.4%) | 55 (5.4%) |
| $7,500 to $9,999 | 28 (2.2%) | 46 (4.5%) |
| $10,000 to $12,499 | 66 (5.3%) | 83 (8.1%) |
| $12,500 to $14,999 | 10 (0.8%) | 4 (0.4%) |
| $15,000 to $17,499 | 129 (10.4%) | 76 (7.4%) |
| $17,500 to $19,999 | 39 (3.1%) | 98 (9.5%) |
| $20,000 to $22,499 | 55 (4.4%) | 52 (5.1%) |
| $22,500 to $24,999 | 25 (2.0%) | 11 (1.1%) |
| $25,000 to $29,999 | 162 (13.0%) | 60 (5.8%) |
| $30,000 to $34,999 | 169 (13.6%) | 144 (14.0%) |
| $35,000 to $39,999 | 111 (8.9%) | 56 (5.4%) |
| $40,000 to $44,999 | 43 (3.5%) | 75 (7.3%) |
| $45,000 to $49,999 | 40 (3.2%) | 63 (6.1%) |
| $50,000 to $54,999 | 64 (5.1%) | 36 (3.5%) |
| $55,000 to $64,999 | 49 (3.9%) | 102 (9.9%) |
| $65,000 to $74,999 | 0 (0.0%) | 3 (0.3%) |
| $75,000 to $99,999 | 71 (5.7%) | 0 (0.0%) |
| $100,000+ | 73 (5.9%) | 0 (0.0%) |
| Total | 1,244 (100.0%) | 1,027 (100.0%) |
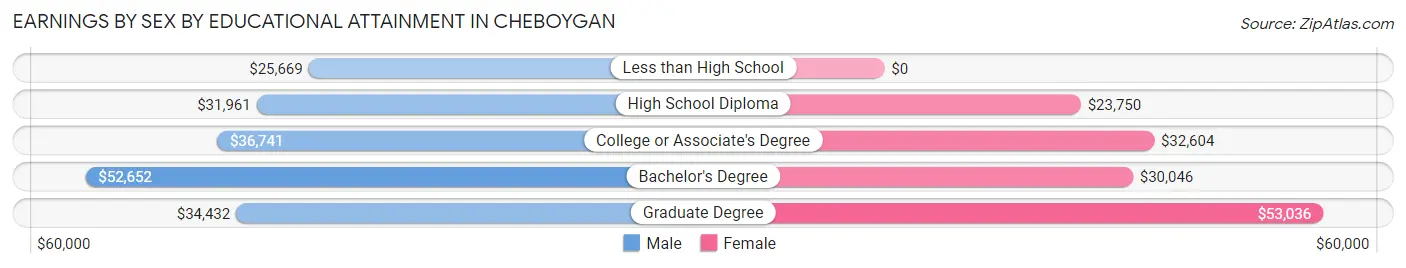
Earnings by Sex by Educational Attainment in Cheboygan
Average earnings in Cheboygan are $31,468 for men and $30,040 for women, a difference of 4.5%. Men with an educational attainment of bachelor's degree enjoy the highest average annual earnings of $52,652, while those with less than high school education earn the least with $25,669. Women with an educational attainment of graduate degree earn the most with the average annual earnings of $53,036, while those with high school diploma education have the smallest earnings of $23,750.
| Educational Attainment | Male Income | Female Income |
| Less than High School | $25,669 | $0 |
| High School Diploma | $31,961 | $23,750 |
| College or Associate's Degree | $36,741 | $32,604 |
| Bachelor's Degree | $52,652 | $30,046 |
| Graduate Degree | $34,432 | $53,036 |
| Total | $31,468 | $30,040 |
Family Income in Cheboygan
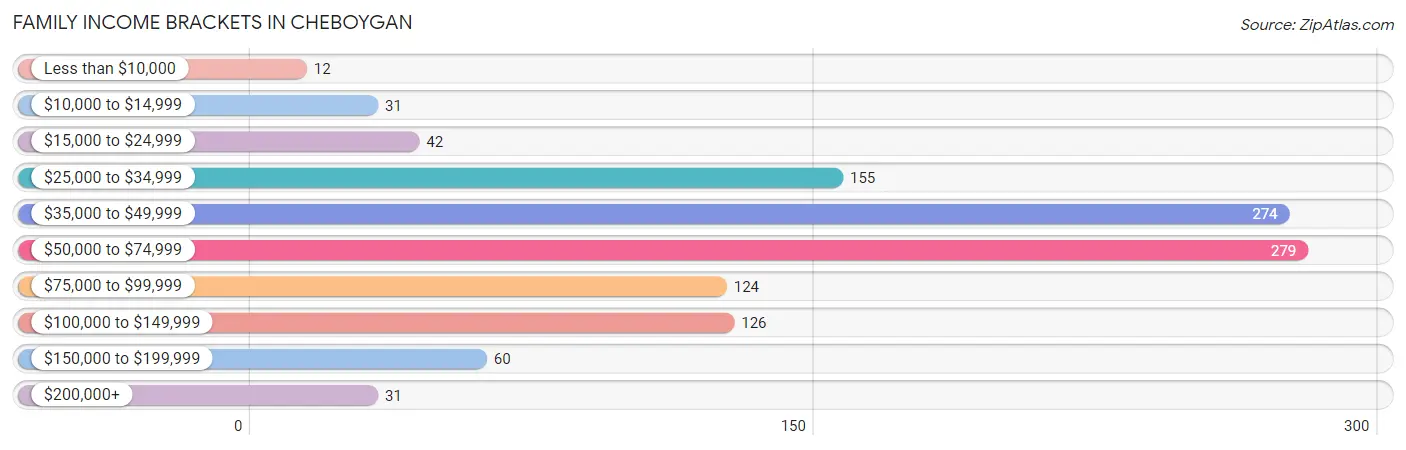
Family Income Brackets in Cheboygan
According to the Cheboygan family income data, there are 279 families falling into the $50,000 to $74,999 income range, which is the most common income bracket and makes up 24.7% of all families. Conversely, the less than $10,000 income bracket is the least frequent group with only 12 families (1.1%) belonging to this category.
| Income Bracket | # Families | % Families |
| Less than $10,000 | 12 | 1.1% |
| $10,000 to $14,999 | 31 | 2.7% |
| $15,000 to $24,999 | 42 | 3.7% |
| $25,000 to $34,999 | 155 | 13.7% |
| $35,000 to $49,999 | 274 | 24.2% |
| $50,000 to $74,999 | 279 | 24.7% |
| $75,000 to $99,999 | 124 | 11.0% |
| $100,000 to $149,999 | 126 | 11.1% |
| $150,000 to $199,999 | 60 | 5.3% |
| $200,000+ | 31 | 2.7% |
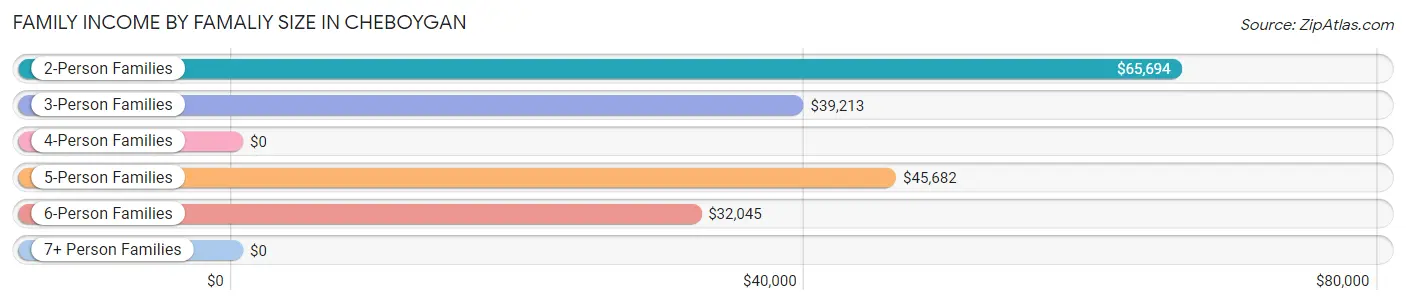
Family Income by Famaliy Size in Cheboygan
2-person families (595 | 52.6%) account for the highest median family income in Cheboygan with $65,694 per family, while 2-person families (595 | 52.6%) have the highest median income of $32,847 per family member.
| Income Bracket | # Families | Median Income |
| 2-Person Families | 595 (52.6%) | $65,694 |
| 3-Person Families | 255 (22.6%) | $39,213 |
| 4-Person Families | 111 (9.8%) | $0 |
| 5-Person Families | 96 (8.5%) | $45,682 |
| 6-Person Families | 68 (6.0%) | $32,045 |
| 7+ Person Families | 6 (0.5%) | $0 |
| Total | 1,131 (100.0%) | $54,609 |
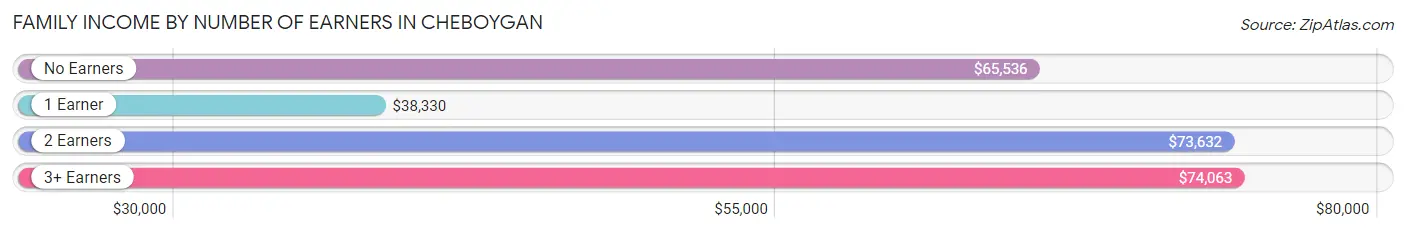
Family Income by Number of Earners in Cheboygan
The median family income in Cheboygan is $54,609, with families comprising 3+ earners (75) having the highest median family income of $74,063, while families with 1 earner (367) have the lowest median family income of $38,330, accounting for 6.6% and 32.5% of families, respectively.
| Number of Earners | # Families | Median Income |
| No Earners | 237 (20.9%) | $65,536 |
| 1 Earner | 367 (32.5%) | $38,330 |
| 2 Earners | 452 (40.0%) | $73,632 |
| 3+ Earners | 75 (6.6%) | $74,063 |
| Total | 1,131 (100.0%) | $54,609 |
Household Income in Cheboygan
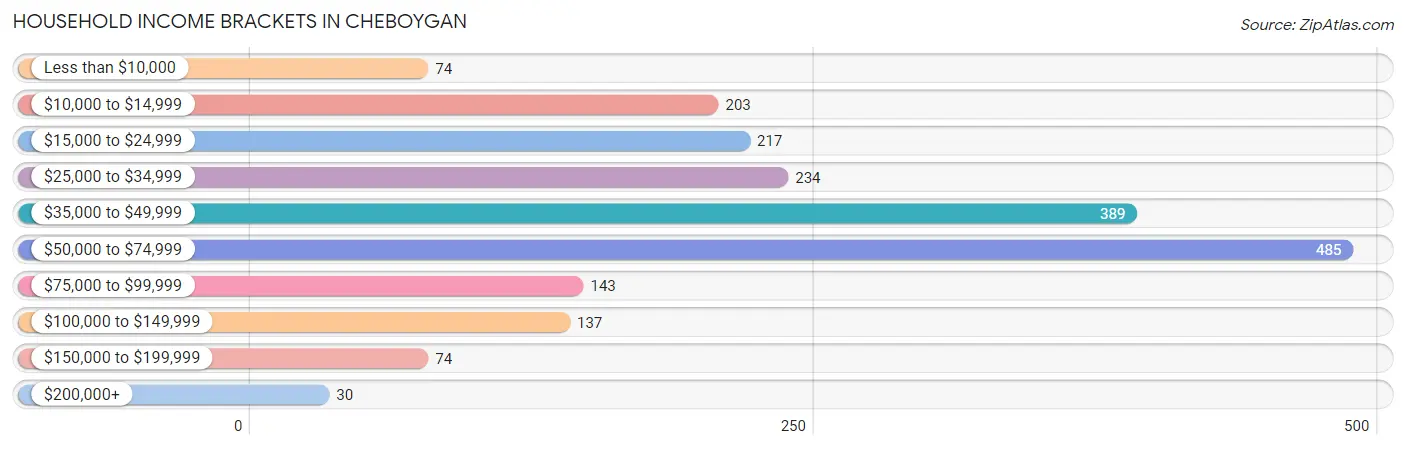
Household Income Brackets in Cheboygan
With 485 households falling in the category, the $50,000 to $74,999 income range is the most frequent in Cheboygan, accounting for 24.4% of all households. In contrast, only 30 households (1.5%) fall into the $200,000+ income bracket, making it the least populous group.
| Income Bracket | # Households | % Households |
| Less than $10,000 | 74 | 3.7% |
| $10,000 to $14,999 | 203 | 10.2% |
| $15,000 to $24,999 | 217 | 10.9% |
| $25,000 to $34,999 | 234 | 11.8% |
| $35,000 to $49,999 | 389 | 19.6% |
| $50,000 to $74,999 | 485 | 24.4% |
| $75,000 to $99,999 | 143 | 7.2% |
| $100,000 to $149,999 | 137 | 6.9% |
| $150,000 to $199,999 | 74 | 3.7% |
| $200,000+ | 30 | 1.5% |
Household Income by Householder Age in Cheboygan
The median household income in Cheboygan is $39,919, with the highest median household income of $51,838 found in the 45 to 64 years age bracket for the primary householder. A total of 660 households (33.2%) fall into this category. Meanwhile, the 15 to 24 years age bracket for the primary householder has the lowest median household income of $0, with 22 households (1.1%) in this group.
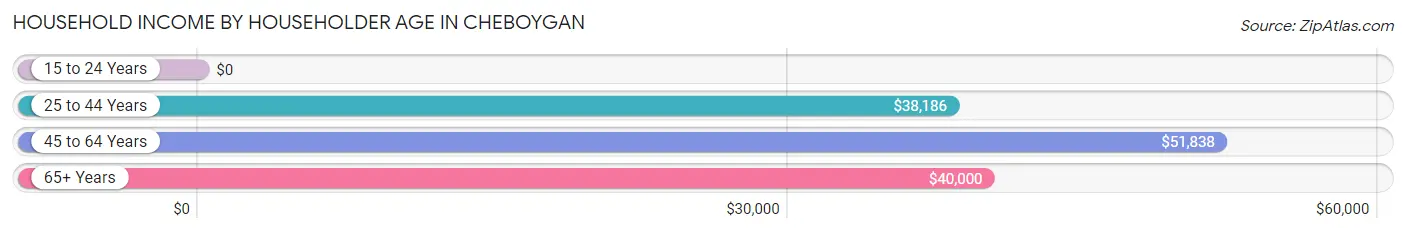
| Income Bracket | # Households | Median Income |
| 15 to 24 Years | 22 (1.1%) | $0 |
| 25 to 44 Years | 621 (31.2%) | $38,186 |
| 45 to 64 Years | 660 (33.2%) | $51,838 |
| 65+ Years | 684 (34.4%) | $40,000 |
| Total | 1,987 (100.0%) | $39,919 |
Poverty in Cheboygan
Income Below Poverty by Sex and Age in Cheboygan
With 15.7% poverty level for males and 18.2% for females among the residents of Cheboygan, 16 and 17 year old males and 12 to 14 year old females are the most vulnerable to poverty, with 28 males (50.9%) and 38 females (62.3%) in their respective age groups living below the poverty level.
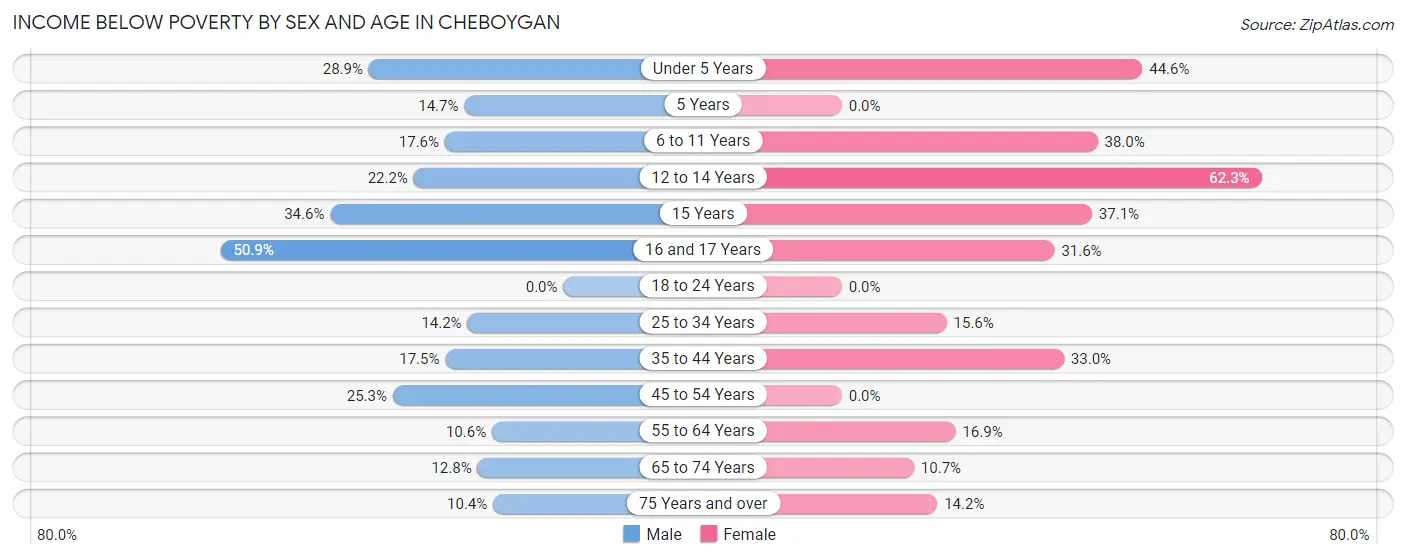
| Age Bracket | Male | Female |
| Under 5 Years | 26 (28.9%) | 29 (44.6%) |
| 5 Years | 10 (14.7%) | 0 (0.0%) |
| 6 to 11 Years | 19 (17.6%) | 71 (38.0%) |
| 12 to 14 Years | 24 (22.2%) | 38 (62.3%) |
| 15 Years | 9 (34.6%) | 13 (37.1%) |
| 16 and 17 Years | 28 (50.9%) | 6 (31.6%) |
| 18 to 24 Years | 0 (0.0%) | 0 (0.0%) |
| 25 to 34 Years | 43 (14.2%) | 54 (15.6%) |
| 35 to 44 Years | 68 (17.5%) | 62 (33.0%) |
| 45 to 54 Years | 40 (25.3%) | 0 (0.0%) |
| 55 to 64 Years | 32 (10.6%) | 65 (16.9%) |
| 65 to 74 Years | 51 (12.8%) | 36 (10.7%) |
| 75 Years and over | 12 (10.4%) | 35 (14.2%) |
| Total | 362 (15.7%) | 409 (18.2%) |
Income Above Poverty by Sex and Age in Cheboygan
According to the poverty statistics in Cheboygan, males aged 18 to 24 years and females aged 5 years are the age groups that are most secure financially, with 100.0% of males and 100.0% of females in these age groups living above the poverty line.
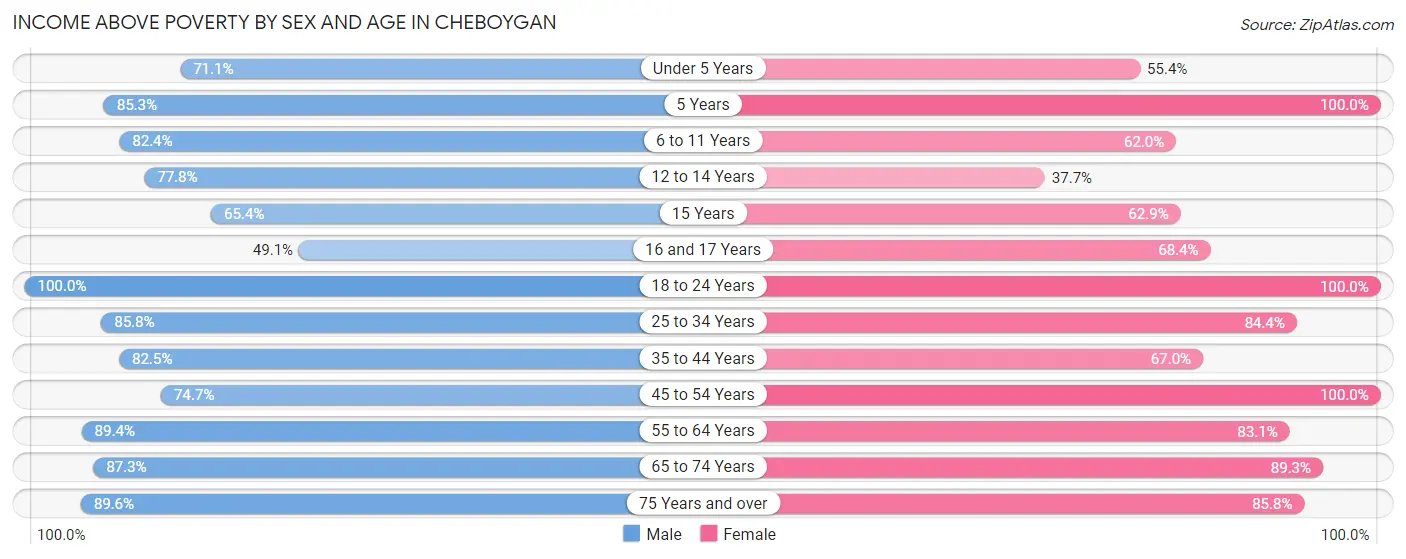
| Age Bracket | Male | Female |
| Under 5 Years | 64 (71.1%) | 36 (55.4%) |
| 5 Years | 58 (85.3%) | 18 (100.0%) |
| 6 to 11 Years | 89 (82.4%) | 116 (62.0%) |
| 12 to 14 Years | 84 (77.8%) | 23 (37.7%) |
| 15 Years | 17 (65.4%) | 22 (62.9%) |
| 16 and 17 Years | 27 (49.1%) | 13 (68.4%) |
| 18 to 24 Years | 190 (100.0%) | 66 (100.0%) |
| 25 to 34 Years | 259 (85.8%) | 293 (84.4%) |
| 35 to 44 Years | 320 (82.5%) | 126 (67.0%) |
| 45 to 54 Years | 118 (74.7%) | 297 (100.0%) |
| 55 to 64 Years | 270 (89.4%) | 320 (83.1%) |
| 65 to 74 Years | 349 (87.3%) | 300 (89.3%) |
| 75 Years and over | 103 (89.6%) | 212 (85.8%) |
| Total | 1,948 (84.3%) | 1,842 (81.8%) |
Income Below Poverty Among Married-Couple Families in Cheboygan
The poverty statistics for married-couple families in Cheboygan show that 13.6% or 102 of the total 752 families live below the poverty line. Families with 3 or 4 children have the highest poverty rate of 40.7%, comprising of 59 families. On the other hand, families with 1 or 2 children have the lowest poverty rate of 7.0%, which includes 11 families.
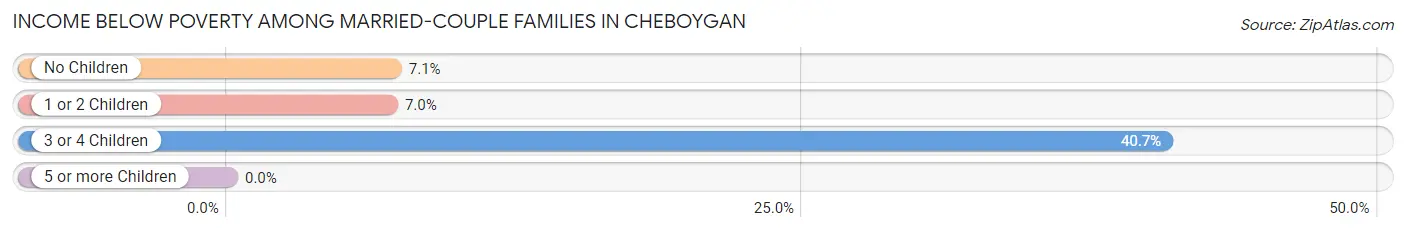
| Children | Above Poverty | Below Poverty |
| No Children | 417 (92.9%) | 32 (7.1%) |
| 1 or 2 Children | 147 (93.0%) | 11 (7.0%) |
| 3 or 4 Children | 86 (59.3%) | 59 (40.7%) |
| 5 or more Children | 0 (0.0%) | 0 (0.0%) |
| Total | 650 (86.4%) | 102 (13.6%) |
Income Below Poverty Among Single-Parent Households in Cheboygan
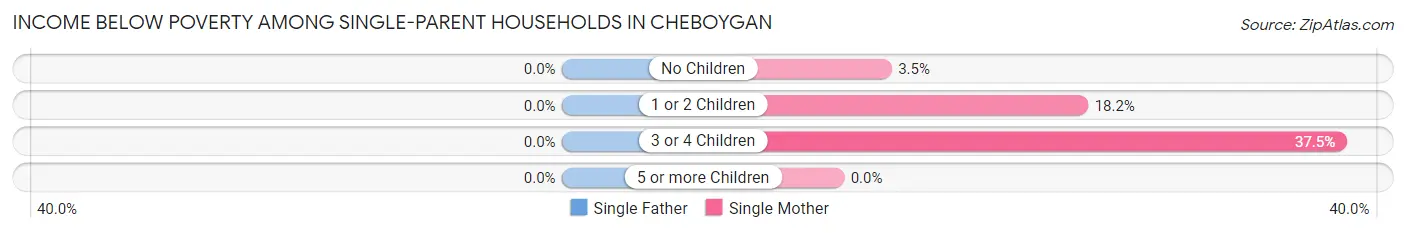
| Children | Single Father | Single Mother |
| No Children | 0 (0.0%) | 7 (3.5%) |
| 1 or 2 Children | 0 (0.0%) | 6 (18.2%) |
| 3 or 4 Children | 0 (0.0%) | 3 (37.5%) |
| 5 or more Children | 0 (0.0%) | 0 (0.0%) |
| Total | 0 (0.0%) | 16 (6.7%) |
Income Below Poverty Among Married-Couple vs Single-Parent Households in Cheboygan
The poverty data for Cheboygan shows that 102 of the married-couple family households (13.6%) and 16 of the single-parent households (4.2%) are living below the poverty level. Within the married-couple family households, those with 3 or 4 children have the highest poverty rate, with 59 households (40.7%) falling below the poverty line. Among the single-parent households, those with 3 or 4 children have the highest poverty rate, with 3 household (17.6%) living below poverty.
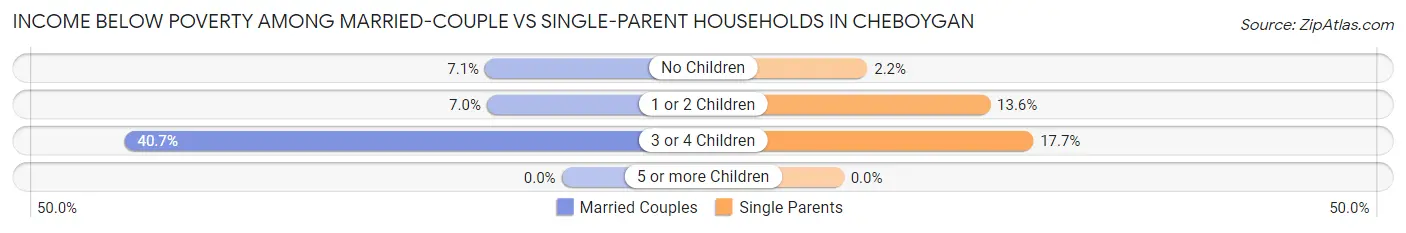
| Children | Married-Couple Families | Single-Parent Households |
| No Children | 32 (7.1%) | 7 (2.2%) |
| 1 or 2 Children | 11 (7.0%) | 6 (13.6%) |
| 3 or 4 Children | 59 (40.7%) | 3 (17.6%) |
| 5 or more Children | 0 (0.0%) | 0 (0.0%) |
| Total | 102 (13.6%) | 16 (4.2%) |
Race in Cheboygan
The most populous races in Cheboygan are White / Caucasian (4,337 | 90.7%), Hispanic or Latino (206 | 4.3%), and Two or more Races (190 | 4.0%).
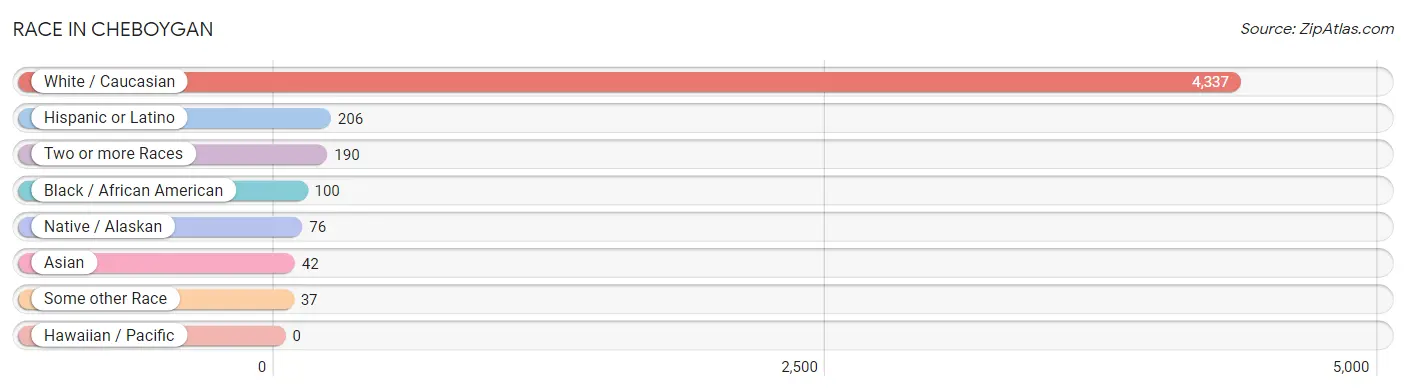
| Race | # Population | % Population |
| Asian | 42 | 0.9% |
| Black / African American | 100 | 2.1% |
| Hawaiian / Pacific | 0 | 0.0% |
| Hispanic or Latino | 206 | 4.3% |
| Native / Alaskan | 76 | 1.6% |
| White / Caucasian | 4,337 | 90.7% |
| Two or more Races | 190 | 4.0% |
| Some other Race | 37 | 0.8% |
| Total | 4,782 | 100.0% |
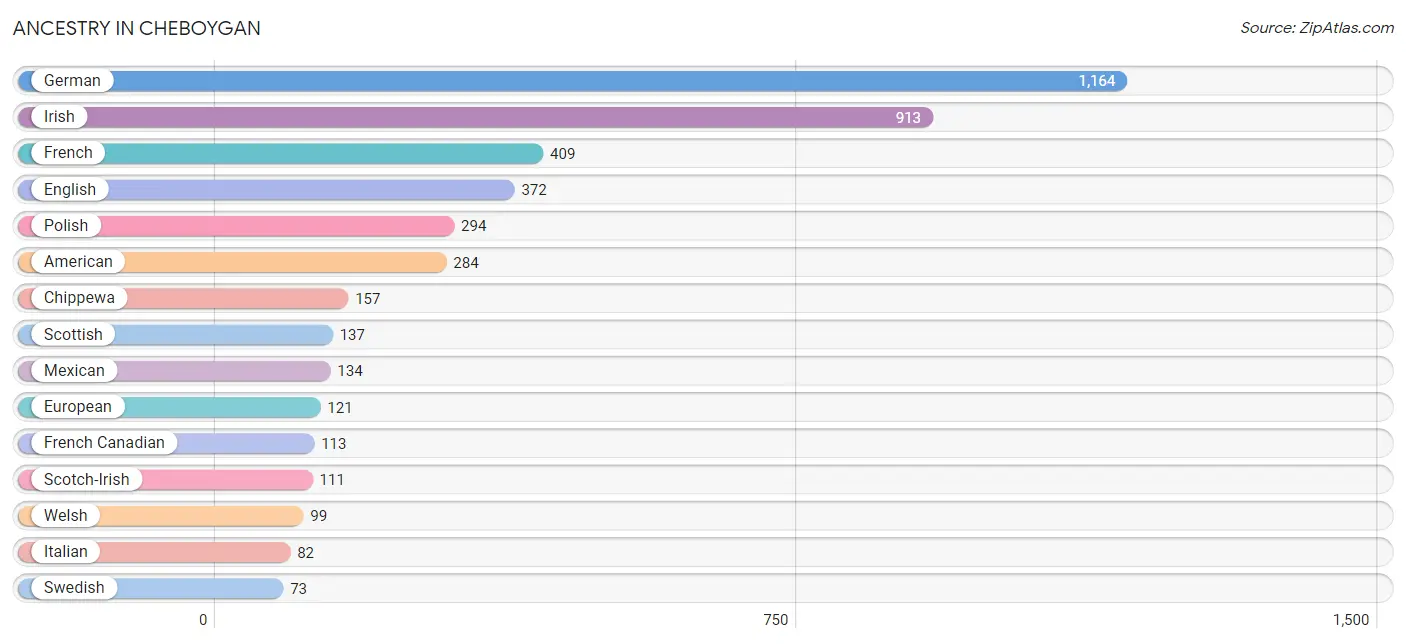
Ancestry in Cheboygan
The most populous ancestries reported in Cheboygan are German (1,164 | 24.3%), Irish (913 | 19.1%), French (409 | 8.6%), English (372 | 7.8%), and Polish (294 | 6.1%), together accounting for 65.9% of all Cheboygan residents.
| Ancestry | # Population | % Population |
| African | 1 | 0.0% |
| American | 284 | 5.9% |
| Arab | 65 | 1.4% |
| Armenian | 14 | 0.3% |
| Austrian | 10 | 0.2% |
| Belgian | 7 | 0.2% |
| British | 45 | 0.9% |
| Burmese | 6 | 0.1% |
| Canadian | 50 | 1.1% |
| Chippewa | 157 | 3.3% |
| Croatian | 12 | 0.3% |
| Czech | 12 | 0.3% |
| Danish | 14 | 0.3% |
| Dutch | 49 | 1.0% |
| English | 372 | 7.8% |
| European | 121 | 2.5% |
| Finnish | 14 | 0.3% |
| French | 409 | 8.6% |
| French American Indian | 32 | 0.7% |
| French Canadian | 113 | 2.4% |
| German | 1,164 | 24.3% |
| Hungarian | 6 | 0.1% |
| Indian (Asian) | 8 | 0.2% |
| Irish | 913 | 19.1% |
| Italian | 82 | 1.7% |
| Lebanese | 65 | 1.4% |
| Mexican | 134 | 2.8% |
| Norwegian | 41 | 0.9% |
| Pennsylvania German | 11 | 0.2% |
| Peruvian | 20 | 0.4% |
| Polish | 294 | 6.1% |
| Puerto Rican | 6 | 0.1% |
| Romanian | 12 | 0.3% |
| Scandinavian | 6 | 0.1% |
| Scotch-Irish | 111 | 2.3% |
| Scottish | 137 | 2.9% |
| South American | 20 | 0.4% |
| South American Indian | 44 | 0.9% |
| Subsaharan African | 1 | 0.0% |
| Swedish | 73 | 1.5% |
| Thai | 72 | 1.5% |
| Ukrainian | 24 | 0.5% |
| Welsh | 99 | 2.1% | View All 43 Rows |
Immigrants in Cheboygan
The most numerous immigrant groups reported in Cheboygan came from Latin America (54 | 1.1%), Asia (34 | 0.7%), Central America (32 | 0.7%), Mexico (32 | 0.7%), and India (28 | 0.6%), together accounting for 3.8% of all Cheboygan residents.
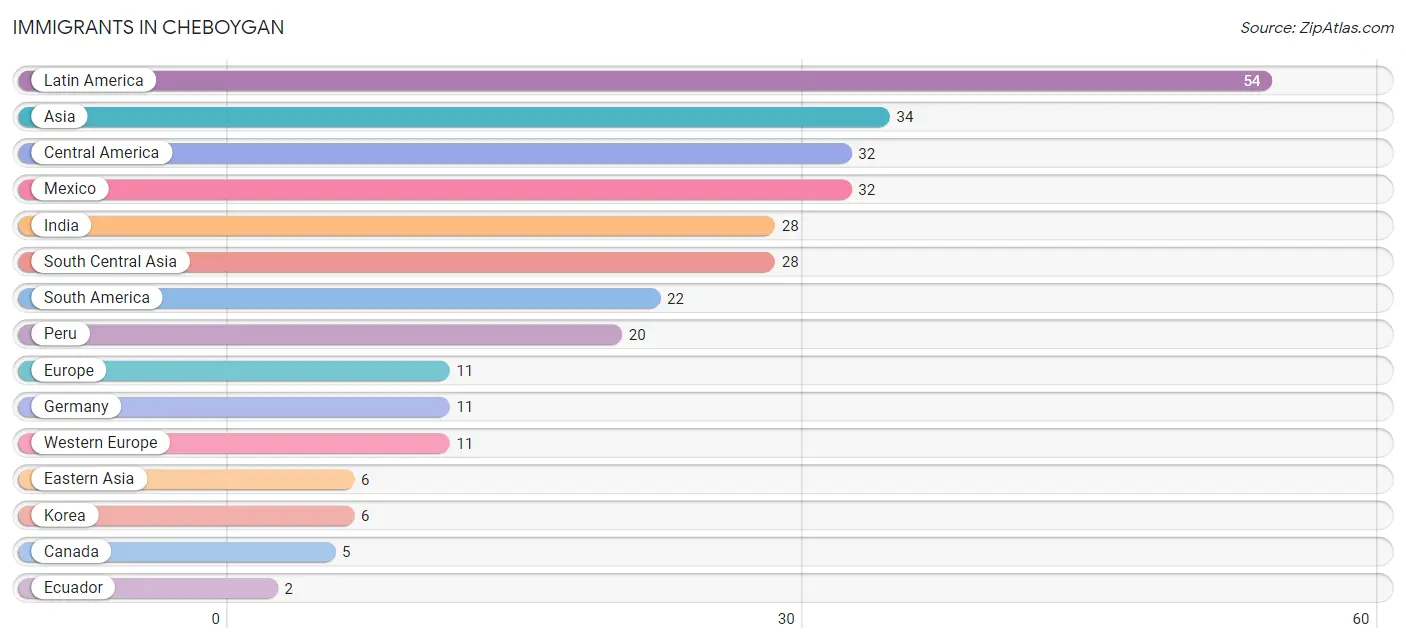
| Immigration Origin | # Population | % Population |
| Asia | 34 | 0.7% |
| Canada | 5 | 0.1% |
| Central America | 32 | 0.7% |
| Eastern Asia | 6 | 0.1% |
| Ecuador | 2 | 0.0% |
| Europe | 11 | 0.2% |
| Germany | 11 | 0.2% |
| India | 28 | 0.6% |
| Korea | 6 | 0.1% |
| Latin America | 54 | 1.1% |
| Mexico | 32 | 0.7% |
| Peru | 20 | 0.4% |
| South America | 22 | 0.5% |
| South Central Asia | 28 | 0.6% |
| Western Europe | 11 | 0.2% | View All 15 Rows |
Sex and Age in Cheboygan
Sex and Age in Cheboygan
The most populous age groups in Cheboygan are 35 to 39 Years (289 | 11.8%) for men and 55 to 59 Years (217 | 9.3%) for women.
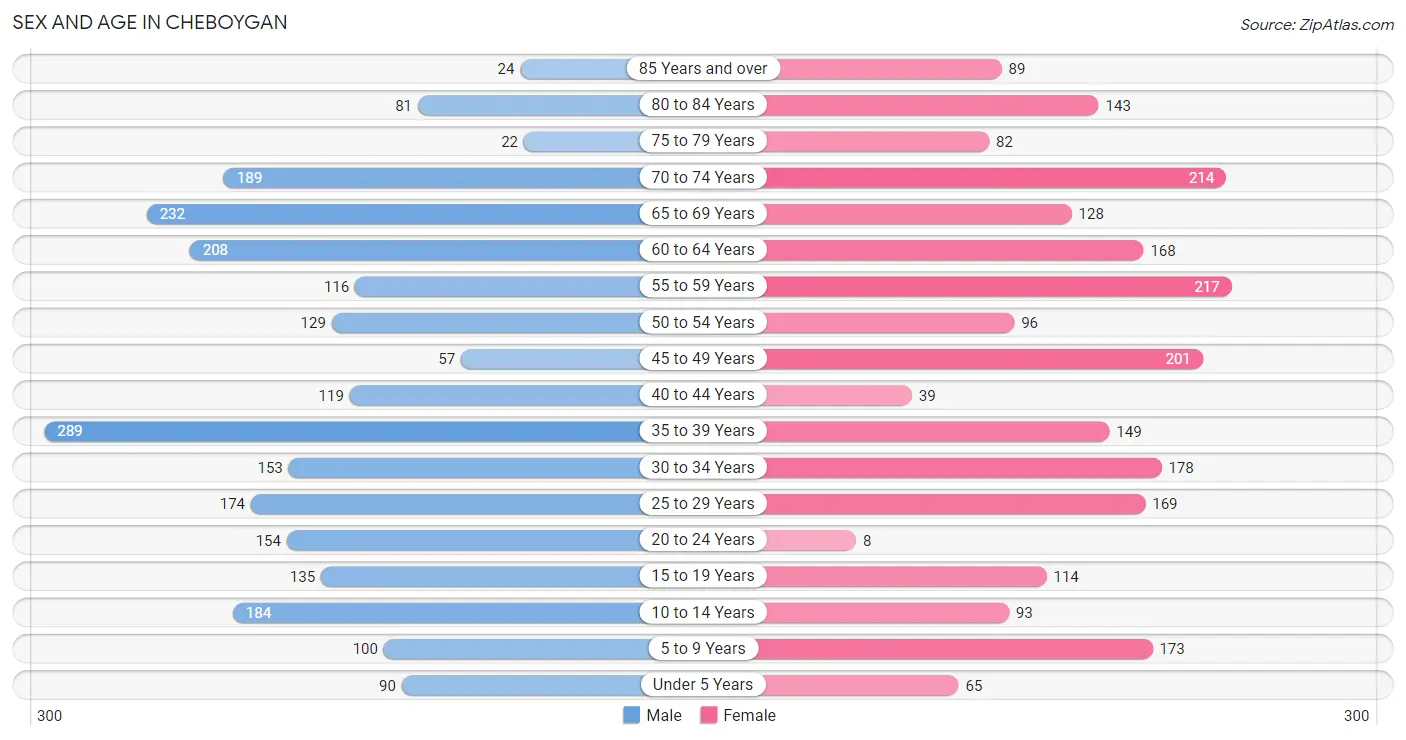
| Age Bracket | Male | Female |
| Under 5 Years | 90 (3.7%) | 65 (2.8%) |
| 5 to 9 Years | 100 (4.1%) | 173 (7.4%) |
| 10 to 14 Years | 184 (7.5%) | 93 (4.0%) |
| 15 to 19 Years | 135 (5.5%) | 114 (4.9%) |
| 20 to 24 Years | 154 (6.3%) | 8 (0.3%) |
| 25 to 29 Years | 174 (7.1%) | 169 (7.3%) |
| 30 to 34 Years | 153 (6.2%) | 178 (7.6%) |
| 35 to 39 Years | 289 (11.8%) | 149 (6.4%) |
| 40 to 44 Years | 119 (4.9%) | 39 (1.7%) |
| 45 to 49 Years | 57 (2.3%) | 201 (8.6%) |
| 50 to 54 Years | 129 (5.2%) | 96 (4.1%) |
| 55 to 59 Years | 116 (4.7%) | 217 (9.3%) |
| 60 to 64 Years | 208 (8.5%) | 168 (7.2%) |
| 65 to 69 Years | 232 (9.5%) | 128 (5.5%) |
| 70 to 74 Years | 189 (7.7%) | 214 (9.2%) |
| 75 to 79 Years | 22 (0.9%) | 82 (3.5%) |
| 80 to 84 Years | 81 (3.3%) | 143 (6.1%) |
| 85 Years and over | 24 (1.0%) | 89 (3.8%) |
| Total | 2,456 (100.0%) | 2,326 (100.0%) |
Families and Households in Cheboygan
Median Family Size in Cheboygan
The median family size in Cheboygan is 3.15 persons per family, with single female/mother families (239 | 21.1%) accounting for the largest median family size of 3.41 persons per family. On the other hand, single male/father families (140 | 12.4%) represent the smallest median family size with 2.93 persons per family.
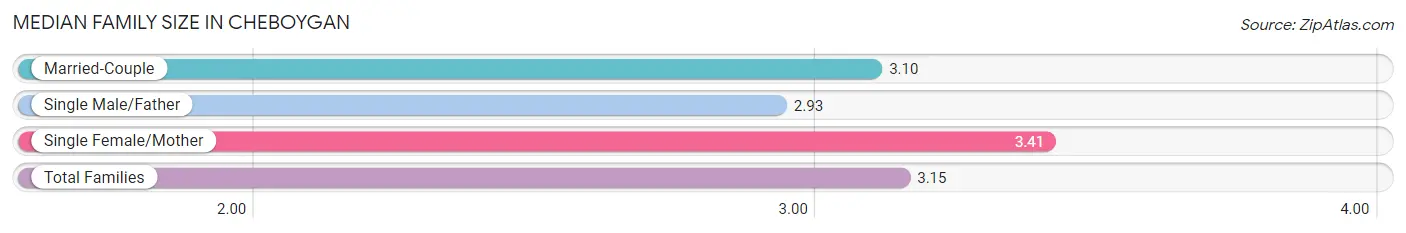
| Family Type | # Families | Family Size |
| Married-Couple | 752 (66.5%) | 3.10 |
| Single Male/Father | 140 (12.4%) | 2.93 |
| Single Female/Mother | 239 (21.1%) | 3.41 |
| Total Families | 1,131 (100.0%) | 3.15 |
Median Household Size in Cheboygan
The median household size in Cheboygan is 2.29 persons per household, with single female/mother households (239 | 12.0%) accounting for the largest median household size of 3.5 persons per household. non-family households (856 | 43.1%) represent the smallest median household size with 1.13 persons per household.
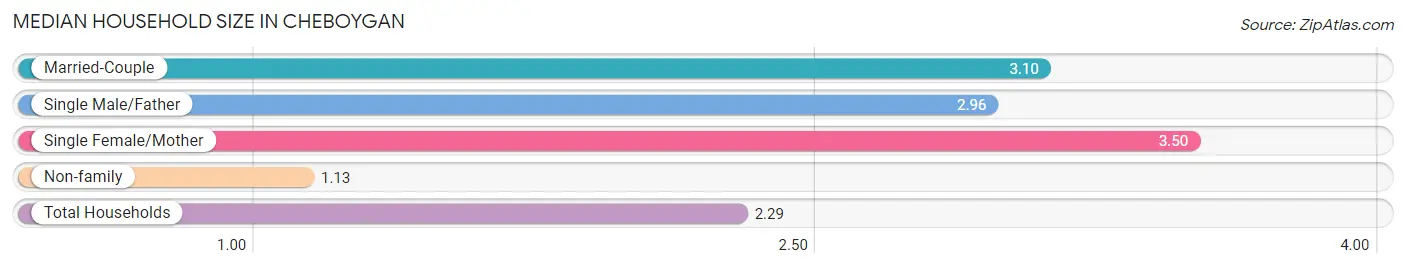
| Household Type | # Households | Household Size |
| Married-Couple | 752 (37.9%) | 3.10 |
| Single Male/Father | 140 (7.0%) | 2.96 |
| Single Female/Mother | 239 (12.0%) | 3.50 |
| Non-family | 856 (43.1%) | 1.13 |
| Total Households | 1,987 (100.0%) | 2.29 |
Household Size by Marriage Status in Cheboygan
Out of a total of 1,987 households in Cheboygan, 1,131 (56.9%) are family households, while 856 (43.1%) are nonfamily households. The most numerous type of family households are 2-person households, comprising 589, and the most common type of nonfamily households are 1-person households, comprising 792.
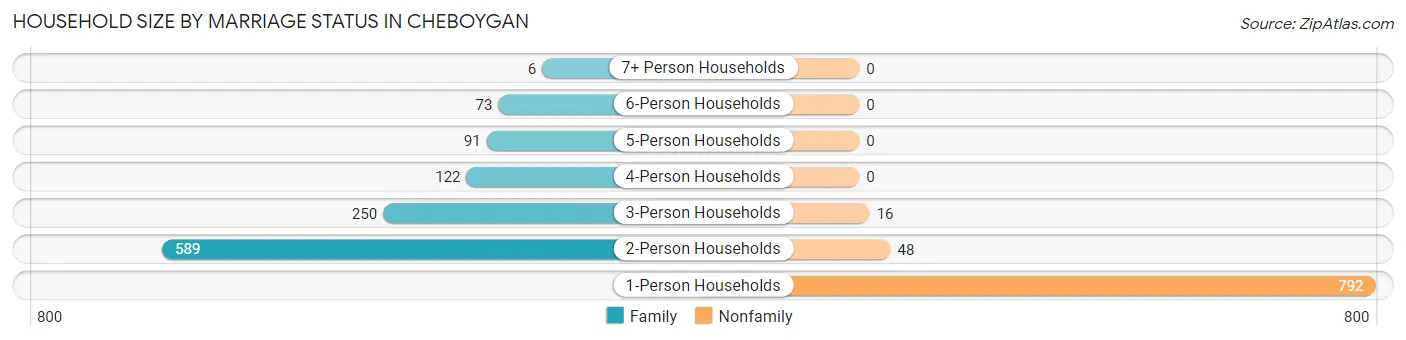
| Household Size | Family Households | Nonfamily Households |
| 1-Person Households | - | 792 (39.9%) |
| 2-Person Households | 589 (29.6%) | 48 (2.4%) |
| 3-Person Households | 250 (12.6%) | 16 (0.8%) |
| 4-Person Households | 122 (6.1%) | 0 (0.0%) |
| 5-Person Households | 91 (4.6%) | 0 (0.0%) |
| 6-Person Households | 73 (3.7%) | 0 (0.0%) |
| 7+ Person Households | 6 (0.3%) | 0 (0.0%) |
| Total | 1,131 (56.9%) | 856 (43.1%) |
Female Fertility in Cheboygan
Fertility by Age in Cheboygan
Average fertility rate in Cheboygan is 37.0 births per 1,000 women. Women in the age bracket of 20 to 34 years have the highest fertility rate with 87.0 births per 1,000 women. Women in the age bracket of 20 to 34 years acount for 93.9% of all women with births.
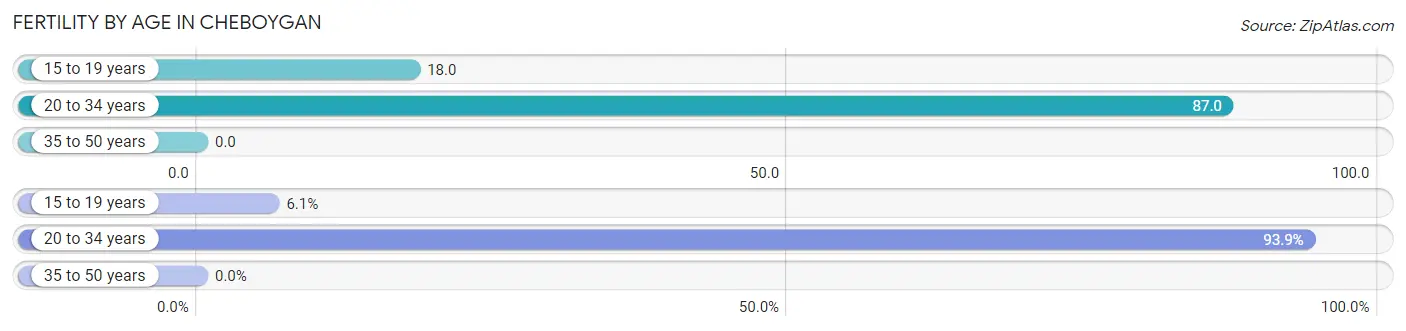
| Age Bracket | Women with Births | Births / 1,000 Women |
| 15 to 19 years | 2 (6.1%) | 18.0 |
| 20 to 34 years | 31 (93.9%) | 87.0 |
| 35 to 50 years | 0 (0.0%) | 0.0 |
| Total | 33 (100.0%) | 37.0 |
Fertility by Age by Marriage Status in Cheboygan
93.9% of women with births (33) in Cheboygan are married. The highest percentage of unmarried women with births falls into 15 to 19 years age bracket with 100.0% of them unmarried at the time of birth, while the lowest percentage of unmarried women with births belong to 20 to 34 years age bracket with 0.0% of them unmarried.
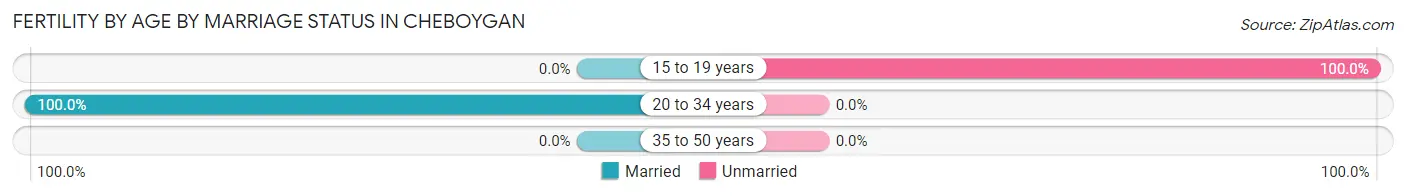
| Age Bracket | Married | Unmarried |
| 15 to 19 years | 0 (0.0%) | 2 (100.0%) |
| 20 to 34 years | 31 (100.0%) | 0 (0.0%) |
| 35 to 50 years | 0 (0.0%) | 0 (0.0%) |
| Total | 31 (93.9%) | 2 (6.1%) |
Fertility by Education in Cheboygan
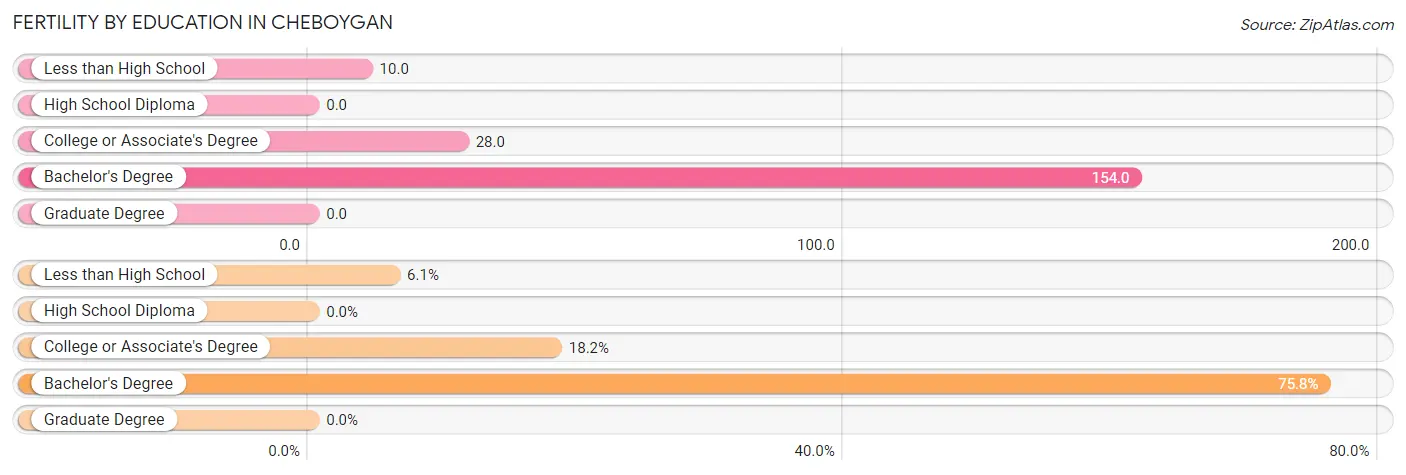
| Educational Attainment | Women with Births | Births / 1,000 Women |
| Less than High School | 2 (6.1%) | 10.0 |
| High School Diploma | 0 (0.0%) | 0.0 |
| College or Associate's Degree | 6 (18.2%) | 28.0 |
| Bachelor's Degree | 25 (75.8%) | 154.0 |
| Graduate Degree | 0 (0.0%) | 0.0 |
| Total | 33 (100.0%) | 37.0 |
Fertility by Education by Marriage Status in Cheboygan
6.1% of women with births in Cheboygan are unmarried. Women with the educational attainment of college or associate's degree are most likely to be married with 100.0% of them married at childbirth, while women with the educational attainment of less than high school are least likely to be married with 100.0% of them unmarried at childbirth.
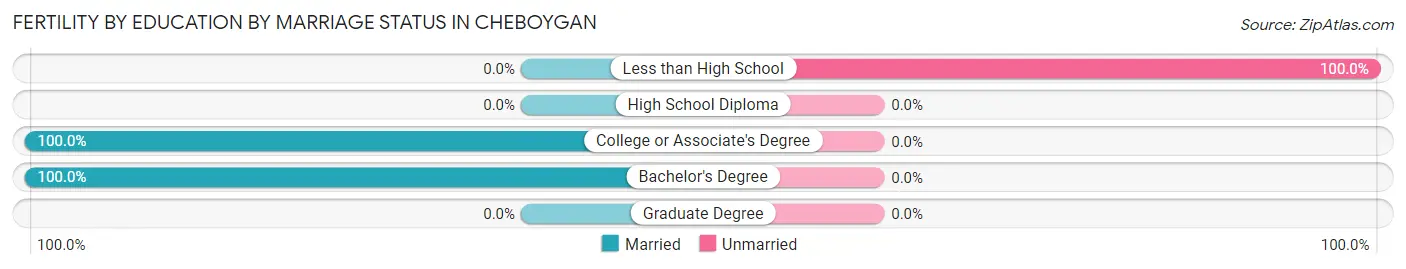
| Educational Attainment | Married | Unmarried |
| Less than High School | 0 (0.0%) | 2 (100.0%) |
| High School Diploma | 0 (0.0%) | 0 (0.0%) |
| College or Associate's Degree | 6 (100.0%) | 0 (0.0%) |
| Bachelor's Degree | 25 (100.0%) | 0 (0.0%) |
| Graduate Degree | 0 (0.0%) | 0 (0.0%) |
| Total | 31 (93.9%) | 2 (6.1%) |
Employment Characteristics in Cheboygan
Employment by Class of Employer in Cheboygan
Among the 1,780 employed individuals in Cheboygan, private company employees (1,285 | 72.2%), self-employed (incorporated) (121 | 6.8%), and not-for-profit organizations (99 | 5.6%) make up the most common classes of employment.
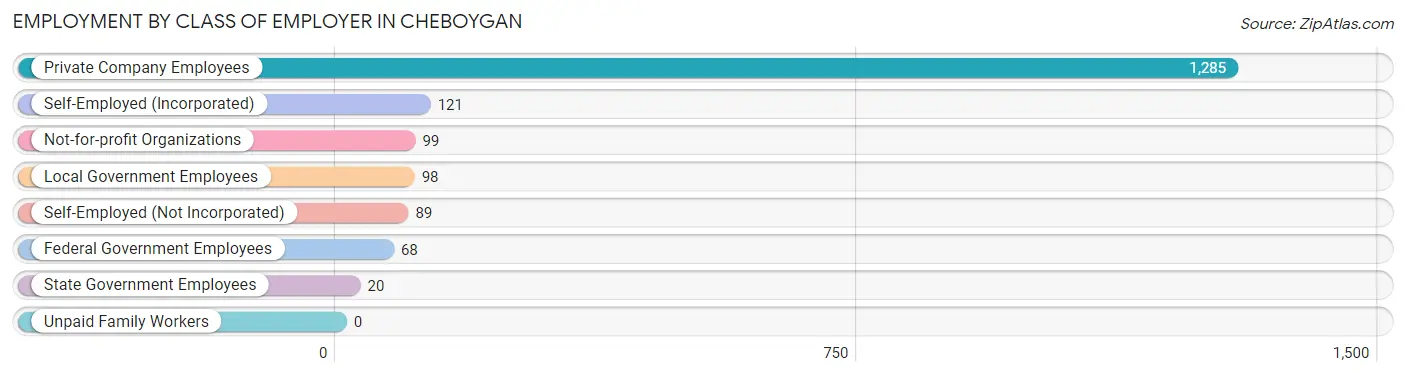
| Employer Class | # Employees | % Employees |
| Private Company Employees | 1,285 | 72.2% |
| Self-Employed (Incorporated) | 121 | 6.8% |
| Self-Employed (Not Incorporated) | 89 | 5.0% |
| Not-for-profit Organizations | 99 | 5.6% |
| Local Government Employees | 98 | 5.5% |
| State Government Employees | 20 | 1.1% |
| Federal Government Employees | 68 | 3.8% |
| Unpaid Family Workers | 0 | 0.0% |
| Total | 1,780 | 100.0% |
Employment Status by Age in Cheboygan
According to the labor force statistics for Cheboygan, out of the total population over 16 years of age (4,016), 49.7% or 1,996 individuals are in the labor force, with 9.5% or 190 of them unemployed. The age group with the highest labor force participation rate is 35 to 44 years, with 83.1% or 495 individuals in the labor force. Within the labor force, the 75 years and over age range has the highest percentage of unemployed individuals, with 40.0% or 4 of them being unemployed.
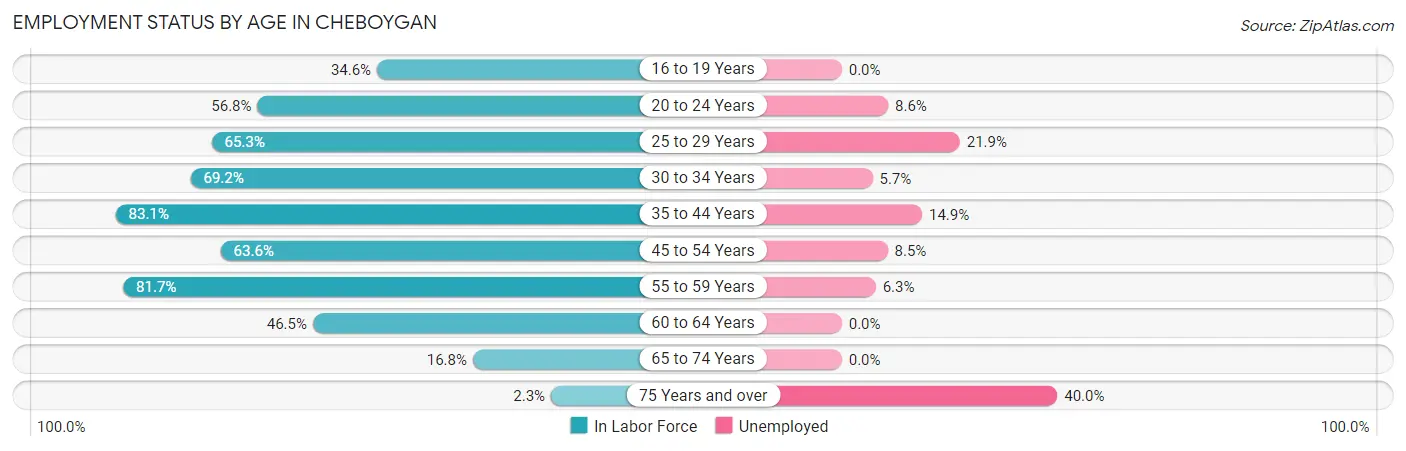
| Age Bracket | In Labor Force | Unemployed |
| 16 to 19 Years | 65 (34.6%) | 0 (0.0%) |
| 20 to 24 Years | 92 (56.8%) | 8 (8.6%) |
| 25 to 29 Years | 224 (65.3%) | 49 (21.9%) |
| 30 to 34 Years | 229 (69.2%) | 13 (5.7%) |
| 35 to 44 Years | 495 (83.1%) | 74 (14.9%) |
| 45 to 54 Years | 307 (63.6%) | 26 (8.5%) |
| 55 to 59 Years | 272 (81.7%) | 17 (6.3%) |
| 60 to 64 Years | 175 (46.5%) | 0 (0.0%) |
| 65 to 74 Years | 128 (16.8%) | 0 (0.0%) |
| 75 Years and over | 10 (2.3%) | 4 (40.0%) |
| Total | 1,996 (49.7%) | 190 (9.5%) |
Employment Status by Educational Attainment in Cheboygan
According to labor force statistics for Cheboygan, 69.1% of individuals (1,701) out of the total population between 25 and 64 years of age (2,462) are in the labor force, with 10.5% or 179 of them being unemployed. The group with the highest labor force participation rate are those with the educational attainment of bachelor's degree or higher, with 75.5% or 311 individuals in the labor force. Within the labor force, individuals with less than high school education have the highest percentage of unemployment, with 29.7% or 52 of them being unemployed.
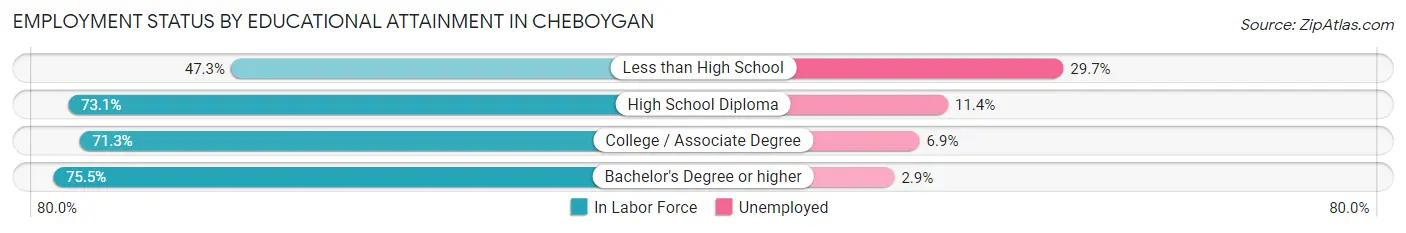
| Educational Attainment | In Labor Force | Unemployed |
| Less than High School | 175 (47.3%) | 110 (29.7%) |
| High School Diploma | 728 (73.1%) | 114 (11.4%) |
| College / Associate Degree | 488 (71.3%) | 47 (6.9%) |
| Bachelor's Degree or higher | 311 (75.5%) | 12 (2.9%) |
| Total | 1,701 (69.1%) | 259 (10.5%) |
Employment Occupations by Sex in Cheboygan
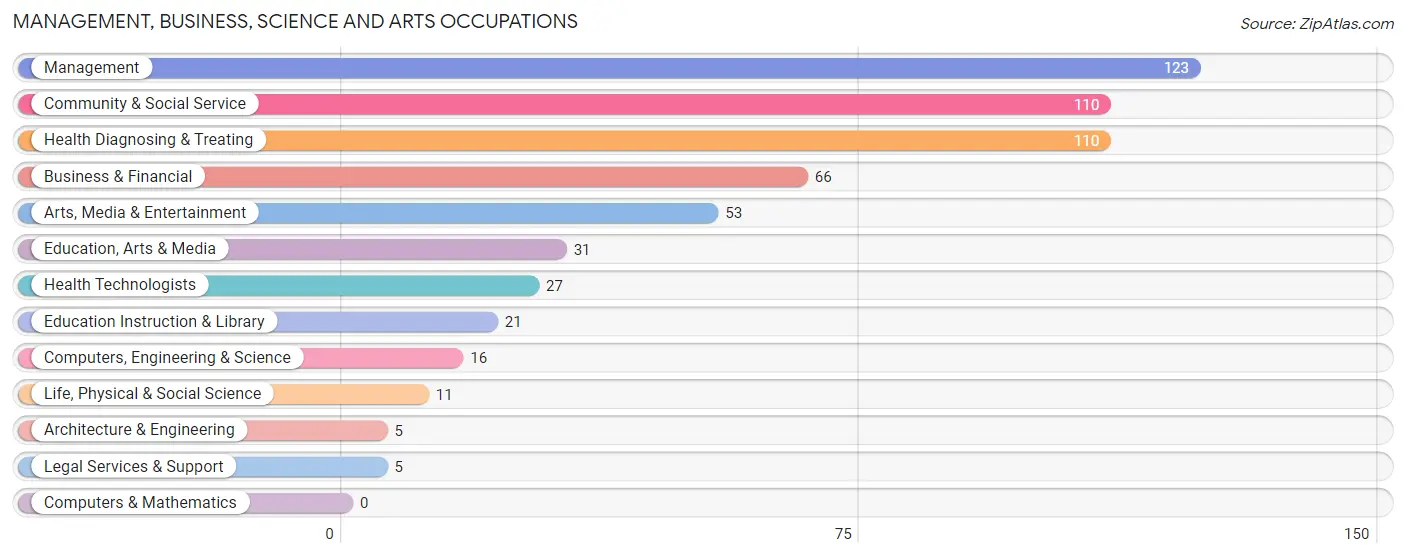
Management, Business, Science and Arts Occupations
The most common Management, Business, Science and Arts occupations in Cheboygan are Management (123 | 7.0%), Community & Social Service (110 | 6.3%), Health Diagnosing & Treating (110 | 6.3%), Business & Financial (66 | 3.8%), and Arts, Media & Entertainment (53 | 3.0%).
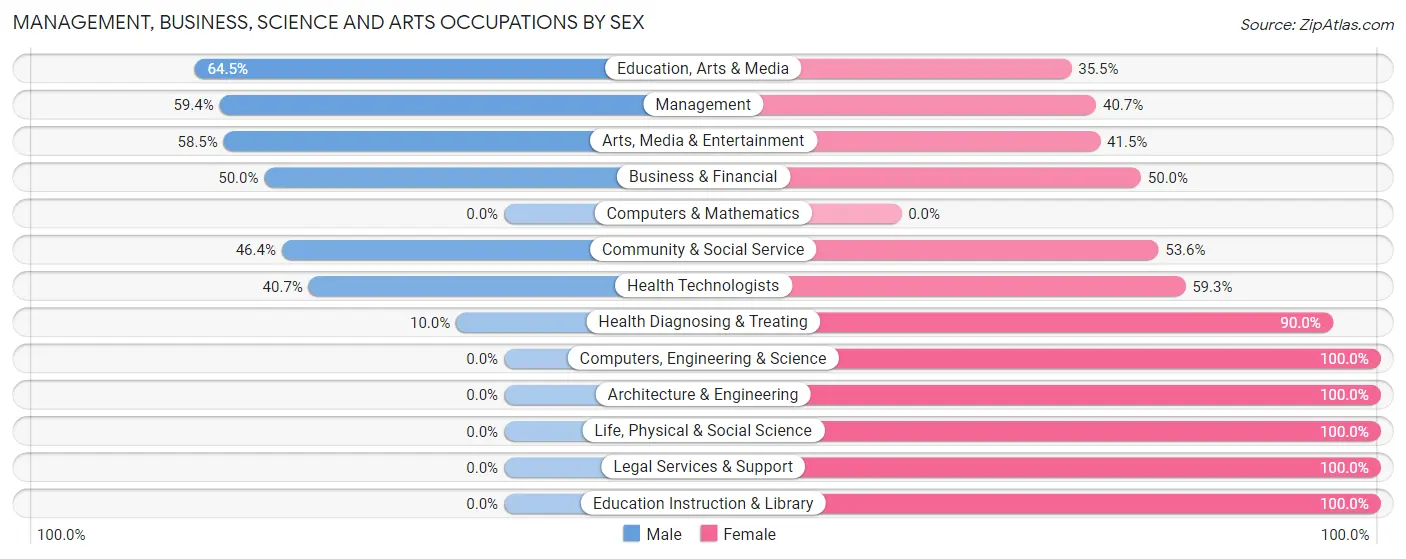
Management, Business, Science and Arts Occupations by Sex
Within the Management, Business, Science and Arts occupations in Cheboygan, the most male-oriented occupations are Education, Arts & Media (64.5%), Management (59.4%), and Arts, Media & Entertainment (58.5%), while the most female-oriented occupations are Computers, Engineering & Science (100.0%), Architecture & Engineering (100.0%), and Life, Physical & Social Science (100.0%).
| Occupation | Male | Female |
| Management | 73 (59.4%) | 50 (40.6%) |
| Business & Financial | 33 (50.0%) | 33 (50.0%) |
| Computers, Engineering & Science | 0 (0.0%) | 16 (100.0%) |
| Computers & Mathematics | 0 (0.0%) | 0 (0.0%) |
| Architecture & Engineering | 0 (0.0%) | 5 (100.0%) |
| Life, Physical & Social Science | 0 (0.0%) | 11 (100.0%) |
| Community & Social Service | 51 (46.4%) | 59 (53.6%) |
| Education, Arts & Media | 20 (64.5%) | 11 (35.5%) |
| Legal Services & Support | 0 (0.0%) | 5 (100.0%) |
| Education Instruction & Library | 0 (0.0%) | 21 (100.0%) |
| Arts, Media & Entertainment | 31 (58.5%) | 22 (41.5%) |
| Health Diagnosing & Treating | 11 (10.0%) | 99 (90.0%) |
| Health Technologists | 11 (40.7%) | 16 (59.3%) |
| Total (Category) | 168 (39.5%) | 257 (60.5%) |
| Total (Overall) | 919 (52.4%) | 836 (47.6%) |
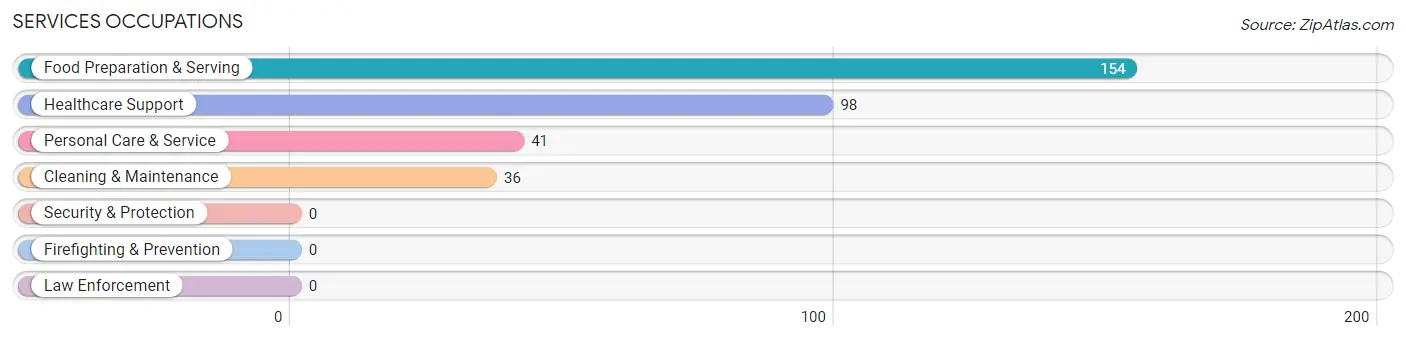
Services Occupations
The most common Services occupations in Cheboygan are Food Preparation & Serving (154 | 8.8%), Healthcare Support (98 | 5.6%), Personal Care & Service (41 | 2.3%), and Cleaning & Maintenance (36 | 2.1%).
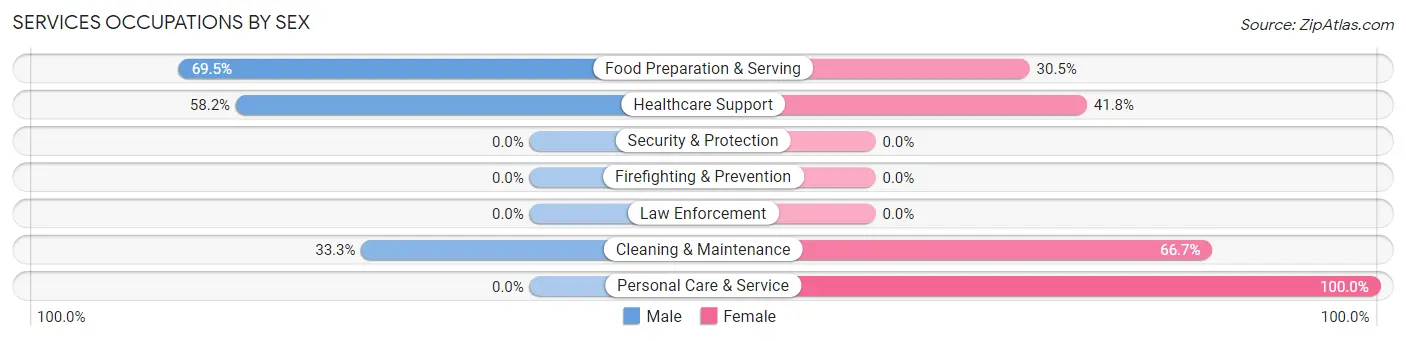
Services Occupations by Sex
Within the Services occupations in Cheboygan, the most male-oriented occupations are Food Preparation & Serving (69.5%), Healthcare Support (58.2%), and Cleaning & Maintenance (33.3%), while the most female-oriented occupations are Personal Care & Service (100.0%), Cleaning & Maintenance (66.7%), and Healthcare Support (41.8%).
| Occupation | Male | Female |
| Healthcare Support | 57 (58.2%) | 41 (41.8%) |
| Security & Protection | 0 (0.0%) | 0 (0.0%) |
| Firefighting & Prevention | 0 (0.0%) | 0 (0.0%) |
| Law Enforcement | 0 (0.0%) | 0 (0.0%) |
| Food Preparation & Serving | 107 (69.5%) | 47 (30.5%) |
| Cleaning & Maintenance | 12 (33.3%) | 24 (66.7%) |
| Personal Care & Service | 0 (0.0%) | 41 (100.0%) |
| Total (Category) | 176 (53.5%) | 153 (46.5%) |
| Total (Overall) | 919 (52.4%) | 836 (47.6%) |
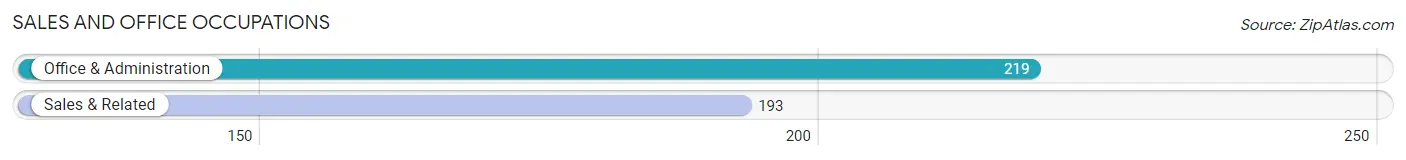
Sales and Office Occupations
The most common Sales and Office occupations in Cheboygan are Office & Administration (219 | 12.5%), and Sales & Related (193 | 11.0%).
Sales and Office Occupations by Sex
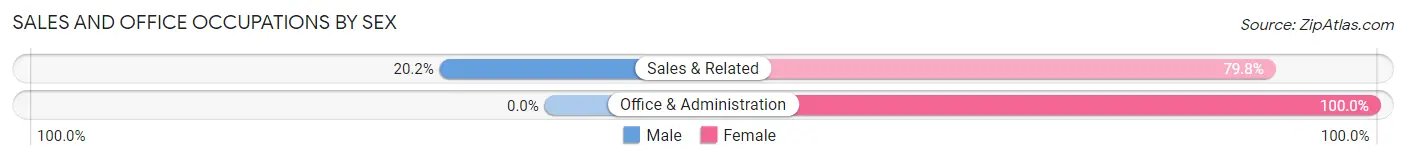
| Occupation | Male | Female |
| Sales & Related | 39 (20.2%) | 154 (79.8%) |
| Office & Administration | 0 (0.0%) | 219 (100.0%) |
| Total (Category) | 39 (9.5%) | 373 (90.5%) |
| Total (Overall) | 919 (52.4%) | 836 (47.6%) |
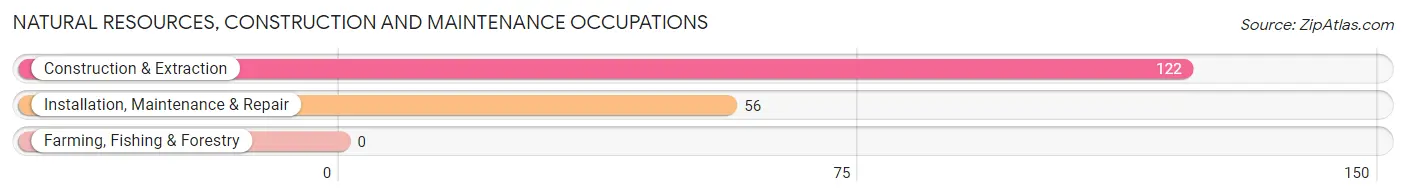
Natural Resources, Construction and Maintenance Occupations
The most common Natural Resources, Construction and Maintenance occupations in Cheboygan are Construction & Extraction (122 | 7.0%), and Installation, Maintenance & Repair (56 | 3.2%).
Natural Resources, Construction and Maintenance Occupations by Sex
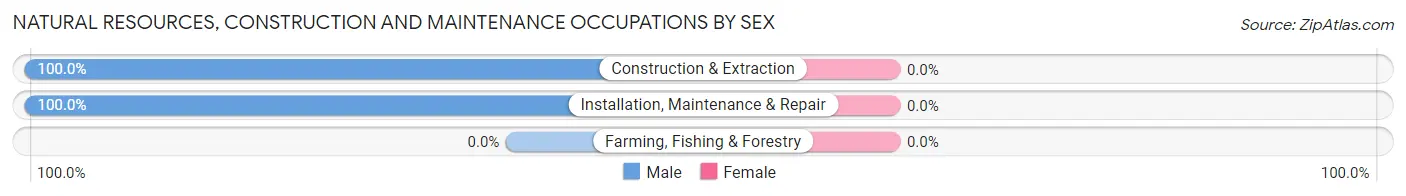
| Occupation | Male | Female |
| Farming, Fishing & Forestry | 0 (0.0%) | 0 (0.0%) |
| Construction & Extraction | 122 (100.0%) | 0 (0.0%) |
| Installation, Maintenance & Repair | 56 (100.0%) | 0 (0.0%) |
| Total (Category) | 178 (100.0%) | 0 (0.0%) |
| Total (Overall) | 919 (52.4%) | 836 (47.6%) |
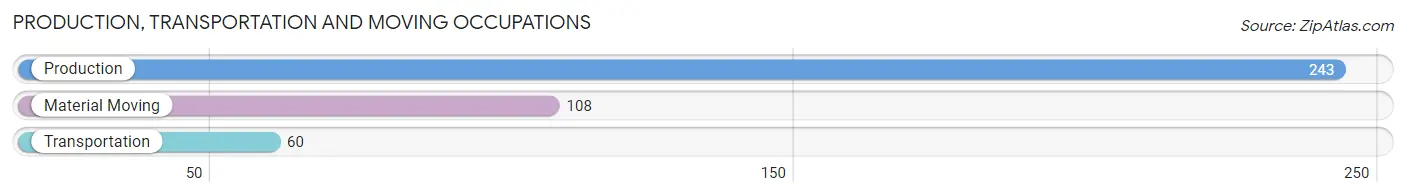
Production, Transportation and Moving Occupations
The most common Production, Transportation and Moving occupations in Cheboygan are Production (243 | 13.9%), Material Moving (108 | 6.1%), and Transportation (60 | 3.4%).
Production, Transportation and Moving Occupations by Sex
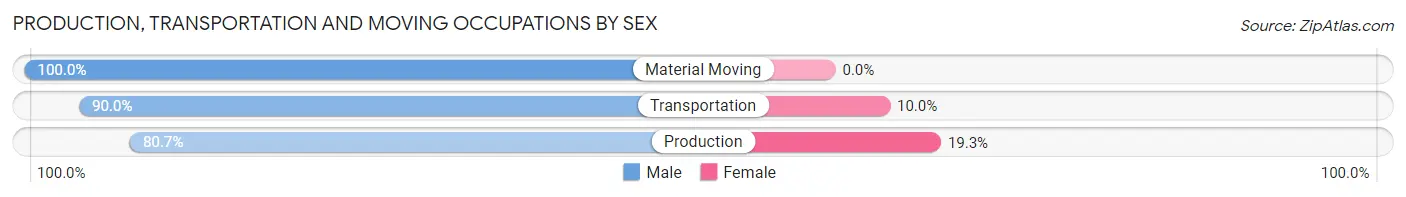
| Occupation | Male | Female |
| Production | 196 (80.7%) | 47 (19.3%) |
| Transportation | 54 (90.0%) | 6 (10.0%) |
| Material Moving | 108 (100.0%) | 0 (0.0%) |
| Total (Category) | 358 (87.1%) | 53 (12.9%) |
| Total (Overall) | 919 (52.4%) | 836 (47.6%) |
Employment Industries by Sex in Cheboygan
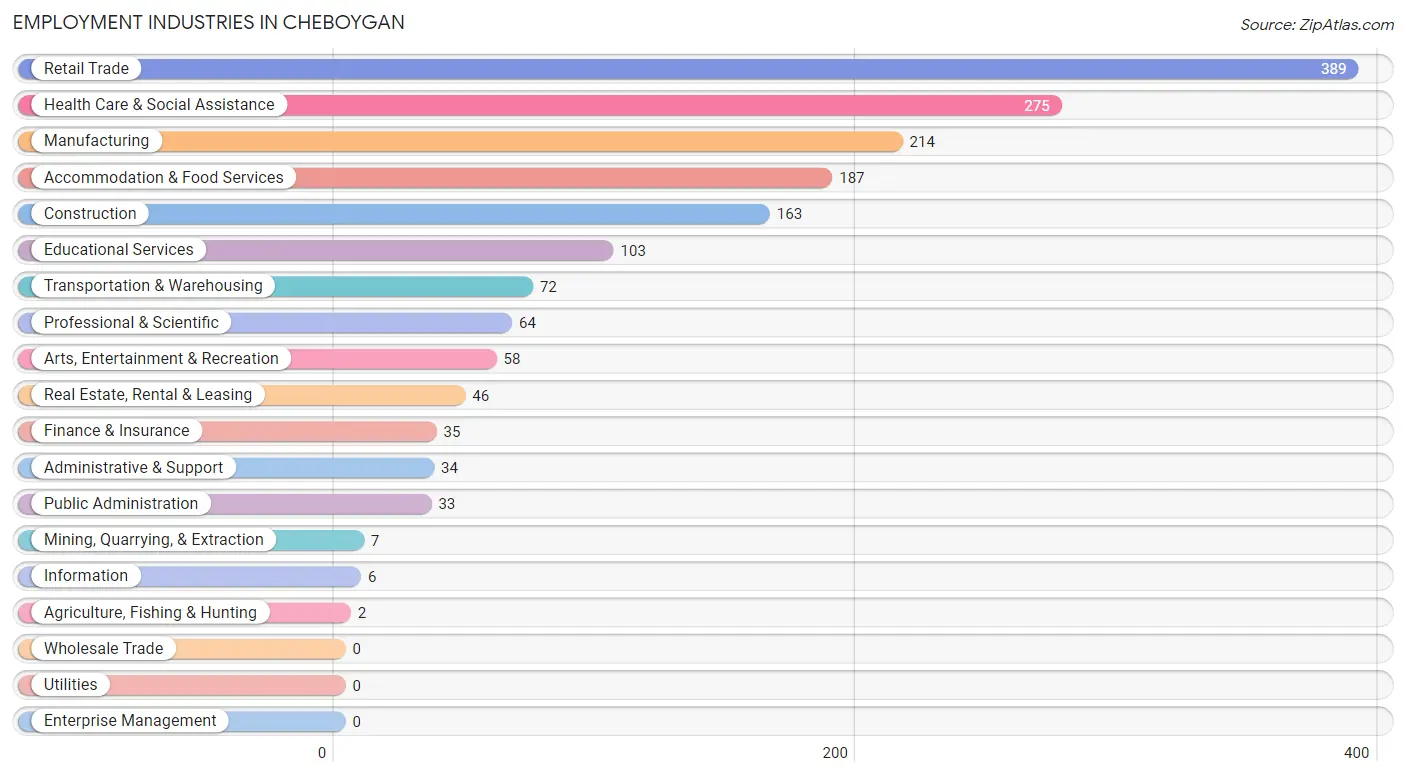
Employment Industries in Cheboygan
The major employment industries in Cheboygan include Retail Trade (389 | 22.2%), Health Care & Social Assistance (275 | 15.7%), Manufacturing (214 | 12.2%), Accommodation & Food Services (187 | 10.7%), and Construction (163 | 9.3%).
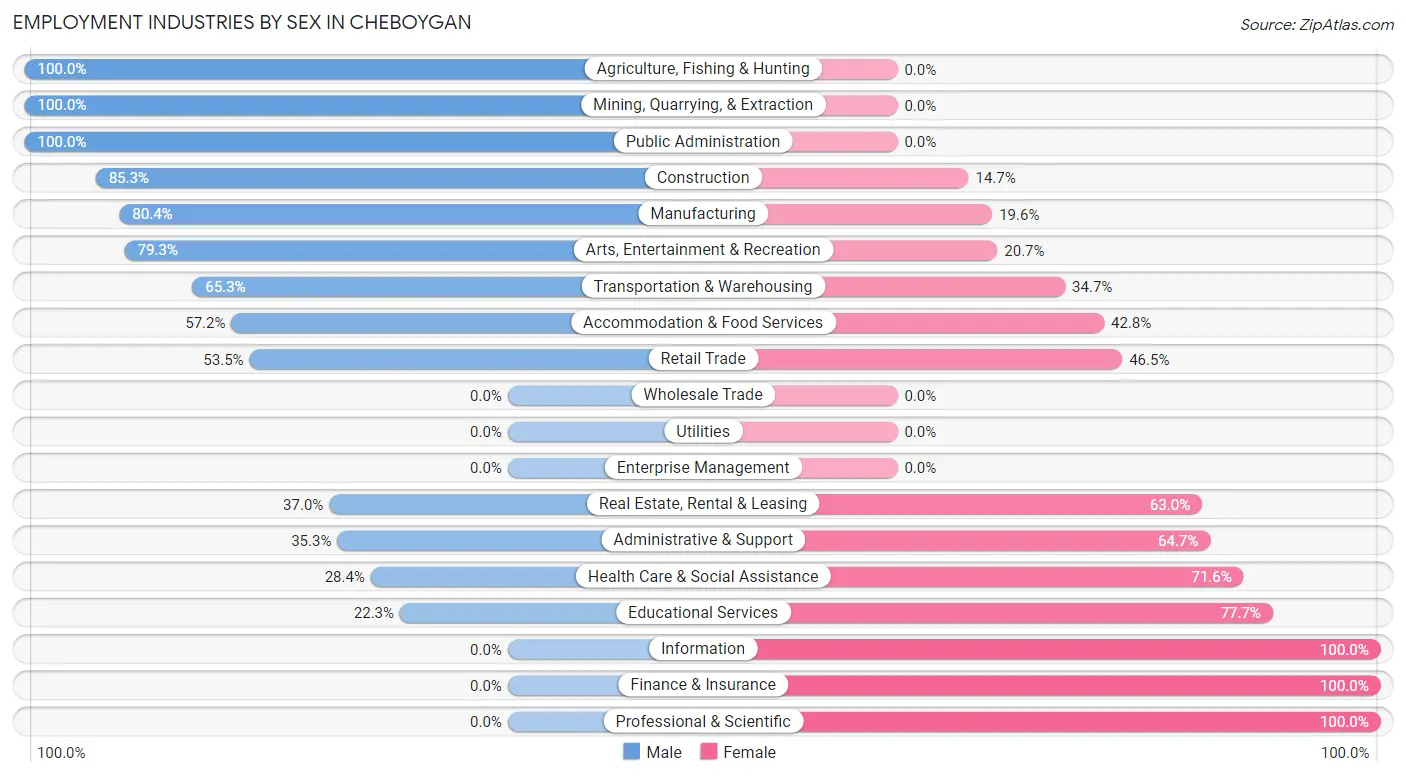
Employment Industries by Sex in Cheboygan
The Cheboygan industries that see more men than women are Agriculture, Fishing & Hunting (100.0%), Mining, Quarrying, & Extraction (100.0%), and Public Administration (100.0%), whereas the industries that tend to have a higher number of women are Information (100.0%), Finance & Insurance (100.0%), and Professional & Scientific (100.0%).
| Industry | Male | Female |
| Agriculture, Fishing & Hunting | 2 (100.0%) | 0 (0.0%) |
| Mining, Quarrying, & Extraction | 7 (100.0%) | 0 (0.0%) |
| Construction | 139 (85.3%) | 24 (14.7%) |
| Manufacturing | 172 (80.4%) | 42 (19.6%) |
| Wholesale Trade | 0 (0.0%) | 0 (0.0%) |
| Retail Trade | 208 (53.5%) | 181 (46.5%) |
| Transportation & Warehousing | 47 (65.3%) | 25 (34.7%) |
| Utilities | 0 (0.0%) | 0 (0.0%) |
| Information | 0 (0.0%) | 6 (100.0%) |
| Finance & Insurance | 0 (0.0%) | 35 (100.0%) |
| Real Estate, Rental & Leasing | 17 (37.0%) | 29 (63.0%) |
| Professional & Scientific | 0 (0.0%) | 64 (100.0%) |
| Enterprise Management | 0 (0.0%) | 0 (0.0%) |
| Administrative & Support | 12 (35.3%) | 22 (64.7%) |
| Educational Services | 23 (22.3%) | 80 (77.7%) |
| Health Care & Social Assistance | 78 (28.4%) | 197 (71.6%) |
| Arts, Entertainment & Recreation | 46 (79.3%) | 12 (20.7%) |
| Accommodation & Food Services | 107 (57.2%) | 80 (42.8%) |
| Public Administration | 33 (100.0%) | 0 (0.0%) |
| Total | 919 (52.4%) | 836 (47.6%) |
Education in Cheboygan
School Enrollment in Cheboygan
The most common levels of schooling among the 947 students in Cheboygan are middle school (264 | 27.9%), high school (188 | 19.9%), and elementary school (177 | 18.7%).
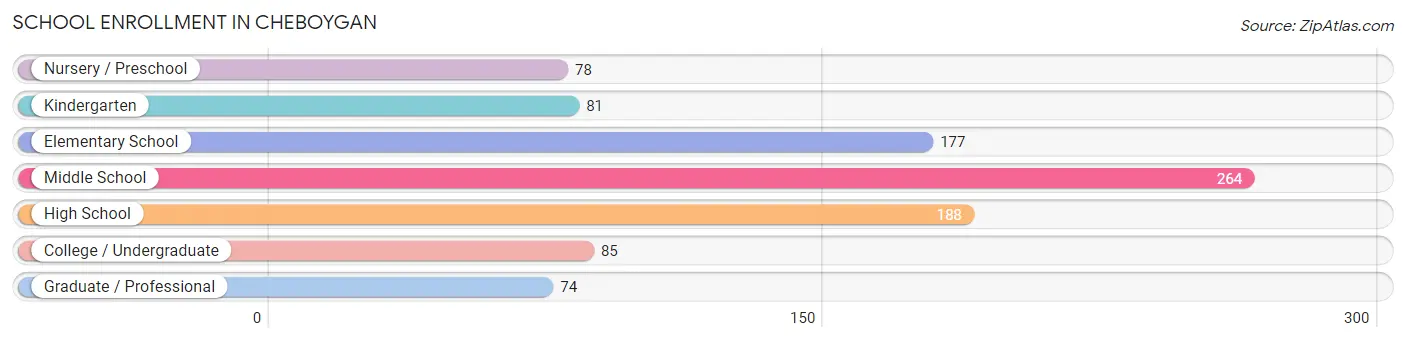
| School Level | # Students | % Students |
| Nursery / Preschool | 78 | 8.2% |
| Kindergarten | 81 | 8.6% |
| Elementary School | 177 | 18.7% |
| Middle School | 264 | 27.9% |
| High School | 188 | 19.9% |
| College / Undergraduate | 85 | 9.0% |
| Graduate / Professional | 74 | 7.8% |
| Total | 947 | 100.0% |
School Enrollment by Age by Funding Source in Cheboygan
Out of a total of 947 students who are enrolled in schools in Cheboygan, 229 (24.2%) attend a private institution, while the remaining 718 (75.8%) are enrolled in public schools. The age group of 20 to 24 year olds has the highest likelihood of being enrolled in private schools, with 57 (100.0% in the age bracket) enrolled. Conversely, the age group of 18 to 19 year olds has the lowest likelihood of being enrolled in a private school, with 97 (100.0% in the age bracket) attending a public institution.
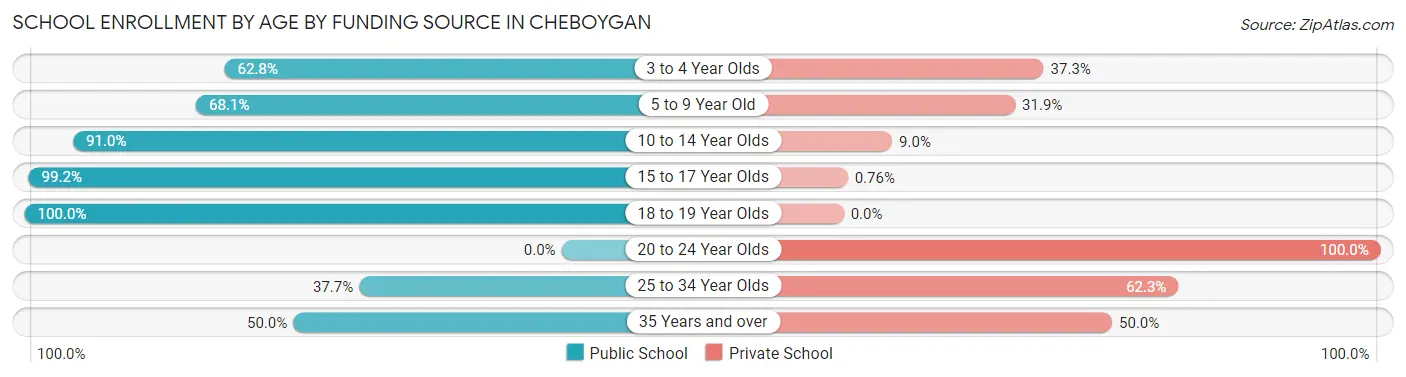
| Age Bracket | Public School | Private School |
| 3 to 4 Year Olds | 32 (62.7%) | 19 (37.2%) |
| 5 to 9 Year Old | 179 (68.1%) | 84 (31.9%) |
| 10 to 14 Year Olds | 252 (91.0%) | 25 (9.0%) |
| 15 to 17 Year Olds | 130 (99.2%) | 1 (0.8%) |
| 18 to 19 Year Olds | 97 (100.0%) | 0 (0.0%) |
| 20 to 24 Year Olds | 0 (0.0%) | 57 (100.0%) |
| 25 to 34 Year Olds | 23 (37.7%) | 38 (62.3%) |
| 35 Years and over | 5 (50.0%) | 5 (50.0%) |
| Total | 718 (75.8%) | 229 (24.2%) |
Educational Attainment by Field of Study in Cheboygan
Education (216 | 26.1%), business (160 | 19.3%), psychology (87 | 10.5%), science & technology (76 | 9.2%), and arts & humanities (70 | 8.5%) are the most common fields of study among 828 individuals in Cheboygan who have obtained a bachelor's degree or higher.
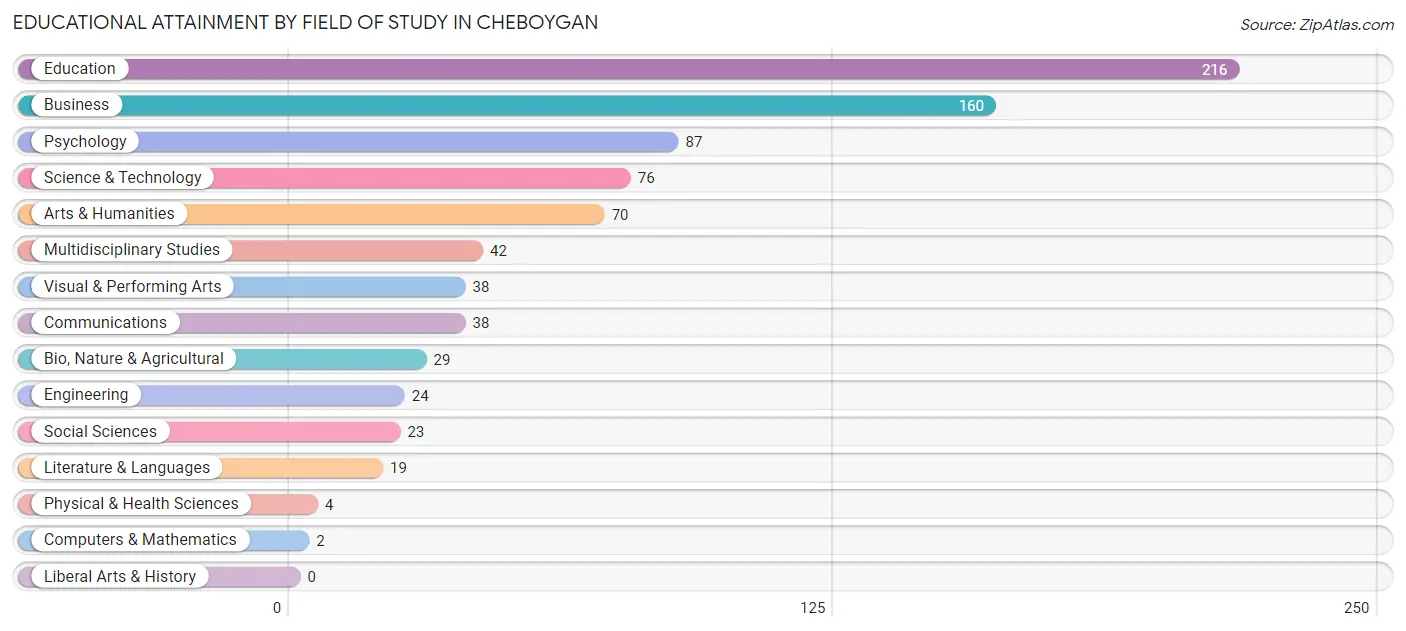
| Field of Study | # Graduates | % Graduates |
| Computers & Mathematics | 2 | 0.2% |
| Bio, Nature & Agricultural | 29 | 3.5% |
| Physical & Health Sciences | 4 | 0.5% |
| Psychology | 87 | 10.5% |
| Social Sciences | 23 | 2.8% |
| Engineering | 24 | 2.9% |
| Multidisciplinary Studies | 42 | 5.1% |
| Science & Technology | 76 | 9.2% |
| Business | 160 | 19.3% |
| Education | 216 | 26.1% |
| Literature & Languages | 19 | 2.3% |
| Liberal Arts & History | 0 | 0.0% |
| Visual & Performing Arts | 38 | 4.6% |
| Communications | 38 | 4.6% |
| Arts & Humanities | 70 | 8.5% |
| Total | 828 | 100.0% |
Transportation & Commute in Cheboygan
Vehicle Availability by Sex in Cheboygan
The most prevalent vehicle ownership categories in Cheboygan are males with 2 vehicles (294, accounting for 31.7%) and females with 2 vehicles (331, making up 35.4%).
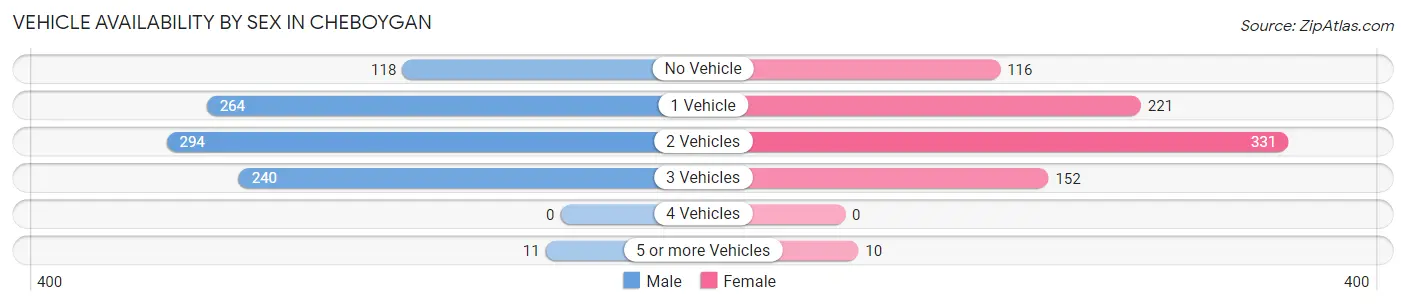
| Vehicles Available | Male | Female |
| No Vehicle | 118 (12.7%) | 116 (14.0%) |
| 1 Vehicle | 264 (28.5%) | 221 (26.6%) |
| 2 Vehicles | 294 (31.7%) | 331 (39.9%) |
| 3 Vehicles | 240 (25.9%) | 152 (18.3%) |
| 4 Vehicles | 0 (0.0%) | 0 (0.0%) |
| 5 or more Vehicles | 11 (1.2%) | 10 (1.2%) |
| Total | 927 (100.0%) | 830 (100.0%) |
Commute Time in Cheboygan
The most frequently occuring commute durations in Cheboygan are 5 to 9 minutes (601 commuters, 35.5%), 10 to 14 minutes (320 commuters, 18.9%), and 20 to 24 minutes (174 commuters, 10.3%).
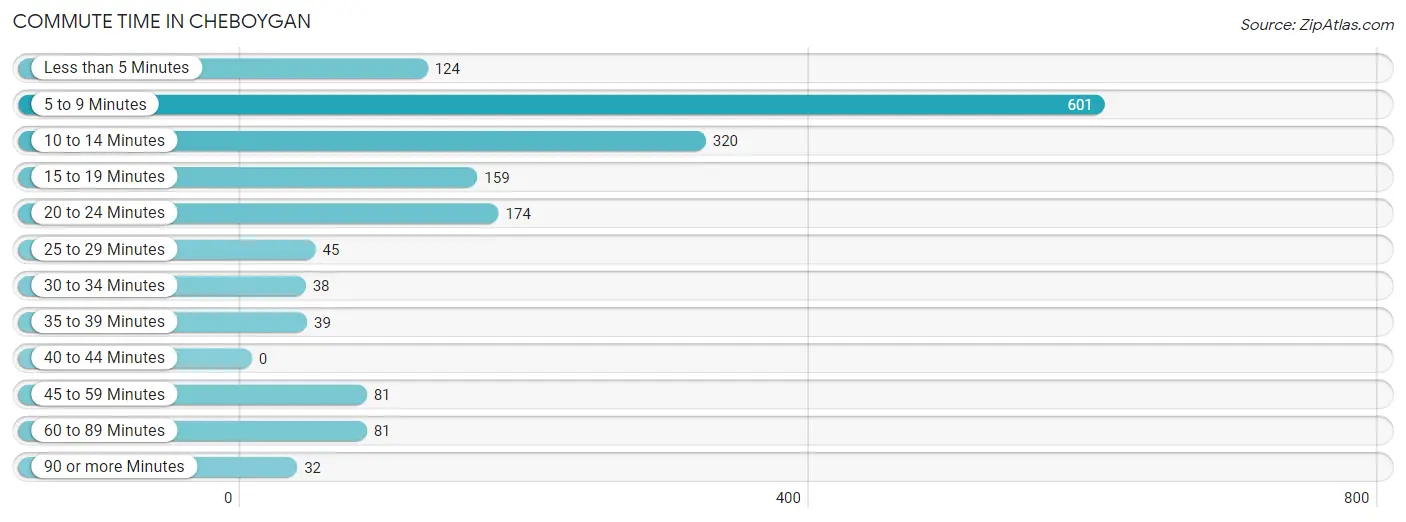
| Commute Time | # Commuters | % Commuters |
| Less than 5 Minutes | 124 | 7.3% |
| 5 to 9 Minutes | 601 | 35.5% |
| 10 to 14 Minutes | 320 | 18.9% |
| 15 to 19 Minutes | 159 | 9.4% |
| 20 to 24 Minutes | 174 | 10.3% |
| 25 to 29 Minutes | 45 | 2.7% |
| 30 to 34 Minutes | 38 | 2.2% |
| 35 to 39 Minutes | 39 | 2.3% |
| 40 to 44 Minutes | 0 | 0.0% |
| 45 to 59 Minutes | 81 | 4.8% |
| 60 to 89 Minutes | 81 | 4.8% |
| 90 or more Minutes | 32 | 1.9% |
Commute Time by Sex in Cheboygan
The most common commute times in Cheboygan are 5 to 9 minutes (273 commuters, 29.1%) for males and 5 to 9 minutes (328 commuters, 43.4%) for females.
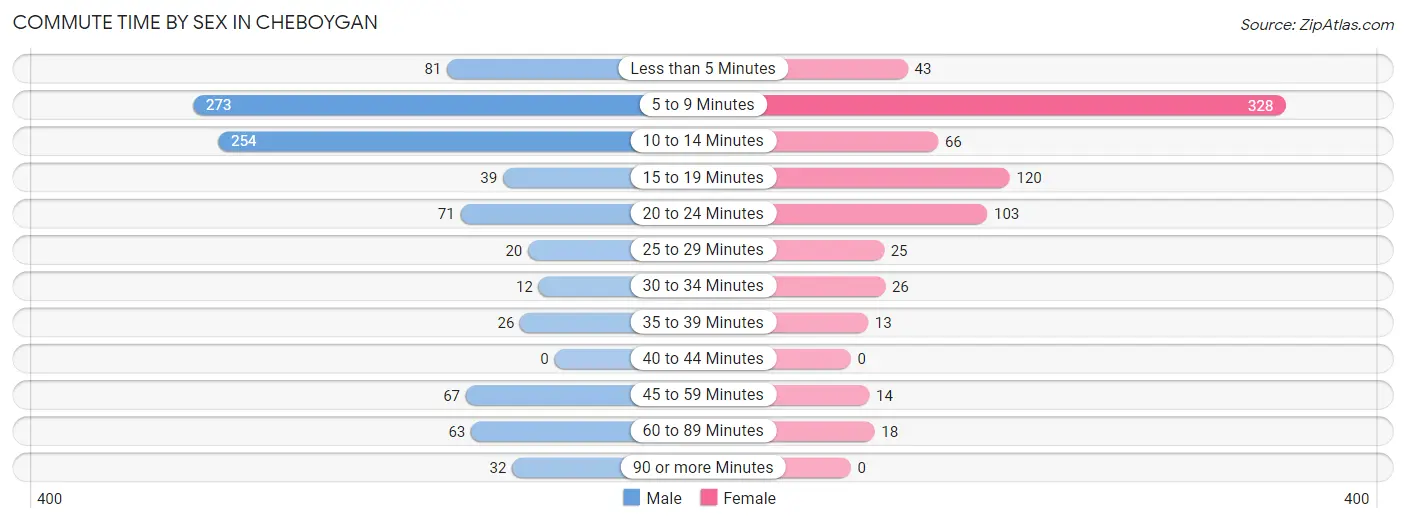
| Commute Time | Male | Female |
| Less than 5 Minutes | 81 (8.6%) | 43 (5.7%) |
| 5 to 9 Minutes | 273 (29.1%) | 328 (43.4%) |
| 10 to 14 Minutes | 254 (27.1%) | 66 (8.7%) |
| 15 to 19 Minutes | 39 (4.2%) | 120 (15.9%) |
| 20 to 24 Minutes | 71 (7.6%) | 103 (13.6%) |
| 25 to 29 Minutes | 20 (2.1%) | 25 (3.3%) |
| 30 to 34 Minutes | 12 (1.3%) | 26 (3.4%) |
| 35 to 39 Minutes | 26 (2.8%) | 13 (1.7%) |
| 40 to 44 Minutes | 0 (0.0%) | 0 (0.0%) |
| 45 to 59 Minutes | 67 (7.1%) | 14 (1.8%) |
| 60 to 89 Minutes | 63 (6.7%) | 18 (2.4%) |
| 90 or more Minutes | 32 (3.4%) | 0 (0.0%) |
Time of Departure to Work by Sex in Cheboygan
The most frequent times of departure to work in Cheboygan are 4:00 PM to 11:59 PM (183, 19.5%) for males and 7:30 AM to 7:59 AM (255, 33.7%) for females.
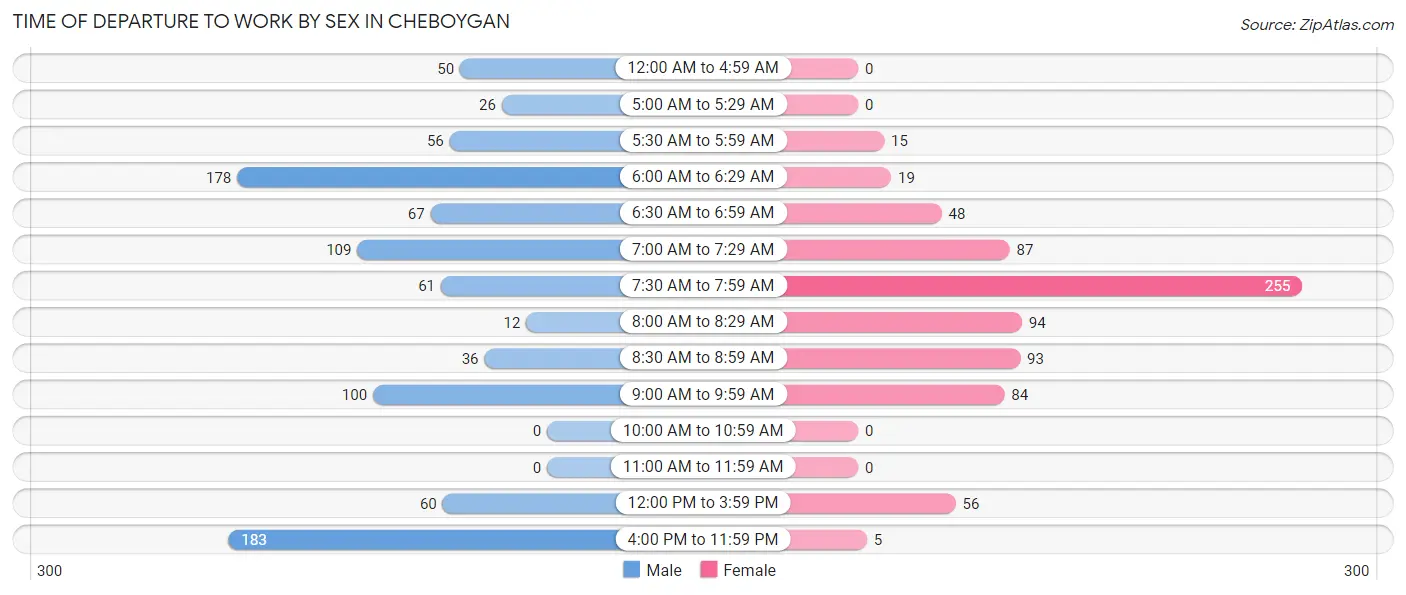
| Time of Departure | Male | Female |
| 12:00 AM to 4:59 AM | 50 (5.3%) | 0 (0.0%) |
| 5:00 AM to 5:29 AM | 26 (2.8%) | 0 (0.0%) |
| 5:30 AM to 5:59 AM | 56 (6.0%) | 15 (2.0%) |
| 6:00 AM to 6:29 AM | 178 (19.0%) | 19 (2.5%) |
| 6:30 AM to 6:59 AM | 67 (7.1%) | 48 (6.4%) |
| 7:00 AM to 7:29 AM | 109 (11.6%) | 87 (11.5%) |
| 7:30 AM to 7:59 AM | 61 (6.5%) | 255 (33.7%) |
| 8:00 AM to 8:29 AM | 12 (1.3%) | 94 (12.4%) |
| 8:30 AM to 8:59 AM | 36 (3.8%) | 93 (12.3%) |
| 9:00 AM to 9:59 AM | 100 (10.7%) | 84 (11.1%) |
| 10:00 AM to 10:59 AM | 0 (0.0%) | 0 (0.0%) |
| 11:00 AM to 11:59 AM | 0 (0.0%) | 0 (0.0%) |
| 12:00 PM to 3:59 PM | 60 (6.4%) | 56 (7.4%) |
| 4:00 PM to 11:59 PM | 183 (19.5%) | 5 (0.7%) |
| Total | 938 (100.0%) | 756 (100.0%) |
Housing Occupancy in Cheboygan
Occupancy by Ownership in Cheboygan
Of the total 1,987 dwellings in Cheboygan, owner-occupied units account for 1,290 (64.9%), while renter-occupied units make up 697 (35.1%).
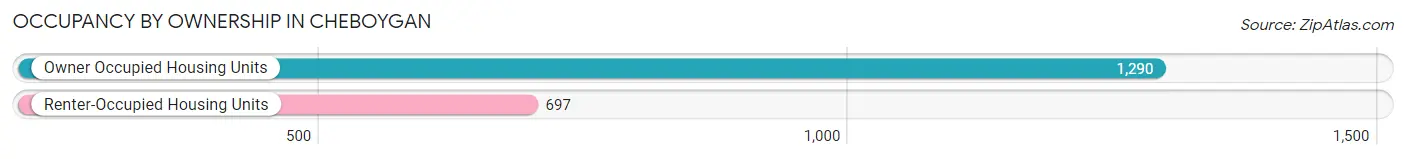
| Occupancy | # Housing Units | % Housing Units |
| Owner Occupied Housing Units | 1,290 | 64.9% |
| Renter-Occupied Housing Units | 697 | 35.1% |
| Total Occupied Housing Units | 1,987 | 100.0% |
Occupancy by Household Size in Cheboygan
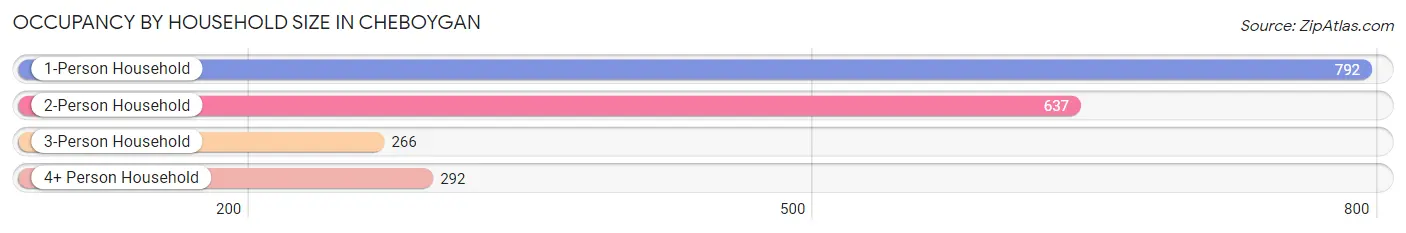
| Household Size | # Housing Units | % Housing Units |
| 1-Person Household | 792 | 39.9% |
| 2-Person Household | 637 | 32.1% |
| 3-Person Household | 266 | 13.4% |
| 4+ Person Household | 292 | 14.7% |
| Total Housing Units | 1,987 | 100.0% |
Occupancy by Ownership by Household Size in Cheboygan
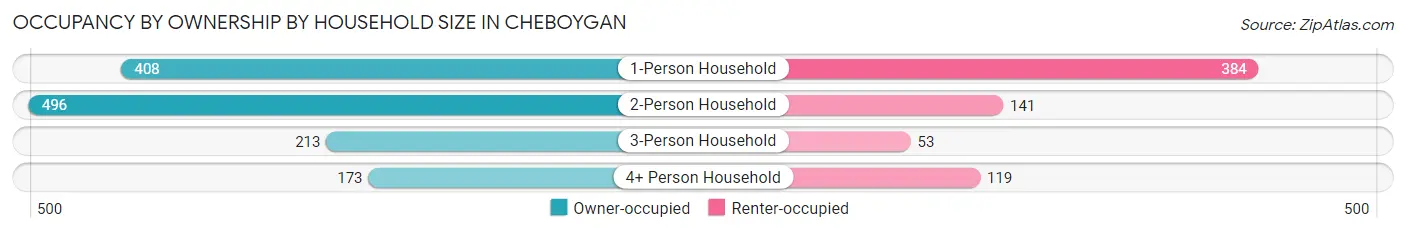
| Household Size | Owner-occupied | Renter-occupied |
| 1-Person Household | 408 (51.5%) | 384 (48.5%) |
| 2-Person Household | 496 (77.9%) | 141 (22.1%) |
| 3-Person Household | 213 (80.1%) | 53 (19.9%) |
| 4+ Person Household | 173 (59.3%) | 119 (40.7%) |
| Total Housing Units | 1,290 (64.9%) | 697 (35.1%) |
Occupancy by Educational Attainment in Cheboygan
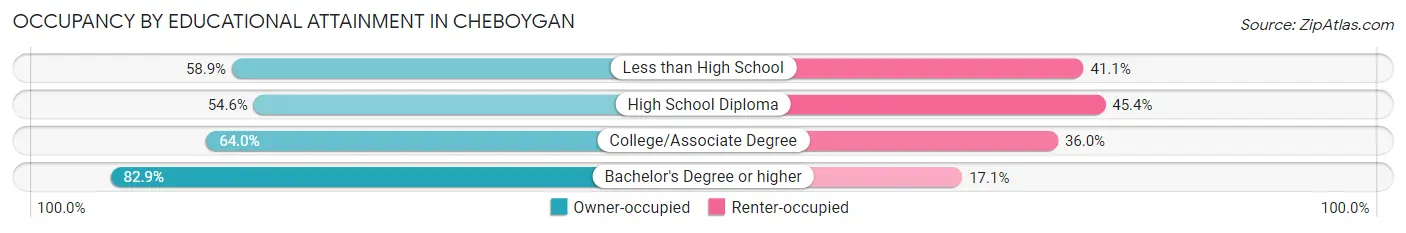
| Household Size | Owner-occupied | Renter-occupied |
| Less than High School | 106 (58.9%) | 74 (41.1%) |
| High School Diploma | 399 (54.6%) | 332 (45.4%) |
| College/Associate Degree | 362 (64.0%) | 204 (36.0%) |
| Bachelor's Degree or higher | 423 (82.9%) | 87 (17.1%) |
Occupancy by Age of Householder in Cheboygan
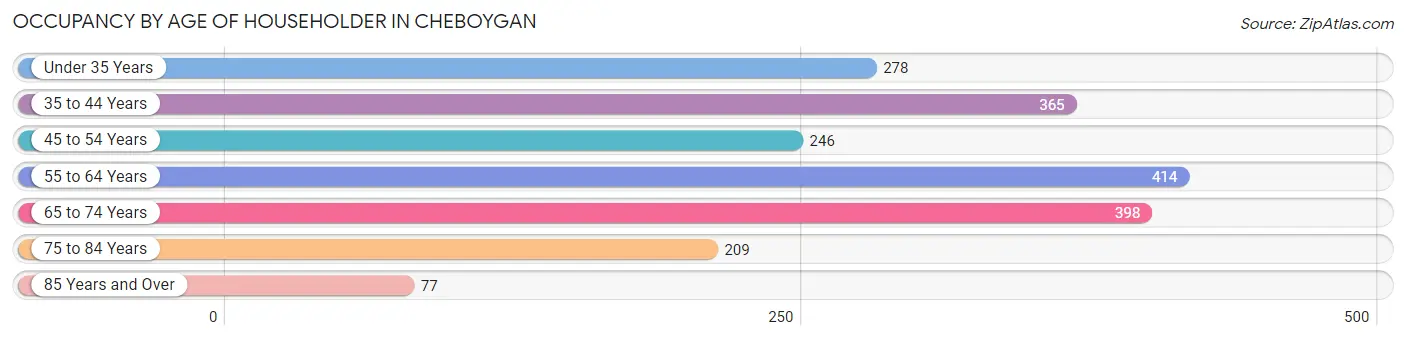
| Age Bracket | # Households | % Households |
| Under 35 Years | 278 | 14.0% |
| 35 to 44 Years | 365 | 18.4% |
| 45 to 54 Years | 246 | 12.4% |
| 55 to 64 Years | 414 | 20.8% |
| 65 to 74 Years | 398 | 20.0% |
| 75 to 84 Years | 209 | 10.5% |
| 85 Years and Over | 77 | 3.9% |
| Total | 1,987 | 100.0% |
Housing Finances in Cheboygan
Median Income by Occupancy in Cheboygan
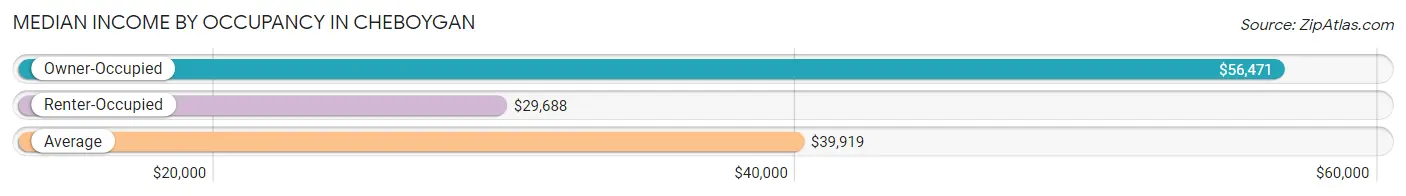
| Occupancy Type | # Households | Median Income |
| Owner-Occupied | 1,290 (64.9%) | $56,471 |
| Renter-Occupied | 697 (35.1%) | $29,688 |
| Average | 1,987 (100.0%) | $39,919 |
Occupancy by Householder Income Bracket in Cheboygan
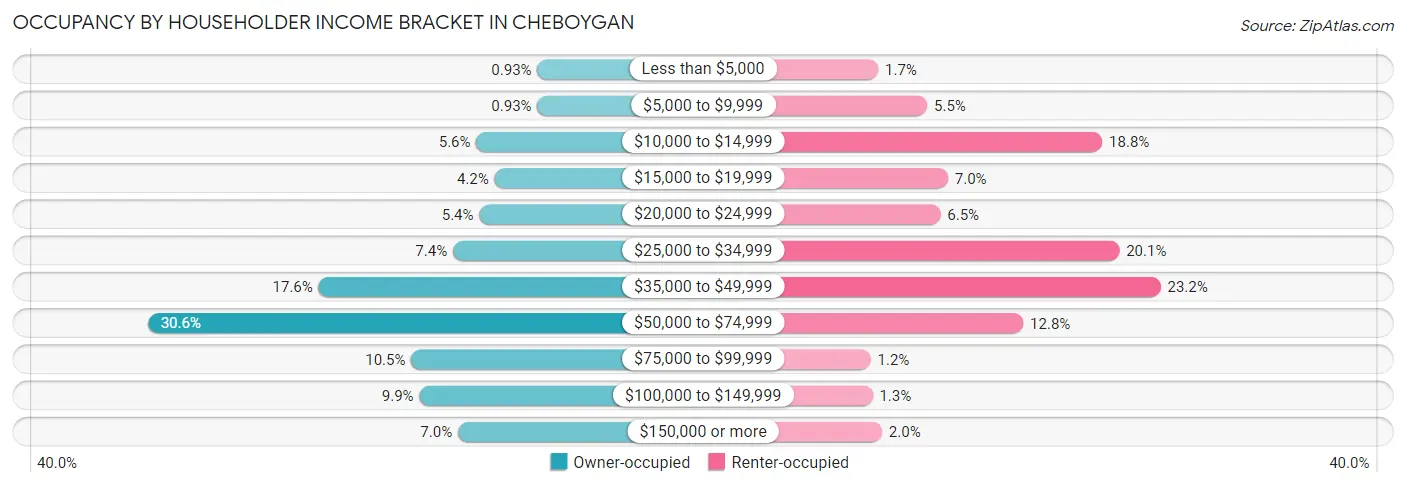
| Income Bracket | Owner-occupied | Renter-occupied |
| Less than $5,000 | 12 (0.9%) | 12 (1.7%) |
| $5,000 to $9,999 | 12 (0.9%) | 38 (5.4%) |
| $10,000 to $14,999 | 72 (5.6%) | 131 (18.8%) |
| $15,000 to $19,999 | 54 (4.2%) | 49 (7.0%) |
| $20,000 to $24,999 | 69 (5.3%) | 45 (6.5%) |
| $25,000 to $34,999 | 95 (7.4%) | 140 (20.1%) |
| $35,000 to $49,999 | 227 (17.6%) | 162 (23.2%) |
| $50,000 to $74,999 | 395 (30.6%) | 89 (12.8%) |
| $75,000 to $99,999 | 136 (10.5%) | 8 (1.1%) |
| $100,000 to $149,999 | 128 (9.9%) | 9 (1.3%) |
| $150,000 or more | 90 (7.0%) | 14 (2.0%) |
| Total | 1,290 (100.0%) | 697 (100.0%) |
Monthly Housing Cost Tiers in Cheboygan
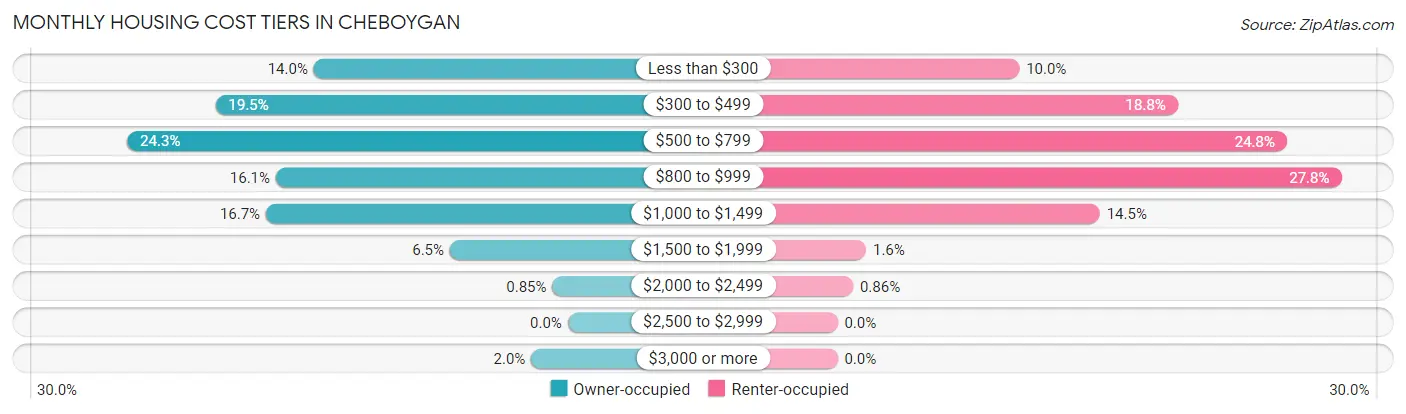
| Monthly Cost | Owner-occupied | Renter-occupied |
| Less than $300 | 181 (14.0%) | 70 (10.0%) |
| $300 to $499 | 251 (19.5%) | 131 (18.8%) |
| $500 to $799 | 314 (24.3%) | 173 (24.8%) |
| $800 to $999 | 208 (16.1%) | 194 (27.8%) |
| $1,000 to $1,499 | 215 (16.7%) | 101 (14.5%) |
| $1,500 to $1,999 | 84 (6.5%) | 11 (1.6%) |
| $2,000 to $2,499 | 11 (0.9%) | 6 (0.9%) |
| $2,500 to $2,999 | 0 (0.0%) | 0 (0.0%) |
| $3,000 or more | 26 (2.0%) | 0 (0.0%) |
| Total | 1,290 (100.0%) | 697 (100.0%) |
Physical Housing Characteristics in Cheboygan
Housing Structures in Cheboygan
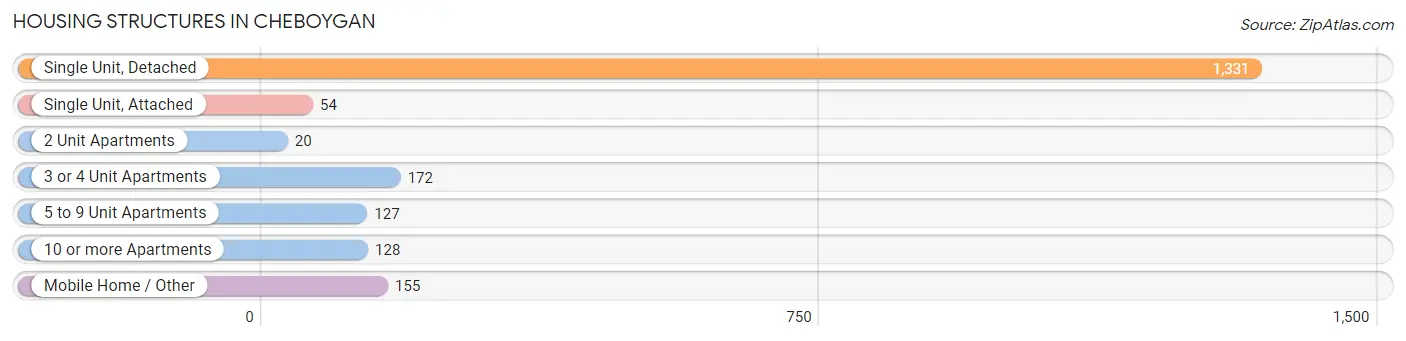
| Structure Type | # Housing Units | % Housing Units |
| Single Unit, Detached | 1,331 | 67.0% |
| Single Unit, Attached | 54 | 2.7% |
| 2 Unit Apartments | 20 | 1.0% |
| 3 or 4 Unit Apartments | 172 | 8.7% |
| 5 to 9 Unit Apartments | 127 | 6.4% |
| 10 or more Apartments | 128 | 6.4% |
| Mobile Home / Other | 155 | 7.8% |
| Total | 1,987 | 100.0% |
Housing Structures by Occupancy in Cheboygan
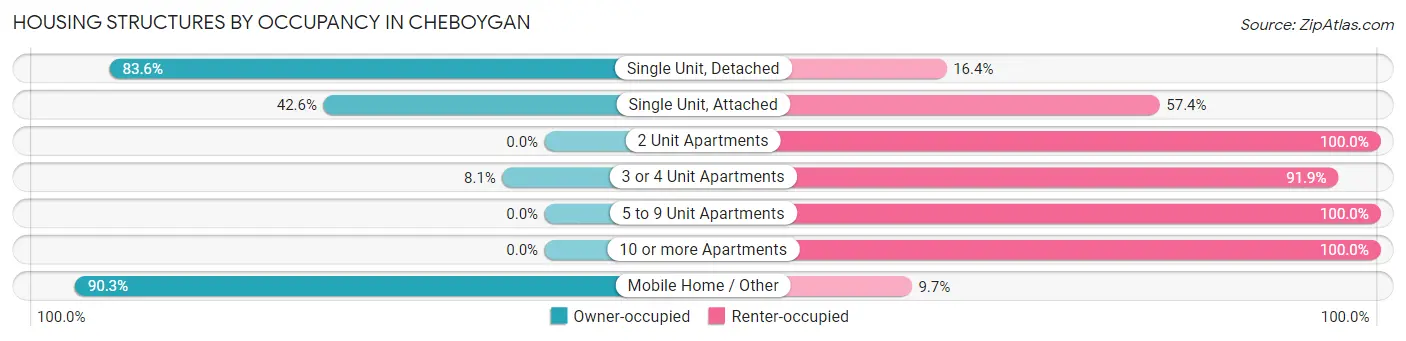
| Structure Type | Owner-occupied | Renter-occupied |
| Single Unit, Detached | 1,113 (83.6%) | 218 (16.4%) |
| Single Unit, Attached | 23 (42.6%) | 31 (57.4%) |
| 2 Unit Apartments | 0 (0.0%) | 20 (100.0%) |
| 3 or 4 Unit Apartments | 14 (8.1%) | 158 (91.9%) |
| 5 to 9 Unit Apartments | 0 (0.0%) | 127 (100.0%) |
| 10 or more Apartments | 0 (0.0%) | 128 (100.0%) |
| Mobile Home / Other | 140 (90.3%) | 15 (9.7%) |
| Total | 1,290 (64.9%) | 697 (35.1%) |
Housing Structures by Number of Rooms in Cheboygan
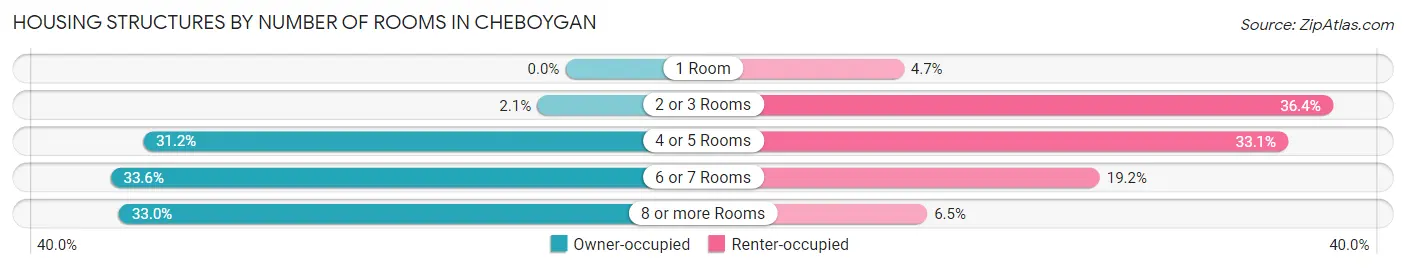
| Number of Rooms | Owner-occupied | Renter-occupied |
| 1 Room | 0 (0.0%) | 33 (4.7%) |
| 2 or 3 Rooms | 27 (2.1%) | 254 (36.4%) |
| 4 or 5 Rooms | 403 (31.2%) | 231 (33.1%) |
| 6 or 7 Rooms | 434 (33.6%) | 134 (19.2%) |
| 8 or more Rooms | 426 (33.0%) | 45 (6.5%) |
| Total | 1,290 (100.0%) | 697 (100.0%) |
Housing Structure by Heating Type in Cheboygan
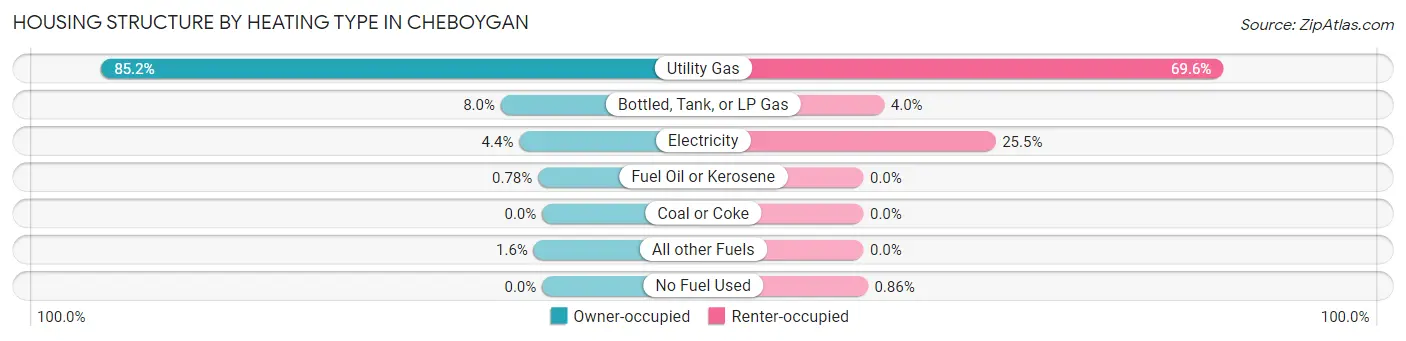
| Heating Type | Owner-occupied | Renter-occupied |
| Utility Gas | 1,099 (85.2%) | 485 (69.6%) |
| Bottled, Tank, or LP Gas | 103 (8.0%) | 28 (4.0%) |
| Electricity | 57 (4.4%) | 178 (25.5%) |
| Fuel Oil or Kerosene | 10 (0.8%) | 0 (0.0%) |
| Coal or Coke | 0 (0.0%) | 0 (0.0%) |
| All other Fuels | 21 (1.6%) | 0 (0.0%) |
| No Fuel Used | 0 (0.0%) | 6 (0.9%) |
| Total | 1,290 (100.0%) | 697 (100.0%) |
Household Vehicle Usage in Cheboygan
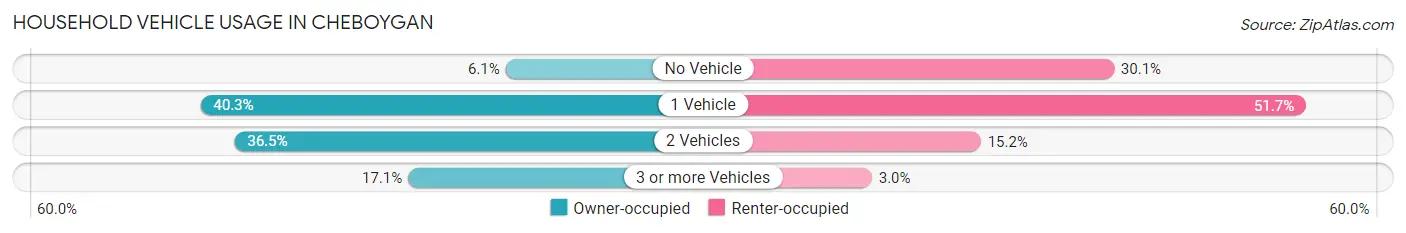
| Vehicles per Household | Owner-occupied | Renter-occupied |
| No Vehicle | 79 (6.1%) | 210 (30.1%) |
| 1 Vehicle | 520 (40.3%) | 360 (51.6%) |
| 2 Vehicles | 471 (36.5%) | 106 (15.2%) |
| 3 or more Vehicles | 220 (17.1%) | 21 (3.0%) |
| Total | 1,290 (100.0%) | 697 (100.0%) |
Real Estate & Mortgages in Cheboygan
Real Estate and Mortgage Overview in Cheboygan
| Characteristic | Without Mortgage | With Mortgage |
| Housing Units | 751 | 539 |
| Median Property Value | $102,900 | $132,500 |
| Median Household Income | $53,380 | $76 |
| Monthly Housing Costs | $480 | $26 |
| Real Estate Taxes | $1,929 | $0 |
Property Value by Mortgage Status in Cheboygan
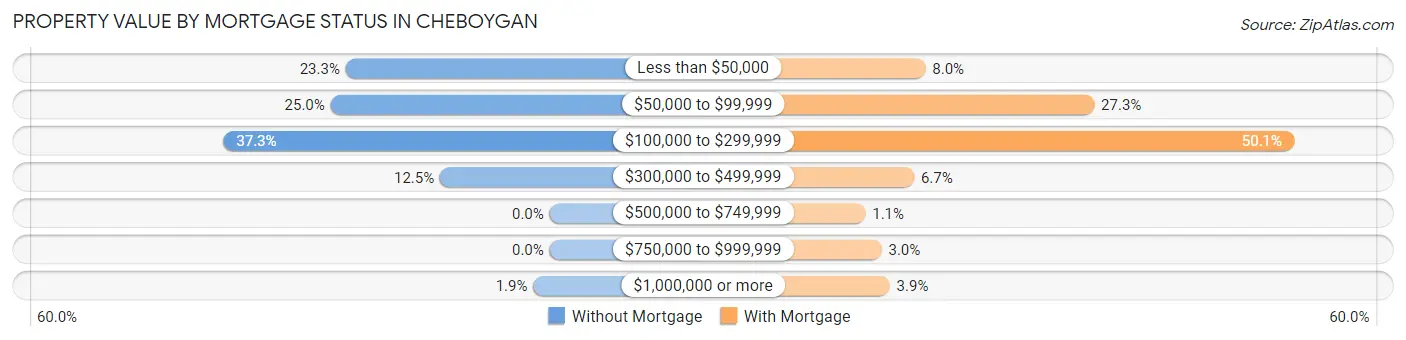
| Property Value | Without Mortgage | With Mortgage |
| Less than $50,000 | 175 (23.3%) | 43 (8.0%) |
| $50,000 to $99,999 | 188 (25.0%) | 147 (27.3%) |
| $100,000 to $299,999 | 280 (37.3%) | 270 (50.1%) |
| $300,000 to $499,999 | 94 (12.5%) | 36 (6.7%) |
| $500,000 to $749,999 | 0 (0.0%) | 6 (1.1%) |
| $750,000 to $999,999 | 0 (0.0%) | 16 (3.0%) |
| $1,000,000 or more | 14 (1.9%) | 21 (3.9%) |
| Total | 751 (100.0%) | 539 (100.0%) |
Household Income by Mortgage Status in Cheboygan
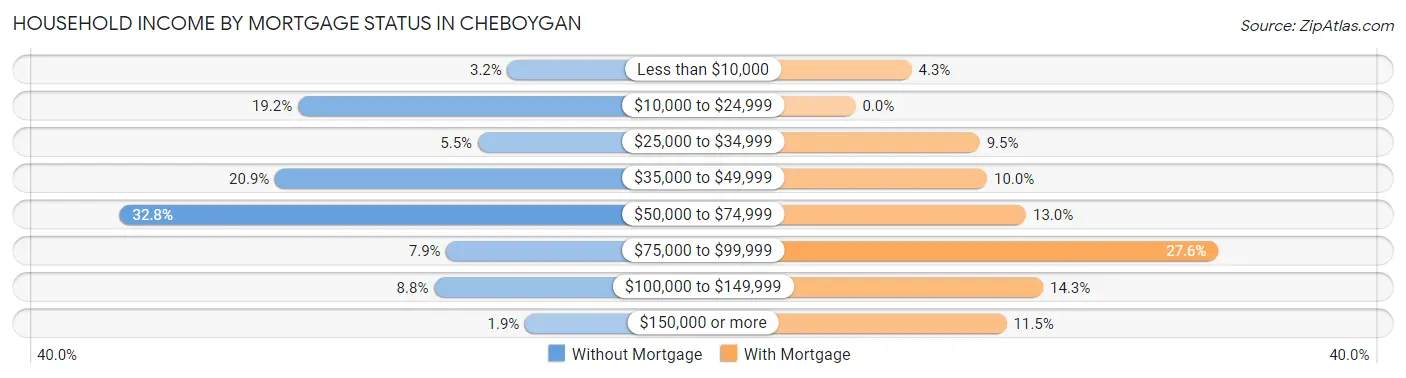
| Household Income | Without Mortgage | With Mortgage |
| Less than $10,000 | 24 (3.2%) | 23 (4.3%) |
| $10,000 to $24,999 | 144 (19.2%) | 0 (0.0%) |
| $25,000 to $34,999 | 41 (5.5%) | 51 (9.5%) |
| $35,000 to $49,999 | 157 (20.9%) | 54 (10.0%) |
| $50,000 to $74,999 | 246 (32.8%) | 70 (13.0%) |
| $75,000 to $99,999 | 59 (7.9%) | 149 (27.6%) |
| $100,000 to $149,999 | 66 (8.8%) | 77 (14.3%) |
| $150,000 or more | 14 (1.9%) | 62 (11.5%) |
| Total | 751 (100.0%) | 539 (100.0%) |
Property Value to Household Income Ratio in Cheboygan
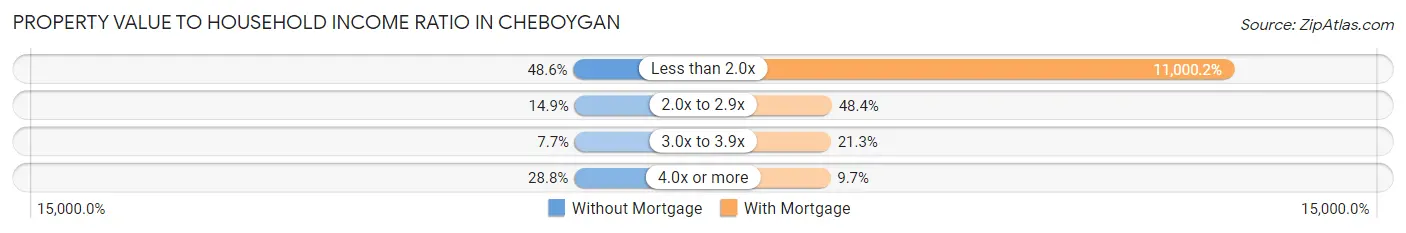
| Value-to-Income Ratio | Without Mortgage | With Mortgage |
| Less than 2.0x | 365 (48.6%) | 59,291 (11,000.2%) |
| 2.0x to 2.9x | 112 (14.9%) | 261 (48.4%) |
| 3.0x to 3.9x | 58 (7.7%) | 115 (21.3%) |
| 4.0x or more | 216 (28.8%) | 52 (9.7%) |
| Total | 751 (100.0%) | 539 (100.0%) |
Real Estate Taxes by Mortgage Status in Cheboygan
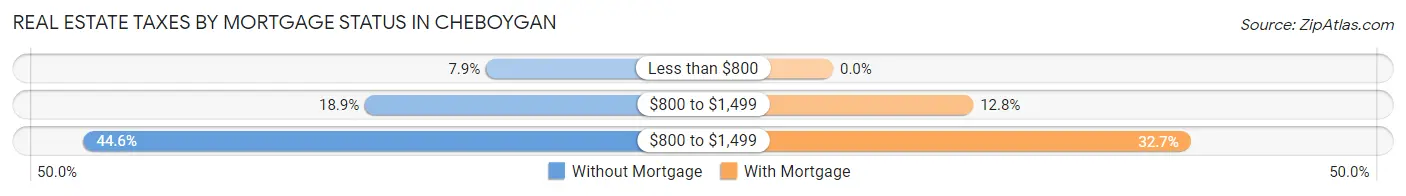
| Property Taxes | Without Mortgage | With Mortgage |
| Less than $800 | 59 (7.9%) | 0 (0.0%) |
| $800 to $1,499 | 142 (18.9%) | 69 (12.8%) |
| $800 to $1,499 | 335 (44.6%) | 176 (32.7%) |
| Total | 751 (100.0%) | 539 (100.0%) |
Health & Disability in Cheboygan
Health Insurance Coverage by Age in Cheboygan
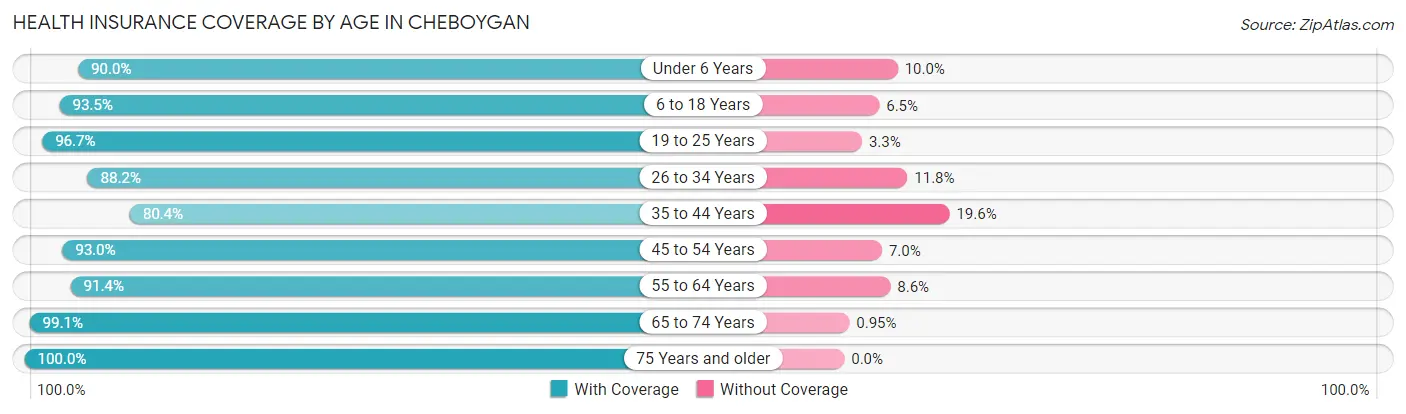
| Age Bracket | With Coverage | Without Coverage |
| Under 6 Years | 217 (90.0%) | 24 (10.0%) |
| 6 to 18 Years | 616 (93.5%) | 43 (6.5%) |
| 19 to 25 Years | 206 (96.7%) | 7 (3.3%) |
| 26 to 34 Years | 525 (88.2%) | 70 (11.8%) |
| 35 to 44 Years | 463 (80.4%) | 113 (19.6%) |
| 45 to 54 Years | 423 (93.0%) | 32 (7.0%) |
| 55 to 64 Years | 628 (91.4%) | 59 (8.6%) |
| 65 to 74 Years | 729 (99.1%) | 7 (0.9%) |
| 75 Years and older | 362 (100.0%) | 0 (0.0%) |
| Total | 4,169 (92.1%) | 355 (7.9%) |
Health Insurance Coverage by Citizenship Status in Cheboygan
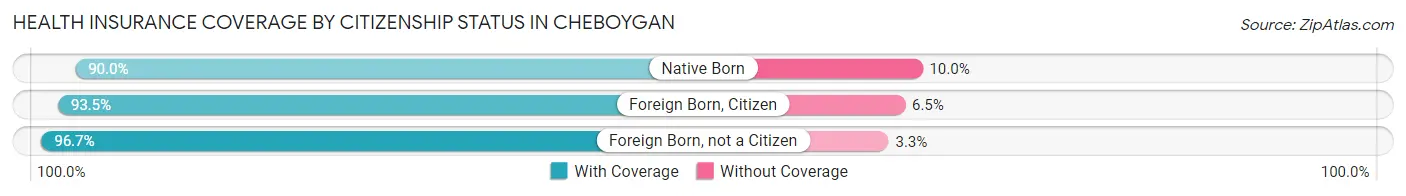
| Citizenship Status | With Coverage | Without Coverage |
| Native Born | 217 (90.0%) | 24 (10.0%) |
| Foreign Born, Citizen | 616 (93.5%) | 43 (6.5%) |
| Foreign Born, not a Citizen | 206 (96.7%) | 7 (3.3%) |
Health Insurance Coverage by Household Income in Cheboygan
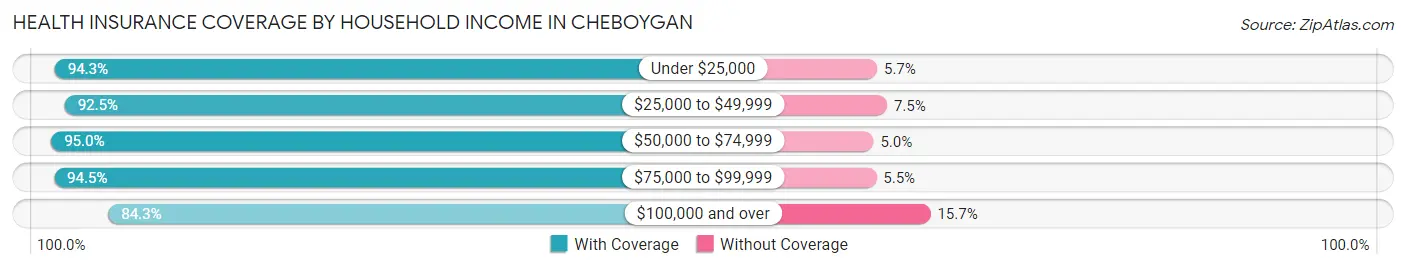
| Household Income | With Coverage | Without Coverage |
| Under $25,000 | 582 (94.3%) | 35 (5.7%) |
| $25,000 to $49,999 | 1,549 (92.5%) | 126 (7.5%) |
| $50,000 to $74,999 | 1,064 (95.0%) | 56 (5.0%) |
| $75,000 to $99,999 | 324 (94.5%) | 19 (5.5%) |
| $100,000 and over | 640 (84.3%) | 119 (15.7%) |
Public vs Private Health Insurance Coverage by Age in Cheboygan
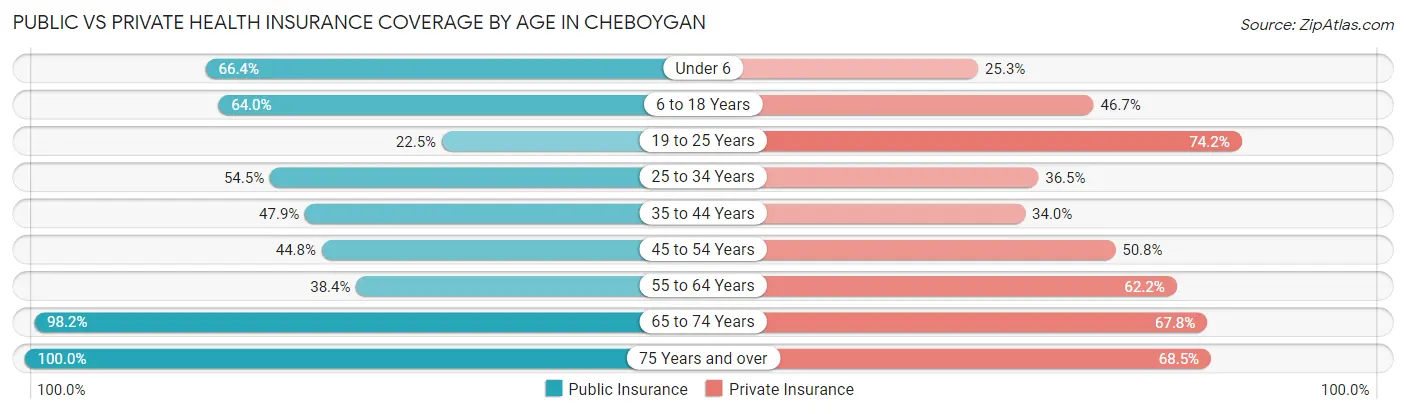
| Age Bracket | Public Insurance | Private Insurance |
| Under 6 | 160 (66.4%) | 61 (25.3%) |
| 6 to 18 Years | 422 (64.0%) | 308 (46.7%) |
| 19 to 25 Years | 48 (22.5%) | 158 (74.2%) |
| 25 to 34 Years | 324 (54.4%) | 217 (36.5%) |
| 35 to 44 Years | 276 (47.9%) | 196 (34.0%) |
| 45 to 54 Years | 204 (44.8%) | 231 (50.8%) |
| 55 to 64 Years | 264 (38.4%) | 427 (62.2%) |
| 65 to 74 Years | 723 (98.2%) | 499 (67.8%) |
| 75 Years and over | 362 (100.0%) | 248 (68.5%) |
| Total | 2,783 (61.5%) | 2,345 (51.8%) |
Disability Status by Sex by Age in Cheboygan
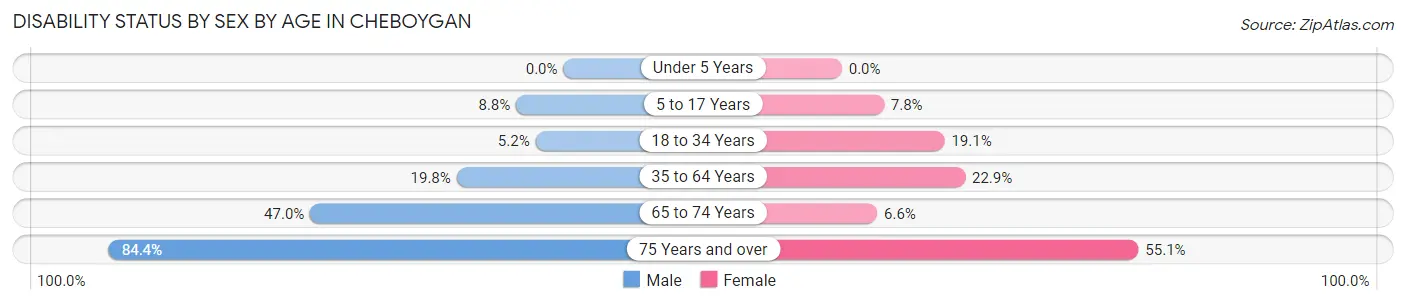
| Age Bracket | Male | Female |
| Under 5 Years | 0 (0.0%) | 0 (0.0%) |
| 5 to 17 Years | 32 (8.8%) | 25 (7.8%) |
| 18 to 34 Years | 24 (5.2%) | 77 (19.1%) |
| 35 to 64 Years | 168 (19.8%) | 199 (22.9%) |
| 65 to 74 Years | 188 (47.0%) | 22 (6.6%) |
| 75 Years and over | 97 (84.4%) | 136 (55.1%) |
Disability Class by Sex by Age in Cheboygan
Disability Class: Hearing Difficulty
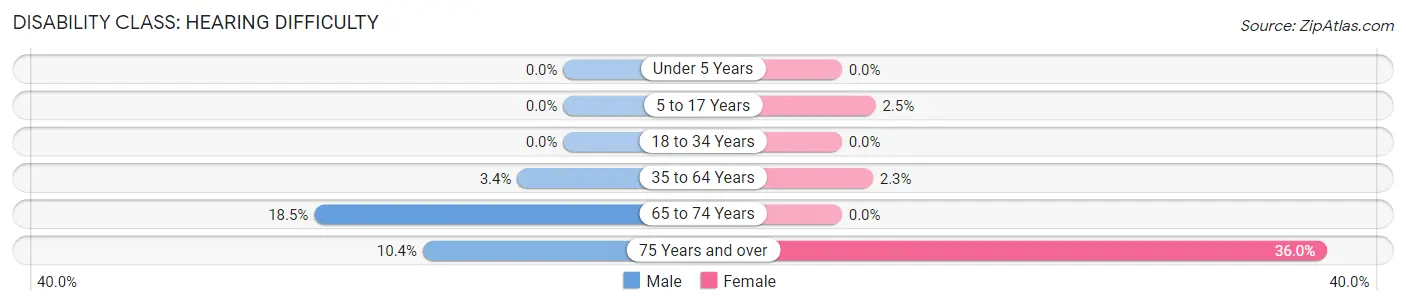
| Age Bracket | Male | Female |
| Under 5 Years | 0 (0.0%) | 0 (0.0%) |
| 5 to 17 Years | 0 (0.0%) | 8 (2.5%) |
| 18 to 34 Years | 0 (0.0%) | 0 (0.0%) |
| 35 to 64 Years | 29 (3.4%) | 20 (2.3%) |
| 65 to 74 Years | 74 (18.5%) | 0 (0.0%) |
| 75 Years and over | 12 (10.4%) | 89 (36.0%) |
Disability Class: Vision Difficulty
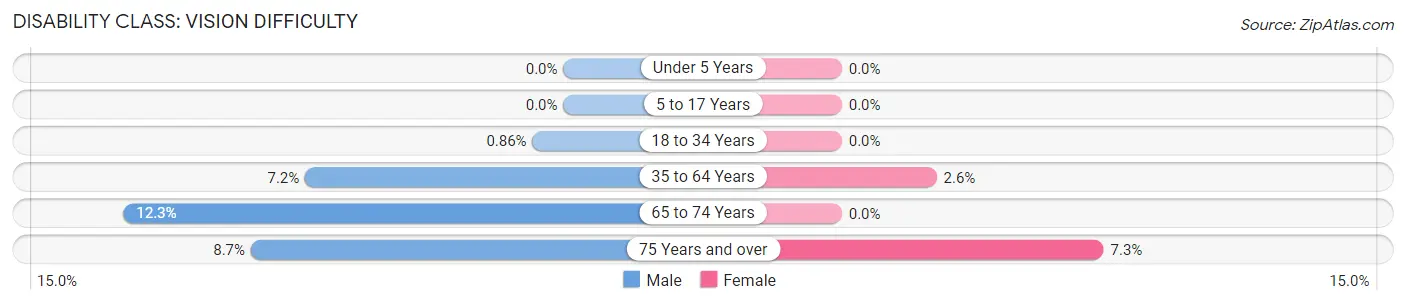
| Age Bracket | Male | Female |
| Under 5 Years | 0 (0.0%) | 0 (0.0%) |
| 5 to 17 Years | 0 (0.0%) | 0 (0.0%) |
| 18 to 34 Years | 4 (0.9%) | 0 (0.0%) |
| 35 to 64 Years | 61 (7.2%) | 23 (2.6%) |
| 65 to 74 Years | 49 (12.2%) | 0 (0.0%) |
| 75 Years and over | 10 (8.7%) | 18 (7.3%) |
Disability Class: Cognitive Difficulty
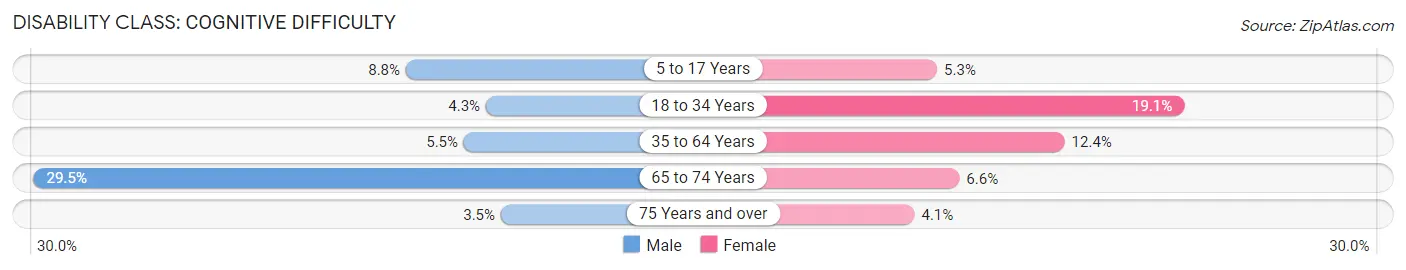
| Age Bracket | Male | Female |
| 5 to 17 Years | 32 (8.8%) | 17 (5.3%) |
| 18 to 34 Years | 20 (4.3%) | 77 (19.1%) |
| 35 to 64 Years | 47 (5.5%) | 108 (12.4%) |
| 65 to 74 Years | 118 (29.5%) | 22 (6.6%) |
| 75 Years and over | 4 (3.5%) | 10 (4.1%) |
Disability Class: Ambulatory Difficulty
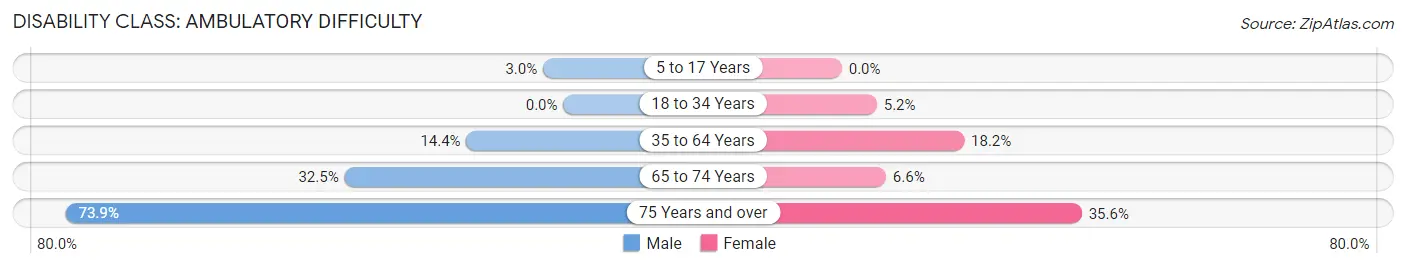
| Age Bracket | Male | Female |
| 5 to 17 Years | 11 (3.0%) | 0 (0.0%) |
| 18 to 34 Years | 0 (0.0%) | 21 (5.2%) |
| 35 to 64 Years | 122 (14.4%) | 158 (18.2%) |
| 65 to 74 Years | 130 (32.5%) | 22 (6.6%) |
| 75 Years and over | 85 (73.9%) | 88 (35.6%) |
Disability Class: Self-Care Difficulty
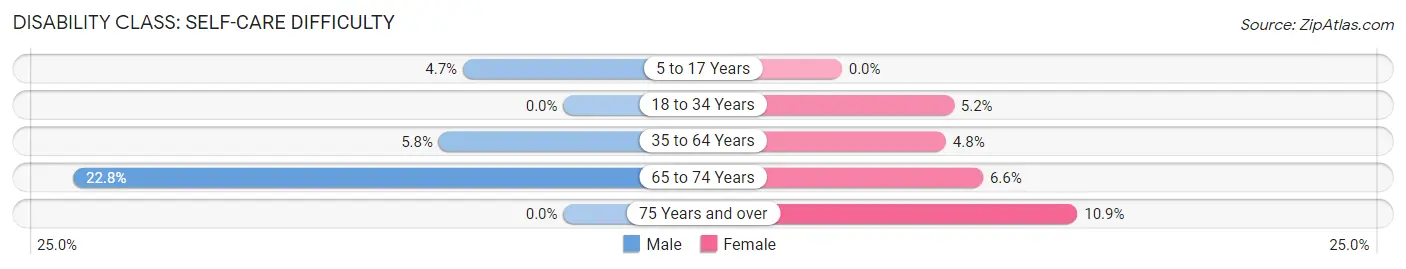
| Age Bracket | Male | Female |
| 5 to 17 Years | 17 (4.7%) | 0 (0.0%) |
| 18 to 34 Years | 0 (0.0%) | 21 (5.2%) |
| 35 to 64 Years | 49 (5.8%) | 42 (4.8%) |
| 65 to 74 Years | 91 (22.8%) | 22 (6.6%) |
| 75 Years and over | 0 (0.0%) | 27 (10.9%) |
Technology Access in Cheboygan
Computing Device Access in Cheboygan
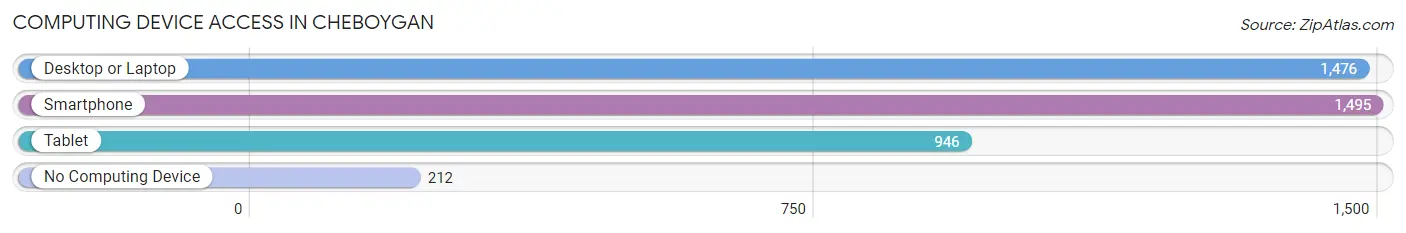
| Device Type | # Households | % Households |
| Desktop or Laptop | 1,476 | 74.3% |
| Smartphone | 1,495 | 75.2% |
| Tablet | 946 | 47.6% |
| No Computing Device | 212 | 10.7% |
| Total | 1,987 | 100.0% |
Internet Access in Cheboygan
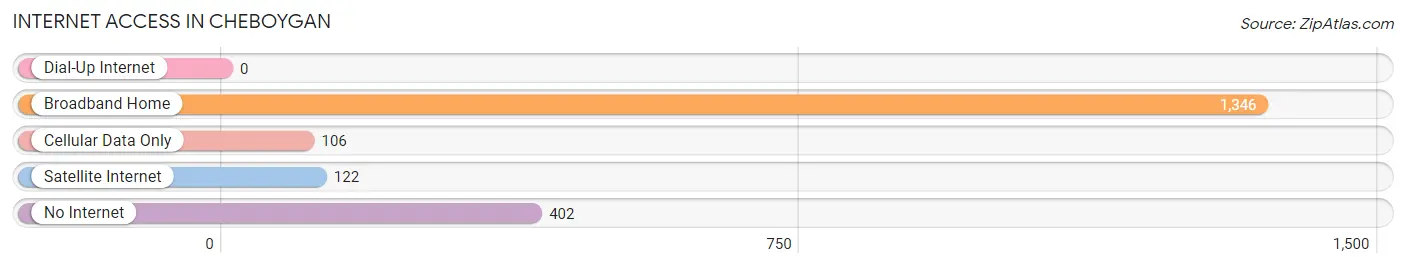
| Internet Type | # Households | % Households |
| Dial-Up Internet | 0 | 0.0% |
| Broadband Home | 1,346 | 67.7% |
| Cellular Data Only | 106 | 5.3% |
| Satellite Internet | 122 | 6.1% |
| No Internet | 402 | 20.2% |
| Total | 1,987 | 100.0% |
Cheboygan Summary
Cheboygan, Michigan is a small city located in the northern part of the state, on the shores of Lake Huron. It is the county seat of Cheboygan County and is home to a population of 4,876 people as of the 2010 census. The city is known for its beautiful scenery, outdoor activities, and its rich history.
Geography
Cheboygan is located in the northern part of Michigan, on the shores of Lake Huron. It is situated at the mouth of the Cheboygan River, which flows into the lake. The city is surrounded by forests and is home to many parks and outdoor recreation areas. The city is located about 90 miles north of the state capital of Lansing and is about a four-hour drive from Detroit.
The city has a total area of 4.2 square miles, all of which is land. The terrain is mostly flat, with some rolling hills. The climate is humid continental, with cold winters and warm summers.
History
Cheboygan was first settled in 1844 by a group of French-Canadian fur traders. The city was officially incorporated in 1871 and was named after the Cheboygan River. The city quickly grew and became a major port for the lumber industry. In the late 19th century, the city was a popular tourist destination, with many visitors coming to enjoy the scenery and outdoor activities.
In the early 20th century, the city was a major hub for the Great Lakes shipping industry. The city was also home to a large military base during World War II. After the war, the city continued to grow and develop, becoming a popular tourist destination once again.
Economy
Cheboygan’s economy is largely based on tourism and outdoor recreation. The city is home to several resorts and hotels, as well as a variety of restaurants and shops. The city is also home to a number of manufacturing companies, including a paper mill and a boat-building company.
The city is also home to a number of government agencies, including the Cheboygan County Sheriff’s Office and the Cheboygan County Courthouse. The city is also home to a number of educational institutions, including North Central Michigan College and the Cheboygan Area Schools.
Demographics
As of the 2010 census, Cheboygan had a population of 4,876 people. The racial makeup of the city was 94.3% White, 0.7% African American, 0.7% Native American, 0.4% Asian, 0.1% Pacific Islander, and 3.8% from other races. The median household income was $35,938 and the median family income was $45,938.
Cheboygan is a small city with a rich history and a vibrant economy. It is home to a diverse population and offers a variety of outdoor activities and attractions. The city is a great place to live, work, and play.
Common Questions
What is Per Capita Income in Cheboygan?
Per Capita income in Cheboygan is $24,681.
What is the Median Family Income in Cheboygan?
Median Family Income in Cheboygan is $54,609.
What is the Median Household income in Cheboygan?
Median Household Income in Cheboygan is $39,919.
What is Income or Wage Gap in Cheboygan?
Income or Wage Gap in Cheboygan is 8.5%.
Women in Cheboygan earn 91.5 cents for every dollar earned by a man.
What is Family Income Deficit in Cheboygan?
Family Income Deficit in Cheboygan is $6,861.
Families that are below poverty line in Cheboygan earn $6,861 less on average than the poverty threshold level.
What is Inequality or Gini Index in Cheboygan?
Inequality or Gini Index in Cheboygan is 0.40.
What is the Total Population of Cheboygan?
Total Population of Cheboygan is 4,782.
What is the Total Male Population of Cheboygan?
Total Male Population of Cheboygan is 2,456.
What is the Total Female Population of Cheboygan?
Total Female Population of Cheboygan is 2,326.
What is the Ratio of Males per 100 Females in Cheboygan?
There are 105.59 Males per 100 Females in Cheboygan.
What is the Ratio of Females per 100 Males in Cheboygan?
There are 94.71 Females per 100 Males in Cheboygan.
What is the Median Population Age in Cheboygan?
Median Population Age in Cheboygan is 45.4 Years.
What is the Average Family Size in Cheboygan
Average Family Size in Cheboygan is 3.1 People.
What is the Average Household Size in Cheboygan
Average Household Size in Cheboygan is 2.3 People.
How Large is the Labor Force in Cheboygan?
There are 1,996 People in the Labor Forcein in Cheboygan.
What is the Percentage of People in the Labor Force in Cheboygan?
49.7% of People are in the Labor Force in Cheboygan.
What is the Unemployment Rate in Cheboygan?
Unemployment Rate in Cheboygan is 9.5%.