Zip Codes with the Highest Percentage of Households Without a Vehicle in Muskegon, MI
RELATED REPORTS & OPTIONS
Households without a Cars
Muskegon
Compare Zip Codes
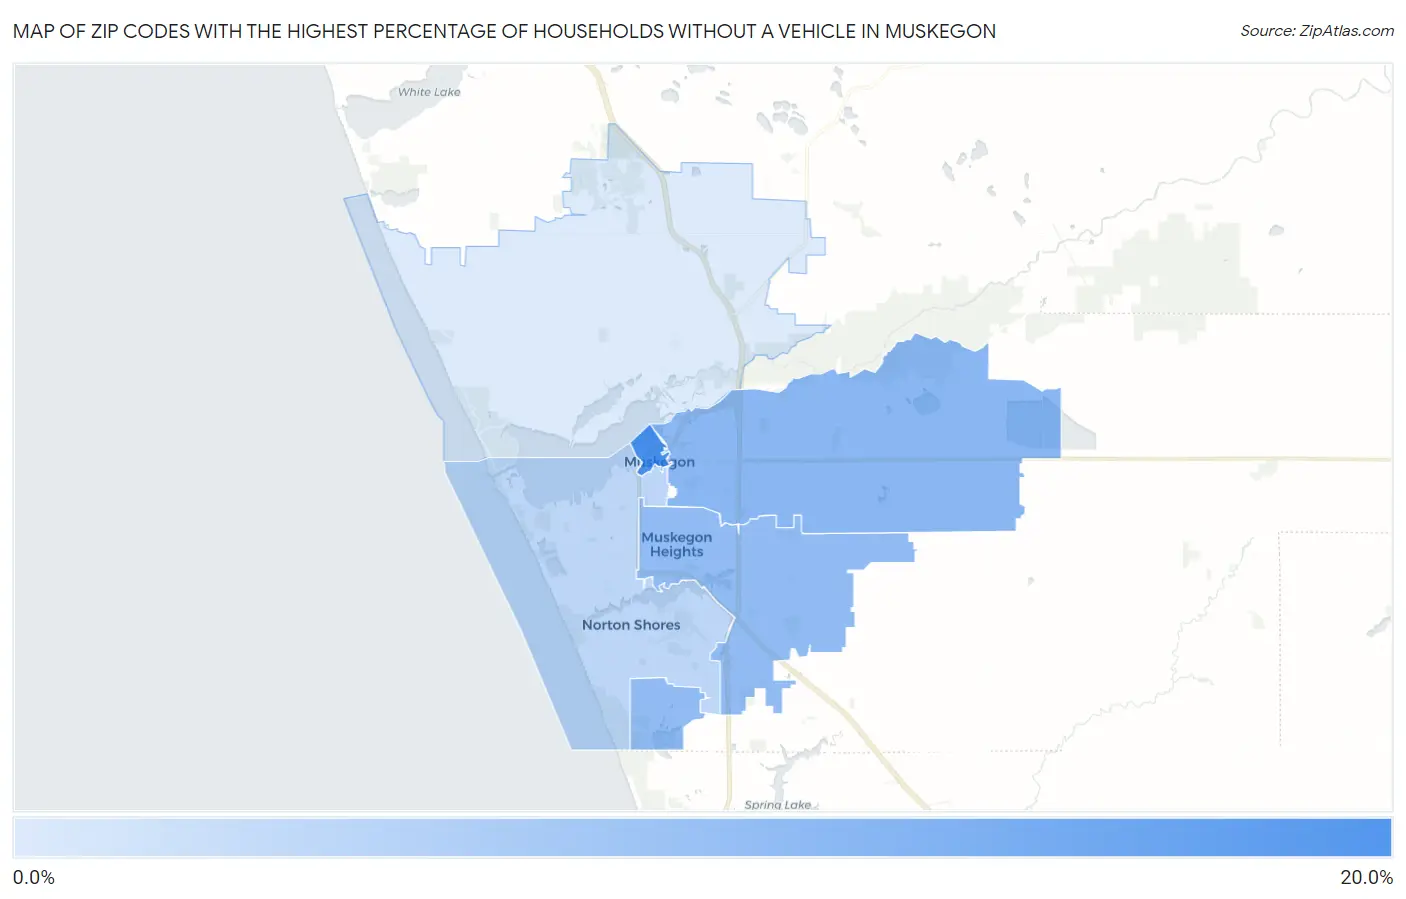
Map of Zip Codes with the Highest Percentage of Households Without a Vehicle in Muskegon
2.9%
18.4%
Zip Codes with the Highest Percentage of Households Without a Vehicle in Muskegon, MI
| Zip Code | Housholds Without a Car | vs State | vs National | |
| 1. | 49440 | 18.4% | 7.2%(+11.2)#41 | 8.3%(+10.1)#1,730 |
| 2. | 49442 | 11.3% | 7.2%(+4.10)#94 | 8.3%(+3.00)#3,933 |
| 3. | 49444 | 10.5% | 7.2%(+3.30)#107 | 8.3%(+2.20)#4,458 |
| 4. | 49441 | 6.1% | 7.2%(-1.10)#322 | 8.3%(-2.20)#10,184 |
| 5. | 49445 | 2.9% | 7.2%(-4.30)#654 | 8.3%(-5.40)#19,432 |
1
Common Questions
What are the Top 3 Zip Codes with the Highest Percentage of Households Without a Vehicle in Muskegon, MI?
Top 3 Zip Codes with the Highest Percentage of Households Without a Vehicle in Muskegon, MI are:
What zip code has the Highest Percentage of Households Without a Vehicle in Muskegon, MI?
49440 has the Highest Percentage of Households Without a Vehicle in Muskegon, MI with 18.4%.
What is the Percentage of Households Without a Vehicle in Muskegon, MI?
Percentage of Households Without a Vehicle in Muskegon is 14.0%.
What is the Percentage of Households Without a Vehicle in Michigan?
Percentage of Households Without a Vehicle in Michigan is 7.2%.
What is the Percentage of Households Without a Vehicle in the United States?
Percentage of Households Without a Vehicle in the United States is 8.3%.