Laurium, MI Map & Demographics
Laurium Map
Laurium Overview
$26,889
PER CAPITA INCOME
$67,656
AVG FAMILY INCOME
$42,292
AVG HOUSEHOLD INCOME
45.9%
WAGE / INCOME GAP [ % ]
54.1¢/ $1
WAGE / INCOME GAP [ $ ]
$11,178
FAMILY INCOME DEFICIT
0.46
INEQUALITY / GINI INDEX
1,669
TOTAL POPULATION
748
MALE POPULATION
921
FEMALE POPULATION
81.22
MALES / 100 FEMALES
123.13
FEMALES / 100 MALES
44.1
MEDIAN AGE
3.1
AVG FAMILY SIZE
2.3
AVG HOUSEHOLD SIZE
832
LABOR FORCE [ PEOPLE ]
61.6%
PERCENT IN LABOR FORCE
2.6%
UNEMPLOYMENT RATE
Laurium Area Codes
Income in Laurium
Income Overview in Laurium
Per Capita Income in Laurium is $26,889, while median incomes of families and households are $67,656 and $42,292 respectively.
| Characteristic | Number | Measure |
| Per Capita Income | 1,669 | $26,889 |
| Median Family Income | 408 | $67,656 |
| Mean Family Income | 408 | $79,583 |
| Median Household Income | 733 | $42,292 |
| Mean Household Income | 733 | $59,557 |
| Income Deficit | 408 | $11,178 |
| Wage / Income Gap (%) | 1,669 | 45.88% |
| Wage / Income Gap ($) | 1,669 | 54.12¢ per $1 |
| Gini / Inequality Index | 1,669 | 0.46 |
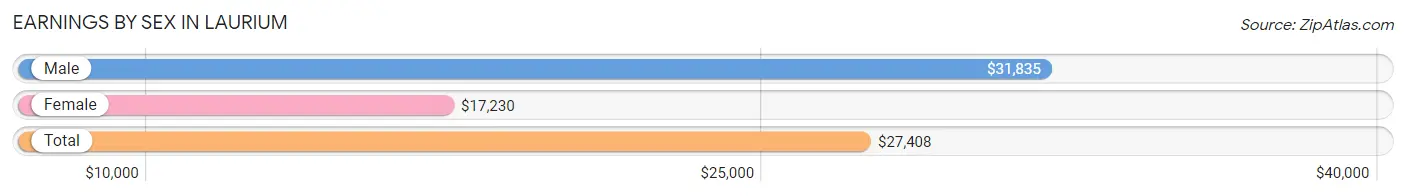
Earnings by Sex in Laurium
Average Earnings in Laurium are $27,408, $31,835 for men and $17,230 for women, a difference of 45.9%.
| Sex | Number | Average Earnings |
| Male | 395 (45.9%) | $31,835 |
| Female | 466 (54.1%) | $17,230 |
| Total | 861 (100.0%) | $27,408 |
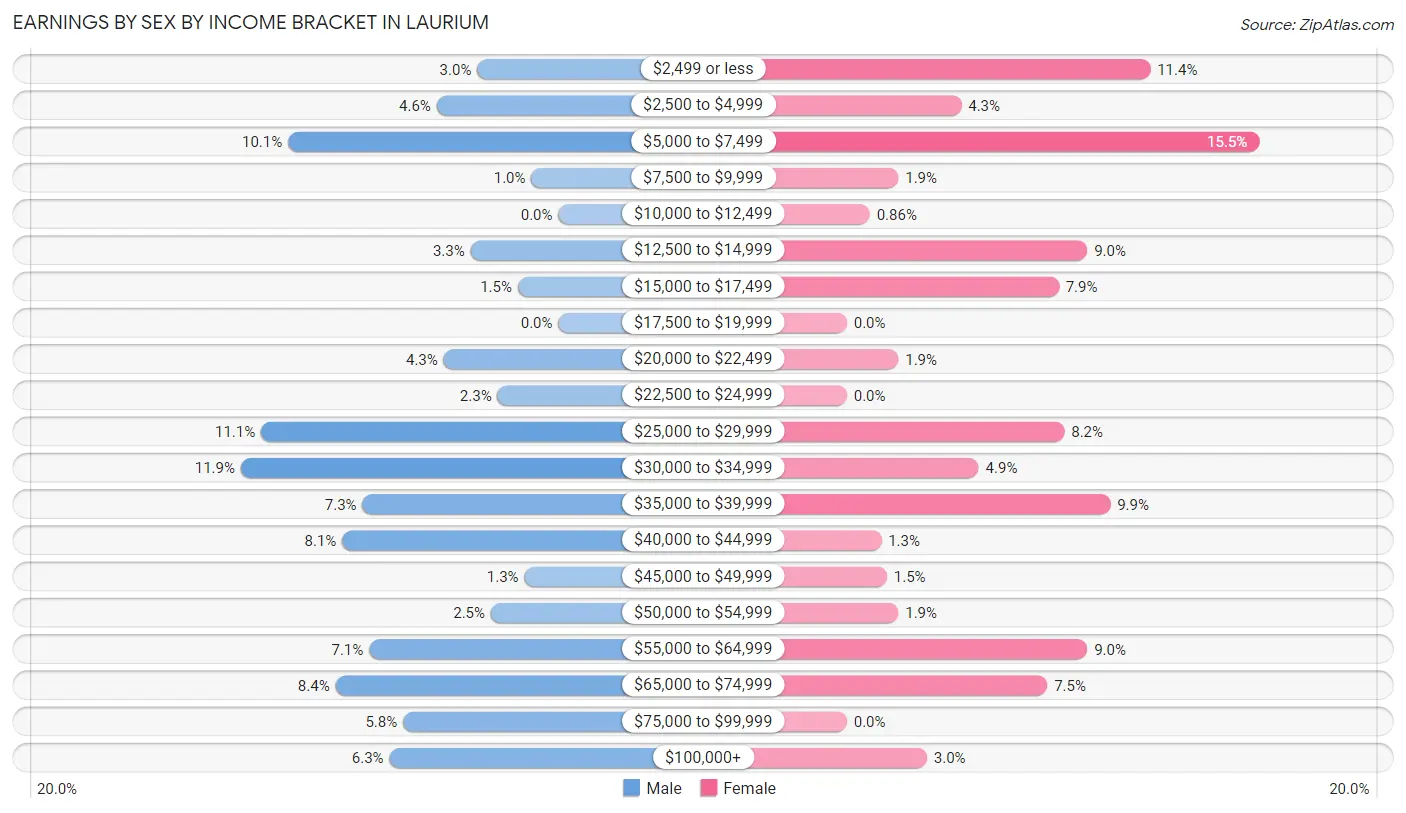
Earnings by Sex by Income Bracket in Laurium
The most common earnings brackets in Laurium are $30,000 to $34,999 for men (47 | 11.9%) and $5,000 to $7,499 for women (72 | 15.4%).
| Income | Male | Female |
| $2,499 or less | 12 (3.0%) | 53 (11.4%) |
| $2,500 to $4,999 | 18 (4.6%) | 20 (4.3%) |
| $5,000 to $7,499 | 40 (10.1%) | 72 (15.4%) |
| $7,500 to $9,999 | 4 (1.0%) | 9 (1.9%) |
| $10,000 to $12,499 | 0 (0.0%) | 4 (0.9%) |
| $12,500 to $14,999 | 13 (3.3%) | 42 (9.0%) |
| $15,000 to $17,499 | 6 (1.5%) | 37 (7.9%) |
| $17,500 to $19,999 | 0 (0.0%) | 0 (0.0%) |
| $20,000 to $22,499 | 17 (4.3%) | 9 (1.9%) |
| $22,500 to $24,999 | 9 (2.3%) | 0 (0.0%) |
| $25,000 to $29,999 | 44 (11.1%) | 38 (8.2%) |
| $30,000 to $34,999 | 47 (11.9%) | 23 (4.9%) |
| $35,000 to $39,999 | 29 (7.3%) | 46 (9.9%) |
| $40,000 to $44,999 | 32 (8.1%) | 6 (1.3%) |
| $45,000 to $49,999 | 5 (1.3%) | 7 (1.5%) |
| $50,000 to $54,999 | 10 (2.5%) | 9 (1.9%) |
| $55,000 to $64,999 | 28 (7.1%) | 42 (9.0%) |
| $65,000 to $74,999 | 33 (8.4%) | 35 (7.5%) |
| $75,000 to $99,999 | 23 (5.8%) | 0 (0.0%) |
| $100,000+ | 25 (6.3%) | 14 (3.0%) |
| Total | 395 (100.0%) | 466 (100.0%) |
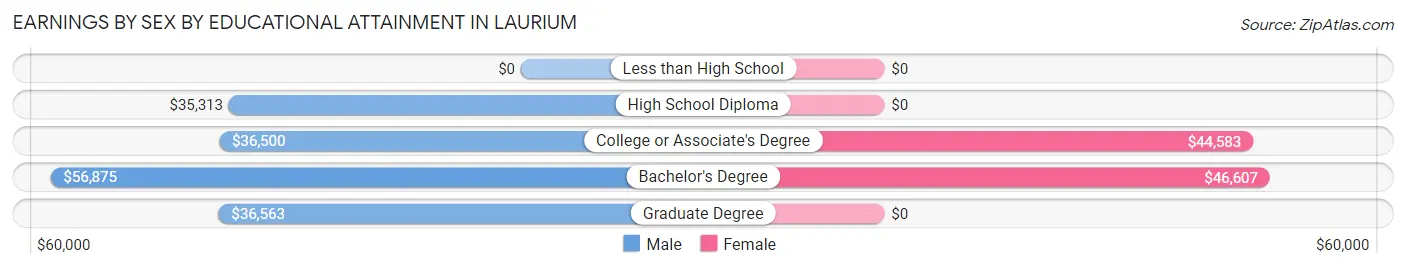
Earnings by Sex by Educational Attainment in Laurium
Average earnings in Laurium are $42,500 for men and $35,688 for women, a difference of 16.0%. Men with an educational attainment of bachelor's degree enjoy the highest average annual earnings of $56,875, while those with high school diploma education earn the least with $35,313. Women with an educational attainment of bachelor's degree earn the most with the average annual earnings of $46,607, while those with college or associate's degree education have the smallest earnings of $44,583.
| Educational Attainment | Male Income | Female Income |
| Less than High School | - | - |
| High School Diploma | $35,313 | $0 |
| College or Associate's Degree | $36,500 | $44,583 |
| Bachelor's Degree | $56,875 | $46,607 |
| Graduate Degree | $36,563 | $0 |
| Total | $42,500 | $35,688 |
Family Income in Laurium
Family Income Brackets in Laurium
According to the Laurium family income data, there are 107 families falling into the $50,000 to $74,999 income range, which is the most common income bracket and makes up 26.2% of all families. Conversely, the $10,000 to $14,999 income bracket is the least frequent group with only 6 families (1.5%) belonging to this category.
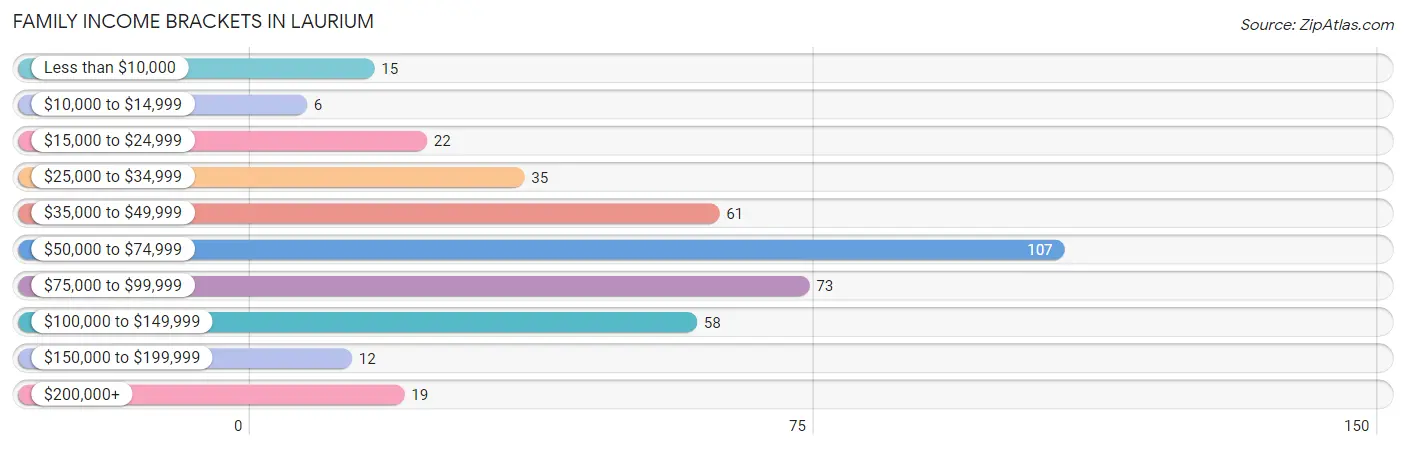
| Income Bracket | # Families | % Families |
| Less than $10,000 | 15 | 3.7% |
| $10,000 to $14,999 | 6 | 1.5% |
| $15,000 to $24,999 | 22 | 5.4% |
| $25,000 to $34,999 | 35 | 8.6% |
| $35,000 to $49,999 | 61 | 15.0% |
| $50,000 to $74,999 | 107 | 26.2% |
| $75,000 to $99,999 | 73 | 17.9% |
| $100,000 to $149,999 | 58 | 14.2% |
| $150,000 to $199,999 | 12 | 2.9% |
| $200,000+ | 19 | 4.7% |
Family Income by Famaliy Size in Laurium
4-person families (83 | 20.3%) account for the highest median family income in Laurium with $70,781 per family, while 2-person families (192 | 47.1%) have the highest median income of $34,875 per family member.
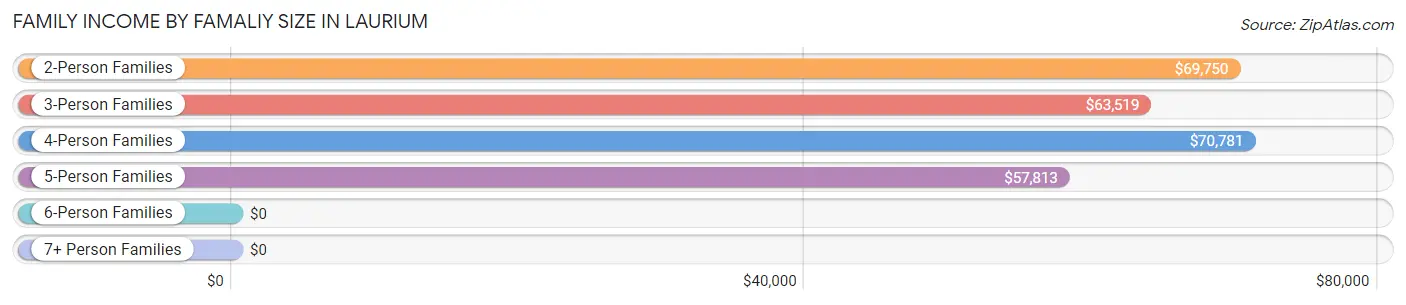
| Income Bracket | # Families | Median Income |
| 2-Person Families | 192 (47.1%) | $69,750 |
| 3-Person Families | 96 (23.5%) | $63,519 |
| 4-Person Families | 83 (20.3%) | $70,781 |
| 5-Person Families | 31 (7.6%) | $57,813 |
| 6-Person Families | 3 (0.7%) | $0 |
| 7+ Person Families | 3 (0.7%) | $0 |
| Total | 408 (100.0%) | $67,656 |
Family Income by Number of Earners in Laurium
The median family income in Laurium is $67,656, with families comprising 2 earners (140) having the highest median family income of $99,412, while families with 1 earner (122) have the lowest median family income of $43,519, accounting for 34.3% and 29.9% of families, respectively.
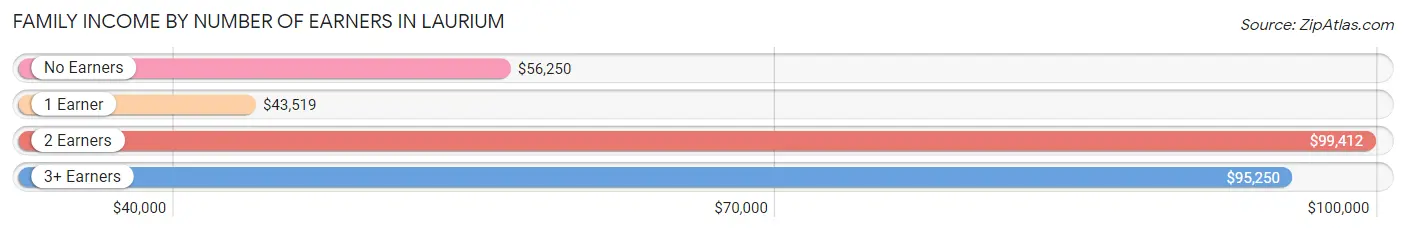
| Number of Earners | # Families | Median Income |
| No Earners | 82 (20.1%) | $56,250 |
| 1 Earner | 122 (29.9%) | $43,519 |
| 2 Earners | 140 (34.3%) | $99,412 |
| 3+ Earners | 64 (15.7%) | $95,250 |
| Total | 408 (100.0%) | $67,656 |
Household Income in Laurium
Household Income Brackets in Laurium
With 124 households falling in the category, the $25,000 to $34,999 income range is the most frequent in Laurium, accounting for 16.9% of all households. In contrast, only 19 households (2.6%) fall into the $200,000+ income bracket, making it the least populous group.
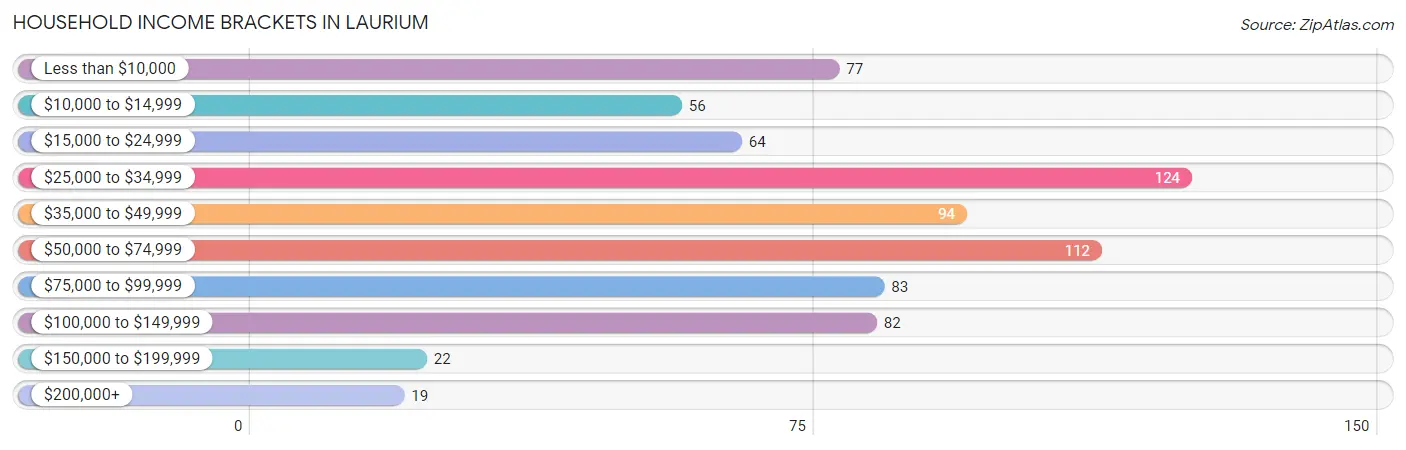
| Income Bracket | # Households | % Households |
| Less than $10,000 | 77 | 10.5% |
| $10,000 to $14,999 | 56 | 7.6% |
| $15,000 to $24,999 | 64 | 8.7% |
| $25,000 to $34,999 | 124 | 16.9% |
| $35,000 to $49,999 | 94 | 12.8% |
| $50,000 to $74,999 | 112 | 15.3% |
| $75,000 to $99,999 | 83 | 11.3% |
| $100,000 to $149,999 | 82 | 11.2% |
| $150,000 to $199,999 | 22 | 3.0% |
| $200,000+ | 19 | 2.6% |
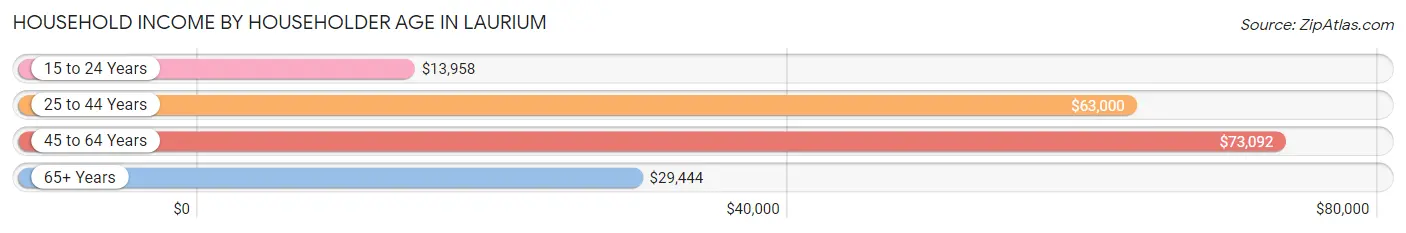
Household Income by Householder Age in Laurium
The median household income in Laurium is $42,292, with the highest median household income of $73,092 found in the 45 to 64 years age bracket for the primary householder. A total of 287 households (39.2%) fall into this category. Meanwhile, the 15 to 24 years age bracket for the primary householder has the lowest median household income of $13,958, with 64 households (8.7%) in this group.
| Income Bracket | # Households | Median Income |
| 15 to 24 Years | 64 (8.7%) | $13,958 |
| 25 to 44 Years | 134 (18.3%) | $63,000 |
| 45 to 64 Years | 287 (39.2%) | $73,092 |
| 65+ Years | 248 (33.8%) | $29,444 |
| Total | 733 (100.0%) | $42,292 |
Poverty in Laurium
Income Below Poverty by Sex and Age in Laurium
With 13.4% poverty level for males and 27.5% for females among the residents of Laurium, under 5 year old males and 18 to 24 year old females are the most vulnerable to poverty, with 11 males (33.3%) and 104 females (63.8%) in their respective age groups living below the poverty level.
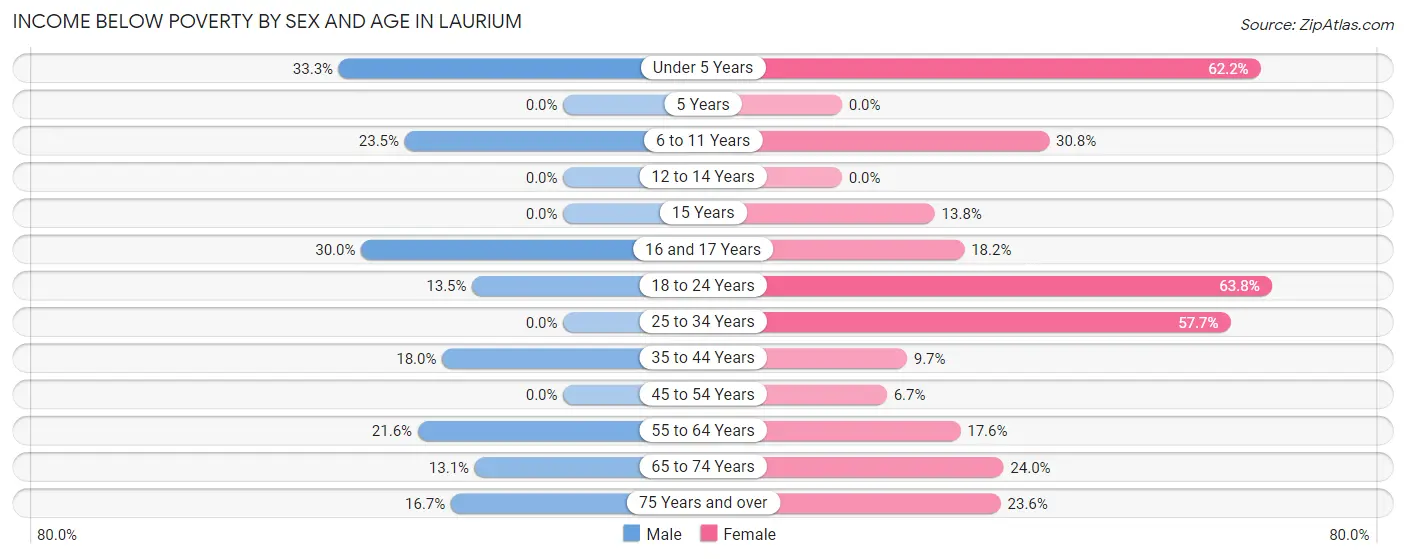
| Age Bracket | Male | Female |
| Under 5 Years | 11 (33.3%) | 23 (62.2%) |
| 5 Years | 0 (0.0%) | 0 (0.0%) |
| 6 to 11 Years | 8 (23.5%) | 16 (30.8%) |
| 12 to 14 Years | 0 (0.0%) | 0 (0.0%) |
| 15 Years | 0 (0.0%) | 4 (13.8%) |
| 16 and 17 Years | 9 (30.0%) | 4 (18.2%) |
| 18 to 24 Years | 10 (13.5%) | 104 (63.8%) |
| 25 to 34 Years | 0 (0.0%) | 15 (57.7%) |
| 35 to 44 Years | 16 (18.0%) | 11 (9.7%) |
| 45 to 54 Years | 0 (0.0%) | 5 (6.7%) |
| 55 to 64 Years | 27 (21.6%) | 22 (17.6%) |
| 65 to 74 Years | 13 (13.1%) | 24 (24.0%) |
| 75 Years and over | 6 (16.7%) | 25 (23.6%) |
| Total | 100 (13.4%) | 253 (27.5%) |
Income Above Poverty by Sex and Age in Laurium
According to the poverty statistics in Laurium, males aged 12 to 14 years and females aged 5 years are the age groups that are most secure financially, with 100.0% of males and 100.0% of females in these age groups living above the poverty line.
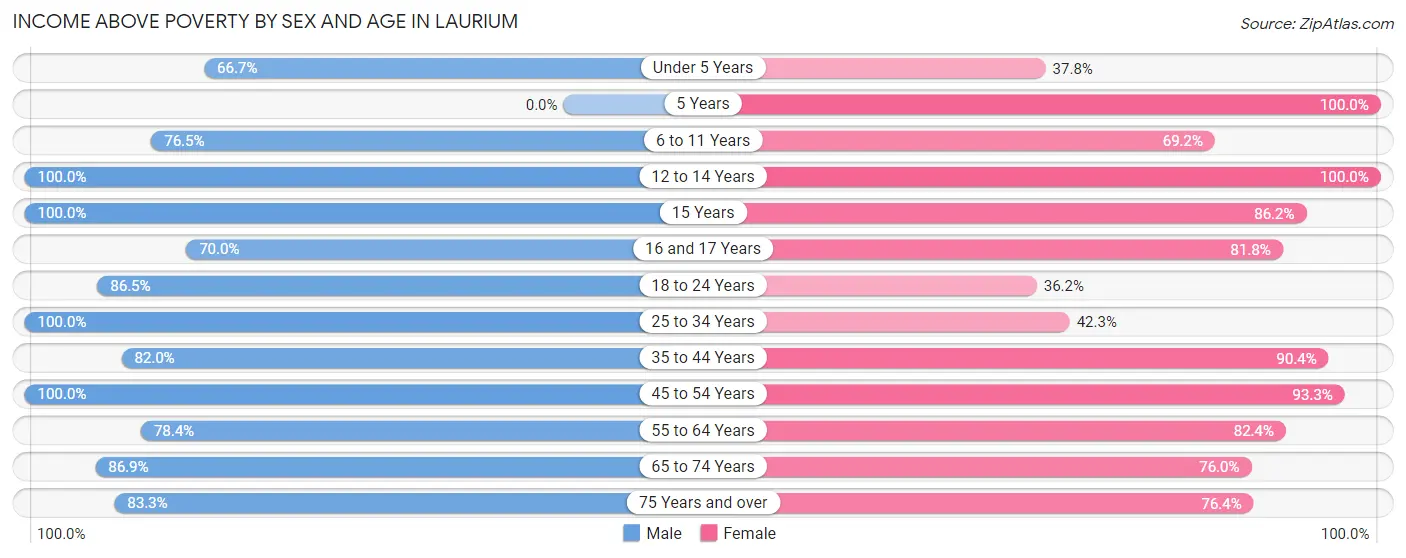
| Age Bracket | Male | Female |
| Under 5 Years | 22 (66.7%) | 14 (37.8%) |
| 5 Years | 0 (0.0%) | 9 (100.0%) |
| 6 to 11 Years | 26 (76.5%) | 36 (69.2%) |
| 12 to 14 Years | 49 (100.0%) | 63 (100.0%) |
| 15 Years | 12 (100.0%) | 25 (86.2%) |
| 16 and 17 Years | 21 (70.0%) | 18 (81.8%) |
| 18 to 24 Years | 64 (86.5%) | 59 (36.2%) |
| 25 to 34 Years | 52 (100.0%) | 11 (42.3%) |
| 35 to 44 Years | 73 (82.0%) | 103 (90.3%) |
| 45 to 54 Years | 115 (100.0%) | 70 (93.3%) |
| 55 to 64 Years | 98 (78.4%) | 103 (82.4%) |
| 65 to 74 Years | 86 (86.9%) | 76 (76.0%) |
| 75 Years and over | 30 (83.3%) | 81 (76.4%) |
| Total | 648 (86.6%) | 668 (72.5%) |
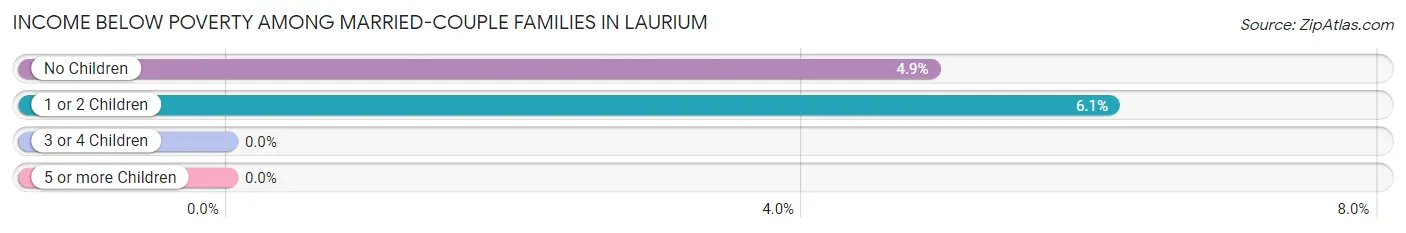
Income Below Poverty Among Married-Couple Families in Laurium
The poverty statistics for married-couple families in Laurium show that 5.1% or 16 of the total 311 families live below the poverty line. Families with 1 or 2 children have the highest poverty rate of 6.1%, comprising of 7 families. On the other hand, families with 3 or 4 children have the lowest poverty rate of 0.0%, which includes 0 families.
| Children | Above Poverty | Below Poverty |
| No Children | 175 (95.1%) | 9 (4.9%) |
| 1 or 2 Children | 107 (93.9%) | 7 (6.1%) |
| 3 or 4 Children | 10 (100.0%) | 0 (0.0%) |
| 5 or more Children | 3 (100.0%) | 0 (0.0%) |
| Total | 295 (94.9%) | 16 (5.1%) |
Income Below Poverty Among Single-Parent Households in Laurium
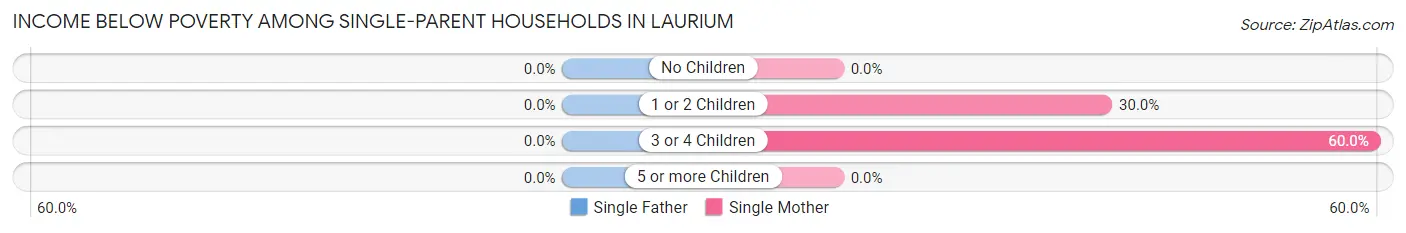
| Children | Single Father | Single Mother |
| No Children | 0 (0.0%) | 0 (0.0%) |
| 1 or 2 Children | 0 (0.0%) | 15 (30.0%) |
| 3 or 4 Children | 0 (0.0%) | 9 (60.0%) |
| 5 or more Children | 0 (0.0%) | 0 (0.0%) |
| Total | 0 (0.0%) | 24 (29.6%) |
Income Below Poverty Among Married-Couple vs Single-Parent Households in Laurium
The poverty data for Laurium shows that 16 of the married-couple family households (5.1%) and 24 of the single-parent households (24.7%) are living below the poverty level. Within the married-couple family households, those with 1 or 2 children have the highest poverty rate, with 7 households (6.1%) falling below the poverty line. Among the single-parent households, those with 3 or 4 children have the highest poverty rate, with 9 household (45.0%) living below poverty.
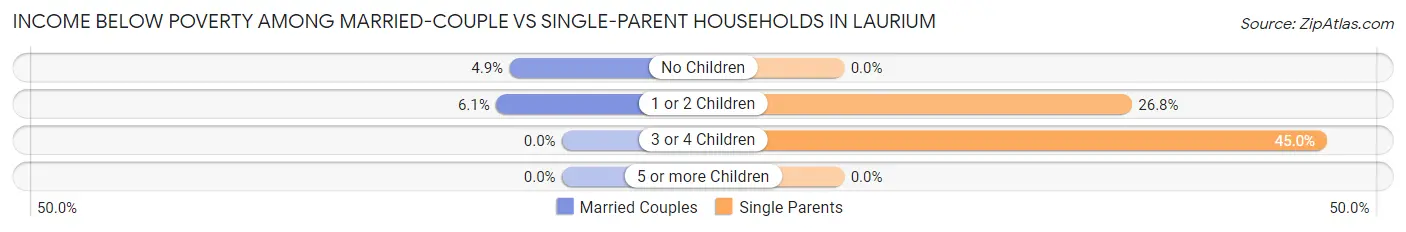
| Children | Married-Couple Families | Single-Parent Households |
| No Children | 9 (4.9%) | 0 (0.0%) |
| 1 or 2 Children | 7 (6.1%) | 15 (26.8%) |
| 3 or 4 Children | 0 (0.0%) | 9 (45.0%) |
| 5 or more Children | 0 (0.0%) | 0 (0.0%) |
| Total | 16 (5.1%) | 24 (24.7%) |
Race in Laurium
The most populous races in Laurium are White / Caucasian (1,628 | 97.5%), Hispanic or Latino (33 | 2.0%), and Two or more Races (22 | 1.3%).
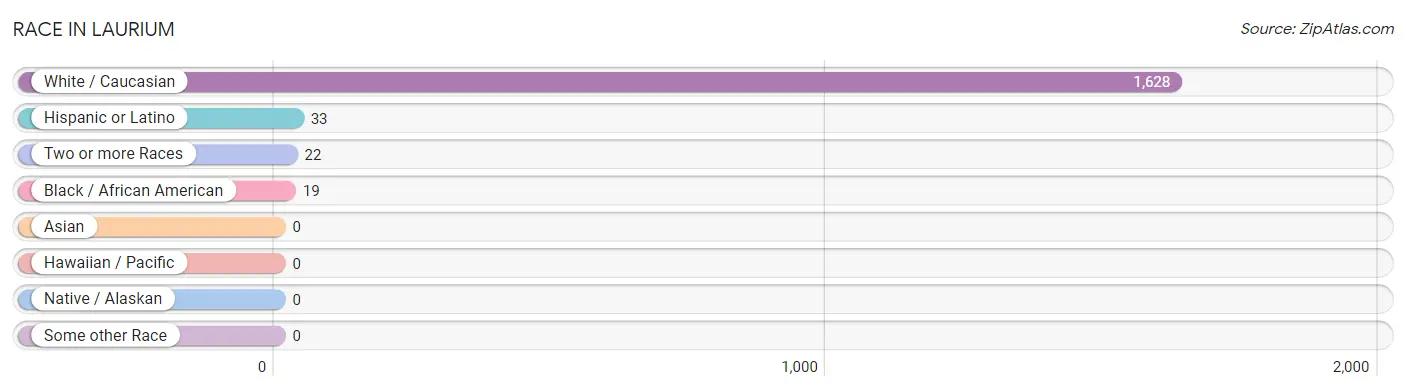
| Race | # Population | % Population |
| Asian | 0 | 0.0% |
| Black / African American | 19 | 1.1% |
| Hawaiian / Pacific | 0 | 0.0% |
| Hispanic or Latino | 33 | 2.0% |
| Native / Alaskan | 0 | 0.0% |
| White / Caucasian | 1,628 | 97.5% |
| Two or more Races | 22 | 1.3% |
| Some other Race | 0 | 0.0% |
| Total | 1,669 | 100.0% |
Ancestry in Laurium
The most populous ancestries reported in Laurium are Finnish (405 | 24.3%), German (332 | 19.9%), Italian (172 | 10.3%), English (165 | 9.9%), and French (151 | 9.0%), together accounting for 73.4% of all Laurium residents.
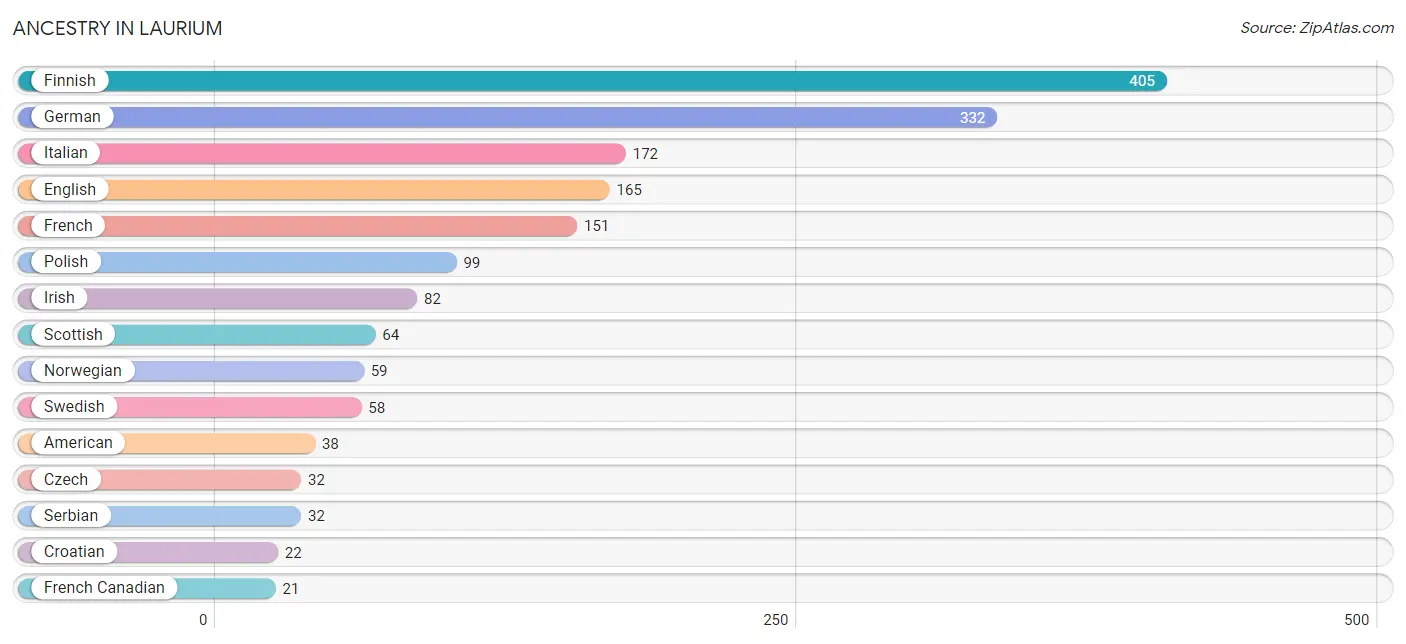
| Ancestry | # Population | % Population |
| American | 38 | 2.3% |
| Chippewa | 6 | 0.4% |
| Croatian | 22 | 1.3% |
| Czech | 32 | 1.9% |
| Danish | 14 | 0.8% |
| Dutch | 16 | 1.0% |
| English | 165 | 9.9% |
| Finnish | 405 | 24.3% |
| French | 151 | 9.0% |
| French Canadian | 21 | 1.3% |
| German | 332 | 19.9% |
| Hungarian | 21 | 1.3% |
| Iranian | 6 | 0.4% |
| Irish | 82 | 4.9% |
| Italian | 172 | 10.3% |
| Jamaican | 5 | 0.3% |
| Mexican | 14 | 0.8% |
| Norwegian | 59 | 3.5% |
| Polish | 99 | 5.9% |
| Portuguese | 7 | 0.4% |
| Puerto Rican | 8 | 0.5% |
| Scotch-Irish | 4 | 0.2% |
| Scottish | 64 | 3.8% |
| Serbian | 32 | 1.9% |
| Slovene | 10 | 0.6% |
| Spaniard | 11 | 0.7% |
| Swedish | 58 | 3.5% | View All 27 Rows |
Immigrants in Laurium
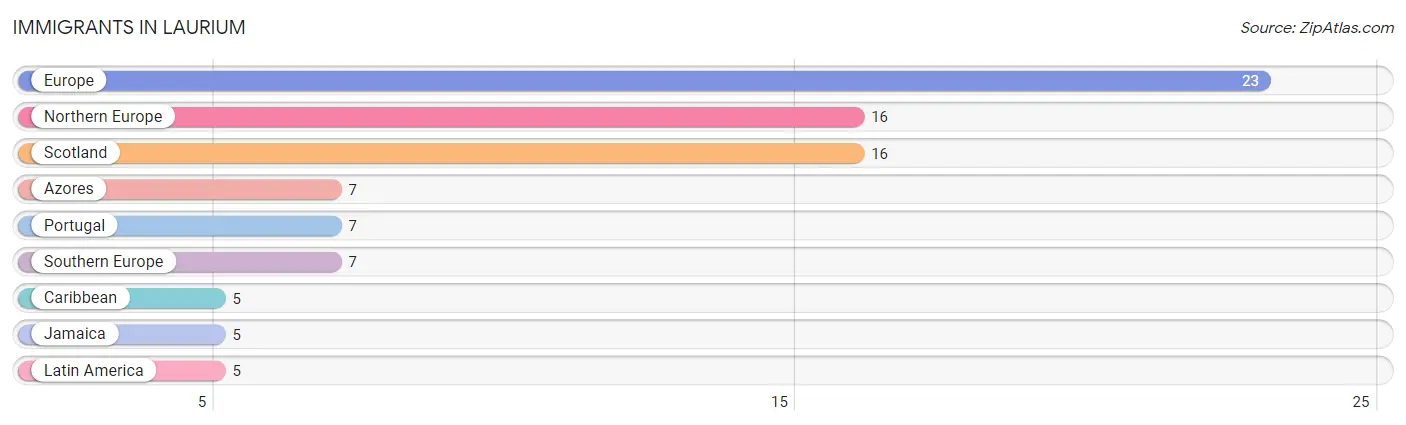
The most numerous immigrant groups reported in Laurium came from Europe (23 | 1.4%), Northern Europe (16 | 1.0%), Scotland (16 | 1.0%), Azores (7 | 0.4%), and Portugal (7 | 0.4%), together accounting for 4.1% of all Laurium residents.
| Immigration Origin | # Population | % Population |
| Azores | 7 | 0.4% |
| Caribbean | 5 | 0.3% |
| Europe | 23 | 1.4% |
| Jamaica | 5 | 0.3% |
| Latin America | 5 | 0.3% |
| Northern Europe | 16 | 1.0% |
| Portugal | 7 | 0.4% |
| Scotland | 16 | 1.0% |
| Southern Europe | 7 | 0.4% | View All 9 Rows |
Sex and Age in Laurium
Sex and Age in Laurium
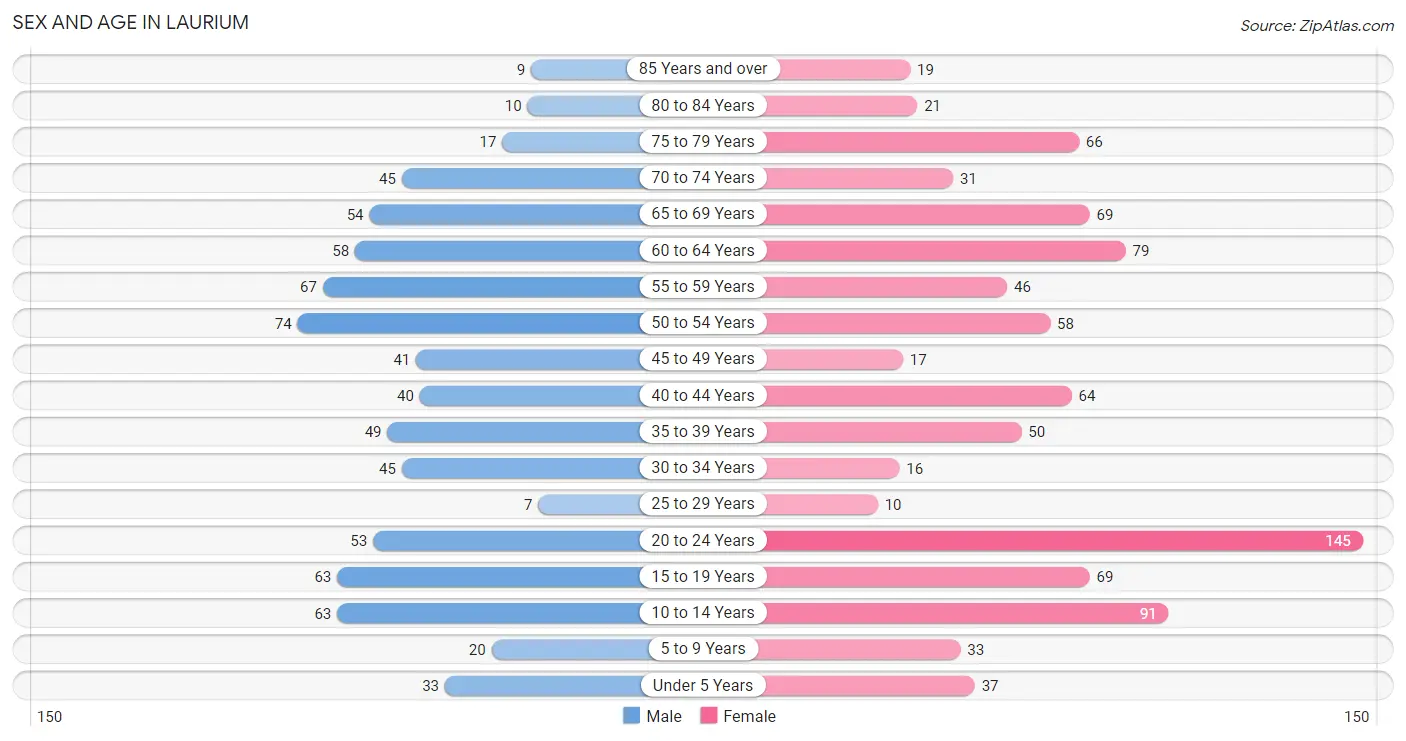
The most populous age groups in Laurium are 50 to 54 Years (74 | 9.9%) for men and 20 to 24 Years (145 | 15.7%) for women.
| Age Bracket | Male | Female |
| Under 5 Years | 33 (4.4%) | 37 (4.0%) |
| 5 to 9 Years | 20 (2.7%) | 33 (3.6%) |
| 10 to 14 Years | 63 (8.4%) | 91 (9.9%) |
| 15 to 19 Years | 63 (8.4%) | 69 (7.5%) |
| 20 to 24 Years | 53 (7.1%) | 145 (15.7%) |
| 25 to 29 Years | 7 (0.9%) | 10 (1.1%) |
| 30 to 34 Years | 45 (6.0%) | 16 (1.7%) |
| 35 to 39 Years | 49 (6.6%) | 50 (5.4%) |
| 40 to 44 Years | 40 (5.3%) | 64 (7.0%) |
| 45 to 49 Years | 41 (5.5%) | 17 (1.8%) |
| 50 to 54 Years | 74 (9.9%) | 58 (6.3%) |
| 55 to 59 Years | 67 (9.0%) | 46 (5.0%) |
| 60 to 64 Years | 58 (7.7%) | 79 (8.6%) |
| 65 to 69 Years | 54 (7.2%) | 69 (7.5%) |
| 70 to 74 Years | 45 (6.0%) | 31 (3.4%) |
| 75 to 79 Years | 17 (2.3%) | 66 (7.2%) |
| 80 to 84 Years | 10 (1.3%) | 21 (2.3%) |
| 85 Years and over | 9 (1.2%) | 19 (2.1%) |
| Total | 748 (100.0%) | 921 (100.0%) |
Families and Households in Laurium
Median Family Size in Laurium
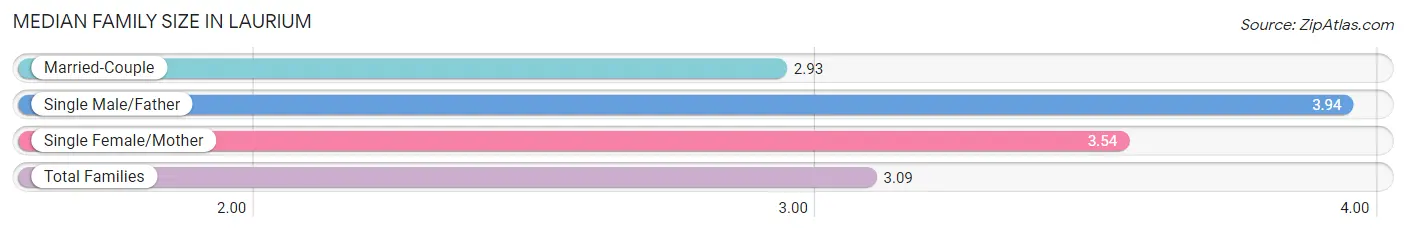
The median family size in Laurium is 3.09 persons per family, with single male/father families (16 | 3.9%) accounting for the largest median family size of 3.94 persons per family. On the other hand, married-couple families (311 | 76.2%) represent the smallest median family size with 2.93 persons per family.
| Family Type | # Families | Family Size |
| Married-Couple | 311 (76.2%) | 2.93 |
| Single Male/Father | 16 (3.9%) | 3.94 |
| Single Female/Mother | 81 (19.9%) | 3.54 |
| Total Families | 408 (100.0%) | 3.09 |
Median Household Size in Laurium
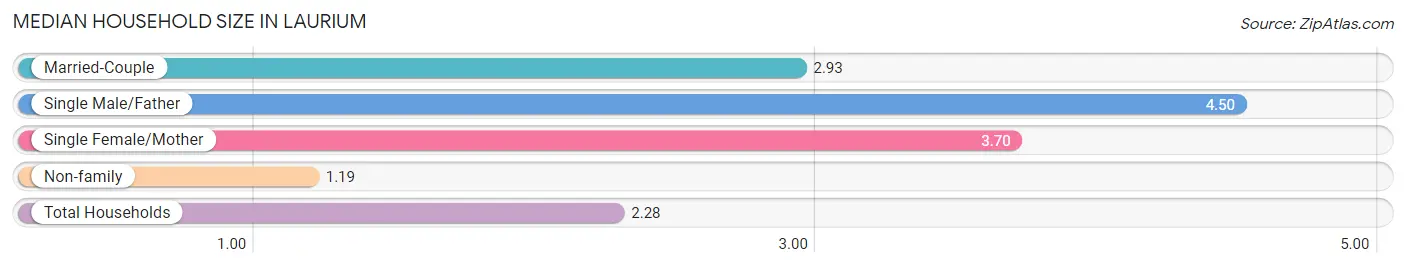
The median household size in Laurium is 2.28 persons per household, with single male/father households (16 | 2.2%) accounting for the largest median household size of 4.5 persons per household. non-family households (325 | 44.3%) represent the smallest median household size with 1.19 persons per household.
| Household Type | # Households | Household Size |
| Married-Couple | 311 (42.4%) | 2.93 |
| Single Male/Father | 16 (2.2%) | 4.50 |
| Single Female/Mother | 81 (11.1%) | 3.70 |
| Non-family | 325 (44.3%) | 1.19 |
| Total Households | 733 (100.0%) | 2.28 |
Household Size by Marriage Status in Laurium
Out of a total of 733 households in Laurium, 408 (55.7%) are family households, while 325 (44.3%) are nonfamily households. The most numerous type of family households are 2-person households, comprising 181, and the most common type of nonfamily households are 1-person households, comprising 271.

| Household Size | Family Households | Nonfamily Households |
| 1-Person Households | - | 271 (37.0%) |
| 2-Person Households | 181 (24.7%) | 54 (7.4%) |
| 3-Person Households | 107 (14.6%) | 0 (0.0%) |
| 4-Person Households | 78 (10.6%) | 0 (0.0%) |
| 5-Person Households | 27 (3.7%) | 0 (0.0%) |
| 6-Person Households | 12 (1.6%) | 0 (0.0%) |
| 7+ Person Households | 3 (0.4%) | 0 (0.0%) |
| Total | 408 (55.7%) | 325 (44.3%) |
Female Fertility in Laurium
Fertility by Age in Laurium
Average fertility rate in Laurium is 30.0 births per 1,000 women. Women in the age bracket of 20 to 34 years have the highest fertility rate with 53.0 births per 1,000 women. Women in the age bracket of 20 to 34 years acount for 75.0% of all women with births.
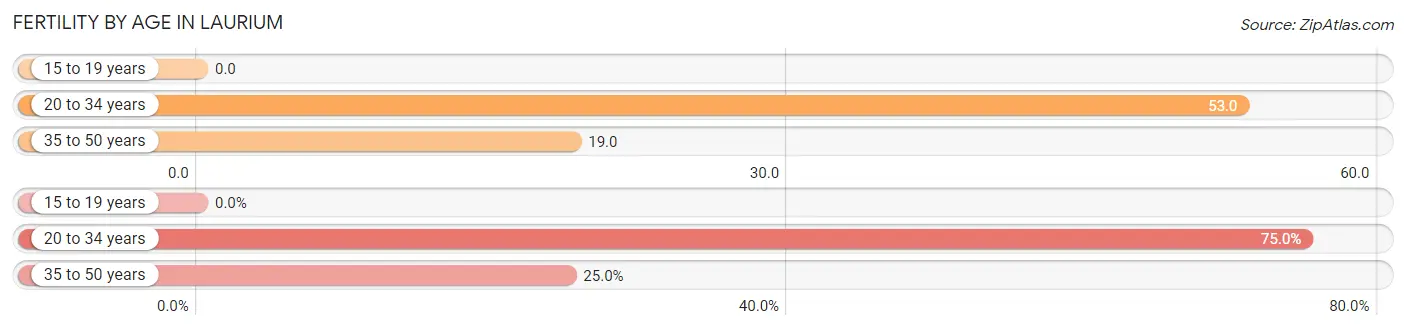
| Age Bracket | Women with Births | Births / 1,000 Women |
| 15 to 19 years | 0 (0.0%) | 0.0 |
| 20 to 34 years | 9 (75.0%) | 53.0 |
| 35 to 50 years | 3 (25.0%) | 19.0 |
| Total | 12 (100.0%) | 30.0 |
Fertility by Age by Marriage Status in Laurium
25.0% of women with births (12) in Laurium are married. The highest percentage of unmarried women with births falls into 20 to 34 years age bracket with 100.0% of them unmarried at the time of birth, while the lowest percentage of unmarried women with births belong to 35 to 50 years age bracket with 0.0% of them unmarried.
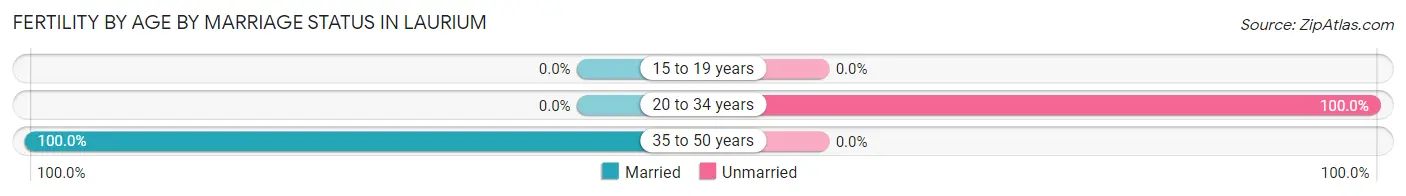
| Age Bracket | Married | Unmarried |
| 15 to 19 years | 0 (0.0%) | 0 (0.0%) |
| 20 to 34 years | 0 (0.0%) | 9 (100.0%) |
| 35 to 50 years | 3 (100.0%) | 0 (0.0%) |
| Total | 3 (25.0%) | 9 (75.0%) |
Fertility by Education in Laurium
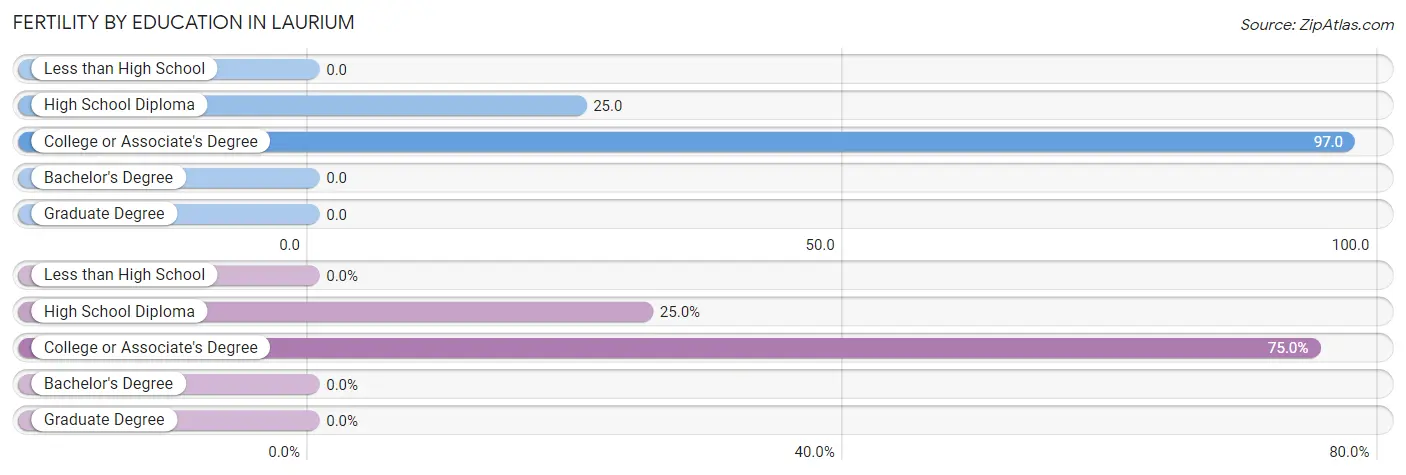
| Educational Attainment | Women with Births | Births / 1,000 Women |
| Less than High School | 0 (0.0%) | 0.0 |
| High School Diploma | 3 (25.0%) | 25.0 |
| College or Associate's Degree | 9 (75.0%) | 97.0 |
| Bachelor's Degree | 0 (0.0%) | 0.0 |
| Graduate Degree | 0 (0.0%) | 0.0 |
| Total | 12 (100.0%) | 30.0 |
Fertility by Education by Marriage Status in Laurium
75.0% of women with births in Laurium are unmarried. Women with the educational attainment of college or associate's degree are most likely to be married with 33.3% of them married at childbirth, while women with the educational attainment of high school diploma are least likely to be married with 100.0% of them unmarried at childbirth.
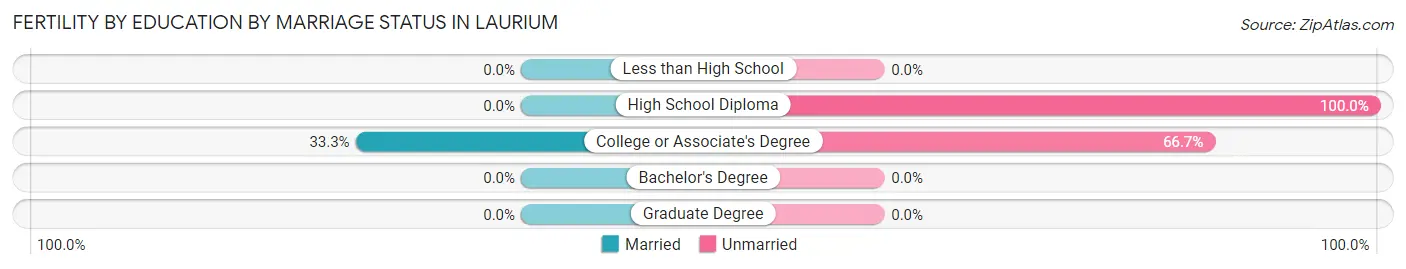
| Educational Attainment | Married | Unmarried |
| Less than High School | 0 (0.0%) | 0 (0.0%) |
| High School Diploma | 0 (0.0%) | 3 (100.0%) |
| College or Associate's Degree | 3 (33.3%) | 6 (66.7%) |
| Bachelor's Degree | 0 (0.0%) | 0 (0.0%) |
| Graduate Degree | 0 (0.0%) | 0 (0.0%) |
| Total | 3 (25.0%) | 9 (75.0%) |
Employment Characteristics in Laurium
Employment by Class of Employer in Laurium
Among the 794 employed individuals in Laurium, private company employees (489 | 61.6%), not-for-profit organizations (194 | 24.4%), and local government employees (51 | 6.4%) make up the most common classes of employment.
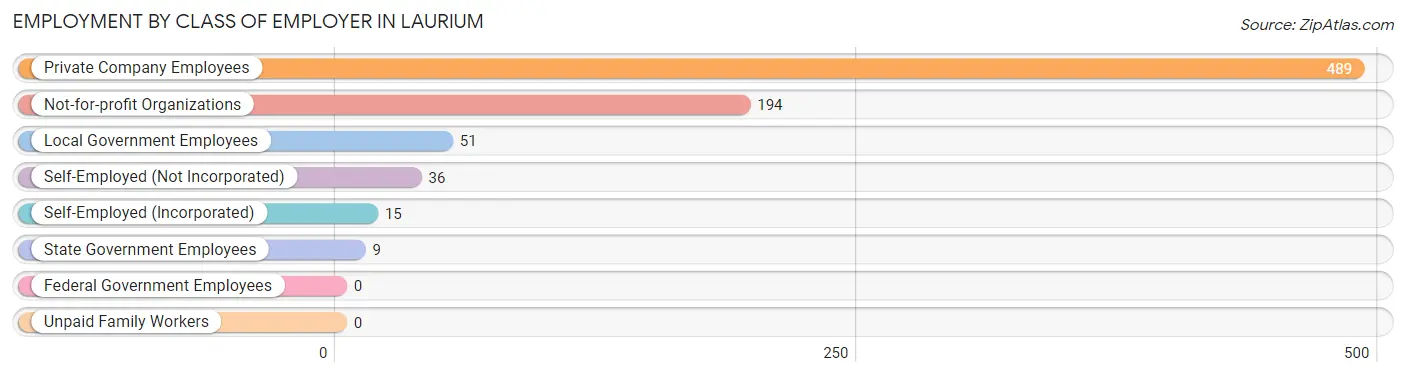
| Employer Class | # Employees | % Employees |
| Private Company Employees | 489 | 61.6% |
| Self-Employed (Incorporated) | 15 | 1.9% |
| Self-Employed (Not Incorporated) | 36 | 4.5% |
| Not-for-profit Organizations | 194 | 24.4% |
| Local Government Employees | 51 | 6.4% |
| State Government Employees | 9 | 1.1% |
| Federal Government Employees | 0 | 0.0% |
| Unpaid Family Workers | 0 | 0.0% |
| Total | 794 | 100.0% |
Employment Status by Age in Laurium
According to the labor force statistics for Laurium, out of the total population over 16 years of age (1,351), 61.6% or 832 individuals are in the labor force, with 2.6% or 22 of them unemployed. The age group with the highest labor force participation rate is 20 to 24 years, with 94.4% or 187 individuals in the labor force. Within the labor force, the 16 to 19 years age range has the highest percentage of unemployed individuals, with 22.6% or 14 of them being unemployed.
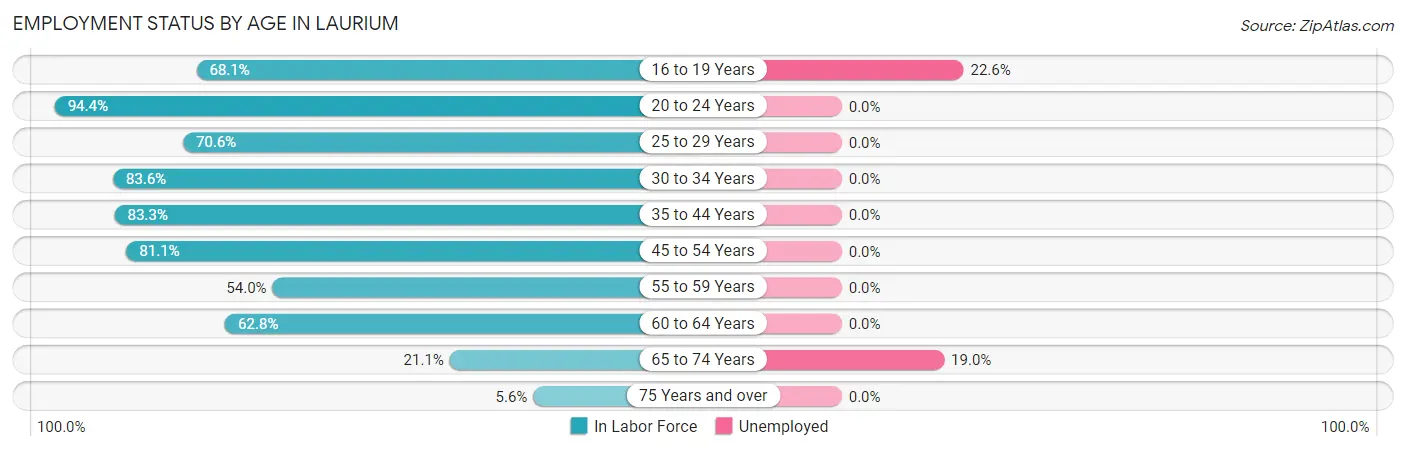
| Age Bracket | In Labor Force | Unemployed |
| 16 to 19 Years | 62 (68.1%) | 14 (22.6%) |
| 20 to 24 Years | 187 (94.4%) | 0 (0.0%) |
| 25 to 29 Years | 12 (70.6%) | 0 (0.0%) |
| 30 to 34 Years | 51 (83.6%) | 0 (0.0%) |
| 35 to 44 Years | 169 (83.3%) | 0 (0.0%) |
| 45 to 54 Years | 154 (81.1%) | 0 (0.0%) |
| 55 to 59 Years | 61 (54.0%) | 0 (0.0%) |
| 60 to 64 Years | 86 (62.8%) | 0 (0.0%) |
| 65 to 74 Years | 42 (21.1%) | 8 (19.0%) |
| 75 Years and over | 8 (5.6%) | 0 (0.0%) |
| Total | 832 (61.6%) | 22 (2.6%) |
Employment Status by Educational Attainment in Laurium
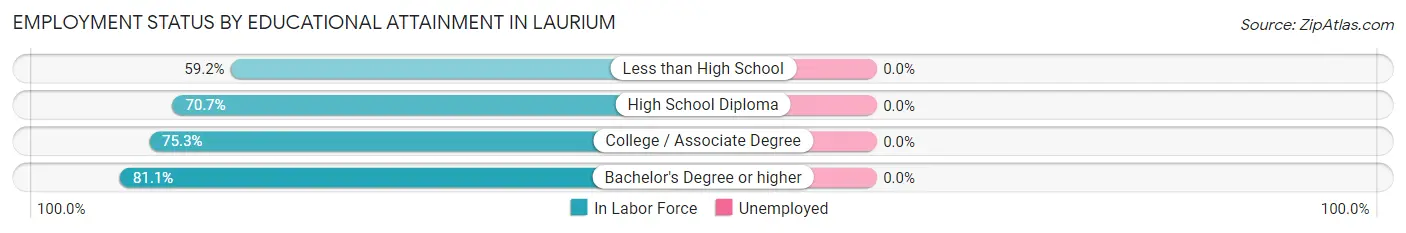
| Educational Attainment | In Labor Force | Unemployed |
| Less than High School | 45 (59.2%) | 0 (0.0%) |
| High School Diploma | 159 (70.7%) | 0 (0.0%) |
| College / Associate Degree | 149 (75.3%) | 0 (0.0%) |
| Bachelor's Degree or higher | 180 (81.1%) | 0 (0.0%) |
| Total | 533 (73.9%) | 0 (0.0%) |
Employment Occupations by Sex in Laurium
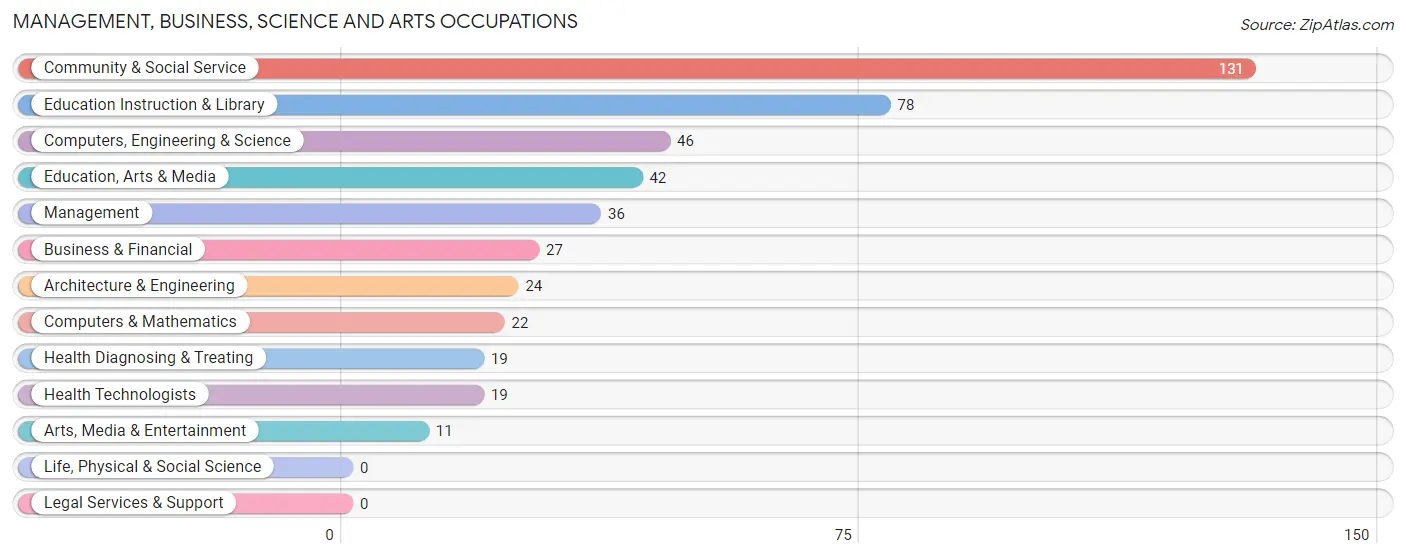
Management, Business, Science and Arts Occupations
The most common Management, Business, Science and Arts occupations in Laurium are Community & Social Service (131 | 16.2%), Education Instruction & Library (78 | 9.6%), Computers, Engineering & Science (46 | 5.7%), Education, Arts & Media (42 | 5.2%), and Management (36 | 4.4%).
Management, Business, Science and Arts Occupations by Sex
Within the Management, Business, Science and Arts occupations in Laurium, the most male-oriented occupations are Architecture & Engineering (100.0%), Education, Arts & Media (100.0%), and Arts, Media & Entertainment (100.0%), while the most female-oriented occupations are Health Diagnosing & Treating (100.0%), Health Technologists (100.0%), and Education Instruction & Library (74.4%).
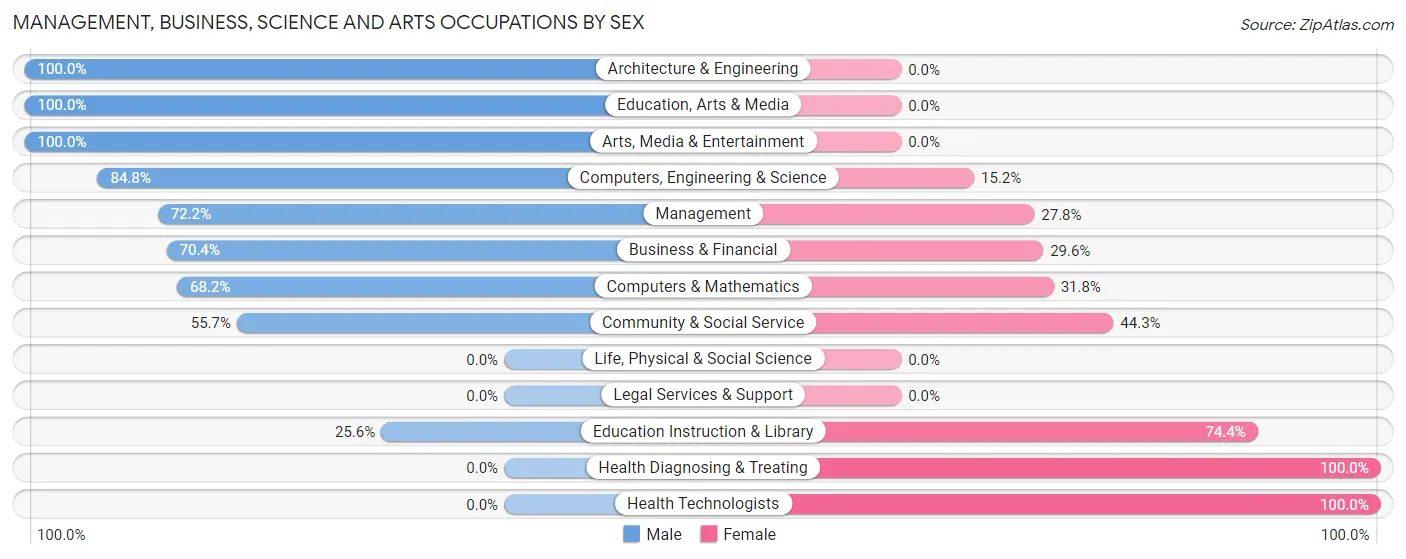
| Occupation | Male | Female |
| Management | 26 (72.2%) | 10 (27.8%) |
| Business & Financial | 19 (70.4%) | 8 (29.6%) |
| Computers, Engineering & Science | 39 (84.8%) | 7 (15.2%) |
| Computers & Mathematics | 15 (68.2%) | 7 (31.8%) |
| Architecture & Engineering | 24 (100.0%) | 0 (0.0%) |
| Life, Physical & Social Science | 0 (0.0%) | 0 (0.0%) |
| Community & Social Service | 73 (55.7%) | 58 (44.3%) |
| Education, Arts & Media | 42 (100.0%) | 0 (0.0%) |
| Legal Services & Support | 0 (0.0%) | 0 (0.0%) |
| Education Instruction & Library | 20 (25.6%) | 58 (74.4%) |
| Arts, Media & Entertainment | 11 (100.0%) | 0 (0.0%) |
| Health Diagnosing & Treating | 0 (0.0%) | 19 (100.0%) |
| Health Technologists | 0 (0.0%) | 19 (100.0%) |
| Total (Category) | 157 (60.6%) | 102 (39.4%) |
| Total (Overall) | 379 (46.8%) | 431 (53.2%) |
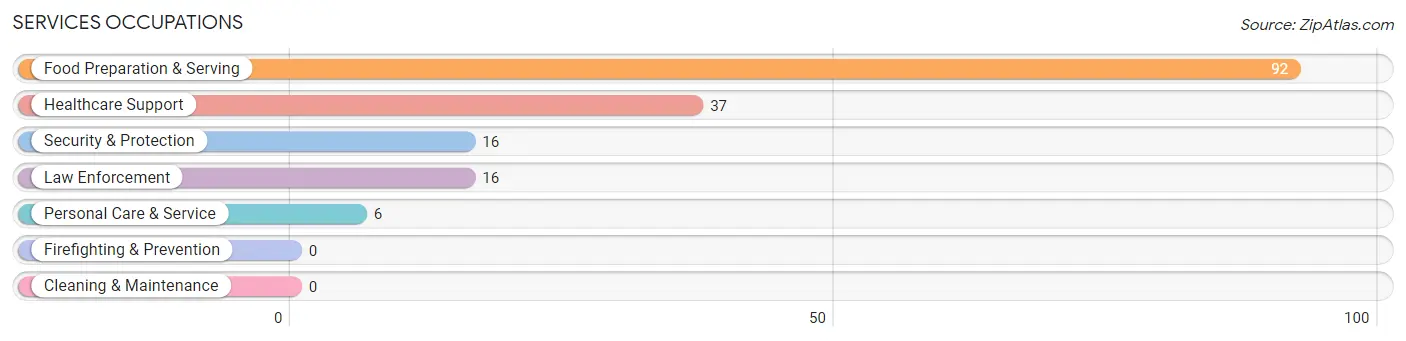
Services Occupations
The most common Services occupations in Laurium are Food Preparation & Serving (92 | 11.4%), Healthcare Support (37 | 4.6%), Security & Protection (16 | 2.0%), Law Enforcement (16 | 2.0%), and Personal Care & Service (6 | 0.7%).
Services Occupations by Sex
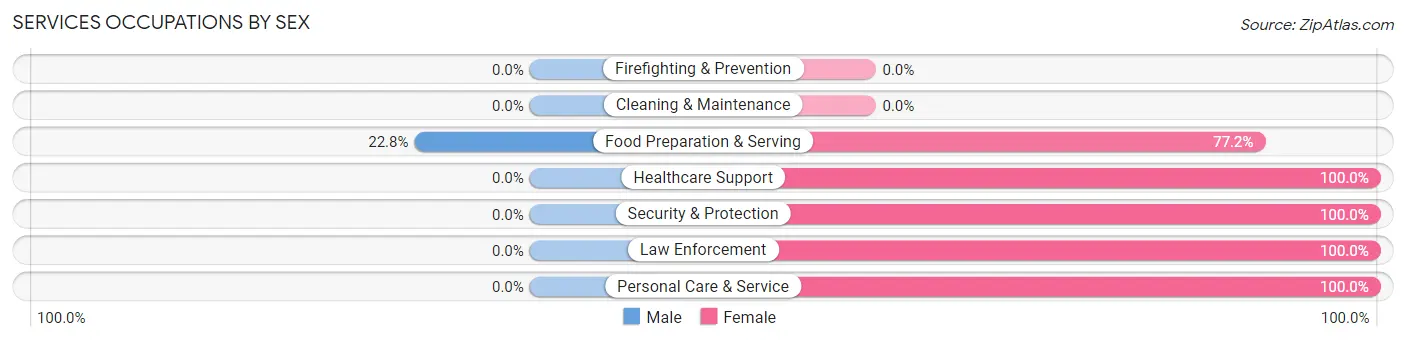
| Occupation | Male | Female |
| Healthcare Support | 0 (0.0%) | 37 (100.0%) |
| Security & Protection | 0 (0.0%) | 16 (100.0%) |
| Firefighting & Prevention | 0 (0.0%) | 0 (0.0%) |
| Law Enforcement | 0 (0.0%) | 16 (100.0%) |
| Food Preparation & Serving | 21 (22.8%) | 71 (77.2%) |
| Cleaning & Maintenance | 0 (0.0%) | 0 (0.0%) |
| Personal Care & Service | 0 (0.0%) | 6 (100.0%) |
| Total (Category) | 21 (13.9%) | 130 (86.1%) |
| Total (Overall) | 379 (46.8%) | 431 (53.2%) |
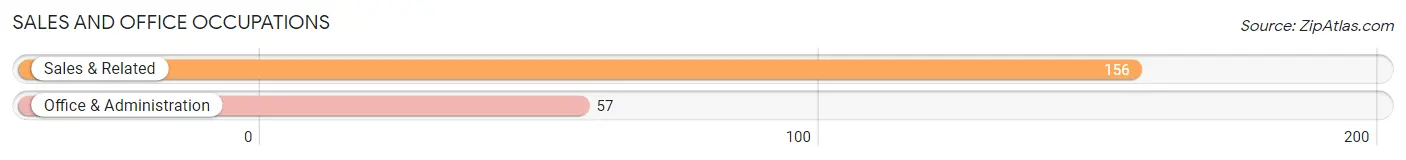
Sales and Office Occupations
The most common Sales and Office occupations in Laurium are Sales & Related (156 | 19.3%), and Office & Administration (57 | 7.0%).
Sales and Office Occupations by Sex

| Occupation | Male | Female |
| Sales & Related | 37 (23.7%) | 119 (76.3%) |
| Office & Administration | 9 (15.8%) | 48 (84.2%) |
| Total (Category) | 46 (21.6%) | 167 (78.4%) |
| Total (Overall) | 379 (46.8%) | 431 (53.2%) |
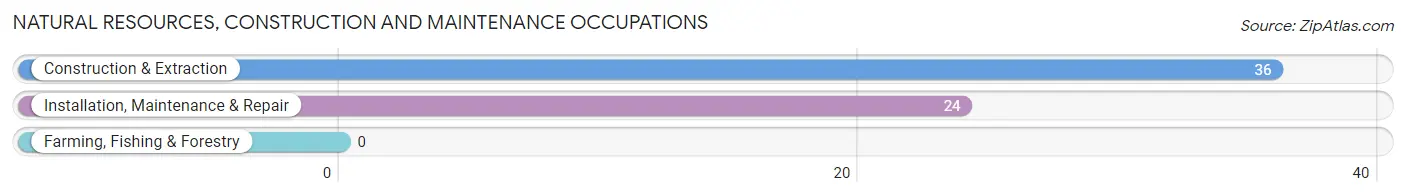
Natural Resources, Construction and Maintenance Occupations
The most common Natural Resources, Construction and Maintenance occupations in Laurium are Construction & Extraction (36 | 4.4%), and Installation, Maintenance & Repair (24 | 3.0%).
Natural Resources, Construction and Maintenance Occupations by Sex
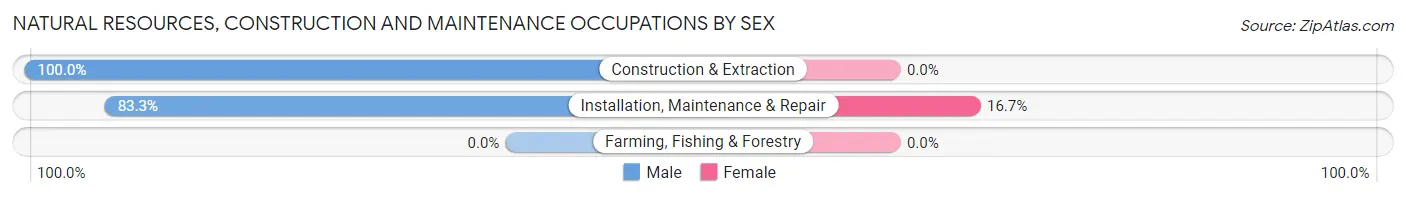
| Occupation | Male | Female |
| Farming, Fishing & Forestry | 0 (0.0%) | 0 (0.0%) |
| Construction & Extraction | 36 (100.0%) | 0 (0.0%) |
| Installation, Maintenance & Repair | 20 (83.3%) | 4 (16.7%) |
| Total (Category) | 56 (93.3%) | 4 (6.7%) |
| Total (Overall) | 379 (46.8%) | 431 (53.2%) |
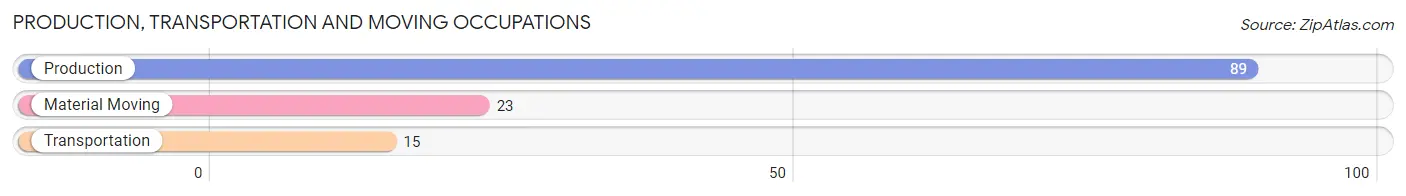
Production, Transportation and Moving Occupations
The most common Production, Transportation and Moving occupations in Laurium are Production (89 | 11.0%), Material Moving (23 | 2.8%), and Transportation (15 | 1.8%).
Production, Transportation and Moving Occupations by Sex
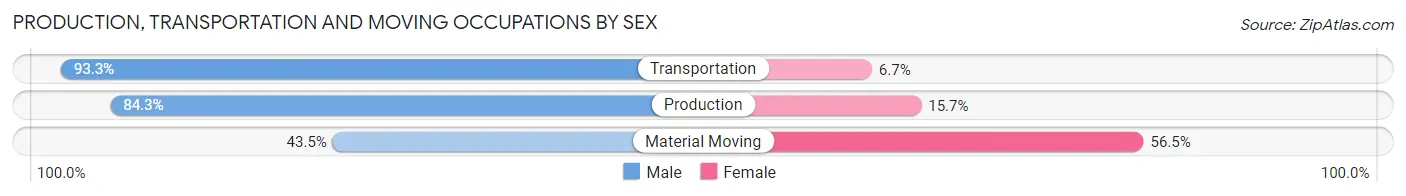
| Occupation | Male | Female |
| Production | 75 (84.3%) | 14 (15.7%) |
| Transportation | 14 (93.3%) | 1 (6.7%) |
| Material Moving | 10 (43.5%) | 13 (56.5%) |
| Total (Category) | 99 (77.9%) | 28 (22.1%) |
| Total (Overall) | 379 (46.8%) | 431 (53.2%) |
Employment Industries by Sex in Laurium
Employment Industries in Laurium
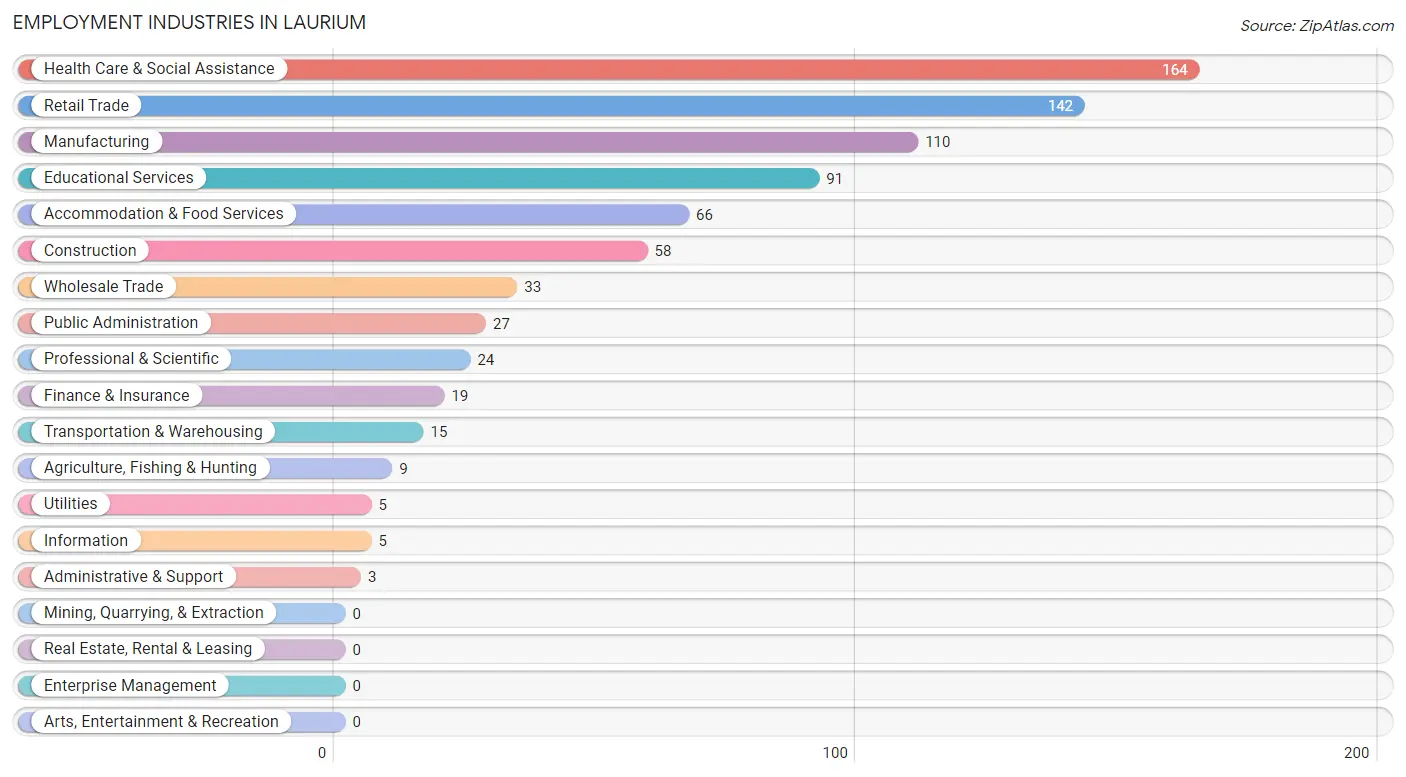
The major employment industries in Laurium include Health Care & Social Assistance (164 | 20.3%), Retail Trade (142 | 17.5%), Manufacturing (110 | 13.6%), Educational Services (91 | 11.2%), and Accommodation & Food Services (66 | 8.2%).
Employment Industries by Sex in Laurium
The Laurium industries that see more men than women are Construction (100.0%), Utilities (100.0%), and Professional & Scientific (100.0%), whereas the industries that tend to have a higher number of women are Agriculture, Fishing & Hunting (100.0%), Information (100.0%), and Administrative & Support (100.0%).
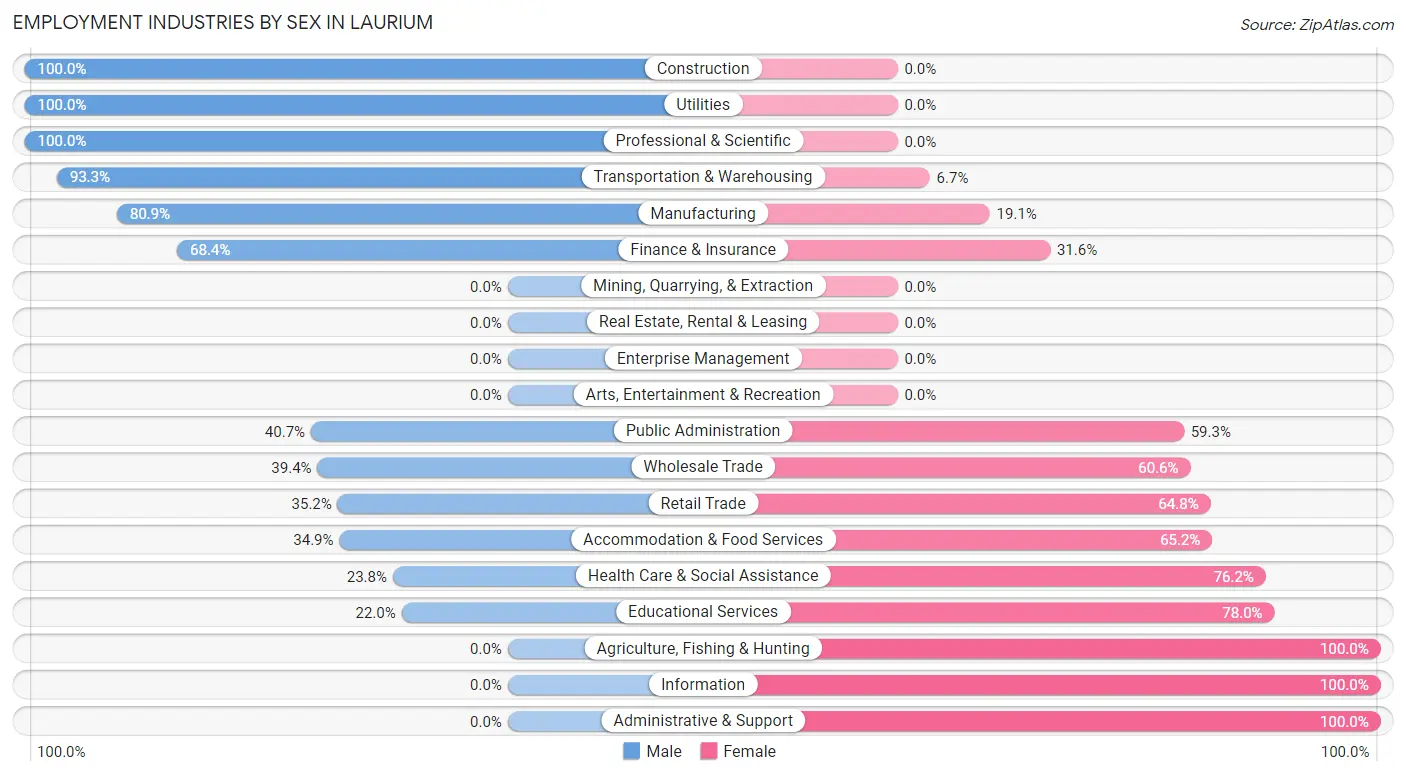
| Industry | Male | Female |
| Agriculture, Fishing & Hunting | 0 (0.0%) | 9 (100.0%) |
| Mining, Quarrying, & Extraction | 0 (0.0%) | 0 (0.0%) |
| Construction | 58 (100.0%) | 0 (0.0%) |
| Manufacturing | 89 (80.9%) | 21 (19.1%) |
| Wholesale Trade | 13 (39.4%) | 20 (60.6%) |
| Retail Trade | 50 (35.2%) | 92 (64.8%) |
| Transportation & Warehousing | 14 (93.3%) | 1 (6.7%) |
| Utilities | 5 (100.0%) | 0 (0.0%) |
| Information | 0 (0.0%) | 5 (100.0%) |
| Finance & Insurance | 13 (68.4%) | 6 (31.6%) |
| Real Estate, Rental & Leasing | 0 (0.0%) | 0 (0.0%) |
| Professional & Scientific | 24 (100.0%) | 0 (0.0%) |
| Enterprise Management | 0 (0.0%) | 0 (0.0%) |
| Administrative & Support | 0 (0.0%) | 3 (100.0%) |
| Educational Services | 20 (22.0%) | 71 (78.0%) |
| Health Care & Social Assistance | 39 (23.8%) | 125 (76.2%) |
| Arts, Entertainment & Recreation | 0 (0.0%) | 0 (0.0%) |
| Accommodation & Food Services | 23 (34.8%) | 43 (65.1%) |
| Public Administration | 11 (40.7%) | 16 (59.3%) |
| Total | 379 (46.8%) | 431 (53.2%) |
Education in Laurium
School Enrollment in Laurium
The most common levels of schooling among the 462 students in Laurium are middle school (147 | 31.8%), high school (121 | 26.2%), and college / undergraduate (98 | 21.2%).
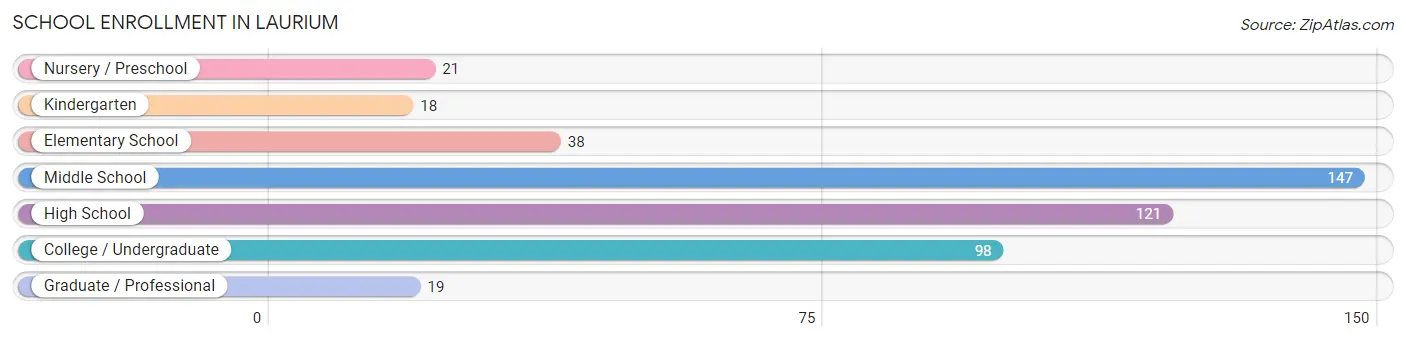
| School Level | # Students | % Students |
| Nursery / Preschool | 21 | 4.5% |
| Kindergarten | 18 | 3.9% |
| Elementary School | 38 | 8.2% |
| Middle School | 147 | 31.8% |
| High School | 121 | 26.2% |
| College / Undergraduate | 98 | 21.2% |
| Graduate / Professional | 19 | 4.1% |
| Total | 462 | 100.0% |
School Enrollment by Age by Funding Source in Laurium
Out of a total of 462 students who are enrolled in schools in Laurium, 74 (16.0%) attend a private institution, while the remaining 388 (84.0%) are enrolled in public schools. The age group of 35 years and over has the highest likelihood of being enrolled in private schools, with 19 (61.3% in the age bracket) enrolled. Conversely, the age group of 18 to 19 year olds has the lowest likelihood of being enrolled in a private school, with 30 (100.0% in the age bracket) attending a public institution.
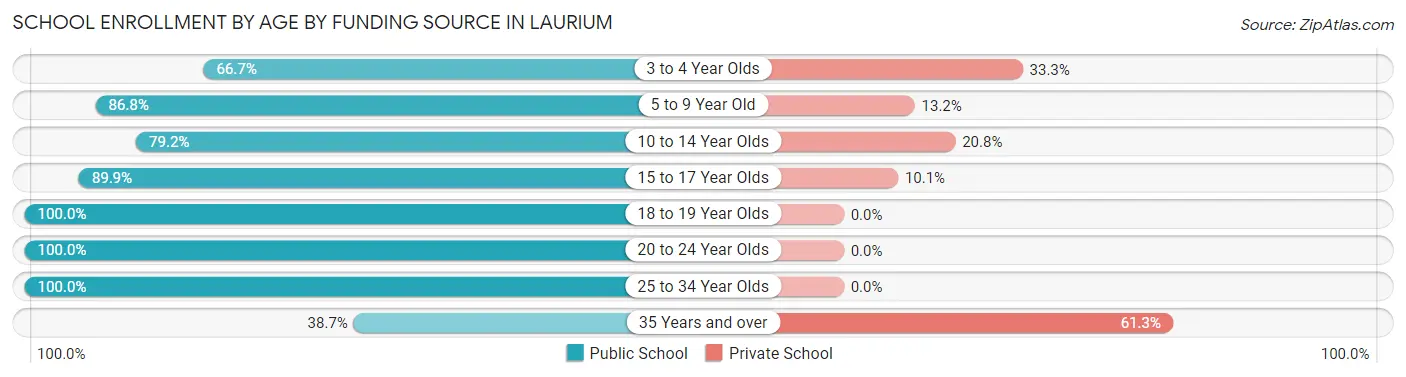
| Age Bracket | Public School | Private School |
| 3 to 4 Year Olds | 14 (66.7%) | 7 (33.3%) |
| 5 to 9 Year Old | 46 (86.8%) | 7 (13.2%) |
| 10 to 14 Year Olds | 122 (79.2%) | 32 (20.8%) |
| 15 to 17 Year Olds | 80 (89.9%) | 9 (10.1%) |
| 18 to 19 Year Olds | 30 (100.0%) | 0 (0.0%) |
| 20 to 24 Year Olds | 82 (100.0%) | 0 (0.0%) |
| 25 to 34 Year Olds | 2 (100.0%) | 0 (0.0%) |
| 35 Years and over | 12 (38.7%) | 19 (61.3%) |
| Total | 388 (84.0%) | 74 (16.0%) |
Educational Attainment by Field of Study in Laurium
Education (96 | 25.0%), science & technology (66 | 17.2%), arts & humanities (46 | 12.0%), bio, nature & agricultural (33 | 8.6%), and engineering (30 | 7.8%) are the most common fields of study among 384 individuals in Laurium who have obtained a bachelor's degree or higher.
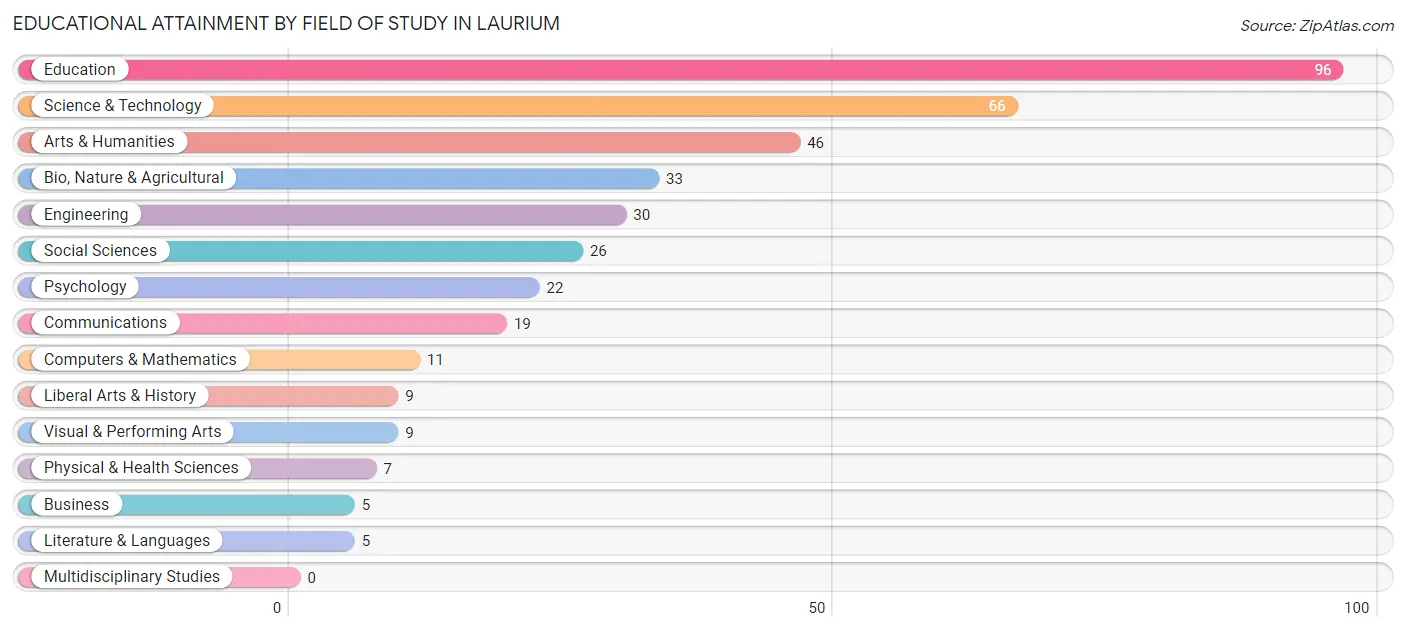
| Field of Study | # Graduates | % Graduates |
| Computers & Mathematics | 11 | 2.9% |
| Bio, Nature & Agricultural | 33 | 8.6% |
| Physical & Health Sciences | 7 | 1.8% |
| Psychology | 22 | 5.7% |
| Social Sciences | 26 | 6.8% |
| Engineering | 30 | 7.8% |
| Multidisciplinary Studies | 0 | 0.0% |
| Science & Technology | 66 | 17.2% |
| Business | 5 | 1.3% |
| Education | 96 | 25.0% |
| Literature & Languages | 5 | 1.3% |
| Liberal Arts & History | 9 | 2.3% |
| Visual & Performing Arts | 9 | 2.3% |
| Communications | 19 | 5.0% |
| Arts & Humanities | 46 | 12.0% |
| Total | 384 | 100.0% |
Transportation & Commute in Laurium
Vehicle Availability by Sex in Laurium
The most prevalent vehicle ownership categories in Laurium are males with 2 vehicles (158, accounting for 42.8%) and females with 2 vehicles (146, making up 37.2%).
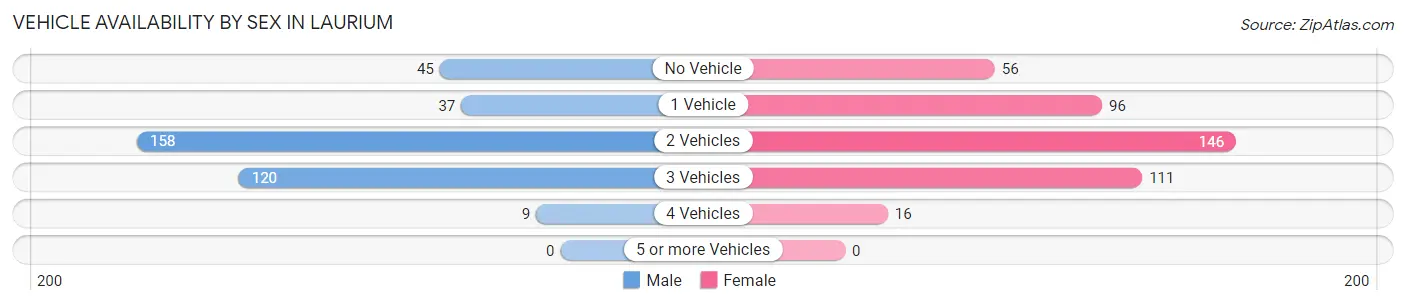
| Vehicles Available | Male | Female |
| No Vehicle | 45 (12.2%) | 56 (13.2%) |
| 1 Vehicle | 37 (10.0%) | 96 (22.6%) |
| 2 Vehicles | 158 (42.8%) | 146 (34.4%) |
| 3 Vehicles | 120 (32.5%) | 111 (26.1%) |
| 4 Vehicles | 9 (2.4%) | 16 (3.8%) |
| 5 or more Vehicles | 0 (0.0%) | 0 (0.0%) |
| Total | 369 (100.0%) | 425 (100.0%) |
Commute Time in Laurium
The most frequently occuring commute durations in Laurium are 5 to 9 minutes (203 commuters, 27.2%), 20 to 24 minutes (194 commuters, 26.0%), and less than 5 minutes (111 commuters, 14.9%).
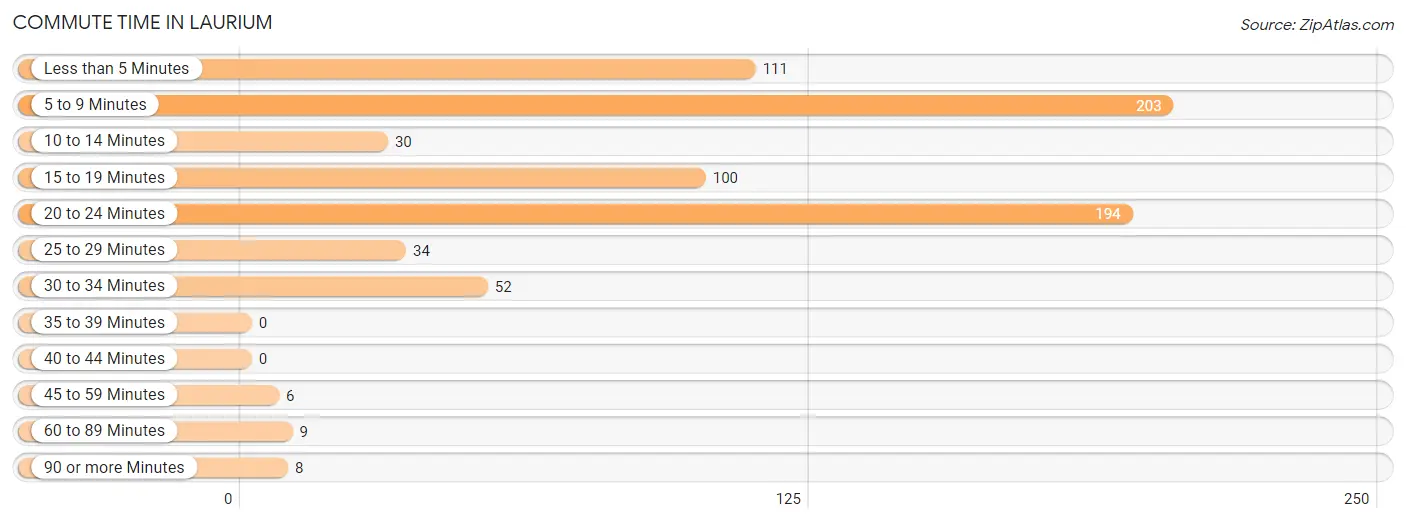
| Commute Time | # Commuters | % Commuters |
| Less than 5 Minutes | 111 | 14.9% |
| 5 to 9 Minutes | 203 | 27.2% |
| 10 to 14 Minutes | 30 | 4.0% |
| 15 to 19 Minutes | 100 | 13.4% |
| 20 to 24 Minutes | 194 | 26.0% |
| 25 to 29 Minutes | 34 | 4.5% |
| 30 to 34 Minutes | 52 | 7.0% |
| 35 to 39 Minutes | 0 | 0.0% |
| 40 to 44 Minutes | 0 | 0.0% |
| 45 to 59 Minutes | 6 | 0.8% |
| 60 to 89 Minutes | 9 | 1.2% |
| 90 or more Minutes | 8 | 1.1% |
Commute Time by Sex in Laurium
The most common commute times in Laurium are 5 to 9 minutes (124 commuters, 36.3%) for males and 20 to 24 minutes (119 commuters, 29.4%) for females.
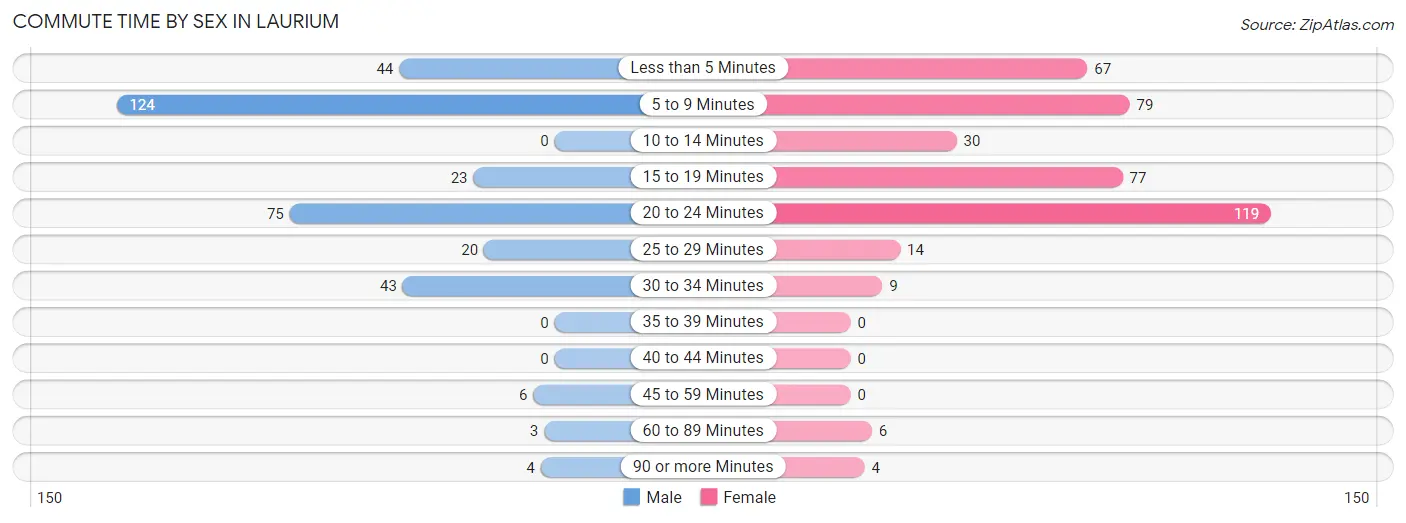
| Commute Time | Male | Female |
| Less than 5 Minutes | 44 (12.9%) | 67 (16.5%) |
| 5 to 9 Minutes | 124 (36.3%) | 79 (19.5%) |
| 10 to 14 Minutes | 0 (0.0%) | 30 (7.4%) |
| 15 to 19 Minutes | 23 (6.7%) | 77 (19.0%) |
| 20 to 24 Minutes | 75 (21.9%) | 119 (29.4%) |
| 25 to 29 Minutes | 20 (5.9%) | 14 (3.5%) |
| 30 to 34 Minutes | 43 (12.6%) | 9 (2.2%) |
| 35 to 39 Minutes | 0 (0.0%) | 0 (0.0%) |
| 40 to 44 Minutes | 0 (0.0%) | 0 (0.0%) |
| 45 to 59 Minutes | 6 (1.8%) | 0 (0.0%) |
| 60 to 89 Minutes | 3 (0.9%) | 6 (1.5%) |
| 90 or more Minutes | 4 (1.2%) | 4 (1.0%) |
Time of Departure to Work by Sex in Laurium
The most frequent times of departure to work in Laurium are 7:30 AM to 7:59 AM (69, 20.2%) for males and 8:00 AM to 8:29 AM (72, 17.8%) for females.
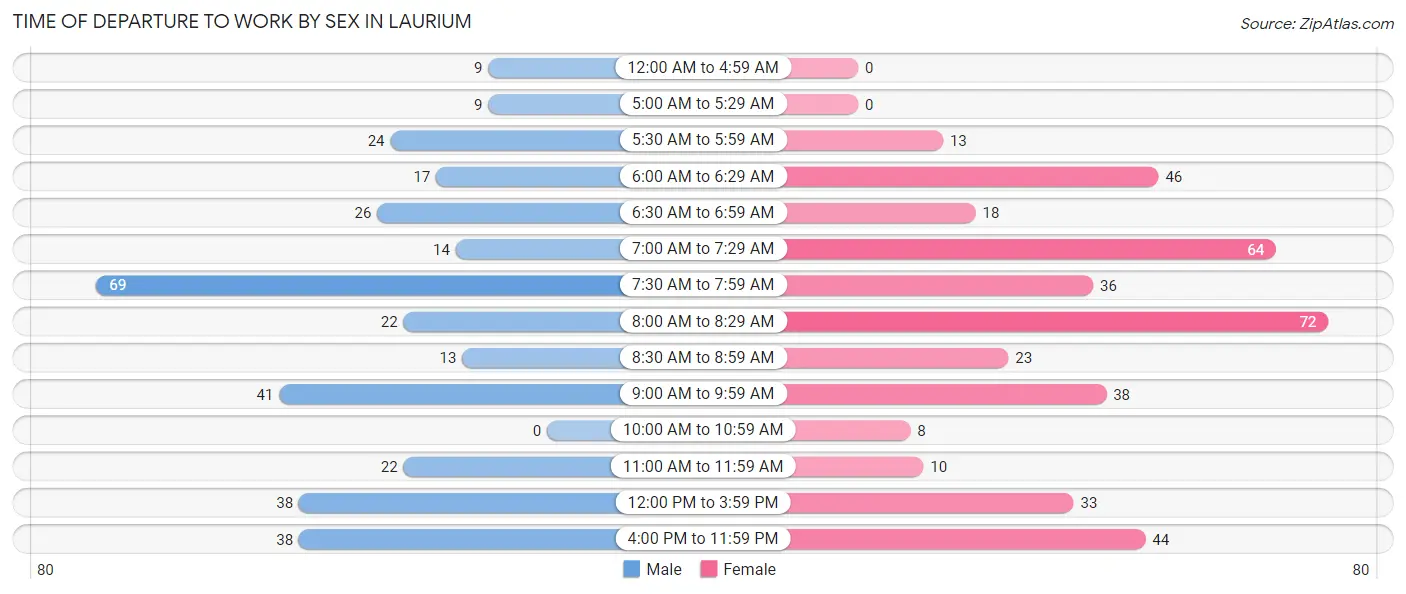
| Time of Departure | Male | Female |
| 12:00 AM to 4:59 AM | 9 (2.6%) | 0 (0.0%) |
| 5:00 AM to 5:29 AM | 9 (2.6%) | 0 (0.0%) |
| 5:30 AM to 5:59 AM | 24 (7.0%) | 13 (3.2%) |
| 6:00 AM to 6:29 AM | 17 (5.0%) | 46 (11.4%) |
| 6:30 AM to 6:59 AM | 26 (7.6%) | 18 (4.4%) |
| 7:00 AM to 7:29 AM | 14 (4.1%) | 64 (15.8%) |
| 7:30 AM to 7:59 AM | 69 (20.2%) | 36 (8.9%) |
| 8:00 AM to 8:29 AM | 22 (6.4%) | 72 (17.8%) |
| 8:30 AM to 8:59 AM | 13 (3.8%) | 23 (5.7%) |
| 9:00 AM to 9:59 AM | 41 (12.0%) | 38 (9.4%) |
| 10:00 AM to 10:59 AM | 0 (0.0%) | 8 (2.0%) |
| 11:00 AM to 11:59 AM | 22 (6.4%) | 10 (2.5%) |
| 12:00 PM to 3:59 PM | 38 (11.1%) | 33 (8.2%) |
| 4:00 PM to 11:59 PM | 38 (11.1%) | 44 (10.9%) |
| Total | 342 (100.0%) | 405 (100.0%) |
Housing Occupancy in Laurium
Occupancy by Ownership in Laurium
Of the total 733 dwellings in Laurium, owner-occupied units account for 522 (71.2%), while renter-occupied units make up 211 (28.8%).
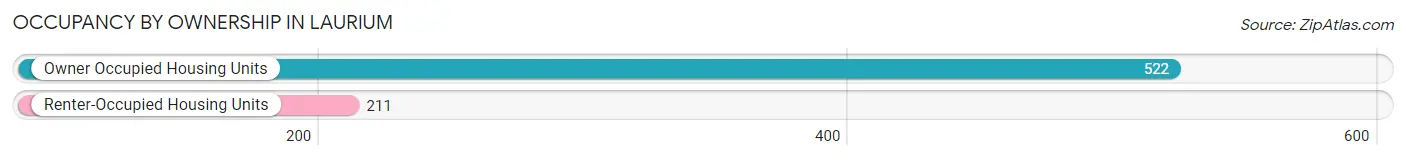
| Occupancy | # Housing Units | % Housing Units |
| Owner Occupied Housing Units | 522 | 71.2% |
| Renter-Occupied Housing Units | 211 | 28.8% |
| Total Occupied Housing Units | 733 | 100.0% |
Occupancy by Household Size in Laurium
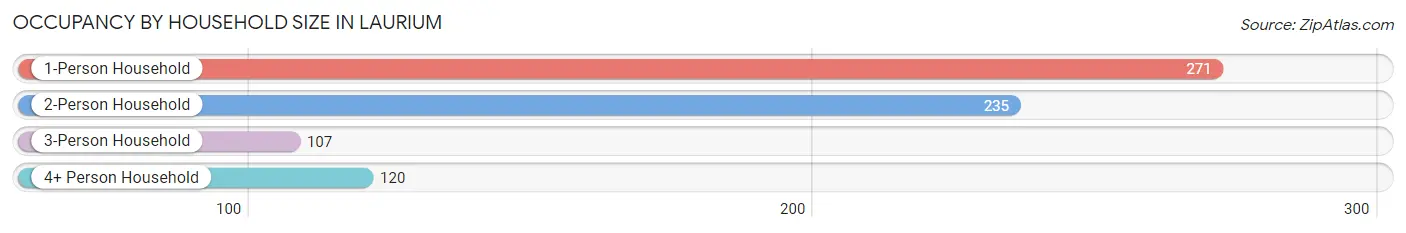
| Household Size | # Housing Units | % Housing Units |
| 1-Person Household | 271 | 37.0% |
| 2-Person Household | 235 | 32.1% |
| 3-Person Household | 107 | 14.6% |
| 4+ Person Household | 120 | 16.4% |
| Total Housing Units | 733 | 100.0% |
Occupancy by Ownership by Household Size in Laurium
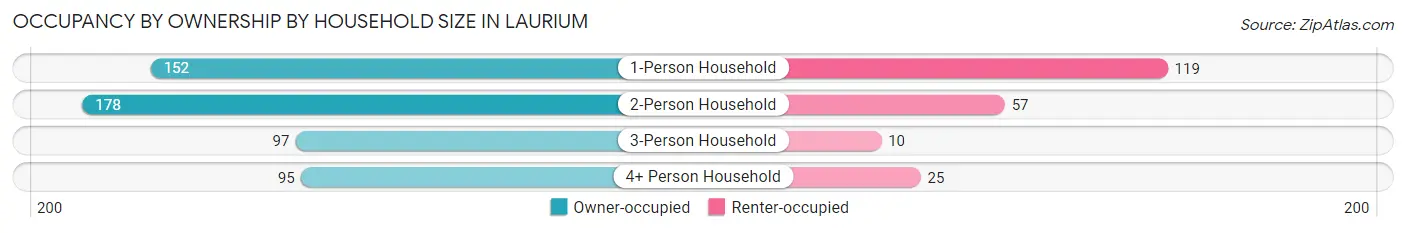
| Household Size | Owner-occupied | Renter-occupied |
| 1-Person Household | 152 (56.1%) | 119 (43.9%) |
| 2-Person Household | 178 (75.7%) | 57 (24.3%) |
| 3-Person Household | 97 (90.6%) | 10 (9.3%) |
| 4+ Person Household | 95 (79.2%) | 25 (20.8%) |
| Total Housing Units | 522 (71.2%) | 211 (28.8%) |
Occupancy by Educational Attainment in Laurium
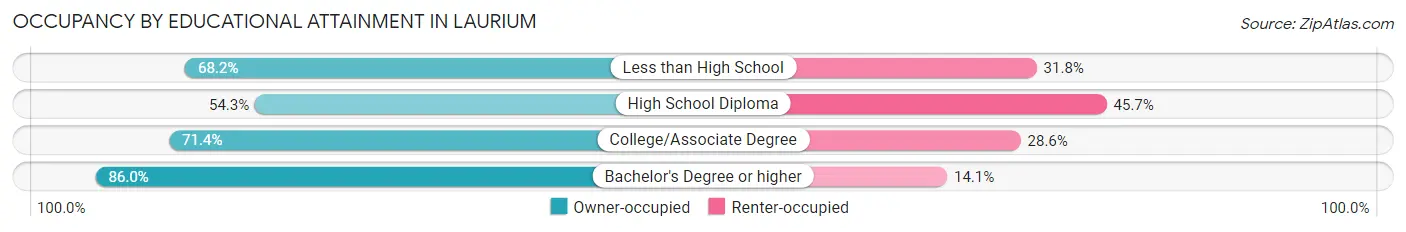
| Household Size | Owner-occupied | Renter-occupied |
| Less than High School | 60 (68.2%) | 28 (31.8%) |
| High School Diploma | 107 (54.3%) | 90 (45.7%) |
| College/Associate Degree | 147 (71.4%) | 59 (28.6%) |
| Bachelor's Degree or higher | 208 (86.0%) | 34 (14.1%) |
Occupancy by Age of Householder in Laurium
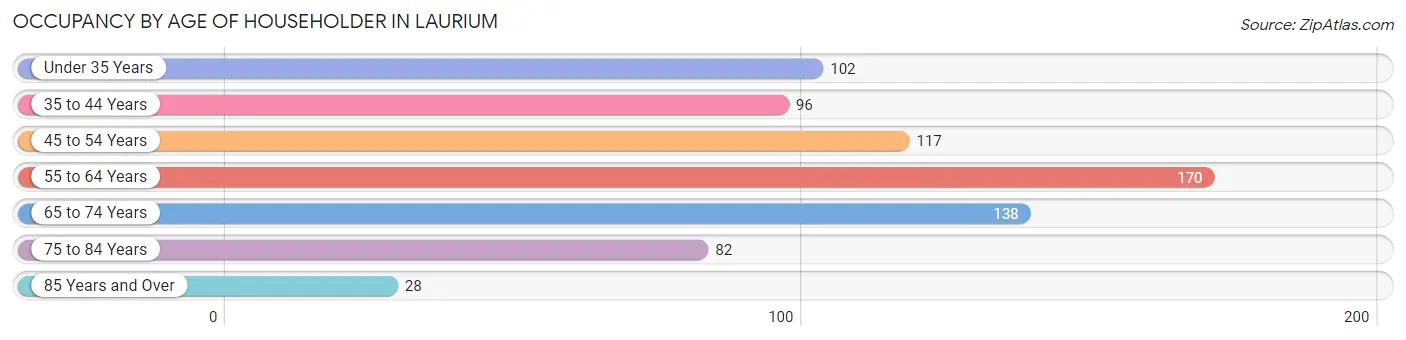
| Age Bracket | # Households | % Households |
| Under 35 Years | 102 | 13.9% |
| 35 to 44 Years | 96 | 13.1% |
| 45 to 54 Years | 117 | 16.0% |
| 55 to 64 Years | 170 | 23.2% |
| 65 to 74 Years | 138 | 18.8% |
| 75 to 84 Years | 82 | 11.2% |
| 85 Years and Over | 28 | 3.8% |
| Total | 733 | 100.0% |
Housing Finances in Laurium
Median Income by Occupancy in Laurium
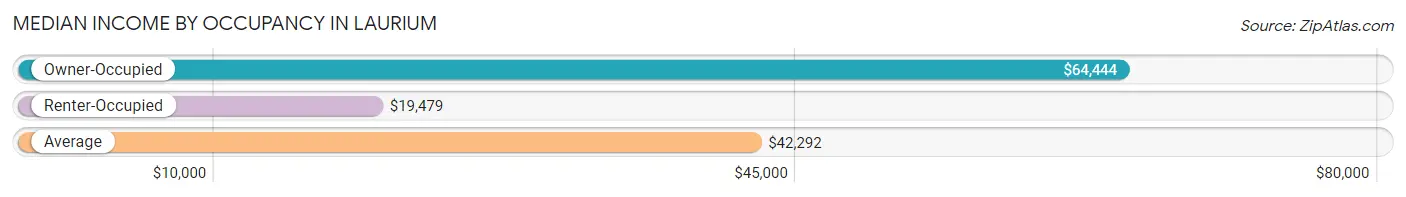
| Occupancy Type | # Households | Median Income |
| Owner-Occupied | 522 (71.2%) | $64,444 |
| Renter-Occupied | 211 (28.8%) | $19,479 |
| Average | 733 (100.0%) | $42,292 |
Occupancy by Householder Income Bracket in Laurium
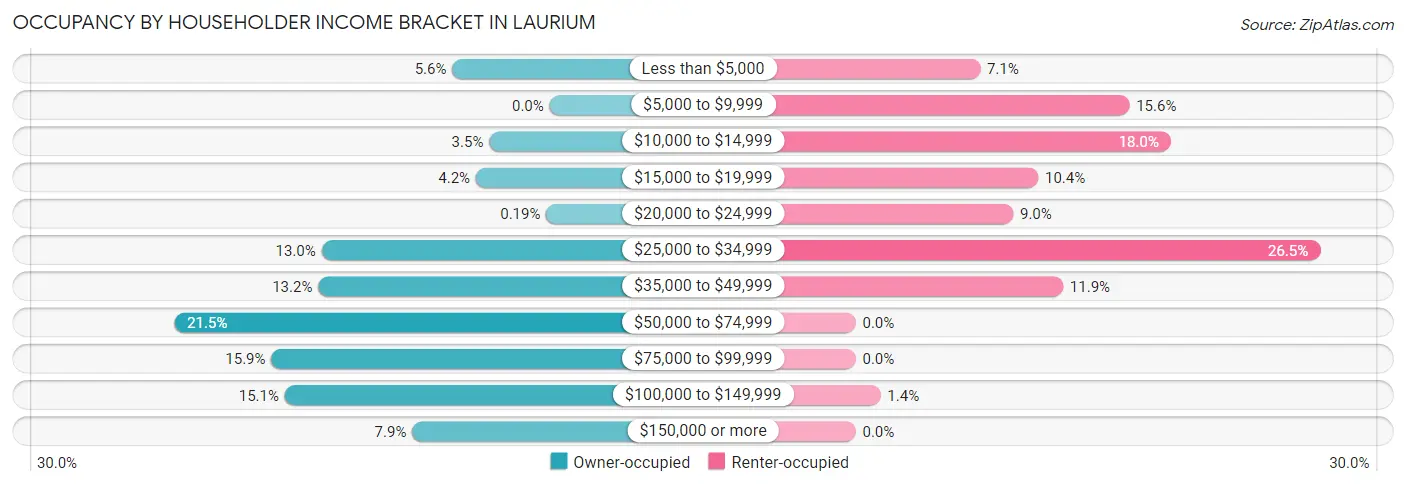
| Income Bracket | Owner-occupied | Renter-occupied |
| Less than $5,000 | 29 (5.6%) | 15 (7.1%) |
| $5,000 to $9,999 | 0 (0.0%) | 33 (15.6%) |
| $10,000 to $14,999 | 18 (3.5%) | 38 (18.0%) |
| $15,000 to $19,999 | 22 (4.2%) | 22 (10.4%) |
| $20,000 to $24,999 | 1 (0.2%) | 19 (9.0%) |
| $25,000 to $34,999 | 68 (13.0%) | 56 (26.5%) |
| $35,000 to $49,999 | 69 (13.2%) | 25 (11.8%) |
| $50,000 to $74,999 | 112 (21.5%) | 0 (0.0%) |
| $75,000 to $99,999 | 83 (15.9%) | 0 (0.0%) |
| $100,000 to $149,999 | 79 (15.1%) | 3 (1.4%) |
| $150,000 or more | 41 (7.9%) | 0 (0.0%) |
| Total | 522 (100.0%) | 211 (100.0%) |
Monthly Housing Cost Tiers in Laurium
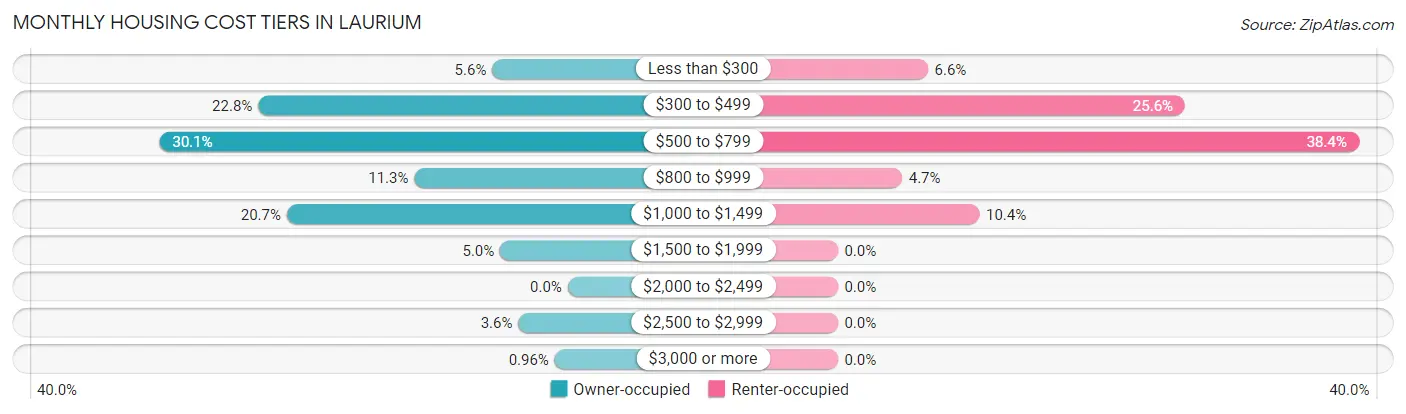
| Monthly Cost | Owner-occupied | Renter-occupied |
| Less than $300 | 29 (5.6%) | 14 (6.6%) |
| $300 to $499 | 119 (22.8%) | 54 (25.6%) |
| $500 to $799 | 157 (30.1%) | 81 (38.4%) |
| $800 to $999 | 59 (11.3%) | 10 (4.7%) |
| $1,000 to $1,499 | 108 (20.7%) | 22 (10.4%) |
| $1,500 to $1,999 | 26 (5.0%) | 0 (0.0%) |
| $2,000 to $2,499 | 0 (0.0%) | 0 (0.0%) |
| $2,500 to $2,999 | 19 (3.6%) | 0 (0.0%) |
| $3,000 or more | 5 (1.0%) | 0 (0.0%) |
| Total | 522 (100.0%) | 211 (100.0%) |
Physical Housing Characteristics in Laurium
Housing Structures in Laurium
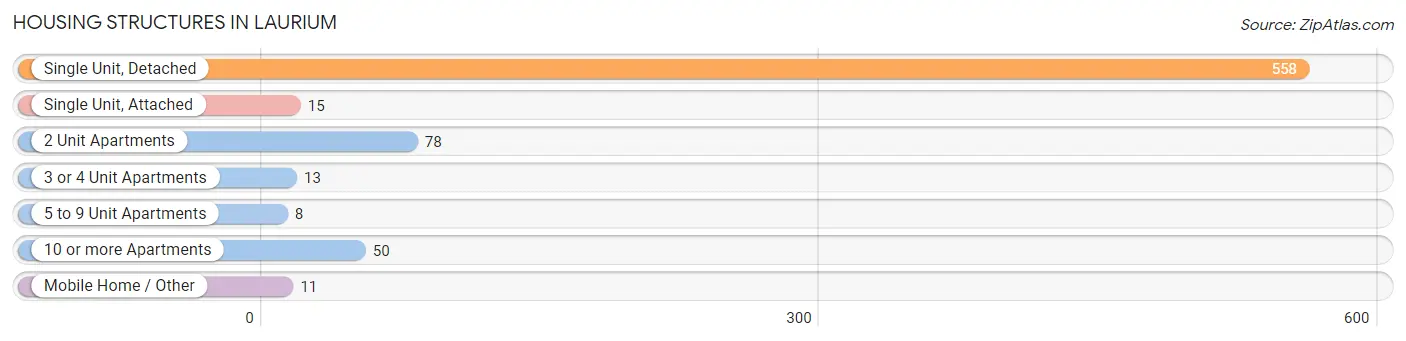
| Structure Type | # Housing Units | % Housing Units |
| Single Unit, Detached | 558 | 76.1% |
| Single Unit, Attached | 15 | 2.1% |
| 2 Unit Apartments | 78 | 10.6% |
| 3 or 4 Unit Apartments | 13 | 1.8% |
| 5 to 9 Unit Apartments | 8 | 1.1% |
| 10 or more Apartments | 50 | 6.8% |
| Mobile Home / Other | 11 | 1.5% |
| Total | 733 | 100.0% |
Housing Structures by Occupancy in Laurium
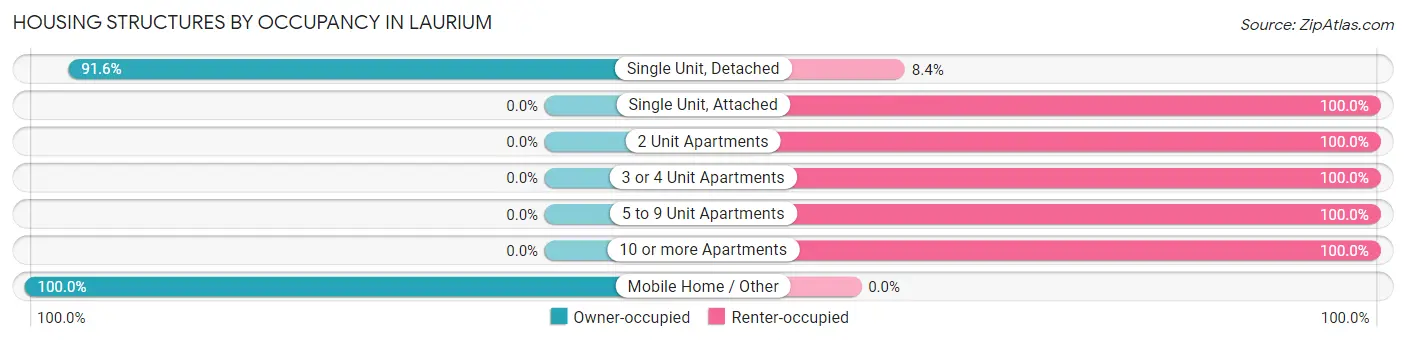
| Structure Type | Owner-occupied | Renter-occupied |
| Single Unit, Detached | 511 (91.6%) | 47 (8.4%) |
| Single Unit, Attached | 0 (0.0%) | 15 (100.0%) |
| 2 Unit Apartments | 0 (0.0%) | 78 (100.0%) |
| 3 or 4 Unit Apartments | 0 (0.0%) | 13 (100.0%) |
| 5 to 9 Unit Apartments | 0 (0.0%) | 8 (100.0%) |
| 10 or more Apartments | 0 (0.0%) | 50 (100.0%) |
| Mobile Home / Other | 11 (100.0%) | 0 (0.0%) |
| Total | 522 (71.2%) | 211 (28.8%) |
Housing Structures by Number of Rooms in Laurium
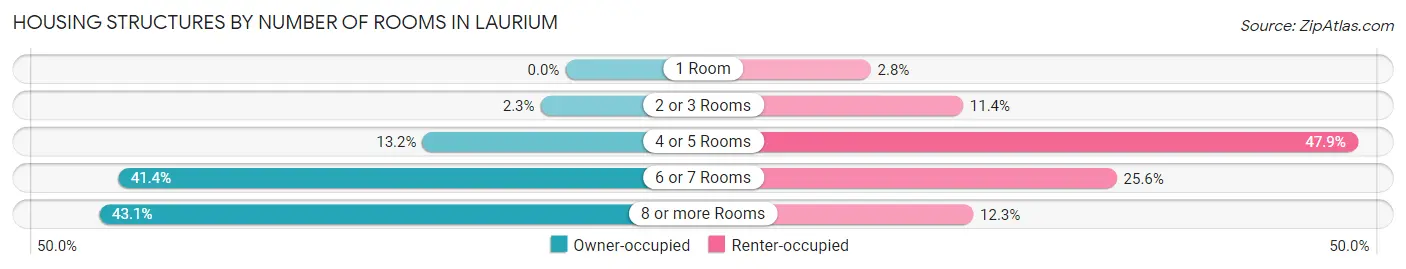
| Number of Rooms | Owner-occupied | Renter-occupied |
| 1 Room | 0 (0.0%) | 6 (2.8%) |
| 2 or 3 Rooms | 12 (2.3%) | 24 (11.4%) |
| 4 or 5 Rooms | 69 (13.2%) | 101 (47.9%) |
| 6 or 7 Rooms | 216 (41.4%) | 54 (25.6%) |
| 8 or more Rooms | 225 (43.1%) | 26 (12.3%) |
| Total | 522 (100.0%) | 211 (100.0%) |
Housing Structure by Heating Type in Laurium
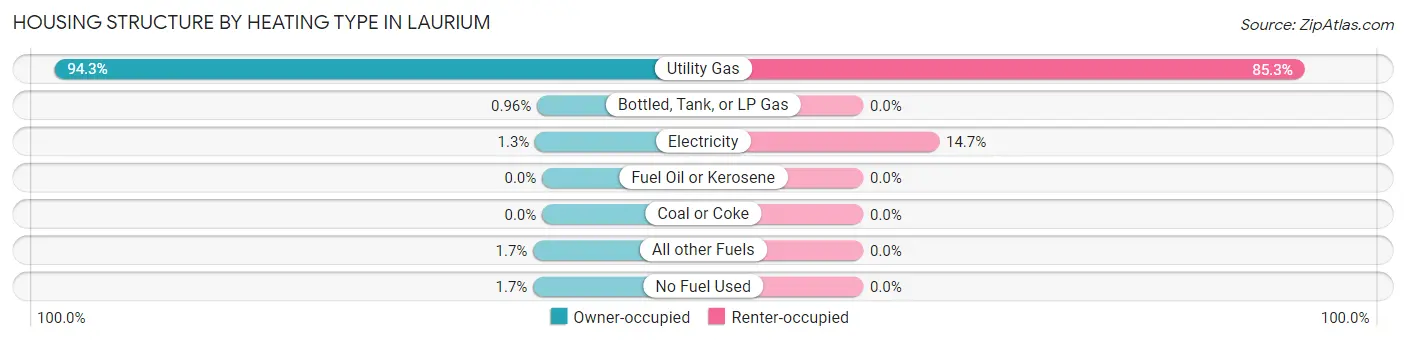
| Heating Type | Owner-occupied | Renter-occupied |
| Utility Gas | 492 (94.3%) | 180 (85.3%) |
| Bottled, Tank, or LP Gas | 5 (1.0%) | 0 (0.0%) |
| Electricity | 7 (1.3%) | 31 (14.7%) |
| Fuel Oil or Kerosene | 0 (0.0%) | 0 (0.0%) |
| Coal or Coke | 0 (0.0%) | 0 (0.0%) |
| All other Fuels | 9 (1.7%) | 0 (0.0%) |
| No Fuel Used | 9 (1.7%) | 0 (0.0%) |
| Total | 522 (100.0%) | 211 (100.0%) |
Household Vehicle Usage in Laurium
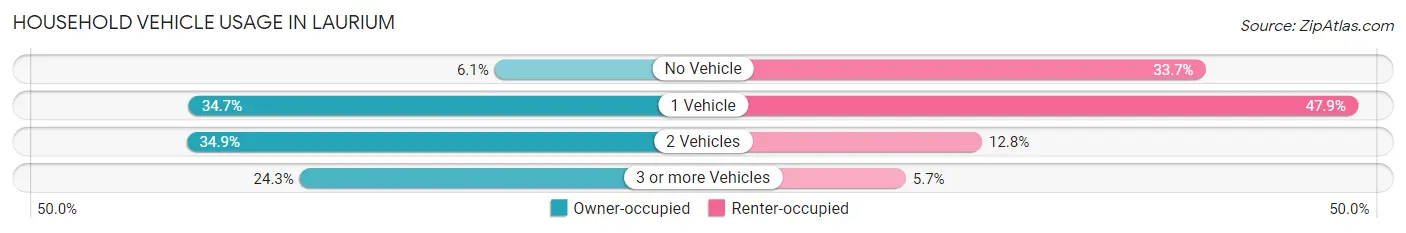
| Vehicles per Household | Owner-occupied | Renter-occupied |
| No Vehicle | 32 (6.1%) | 71 (33.7%) |
| 1 Vehicle | 181 (34.7%) | 101 (47.9%) |
| 2 Vehicles | 182 (34.9%) | 27 (12.8%) |
| 3 or more Vehicles | 127 (24.3%) | 12 (5.7%) |
| Total | 522 (100.0%) | 211 (100.0%) |
Real Estate & Mortgages in Laurium
Real Estate and Mortgage Overview in Laurium
| Characteristic | Without Mortgage | With Mortgage |
| Housing Units | 255 | 267 |
| Median Property Value | $87,500 | $89,600 |
| Median Household Income | $58,672 | $22 |
| Monthly Housing Costs | $481 | $5 |
| Real Estate Taxes | $1,181 | $0 |
Property Value by Mortgage Status in Laurium
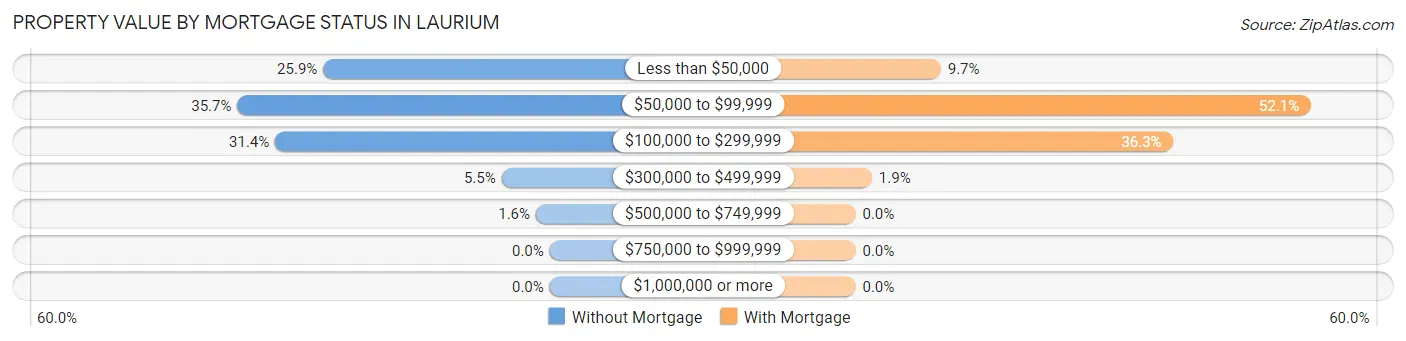
| Property Value | Without Mortgage | With Mortgage |
| Less than $50,000 | 66 (25.9%) | 26 (9.7%) |
| $50,000 to $99,999 | 91 (35.7%) | 139 (52.1%) |
| $100,000 to $299,999 | 80 (31.4%) | 97 (36.3%) |
| $300,000 to $499,999 | 14 (5.5%) | 5 (1.9%) |
| $500,000 to $749,999 | 4 (1.6%) | 0 (0.0%) |
| $750,000 to $999,999 | 0 (0.0%) | 0 (0.0%) |
| $1,000,000 or more | 0 (0.0%) | 0 (0.0%) |
| Total | 255 (100.0%) | 267 (100.0%) |
Household Income by Mortgage Status in Laurium
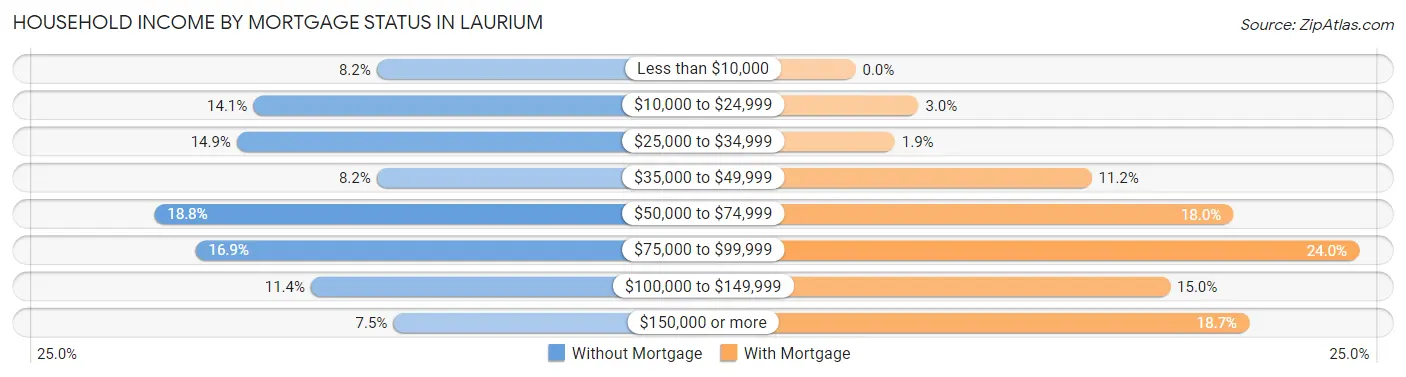
| Household Income | Without Mortgage | With Mortgage |
| Less than $10,000 | 21 (8.2%) | 0 (0.0%) |
| $10,000 to $24,999 | 36 (14.1%) | 8 (3.0%) |
| $25,000 to $34,999 | 38 (14.9%) | 5 (1.9%) |
| $35,000 to $49,999 | 21 (8.2%) | 30 (11.2%) |
| $50,000 to $74,999 | 48 (18.8%) | 48 (18.0%) |
| $75,000 to $99,999 | 43 (16.9%) | 64 (24.0%) |
| $100,000 to $149,999 | 29 (11.4%) | 40 (15.0%) |
| $150,000 or more | 19 (7.4%) | 50 (18.7%) |
| Total | 255 (100.0%) | 267 (100.0%) |
Property Value to Household Income Ratio in Laurium
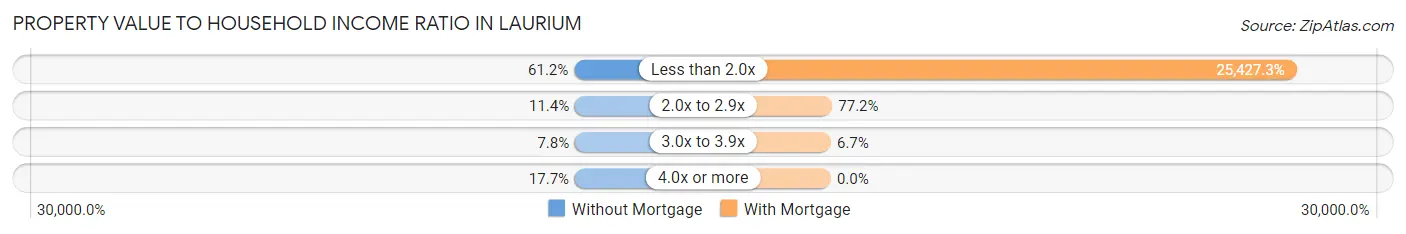
| Value-to-Income Ratio | Without Mortgage | With Mortgage |
| Less than 2.0x | 156 (61.2%) | 67,891 (25,427.3%) |
| 2.0x to 2.9x | 29 (11.4%) | 206 (77.1%) |
| 3.0x to 3.9x | 20 (7.8%) | 18 (6.7%) |
| 4.0x or more | 45 (17.6%) | 0 (0.0%) |
| Total | 255 (100.0%) | 267 (100.0%) |
Real Estate Taxes by Mortgage Status in Laurium
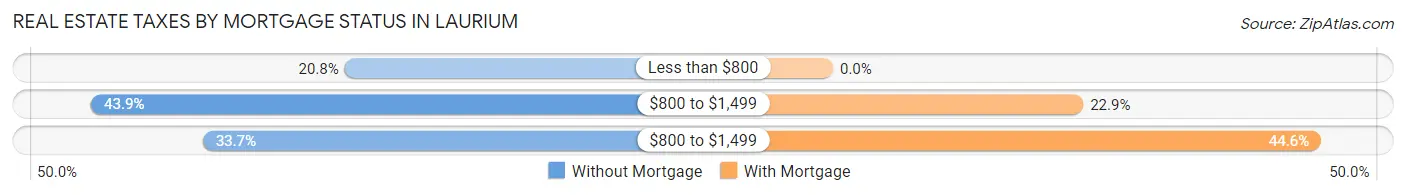
| Property Taxes | Without Mortgage | With Mortgage |
| Less than $800 | 53 (20.8%) | 0 (0.0%) |
| $800 to $1,499 | 112 (43.9%) | 61 (22.9%) |
| $800 to $1,499 | 86 (33.7%) | 119 (44.6%) |
| Total | 255 (100.0%) | 267 (100.0%) |
Health & Disability in Laurium
Health Insurance Coverage by Age in Laurium
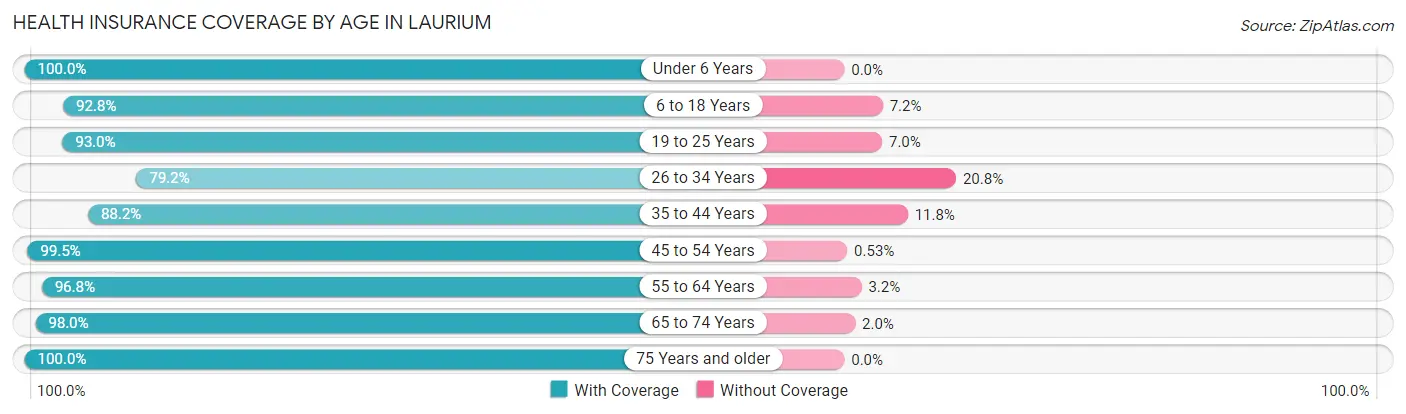
| Age Bracket | With Coverage | Without Coverage |
| Under 6 Years | 79 (100.0%) | 0 (0.0%) |
| 6 to 18 Years | 298 (92.8%) | 23 (7.2%) |
| 19 to 25 Years | 198 (93.0%) | 15 (7.0%) |
| 26 to 34 Years | 57 (79.2%) | 15 (20.8%) |
| 35 to 44 Years | 179 (88.2%) | 24 (11.8%) |
| 45 to 54 Years | 189 (99.5%) | 1 (0.5%) |
| 55 to 64 Years | 242 (96.8%) | 8 (3.2%) |
| 65 to 74 Years | 195 (98.0%) | 4 (2.0%) |
| 75 Years and older | 142 (100.0%) | 0 (0.0%) |
| Total | 1,579 (94.6%) | 90 (5.4%) |
Health Insurance Coverage by Citizenship Status in Laurium
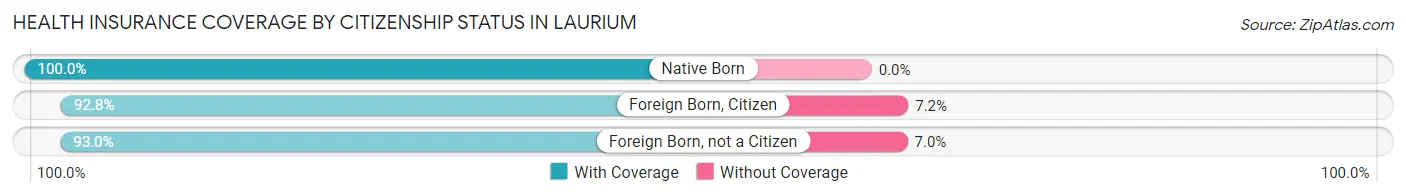
| Citizenship Status | With Coverage | Without Coverage |
| Native Born | 79 (100.0%) | 0 (0.0%) |
| Foreign Born, Citizen | 298 (92.8%) | 23 (7.2%) |
| Foreign Born, not a Citizen | 198 (93.0%) | 15 (7.0%) |
Health Insurance Coverage by Household Income in Laurium
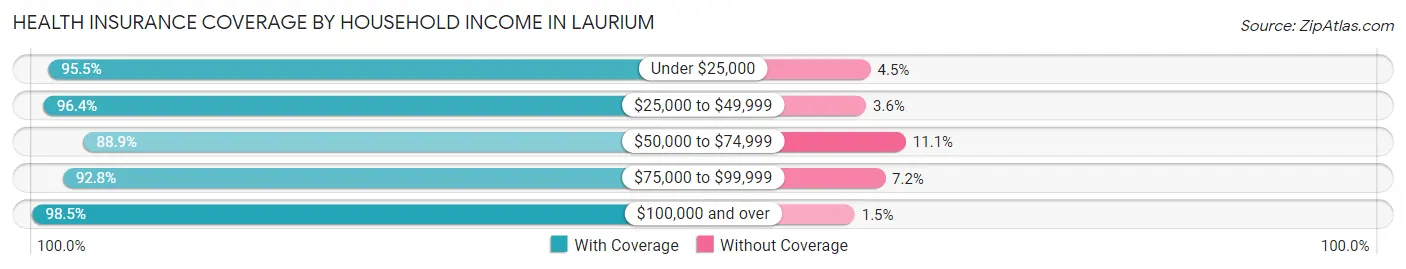
| Household Income | With Coverage | Without Coverage |
| Under $25,000 | 321 (95.5%) | 15 (4.5%) |
| $25,000 to $49,999 | 453 (96.4%) | 17 (3.6%) |
| $50,000 to $74,999 | 257 (88.9%) | 32 (11.1%) |
| $75,000 to $99,999 | 285 (92.8%) | 22 (7.2%) |
| $100,000 and over | 263 (98.5%) | 4 (1.5%) |
Public vs Private Health Insurance Coverage by Age in Laurium
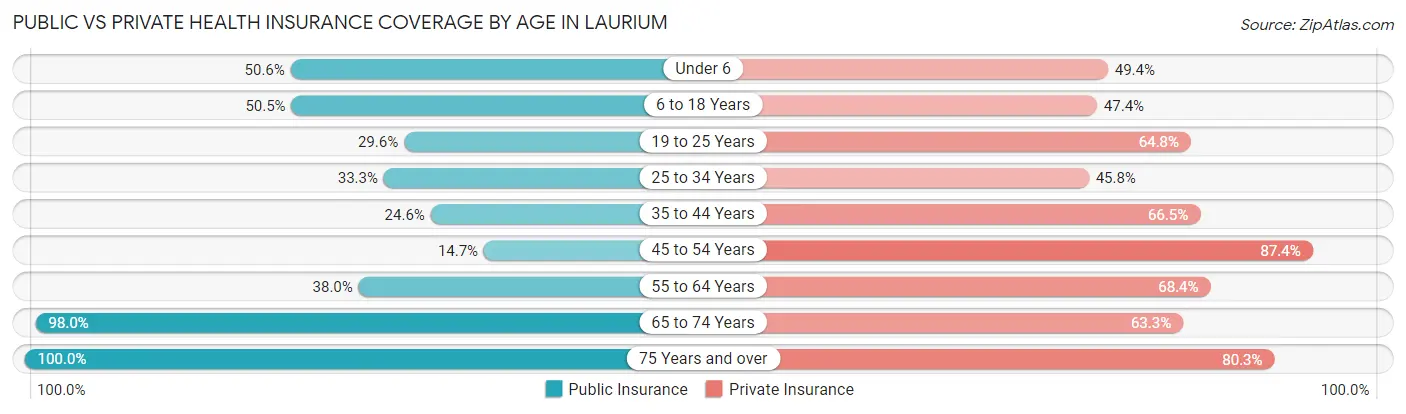
| Age Bracket | Public Insurance | Private Insurance |
| Under 6 | 40 (50.6%) | 39 (49.4%) |
| 6 to 18 Years | 162 (50.5%) | 152 (47.3%) |
| 19 to 25 Years | 63 (29.6%) | 138 (64.8%) |
| 25 to 34 Years | 24 (33.3%) | 33 (45.8%) |
| 35 to 44 Years | 50 (24.6%) | 135 (66.5%) |
| 45 to 54 Years | 28 (14.7%) | 166 (87.4%) |
| 55 to 64 Years | 95 (38.0%) | 171 (68.4%) |
| 65 to 74 Years | 195 (98.0%) | 126 (63.3%) |
| 75 Years and over | 142 (100.0%) | 114 (80.3%) |
| Total | 799 (47.9%) | 1,074 (64.3%) |
Disability Status by Sex by Age in Laurium
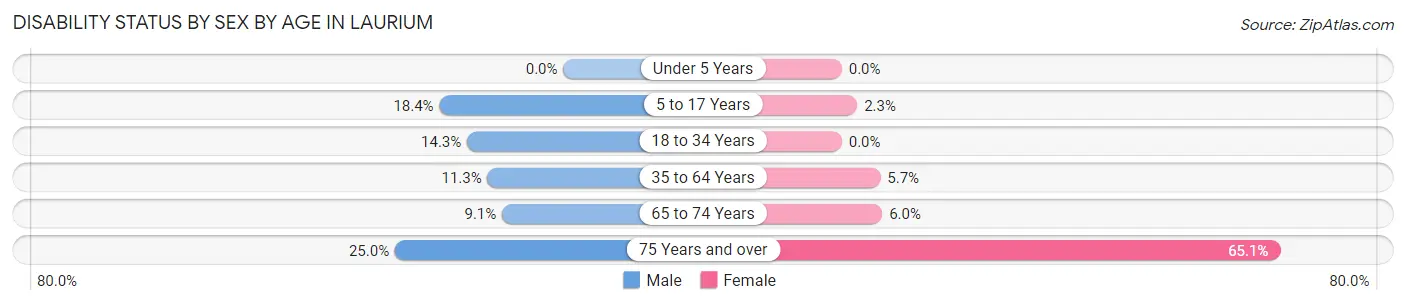
| Age Bracket | Male | Female |
| Under 5 Years | 0 (0.0%) | 0 (0.0%) |
| 5 to 17 Years | 23 (18.4%) | 4 (2.3%) |
| 18 to 34 Years | 18 (14.3%) | 0 (0.0%) |
| 35 to 64 Years | 37 (11.3%) | 18 (5.7%) |
| 65 to 74 Years | 9 (9.1%) | 6 (6.0%) |
| 75 Years and over | 9 (25.0%) | 69 (65.1%) |
Disability Class by Sex by Age in Laurium
Disability Class: Hearing Difficulty
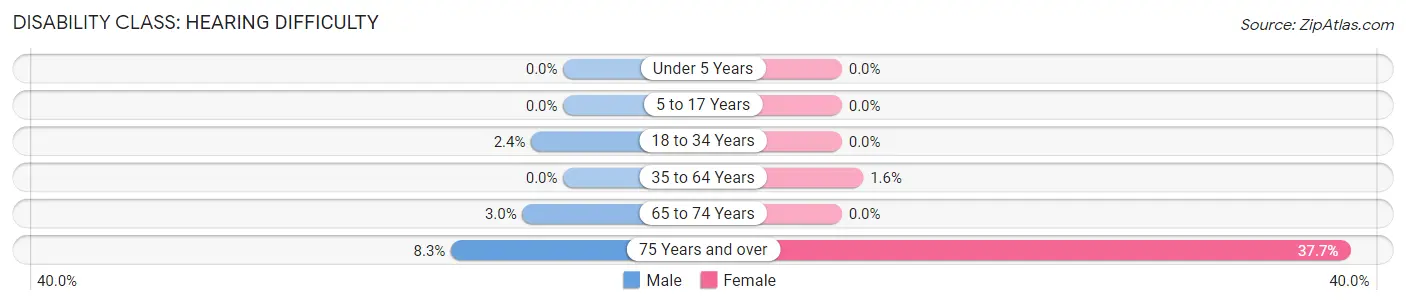
| Age Bracket | Male | Female |
| Under 5 Years | 0 (0.0%) | 0 (0.0%) |
| 5 to 17 Years | 0 (0.0%) | 0 (0.0%) |
| 18 to 34 Years | 3 (2.4%) | 0 (0.0%) |
| 35 to 64 Years | 0 (0.0%) | 5 (1.6%) |
| 65 to 74 Years | 3 (3.0%) | 0 (0.0%) |
| 75 Years and over | 3 (8.3%) | 40 (37.7%) |
Disability Class: Vision Difficulty
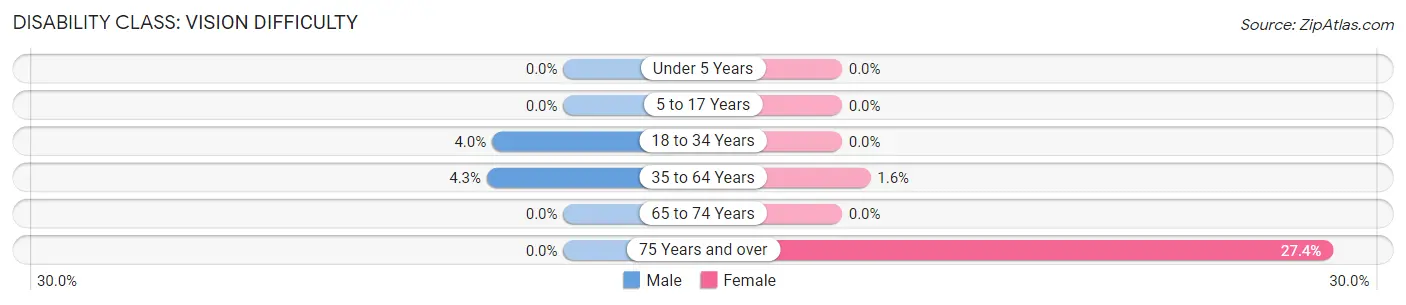
| Age Bracket | Male | Female |
| Under 5 Years | 0 (0.0%) | 0 (0.0%) |
| 5 to 17 Years | 0 (0.0%) | 0 (0.0%) |
| 18 to 34 Years | 5 (4.0%) | 0 (0.0%) |
| 35 to 64 Years | 14 (4.3%) | 5 (1.6%) |
| 65 to 74 Years | 0 (0.0%) | 0 (0.0%) |
| 75 Years and over | 0 (0.0%) | 29 (27.4%) |
Disability Class: Cognitive Difficulty
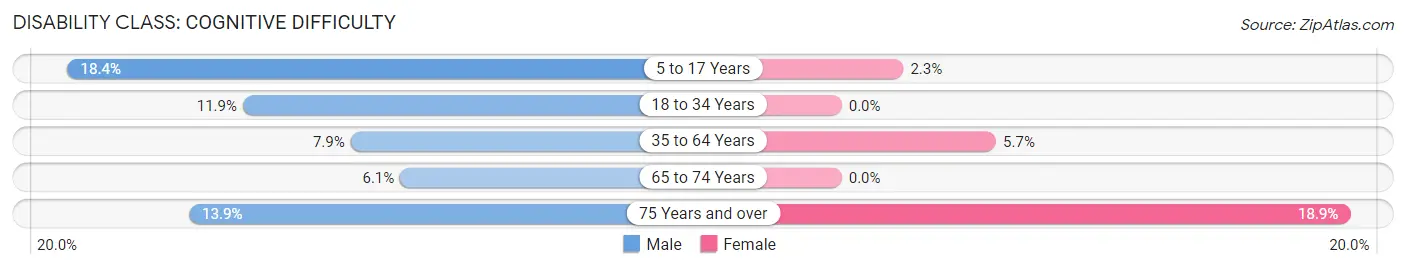
| Age Bracket | Male | Female |
| 5 to 17 Years | 23 (18.4%) | 4 (2.3%) |
| 18 to 34 Years | 15 (11.9%) | 0 (0.0%) |
| 35 to 64 Years | 26 (7.9%) | 18 (5.7%) |
| 65 to 74 Years | 6 (6.1%) | 0 (0.0%) |
| 75 Years and over | 5 (13.9%) | 20 (18.9%) |
Disability Class: Ambulatory Difficulty
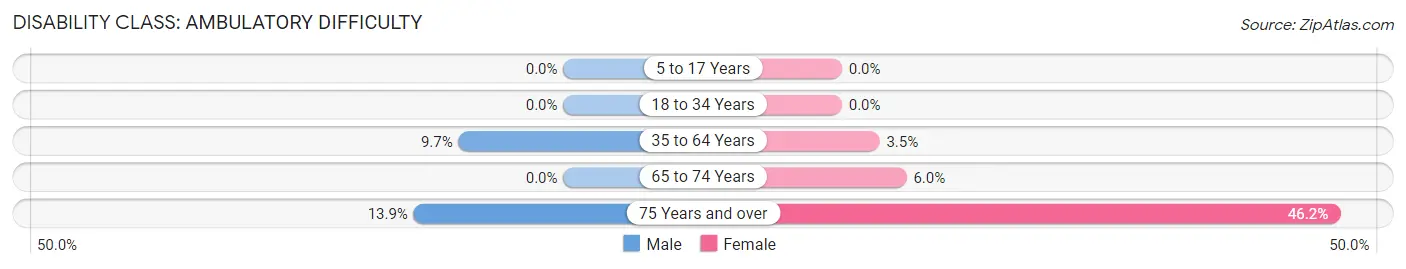
| Age Bracket | Male | Female |
| 5 to 17 Years | 0 (0.0%) | 0 (0.0%) |
| 18 to 34 Years | 0 (0.0%) | 0 (0.0%) |
| 35 to 64 Years | 32 (9.7%) | 11 (3.5%) |
| 65 to 74 Years | 0 (0.0%) | 6 (6.0%) |
| 75 Years and over | 5 (13.9%) | 49 (46.2%) |
Disability Class: Self-Care Difficulty
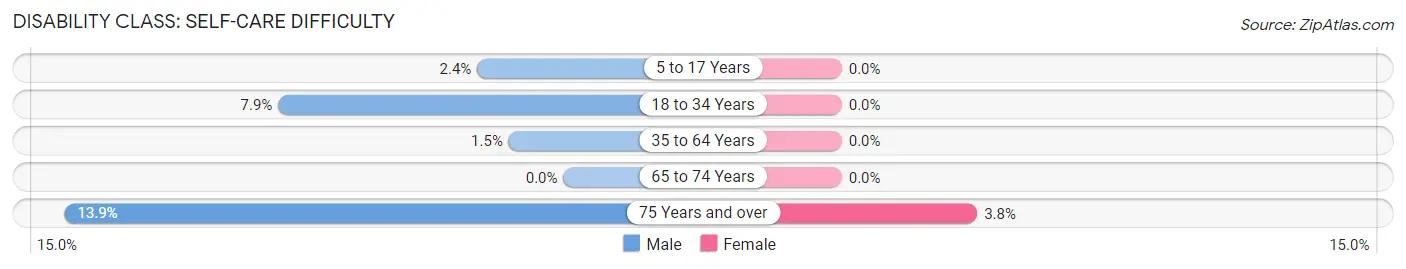
| Age Bracket | Male | Female |
| 5 to 17 Years | 3 (2.4%) | 0 (0.0%) |
| 18 to 34 Years | 10 (7.9%) | 0 (0.0%) |
| 35 to 64 Years | 5 (1.5%) | 0 (0.0%) |
| 65 to 74 Years | 0 (0.0%) | 0 (0.0%) |
| 75 Years and over | 5 (13.9%) | 4 (3.8%) |
Technology Access in Laurium
Computing Device Access in Laurium
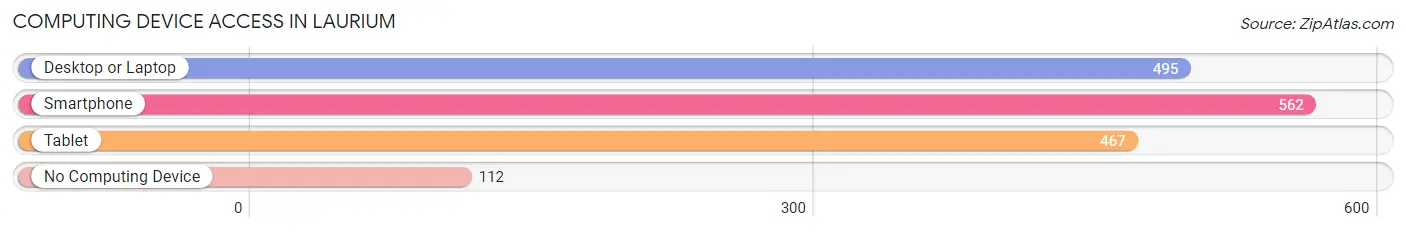
| Device Type | # Households | % Households |
| Desktop or Laptop | 495 | 67.5% |
| Smartphone | 562 | 76.7% |
| Tablet | 467 | 63.7% |
| No Computing Device | 112 | 15.3% |
| Total | 733 | 100.0% |
Internet Access in Laurium
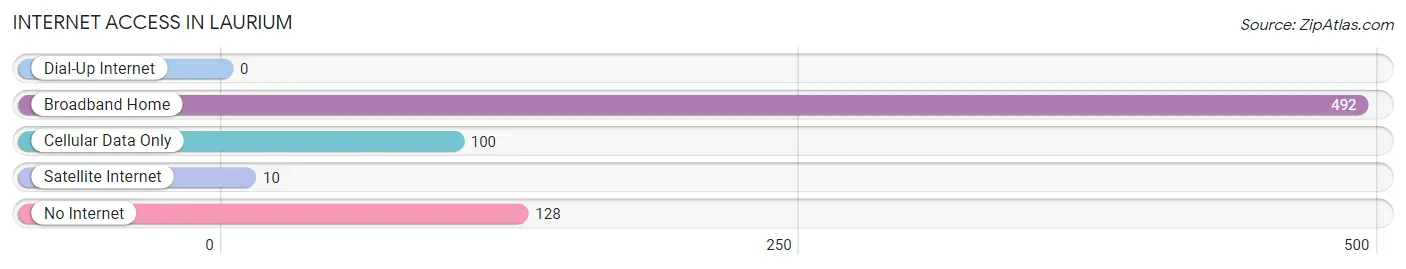
| Internet Type | # Households | % Households |
| Dial-Up Internet | 0 | 0.0% |
| Broadband Home | 492 | 67.1% |
| Cellular Data Only | 100 | 13.6% |
| Satellite Internet | 10 | 1.4% |
| No Internet | 128 | 17.5% |
| Total | 733 | 100.0% |
Laurium Summary
Laurium is a village located in Houghton County, Michigan, United States. It is situated on the Keweenaw Peninsula, which is the northernmost part of Michigan’s Upper Peninsula. The village is located on the shore of Lake Superior, and is part of the Copper Country region. The population of Laurium was 2,126 at the 2010 census.
History
The area that is now Laurium was originally inhabited by the Ojibwe people. The first European settlers arrived in the area in the late 1800s, and the village was officially incorporated in 1891. The village was named after the ancient Greek city of Laurium, which was known for its rich deposits of silver and copper.
The village was founded by the Calumet and Hecla Mining Company, which was one of the largest copper mining companies in the world at the time. The company built a smelter in Laurium to process the copper ore that was mined in the area. The smelter was in operation until the early 1900s, when the copper industry began to decline.
The village of Laurium was also home to a number of other industries, including lumbering, fishing, and tourism. The village was a popular destination for tourists, who came to enjoy the scenic beauty of the area.
Geography
Laurium is located in the Keweenaw Peninsula, which is the northernmost part of Michigan’s Upper Peninsula. The village is situated on the shore of Lake Superior, and is part of the Copper Country region. The village is located about 25 miles (40 km) northwest of Houghton, the county seat.
The village is located in a hilly area, with elevations ranging from 600 to 900 feet (180 to 270 m). The village is surrounded by forests, and is home to a number of lakes and streams. The climate in Laurium is classified as humid continental, with cold winters and warm summers.
Economy
The economy of Laurium is largely based on tourism and recreation. The village is home to a number of resorts and hotels, as well as restaurants and other businesses that cater to tourists. The village is also home to a number of small businesses, including retail stores, auto repair shops, and other service-oriented businesses.
The village is also home to a number of manufacturing companies, including a paper mill and a furniture factory. The village is also home to a number of mining companies, which are involved in the extraction of copper, iron, and other minerals.
Demographics
As of the 2010 census, the population of Laurium was 2,126. The racial makeup of the village was 97.2% White, 0.7% African American, 0.3% Native American, 0.2% Asian, 0.1% Pacific Islander, 0.3% from other races, and 1.3% from two or more races. Hispanic or Latino of any race were 1.2% of the population.
The median income for a household in the village was $37,917, and the median income for a family was $45,000. The per capita income for the village was $19,945. About 11.2% of families and 14.2% of the population were below the poverty line, including 19.2% of those under age 18 and 8.2% of those age 65 or over.
Common Questions
What is Per Capita Income in Laurium?
Per Capita income in Laurium is $26,889.
What is the Median Family Income in Laurium?
Median Family Income in Laurium is $67,656.
What is the Median Household income in Laurium?
Median Household Income in Laurium is $42,292.
What is Income or Wage Gap in Laurium?
Income or Wage Gap in Laurium is 45.9%.
Women in Laurium earn 54.1 cents for every dollar earned by a man.
What is Family Income Deficit in Laurium?
Family Income Deficit in Laurium is $11,178.
Families that are below poverty line in Laurium earn $11,178 less on average than the poverty threshold level.
What is Inequality or Gini Index in Laurium?
Inequality or Gini Index in Laurium is 0.46.
What is the Total Population of Laurium?
Total Population of Laurium is 1,669.
What is the Total Male Population of Laurium?
Total Male Population of Laurium is 748.
What is the Total Female Population of Laurium?
Total Female Population of Laurium is 921.
What is the Ratio of Males per 100 Females in Laurium?
There are 81.22 Males per 100 Females in Laurium.
What is the Ratio of Females per 100 Males in Laurium?
There are 123.13 Females per 100 Males in Laurium.
What is the Median Population Age in Laurium?
Median Population Age in Laurium is 44.1 Years.
What is the Average Family Size in Laurium
Average Family Size in Laurium is 3.1 People.
What is the Average Household Size in Laurium
Average Household Size in Laurium is 2.3 People.
How Large is the Labor Force in Laurium?
There are 832 People in the Labor Forcein in Laurium.
What is the Percentage of People in the Labor Force in Laurium?
61.6% of People are in the Labor Force in Laurium.
What is the Unemployment Rate in Laurium?
Unemployment Rate in Laurium is 2.6%.