Grand Haven, MI Map & Demographics
Grand Haven Map
Grand Haven Overview
$38,487
PER CAPITA INCOME
$79,489
AVG FAMILY INCOME
$57,650
AVG HOUSEHOLD INCOME
47.0%
WAGE / INCOME GAP [ % ]
53.0¢/ $1
WAGE / INCOME GAP [ $ ]
$10,914
FAMILY INCOME DEFICIT
0.47
INEQUALITY / GINI INDEX
10,961
TOTAL POPULATION
5,101
MALE POPULATION
5,860
FEMALE POPULATION
87.05
MALES / 100 FEMALES
114.88
FEMALES / 100 MALES
43.7
MEDIAN AGE
2.7
AVG FAMILY SIZE
2.1
AVG HOUSEHOLD SIZE
5,385
LABOR FORCE [ PEOPLE ]
58.6%
PERCENT IN LABOR FORCE
5.1%
UNEMPLOYMENT RATE
Grand Haven Zip Codes
Grand Haven Area Codes
Income in Grand Haven
Income Overview in Grand Haven
Per Capita Income in Grand Haven is $38,487, while median incomes of families and households are $79,489 and $57,650 respectively.
| Characteristic | Number | Measure |
| Per Capita Income | 10,961 | $38,487 |
| Median Family Income | 3,098 | $79,489 |
| Mean Family Income | 3,098 | $101,413 |
| Median Household Income | 5,169 | $57,650 |
| Mean Household Income | 5,169 | $81,131 |
| Income Deficit | 3,098 | $10,914 |
| Wage / Income Gap (%) | 10,961 | 47.05% |
| Wage / Income Gap ($) | 10,961 | 52.95¢ per $1 |
| Gini / Inequality Index | 10,961 | 0.47 |
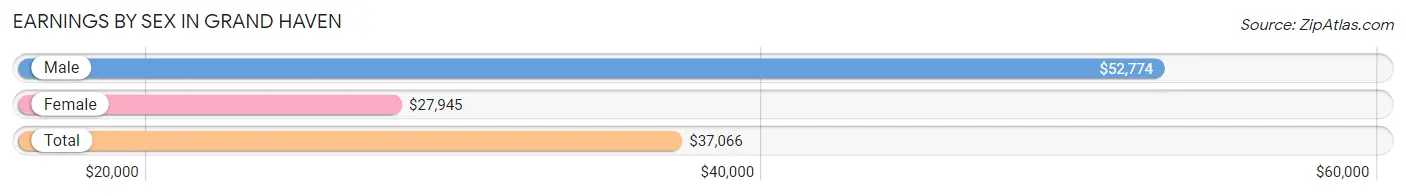
Earnings by Sex in Grand Haven
Average Earnings in Grand Haven are $37,066, $52,774 for men and $27,945 for women, a difference of 47.0%.
| Sex | Number | Average Earnings |
| Male | 2,888 (50.1%) | $52,774 |
| Female | 2,879 (49.9%) | $27,945 |
| Total | 5,767 (100.0%) | $37,066 |
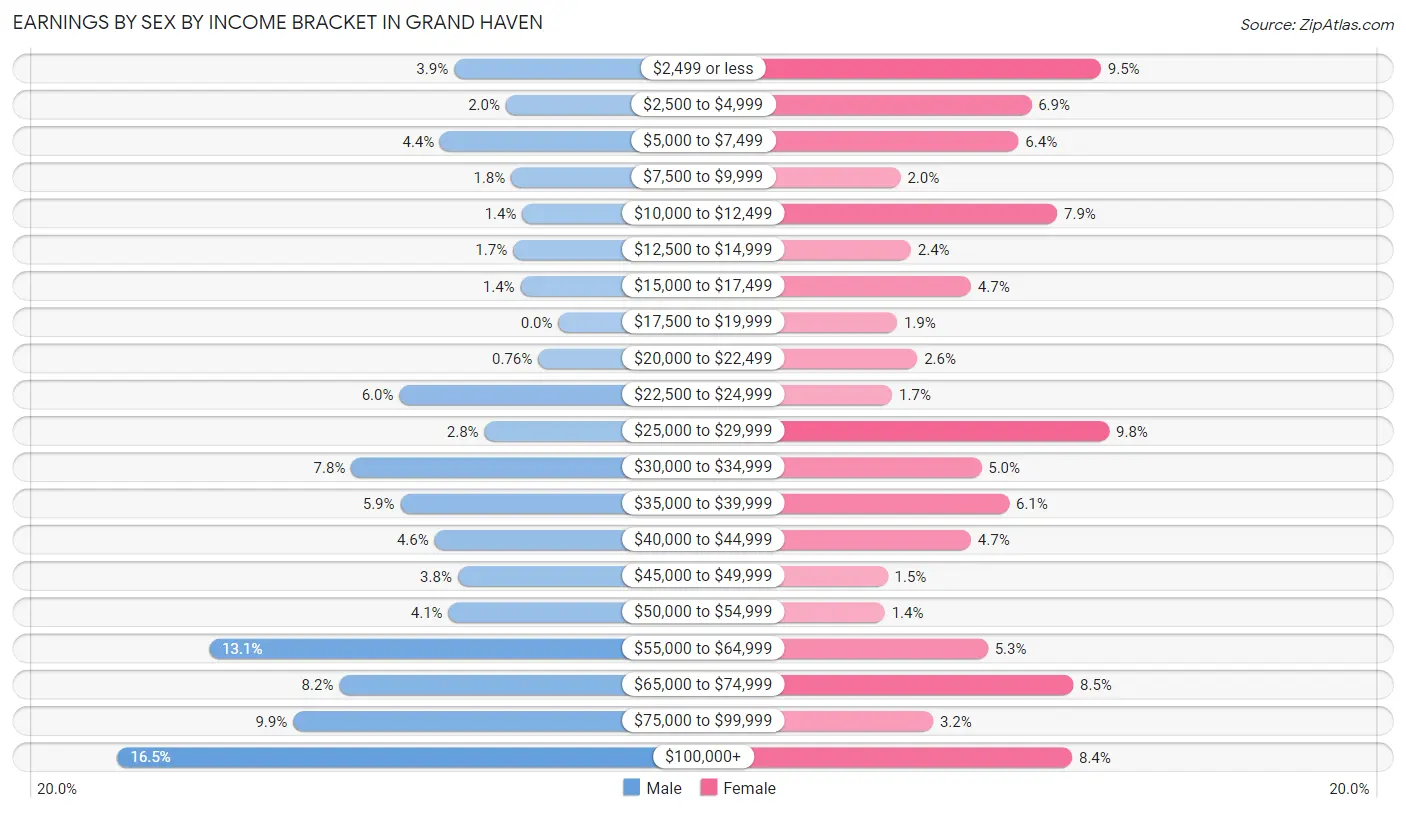
Earnings by Sex by Income Bracket in Grand Haven
The most common earnings brackets in Grand Haven are $100,000+ for men (477 | 16.5%) and $25,000 to $29,999 for women (283 | 9.8%).
| Income | Male | Female |
| $2,499 or less | 113 (3.9%) | 274 (9.5%) |
| $2,500 to $4,999 | 57 (2.0%) | 199 (6.9%) |
| $5,000 to $7,499 | 128 (4.4%) | 185 (6.4%) |
| $7,500 to $9,999 | 51 (1.8%) | 58 (2.0%) |
| $10,000 to $12,499 | 39 (1.3%) | 227 (7.9%) |
| $12,500 to $14,999 | 49 (1.7%) | 69 (2.4%) |
| $15,000 to $17,499 | 41 (1.4%) | 134 (4.6%) |
| $17,500 to $19,999 | 0 (0.0%) | 54 (1.9%) |
| $20,000 to $22,499 | 22 (0.8%) | 76 (2.6%) |
| $22,500 to $24,999 | 172 (6.0%) | 49 (1.7%) |
| $25,000 to $29,999 | 80 (2.8%) | 283 (9.8%) |
| $30,000 to $34,999 | 224 (7.8%) | 145 (5.0%) |
| $35,000 to $39,999 | 171 (5.9%) | 175 (6.1%) |
| $40,000 to $44,999 | 134 (4.6%) | 134 (4.6%) |
| $45,000 to $49,999 | 109 (3.8%) | 44 (1.5%) |
| $50,000 to $54,999 | 119 (4.1%) | 41 (1.4%) |
| $55,000 to $64,999 | 378 (13.1%) | 152 (5.3%) |
| $65,000 to $74,999 | 237 (8.2%) | 244 (8.5%) |
| $75,000 to $99,999 | 287 (9.9%) | 93 (3.2%) |
| $100,000+ | 477 (16.5%) | 243 (8.4%) |
| Total | 2,888 (100.0%) | 2,879 (100.0%) |
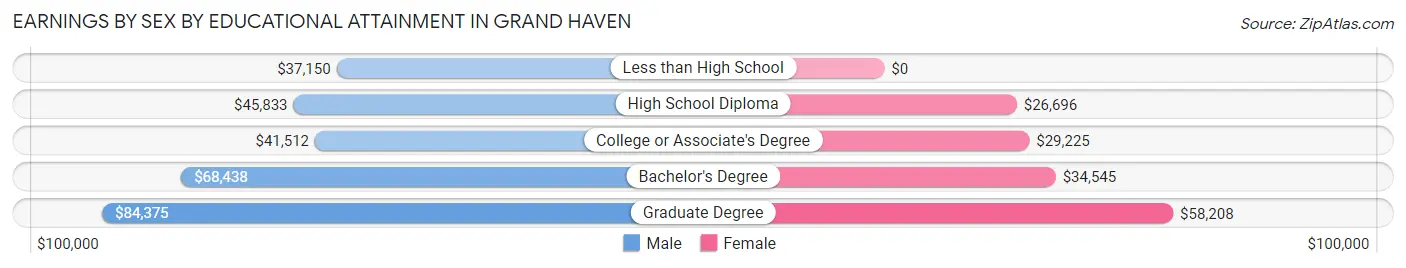
Earnings by Sex by Educational Attainment in Grand Haven
Average earnings in Grand Haven are $56,201 for men and $31,196 for women, a difference of 44.5%. Men with an educational attainment of graduate degree enjoy the highest average annual earnings of $84,375, while those with less than high school education earn the least with $37,150. Women with an educational attainment of graduate degree earn the most with the average annual earnings of $58,208, while those with high school diploma education have the smallest earnings of $26,696.
| Educational Attainment | Male Income | Female Income |
| Less than High School | $37,150 | $0 |
| High School Diploma | $45,833 | $26,696 |
| College or Associate's Degree | $41,512 | $29,225 |
| Bachelor's Degree | $68,438 | $34,545 |
| Graduate Degree | $84,375 | $58,208 |
| Total | $56,201 | $31,196 |
Family Income in Grand Haven
Family Income Brackets in Grand Haven
According to the Grand Haven family income data, there are 635 families falling into the $50,000 to $74,999 income range, which is the most common income bracket and makes up 20.5% of all families. Conversely, the $10,000 to $14,999 income bracket is the least frequent group with only 71 families (2.3%) belonging to this category.
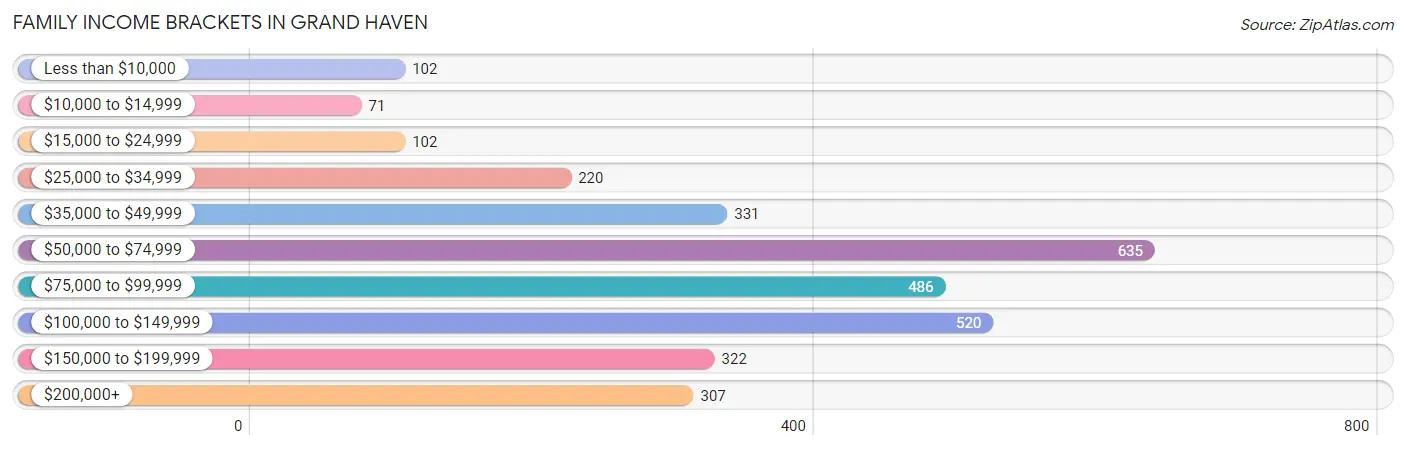
| Income Bracket | # Families | % Families |
| Less than $10,000 | 102 | 3.3% |
| $10,000 to $14,999 | 71 | 2.3% |
| $15,000 to $24,999 | 102 | 3.3% |
| $25,000 to $34,999 | 220 | 7.1% |
| $35,000 to $49,999 | 331 | 10.7% |
| $50,000 to $74,999 | 635 | 20.5% |
| $75,000 to $99,999 | 486 | 15.7% |
| $100,000 to $149,999 | 520 | 16.8% |
| $150,000 to $199,999 | 322 | 10.4% |
| $200,000+ | 307 | 9.9% |
Family Income by Famaliy Size in Grand Haven
4-person families (367 | 11.8%) account for the highest median family income in Grand Haven with $117,875 per family, while 2-person families (1,838 | 59.3%) have the highest median income of $34,938 per family member.
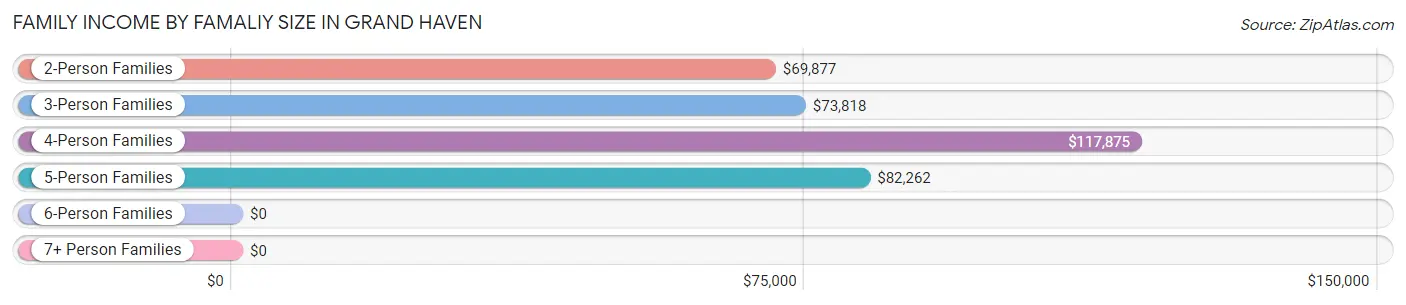
| Income Bracket | # Families | Median Income |
| 2-Person Families | 1,838 (59.3%) | $69,877 |
| 3-Person Families | 615 (19.9%) | $73,818 |
| 4-Person Families | 367 (11.8%) | $117,875 |
| 5-Person Families | 244 (7.9%) | $82,262 |
| 6-Person Families | 22 (0.7%) | $0 |
| 7+ Person Families | 12 (0.4%) | $0 |
| Total | 3,098 (100.0%) | $79,489 |
Family Income by Number of Earners in Grand Haven
The median family income in Grand Haven is $79,489, with families comprising 3+ earners (335) having the highest median family income of $178,523, while families with no earners (694) have the lowest median family income of $45,930, accounting for 10.8% and 22.4% of families, respectively.
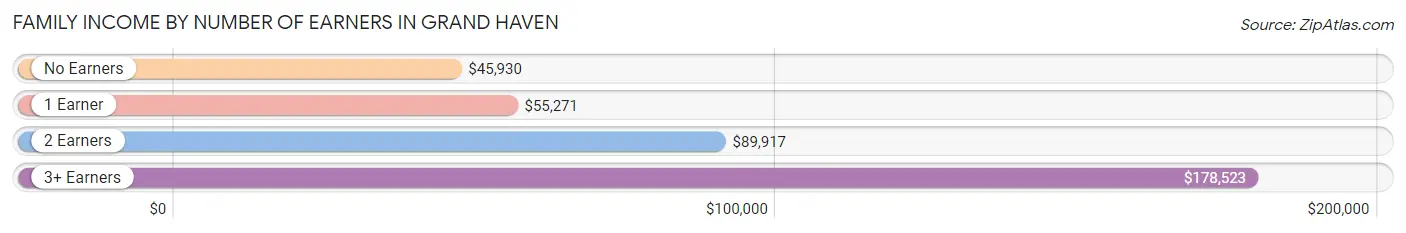
| Number of Earners | # Families | Median Income |
| No Earners | 694 (22.4%) | $45,930 |
| 1 Earner | 773 (24.9%) | $55,271 |
| 2 Earners | 1,296 (41.8%) | $89,917 |
| 3+ Earners | 335 (10.8%) | $178,523 |
| Total | 3,098 (100.0%) | $79,489 |
Household Income in Grand Haven
Household Income Brackets in Grand Haven
With 1,065 households falling in the category, the $50,000 to $74,999 income range is the most frequent in Grand Haven, accounting for 20.6% of all households. In contrast, only 227 households (4.4%) fall into the $10,000 to $14,999 income bracket, making it the least populous group.
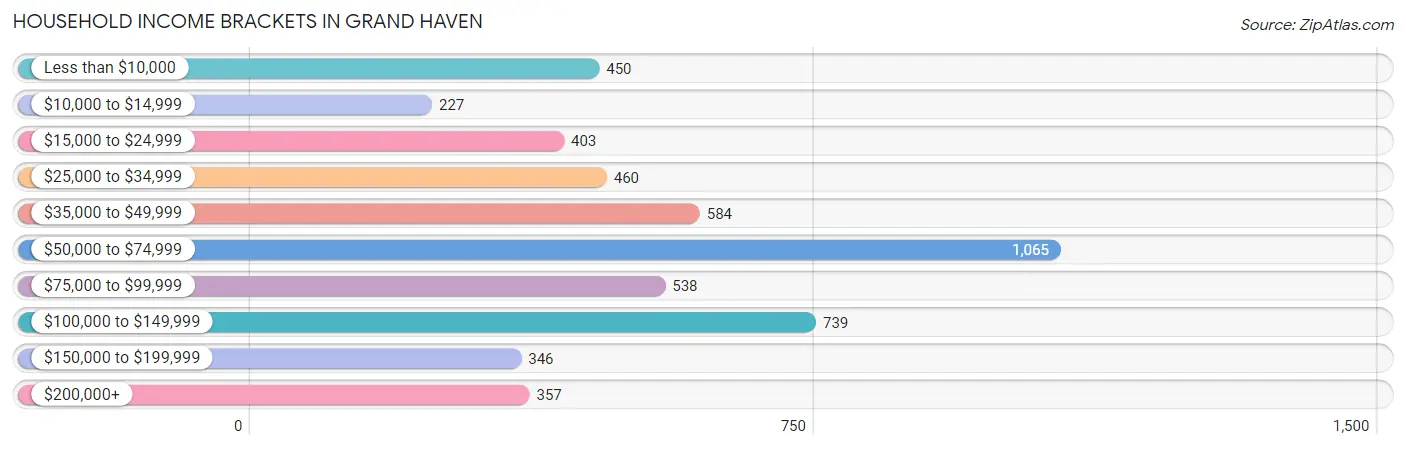
| Income Bracket | # Households | % Households |
| Less than $10,000 | 450 | 8.7% |
| $10,000 to $14,999 | 227 | 4.4% |
| $15,000 to $24,999 | 403 | 7.8% |
| $25,000 to $34,999 | 460 | 8.9% |
| $35,000 to $49,999 | 584 | 11.3% |
| $50,000 to $74,999 | 1,065 | 20.6% |
| $75,000 to $99,999 | 538 | 10.4% |
| $100,000 to $149,999 | 739 | 14.3% |
| $150,000 to $199,999 | 346 | 6.7% |
| $200,000+ | 357 | 6.9% |
Household Income by Householder Age in Grand Haven
The median household income in Grand Haven is $57,650, with the highest median household income of $81,136 found in the 45 to 64 years age bracket for the primary householder. A total of 1,494 households (28.9%) fall into this category. Meanwhile, the 15 to 24 years age bracket for the primary householder has the lowest median household income of $0, with 224 households (4.3%) in this group.
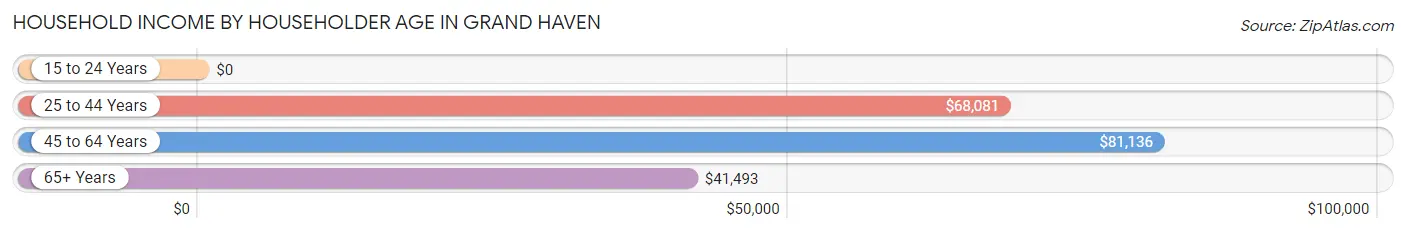
| Income Bracket | # Households | Median Income |
| 15 to 24 Years | 224 (4.3%) | $0 |
| 25 to 44 Years | 1,623 (31.4%) | $68,081 |
| 45 to 64 Years | 1,494 (28.9%) | $81,136 |
| 65+ Years | 1,828 (35.4%) | $41,493 |
| Total | 5,169 (100.0%) | $57,650 |
Poverty in Grand Haven
Income Below Poverty by Sex and Age in Grand Haven
With 5.9% poverty level for males and 17.5% for females among the residents of Grand Haven, 18 to 24 year old males and 15 year old females are the most vulnerable to poverty, with 93 males (28.3%) and 21 females (53.8%) in their respective age groups living below the poverty level.
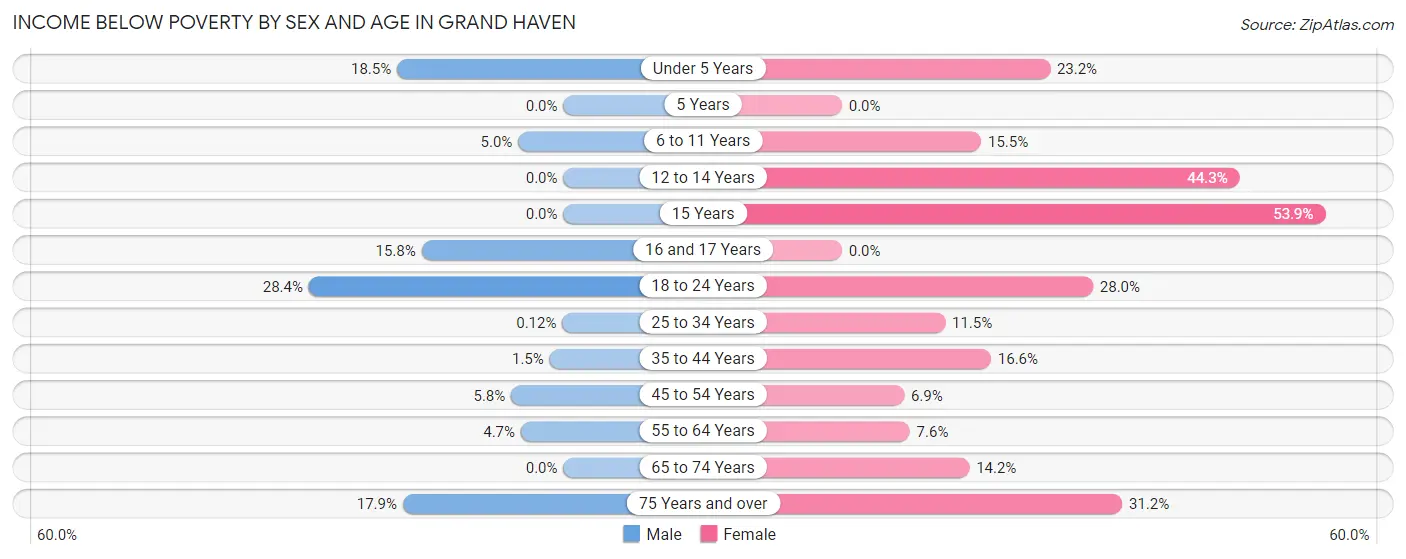
| Age Bracket | Male | Female |
| Under 5 Years | 25 (18.5%) | 67 (23.2%) |
| 5 Years | 0 (0.0%) | 0 (0.0%) |
| 6 to 11 Years | 20 (5.0%) | 47 (15.5%) |
| 12 to 14 Years | 0 (0.0%) | 93 (44.3%) |
| 15 Years | 0 (0.0%) | 21 (53.8%) |
| 16 and 17 Years | 12 (15.8%) | 0 (0.0%) |
| 18 to 24 Years | 93 (28.3%) | 144 (28.0%) |
| 25 to 34 Years | 1 (0.1%) | 104 (11.5%) |
| 35 to 44 Years | 9 (1.5%) | 87 (16.6%) |
| 45 to 54 Years | 33 (5.8%) | 42 (6.9%) |
| 55 to 64 Years | 36 (4.7%) | 47 (7.6%) |
| 65 to 74 Years | 0 (0.0%) | 123 (14.2%) |
| 75 Years and over | 64 (17.9%) | 235 (31.2%) |
| Total | 293 (5.9%) | 1,010 (17.5%) |
Income Above Poverty by Sex and Age in Grand Haven
According to the poverty statistics in Grand Haven, males aged 5 years and females aged 5 years are the age groups that are most secure financially, with 100.0% of males and 100.0% of females in these age groups living above the poverty line.
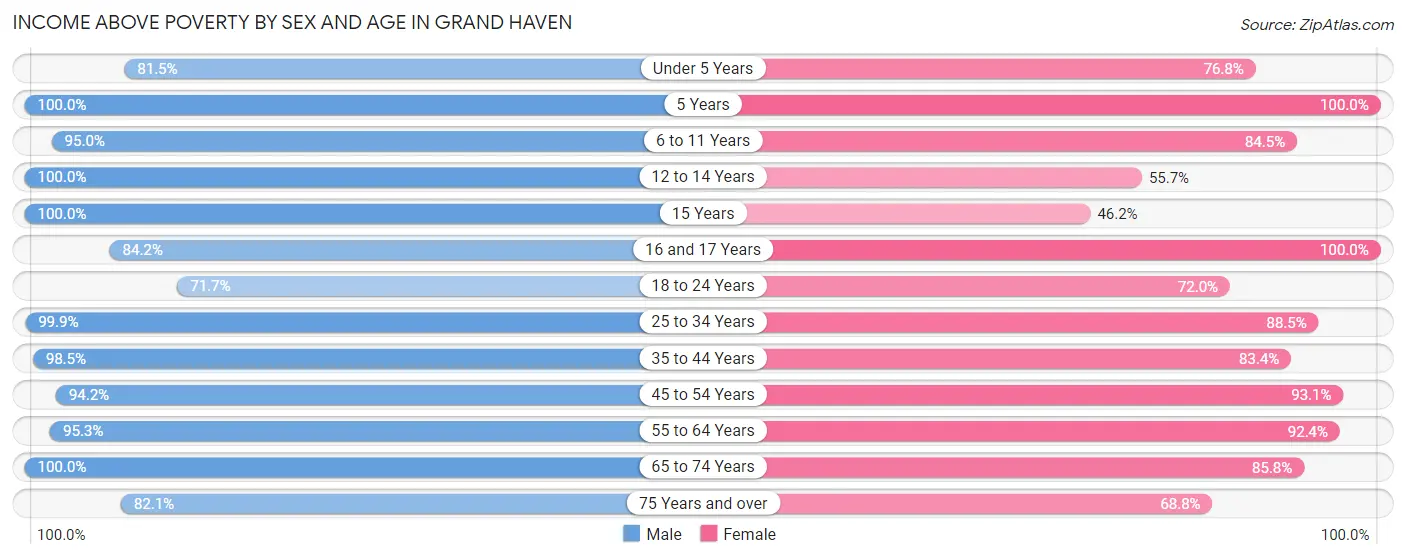
| Age Bracket | Male | Female |
| Under 5 Years | 110 (81.5%) | 222 (76.8%) |
| 5 Years | 89 (100.0%) | 57 (100.0%) |
| 6 to 11 Years | 378 (95.0%) | 256 (84.5%) |
| 12 to 14 Years | 189 (100.0%) | 117 (55.7%) |
| 15 Years | 18 (100.0%) | 18 (46.2%) |
| 16 and 17 Years | 64 (84.2%) | 66 (100.0%) |
| 18 to 24 Years | 235 (71.7%) | 371 (72.0%) |
| 25 to 34 Years | 842 (99.9%) | 800 (88.5%) |
| 35 to 44 Years | 581 (98.5%) | 437 (83.4%) |
| 45 to 54 Years | 534 (94.2%) | 565 (93.1%) |
| 55 to 64 Years | 725 (95.3%) | 575 (92.4%) |
| 65 to 74 Years | 632 (100.0%) | 744 (85.8%) |
| 75 Years and over | 294 (82.1%) | 518 (68.8%) |
| Total | 4,691 (94.1%) | 4,746 (82.5%) |
Income Below Poverty Among Married-Couple Families in Grand Haven
The poverty statistics for married-couple families in Grand Haven show that 2.7% or 62 of the total 2,264 families live below the poverty line. Families with 5 or more children have the highest poverty rate of 100.0%, comprising of 12 families. On the other hand, families with 1 or 2 children have the lowest poverty rate of 0.0%, which includes 0 families.
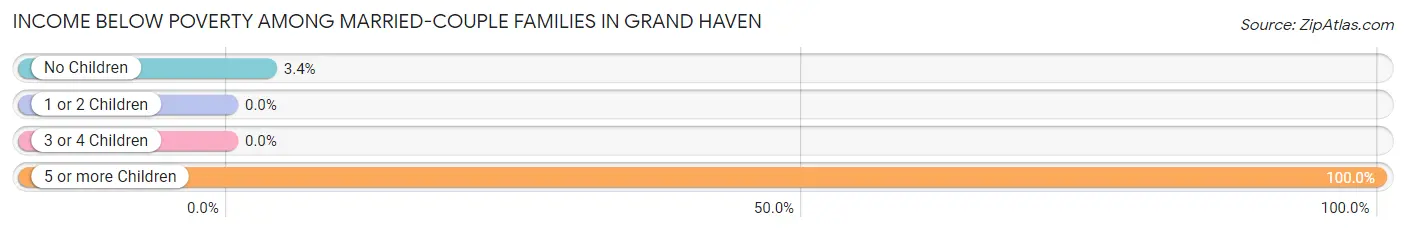
| Children | Above Poverty | Below Poverty |
| No Children | 1,430 (96.6%) | 50 (3.4%) |
| 1 or 2 Children | 605 (100.0%) | 0 (0.0%) |
| 3 or 4 Children | 167 (100.0%) | 0 (0.0%) |
| 5 or more Children | 0 (0.0%) | 12 (100.0%) |
| Total | 2,202 (97.3%) | 62 (2.7%) |
Income Below Poverty Among Single-Parent Households in Grand Haven
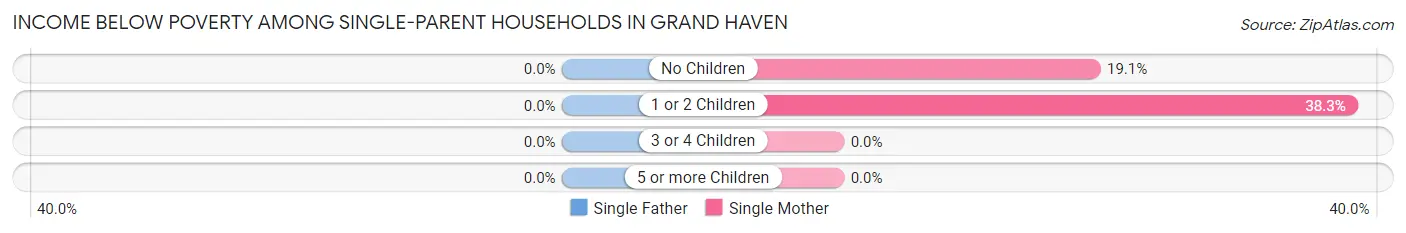
| Children | Single Father | Single Mother |
| No Children | 0 (0.0%) | 55 (19.1%) |
| 1 or 2 Children | 0 (0.0%) | 129 (38.3%) |
| 3 or 4 Children | 0 (0.0%) | 0 (0.0%) |
| 5 or more Children | 0 (0.0%) | 0 (0.0%) |
| Total | 0 (0.0%) | 184 (29.4%) |
Income Below Poverty Among Married-Couple vs Single-Parent Households in Grand Haven
The poverty data for Grand Haven shows that 62 of the married-couple family households (2.7%) and 184 of the single-parent households (22.1%) are living below the poverty level. Within the married-couple family households, those with 5 or more children have the highest poverty rate, with 12 households (100.0%) falling below the poverty line. Among the single-parent households, those with 1 or 2 children have the highest poverty rate, with 129 household (34.3%) living below poverty.
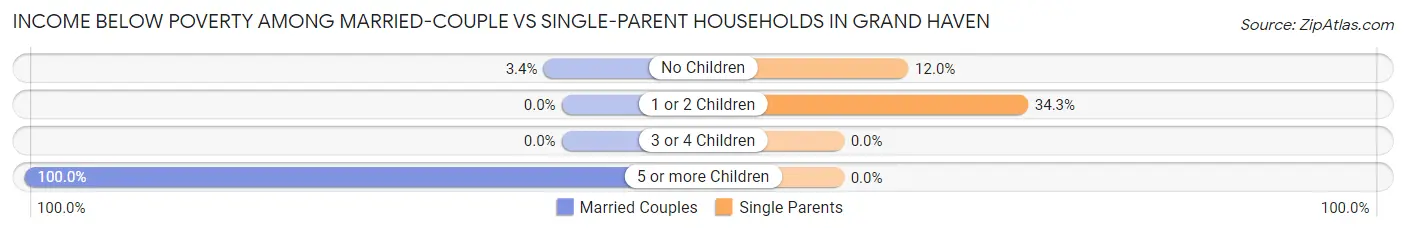
| Children | Married-Couple Families | Single-Parent Households |
| No Children | 50 (3.4%) | 55 (12.0%) |
| 1 or 2 Children | 0 (0.0%) | 129 (34.3%) |
| 3 or 4 Children | 0 (0.0%) | 0 (0.0%) |
| 5 or more Children | 12 (100.0%) | 0 (0.0%) |
| Total | 62 (2.7%) | 184 (22.1%) |
Race in Grand Haven
The most populous races in Grand Haven are White / Caucasian (10,167 | 92.8%), Hispanic or Latino (560 | 5.1%), and Two or more Races (495 | 4.5%).
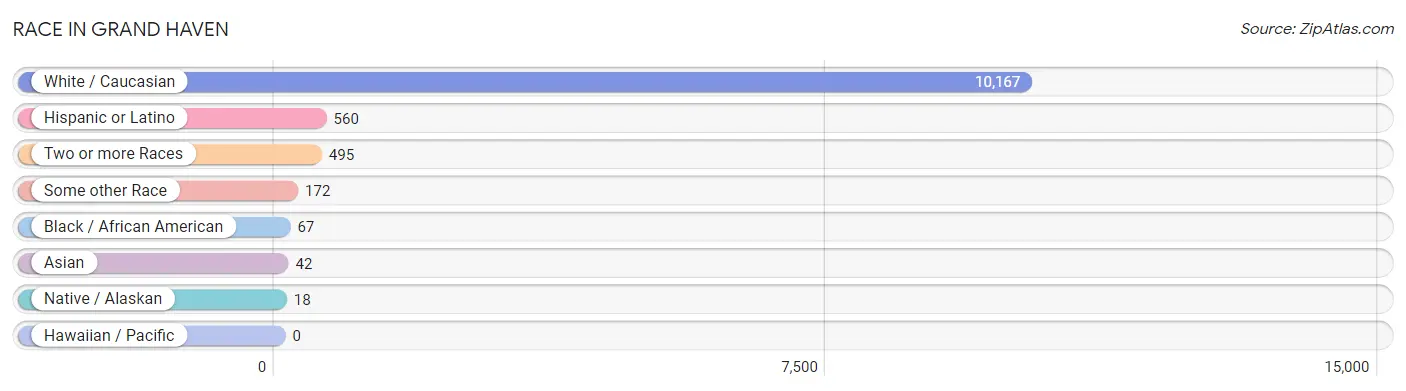
| Race | # Population | % Population |
| Asian | 42 | 0.4% |
| Black / African American | 67 | 0.6% |
| Hawaiian / Pacific | 0 | 0.0% |
| Hispanic or Latino | 560 | 5.1% |
| Native / Alaskan | 18 | 0.2% |
| White / Caucasian | 10,167 | 92.8% |
| Two or more Races | 495 | 4.5% |
| Some other Race | 172 | 1.6% |
| Total | 10,961 | 100.0% |
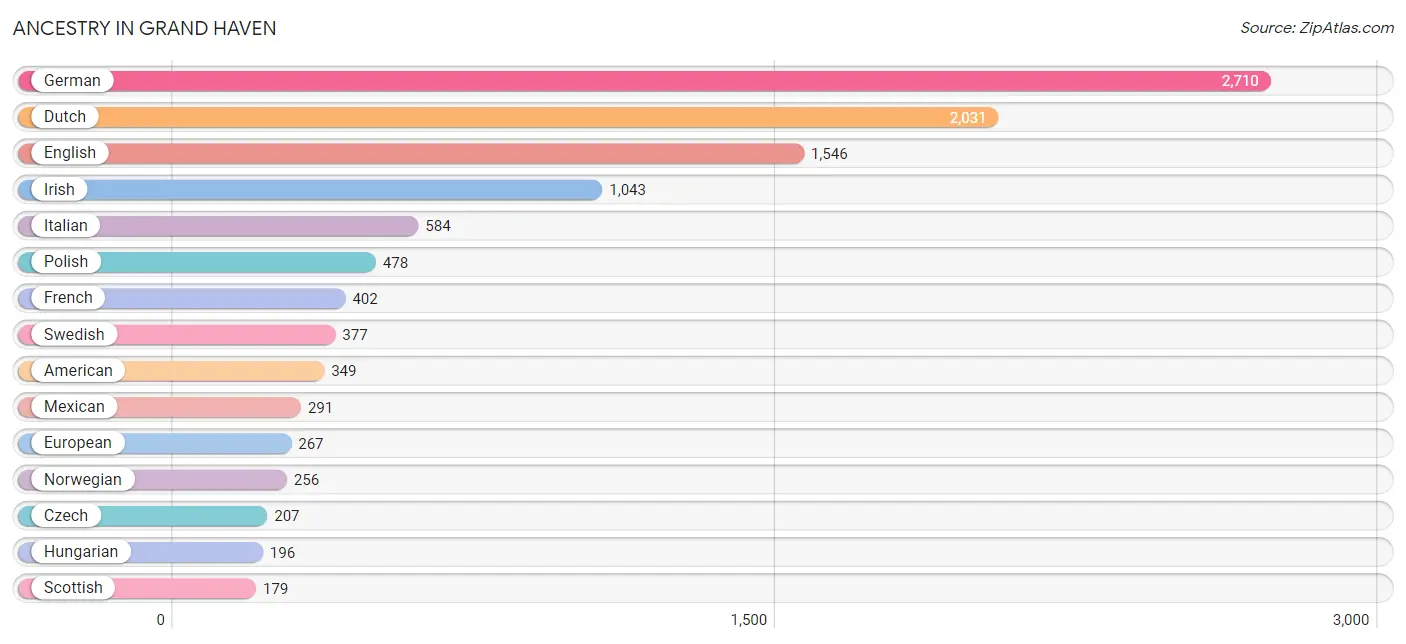
Ancestry in Grand Haven
The most populous ancestries reported in Grand Haven are German (2,710 | 24.7%), Dutch (2,031 | 18.5%), English (1,546 | 14.1%), Irish (1,043 | 9.5%), and Italian (584 | 5.3%), together accounting for 72.2% of all Grand Haven residents.
| Ancestry | # Population | % Population |
| American | 349 | 3.2% |
| Arab | 9 | 0.1% |
| Argentinean | 19 | 0.2% |
| Armenian | 35 | 0.3% |
| Austrian | 17 | 0.2% |
| Belgian | 25 | 0.2% |
| British | 54 | 0.5% |
| Burmese | 33 | 0.3% |
| Canadian | 30 | 0.3% |
| Celtic | 12 | 0.1% |
| Central American | 164 | 1.5% |
| Cherokee | 31 | 0.3% |
| Chippewa | 4 | 0.0% |
| Cuban | 28 | 0.3% |
| Czech | 207 | 1.9% |
| Czechoslovakian | 24 | 0.2% |
| Danish | 86 | 0.8% |
| Dutch | 2,031 | 18.5% |
| English | 1,546 | 14.1% |
| European | 267 | 2.4% |
| Finnish | 88 | 0.8% |
| French | 402 | 3.7% |
| French Canadian | 145 | 1.3% |
| German | 2,710 | 24.7% |
| Greek | 42 | 0.4% |
| Guatemalan | 123 | 1.1% |
| Honduran | 41 | 0.4% |
| Hungarian | 196 | 1.8% |
| Irish | 1,043 | 9.5% |
| Italian | 584 | 5.3% |
| Lithuanian | 19 | 0.2% |
| Mexican | 291 | 2.6% |
| Northern European | 43 | 0.4% |
| Norwegian | 256 | 2.3% |
| Ottawa | 18 | 0.2% |
| Polish | 478 | 4.4% |
| Potawatomi | 10 | 0.1% |
| Puerto Rican | 16 | 0.2% |
| Romanian | 20 | 0.2% |
| Scandinavian | 77 | 0.7% |
| Scotch-Irish | 111 | 1.0% |
| Scottish | 179 | 1.6% |
| Slovak | 16 | 0.2% |
| South American | 19 | 0.2% |
| Spanish | 23 | 0.2% |
| Swedish | 377 | 3.4% |
| Swiss | 17 | 0.2% |
| Syrian | 9 | 0.1% |
| Welsh | 34 | 0.3% |
| Yugoslavian | 8 | 0.1% | View All 50 Rows |
Immigrants in Grand Haven
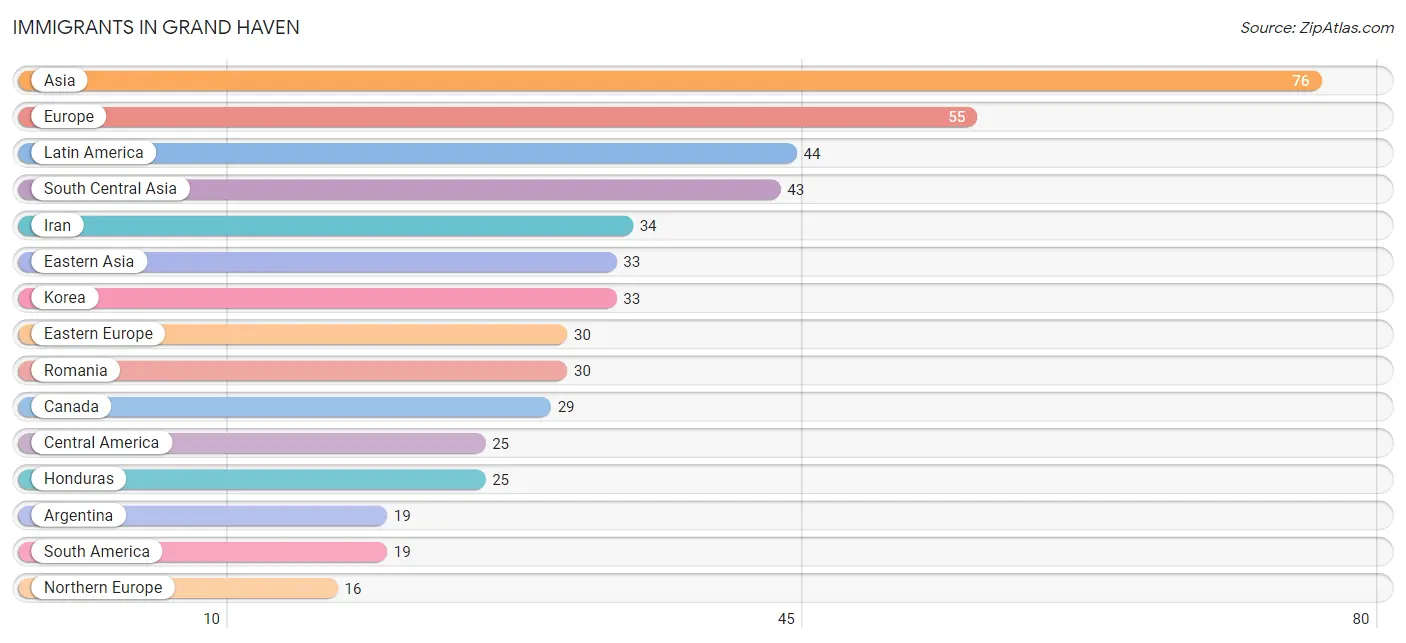
The most numerous immigrant groups reported in Grand Haven came from Asia (76 | 0.7%), Europe (55 | 0.5%), Latin America (44 | 0.4%), South Central Asia (43 | 0.4%), and Iran (34 | 0.3%), together accounting for 2.3% of all Grand Haven residents.
| Immigration Origin | # Population | % Population |
| Argentina | 19 | 0.2% |
| Asia | 76 | 0.7% |
| Canada | 29 | 0.3% |
| Central America | 25 | 0.2% |
| Eastern Asia | 33 | 0.3% |
| Eastern Europe | 30 | 0.3% |
| Europe | 55 | 0.5% |
| Germany | 9 | 0.1% |
| Honduras | 25 | 0.2% |
| Iran | 34 | 0.3% |
| Korea | 33 | 0.3% |
| Latin America | 44 | 0.4% |
| Nepal | 9 | 0.1% |
| Northern Europe | 16 | 0.2% |
| Romania | 30 | 0.3% |
| Scotland | 16 | 0.2% |
| South America | 19 | 0.2% |
| South Central Asia | 43 | 0.4% |
| Western Europe | 9 | 0.1% | View All 19 Rows |
Sex and Age in Grand Haven
Sex and Age in Grand Haven
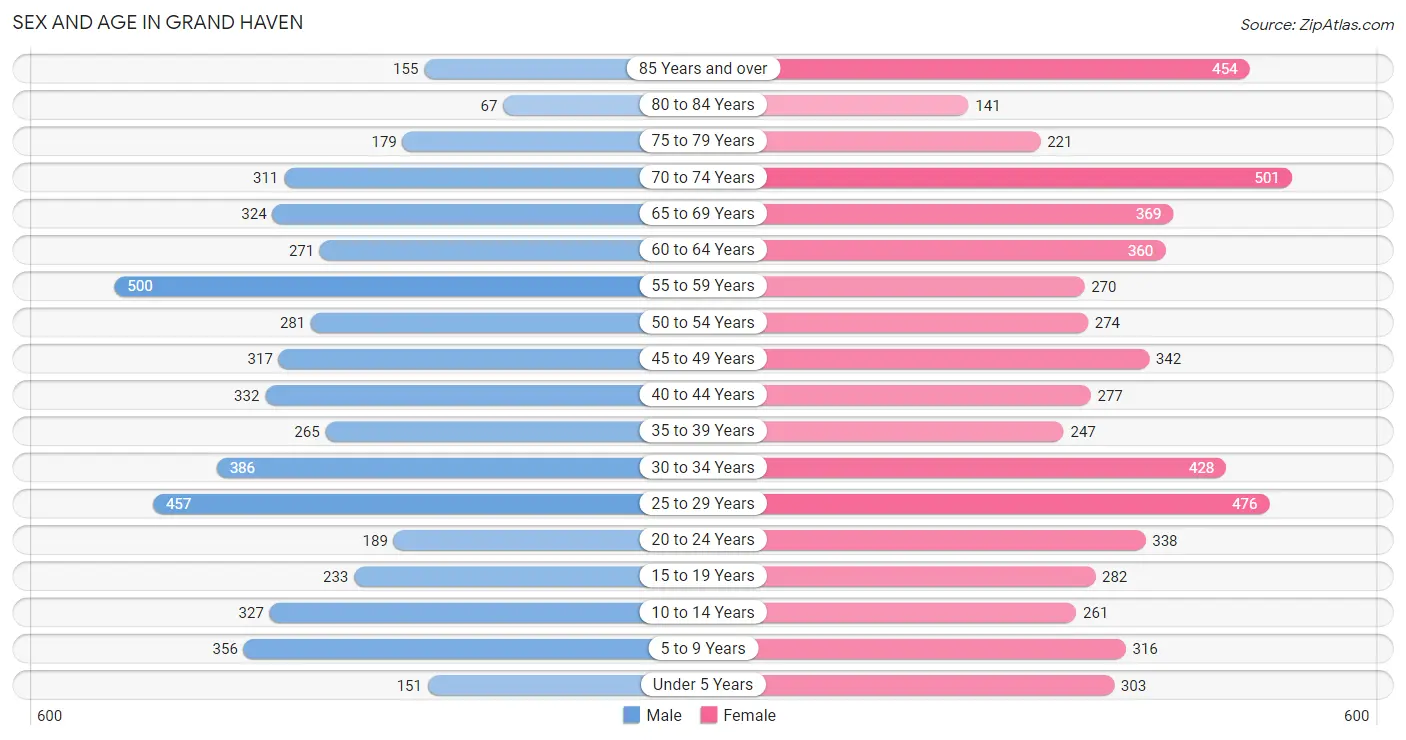
The most populous age groups in Grand Haven are 55 to 59 Years (500 | 9.8%) for men and 70 to 74 Years (501 | 8.6%) for women.
| Age Bracket | Male | Female |
| Under 5 Years | 151 (3.0%) | 303 (5.2%) |
| 5 to 9 Years | 356 (7.0%) | 316 (5.4%) |
| 10 to 14 Years | 327 (6.4%) | 261 (4.4%) |
| 15 to 19 Years | 233 (4.6%) | 282 (4.8%) |
| 20 to 24 Years | 189 (3.7%) | 338 (5.8%) |
| 25 to 29 Years | 457 (9.0%) | 476 (8.1%) |
| 30 to 34 Years | 386 (7.6%) | 428 (7.3%) |
| 35 to 39 Years | 265 (5.2%) | 247 (4.2%) |
| 40 to 44 Years | 332 (6.5%) | 277 (4.7%) |
| 45 to 49 Years | 317 (6.2%) | 342 (5.8%) |
| 50 to 54 Years | 281 (5.5%) | 274 (4.7%) |
| 55 to 59 Years | 500 (9.8%) | 270 (4.6%) |
| 60 to 64 Years | 271 (5.3%) | 360 (6.1%) |
| 65 to 69 Years | 324 (6.4%) | 369 (6.3%) |
| 70 to 74 Years | 311 (6.1%) | 501 (8.6%) |
| 75 to 79 Years | 179 (3.5%) | 221 (3.8%) |
| 80 to 84 Years | 67 (1.3%) | 141 (2.4%) |
| 85 Years and over | 155 (3.0%) | 454 (7.7%) |
| Total | 5,101 (100.0%) | 5,860 (100.0%) |
Families and Households in Grand Haven
Median Family Size in Grand Haven
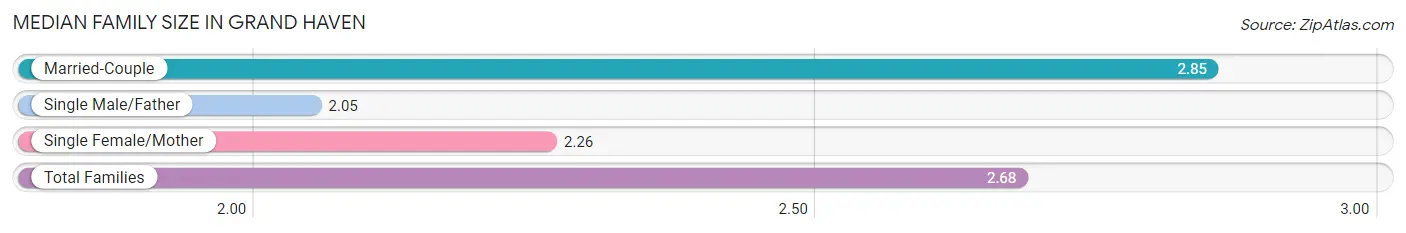
The median family size in Grand Haven is 2.68 persons per family, with married-couple families (2,264 | 73.1%) accounting for the largest median family size of 2.85 persons per family. On the other hand, single male/father families (209 | 6.8%) represent the smallest median family size with 2.05 persons per family.
| Family Type | # Families | Family Size |
| Married-Couple | 2,264 (73.1%) | 2.85 |
| Single Male/Father | 209 (6.8%) | 2.05 |
| Single Female/Mother | 625 (20.2%) | 2.26 |
| Total Families | 3,098 (100.0%) | 2.68 |
Median Household Size in Grand Haven
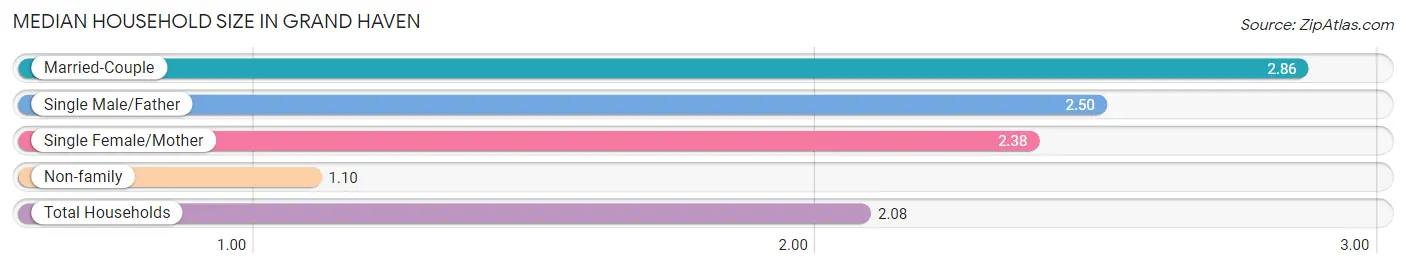
The median household size in Grand Haven is 2.08 persons per household, with married-couple households (2,264 | 43.8%) accounting for the largest median household size of 2.86 persons per household. non-family households (2,071 | 40.1%) represent the smallest median household size with 1.10 persons per household.
| Household Type | # Households | Household Size |
| Married-Couple | 2,264 (43.8%) | 2.86 |
| Single Male/Father | 209 (4.0%) | 2.50 |
| Single Female/Mother | 625 (12.1%) | 2.38 |
| Non-family | 2,071 (40.1%) | 1.10 |
| Total Households | 5,169 (100.0%) | 2.08 |
Household Size by Marriage Status in Grand Haven
Out of a total of 5,169 households in Grand Haven, 3,098 (59.9%) are family households, while 2,071 (40.1%) are nonfamily households. The most numerous type of family households are 2-person households, comprising 1,647, and the most common type of nonfamily households are 1-person households, comprising 1,879.
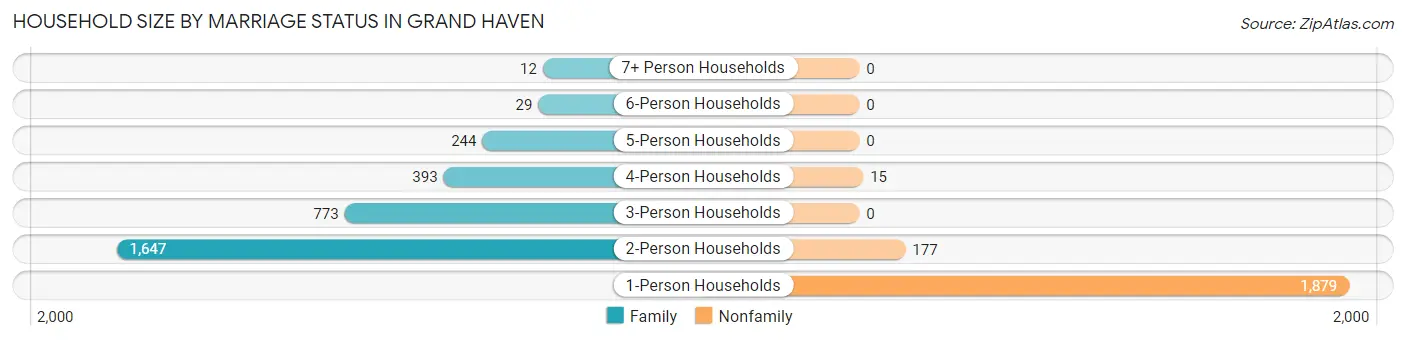
| Household Size | Family Households | Nonfamily Households |
| 1-Person Households | - | 1,879 (36.3%) |
| 2-Person Households | 1,647 (31.9%) | 177 (3.4%) |
| 3-Person Households | 773 (14.9%) | 0 (0.0%) |
| 4-Person Households | 393 (7.6%) | 15 (0.3%) |
| 5-Person Households | 244 (4.7%) | 0 (0.0%) |
| 6-Person Households | 29 (0.6%) | 0 (0.0%) |
| 7+ Person Households | 12 (0.2%) | 0 (0.0%) |
| Total | 3,098 (59.9%) | 2,071 (40.1%) |
Female Fertility in Grand Haven
Fertility by Age in Grand Haven
Average fertility rate in Grand Haven is 29.0 births per 1,000 women. Women in the age bracket of 20 to 34 years have the highest fertility rate with 49.0 births per 1,000 women. Women in the age bracket of 20 to 34 years acount for 87.1% of all women with births.
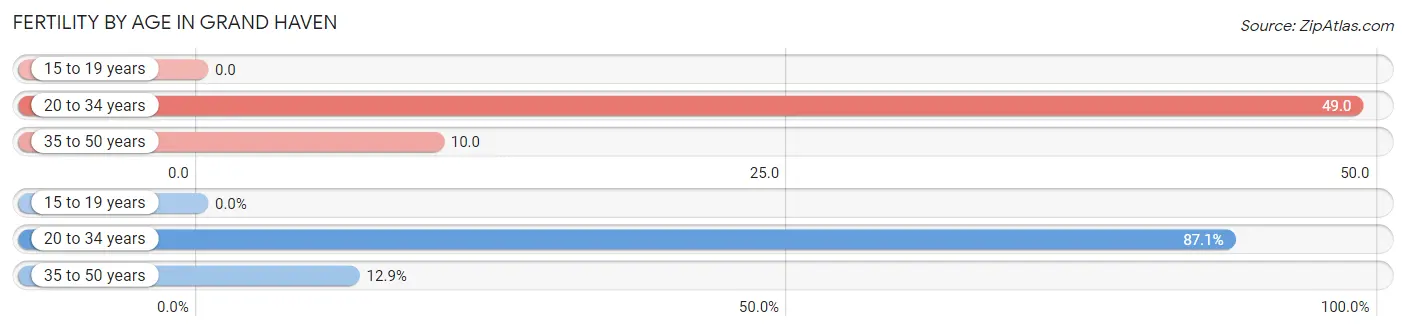
| Age Bracket | Women with Births | Births / 1,000 Women |
| 15 to 19 years | 0 (0.0%) | 0.0 |
| 20 to 34 years | 61 (87.1%) | 49.0 |
| 35 to 50 years | 9 (12.9%) | 10.0 |
| Total | 70 (100.0%) | 29.0 |
Fertility by Age by Marriage Status in Grand Haven
57.1% of women with births (70) in Grand Haven are married. The highest percentage of unmarried women with births falls into 35 to 50 years age bracket with 100.0% of them unmarried at the time of birth, while the lowest percentage of unmarried women with births belong to 20 to 34 years age bracket with 34.4% of them unmarried.
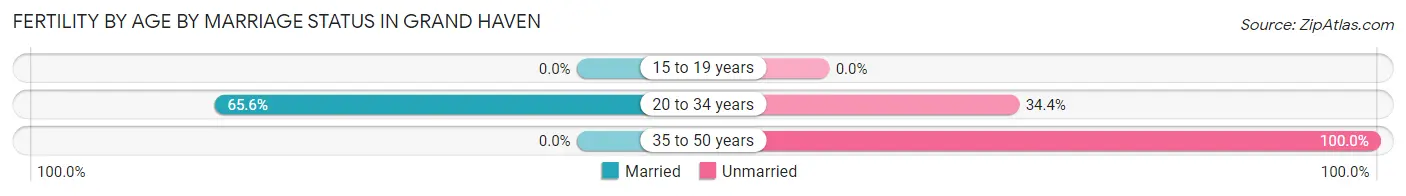
| Age Bracket | Married | Unmarried |
| 15 to 19 years | 0 (0.0%) | 0 (0.0%) |
| 20 to 34 years | 40 (65.6%) | 21 (34.4%) |
| 35 to 50 years | 0 (0.0%) | 9 (100.0%) |
| Total | 40 (57.1%) | 30 (42.9%) |
Fertility by Education in Grand Haven
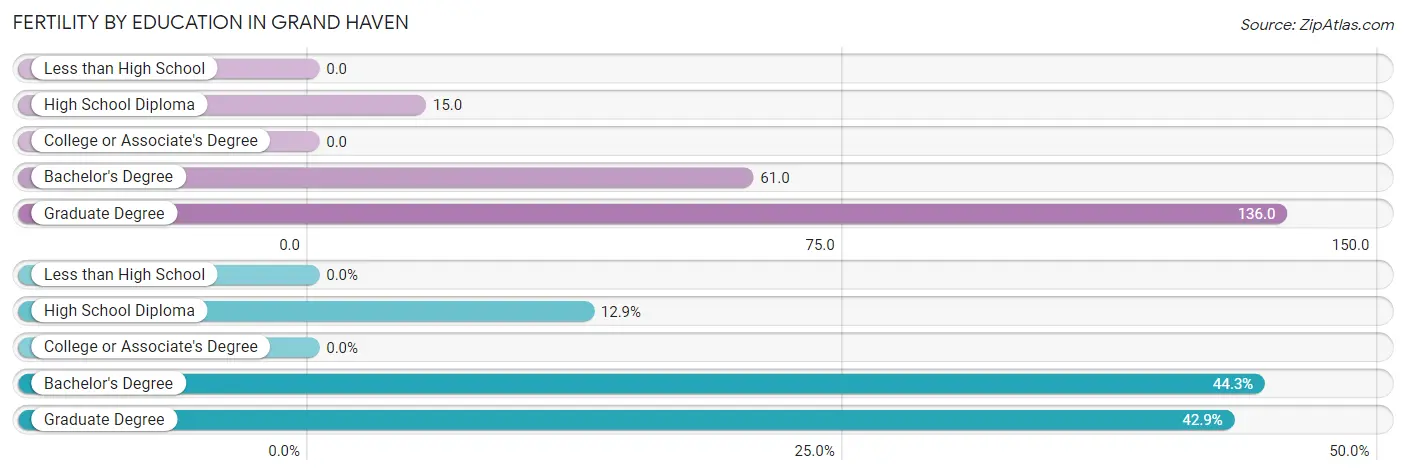
| Educational Attainment | Women with Births | Births / 1,000 Women |
| Less than High School | 0 (0.0%) | 0.0 |
| High School Diploma | 9 (12.9%) | 15.0 |
| College or Associate's Degree | 0 (0.0%) | 0.0 |
| Bachelor's Degree | 31 (44.3%) | 61.0 |
| Graduate Degree | 30 (42.9%) | 136.0 |
| Total | 70 (100.0%) | 29.0 |
Fertility by Education by Marriage Status in Grand Haven
42.9% of women with births in Grand Haven are unmarried. Women with the educational attainment of bachelor's degree are most likely to be married with 100.0% of them married at childbirth, while women with the educational attainment of high school diploma are least likely to be married with 100.0% of them unmarried at childbirth.
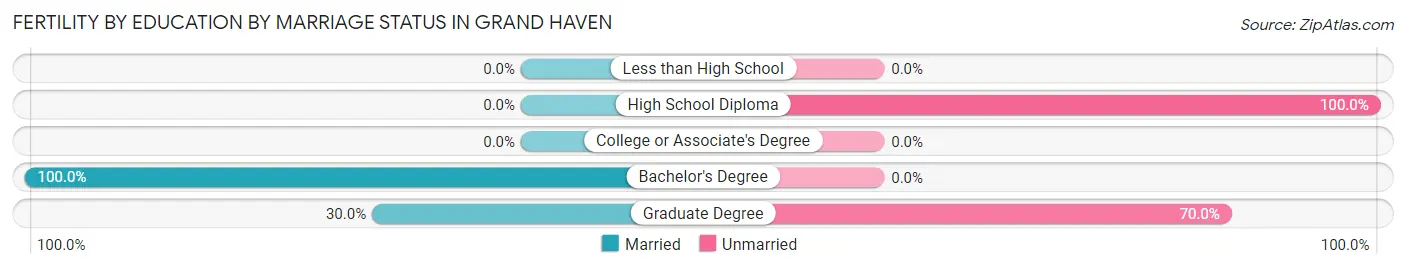
| Educational Attainment | Married | Unmarried |
| Less than High School | 0 (0.0%) | 0 (0.0%) |
| High School Diploma | 0 (0.0%) | 9 (100.0%) |
| College or Associate's Degree | 0 (0.0%) | 0 (0.0%) |
| Bachelor's Degree | 31 (100.0%) | 0 (0.0%) |
| Graduate Degree | 9 (30.0%) | 21 (70.0%) |
| Total | 40 (57.1%) | 30 (42.9%) |
Employment Characteristics in Grand Haven
Employment by Class of Employer in Grand Haven
Among the 4,984 employed individuals in Grand Haven, private company employees (3,539 | 71.0%), not-for-profit organizations (412 | 8.3%), and local government employees (366 | 7.3%) make up the most common classes of employment.
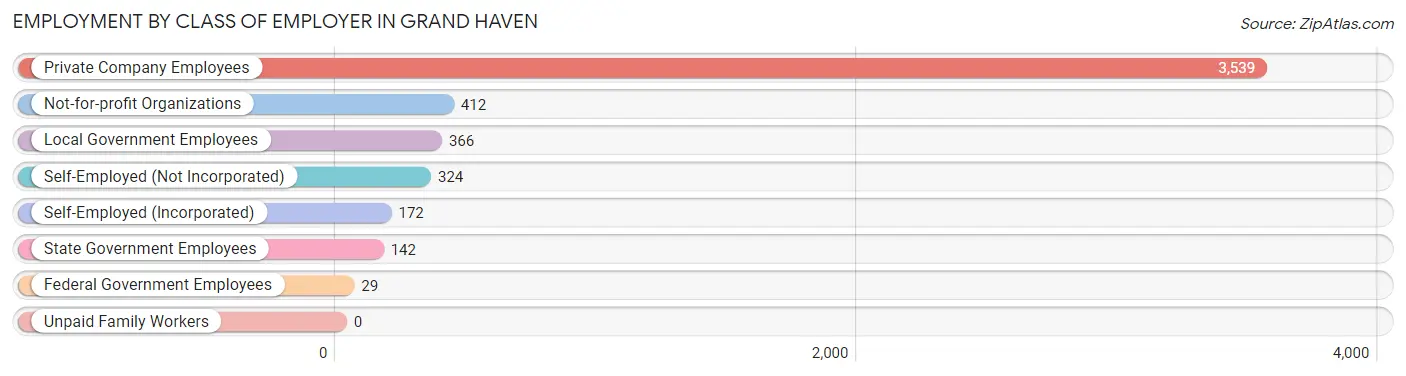
| Employer Class | # Employees | % Employees |
| Private Company Employees | 3,539 | 71.0% |
| Self-Employed (Incorporated) | 172 | 3.5% |
| Self-Employed (Not Incorporated) | 324 | 6.5% |
| Not-for-profit Organizations | 412 | 8.3% |
| Local Government Employees | 366 | 7.3% |
| State Government Employees | 142 | 2.9% |
| Federal Government Employees | 29 | 0.6% |
| Unpaid Family Workers | 0 | 0.0% |
| Total | 4,984 | 100.0% |
Employment Status by Age in Grand Haven
According to the labor force statistics for Grand Haven, out of the total population over 16 years of age (9,190), 58.6% or 5,385 individuals are in the labor force, with 5.1% or 275 of them unemployed. The age group with the highest labor force participation rate is 30 to 34 years, with 95.9% or 781 individuals in the labor force. Within the labor force, the 65 to 74 years age range has the highest percentage of unemployed individuals, with 19.4% or 68 of them being unemployed.
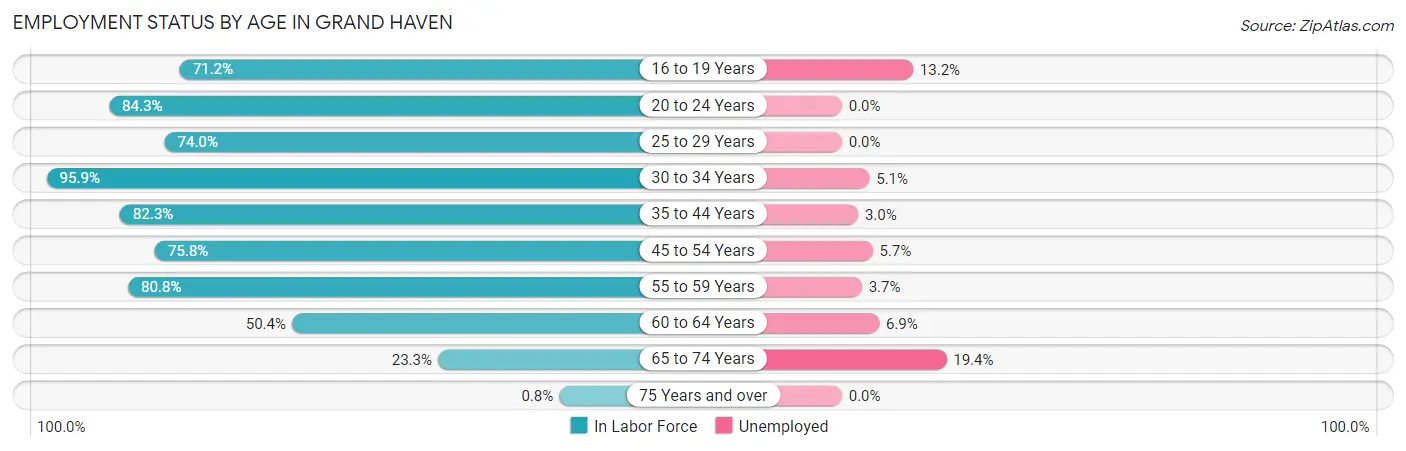
| Age Bracket | In Labor Force | Unemployed |
| 16 to 19 Years | 326 (71.2%) | 43 (13.2%) |
| 20 to 24 Years | 444 (84.3%) | 0 (0.0%) |
| 25 to 29 Years | 690 (74.0%) | 0 (0.0%) |
| 30 to 34 Years | 781 (95.9%) | 40 (5.1%) |
| 35 to 44 Years | 923 (82.3%) | 28 (3.0%) |
| 45 to 54 Years | 920 (75.8%) | 52 (5.7%) |
| 55 to 59 Years | 622 (80.8%) | 23 (3.7%) |
| 60 to 64 Years | 318 (50.4%) | 22 (6.9%) |
| 65 to 74 Years | 351 (23.3%) | 68 (19.4%) |
| 75 Years and over | 10 (0.8%) | 0 (0.0%) |
| Total | 5,385 (58.6%) | 275 (5.1%) |
Employment Status by Educational Attainment in Grand Haven
According to labor force statistics for Grand Haven, 77.6% of individuals (4,255) out of the total population between 25 and 64 years of age (5,483) are in the labor force, with 3.9% or 166 of them being unemployed. The group with the highest labor force participation rate are those with the educational attainment of bachelor's degree or higher, with 87.6% or 1,791 individuals in the labor force. Within the labor force, individuals with high school diploma education have the highest percentage of unemployment, with 10.1% or 87 of them being unemployed.
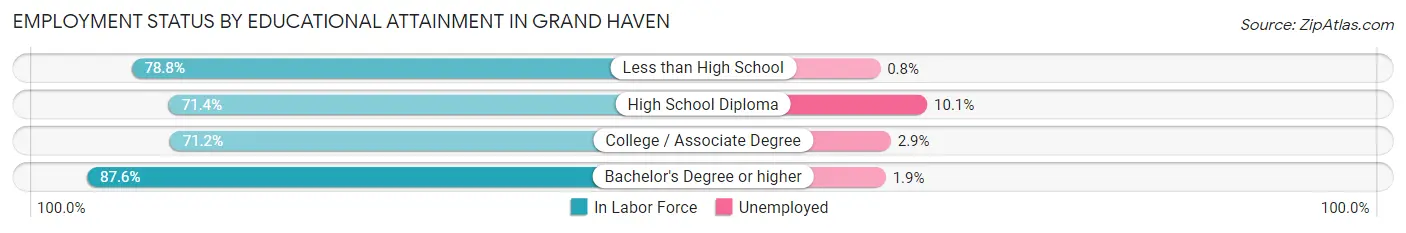
| Educational Attainment | In Labor Force | Unemployed |
| Less than High School | 130 (78.8%) | 1 (0.8%) |
| High School Diploma | 859 (71.4%) | 122 (10.1%) |
| College / Associate Degree | 1,475 (71.2%) | 60 (2.9%) |
| Bachelor's Degree or higher | 1,791 (87.6%) | 39 (1.9%) |
| Total | 4,255 (77.6%) | 214 (3.9%) |
Employment Occupations by Sex in Grand Haven
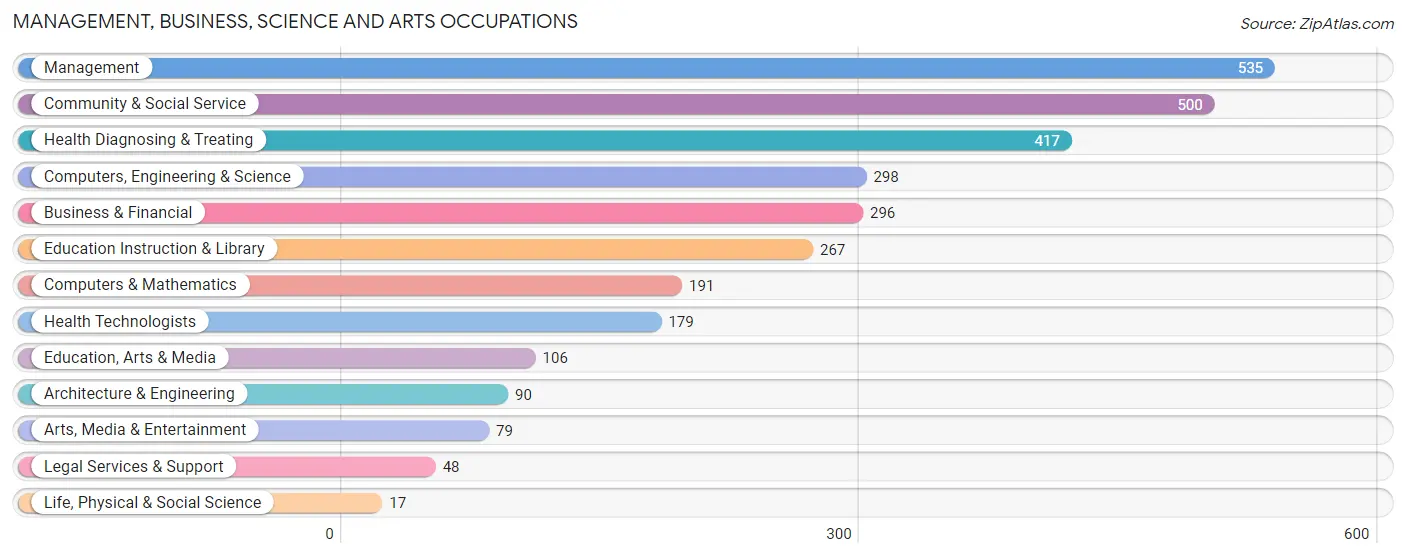
Management, Business, Science and Arts Occupations
The most common Management, Business, Science and Arts occupations in Grand Haven are Management (535 | 10.5%), Community & Social Service (500 | 9.8%), Health Diagnosing & Treating (417 | 8.2%), Computers, Engineering & Science (298 | 5.8%), and Business & Financial (296 | 5.8%).
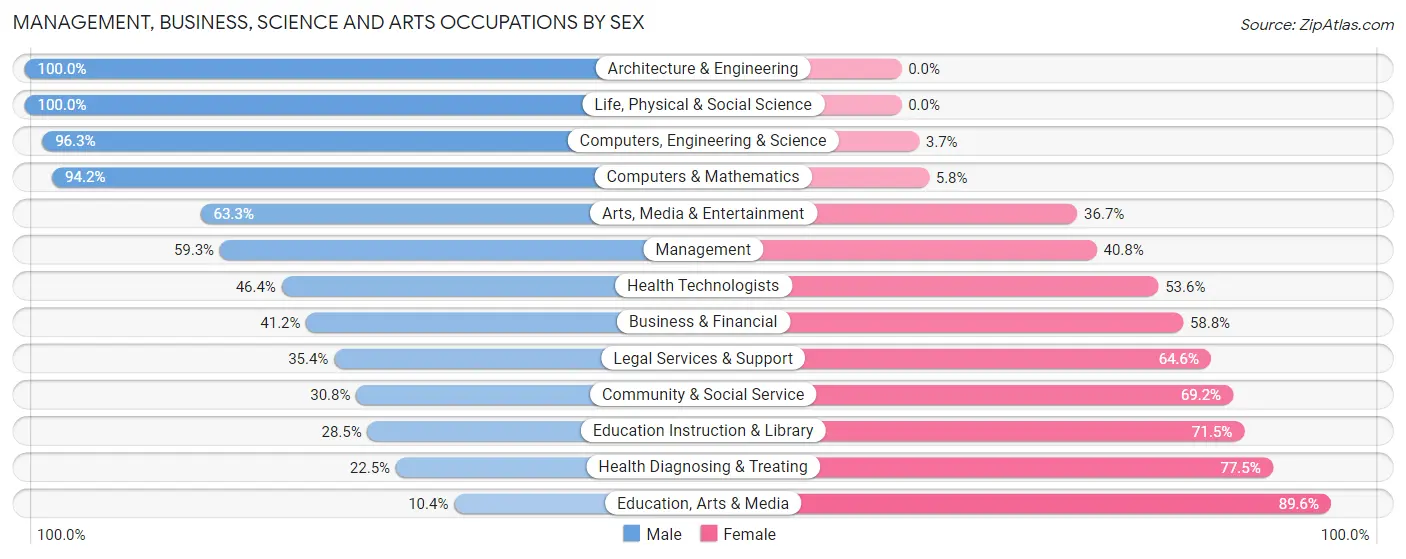
Management, Business, Science and Arts Occupations by Sex
Within the Management, Business, Science and Arts occupations in Grand Haven, the most male-oriented occupations are Architecture & Engineering (100.0%), Life, Physical & Social Science (100.0%), and Computers, Engineering & Science (96.3%), while the most female-oriented occupations are Education, Arts & Media (89.6%), Health Diagnosing & Treating (77.5%), and Education Instruction & Library (71.5%).
| Occupation | Male | Female |
| Management | 317 (59.3%) | 218 (40.7%) |
| Business & Financial | 122 (41.2%) | 174 (58.8%) |
| Computers, Engineering & Science | 287 (96.3%) | 11 (3.7%) |
| Computers & Mathematics | 180 (94.2%) | 11 (5.8%) |
| Architecture & Engineering | 90 (100.0%) | 0 (0.0%) |
| Life, Physical & Social Science | 17 (100.0%) | 0 (0.0%) |
| Community & Social Service | 154 (30.8%) | 346 (69.2%) |
| Education, Arts & Media | 11 (10.4%) | 95 (89.6%) |
| Legal Services & Support | 17 (35.4%) | 31 (64.6%) |
| Education Instruction & Library | 76 (28.5%) | 191 (71.5%) |
| Arts, Media & Entertainment | 50 (63.3%) | 29 (36.7%) |
| Health Diagnosing & Treating | 94 (22.5%) | 323 (77.5%) |
| Health Technologists | 83 (46.4%) | 96 (53.6%) |
| Total (Category) | 974 (47.6%) | 1,072 (52.4%) |
| Total (Overall) | 2,624 (51.4%) | 2,484 (48.6%) |
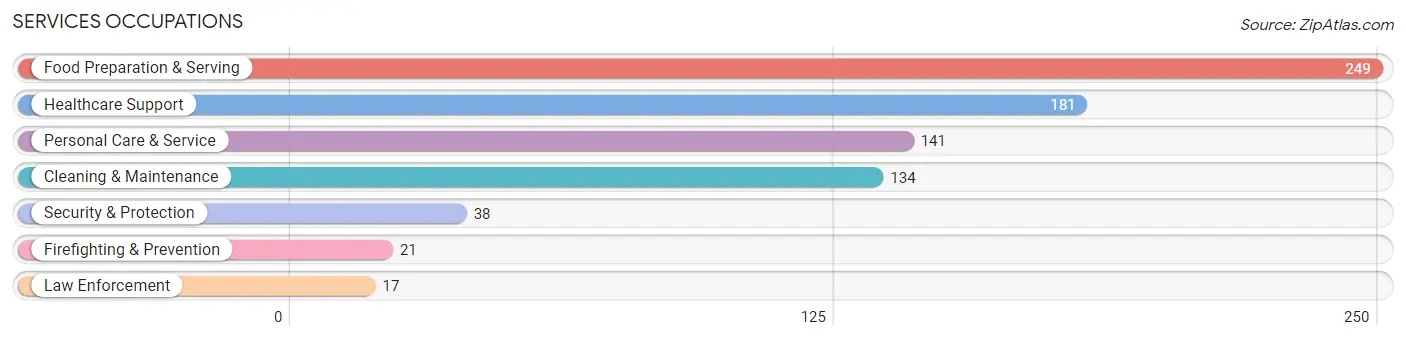
Services Occupations
The most common Services occupations in Grand Haven are Food Preparation & Serving (249 | 4.9%), Healthcare Support (181 | 3.5%), Personal Care & Service (141 | 2.8%), Cleaning & Maintenance (134 | 2.6%), and Security & Protection (38 | 0.7%).
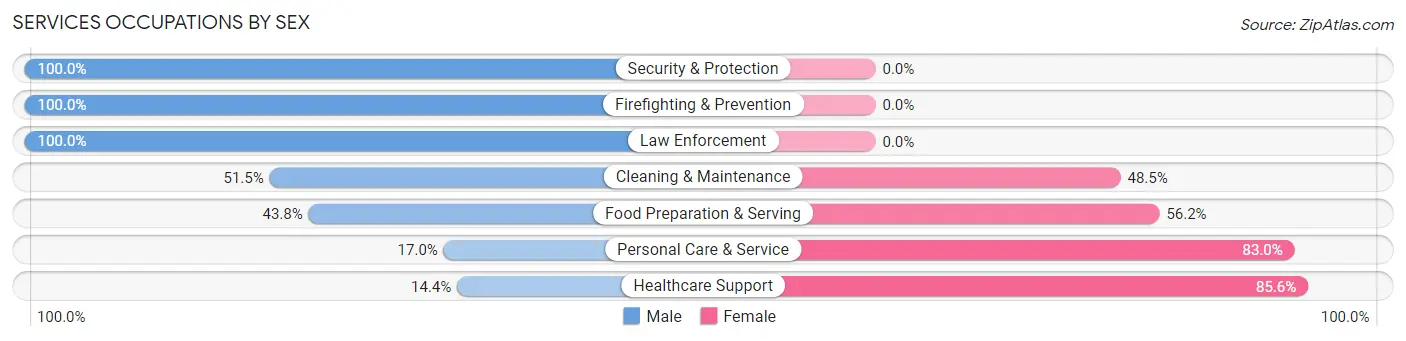
Services Occupations by Sex
Within the Services occupations in Grand Haven, the most male-oriented occupations are Security & Protection (100.0%), Firefighting & Prevention (100.0%), and Law Enforcement (100.0%), while the most female-oriented occupations are Healthcare Support (85.6%), Personal Care & Service (83.0%), and Food Preparation & Serving (56.2%).
| Occupation | Male | Female |
| Healthcare Support | 26 (14.4%) | 155 (85.6%) |
| Security & Protection | 38 (100.0%) | 0 (0.0%) |
| Firefighting & Prevention | 21 (100.0%) | 0 (0.0%) |
| Law Enforcement | 17 (100.0%) | 0 (0.0%) |
| Food Preparation & Serving | 109 (43.8%) | 140 (56.2%) |
| Cleaning & Maintenance | 69 (51.5%) | 65 (48.5%) |
| Personal Care & Service | 24 (17.0%) | 117 (83.0%) |
| Total (Category) | 266 (35.8%) | 477 (64.2%) |
| Total (Overall) | 2,624 (51.4%) | 2,484 (48.6%) |
Sales and Office Occupations
The most common Sales and Office occupations in Grand Haven are Office & Administration (629 | 12.3%), and Sales & Related (461 | 9.0%).
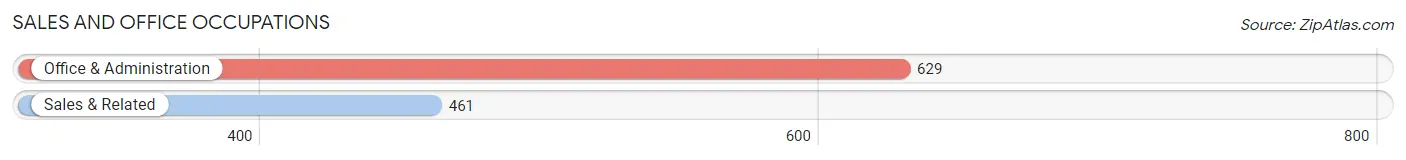
Sales and Office Occupations by Sex
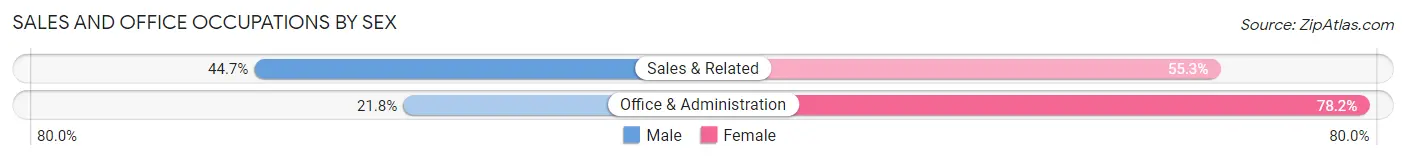
| Occupation | Male | Female |
| Sales & Related | 206 (44.7%) | 255 (55.3%) |
| Office & Administration | 137 (21.8%) | 492 (78.2%) |
| Total (Category) | 343 (31.5%) | 747 (68.5%) |
| Total (Overall) | 2,624 (51.4%) | 2,484 (48.6%) |
Natural Resources, Construction and Maintenance Occupations
The most common Natural Resources, Construction and Maintenance occupations in Grand Haven are Construction & Extraction (265 | 5.2%), and Installation, Maintenance & Repair (119 | 2.3%).
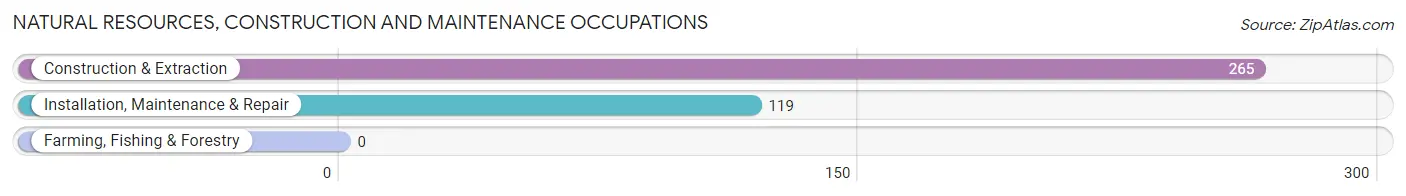
Natural Resources, Construction and Maintenance Occupations by Sex
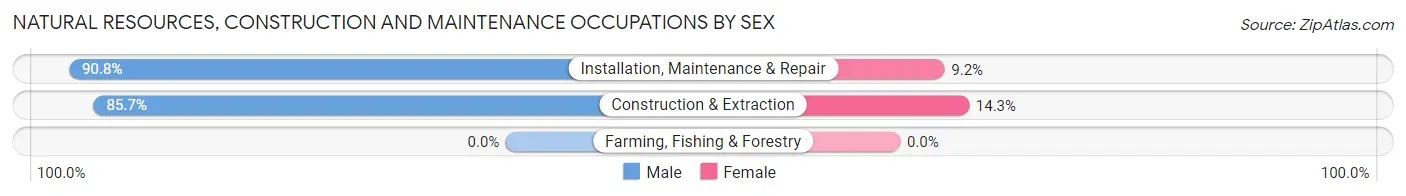
| Occupation | Male | Female |
| Farming, Fishing & Forestry | 0 (0.0%) | 0 (0.0%) |
| Construction & Extraction | 227 (85.7%) | 38 (14.3%) |
| Installation, Maintenance & Repair | 108 (90.8%) | 11 (9.2%) |
| Total (Category) | 335 (87.2%) | 49 (12.8%) |
| Total (Overall) | 2,624 (51.4%) | 2,484 (48.6%) |
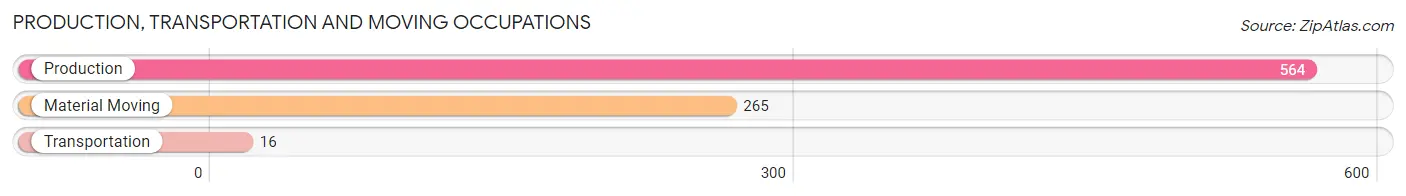
Production, Transportation and Moving Occupations
The most common Production, Transportation and Moving occupations in Grand Haven are Production (564 | 11.0%), Material Moving (265 | 5.2%), and Transportation (16 | 0.3%).
Production, Transportation and Moving Occupations by Sex
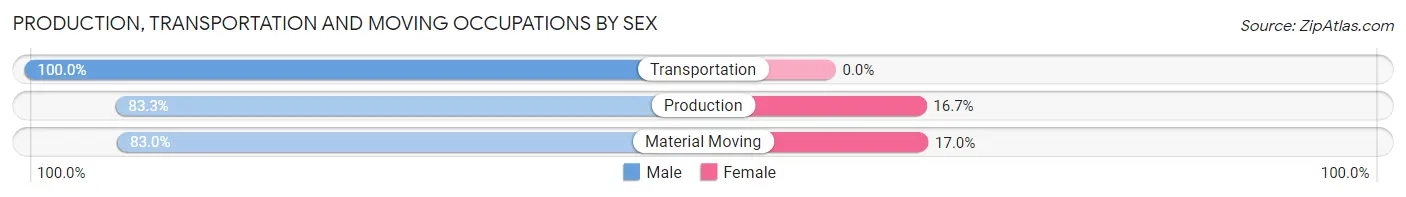
| Occupation | Male | Female |
| Production | 470 (83.3%) | 94 (16.7%) |
| Transportation | 16 (100.0%) | 0 (0.0%) |
| Material Moving | 220 (83.0%) | 45 (17.0%) |
| Total (Category) | 706 (83.6%) | 139 (16.5%) |
| Total (Overall) | 2,624 (51.4%) | 2,484 (48.6%) |
Employment Industries by Sex in Grand Haven
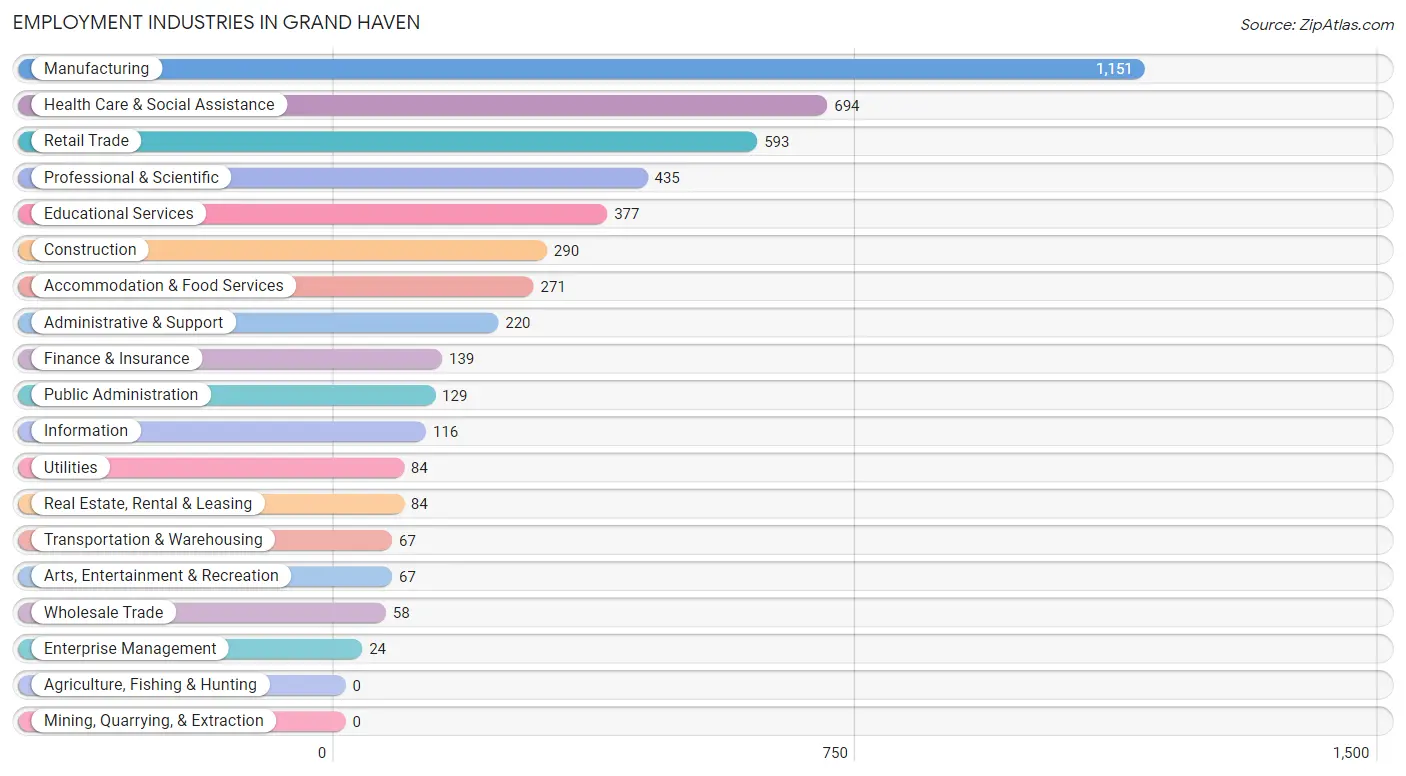
Employment Industries in Grand Haven
The major employment industries in Grand Haven include Manufacturing (1,151 | 22.5%), Health Care & Social Assistance (694 | 13.6%), Retail Trade (593 | 11.6%), Professional & Scientific (435 | 8.5%), and Educational Services (377 | 7.4%).
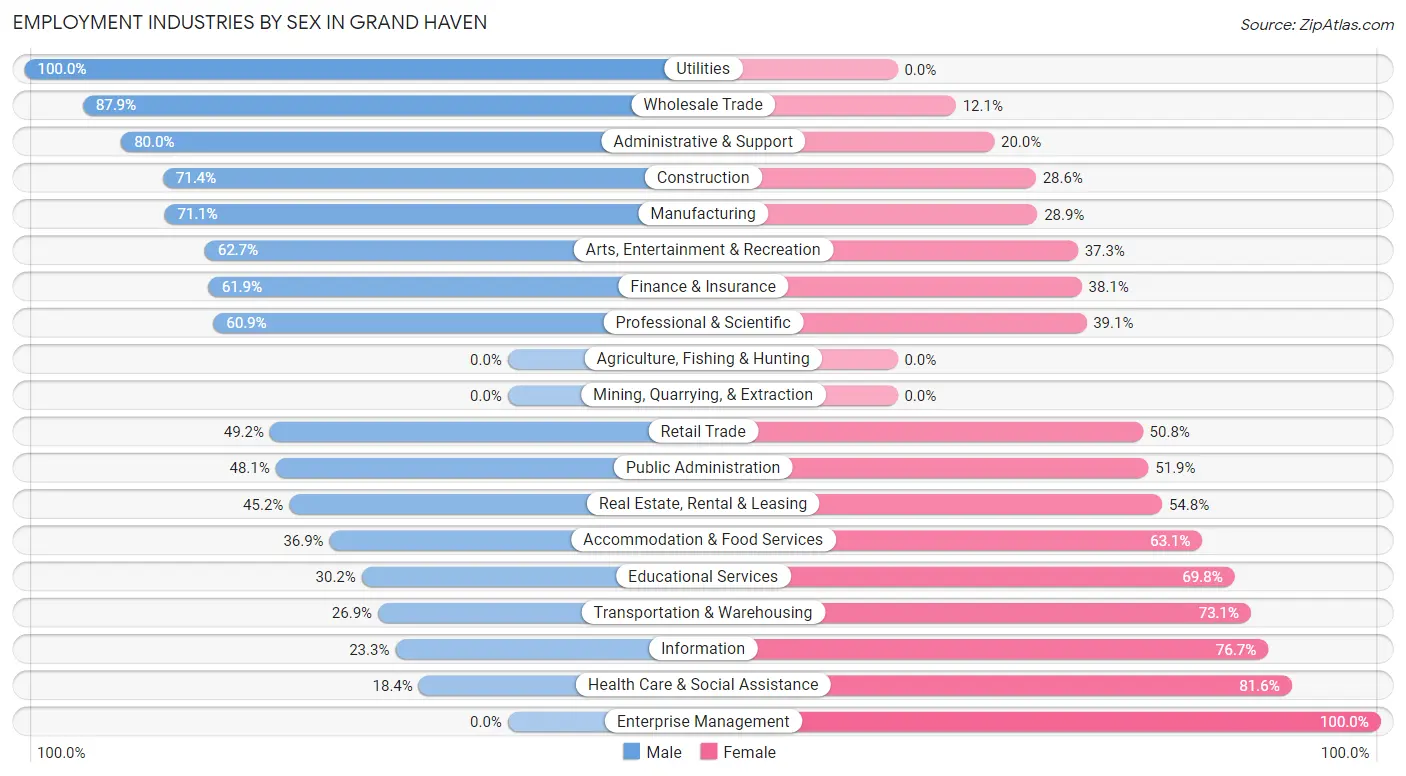
Employment Industries by Sex in Grand Haven
The Grand Haven industries that see more men than women are Utilities (100.0%), Wholesale Trade (87.9%), and Administrative & Support (80.0%), whereas the industries that tend to have a higher number of women are Enterprise Management (100.0%), Health Care & Social Assistance (81.6%), and Information (76.7%).
| Industry | Male | Female |
| Agriculture, Fishing & Hunting | 0 (0.0%) | 0 (0.0%) |
| Mining, Quarrying, & Extraction | 0 (0.0%) | 0 (0.0%) |
| Construction | 207 (71.4%) | 83 (28.6%) |
| Manufacturing | 818 (71.1%) | 333 (28.9%) |
| Wholesale Trade | 51 (87.9%) | 7 (12.1%) |
| Retail Trade | 292 (49.2%) | 301 (50.8%) |
| Transportation & Warehousing | 18 (26.9%) | 49 (73.1%) |
| Utilities | 84 (100.0%) | 0 (0.0%) |
| Information | 27 (23.3%) | 89 (76.7%) |
| Finance & Insurance | 86 (61.9%) | 53 (38.1%) |
| Real Estate, Rental & Leasing | 38 (45.2%) | 46 (54.8%) |
| Professional & Scientific | 265 (60.9%) | 170 (39.1%) |
| Enterprise Management | 0 (0.0%) | 24 (100.0%) |
| Administrative & Support | 176 (80.0%) | 44 (20.0%) |
| Educational Services | 114 (30.2%) | 263 (69.8%) |
| Health Care & Social Assistance | 128 (18.4%) | 566 (81.6%) |
| Arts, Entertainment & Recreation | 42 (62.7%) | 25 (37.3%) |
| Accommodation & Food Services | 100 (36.9%) | 171 (63.1%) |
| Public Administration | 62 (48.1%) | 67 (51.9%) |
| Total | 2,624 (51.4%) | 2,484 (48.6%) |
Education in Grand Haven
School Enrollment in Grand Haven
The most common levels of schooling among the 2,250 students in Grand Haven are elementary school (554 | 24.6%), middle school (445 | 19.8%), and high school (402 | 17.9%).
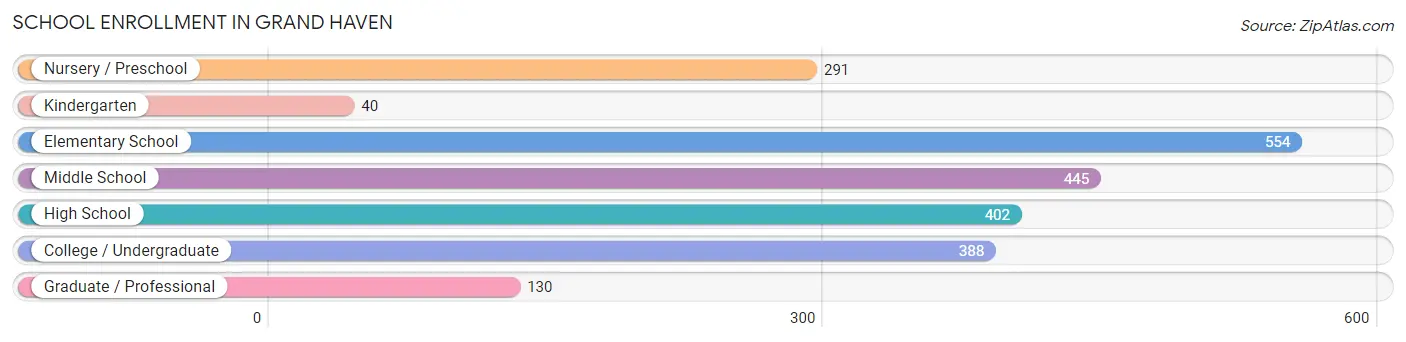
| School Level | # Students | % Students |
| Nursery / Preschool | 291 | 12.9% |
| Kindergarten | 40 | 1.8% |
| Elementary School | 554 | 24.6% |
| Middle School | 445 | 19.8% |
| High School | 402 | 17.9% |
| College / Undergraduate | 388 | 17.2% |
| Graduate / Professional | 130 | 5.8% |
| Total | 2,250 | 100.0% |
School Enrollment by Age by Funding Source in Grand Haven
Out of a total of 2,250 students who are enrolled in schools in Grand Haven, 378 (16.8%) attend a private institution, while the remaining 1,872 (83.2%) are enrolled in public schools. The age group of 3 to 4 year olds has the highest likelihood of being enrolled in private schools, with 68 (42.0% in the age bracket) enrolled. Conversely, the age group of 20 to 24 year olds has the lowest likelihood of being enrolled in a private school, with 166 (100.0% in the age bracket) attending a public institution.
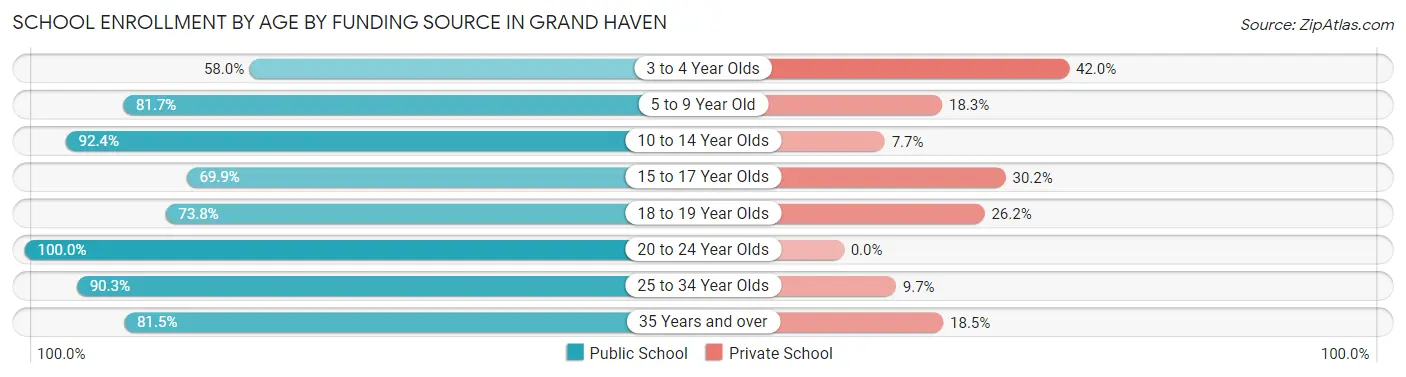
| Age Bracket | Public School | Private School |
| 3 to 4 Year Olds | 94 (58.0%) | 68 (42.0%) |
| 5 to 9 Year Old | 535 (81.7%) | 120 (18.3%) |
| 10 to 14 Year Olds | 543 (92.3%) | 45 (7.6%) |
| 15 to 17 Year Olds | 139 (69.9%) | 60 (30.1%) |
| 18 to 19 Year Olds | 135 (73.8%) | 48 (26.2%) |
| 20 to 24 Year Olds | 166 (100.0%) | 0 (0.0%) |
| 25 to 34 Year Olds | 195 (90.3%) | 21 (9.7%) |
| 35 Years and over | 66 (81.5%) | 15 (18.5%) |
| Total | 1,872 (83.2%) | 378 (16.8%) |
Educational Attainment by Field of Study in Grand Haven
Business (526 | 16.1%), education (442 | 13.5%), science & technology (396 | 12.1%), social sciences (281 | 8.6%), and arts & humanities (244 | 7.5%) are the most common fields of study among 3,268 individuals in Grand Haven who have obtained a bachelor's degree or higher.
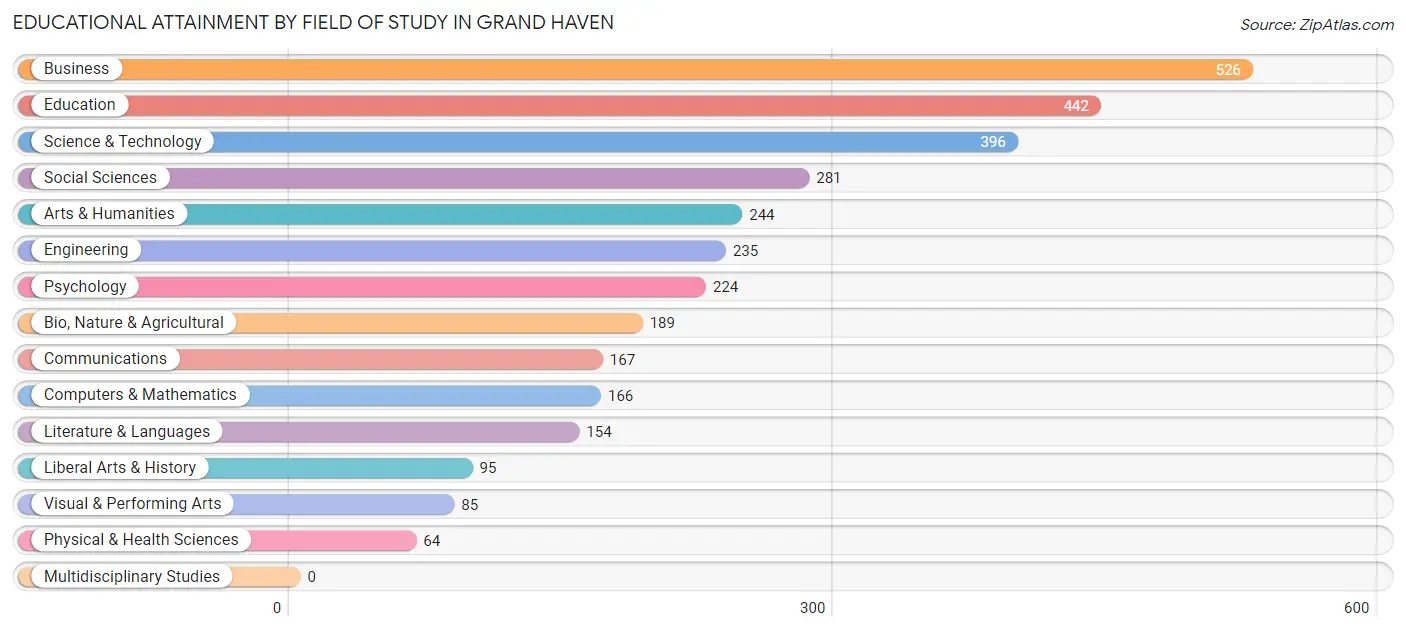
| Field of Study | # Graduates | % Graduates |
| Computers & Mathematics | 166 | 5.1% |
| Bio, Nature & Agricultural | 189 | 5.8% |
| Physical & Health Sciences | 64 | 2.0% |
| Psychology | 224 | 6.9% |
| Social Sciences | 281 | 8.6% |
| Engineering | 235 | 7.2% |
| Multidisciplinary Studies | 0 | 0.0% |
| Science & Technology | 396 | 12.1% |
| Business | 526 | 16.1% |
| Education | 442 | 13.5% |
| Literature & Languages | 154 | 4.7% |
| Liberal Arts & History | 95 | 2.9% |
| Visual & Performing Arts | 85 | 2.6% |
| Communications | 167 | 5.1% |
| Arts & Humanities | 244 | 7.5% |
| Total | 3,268 | 100.0% |
Transportation & Commute in Grand Haven
Vehicle Availability by Sex in Grand Haven
The most prevalent vehicle ownership categories in Grand Haven are males with 2 vehicles (1,195, accounting for 46.6%) and females with 2 vehicles (1,125, making up 49.4%).
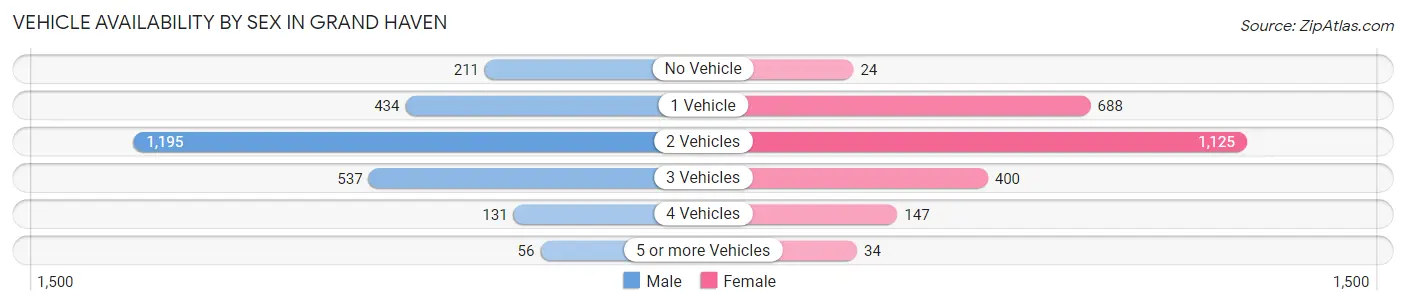
| Vehicles Available | Male | Female |
| No Vehicle | 211 (8.2%) | 24 (1.0%) |
| 1 Vehicle | 434 (16.9%) | 688 (28.4%) |
| 2 Vehicles | 1,195 (46.6%) | 1,125 (46.5%) |
| 3 Vehicles | 537 (20.9%) | 400 (16.5%) |
| 4 Vehicles | 131 (5.1%) | 147 (6.1%) |
| 5 or more Vehicles | 56 (2.2%) | 34 (1.4%) |
| Total | 2,564 (100.0%) | 2,418 (100.0%) |
Commute Time in Grand Haven
The most frequently occuring commute durations in Grand Haven are 5 to 9 minutes (1,205 commuters, 26.9%), 15 to 19 minutes (712 commuters, 15.9%), and 10 to 14 minutes (592 commuters, 13.2%).
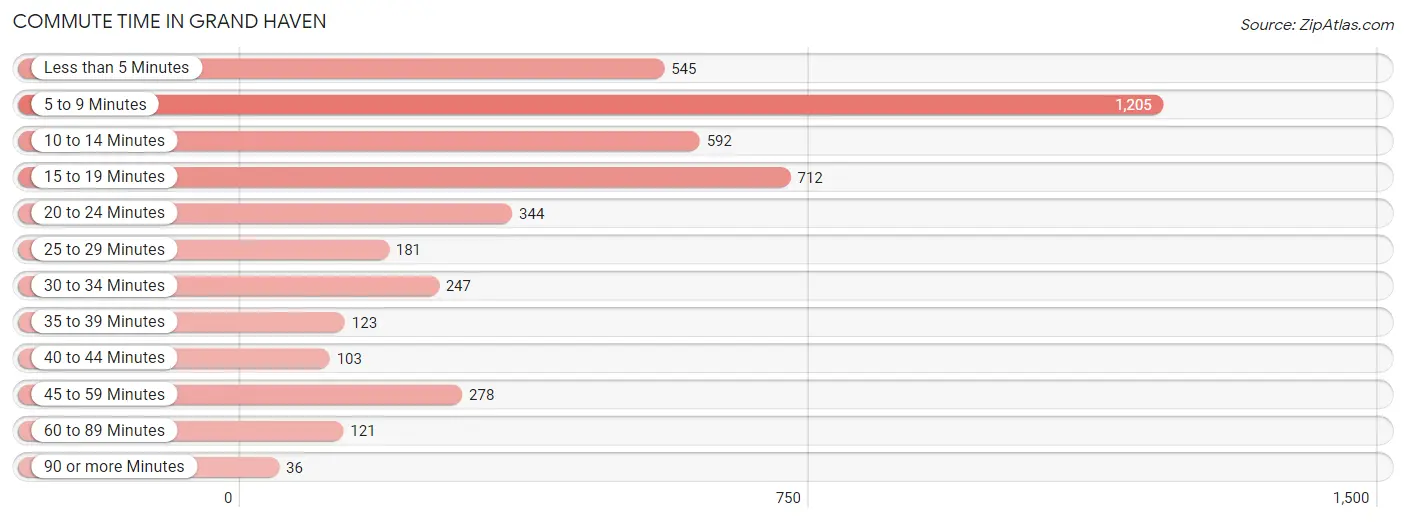
| Commute Time | # Commuters | % Commuters |
| Less than 5 Minutes | 545 | 12.1% |
| 5 to 9 Minutes | 1,205 | 26.9% |
| 10 to 14 Minutes | 592 | 13.2% |
| 15 to 19 Minutes | 712 | 15.9% |
| 20 to 24 Minutes | 344 | 7.7% |
| 25 to 29 Minutes | 181 | 4.0% |
| 30 to 34 Minutes | 247 | 5.5% |
| 35 to 39 Minutes | 123 | 2.7% |
| 40 to 44 Minutes | 103 | 2.3% |
| 45 to 59 Minutes | 278 | 6.2% |
| 60 to 89 Minutes | 121 | 2.7% |
| 90 or more Minutes | 36 | 0.8% |
Commute Time by Sex in Grand Haven
The most common commute times in Grand Haven are 5 to 9 minutes (433 commuters, 19.3%) for males and 5 to 9 minutes (772 commuters, 34.4%) for females.
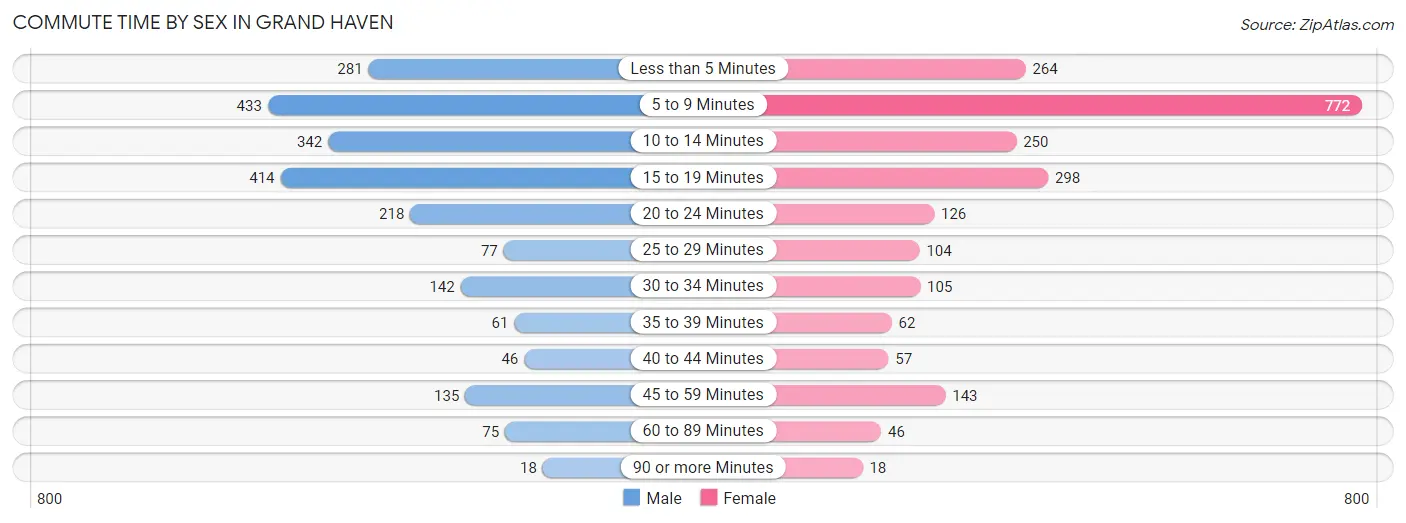
| Commute Time | Male | Female |
| Less than 5 Minutes | 281 (12.5%) | 264 (11.8%) |
| 5 to 9 Minutes | 433 (19.3%) | 772 (34.4%) |
| 10 to 14 Minutes | 342 (15.2%) | 250 (11.1%) |
| 15 to 19 Minutes | 414 (18.5%) | 298 (13.3%) |
| 20 to 24 Minutes | 218 (9.7%) | 126 (5.6%) |
| 25 to 29 Minutes | 77 (3.4%) | 104 (4.6%) |
| 30 to 34 Minutes | 142 (6.3%) | 105 (4.7%) |
| 35 to 39 Minutes | 61 (2.7%) | 62 (2.8%) |
| 40 to 44 Minutes | 46 (2.1%) | 57 (2.5%) |
| 45 to 59 Minutes | 135 (6.0%) | 143 (6.4%) |
| 60 to 89 Minutes | 75 (3.4%) | 46 (2.1%) |
| 90 or more Minutes | 18 (0.8%) | 18 (0.8%) |
Time of Departure to Work by Sex in Grand Haven
The most frequent times of departure to work in Grand Haven are 7:30 AM to 7:59 AM (430, 19.2%) for males and 7:30 AM to 7:59 AM (568, 25.3%) for females.
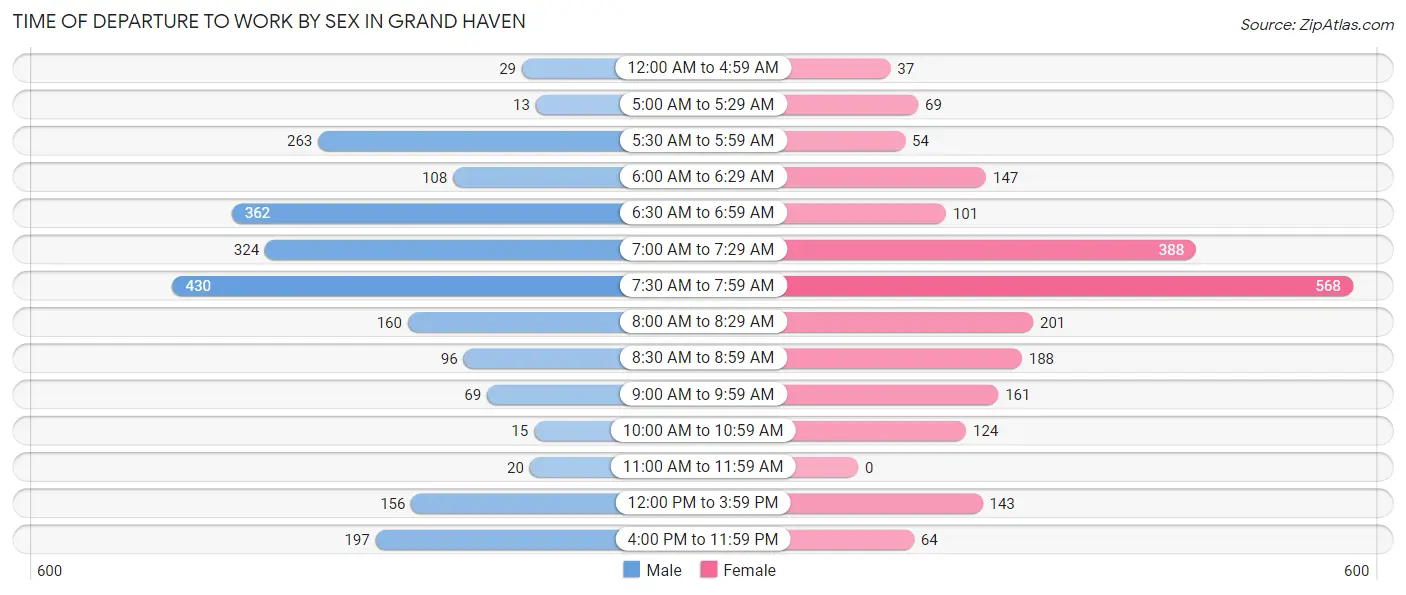
| Time of Departure | Male | Female |
| 12:00 AM to 4:59 AM | 29 (1.3%) | 37 (1.7%) |
| 5:00 AM to 5:29 AM | 13 (0.6%) | 69 (3.1%) |
| 5:30 AM to 5:59 AM | 263 (11.7%) | 54 (2.4%) |
| 6:00 AM to 6:29 AM | 108 (4.8%) | 147 (6.6%) |
| 6:30 AM to 6:59 AM | 362 (16.2%) | 101 (4.5%) |
| 7:00 AM to 7:29 AM | 324 (14.4%) | 388 (17.3%) |
| 7:30 AM to 7:59 AM | 430 (19.2%) | 568 (25.3%) |
| 8:00 AM to 8:29 AM | 160 (7.1%) | 201 (8.9%) |
| 8:30 AM to 8:59 AM | 96 (4.3%) | 188 (8.4%) |
| 9:00 AM to 9:59 AM | 69 (3.1%) | 161 (7.2%) |
| 10:00 AM to 10:59 AM | 15 (0.7%) | 124 (5.5%) |
| 11:00 AM to 11:59 AM | 20 (0.9%) | 0 (0.0%) |
| 12:00 PM to 3:59 PM | 156 (7.0%) | 143 (6.4%) |
| 4:00 PM to 11:59 PM | 197 (8.8%) | 64 (2.9%) |
| Total | 2,242 (100.0%) | 2,245 (100.0%) |
Housing Occupancy in Grand Haven
Occupancy by Ownership in Grand Haven
Of the total 5,169 dwellings in Grand Haven, owner-occupied units account for 3,471 (67.1%), while renter-occupied units make up 1,698 (32.9%).
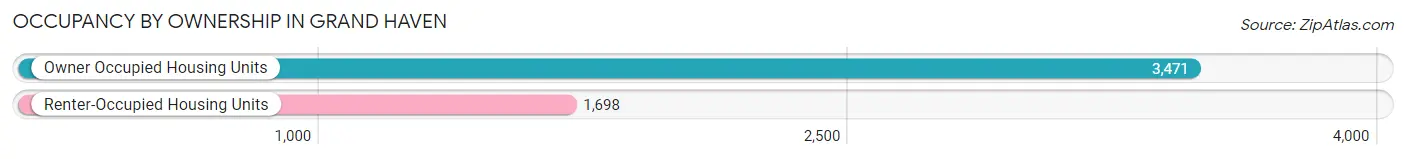
| Occupancy | # Housing Units | % Housing Units |
| Owner Occupied Housing Units | 3,471 | 67.1% |
| Renter-Occupied Housing Units | 1,698 | 32.9% |
| Total Occupied Housing Units | 5,169 | 100.0% |
Occupancy by Household Size in Grand Haven
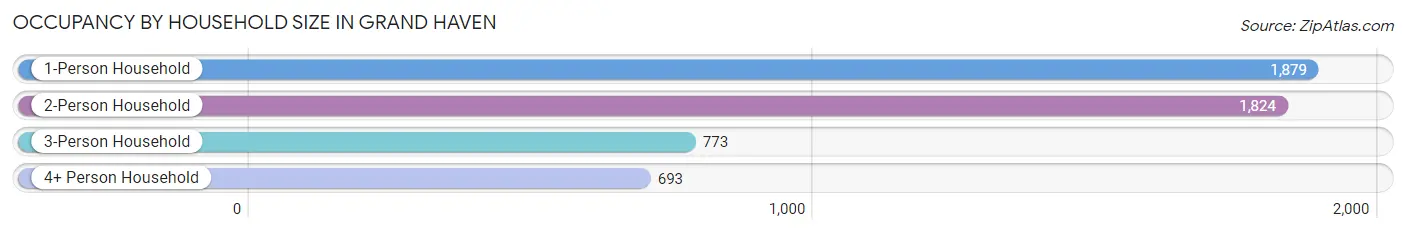
| Household Size | # Housing Units | % Housing Units |
| 1-Person Household | 1,879 | 36.3% |
| 2-Person Household | 1,824 | 35.3% |
| 3-Person Household | 773 | 14.9% |
| 4+ Person Household | 693 | 13.4% |
| Total Housing Units | 5,169 | 100.0% |
Occupancy by Ownership by Household Size in Grand Haven
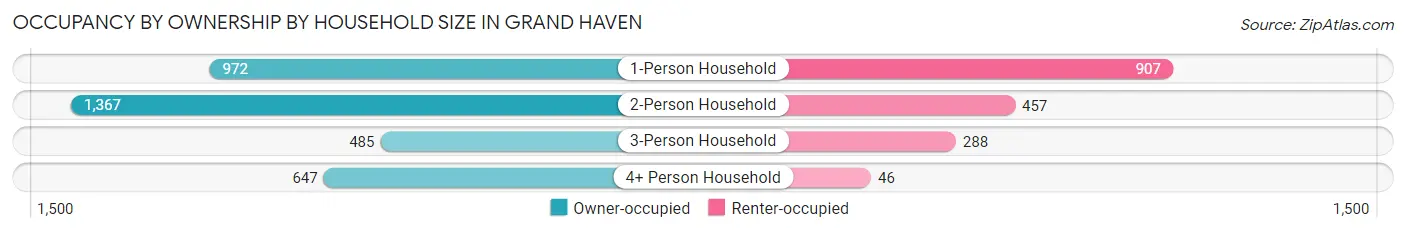
| Household Size | Owner-occupied | Renter-occupied |
| 1-Person Household | 972 (51.7%) | 907 (48.3%) |
| 2-Person Household | 1,367 (75.0%) | 457 (25.1%) |
| 3-Person Household | 485 (62.7%) | 288 (37.3%) |
| 4+ Person Household | 647 (93.4%) | 46 (6.6%) |
| Total Housing Units | 3,471 (67.1%) | 1,698 (32.9%) |
Occupancy by Educational Attainment in Grand Haven
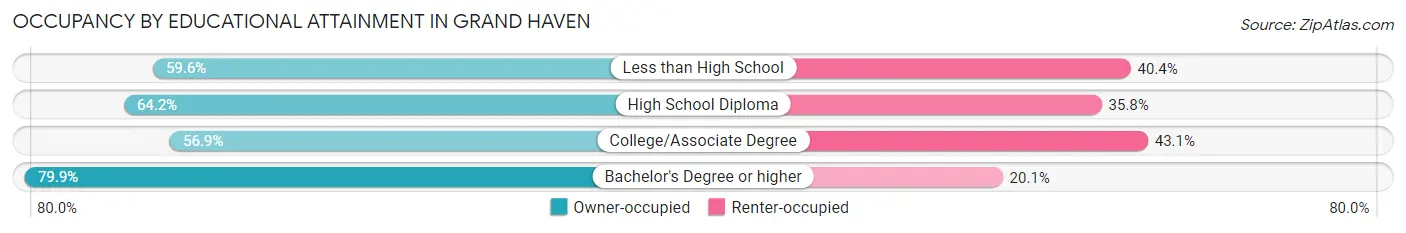
| Household Size | Owner-occupied | Renter-occupied |
| Less than High School | 99 (59.6%) | 67 (40.4%) |
| High School Diploma | 846 (64.2%) | 471 (35.8%) |
| College/Associate Degree | 1,040 (56.9%) | 787 (43.1%) |
| Bachelor's Degree or higher | 1,486 (79.9%) | 373 (20.1%) |
Occupancy by Age of Householder in Grand Haven
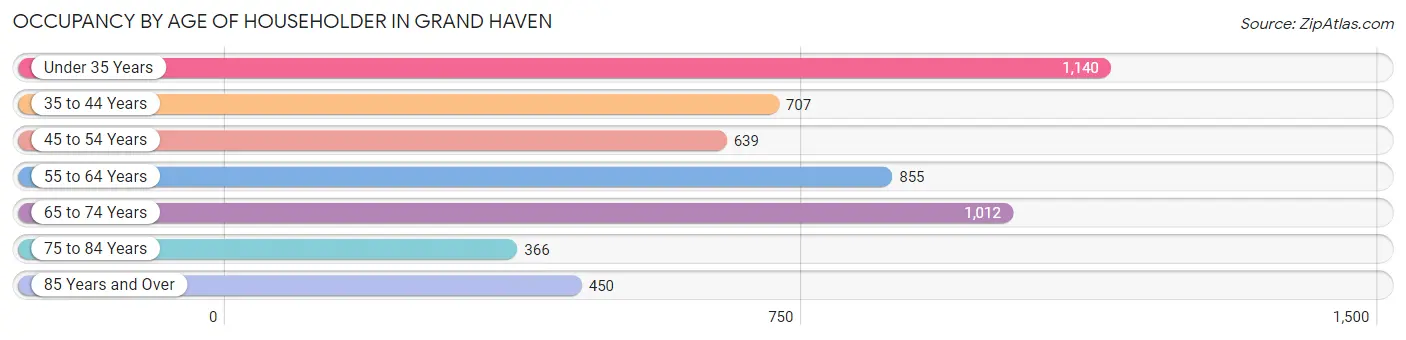
| Age Bracket | # Households | % Households |
| Under 35 Years | 1,140 | 22.1% |
| 35 to 44 Years | 707 | 13.7% |
| 45 to 54 Years | 639 | 12.4% |
| 55 to 64 Years | 855 | 16.5% |
| 65 to 74 Years | 1,012 | 19.6% |
| 75 to 84 Years | 366 | 7.1% |
| 85 Years and Over | 450 | 8.7% |
| Total | 5,169 | 100.0% |
Housing Finances in Grand Haven
Median Income by Occupancy in Grand Haven
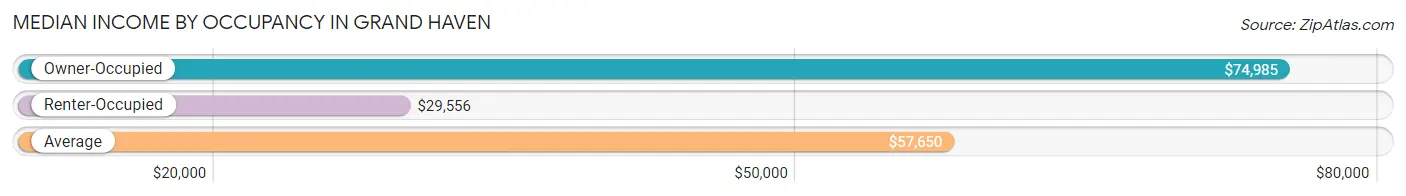
| Occupancy Type | # Households | Median Income |
| Owner-Occupied | 3,471 (67.1%) | $74,985 |
| Renter-Occupied | 1,698 (32.9%) | $29,556 |
| Average | 5,169 (100.0%) | $57,650 |
Occupancy by Householder Income Bracket in Grand Haven
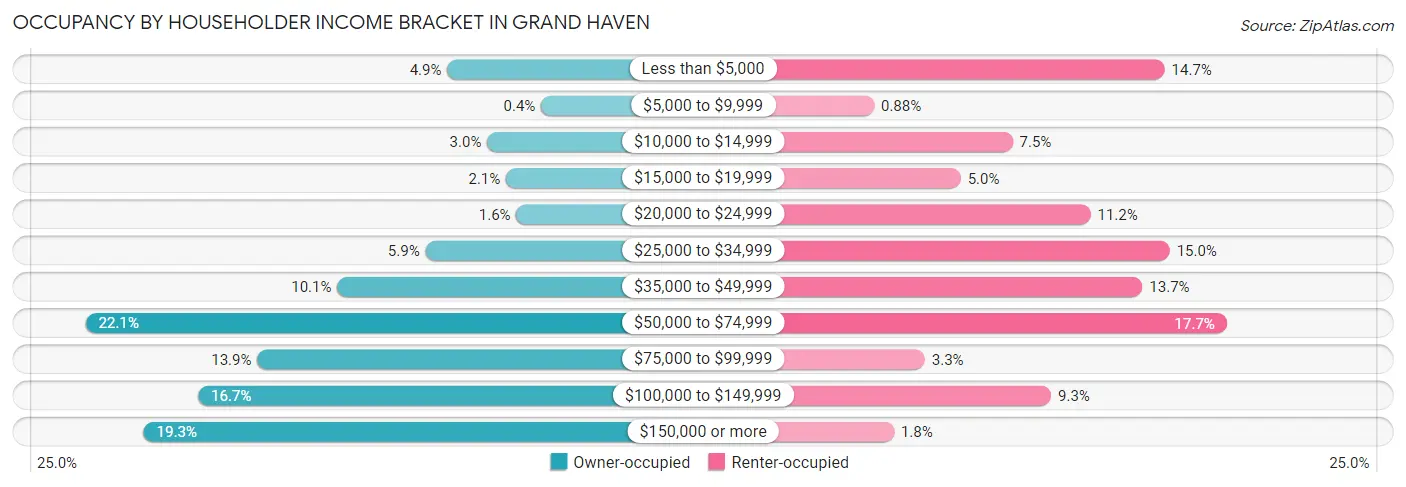
| Income Bracket | Owner-occupied | Renter-occupied |
| Less than $5,000 | 169 (4.9%) | 250 (14.7%) |
| $5,000 to $9,999 | 14 (0.4%) | 15 (0.9%) |
| $10,000 to $14,999 | 103 (3.0%) | 127 (7.5%) |
| $15,000 to $19,999 | 72 (2.1%) | 85 (5.0%) |
| $20,000 to $24,999 | 55 (1.6%) | 190 (11.2%) |
| $25,000 to $34,999 | 205 (5.9%) | 254 (15.0%) |
| $35,000 to $49,999 | 351 (10.1%) | 232 (13.7%) |
| $50,000 to $74,999 | 767 (22.1%) | 300 (17.7%) |
| $75,000 to $99,999 | 483 (13.9%) | 56 (3.3%) |
| $100,000 to $149,999 | 581 (16.7%) | 158 (9.3%) |
| $150,000 or more | 671 (19.3%) | 31 (1.8%) |
| Total | 3,471 (100.0%) | 1,698 (100.0%) |
Monthly Housing Cost Tiers in Grand Haven
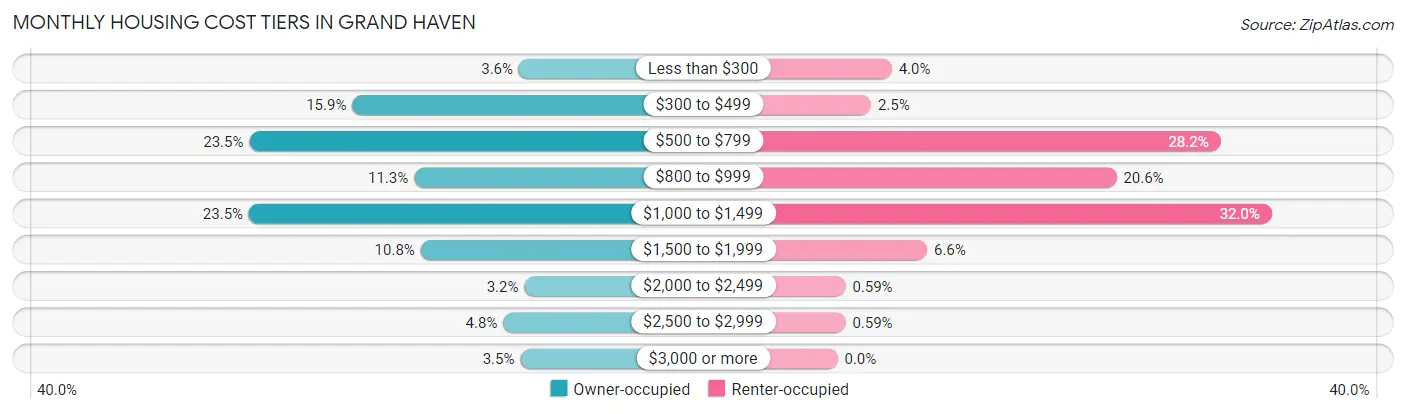
| Monthly Cost | Owner-occupied | Renter-occupied |
| Less than $300 | 125 (3.6%) | 68 (4.0%) |
| $300 to $499 | 551 (15.9%) | 42 (2.5%) |
| $500 to $799 | 814 (23.4%) | 479 (28.2%) |
| $800 to $999 | 393 (11.3%) | 349 (20.5%) |
| $1,000 to $1,499 | 815 (23.5%) | 543 (32.0%) |
| $1,500 to $1,999 | 376 (10.8%) | 112 (6.6%) |
| $2,000 to $2,499 | 111 (3.2%) | 10 (0.6%) |
| $2,500 to $2,999 | 165 (4.8%) | 10 (0.6%) |
| $3,000 or more | 121 (3.5%) | 0 (0.0%) |
| Total | 3,471 (100.0%) | 1,698 (100.0%) |
Physical Housing Characteristics in Grand Haven
Housing Structures in Grand Haven
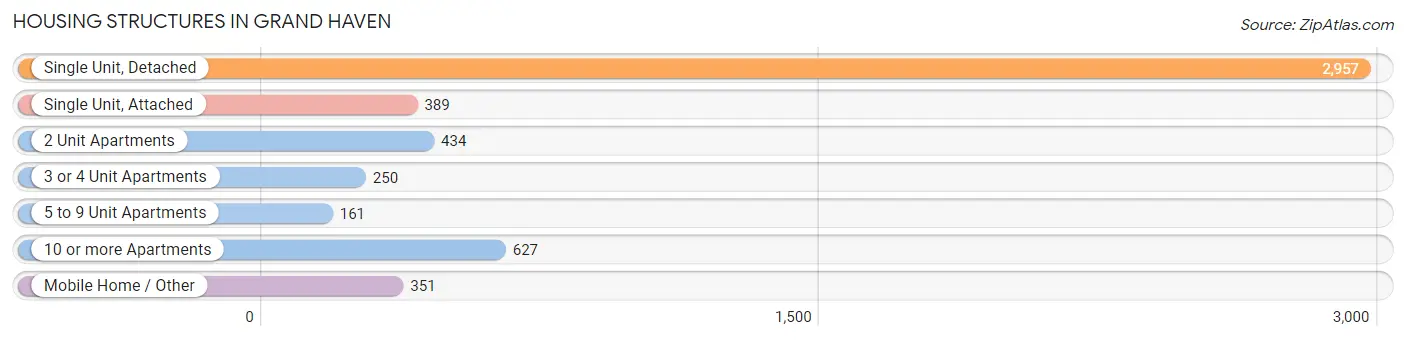
| Structure Type | # Housing Units | % Housing Units |
| Single Unit, Detached | 2,957 | 57.2% |
| Single Unit, Attached | 389 | 7.5% |
| 2 Unit Apartments | 434 | 8.4% |
| 3 or 4 Unit Apartments | 250 | 4.8% |
| 5 to 9 Unit Apartments | 161 | 3.1% |
| 10 or more Apartments | 627 | 12.1% |
| Mobile Home / Other | 351 | 6.8% |
| Total | 5,169 | 100.0% |
Housing Structures by Occupancy in Grand Haven
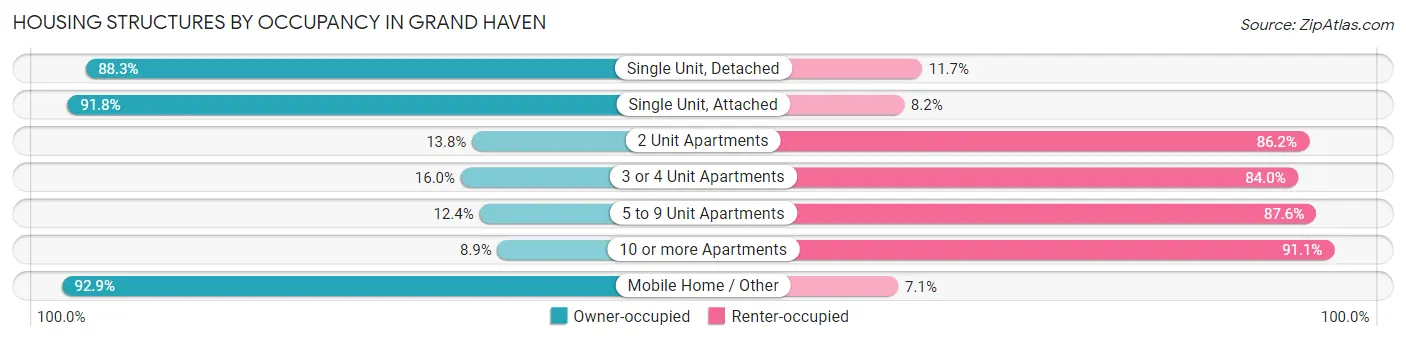
| Structure Type | Owner-occupied | Renter-occupied |
| Single Unit, Detached | 2,612 (88.3%) | 345 (11.7%) |
| Single Unit, Attached | 357 (91.8%) | 32 (8.2%) |
| 2 Unit Apartments | 60 (13.8%) | 374 (86.2%) |
| 3 or 4 Unit Apartments | 40 (16.0%) | 210 (84.0%) |
| 5 to 9 Unit Apartments | 20 (12.4%) | 141 (87.6%) |
| 10 or more Apartments | 56 (8.9%) | 571 (91.1%) |
| Mobile Home / Other | 326 (92.9%) | 25 (7.1%) |
| Total | 3,471 (67.1%) | 1,698 (32.9%) |
Housing Structures by Number of Rooms in Grand Haven
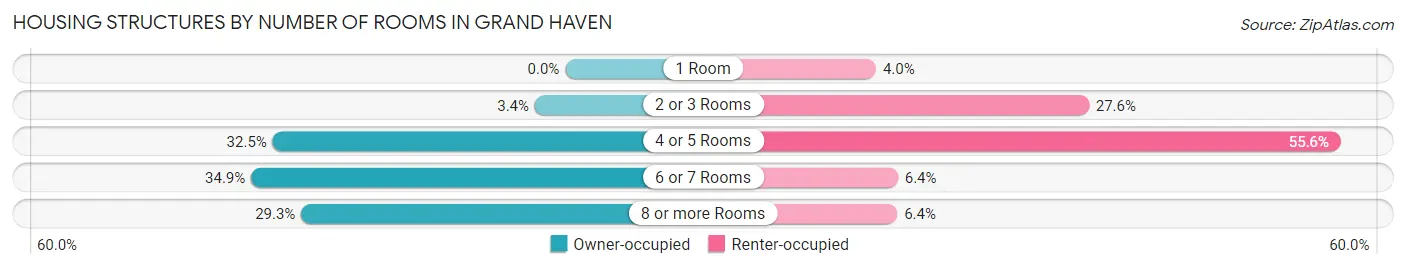
| Number of Rooms | Owner-occupied | Renter-occupied |
| 1 Room | 0 (0.0%) | 68 (4.0%) |
| 2 or 3 Rooms | 117 (3.4%) | 469 (27.6%) |
| 4 or 5 Rooms | 1,127 (32.5%) | 944 (55.6%) |
| 6 or 7 Rooms | 1,210 (34.9%) | 109 (6.4%) |
| 8 or more Rooms | 1,017 (29.3%) | 108 (6.4%) |
| Total | 3,471 (100.0%) | 1,698 (100.0%) |
Housing Structure by Heating Type in Grand Haven
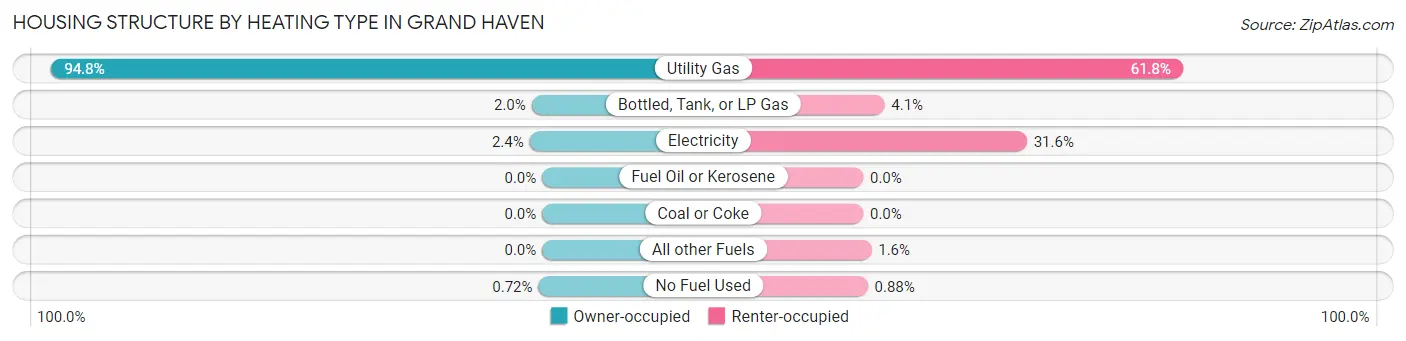
| Heating Type | Owner-occupied | Renter-occupied |
| Utility Gas | 3,292 (94.8%) | 1,049 (61.8%) |
| Bottled, Tank, or LP Gas | 70 (2.0%) | 70 (4.1%) |
| Electricity | 84 (2.4%) | 537 (31.6%) |
| Fuel Oil or Kerosene | 0 (0.0%) | 0 (0.0%) |
| Coal or Coke | 0 (0.0%) | 0 (0.0%) |
| All other Fuels | 0 (0.0%) | 27 (1.6%) |
| No Fuel Used | 25 (0.7%) | 15 (0.9%) |
| Total | 3,471 (100.0%) | 1,698 (100.0%) |
Household Vehicle Usage in Grand Haven
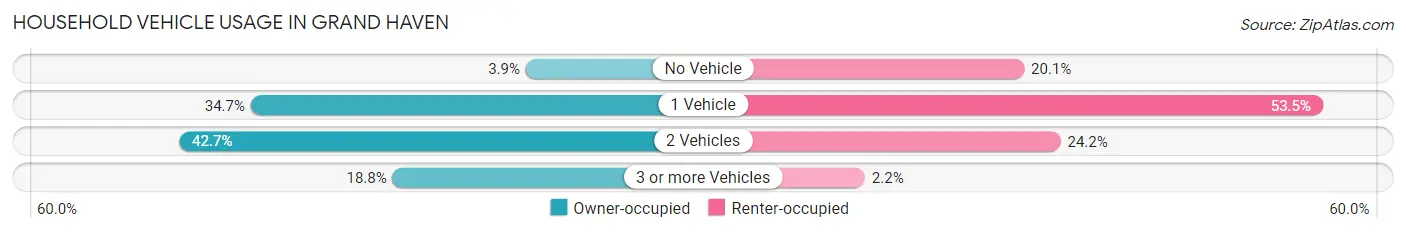
| Vehicles per Household | Owner-occupied | Renter-occupied |
| No Vehicle | 134 (3.9%) | 341 (20.1%) |
| 1 Vehicle | 1,203 (34.7%) | 909 (53.5%) |
| 2 Vehicles | 1,482 (42.7%) | 410 (24.1%) |
| 3 or more Vehicles | 652 (18.8%) | 38 (2.2%) |
| Total | 3,471 (100.0%) | 1,698 (100.0%) |
Real Estate & Mortgages in Grand Haven
Real Estate and Mortgage Overview in Grand Haven
| Characteristic | Without Mortgage | With Mortgage |
| Housing Units | 1,598 | 1,873 |
| Median Property Value | $195,900 | $248,300 |
| Median Household Income | $55,665 | $485 |
| Monthly Housing Costs | $566 | $121 |
| Real Estate Taxes | $2,951 | $61 |
Property Value by Mortgage Status in Grand Haven
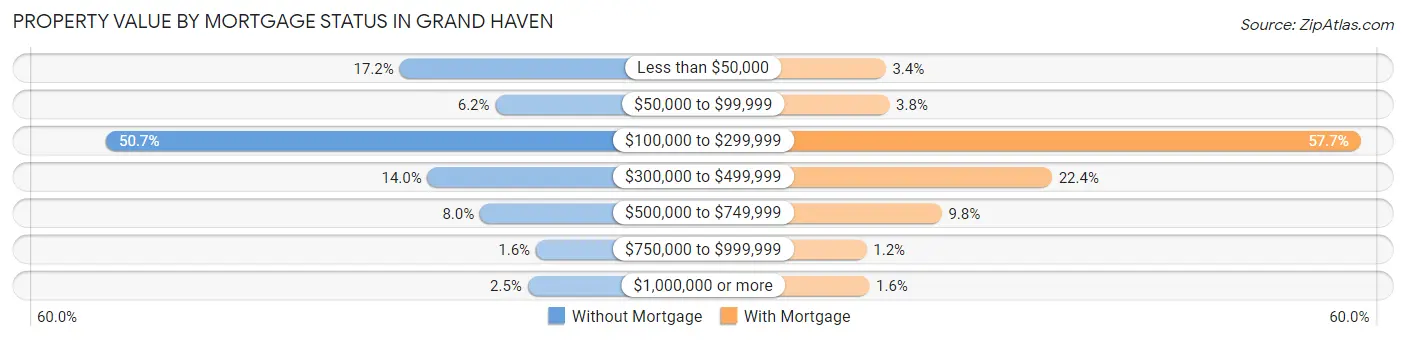
| Property Value | Without Mortgage | With Mortgage |
| Less than $50,000 | 274 (17.2%) | 64 (3.4%) |
| $50,000 to $99,999 | 99 (6.2%) | 72 (3.8%) |
| $100,000 to $299,999 | 810 (50.7%) | 1,081 (57.7%) |
| $300,000 to $499,999 | 223 (14.0%) | 420 (22.4%) |
| $500,000 to $749,999 | 127 (8.0%) | 184 (9.8%) |
| $750,000 to $999,999 | 25 (1.6%) | 23 (1.2%) |
| $1,000,000 or more | 40 (2.5%) | 29 (1.5%) |
| Total | 1,598 (100.0%) | 1,873 (100.0%) |
Household Income by Mortgage Status in Grand Haven
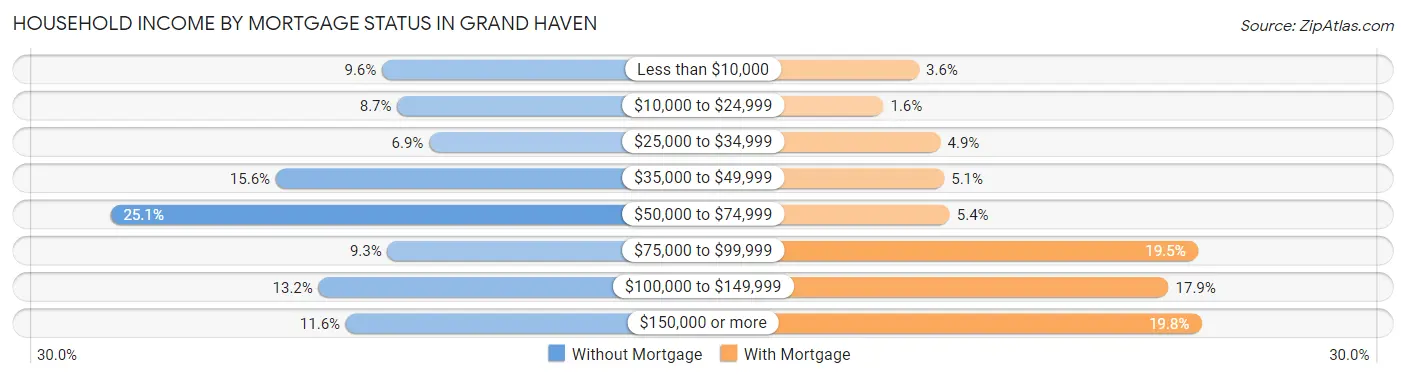
| Household Income | Without Mortgage | With Mortgage |
| Less than $10,000 | 153 (9.6%) | 68 (3.6%) |
| $10,000 to $24,999 | 139 (8.7%) | 30 (1.6%) |
| $25,000 to $34,999 | 110 (6.9%) | 91 (4.9%) |
| $35,000 to $49,999 | 250 (15.6%) | 95 (5.1%) |
| $50,000 to $74,999 | 401 (25.1%) | 101 (5.4%) |
| $75,000 to $99,999 | 148 (9.3%) | 366 (19.5%) |
| $100,000 to $149,999 | 211 (13.2%) | 335 (17.9%) |
| $150,000 or more | 186 (11.6%) | 370 (19.8%) |
| Total | 1,598 (100.0%) | 1,873 (100.0%) |
Property Value to Household Income Ratio in Grand Haven
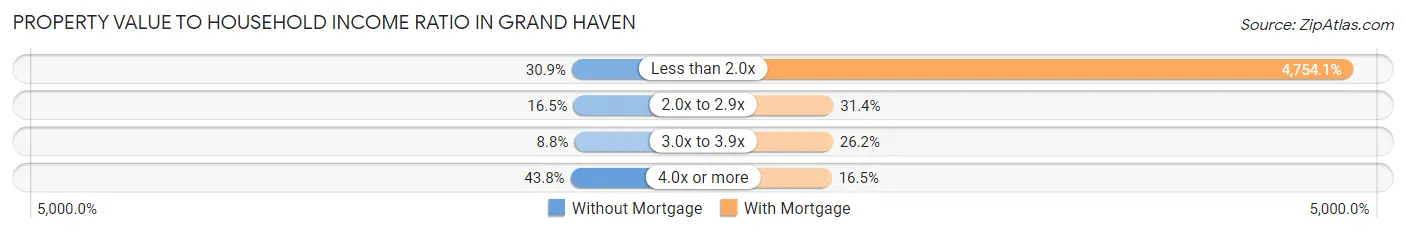
| Value-to-Income Ratio | Without Mortgage | With Mortgage |
| Less than 2.0x | 493 (30.8%) | 89,044 (4,754.1%) |
| 2.0x to 2.9x | 264 (16.5%) | 588 (31.4%) |
| 3.0x to 3.9x | 141 (8.8%) | 491 (26.2%) |
| 4.0x or more | 700 (43.8%) | 309 (16.5%) |
| Total | 1,598 (100.0%) | 1,873 (100.0%) |
Real Estate Taxes by Mortgage Status in Grand Haven
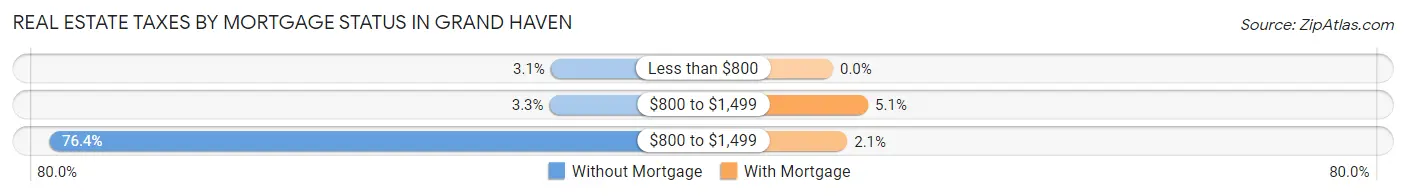
| Property Taxes | Without Mortgage | With Mortgage |
| Less than $800 | 50 (3.1%) | 0 (0.0%) |
| $800 to $1,499 | 53 (3.3%) | 96 (5.1%) |
| $800 to $1,499 | 1,221 (76.4%) | 39 (2.1%) |
| Total | 1,598 (100.0%) | 1,873 (100.0%) |
Health & Disability in Grand Haven
Health Insurance Coverage by Age in Grand Haven
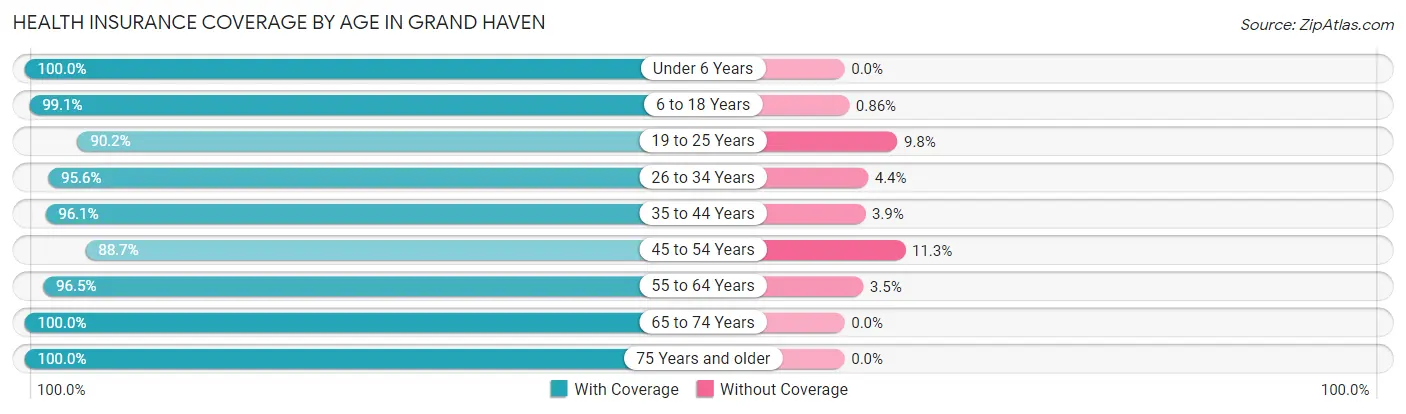
| Age Bracket | With Coverage | Without Coverage |
| Under 6 Years | 600 (100.0%) | 0 (0.0%) |
| 6 to 18 Years | 1,496 (99.1%) | 13 (0.9%) |
| 19 to 25 Years | 779 (90.2%) | 85 (9.8%) |
| 26 to 34 Years | 1,463 (95.6%) | 67 (4.4%) |
| 35 to 44 Years | 1,071 (96.1%) | 43 (3.9%) |
| 45 to 54 Years | 1,041 (88.7%) | 133 (11.3%) |
| 55 to 64 Years | 1,335 (96.5%) | 48 (3.5%) |
| 65 to 74 Years | 1,499 (100.0%) | 0 (0.0%) |
| 75 Years and older | 1,111 (100.0%) | 0 (0.0%) |
| Total | 10,395 (96.4%) | 389 (3.6%) |
Health Insurance Coverage by Citizenship Status in Grand Haven
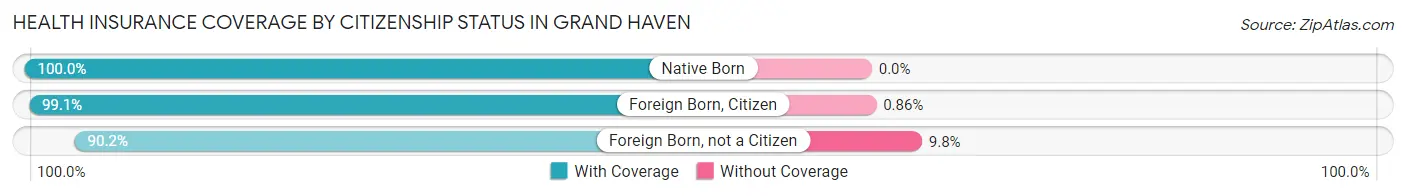
| Citizenship Status | With Coverage | Without Coverage |
| Native Born | 600 (100.0%) | 0 (0.0%) |
| Foreign Born, Citizen | 1,496 (99.1%) | 13 (0.9%) |
| Foreign Born, not a Citizen | 779 (90.2%) | 85 (9.8%) |
Health Insurance Coverage by Household Income in Grand Haven
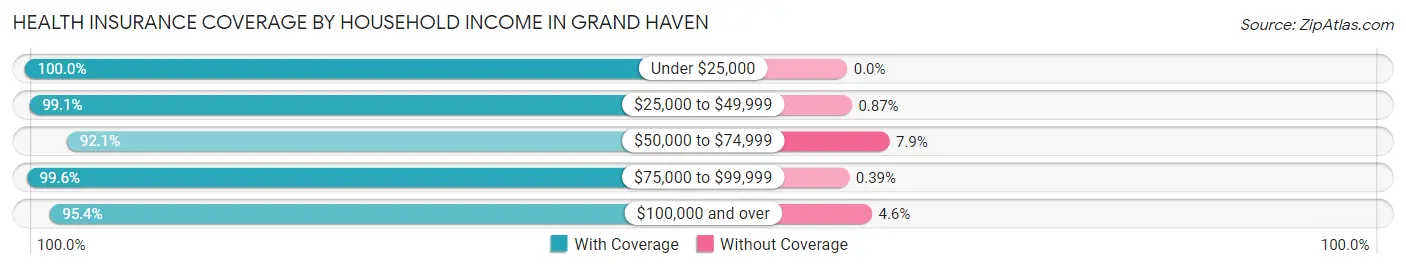
| Household Income | With Coverage | Without Coverage |
| Under $25,000 | 1,544 (100.0%) | 0 (0.0%) |
| $25,000 to $49,999 | 1,588 (99.1%) | 14 (0.9%) |
| $50,000 to $74,999 | 2,118 (92.1%) | 182 (7.9%) |
| $75,000 to $99,999 | 1,289 (99.6%) | 5 (0.4%) |
| $100,000 and over | 3,835 (95.4%) | 186 (4.6%) |
Public vs Private Health Insurance Coverage by Age in Grand Haven
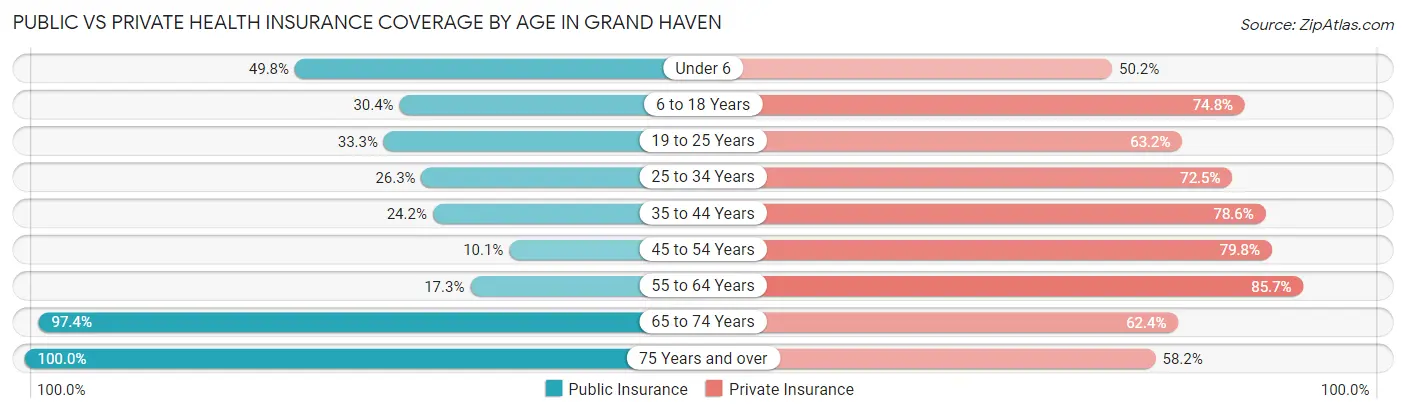
| Age Bracket | Public Insurance | Private Insurance |
| Under 6 | 299 (49.8%) | 301 (50.2%) |
| 6 to 18 Years | 459 (30.4%) | 1,129 (74.8%) |
| 19 to 25 Years | 288 (33.3%) | 546 (63.2%) |
| 25 to 34 Years | 403 (26.3%) | 1,109 (72.5%) |
| 35 to 44 Years | 270 (24.2%) | 876 (78.6%) |
| 45 to 54 Years | 118 (10.1%) | 937 (79.8%) |
| 55 to 64 Years | 239 (17.3%) | 1,185 (85.7%) |
| 65 to 74 Years | 1,460 (97.4%) | 936 (62.4%) |
| 75 Years and over | 1,111 (100.0%) | 647 (58.2%) |
| Total | 4,647 (43.1%) | 7,666 (71.1%) |
Disability Status by Sex by Age in Grand Haven
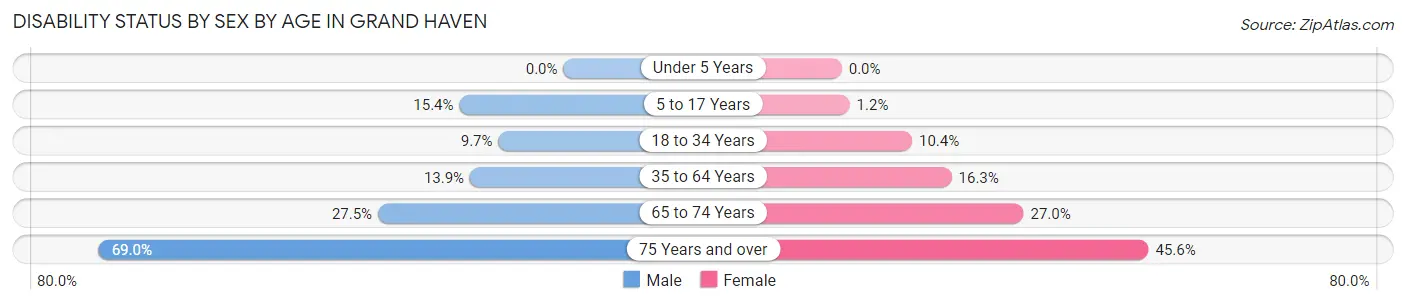
| Age Bracket | Male | Female |
| Under 5 Years | 0 (0.0%) | 0 (0.0%) |
| 5 to 17 Years | 120 (15.4%) | 8 (1.2%) |
| 18 to 34 Years | 113 (9.7%) | 148 (10.4%) |
| 35 to 64 Years | 266 (13.9%) | 286 (16.3%) |
| 65 to 74 Years | 174 (27.5%) | 234 (27.0%) |
| 75 Years and over | 247 (69.0%) | 343 (45.6%) |
Disability Class by Sex by Age in Grand Haven
Disability Class: Hearing Difficulty
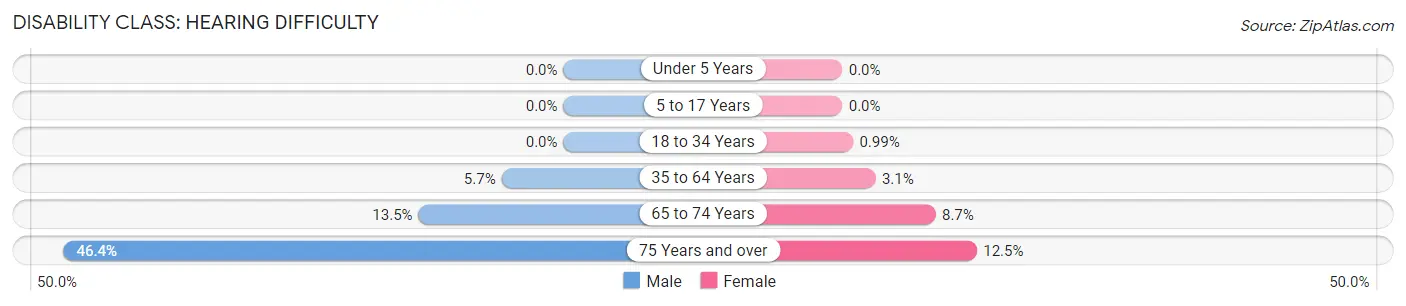
| Age Bracket | Male | Female |
| Under 5 Years | 0 (0.0%) | 0 (0.0%) |
| 5 to 17 Years | 0 (0.0%) | 0 (0.0%) |
| 18 to 34 Years | 0 (0.0%) | 14 (1.0%) |
| 35 to 64 Years | 110 (5.7%) | 54 (3.1%) |
| 65 to 74 Years | 85 (13.5%) | 75 (8.6%) |
| 75 Years and over | 166 (46.4%) | 94 (12.5%) |
Disability Class: Vision Difficulty
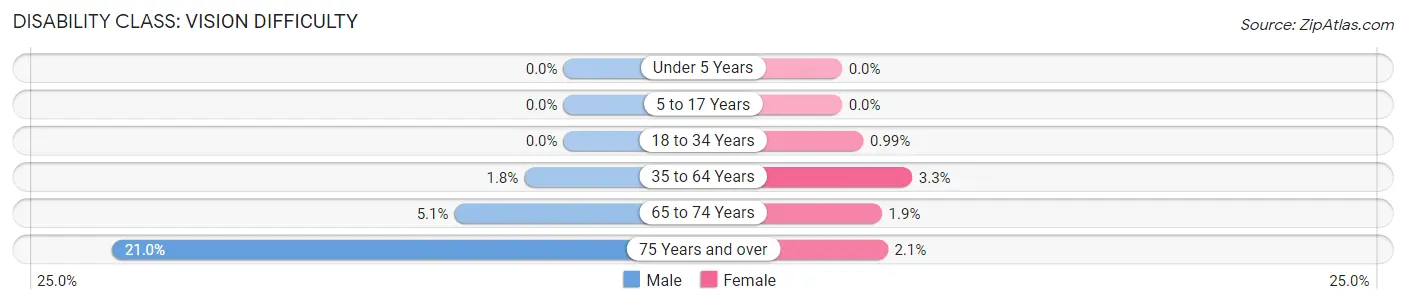
| Age Bracket | Male | Female |
| Under 5 Years | 0 (0.0%) | 0 (0.0%) |
| 5 to 17 Years | 0 (0.0%) | 0 (0.0%) |
| 18 to 34 Years | 0 (0.0%) | 14 (1.0%) |
| 35 to 64 Years | 35 (1.8%) | 57 (3.3%) |
| 65 to 74 Years | 32 (5.1%) | 16 (1.8%) |
| 75 Years and over | 75 (20.9%) | 16 (2.1%) |
Disability Class: Cognitive Difficulty
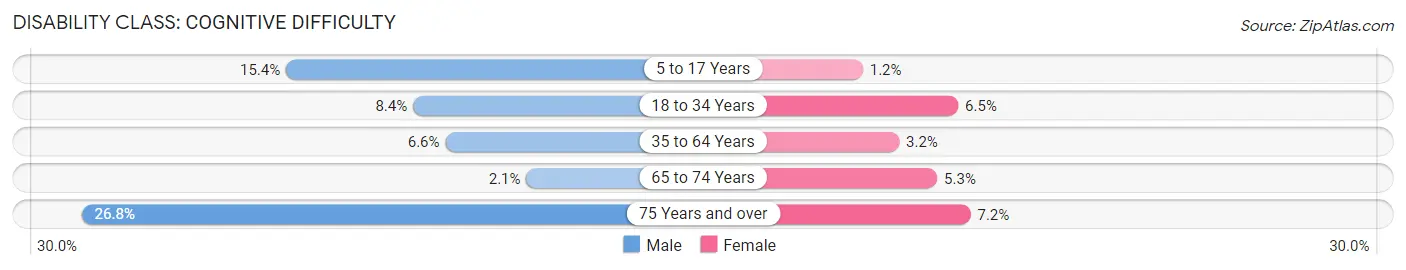
| Age Bracket | Male | Female |
| 5 to 17 Years | 120 (15.4%) | 8 (1.2%) |
| 18 to 34 Years | 98 (8.4%) | 92 (6.5%) |
| 35 to 64 Years | 126 (6.6%) | 56 (3.2%) |
| 65 to 74 Years | 13 (2.1%) | 46 (5.3%) |
| 75 Years and over | 96 (26.8%) | 54 (7.2%) |
Disability Class: Ambulatory Difficulty
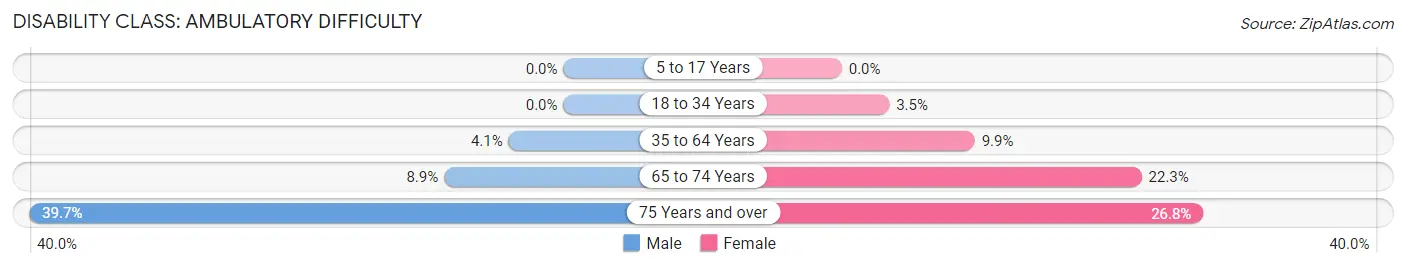
| Age Bracket | Male | Female |
| 5 to 17 Years | 0 (0.0%) | 0 (0.0%) |
| 18 to 34 Years | 0 (0.0%) | 50 (3.5%) |
| 35 to 64 Years | 78 (4.1%) | 173 (9.9%) |
| 65 to 74 Years | 56 (8.9%) | 193 (22.3%) |
| 75 Years and over | 142 (39.7%) | 202 (26.8%) |
Disability Class: Self-Care Difficulty
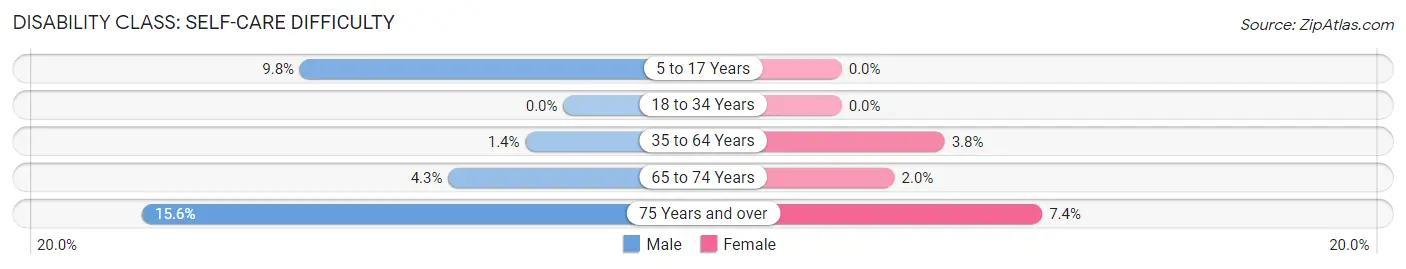
| Age Bracket | Male | Female |
| 5 to 17 Years | 76 (9.8%) | 0 (0.0%) |
| 18 to 34 Years | 0 (0.0%) | 0 (0.0%) |
| 35 to 64 Years | 27 (1.4%) | 67 (3.8%) |
| 65 to 74 Years | 27 (4.3%) | 17 (2.0%) |
| 75 Years and over | 56 (15.6%) | 56 (7.4%) |
Technology Access in Grand Haven
Computing Device Access in Grand Haven
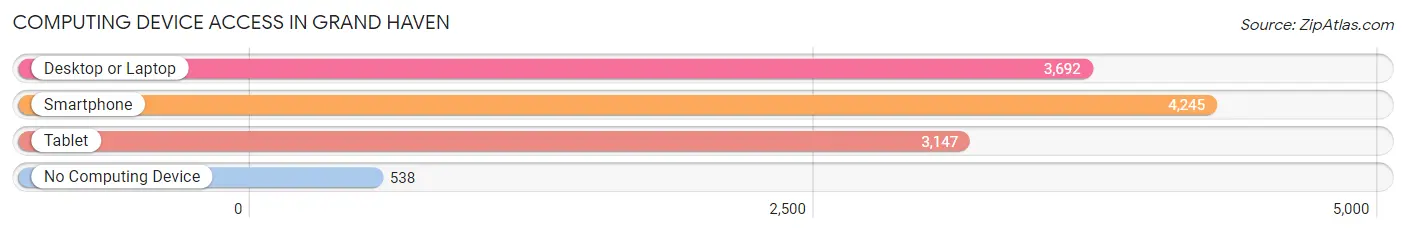
| Device Type | # Households | % Households |
| Desktop or Laptop | 3,692 | 71.4% |
| Smartphone | 4,245 | 82.1% |
| Tablet | 3,147 | 60.9% |
| No Computing Device | 538 | 10.4% |
| Total | 5,169 | 100.0% |
Internet Access in Grand Haven
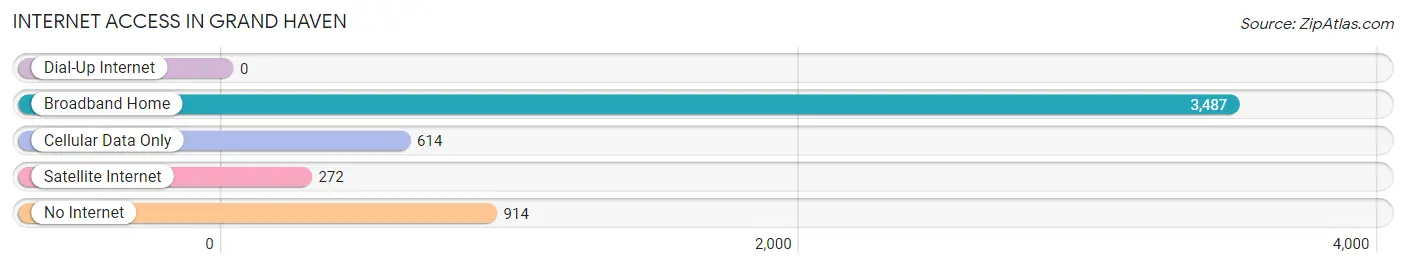
| Internet Type | # Households | % Households |
| Dial-Up Internet | 0 | 0.0% |
| Broadband Home | 3,487 | 67.5% |
| Cellular Data Only | 614 | 11.9% |
| Satellite Internet | 272 | 5.3% |
| No Internet | 914 | 17.7% |
| Total | 5,169 | 100.0% |
Grand Haven Summary
History
Grand Haven, Michigan is a city located on the eastern shore of Lake Michigan in Ottawa County. It is the county seat of Ottawa County and is part of the Grand Rapids metropolitan area. The city was founded in 1835 by French-Canadian fur trader Louis Campau, who named it after his grandfather’s hometown of Grand Haven, France.
Grand Haven was initially a small fishing village, but it quickly grew into a bustling port town. In 1837, the first lighthouse was built on the shores of Lake Michigan, and in 1847, the first steamboat arrived in Grand Haven. The city was incorporated in 1867, and by the late 19th century, it had become a popular summer resort destination.
The city’s economy was largely based on the lumber industry, and it was home to several sawmills and shipbuilding companies. In the early 20th century, the city’s economy shifted to tourism, and it became known as the “Coast Guard City” due to its proximity to the U.S. Coast Guard station.
Geography
Grand Haven is located on the eastern shore of Lake Michigan in Ottawa County, Michigan. It is situated at the mouth of the Grand River, which flows into Lake Michigan. The city is bordered by the cities of Ferrysburg to the north, Spring Lake to the east, and Grand Haven Township to the south and west.
The city has a total area of 8.3 square miles, of which 7.9 square miles is land and 0.4 square miles is water. The terrain is mostly flat, with some rolling hills in the northern part of the city. The highest point in the city is located at the intersection of US-31 and Robbins Road, which is approximately 200 feet above sea level.
Economy
Grand Haven’s economy is largely based on tourism and manufacturing. The city is home to several large manufacturing companies, including Grand Haven Plastics, Grand Haven Steel, and Grand Haven Industries. The city is also home to several retail stores, restaurants, and other businesses.
The city’s tourism industry is centered around its beaches, marinas, and other attractions. The city is home to several popular beaches, including Grand Haven State Park, Grand Haven Beach, and Grand Haven City Beach. The city also has several marinas, including Grand Haven Marina, Grand Haven Yacht Club, and Grand Haven Harbor.
Demographics
As of the 2010 census, the population of Grand Haven was 10,412. The racial makeup of the city was 94.2% White, 1.3% African American, 0.5% Native American, 1.2% Asian, 0.1% Pacific Islander, 1.2% from other races, and 1.5% from two or more races. Hispanic or Latino of any race were 3.2% of the population.
The median household income in Grand Haven was $45,945, and the median family income was $54,945. The per capita income for the city was $25,945. About 8.2% of families and 10.7% of the population were below the poverty line, including 15.2% of those under age 18 and 6.2% of those age 65 or over.
Common Questions
What is Per Capita Income in Grand Haven?
Per Capita income in Grand Haven is $38,487.
What is the Median Family Income in Grand Haven?
Median Family Income in Grand Haven is $79,489.
What is the Median Household income in Grand Haven?
Median Household Income in Grand Haven is $57,650.
What is Income or Wage Gap in Grand Haven?
Income or Wage Gap in Grand Haven is 47.0%.
Women in Grand Haven earn 53.0 cents for every dollar earned by a man.
What is Family Income Deficit in Grand Haven?
Family Income Deficit in Grand Haven is $10,914.
Families that are below poverty line in Grand Haven earn $10,914 less on average than the poverty threshold level.
What is Inequality or Gini Index in Grand Haven?
Inequality or Gini Index in Grand Haven is 0.47.
What is the Total Population of Grand Haven?
Total Population of Grand Haven is 10,961.
What is the Total Male Population of Grand Haven?
Total Male Population of Grand Haven is 5,101.
What is the Total Female Population of Grand Haven?
Total Female Population of Grand Haven is 5,860.
What is the Ratio of Males per 100 Females in Grand Haven?
There are 87.05 Males per 100 Females in Grand Haven.
What is the Ratio of Females per 100 Males in Grand Haven?
There are 114.88 Females per 100 Males in Grand Haven.
What is the Median Population Age in Grand Haven?
Median Population Age in Grand Haven is 43.7 Years.
What is the Average Family Size in Grand Haven
Average Family Size in Grand Haven is 2.7 People.
What is the Average Household Size in Grand Haven
Average Household Size in Grand Haven is 2.1 People.
How Large is the Labor Force in Grand Haven?
There are 5,385 People in the Labor Forcein in Grand Haven.
What is the Percentage of People in the Labor Force in Grand Haven?
58.6% of People are in the Labor Force in Grand Haven.
What is the Unemployment Rate in Grand Haven?
Unemployment Rate in Grand Haven is 5.1%.