Powellville, MD Map & Demographics
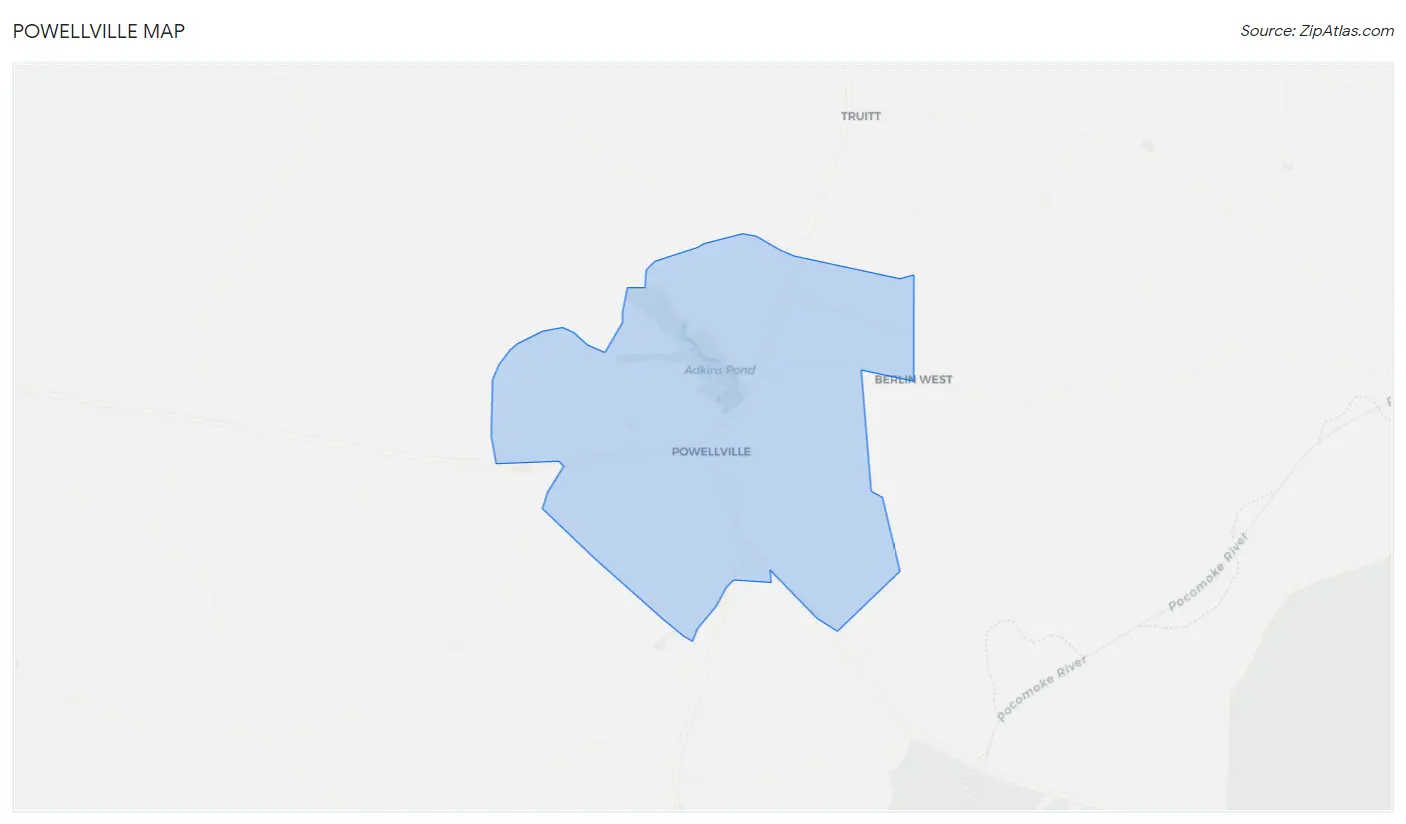
Powellville Map
Powellville Overview
$39,348
PER CAPITA INCOME
$54,853
AVG HOUSEHOLD INCOME
5.6%
WAGE / INCOME GAP [ % ]
94.4¢/ $1
WAGE / INCOME GAP [ $ ]
0.20
INEQUALITY / GINI INDEX
140
TOTAL POPULATION
82
MALE POPULATION
58
FEMALE POPULATION
141.38
MALES / 100 FEMALES
70.73
FEMALES / 100 MALES
58.0
MEDIAN AGE
4.0
AVG FAMILY SIZE
1.8
AVG HOUSEHOLD SIZE
74
LABOR FORCE [ PEOPLE ]
62.7%
PERCENT IN LABOR FORCE
Powellville Area Codes
Income in Powellville
Income Overview in Powellville
| Characteristic | Number | Measure |
| Per Capita Income | 140 | $39,348 |
| Median Family Income | 18 | $0 |
| Mean Family Income | 18 | $0 |
| Median Household Income | 76 | $54,853 |
| Mean Household Income | 76 | $72,658 |
| Income Deficit | 18 | $0 |
| Wage / Income Gap (%) | 140 | 5.58% |
| Wage / Income Gap ($) | 140 | 94.42¢ per $1 |
| Gini / Inequality Index | 140 | 0.20 |
Earnings by Sex in Powellville
Average Earnings in Powellville are $53,787, $53,346 for men and $56,500 for women, a difference of 5.6%.
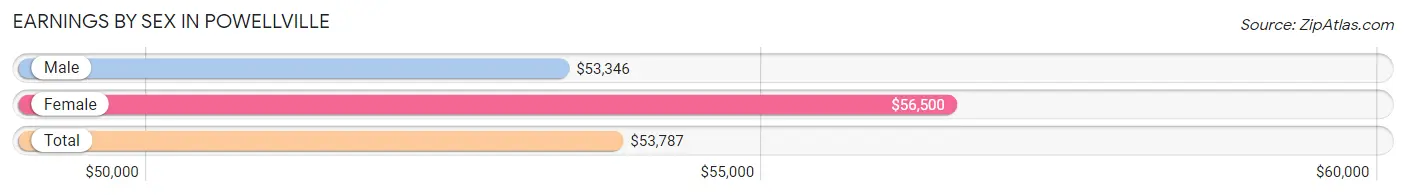
| Sex | Number | Average Earnings |
| Male | 63 (70.8%) | $53,346 |
| Female | 26 (29.2%) | $56,500 |
| Total | 89 (100.0%) | $53,787 |
Earnings by Sex by Income Bracket in Powellville
The most common earnings brackets in Powellville are $50,000 to $54,999 for men (34 | 54.0%) and $55,000 to $64,999 for women (10 | 38.5%).
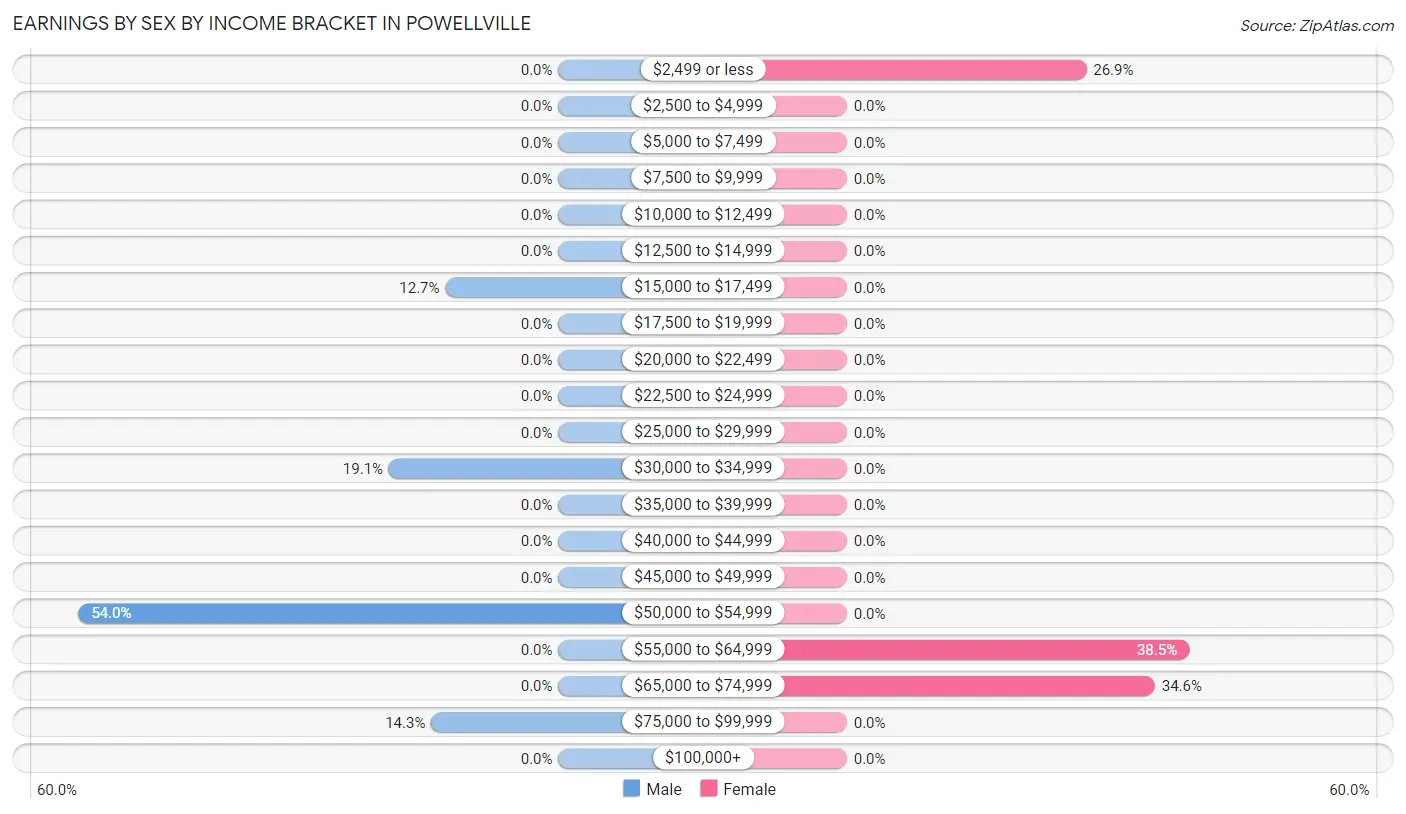
| Income | Male | Female |
| $2,499 or less | 0 (0.0%) | 7 (26.9%) |
| $2,500 to $4,999 | 0 (0.0%) | 0 (0.0%) |
| $5,000 to $7,499 | 0 (0.0%) | 0 (0.0%) |
| $7,500 to $9,999 | 0 (0.0%) | 0 (0.0%) |
| $10,000 to $12,499 | 0 (0.0%) | 0 (0.0%) |
| $12,500 to $14,999 | 0 (0.0%) | 0 (0.0%) |
| $15,000 to $17,499 | 8 (12.7%) | 0 (0.0%) |
| $17,500 to $19,999 | 0 (0.0%) | 0 (0.0%) |
| $20,000 to $22,499 | 0 (0.0%) | 0 (0.0%) |
| $22,500 to $24,999 | 0 (0.0%) | 0 (0.0%) |
| $25,000 to $29,999 | 0 (0.0%) | 0 (0.0%) |
| $30,000 to $34,999 | 12 (19.1%) | 0 (0.0%) |
| $35,000 to $39,999 | 0 (0.0%) | 0 (0.0%) |
| $40,000 to $44,999 | 0 (0.0%) | 0 (0.0%) |
| $45,000 to $49,999 | 0 (0.0%) | 0 (0.0%) |
| $50,000 to $54,999 | 34 (54.0%) | 0 (0.0%) |
| $55,000 to $64,999 | 0 (0.0%) | 10 (38.5%) |
| $65,000 to $74,999 | 0 (0.0%) | 9 (34.6%) |
| $75,000 to $99,999 | 9 (14.3%) | 0 (0.0%) |
| $100,000+ | 0 (0.0%) | 0 (0.0%) |
| Total | 63 (100.0%) | 26 (100.0%) |
Earnings by Sex by Educational Attainment in Powellville
| Educational Attainment | Male Income | Female Income |
| Less than High School | - | - |
| High School Diploma | - | - |
| College or Associate's Degree | - | - |
| Bachelor's Degree | - | - |
| Graduate Degree | - | - |
| Total | $53,346 | $0 |
Family Income in Powellville
Family Income Brackets in Powellville
According to the Powellville family income data, there are 10 families falling into the $75,000 to $99,999 income range, which is the most common income bracket and makes up 55.6% of all families.
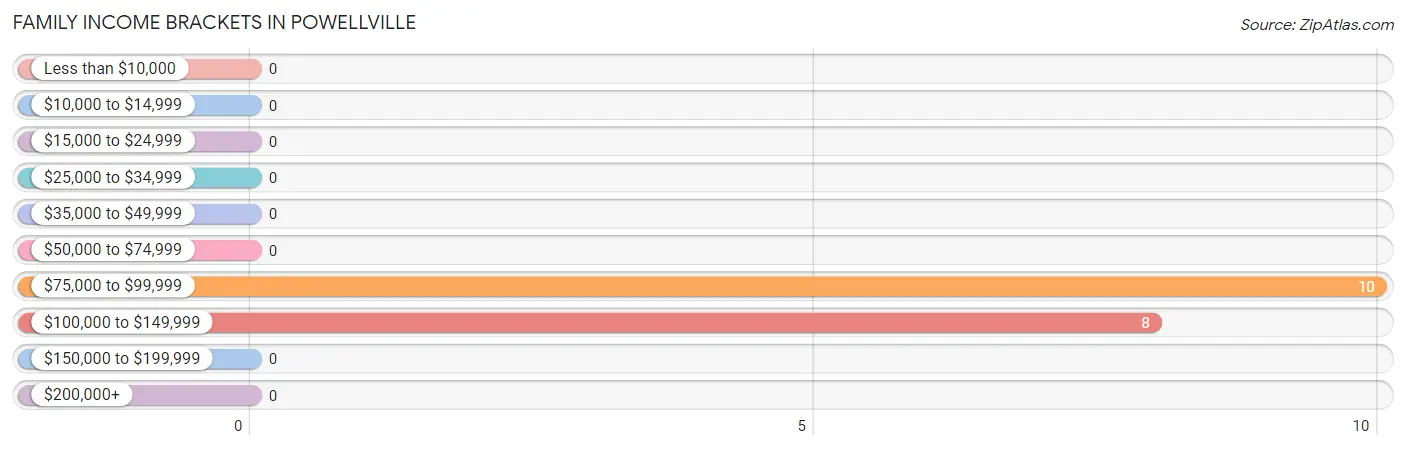
| Income Bracket | # Families | % Families |
| Less than $10,000 | 0 | 0.0% |
| $10,000 to $14,999 | 0 | 0.0% |
| $15,000 to $24,999 | 0 | 0.0% |
| $25,000 to $34,999 | 0 | 0.0% |
| $35,000 to $49,999 | 0 | 0.0% |
| $50,000 to $74,999 | 0 | 0.0% |
| $75,000 to $99,999 | 10 | 55.6% |
| $100,000 to $149,999 | 8 | 44.4% |
| $150,000 to $199,999 | 0 | 0.0% |
| $200,000+ | 0 | 0.0% |
Family Income by Famaliy Size in Powellville
| Income Bracket | # Families | Median Income |
| 2-Person Families | 0 (0.0%) | $0 |
| 3-Person Families | 8 (44.4%) | $0 |
| 4-Person Families | 0 (0.0%) | $0 |
| 5-Person Families | 10 (55.6%) | $0 |
| 6-Person Families | 0 (0.0%) | $0 |
| 7+ Person Families | 0 (0.0%) | $0 |
| Total | 18 (100.0%) | $0 |
Family Income by Number of Earners in Powellville
| Number of Earners | # Families | Median Income |
| No Earners | 0 (0.0%) | $0 |
| 1 Earner | 8 (44.4%) | $0 |
| 2 Earners | 0 (0.0%) | $0 |
| 3+ Earners | 10 (55.6%) | $0 |
| Total | 18 (100.0%) | $0 |
Household Income in Powellville
Household Income Brackets in Powellville
With 43 households falling in the category, the $50,000 to $74,999 income range is the most frequent in Powellville, accounting for 56.6% of all households.
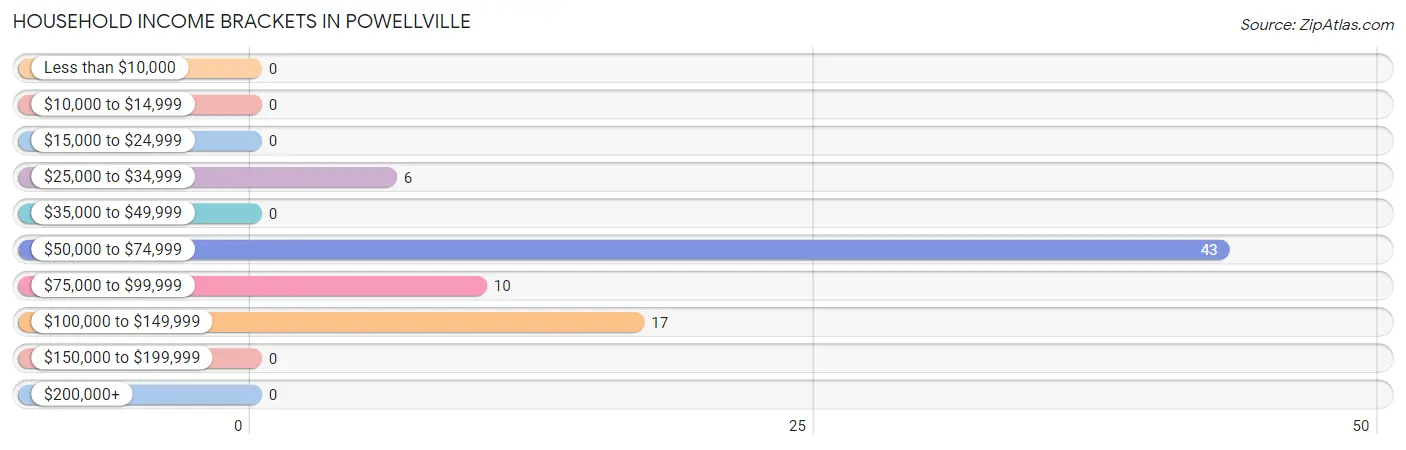
| Income Bracket | # Households | % Households |
| Less than $10,000 | 0 | 0.0% |
| $10,000 to $14,999 | 0 | 0.0% |
| $15,000 to $24,999 | 0 | 0.0% |
| $25,000 to $34,999 | 6 | 7.9% |
| $35,000 to $49,999 | 0 | 0.0% |
| $50,000 to $74,999 | 43 | 56.6% |
| $75,000 to $99,999 | 10 | 13.2% |
| $100,000 to $149,999 | 17 | 22.4% |
| $150,000 to $199,999 | 0 | 0.0% |
| $200,000+ | 0 | 0.0% |
Household Income by Householder Age in Powellville
The median household income in Powellville is $54,853, with the highest median household income of $111,528 found in the 65+ years age bracket for the primary householder. A total of 23 households (30.3%) fall into this category. Meanwhile, the 15 to 24 years age bracket for the primary householder has the lowest median household income of $0, with 9 households (11.8%) in this group.
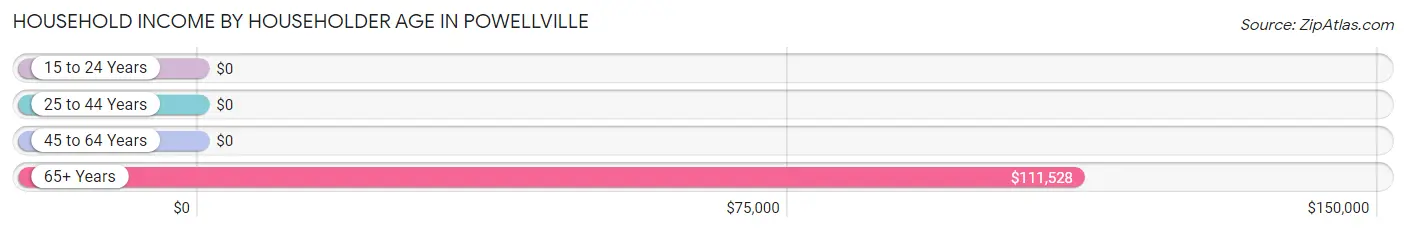
| Income Bracket | # Households | Median Income |
| 15 to 24 Years | 9 (11.8%) | $0 |
| 25 to 44 Years | 10 (13.2%) | $0 |
| 45 to 64 Years | 34 (44.7%) | $0 |
| 65+ Years | 23 (30.3%) | $111,528 |
| Total | 76 (100.0%) | $54,853 |
Poverty in Powellville
Income Below Poverty by Sex and Age in Powellville
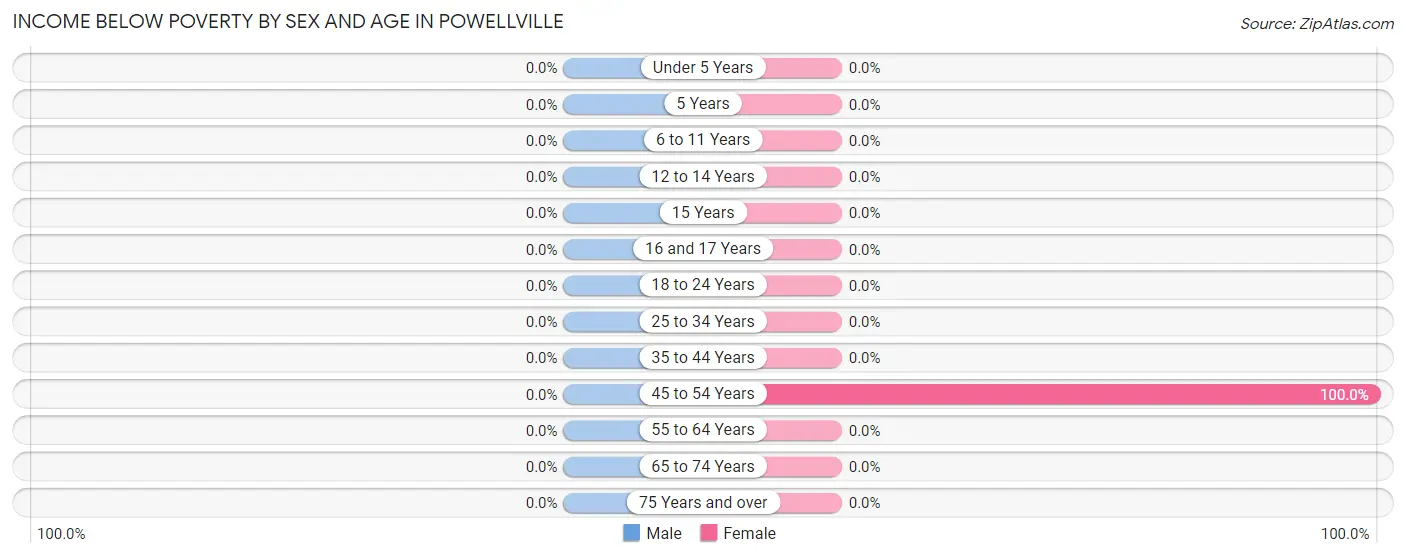
| Age Bracket | Male | Female |
| Under 5 Years | 0 (0.0%) | 0 (0.0%) |
| 5 Years | 0 (0.0%) | 0 (0.0%) |
| 6 to 11 Years | 0 (0.0%) | 0 (0.0%) |
| 12 to 14 Years | 0 (0.0%) | 0 (0.0%) |
| 15 Years | 0 (0.0%) | 0 (0.0%) |
| 16 and 17 Years | 0 (0.0%) | 0 (0.0%) |
| 18 to 24 Years | 0 (0.0%) | 0 (0.0%) |
| 25 to 34 Years | 0 (0.0%) | 0 (0.0%) |
| 35 to 44 Years | 0 (0.0%) | 0 (0.0%) |
| 45 to 54 Years | 0 (0.0%) | 10 (100.0%) |
| 55 to 64 Years | 0 (0.0%) | 0 (0.0%) |
| 65 to 74 Years | 0 (0.0%) | 0 (0.0%) |
| 75 Years and over | 0 (0.0%) | 0 (0.0%) |
| Total | 0 (0.0%) | 10 (17.2%) |
Income Above Poverty by Sex and Age in Powellville
According to the poverty statistics in Powellville, males aged 15 years and females aged 6 to 11 years are the age groups that are most secure financially, with 100.0% of males and 100.0% of females in these age groups living above the poverty line.
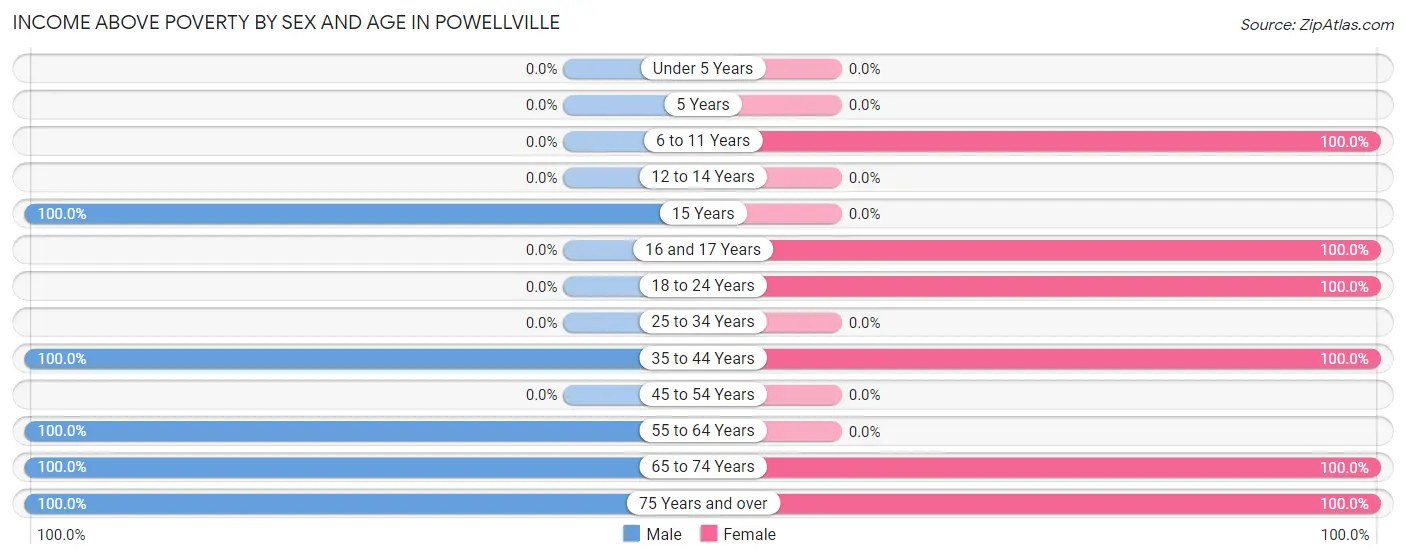
| Age Bracket | Male | Female |
| Under 5 Years | 0 (0.0%) | 0 (0.0%) |
| 5 Years | 0 (0.0%) | 0 (0.0%) |
| 6 to 11 Years | 0 (0.0%) | 9 (100.0%) |
| 12 to 14 Years | 0 (0.0%) | 0 (0.0%) |
| 15 Years | 13 (100.0%) | 0 (0.0%) |
| 16 and 17 Years | 0 (0.0%) | 7 (100.0%) |
| 18 to 24 Years | 0 (0.0%) | 9 (100.0%) |
| 25 to 34 Years | 0 (0.0%) | 0 (0.0%) |
| 35 to 44 Years | 12 (100.0%) | 10 (100.0%) |
| 45 to 54 Years | 0 (0.0%) | 0 (0.0%) |
| 55 to 64 Years | 34 (100.0%) | 0 (0.0%) |
| 65 to 74 Years | 9 (100.0%) | 7 (100.0%) |
| 75 Years and over | 14 (100.0%) | 6 (100.0%) |
| Total | 82 (100.0%) | 48 (82.8%) |
Income Below Poverty Among Married-Couple Families in Powellville
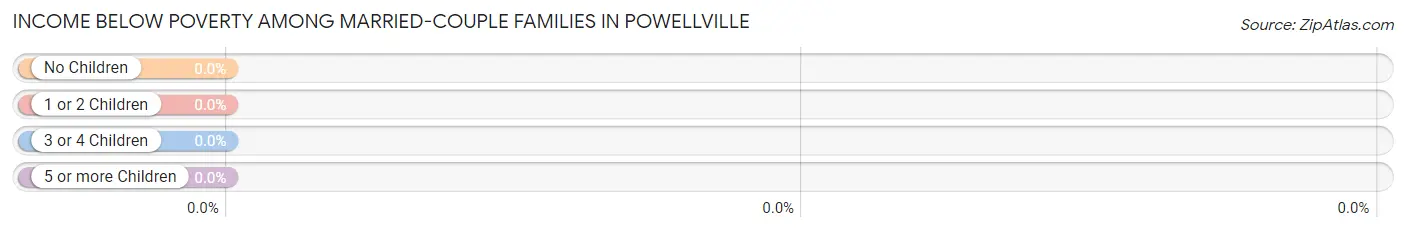
| Children | Above Poverty | Below Poverty |
| No Children | 8 (100.0%) | 0 (0.0%) |
| 1 or 2 Children | 0 (0.0%) | 0 (0.0%) |
| 3 or 4 Children | 10 (100.0%) | 0 (0.0%) |
| 5 or more Children | 0 (0.0%) | 0 (0.0%) |
| Total | 18 (100.0%) | 0 (0.0%) |
Income Below Poverty Among Single-Parent Households in Powellville
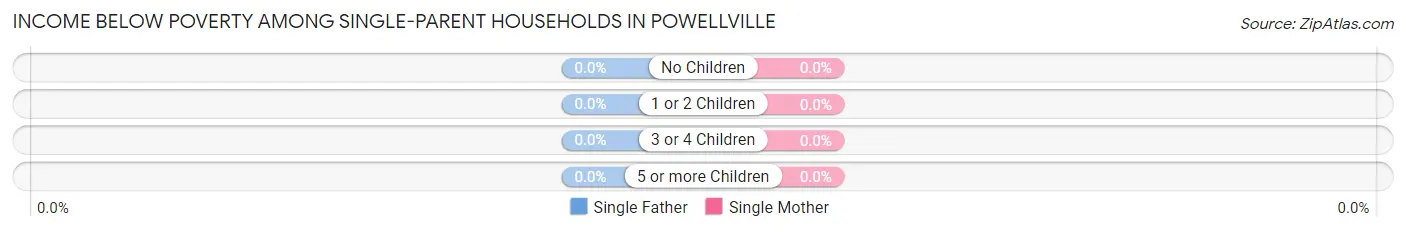
| Children | Single Father | Single Mother |
| No Children | 0 (0.0%) | 0 (0.0%) |
| 1 or 2 Children | 0 (0.0%) | 0 (0.0%) |
| 3 or 4 Children | 0 (0.0%) | 0 (0.0%) |
| 5 or more Children | 0 (0.0%) | 0 (0.0%) |
| Total | 0 (0.0%) | 0 (0.0%) |
Income Below Poverty Among Married-Couple vs Single-Parent Households in Powellville
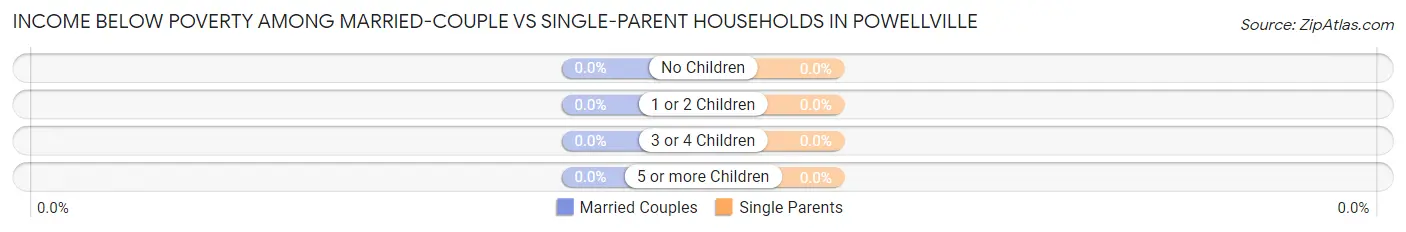
| Children | Married-Couple Families | Single-Parent Households |
| No Children | 0 (0.0%) | 0 (0.0%) |
| 1 or 2 Children | 0 (0.0%) | 0 (0.0%) |
| 3 or 4 Children | 0 (0.0%) | 0 (0.0%) |
| 5 or more Children | 0 (0.0%) | 0 (0.0%) |
| Total | 0 (0.0%) | 0 (0.0%) |
Race in Powellville
The most populous races in Powellville are White / Caucasian (89 | 63.6%), and Black / African American (51 | 36.4%).
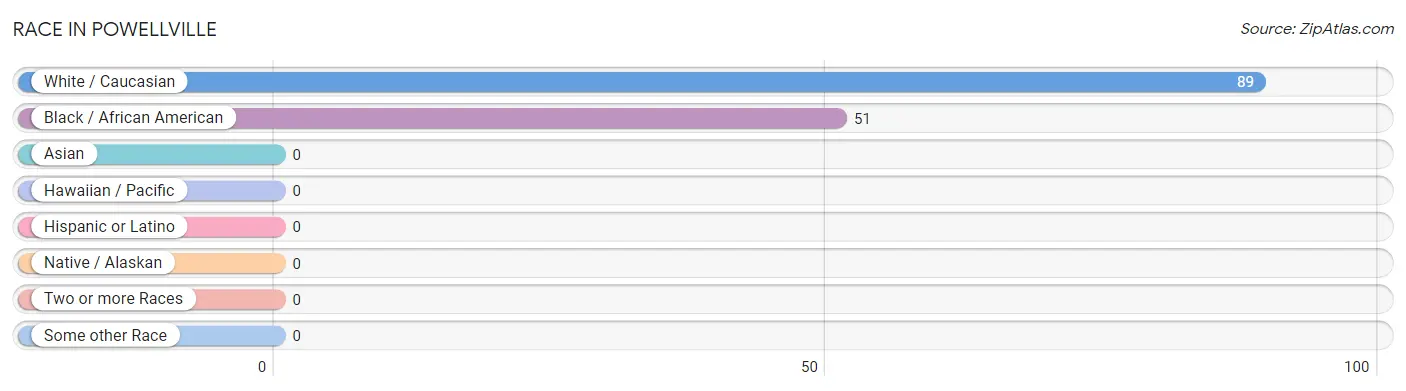
| Race | # Population | % Population |
| Asian | 0 | 0.0% |
| Black / African American | 51 | 36.4% |
| Hawaiian / Pacific | 0 | 0.0% |
| Hispanic or Latino | 0 | 0.0% |
| Native / Alaskan | 0 | 0.0% |
| White / Caucasian | 89 | 63.6% |
| Two or more Races | 0 | 0.0% |
| Some other Race | 0 | 0.0% |
| Total | 140 | 100.0% |
Ancestry in Powellville
The most populous ancestries reported in Powellville are , and English (21 | 15.0%), together accounting for 15.0% of all Powellville residents.

| Ancestry | # Population | % Population |
| English | 21 | 15.0% | View All 1 Rows |
Immigrants in Powellville

| Immigration Origin | # Population | % Population | View All 0 Rows |
Sex and Age in Powellville
Sex and Age in Powellville
The most populous age groups in Powellville are 60 to 64 Years (34 | 41.5%) for men and 35 to 39 Years (10 | 17.2%) for women.
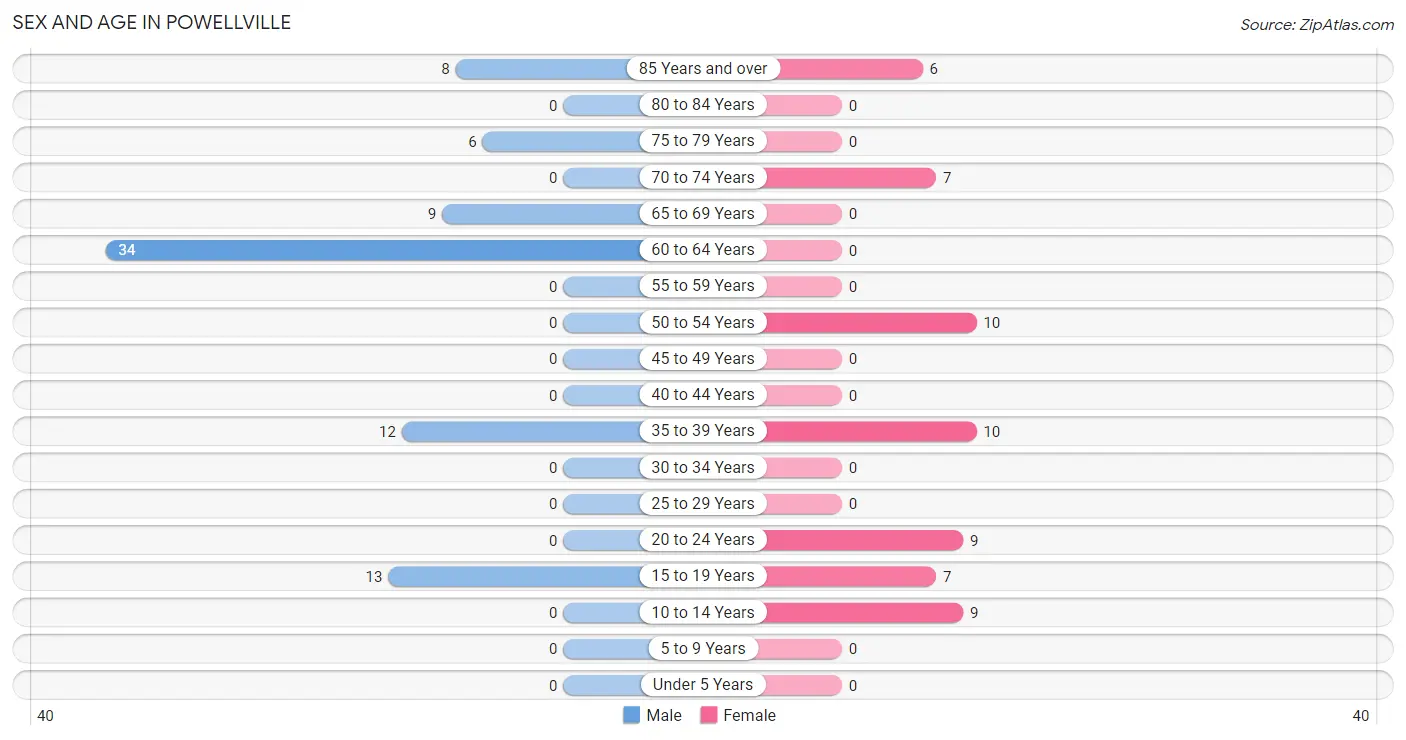
| Age Bracket | Male | Female |
| Under 5 Years | 0 (0.0%) | 0 (0.0%) |
| 5 to 9 Years | 0 (0.0%) | 0 (0.0%) |
| 10 to 14 Years | 0 (0.0%) | 9 (15.5%) |
| 15 to 19 Years | 13 (15.9%) | 7 (12.1%) |
| 20 to 24 Years | 0 (0.0%) | 9 (15.5%) |
| 25 to 29 Years | 0 (0.0%) | 0 (0.0%) |
| 30 to 34 Years | 0 (0.0%) | 0 (0.0%) |
| 35 to 39 Years | 12 (14.6%) | 10 (17.2%) |
| 40 to 44 Years | 0 (0.0%) | 0 (0.0%) |
| 45 to 49 Years | 0 (0.0%) | 0 (0.0%) |
| 50 to 54 Years | 0 (0.0%) | 10 (17.2%) |
| 55 to 59 Years | 0 (0.0%) | 0 (0.0%) |
| 60 to 64 Years | 34 (41.5%) | 0 (0.0%) |
| 65 to 69 Years | 9 (11.0%) | 0 (0.0%) |
| 70 to 74 Years | 0 (0.0%) | 7 (12.1%) |
| 75 to 79 Years | 6 (7.3%) | 0 (0.0%) |
| 80 to 84 Years | 0 (0.0%) | 0 (0.0%) |
| 85 Years and over | 8 (9.8%) | 6 (10.3%) |
| Total | 82 (100.0%) | 58 (100.0%) |
Families and Households in Powellville
Median Family Size in Powellville
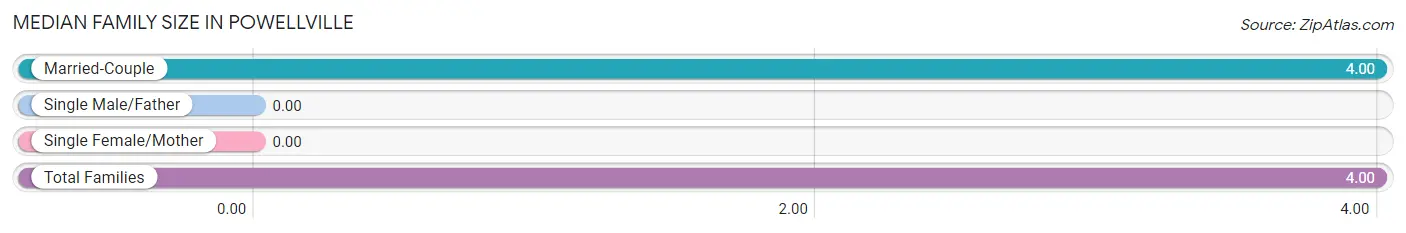
| Family Type | # Families | Family Size |
| Married-Couple | 18 (100.0%) | 4.00 |
| Single Male/Father | 0 (0.0%) | - |
| Single Female/Mother | 0 (0.0%) | - |
| Total Families | 18 (100.0%) | 4.00 |
Median Household Size in Powellville
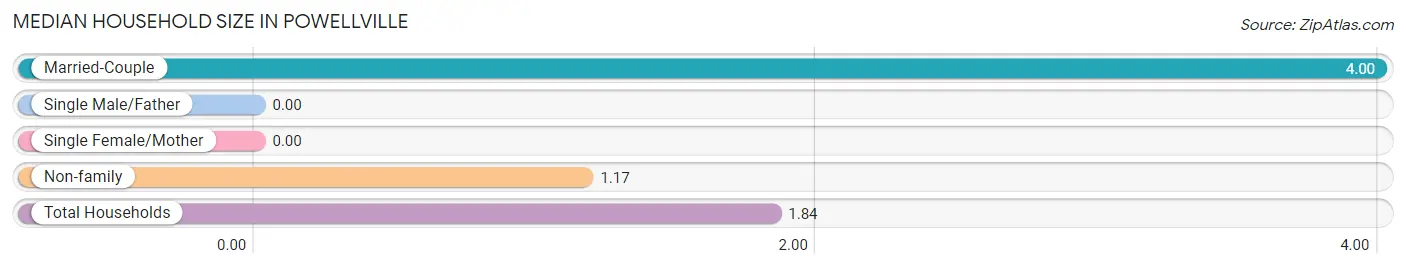
| Household Type | # Households | Household Size |
| Married-Couple | 18 (23.7%) | 4.00 |
| Single Male/Father | 0 (0.0%) | - |
| Single Female/Mother | 0 (0.0%) | - |
| Non-family | 58 (76.3%) | 1.17 |
| Total Households | 76 (100.0%) | 1.84 |
Household Size by Marriage Status in Powellville
Out of a total of 76 households in Powellville, 18 (23.7%) are family households, while 58 (76.3%) are nonfamily households. The most numerous type of family households are 5-person households, comprising 10, and the most common type of nonfamily households are 1-person households, comprising 49.
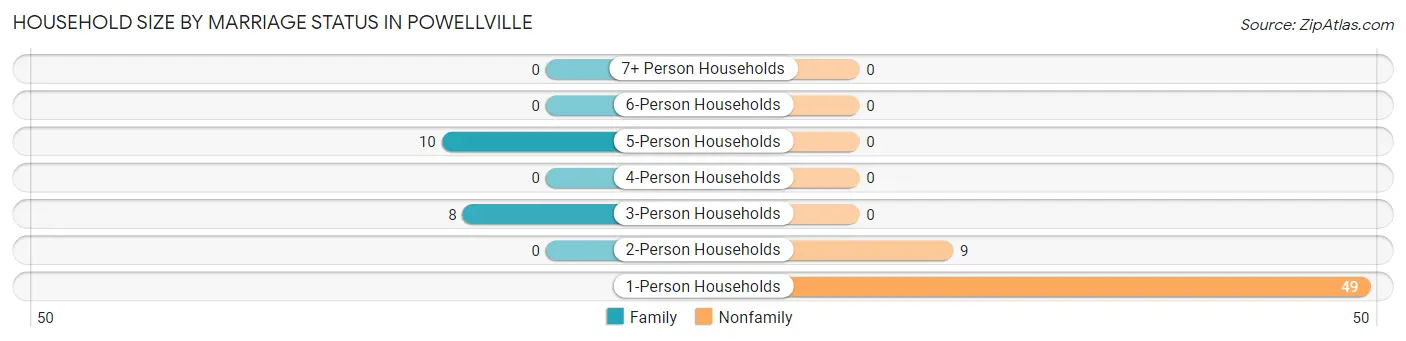
| Household Size | Family Households | Nonfamily Households |
| 1-Person Households | - | 49 (64.5%) |
| 2-Person Households | 0 (0.0%) | 9 (11.8%) |
| 3-Person Households | 8 (10.5%) | 0 (0.0%) |
| 4-Person Households | 0 (0.0%) | 0 (0.0%) |
| 5-Person Households | 10 (13.2%) | 0 (0.0%) |
| 6-Person Households | 0 (0.0%) | 0 (0.0%) |
| 7+ Person Households | 0 (0.0%) | 0 (0.0%) |
| Total | 18 (23.7%) | 58 (76.3%) |
Female Fertility in Powellville
Fertility by Age in Powellville
| Age Bracket | Women with Births | Births / 1,000 Women |
| 15 to 19 years | 0 (0.0%) | 0.0 |
| 20 to 34 years | 0 (0.0%) | 0.0 |
| 35 to 50 years | 0 (0.0%) | 0.0 |
| Total | 0 (0.0%) | 0.0 |
Fertility by Age by Marriage Status in Powellville
| Age Bracket | Married | Unmarried |
| 15 to 19 years | 0 (0.0%) | 0 (0.0%) |
| 20 to 34 years | 0 (0.0%) | 0 (0.0%) |
| 35 to 50 years | 0 (0.0%) | 0 (0.0%) |
| Total | 0 (0.0%) | 0 (0.0%) |
Fertility by Education in Powellville
| Educational Attainment | Women with Births | Births / 1,000 Women |
| Less than High School | 0 (0.0%) | 0.0 |
| High School Diploma | 0 (0.0%) | 0.0 |
| College or Associate's Degree | 0 (0.0%) | 0.0 |
| Bachelor's Degree | 0 (0.0%) | 0.0 |
| Graduate Degree | 0 (0.0%) | 0.0 |
| Total | 0 (0.0%) | 0.0 |
Fertility by Education by Marriage Status in Powellville
| Educational Attainment | Married | Unmarried |
| Less than High School | 0 (0.0%) | 0 (0.0%) |
| High School Diploma | 0 (0.0%) | 0 (0.0%) |
| College or Associate's Degree | 0 (0.0%) | 0 (0.0%) |
| Bachelor's Degree | 0 (0.0%) | 0 (0.0%) |
| Graduate Degree | 0 (0.0%) | 0 (0.0%) |
| Total | 0 (0.0%) | 0 (0.0%) |
Employment Characteristics in Powellville
Employment by Class of Employer in Powellville
Among the 74 employed individuals in Powellville, private company employees (55 | 74.3%), state government employees (10 | 13.5%), and local government employees (9 | 12.2%) make up the most common classes of employment.
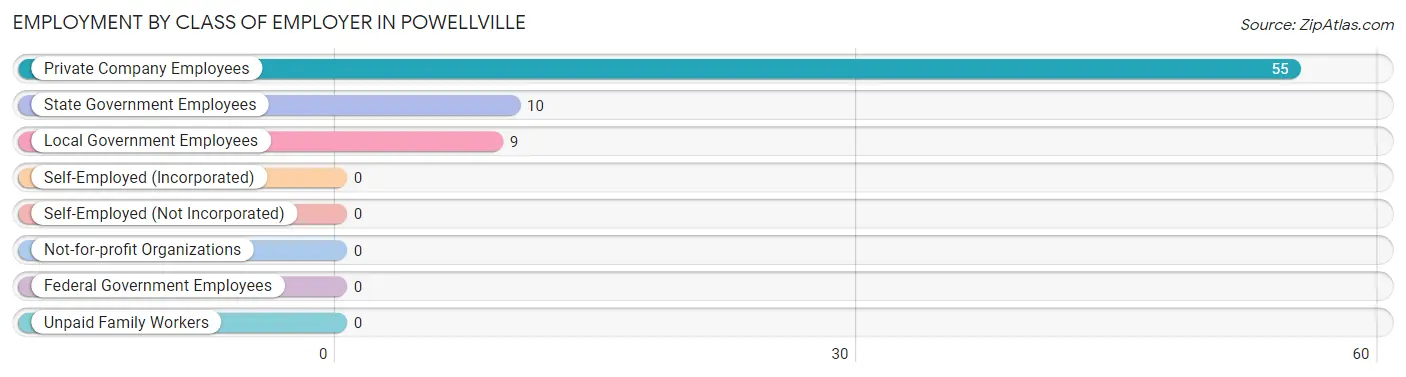
| Employer Class | # Employees | % Employees |
| Private Company Employees | 55 | 74.3% |
| Self-Employed (Incorporated) | 0 | 0.0% |
| Self-Employed (Not Incorporated) | 0 | 0.0% |
| Not-for-profit Organizations | 0 | 0.0% |
| Local Government Employees | 9 | 12.2% |
| State Government Employees | 10 | 13.5% |
| Federal Government Employees | 0 | 0.0% |
| Unpaid Family Workers | 0 | 0.0% |
| Total | 74 | 100.0% |
Employment Status by Age in Powellville
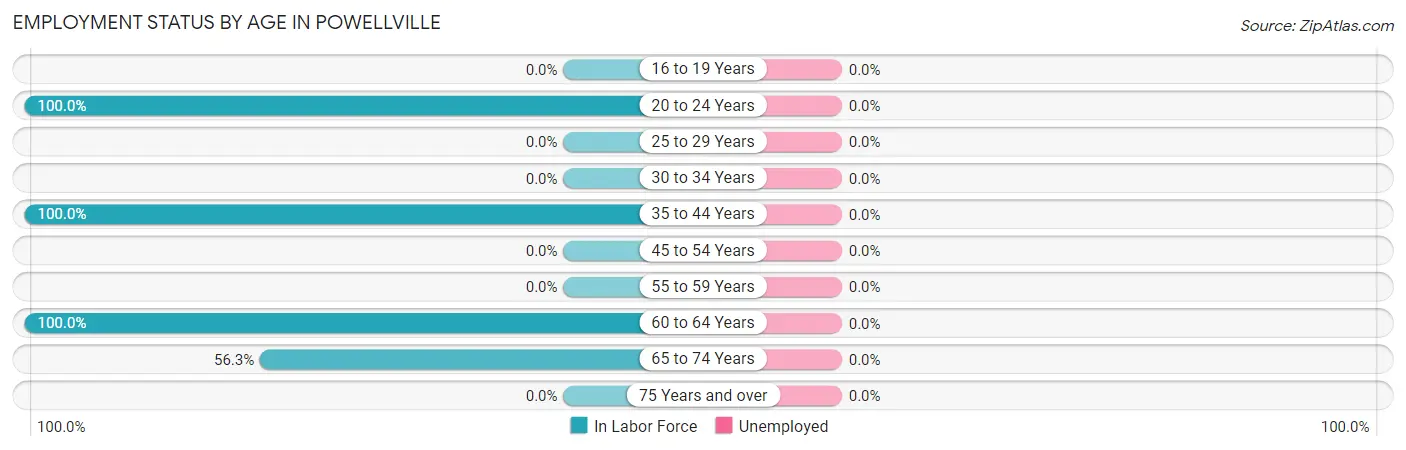
| Age Bracket | In Labor Force | Unemployed |
| 16 to 19 Years | 0 (0.0%) | 0 (0.0%) |
| 20 to 24 Years | 9 (100.0%) | 0 (0.0%) |
| 25 to 29 Years | 0 (0.0%) | 0 (0.0%) |
| 30 to 34 Years | 0 (0.0%) | 0 (0.0%) |
| 35 to 44 Years | 22 (100.0%) | 0 (0.0%) |
| 45 to 54 Years | 0 (0.0%) | 0 (0.0%) |
| 55 to 59 Years | 0 (0.0%) | 0 (0.0%) |
| 60 to 64 Years | 34 (100.0%) | 0 (0.0%) |
| 65 to 74 Years | 9 (56.3%) | 0 (0.0%) |
| 75 Years and over | 0 (0.0%) | 0 (0.0%) |
| Total | 74 (62.7%) | 0 (0.0%) |
Employment Status by Educational Attainment in Powellville
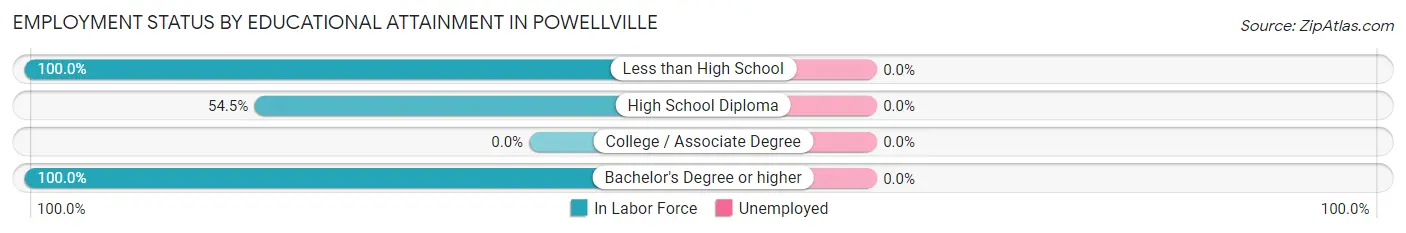
| Educational Attainment | In Labor Force | Unemployed |
| Less than High School | 34 (100.0%) | 0 (0.0%) |
| High School Diploma | 12 (54.5%) | 0 (0.0%) |
| College / Associate Degree | 0 (0.0%) | 0 (0.0%) |
| Bachelor's Degree or higher | 10 (100.0%) | 0 (0.0%) |
| Total | 56 (84.8%) | 0 (0.0%) |
Employment Occupations by Sex in Powellville
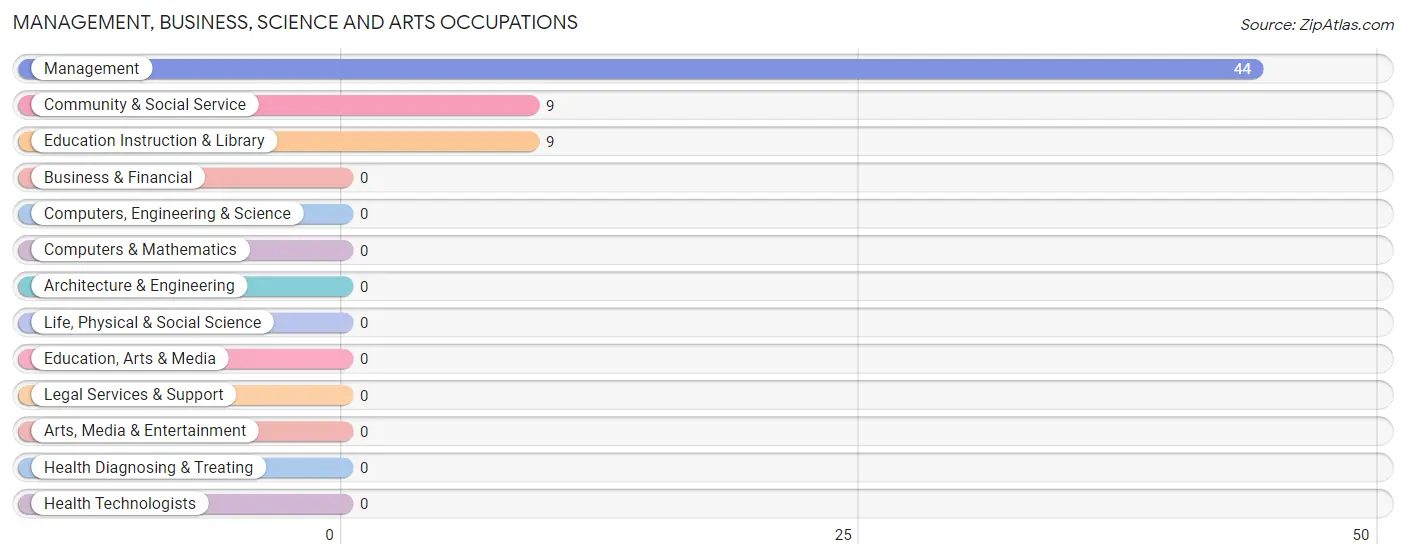
Management, Business, Science and Arts Occupations
The most common Management, Business, Science and Arts occupations in Powellville are Management (44 | 59.5%), Community & Social Service (9 | 12.2%), and Education Instruction & Library (9 | 12.2%).
Management, Business, Science and Arts Occupations by Sex
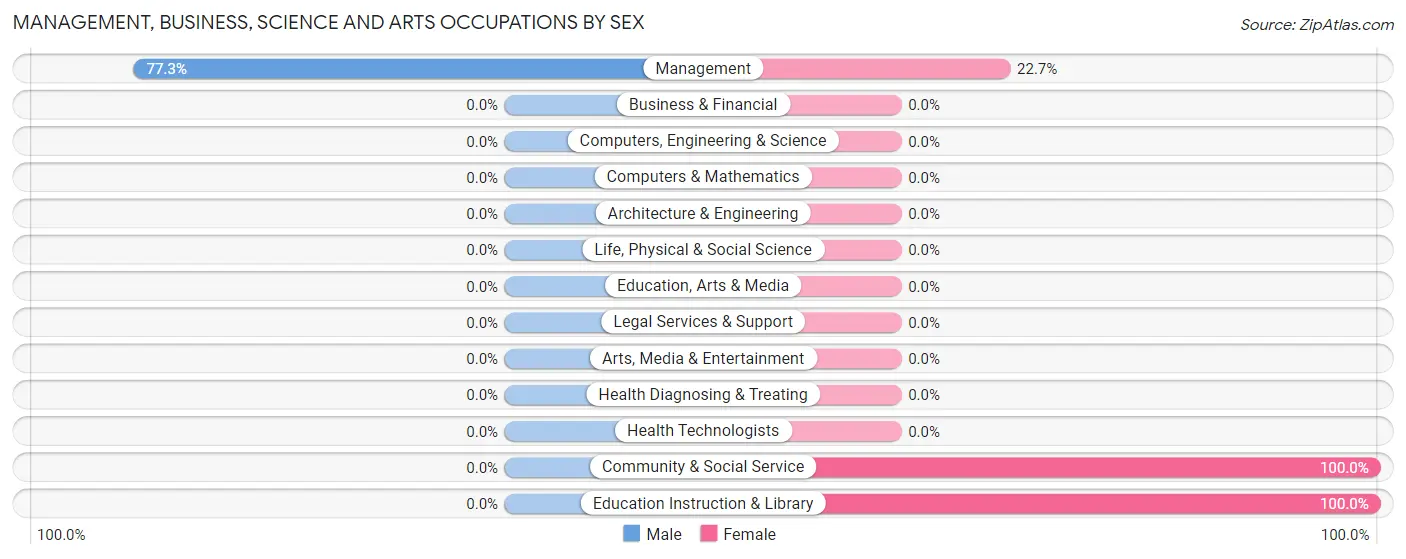
| Occupation | Male | Female |
| Management | 34 (77.3%) | 10 (22.7%) |
| Business & Financial | 0 (0.0%) | 0 (0.0%) |
| Computers, Engineering & Science | 0 (0.0%) | 0 (0.0%) |
| Computers & Mathematics | 0 (0.0%) | 0 (0.0%) |
| Architecture & Engineering | 0 (0.0%) | 0 (0.0%) |
| Life, Physical & Social Science | 0 (0.0%) | 0 (0.0%) |
| Community & Social Service | 0 (0.0%) | 9 (100.0%) |
| Education, Arts & Media | 0 (0.0%) | 0 (0.0%) |
| Legal Services & Support | 0 (0.0%) | 0 (0.0%) |
| Education Instruction & Library | 0 (0.0%) | 9 (100.0%) |
| Arts, Media & Entertainment | 0 (0.0%) | 0 (0.0%) |
| Health Diagnosing & Treating | 0 (0.0%) | 0 (0.0%) |
| Health Technologists | 0 (0.0%) | 0 (0.0%) |
| Total (Category) | 34 (64.1%) | 19 (35.8%) |
| Total (Overall) | 55 (74.3%) | 19 (25.7%) |
Services Occupations
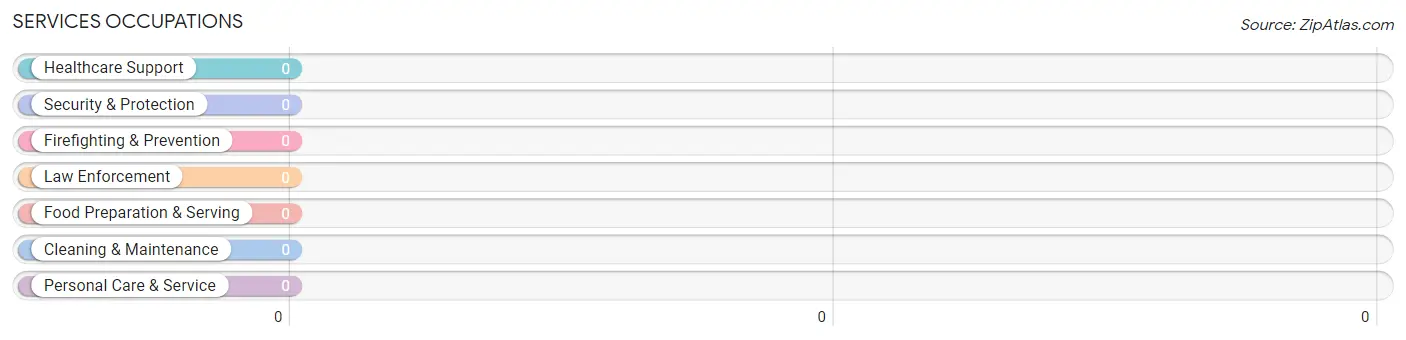
Services Occupations by Sex
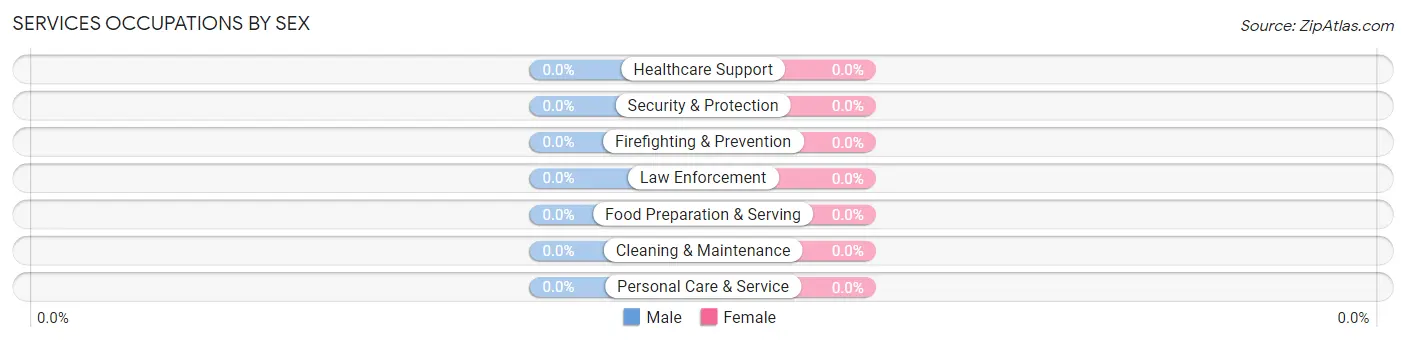
| Occupation | Male | Female |
| Healthcare Support | 0 (0.0%) | 0 (0.0%) |
| Security & Protection | 0 (0.0%) | 0 (0.0%) |
| Firefighting & Prevention | 0 (0.0%) | 0 (0.0%) |
| Law Enforcement | 0 (0.0%) | 0 (0.0%) |
| Food Preparation & Serving | 0 (0.0%) | 0 (0.0%) |
| Cleaning & Maintenance | 0 (0.0%) | 0 (0.0%) |
| Personal Care & Service | 0 (0.0%) | 0 (0.0%) |
| Total (Category) | 0 (0.0%) | 0 (0.0%) |
| Total (Overall) | 55 (74.3%) | 19 (25.7%) |
Sales and Office Occupations

Sales and Office Occupations by Sex
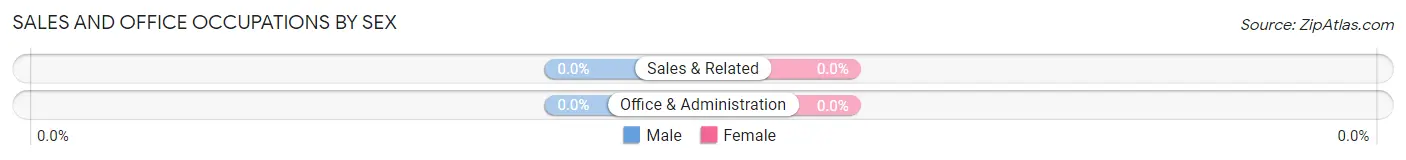
| Occupation | Male | Female |
| Sales & Related | 0 (0.0%) | 0 (0.0%) |
| Office & Administration | 0 (0.0%) | 0 (0.0%) |
| Total (Category) | 0 (0.0%) | 0 (0.0%) |
| Total (Overall) | 55 (74.3%) | 19 (25.7%) |
Natural Resources, Construction and Maintenance Occupations
The most common Natural Resources, Construction and Maintenance occupations in Powellville are , and Construction & Extraction (9 | 12.2%).
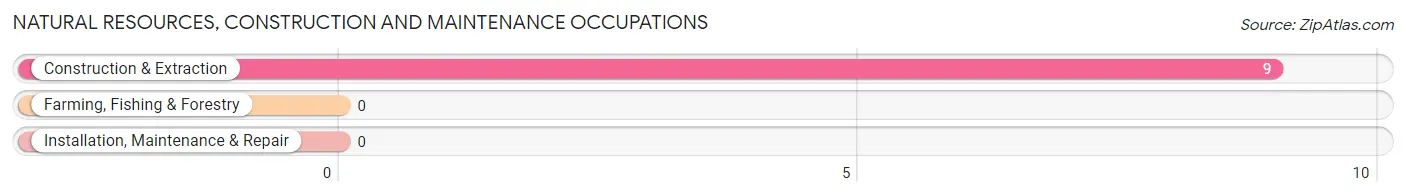
Natural Resources, Construction and Maintenance Occupations by Sex
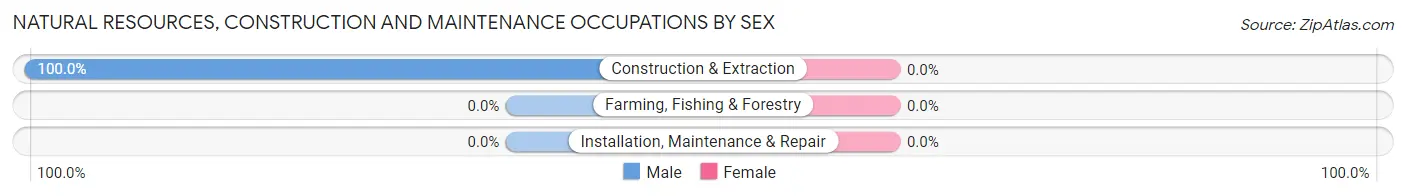
| Occupation | Male | Female |
| Farming, Fishing & Forestry | 0 (0.0%) | 0 (0.0%) |
| Construction & Extraction | 9 (100.0%) | 0 (0.0%) |
| Installation, Maintenance & Repair | 0 (0.0%) | 0 (0.0%) |
| Total (Category) | 9 (100.0%) | 0 (0.0%) |
| Total (Overall) | 55 (74.3%) | 19 (25.7%) |
Production, Transportation and Moving Occupations
The most common Production, Transportation and Moving occupations in Powellville are , and Transportation (12 | 16.2%).
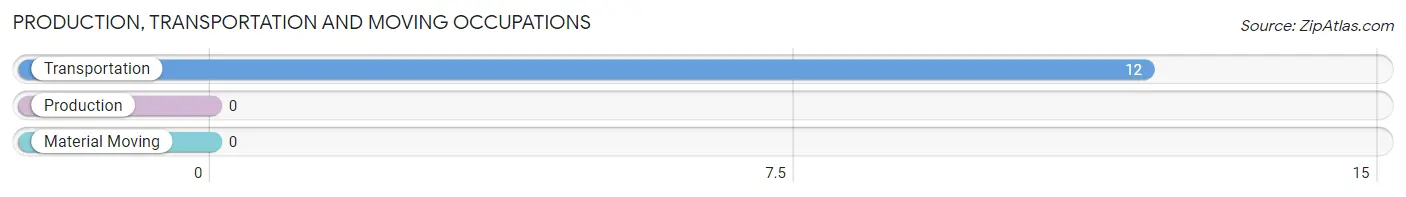
Production, Transportation and Moving Occupations by Sex

| Occupation | Male | Female |
| Production | 0 (0.0%) | 0 (0.0%) |
| Transportation | 12 (100.0%) | 0 (0.0%) |
| Material Moving | 0 (0.0%) | 0 (0.0%) |
| Total (Category) | 12 (100.0%) | 0 (0.0%) |
| Total (Overall) | 55 (74.3%) | 19 (25.7%) |
Employment Industries by Sex in Powellville
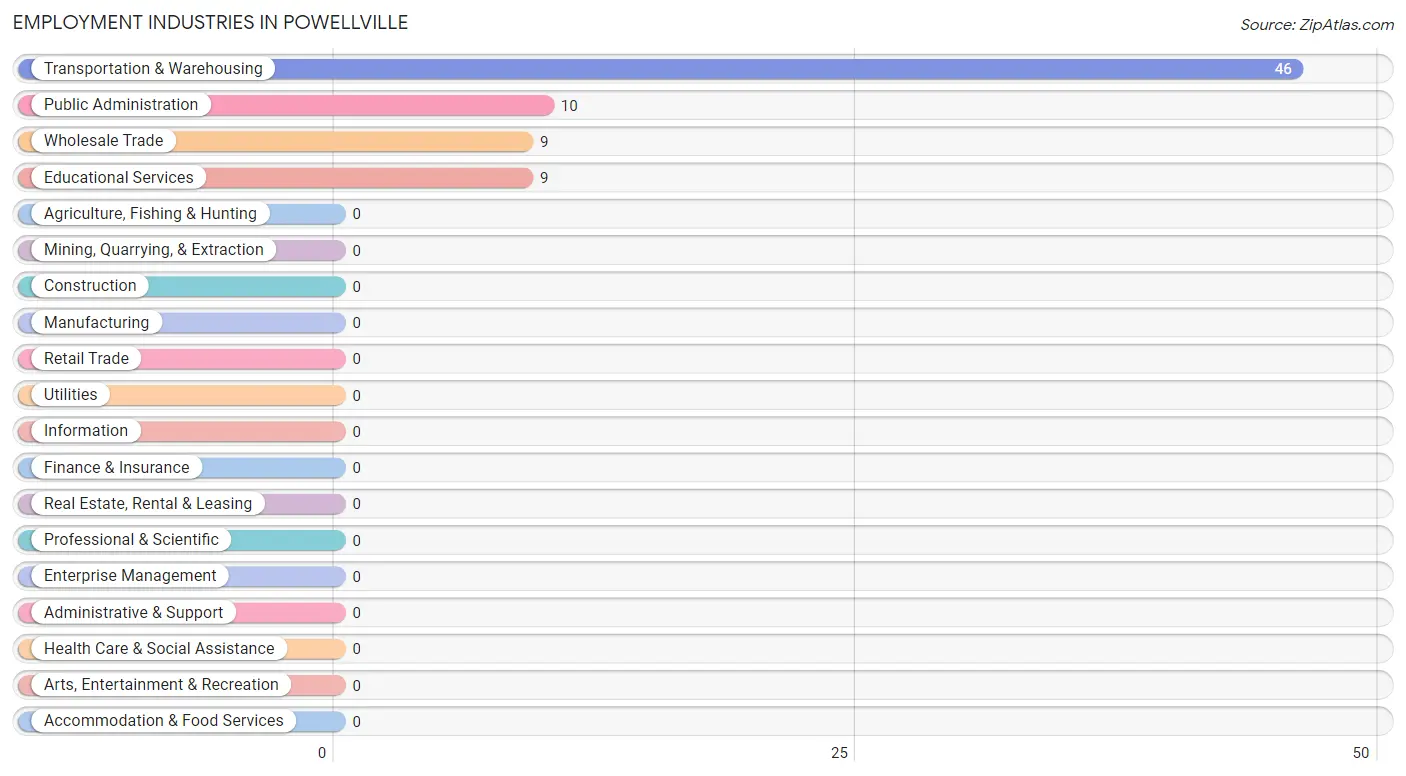
Employment Industries in Powellville
The major employment industries in Powellville include Transportation & Warehousing (46 | 62.2%), Public Administration (10 | 13.5%), Wholesale Trade (9 | 12.2%), and Educational Services (9 | 12.2%).
Employment Industries by Sex in Powellville
The Powellville industries that see more men than women are Wholesale Trade (100.0%), and Transportation & Warehousing (100.0%), whereas the industries that tend to have a higher number of women are Educational Services (100.0%), and Public Administration (100.0%).
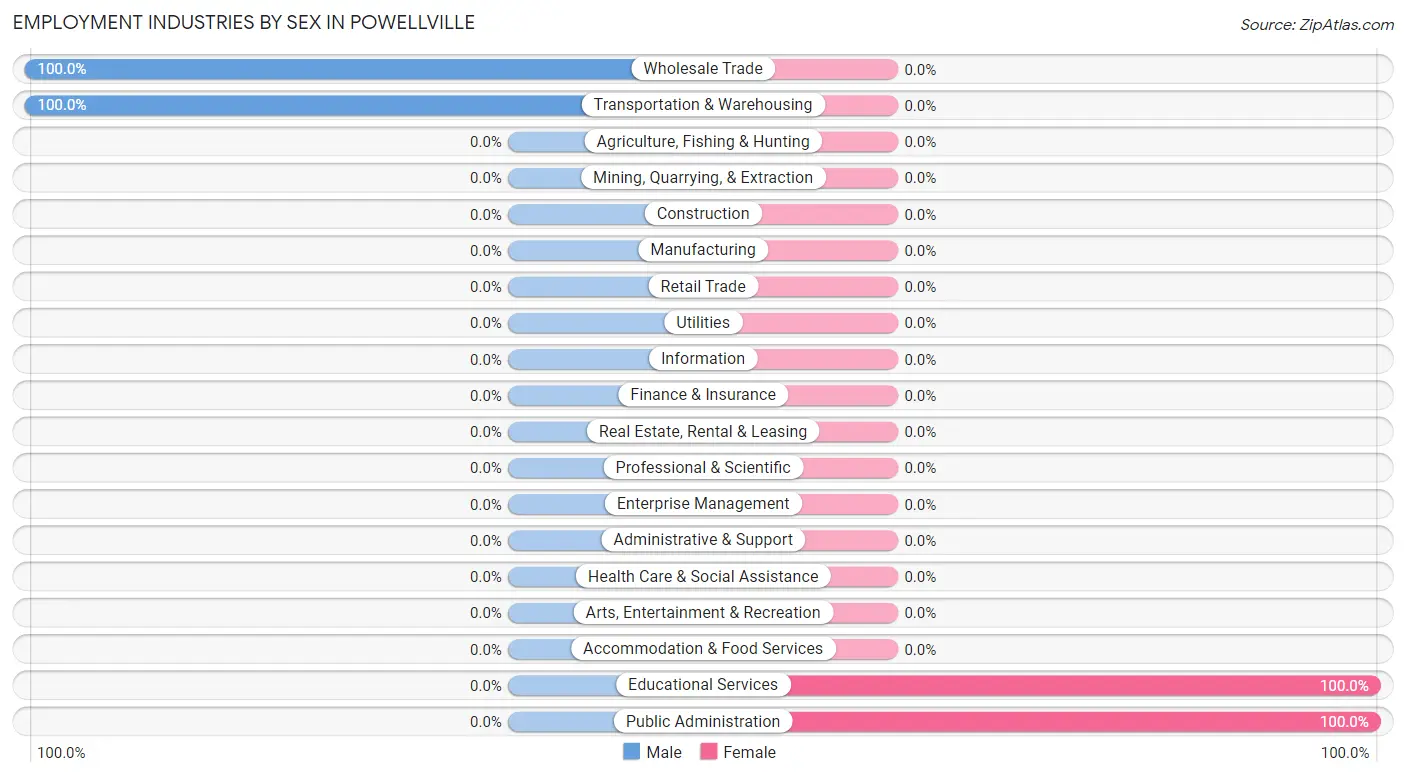
| Industry | Male | Female |
| Agriculture, Fishing & Hunting | 0 (0.0%) | 0 (0.0%) |
| Mining, Quarrying, & Extraction | 0 (0.0%) | 0 (0.0%) |
| Construction | 0 (0.0%) | 0 (0.0%) |
| Manufacturing | 0 (0.0%) | 0 (0.0%) |
| Wholesale Trade | 9 (100.0%) | 0 (0.0%) |
| Retail Trade | 0 (0.0%) | 0 (0.0%) |
| Transportation & Warehousing | 46 (100.0%) | 0 (0.0%) |
| Utilities | 0 (0.0%) | 0 (0.0%) |
| Information | 0 (0.0%) | 0 (0.0%) |
| Finance & Insurance | 0 (0.0%) | 0 (0.0%) |
| Real Estate, Rental & Leasing | 0 (0.0%) | 0 (0.0%) |
| Professional & Scientific | 0 (0.0%) | 0 (0.0%) |
| Enterprise Management | 0 (0.0%) | 0 (0.0%) |
| Administrative & Support | 0 (0.0%) | 0 (0.0%) |
| Educational Services | 0 (0.0%) | 9 (100.0%) |
| Health Care & Social Assistance | 0 (0.0%) | 0 (0.0%) |
| Arts, Entertainment & Recreation | 0 (0.0%) | 0 (0.0%) |
| Accommodation & Food Services | 0 (0.0%) | 0 (0.0%) |
| Public Administration | 0 (0.0%) | 10 (100.0%) |
| Total | 55 (74.3%) | 19 (25.7%) |
Education in Powellville
School Enrollment in Powellville
The most common levels of schooling among the 38 students in Powellville are high school (20 | 52.6%), elementary school (9 | 23.7%), and graduate / professional (9 | 23.7%).
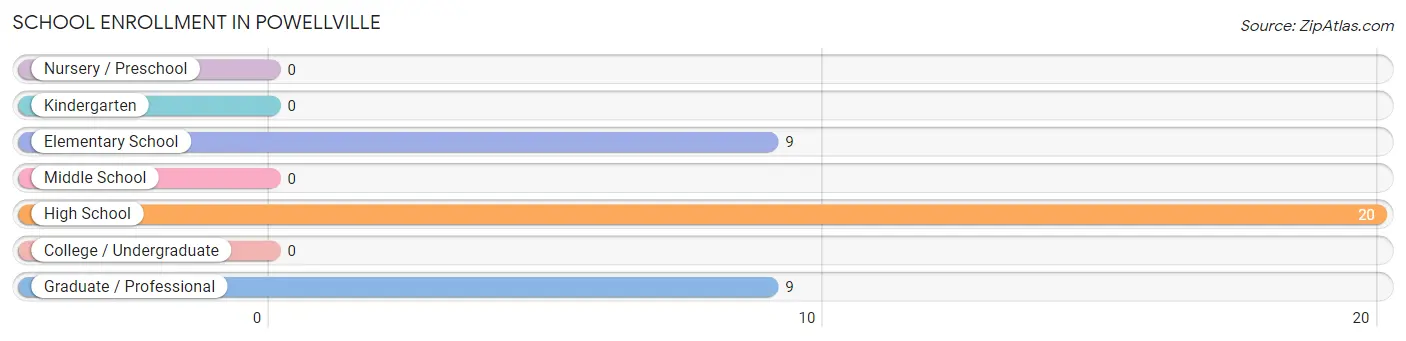
| School Level | # Students | % Students |
| Nursery / Preschool | 0 | 0.0% |
| Kindergarten | 0 | 0.0% |
| Elementary School | 9 | 23.7% |
| Middle School | 0 | 0.0% |
| High School | 20 | 52.6% |
| College / Undergraduate | 0 | 0.0% |
| Graduate / Professional | 9 | 23.7% |
| Total | 38 | 100.0% |
School Enrollment by Age by Funding Source in Powellville
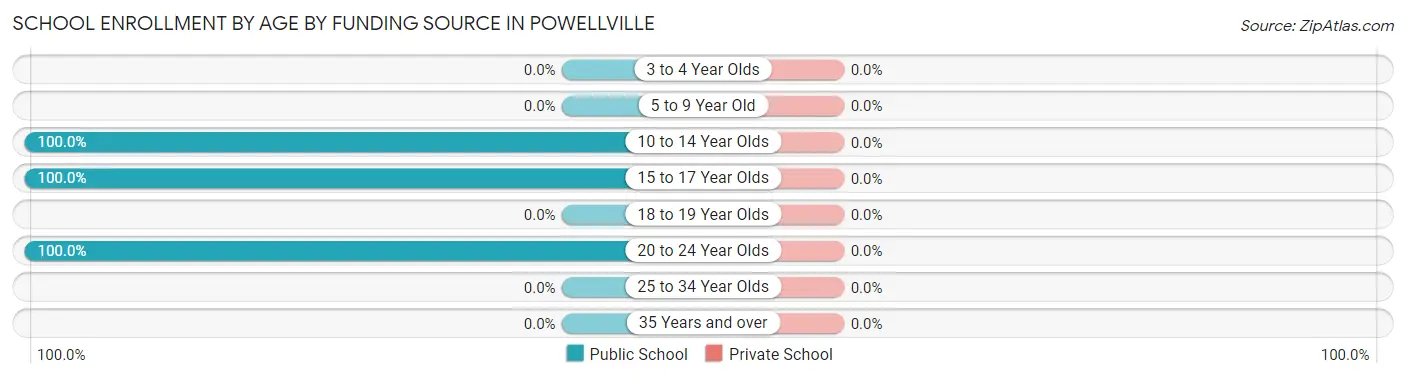
| Age Bracket | Public School | Private School |
| 3 to 4 Year Olds | 0 (0.0%) | 0 (0.0%) |
| 5 to 9 Year Old | 0 (0.0%) | 0 (0.0%) |
| 10 to 14 Year Olds | 9 (100.0%) | 0 (0.0%) |
| 15 to 17 Year Olds | 20 (100.0%) | 0 (0.0%) |
| 18 to 19 Year Olds | 0 (0.0%) | 0 (0.0%) |
| 20 to 24 Year Olds | 9 (100.0%) | 0 (0.0%) |
| 25 to 34 Year Olds | 0 (0.0%) | 0 (0.0%) |
| 35 Years and over | 0 (0.0%) | 0 (0.0%) |
| Total | 38 (100.0%) | 0 (0.0%) |
Educational Attainment by Field of Study in Powellville
Social sciences (10 | 50.0%), and arts & humanities (10 | 50.0%) are the most common fields of study among 20 individuals in Powellville who have obtained a bachelor's degree or higher.
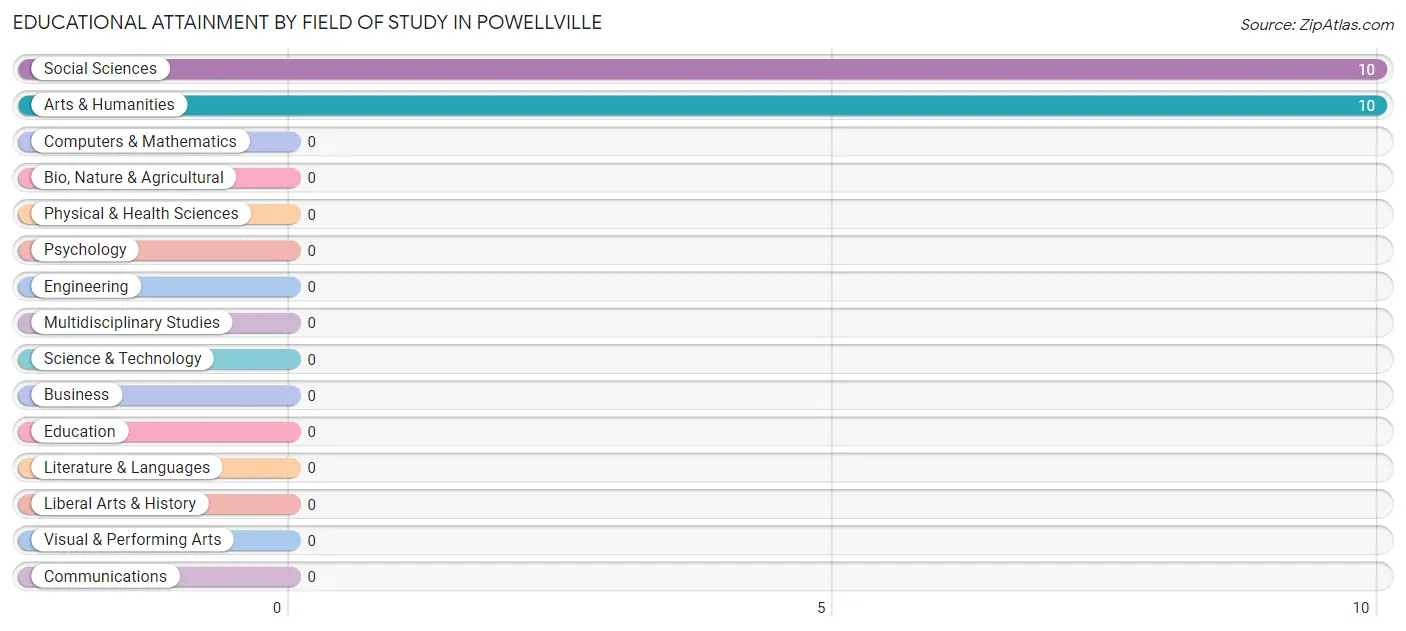
| Field of Study | # Graduates | % Graduates |
| Computers & Mathematics | 0 | 0.0% |
| Bio, Nature & Agricultural | 0 | 0.0% |
| Physical & Health Sciences | 0 | 0.0% |
| Psychology | 0 | 0.0% |
| Social Sciences | 10 | 50.0% |
| Engineering | 0 | 0.0% |
| Multidisciplinary Studies | 0 | 0.0% |
| Science & Technology | 0 | 0.0% |
| Business | 0 | 0.0% |
| Education | 0 | 0.0% |
| Literature & Languages | 0 | 0.0% |
| Liberal Arts & History | 0 | 0.0% |
| Visual & Performing Arts | 0 | 0.0% |
| Communications | 0 | 0.0% |
| Arts & Humanities | 10 | 50.0% |
| Total | 20 | 100.0% |
Transportation & Commute in Powellville
Vehicle Availability by Sex in Powellville
The most prevalent vehicle ownership categories in Powellville are males with 2 vehicles (46, accounting for 83.6%) and females with 2 vehicles (10, making up 242.1%).
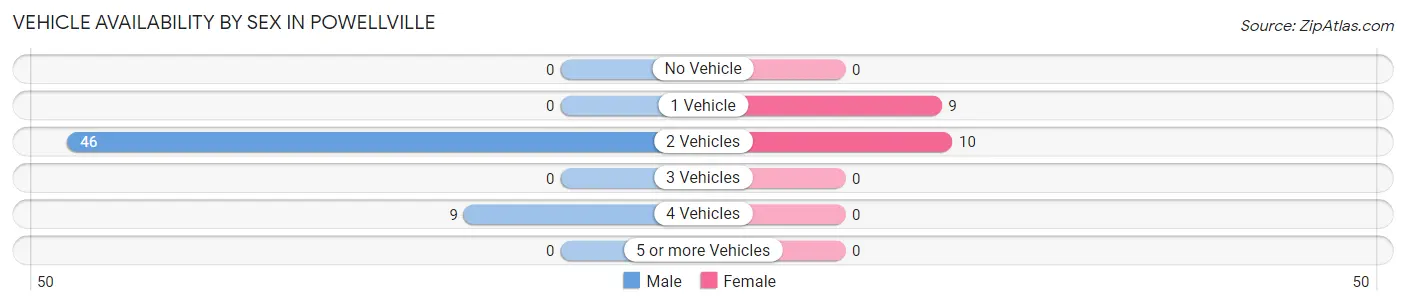
| Vehicles Available | Male | Female |
| No Vehicle | 0 (0.0%) | 0 (0.0%) |
| 1 Vehicle | 0 (0.0%) | 9 (47.4%) |
| 2 Vehicles | 46 (83.6%) | 10 (52.6%) |
| 3 Vehicles | 0 (0.0%) | 0 (0.0%) |
| 4 Vehicles | 9 (16.4%) | 0 (0.0%) |
| 5 or more Vehicles | 0 (0.0%) | 0 (0.0%) |
| Total | 55 (100.0%) | 19 (100.0%) |
Commute Time in Powellville
The most frequently occuring commute durations in Powellville are 20 to 24 minutes (53 commuters, 71.6%), 90 or more minutes (12 commuters, 16.2%), and 25 to 29 minutes (9 commuters, 12.2%).
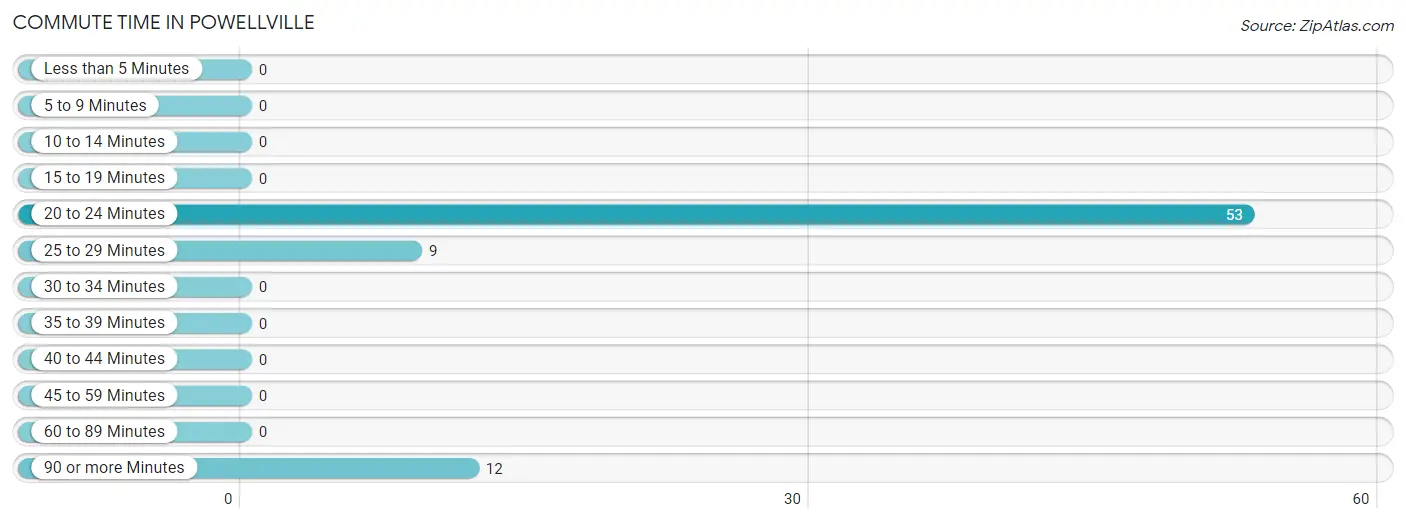
| Commute Time | # Commuters | % Commuters |
| Less than 5 Minutes | 0 | 0.0% |
| 5 to 9 Minutes | 0 | 0.0% |
| 10 to 14 Minutes | 0 | 0.0% |
| 15 to 19 Minutes | 0 | 0.0% |
| 20 to 24 Minutes | 53 | 71.6% |
| 25 to 29 Minutes | 9 | 12.2% |
| 30 to 34 Minutes | 0 | 0.0% |
| 35 to 39 Minutes | 0 | 0.0% |
| 40 to 44 Minutes | 0 | 0.0% |
| 45 to 59 Minutes | 0 | 0.0% |
| 60 to 89 Minutes | 0 | 0.0% |
| 90 or more Minutes | 12 | 16.2% |
Commute Time by Sex in Powellville
The most common commute times in Powellville are 20 to 24 minutes (43 commuters, 78.2%) for males and 20 to 24 minutes (10 commuters, 52.6%) for females.
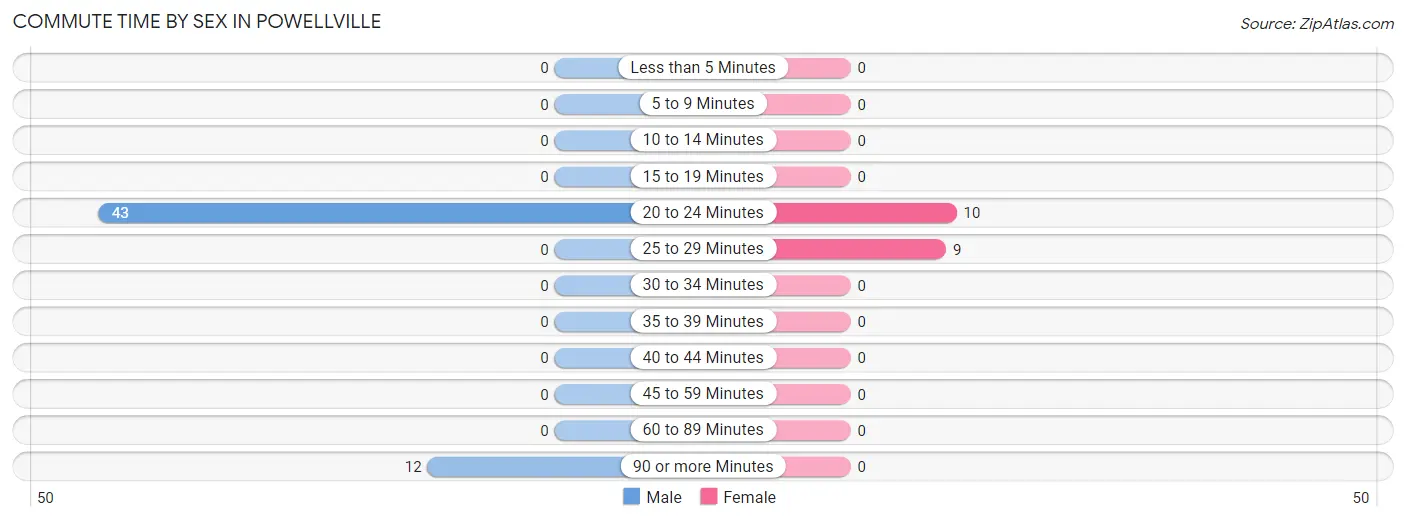
| Commute Time | Male | Female |
| Less than 5 Minutes | 0 (0.0%) | 0 (0.0%) |
| 5 to 9 Minutes | 0 (0.0%) | 0 (0.0%) |
| 10 to 14 Minutes | 0 (0.0%) | 0 (0.0%) |
| 15 to 19 Minutes | 0 (0.0%) | 0 (0.0%) |
| 20 to 24 Minutes | 43 (78.2%) | 10 (52.6%) |
| 25 to 29 Minutes | 0 (0.0%) | 9 (47.4%) |
| 30 to 34 Minutes | 0 (0.0%) | 0 (0.0%) |
| 35 to 39 Minutes | 0 (0.0%) | 0 (0.0%) |
| 40 to 44 Minutes | 0 (0.0%) | 0 (0.0%) |
| 45 to 59 Minutes | 0 (0.0%) | 0 (0.0%) |
| 60 to 89 Minutes | 0 (0.0%) | 0 (0.0%) |
| 90 or more Minutes | 12 (21.8%) | 0 (0.0%) |
Time of Departure to Work by Sex in Powellville
The most frequent times of departure to work in Powellville are 5:00 AM to 5:29 AM (34, 61.8%) for males and 8:30 AM to 8:59 AM (10, 52.6%) for females.
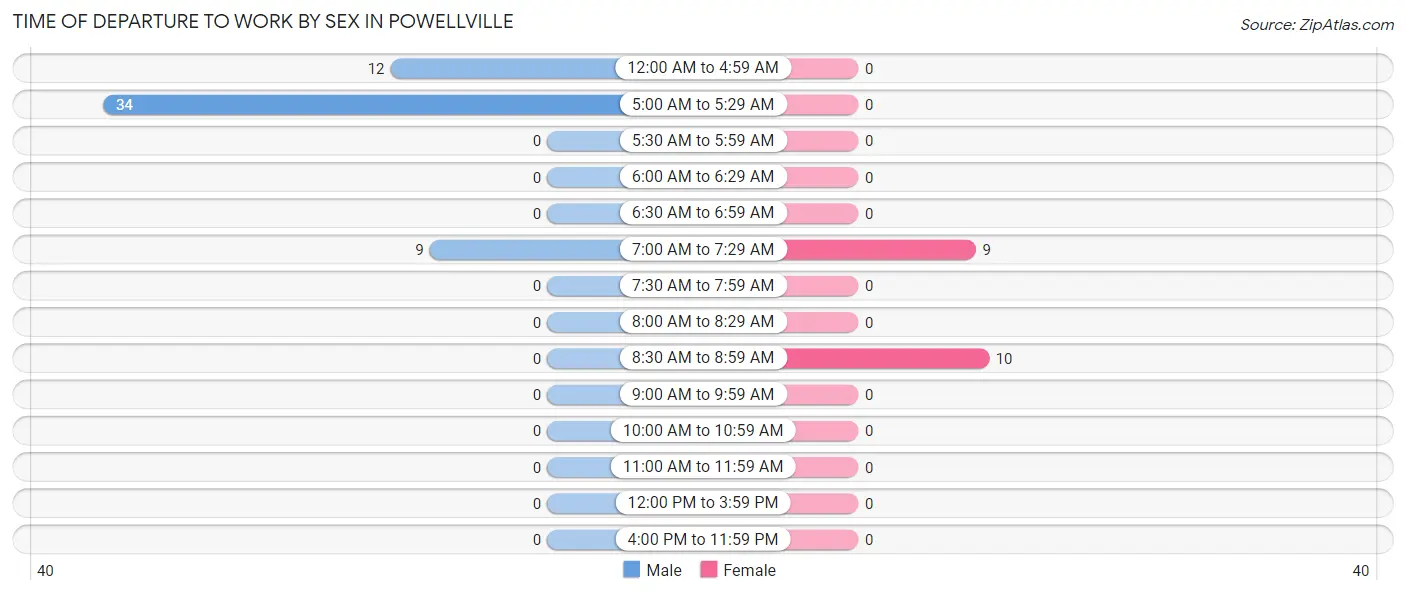
| Time of Departure | Male | Female |
| 12:00 AM to 4:59 AM | 12 (21.8%) | 0 (0.0%) |
| 5:00 AM to 5:29 AM | 34 (61.8%) | 0 (0.0%) |
| 5:30 AM to 5:59 AM | 0 (0.0%) | 0 (0.0%) |
| 6:00 AM to 6:29 AM | 0 (0.0%) | 0 (0.0%) |
| 6:30 AM to 6:59 AM | 0 (0.0%) | 0 (0.0%) |
| 7:00 AM to 7:29 AM | 9 (16.4%) | 9 (47.4%) |
| 7:30 AM to 7:59 AM | 0 (0.0%) | 0 (0.0%) |
| 8:00 AM to 8:29 AM | 0 (0.0%) | 0 (0.0%) |
| 8:30 AM to 8:59 AM | 0 (0.0%) | 10 (52.6%) |
| 9:00 AM to 9:59 AM | 0 (0.0%) | 0 (0.0%) |
| 10:00 AM to 10:59 AM | 0 (0.0%) | 0 (0.0%) |
| 11:00 AM to 11:59 AM | 0 (0.0%) | 0 (0.0%) |
| 12:00 PM to 3:59 PM | 0 (0.0%) | 0 (0.0%) |
| 4:00 PM to 11:59 PM | 0 (0.0%) | 0 (0.0%) |
| Total | 55 (100.0%) | 19 (100.0%) |
Housing Occupancy in Powellville
Occupancy by Ownership in Powellville
Of the total 76 dwellings in Powellville, owner-occupied units account for 57 (75.0%), while renter-occupied units make up 19 (25.0%).
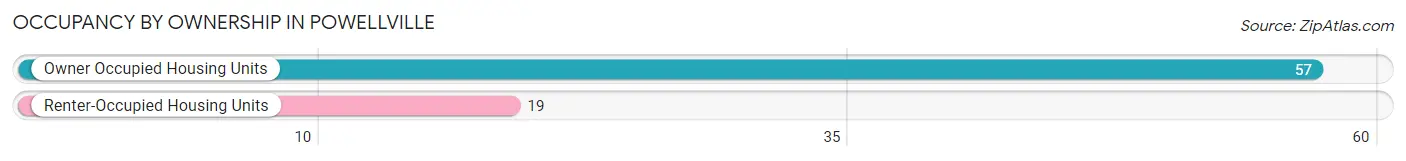
| Occupancy | # Housing Units | % Housing Units |
| Owner Occupied Housing Units | 57 | 75.0% |
| Renter-Occupied Housing Units | 19 | 25.0% |
| Total Occupied Housing Units | 76 | 100.0% |
Occupancy by Household Size in Powellville
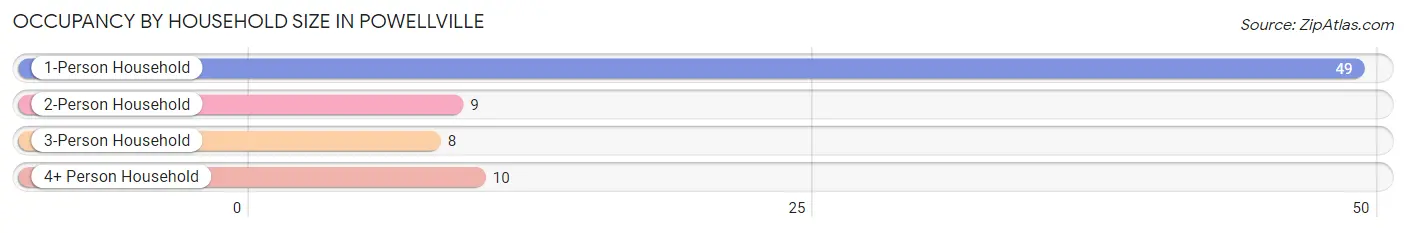
| Household Size | # Housing Units | % Housing Units |
| 1-Person Household | 49 | 64.5% |
| 2-Person Household | 9 | 11.8% |
| 3-Person Household | 8 | 10.5% |
| 4+ Person Household | 10 | 13.2% |
| Total Housing Units | 76 | 100.0% |
Occupancy by Ownership by Household Size in Powellville
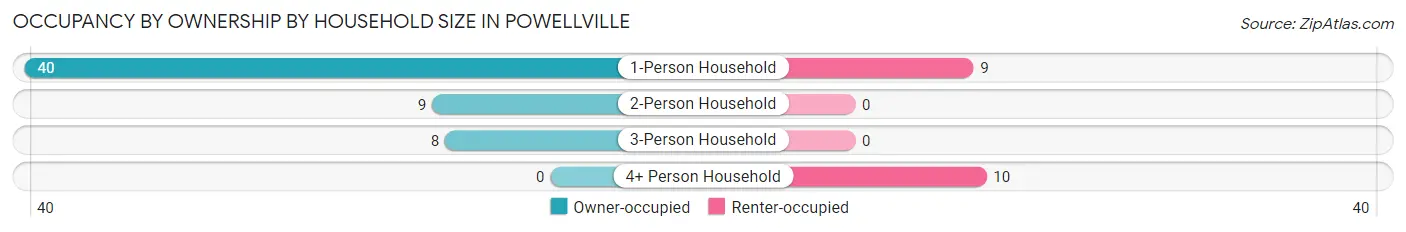
| Household Size | Owner-occupied | Renter-occupied |
| 1-Person Household | 40 (81.6%) | 9 (18.4%) |
| 2-Person Household | 9 (100.0%) | 0 (0.0%) |
| 3-Person Household | 8 (100.0%) | 0 (0.0%) |
| 4+ Person Household | 0 (0.0%) | 10 (100.0%) |
| Total Housing Units | 57 (75.0%) | 19 (25.0%) |
Occupancy by Educational Attainment in Powellville
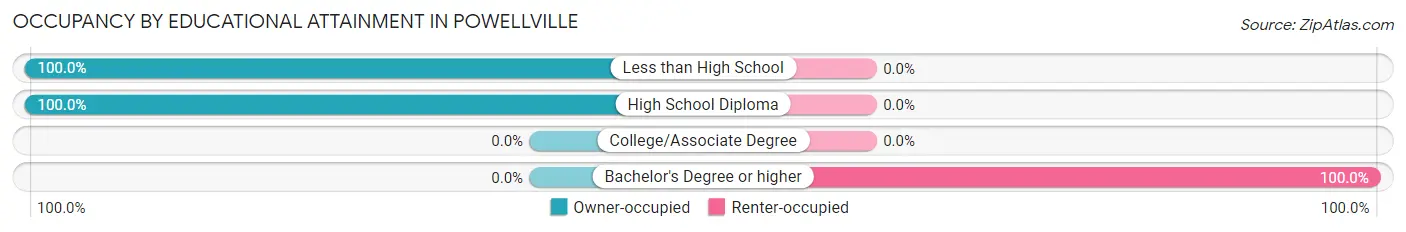
| Household Size | Owner-occupied | Renter-occupied |
| Less than High School | 42 (100.0%) | 0 (0.0%) |
| High School Diploma | 15 (100.0%) | 0 (0.0%) |
| College/Associate Degree | 0 (0.0%) | 0 (0.0%) |
| Bachelor's Degree or higher | 0 (0.0%) | 19 (100.0%) |
Occupancy by Age of Householder in Powellville
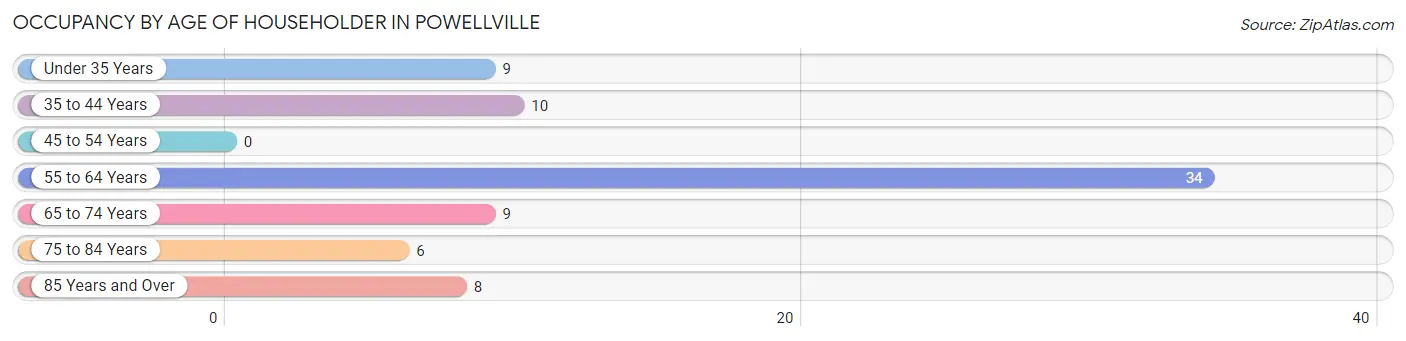
| Age Bracket | # Households | % Households |
| Under 35 Years | 9 | 11.8% |
| 35 to 44 Years | 10 | 13.2% |
| 45 to 54 Years | 0 | 0.0% |
| 55 to 64 Years | 34 | 44.7% |
| 65 to 74 Years | 9 | 11.8% |
| 75 to 84 Years | 6 | 7.9% |
| 85 Years and Over | 8 | 10.5% |
| Total | 76 | 100.0% |
Housing Finances in Powellville
Median Income by Occupancy in Powellville
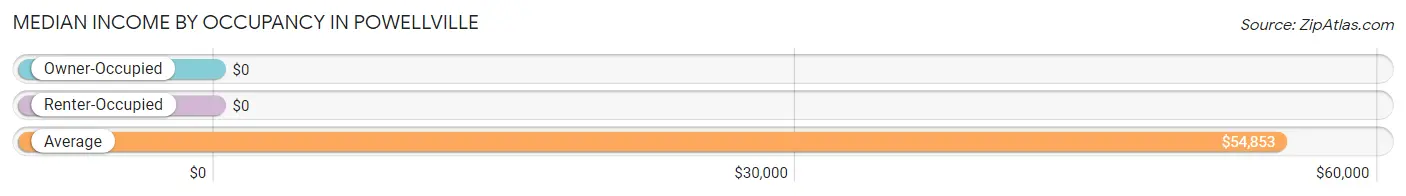
| Occupancy Type | # Households | Median Income |
| Owner-Occupied | 57 (75.0%) | $0 |
| Renter-Occupied | 19 (25.0%) | $0 |
| Average | 76 (100.0%) | $54,853 |
Occupancy by Householder Income Bracket in Powellville
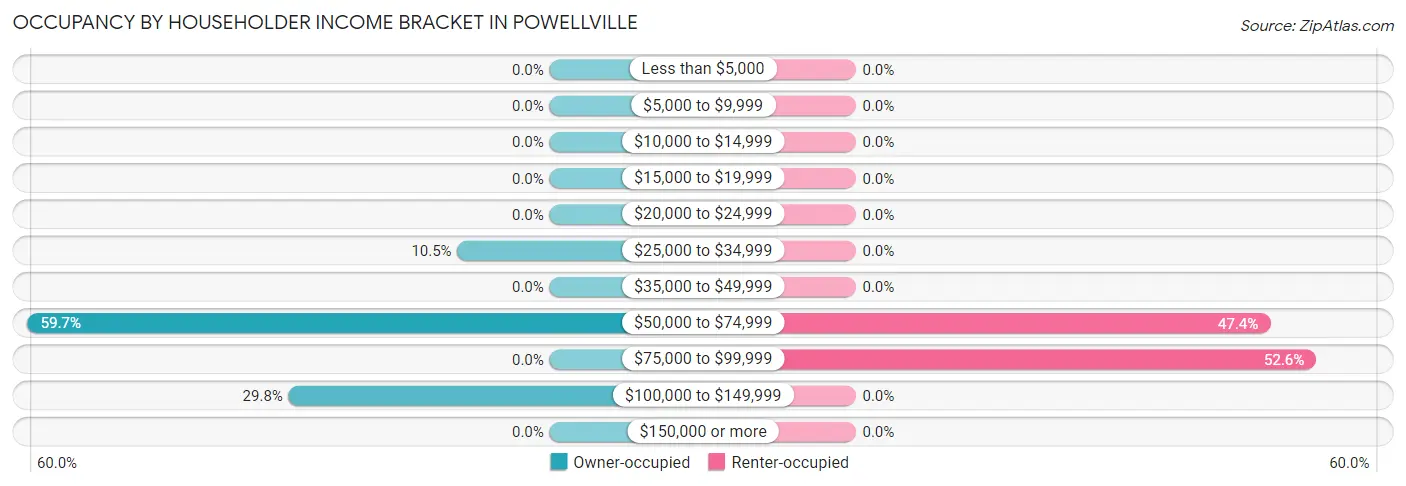
| Income Bracket | Owner-occupied | Renter-occupied |
| Less than $5,000 | 0 (0.0%) | 0 (0.0%) |
| $5,000 to $9,999 | 0 (0.0%) | 0 (0.0%) |
| $10,000 to $14,999 | 0 (0.0%) | 0 (0.0%) |
| $15,000 to $19,999 | 0 (0.0%) | 0 (0.0%) |
| $20,000 to $24,999 | 0 (0.0%) | 0 (0.0%) |
| $25,000 to $34,999 | 6 (10.5%) | 0 (0.0%) |
| $35,000 to $49,999 | 0 (0.0%) | 0 (0.0%) |
| $50,000 to $74,999 | 34 (59.7%) | 9 (47.4%) |
| $75,000 to $99,999 | 0 (0.0%) | 10 (52.6%) |
| $100,000 to $149,999 | 17 (29.8%) | 0 (0.0%) |
| $150,000 or more | 0 (0.0%) | 0 (0.0%) |
| Total | 57 (100.0%) | 19 (100.0%) |
Monthly Housing Cost Tiers in Powellville
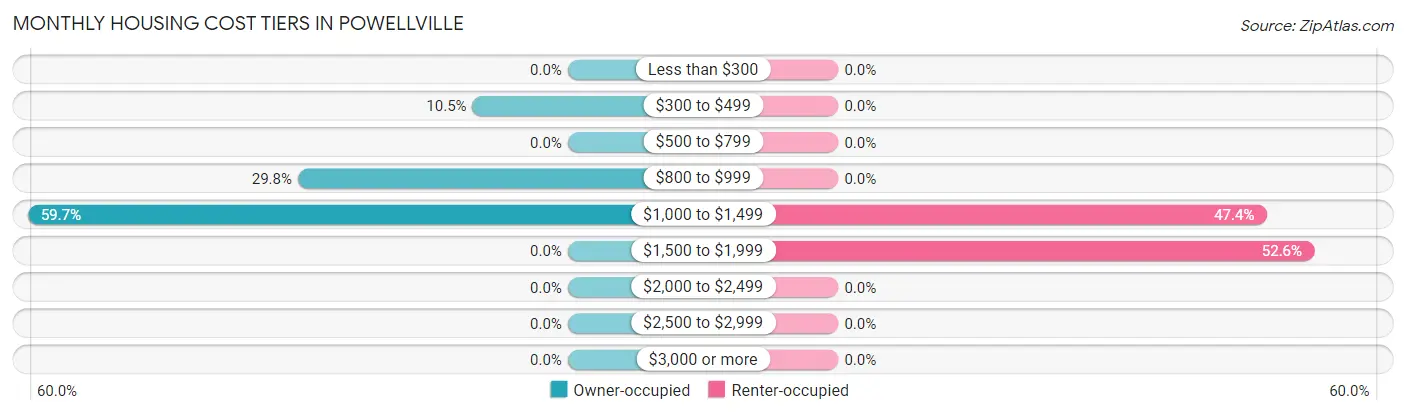
| Monthly Cost | Owner-occupied | Renter-occupied |
| Less than $300 | 0 (0.0%) | 0 (0.0%) |
| $300 to $499 | 6 (10.5%) | 0 (0.0%) |
| $500 to $799 | 0 (0.0%) | 0 (0.0%) |
| $800 to $999 | 17 (29.8%) | 0 (0.0%) |
| $1,000 to $1,499 | 34 (59.7%) | 9 (47.4%) |
| $1,500 to $1,999 | 0 (0.0%) | 10 (52.6%) |
| $2,000 to $2,499 | 0 (0.0%) | 0 (0.0%) |
| $2,500 to $2,999 | 0 (0.0%) | 0 (0.0%) |
| $3,000 or more | 0 (0.0%) | 0 (0.0%) |
| Total | 57 (100.0%) | 19 (100.0%) |
Physical Housing Characteristics in Powellville
Housing Structures in Powellville
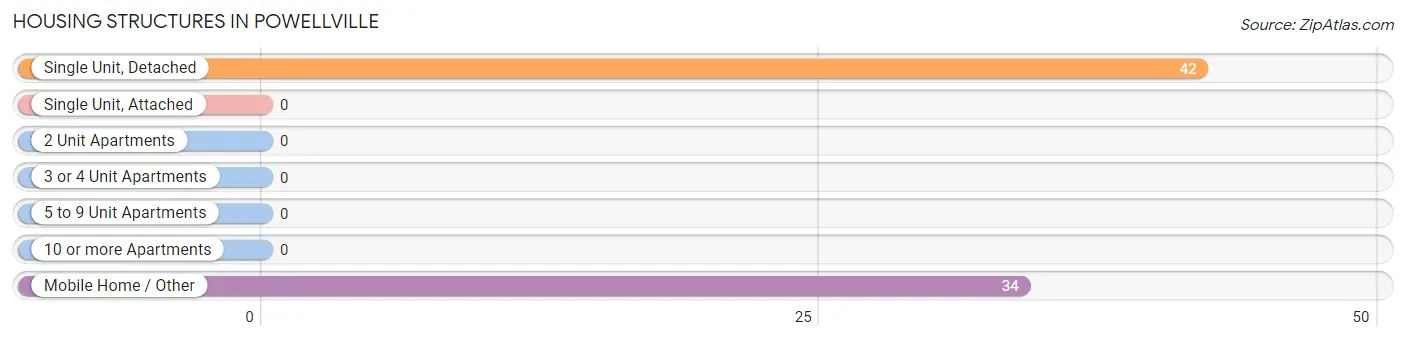
| Structure Type | # Housing Units | % Housing Units |
| Single Unit, Detached | 42 | 55.3% |
| Single Unit, Attached | 0 | 0.0% |
| 2 Unit Apartments | 0 | 0.0% |
| 3 or 4 Unit Apartments | 0 | 0.0% |
| 5 to 9 Unit Apartments | 0 | 0.0% |
| 10 or more Apartments | 0 | 0.0% |
| Mobile Home / Other | 34 | 44.7% |
| Total | 76 | 100.0% |
Housing Structures by Occupancy in Powellville
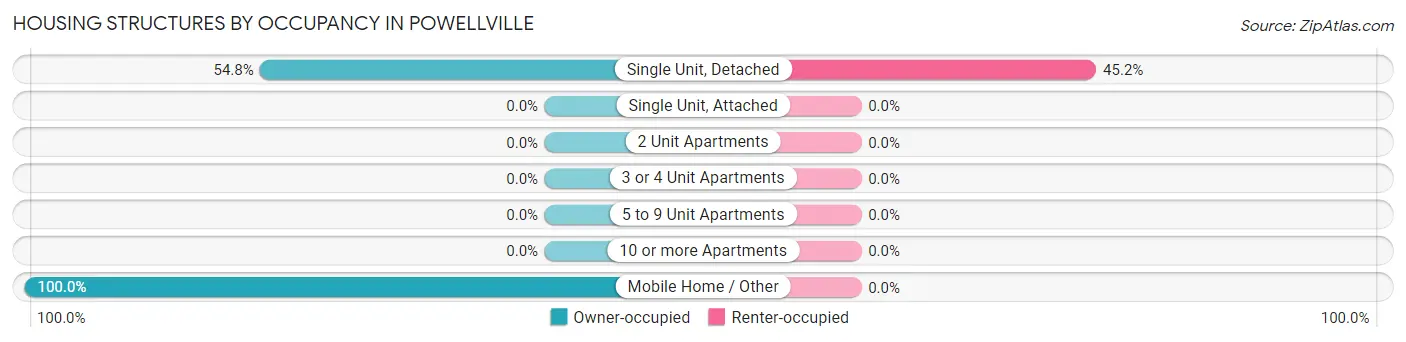
| Structure Type | Owner-occupied | Renter-occupied |
| Single Unit, Detached | 23 (54.8%) | 19 (45.2%) |
| Single Unit, Attached | 0 (0.0%) | 0 (0.0%) |
| 2 Unit Apartments | 0 (0.0%) | 0 (0.0%) |
| 3 or 4 Unit Apartments | 0 (0.0%) | 0 (0.0%) |
| 5 to 9 Unit Apartments | 0 (0.0%) | 0 (0.0%) |
| 10 or more Apartments | 0 (0.0%) | 0 (0.0%) |
| Mobile Home / Other | 34 (100.0%) | 0 (0.0%) |
| Total | 57 (75.0%) | 19 (25.0%) |
Housing Structures by Number of Rooms in Powellville
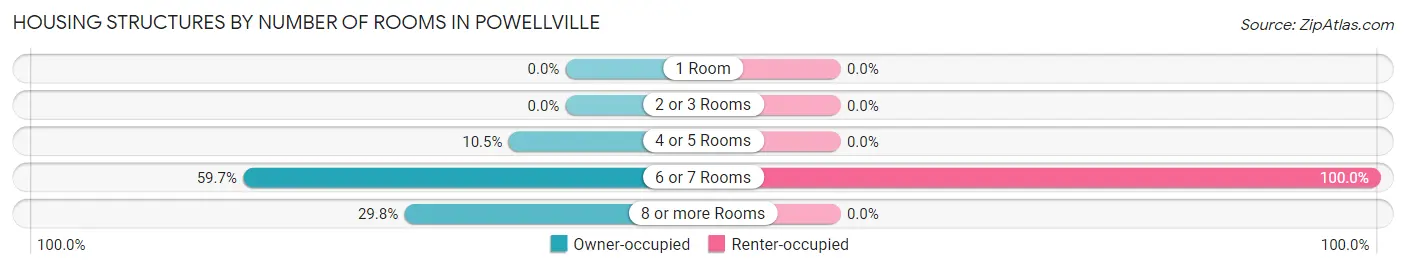
| Number of Rooms | Owner-occupied | Renter-occupied |
| 1 Room | 0 (0.0%) | 0 (0.0%) |
| 2 or 3 Rooms | 0 (0.0%) | 0 (0.0%) |
| 4 or 5 Rooms | 6 (10.5%) | 0 (0.0%) |
| 6 or 7 Rooms | 34 (59.7%) | 19 (100.0%) |
| 8 or more Rooms | 17 (29.8%) | 0 (0.0%) |
| Total | 57 (100.0%) | 19 (100.0%) |
Housing Structure by Heating Type in Powellville
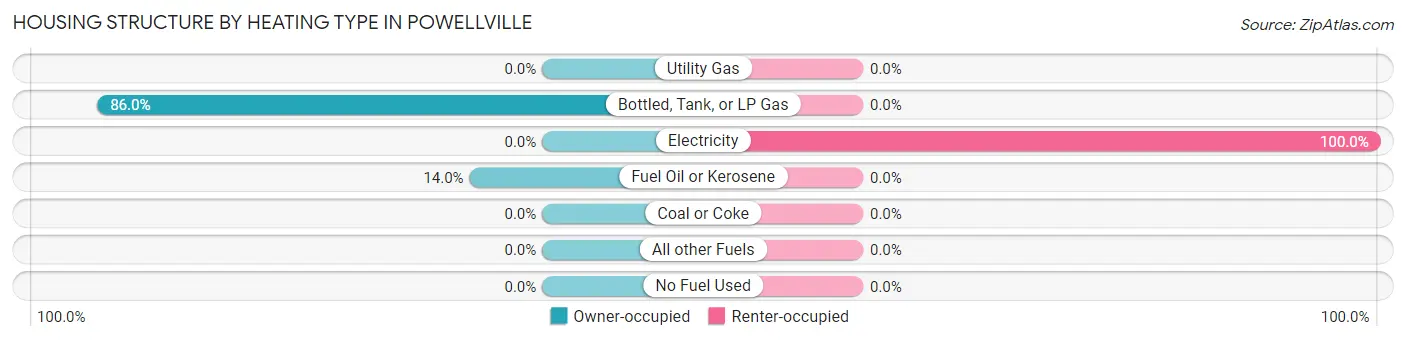
| Heating Type | Owner-occupied | Renter-occupied |
| Utility Gas | 0 (0.0%) | 0 (0.0%) |
| Bottled, Tank, or LP Gas | 49 (86.0%) | 0 (0.0%) |
| Electricity | 0 (0.0%) | 19 (100.0%) |
| Fuel Oil or Kerosene | 8 (14.0%) | 0 (0.0%) |
| Coal or Coke | 0 (0.0%) | 0 (0.0%) |
| All other Fuels | 0 (0.0%) | 0 (0.0%) |
| No Fuel Used | 0 (0.0%) | 0 (0.0%) |
| Total | 57 (100.0%) | 19 (100.0%) |
Household Vehicle Usage in Powellville
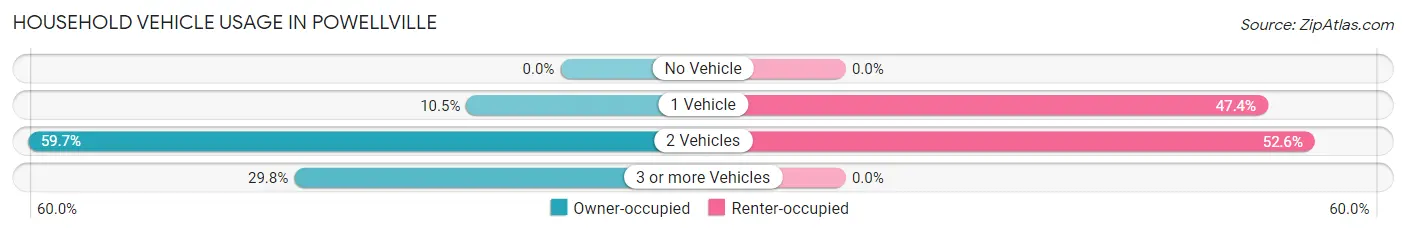
| Vehicles per Household | Owner-occupied | Renter-occupied |
| No Vehicle | 0 (0.0%) | 0 (0.0%) |
| 1 Vehicle | 6 (10.5%) | 9 (47.4%) |
| 2 Vehicles | 34 (59.7%) | 10 (52.6%) |
| 3 or more Vehicles | 17 (29.8%) | 0 (0.0%) |
| Total | 57 (100.0%) | 19 (100.0%) |
Real Estate & Mortgages in Powellville
Real Estate and Mortgage Overview in Powellville
| Characteristic | Without Mortgage | With Mortgage |
| Housing Units | 23 | 34 |
| Median Property Value | $165,300 | $0 |
| Median Household Income | $111,528 | $0 |
| Monthly Housing Costs | $869 | $0 |
| Real Estate Taxes | $1,338 | $0 |
Property Value by Mortgage Status in Powellville
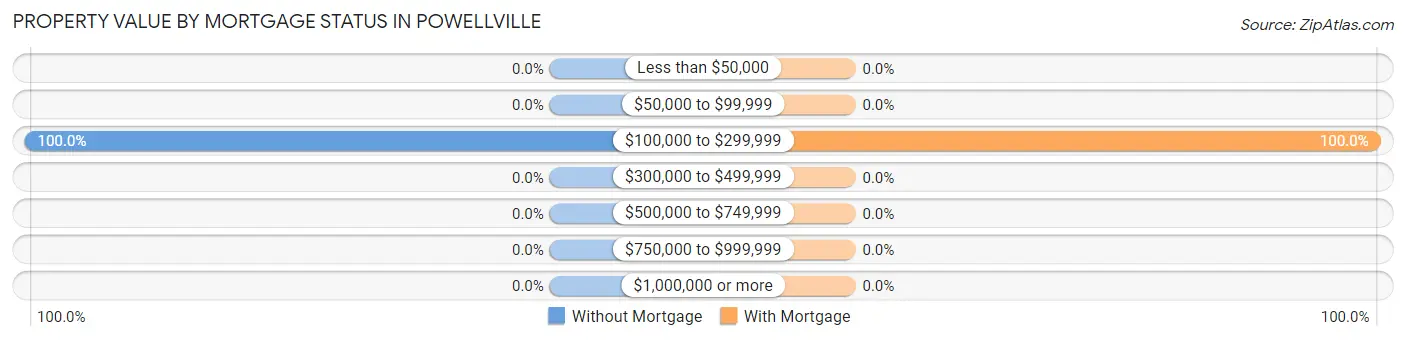
| Property Value | Without Mortgage | With Mortgage |
| Less than $50,000 | 0 (0.0%) | 0 (0.0%) |
| $50,000 to $99,999 | 0 (0.0%) | 0 (0.0%) |
| $100,000 to $299,999 | 23 (100.0%) | 34 (100.0%) |
| $300,000 to $499,999 | 0 (0.0%) | 0 (0.0%) |
| $500,000 to $749,999 | 0 (0.0%) | 0 (0.0%) |
| $750,000 to $999,999 | 0 (0.0%) | 0 (0.0%) |
| $1,000,000 or more | 0 (0.0%) | 0 (0.0%) |
| Total | 23 (100.0%) | 34 (100.0%) |
Household Income by Mortgage Status in Powellville
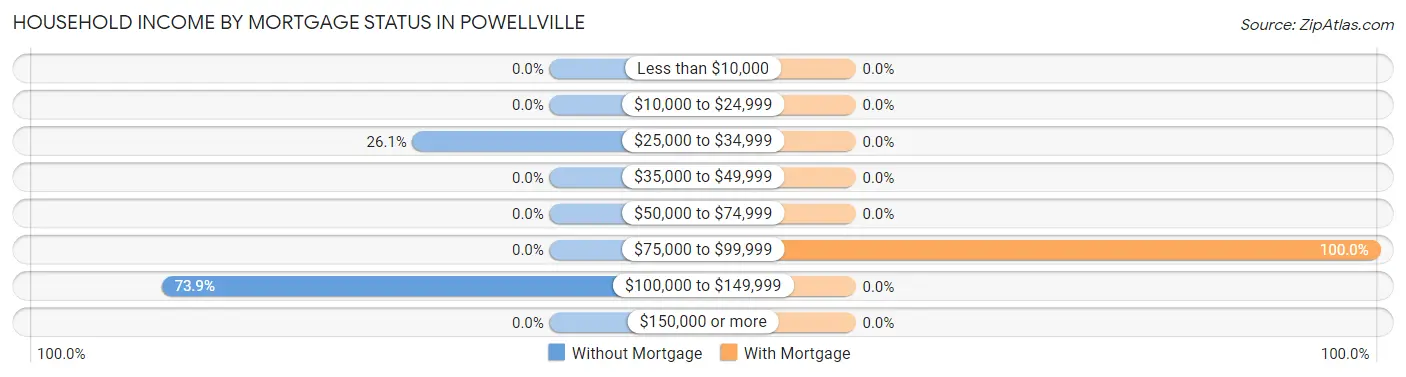
| Household Income | Without Mortgage | With Mortgage |
| Less than $10,000 | 0 (0.0%) | 0 (0.0%) |
| $10,000 to $24,999 | 0 (0.0%) | 0 (0.0%) |
| $25,000 to $34,999 | 6 (26.1%) | 0 (0.0%) |
| $35,000 to $49,999 | 0 (0.0%) | 0 (0.0%) |
| $50,000 to $74,999 | 0 (0.0%) | 0 (0.0%) |
| $75,000 to $99,999 | 0 (0.0%) | 34 (100.0%) |
| $100,000 to $149,999 | 17 (73.9%) | 0 (0.0%) |
| $150,000 or more | 0 (0.0%) | 0 (0.0%) |
| Total | 23 (100.0%) | 34 (100.0%) |
Property Value to Household Income Ratio in Powellville
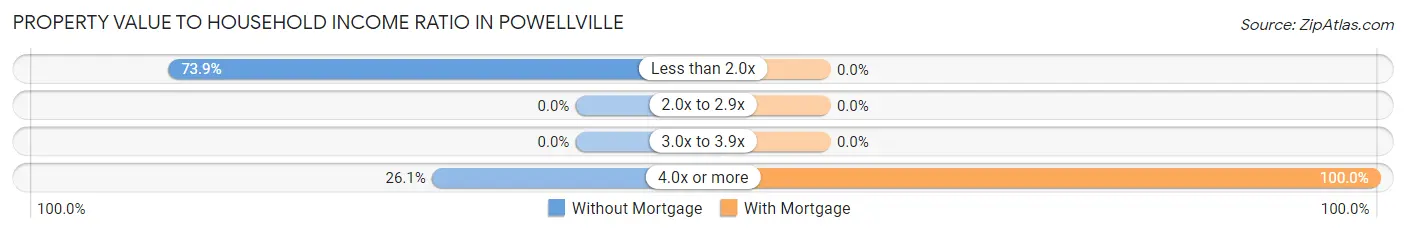
| Value-to-Income Ratio | Without Mortgage | With Mortgage |
| Less than 2.0x | 17 (73.9%) | 0 (0.0%) |
| 2.0x to 2.9x | 0 (0.0%) | 0 (0.0%) |
| 3.0x to 3.9x | 0 (0.0%) | 0 (0.0%) |
| 4.0x or more | 6 (26.1%) | 34 (100.0%) |
| Total | 23 (100.0%) | 34 (100.0%) |
Real Estate Taxes by Mortgage Status in Powellville
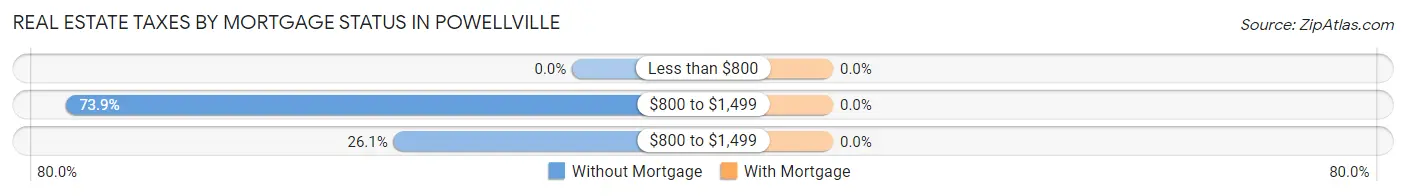
| Property Taxes | Without Mortgage | With Mortgage |
| Less than $800 | 0 (0.0%) | 0 (0.0%) |
| $800 to $1,499 | 17 (73.9%) | 0 (0.0%) |
| $800 to $1,499 | 6 (26.1%) | 0 (0.0%) |
| Total | 23 (100.0%) | 34 (100.0%) |
Health & Disability in Powellville
Health Insurance Coverage by Age in Powellville
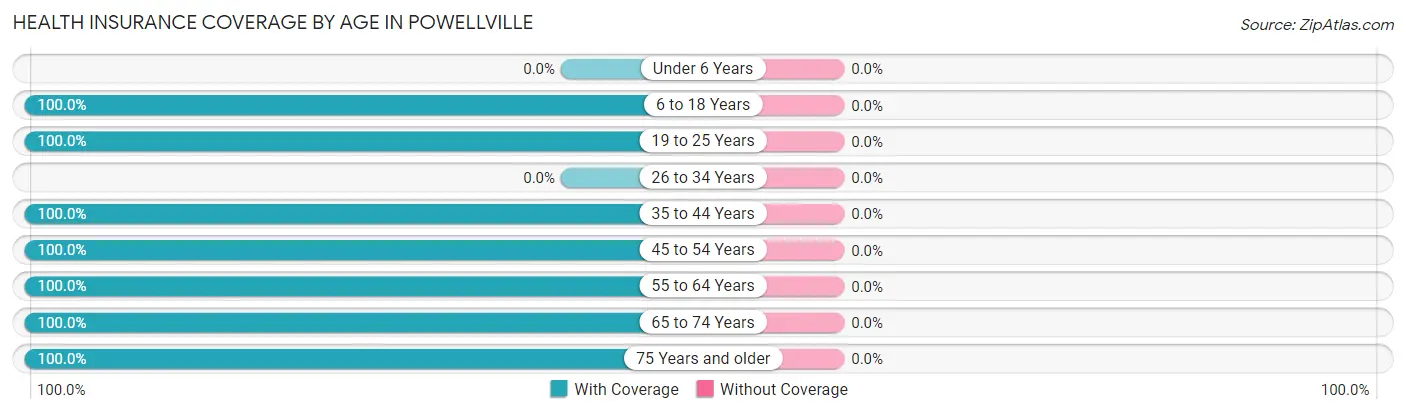
| Age Bracket | With Coverage | Without Coverage |
| Under 6 Years | 0 (0.0%) | 0 (0.0%) |
| 6 to 18 Years | 29 (100.0%) | 0 (0.0%) |
| 19 to 25 Years | 9 (100.0%) | 0 (0.0%) |
| 26 to 34 Years | 0 (0.0%) | 0 (0.0%) |
| 35 to 44 Years | 22 (100.0%) | 0 (0.0%) |
| 45 to 54 Years | 10 (100.0%) | 0 (0.0%) |
| 55 to 64 Years | 34 (100.0%) | 0 (0.0%) |
| 65 to 74 Years | 16 (100.0%) | 0 (0.0%) |
| 75 Years and older | 20 (100.0%) | 0 (0.0%) |
| Total | 140 (100.0%) | 0 (0.0%) |
Health Insurance Coverage by Citizenship Status in Powellville
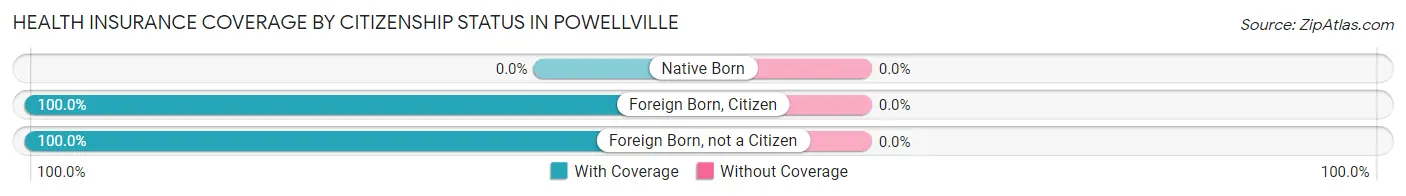
| Citizenship Status | With Coverage | Without Coverage |
| Native Born | 0 (0.0%) | 0 (0.0%) |
| Foreign Born, Citizen | 29 (100.0%) | 0 (0.0%) |
| Foreign Born, not a Citizen | 9 (100.0%) | 0 (0.0%) |
Health Insurance Coverage by Household Income in Powellville
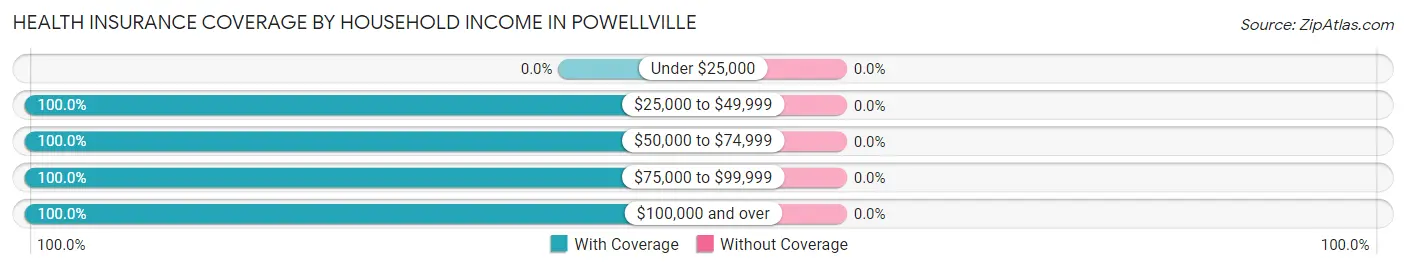
| Household Income | With Coverage | Without Coverage |
| Under $25,000 | 0 (0.0%) | 0 (0.0%) |
| $25,000 to $49,999 | 6 (100.0%) | 0 (0.0%) |
| $50,000 to $74,999 | 43 (100.0%) | 0 (0.0%) |
| $75,000 to $99,999 | 51 (100.0%) | 0 (0.0%) |
| $100,000 and over | 40 (100.0%) | 0 (0.0%) |
Public vs Private Health Insurance Coverage by Age in Powellville
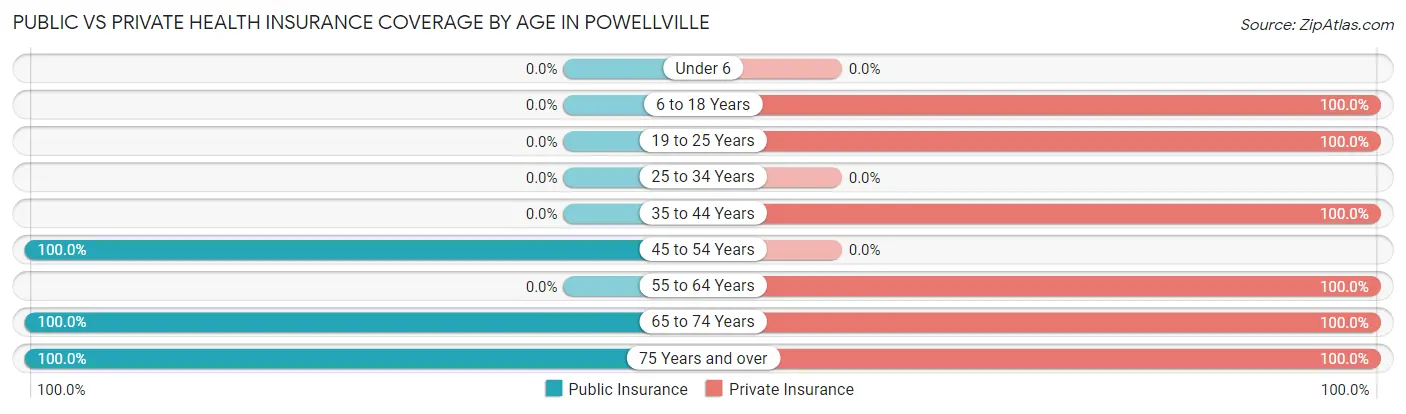
| Age Bracket | Public Insurance | Private Insurance |
| Under 6 | 0 (0.0%) | 0 (0.0%) |
| 6 to 18 Years | 0 (0.0%) | 29 (100.0%) |
| 19 to 25 Years | 0 (0.0%) | 9 (100.0%) |
| 25 to 34 Years | 0 (0.0%) | 0 (0.0%) |
| 35 to 44 Years | 0 (0.0%) | 22 (100.0%) |
| 45 to 54 Years | 10 (100.0%) | 0 (0.0%) |
| 55 to 64 Years | 0 (0.0%) | 34 (100.0%) |
| 65 to 74 Years | 16 (100.0%) | 16 (100.0%) |
| 75 Years and over | 20 (100.0%) | 20 (100.0%) |
| Total | 46 (32.9%) | 130 (92.9%) |
Disability Status by Sex by Age in Powellville
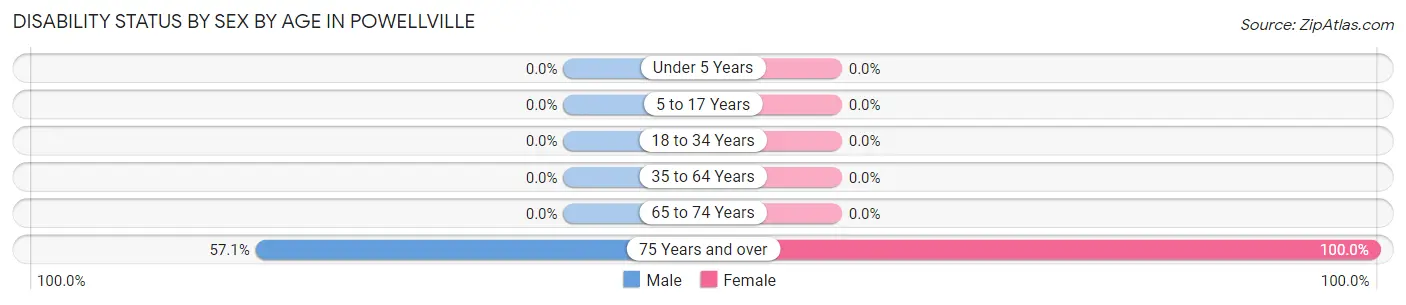
| Age Bracket | Male | Female |
| Under 5 Years | 0 (0.0%) | 0 (0.0%) |
| 5 to 17 Years | 0 (0.0%) | 0 (0.0%) |
| 18 to 34 Years | 0 (0.0%) | 0 (0.0%) |
| 35 to 64 Years | 0 (0.0%) | 0 (0.0%) |
| 65 to 74 Years | 0 (0.0%) | 0 (0.0%) |
| 75 Years and over | 8 (57.1%) | 6 (100.0%) |
Disability Class by Sex by Age in Powellville
Disability Class: Hearing Difficulty
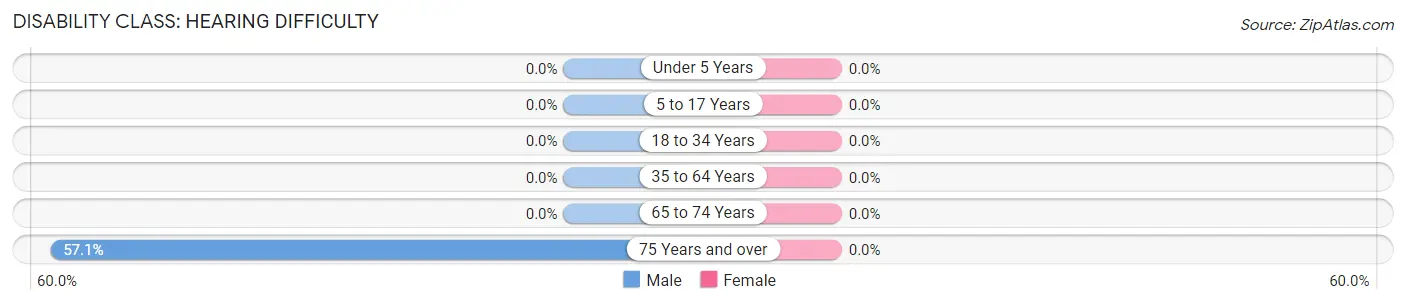
| Age Bracket | Male | Female |
| Under 5 Years | 0 (0.0%) | 0 (0.0%) |
| 5 to 17 Years | 0 (0.0%) | 0 (0.0%) |
| 18 to 34 Years | 0 (0.0%) | 0 (0.0%) |
| 35 to 64 Years | 0 (0.0%) | 0 (0.0%) |
| 65 to 74 Years | 0 (0.0%) | 0 (0.0%) |
| 75 Years and over | 8 (57.1%) | 0 (0.0%) |
Disability Class: Vision Difficulty
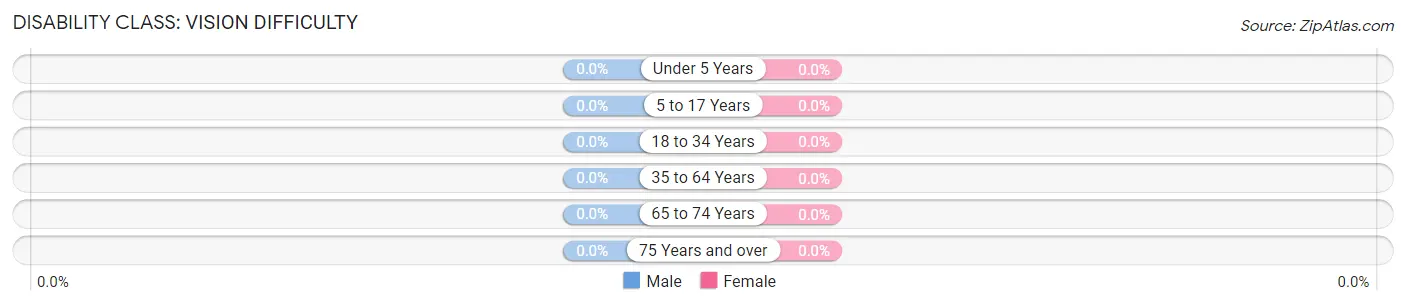
| Age Bracket | Male | Female |
| Under 5 Years | 0 (0.0%) | 0 (0.0%) |
| 5 to 17 Years | 0 (0.0%) | 0 (0.0%) |
| 18 to 34 Years | 0 (0.0%) | 0 (0.0%) |
| 35 to 64 Years | 0 (0.0%) | 0 (0.0%) |
| 65 to 74 Years | 0 (0.0%) | 0 (0.0%) |
| 75 Years and over | 0 (0.0%) | 0 (0.0%) |
Disability Class: Cognitive Difficulty
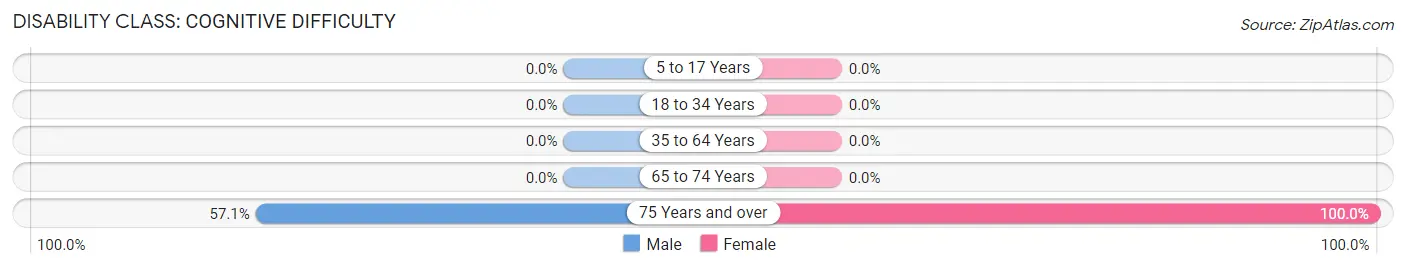
| Age Bracket | Male | Female |
| 5 to 17 Years | 0 (0.0%) | 0 (0.0%) |
| 18 to 34 Years | 0 (0.0%) | 0 (0.0%) |
| 35 to 64 Years | 0 (0.0%) | 0 (0.0%) |
| 65 to 74 Years | 0 (0.0%) | 0 (0.0%) |
| 75 Years and over | 8 (57.1%) | 6 (100.0%) |
Disability Class: Ambulatory Difficulty
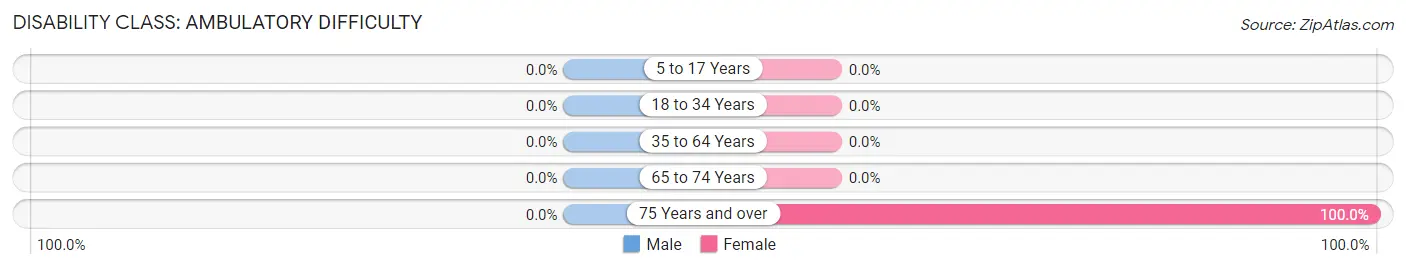
| Age Bracket | Male | Female |
| 5 to 17 Years | 0 (0.0%) | 0 (0.0%) |
| 18 to 34 Years | 0 (0.0%) | 0 (0.0%) |
| 35 to 64 Years | 0 (0.0%) | 0 (0.0%) |
| 65 to 74 Years | 0 (0.0%) | 0 (0.0%) |
| 75 Years and over | 0 (0.0%) | 6 (100.0%) |
Disability Class: Self-Care Difficulty
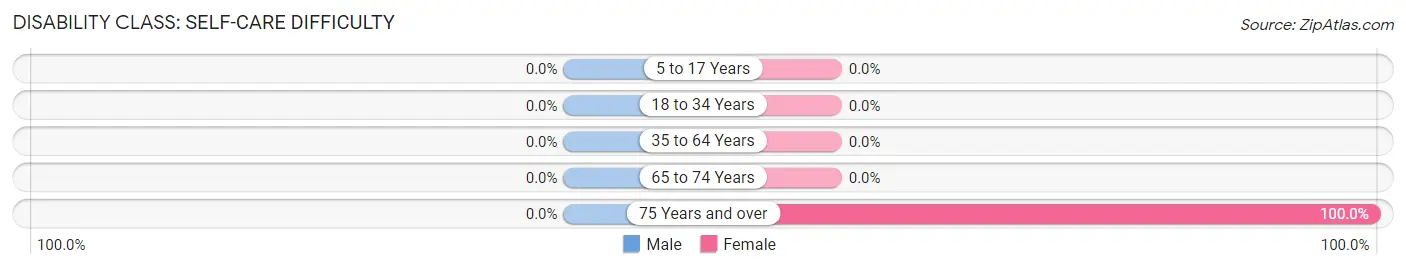
| Age Bracket | Male | Female |
| 5 to 17 Years | 0 (0.0%) | 0 (0.0%) |
| 18 to 34 Years | 0 (0.0%) | 0 (0.0%) |
| 35 to 64 Years | 0 (0.0%) | 0 (0.0%) |
| 65 to 74 Years | 0 (0.0%) | 0 (0.0%) |
| 75 Years and over | 0 (0.0%) | 6 (100.0%) |
Technology Access in Powellville
Computing Device Access in Powellville
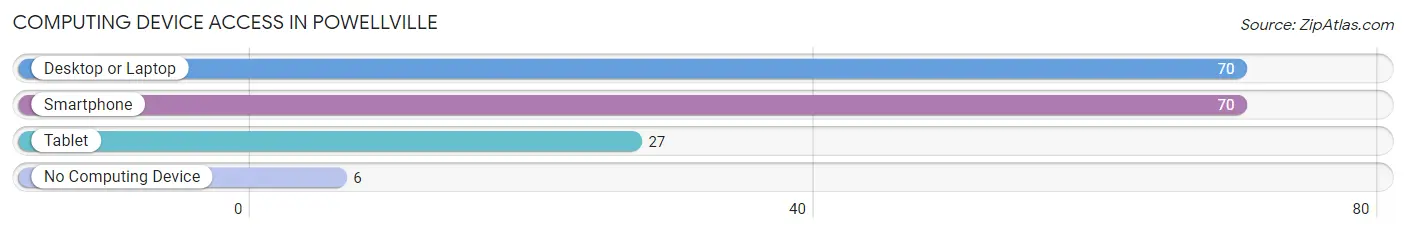
| Device Type | # Households | % Households |
| Desktop or Laptop | 70 | 92.1% |
| Smartphone | 70 | 92.1% |
| Tablet | 27 | 35.5% |
| No Computing Device | 6 | 7.9% |
| Total | 76 | 100.0% |
Internet Access in Powellville
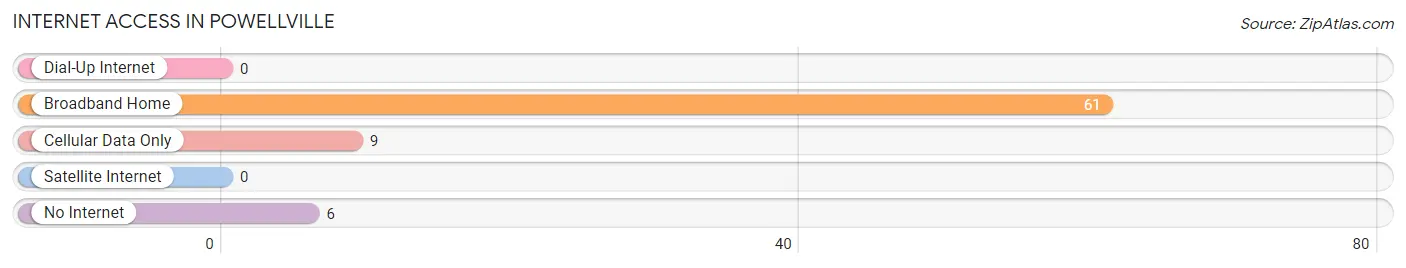
| Internet Type | # Households | % Households |
| Dial-Up Internet | 0 | 0.0% |
| Broadband Home | 61 | 80.3% |
| Cellular Data Only | 9 | 11.8% |
| Satellite Internet | 0 | 0.0% |
| No Internet | 6 | 7.9% |
| Total | 76 | 100.0% |
Powellville Summary
Powellville is a small unincorporated community located in Wicomico County, Maryland. It is situated on the eastern shore of the Chesapeake Bay, approximately 10 miles south of Salisbury. The population of Powellville was estimated to be around 500 in 2000.
History
Powellville was first settled in the early 1700s by the Powell family, who were among the first settlers in the area. The town was originally known as Powell's Town, and was later changed to Powellville. The town was officially incorporated in 1867.
Powellville was a thriving agricultural community in the late 19th and early 20th centuries. The town was home to several large farms, as well as a number of small businesses. The town also had a post office, a school, and a church.
Geography
Powellville is located in Wicomico County, Maryland, on the eastern shore of the Chesapeake Bay. The town is situated on a peninsula, with the Chesapeake Bay to the east and the Nanticoke River to the west. The town is approximately 10 miles south of Salisbury, the county seat.
The town is surrounded by rural farmland, with the nearest major city being Baltimore, which is approximately 90 miles to the north. The climate in Powellville is humid subtropical, with hot, humid summers and mild winters.
Economy
Powellville is a small, rural community with a limited economy. The town is primarily supported by agriculture, with the majority of the population employed in farming and related industries. The town also has a few small businesses, including a convenience store, a gas station, and a few restaurants.
Demographics
As of the 2000 census, the population of Powellville was estimated to be around 500. The racial makeup of the town was 97.2% White, 1.2% African American, 0.4% Native American, 0.2% Asian, and 0.8% from other races. The median household income was $37,500, and the median family income was $41,250. The per capita income was $17,500.
Conclusion
Powellville is a small, rural community located on the eastern shore of the Chesapeake Bay in Wicomico County, Maryland. The town has a long history, dating back to the early 1700s, and has a population of around 500. The town is primarily supported by agriculture, with the majority of the population employed in farming and related industries. The town also has a few small businesses, including a convenience store, a gas station, and a few restaurants.
Common Questions
What is Per Capita Income in Powellville?
Per Capita income in Powellville is $39,348.
What is the Median Household income in Powellville?
Median Household Income in Powellville is $54,853.
What is Income or Wage Gap in Powellville?
Income or Wage Gap in Powellville is 5.6%.
Women in Powellville earn 94.4 cents for every dollar earned by a man.
What is Inequality or Gini Index in Powellville?
Inequality or Gini Index in Powellville is 0.20.
What is the Total Population of Powellville?
Total Population of Powellville is 140.
What is the Total Male Population of Powellville?
Total Male Population of Powellville is 82.
What is the Total Female Population of Powellville?
Total Female Population of Powellville is 58.
What is the Ratio of Males per 100 Females in Powellville?
There are 141.38 Males per 100 Females in Powellville.
What is the Ratio of Females per 100 Males in Powellville?
There are 70.73 Females per 100 Males in Powellville.
What is the Median Population Age in Powellville?
Median Population Age in Powellville is 58.0 Years.
What is the Average Family Size in Powellville
Average Family Size in Powellville is 4.0 People.
What is the Average Household Size in Powellville
Average Household Size in Powellville is 1.8 People.
How Large is the Labor Force in Powellville?
There are 74 People in the Labor Forcein in Powellville.
What is the Percentage of People in the Labor Force in Powellville?
62.7% of People are in the Labor Force in Powellville.