Williston, MD Map & Demographics
Williston Map
Williston Overview
$57,739
PER CAPITA INCOME
0.33
INEQUALITY / GINI INDEX
153
TOTAL POPULATION
132
MALE POPULATION
21
FEMALE POPULATION
628.57
MALES / 100 FEMALES
15.91
FEMALES / 100 MALES
33.2
MEDIAN AGE
2.9
AVG FAMILY SIZE
2.5
AVG HOUSEHOLD SIZE
131
LABOR FORCE [ PEOPLE ]
85.6%
PERCENT IN LABOR FORCE
Income in Williston
Income Overview in Williston
| Characteristic | Number | Measure |
| Per Capita Income | 153 | $57,739 |
| Median Family Income | 23 | $0 |
| Mean Family Income | 23 | $0 |
| Median Household Income | 60 | $0 |
| Mean Household Income | 60 | $108,143 |
| Income Deficit | 23 | $0 |
| Wage / Income Gap (%) | 153 | 0.00% |
| Wage / Income Gap ($) | 153 | 100.00¢ per $1 |
| Gini / Inequality Index | 153 | 0.33 |
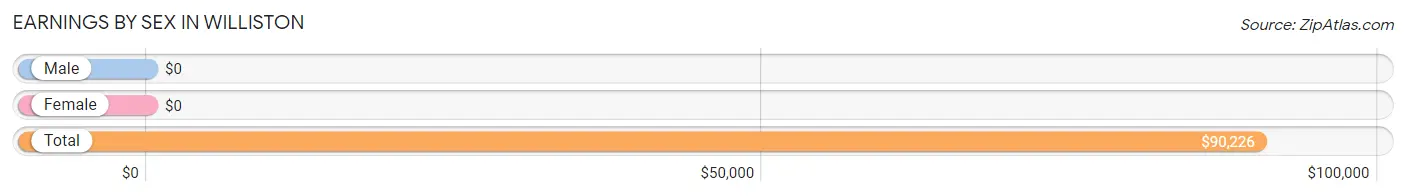
Earnings by Sex in Williston
| Sex | Number | Average Earnings |
| Male | 121 (92.4%) | $0 |
| Female | 10 (7.6%) | $0 |
| Total | 131 (100.0%) | $90,226 |
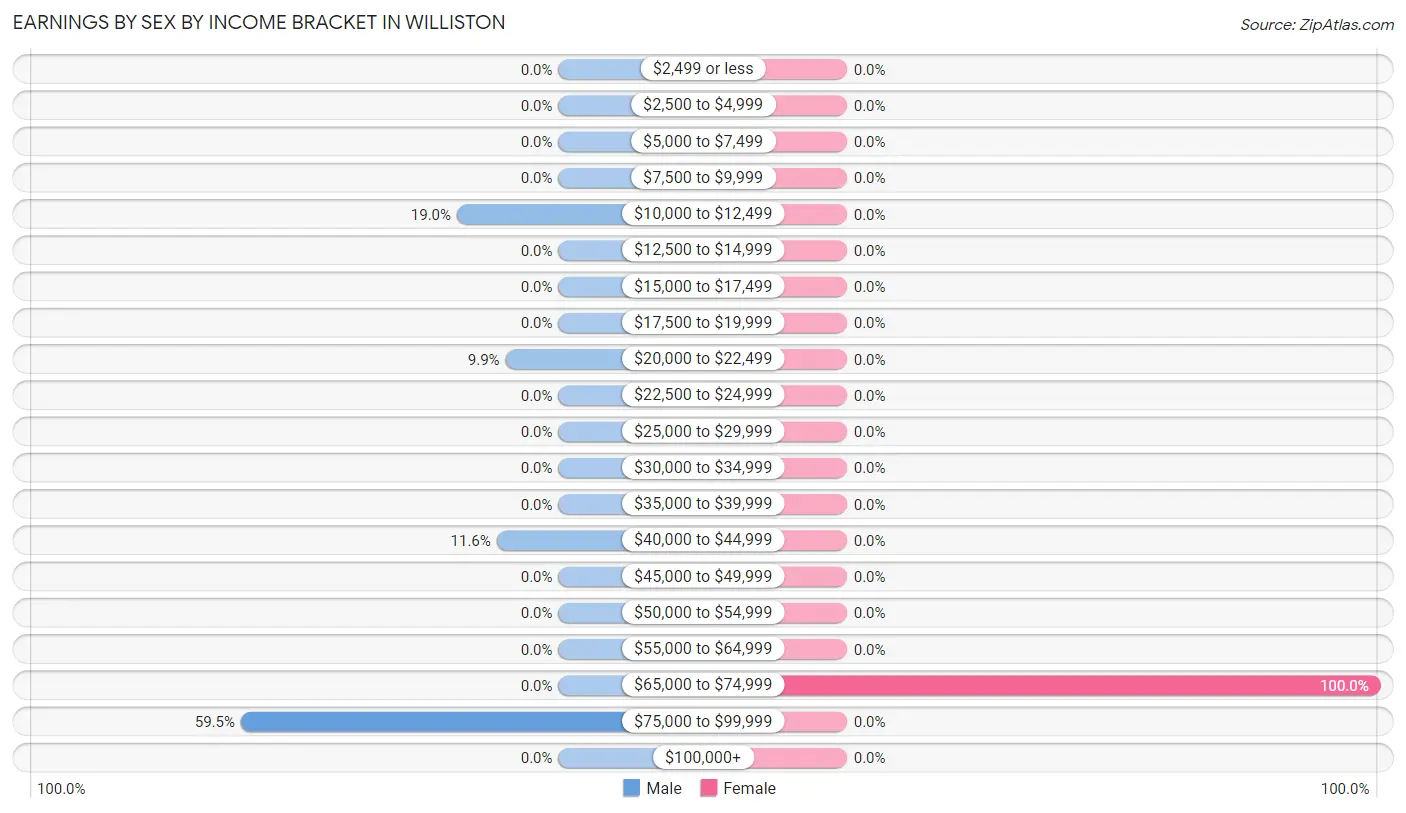
Earnings by Sex by Income Bracket in Williston
The most common earnings brackets in Williston are $75,000 to $99,999 for men (72 | 59.5%) and $65,000 to $74,999 for women (10 | 100.0%).
| Income | Male | Female |
| $2,499 or less | 0 (0.0%) | 0 (0.0%) |
| $2,500 to $4,999 | 0 (0.0%) | 0 (0.0%) |
| $5,000 to $7,499 | 0 (0.0%) | 0 (0.0%) |
| $7,500 to $9,999 | 0 (0.0%) | 0 (0.0%) |
| $10,000 to $12,499 | 23 (19.0%) | 0 (0.0%) |
| $12,500 to $14,999 | 0 (0.0%) | 0 (0.0%) |
| $15,000 to $17,499 | 0 (0.0%) | 0 (0.0%) |
| $17,500 to $19,999 | 0 (0.0%) | 0 (0.0%) |
| $20,000 to $22,499 | 12 (9.9%) | 0 (0.0%) |
| $22,500 to $24,999 | 0 (0.0%) | 0 (0.0%) |
| $25,000 to $29,999 | 0 (0.0%) | 0 (0.0%) |
| $30,000 to $34,999 | 0 (0.0%) | 0 (0.0%) |
| $35,000 to $39,999 | 0 (0.0%) | 0 (0.0%) |
| $40,000 to $44,999 | 14 (11.6%) | 0 (0.0%) |
| $45,000 to $49,999 | 0 (0.0%) | 0 (0.0%) |
| $50,000 to $54,999 | 0 (0.0%) | 0 (0.0%) |
| $55,000 to $64,999 | 0 (0.0%) | 0 (0.0%) |
| $65,000 to $74,999 | 0 (0.0%) | 10 (100.0%) |
| $75,000 to $99,999 | 72 (59.5%) | 0 (0.0%) |
| $100,000+ | 0 (0.0%) | 0 (0.0%) |
| Total | 121 (100.0%) | 10 (100.0%) |
Earnings by Sex by Educational Attainment in Williston
| Educational Attainment | Male Income | Female Income |
| Less than High School | - | - |
| High School Diploma | - | - |
| College or Associate's Degree | - | - |
| Bachelor's Degree | - | - |
| Graduate Degree | - | - |
| Total | - | - |
Family Income in Williston
Family Income Brackets in Williston
According to the Williston family income data, there are 12 families falling into the $100,000 to $149,999 income range, which is the most common income bracket and makes up 52.2% of all families.
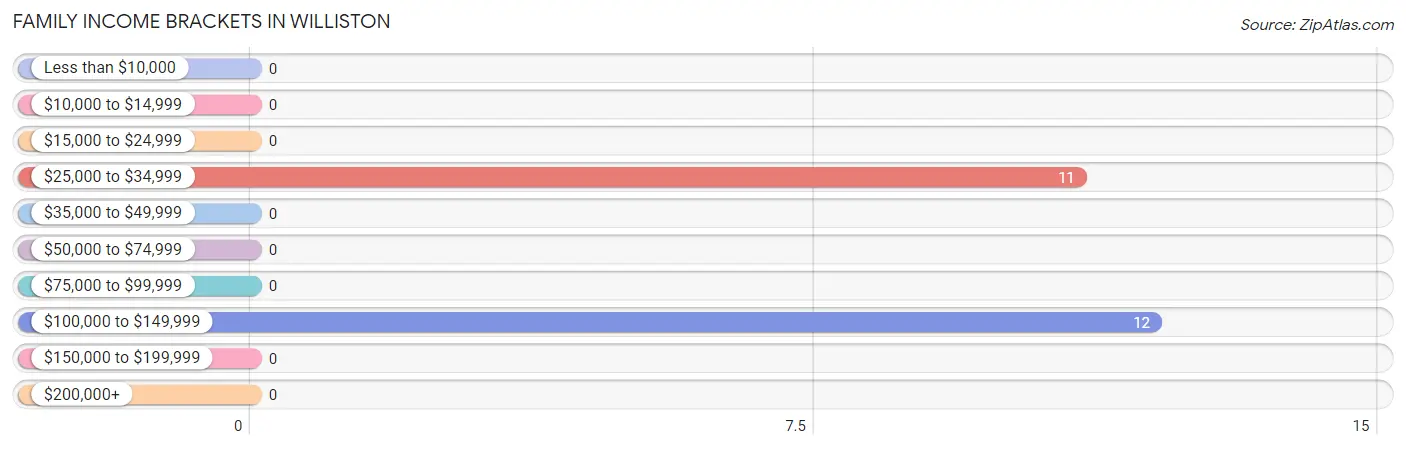
| Income Bracket | # Families | % Families |
| Less than $10,000 | 0 | 0.0% |
| $10,000 to $14,999 | 0 | 0.0% |
| $15,000 to $24,999 | 0 | 0.0% |
| $25,000 to $34,999 | 11 | 47.8% |
| $35,000 to $49,999 | 0 | 0.0% |
| $50,000 to $74,999 | 0 | 0.0% |
| $75,000 to $99,999 | 0 | 0.0% |
| $100,000 to $149,999 | 12 | 52.2% |
| $150,000 to $199,999 | 0 | 0.0% |
| $200,000+ | 0 | 0.0% |
Family Income by Famaliy Size in Williston
| Income Bracket | # Families | Median Income |
| 2-Person Families | 11 (47.8%) | $0 |
| 3-Person Families | 12 (52.2%) | $0 |
| 4-Person Families | 0 (0.0%) | $0 |
| 5-Person Families | 0 (0.0%) | $0 |
| 6-Person Families | 0 (0.0%) | $0 |
| 7+ Person Families | 0 (0.0%) | $0 |
| Total | 23 (100.0%) | $0 |
Family Income by Number of Earners in Williston
| Number of Earners | # Families | Median Income |
| No Earners | 11 (47.8%) | $0 |
| 1 Earner | 0 (0.0%) | $0 |
| 2 Earners | 0 (0.0%) | $0 |
| 3+ Earners | 12 (52.2%) | $0 |
| Total | 23 (100.0%) | $0 |
Household Income in Williston
Household Income Brackets in Williston
With 23 households falling in the category, the $150,000 to $199,999 income range is the most frequent in Williston, accounting for 38.3% of all households.
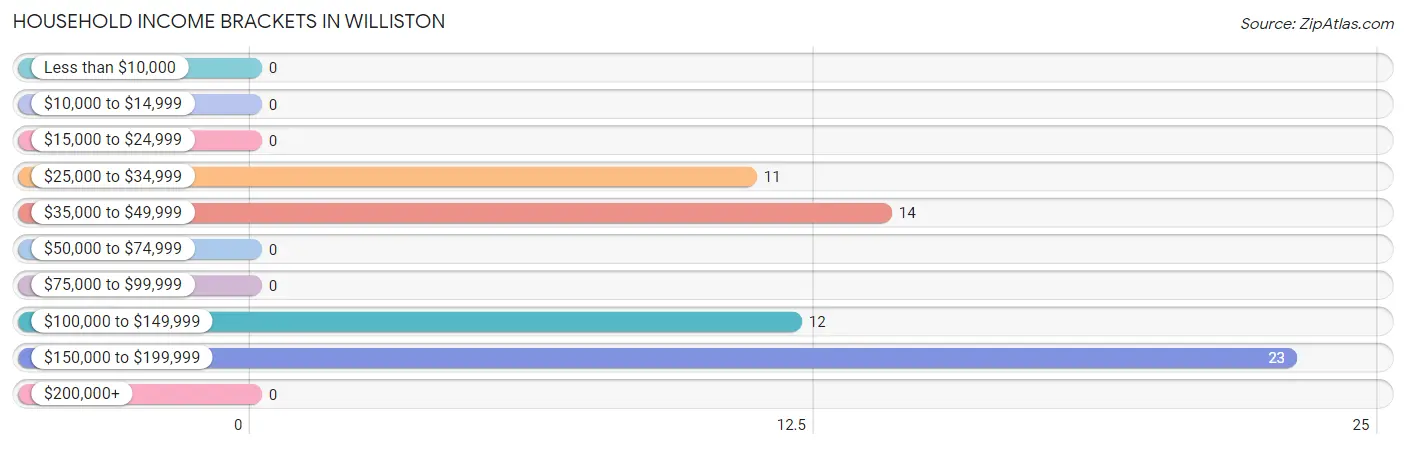
| Income Bracket | # Households | % Households |
| Less than $10,000 | 0 | 0.0% |
| $10,000 to $14,999 | 0 | 0.0% |
| $15,000 to $24,999 | 0 | 0.0% |
| $25,000 to $34,999 | 11 | 18.3% |
| $35,000 to $49,999 | 14 | 23.3% |
| $50,000 to $74,999 | 0 | 0.0% |
| $75,000 to $99,999 | 0 | 0.0% |
| $100,000 to $149,999 | 12 | 20.0% |
| $150,000 to $199,999 | 23 | 38.3% |
| $200,000+ | 0 | 0.0% |
Household Income by Householder Age in Williston
| Income Bracket | # Households | Median Income |
| 15 to 24 Years | 0 (0.0%) | $0 |
| 25 to 44 Years | 23 (38.3%) | $0 |
| 45 to 64 Years | 14 (23.3%) | $0 |
| 65+ Years | 23 (38.3%) | $0 |
| Total | 60 (100.0%) | $0 |
Poverty in Williston
Income Below Poverty by Sex and Age in Williston
| Age Bracket | Male | Female |
| Under 5 Years | 0 (0.0%) | 0 (0.0%) |
| 5 Years | 0 (0.0%) | 0 (0.0%) |
| 6 to 11 Years | 0 (0.0%) | 0 (0.0%) |
| 12 to 14 Years | 0 (0.0%) | 0 (0.0%) |
| 15 Years | 0 (0.0%) | 0 (0.0%) |
| 16 and 17 Years | 0 (0.0%) | 0 (0.0%) |
| 18 to 24 Years | 0 (0.0%) | 0 (0.0%) |
| 25 to 34 Years | 0 (0.0%) | 0 (0.0%) |
| 35 to 44 Years | 0 (0.0%) | 0 (0.0%) |
| 45 to 54 Years | 0 (0.0%) | 0 (0.0%) |
| 55 to 64 Years | 0 (0.0%) | 0 (0.0%) |
| 65 to 74 Years | 0 (0.0%) | 0 (0.0%) |
| 75 Years and over | 0 (0.0%) | 0 (0.0%) |
| Total | 0 (0.0%) | 0 (0.0%) |
Income Above Poverty by Sex and Age in Williston
According to the poverty statistics in Williston, males aged 25 to 34 years and females aged 45 to 54 years are the age groups that are most secure financially, with 100.0% of males and 100.0% of females in these age groups living above the poverty line.
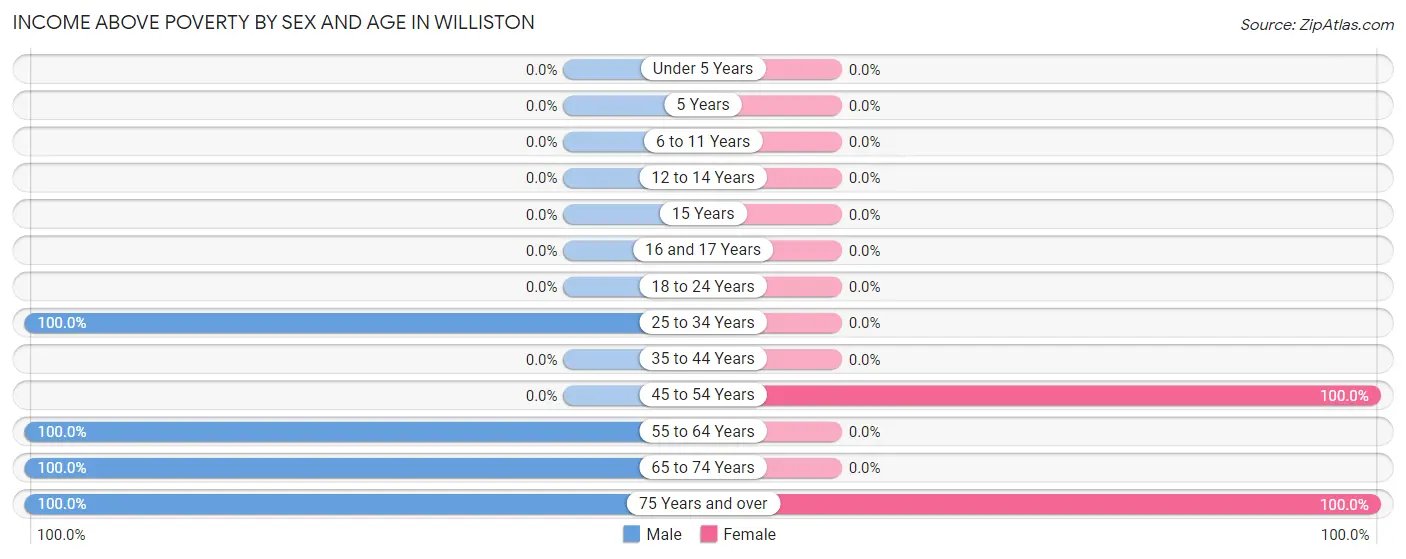
| Age Bracket | Male | Female |
| Under 5 Years | 0 (0.0%) | 0 (0.0%) |
| 5 Years | 0 (0.0%) | 0 (0.0%) |
| 6 to 11 Years | 0 (0.0%) | 0 (0.0%) |
| 12 to 14 Years | 0 (0.0%) | 0 (0.0%) |
| 15 Years | 0 (0.0%) | 0 (0.0%) |
| 16 and 17 Years | 0 (0.0%) | 0 (0.0%) |
| 18 to 24 Years | 0 (0.0%) | 0 (0.0%) |
| 25 to 34 Years | 95 (100.0%) | 0 (0.0%) |
| 35 to 44 Years | 0 (0.0%) | 0 (0.0%) |
| 45 to 54 Years | 0 (0.0%) | 10 (100.0%) |
| 55 to 64 Years | 14 (100.0%) | 0 (0.0%) |
| 65 to 74 Years | 12 (100.0%) | 0 (0.0%) |
| 75 Years and over | 11 (100.0%) | 11 (100.0%) |
| Total | 132 (100.0%) | 21 (100.0%) |
Income Below Poverty Among Married-Couple Families in Williston
| Children | Above Poverty | Below Poverty |
| No Children | 23 (100.0%) | 0 (0.0%) |
| 1 or 2 Children | 0 (0.0%) | 0 (0.0%) |
| 3 or 4 Children | 0 (0.0%) | 0 (0.0%) |
| 5 or more Children | 0 (0.0%) | 0 (0.0%) |
| Total | 23 (100.0%) | 0 (0.0%) |
Income Below Poverty Among Single-Parent Households in Williston
| Children | Single Father | Single Mother |
| No Children | 0 (0.0%) | 0 (0.0%) |
| 1 or 2 Children | 0 (0.0%) | 0 (0.0%) |
| 3 or 4 Children | 0 (0.0%) | 0 (0.0%) |
| 5 or more Children | 0 (0.0%) | 0 (0.0%) |
| Total | 0 (0.0%) | 0 (0.0%) |
Income Below Poverty Among Married-Couple vs Single-Parent Households in Williston
| Children | Married-Couple Families | Single-Parent Households |
| No Children | 0 (0.0%) | 0 (0.0%) |
| 1 or 2 Children | 0 (0.0%) | 0 (0.0%) |
| 3 or 4 Children | 0 (0.0%) | 0 (0.0%) |
| 5 or more Children | 0 (0.0%) | 0 (0.0%) |
| Total | 0 (0.0%) | 0 (0.0%) |
Race in Williston
The most populous races in Williston are , and White / Caucasian (153 | 100.0%).
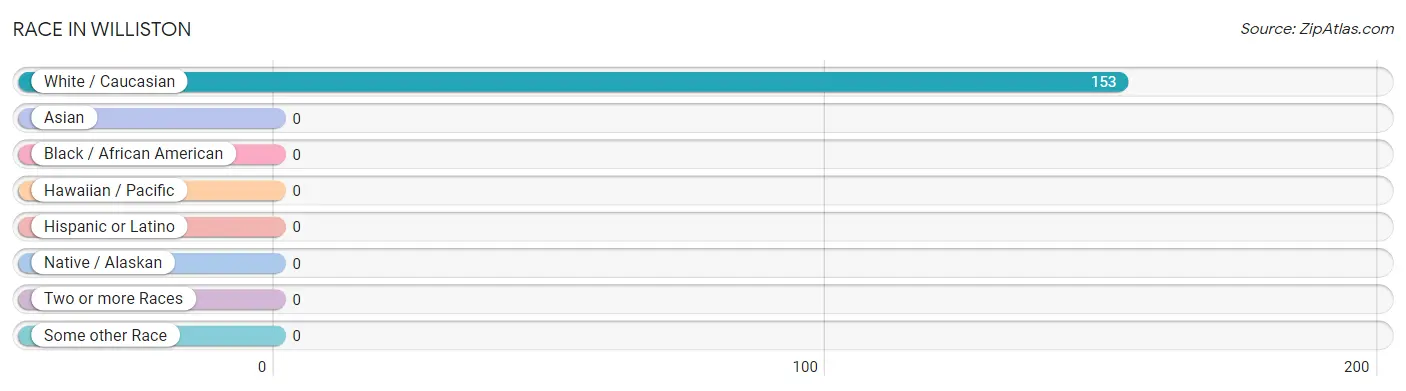
| Race | # Population | % Population |
| Asian | 0 | 0.0% |
| Black / African American | 0 | 0.0% |
| Hawaiian / Pacific | 0 | 0.0% |
| Hispanic or Latino | 0 | 0.0% |
| Native / Alaskan | 0 | 0.0% |
| White / Caucasian | 153 | 100.0% |
| Two or more Races | 0 | 0.0% |
| Some other Race | 0 | 0.0% |
| Total | 153 | 100.0% |
Ancestry in Williston
The most populous ancestries reported in Williston are American (55 | 35.9%), Dutch (12 | 7.8%), and German (12 | 7.8%), together accounting for 51.6% of all Williston residents.
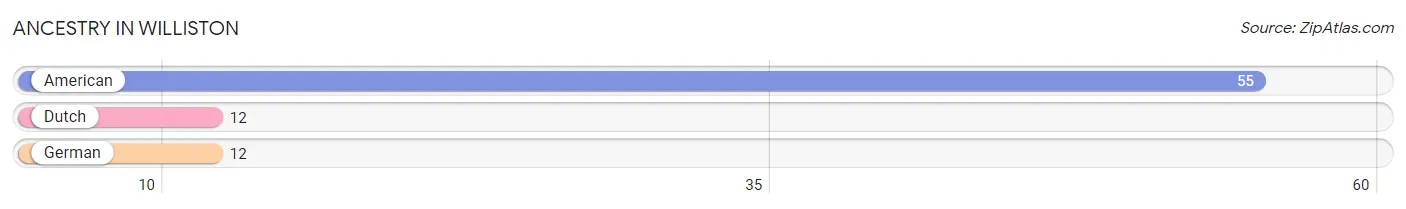
| Ancestry | # Population | % Population |
| American | 55 | 35.9% |
| Dutch | 12 | 7.8% |
| German | 12 | 7.8% | View All 3 Rows |
Immigrants in Williston

| Immigration Origin | # Population | % Population | View All 0 Rows |
Sex and Age in Williston
Sex and Age in Williston
The most populous age groups in Williston are 25 to 29 Years (72 | 54.5%) for men and 80 to 84 Years (11 | 52.4%) for women.
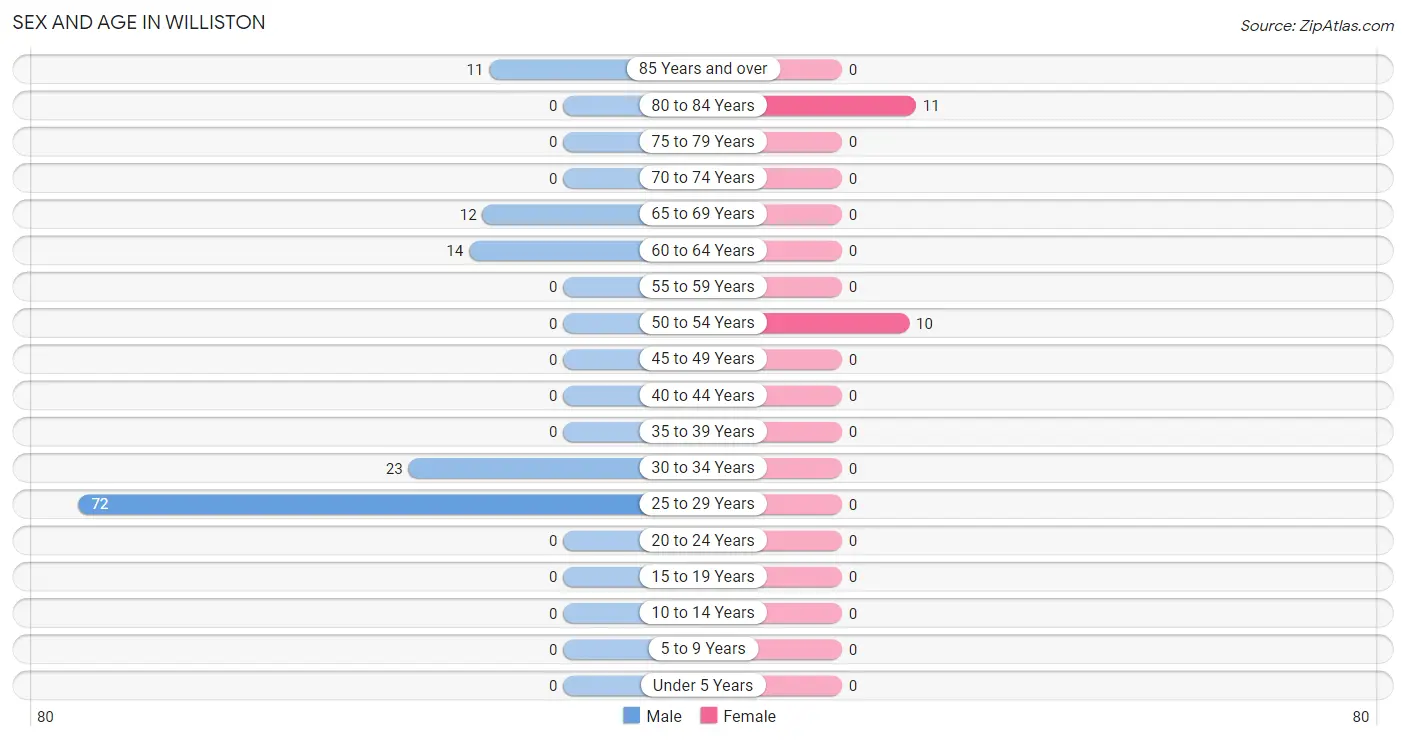
| Age Bracket | Male | Female |
| Under 5 Years | 0 (0.0%) | 0 (0.0%) |
| 5 to 9 Years | 0 (0.0%) | 0 (0.0%) |
| 10 to 14 Years | 0 (0.0%) | 0 (0.0%) |
| 15 to 19 Years | 0 (0.0%) | 0 (0.0%) |
| 20 to 24 Years | 0 (0.0%) | 0 (0.0%) |
| 25 to 29 Years | 72 (54.5%) | 0 (0.0%) |
| 30 to 34 Years | 23 (17.4%) | 0 (0.0%) |
| 35 to 39 Years | 0 (0.0%) | 0 (0.0%) |
| 40 to 44 Years | 0 (0.0%) | 0 (0.0%) |
| 45 to 49 Years | 0 (0.0%) | 0 (0.0%) |
| 50 to 54 Years | 0 (0.0%) | 10 (47.6%) |
| 55 to 59 Years | 0 (0.0%) | 0 (0.0%) |
| 60 to 64 Years | 14 (10.6%) | 0 (0.0%) |
| 65 to 69 Years | 12 (9.1%) | 0 (0.0%) |
| 70 to 74 Years | 0 (0.0%) | 0 (0.0%) |
| 75 to 79 Years | 0 (0.0%) | 0 (0.0%) |
| 80 to 84 Years | 0 (0.0%) | 11 (52.4%) |
| 85 Years and over | 11 (8.3%) | 0 (0.0%) |
| Total | 132 (100.0%) | 21 (100.0%) |
Families and Households in Williston
Median Family Size in Williston
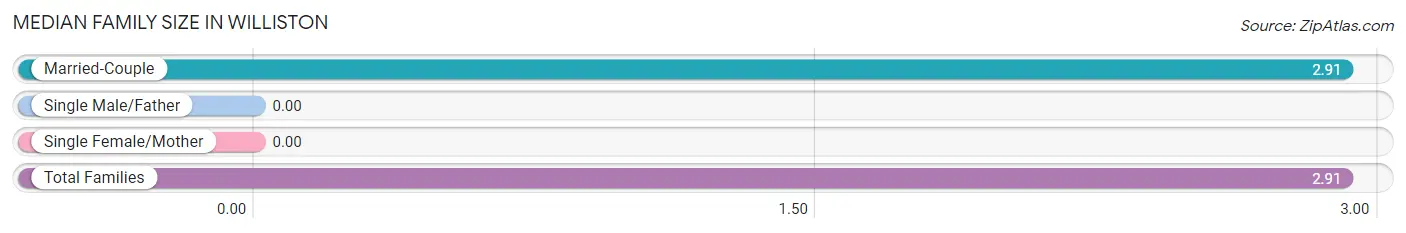
| Family Type | # Families | Family Size |
| Married-Couple | 23 (100.0%) | 2.91 |
| Single Male/Father | 0 (0.0%) | - |
| Single Female/Mother | 0 (0.0%) | - |
| Total Families | 23 (100.0%) | 2.91 |
Median Household Size in Williston
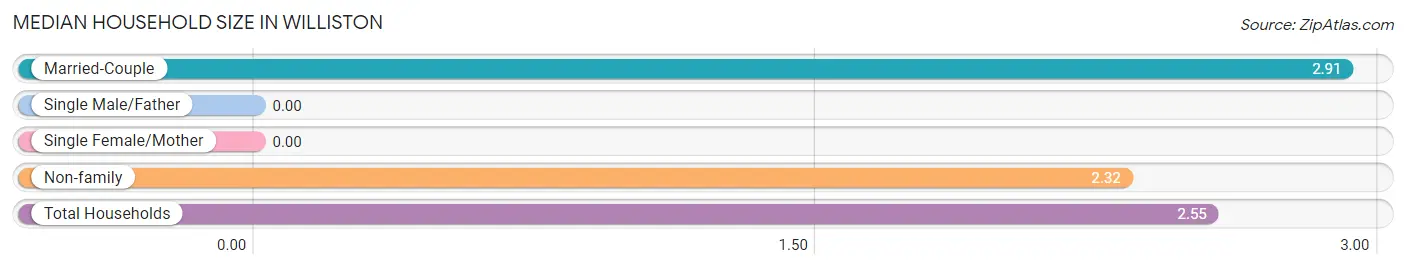
| Household Type | # Households | Household Size |
| Married-Couple | 23 (38.3%) | 2.91 |
| Single Male/Father | 0 (0.0%) | - |
| Single Female/Mother | 0 (0.0%) | - |
| Non-family | 37 (61.7%) | 2.32 |
| Total Households | 60 (100.0%) | 2.55 |
Household Size by Marriage Status in Williston
Out of a total of 60 households in Williston, 23 (38.3%) are family households, while 37 (61.7%) are nonfamily households. The most numerous type of family households are 3-person households, comprising 12, and the most common type of nonfamily households are 2-person households, comprising 23.
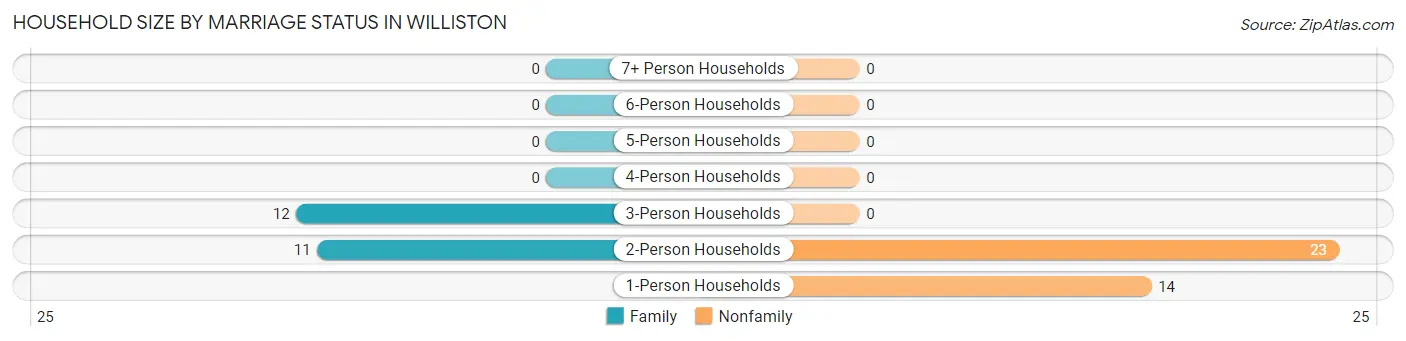
| Household Size | Family Households | Nonfamily Households |
| 1-Person Households | - | 14 (23.3%) |
| 2-Person Households | 11 (18.3%) | 23 (38.3%) |
| 3-Person Households | 12 (20.0%) | 0 (0.0%) |
| 4-Person Households | 0 (0.0%) | 0 (0.0%) |
| 5-Person Households | 0 (0.0%) | 0 (0.0%) |
| 6-Person Households | 0 (0.0%) | 0 (0.0%) |
| 7+ Person Households | 0 (0.0%) | 0 (0.0%) |
| Total | 23 (38.3%) | 37 (61.7%) |
Female Fertility in Williston
Fertility by Age in Williston
| Age Bracket | Women with Births | Births / 1,000 Women |
| 15 to 19 years | 0 (0.0%) | 0.0 |
| 20 to 34 years | 0 (0.0%) | 0.0 |
| 35 to 50 years | 0 (0.0%) | 0.0 |
| Total | 0 (0.0%) | 0.0 |
Fertility by Age by Marriage Status in Williston
| Age Bracket | Married | Unmarried |
| 15 to 19 years | 0 (0.0%) | 0 (0.0%) |
| 20 to 34 years | 0 (0.0%) | 0 (0.0%) |
| 35 to 50 years | 0 (0.0%) | 0 (0.0%) |
| Total | 0 (0.0%) | 0 (0.0%) |
Fertility by Education in Williston
| Educational Attainment | Women with Births | Births / 1,000 Women |
| Less than High School | 0 (0.0%) | 0.0 |
| High School Diploma | 0 (0.0%) | 0.0 |
| College or Associate's Degree | 0 (0.0%) | 0.0 |
| Bachelor's Degree | 0 (0.0%) | 0.0 |
| Graduate Degree | 0 (0.0%) | 0.0 |
| Total | 0 (0.0%) | 0.0 |
Fertility by Education by Marriage Status in Williston
| Educational Attainment | Married | Unmarried |
| Less than High School | 0 (0.0%) | 0 (0.0%) |
| High School Diploma | 0 (0.0%) | 0 (0.0%) |
| College or Associate's Degree | 0 (0.0%) | 0 (0.0%) |
| Bachelor's Degree | 0 (0.0%) | 0 (0.0%) |
| Graduate Degree | 0 (0.0%) | 0 (0.0%) |
| Total | 0 (0.0%) | 0 (0.0%) |
Employment Characteristics in Williston
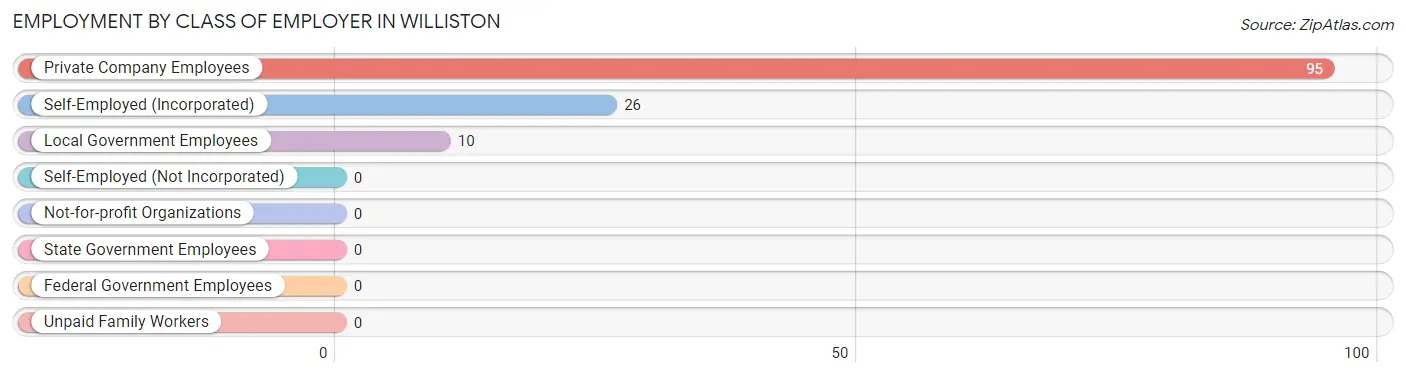
Employment by Class of Employer in Williston
Among the 131 employed individuals in Williston, private company employees (95 | 72.5%), self-employed (incorporated) (26 | 19.9%), and local government employees (10 | 7.6%) make up the most common classes of employment.
| Employer Class | # Employees | % Employees |
| Private Company Employees | 95 | 72.5% |
| Self-Employed (Incorporated) | 26 | 19.9% |
| Self-Employed (Not Incorporated) | 0 | 0.0% |
| Not-for-profit Organizations | 0 | 0.0% |
| Local Government Employees | 10 | 7.6% |
| State Government Employees | 0 | 0.0% |
| Federal Government Employees | 0 | 0.0% |
| Unpaid Family Workers | 0 | 0.0% |
| Total | 131 | 100.0% |
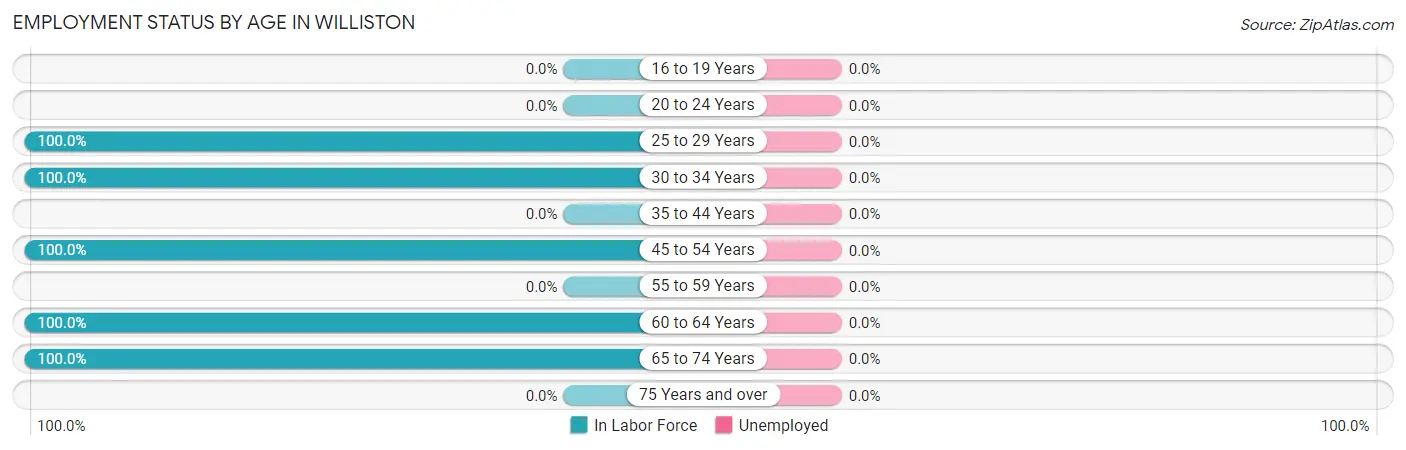
Employment Status by Age in Williston
| Age Bracket | In Labor Force | Unemployed |
| 16 to 19 Years | 0 (0.0%) | 0 (0.0%) |
| 20 to 24 Years | 0 (0.0%) | 0 (0.0%) |
| 25 to 29 Years | 72 (100.0%) | 0 (0.0%) |
| 30 to 34 Years | 23 (100.0%) | 0 (0.0%) |
| 35 to 44 Years | 0 (0.0%) | 0 (0.0%) |
| 45 to 54 Years | 10 (100.0%) | 0 (0.0%) |
| 55 to 59 Years | 0 (0.0%) | 0 (0.0%) |
| 60 to 64 Years | 14 (100.0%) | 0 (0.0%) |
| 65 to 74 Years | 12 (100.0%) | 0 (0.0%) |
| 75 Years and over | 0 (0.0%) | 0 (0.0%) |
| Total | 131 (85.6%) | 0 (0.0%) |
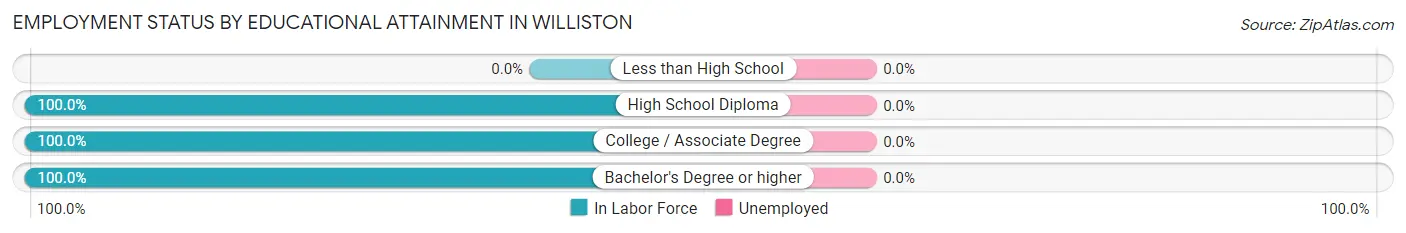
Employment Status by Educational Attainment in Williston
| Educational Attainment | In Labor Force | Unemployed |
| Less than High School | 0 (0.0%) | 0 (0.0%) |
| High School Diploma | 14 (100.0%) | 0 (0.0%) |
| College / Associate Degree | 46 (100.0%) | 0 (0.0%) |
| Bachelor's Degree or higher | 59 (100.0%) | 0 (0.0%) |
| Total | 119 (100.0%) | 0 (0.0%) |
Employment Occupations by Sex in Williston
Management, Business, Science and Arts Occupations
The most common Management, Business, Science and Arts occupations in Williston are , and Management (22 | 16.8%).
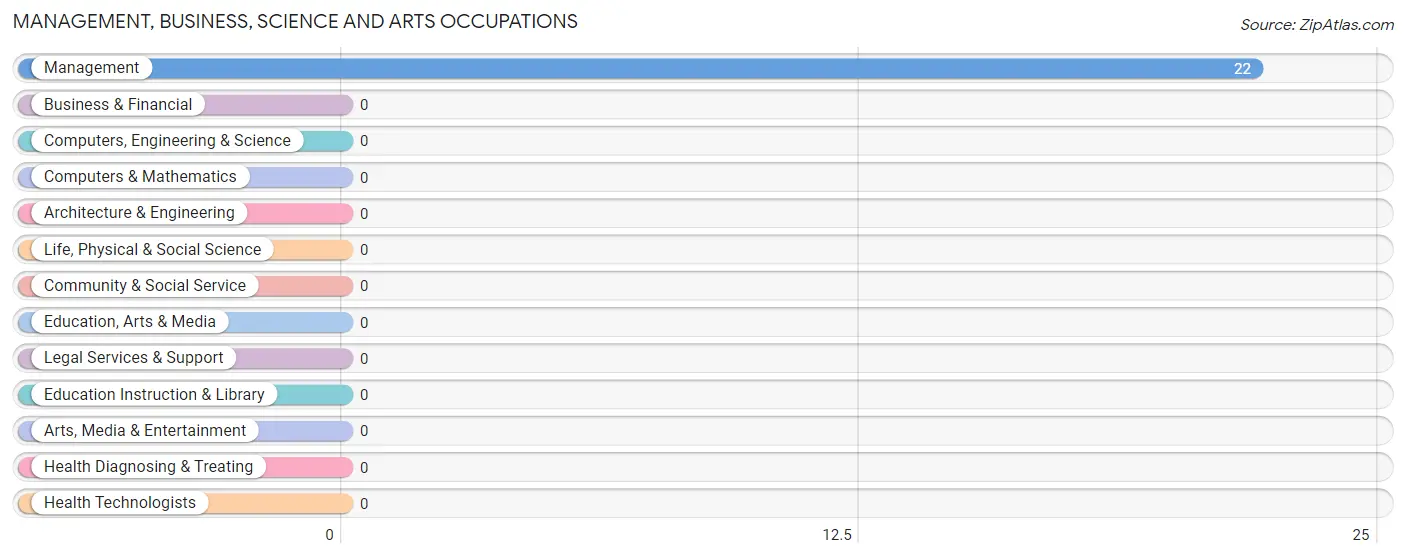
Management, Business, Science and Arts Occupations by Sex
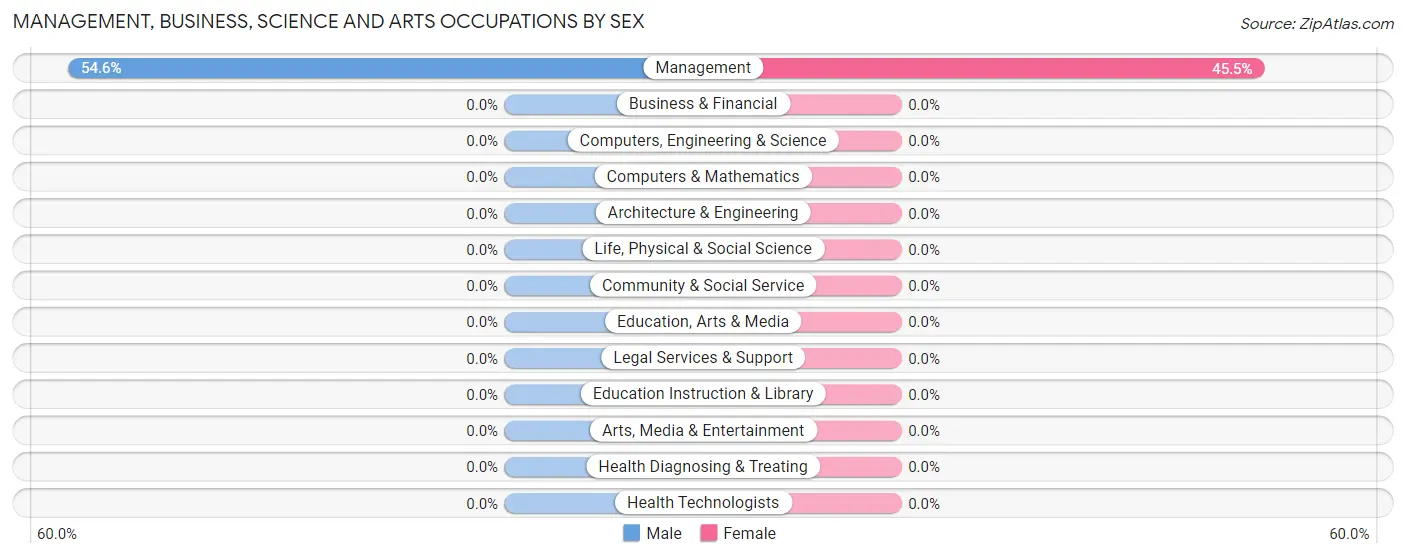
| Occupation | Male | Female |
| Management | 12 (54.5%) | 10 (45.5%) |
| Business & Financial | 0 (0.0%) | 0 (0.0%) |
| Computers, Engineering & Science | 0 (0.0%) | 0 (0.0%) |
| Computers & Mathematics | 0 (0.0%) | 0 (0.0%) |
| Architecture & Engineering | 0 (0.0%) | 0 (0.0%) |
| Life, Physical & Social Science | 0 (0.0%) | 0 (0.0%) |
| Community & Social Service | 0 (0.0%) | 0 (0.0%) |
| Education, Arts & Media | 0 (0.0%) | 0 (0.0%) |
| Legal Services & Support | 0 (0.0%) | 0 (0.0%) |
| Education Instruction & Library | 0 (0.0%) | 0 (0.0%) |
| Arts, Media & Entertainment | 0 (0.0%) | 0 (0.0%) |
| Health Diagnosing & Treating | 0 (0.0%) | 0 (0.0%) |
| Health Technologists | 0 (0.0%) | 0 (0.0%) |
| Total (Category) | 12 (54.5%) | 10 (45.5%) |
| Total (Overall) | 121 (92.4%) | 10 (7.6%) |
Services Occupations
Services Occupations by Sex
| Occupation | Male | Female |
| Healthcare Support | 0 (0.0%) | 0 (0.0%) |
| Security & Protection | 0 (0.0%) | 0 (0.0%) |
| Firefighting & Prevention | 0 (0.0%) | 0 (0.0%) |
| Law Enforcement | 0 (0.0%) | 0 (0.0%) |
| Food Preparation & Serving | 0 (0.0%) | 0 (0.0%) |
| Cleaning & Maintenance | 0 (0.0%) | 0 (0.0%) |
| Personal Care & Service | 0 (0.0%) | 0 (0.0%) |
| Total (Category) | 0 (0.0%) | 0 (0.0%) |
| Total (Overall) | 121 (92.4%) | 10 (7.6%) |
Sales and Office Occupations
The most common Sales and Office occupations in Williston are , and Sales & Related (72 | 55.0%).
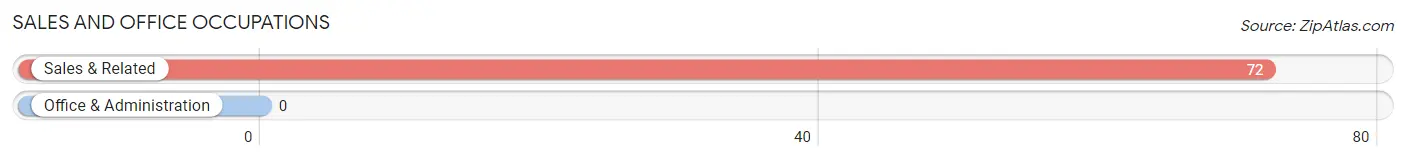
Sales and Office Occupations by Sex

| Occupation | Male | Female |
| Sales & Related | 72 (100.0%) | 0 (0.0%) |
| Office & Administration | 0 (0.0%) | 0 (0.0%) |
| Total (Category) | 72 (100.0%) | 0 (0.0%) |
| Total (Overall) | 121 (92.4%) | 10 (7.6%) |
Natural Resources, Construction and Maintenance Occupations
The most common Natural Resources, Construction and Maintenance occupations in Williston are , and Construction & Extraction (37 | 28.2%).
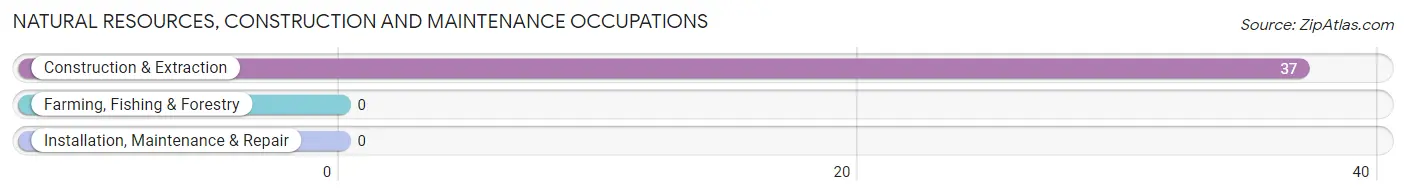
Natural Resources, Construction and Maintenance Occupations by Sex
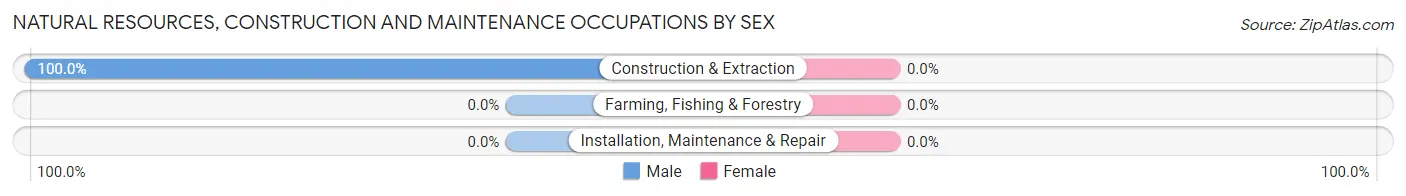
| Occupation | Male | Female |
| Farming, Fishing & Forestry | 0 (0.0%) | 0 (0.0%) |
| Construction & Extraction | 37 (100.0%) | 0 (0.0%) |
| Installation, Maintenance & Repair | 0 (0.0%) | 0 (0.0%) |
| Total (Category) | 37 (100.0%) | 0 (0.0%) |
| Total (Overall) | 121 (92.4%) | 10 (7.6%) |
Production, Transportation and Moving Occupations
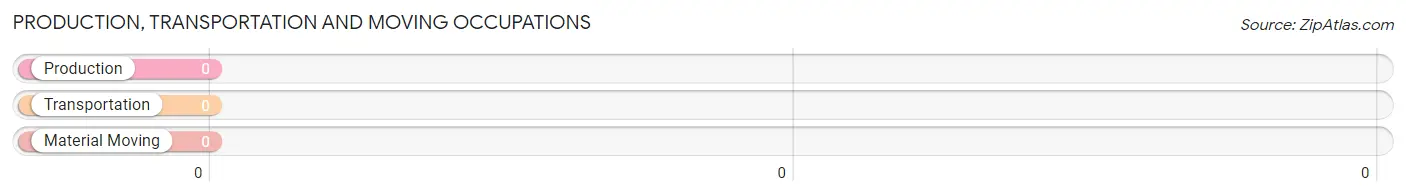
Production, Transportation and Moving Occupations by Sex
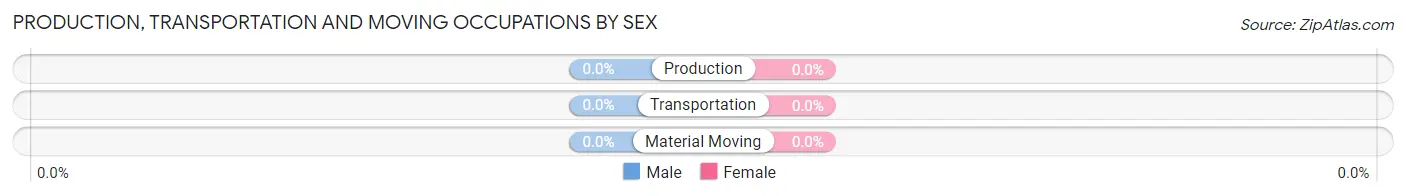
| Occupation | Male | Female |
| Production | 0 (0.0%) | 0 (0.0%) |
| Transportation | 0 (0.0%) | 0 (0.0%) |
| Material Moving | 0 (0.0%) | 0 (0.0%) |
| Total (Category) | 0 (0.0%) | 0 (0.0%) |
| Total (Overall) | 121 (92.4%) | 10 (7.6%) |
Employment Industries by Sex in Williston
Employment Industries in Williston
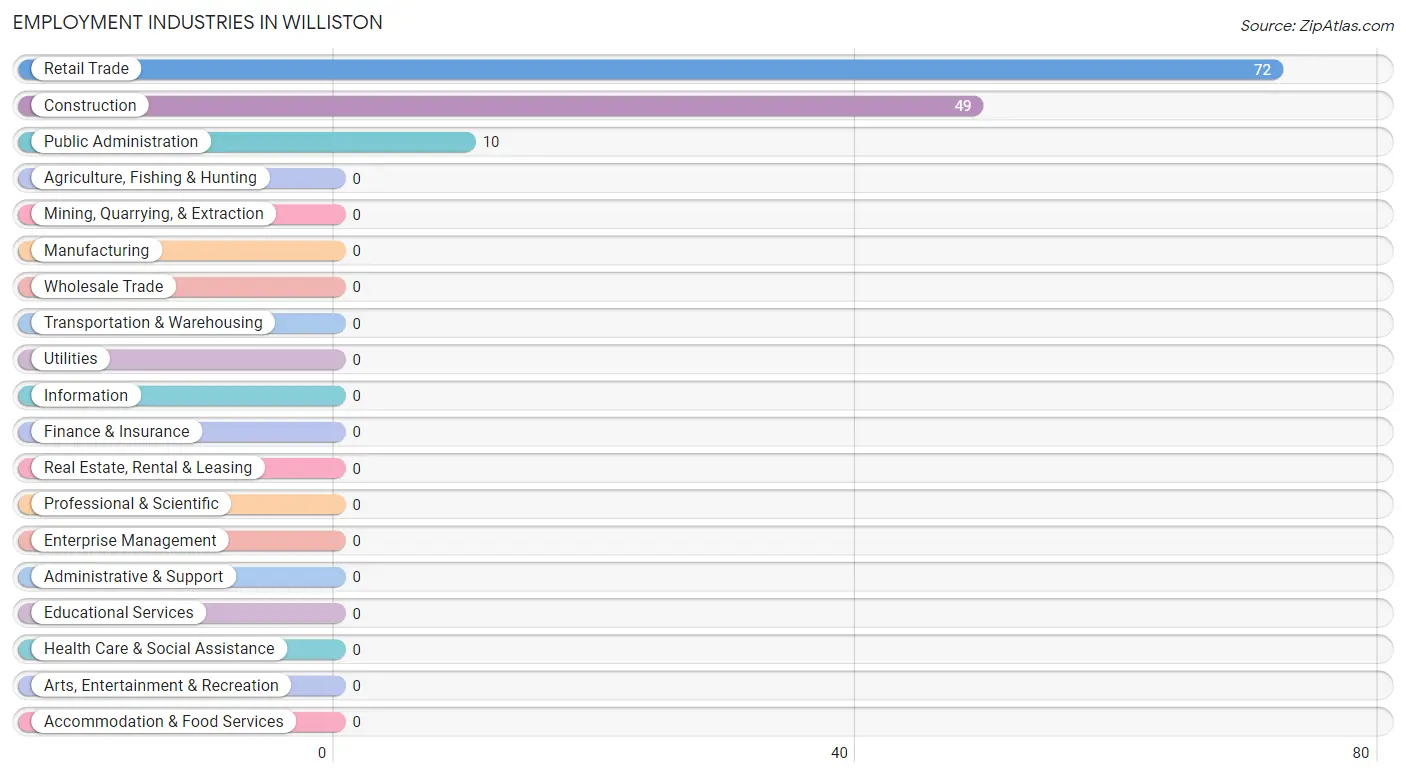
The major employment industries in Williston include Retail Trade (72 | 55.0%), Construction (49 | 37.4%), and Public Administration (10 | 7.6%).
Employment Industries by Sex in Williston
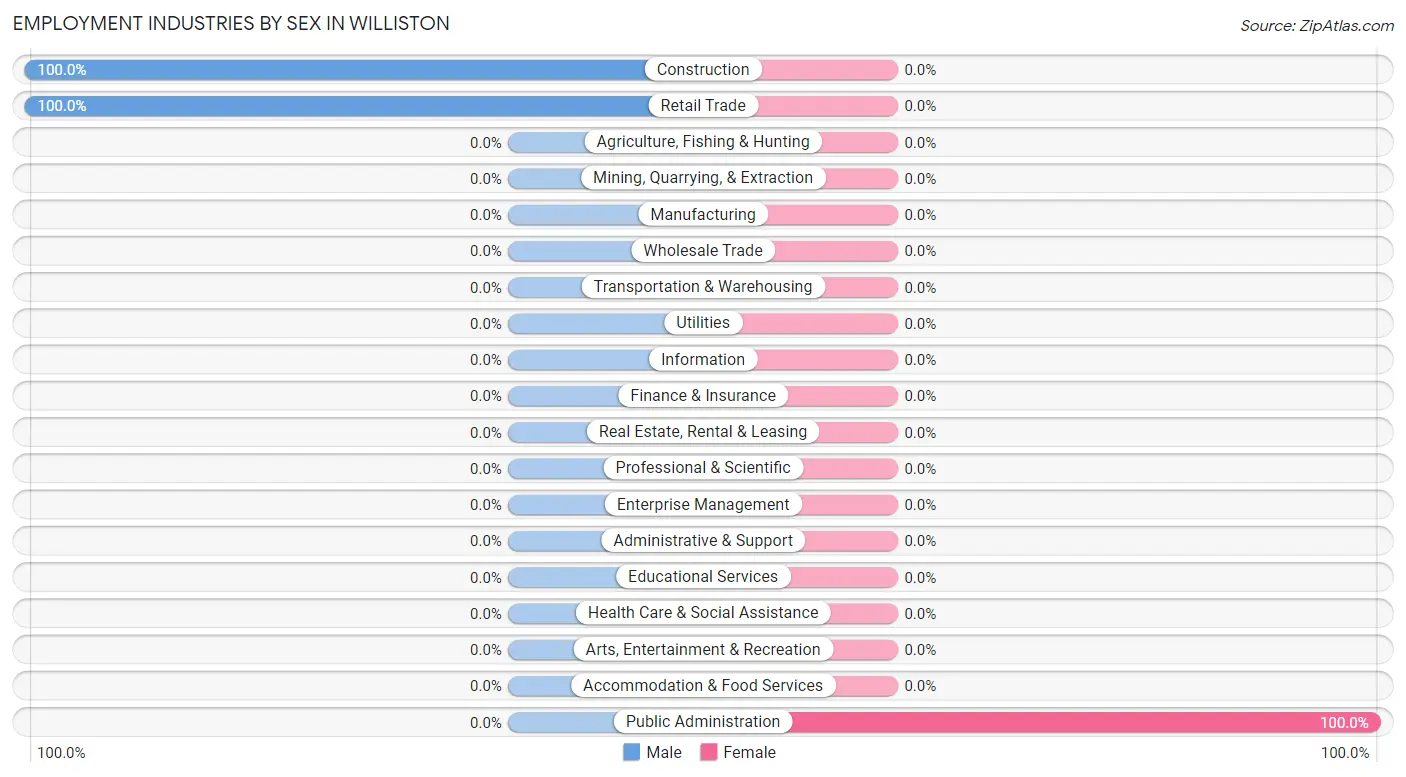
| Industry | Male | Female |
| Agriculture, Fishing & Hunting | 0 (0.0%) | 0 (0.0%) |
| Mining, Quarrying, & Extraction | 0 (0.0%) | 0 (0.0%) |
| Construction | 49 (100.0%) | 0 (0.0%) |
| Manufacturing | 0 (0.0%) | 0 (0.0%) |
| Wholesale Trade | 0 (0.0%) | 0 (0.0%) |
| Retail Trade | 72 (100.0%) | 0 (0.0%) |
| Transportation & Warehousing | 0 (0.0%) | 0 (0.0%) |
| Utilities | 0 (0.0%) | 0 (0.0%) |
| Information | 0 (0.0%) | 0 (0.0%) |
| Finance & Insurance | 0 (0.0%) | 0 (0.0%) |
| Real Estate, Rental & Leasing | 0 (0.0%) | 0 (0.0%) |
| Professional & Scientific | 0 (0.0%) | 0 (0.0%) |
| Enterprise Management | 0 (0.0%) | 0 (0.0%) |
| Administrative & Support | 0 (0.0%) | 0 (0.0%) |
| Educational Services | 0 (0.0%) | 0 (0.0%) |
| Health Care & Social Assistance | 0 (0.0%) | 0 (0.0%) |
| Arts, Entertainment & Recreation | 0 (0.0%) | 0 (0.0%) |
| Accommodation & Food Services | 0 (0.0%) | 0 (0.0%) |
| Public Administration | 0 (0.0%) | 10 (100.0%) |
| Total | 121 (92.4%) | 10 (7.6%) |
Education in Williston
School Enrollment in Williston
| School Level | # Students | % Students |
| Nursery / Preschool | 0 | 0.0% |
| Kindergarten | 0 | 0.0% |
| Elementary School | 0 | 0.0% |
| Middle School | 0 | 0.0% |
| High School | 0 | 0.0% |
| College / Undergraduate | 0 | 0.0% |
| Graduate / Professional | 0 | 0.0% |
| Total | 0 | 0.0% |
School Enrollment by Age by Funding Source in Williston
| Age Bracket | Public School | Private School |
| 3 to 4 Year Olds | 0 (0.0%) | 0 (0.0%) |
| 5 to 9 Year Old | 0 (0.0%) | 0 (0.0%) |
| 10 to 14 Year Olds | 0 (0.0%) | 0 (0.0%) |
| 15 to 17 Year Olds | 0 (0.0%) | 0 (0.0%) |
| 18 to 19 Year Olds | 0 (0.0%) | 0 (0.0%) |
| 20 to 24 Year Olds | 0 (0.0%) | 0 (0.0%) |
| 25 to 34 Year Olds | 0 (0.0%) | 0 (0.0%) |
| 35 Years and over | 0 (0.0%) | 0 (0.0%) |
| Total | 0 (0.0%) | 0 (0.0%) |
Educational Attainment by Field of Study in Williston
Business (49 | 60.5%), social sciences (12 | 14.8%), literature & languages (10 | 12.3%), and communications (10 | 12.3%) are the most common fields of study among 81 individuals in Williston who have obtained a bachelor's degree or higher.
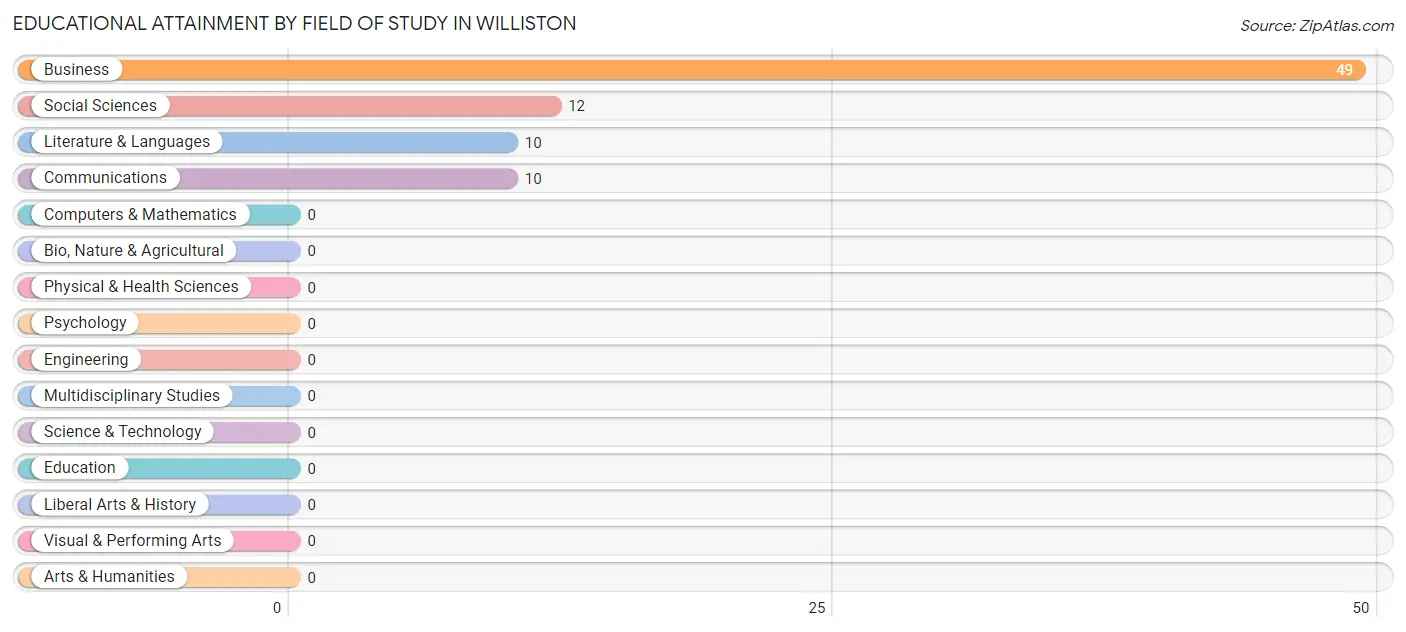
| Field of Study | # Graduates | % Graduates |
| Computers & Mathematics | 0 | 0.0% |
| Bio, Nature & Agricultural | 0 | 0.0% |
| Physical & Health Sciences | 0 | 0.0% |
| Psychology | 0 | 0.0% |
| Social Sciences | 12 | 14.8% |
| Engineering | 0 | 0.0% |
| Multidisciplinary Studies | 0 | 0.0% |
| Science & Technology | 0 | 0.0% |
| Business | 49 | 60.5% |
| Education | 0 | 0.0% |
| Literature & Languages | 10 | 12.3% |
| Liberal Arts & History | 0 | 0.0% |
| Visual & Performing Arts | 0 | 0.0% |
| Communications | 10 | 12.3% |
| Arts & Humanities | 0 | 0.0% |
| Total | 81 | 100.0% |
Transportation & Commute in Williston
Vehicle Availability by Sex in Williston
The most prevalent vehicle ownership categories in Williston are males with 2 vehicles (72, accounting for 59.5%) and females with 2 vehicles (0, making up 720.0%).
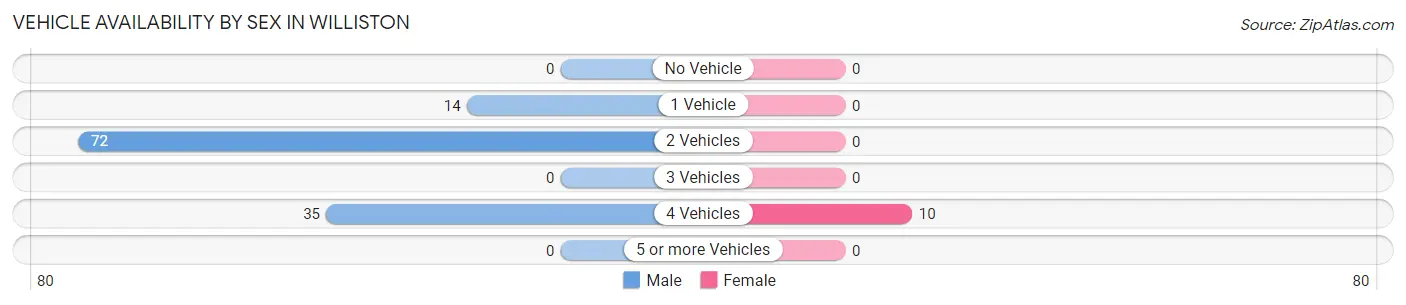
| Vehicles Available | Male | Female |
| No Vehicle | 0 (0.0%) | 0 (0.0%) |
| 1 Vehicle | 14 (11.6%) | 0 (0.0%) |
| 2 Vehicles | 72 (59.5%) | 0 (0.0%) |
| 3 Vehicles | 0 (0.0%) | 0 (0.0%) |
| 4 Vehicles | 35 (28.9%) | 10 (100.0%) |
| 5 or more Vehicles | 0 (0.0%) | 0 (0.0%) |
| Total | 121 (100.0%) | 10 (100.0%) |
Commute Time in Williston
The most frequently occuring commute durations in Williston are 10 to 14 minutes (60 commuters, 45.8%), 35 to 39 minutes (49 commuters, 37.4%), and 15 to 19 minutes (12 commuters, 9.2%).
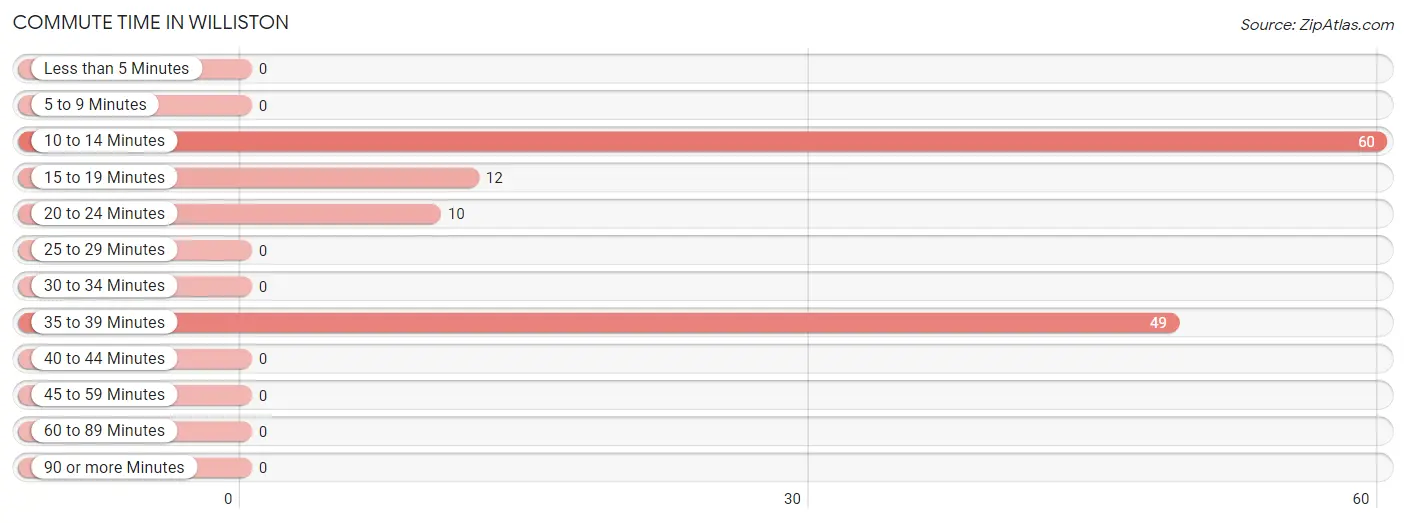
| Commute Time | # Commuters | % Commuters |
| Less than 5 Minutes | 0 | 0.0% |
| 5 to 9 Minutes | 0 | 0.0% |
| 10 to 14 Minutes | 60 | 45.8% |
| 15 to 19 Minutes | 12 | 9.2% |
| 20 to 24 Minutes | 10 | 7.6% |
| 25 to 29 Minutes | 0 | 0.0% |
| 30 to 34 Minutes | 0 | 0.0% |
| 35 to 39 Minutes | 49 | 37.4% |
| 40 to 44 Minutes | 0 | 0.0% |
| 45 to 59 Minutes | 0 | 0.0% |
| 60 to 89 Minutes | 0 | 0.0% |
| 90 or more Minutes | 0 | 0.0% |
Commute Time by Sex in Williston
The most common commute times in Williston are 10 to 14 minutes (60 commuters, 49.6%) for males and 20 to 24 minutes (10 commuters, 100.0%) for females.
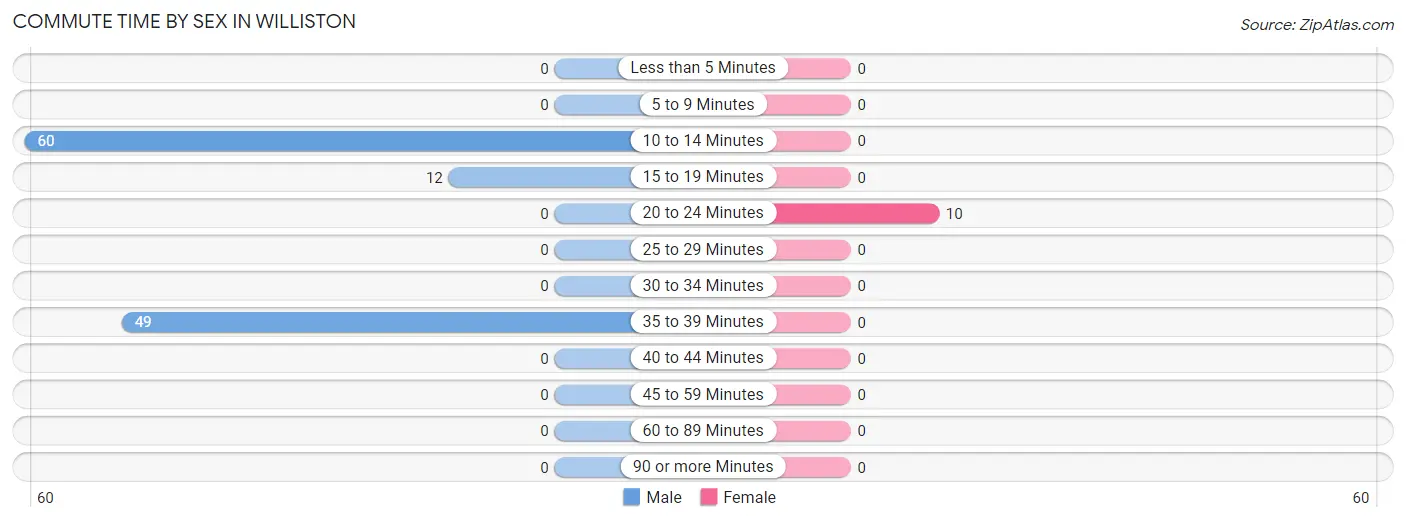
| Commute Time | Male | Female |
| Less than 5 Minutes | 0 (0.0%) | 0 (0.0%) |
| 5 to 9 Minutes | 0 (0.0%) | 0 (0.0%) |
| 10 to 14 Minutes | 60 (49.6%) | 0 (0.0%) |
| 15 to 19 Minutes | 12 (9.9%) | 0 (0.0%) |
| 20 to 24 Minutes | 0 (0.0%) | 10 (100.0%) |
| 25 to 29 Minutes | 0 (0.0%) | 0 (0.0%) |
| 30 to 34 Minutes | 0 (0.0%) | 0 (0.0%) |
| 35 to 39 Minutes | 49 (40.5%) | 0 (0.0%) |
| 40 to 44 Minutes | 0 (0.0%) | 0 (0.0%) |
| 45 to 59 Minutes | 0 (0.0%) | 0 (0.0%) |
| 60 to 89 Minutes | 0 (0.0%) | 0 (0.0%) |
| 90 or more Minutes | 0 (0.0%) | 0 (0.0%) |
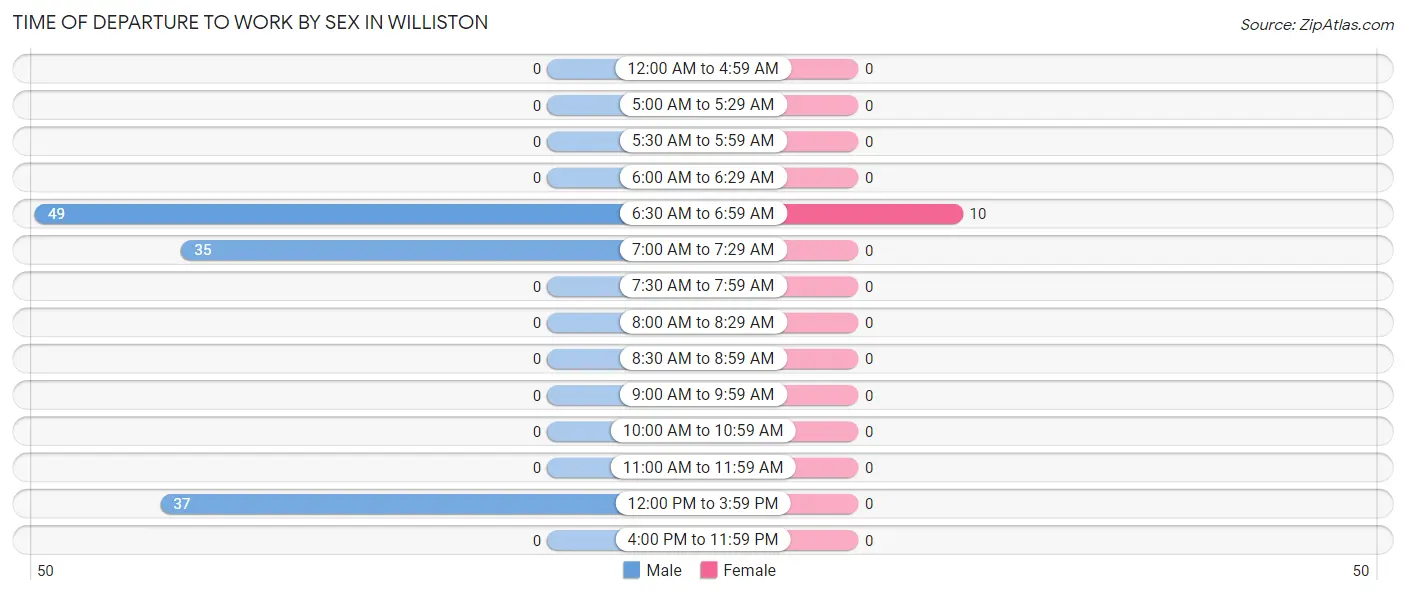
Time of Departure to Work by Sex in Williston
The most frequent times of departure to work in Williston are 6:30 AM to 6:59 AM (49, 40.5%) for males and 6:30 AM to 6:59 AM (10, 100.0%) for females.
| Time of Departure | Male | Female |
| 12:00 AM to 4:59 AM | 0 (0.0%) | 0 (0.0%) |
| 5:00 AM to 5:29 AM | 0 (0.0%) | 0 (0.0%) |
| 5:30 AM to 5:59 AM | 0 (0.0%) | 0 (0.0%) |
| 6:00 AM to 6:29 AM | 0 (0.0%) | 0 (0.0%) |
| 6:30 AM to 6:59 AM | 49 (40.5%) | 10 (100.0%) |
| 7:00 AM to 7:29 AM | 35 (28.9%) | 0 (0.0%) |
| 7:30 AM to 7:59 AM | 0 (0.0%) | 0 (0.0%) |
| 8:00 AM to 8:29 AM | 0 (0.0%) | 0 (0.0%) |
| 8:30 AM to 8:59 AM | 0 (0.0%) | 0 (0.0%) |
| 9:00 AM to 9:59 AM | 0 (0.0%) | 0 (0.0%) |
| 10:00 AM to 10:59 AM | 0 (0.0%) | 0 (0.0%) |
| 11:00 AM to 11:59 AM | 0 (0.0%) | 0 (0.0%) |
| 12:00 PM to 3:59 PM | 37 (30.6%) | 0 (0.0%) |
| 4:00 PM to 11:59 PM | 0 (0.0%) | 0 (0.0%) |
| Total | 121 (100.0%) | 10 (100.0%) |
Housing Occupancy in Williston
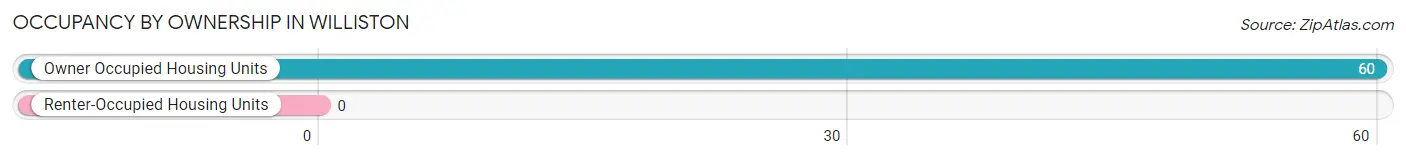
Occupancy by Ownership in Williston
Of the total 60 dwellings in Williston, owner-occupied units account for 60 (100.0%), while renter-occupied units make up 0 (0.0%).
| Occupancy | # Housing Units | % Housing Units |
| Owner Occupied Housing Units | 60 | 100.0% |
| Renter-Occupied Housing Units | 0 | 0.0% |
| Total Occupied Housing Units | 60 | 100.0% |
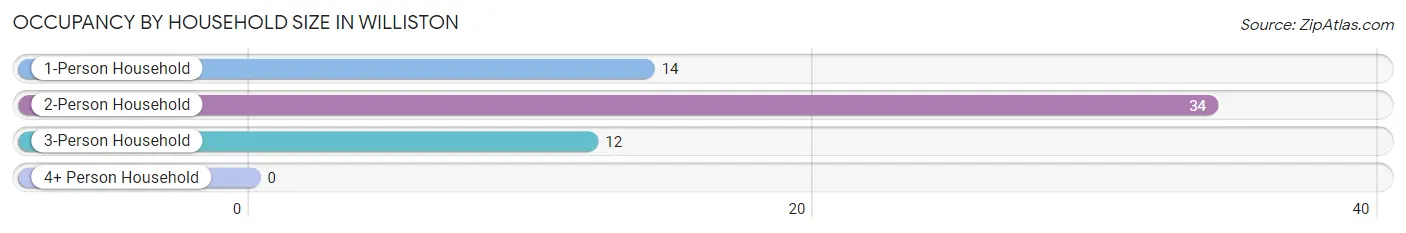
Occupancy by Household Size in Williston
| Household Size | # Housing Units | % Housing Units |
| 1-Person Household | 14 | 23.3% |
| 2-Person Household | 34 | 56.7% |
| 3-Person Household | 12 | 20.0% |
| 4+ Person Household | 0 | 0.0% |
| Total Housing Units | 60 | 100.0% |
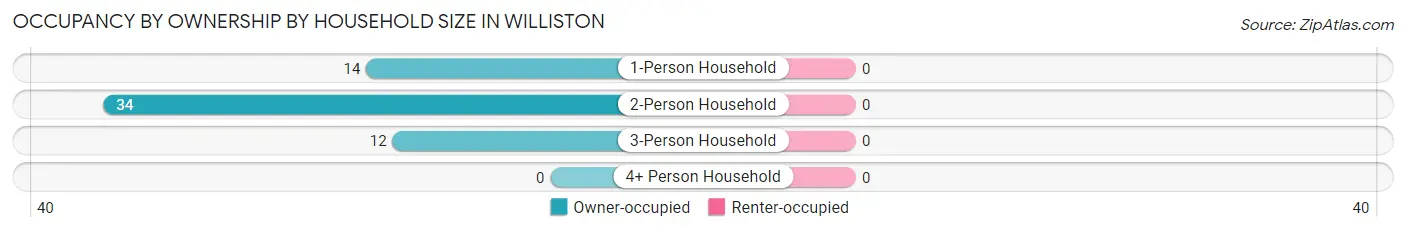
Occupancy by Ownership by Household Size in Williston
| Household Size | Owner-occupied | Renter-occupied |
| 1-Person Household | 14 (100.0%) | 0 (0.0%) |
| 2-Person Household | 34 (100.0%) | 0 (0.0%) |
| 3-Person Household | 12 (100.0%) | 0 (0.0%) |
| 4+ Person Household | 0 (0.0%) | 0 (0.0%) |
| Total Housing Units | 60 (100.0%) | 0 (0.0%) |
Occupancy by Educational Attainment in Williston
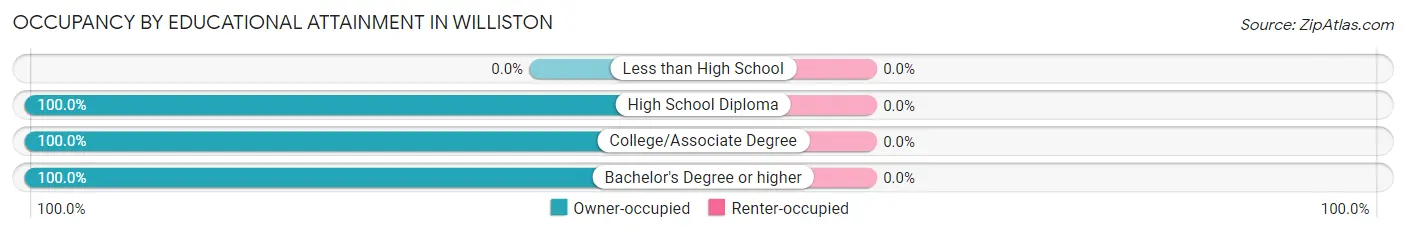
| Household Size | Owner-occupied | Renter-occupied |
| Less than High School | 0 (0.0%) | 0 (0.0%) |
| High School Diploma | 25 (100.0%) | 0 (0.0%) |
| College/Associate Degree | 23 (100.0%) | 0 (0.0%) |
| Bachelor's Degree or higher | 12 (100.0%) | 0 (0.0%) |
Occupancy by Age of Householder in Williston
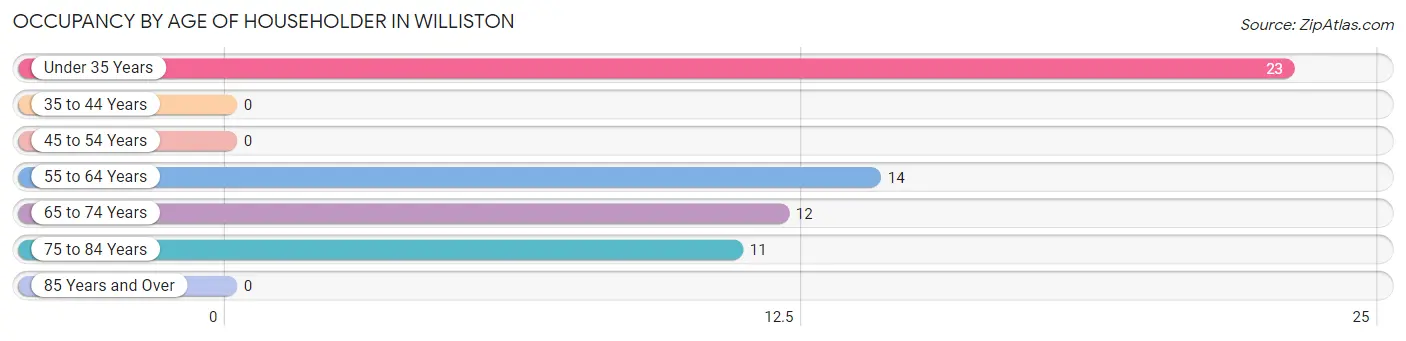
| Age Bracket | # Households | % Households |
| Under 35 Years | 23 | 38.3% |
| 35 to 44 Years | 0 | 0.0% |
| 45 to 54 Years | 0 | 0.0% |
| 55 to 64 Years | 14 | 23.3% |
| 65 to 74 Years | 12 | 20.0% |
| 75 to 84 Years | 11 | 18.3% |
| 85 Years and Over | 0 | 0.0% |
| Total | 60 | 100.0% |
Housing Finances in Williston
Median Income by Occupancy in Williston
| Occupancy Type | # Households | Median Income |
| Owner-Occupied | 60 (100.0%) | $0 |
| Renter-Occupied | 0 (0.0%) | $0 |
| Average | 60 (100.0%) | $0 |
Occupancy by Householder Income Bracket in Williston
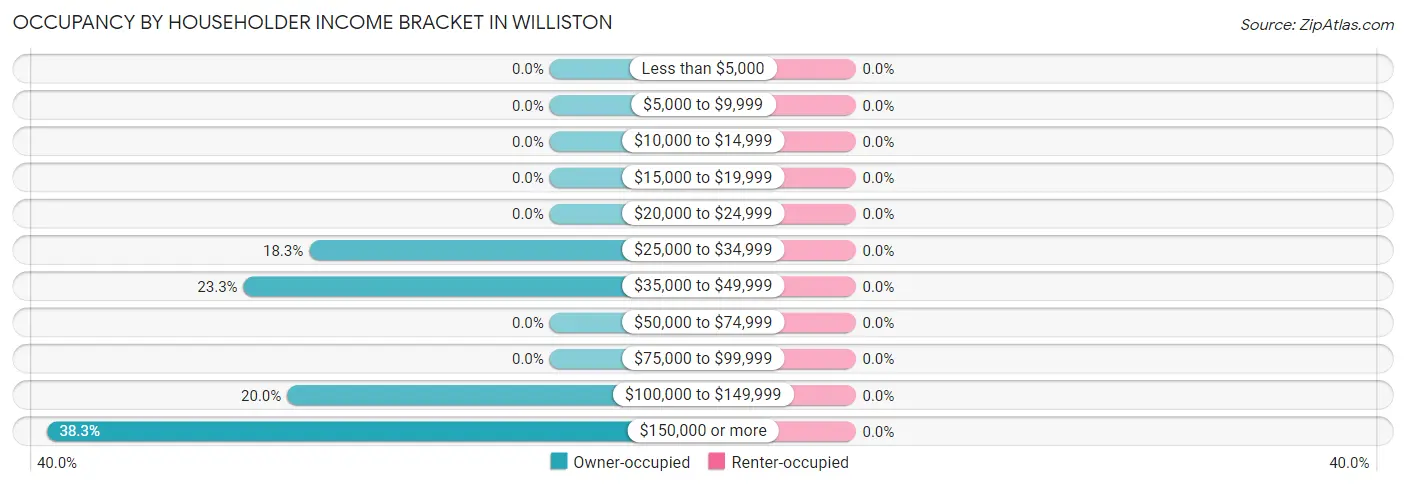
| Income Bracket | Owner-occupied | Renter-occupied |
| Less than $5,000 | 0 (0.0%) | 0 (0.0%) |
| $5,000 to $9,999 | 0 (0.0%) | 0 (0.0%) |
| $10,000 to $14,999 | 0 (0.0%) | 0 (0.0%) |
| $15,000 to $19,999 | 0 (0.0%) | 0 (0.0%) |
| $20,000 to $24,999 | 0 (0.0%) | 0 (0.0%) |
| $25,000 to $34,999 | 11 (18.3%) | 0 (0.0%) |
| $35,000 to $49,999 | 14 (23.3%) | 0 (0.0%) |
| $50,000 to $74,999 | 0 (0.0%) | 0 (0.0%) |
| $75,000 to $99,999 | 0 (0.0%) | 0 (0.0%) |
| $100,000 to $149,999 | 12 (20.0%) | 0 (0.0%) |
| $150,000 or more | 23 (38.3%) | 0 (0.0%) |
| Total | 60 (100.0%) | 0 (0.0%) |
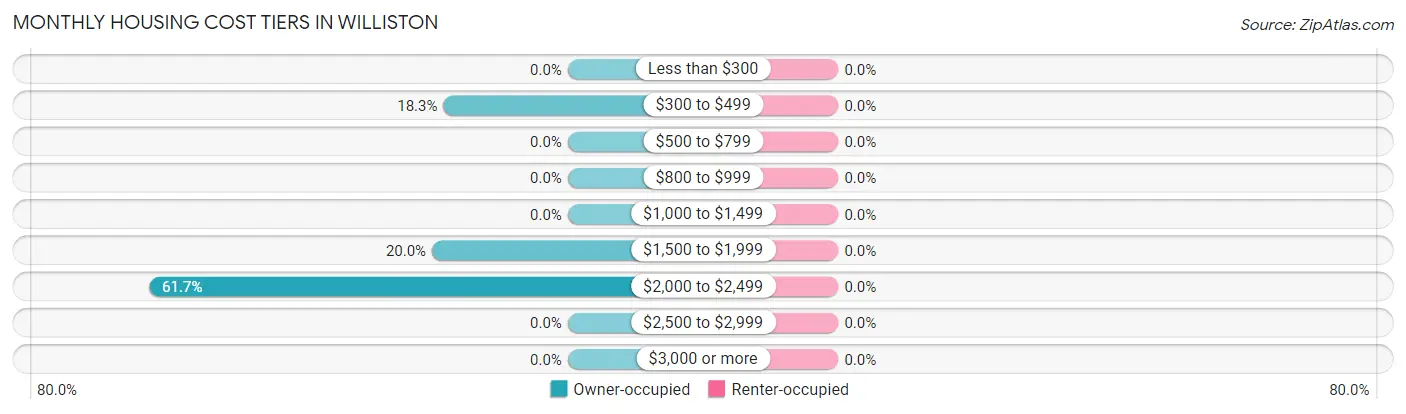
Monthly Housing Cost Tiers in Williston
| Monthly Cost | Owner-occupied | Renter-occupied |
| Less than $300 | 0 (0.0%) | 0 (0.0%) |
| $300 to $499 | 11 (18.3%) | 0 (0.0%) |
| $500 to $799 | 0 (0.0%) | 0 (0.0%) |
| $800 to $999 | 0 (0.0%) | 0 (0.0%) |
| $1,000 to $1,499 | 0 (0.0%) | 0 (0.0%) |
| $1,500 to $1,999 | 12 (20.0%) | 0 (0.0%) |
| $2,000 to $2,499 | 37 (61.7%) | 0 (0.0%) |
| $2,500 to $2,999 | 0 (0.0%) | 0 (0.0%) |
| $3,000 or more | 0 (0.0%) | 0 (0.0%) |
| Total | 60 (100.0%) | 0 (0.0%) |
Physical Housing Characteristics in Williston
Housing Structures in Williston
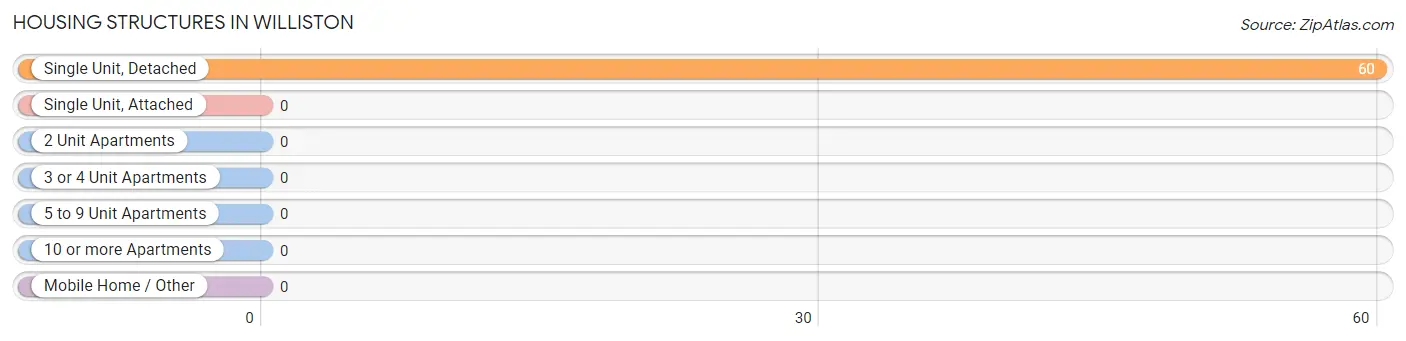
| Structure Type | # Housing Units | % Housing Units |
| Single Unit, Detached | 60 | 100.0% |
| Single Unit, Attached | 0 | 0.0% |
| 2 Unit Apartments | 0 | 0.0% |
| 3 or 4 Unit Apartments | 0 | 0.0% |
| 5 to 9 Unit Apartments | 0 | 0.0% |
| 10 or more Apartments | 0 | 0.0% |
| Mobile Home / Other | 0 | 0.0% |
| Total | 60 | 100.0% |
Housing Structures by Occupancy in Williston
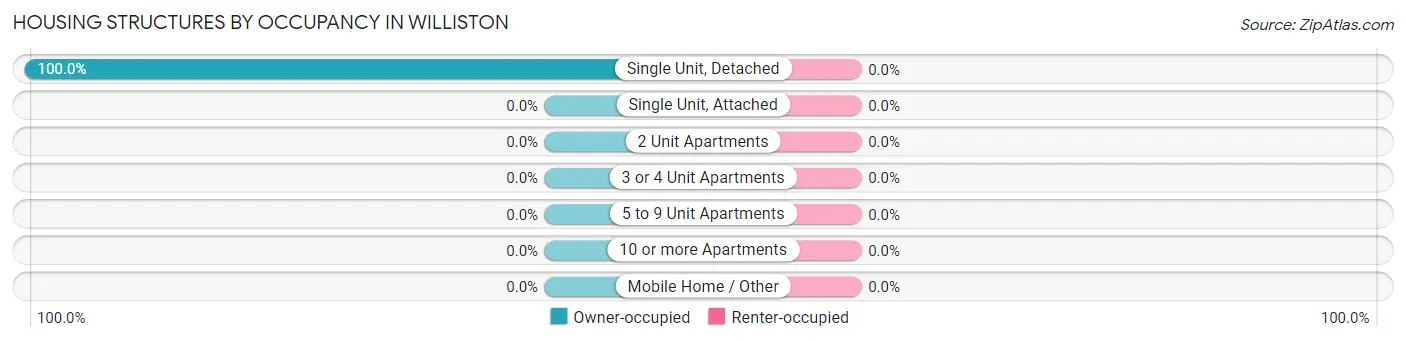
| Structure Type | Owner-occupied | Renter-occupied |
| Single Unit, Detached | 60 (100.0%) | 0 (0.0%) |
| Single Unit, Attached | 0 (0.0%) | 0 (0.0%) |
| 2 Unit Apartments | 0 (0.0%) | 0 (0.0%) |
| 3 or 4 Unit Apartments | 0 (0.0%) | 0 (0.0%) |
| 5 to 9 Unit Apartments | 0 (0.0%) | 0 (0.0%) |
| 10 or more Apartments | 0 (0.0%) | 0 (0.0%) |
| Mobile Home / Other | 0 (0.0%) | 0 (0.0%) |
| Total | 60 (100.0%) | 0 (0.0%) |
Housing Structures by Number of Rooms in Williston
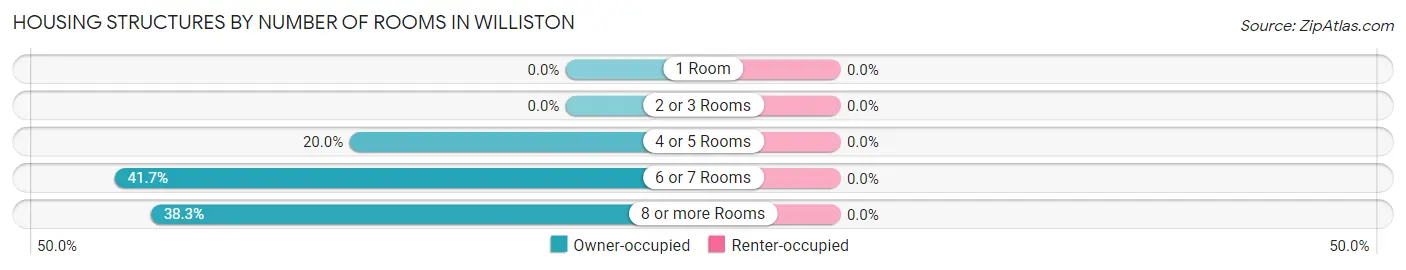
| Number of Rooms | Owner-occupied | Renter-occupied |
| 1 Room | 0 (0.0%) | 0 (0.0%) |
| 2 or 3 Rooms | 0 (0.0%) | 0 (0.0%) |
| 4 or 5 Rooms | 12 (20.0%) | 0 (0.0%) |
| 6 or 7 Rooms | 25 (41.7%) | 0 (0.0%) |
| 8 or more Rooms | 23 (38.3%) | 0 (0.0%) |
| Total | 60 (100.0%) | 0 (0.0%) |
Housing Structure by Heating Type in Williston
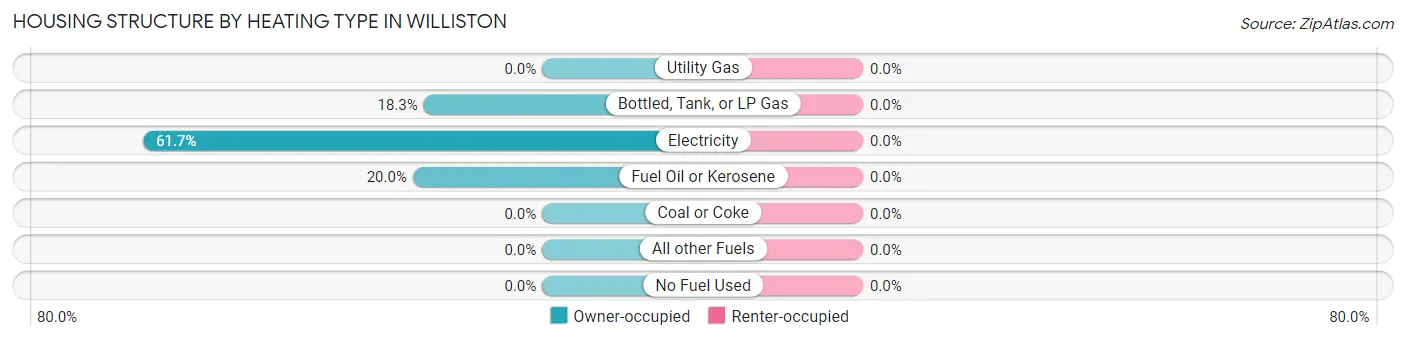
| Heating Type | Owner-occupied | Renter-occupied |
| Utility Gas | 0 (0.0%) | 0 (0.0%) |
| Bottled, Tank, or LP Gas | 11 (18.3%) | 0 (0.0%) |
| Electricity | 37 (61.7%) | 0 (0.0%) |
| Fuel Oil or Kerosene | 12 (20.0%) | 0 (0.0%) |
| Coal or Coke | 0 (0.0%) | 0 (0.0%) |
| All other Fuels | 0 (0.0%) | 0 (0.0%) |
| No Fuel Used | 0 (0.0%) | 0 (0.0%) |
| Total | 60 (100.0%) | 0 (0.0%) |
Household Vehicle Usage in Williston
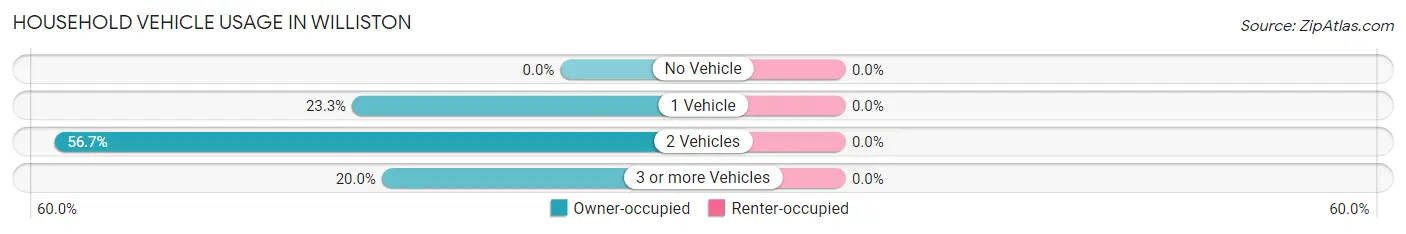
| Vehicles per Household | Owner-occupied | Renter-occupied |
| No Vehicle | 0 (0.0%) | 0 (0.0%) |
| 1 Vehicle | 14 (23.3%) | 0 (0.0%) |
| 2 Vehicles | 34 (56.7%) | 0 (0.0%) |
| 3 or more Vehicles | 12 (20.0%) | 0 (0.0%) |
| Total | 60 (100.0%) | 0 (0.0%) |
Real Estate & Mortgages in Williston
Real Estate and Mortgage Overview in Williston
| Characteristic | Without Mortgage | With Mortgage |
| Housing Units | 11 | 49 |
| Median Property Value | - | - |
| Median Household Income | - | - |
| Monthly Housing Costs | - | - |
| Real Estate Taxes | - | - |
Property Value by Mortgage Status in Williston
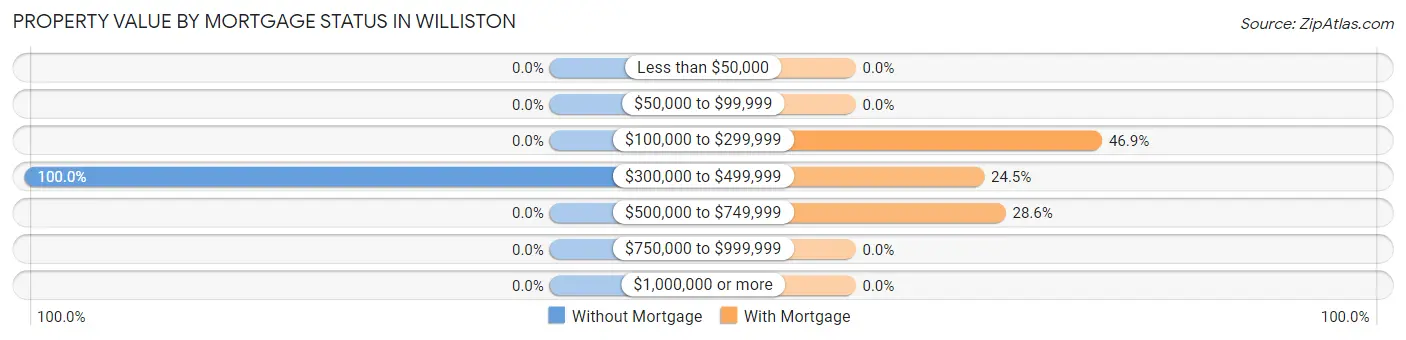
| Property Value | Without Mortgage | With Mortgage |
| Less than $50,000 | 0 (0.0%) | 0 (0.0%) |
| $50,000 to $99,999 | 0 (0.0%) | 0 (0.0%) |
| $100,000 to $299,999 | 0 (0.0%) | 23 (46.9%) |
| $300,000 to $499,999 | 11 (100.0%) | 12 (24.5%) |
| $500,000 to $749,999 | 0 (0.0%) | 14 (28.6%) |
| $750,000 to $999,999 | 0 (0.0%) | 0 (0.0%) |
| $1,000,000 or more | 0 (0.0%) | 0 (0.0%) |
| Total | 11 (100.0%) | 49 (100.0%) |
Household Income by Mortgage Status in Williston
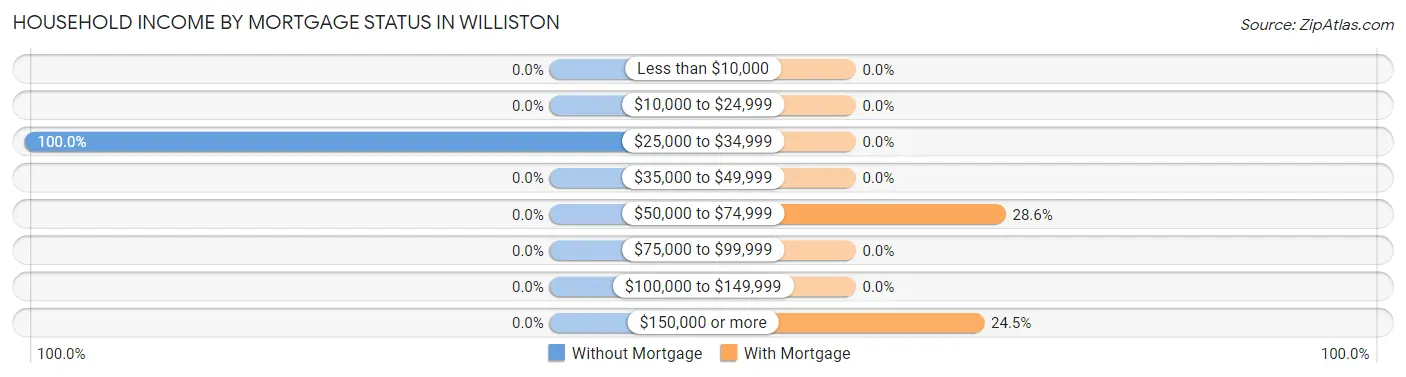
| Household Income | Without Mortgage | With Mortgage |
| Less than $10,000 | 0 (0.0%) | 0 (0.0%) |
| $10,000 to $24,999 | 0 (0.0%) | 0 (0.0%) |
| $25,000 to $34,999 | 11 (100.0%) | 0 (0.0%) |
| $35,000 to $49,999 | 0 (0.0%) | 0 (0.0%) |
| $50,000 to $74,999 | 0 (0.0%) | 14 (28.6%) |
| $75,000 to $99,999 | 0 (0.0%) | 0 (0.0%) |
| $100,000 to $149,999 | 0 (0.0%) | 0 (0.0%) |
| $150,000 or more | 0 (0.0%) | 12 (24.5%) |
| Total | 11 (100.0%) | 49 (100.0%) |
Property Value to Household Income Ratio in Williston
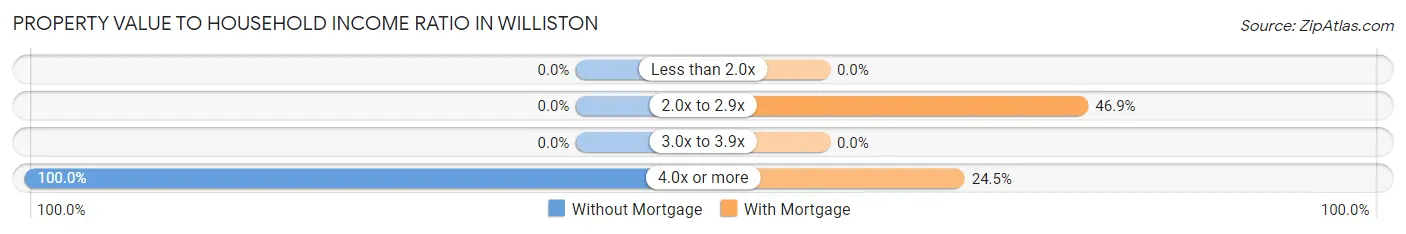
| Value-to-Income Ratio | Without Mortgage | With Mortgage |
| Less than 2.0x | 0 (0.0%) | 0 (0.0%) |
| 2.0x to 2.9x | 0 (0.0%) | 23 (46.9%) |
| 3.0x to 3.9x | 0 (0.0%) | 0 (0.0%) |
| 4.0x or more | 11 (100.0%) | 12 (24.5%) |
| Total | 11 (100.0%) | 49 (100.0%) |
Real Estate Taxes by Mortgage Status in Williston
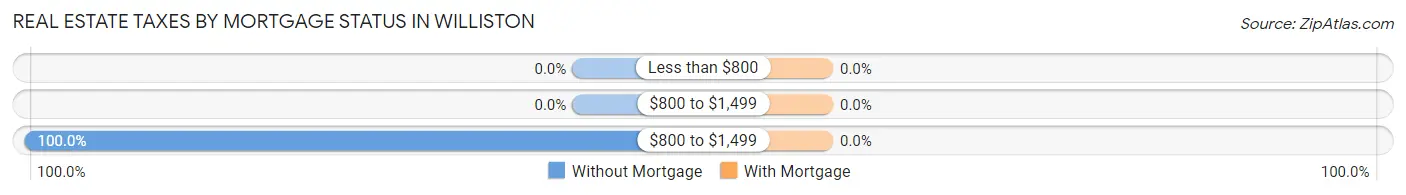
| Property Taxes | Without Mortgage | With Mortgage |
| Less than $800 | 0 (0.0%) | 0 (0.0%) |
| $800 to $1,499 | 0 (0.0%) | 0 (0.0%) |
| $800 to $1,499 | 11 (100.0%) | 0 (0.0%) |
| Total | 11 (100.0%) | 49 (100.0%) |
Health & Disability in Williston
Health Insurance Coverage by Age in Williston
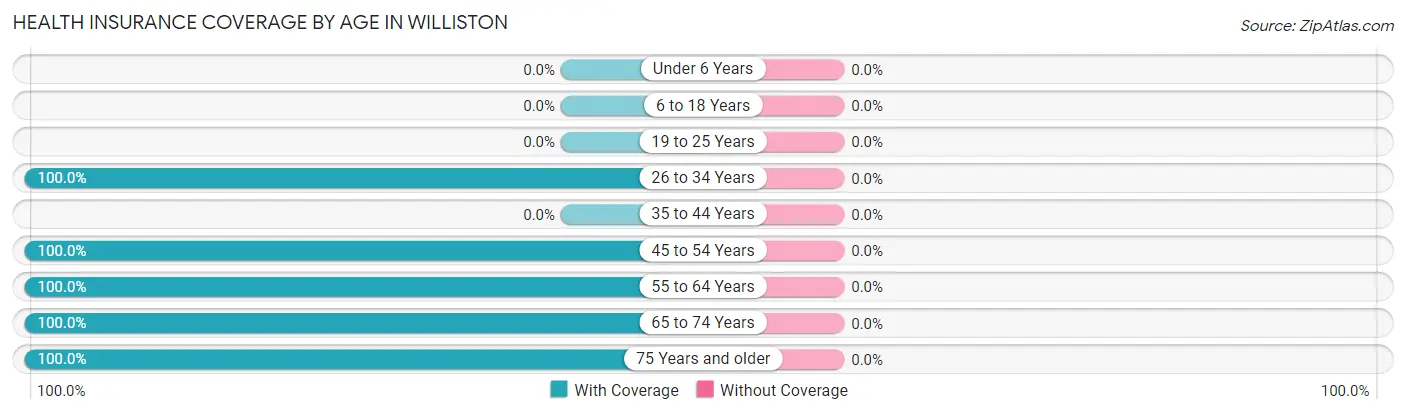
| Age Bracket | With Coverage | Without Coverage |
| Under 6 Years | 0 (0.0%) | 0 (0.0%) |
| 6 to 18 Years | 0 (0.0%) | 0 (0.0%) |
| 19 to 25 Years | 0 (0.0%) | 0 (0.0%) |
| 26 to 34 Years | 95 (100.0%) | 0 (0.0%) |
| 35 to 44 Years | 0 (0.0%) | 0 (0.0%) |
| 45 to 54 Years | 10 (100.0%) | 0 (0.0%) |
| 55 to 64 Years | 14 (100.0%) | 0 (0.0%) |
| 65 to 74 Years | 12 (100.0%) | 0 (0.0%) |
| 75 Years and older | 22 (100.0%) | 0 (0.0%) |
| Total | 153 (100.0%) | 0 (0.0%) |
Health Insurance Coverage by Citizenship Status in Williston
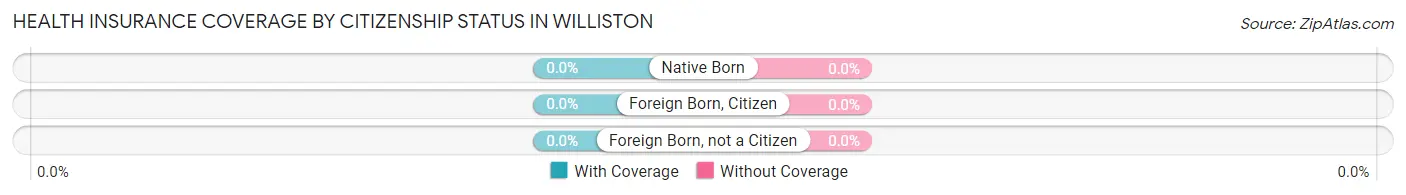
| Citizenship Status | With Coverage | Without Coverage |
| Native Born | 0 (0.0%) | 0 (0.0%) |
| Foreign Born, Citizen | 0 (0.0%) | 0 (0.0%) |
| Foreign Born, not a Citizen | 0 (0.0%) | 0 (0.0%) |
Health Insurance Coverage by Household Income in Williston
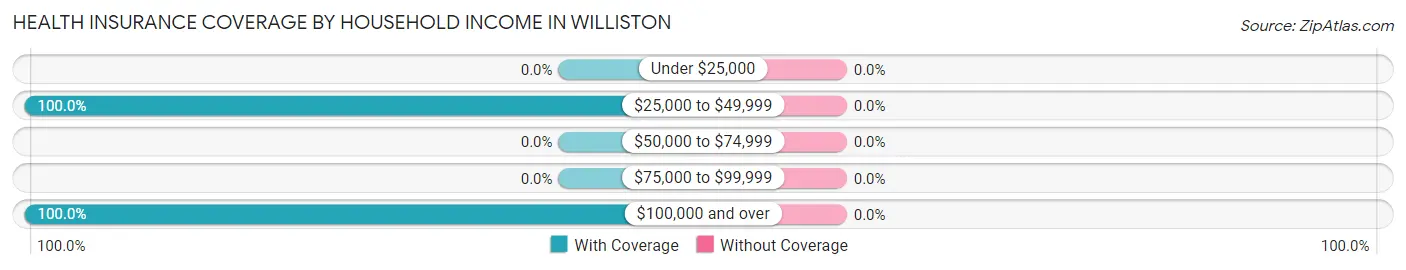
| Household Income | With Coverage | Without Coverage |
| Under $25,000 | 0 (0.0%) | 0 (0.0%) |
| $25,000 to $49,999 | 36 (100.0%) | 0 (0.0%) |
| $50,000 to $74,999 | 0 (0.0%) | 0 (0.0%) |
| $75,000 to $99,999 | 0 (0.0%) | 0 (0.0%) |
| $100,000 and over | 117 (100.0%) | 0 (0.0%) |
Public vs Private Health Insurance Coverage by Age in Williston
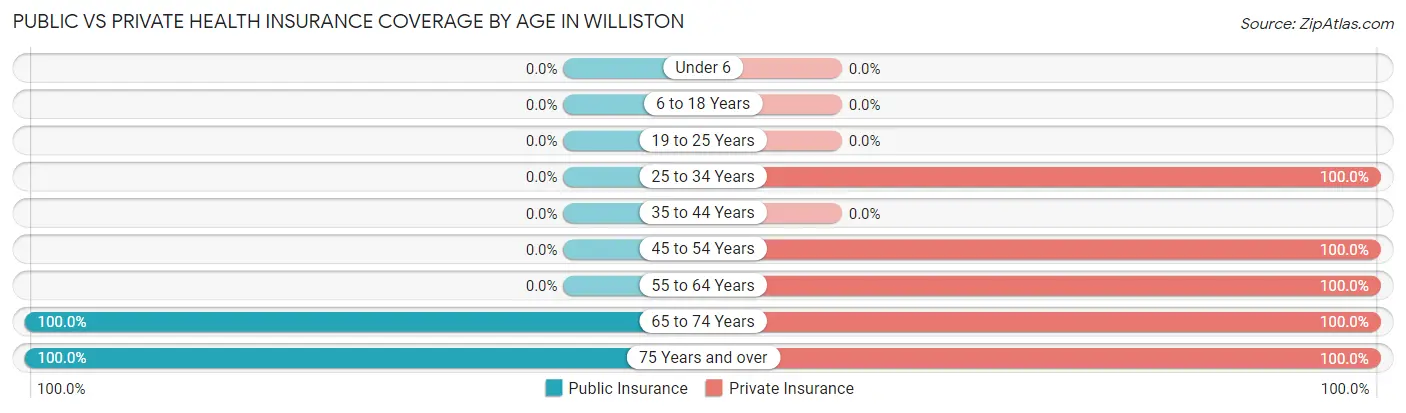
| Age Bracket | Public Insurance | Private Insurance |
| Under 6 | 0 (0.0%) | 0 (0.0%) |
| 6 to 18 Years | 0 (0.0%) | 0 (0.0%) |
| 19 to 25 Years | 0 (0.0%) | 0 (0.0%) |
| 25 to 34 Years | 0 (0.0%) | 95 (100.0%) |
| 35 to 44 Years | 0 (0.0%) | 0 (0.0%) |
| 45 to 54 Years | 0 (0.0%) | 10 (100.0%) |
| 55 to 64 Years | 0 (0.0%) | 14 (100.0%) |
| 65 to 74 Years | 12 (100.0%) | 12 (100.0%) |
| 75 Years and over | 22 (100.0%) | 22 (100.0%) |
| Total | 34 (22.2%) | 153 (100.0%) |
Disability Status by Sex by Age in Williston
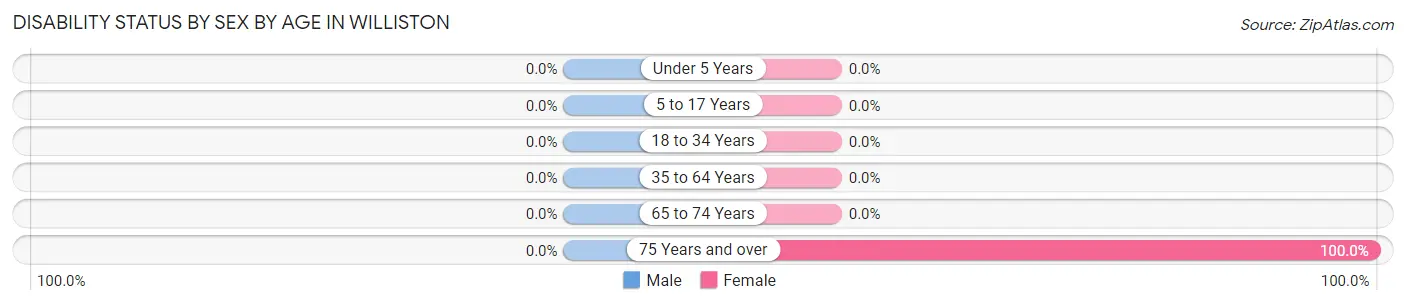
| Age Bracket | Male | Female |
| Under 5 Years | 0 (0.0%) | 0 (0.0%) |
| 5 to 17 Years | 0 (0.0%) | 0 (0.0%) |
| 18 to 34 Years | 0 (0.0%) | 0 (0.0%) |
| 35 to 64 Years | 0 (0.0%) | 0 (0.0%) |
| 65 to 74 Years | 0 (0.0%) | 0 (0.0%) |
| 75 Years and over | 0 (0.0%) | 11 (100.0%) |
Disability Class by Sex by Age in Williston
Disability Class: Hearing Difficulty
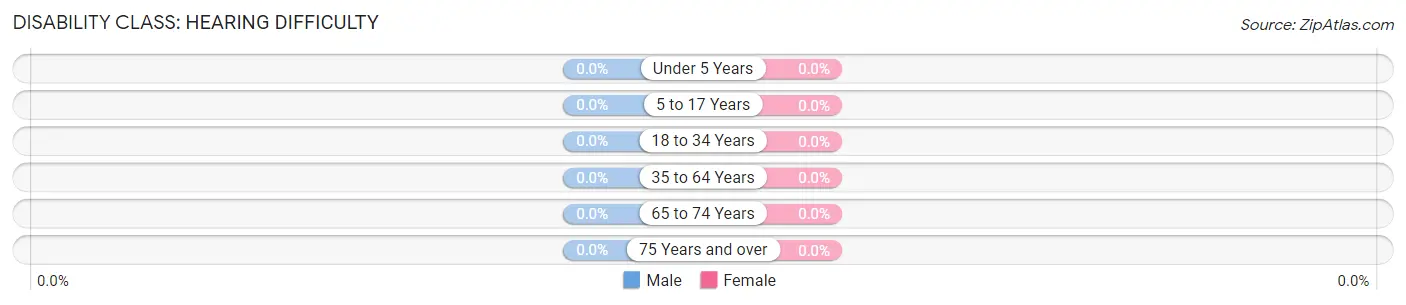
| Age Bracket | Male | Female |
| Under 5 Years | 0 (0.0%) | 0 (0.0%) |
| 5 to 17 Years | 0 (0.0%) | 0 (0.0%) |
| 18 to 34 Years | 0 (0.0%) | 0 (0.0%) |
| 35 to 64 Years | 0 (0.0%) | 0 (0.0%) |
| 65 to 74 Years | 0 (0.0%) | 0 (0.0%) |
| 75 Years and over | 0 (0.0%) | 0 (0.0%) |
Disability Class: Vision Difficulty
| Age Bracket | Male | Female |
| Under 5 Years | 0 (0.0%) | 0 (0.0%) |
| 5 to 17 Years | 0 (0.0%) | 0 (0.0%) |
| 18 to 34 Years | 0 (0.0%) | 0 (0.0%) |
| 35 to 64 Years | 0 (0.0%) | 0 (0.0%) |
| 65 to 74 Years | 0 (0.0%) | 0 (0.0%) |
| 75 Years and over | 0 (0.0%) | 0 (0.0%) |
Disability Class: Cognitive Difficulty
| Age Bracket | Male | Female |
| 5 to 17 Years | 0 (0.0%) | 0 (0.0%) |
| 18 to 34 Years | 0 (0.0%) | 0 (0.0%) |
| 35 to 64 Years | 0 (0.0%) | 0 (0.0%) |
| 65 to 74 Years | 0 (0.0%) | 0 (0.0%) |
| 75 Years and over | 0 (0.0%) | 0 (0.0%) |
Disability Class: Ambulatory Difficulty
| Age Bracket | Male | Female |
| 5 to 17 Years | 0 (0.0%) | 0 (0.0%) |
| 18 to 34 Years | 0 (0.0%) | 0 (0.0%) |
| 35 to 64 Years | 0 (0.0%) | 0 (0.0%) |
| 65 to 74 Years | 0 (0.0%) | 0 (0.0%) |
| 75 Years and over | 0 (0.0%) | 11 (100.0%) |
Disability Class: Self-Care Difficulty
| Age Bracket | Male | Female |
| 5 to 17 Years | 0 (0.0%) | 0 (0.0%) |
| 18 to 34 Years | 0 (0.0%) | 0 (0.0%) |
| 35 to 64 Years | 0 (0.0%) | 0 (0.0%) |
| 65 to 74 Years | 0 (0.0%) | 0 (0.0%) |
| 75 Years and over | 0 (0.0%) | 0 (0.0%) |
Technology Access in Williston
Computing Device Access in Williston
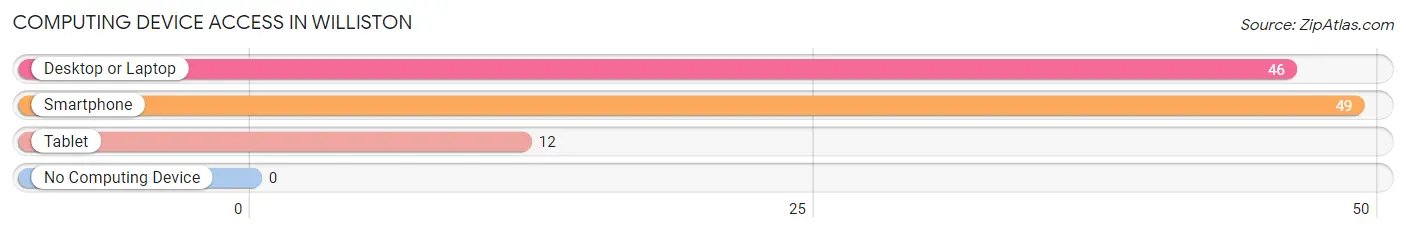
| Device Type | # Households | % Households |
| Desktop or Laptop | 46 | 76.7% |
| Smartphone | 49 | 81.7% |
| Tablet | 12 | 20.0% |
| No Computing Device | 0 | 0.0% |
| Total | 60 | 100.0% |
Internet Access in Williston
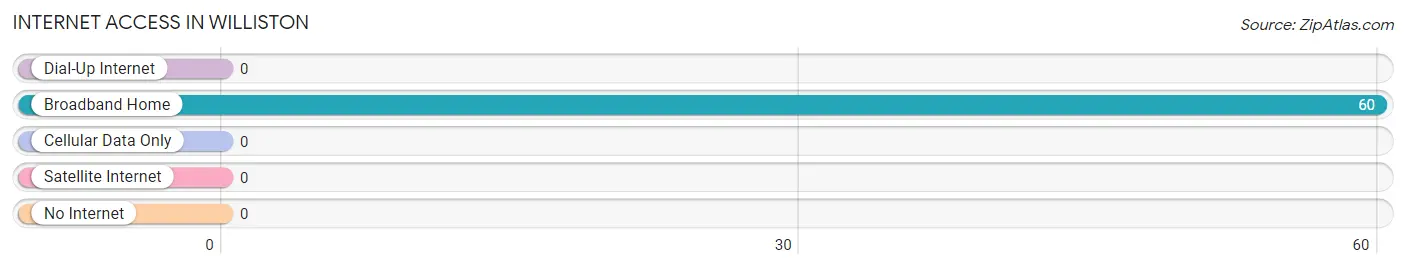
| Internet Type | # Households | % Households |
| Dial-Up Internet | 0 | 0.0% |
| Broadband Home | 60 | 100.0% |
| Cellular Data Only | 0 | 0.0% |
| Satellite Internet | 0 | 0.0% |
| No Internet | 0 | 0.0% |
| Total | 60 | 100.0% |
Williston Summary
Williston is a small town located in the state of Maryland, United States. It is situated in the northern part of the state, in Washington County. The town has a population of approximately 1,000 people, and is part of the Hagerstown-Martinsburg Metropolitan Statistical Area.
History
Williston was founded in 1790 by William Williston, a Revolutionary War veteran. The town was originally known as Williston’s Crossroads, and was a stop on the National Road, which connected Cumberland, Maryland to Wheeling, West Virginia. The town was officially incorporated in 1872.
In the late 19th century, Williston was a thriving agricultural community. The town was home to several mills, including a grist mill, a saw mill, and a woolen mill. The town also had a blacksmith shop, a general store, and a post office.
In the early 20th century, Williston experienced a period of decline. The mills closed, and the population began to decline. In the 1950s, the town was revitalized when the Maryland State Highway Administration built a bypass around the town. This allowed for easier access to the nearby cities of Hagerstown and Frederick.
Geography
Williston is located in the northern part of Washington County, Maryland. It is situated at the intersection of Maryland Route 67 and Maryland Route 68. The town is located approximately 10 miles south of Hagerstown and 25 miles northwest of Frederick.
The town is situated in the Appalachian Mountains, and is surrounded by rolling hills and forests. The town is located in the Appalachian Plateau, which is characterized by steep slopes and narrow valleys. The town is located in the Potomac River watershed, and is situated near the Potomac River.
Economy
Williston’s economy is largely based on agriculture and tourism. The town is home to several farms, which produce a variety of crops, including corn, soybeans, and hay. The town is also home to several wineries, which produce a variety of wines.
The town is also home to several small businesses, including restaurants, antique stores, and gift shops. The town is also home to several bed and breakfasts, which attract tourists from around the region.
Demographics
As of the 2010 census, Williston had a population of 1,000 people. The town is predominantly white, with approximately 95% of the population being white. The town also has a small African American population, with approximately 4% of the population being African American. The town also has a small Hispanic population, with approximately 1% of the population being Hispanic.
The median household income in Williston is approximately $50,000, and the median home value is approximately $150,000. The town has a low unemployment rate, with approximately 4% of the population being unemployed. The town also has a low poverty rate, with approximately 5% of the population living below the poverty line.
Common Questions
What is Per Capita Income in Williston?
Per Capita income in Williston is $57,739.
What is Inequality or Gini Index in Williston?
Inequality or Gini Index in Williston is 0.33.
What is the Total Population of Williston?
Total Population of Williston is 153.
What is the Total Male Population of Williston?
Total Male Population of Williston is 132.
What is the Total Female Population of Williston?
Total Female Population of Williston is 21.
What is the Ratio of Males per 100 Females in Williston?
There are 628.57 Males per 100 Females in Williston.
What is the Ratio of Females per 100 Males in Williston?
There are 15.91 Females per 100 Males in Williston.
What is the Median Population Age in Williston?
Median Population Age in Williston is 33.2 Years.
What is the Average Family Size in Williston
Average Family Size in Williston is 2.9 People.
What is the Average Household Size in Williston
Average Household Size in Williston is 2.5 People.
How Large is the Labor Force in Williston?
There are 131 People in the Labor Forcein in Williston.
What is the Percentage of People in the Labor Force in Williston?
85.6% of People are in the Labor Force in Williston.