South Hooksett, NH Map & Demographics
South Hooksett Map
South Hooksett Overview
$43,395
PER CAPITA INCOME
$140,357
AVG FAMILY INCOME
$113,024
AVG HOUSEHOLD INCOME
18.8%
WAGE / INCOME GAP [ % ]
81.2¢/ $1
WAGE / INCOME GAP [ $ ]
0.44
INEQUALITY / GINI INDEX
5,808
TOTAL POPULATION
2,948
MALE POPULATION
2,860
FEMALE POPULATION
103.08
MALES / 100 FEMALES
97.01
FEMALES / 100 MALES
35.0
MEDIAN AGE
3.4
AVG FAMILY SIZE
2.9
AVG HOUSEHOLD SIZE
3,454
LABOR FORCE [ PEOPLE ]
69.3%
PERCENT IN LABOR FORCE
3.9%
UNEMPLOYMENT RATE
Income in South Hooksett
Income Overview in South Hooksett
Per Capita Income in South Hooksett is $43,395, while median incomes of families and households are $140,357 and $113,024 respectively.
| Characteristic | Number | Measure |
| Per Capita Income | 5,808 | $43,395 |
| Median Family Income | 1,290 | $140,357 |
| Mean Family Income | 1,290 | $164,896 |
| Median Household Income | 1,727 | $113,024 |
| Mean Household Income | 1,727 | $140,395 |
| Income Deficit | 1,290 | $0 |
| Wage / Income Gap (%) | 5,808 | 18.82% |
| Wage / Income Gap ($) | 5,808 | 81.18¢ per $1 |
| Gini / Inequality Index | 5,808 | 0.44 |
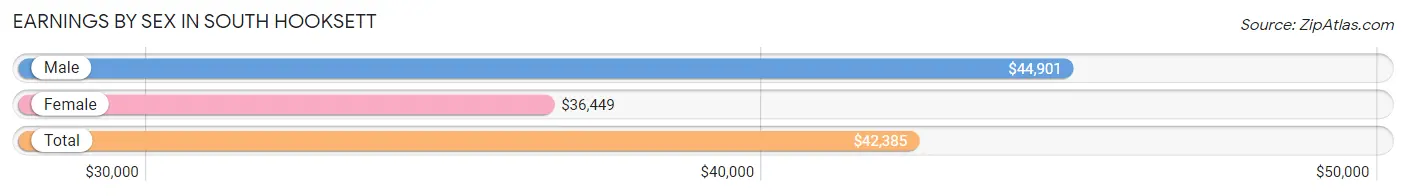
Earnings by Sex in South Hooksett
Average Earnings in South Hooksett are $42,385, $44,901 for men and $36,449 for women, a difference of 18.8%.
| Sex | Number | Average Earnings |
| Male | 1,869 (50.7%) | $44,901 |
| Female | 1,819 (49.3%) | $36,449 |
| Total | 3,688 (100.0%) | $42,385 |
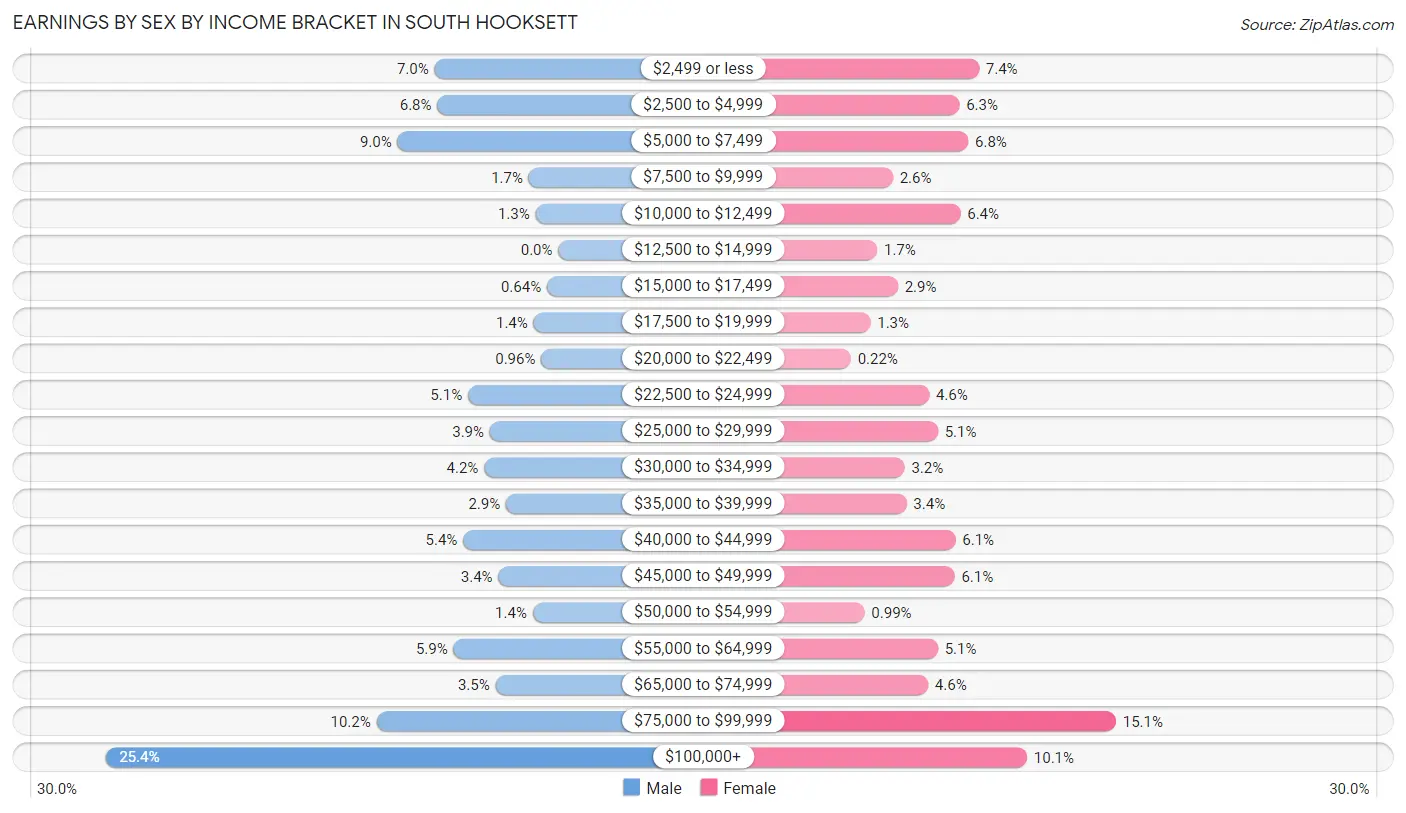
Earnings by Sex by Income Bracket in South Hooksett
The most common earnings brackets in South Hooksett are $100,000+ for men (475 | 25.4%) and $75,000 to $99,999 for women (275 | 15.1%).
| Income | Male | Female |
| $2,499 or less | 130 (7.0%) | 135 (7.4%) |
| $2,500 to $4,999 | 127 (6.8%) | 115 (6.3%) |
| $5,000 to $7,499 | 169 (9.0%) | 124 (6.8%) |
| $7,500 to $9,999 | 31 (1.7%) | 47 (2.6%) |
| $10,000 to $12,499 | 24 (1.3%) | 116 (6.4%) |
| $12,500 to $14,999 | 0 (0.0%) | 31 (1.7%) |
| $15,000 to $17,499 | 12 (0.6%) | 52 (2.9%) |
| $17,500 to $19,999 | 26 (1.4%) | 24 (1.3%) |
| $20,000 to $22,499 | 18 (1.0%) | 4 (0.2%) |
| $22,500 to $24,999 | 95 (5.1%) | 84 (4.6%) |
| $25,000 to $29,999 | 72 (3.8%) | 93 (5.1%) |
| $30,000 to $34,999 | 78 (4.2%) | 59 (3.2%) |
| $35,000 to $39,999 | 55 (2.9%) | 61 (3.4%) |
| $40,000 to $44,999 | 100 (5.3%) | 111 (6.1%) |
| $45,000 to $49,999 | 63 (3.4%) | 110 (6.0%) |
| $50,000 to $54,999 | 27 (1.4%) | 18 (1.0%) |
| $55,000 to $64,999 | 110 (5.9%) | 93 (5.1%) |
| $65,000 to $74,999 | 66 (3.5%) | 83 (4.6%) |
| $75,000 to $99,999 | 191 (10.2%) | 275 (15.1%) |
| $100,000+ | 475 (25.4%) | 184 (10.1%) |
| Total | 1,869 (100.0%) | 1,819 (100.0%) |
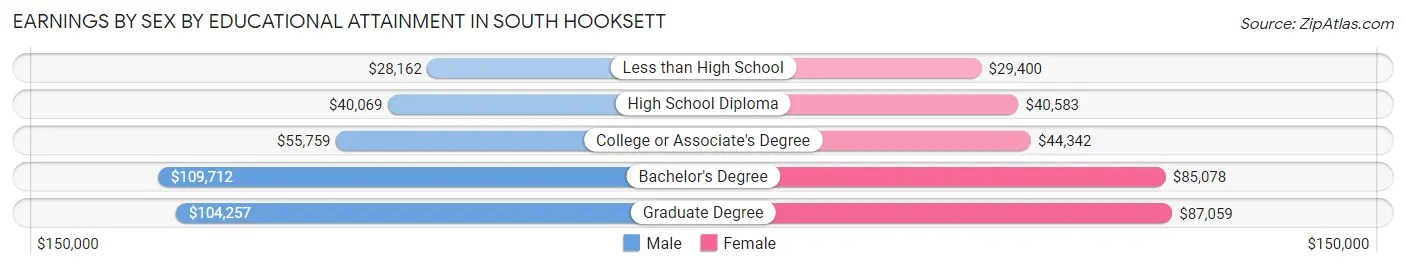
Earnings by Sex by Educational Attainment in South Hooksett
Average earnings in South Hooksett are $73,209 for men and $52,692 for women, a difference of 28.0%. Men with an educational attainment of bachelor's degree enjoy the highest average annual earnings of $109,712, while those with less than high school education earn the least with $28,162. Women with an educational attainment of graduate degree earn the most with the average annual earnings of $87,059, while those with less than high school education have the smallest earnings of $29,400.
| Educational Attainment | Male Income | Female Income |
| Less than High School | $28,162 | $29,400 |
| High School Diploma | $40,069 | $40,583 |
| College or Associate's Degree | $55,759 | $44,342 |
| Bachelor's Degree | $109,712 | $85,078 |
| Graduate Degree | $104,257 | $87,059 |
| Total | $73,209 | $52,692 |
Family Income in South Hooksett
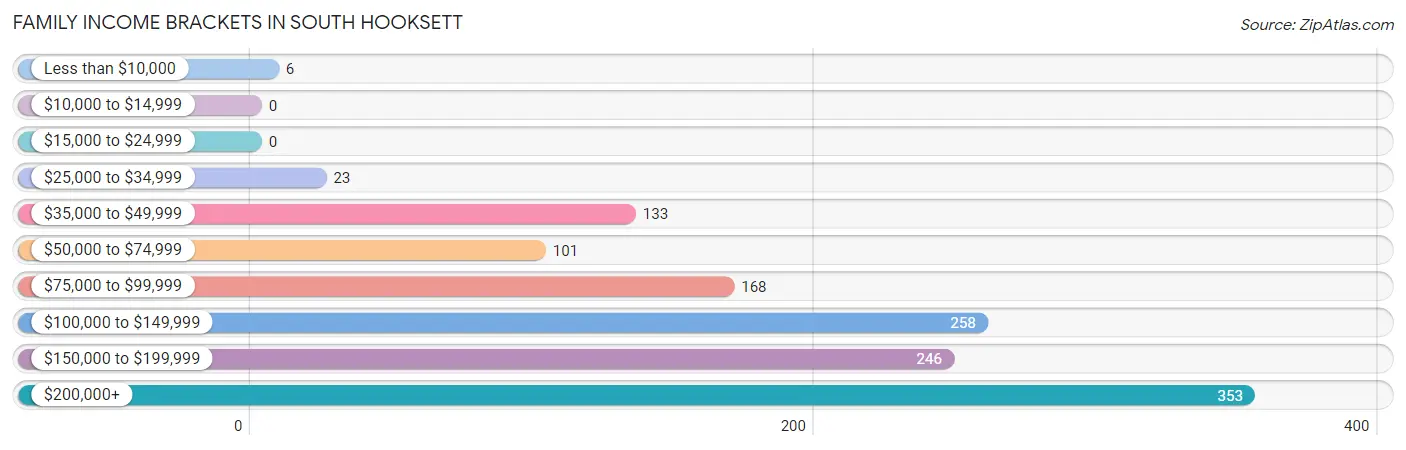
Family Income Brackets in South Hooksett
According to the South Hooksett family income data, there are 353 families falling into the $200,000+ income range, which is the most common income bracket and makes up 27.4% of all families.
| Income Bracket | # Families | % Families |
| Less than $10,000 | 6 | 0.5% |
| $10,000 to $14,999 | 0 | 0.0% |
| $15,000 to $24,999 | 0 | 0.0% |
| $25,000 to $34,999 | 23 | 1.8% |
| $35,000 to $49,999 | 133 | 10.3% |
| $50,000 to $74,999 | 101 | 7.8% |
| $75,000 to $99,999 | 168 | 13.0% |
| $100,000 to $149,999 | 258 | 20.0% |
| $150,000 to $199,999 | 246 | 19.1% |
| $200,000+ | 353 | 27.4% |
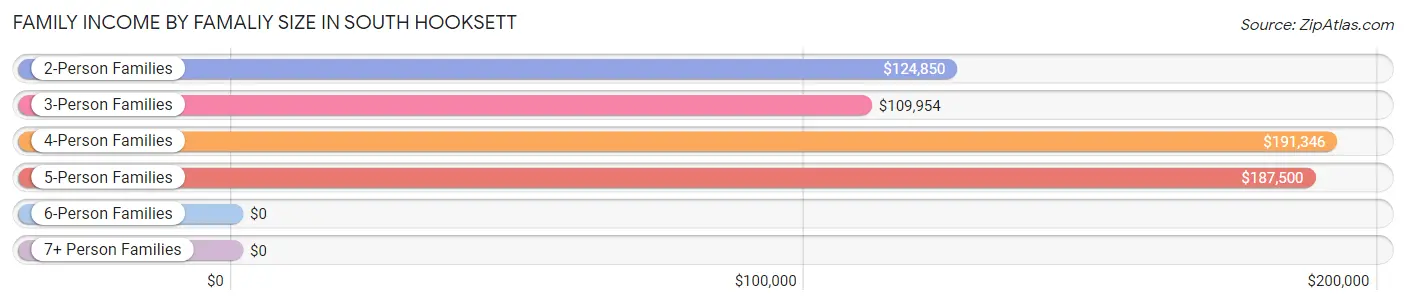
Family Income by Famaliy Size in South Hooksett
4-person families (334 | 25.9%) account for the highest median family income in South Hooksett with $191,346 per family, while 2-person families (507 | 39.3%) have the highest median income of $62,425 per family member.
| Income Bracket | # Families | Median Income |
| 2-Person Families | 507 (39.3%) | $124,850 |
| 3-Person Families | 305 (23.6%) | $109,954 |
| 4-Person Families | 334 (25.9%) | $191,346 |
| 5-Person Families | 118 (9.1%) | $187,500 |
| 6-Person Families | 26 (2.0%) | $0 |
| 7+ Person Families | 0 (0.0%) | $0 |
| Total | 1,290 (100.0%) | $140,357 |
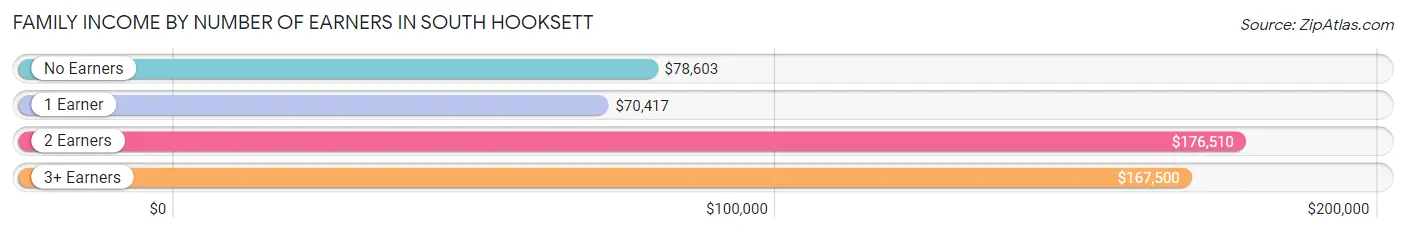
Family Income by Number of Earners in South Hooksett
The median family income in South Hooksett is $140,357, with families comprising 2 earners (524) having the highest median family income of $176,510, while families with 1 earner (310) have the lowest median family income of $70,417, accounting for 40.6% and 24.0% of families, respectively.
| Number of Earners | # Families | Median Income |
| No Earners | 120 (9.3%) | $78,603 |
| 1 Earner | 310 (24.0%) | $70,417 |
| 2 Earners | 524 (40.6%) | $176,510 |
| 3+ Earners | 336 (26.1%) | $167,500 |
| Total | 1,290 (100.0%) | $140,357 |
Household Income in South Hooksett
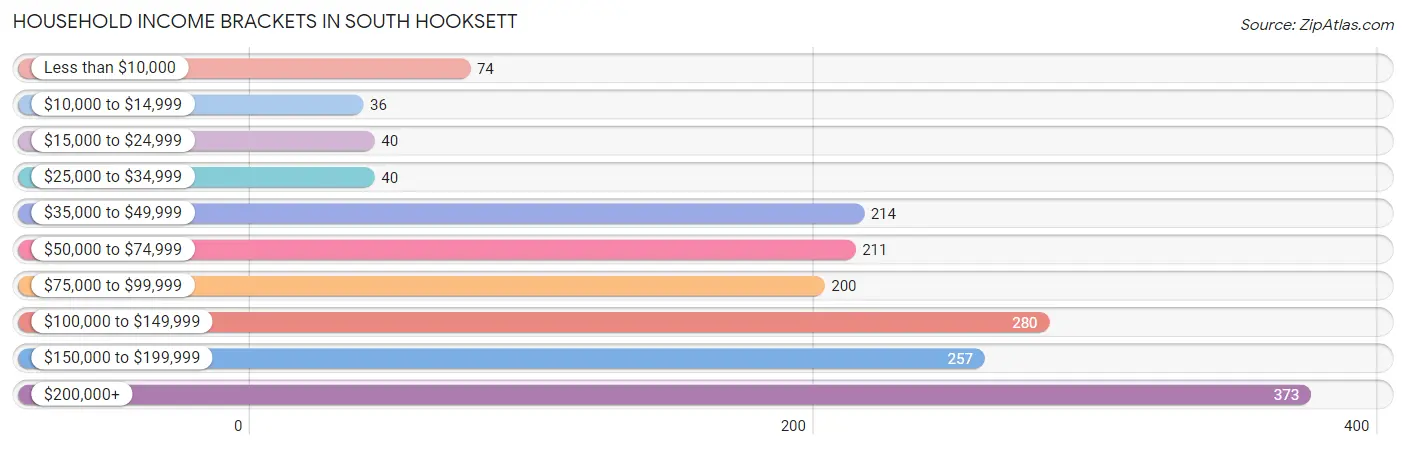
Household Income Brackets in South Hooksett
With 373 households falling in the category, the $200,000+ income range is the most frequent in South Hooksett, accounting for 21.6% of all households. In contrast, only 36 households (2.1%) fall into the $10,000 to $14,999 income bracket, making it the least populous group.
| Income Bracket | # Households | % Households |
| Less than $10,000 | 74 | 4.3% |
| $10,000 to $14,999 | 36 | 2.1% |
| $15,000 to $24,999 | 40 | 2.3% |
| $25,000 to $34,999 | 40 | 2.3% |
| $35,000 to $49,999 | 214 | 12.4% |
| $50,000 to $74,999 | 211 | 12.2% |
| $75,000 to $99,999 | 200 | 11.6% |
| $100,000 to $149,999 | 280 | 16.2% |
| $150,000 to $199,999 | 257 | 14.9% |
| $200,000+ | 373 | 21.6% |
Household Income by Householder Age in South Hooksett
The median household income in South Hooksett is $113,024, with the highest median household income of $175,990 found in the 25 to 44 years age bracket for the primary householder. A total of 370 households (21.4%) fall into this category. Meanwhile, the 15 to 24 years age bracket for the primary householder has the lowest median household income of $0, with 57 households (3.3%) in this group.
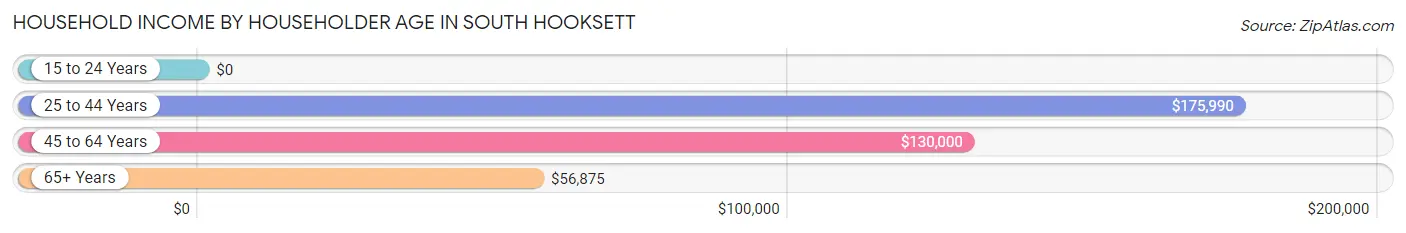
| Income Bracket | # Households | Median Income |
| 15 to 24 Years | 57 (3.3%) | $0 |
| 25 to 44 Years | 370 (21.4%) | $175,990 |
| 45 to 64 Years | 878 (50.8%) | $130,000 |
| 65+ Years | 422 (24.4%) | $56,875 |
| Total | 1,727 (100.0%) | $113,024 |
Poverty in South Hooksett
Income Below Poverty by Sex and Age in South Hooksett
With 4.5% poverty level for males and 1.4% for females among the residents of South Hooksett, 18 to 24 year old males and 55 to 64 year old females are the most vulnerable to poverty, with 35 males (17.2%) and 20 females (4.5%) in their respective age groups living below the poverty level.
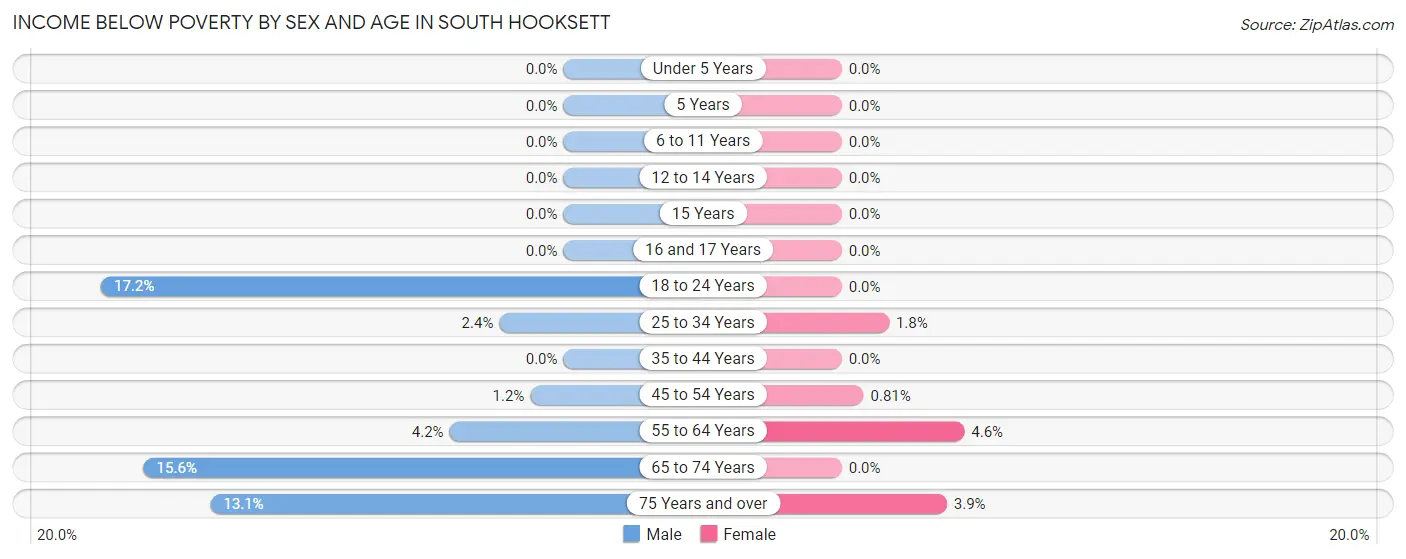
| Age Bracket | Male | Female |
| Under 5 Years | 0 (0.0%) | 0 (0.0%) |
| 5 Years | 0 (0.0%) | 0 (0.0%) |
| 6 to 11 Years | 0 (0.0%) | 0 (0.0%) |
| 12 to 14 Years | 0 (0.0%) | 0 (0.0%) |
| 15 Years | 0 (0.0%) | 0 (0.0%) |
| 16 and 17 Years | 0 (0.0%) | 0 (0.0%) |
| 18 to 24 Years | 35 (17.2%) | 0 (0.0%) |
| 25 to 34 Years | 9 (2.4%) | 6 (1.8%) |
| 35 to 44 Years | 0 (0.0%) | 0 (0.0%) |
| 45 to 54 Years | 5 (1.2%) | 3 (0.8%) |
| 55 to 64 Years | 15 (4.2%) | 20 (4.5%) |
| 65 to 74 Years | 31 (15.6%) | 0 (0.0%) |
| 75 Years and over | 22 (13.1%) | 6 (3.9%) |
| Total | 117 (4.5%) | 35 (1.4%) |
Income Above Poverty by Sex and Age in South Hooksett
According to the poverty statistics in South Hooksett, males aged under 5 years and females aged under 5 years are the age groups that are most secure financially, with 100.0% of males and 100.0% of females in these age groups living above the poverty line.
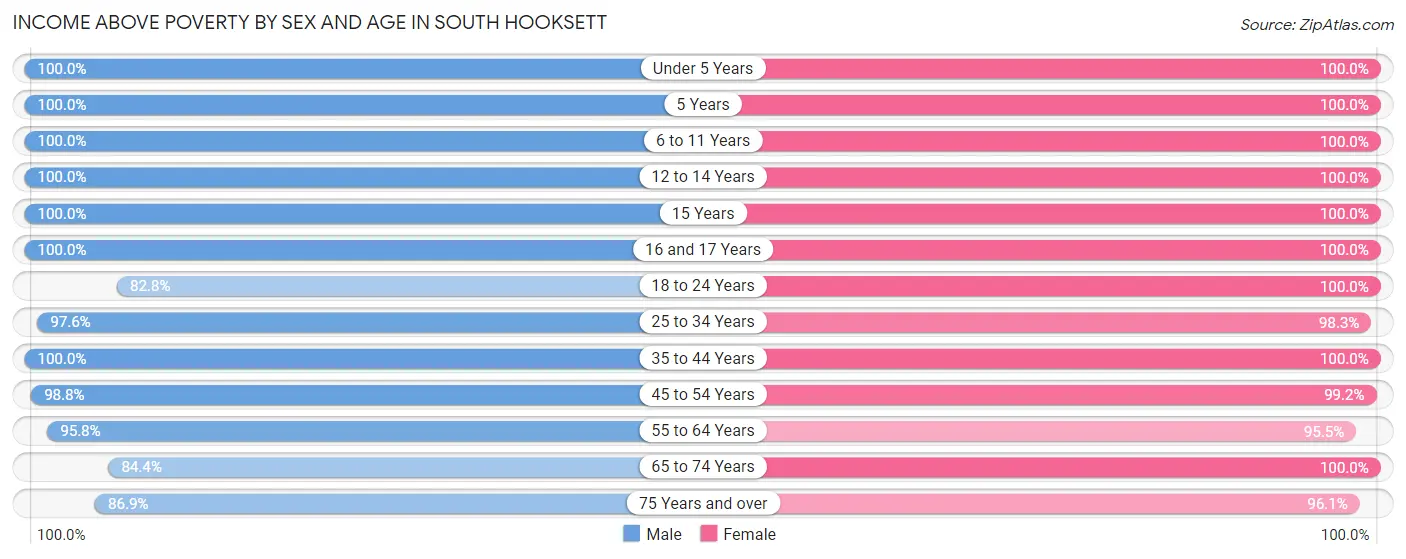
| Age Bracket | Male | Female |
| Under 5 Years | 205 (100.0%) | 40 (100.0%) |
| 5 Years | 23 (100.0%) | 21 (100.0%) |
| 6 to 11 Years | 128 (100.0%) | 240 (100.0%) |
| 12 to 14 Years | 77 (100.0%) | 36 (100.0%) |
| 15 Years | 25 (100.0%) | 29 (100.0%) |
| 16 and 17 Years | 72 (100.0%) | 107 (100.0%) |
| 18 to 24 Years | 169 (82.8%) | 241 (100.0%) |
| 25 to 34 Years | 369 (97.6%) | 336 (98.3%) |
| 35 to 44 Years | 343 (100.0%) | 244 (100.0%) |
| 45 to 54 Years | 402 (98.8%) | 369 (99.2%) |
| 55 to 64 Years | 340 (95.8%) | 420 (95.5%) |
| 65 to 74 Years | 168 (84.4%) | 221 (100.0%) |
| 75 Years and over | 146 (86.9%) | 148 (96.1%) |
| Total | 2,467 (95.5%) | 2,452 (98.6%) |
Income Below Poverty Among Married-Couple Families in South Hooksett
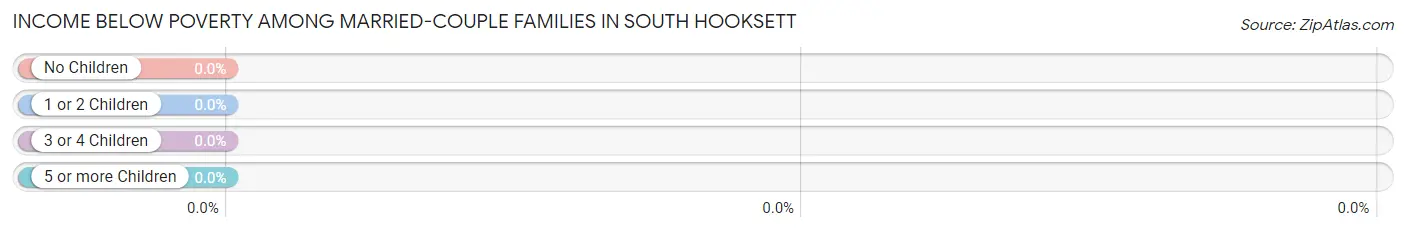
| Children | Above Poverty | Below Poverty |
| No Children | 615 (100.0%) | 0 (0.0%) |
| 1 or 2 Children | 460 (100.0%) | 0 (0.0%) |
| 3 or 4 Children | 25 (100.0%) | 0 (0.0%) |
| 5 or more Children | 0 (0.0%) | 0 (0.0%) |
| Total | 1,100 (100.0%) | 0 (0.0%) |
Income Below Poverty Among Single-Parent Households in South Hooksett
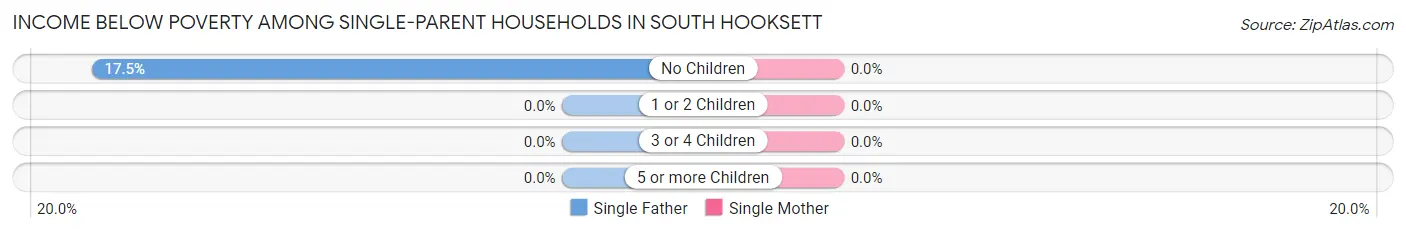
| Children | Single Father | Single Mother |
| No Children | 7 (17.5%) | 0 (0.0%) |
| 1 or 2 Children | 0 (0.0%) | 0 (0.0%) |
| 3 or 4 Children | 0 (0.0%) | 0 (0.0%) |
| 5 or more Children | 0 (0.0%) | 0 (0.0%) |
| Total | 7 (10.8%) | 0 (0.0%) |
Income Below Poverty Among Married-Couple vs Single-Parent Households in South Hooksett
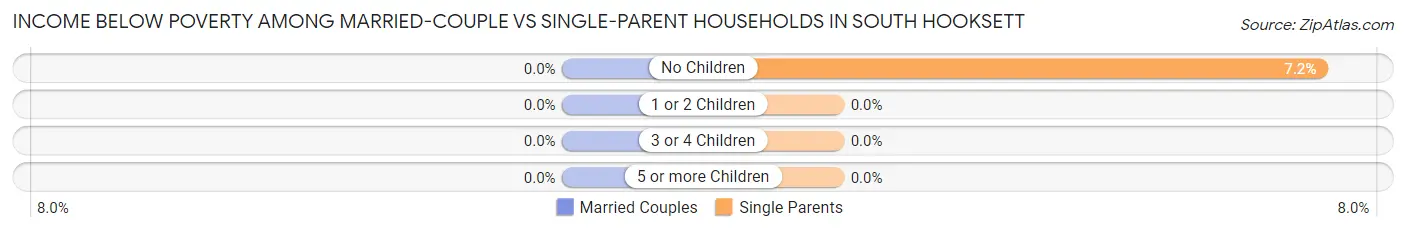
| Children | Married-Couple Families | Single-Parent Households |
| No Children | 0 (0.0%) | 7 (7.2%) |
| 1 or 2 Children | 0 (0.0%) | 0 (0.0%) |
| 3 or 4 Children | 0 (0.0%) | 0 (0.0%) |
| 5 or more Children | 0 (0.0%) | 0 (0.0%) |
| Total | 0 (0.0%) | 7 (3.7%) |
Race in South Hooksett
The most populous races in South Hooksett are White / Caucasian (4,926 | 84.8%), Two or more Races (282 | 4.9%), and Black / African American (258 | 4.4%).
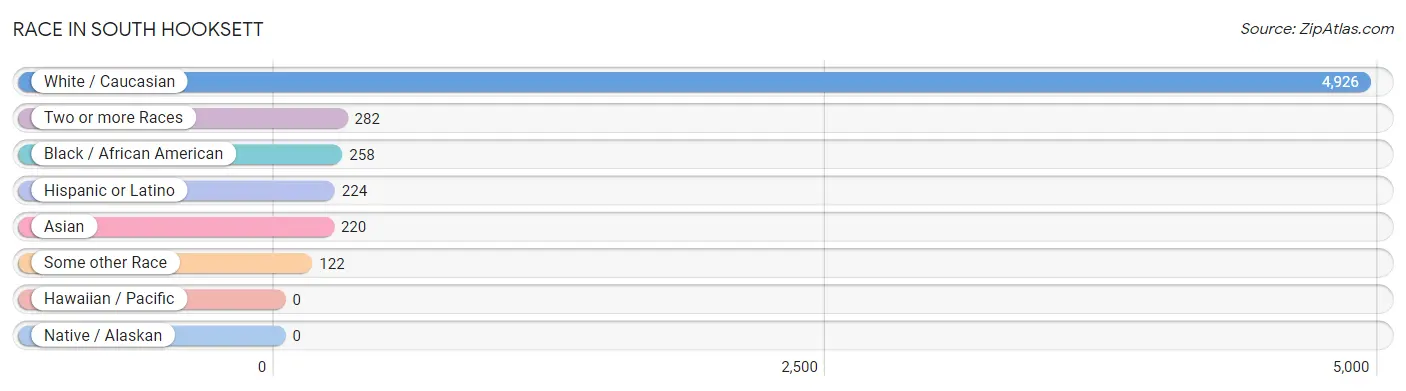
| Race | # Population | % Population |
| Asian | 220 | 3.8% |
| Black / African American | 258 | 4.4% |
| Hawaiian / Pacific | 0 | 0.0% |
| Hispanic or Latino | 224 | 3.9% |
| Native / Alaskan | 0 | 0.0% |
| White / Caucasian | 4,926 | 84.8% |
| Two or more Races | 282 | 4.9% |
| Some other Race | 122 | 2.1% |
| Total | 5,808 | 100.0% |
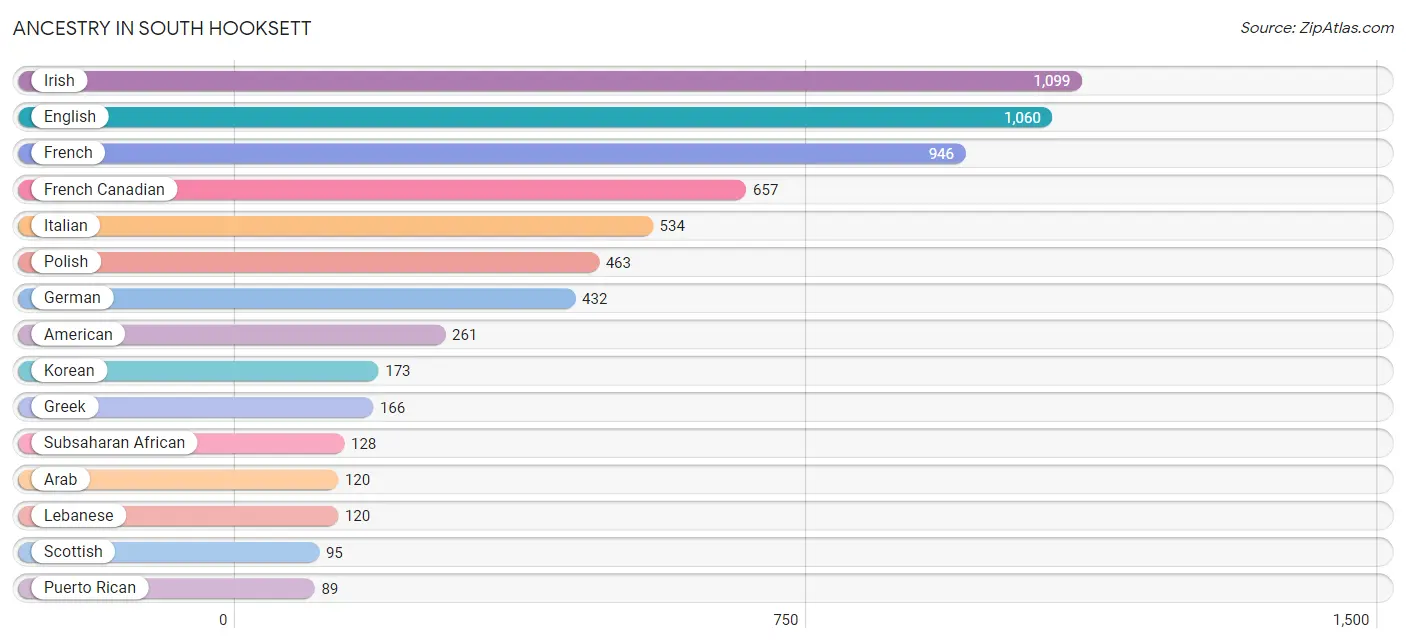
Ancestry in South Hooksett
The most populous ancestries reported in South Hooksett are Irish (1,099 | 18.9%), English (1,060 | 18.2%), French (946 | 16.3%), French Canadian (657 | 11.3%), and Italian (534 | 9.2%), together accounting for 74.0% of all South Hooksett residents.
| Ancestry | # Population | % Population |
| African | 72 | 1.2% |
| American | 261 | 4.5% |
| Arab | 120 | 2.1% |
| Barbadian | 9 | 0.2% |
| Bhutanese | 24 | 0.4% |
| Burmese | 45 | 0.8% |
| Canadian | 26 | 0.4% |
| Central American | 11 | 0.2% |
| Danish | 9 | 0.2% |
| Dominican | 15 | 0.3% |
| Dutch | 43 | 0.7% |
| Eastern European | 2 | 0.0% |
| English | 1,060 | 18.2% |
| European | 13 | 0.2% |
| French | 946 | 16.3% |
| French Canadian | 657 | 11.3% |
| German | 432 | 7.4% |
| Greek | 166 | 2.9% |
| Indian (Asian) | 24 | 0.4% |
| Irish | 1,099 | 18.9% |
| Italian | 534 | 9.2% |
| Korean | 173 | 3.0% |
| Latvian | 16 | 0.3% |
| Lebanese | 120 | 2.1% |
| Lithuanian | 50 | 0.9% |
| Malaysian | 18 | 0.3% |
| Mexican | 79 | 1.4% |
| Northern European | 7 | 0.1% |
| Norwegian | 3 | 0.1% |
| Pakistani | 24 | 0.4% |
| Polish | 463 | 8.0% |
| Portuguese | 66 | 1.1% |
| Puerto Rican | 89 | 1.5% |
| Russian | 69 | 1.2% |
| Salvadoran | 11 | 0.2% |
| Scotch-Irish | 70 | 1.2% |
| Scottish | 95 | 1.6% |
| Serbian | 20 | 0.3% |
| Spaniard | 6 | 0.1% |
| Spanish | 14 | 0.2% |
| Spanish American | 10 | 0.2% |
| Sri Lankan | 25 | 0.4% |
| Subsaharan African | 128 | 2.2% |
| Sudanese | 74 | 1.3% |
| Swedish | 57 | 1.0% |
| Thai | 10 | 0.2% |
| Trinidadian and Tobagonian | 6 | 0.1% |
| Ukrainian | 7 | 0.1% |
| West Indian | 18 | 0.3% |
| Yugoslavian | 40 | 0.7% | View All 50 Rows |
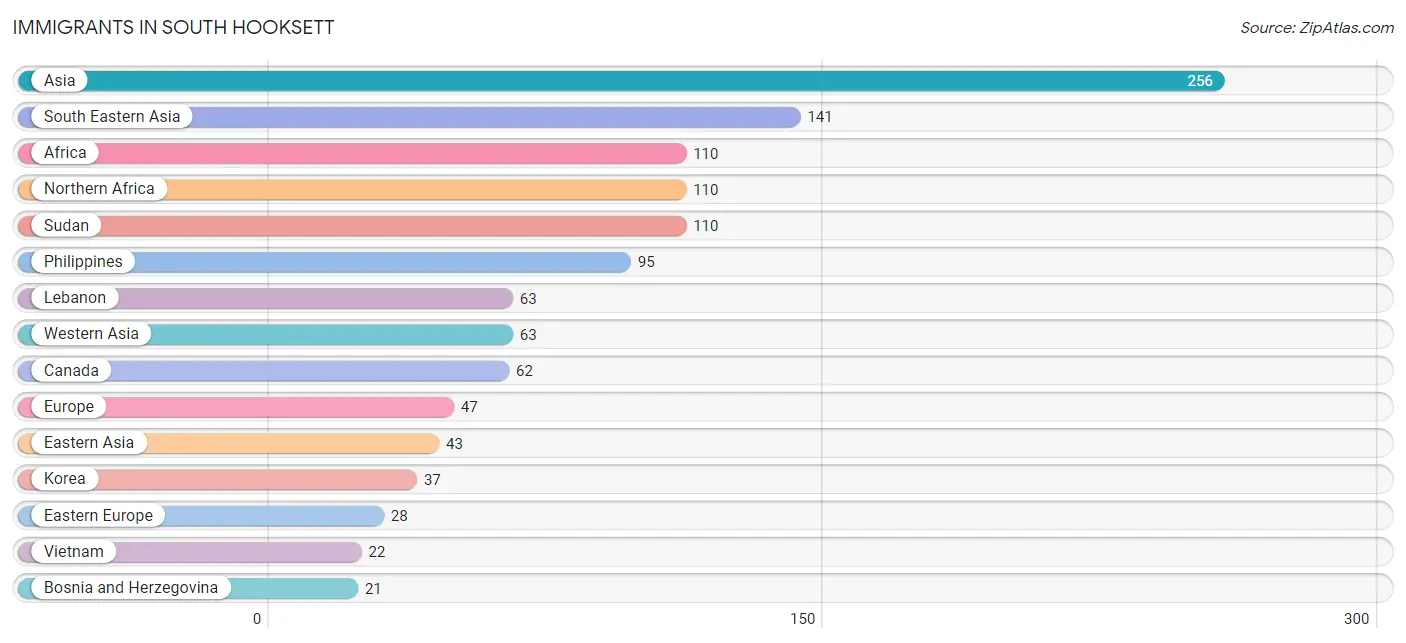
Immigrants in South Hooksett
The most numerous immigrant groups reported in South Hooksett came from Asia (256 | 4.4%), South Eastern Asia (141 | 2.4%), Africa (110 | 1.9%), Northern Africa (110 | 1.9%), and Sudan (110 | 1.9%), together accounting for 12.5% of all South Hooksett residents.
| Immigration Origin | # Population | % Population |
| Africa | 110 | 1.9% |
| Asia | 256 | 4.4% |
| Bosnia and Herzegovina | 21 | 0.4% |
| Canada | 62 | 1.1% |
| Caribbean | 15 | 0.3% |
| China | 6 | 0.1% |
| Dominican Republic | 9 | 0.2% |
| Eastern Asia | 43 | 0.7% |
| Eastern Europe | 28 | 0.5% |
| Europe | 47 | 0.8% |
| Germany | 10 | 0.2% |
| Greece | 9 | 0.2% |
| Korea | 37 | 0.6% |
| Laos | 18 | 0.3% |
| Latin America | 15 | 0.3% |
| Lebanon | 63 | 1.1% |
| Nepal | 9 | 0.2% |
| Northern Africa | 110 | 1.9% |
| Philippines | 95 | 1.6% |
| South Central Asia | 9 | 0.2% |
| South Eastern Asia | 141 | 2.4% |
| Southern Europe | 9 | 0.2% |
| Sudan | 110 | 1.9% |
| Thailand | 6 | 0.1% |
| Trinidad and Tobago | 6 | 0.1% |
| Ukraine | 7 | 0.1% |
| Vietnam | 22 | 0.4% |
| Western Asia | 63 | 1.1% |
| Western Europe | 10 | 0.2% | View All 29 Rows |
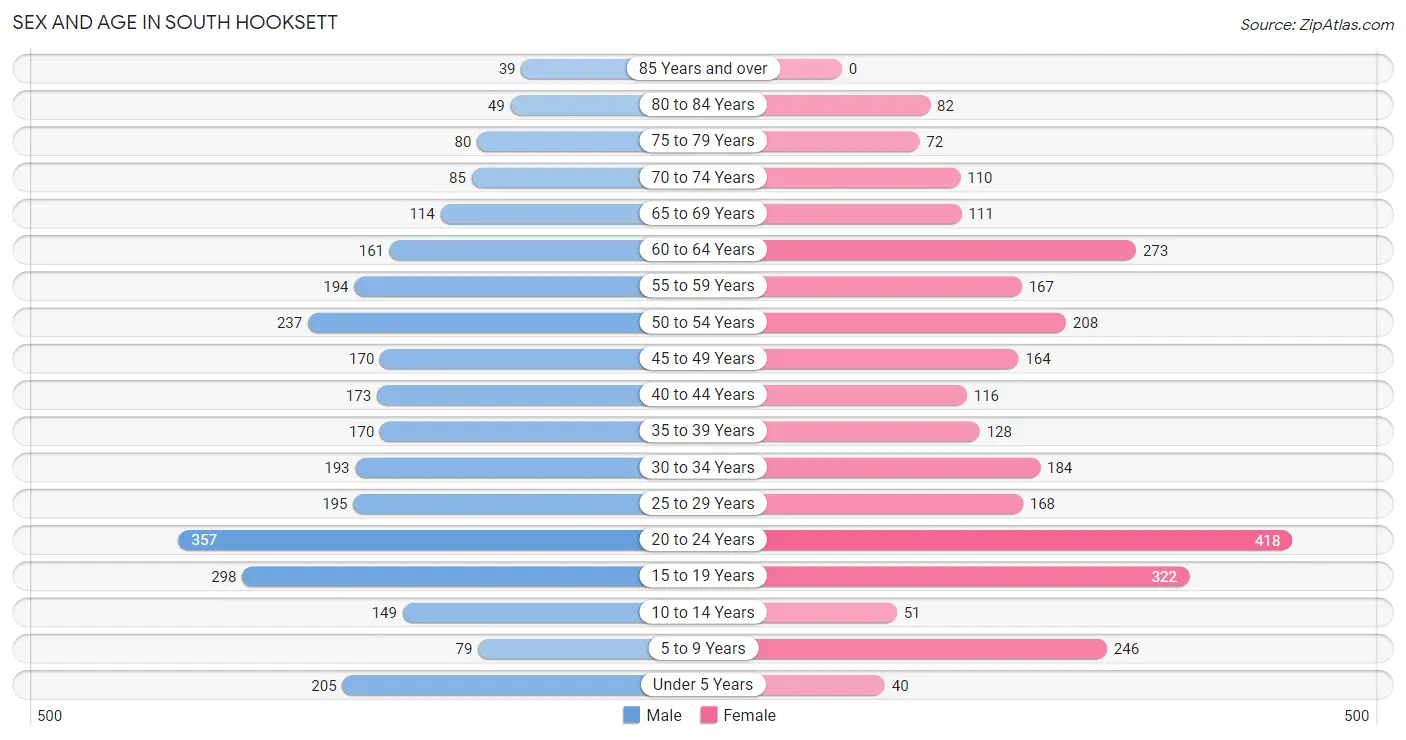
Sex and Age in South Hooksett
Sex and Age in South Hooksett
The most populous age groups in South Hooksett are 20 to 24 Years (357 | 12.1%) for men and 20 to 24 Years (418 | 14.6%) for women.
| Age Bracket | Male | Female |
| Under 5 Years | 205 (7.0%) | 40 (1.4%) |
| 5 to 9 Years | 79 (2.7%) | 246 (8.6%) |
| 10 to 14 Years | 149 (5.1%) | 51 (1.8%) |
| 15 to 19 Years | 298 (10.1%) | 322 (11.3%) |
| 20 to 24 Years | 357 (12.1%) | 418 (14.6%) |
| 25 to 29 Years | 195 (6.6%) | 168 (5.9%) |
| 30 to 34 Years | 193 (6.6%) | 184 (6.4%) |
| 35 to 39 Years | 170 (5.8%) | 128 (4.5%) |
| 40 to 44 Years | 173 (5.9%) | 116 (4.1%) |
| 45 to 49 Years | 170 (5.8%) | 164 (5.7%) |
| 50 to 54 Years | 237 (8.0%) | 208 (7.3%) |
| 55 to 59 Years | 194 (6.6%) | 167 (5.8%) |
| 60 to 64 Years | 161 (5.5%) | 273 (9.6%) |
| 65 to 69 Years | 114 (3.9%) | 111 (3.9%) |
| 70 to 74 Years | 85 (2.9%) | 110 (3.8%) |
| 75 to 79 Years | 80 (2.7%) | 72 (2.5%) |
| 80 to 84 Years | 49 (1.7%) | 82 (2.9%) |
| 85 Years and over | 39 (1.3%) | 0 (0.0%) |
| Total | 2,948 (100.0%) | 2,860 (100.0%) |
Families and Households in South Hooksett
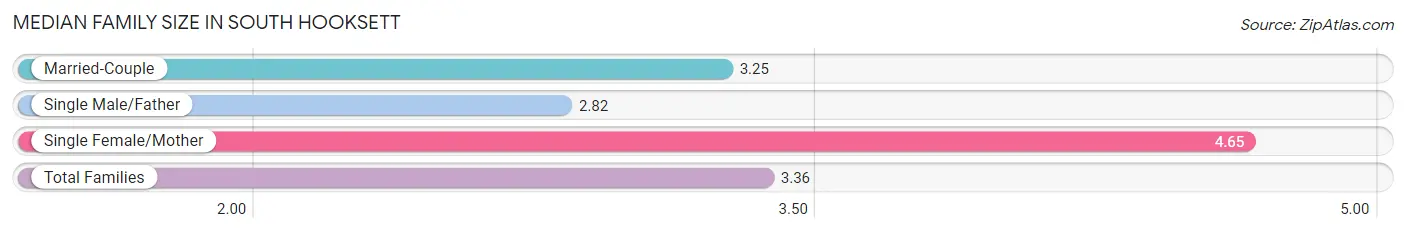
Median Family Size in South Hooksett
The median family size in South Hooksett is 3.36 persons per family, with single female/mother families (125 | 9.7%) accounting for the largest median family size of 4.65 persons per family. On the other hand, single male/father families (65 | 5.0%) represent the smallest median family size with 2.82 persons per family.
| Family Type | # Families | Family Size |
| Married-Couple | 1,100 (85.3%) | 3.25 |
| Single Male/Father | 65 (5.0%) | 2.82 |
| Single Female/Mother | 125 (9.7%) | 4.65 |
| Total Families | 1,290 (100.0%) | 3.36 |
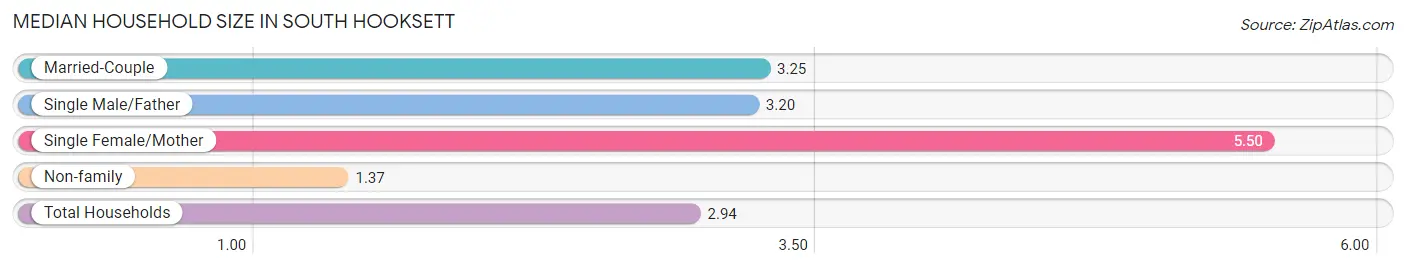
Median Household Size in South Hooksett
The median household size in South Hooksett is 2.94 persons per household, with single female/mother households (125 | 7.2%) accounting for the largest median household size of 5.5 persons per household. non-family households (437 | 25.3%) represent the smallest median household size with 1.37 persons per household.
| Household Type | # Households | Household Size |
| Married-Couple | 1,100 (63.7%) | 3.25 |
| Single Male/Father | 65 (3.8%) | 3.20 |
| Single Female/Mother | 125 (7.2%) | 5.50 |
| Non-family | 437 (25.3%) | 1.37 |
| Total Households | 1,727 (100.0%) | 2.94 |
Household Size by Marriage Status in South Hooksett
Out of a total of 1,727 households in South Hooksett, 1,290 (74.7%) are family households, while 437 (25.3%) are nonfamily households. The most numerous type of family households are 2-person households, comprising 483, and the most common type of nonfamily households are 1-person households, comprising 308.
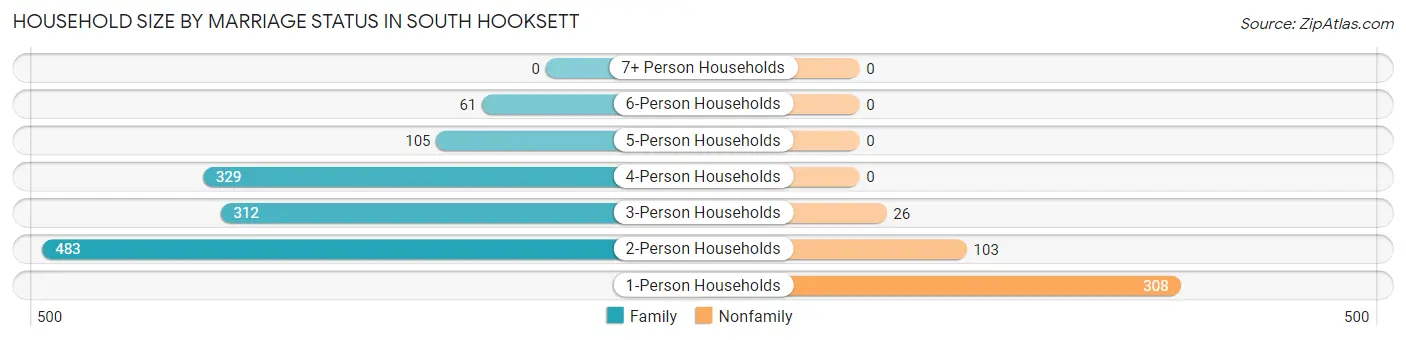
| Household Size | Family Households | Nonfamily Households |
| 1-Person Households | - | 308 (17.8%) |
| 2-Person Households | 483 (28.0%) | 103 (6.0%) |
| 3-Person Households | 312 (18.1%) | 26 (1.5%) |
| 4-Person Households | 329 (19.1%) | 0 (0.0%) |
| 5-Person Households | 105 (6.1%) | 0 (0.0%) |
| 6-Person Households | 61 (3.5%) | 0 (0.0%) |
| 7+ Person Households | 0 (0.0%) | 0 (0.0%) |
| Total | 1,290 (74.7%) | 437 (25.3%) |
Female Fertility in South Hooksett
Fertility by Age in South Hooksett
Average fertility rate in South Hooksett is 36.0 births per 1,000 women. Women in the age bracket of 20 to 34 years have the highest fertility rate with 74.0 births per 1,000 women. Women in the age bracket of 20 to 34 years acount for 100.0% of all women with births.
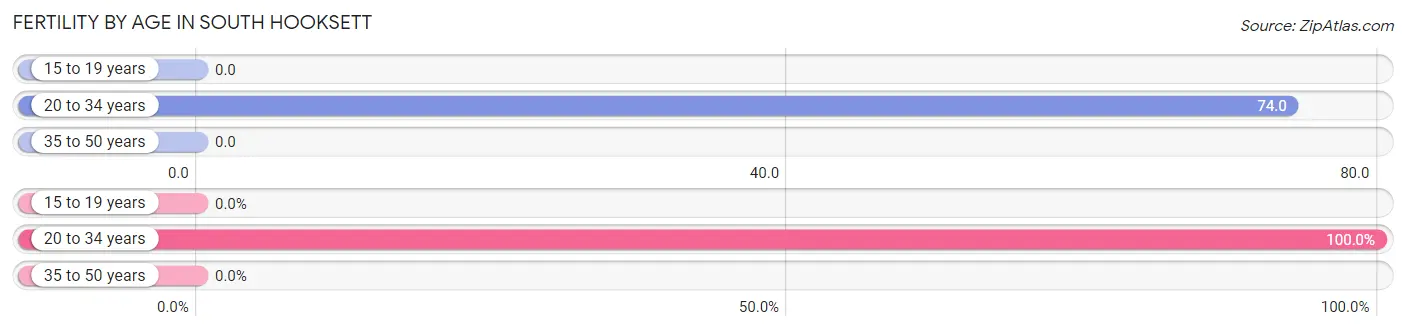
| Age Bracket | Women with Births | Births / 1,000 Women |
| 15 to 19 years | 0 (0.0%) | 0.0 |
| 20 to 34 years | 57 (100.0%) | 74.0 |
| 35 to 50 years | 0 (0.0%) | 0.0 |
| Total | 57 (100.0%) | 36.0 |
Fertility by Age by Marriage Status in South Hooksett
57.9% of women with births (57) in South Hooksett are married. The highest percentage of unmarried women with births falls into 20 to 34 years age bracket with 42.1% of them unmarried at the time of birth, while the lowest percentage of unmarried women with births belong to 20 to 34 years age bracket with 42.1% of them unmarried.
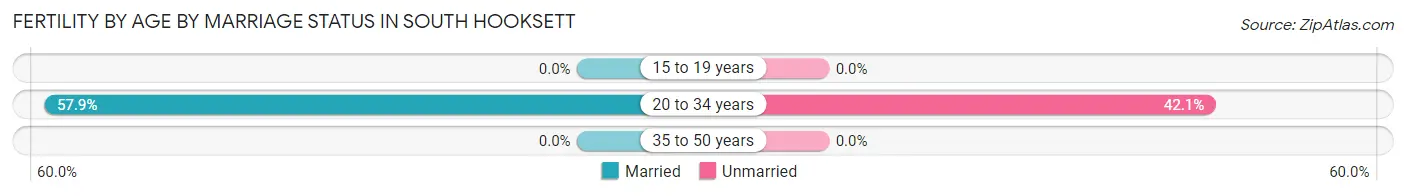
| Age Bracket | Married | Unmarried |
| 15 to 19 years | 0 (0.0%) | 0 (0.0%) |
| 20 to 34 years | 33 (57.9%) | 24 (42.1%) |
| 35 to 50 years | 0 (0.0%) | 0 (0.0%) |
| Total | 33 (57.9%) | 24 (42.1%) |
Fertility by Education in South Hooksett
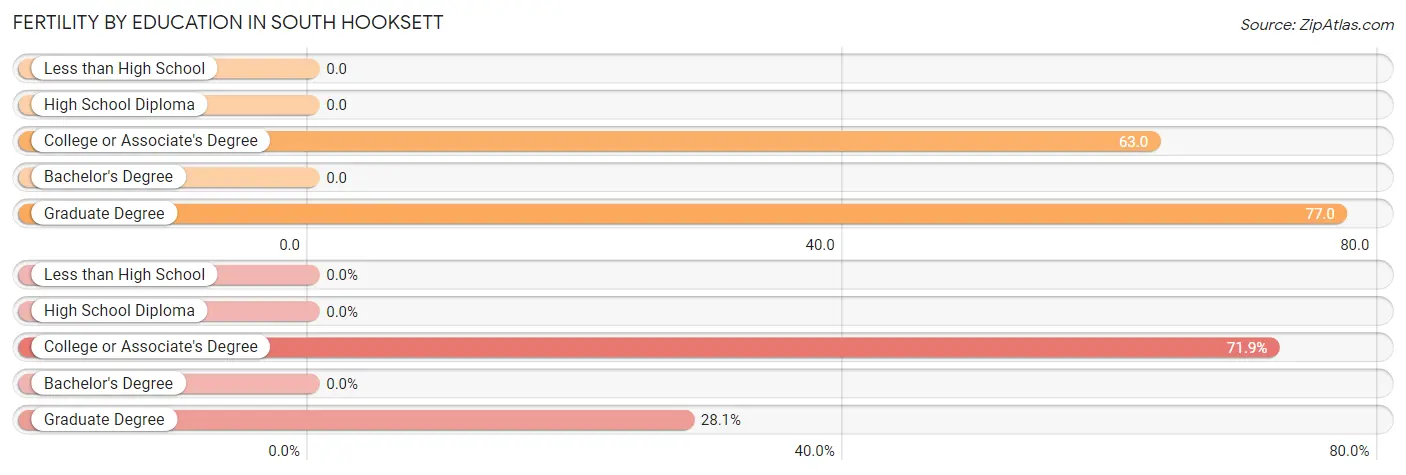
| Educational Attainment | Women with Births | Births / 1,000 Women |
| Less than High School | 0 (0.0%) | 0.0 |
| High School Diploma | 0 (0.0%) | 0.0 |
| College or Associate's Degree | 41 (71.9%) | 63.0 |
| Bachelor's Degree | 0 (0.0%) | 0.0 |
| Graduate Degree | 16 (28.1%) | 77.0 |
| Total | 57 (100.0%) | 36.0 |
Fertility by Education by Marriage Status in South Hooksett
42.1% of women with births in South Hooksett are unmarried. Women with the educational attainment of graduate degree are most likely to be married with 100.0% of them married at childbirth, while women with the educational attainment of college or associate's degree are least likely to be married with 58.5% of them unmarried at childbirth.
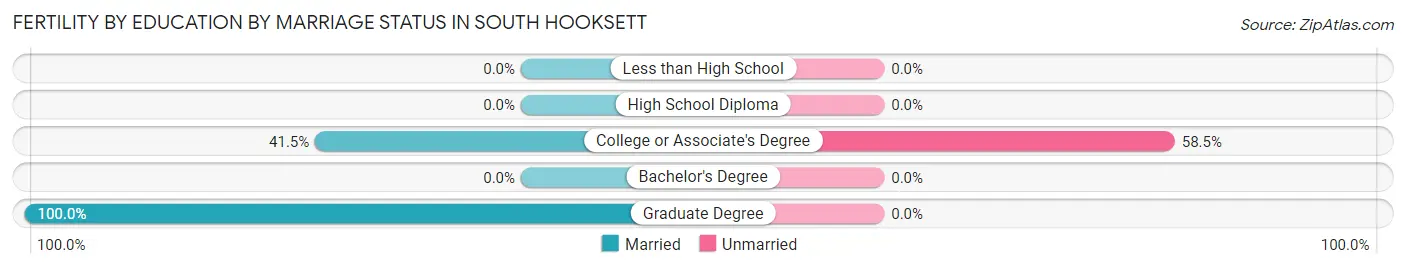
| Educational Attainment | Married | Unmarried |
| Less than High School | 0 (0.0%) | 0 (0.0%) |
| High School Diploma | 0 (0.0%) | 0 (0.0%) |
| College or Associate's Degree | 17 (41.5%) | 24 (58.5%) |
| Bachelor's Degree | 0 (0.0%) | 0 (0.0%) |
| Graduate Degree | 16 (100.0%) | 0 (0.0%) |
| Total | 33 (57.9%) | 24 (42.1%) |
Employment Characteristics in South Hooksett
Employment by Class of Employer in South Hooksett
Among the 3,268 employed individuals in South Hooksett, private company employees (2,392 | 73.2%), not-for-profit organizations (324 | 9.9%), and local government employees (243 | 7.4%) make up the most common classes of employment.
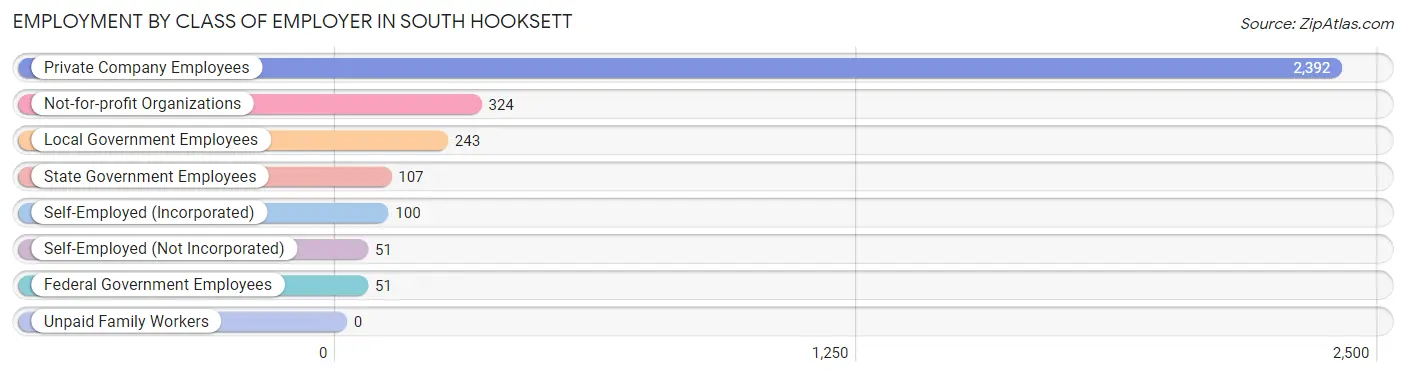
| Employer Class | # Employees | % Employees |
| Private Company Employees | 2,392 | 73.2% |
| Self-Employed (Incorporated) | 100 | 3.1% |
| Self-Employed (Not Incorporated) | 51 | 1.6% |
| Not-for-profit Organizations | 324 | 9.9% |
| Local Government Employees | 243 | 7.4% |
| State Government Employees | 107 | 3.3% |
| Federal Government Employees | 51 | 1.6% |
| Unpaid Family Workers | 0 | 0.0% |
| Total | 3,268 | 100.0% |
Employment Status by Age in South Hooksett
According to the labor force statistics for South Hooksett, out of the total population over 16 years of age (4,984), 69.3% or 3,454 individuals are in the labor force, with 3.9% or 135 of them unemployed. The age group with the highest labor force participation rate is 35 to 44 years, with 96.8% or 568 individuals in the labor force. Within the labor force, the 25 to 29 years age range has the highest percentage of unemployed individuals, with 13.8% or 48 of them being unemployed.
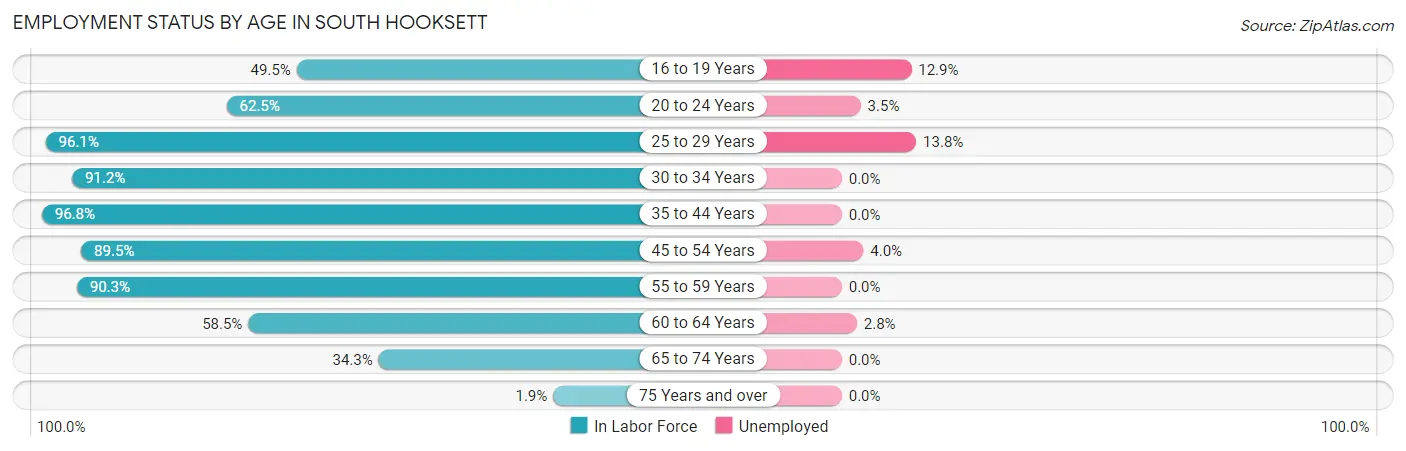
| Age Bracket | In Labor Force | Unemployed |
| 16 to 19 Years | 280 (49.5%) | 36 (12.9%) |
| 20 to 24 Years | 484 (62.5%) | 17 (3.5%) |
| 25 to 29 Years | 349 (96.1%) | 48 (13.8%) |
| 30 to 34 Years | 344 (91.2%) | 0 (0.0%) |
| 35 to 44 Years | 568 (96.8%) | 0 (0.0%) |
| 45 to 54 Years | 697 (89.5%) | 28 (4.0%) |
| 55 to 59 Years | 326 (90.3%) | 0 (0.0%) |
| 60 to 64 Years | 254 (58.5%) | 7 (2.8%) |
| 65 to 74 Years | 144 (34.3%) | 0 (0.0%) |
| 75 Years and over | 6 (1.9%) | 0 (0.0%) |
| Total | 3,454 (69.3%) | 135 (3.9%) |
Employment Status by Educational Attainment in South Hooksett
According to labor force statistics for South Hooksett, 87.5% of individuals (2,538) out of the total population between 25 and 64 years of age (2,901) are in the labor force, with 3.3% or 84 of them being unemployed. The group with the highest labor force participation rate are those with the educational attainment of bachelor's degree or higher, with 94.3% or 1,199 individuals in the labor force. Within the labor force, individuals with high school diploma education have the highest percentage of unemployment, with 13.5% or 76 of them being unemployed.
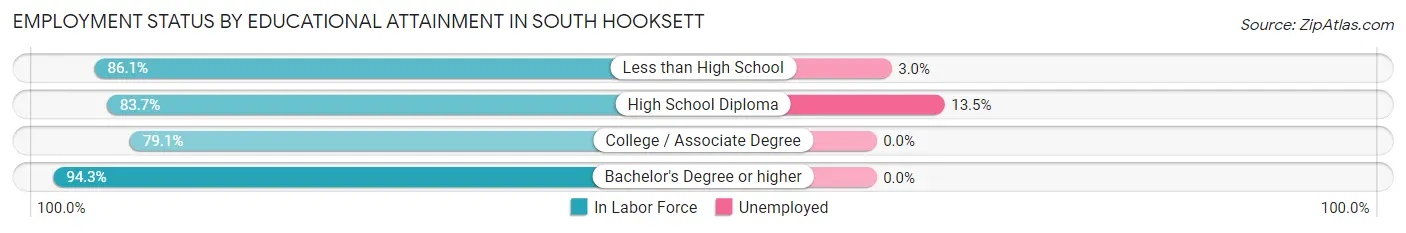
| Educational Attainment | In Labor Force | Unemployed |
| Less than High School | 236 (86.1%) | 8 (3.0%) |
| High School Diploma | 561 (83.7%) | 90 (13.5%) |
| College / Associate Degree | 542 (79.1%) | 0 (0.0%) |
| Bachelor's Degree or higher | 1,199 (94.3%) | 0 (0.0%) |
| Total | 2,538 (87.5%) | 96 (3.3%) |
Employment Occupations by Sex in South Hooksett
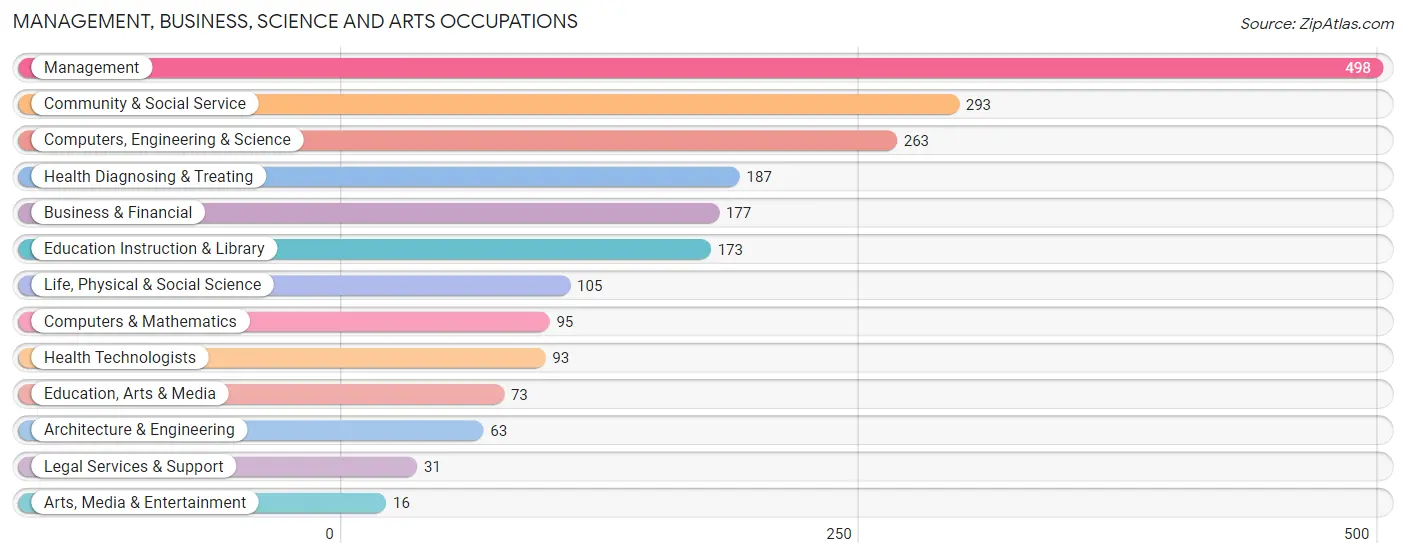
Management, Business, Science and Arts Occupations
The most common Management, Business, Science and Arts occupations in South Hooksett are Management (498 | 15.0%), Community & Social Service (293 | 8.8%), Computers, Engineering & Science (263 | 7.9%), Health Diagnosing & Treating (187 | 5.6%), and Business & Financial (177 | 5.3%).
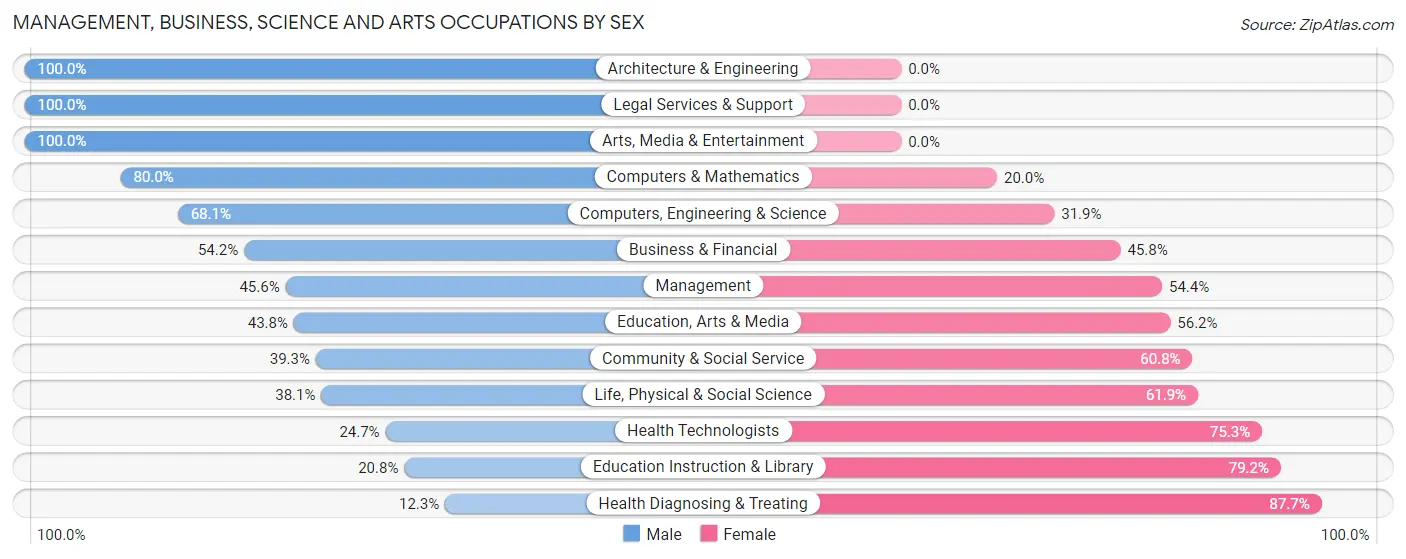
Management, Business, Science and Arts Occupations by Sex
Within the Management, Business, Science and Arts occupations in South Hooksett, the most male-oriented occupations are Architecture & Engineering (100.0%), Legal Services & Support (100.0%), and Arts, Media & Entertainment (100.0%), while the most female-oriented occupations are Health Diagnosing & Treating (87.7%), Education Instruction & Library (79.2%), and Health Technologists (75.3%).
| Occupation | Male | Female |
| Management | 227 (45.6%) | 271 (54.4%) |
| Business & Financial | 96 (54.2%) | 81 (45.8%) |
| Computers, Engineering & Science | 179 (68.1%) | 84 (31.9%) |
| Computers & Mathematics | 76 (80.0%) | 19 (20.0%) |
| Architecture & Engineering | 63 (100.0%) | 0 (0.0%) |
| Life, Physical & Social Science | 40 (38.1%) | 65 (61.9%) |
| Community & Social Service | 115 (39.3%) | 178 (60.8%) |
| Education, Arts & Media | 32 (43.8%) | 41 (56.2%) |
| Legal Services & Support | 31 (100.0%) | 0 (0.0%) |
| Education Instruction & Library | 36 (20.8%) | 137 (79.2%) |
| Arts, Media & Entertainment | 16 (100.0%) | 0 (0.0%) |
| Health Diagnosing & Treating | 23 (12.3%) | 164 (87.7%) |
| Health Technologists | 23 (24.7%) | 70 (75.3%) |
| Total (Category) | 640 (45.1%) | 778 (54.9%) |
| Total (Overall) | 1,650 (49.8%) | 1,666 (50.2%) |
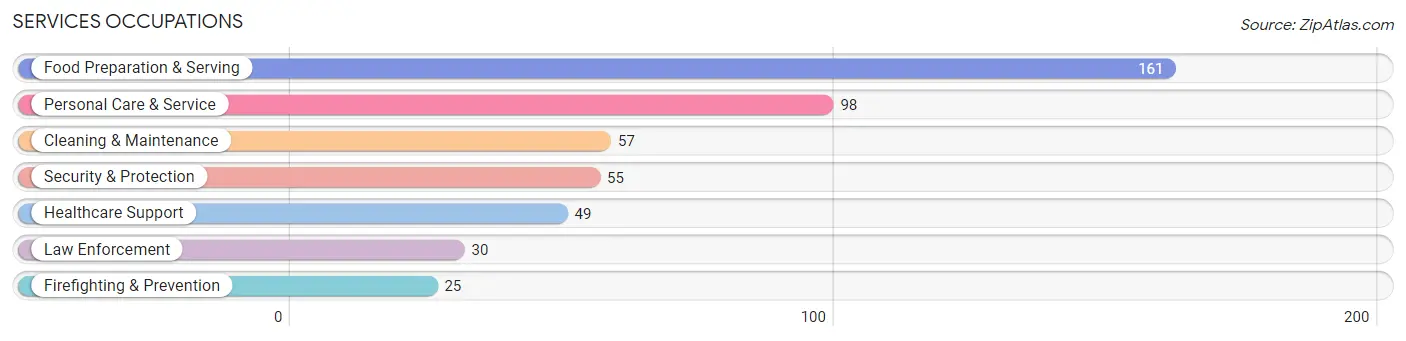
Services Occupations
The most common Services occupations in South Hooksett are Food Preparation & Serving (161 | 4.9%), Personal Care & Service (98 | 3.0%), Cleaning & Maintenance (57 | 1.7%), Security & Protection (55 | 1.7%), and Healthcare Support (49 | 1.5%).
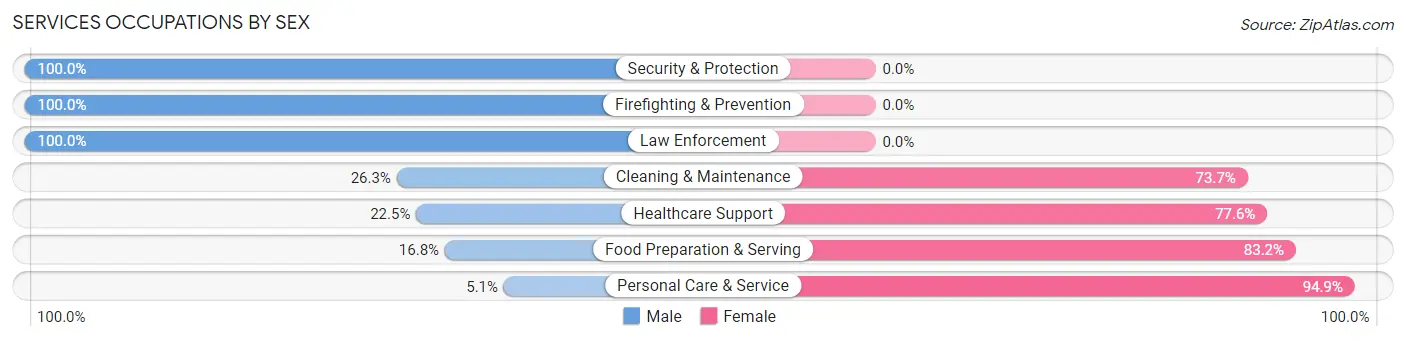
Services Occupations by Sex
Within the Services occupations in South Hooksett, the most male-oriented occupations are Security & Protection (100.0%), Firefighting & Prevention (100.0%), and Law Enforcement (100.0%), while the most female-oriented occupations are Personal Care & Service (94.9%), Food Preparation & Serving (83.2%), and Healthcare Support (77.5%).
| Occupation | Male | Female |
| Healthcare Support | 11 (22.5%) | 38 (77.5%) |
| Security & Protection | 55 (100.0%) | 0 (0.0%) |
| Firefighting & Prevention | 25 (100.0%) | 0 (0.0%) |
| Law Enforcement | 30 (100.0%) | 0 (0.0%) |
| Food Preparation & Serving | 27 (16.8%) | 134 (83.2%) |
| Cleaning & Maintenance | 15 (26.3%) | 42 (73.7%) |
| Personal Care & Service | 5 (5.1%) | 93 (94.9%) |
| Total (Category) | 113 (26.9%) | 307 (73.1%) |
| Total (Overall) | 1,650 (49.8%) | 1,666 (50.2%) |
Sales and Office Occupations
The most common Sales and Office occupations in South Hooksett are Sales & Related (388 | 11.7%), and Office & Administration (344 | 10.4%).
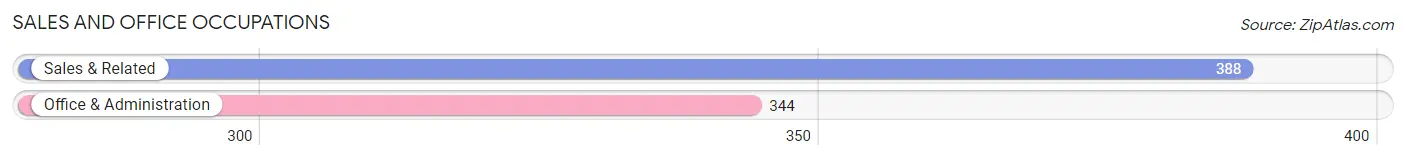
Sales and Office Occupations by Sex
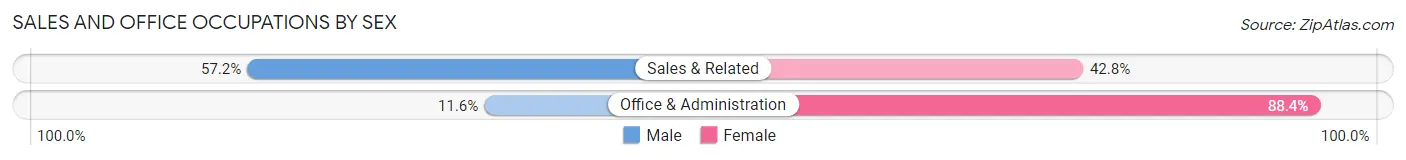
| Occupation | Male | Female |
| Sales & Related | 222 (57.2%) | 166 (42.8%) |
| Office & Administration | 40 (11.6%) | 304 (88.4%) |
| Total (Category) | 262 (35.8%) | 470 (64.2%) |
| Total (Overall) | 1,650 (49.8%) | 1,666 (50.2%) |
Natural Resources, Construction and Maintenance Occupations
The most common Natural Resources, Construction and Maintenance occupations in South Hooksett are Construction & Extraction (241 | 7.3%), and Installation, Maintenance & Repair (55 | 1.7%).
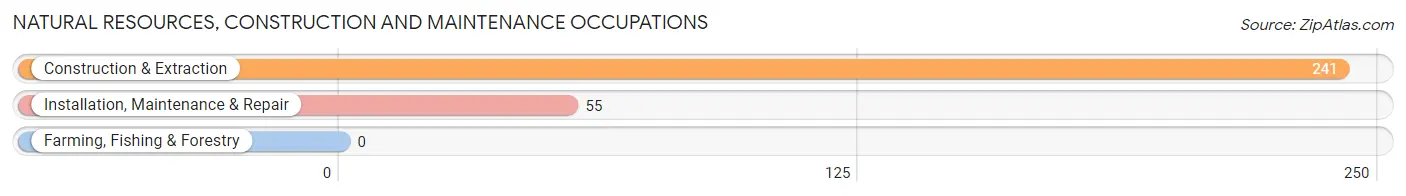
Natural Resources, Construction and Maintenance Occupations by Sex
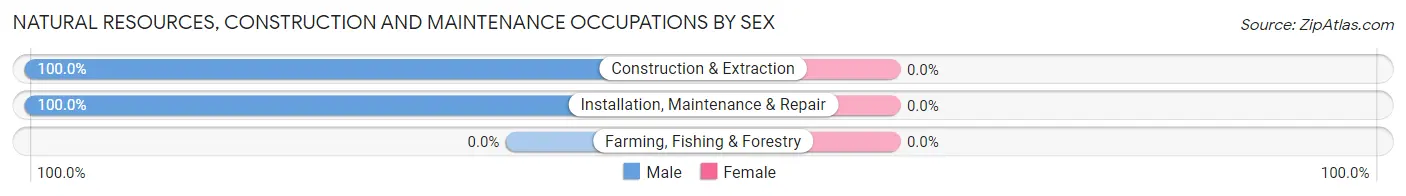
| Occupation | Male | Female |
| Farming, Fishing & Forestry | 0 (0.0%) | 0 (0.0%) |
| Construction & Extraction | 241 (100.0%) | 0 (0.0%) |
| Installation, Maintenance & Repair | 55 (100.0%) | 0 (0.0%) |
| Total (Category) | 296 (100.0%) | 0 (0.0%) |
| Total (Overall) | 1,650 (49.8%) | 1,666 (50.2%) |
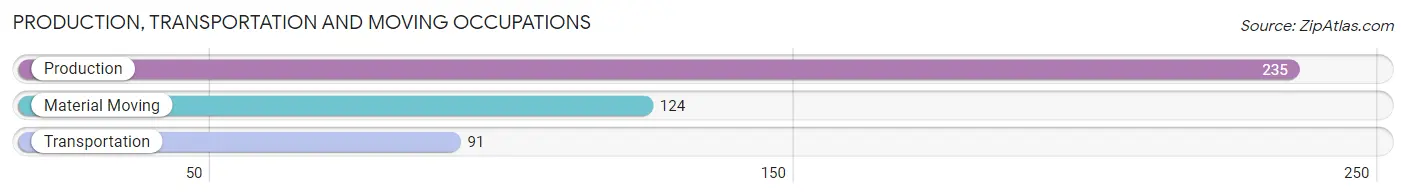
Production, Transportation and Moving Occupations
The most common Production, Transportation and Moving occupations in South Hooksett are Production (235 | 7.1%), Material Moving (124 | 3.7%), and Transportation (91 | 2.7%).
Production, Transportation and Moving Occupations by Sex
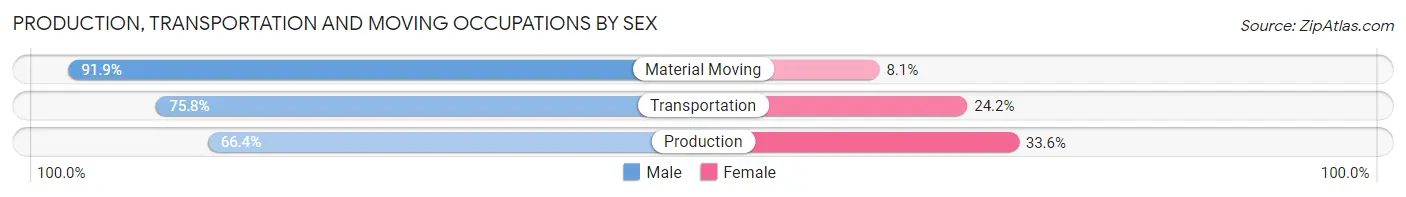
| Occupation | Male | Female |
| Production | 156 (66.4%) | 79 (33.6%) |
| Transportation | 69 (75.8%) | 22 (24.2%) |
| Material Moving | 114 (91.9%) | 10 (8.1%) |
| Total (Category) | 339 (75.3%) | 111 (24.7%) |
| Total (Overall) | 1,650 (49.8%) | 1,666 (50.2%) |
Employment Industries by Sex in South Hooksett
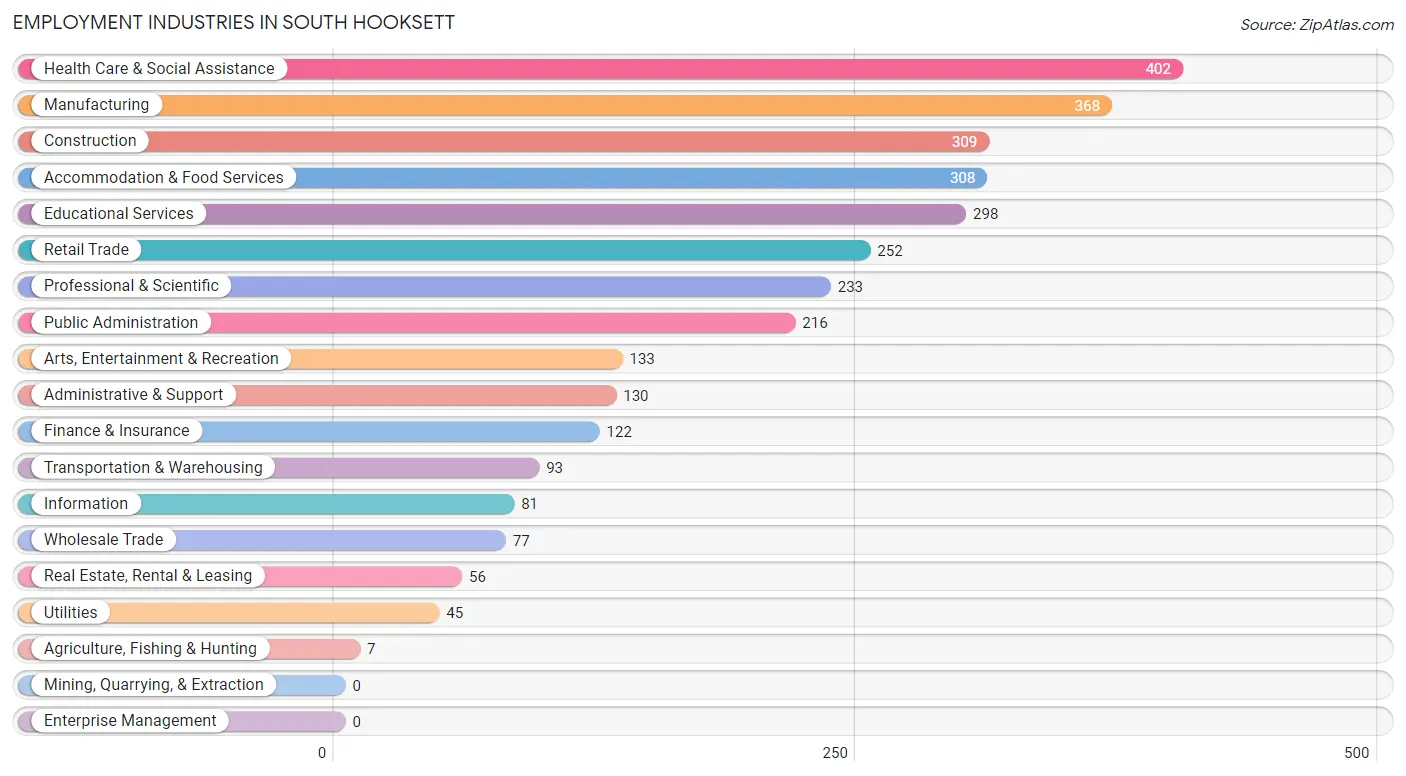
Employment Industries in South Hooksett
The major employment industries in South Hooksett include Health Care & Social Assistance (402 | 12.1%), Manufacturing (368 | 11.1%), Construction (309 | 9.3%), Accommodation & Food Services (308 | 9.3%), and Educational Services (298 | 9.0%).
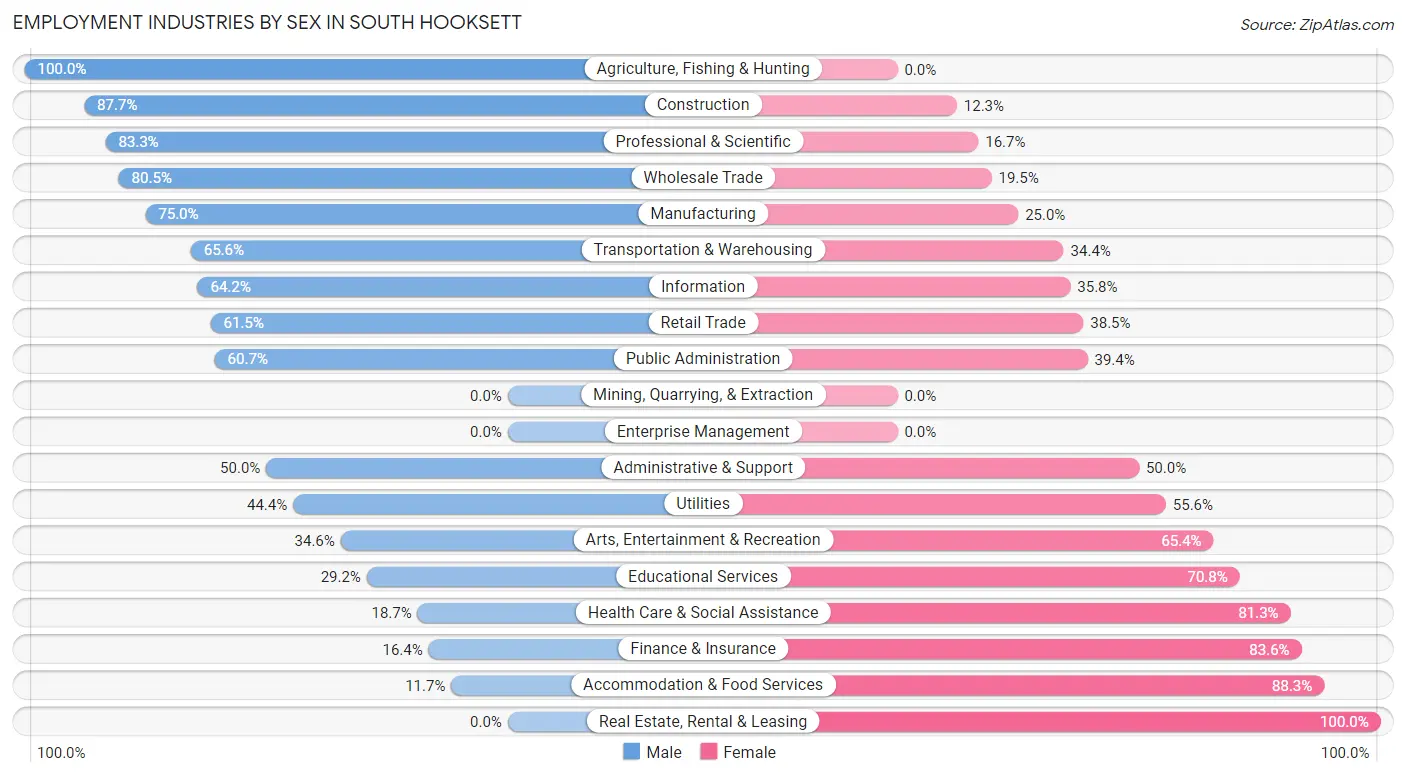
Employment Industries by Sex in South Hooksett
The South Hooksett industries that see more men than women are Agriculture, Fishing & Hunting (100.0%), Construction (87.7%), and Professional & Scientific (83.3%), whereas the industries that tend to have a higher number of women are Real Estate, Rental & Leasing (100.0%), Accommodation & Food Services (88.3%), and Finance & Insurance (83.6%).
| Industry | Male | Female |
| Agriculture, Fishing & Hunting | 7 (100.0%) | 0 (0.0%) |
| Mining, Quarrying, & Extraction | 0 (0.0%) | 0 (0.0%) |
| Construction | 271 (87.7%) | 38 (12.3%) |
| Manufacturing | 276 (75.0%) | 92 (25.0%) |
| Wholesale Trade | 62 (80.5%) | 15 (19.5%) |
| Retail Trade | 155 (61.5%) | 97 (38.5%) |
| Transportation & Warehousing | 61 (65.6%) | 32 (34.4%) |
| Utilities | 20 (44.4%) | 25 (55.6%) |
| Information | 52 (64.2%) | 29 (35.8%) |
| Finance & Insurance | 20 (16.4%) | 102 (83.6%) |
| Real Estate, Rental & Leasing | 0 (0.0%) | 56 (100.0%) |
| Professional & Scientific | 194 (83.3%) | 39 (16.7%) |
| Enterprise Management | 0 (0.0%) | 0 (0.0%) |
| Administrative & Support | 65 (50.0%) | 65 (50.0%) |
| Educational Services | 87 (29.2%) | 211 (70.8%) |
| Health Care & Social Assistance | 75 (18.7%) | 327 (81.3%) |
| Arts, Entertainment & Recreation | 46 (34.6%) | 87 (65.4%) |
| Accommodation & Food Services | 36 (11.7%) | 272 (88.3%) |
| Public Administration | 131 (60.7%) | 85 (39.4%) |
| Total | 1,650 (49.8%) | 1,666 (50.2%) |
Education in South Hooksett
School Enrollment in South Hooksett
The most common levels of schooling among the 1,928 students in South Hooksett are college / undergraduate (891 | 46.2%), high school (288 | 14.9%), and elementary school (283 | 14.7%).
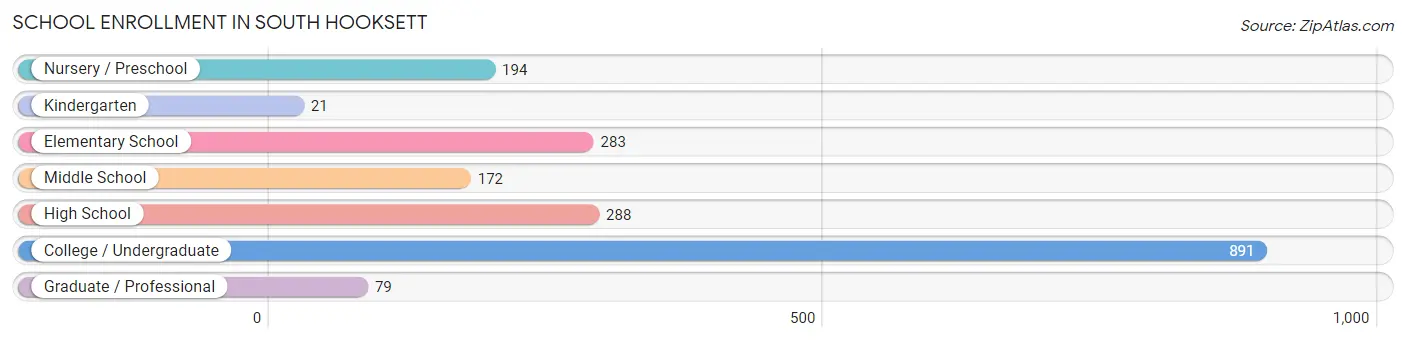
| School Level | # Students | % Students |
| Nursery / Preschool | 194 | 10.1% |
| Kindergarten | 21 | 1.1% |
| Elementary School | 283 | 14.7% |
| Middle School | 172 | 8.9% |
| High School | 288 | 14.9% |
| College / Undergraduate | 891 | 46.2% |
| Graduate / Professional | 79 | 4.1% |
| Total | 1,928 | 100.0% |
School Enrollment by Age by Funding Source in South Hooksett
Out of a total of 1,928 students who are enrolled in schools in South Hooksett, 893 (46.3%) attend a private institution, while the remaining 1,035 (53.7%) are enrolled in public schools. The age group of 3 to 4 year olds has the highest likelihood of being enrolled in private schools, with 158 (100.0% in the age bracket) enrolled. Conversely, the age group of 10 to 14 year olds has the lowest likelihood of being enrolled in a private school, with 187 (100.0% in the age bracket) attending a public institution.
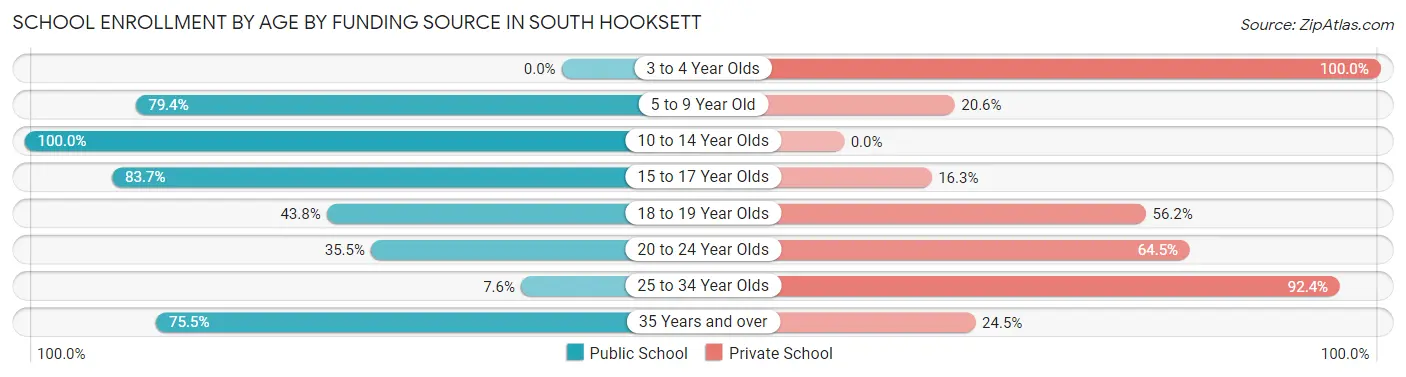
| Age Bracket | Public School | Private School |
| 3 to 4 Year Olds | 0 (0.0%) | 158 (100.0%) |
| 5 to 9 Year Old | 258 (79.4%) | 67 (20.6%) |
| 10 to 14 Year Olds | 187 (100.0%) | 0 (0.0%) |
| 15 to 17 Year Olds | 195 (83.7%) | 38 (16.3%) |
| 18 to 19 Year Olds | 158 (43.8%) | 203 (56.2%) |
| 20 to 24 Year Olds | 195 (35.5%) | 354 (64.5%) |
| 25 to 34 Year Olds | 5 (7.6%) | 61 (92.4%) |
| 35 Years and over | 37 (75.5%) | 12 (24.5%) |
| Total | 1,035 (53.7%) | 893 (46.3%) |
Educational Attainment by Field of Study in South Hooksett
Business (222 | 15.4%), engineering (187 | 13.0%), science & technology (187 | 13.0%), bio, nature & agricultural (168 | 11.7%), and education (127 | 8.8%) are the most common fields of study among 1,441 individuals in South Hooksett who have obtained a bachelor's degree or higher.
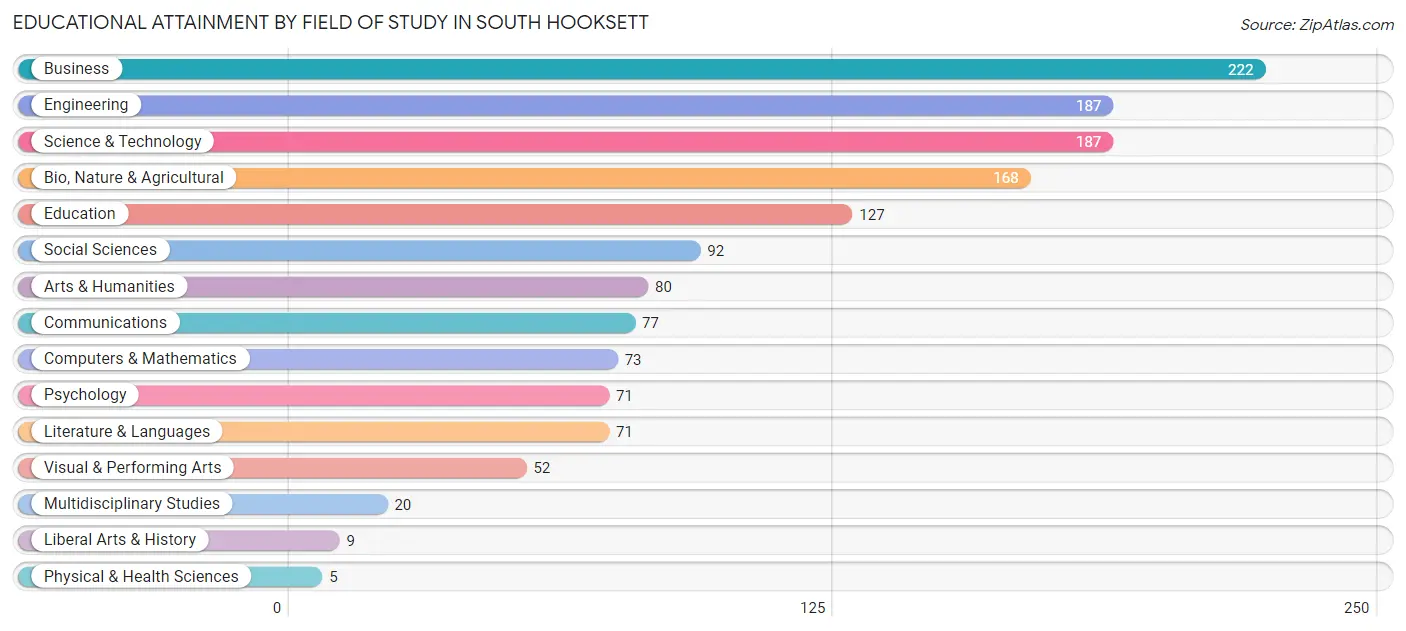
| Field of Study | # Graduates | % Graduates |
| Computers & Mathematics | 73 | 5.1% |
| Bio, Nature & Agricultural | 168 | 11.7% |
| Physical & Health Sciences | 5 | 0.4% |
| Psychology | 71 | 4.9% |
| Social Sciences | 92 | 6.4% |
| Engineering | 187 | 13.0% |
| Multidisciplinary Studies | 20 | 1.4% |
| Science & Technology | 187 | 13.0% |
| Business | 222 | 15.4% |
| Education | 127 | 8.8% |
| Literature & Languages | 71 | 4.9% |
| Liberal Arts & History | 9 | 0.6% |
| Visual & Performing Arts | 52 | 3.6% |
| Communications | 77 | 5.3% |
| Arts & Humanities | 80 | 5.6% |
| Total | 1,441 | 100.0% |
Transportation & Commute in South Hooksett
Vehicle Availability by Sex in South Hooksett
The most prevalent vehicle ownership categories in South Hooksett are males with 2 vehicles (619, accounting for 40.8%) and females with 2 vehicles (621, making up 42.5%).
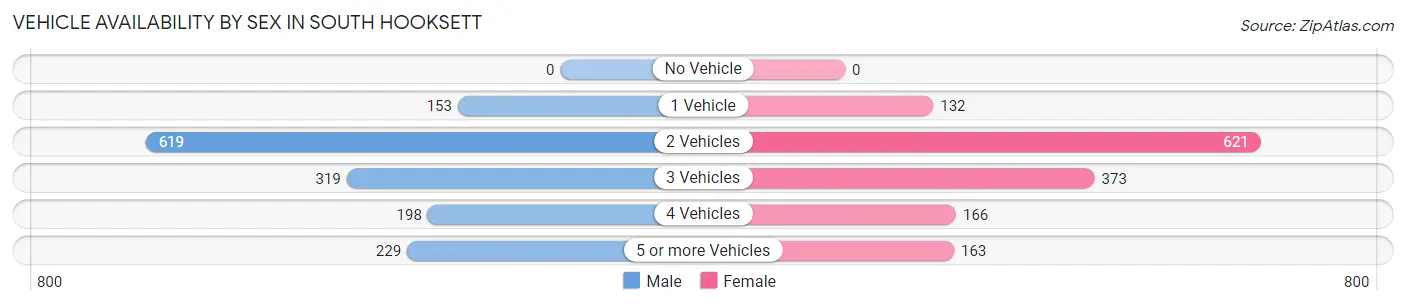
| Vehicles Available | Male | Female |
| No Vehicle | 0 (0.0%) | 0 (0.0%) |
| 1 Vehicle | 153 (10.1%) | 132 (9.1%) |
| 2 Vehicles | 619 (40.8%) | 621 (42.7%) |
| 3 Vehicles | 319 (21.0%) | 373 (25.6%) |
| 4 Vehicles | 198 (13.0%) | 166 (11.4%) |
| 5 or more Vehicles | 229 (15.1%) | 163 (11.2%) |
| Total | 1,518 (100.0%) | 1,455 (100.0%) |
Commute Time in South Hooksett
The most frequently occuring commute durations in South Hooksett are 10 to 14 minutes (662 commuters, 22.5%), 15 to 19 minutes (546 commuters, 18.6%), and 20 to 24 minutes (421 commuters, 14.3%).
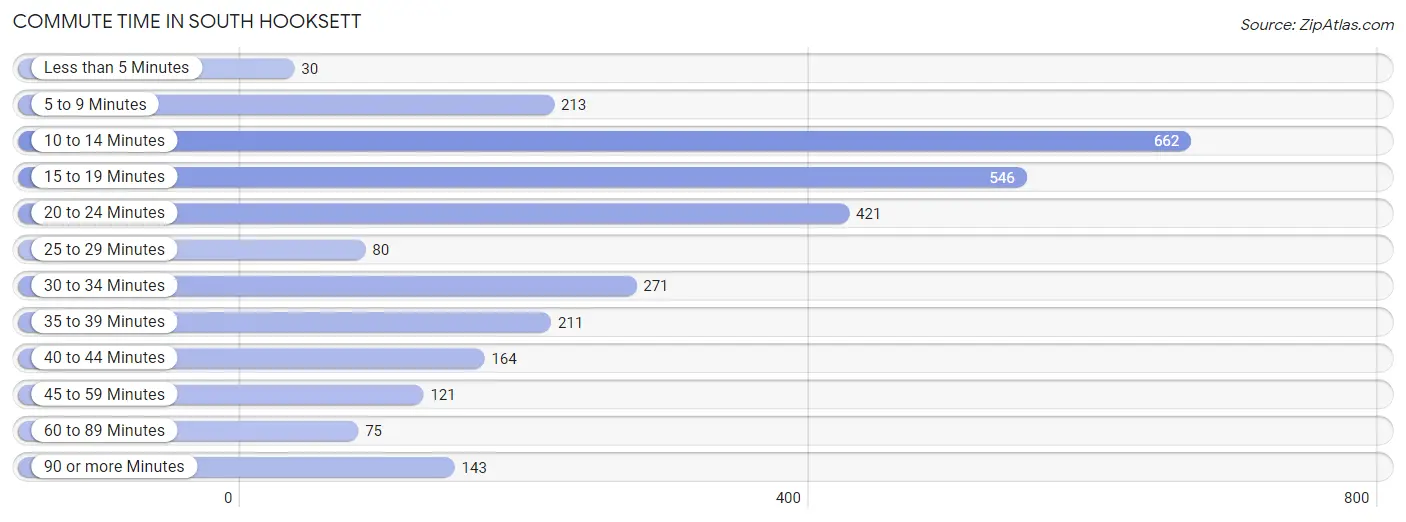
| Commute Time | # Commuters | % Commuters |
| Less than 5 Minutes | 30 | 1.0% |
| 5 to 9 Minutes | 213 | 7.2% |
| 10 to 14 Minutes | 662 | 22.5% |
| 15 to 19 Minutes | 546 | 18.6% |
| 20 to 24 Minutes | 421 | 14.3% |
| 25 to 29 Minutes | 80 | 2.7% |
| 30 to 34 Minutes | 271 | 9.2% |
| 35 to 39 Minutes | 211 | 7.2% |
| 40 to 44 Minutes | 164 | 5.6% |
| 45 to 59 Minutes | 121 | 4.1% |
| 60 to 89 Minutes | 75 | 2.5% |
| 90 or more Minutes | 143 | 4.9% |
Commute Time by Sex in South Hooksett
The most common commute times in South Hooksett are 10 to 14 minutes (279 commuters, 18.1%) for males and 10 to 14 minutes (383 commuters, 27.5%) for females.
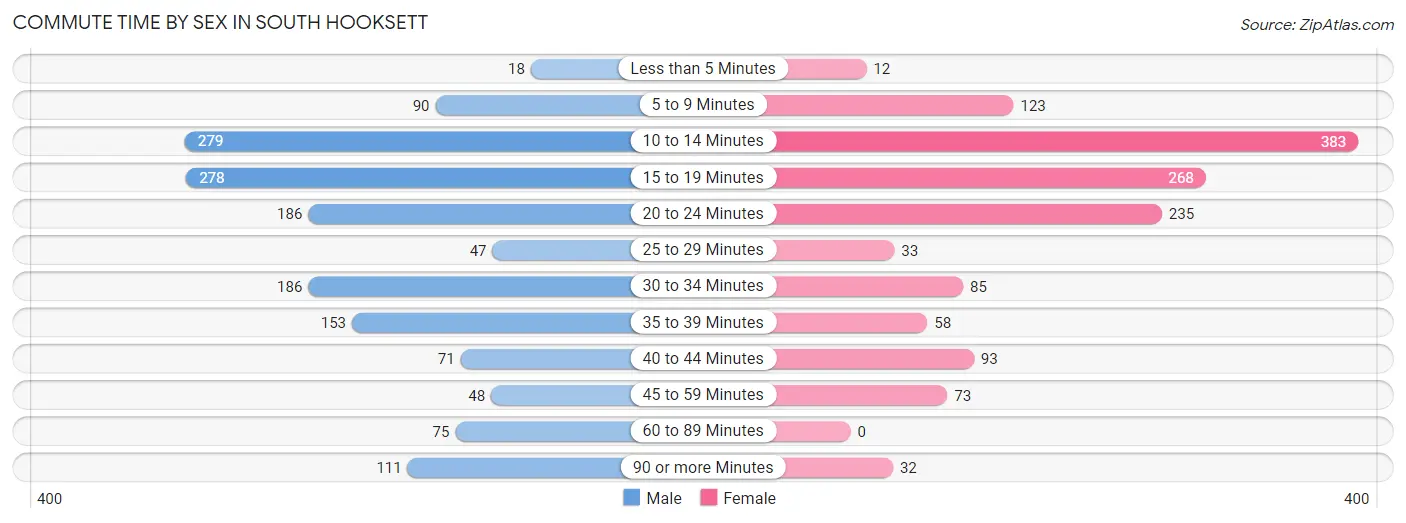
| Commute Time | Male | Female |
| Less than 5 Minutes | 18 (1.2%) | 12 (0.9%) |
| 5 to 9 Minutes | 90 (5.8%) | 123 (8.8%) |
| 10 to 14 Minutes | 279 (18.1%) | 383 (27.5%) |
| 15 to 19 Minutes | 278 (18.0%) | 268 (19.2%) |
| 20 to 24 Minutes | 186 (12.1%) | 235 (16.9%) |
| 25 to 29 Minutes | 47 (3.0%) | 33 (2.4%) |
| 30 to 34 Minutes | 186 (12.1%) | 85 (6.1%) |
| 35 to 39 Minutes | 153 (9.9%) | 58 (4.2%) |
| 40 to 44 Minutes | 71 (4.6%) | 93 (6.7%) |
| 45 to 59 Minutes | 48 (3.1%) | 73 (5.2%) |
| 60 to 89 Minutes | 75 (4.9%) | 0 (0.0%) |
| 90 or more Minutes | 111 (7.2%) | 32 (2.3%) |
Time of Departure to Work by Sex in South Hooksett
The most frequent times of departure to work in South Hooksett are 7:00 AM to 7:29 AM (256, 16.6%) for males and 7:00 AM to 7:29 AM (180, 12.9%) for females.
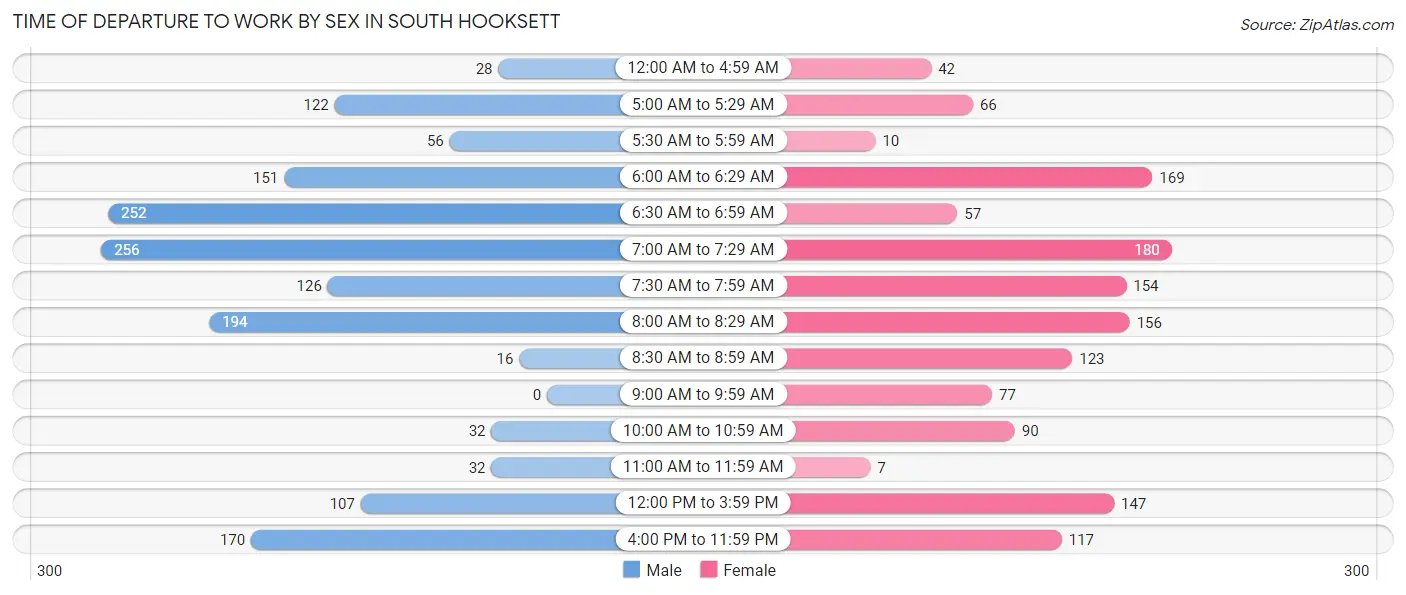
| Time of Departure | Male | Female |
| 12:00 AM to 4:59 AM | 28 (1.8%) | 42 (3.0%) |
| 5:00 AM to 5:29 AM | 122 (7.9%) | 66 (4.7%) |
| 5:30 AM to 5:59 AM | 56 (3.6%) | 10 (0.7%) |
| 6:00 AM to 6:29 AM | 151 (9.8%) | 169 (12.1%) |
| 6:30 AM to 6:59 AM | 252 (16.3%) | 57 (4.1%) |
| 7:00 AM to 7:29 AM | 256 (16.6%) | 180 (12.9%) |
| 7:30 AM to 7:59 AM | 126 (8.2%) | 154 (11.0%) |
| 8:00 AM to 8:29 AM | 194 (12.6%) | 156 (11.2%) |
| 8:30 AM to 8:59 AM | 16 (1.0%) | 123 (8.8%) |
| 9:00 AM to 9:59 AM | 0 (0.0%) | 77 (5.5%) |
| 10:00 AM to 10:59 AM | 32 (2.1%) | 90 (6.5%) |
| 11:00 AM to 11:59 AM | 32 (2.1%) | 7 (0.5%) |
| 12:00 PM to 3:59 PM | 107 (6.9%) | 147 (10.5%) |
| 4:00 PM to 11:59 PM | 170 (11.0%) | 117 (8.4%) |
| Total | 1,542 (100.0%) | 1,395 (100.0%) |
Housing Occupancy in South Hooksett
Occupancy by Ownership in South Hooksett
Of the total 1,727 dwellings in South Hooksett, owner-occupied units account for 1,469 (85.1%), while renter-occupied units make up 258 (14.9%).
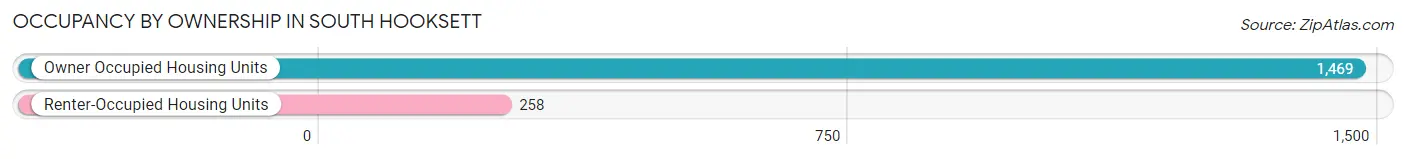
| Occupancy | # Housing Units | % Housing Units |
| Owner Occupied Housing Units | 1,469 | 85.1% |
| Renter-Occupied Housing Units | 258 | 14.9% |
| Total Occupied Housing Units | 1,727 | 100.0% |
Occupancy by Household Size in South Hooksett
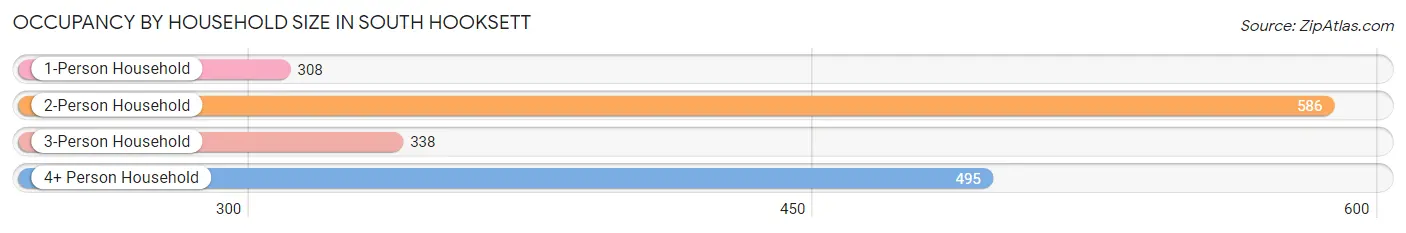
| Household Size | # Housing Units | % Housing Units |
| 1-Person Household | 308 | 17.8% |
| 2-Person Household | 586 | 33.9% |
| 3-Person Household | 338 | 19.6% |
| 4+ Person Household | 495 | 28.7% |
| Total Housing Units | 1,727 | 100.0% |
Occupancy by Ownership by Household Size in South Hooksett
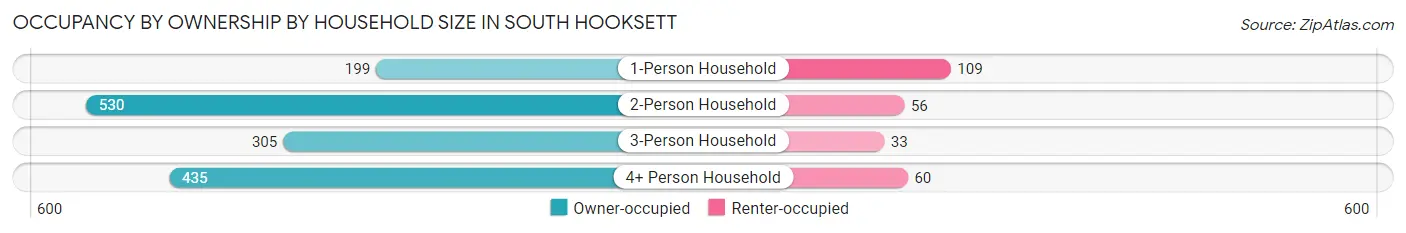
| Household Size | Owner-occupied | Renter-occupied |
| 1-Person Household | 199 (64.6%) | 109 (35.4%) |
| 2-Person Household | 530 (90.4%) | 56 (9.6%) |
| 3-Person Household | 305 (90.2%) | 33 (9.8%) |
| 4+ Person Household | 435 (87.9%) | 60 (12.1%) |
| Total Housing Units | 1,469 (85.1%) | 258 (14.9%) |
Occupancy by Educational Attainment in South Hooksett
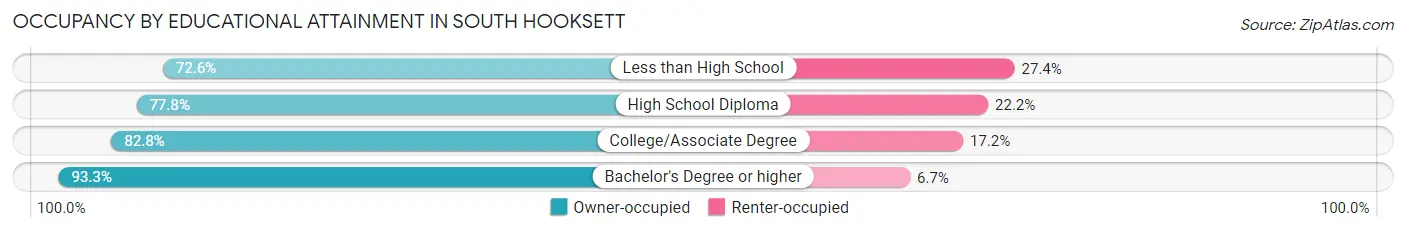
| Household Size | Owner-occupied | Renter-occupied |
| Less than High School | 82 (72.6%) | 31 (27.4%) |
| High School Diploma | 277 (77.8%) | 79 (22.2%) |
| College/Associate Degree | 500 (82.8%) | 104 (17.2%) |
| Bachelor's Degree or higher | 610 (93.3%) | 44 (6.7%) |
Occupancy by Age of Householder in South Hooksett

| Age Bracket | # Households | % Households |
| Under 35 Years | 201 | 11.6% |
| 35 to 44 Years | 226 | 13.1% |
| 45 to 54 Years | 389 | 22.5% |
| 55 to 64 Years | 489 | 28.3% |
| 65 to 74 Years | 233 | 13.5% |
| 75 to 84 Years | 150 | 8.7% |
| 85 Years and Over | 39 | 2.3% |
| Total | 1,727 | 100.0% |
Housing Finances in South Hooksett
Median Income by Occupancy in South Hooksett
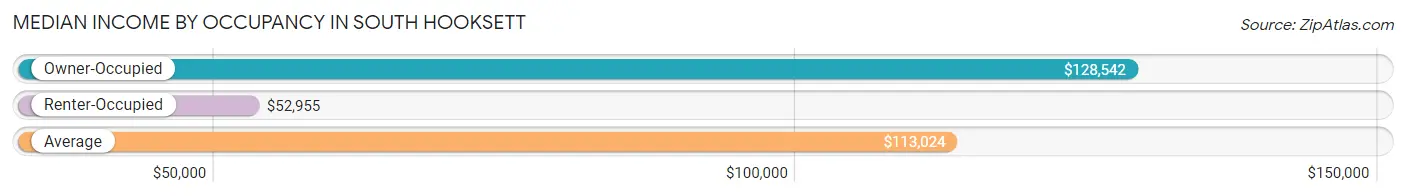
| Occupancy Type | # Households | Median Income |
| Owner-Occupied | 1,469 (85.1%) | $128,542 |
| Renter-Occupied | 258 (14.9%) | $52,955 |
| Average | 1,727 (100.0%) | $113,024 |
Occupancy by Householder Income Bracket in South Hooksett
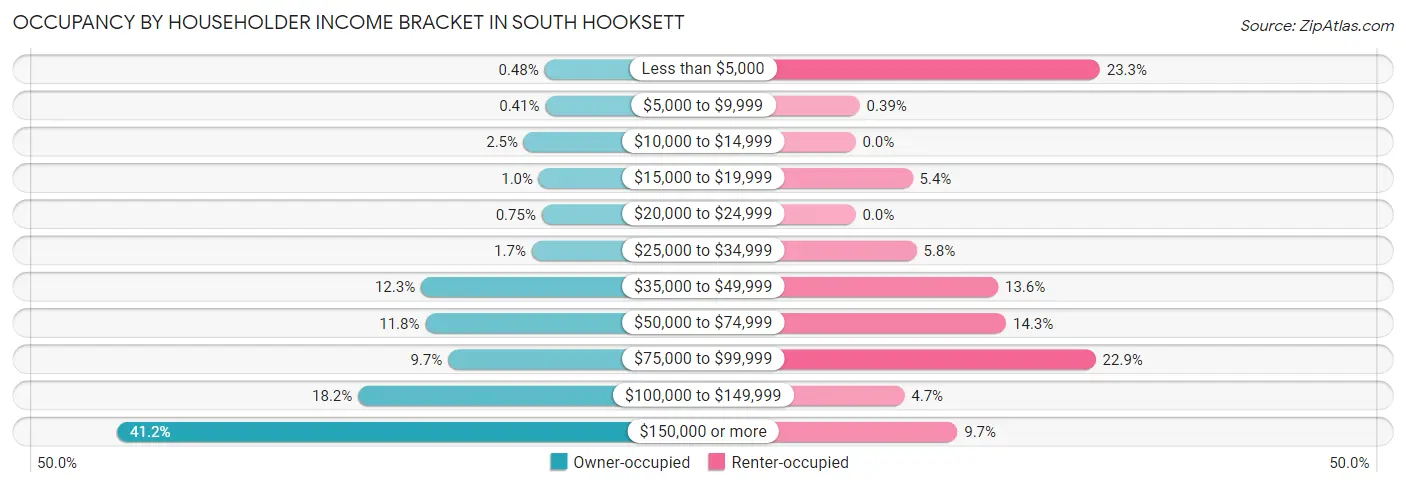
| Income Bracket | Owner-occupied | Renter-occupied |
| Less than $5,000 | 7 (0.5%) | 60 (23.3%) |
| $5,000 to $9,999 | 6 (0.4%) | 1 (0.4%) |
| $10,000 to $14,999 | 36 (2.5%) | 0 (0.0%) |
| $15,000 to $19,999 | 15 (1.0%) | 14 (5.4%) |
| $20,000 to $24,999 | 11 (0.7%) | 0 (0.0%) |
| $25,000 to $34,999 | 25 (1.7%) | 15 (5.8%) |
| $35,000 to $49,999 | 180 (12.2%) | 35 (13.6%) |
| $50,000 to $74,999 | 174 (11.8%) | 37 (14.3%) |
| $75,000 to $99,999 | 142 (9.7%) | 59 (22.9%) |
| $100,000 to $149,999 | 268 (18.2%) | 12 (4.6%) |
| $150,000 or more | 605 (41.2%) | 25 (9.7%) |
| Total | 1,469 (100.0%) | 258 (100.0%) |
Monthly Housing Cost Tiers in South Hooksett
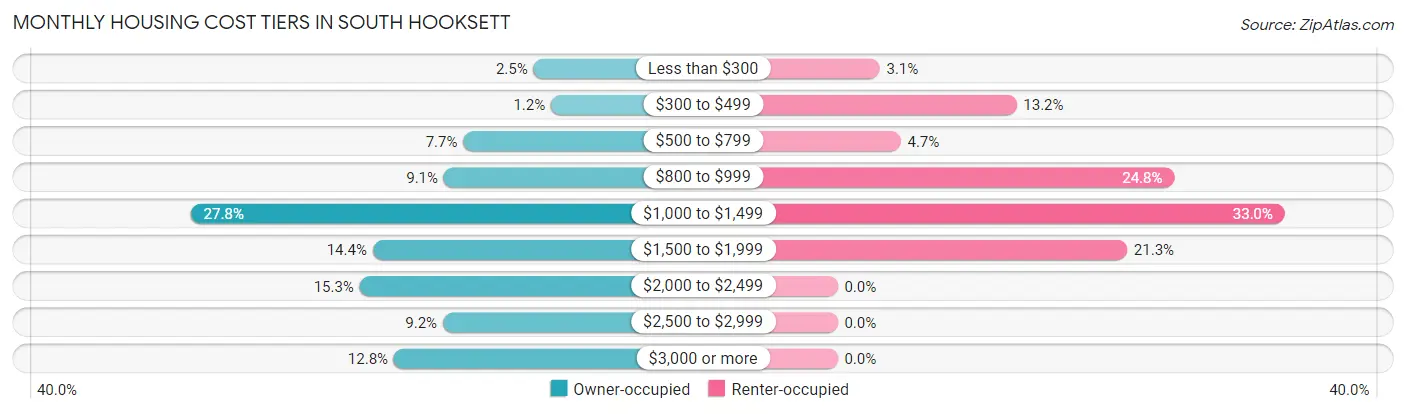
| Monthly Cost | Owner-occupied | Renter-occupied |
| Less than $300 | 37 (2.5%) | 8 (3.1%) |
| $300 to $499 | 18 (1.2%) | 34 (13.2%) |
| $500 to $799 | 113 (7.7%) | 12 (4.6%) |
| $800 to $999 | 134 (9.1%) | 64 (24.8%) |
| $1,000 to $1,499 | 408 (27.8%) | 85 (33.0%) |
| $1,500 to $1,999 | 211 (14.4%) | 55 (21.3%) |
| $2,000 to $2,499 | 225 (15.3%) | 0 (0.0%) |
| $2,500 to $2,999 | 135 (9.2%) | 0 (0.0%) |
| $3,000 or more | 188 (12.8%) | 0 (0.0%) |
| Total | 1,469 (100.0%) | 258 (100.0%) |
Physical Housing Characteristics in South Hooksett
Housing Structures in South Hooksett
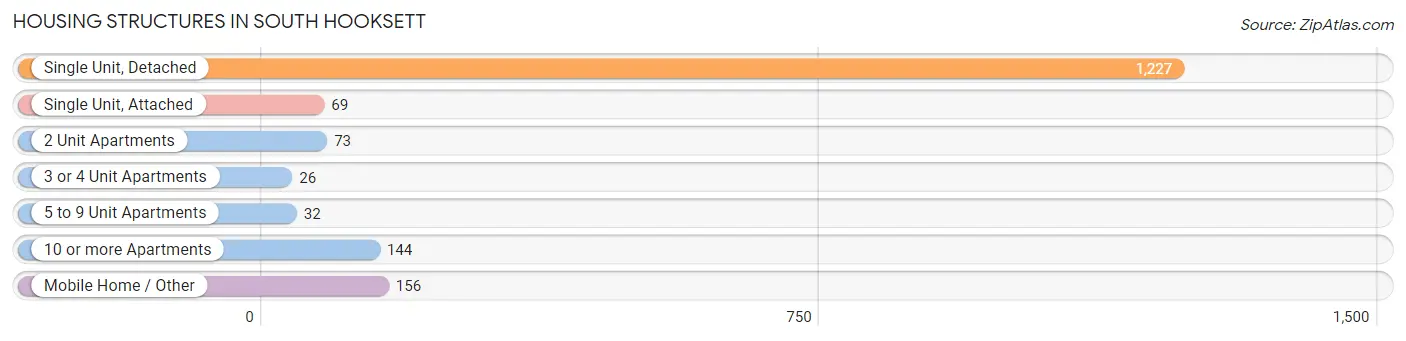
| Structure Type | # Housing Units | % Housing Units |
| Single Unit, Detached | 1,227 | 71.1% |
| Single Unit, Attached | 69 | 4.0% |
| 2 Unit Apartments | 73 | 4.2% |
| 3 or 4 Unit Apartments | 26 | 1.5% |
| 5 to 9 Unit Apartments | 32 | 1.8% |
| 10 or more Apartments | 144 | 8.3% |
| Mobile Home / Other | 156 | 9.0% |
| Total | 1,727 | 100.0% |
Housing Structures by Occupancy in South Hooksett
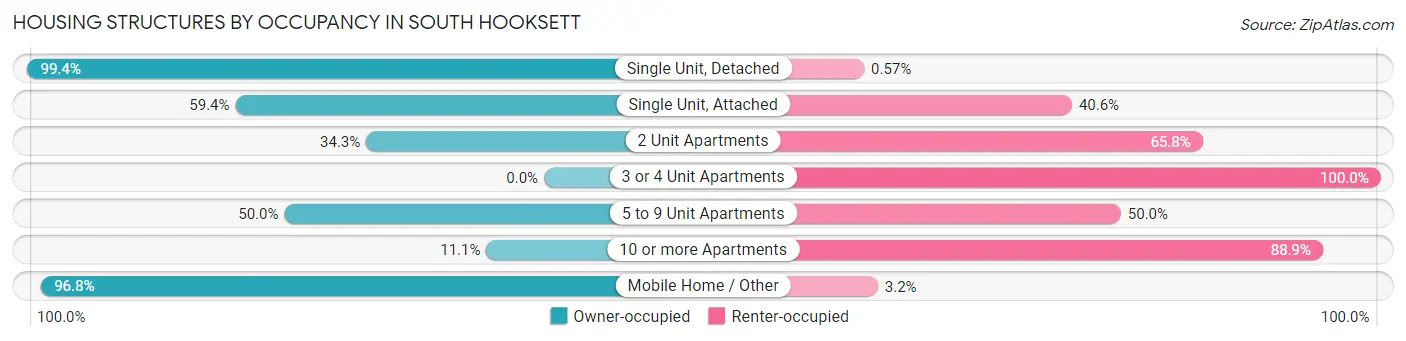
| Structure Type | Owner-occupied | Renter-occupied |
| Single Unit, Detached | 1,220 (99.4%) | 7 (0.6%) |
| Single Unit, Attached | 41 (59.4%) | 28 (40.6%) |
| 2 Unit Apartments | 25 (34.3%) | 48 (65.7%) |
| 3 or 4 Unit Apartments | 0 (0.0%) | 26 (100.0%) |
| 5 to 9 Unit Apartments | 16 (50.0%) | 16 (50.0%) |
| 10 or more Apartments | 16 (11.1%) | 128 (88.9%) |
| Mobile Home / Other | 151 (96.8%) | 5 (3.2%) |
| Total | 1,469 (85.1%) | 258 (14.9%) |
Housing Structures by Number of Rooms in South Hooksett
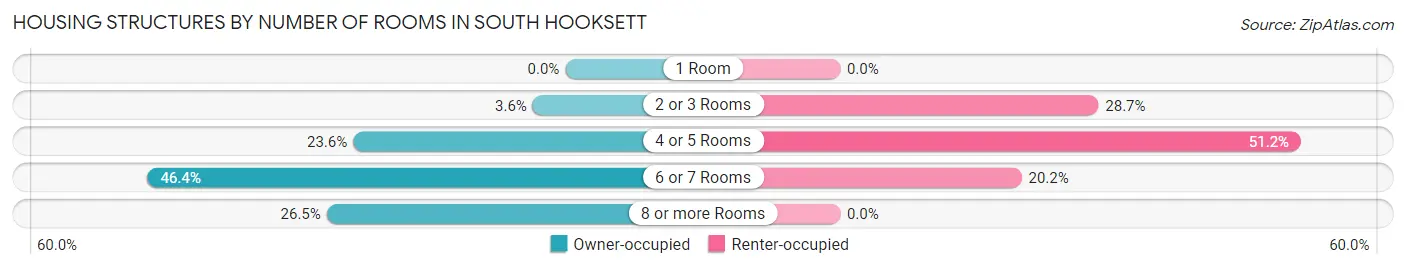
| Number of Rooms | Owner-occupied | Renter-occupied |
| 1 Room | 0 (0.0%) | 0 (0.0%) |
| 2 or 3 Rooms | 53 (3.6%) | 74 (28.7%) |
| 4 or 5 Rooms | 346 (23.5%) | 132 (51.2%) |
| 6 or 7 Rooms | 681 (46.4%) | 52 (20.2%) |
| 8 or more Rooms | 389 (26.5%) | 0 (0.0%) |
| Total | 1,469 (100.0%) | 258 (100.0%) |
Housing Structure by Heating Type in South Hooksett
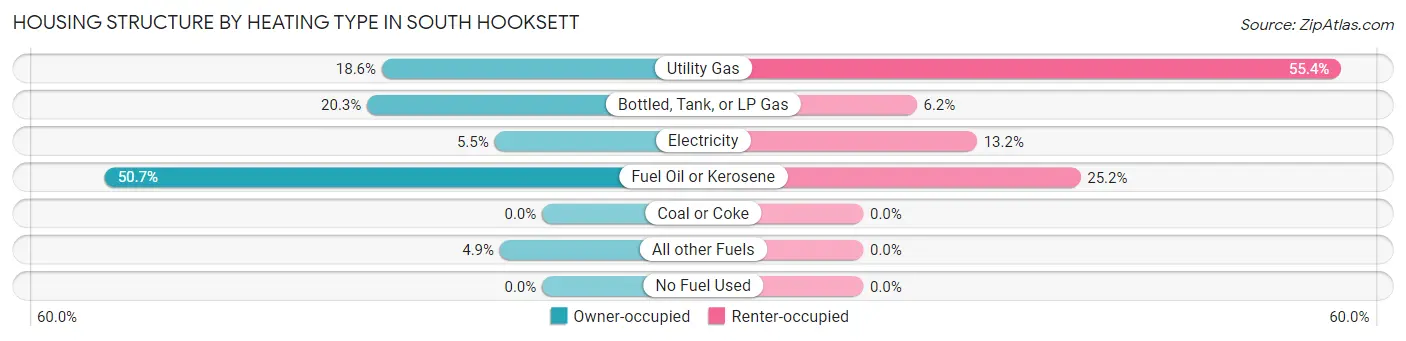
| Heating Type | Owner-occupied | Renter-occupied |
| Utility Gas | 273 (18.6%) | 143 (55.4%) |
| Bottled, Tank, or LP Gas | 298 (20.3%) | 16 (6.2%) |
| Electricity | 81 (5.5%) | 34 (13.2%) |
| Fuel Oil or Kerosene | 745 (50.7%) | 65 (25.2%) |
| Coal or Coke | 0 (0.0%) | 0 (0.0%) |
| All other Fuels | 72 (4.9%) | 0 (0.0%) |
| No Fuel Used | 0 (0.0%) | 0 (0.0%) |
| Total | 1,469 (100.0%) | 258 (100.0%) |
Household Vehicle Usage in South Hooksett
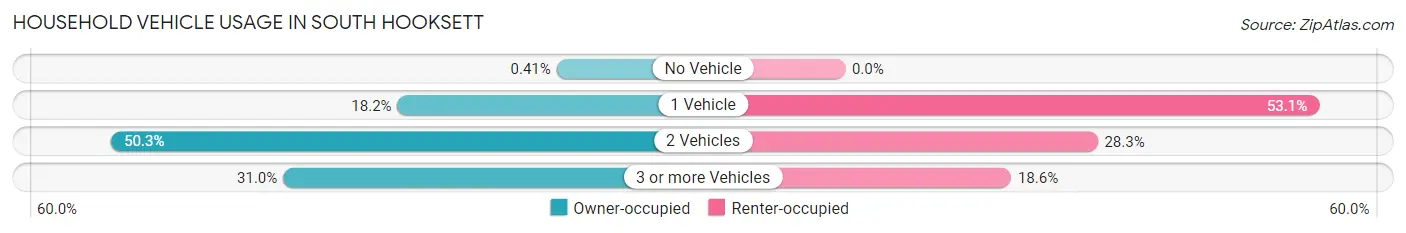
| Vehicles per Household | Owner-occupied | Renter-occupied |
| No Vehicle | 6 (0.4%) | 0 (0.0%) |
| 1 Vehicle | 268 (18.2%) | 137 (53.1%) |
| 2 Vehicles | 739 (50.3%) | 73 (28.3%) |
| 3 or more Vehicles | 456 (31.0%) | 48 (18.6%) |
| Total | 1,469 (100.0%) | 258 (100.0%) |
Real Estate & Mortgages in South Hooksett
Real Estate and Mortgage Overview in South Hooksett
| Characteristic | Without Mortgage | With Mortgage |
| Housing Units | 547 | 922 |
| Median Property Value | $316,400 | $374,800 |
| Median Household Income | $87,697 | $445 |
| Monthly Housing Costs | $1,012 | $182 |
| Real Estate Taxes | $5,600 | $15 |
Property Value by Mortgage Status in South Hooksett
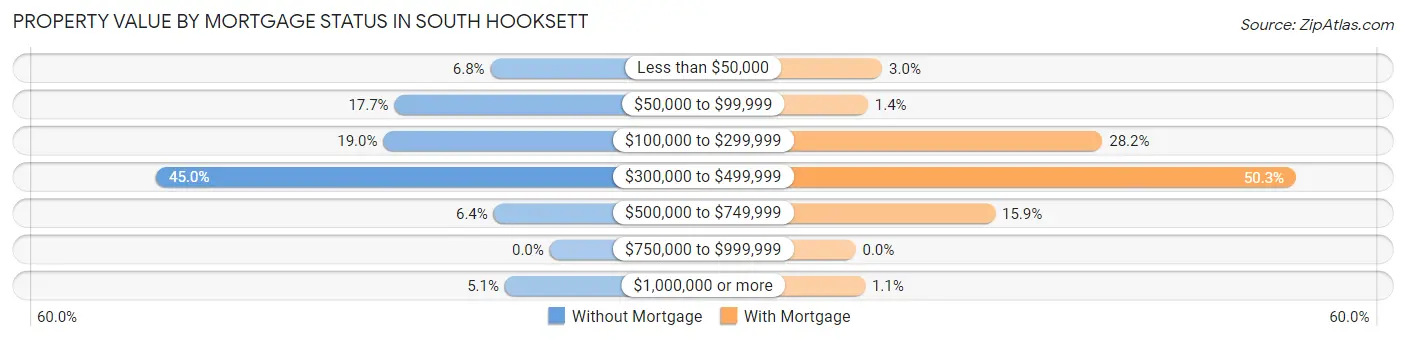
| Property Value | Without Mortgage | With Mortgage |
| Less than $50,000 | 37 (6.8%) | 28 (3.0%) |
| $50,000 to $99,999 | 97 (17.7%) | 13 (1.4%) |
| $100,000 to $299,999 | 104 (19.0%) | 260 (28.2%) |
| $300,000 to $499,999 | 246 (45.0%) | 464 (50.3%) |
| $500,000 to $749,999 | 35 (6.4%) | 147 (15.9%) |
| $750,000 to $999,999 | 0 (0.0%) | 0 (0.0%) |
| $1,000,000 or more | 28 (5.1%) | 10 (1.1%) |
| Total | 547 (100.0%) | 922 (100.0%) |
Household Income by Mortgage Status in South Hooksett
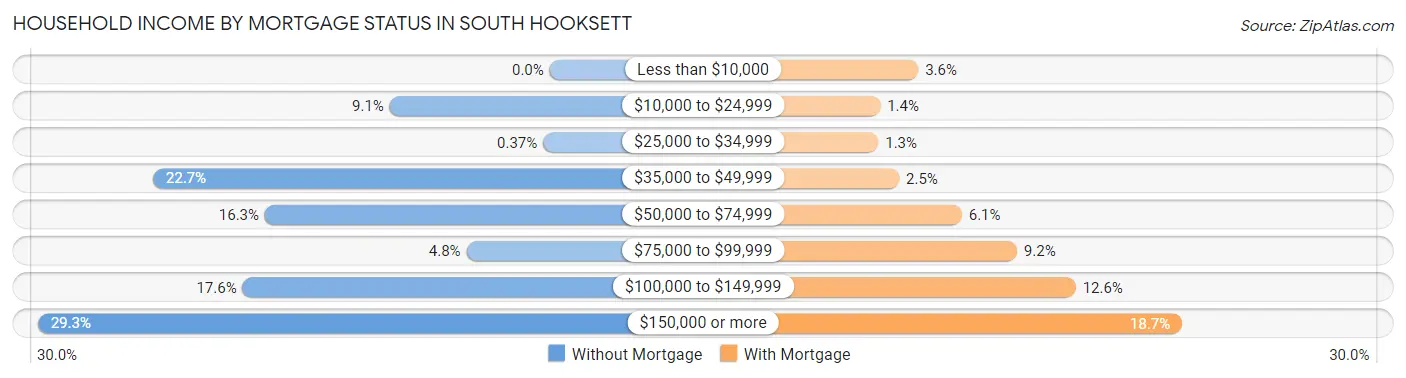
| Household Income | Without Mortgage | With Mortgage |
| Less than $10,000 | 0 (0.0%) | 33 (3.6%) |
| $10,000 to $24,999 | 50 (9.1%) | 13 (1.4%) |
| $25,000 to $34,999 | 2 (0.4%) | 12 (1.3%) |
| $35,000 to $49,999 | 124 (22.7%) | 23 (2.5%) |
| $50,000 to $74,999 | 89 (16.3%) | 56 (6.1%) |
| $75,000 to $99,999 | 26 (4.8%) | 85 (9.2%) |
| $100,000 to $149,999 | 96 (17.5%) | 116 (12.6%) |
| $150,000 or more | 160 (29.2%) | 172 (18.7%) |
| Total | 547 (100.0%) | 922 (100.0%) |
Property Value to Household Income Ratio in South Hooksett
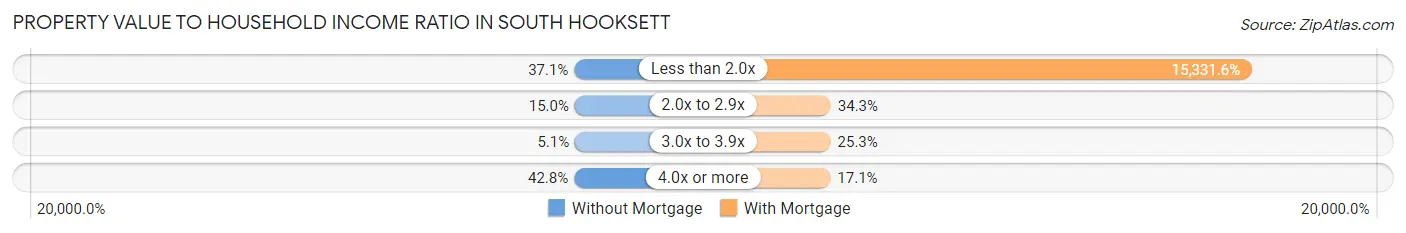
| Value-to-Income Ratio | Without Mortgage | With Mortgage |
| Less than 2.0x | 203 (37.1%) | 141,357 (15,331.6%) |
| 2.0x to 2.9x | 82 (15.0%) | 316 (34.3%) |
| 3.0x to 3.9x | 28 (5.1%) | 233 (25.3%) |
| 4.0x or more | 234 (42.8%) | 158 (17.1%) |
| Total | 547 (100.0%) | 922 (100.0%) |
Real Estate Taxes by Mortgage Status in South Hooksett
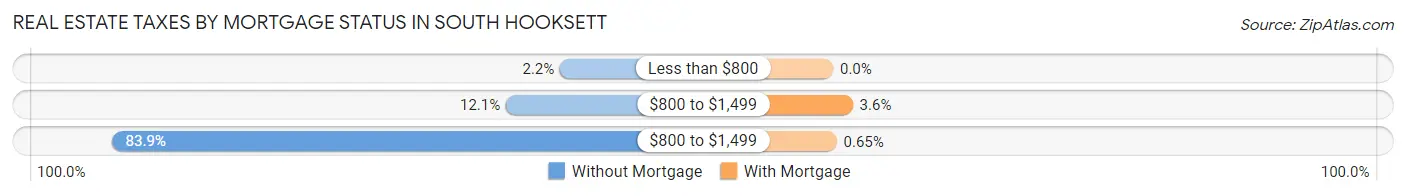
| Property Taxes | Without Mortgage | With Mortgage |
| Less than $800 | 12 (2.2%) | 0 (0.0%) |
| $800 to $1,499 | 66 (12.1%) | 33 (3.6%) |
| $800 to $1,499 | 459 (83.9%) | 6 (0.6%) |
| Total | 547 (100.0%) | 922 (100.0%) |
Health & Disability in South Hooksett
Health Insurance Coverage by Age in South Hooksett
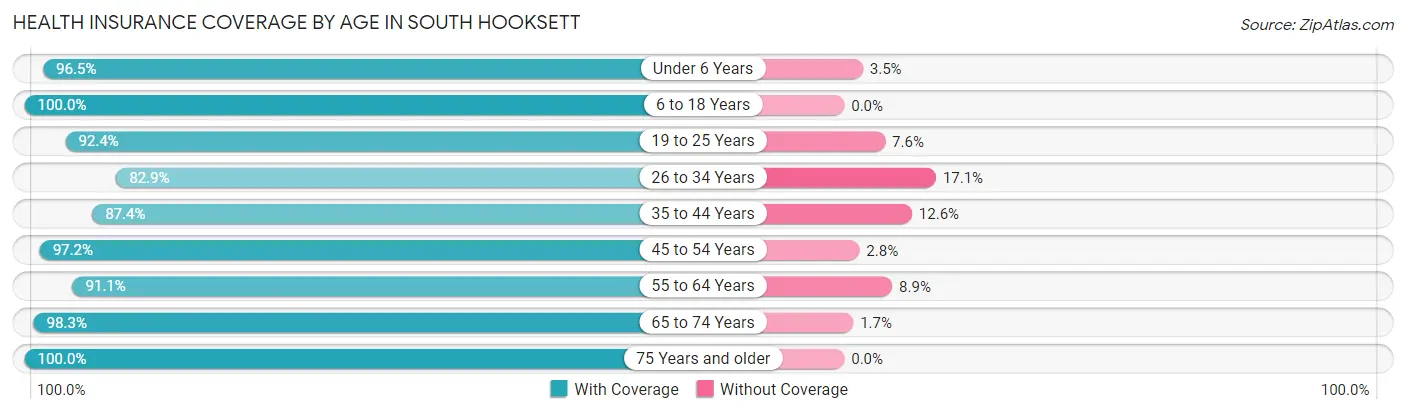
| Age Bracket | With Coverage | Without Coverage |
| Under 6 Years | 279 (96.5%) | 10 (3.5%) |
| 6 to 18 Years | 882 (100.0%) | 0 (0.0%) |
| 19 to 25 Years | 1,018 (92.4%) | 84 (7.6%) |
| 26 to 34 Years | 524 (82.9%) | 108 (17.1%) |
| 35 to 44 Years | 513 (87.4%) | 74 (12.6%) |
| 45 to 54 Years | 757 (97.2%) | 22 (2.8%) |
| 55 to 64 Years | 724 (91.1%) | 71 (8.9%) |
| 65 to 74 Years | 413 (98.3%) | 7 (1.7%) |
| 75 Years and older | 322 (100.0%) | 0 (0.0%) |
| Total | 5,432 (93.5%) | 376 (6.5%) |
Health Insurance Coverage by Citizenship Status in South Hooksett
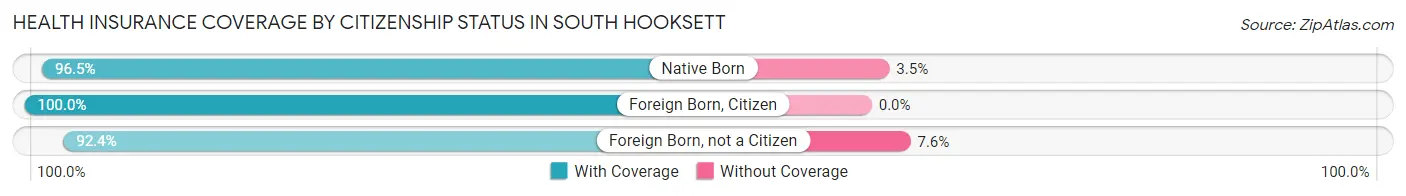
| Citizenship Status | With Coverage | Without Coverage |
| Native Born | 279 (96.5%) | 10 (3.5%) |
| Foreign Born, Citizen | 882 (100.0%) | 0 (0.0%) |
| Foreign Born, not a Citizen | 1,018 (92.4%) | 84 (7.6%) |
Health Insurance Coverage by Household Income in South Hooksett
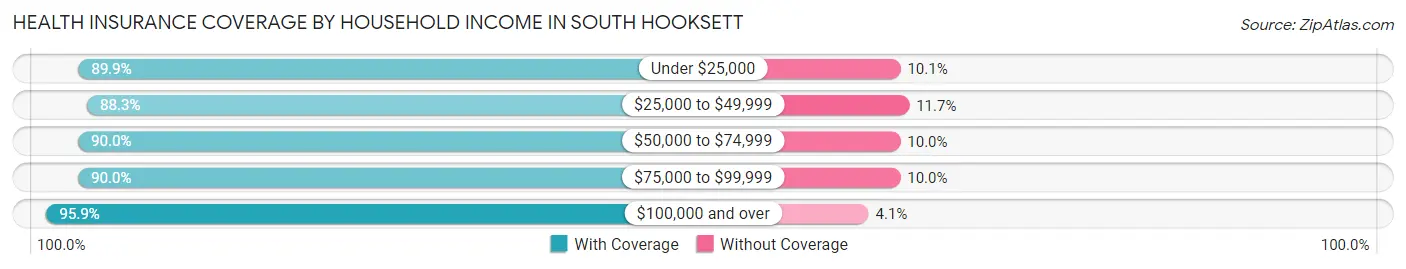
| Household Income | With Coverage | Without Coverage |
| Under $25,000 | 143 (89.9%) | 16 (10.1%) |
| $25,000 to $49,999 | 415 (88.3%) | 55 (11.7%) |
| $50,000 to $74,999 | 735 (90.0%) | 82 (10.0%) |
| $75,000 to $99,999 | 557 (90.0%) | 62 (10.0%) |
| $100,000 and over | 2,882 (95.9%) | 123 (4.1%) |
Public vs Private Health Insurance Coverage by Age in South Hooksett
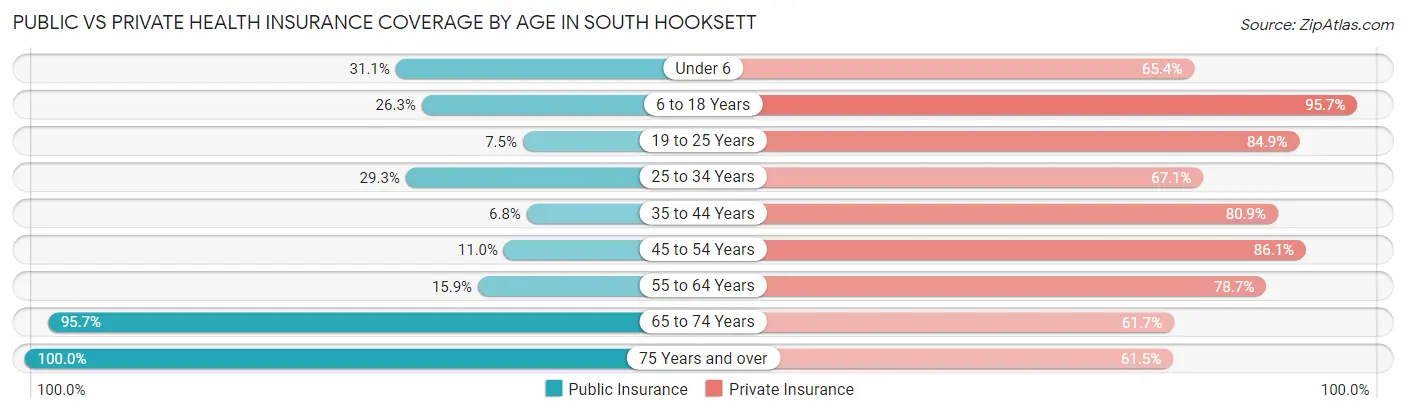
| Age Bracket | Public Insurance | Private Insurance |
| Under 6 | 90 (31.1%) | 189 (65.4%) |
| 6 to 18 Years | 232 (26.3%) | 844 (95.7%) |
| 19 to 25 Years | 83 (7.5%) | 935 (84.9%) |
| 25 to 34 Years | 185 (29.3%) | 424 (67.1%) |
| 35 to 44 Years | 40 (6.8%) | 475 (80.9%) |
| 45 to 54 Years | 86 (11.0%) | 671 (86.1%) |
| 55 to 64 Years | 126 (15.9%) | 626 (78.7%) |
| 65 to 74 Years | 402 (95.7%) | 259 (61.7%) |
| 75 Years and over | 322 (100.0%) | 198 (61.5%) |
| Total | 1,566 (27.0%) | 4,621 (79.6%) |
Disability Status by Sex by Age in South Hooksett
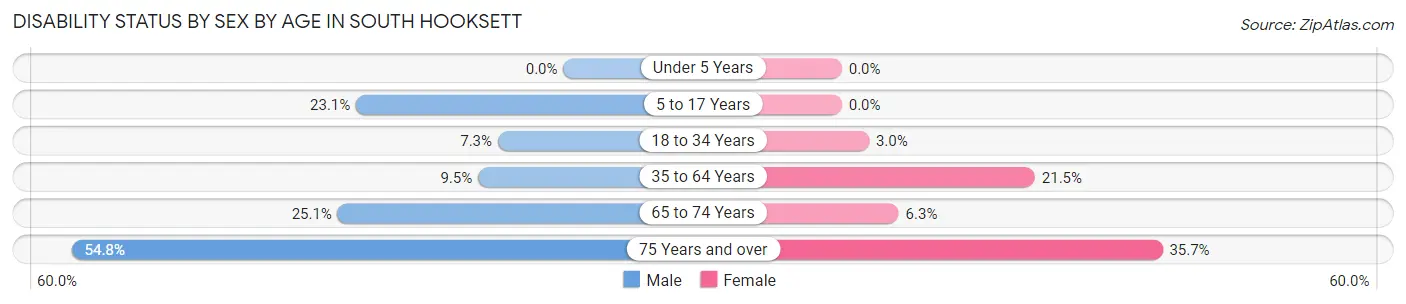
| Age Bracket | Male | Female |
| Under 5 Years | 0 (0.0%) | 0 (0.0%) |
| 5 to 17 Years | 75 (23.1%) | 0 (0.0%) |
| 18 to 34 Years | 69 (7.3%) | 29 (3.0%) |
| 35 to 64 Years | 105 (9.5%) | 227 (21.5%) |
| 65 to 74 Years | 50 (25.1%) | 14 (6.3%) |
| 75 Years and over | 92 (54.8%) | 55 (35.7%) |
Disability Class by Sex by Age in South Hooksett
Disability Class: Hearing Difficulty
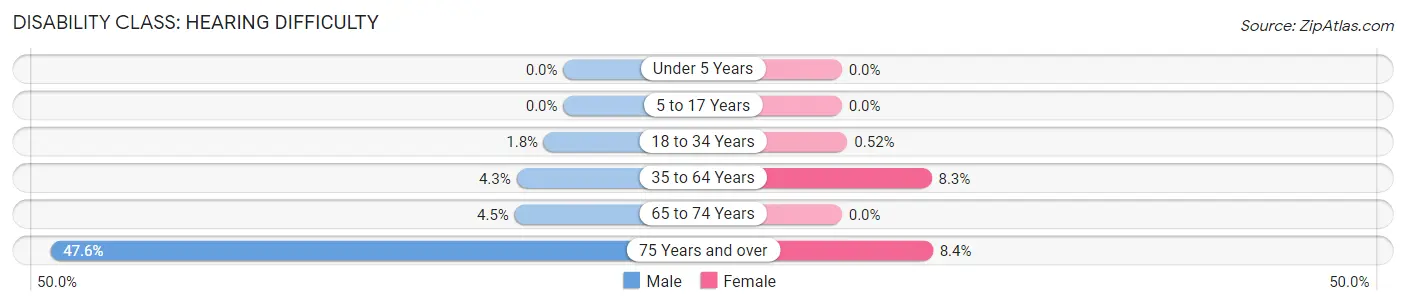
| Age Bracket | Male | Female |
| Under 5 Years | 0 (0.0%) | 0 (0.0%) |
| 5 to 17 Years | 0 (0.0%) | 0 (0.0%) |
| 18 to 34 Years | 17 (1.8%) | 5 (0.5%) |
| 35 to 64 Years | 48 (4.3%) | 88 (8.3%) |
| 65 to 74 Years | 9 (4.5%) | 0 (0.0%) |
| 75 Years and over | 80 (47.6%) | 13 (8.4%) |
Disability Class: Vision Difficulty
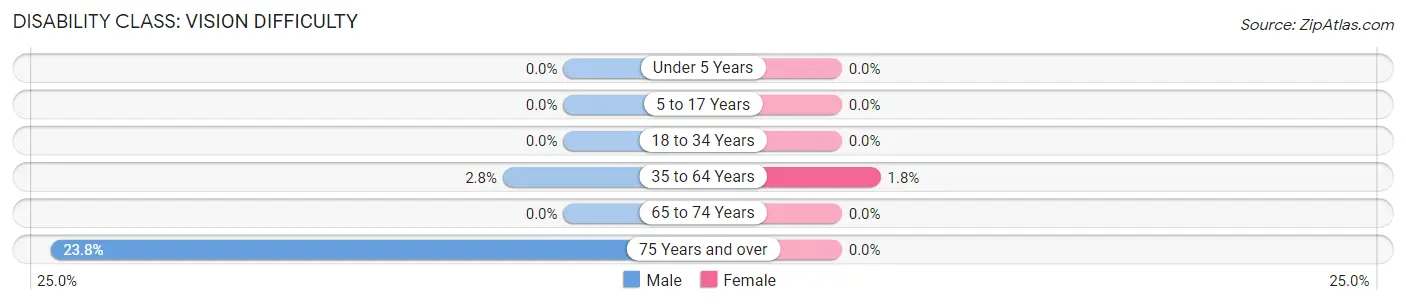
| Age Bracket | Male | Female |
| Under 5 Years | 0 (0.0%) | 0 (0.0%) |
| 5 to 17 Years | 0 (0.0%) | 0 (0.0%) |
| 18 to 34 Years | 0 (0.0%) | 0 (0.0%) |
| 35 to 64 Years | 31 (2.8%) | 19 (1.8%) |
| 65 to 74 Years | 0 (0.0%) | 0 (0.0%) |
| 75 Years and over | 40 (23.8%) | 0 (0.0%) |
Disability Class: Cognitive Difficulty
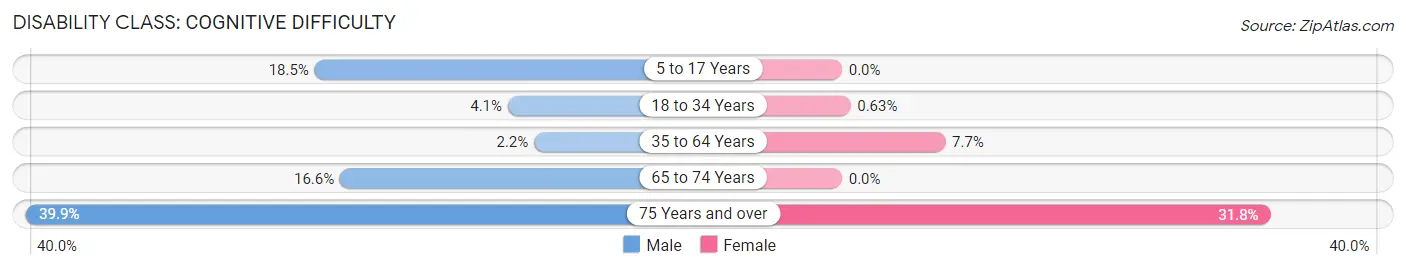
| Age Bracket | Male | Female |
| 5 to 17 Years | 60 (18.5%) | 0 (0.0%) |
| 18 to 34 Years | 39 (4.1%) | 6 (0.6%) |
| 35 to 64 Years | 24 (2.2%) | 81 (7.7%) |
| 65 to 74 Years | 33 (16.6%) | 0 (0.0%) |
| 75 Years and over | 67 (39.9%) | 49 (31.8%) |
Disability Class: Ambulatory Difficulty
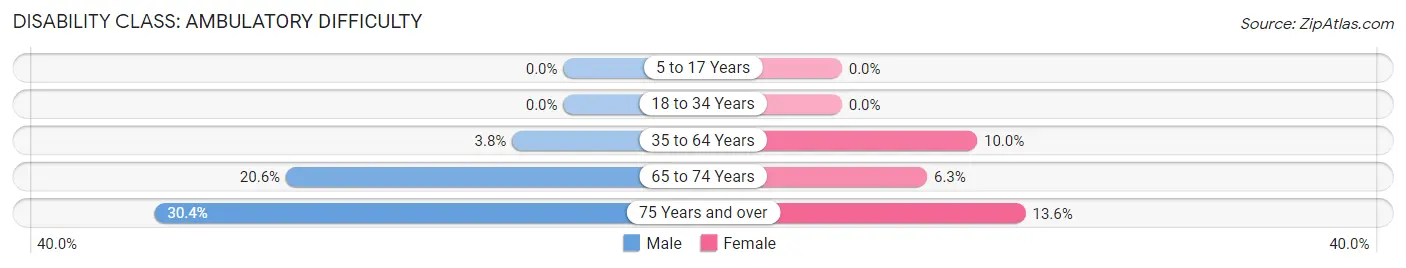
| Age Bracket | Male | Female |
| 5 to 17 Years | 0 (0.0%) | 0 (0.0%) |
| 18 to 34 Years | 0 (0.0%) | 0 (0.0%) |
| 35 to 64 Years | 42 (3.8%) | 106 (10.0%) |
| 65 to 74 Years | 41 (20.6%) | 14 (6.3%) |
| 75 Years and over | 51 (30.4%) | 21 (13.6%) |
Disability Class: Self-Care Difficulty
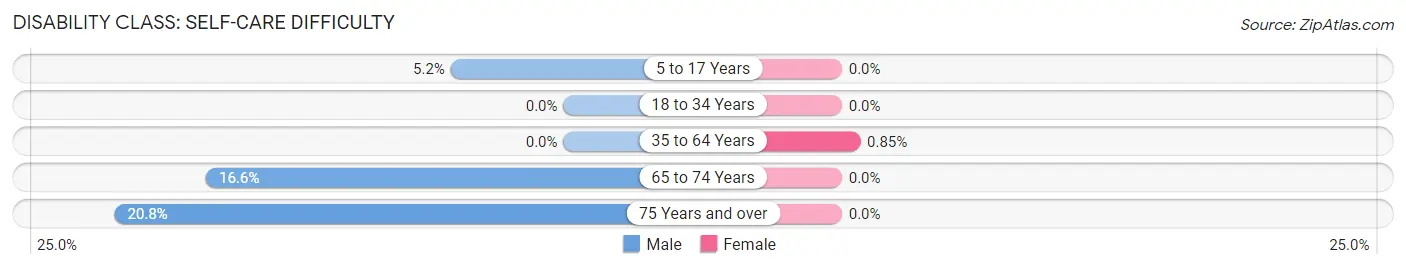
| Age Bracket | Male | Female |
| 5 to 17 Years | 17 (5.2%) | 0 (0.0%) |
| 18 to 34 Years | 0 (0.0%) | 0 (0.0%) |
| 35 to 64 Years | 0 (0.0%) | 9 (0.9%) |
| 65 to 74 Years | 33 (16.6%) | 0 (0.0%) |
| 75 Years and over | 35 (20.8%) | 0 (0.0%) |
Technology Access in South Hooksett
Computing Device Access in South Hooksett
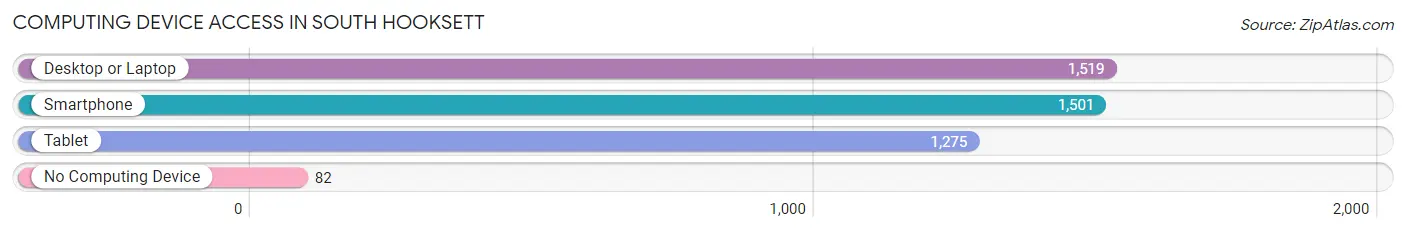
| Device Type | # Households | % Households |
| Desktop or Laptop | 1,519 | 88.0% |
| Smartphone | 1,501 | 86.9% |
| Tablet | 1,275 | 73.8% |
| No Computing Device | 82 | 4.8% |
| Total | 1,727 | 100.0% |
Internet Access in South Hooksett
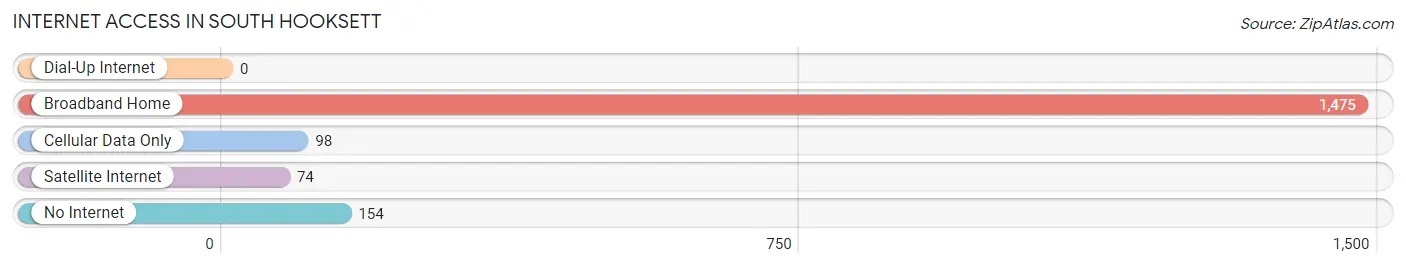
| Internet Type | # Households | % Households |
| Dial-Up Internet | 0 | 0.0% |
| Broadband Home | 1,475 | 85.4% |
| Cellular Data Only | 98 | 5.7% |
| Satellite Internet | 74 | 4.3% |
| No Internet | 154 | 8.9% |
| Total | 1,727 | 100.0% |
South Hooksett Summary
History
The area now known as South Hooksett, New Hampshire was first settled in 1720 by a group of English settlers from Massachusetts. The area was originally part of the town of Hooksett, which was incorporated in 1746. The area was known as South Hooksett because it was located south of the main village of Hooksett.
In the early 19th century, the area was a thriving agricultural community. The town was home to several mills, including a sawmill, gristmill, and a woolen mill. The town also had a blacksmith shop, a tannery, and a general store.
In the late 19th century, the town began to experience a period of growth and development. The railroad arrived in 1872, and the town was connected to the larger cities of Manchester and Concord. This allowed for increased trade and commerce, and the town began to grow.
In the early 20th century, the town experienced a period of industrialization. Several factories were built in the area, including a paper mill, a shoe factory, and a textile mill. These factories provided employment for many of the town’s residents.
In the late 20th century, the town experienced a period of decline. Many of the factories closed, and the population began to decline. In recent years, the town has experienced a resurgence, with new businesses and housing developments being built.
Geography
South Hooksett is located in Merrimack County, New Hampshire. It is situated in the southeastern part of the state, about 20 miles north of Manchester and 30 miles south of Concord. The town is bordered by the towns of Hooksett, Candia, and Deerfield.
The town has a total area of 8.3 square miles, of which 8.2 square miles is land and 0.1 square miles is water. The town is located in the Merrimack River Valley, and is surrounded by rolling hills and forests.
Economy
The economy of South Hooksett is largely based on the service industry. The town is home to several retail stores, restaurants, and other businesses. The town also has a small manufacturing sector, with several factories located in the area.
The town is also home to several educational institutions, including the University of New Hampshire at Manchester and the New Hampshire Technical Institute. These institutions provide employment for many of the town’s residents.
Demographics
As of the 2010 census, the population of South Hooksett was 8,717. The racial makeup of the town was 94.3% White, 1.3% African American, 0.4% Native American, 1.2% Asian, 0.1% Pacific Islander, 1.2% from other races, and 1.5% from two or more races. Hispanic or Latino of any race were 3.2% of the population.
The median household income in the town was $63,917, and the median family income was $76,917. The per capita income in the town was $30,917. About 4.3% of the population was below the poverty line.
Common Questions
What is Per Capita Income in South Hooksett?
Per Capita income in South Hooksett is $43,395.
What is the Median Family Income in South Hooksett?
Median Family Income in South Hooksett is $140,357.
What is the Median Household income in South Hooksett?
Median Household Income in South Hooksett is $113,024.
What is Income or Wage Gap in South Hooksett?
Income or Wage Gap in South Hooksett is 18.8%.
Women in South Hooksett earn 81.2 cents for every dollar earned by a man.
What is Inequality or Gini Index in South Hooksett?
Inequality or Gini Index in South Hooksett is 0.44.
What is the Total Population of South Hooksett?
Total Population of South Hooksett is 5,808.
What is the Total Male Population of South Hooksett?
Total Male Population of South Hooksett is 2,948.
What is the Total Female Population of South Hooksett?
Total Female Population of South Hooksett is 2,860.
What is the Ratio of Males per 100 Females in South Hooksett?
There are 103.08 Males per 100 Females in South Hooksett.
What is the Ratio of Females per 100 Males in South Hooksett?
There are 97.01 Females per 100 Males in South Hooksett.
What is the Median Population Age in South Hooksett?
Median Population Age in South Hooksett is 35.0 Years.
What is the Average Family Size in South Hooksett
Average Family Size in South Hooksett is 3.4 People.
What is the Average Household Size in South Hooksett
Average Household Size in South Hooksett is 2.9 People.
How Large is the Labor Force in South Hooksett?
There are 3,454 People in the Labor Forcein in South Hooksett.
What is the Percentage of People in the Labor Force in South Hooksett?
69.3% of People are in the Labor Force in South Hooksett.
What is the Unemployment Rate in South Hooksett?
Unemployment Rate in South Hooksett is 3.9%.