Aubrey, TX Map & Demographics
Aubrey Map
Aubrey Overview
$39,768
PER CAPITA INCOME
$107,931
AVG FAMILY INCOME
$93,071
AVG HOUSEHOLD INCOME
61.5%
WAGE / INCOME GAP [ % ]
38.5¢/ $1
WAGE / INCOME GAP [ $ ]
0.39
INEQUALITY / GINI INDEX
5,932
TOTAL POPULATION
2,726
MALE POPULATION
3,206
FEMALE POPULATION
85.03
MALES / 100 FEMALES
117.61
FEMALES / 100 MALES
36.5
MEDIAN AGE
3.3
AVG FAMILY SIZE
2.7
AVG HOUSEHOLD SIZE
3,193
LABOR FORCE [ PEOPLE ]
72.4%
PERCENT IN LABOR FORCE
2.3%
UNEMPLOYMENT RATE
Aubrey Zip Codes
Aubrey Area Codes
Income in Aubrey
Income Overview in Aubrey
Per Capita Income in Aubrey is $39,768, while median incomes of families and households are $107,931 and $93,071 respectively.
| Characteristic | Number | Measure |
| Per Capita Income | 5,932 | $39,768 |
| Median Family Income | 1,494 | $107,931 |
| Mean Family Income | 1,494 | $123,863 |
| Median Household Income | 2,183 | $93,071 |
| Mean Household Income | 2,183 | $105,989 |
| Income Deficit | 1,494 | $0 |
| Wage / Income Gap (%) | 5,932 | 61.52% |
| Wage / Income Gap ($) | 5,932 | 38.48¢ per $1 |
| Gini / Inequality Index | 5,932 | 0.39 |
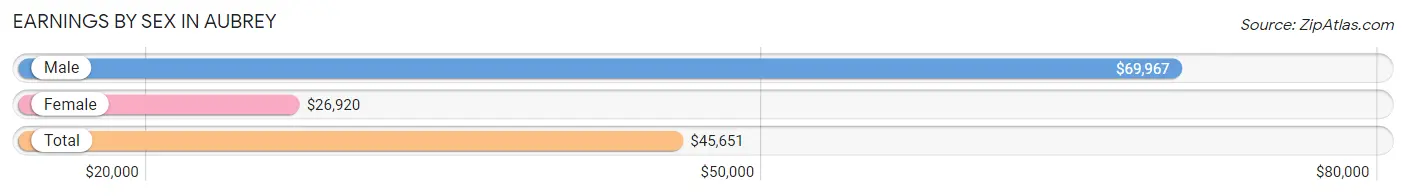
Earnings by Sex in Aubrey
Average Earnings in Aubrey are $45,651, $69,967 for men and $26,920 for women, a difference of 61.5%.
| Sex | Number | Average Earnings |
| Male | 1,643 (49.4%) | $69,967 |
| Female | 1,683 (50.6%) | $26,920 |
| Total | 3,326 (100.0%) | $45,651 |
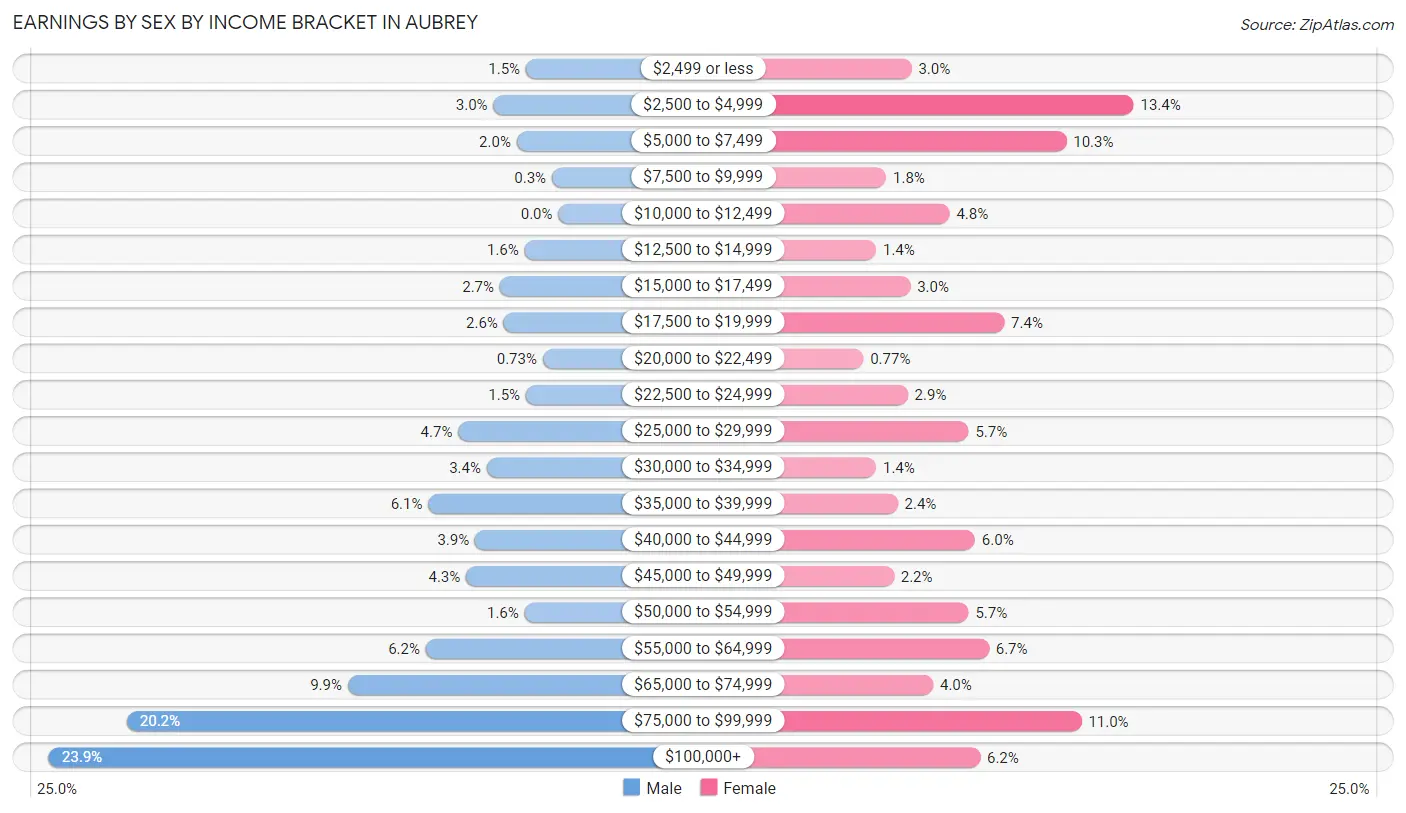
Earnings by Sex by Income Bracket in Aubrey
The most common earnings brackets in Aubrey are $100,000+ for men (392 | 23.9%) and $2,500 to $4,999 for women (226 | 13.4%).
| Income | Male | Female |
| $2,499 or less | 25 (1.5%) | 51 (3.0%) |
| $2,500 to $4,999 | 50 (3.0%) | 226 (13.4%) |
| $5,000 to $7,499 | 32 (1.9%) | 173 (10.3%) |
| $7,500 to $9,999 | 5 (0.3%) | 31 (1.8%) |
| $10,000 to $12,499 | 0 (0.0%) | 81 (4.8%) |
| $12,500 to $14,999 | 26 (1.6%) | 23 (1.4%) |
| $15,000 to $17,499 | 45 (2.7%) | 50 (3.0%) |
| $17,500 to $19,999 | 42 (2.6%) | 124 (7.4%) |
| $20,000 to $22,499 | 12 (0.7%) | 13 (0.8%) |
| $22,500 to $24,999 | 25 (1.5%) | 48 (2.9%) |
| $25,000 to $29,999 | 77 (4.7%) | 96 (5.7%) |
| $30,000 to $34,999 | 55 (3.4%) | 23 (1.4%) |
| $35,000 to $39,999 | 100 (6.1%) | 40 (2.4%) |
| $40,000 to $44,999 | 64 (3.9%) | 101 (6.0%) |
| $45,000 to $49,999 | 71 (4.3%) | 37 (2.2%) |
| $50,000 to $54,999 | 26 (1.6%) | 96 (5.7%) |
| $55,000 to $64,999 | 102 (6.2%) | 112 (6.7%) |
| $65,000 to $74,999 | 162 (9.9%) | 68 (4.0%) |
| $75,000 to $99,999 | 332 (20.2%) | 185 (11.0%) |
| $100,000+ | 392 (23.9%) | 105 (6.2%) |
| Total | 1,643 (100.0%) | 1,683 (100.0%) |
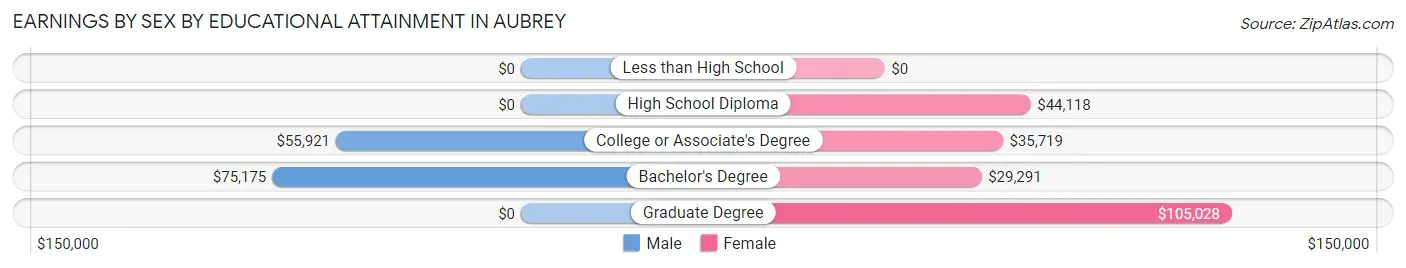
Earnings by Sex by Educational Attainment in Aubrey
Average earnings in Aubrey are $71,429 for men and $36,688 for women, a difference of 48.6%. Men with an educational attainment of bachelor's degree enjoy the highest average annual earnings of $75,175, while those with college or associate's degree education earn the least with $55,921. Women with an educational attainment of graduate degree earn the most with the average annual earnings of $105,028, while those with bachelor's degree education have the smallest earnings of $29,291.
| Educational Attainment | Male Income | Female Income |
| Less than High School | - | - |
| High School Diploma | - | - |
| College or Associate's Degree | $55,921 | $35,719 |
| Bachelor's Degree | $75,175 | $29,291 |
| Graduate Degree | - | - |
| Total | $71,429 | $36,688 |
Family Income in Aubrey
Family Income Brackets in Aubrey
According to the Aubrey family income data, there are 348 families falling into the $150,000 to $199,999 income range, which is the most common income bracket and makes up 23.3% of all families. Conversely, the less than $10,000 income bracket is the least frequent group with only 33 families (2.2%) belonging to this category.
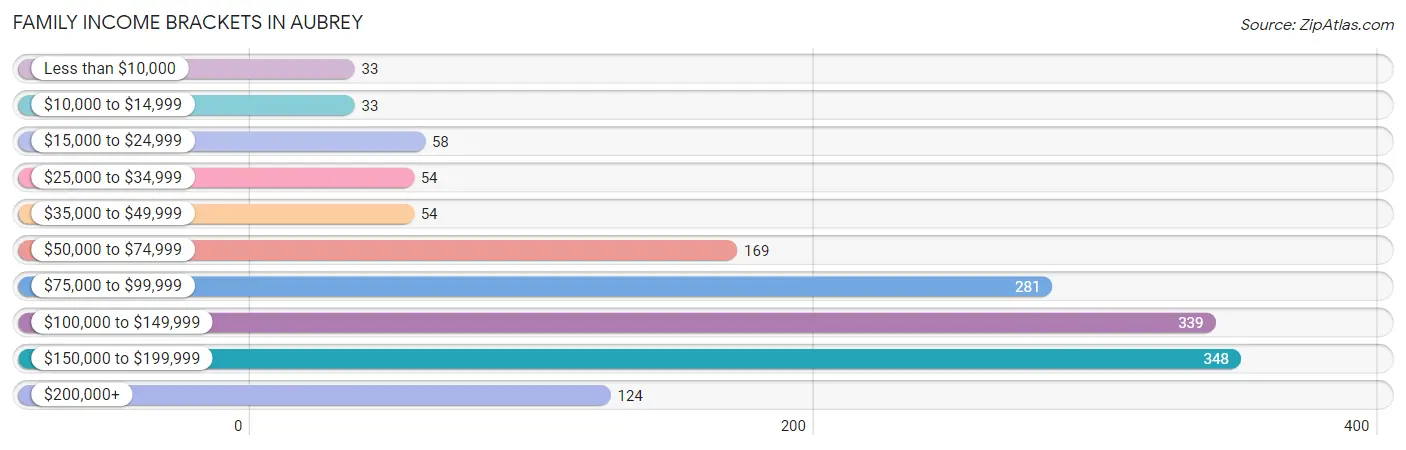
| Income Bracket | # Families | % Families |
| Less than $10,000 | 33 | 2.2% |
| $10,000 to $14,999 | 33 | 2.2% |
| $15,000 to $24,999 | 58 | 3.9% |
| $25,000 to $34,999 | 54 | 3.6% |
| $35,000 to $49,999 | 54 | 3.6% |
| $50,000 to $74,999 | 169 | 11.3% |
| $75,000 to $99,999 | 281 | 18.8% |
| $100,000 to $149,999 | 339 | 22.7% |
| $150,000 to $199,999 | 348 | 23.3% |
| $200,000+ | 124 | 8.3% |
Family Income by Famaliy Size in Aubrey
4-person families (376 | 25.2%) account for the highest median family income in Aubrey with $115,417 per family, while 2-person families (582 | 39.0%) have the highest median income of $53,319 per family member.
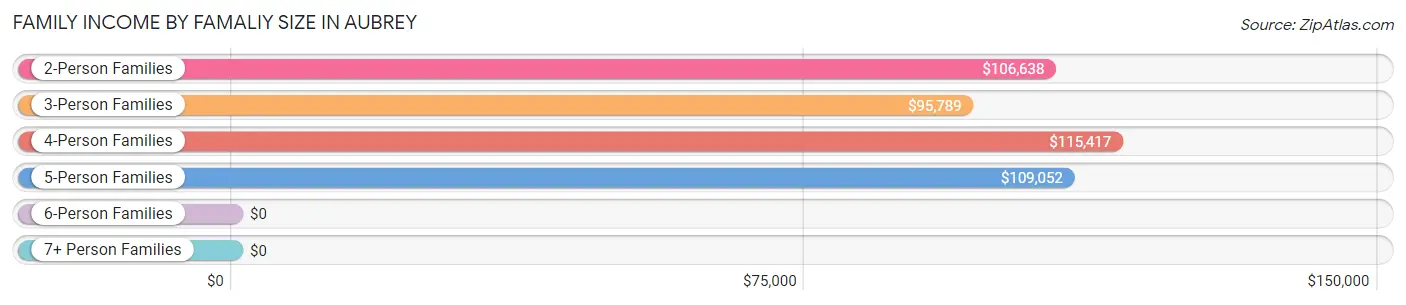
| Income Bracket | # Families | Median Income |
| 2-Person Families | 582 (39.0%) | $106,638 |
| 3-Person Families | 304 (20.3%) | $95,789 |
| 4-Person Families | 376 (25.2%) | $115,417 |
| 5-Person Families | 214 (14.3%) | $109,052 |
| 6-Person Families | 18 (1.2%) | $0 |
| 7+ Person Families | 0 (0.0%) | $0 |
| Total | 1,494 (100.0%) | $107,931 |
Family Income by Number of Earners in Aubrey
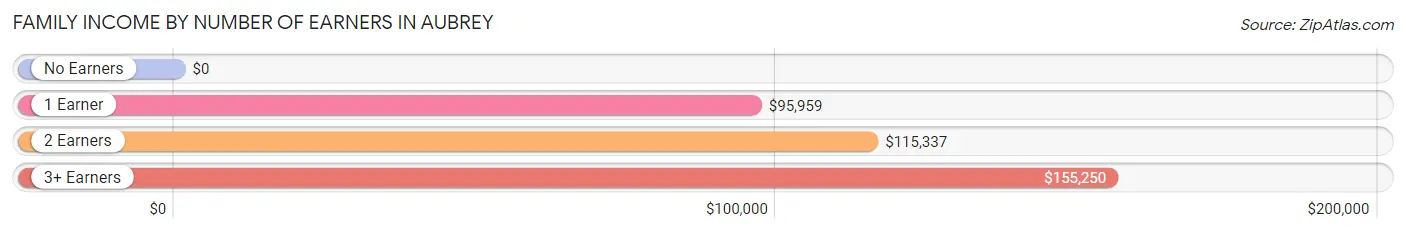
| Number of Earners | # Families | Median Income |
| No Earners | 83 (5.6%) | $0 |
| 1 Earner | 325 (21.7%) | $95,959 |
| 2 Earners | 1,021 (68.3%) | $115,337 |
| 3+ Earners | 65 (4.3%) | $155,250 |
| Total | 1,494 (100.0%) | $107,931 |
Household Income in Aubrey
Household Income Brackets in Aubrey
With 458 households falling in the category, the $100,000 to $149,999 income range is the most frequent in Aubrey, accounting for 21.0% of all households. In contrast, only 39 households (1.8%) fall into the less than $10,000 income bracket, making it the least populous group.
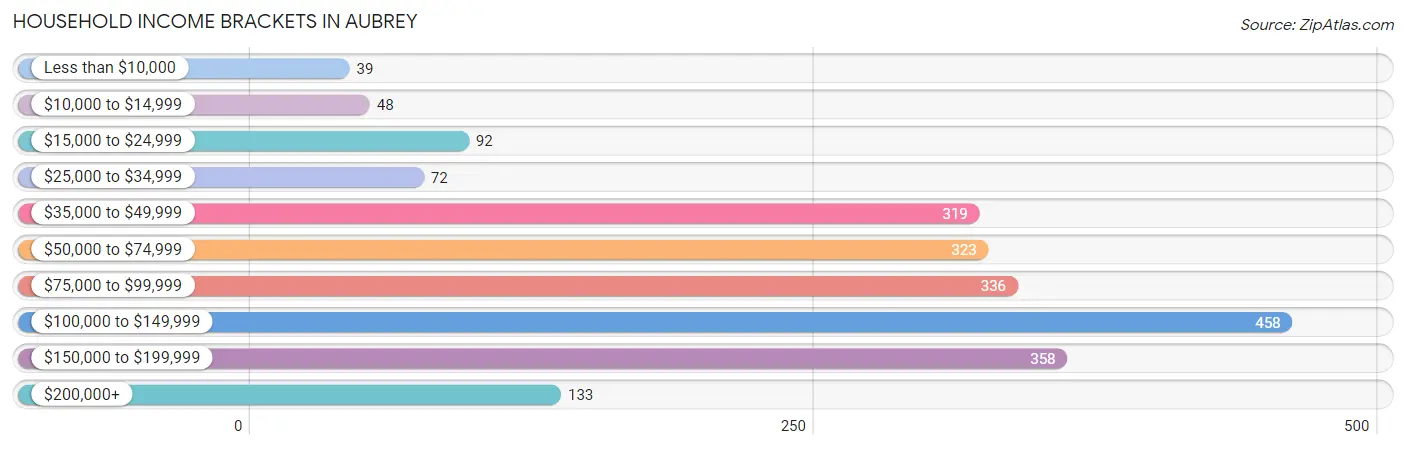
| Income Bracket | # Households | % Households |
| Less than $10,000 | 39 | 1.8% |
| $10,000 to $14,999 | 48 | 2.2% |
| $15,000 to $24,999 | 92 | 4.2% |
| $25,000 to $34,999 | 72 | 3.3% |
| $35,000 to $49,999 | 319 | 14.6% |
| $50,000 to $74,999 | 323 | 14.8% |
| $75,000 to $99,999 | 336 | 15.4% |
| $100,000 to $149,999 | 458 | 21.0% |
| $150,000 to $199,999 | 358 | 16.4% |
| $200,000+ | 133 | 6.1% |
Household Income by Householder Age in Aubrey
The median household income in Aubrey is $93,071, with the highest median household income of $110,819 found in the 45 to 64 years age bracket for the primary householder. A total of 854 households (39.1%) fall into this category. Meanwhile, the 15 to 24 years age bracket for the primary householder has the lowest median household income of $0, with 98 households (4.5%) in this group.
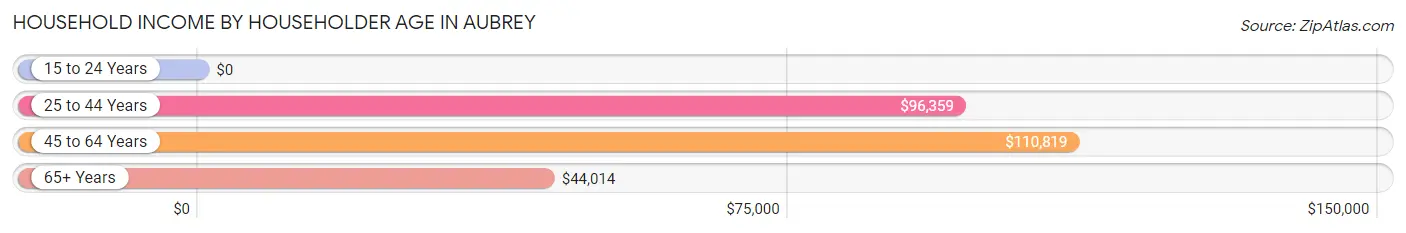
| Income Bracket | # Households | Median Income |
| 15 to 24 Years | 98 (4.5%) | $0 |
| 25 to 44 Years | 797 (36.5%) | $96,359 |
| 45 to 64 Years | 854 (39.1%) | $110,819 |
| 65+ Years | 434 (19.9%) | $44,014 |
| Total | 2,183 (100.0%) | $93,071 |
Poverty in Aubrey
Income Below Poverty by Sex and Age in Aubrey
With 4.2% poverty level for males and 21.1% for females among the residents of Aubrey, 75 year old and over males and 6 to 11 year old females are the most vulnerable to poverty, with 22 males (40.0%) and 211 females (53.3%) in their respective age groups living below the poverty level.
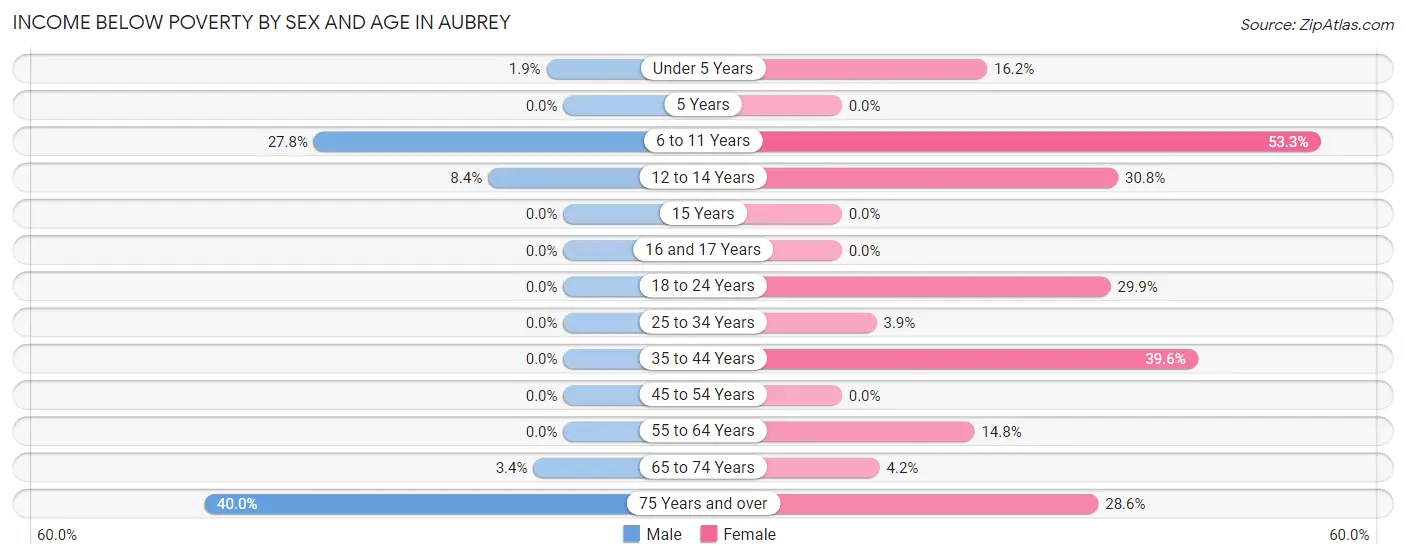
| Age Bracket | Male | Female |
| Under 5 Years | 7 (1.9%) | 33 (16.2%) |
| 5 Years | 0 (0.0%) | 0 (0.0%) |
| 6 to 11 Years | 67 (27.8%) | 211 (53.3%) |
| 12 to 14 Years | 12 (8.4%) | 28 (30.8%) |
| 15 Years | 0 (0.0%) | 0 (0.0%) |
| 16 and 17 Years | 0 (0.0%) | 0 (0.0%) |
| 18 to 24 Years | 0 (0.0%) | 91 (29.9%) |
| 25 to 34 Years | 0 (0.0%) | 15 (3.9%) |
| 35 to 44 Years | 0 (0.0%) | 202 (39.6%) |
| 45 to 54 Years | 0 (0.0%) | 0 (0.0%) |
| 55 to 64 Years | 0 (0.0%) | 56 (14.8%) |
| 65 to 74 Years | 6 (3.4%) | 16 (4.2%) |
| 75 Years and over | 22 (40.0%) | 22 (28.6%) |
| Total | 114 (4.2%) | 674 (21.1%) |
Income Above Poverty by Sex and Age in Aubrey
According to the poverty statistics in Aubrey, males aged 5 years and females aged 16 and 17 years are the age groups that are most secure financially, with 100.0% of males and 100.0% of females in these age groups living above the poverty line.
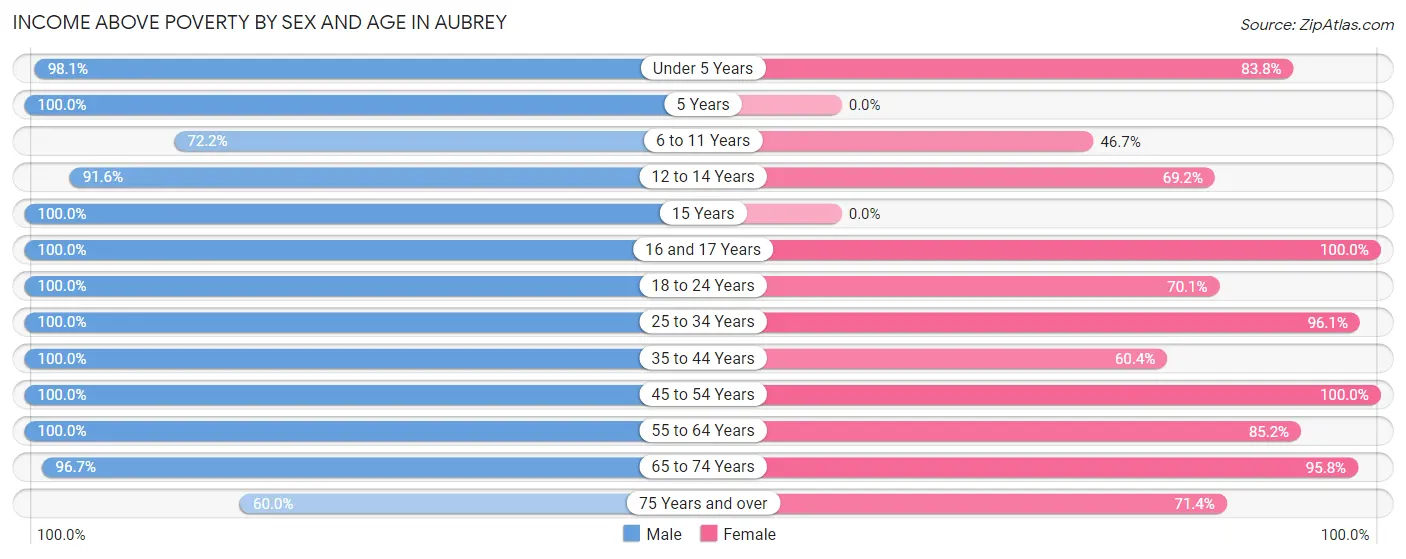
| Age Bracket | Male | Female |
| Under 5 Years | 366 (98.1%) | 171 (83.8%) |
| 5 Years | 18 (100.0%) | 0 (0.0%) |
| 6 to 11 Years | 174 (72.2%) | 185 (46.7%) |
| 12 to 14 Years | 131 (91.6%) | 63 (69.2%) |
| 15 Years | 20 (100.0%) | 0 (0.0%) |
| 16 and 17 Years | 29 (100.0%) | 65 (100.0%) |
| 18 to 24 Years | 139 (100.0%) | 213 (70.1%) |
| 25 to 34 Years | 400 (100.0%) | 373 (96.1%) |
| 35 to 44 Years | 462 (100.0%) | 308 (60.4%) |
| 45 to 54 Years | 392 (100.0%) | 393 (100.0%) |
| 55 to 64 Years | 258 (100.0%) | 323 (85.2%) |
| 65 to 74 Years | 173 (96.7%) | 364 (95.8%) |
| 75 Years and over | 33 (60.0%) | 55 (71.4%) |
| Total | 2,595 (95.8%) | 2,513 (78.8%) |
Income Below Poverty Among Married-Couple Families in Aubrey
The poverty statistics for married-couple families in Aubrey show that 1.8% or 22 of the total 1,187 families live below the poverty line. Families with no children have the highest poverty rate of 3.5%, comprising of 22 families. On the other hand, families with 1 or 2 children have the lowest poverty rate of 0.0%, which includes 0 families.
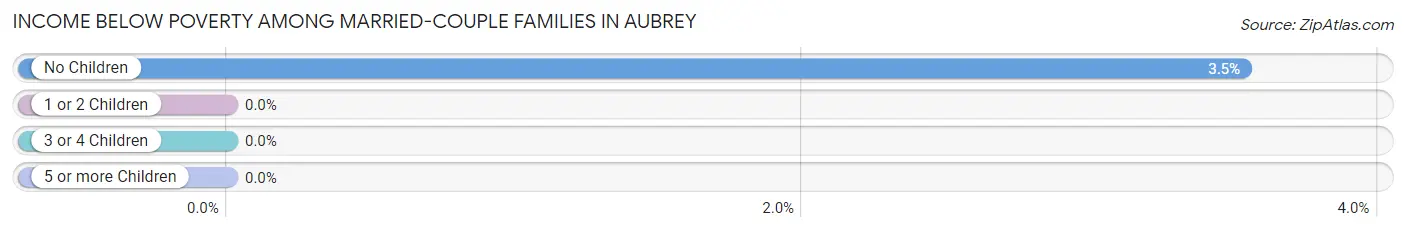
| Children | Above Poverty | Below Poverty |
| No Children | 601 (96.5%) | 22 (3.5%) |
| 1 or 2 Children | 432 (100.0%) | 0 (0.0%) |
| 3 or 4 Children | 132 (100.0%) | 0 (0.0%) |
| 5 or more Children | 0 (0.0%) | 0 (0.0%) |
| Total | 1,165 (98.2%) | 22 (1.8%) |
Income Below Poverty Among Single-Parent Households in Aubrey
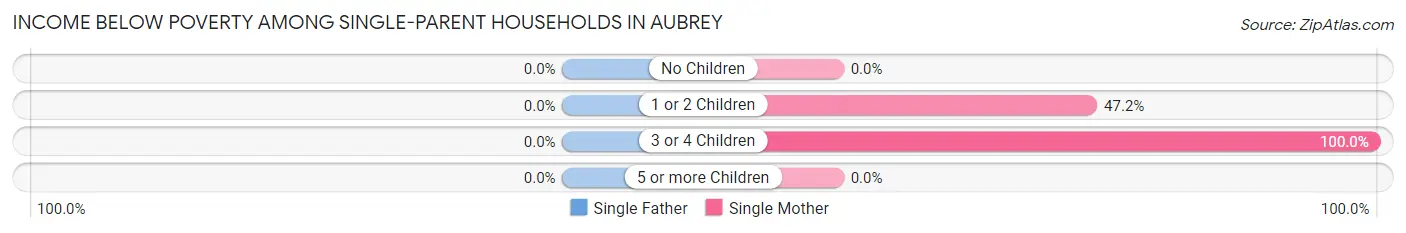
| Children | Single Father | Single Mother |
| No Children | 0 (0.0%) | 0 (0.0%) |
| 1 or 2 Children | 0 (0.0%) | 68 (47.2%) |
| 3 or 4 Children | 0 (0.0%) | 41 (100.0%) |
| 5 or more Children | 0 (0.0%) | 0 (0.0%) |
| Total | 0 (0.0%) | 109 (51.9%) |
Income Below Poverty Among Married-Couple vs Single-Parent Households in Aubrey
The poverty data for Aubrey shows that 22 of the married-couple family households (1.8%) and 109 of the single-parent households (35.5%) are living below the poverty level. Within the married-couple family households, those with no children have the highest poverty rate, with 22 households (3.5%) falling below the poverty line. Among the single-parent households, those with 3 or 4 children have the highest poverty rate, with 41 household (67.2%) living below poverty.
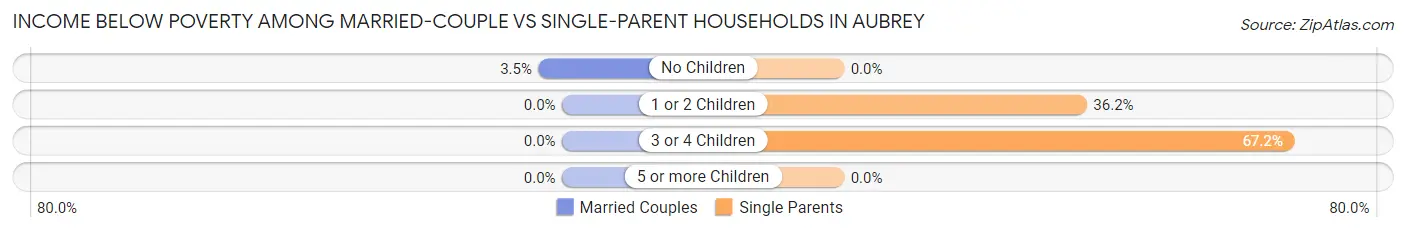
| Children | Married-Couple Families | Single-Parent Households |
| No Children | 22 (3.5%) | 0 (0.0%) |
| 1 or 2 Children | 0 (0.0%) | 68 (36.2%) |
| 3 or 4 Children | 0 (0.0%) | 41 (67.2%) |
| 5 or more Children | 0 (0.0%) | 0 (0.0%) |
| Total | 22 (1.8%) | 109 (35.5%) |
Race in Aubrey
The most populous races in Aubrey are White / Caucasian (4,174 | 70.4%), Black / African American (750 | 12.6%), and Two or more Races (627 | 10.6%).
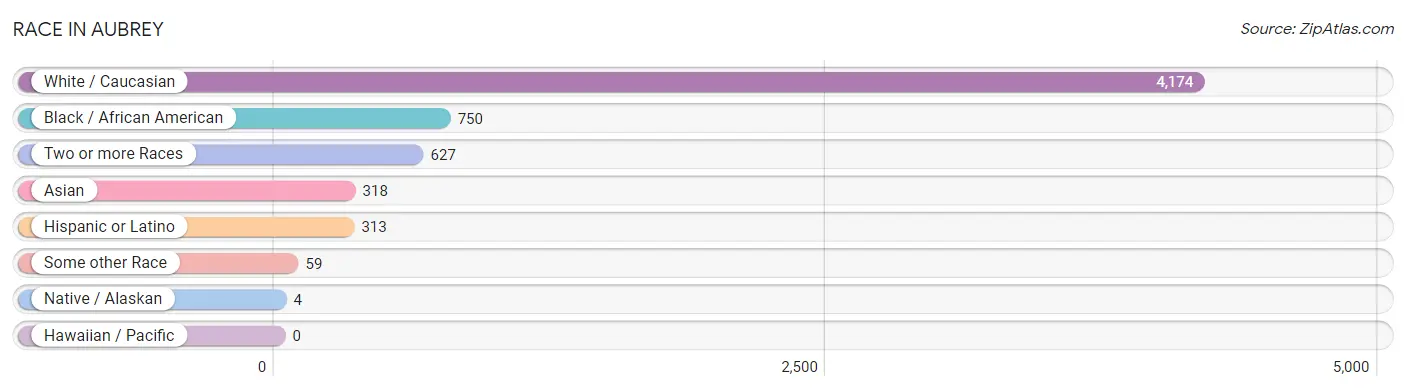
| Race | # Population | % Population |
| Asian | 318 | 5.4% |
| Black / African American | 750 | 12.6% |
| Hawaiian / Pacific | 0 | 0.0% |
| Hispanic or Latino | 313 | 5.3% |
| Native / Alaskan | 4 | 0.1% |
| White / Caucasian | 4,174 | 70.4% |
| Two or more Races | 627 | 10.6% |
| Some other Race | 59 | 1.0% |
| Total | 5,932 | 100.0% |
Ancestry in Aubrey
The most populous ancestries reported in Aubrey are Irish (791 | 13.3%), English (726 | 12.2%), German (483 | 8.1%), Subsaharan African (355 | 6.0%), and American (273 | 4.6%), together accounting for 44.3% of all Aubrey residents.
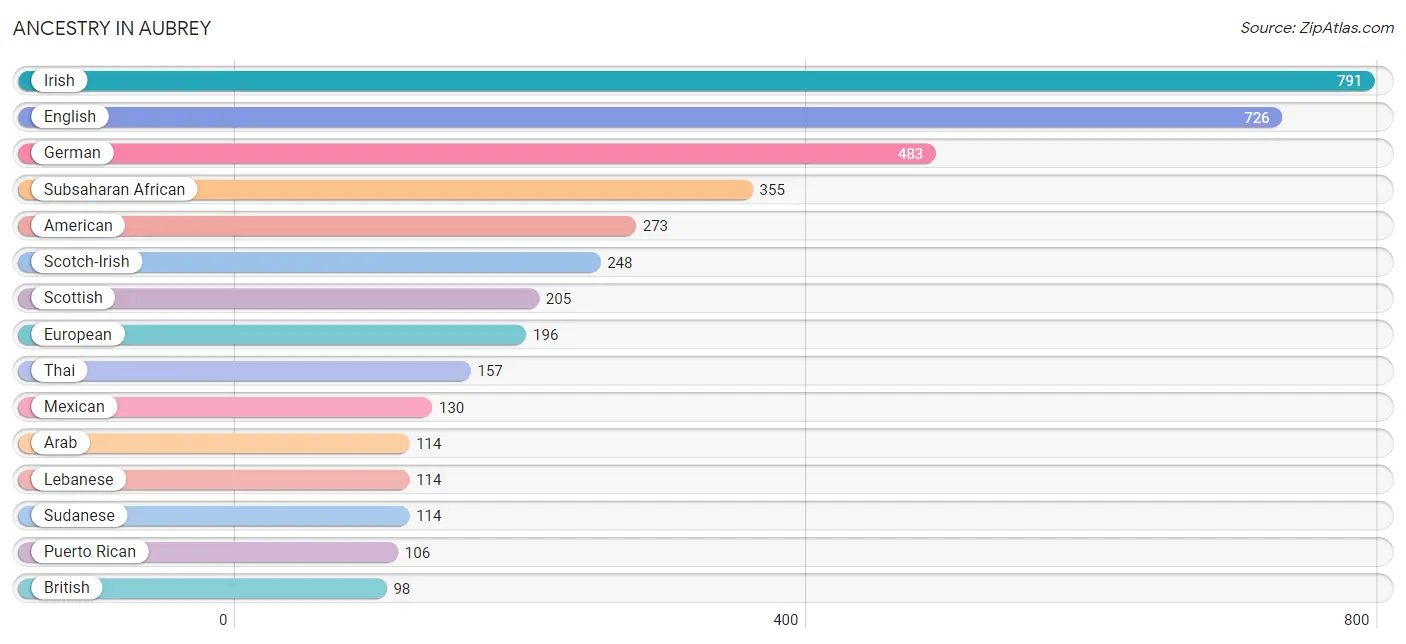
| Ancestry | # Population | % Population |
| African | 38 | 0.6% |
| American | 273 | 4.6% |
| Arab | 114 | 1.9% |
| British | 98 | 1.7% |
| Central American | 15 | 0.3% |
| Cherokee | 39 | 0.7% |
| Choctaw | 4 | 0.1% |
| Colombian | 50 | 0.8% |
| Danish | 12 | 0.2% |
| Dutch | 70 | 1.2% |
| Ecuadorian | 12 | 0.2% |
| English | 726 | 12.2% |
| European | 196 | 3.3% |
| French | 91 | 1.5% |
| German | 483 | 8.1% |
| Guatemalan | 15 | 0.3% |
| Irish | 791 | 13.3% |
| Italian | 64 | 1.1% |
| Korean | 93 | 1.6% |
| Lebanese | 114 | 1.9% |
| Mexican | 130 | 2.2% |
| Norwegian | 19 | 0.3% |
| Polish | 14 | 0.2% |
| Puerto Rican | 106 | 1.8% |
| Scandinavian | 66 | 1.1% |
| Scotch-Irish | 248 | 4.2% |
| Scottish | 205 | 3.5% |
| Serbian | 45 | 0.8% |
| South American | 62 | 1.1% |
| South American Indian | 68 | 1.1% |
| Subsaharan African | 355 | 6.0% |
| Sudanese | 114 | 1.9% |
| Swedish | 31 | 0.5% |
| Thai | 157 | 2.6% |
| Welsh | 14 | 0.2% | View All 35 Rows |
Immigrants in Aubrey
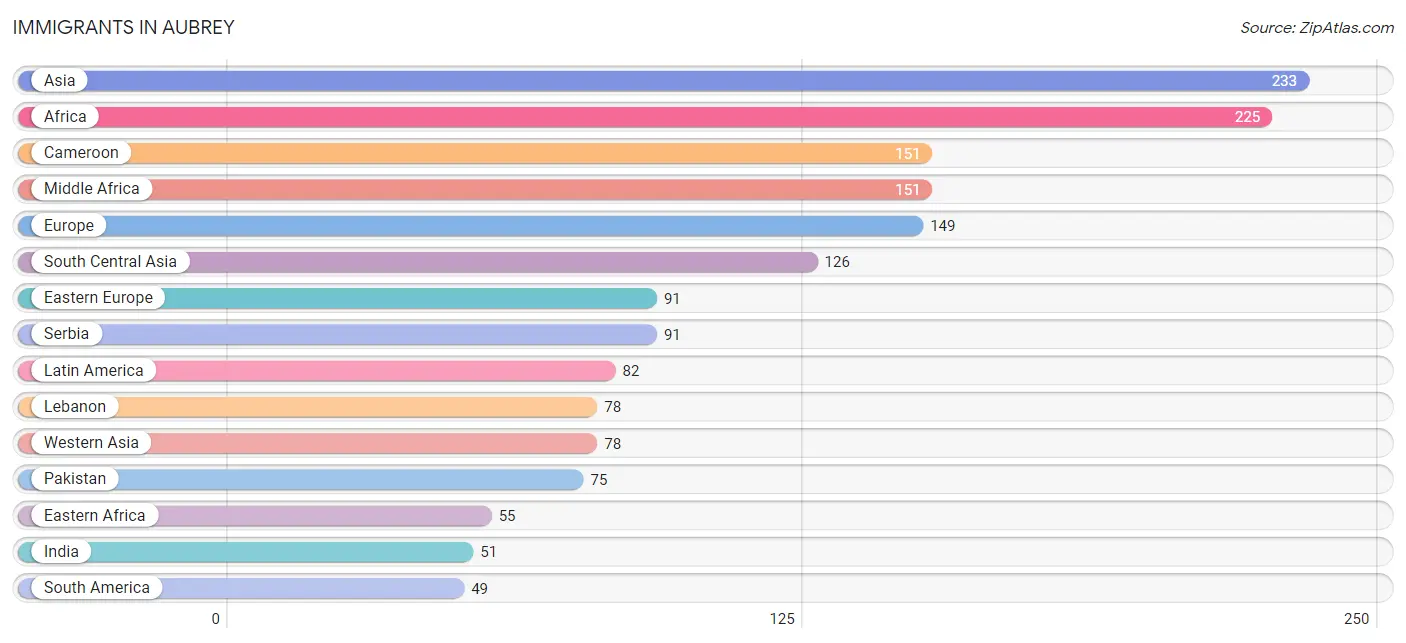
The most numerous immigrant groups reported in Aubrey came from Asia (233 | 3.9%), Africa (225 | 3.8%), Cameroon (151 | 2.5%), Middle Africa (151 | 2.5%), and Europe (149 | 2.5%), together accounting for 15.3% of all Aubrey residents.
| Immigration Origin | # Population | % Population |
| Africa | 225 | 3.8% |
| Asia | 233 | 3.9% |
| Brazil | 25 | 0.4% |
| Cameroon | 151 | 2.5% |
| Central America | 33 | 0.6% |
| Colombia | 24 | 0.4% |
| Eastern Africa | 55 | 0.9% |
| Eastern Europe | 91 | 1.5% |
| Europe | 149 | 2.5% |
| Germany | 19 | 0.3% |
| Greece | 20 | 0.3% |
| India | 51 | 0.9% |
| Latin America | 82 | 1.4% |
| Lebanon | 78 | 1.3% |
| Mexico | 33 | 0.6% |
| Middle Africa | 151 | 2.5% |
| Northern Europe | 19 | 0.3% |
| Pakistan | 75 | 1.3% |
| Philippines | 29 | 0.5% |
| Serbia | 91 | 1.5% |
| South Africa | 19 | 0.3% |
| South America | 49 | 0.8% |
| South Central Asia | 126 | 2.1% |
| South Eastern Asia | 29 | 0.5% |
| Southern Europe | 20 | 0.3% |
| Western Asia | 78 | 1.3% |
| Western Europe | 19 | 0.3% | View All 27 Rows |
Sex and Age in Aubrey
Sex and Age in Aubrey
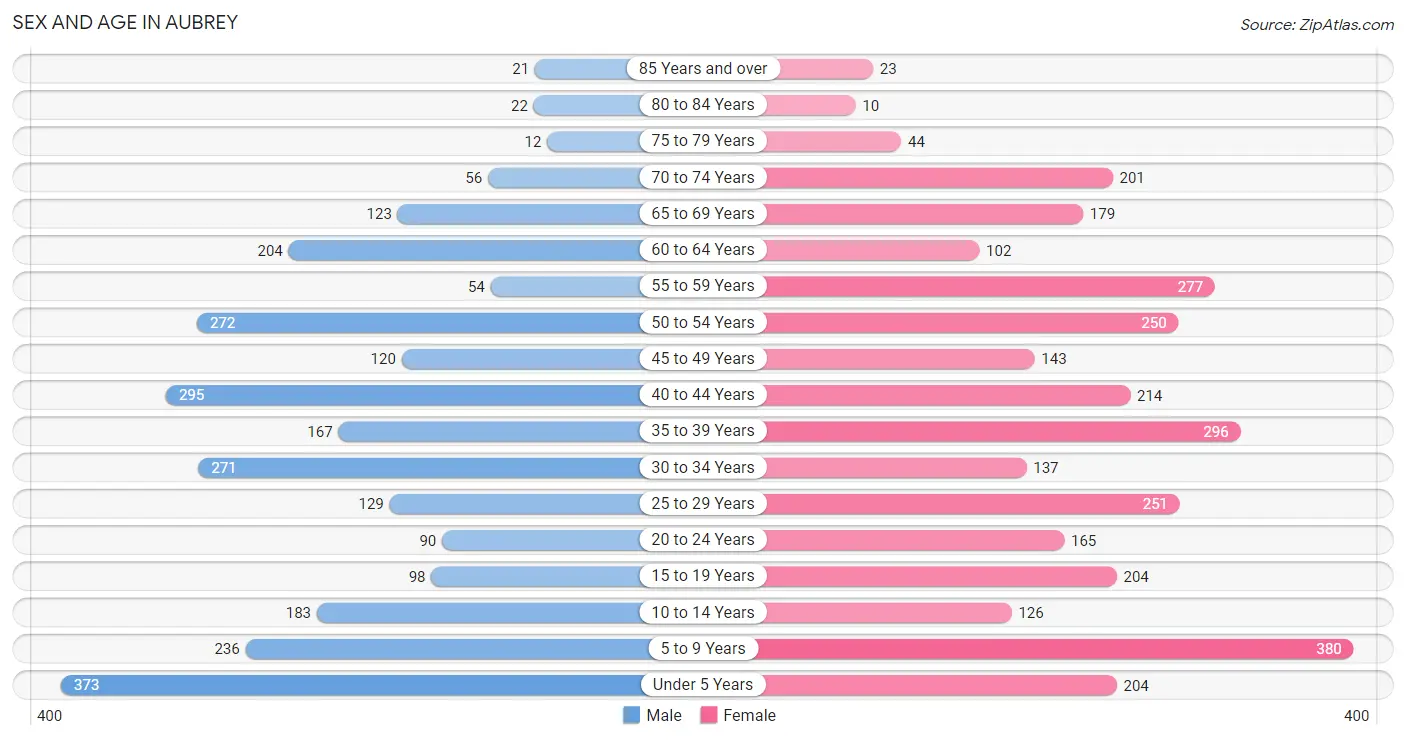
The most populous age groups in Aubrey are Under 5 Years (373 | 13.7%) for men and 5 to 9 Years (380 | 11.8%) for women.
| Age Bracket | Male | Female |
| Under 5 Years | 373 (13.7%) | 204 (6.4%) |
| 5 to 9 Years | 236 (8.7%) | 380 (11.8%) |
| 10 to 14 Years | 183 (6.7%) | 126 (3.9%) |
| 15 to 19 Years | 98 (3.6%) | 204 (6.4%) |
| 20 to 24 Years | 90 (3.3%) | 165 (5.1%) |
| 25 to 29 Years | 129 (4.7%) | 251 (7.8%) |
| 30 to 34 Years | 271 (9.9%) | 137 (4.3%) |
| 35 to 39 Years | 167 (6.1%) | 296 (9.2%) |
| 40 to 44 Years | 295 (10.8%) | 214 (6.7%) |
| 45 to 49 Years | 120 (4.4%) | 143 (4.5%) |
| 50 to 54 Years | 272 (10.0%) | 250 (7.8%) |
| 55 to 59 Years | 54 (2.0%) | 277 (8.6%) |
| 60 to 64 Years | 204 (7.5%) | 102 (3.2%) |
| 65 to 69 Years | 123 (4.5%) | 179 (5.6%) |
| 70 to 74 Years | 56 (2.1%) | 201 (6.3%) |
| 75 to 79 Years | 12 (0.4%) | 44 (1.4%) |
| 80 to 84 Years | 22 (0.8%) | 10 (0.3%) |
| 85 Years and over | 21 (0.8%) | 23 (0.7%) |
| Total | 2,726 (100.0%) | 3,206 (100.0%) |
Families and Households in Aubrey
Median Family Size in Aubrey
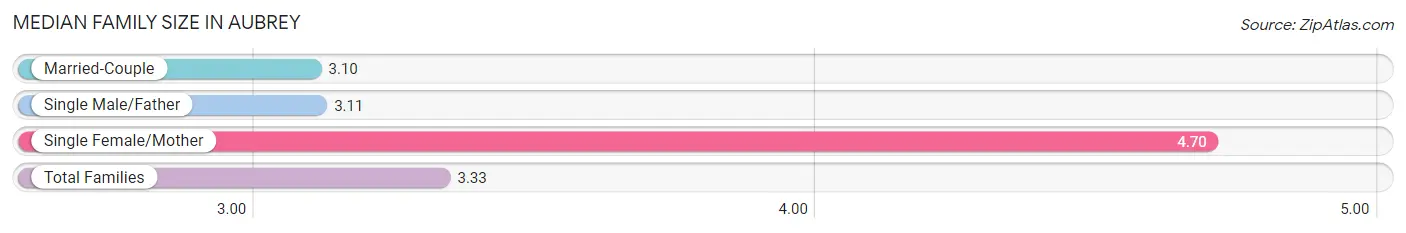
The median family size in Aubrey is 3.33 persons per family, with single female/mother families (210 | 14.1%) accounting for the largest median family size of 4.7 persons per family. On the other hand, married-couple families (1,187 | 79.4%) represent the smallest median family size with 3.10 persons per family.
| Family Type | # Families | Family Size |
| Married-Couple | 1,187 (79.4%) | 3.10 |
| Single Male/Father | 97 (6.5%) | 3.11 |
| Single Female/Mother | 210 (14.1%) | 4.70 |
| Total Families | 1,494 (100.0%) | 3.33 |
Median Household Size in Aubrey
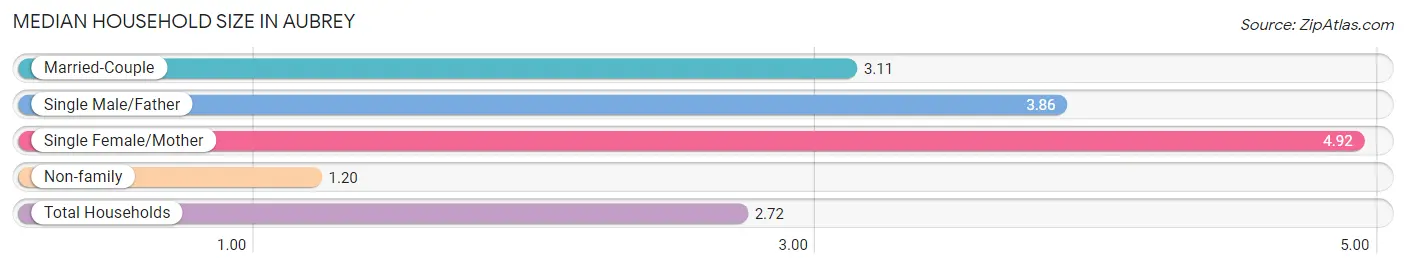
The median household size in Aubrey is 2.72 persons per household, with single female/mother households (210 | 9.6%) accounting for the largest median household size of 4.92 persons per household. non-family households (689 | 31.6%) represent the smallest median household size with 1.20 persons per household.
| Household Type | # Households | Household Size |
| Married-Couple | 1,187 (54.4%) | 3.11 |
| Single Male/Father | 97 (4.4%) | 3.86 |
| Single Female/Mother | 210 (9.6%) | 4.92 |
| Non-family | 689 (31.6%) | 1.20 |
| Total Households | 2,183 (100.0%) | 2.72 |
Household Size by Marriage Status in Aubrey
Out of a total of 2,183 households in Aubrey, 1,494 (68.4%) are family households, while 689 (31.6%) are nonfamily households. The most numerous type of family households are 2-person households, comprising 572, and the most common type of nonfamily households are 1-person households, comprising 576.
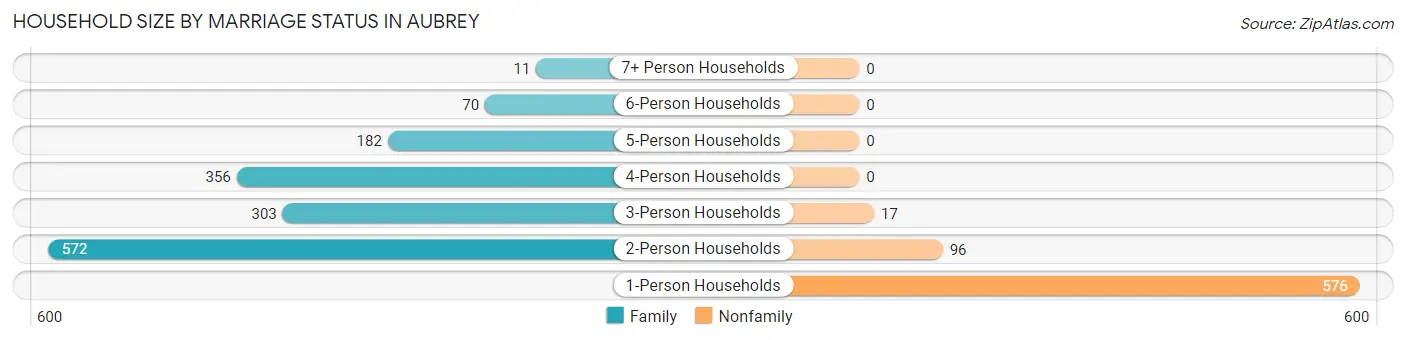
| Household Size | Family Households | Nonfamily Households |
| 1-Person Households | - | 576 (26.4%) |
| 2-Person Households | 572 (26.2%) | 96 (4.4%) |
| 3-Person Households | 303 (13.9%) | 17 (0.8%) |
| 4-Person Households | 356 (16.3%) | 0 (0.0%) |
| 5-Person Households | 182 (8.3%) | 0 (0.0%) |
| 6-Person Households | 70 (3.2%) | 0 (0.0%) |
| 7+ Person Households | 11 (0.5%) | 0 (0.0%) |
| Total | 1,494 (68.4%) | 689 (31.6%) |
Female Fertility in Aubrey
Fertility by Age in Aubrey
Average fertility rate in Aubrey is 53.0 births per 1,000 women. Women in the age bracket of 20 to 34 years have the highest fertility rate with 101.0 births per 1,000 women. Women in the age bracket of 20 to 34 years acount for 72.7% of all women with births.
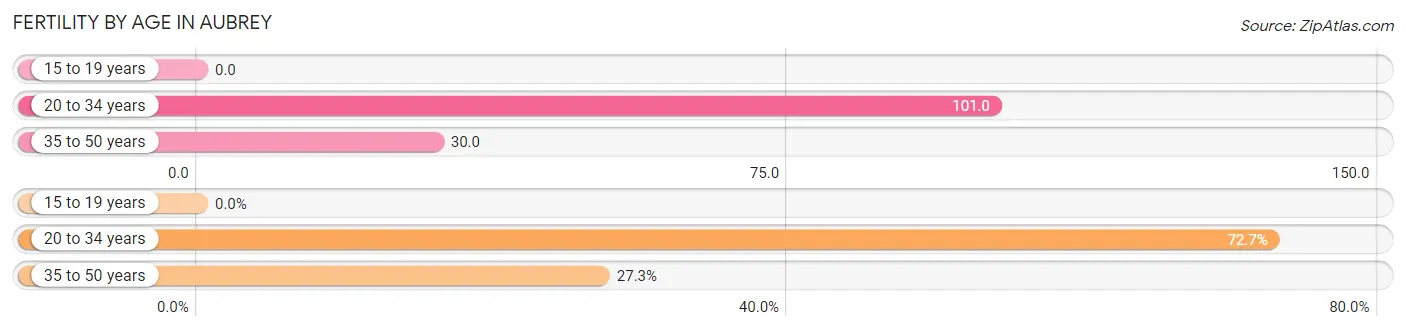
| Age Bracket | Women with Births | Births / 1,000 Women |
| 15 to 19 years | 0 (0.0%) | 0.0 |
| 20 to 34 years | 56 (72.7%) | 101.0 |
| 35 to 50 years | 21 (27.3%) | 30.0 |
| Total | 77 (100.0%) | 53.0 |
Fertility by Age by Marriage Status in Aubrey
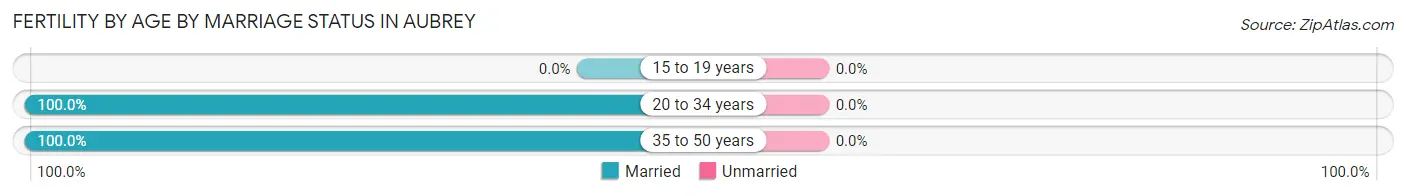
| Age Bracket | Married | Unmarried |
| 15 to 19 years | 0 (0.0%) | 0 (0.0%) |
| 20 to 34 years | 56 (100.0%) | 0 (0.0%) |
| 35 to 50 years | 21 (100.0%) | 0 (0.0%) |
| Total | 77 (100.0%) | 0 (0.0%) |
Fertility by Education in Aubrey
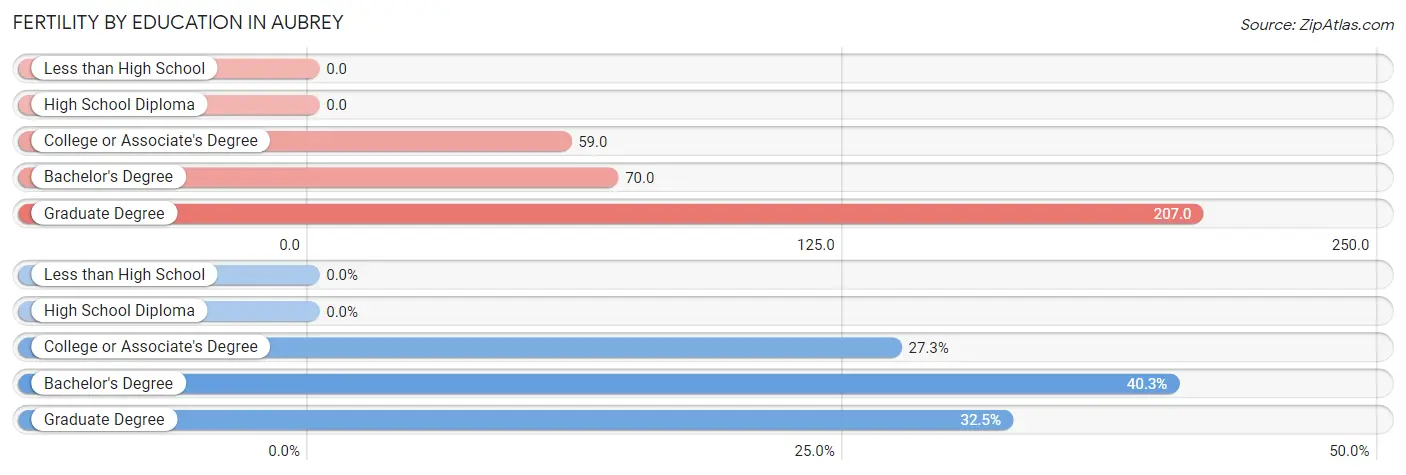
| Educational Attainment | Women with Births | Births / 1,000 Women |
| Less than High School | 0 (0.0%) | 0.0 |
| High School Diploma | 0 (0.0%) | 0.0 |
| College or Associate's Degree | 21 (27.3%) | 59.0 |
| Bachelor's Degree | 31 (40.3%) | 70.0 |
| Graduate Degree | 25 (32.5%) | 207.0 |
| Total | 77 (100.0%) | 53.0 |
Fertility by Education by Marriage Status in Aubrey
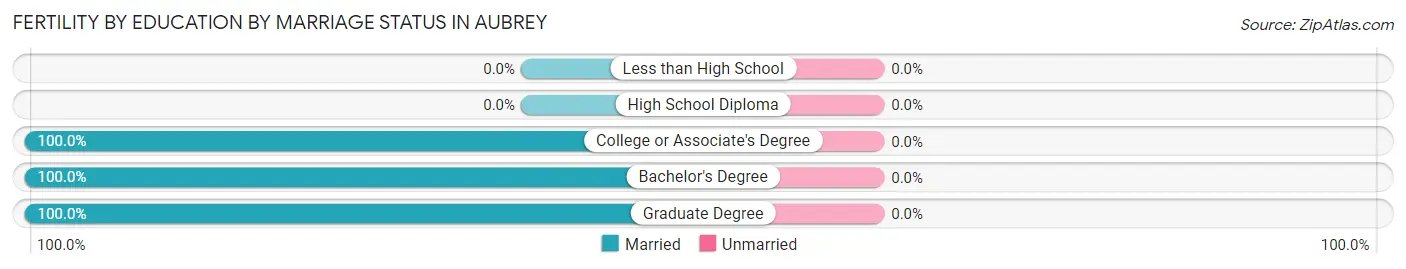
| Educational Attainment | Married | Unmarried |
| Less than High School | 0 (0.0%) | 0 (0.0%) |
| High School Diploma | 0 (0.0%) | 0 (0.0%) |
| College or Associate's Degree | 21 (100.0%) | 0 (0.0%) |
| Bachelor's Degree | 31 (100.0%) | 0 (0.0%) |
| Graduate Degree | 25 (100.0%) | 0 (0.0%) |
| Total | 77 (100.0%) | 0 (0.0%) |
Employment Characteristics in Aubrey
Employment by Class of Employer in Aubrey
Among the 3,082 employed individuals in Aubrey, private company employees (2,056 | 66.7%), self-employed (not incorporated) (304 | 9.9%), and local government employees (201 | 6.5%) make up the most common classes of employment.
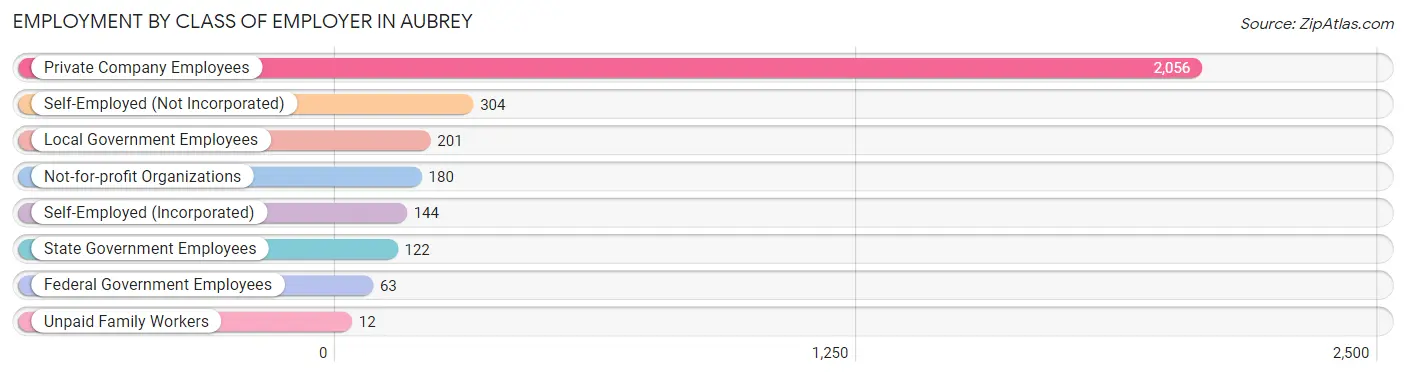
| Employer Class | # Employees | % Employees |
| Private Company Employees | 2,056 | 66.7% |
| Self-Employed (Incorporated) | 144 | 4.7% |
| Self-Employed (Not Incorporated) | 304 | 9.9% |
| Not-for-profit Organizations | 180 | 5.8% |
| Local Government Employees | 201 | 6.5% |
| State Government Employees | 122 | 4.0% |
| Federal Government Employees | 63 | 2.0% |
| Unpaid Family Workers | 12 | 0.4% |
| Total | 3,082 | 100.0% |
Employment Status by Age in Aubrey
According to the labor force statistics for Aubrey, out of the total population over 16 years of age (4,410), 72.4% or 3,193 individuals are in the labor force, with 2.3% or 73 of them unemployed. The age group with the highest labor force participation rate is 45 to 54 years, with 98.2% or 771 individuals in the labor force. Within the labor force, the 16 to 19 years age range has the highest percentage of unemployed individuals, with 15.2% or 24 of them being unemployed.
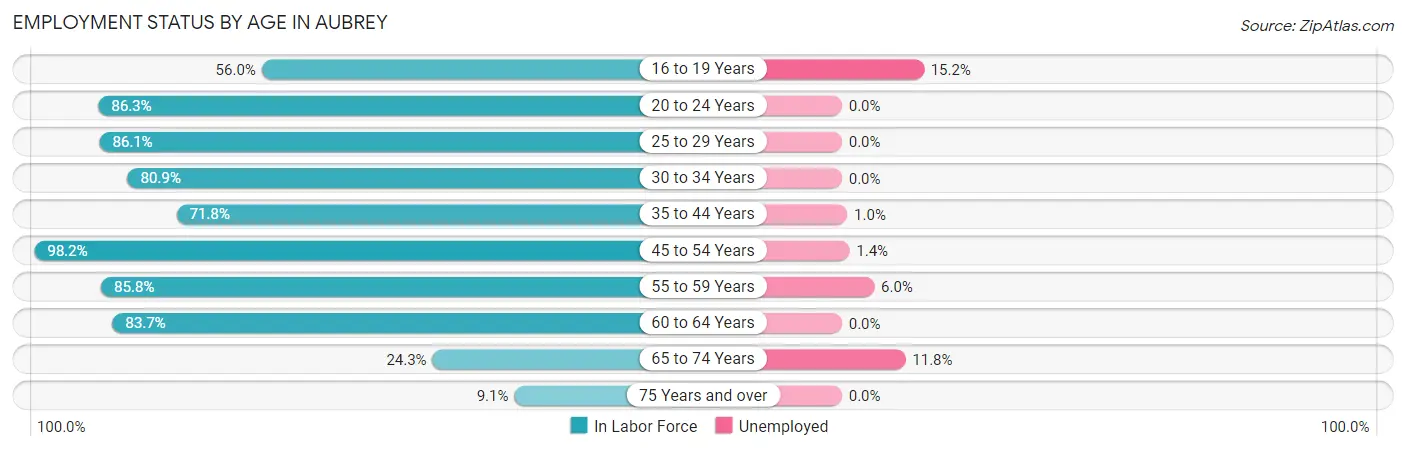
| Age Bracket | In Labor Force | Unemployed |
| 16 to 19 Years | 158 (56.0%) | 24 (15.2%) |
| 20 to 24 Years | 220 (86.3%) | 0 (0.0%) |
| 25 to 29 Years | 327 (86.1%) | 0 (0.0%) |
| 30 to 34 Years | 330 (80.9%) | 0 (0.0%) |
| 35 to 44 Years | 698 (71.8%) | 7 (1.0%) |
| 45 to 54 Years | 771 (98.2%) | 11 (1.4%) |
| 55 to 59 Years | 284 (85.8%) | 17 (6.0%) |
| 60 to 64 Years | 256 (83.7%) | 0 (0.0%) |
| 65 to 74 Years | 136 (24.3%) | 16 (11.8%) |
| 75 Years and over | 12 (9.1%) | 0 (0.0%) |
| Total | 3,193 (72.4%) | 73 (2.3%) |
Employment Status by Educational Attainment in Aubrey
According to labor force statistics for Aubrey, 83.8% of individuals (2,667) out of the total population between 25 and 64 years of age (3,182) are in the labor force, with 1.3% or 35 of them being unemployed. The group with the highest labor force participation rate are those with the educational attainment of bachelor's degree or higher, with 94.0% or 1,283 individuals in the labor force. Within the labor force, individuals with college / associate degree education have the highest percentage of unemployment, with 4.7% or 35 of them being unemployed.
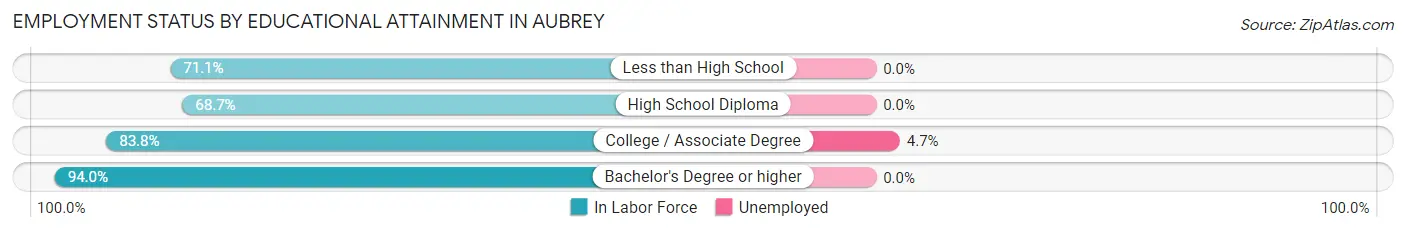
| Educational Attainment | In Labor Force | Unemployed |
| Less than High School | 59 (71.1%) | 0 (0.0%) |
| High School Diploma | 586 (68.7%) | 0 (0.0%) |
| College / Associate Degree | 738 (83.8%) | 41 (4.7%) |
| Bachelor's Degree or higher | 1,283 (94.0%) | 0 (0.0%) |
| Total | 2,667 (83.8%) | 41 (1.3%) |
Employment Occupations by Sex in Aubrey
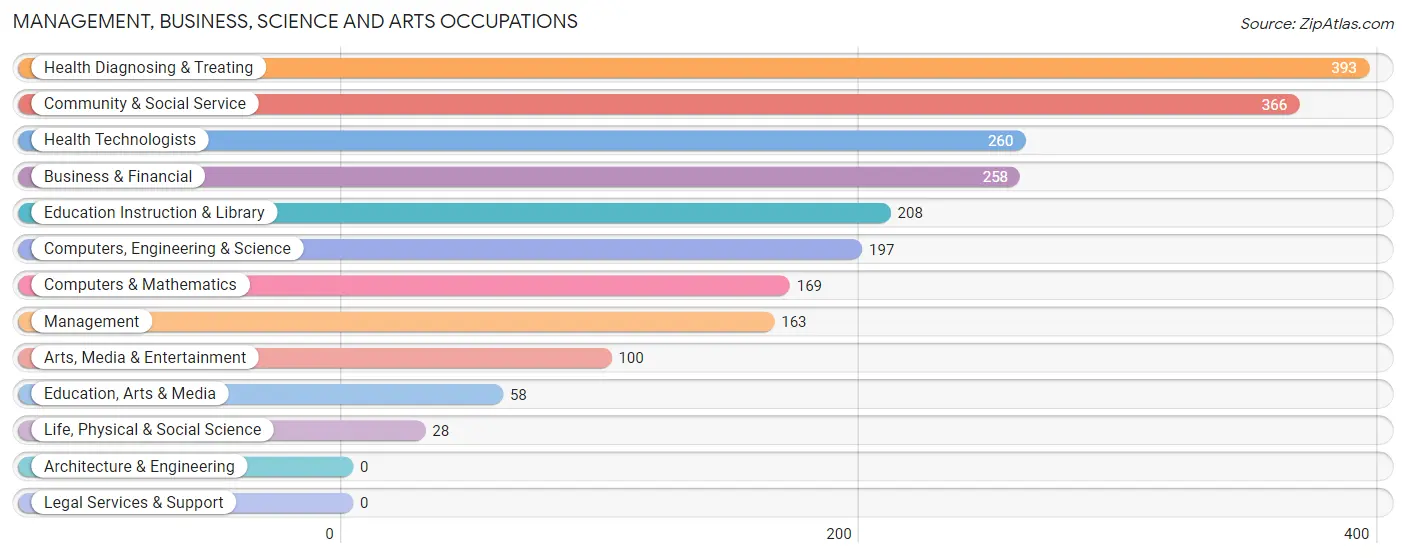
Management, Business, Science and Arts Occupations
The most common Management, Business, Science and Arts occupations in Aubrey are Health Diagnosing & Treating (393 | 12.6%), Community & Social Service (366 | 11.7%), Health Technologists (260 | 8.3%), Business & Financial (258 | 8.3%), and Education Instruction & Library (208 | 6.7%).
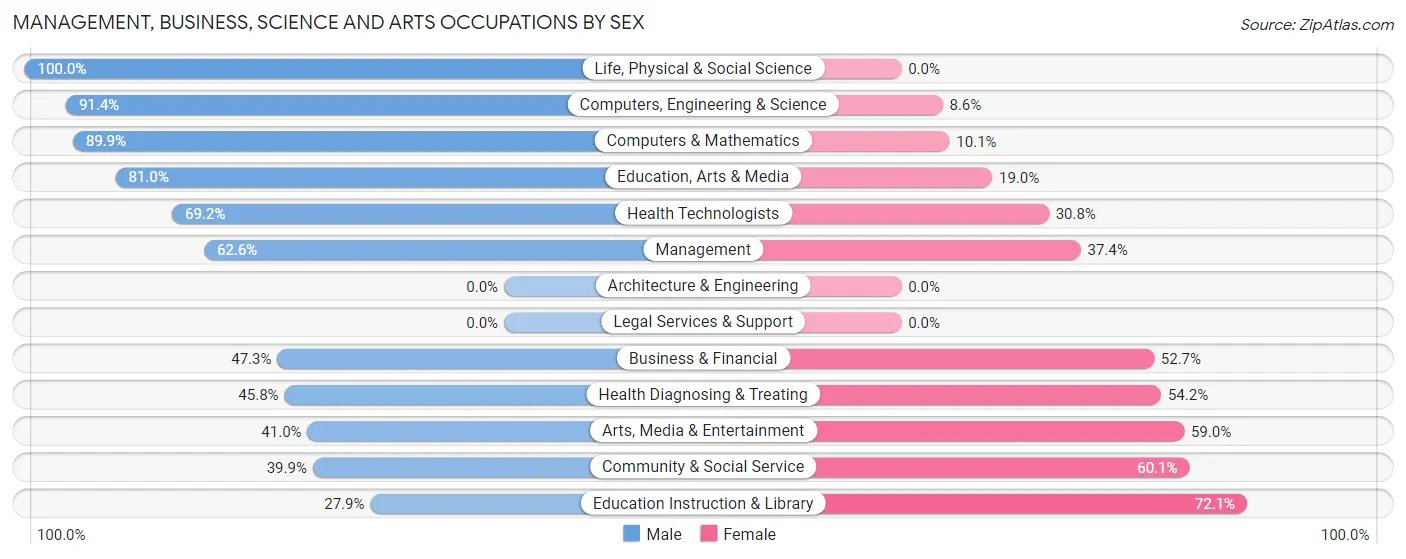
Management, Business, Science and Arts Occupations by Sex
Within the Management, Business, Science and Arts occupations in Aubrey, the most male-oriented occupations are Life, Physical & Social Science (100.0%), Computers, Engineering & Science (91.4%), and Computers & Mathematics (89.9%), while the most female-oriented occupations are Education Instruction & Library (72.1%), Community & Social Service (60.1%), and Arts, Media & Entertainment (59.0%).
| Occupation | Male | Female |
| Management | 102 (62.6%) | 61 (37.4%) |
| Business & Financial | 122 (47.3%) | 136 (52.7%) |
| Computers, Engineering & Science | 180 (91.4%) | 17 (8.6%) |
| Computers & Mathematics | 152 (89.9%) | 17 (10.1%) |
| Architecture & Engineering | 0 (0.0%) | 0 (0.0%) |
| Life, Physical & Social Science | 28 (100.0%) | 0 (0.0%) |
| Community & Social Service | 146 (39.9%) | 220 (60.1%) |
| Education, Arts & Media | 47 (81.0%) | 11 (19.0%) |
| Legal Services & Support | 0 (0.0%) | 0 (0.0%) |
| Education Instruction & Library | 58 (27.9%) | 150 (72.1%) |
| Arts, Media & Entertainment | 41 (41.0%) | 59 (59.0%) |
| Health Diagnosing & Treating | 180 (45.8%) | 213 (54.2%) |
| Health Technologists | 180 (69.2%) | 80 (30.8%) |
| Total (Category) | 730 (53.0%) | 647 (47.0%) |
| Total (Overall) | 1,580 (50.7%) | 1,537 (49.3%) |
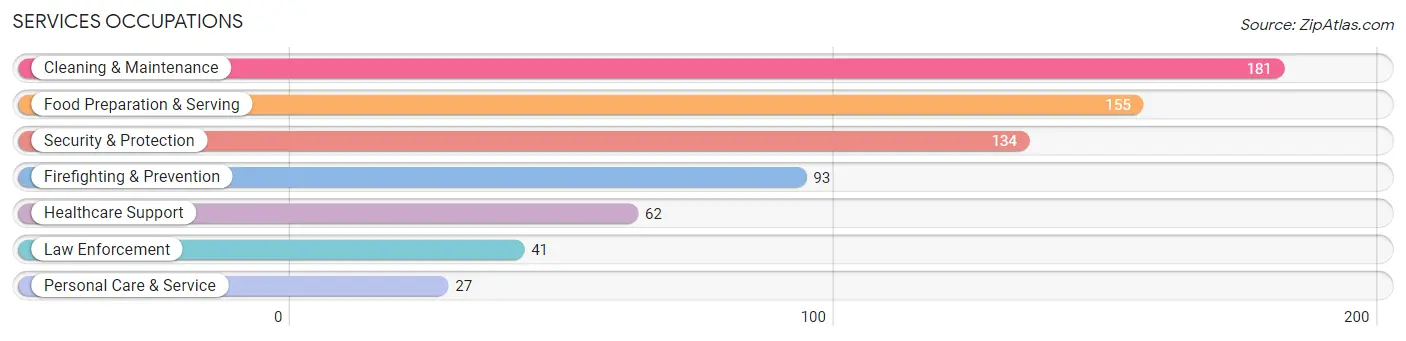
Services Occupations
The most common Services occupations in Aubrey are Cleaning & Maintenance (181 | 5.8%), Food Preparation & Serving (155 | 5.0%), Security & Protection (134 | 4.3%), Firefighting & Prevention (93 | 3.0%), and Healthcare Support (62 | 2.0%).
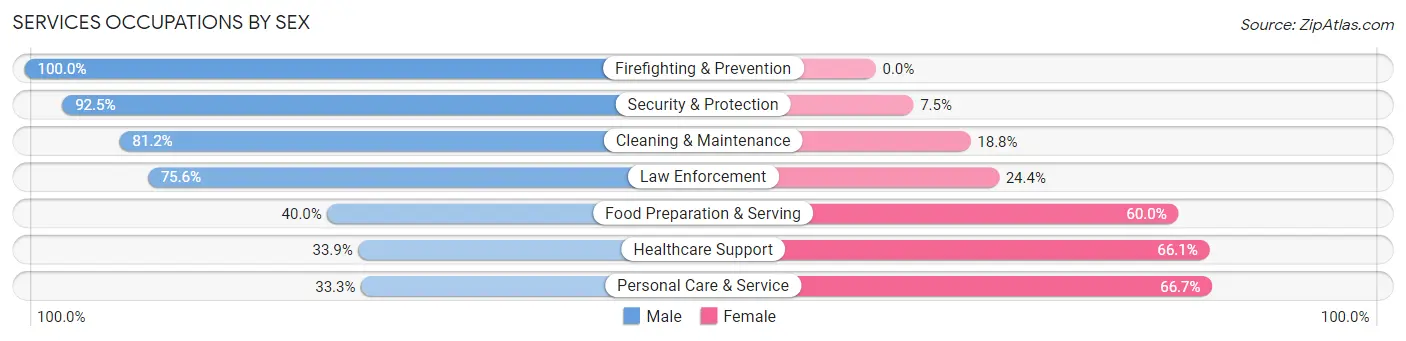
Services Occupations by Sex
Within the Services occupations in Aubrey, the most male-oriented occupations are Firefighting & Prevention (100.0%), Security & Protection (92.5%), and Cleaning & Maintenance (81.2%), while the most female-oriented occupations are Personal Care & Service (66.7%), Healthcare Support (66.1%), and Food Preparation & Serving (60.0%).
| Occupation | Male | Female |
| Healthcare Support | 21 (33.9%) | 41 (66.1%) |
| Security & Protection | 124 (92.5%) | 10 (7.5%) |
| Firefighting & Prevention | 93 (100.0%) | 0 (0.0%) |
| Law Enforcement | 31 (75.6%) | 10 (24.4%) |
| Food Preparation & Serving | 62 (40.0%) | 93 (60.0%) |
| Cleaning & Maintenance | 147 (81.2%) | 34 (18.8%) |
| Personal Care & Service | 9 (33.3%) | 18 (66.7%) |
| Total (Category) | 363 (64.9%) | 196 (35.1%) |
| Total (Overall) | 1,580 (50.7%) | 1,537 (49.3%) |
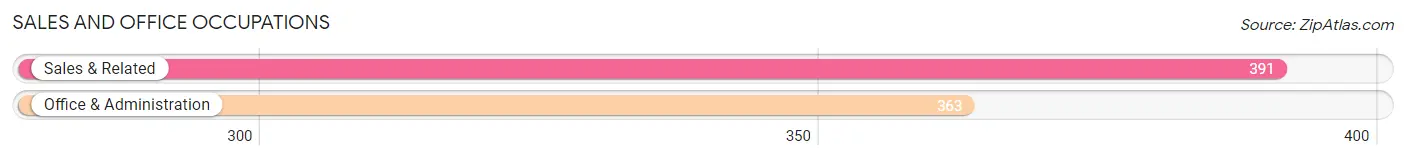
Sales and Office Occupations
The most common Sales and Office occupations in Aubrey are Sales & Related (391 | 12.5%), and Office & Administration (363 | 11.7%).
Sales and Office Occupations by Sex
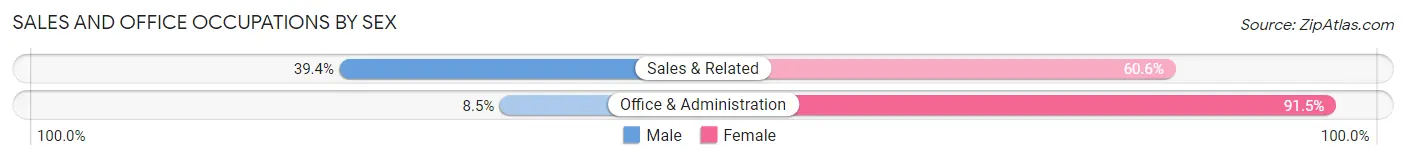
| Occupation | Male | Female |
| Sales & Related | 154 (39.4%) | 237 (60.6%) |
| Office & Administration | 31 (8.5%) | 332 (91.5%) |
| Total (Category) | 185 (24.5%) | 569 (75.5%) |
| Total (Overall) | 1,580 (50.7%) | 1,537 (49.3%) |
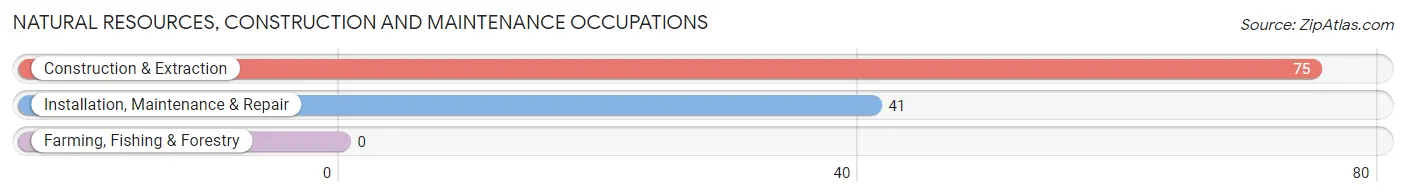
Natural Resources, Construction and Maintenance Occupations
The most common Natural Resources, Construction and Maintenance occupations in Aubrey are Construction & Extraction (75 | 2.4%), and Installation, Maintenance & Repair (41 | 1.3%).
Natural Resources, Construction and Maintenance Occupations by Sex
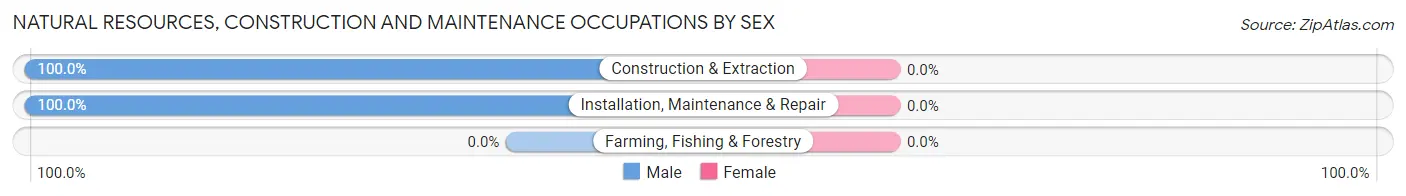
| Occupation | Male | Female |
| Farming, Fishing & Forestry | 0 (0.0%) | 0 (0.0%) |
| Construction & Extraction | 75 (100.0%) | 0 (0.0%) |
| Installation, Maintenance & Repair | 41 (100.0%) | 0 (0.0%) |
| Total (Category) | 116 (100.0%) | 0 (0.0%) |
| Total (Overall) | 1,580 (50.7%) | 1,537 (49.3%) |
Production, Transportation and Moving Occupations
The most common Production, Transportation and Moving occupations in Aubrey are Material Moving (142 | 4.6%), Transportation (107 | 3.4%), and Production (62 | 2.0%).
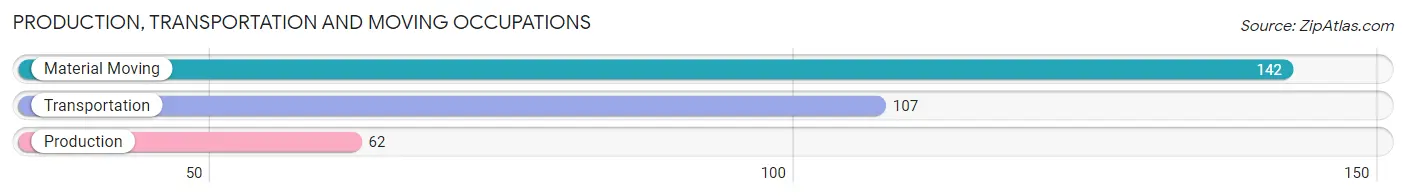
Production, Transportation and Moving Occupations by Sex
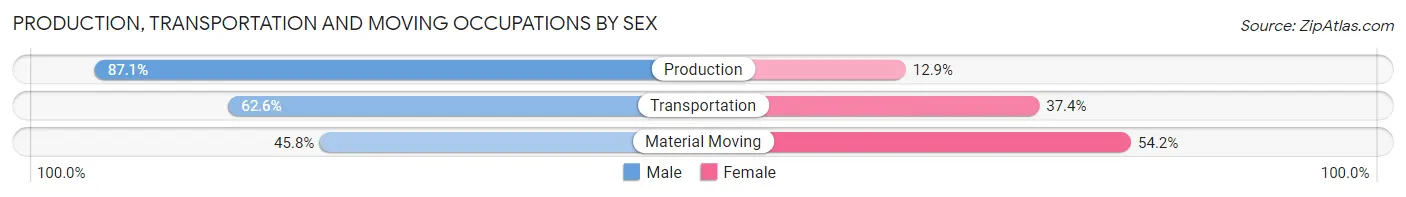
| Occupation | Male | Female |
| Production | 54 (87.1%) | 8 (12.9%) |
| Transportation | 67 (62.6%) | 40 (37.4%) |
| Material Moving | 65 (45.8%) | 77 (54.2%) |
| Total (Category) | 186 (59.8%) | 125 (40.2%) |
| Total (Overall) | 1,580 (50.7%) | 1,537 (49.3%) |
Employment Industries by Sex in Aubrey
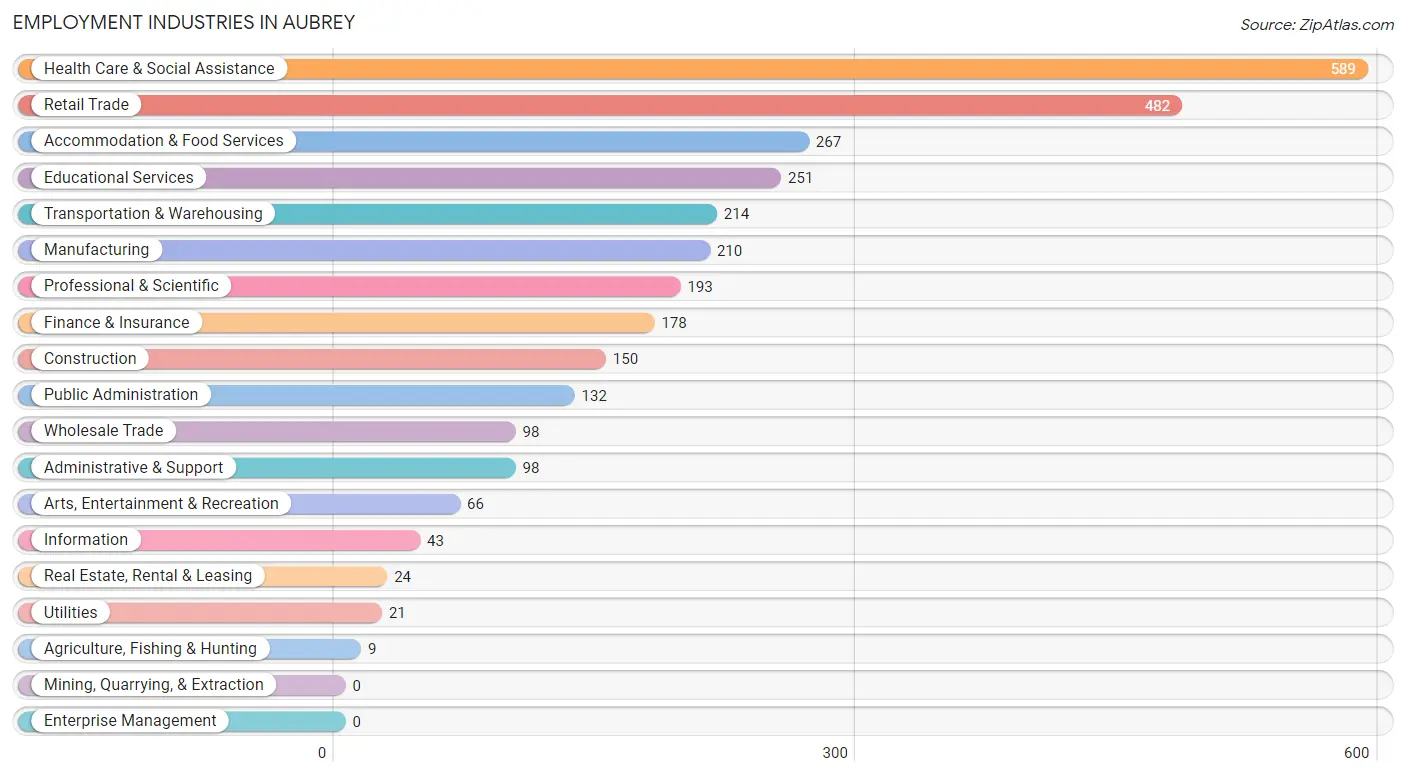
Employment Industries in Aubrey
The major employment industries in Aubrey include Health Care & Social Assistance (589 | 18.9%), Retail Trade (482 | 15.5%), Accommodation & Food Services (267 | 8.6%), Educational Services (251 | 8.1%), and Transportation & Warehousing (214 | 6.9%).
Employment Industries by Sex in Aubrey
The Aubrey industries that see more men than women are Agriculture, Fishing & Hunting (100.0%), Utilities (100.0%), and Administrative & Support (100.0%), whereas the industries that tend to have a higher number of women are Information (100.0%), Real Estate, Rental & Leasing (100.0%), and Retail Trade (70.3%).
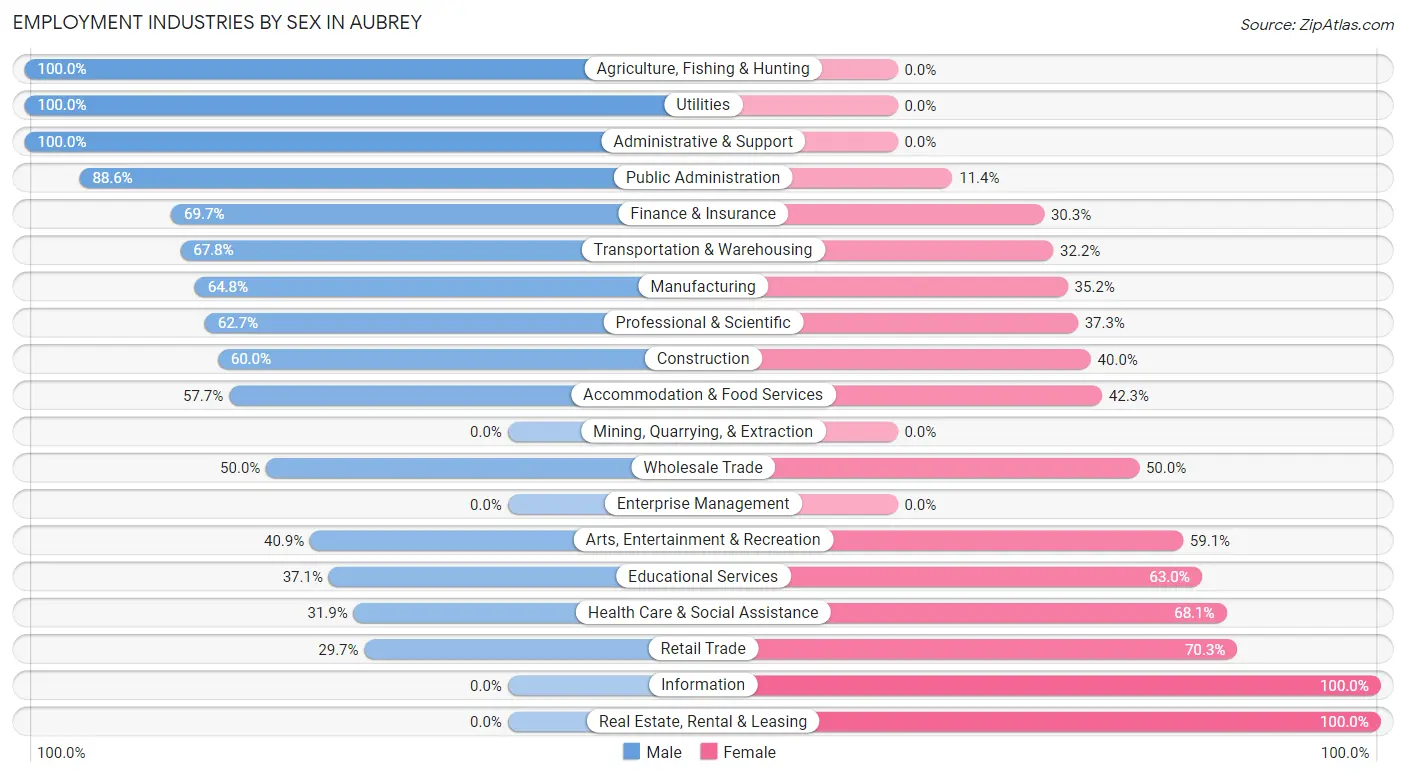
| Industry | Male | Female |
| Agriculture, Fishing & Hunting | 9 (100.0%) | 0 (0.0%) |
| Mining, Quarrying, & Extraction | 0 (0.0%) | 0 (0.0%) |
| Construction | 90 (60.0%) | 60 (40.0%) |
| Manufacturing | 136 (64.8%) | 74 (35.2%) |
| Wholesale Trade | 49 (50.0%) | 49 (50.0%) |
| Retail Trade | 143 (29.7%) | 339 (70.3%) |
| Transportation & Warehousing | 145 (67.8%) | 69 (32.2%) |
| Utilities | 21 (100.0%) | 0 (0.0%) |
| Information | 0 (0.0%) | 43 (100.0%) |
| Finance & Insurance | 124 (69.7%) | 54 (30.3%) |
| Real Estate, Rental & Leasing | 0 (0.0%) | 24 (100.0%) |
| Professional & Scientific | 121 (62.7%) | 72 (37.3%) |
| Enterprise Management | 0 (0.0%) | 0 (0.0%) |
| Administrative & Support | 98 (100.0%) | 0 (0.0%) |
| Educational Services | 93 (37.0%) | 158 (62.9%) |
| Health Care & Social Assistance | 188 (31.9%) | 401 (68.1%) |
| Arts, Entertainment & Recreation | 27 (40.9%) | 39 (59.1%) |
| Accommodation & Food Services | 154 (57.7%) | 113 (42.3%) |
| Public Administration | 117 (88.6%) | 15 (11.4%) |
| Total | 1,580 (50.7%) | 1,537 (49.3%) |
Education in Aubrey
School Enrollment in Aubrey
The most common levels of schooling among the 1,529 students in Aubrey are elementary school (469 | 30.7%), middle school (254 | 16.6%), and college / undergraduate (233 | 15.2%).
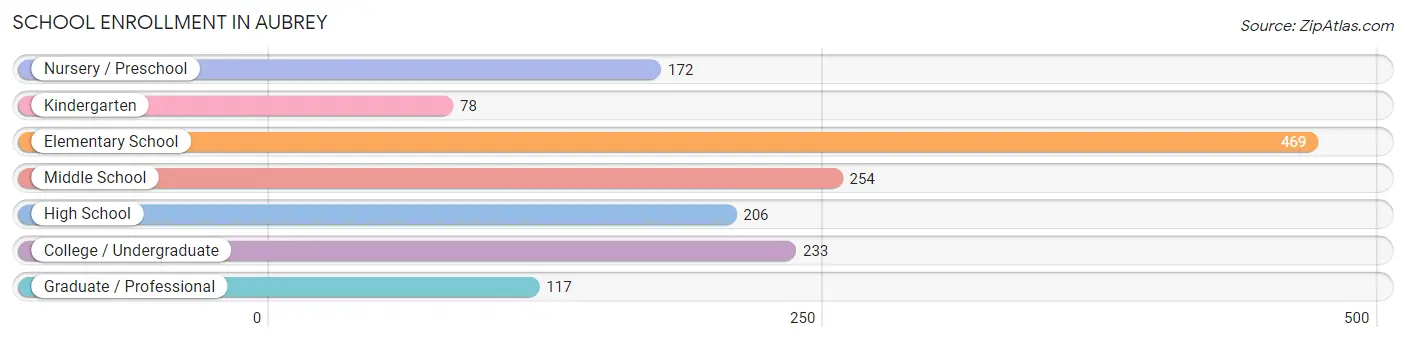
| School Level | # Students | % Students |
| Nursery / Preschool | 172 | 11.3% |
| Kindergarten | 78 | 5.1% |
| Elementary School | 469 | 30.7% |
| Middle School | 254 | 16.6% |
| High School | 206 | 13.5% |
| College / Undergraduate | 233 | 15.2% |
| Graduate / Professional | 117 | 7.6% |
| Total | 1,529 | 100.0% |
School Enrollment by Age by Funding Source in Aubrey
Out of a total of 1,529 students who are enrolled in schools in Aubrey, 180 (11.8%) attend a private institution, while the remaining 1,349 (88.2%) are enrolled in public schools. The age group of 3 to 4 year olds has the highest likelihood of being enrolled in private schools, with 101 (58.7% in the age bracket) enrolled. Conversely, the age group of 5 to 9 year old has the lowest likelihood of being enrolled in a private school, with 522 (100.0% in the age bracket) attending a public institution.
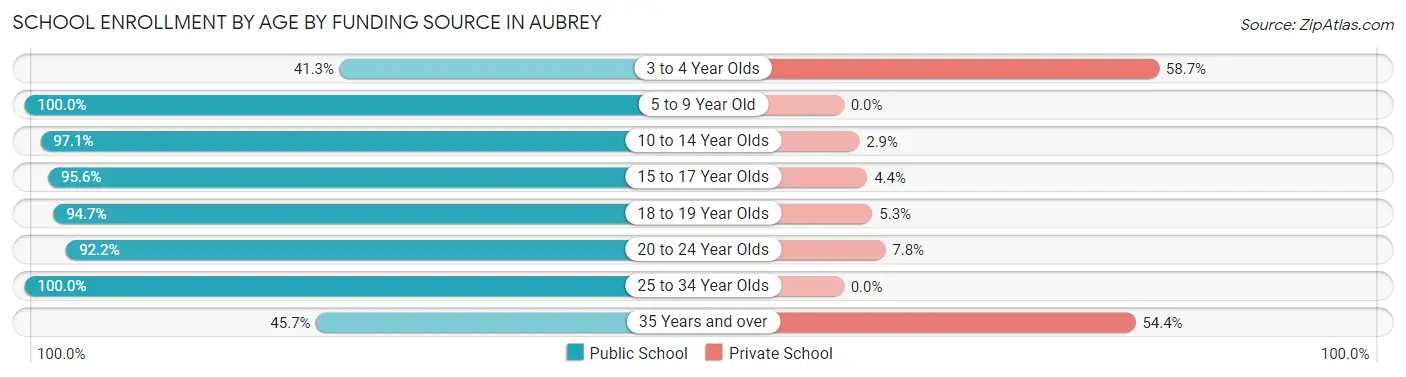
| Age Bracket | Public School | Private School |
| 3 to 4 Year Olds | 71 (41.3%) | 101 (58.7%) |
| 5 to 9 Year Old | 522 (100.0%) | 0 (0.0%) |
| 10 to 14 Year Olds | 300 (97.1%) | 9 (2.9%) |
| 15 to 17 Year Olds | 109 (95.6%) | 5 (4.4%) |
| 18 to 19 Year Olds | 124 (94.7%) | 7 (5.3%) |
| 20 to 24 Year Olds | 107 (92.2%) | 9 (7.8%) |
| 25 to 34 Year Olds | 73 (100.0%) | 0 (0.0%) |
| 35 Years and over | 42 (45.7%) | 50 (54.3%) |
| Total | 1,349 (88.2%) | 180 (11.8%) |
Educational Attainment by Field of Study in Aubrey
Business (356 | 22.6%), science & technology (307 | 19.5%), education (158 | 10.0%), bio, nature & agricultural (117 | 7.4%), and visual & performing arts (113 | 7.2%) are the most common fields of study among 1,577 individuals in Aubrey who have obtained a bachelor's degree or higher.
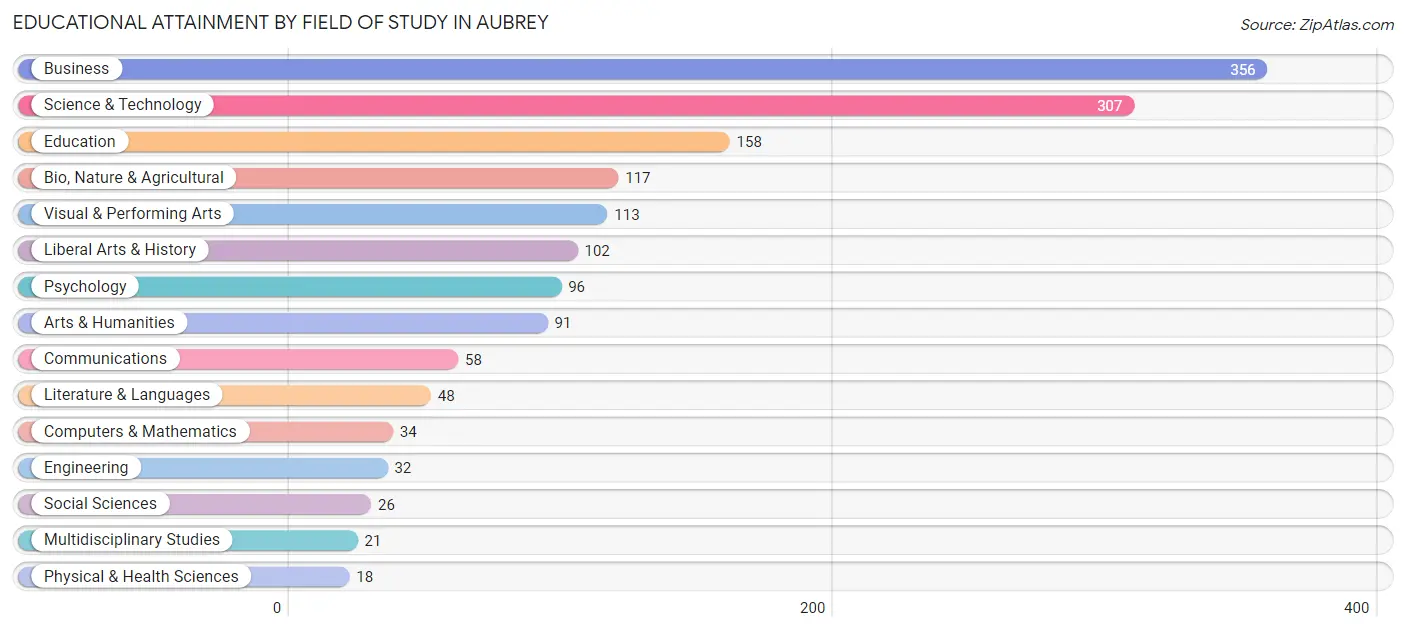
| Field of Study | # Graduates | % Graduates |
| Computers & Mathematics | 34 | 2.2% |
| Bio, Nature & Agricultural | 117 | 7.4% |
| Physical & Health Sciences | 18 | 1.1% |
| Psychology | 96 | 6.1% |
| Social Sciences | 26 | 1.7% |
| Engineering | 32 | 2.0% |
| Multidisciplinary Studies | 21 | 1.3% |
| Science & Technology | 307 | 19.5% |
| Business | 356 | 22.6% |
| Education | 158 | 10.0% |
| Literature & Languages | 48 | 3.0% |
| Liberal Arts & History | 102 | 6.5% |
| Visual & Performing Arts | 113 | 7.2% |
| Communications | 58 | 3.7% |
| Arts & Humanities | 91 | 5.8% |
| Total | 1,577 | 100.0% |
Transportation & Commute in Aubrey
Vehicle Availability by Sex in Aubrey
The most prevalent vehicle ownership categories in Aubrey are males with 2 vehicles (849, accounting for 54.1%) and females with 2 vehicles (689, making up 56.1%).
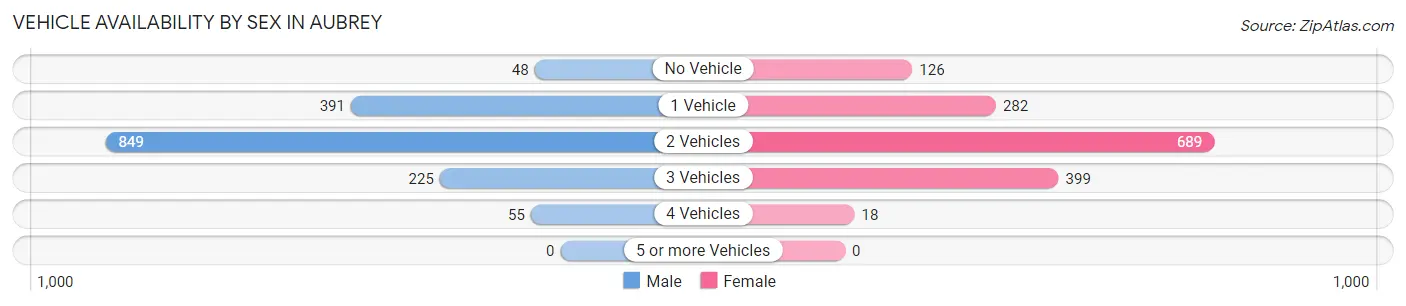
| Vehicles Available | Male | Female |
| No Vehicle | 48 (3.1%) | 126 (8.3%) |
| 1 Vehicle | 391 (24.9%) | 282 (18.6%) |
| 2 Vehicles | 849 (54.1%) | 689 (45.5%) |
| 3 Vehicles | 225 (14.3%) | 399 (26.4%) |
| 4 Vehicles | 55 (3.5%) | 18 (1.2%) |
| 5 or more Vehicles | 0 (0.0%) | 0 (0.0%) |
| Total | 1,568 (100.0%) | 1,514 (100.0%) |
Commute Time in Aubrey
The most frequently occuring commute durations in Aubrey are 45 to 59 minutes (600 commuters, 22.9%), 60 to 89 minutes (323 commuters, 12.3%), and 25 to 29 minutes (308 commuters, 11.7%).
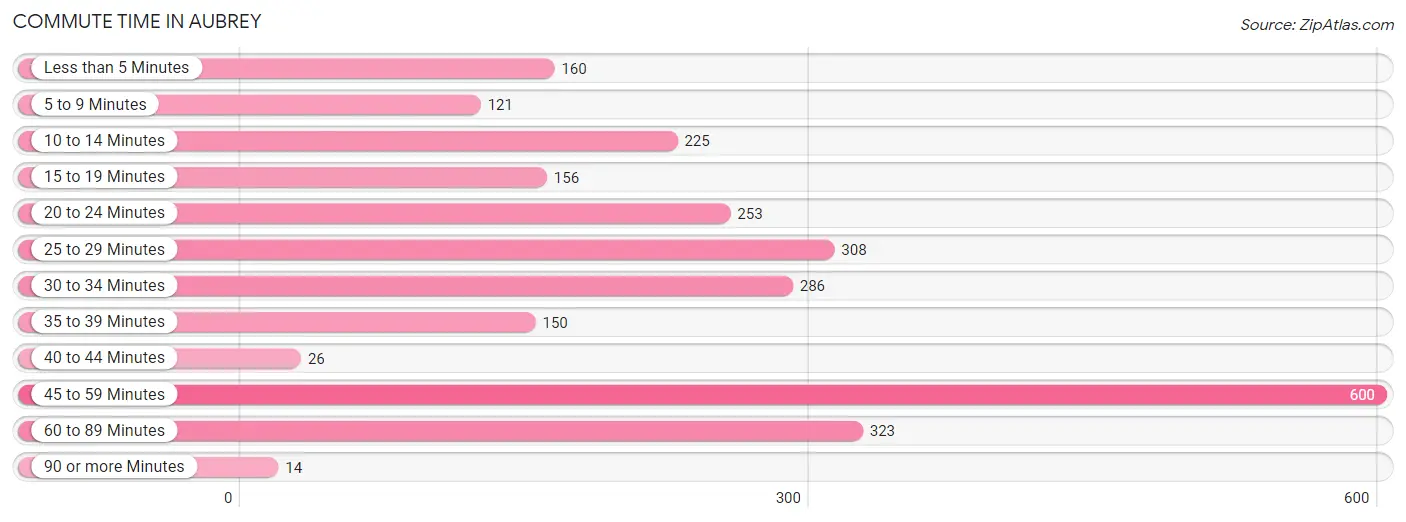
| Commute Time | # Commuters | % Commuters |
| Less than 5 Minutes | 160 | 6.1% |
| 5 to 9 Minutes | 121 | 4.6% |
| 10 to 14 Minutes | 225 | 8.6% |
| 15 to 19 Minutes | 156 | 5.9% |
| 20 to 24 Minutes | 253 | 9.7% |
| 25 to 29 Minutes | 308 | 11.7% |
| 30 to 34 Minutes | 286 | 10.9% |
| 35 to 39 Minutes | 150 | 5.7% |
| 40 to 44 Minutes | 26 | 1.0% |
| 45 to 59 Minutes | 600 | 22.9% |
| 60 to 89 Minutes | 323 | 12.3% |
| 90 or more Minutes | 14 | 0.5% |
Commute Time by Sex in Aubrey
The most common commute times in Aubrey are 45 to 59 minutes (397 commuters, 31.5%) for males and 25 to 29 minutes (258 commuters, 18.9%) for females.
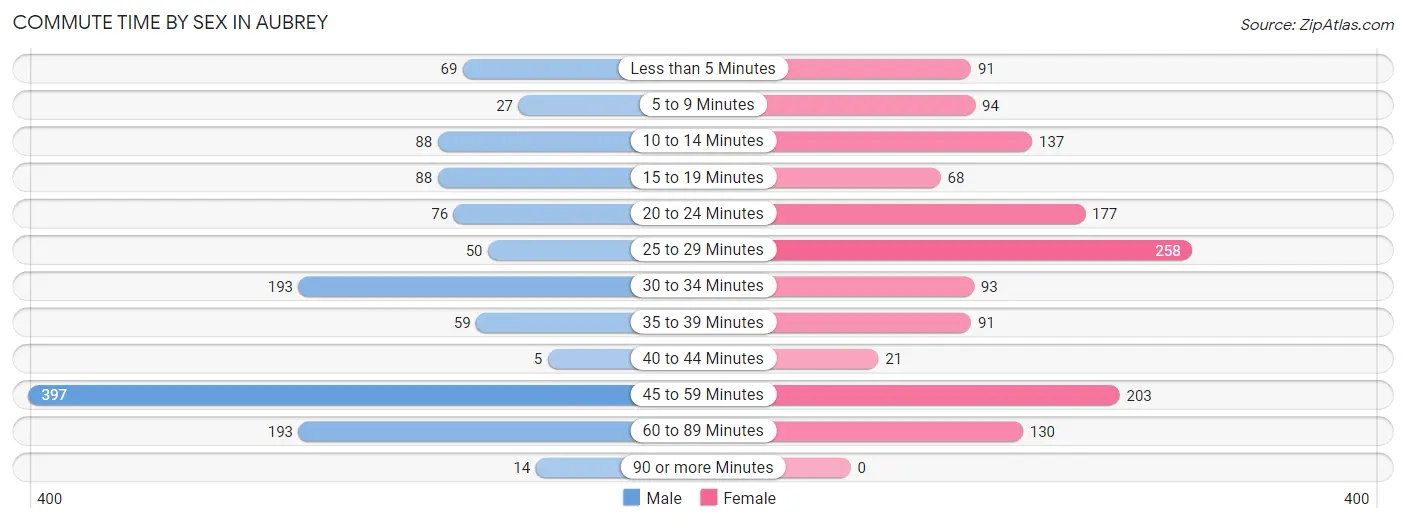
| Commute Time | Male | Female |
| Less than 5 Minutes | 69 (5.5%) | 91 (6.7%) |
| 5 to 9 Minutes | 27 (2.1%) | 94 (6.9%) |
| 10 to 14 Minutes | 88 (7.0%) | 137 (10.1%) |
| 15 to 19 Minutes | 88 (7.0%) | 68 (5.0%) |
| 20 to 24 Minutes | 76 (6.0%) | 177 (13.0%) |
| 25 to 29 Minutes | 50 (4.0%) | 258 (18.9%) |
| 30 to 34 Minutes | 193 (15.3%) | 93 (6.8%) |
| 35 to 39 Minutes | 59 (4.7%) | 91 (6.7%) |
| 40 to 44 Minutes | 5 (0.4%) | 21 (1.5%) |
| 45 to 59 Minutes | 397 (31.5%) | 203 (14.9%) |
| 60 to 89 Minutes | 193 (15.3%) | 130 (9.5%) |
| 90 or more Minutes | 14 (1.1%) | 0 (0.0%) |
Time of Departure to Work by Sex in Aubrey
The most frequent times of departure to work in Aubrey are 8:00 AM to 8:29 AM (262, 20.8%) for males and 6:00 AM to 6:29 AM (186, 13.7%) for females.
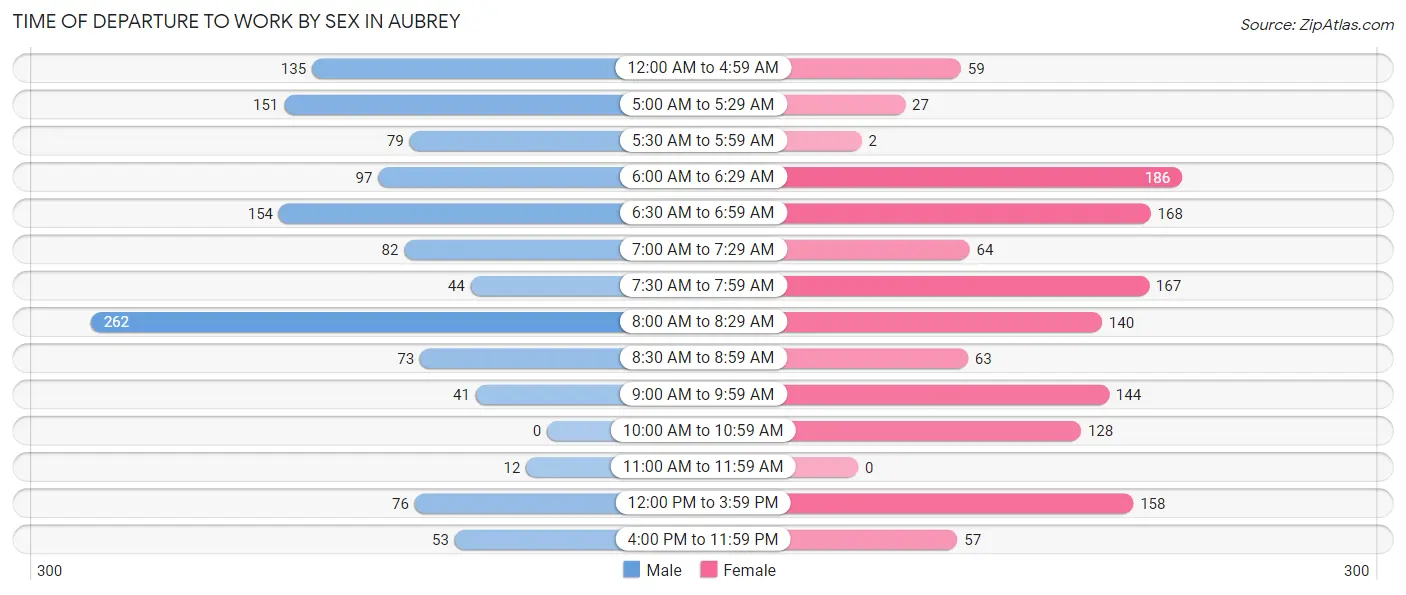
| Time of Departure | Male | Female |
| 12:00 AM to 4:59 AM | 135 (10.7%) | 59 (4.3%) |
| 5:00 AM to 5:29 AM | 151 (12.0%) | 27 (2.0%) |
| 5:30 AM to 5:59 AM | 79 (6.3%) | 2 (0.2%) |
| 6:00 AM to 6:29 AM | 97 (7.7%) | 186 (13.7%) |
| 6:30 AM to 6:59 AM | 154 (12.2%) | 168 (12.3%) |
| 7:00 AM to 7:29 AM | 82 (6.5%) | 64 (4.7%) |
| 7:30 AM to 7:59 AM | 44 (3.5%) | 167 (12.2%) |
| 8:00 AM to 8:29 AM | 262 (20.8%) | 140 (10.3%) |
| 8:30 AM to 8:59 AM | 73 (5.8%) | 63 (4.6%) |
| 9:00 AM to 9:59 AM | 41 (3.3%) | 144 (10.6%) |
| 10:00 AM to 10:59 AM | 0 (0.0%) | 128 (9.4%) |
| 11:00 AM to 11:59 AM | 12 (0.9%) | 0 (0.0%) |
| 12:00 PM to 3:59 PM | 76 (6.0%) | 158 (11.6%) |
| 4:00 PM to 11:59 PM | 53 (4.2%) | 57 (4.2%) |
| Total | 1,259 (100.0%) | 1,363 (100.0%) |
Housing Occupancy in Aubrey
Occupancy by Ownership in Aubrey
Of the total 2,183 dwellings in Aubrey, owner-occupied units account for 1,668 (76.4%), while renter-occupied units make up 515 (23.6%).
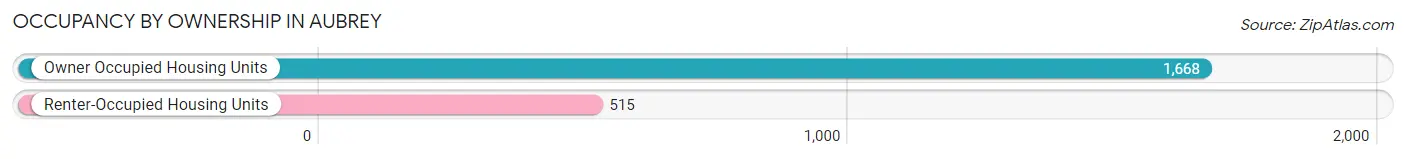
| Occupancy | # Housing Units | % Housing Units |
| Owner Occupied Housing Units | 1,668 | 76.4% |
| Renter-Occupied Housing Units | 515 | 23.6% |
| Total Occupied Housing Units | 2,183 | 100.0% |
Occupancy by Household Size in Aubrey
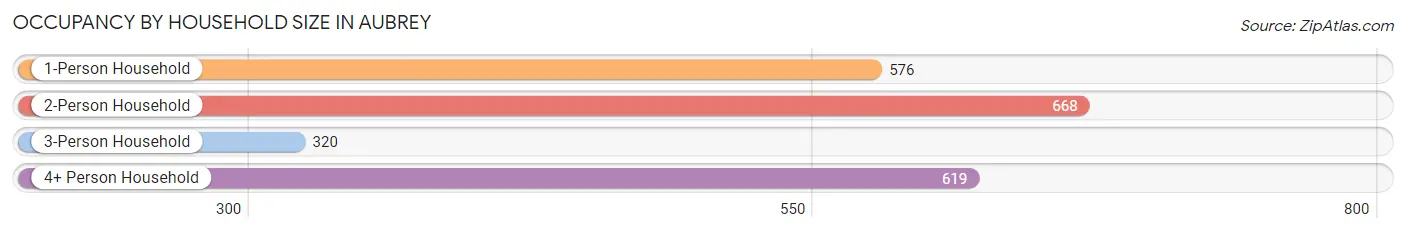
| Household Size | # Housing Units | % Housing Units |
| 1-Person Household | 576 | 26.4% |
| 2-Person Household | 668 | 30.6% |
| 3-Person Household | 320 | 14.7% |
| 4+ Person Household | 619 | 28.4% |
| Total Housing Units | 2,183 | 100.0% |
Occupancy by Ownership by Household Size in Aubrey
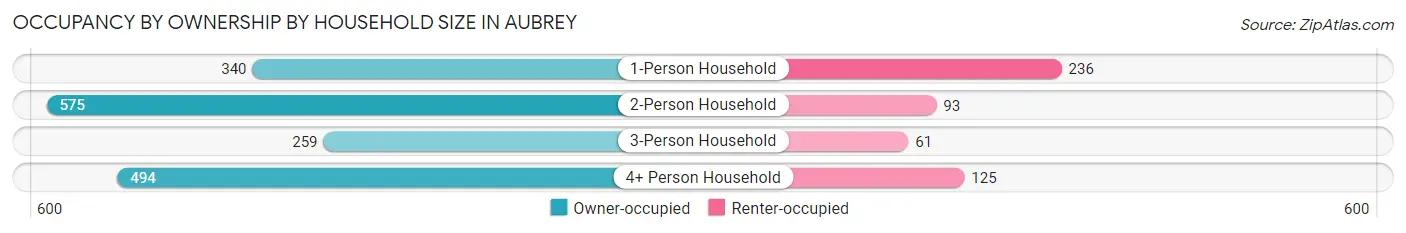
| Household Size | Owner-occupied | Renter-occupied |
| 1-Person Household | 340 (59.0%) | 236 (41.0%) |
| 2-Person Household | 575 (86.1%) | 93 (13.9%) |
| 3-Person Household | 259 (80.9%) | 61 (19.1%) |
| 4+ Person Household | 494 (79.8%) | 125 (20.2%) |
| Total Housing Units | 1,668 (76.4%) | 515 (23.6%) |
Occupancy by Educational Attainment in Aubrey
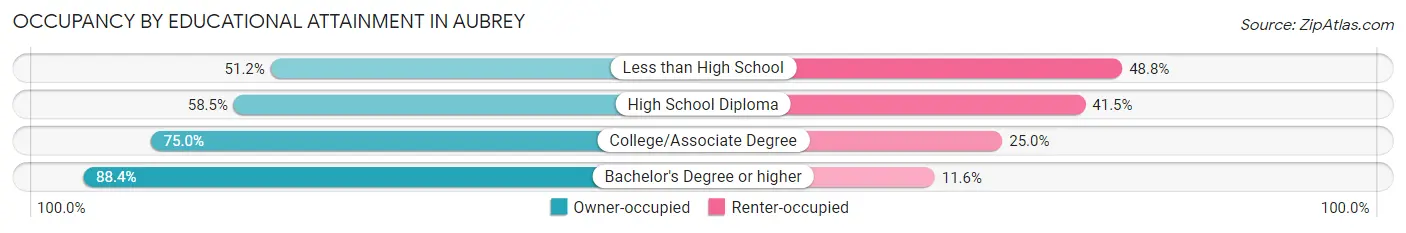
| Household Size | Owner-occupied | Renter-occupied |
| Less than High School | 21 (51.2%) | 20 (48.8%) |
| High School Diploma | 302 (58.5%) | 214 (41.5%) |
| College/Associate Degree | 516 (75.0%) | 172 (25.0%) |
| Bachelor's Degree or higher | 829 (88.4%) | 109 (11.6%) |
Occupancy by Age of Householder in Aubrey
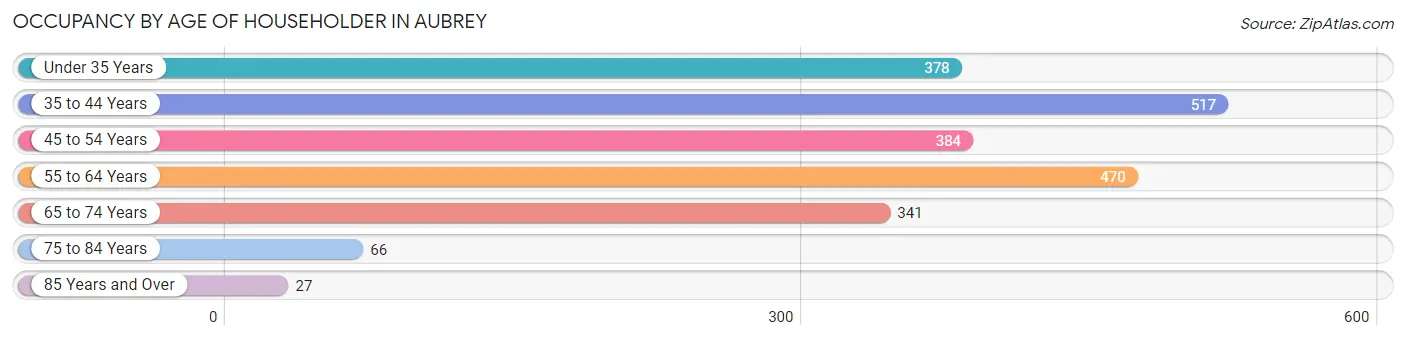
| Age Bracket | # Households | % Households |
| Under 35 Years | 378 | 17.3% |
| 35 to 44 Years | 517 | 23.7% |
| 45 to 54 Years | 384 | 17.6% |
| 55 to 64 Years | 470 | 21.5% |
| 65 to 74 Years | 341 | 15.6% |
| 75 to 84 Years | 66 | 3.0% |
| 85 Years and Over | 27 | 1.2% |
| Total | 2,183 | 100.0% |
Housing Finances in Aubrey
Median Income by Occupancy in Aubrey
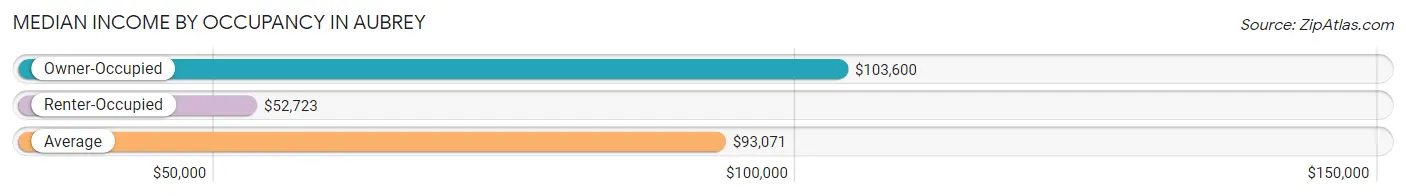
| Occupancy Type | # Households | Median Income |
| Owner-Occupied | 1,668 (76.4%) | $103,600 |
| Renter-Occupied | 515 (23.6%) | $52,723 |
| Average | 2,183 (100.0%) | $93,071 |
Occupancy by Householder Income Bracket in Aubrey
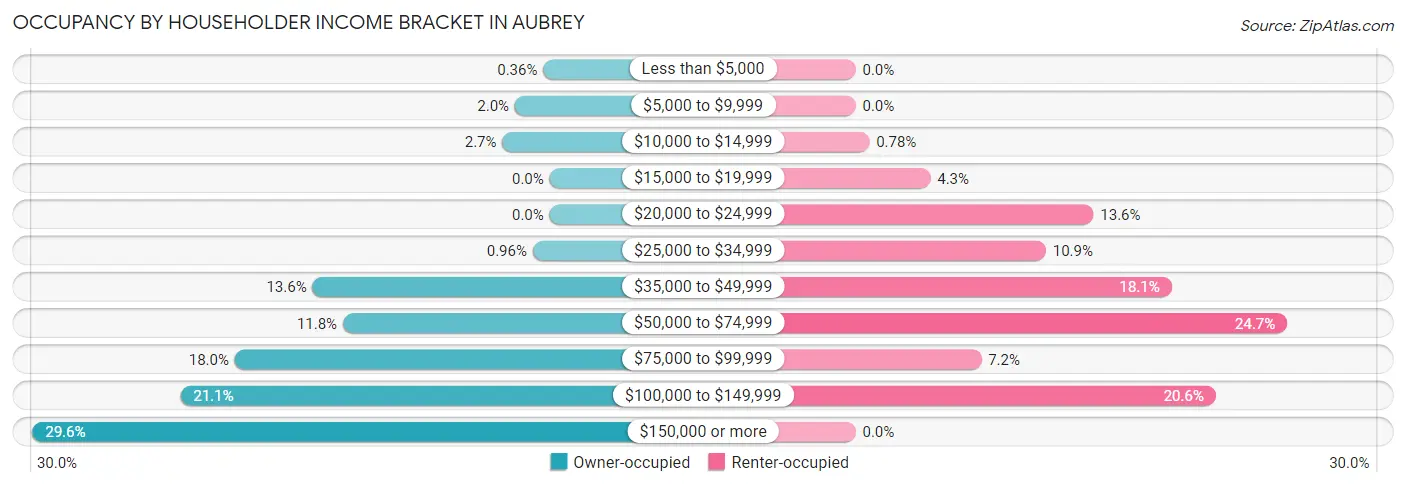
| Income Bracket | Owner-occupied | Renter-occupied |
| Less than $5,000 | 6 (0.4%) | 0 (0.0%) |
| $5,000 to $9,999 | 33 (2.0%) | 0 (0.0%) |
| $10,000 to $14,999 | 45 (2.7%) | 4 (0.8%) |
| $15,000 to $19,999 | 0 (0.0%) | 22 (4.3%) |
| $20,000 to $24,999 | 0 (0.0%) | 70 (13.6%) |
| $25,000 to $34,999 | 16 (1.0%) | 56 (10.9%) |
| $35,000 to $49,999 | 226 (13.6%) | 93 (18.1%) |
| $50,000 to $74,999 | 197 (11.8%) | 127 (24.7%) |
| $75,000 to $99,999 | 300 (18.0%) | 37 (7.2%) |
| $100,000 to $149,999 | 352 (21.1%) | 106 (20.6%) |
| $150,000 or more | 493 (29.6%) | 0 (0.0%) |
| Total | 1,668 (100.0%) | 515 (100.0%) |
Monthly Housing Cost Tiers in Aubrey
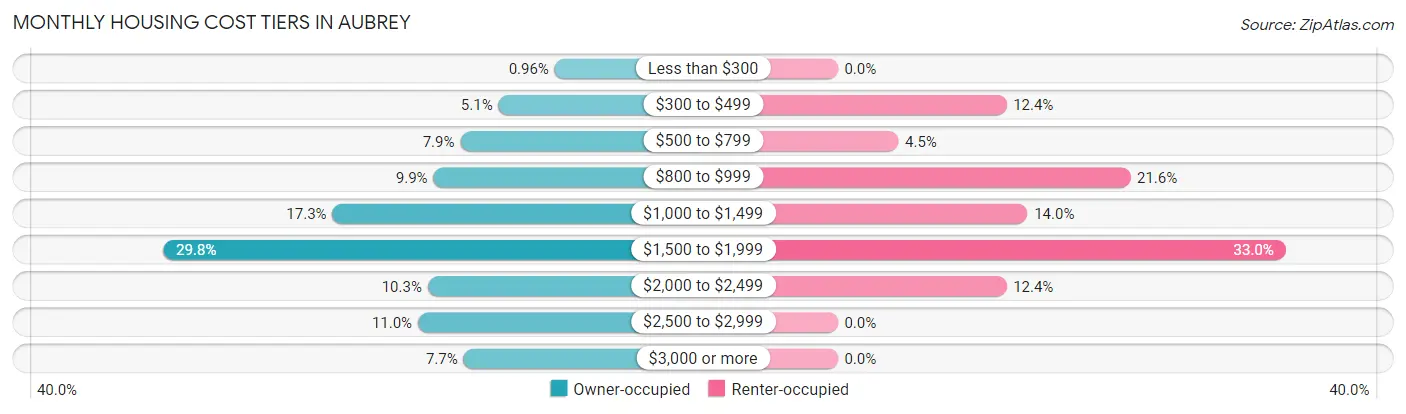
| Monthly Cost | Owner-occupied | Renter-occupied |
| Less than $300 | 16 (1.0%) | 0 (0.0%) |
| $300 to $499 | 85 (5.1%) | 64 (12.4%) |
| $500 to $799 | 132 (7.9%) | 23 (4.5%) |
| $800 to $999 | 165 (9.9%) | 111 (21.5%) |
| $1,000 to $1,499 | 289 (17.3%) | 72 (14.0%) |
| $1,500 to $1,999 | 497 (29.8%) | 170 (33.0%) |
| $2,000 to $2,499 | 172 (10.3%) | 64 (12.4%) |
| $2,500 to $2,999 | 184 (11.0%) | 0 (0.0%) |
| $3,000 or more | 128 (7.7%) | 0 (0.0%) |
| Total | 1,668 (100.0%) | 515 (100.0%) |
Physical Housing Characteristics in Aubrey
Housing Structures in Aubrey
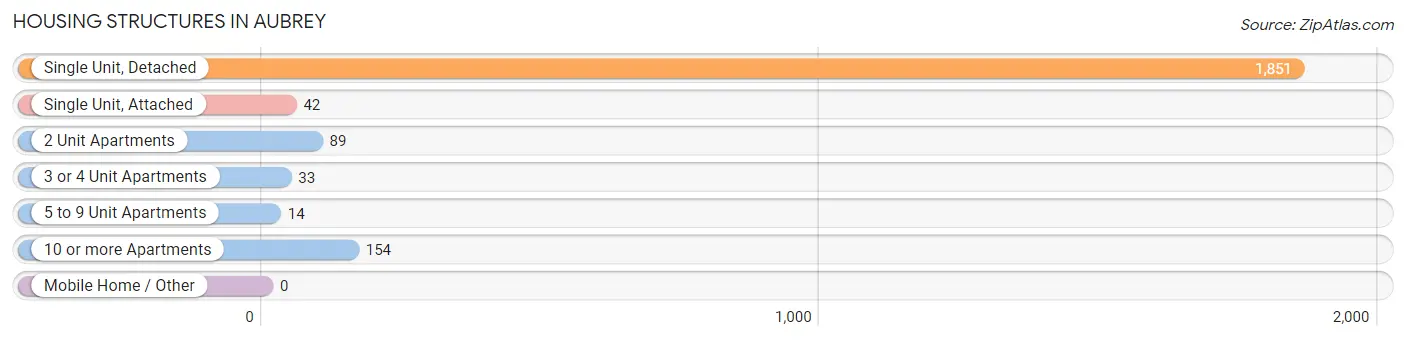
| Structure Type | # Housing Units | % Housing Units |
| Single Unit, Detached | 1,851 | 84.8% |
| Single Unit, Attached | 42 | 1.9% |
| 2 Unit Apartments | 89 | 4.1% |
| 3 or 4 Unit Apartments | 33 | 1.5% |
| 5 to 9 Unit Apartments | 14 | 0.6% |
| 10 or more Apartments | 154 | 7.0% |
| Mobile Home / Other | 0 | 0.0% |
| Total | 2,183 | 100.0% |
Housing Structures by Occupancy in Aubrey
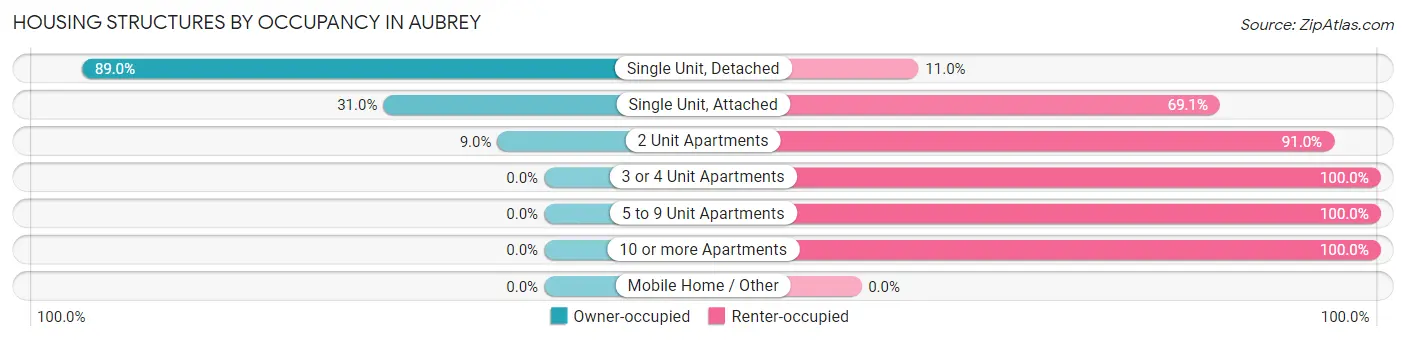
| Structure Type | Owner-occupied | Renter-occupied |
| Single Unit, Detached | 1,647 (89.0%) | 204 (11.0%) |
| Single Unit, Attached | 13 (30.9%) | 29 (69.1%) |
| 2 Unit Apartments | 8 (9.0%) | 81 (91.0%) |
| 3 or 4 Unit Apartments | 0 (0.0%) | 33 (100.0%) |
| 5 to 9 Unit Apartments | 0 (0.0%) | 14 (100.0%) |
| 10 or more Apartments | 0 (0.0%) | 154 (100.0%) |
| Mobile Home / Other | 0 (0.0%) | 0 (0.0%) |
| Total | 1,668 (76.4%) | 515 (23.6%) |
Housing Structures by Number of Rooms in Aubrey
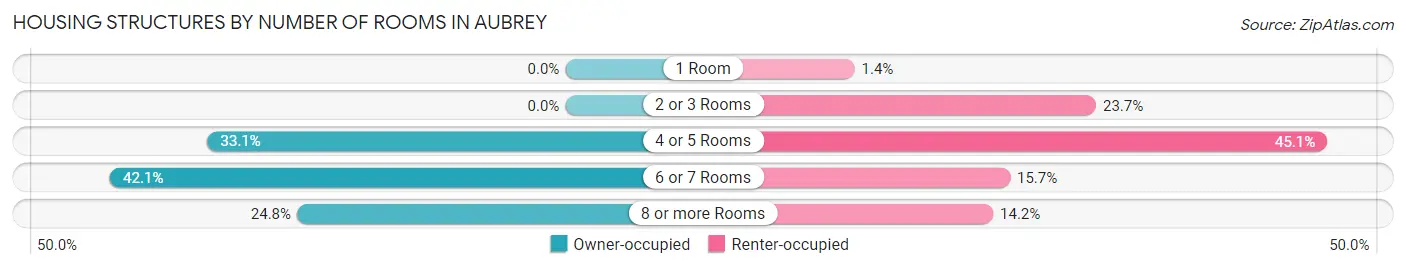
| Number of Rooms | Owner-occupied | Renter-occupied |
| 1 Room | 0 (0.0%) | 7 (1.4%) |
| 2 or 3 Rooms | 0 (0.0%) | 122 (23.7%) |
| 4 or 5 Rooms | 552 (33.1%) | 232 (45.1%) |
| 6 or 7 Rooms | 702 (42.1%) | 81 (15.7%) |
| 8 or more Rooms | 414 (24.8%) | 73 (14.2%) |
| Total | 1,668 (100.0%) | 515 (100.0%) |
Housing Structure by Heating Type in Aubrey
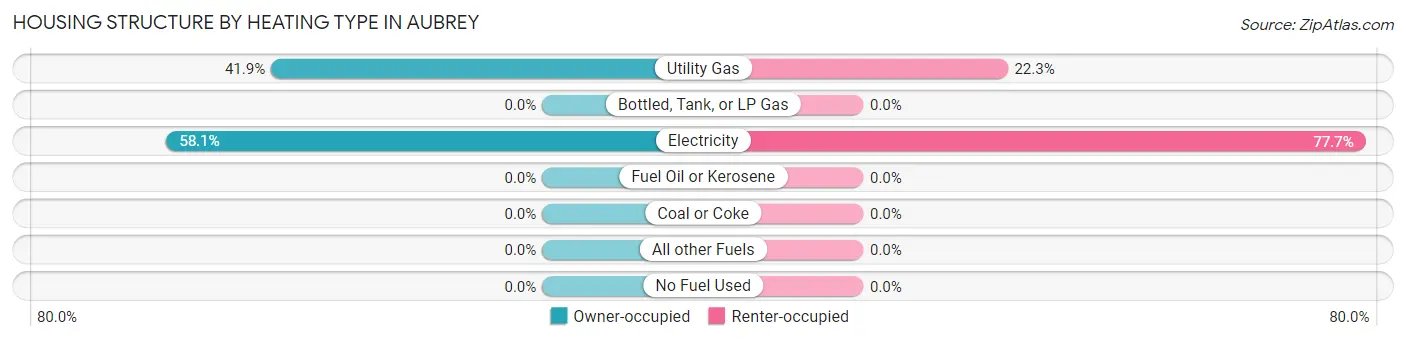
| Heating Type | Owner-occupied | Renter-occupied |
| Utility Gas | 699 (41.9%) | 115 (22.3%) |
| Bottled, Tank, or LP Gas | 0 (0.0%) | 0 (0.0%) |
| Electricity | 969 (58.1%) | 400 (77.7%) |
| Fuel Oil or Kerosene | 0 (0.0%) | 0 (0.0%) |
| Coal or Coke | 0 (0.0%) | 0 (0.0%) |
| All other Fuels | 0 (0.0%) | 0 (0.0%) |
| No Fuel Used | 0 (0.0%) | 0 (0.0%) |
| Total | 1,668 (100.0%) | 515 (100.0%) |
Household Vehicle Usage in Aubrey
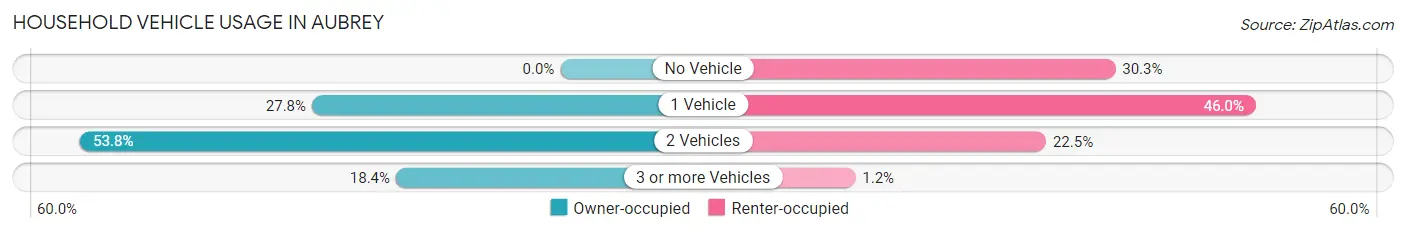
| Vehicles per Household | Owner-occupied | Renter-occupied |
| No Vehicle | 0 (0.0%) | 156 (30.3%) |
| 1 Vehicle | 464 (27.8%) | 237 (46.0%) |
| 2 Vehicles | 897 (53.8%) | 116 (22.5%) |
| 3 or more Vehicles | 307 (18.4%) | 6 (1.2%) |
| Total | 1,668 (100.0%) | 515 (100.0%) |
Real Estate & Mortgages in Aubrey
Real Estate and Mortgage Overview in Aubrey
| Characteristic | Without Mortgage | With Mortgage |
| Housing Units | 470 | 1,198 |
| Median Property Value | $281,100 | $319,800 |
| Median Household Income | $96,346 | $299 |
| Monthly Housing Costs | $803 | $128 |
| Real Estate Taxes | $4,248 | $4 |
Property Value by Mortgage Status in Aubrey
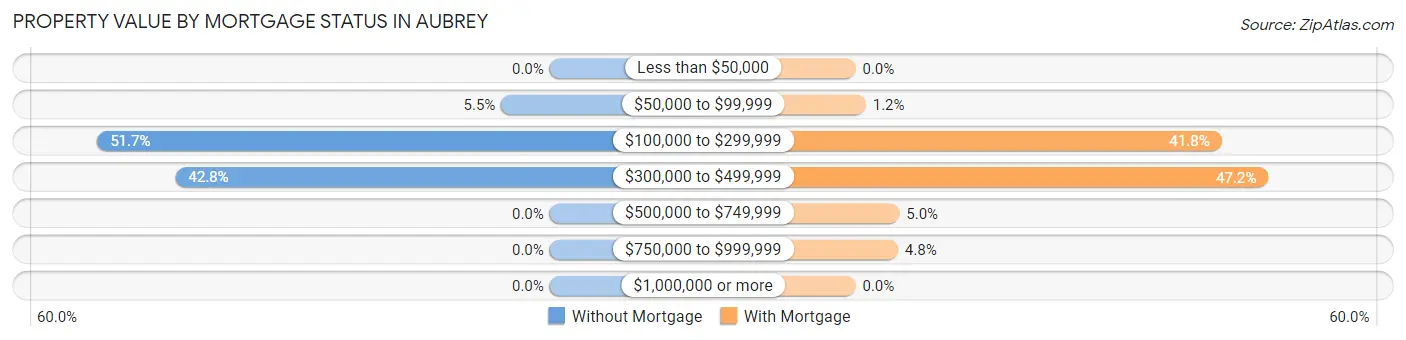
| Property Value | Without Mortgage | With Mortgage |
| Less than $50,000 | 0 (0.0%) | 0 (0.0%) |
| $50,000 to $99,999 | 26 (5.5%) | 14 (1.2%) |
| $100,000 to $299,999 | 243 (51.7%) | 501 (41.8%) |
| $300,000 to $499,999 | 201 (42.8%) | 565 (47.2%) |
| $500,000 to $749,999 | 0 (0.0%) | 60 (5.0%) |
| $750,000 to $999,999 | 0 (0.0%) | 58 (4.8%) |
| $1,000,000 or more | 0 (0.0%) | 0 (0.0%) |
| Total | 470 (100.0%) | 1,198 (100.0%) |
Household Income by Mortgage Status in Aubrey
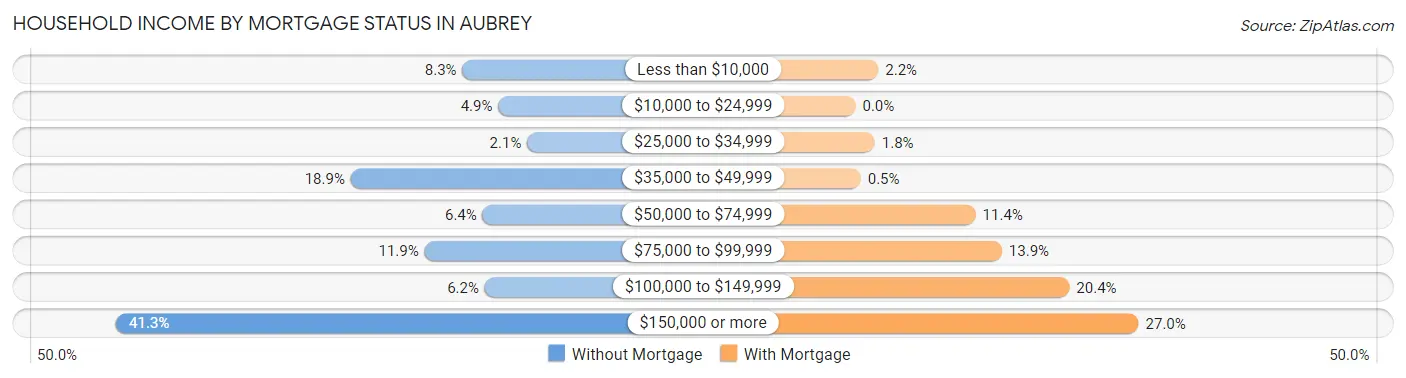
| Household Income | Without Mortgage | With Mortgage |
| Less than $10,000 | 39 (8.3%) | 26 (2.2%) |
| $10,000 to $24,999 | 23 (4.9%) | 0 (0.0%) |
| $25,000 to $34,999 | 10 (2.1%) | 22 (1.8%) |
| $35,000 to $49,999 | 89 (18.9%) | 6 (0.5%) |
| $50,000 to $74,999 | 30 (6.4%) | 137 (11.4%) |
| $75,000 to $99,999 | 56 (11.9%) | 167 (13.9%) |
| $100,000 to $149,999 | 29 (6.2%) | 244 (20.4%) |
| $150,000 or more | 194 (41.3%) | 323 (27.0%) |
| Total | 470 (100.0%) | 1,198 (100.0%) |
Property Value to Household Income Ratio in Aubrey
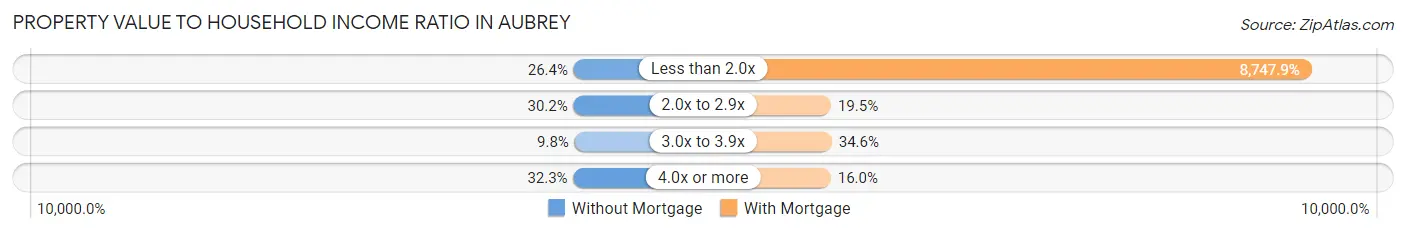
| Value-to-Income Ratio | Without Mortgage | With Mortgage |
| Less than 2.0x | 124 (26.4%) | 104,800 (8,747.9%) |
| 2.0x to 2.9x | 142 (30.2%) | 233 (19.5%) |
| 3.0x to 3.9x | 46 (9.8%) | 415 (34.6%) |
| 4.0x or more | 152 (32.3%) | 192 (16.0%) |
| Total | 470 (100.0%) | 1,198 (100.0%) |
Real Estate Taxes by Mortgage Status in Aubrey
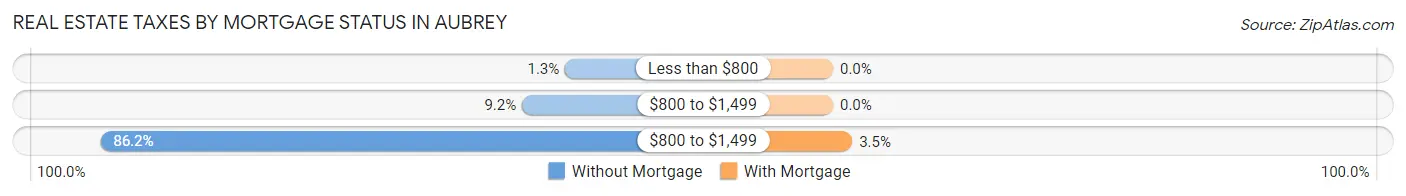
| Property Taxes | Without Mortgage | With Mortgage |
| Less than $800 | 6 (1.3%) | 0 (0.0%) |
| $800 to $1,499 | 43 (9.1%) | 0 (0.0%) |
| $800 to $1,499 | 405 (86.2%) | 42 (3.5%) |
| Total | 470 (100.0%) | 1,198 (100.0%) |
Health & Disability in Aubrey
Health Insurance Coverage by Age in Aubrey
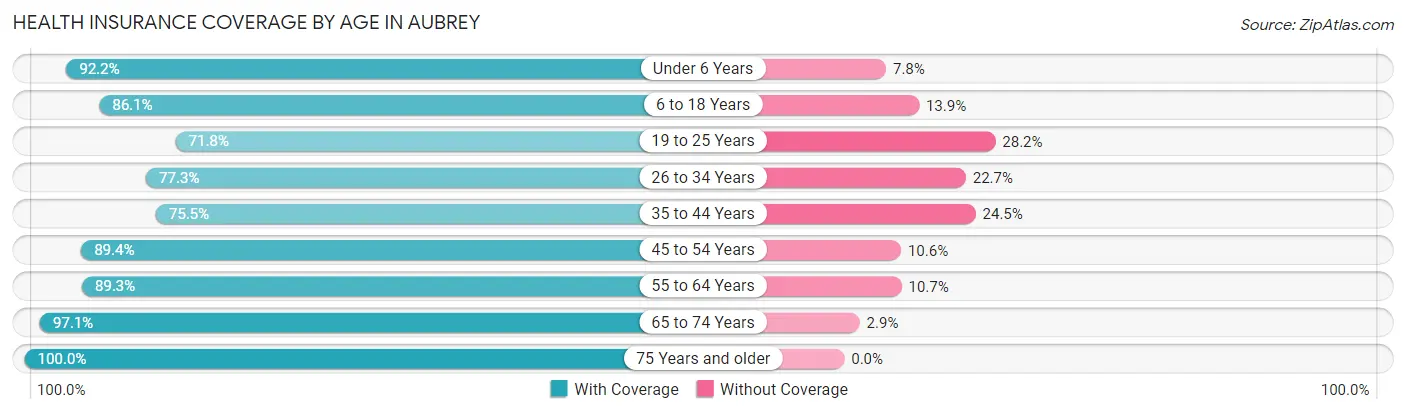
| Age Bracket | With Coverage | Without Coverage |
| Under 6 Years | 557 (92.2%) | 47 (7.8%) |
| 6 to 18 Years | 964 (86.1%) | 156 (13.9%) |
| 19 to 25 Years | 255 (71.8%) | 100 (28.2%) |
| 26 to 34 Years | 594 (77.3%) | 174 (22.7%) |
| 35 to 44 Years | 734 (75.5%) | 238 (24.5%) |
| 45 to 54 Years | 702 (89.4%) | 83 (10.6%) |
| 55 to 64 Years | 569 (89.3%) | 68 (10.7%) |
| 65 to 74 Years | 543 (97.1%) | 16 (2.9%) |
| 75 Years and older | 132 (100.0%) | 0 (0.0%) |
| Total | 5,050 (85.1%) | 882 (14.9%) |
Health Insurance Coverage by Citizenship Status in Aubrey
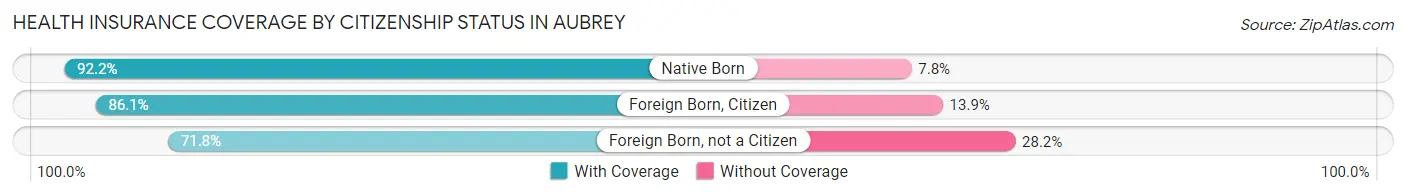
| Citizenship Status | With Coverage | Without Coverage |
| Native Born | 557 (92.2%) | 47 (7.8%) |
| Foreign Born, Citizen | 964 (86.1%) | 156 (13.9%) |
| Foreign Born, not a Citizen | 255 (71.8%) | 100 (28.2%) |
Health Insurance Coverage by Household Income in Aubrey
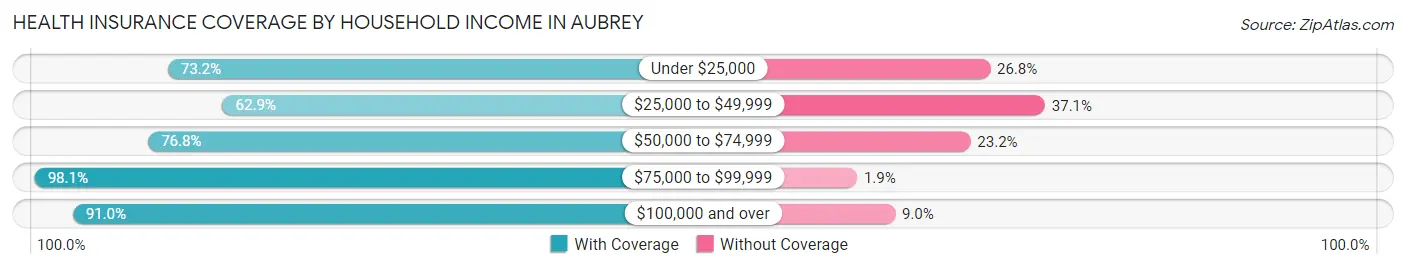
| Household Income | With Coverage | Without Coverage |
| Under $25,000 | 420 (73.2%) | 154 (26.8%) |
| $25,000 to $49,999 | 461 (62.9%) | 272 (37.1%) |
| $50,000 to $74,999 | 594 (76.8%) | 179 (23.2%) |
| $75,000 to $99,999 | 976 (98.1%) | 19 (1.9%) |
| $100,000 and over | 2,599 (91.0%) | 258 (9.0%) |
Public vs Private Health Insurance Coverage by Age in Aubrey
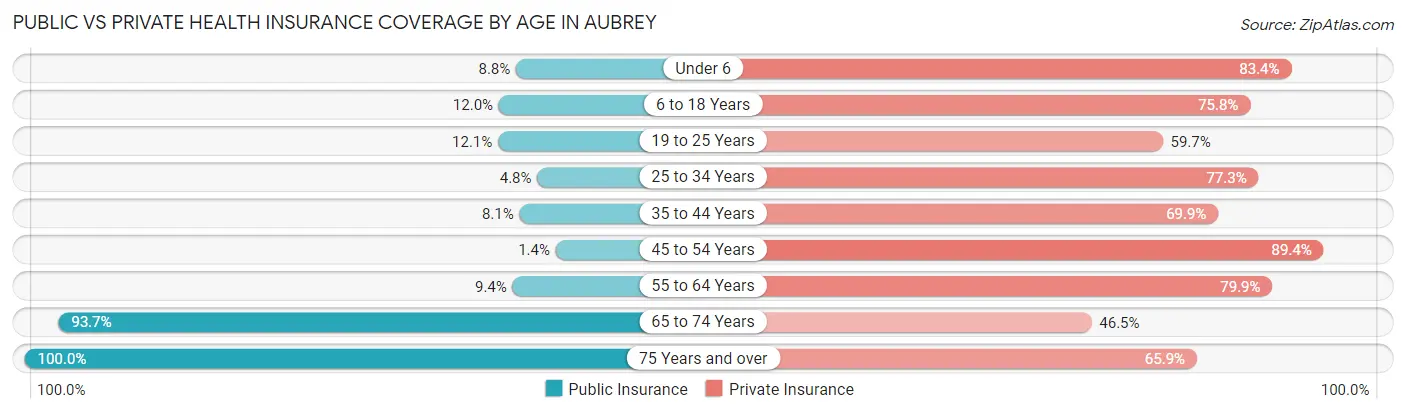
| Age Bracket | Public Insurance | Private Insurance |
| Under 6 | 53 (8.8%) | 504 (83.4%) |
| 6 to 18 Years | 134 (12.0%) | 849 (75.8%) |
| 19 to 25 Years | 43 (12.1%) | 212 (59.7%) |
| 25 to 34 Years | 37 (4.8%) | 594 (77.3%) |
| 35 to 44 Years | 79 (8.1%) | 679 (69.9%) |
| 45 to 54 Years | 11 (1.4%) | 702 (89.4%) |
| 55 to 64 Years | 60 (9.4%) | 509 (79.9%) |
| 65 to 74 Years | 524 (93.7%) | 260 (46.5%) |
| 75 Years and over | 132 (100.0%) | 87 (65.9%) |
| Total | 1,073 (18.1%) | 4,396 (74.1%) |
Disability Status by Sex by Age in Aubrey
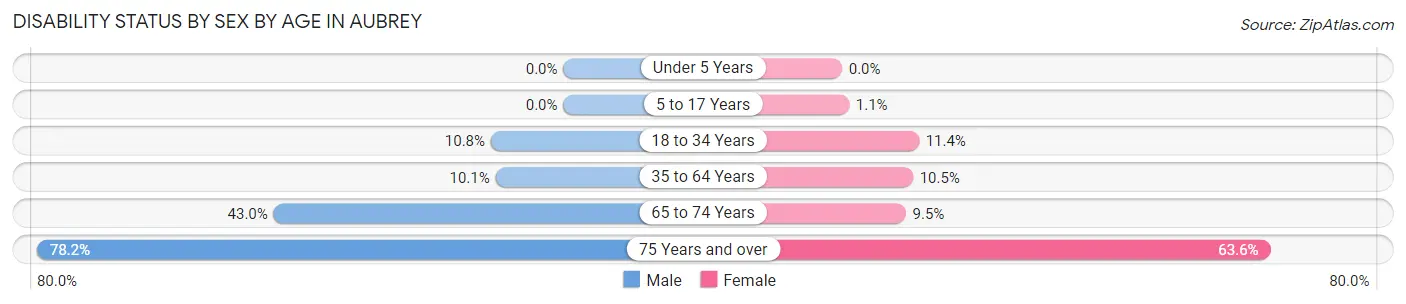
| Age Bracket | Male | Female |
| Under 5 Years | 0 (0.0%) | 0 (0.0%) |
| 5 to 17 Years | 0 (0.0%) | 6 (1.1%) |
| 18 to 34 Years | 58 (10.8%) | 79 (11.4%) |
| 35 to 64 Years | 112 (10.1%) | 135 (10.5%) |
| 65 to 74 Years | 77 (43.0%) | 36 (9.5%) |
| 75 Years and over | 43 (78.2%) | 49 (63.6%) |
Disability Class by Sex by Age in Aubrey
Disability Class: Hearing Difficulty
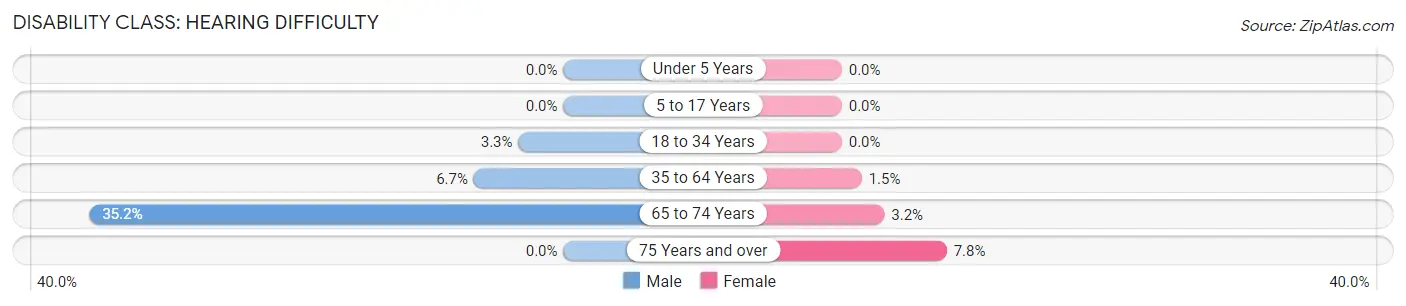
| Age Bracket | Male | Female |
| Under 5 Years | 0 (0.0%) | 0 (0.0%) |
| 5 to 17 Years | 0 (0.0%) | 0 (0.0%) |
| 18 to 34 Years | 18 (3.3%) | 0 (0.0%) |
| 35 to 64 Years | 74 (6.7%) | 19 (1.5%) |
| 65 to 74 Years | 63 (35.2%) | 12 (3.2%) |
| 75 Years and over | 0 (0.0%) | 6 (7.8%) |
Disability Class: Vision Difficulty
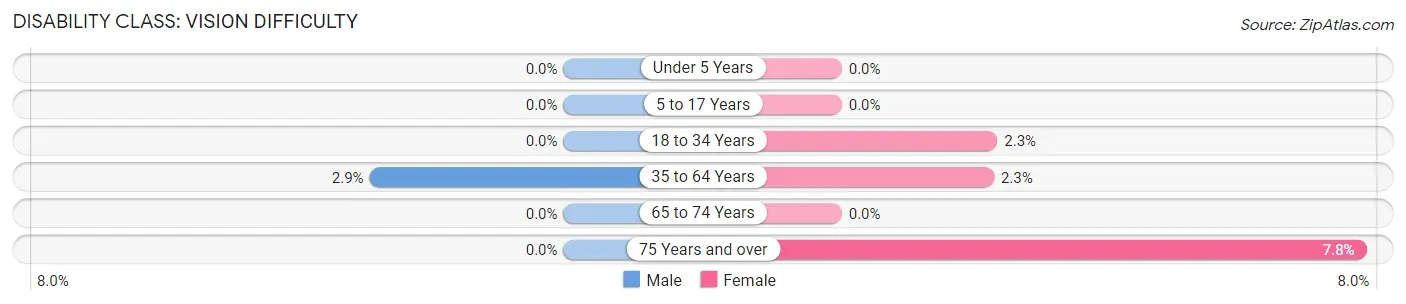
| Age Bracket | Male | Female |
| Under 5 Years | 0 (0.0%) | 0 (0.0%) |
| 5 to 17 Years | 0 (0.0%) | 0 (0.0%) |
| 18 to 34 Years | 0 (0.0%) | 16 (2.3%) |
| 35 to 64 Years | 32 (2.9%) | 29 (2.3%) |
| 65 to 74 Years | 0 (0.0%) | 0 (0.0%) |
| 75 Years and over | 0 (0.0%) | 6 (7.8%) |
Disability Class: Cognitive Difficulty
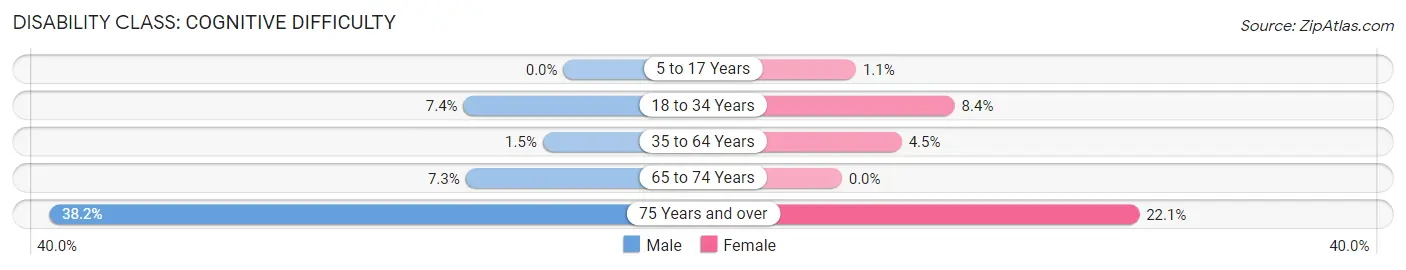
| Age Bracket | Male | Female |
| 5 to 17 Years | 0 (0.0%) | 6 (1.1%) |
| 18 to 34 Years | 40 (7.4%) | 58 (8.4%) |
| 35 to 64 Years | 17 (1.5%) | 57 (4.4%) |
| 65 to 74 Years | 13 (7.3%) | 0 (0.0%) |
| 75 Years and over | 21 (38.2%) | 17 (22.1%) |
Disability Class: Ambulatory Difficulty
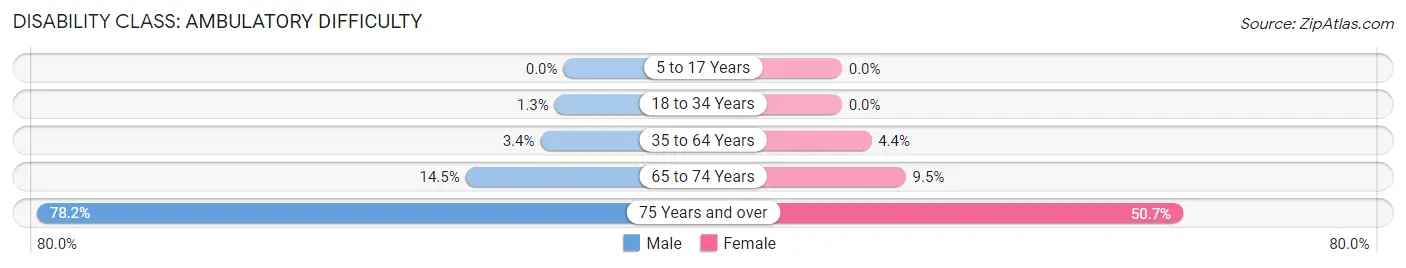
| Age Bracket | Male | Female |
| 5 to 17 Years | 0 (0.0%) | 0 (0.0%) |
| 18 to 34 Years | 7 (1.3%) | 0 (0.0%) |
| 35 to 64 Years | 38 (3.4%) | 56 (4.4%) |
| 65 to 74 Years | 26 (14.5%) | 36 (9.5%) |
| 75 Years and over | 43 (78.2%) | 39 (50.6%) |
Disability Class: Self-Care Difficulty
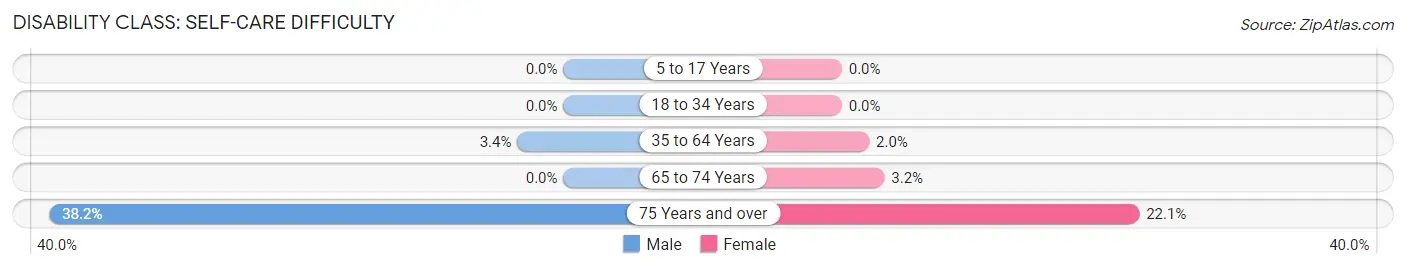
| Age Bracket | Male | Female |
| 5 to 17 Years | 0 (0.0%) | 0 (0.0%) |
| 18 to 34 Years | 0 (0.0%) | 0 (0.0%) |
| 35 to 64 Years | 38 (3.4%) | 26 (2.0%) |
| 65 to 74 Years | 0 (0.0%) | 12 (3.2%) |
| 75 Years and over | 21 (38.2%) | 17 (22.1%) |
Technology Access in Aubrey
Computing Device Access in Aubrey
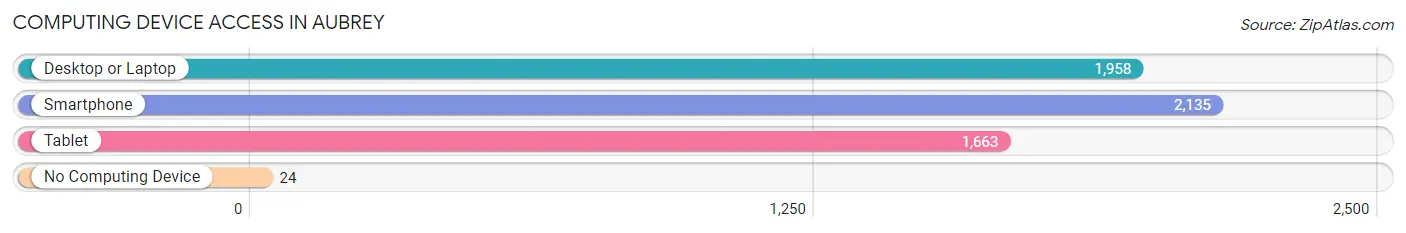
| Device Type | # Households | % Households |
| Desktop or Laptop | 1,958 | 89.7% |
| Smartphone | 2,135 | 97.8% |
| Tablet | 1,663 | 76.2% |
| No Computing Device | 24 | 1.1% |
| Total | 2,183 | 100.0% |
Internet Access in Aubrey
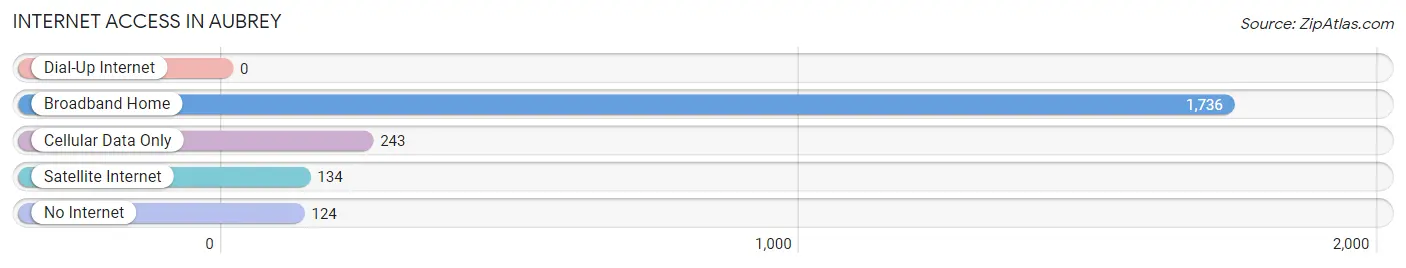
| Internet Type | # Households | % Households |
| Dial-Up Internet | 0 | 0.0% |
| Broadband Home | 1,736 | 79.5% |
| Cellular Data Only | 243 | 11.1% |
| Satellite Internet | 134 | 6.1% |
| No Internet | 124 | 5.7% |
| Total | 2,183 | 100.0% |
Aubrey Summary
Aubrey, Texas is a small town located in Denton County, Texas, United States. It is situated about 40 miles north of Dallas and is part of the Dallas-Fort Worth-Arlington metropolitan area. The town was founded in 1881 and was named after Aubrey, the son of a local rancher. As of the 2010 census, the population of Aubrey was 2,126.
Geography
Aubrey is located at 33°21'25"N 96°59'45"W (33.356944, -96.995833). It is situated in the northeast corner of Denton County, about 40 miles north of Dallas. The town is located on the western edge of the Blackland Prairie, a region of Texas characterized by rich, fertile soil and abundant rainfall. The town is bordered to the north by the city of Pilot Point, to the east by the city of Sanger, to the south by the city of Cross Roads, and to the west by the city of Krugerville.
The terrain of Aubrey is generally flat, with an elevation of approximately 600 feet above sea level. The town is situated on the banks of the Elm Fork of the Trinity River, which flows through the center of town. The climate of Aubrey is characterized by hot, humid summers and mild winters. The average annual temperature is 68°F, and the average annual precipitation is 37 inches.
Economy
Aubrey is a small, rural town with a primarily agricultural economy. The town is home to several large farms and ranches, as well as several small businesses. The town is also home to a number of manufacturing and industrial businesses, including a plastics factory, a metal fabrication plant, and a printing company.
The town is served by the Aubrey Independent School District, which includes two elementary schools, one middle school, and one high school. The town is also home to a branch of the North Central Texas College.
Demographics
As of the 2010 census, the population of Aubrey was 2,126. The racial makeup of the town was 87.3% White, 5.2% African American, 0.7% Native American, 0.5% Asian, 0.1% Pacific Islander, 4.2% from other races, and 2.1% from two or more races. Hispanic or Latino of any race were 11.2% of the population.
The median income for a household in Aubrey was $50,938, and the median income for a family was $58,906. The per capita income for the town was $21,945. About 8.2% of families and 10.3% of the population were below the poverty line, including 14.2% of those under age 18 and 6.2% of those age 65 or over.
Conclusion
Aubrey, Texas is a small town located in Denton County, Texas, United States. It is situated about 40 miles north of Dallas and is part of the Dallas-Fort Worth-Arlington metropolitan area. The town was founded in 1881 and was named after Aubrey, the son of a local rancher. As of the 2010 census, the population of Aubrey was 2,126. The town is situated on the western edge of the Blackland Prairie, and is bordered to the north by the city of Pilot Point, to the east by the city of Sanger, to the south by the city of Cross Roads, and to the west by the city of Krugerville. The town has a primarily agricultural economy, and is served by the Aubrey Independent School District. As of the 2010 census, the population of Aubrey was 2,126, with a median household income of $50,938 and a median family income of $58,906.
Common Questions
What is Per Capita Income in Aubrey?
Per Capita income in Aubrey is $39,768.
What is the Median Family Income in Aubrey?
Median Family Income in Aubrey is $107,931.
What is the Median Household income in Aubrey?
Median Household Income in Aubrey is $93,071.
What is Income or Wage Gap in Aubrey?
Income or Wage Gap in Aubrey is 61.5%.
Women in Aubrey earn 38.5 cents for every dollar earned by a man.
What is Inequality or Gini Index in Aubrey?
Inequality or Gini Index in Aubrey is 0.39.
What is the Total Population of Aubrey?
Total Population of Aubrey is 5,932.
What is the Total Male Population of Aubrey?
Total Male Population of Aubrey is 2,726.
What is the Total Female Population of Aubrey?
Total Female Population of Aubrey is 3,206.
What is the Ratio of Males per 100 Females in Aubrey?
There are 85.03 Males per 100 Females in Aubrey.
What is the Ratio of Females per 100 Males in Aubrey?
There are 117.61 Females per 100 Males in Aubrey.
What is the Median Population Age in Aubrey?
Median Population Age in Aubrey is 36.5 Years.
What is the Average Family Size in Aubrey
Average Family Size in Aubrey is 3.3 People.
What is the Average Household Size in Aubrey
Average Household Size in Aubrey is 2.7 People.
How Large is the Labor Force in Aubrey?
There are 3,193 People in the Labor Forcein in Aubrey.
What is the Percentage of People in the Labor Force in Aubrey?
72.4% of People are in the Labor Force in Aubrey.
What is the Unemployment Rate in Aubrey?
Unemployment Rate in Aubrey is 2.3%.