White Lake, SD Map & Demographics
White Lake Map
White Lake Overview
$28,901
PER CAPITA INCOME
$79,167
AVG FAMILY INCOME
$47,500
AVG HOUSEHOLD INCOME
55.1%
WAGE / INCOME GAP [ % ]
44.9¢/ $1
WAGE / INCOME GAP [ $ ]
$11,817
FAMILY INCOME DEFICIT
0.43
INEQUALITY / GINI INDEX
404
TOTAL POPULATION
203
MALE POPULATION
201
FEMALE POPULATION
101.00
MALES / 100 FEMALES
99.01
FEMALES / 100 MALES
52.2
MEDIAN AGE
3.0
AVG FAMILY SIZE
2.2
AVG HOUSEHOLD SIZE
177
LABOR FORCE [ PEOPLE ]
53.8%
PERCENT IN LABOR FORCE
White Lake Zip Codes
White Lake Area Codes
Income in White Lake
Income Overview in White Lake
Per Capita Income in White Lake is $28,901, while median incomes of families and households are $79,167 and $47,500 respectively.
| Characteristic | Number | Measure |
| Per Capita Income | 404 | $28,901 |
| Median Family Income | 96 | $79,167 |
| Mean Family Income | 96 | $89,560 |
| Median Household Income | 160 | $47,500 |
| Mean Household Income | 160 | $67,544 |
| Income Deficit | 96 | $11,817 |
| Wage / Income Gap (%) | 404 | 55.13% |
| Wage / Income Gap ($) | 404 | 44.87¢ per $1 |
| Gini / Inequality Index | 404 | 0.43 |
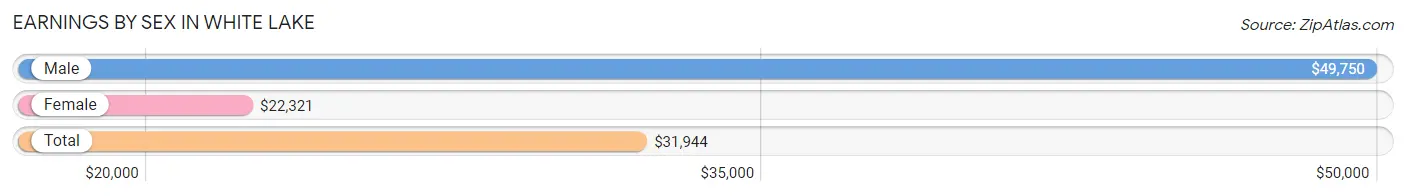
Earnings by Sex in White Lake
Average Earnings in White Lake are $31,944, $49,750 for men and $22,321 for women, a difference of 55.1%.
| Sex | Number | Average Earnings |
| Male | 93 (47.0%) | $49,750 |
| Female | 105 (53.0%) | $22,321 |
| Total | 198 (100.0%) | $31,944 |
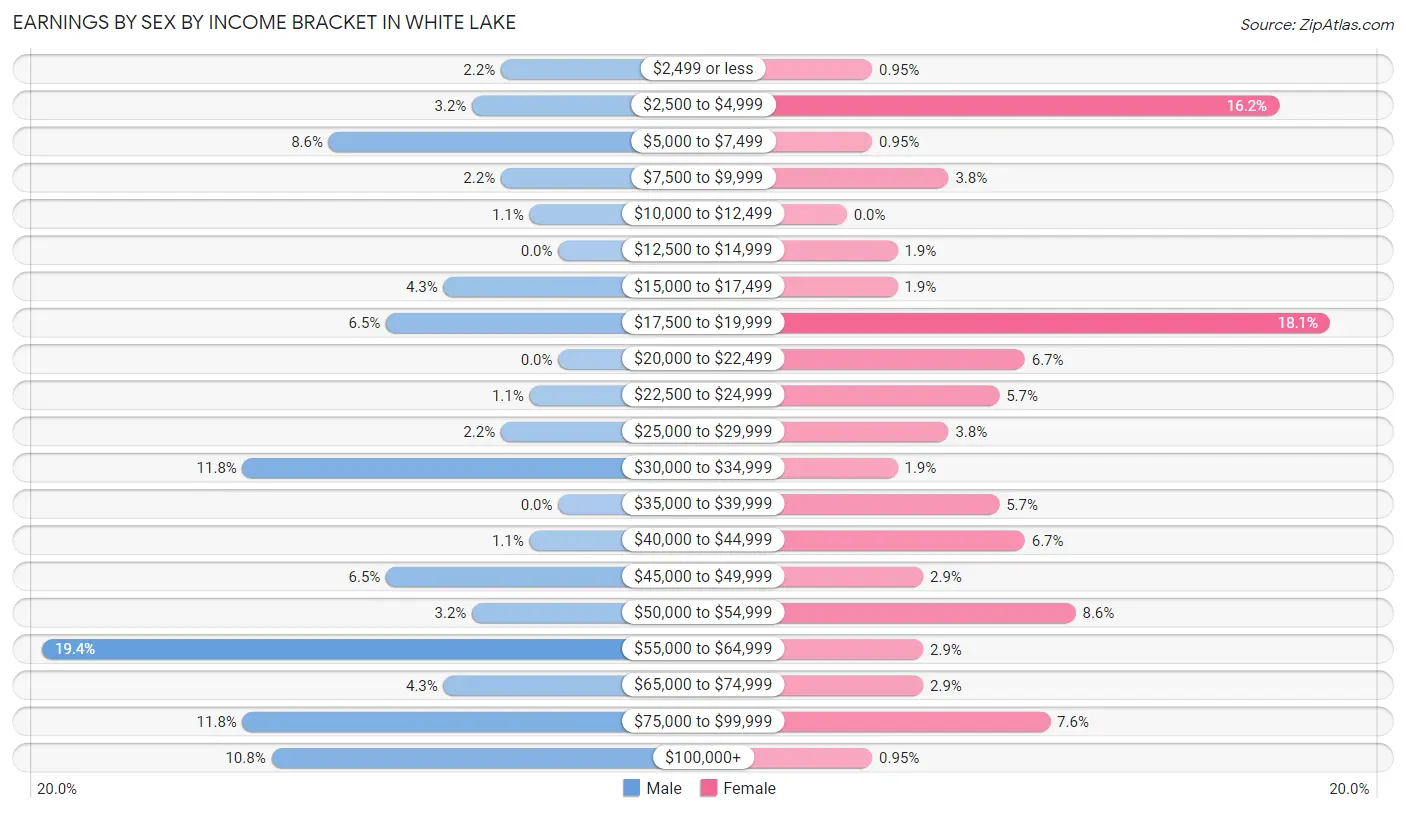
Earnings by Sex by Income Bracket in White Lake
The most common earnings brackets in White Lake are $55,000 to $64,999 for men (18 | 19.4%) and $17,500 to $19,999 for women (19 | 18.1%).
| Income | Male | Female |
| $2,499 or less | 2 (2.1%) | 1 (0.9%) |
| $2,500 to $4,999 | 3 (3.2%) | 17 (16.2%) |
| $5,000 to $7,499 | 8 (8.6%) | 1 (0.9%) |
| $7,500 to $9,999 | 2 (2.1%) | 4 (3.8%) |
| $10,000 to $12,499 | 1 (1.1%) | 0 (0.0%) |
| $12,500 to $14,999 | 0 (0.0%) | 2 (1.9%) |
| $15,000 to $17,499 | 4 (4.3%) | 2 (1.9%) |
| $17,500 to $19,999 | 6 (6.5%) | 19 (18.1%) |
| $20,000 to $22,499 | 0 (0.0%) | 7 (6.7%) |
| $22,500 to $24,999 | 1 (1.1%) | 6 (5.7%) |
| $25,000 to $29,999 | 2 (2.1%) | 4 (3.8%) |
| $30,000 to $34,999 | 11 (11.8%) | 2 (1.9%) |
| $35,000 to $39,999 | 0 (0.0%) | 6 (5.7%) |
| $40,000 to $44,999 | 1 (1.1%) | 7 (6.7%) |
| $45,000 to $49,999 | 6 (6.5%) | 3 (2.9%) |
| $50,000 to $54,999 | 3 (3.2%) | 9 (8.6%) |
| $55,000 to $64,999 | 18 (19.4%) | 3 (2.9%) |
| $65,000 to $74,999 | 4 (4.3%) | 3 (2.9%) |
| $75,000 to $99,999 | 11 (11.8%) | 8 (7.6%) |
| $100,000+ | 10 (10.7%) | 1 (0.9%) |
| Total | 93 (100.0%) | 105 (100.0%) |
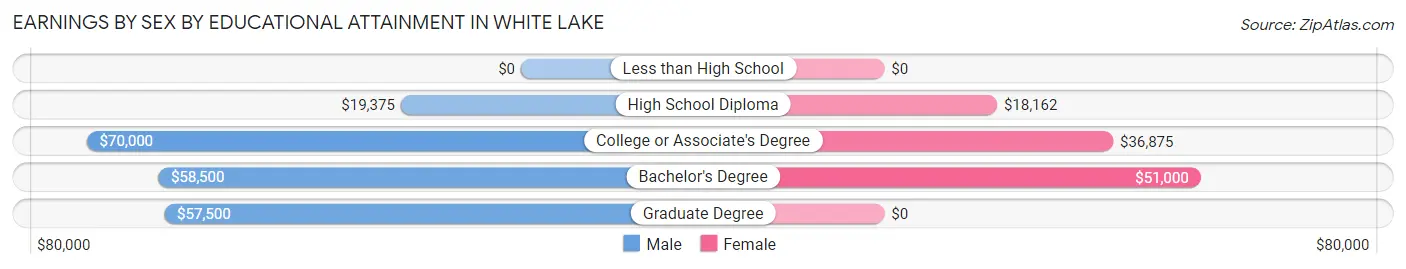
Earnings by Sex by Educational Attainment in White Lake
Average earnings in White Lake are $53,750 for men and $22,500 for women, a difference of 58.1%. Men with an educational attainment of college or associate's degree enjoy the highest average annual earnings of $70,000, while those with high school diploma education earn the least with $19,375. Women with an educational attainment of bachelor's degree earn the most with the average annual earnings of $51,000, while those with high school diploma education have the smallest earnings of $18,162.
| Educational Attainment | Male Income | Female Income |
| Less than High School | - | - |
| High School Diploma | $19,375 | $18,162 |
| College or Associate's Degree | $70,000 | $36,875 |
| Bachelor's Degree | $58,500 | $51,000 |
| Graduate Degree | $57,500 | $0 |
| Total | $53,750 | $22,500 |
Family Income in White Lake
Family Income Brackets in White Lake
According to the White Lake family income data, there are 23 families falling into the $100,000 to $149,999 income range, which is the most common income bracket and makes up 24.0% of all families.
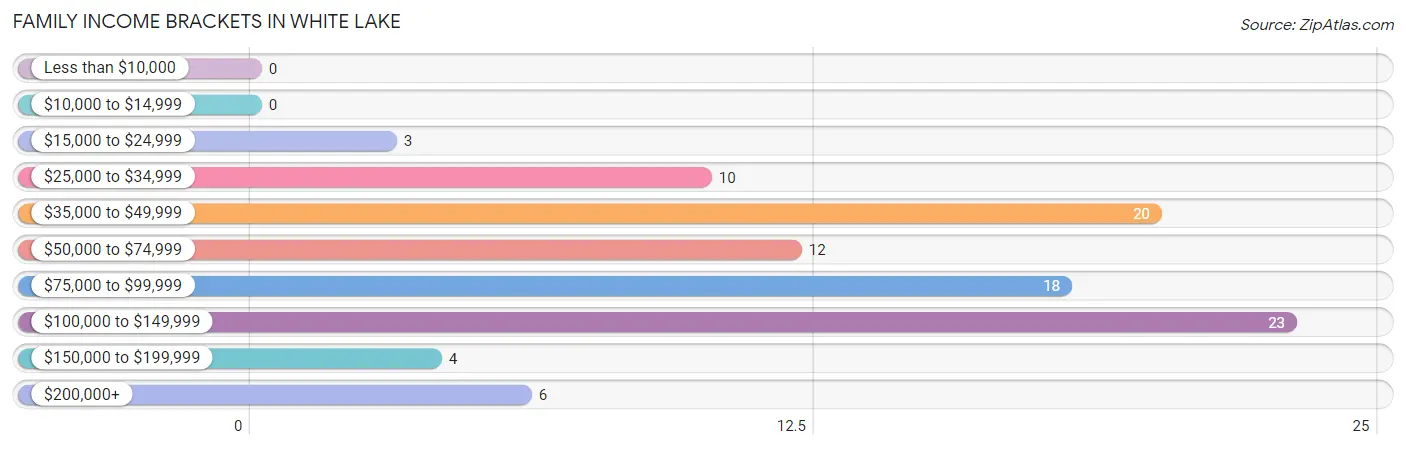
| Income Bracket | # Families | % Families |
| Less than $10,000 | 0 | 0.0% |
| $10,000 to $14,999 | 0 | 0.0% |
| $15,000 to $24,999 | 3 | 3.1% |
| $25,000 to $34,999 | 10 | 10.4% |
| $35,000 to $49,999 | 20 | 20.8% |
| $50,000 to $74,999 | 12 | 12.5% |
| $75,000 to $99,999 | 18 | 18.8% |
| $100,000 to $149,999 | 23 | 24.0% |
| $150,000 to $199,999 | 4 | 4.2% |
| $200,000+ | 6 | 6.3% |
Family Income by Famaliy Size in White Lake
3-person families (8 | 8.3%) account for the highest median family income in White Lake with $133,750 per family, while 3-person families (8 | 8.3%) have the highest median income of $44,583 per family member.
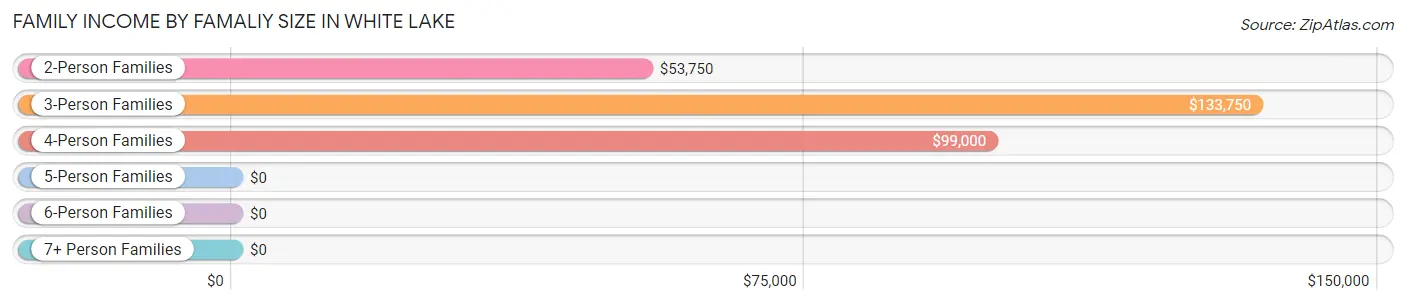
| Income Bracket | # Families | Median Income |
| 2-Person Families | 60 (62.5%) | $53,750 |
| 3-Person Families | 8 (8.3%) | $133,750 |
| 4-Person Families | 14 (14.6%) | $99,000 |
| 5-Person Families | 10 (10.4%) | $0 |
| 6-Person Families | 3 (3.1%) | $0 |
| 7+ Person Families | 1 (1.0%) | $0 |
| Total | 96 (100.0%) | $79,167 |
Family Income by Number of Earners in White Lake
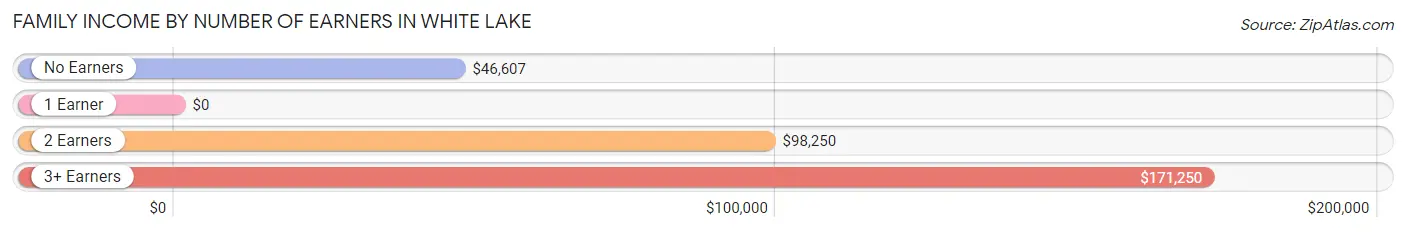
| Number of Earners | # Families | Median Income |
| No Earners | 9 (9.4%) | $46,607 |
| 1 Earner | 23 (24.0%) | $0 |
| 2 Earners | 61 (63.5%) | $98,250 |
| 3+ Earners | 3 (3.1%) | $171,250 |
| Total | 96 (100.0%) | $79,167 |
Household Income in White Lake
Household Income Brackets in White Lake
With 34 households falling in the category, the $15,000 to $24,999 income range is the most frequent in White Lake, accounting for 21.2% of all households. In contrast, only 1 households (0.6%) fall into the less than $10,000 income bracket, making it the least populous group.
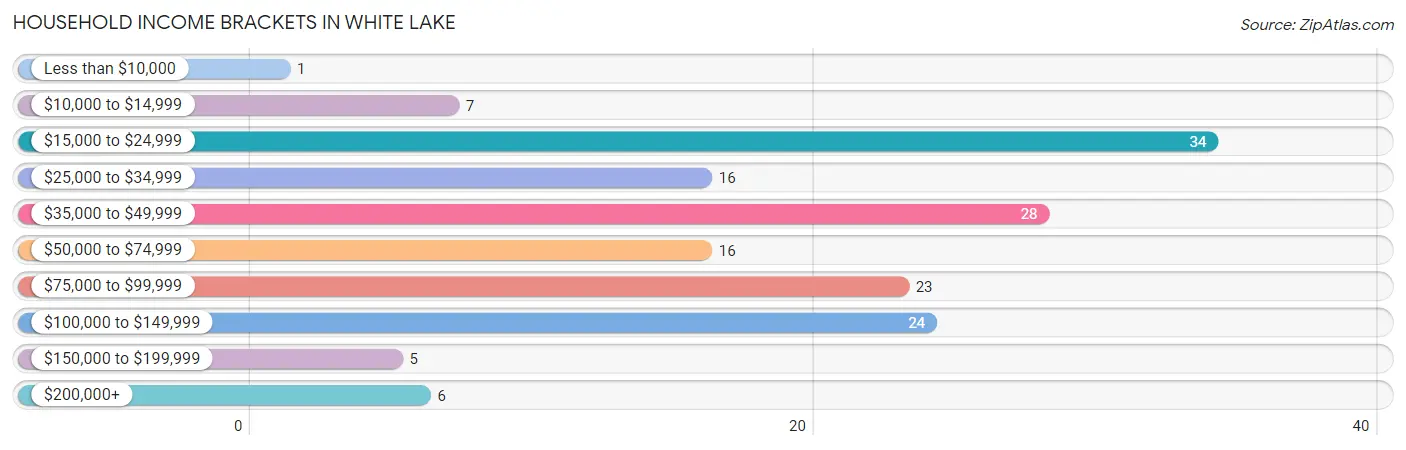
| Income Bracket | # Households | % Households |
| Less than $10,000 | 1 | 0.6% |
| $10,000 to $14,999 | 7 | 4.4% |
| $15,000 to $24,999 | 34 | 21.3% |
| $25,000 to $34,999 | 16 | 10.0% |
| $35,000 to $49,999 | 28 | 17.5% |
| $50,000 to $74,999 | 16 | 10.0% |
| $75,000 to $99,999 | 23 | 14.4% |
| $100,000 to $149,999 | 24 | 15.0% |
| $150,000 to $199,999 | 5 | 3.1% |
| $200,000+ | 6 | 3.8% |
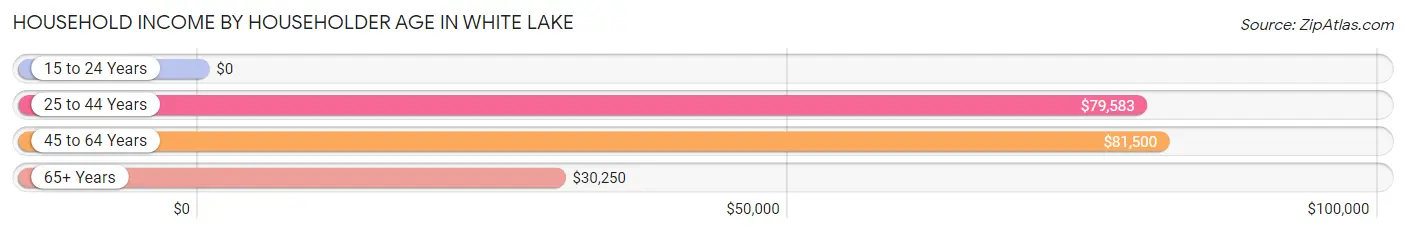
Household Income by Householder Age in White Lake
The median household income in White Lake is $47,500, with the highest median household income of $81,500 found in the 45 to 64 years age bracket for the primary householder. A total of 42 households (26.3%) fall into this category.
| Income Bracket | # Households | Median Income |
| 15 to 24 Years | 0 (0.0%) | $0 |
| 25 to 44 Years | 43 (26.9%) | $79,583 |
| 45 to 64 Years | 42 (26.3%) | $81,500 |
| 65+ Years | 75 (46.9%) | $30,250 |
| Total | 160 (100.0%) | $47,500 |
Poverty in White Lake
Income Below Poverty by Sex and Age in White Lake
With 9.8% poverty level for males and 12.7% for females among the residents of White Lake, 5 year old males and 5 year old females are the most vulnerable to poverty, with 3 males (60.0%) and 1 females (100.0%) in their respective age groups living below the poverty level.
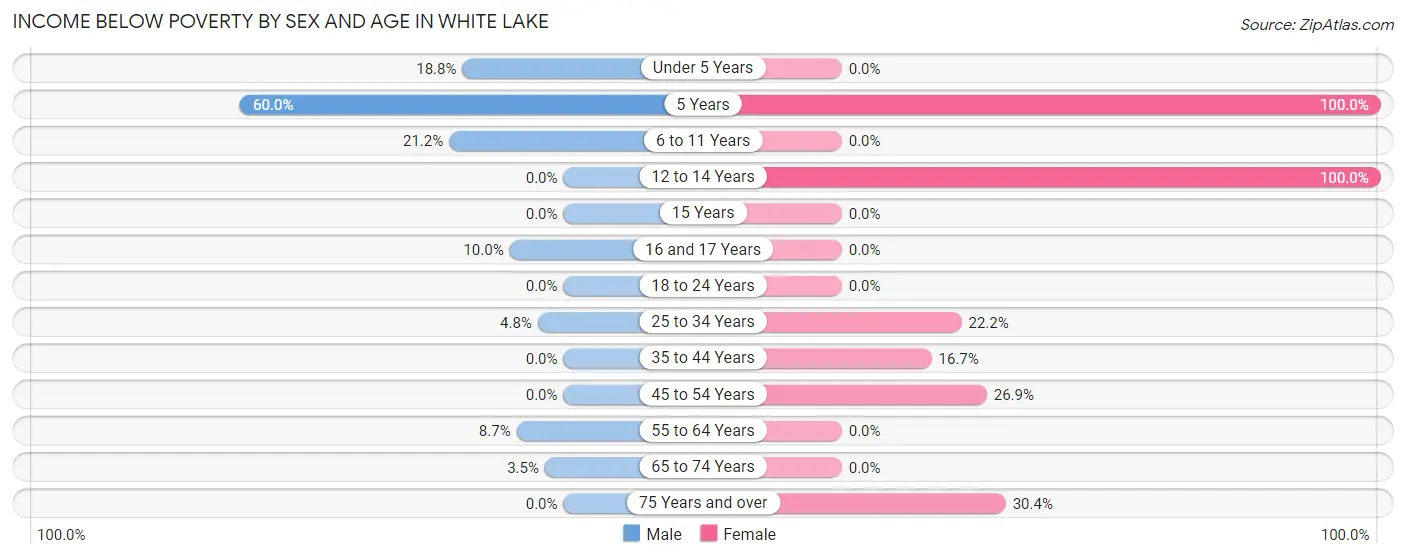
| Age Bracket | Male | Female |
| Under 5 Years | 3 (18.8%) | 0 (0.0%) |
| 5 Years | 3 (60.0%) | 1 (100.0%) |
| 6 to 11 Years | 7 (21.2%) | 0 (0.0%) |
| 12 to 14 Years | 0 (0.0%) | 1 (100.0%) |
| 15 Years | 0 (0.0%) | 0 (0.0%) |
| 16 and 17 Years | 1 (10.0%) | 0 (0.0%) |
| 18 to 24 Years | 0 (0.0%) | 0 (0.0%) |
| 25 to 34 Years | 1 (4.8%) | 4 (22.2%) |
| 35 to 44 Years | 0 (0.0%) | 2 (16.7%) |
| 45 to 54 Years | 0 (0.0%) | 7 (26.9%) |
| 55 to 64 Years | 2 (8.7%) | 0 (0.0%) |
| 65 to 74 Years | 1 (3.5%) | 0 (0.0%) |
| 75 Years and over | 0 (0.0%) | 7 (30.4%) |
| Total | 18 (9.8%) | 22 (12.7%) |
Income Above Poverty by Sex and Age in White Lake
According to the poverty statistics in White Lake, males aged 12 to 14 years and females aged under 5 years are the age groups that are most secure financially, with 100.0% of males and 100.0% of females in these age groups living above the poverty line.
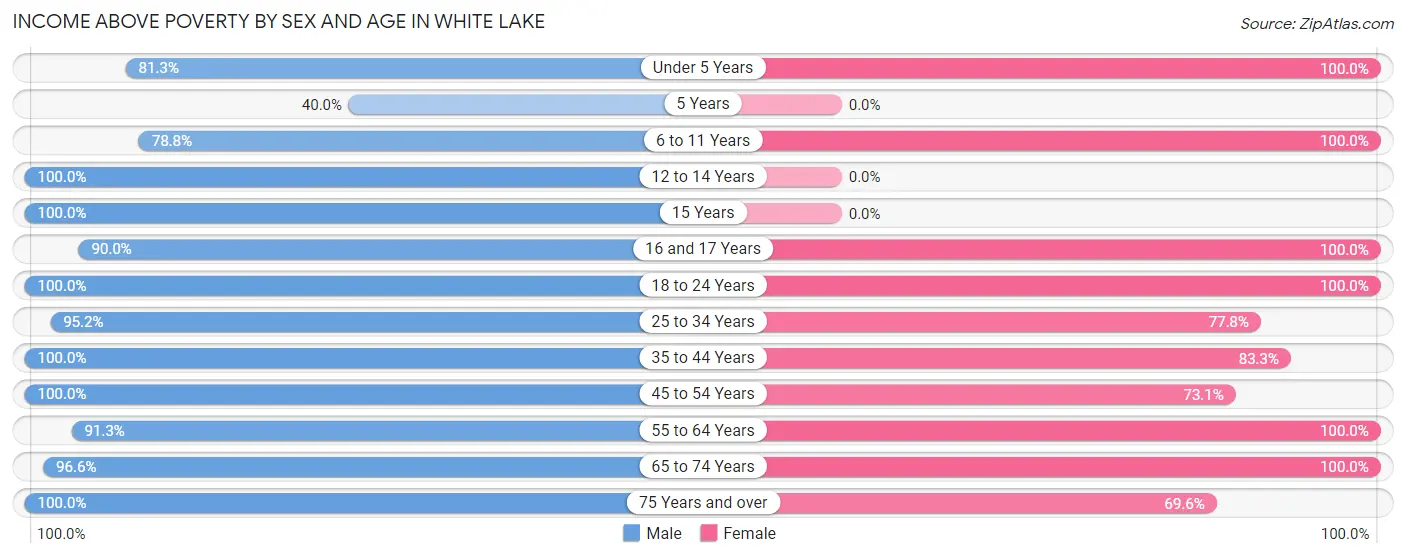
| Age Bracket | Male | Female |
| Under 5 Years | 13 (81.2%) | 11 (100.0%) |
| 5 Years | 2 (40.0%) | 0 (0.0%) |
| 6 to 11 Years | 26 (78.8%) | 4 (100.0%) |
| 12 to 14 Years | 2 (100.0%) | 0 (0.0%) |
| 15 Years | 2 (100.0%) | 0 (0.0%) |
| 16 and 17 Years | 9 (90.0%) | 3 (100.0%) |
| 18 to 24 Years | 7 (100.0%) | 7 (100.0%) |
| 25 to 34 Years | 20 (95.2%) | 14 (77.8%) |
| 35 to 44 Years | 14 (100.0%) | 10 (83.3%) |
| 45 to 54 Years | 16 (100.0%) | 19 (73.1%) |
| 55 to 64 Years | 21 (91.3%) | 21 (100.0%) |
| 65 to 74 Years | 28 (96.6%) | 46 (100.0%) |
| 75 Years and over | 6 (100.0%) | 16 (69.6%) |
| Total | 166 (90.2%) | 151 (87.3%) |
Income Below Poverty Among Married-Couple Families in White Lake
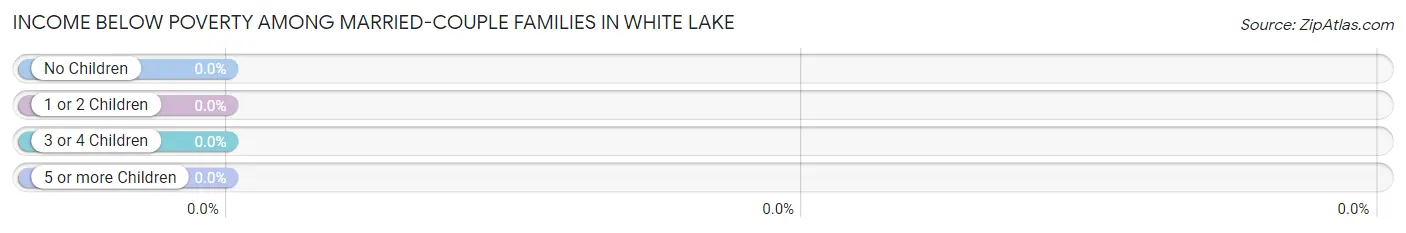
| Children | Above Poverty | Below Poverty |
| No Children | 55 (100.0%) | 0 (0.0%) |
| 1 or 2 Children | 18 (100.0%) | 0 (0.0%) |
| 3 or 4 Children | 5 (100.0%) | 0 (0.0%) |
| 5 or more Children | 1 (100.0%) | 0 (0.0%) |
| Total | 79 (100.0%) | 0 (0.0%) |
Income Below Poverty Among Single-Parent Households in White Lake
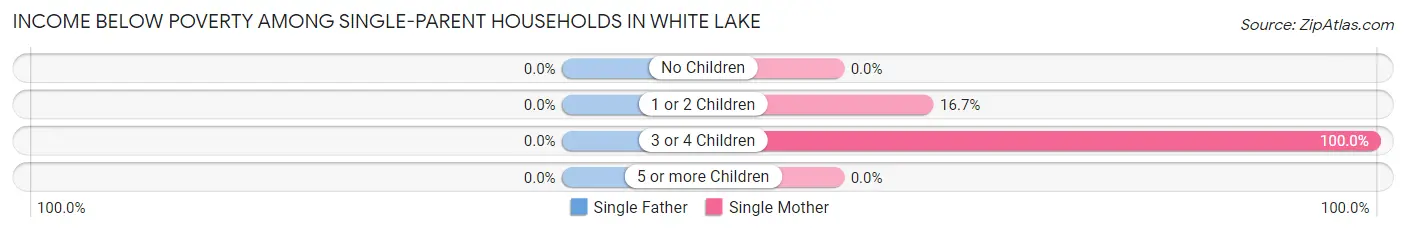
| Children | Single Father | Single Mother |
| No Children | 0 (0.0%) | 0 (0.0%) |
| 1 or 2 Children | 0 (0.0%) | 1 (16.7%) |
| 3 or 4 Children | 0 (0.0%) | 5 (100.0%) |
| 5 or more Children | 0 (0.0%) | 0 (0.0%) |
| Total | 0 (0.0%) | 6 (42.9%) |
Income Below Poverty Among Married-Couple vs Single-Parent Households in White Lake
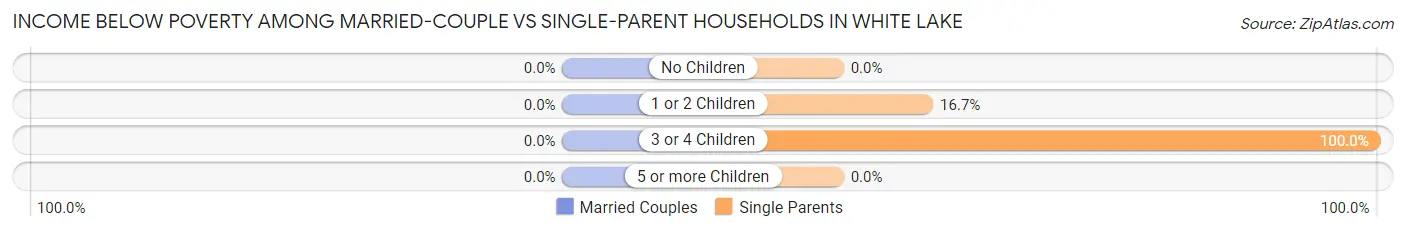
| Children | Married-Couple Families | Single-Parent Households |
| No Children | 0 (0.0%) | 0 (0.0%) |
| 1 or 2 Children | 0 (0.0%) | 1 (16.7%) |
| 3 or 4 Children | 0 (0.0%) | 5 (100.0%) |
| 5 or more Children | 0 (0.0%) | 0 (0.0%) |
| Total | 0 (0.0%) | 6 (35.3%) |
Race in White Lake
The most populous races in White Lake are White / Caucasian (395 | 97.8%), Hispanic or Latino (15 | 3.7%), and Black / African American (9 | 2.2%).
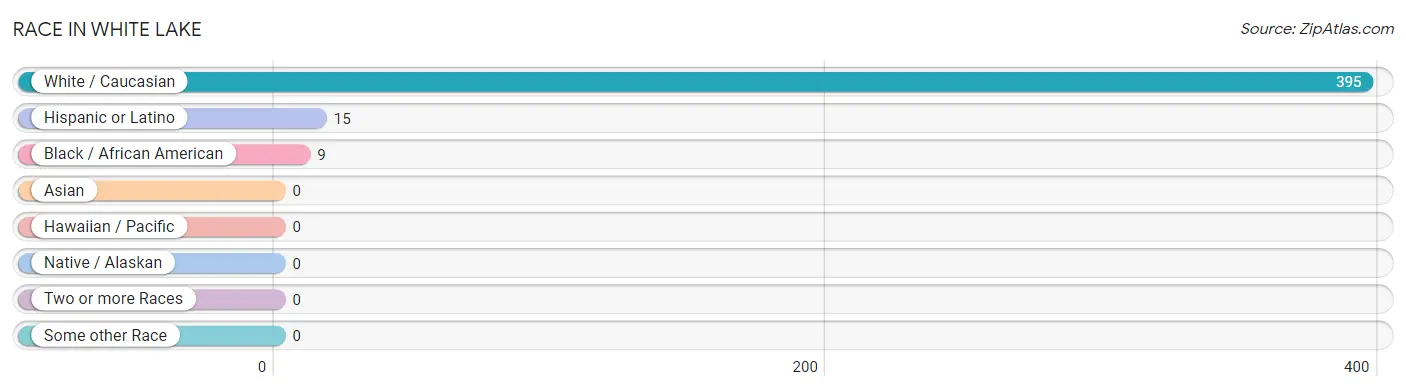
| Race | # Population | % Population |
| Asian | 0 | 0.0% |
| Black / African American | 9 | 2.2% |
| Hawaiian / Pacific | 0 | 0.0% |
| Hispanic or Latino | 15 | 3.7% |
| Native / Alaskan | 0 | 0.0% |
| White / Caucasian | 395 | 97.8% |
| Two or more Races | 0 | 0.0% |
| Some other Race | 0 | 0.0% |
| Total | 404 | 100.0% |
Ancestry in White Lake
The most populous ancestries reported in White Lake are German (151 | 37.4%), Norwegian (42 | 10.4%), Czech (40 | 9.9%), Irish (35 | 8.7%), and American (26 | 6.4%), together accounting for 72.8% of all White Lake residents.
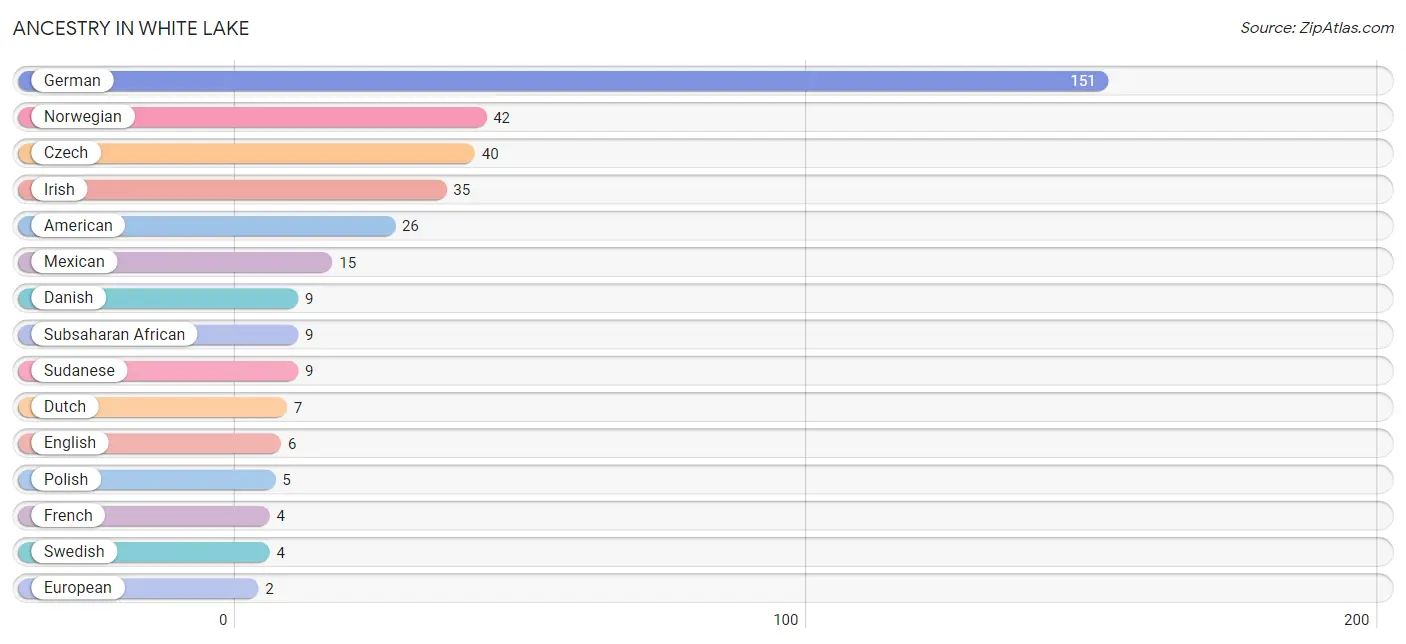
| Ancestry | # Population | % Population |
| American | 26 | 6.4% |
| British | 1 | 0.3% |
| Czech | 40 | 9.9% |
| Danish | 9 | 2.2% |
| Dutch | 7 | 1.7% |
| English | 6 | 1.5% |
| European | 2 | 0.5% |
| French | 4 | 1.0% |
| German | 151 | 37.4% |
| Irish | 35 | 8.7% |
| Mexican | 15 | 3.7% |
| Norwegian | 42 | 10.4% |
| Polish | 5 | 1.2% |
| Scotch-Irish | 1 | 0.3% |
| Scottish | 1 | 0.3% |
| Subsaharan African | 9 | 2.2% |
| Sudanese | 9 | 2.2% |
| Swedish | 4 | 1.0% | View All 18 Rows |
Immigrants in White Lake

| Immigration Origin | # Population | % Population | View All 0 Rows |
Sex and Age in White Lake
Sex and Age in White Lake
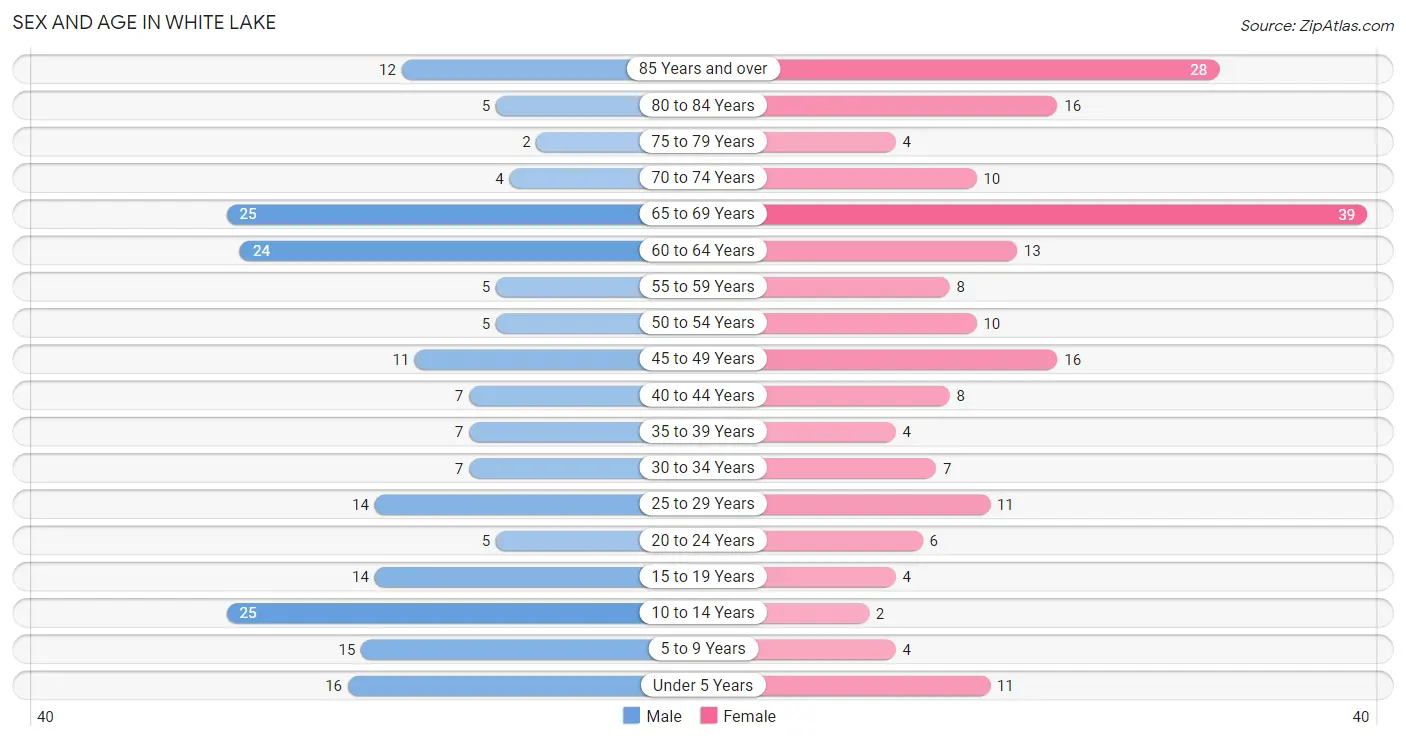
The most populous age groups in White Lake are 10 to 14 Years (25 | 12.3%) for men and 65 to 69 Years (39 | 19.4%) for women.
| Age Bracket | Male | Female |
| Under 5 Years | 16 (7.9%) | 11 (5.5%) |
| 5 to 9 Years | 15 (7.4%) | 4 (2.0%) |
| 10 to 14 Years | 25 (12.3%) | 2 (1.0%) |
| 15 to 19 Years | 14 (6.9%) | 4 (2.0%) |
| 20 to 24 Years | 5 (2.5%) | 6 (3.0%) |
| 25 to 29 Years | 14 (6.9%) | 11 (5.5%) |
| 30 to 34 Years | 7 (3.5%) | 7 (3.5%) |
| 35 to 39 Years | 7 (3.5%) | 4 (2.0%) |
| 40 to 44 Years | 7 (3.5%) | 8 (4.0%) |
| 45 to 49 Years | 11 (5.4%) | 16 (8.0%) |
| 50 to 54 Years | 5 (2.5%) | 10 (5.0%) |
| 55 to 59 Years | 5 (2.5%) | 8 (4.0%) |
| 60 to 64 Years | 24 (11.8%) | 13 (6.5%) |
| 65 to 69 Years | 25 (12.3%) | 39 (19.4%) |
| 70 to 74 Years | 4 (2.0%) | 10 (5.0%) |
| 75 to 79 Years | 2 (1.0%) | 4 (2.0%) |
| 80 to 84 Years | 5 (2.5%) | 16 (8.0%) |
| 85 Years and over | 12 (5.9%) | 28 (13.9%) |
| Total | 203 (100.0%) | 201 (100.0%) |
Families and Households in White Lake
Median Family Size in White Lake
The median family size in White Lake is 3.04 persons per family, with single female/mother families (14 | 14.6%) accounting for the largest median family size of 3.57 persons per family. On the other hand, single male/father families (3 | 3.1%) represent the smallest median family size with 2.33 persons per family.
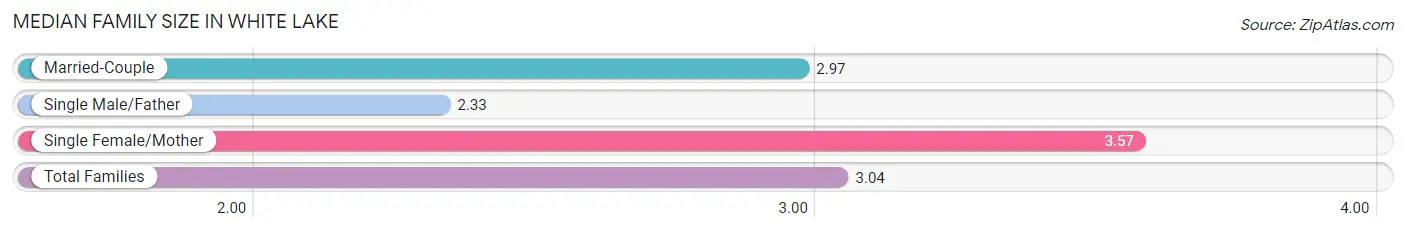
| Family Type | # Families | Family Size |
| Married-Couple | 79 (82.3%) | 2.97 |
| Single Male/Father | 3 (3.1%) | 2.33 |
| Single Female/Mother | 14 (14.6%) | 3.57 |
| Total Families | 96 (100.0%) | 3.04 |
Median Household Size in White Lake
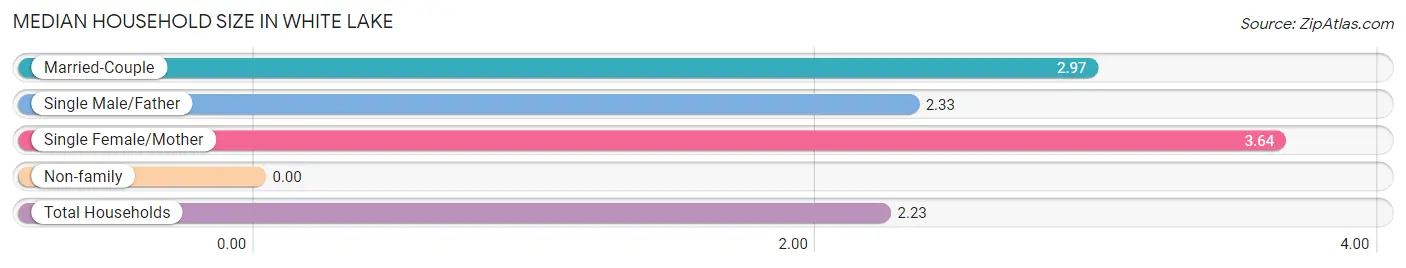
| Household Type | # Households | Household Size |
| Married-Couple | 79 (49.4%) | 2.97 |
| Single Male/Father | 3 (1.9%) | 2.33 |
| Single Female/Mother | 14 (8.7%) | 3.64 |
| Non-family | 64 (40.0%) | - |
| Total Households | 160 (100.0%) | 2.23 |
Household Size by Marriage Status in White Lake
Out of a total of 160 households in White Lake, 96 (60.0%) are family households, while 64 (40.0%) are nonfamily households. The most numerous type of family households are 2-person households, comprising 59, and the most common type of nonfamily households are 1-person households, comprising 64.
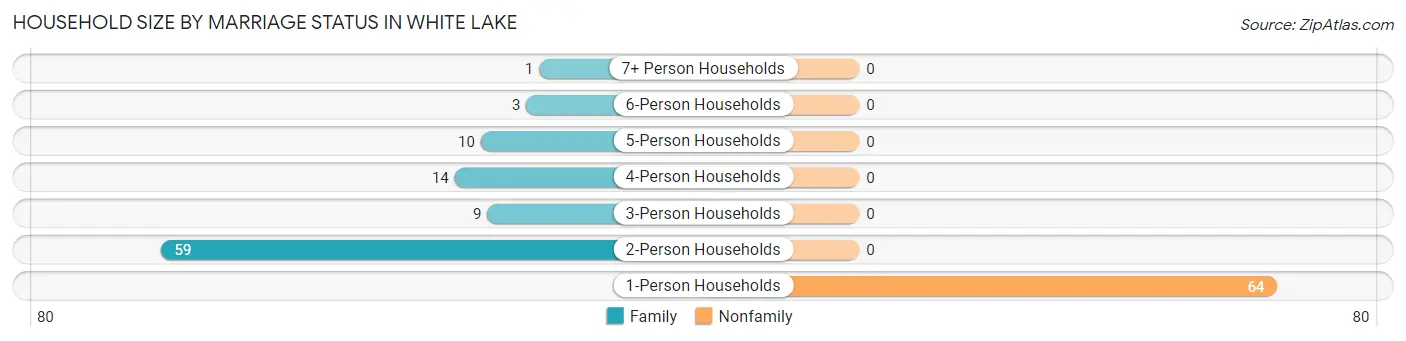
| Household Size | Family Households | Nonfamily Households |
| 1-Person Households | - | 64 (40.0%) |
| 2-Person Households | 59 (36.9%) | 0 (0.0%) |
| 3-Person Households | 9 (5.6%) | 0 (0.0%) |
| 4-Person Households | 14 (8.7%) | 0 (0.0%) |
| 5-Person Households | 10 (6.2%) | 0 (0.0%) |
| 6-Person Households | 3 (1.9%) | 0 (0.0%) |
| 7+ Person Households | 1 (0.6%) | 0 (0.0%) |
| Total | 96 (60.0%) | 64 (40.0%) |
Female Fertility in White Lake
Fertility by Age in White Lake
Average fertility rate in White Lake is 53.0 births per 1,000 women. Women in the age bracket of 20 to 34 years have the highest fertility rate with 125.0 births per 1,000 women. Women in the age bracket of 20 to 34 years acount for 100.0% of all women with births.
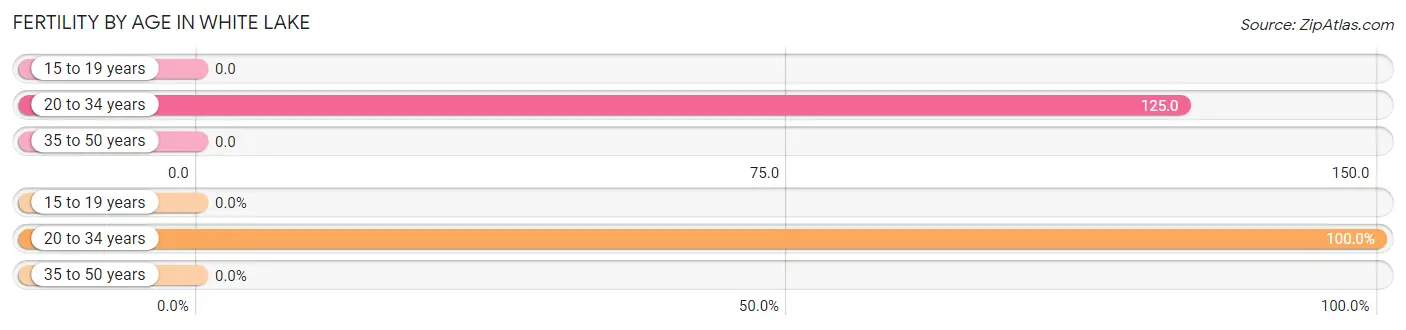
| Age Bracket | Women with Births | Births / 1,000 Women |
| 15 to 19 years | 0 (0.0%) | 0.0 |
| 20 to 34 years | 3 (100.0%) | 125.0 |
| 35 to 50 years | 0 (0.0%) | 0.0 |
| Total | 3 (100.0%) | 53.0 |
Fertility by Age by Marriage Status in White Lake
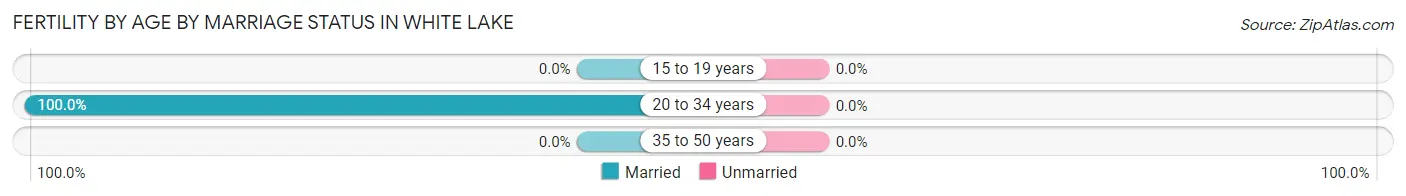
| Age Bracket | Married | Unmarried |
| 15 to 19 years | 0 (0.0%) | 0 (0.0%) |
| 20 to 34 years | 3 (100.0%) | 0 (0.0%) |
| 35 to 50 years | 0 (0.0%) | 0 (0.0%) |
| Total | 3 (100.0%) | 0 (0.0%) |
Fertility by Education in White Lake
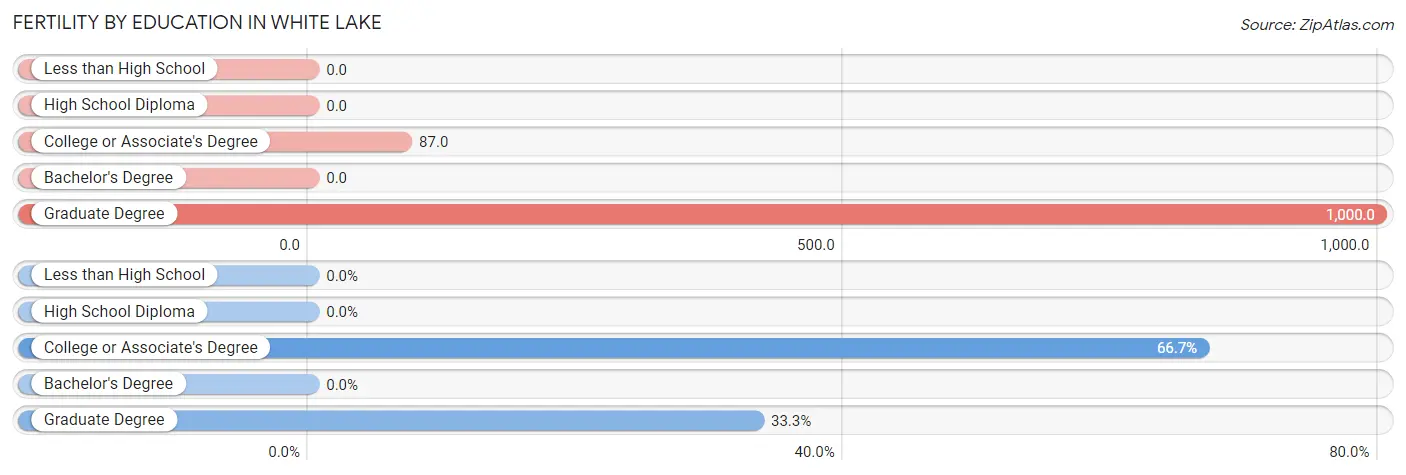
| Educational Attainment | Women with Births | Births / 1,000 Women |
| Less than High School | 0 (0.0%) | 0.0 |
| High School Diploma | 0 (0.0%) | 0.0 |
| College or Associate's Degree | 2 (66.7%) | 87.0 |
| Bachelor's Degree | 0 (0.0%) | 0.0 |
| Graduate Degree | 1 (33.3%) | 1,000.0 |
| Total | 3 (100.0%) | 53.0 |
Fertility by Education by Marriage Status in White Lake
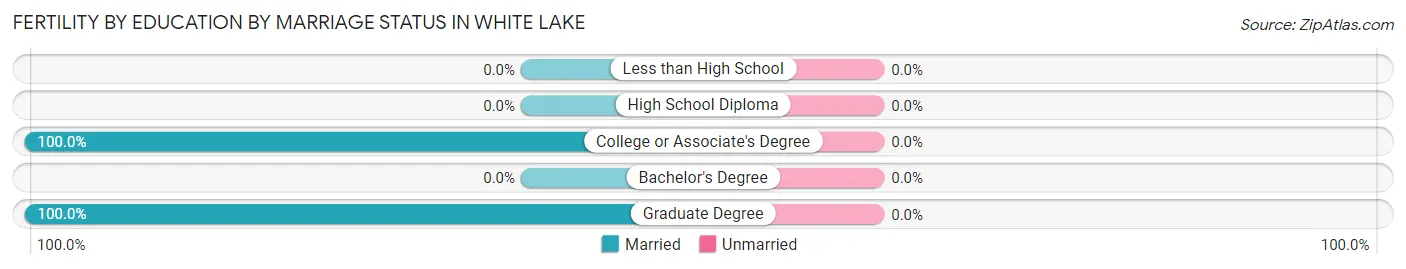
| Educational Attainment | Married | Unmarried |
| Less than High School | 0 (0.0%) | 0 (0.0%) |
| High School Diploma | 0 (0.0%) | 0 (0.0%) |
| College or Associate's Degree | 2 (100.0%) | 0 (0.0%) |
| Bachelor's Degree | 0 (0.0%) | 0 (0.0%) |
| Graduate Degree | 1 (100.0%) | 0 (0.0%) |
| Total | 3 (100.0%) | 0 (0.0%) |
Employment Characteristics in White Lake
Employment by Class of Employer in White Lake
Among the 169 employed individuals in White Lake, private company employees (103 | 61.0%), not-for-profit organizations (24 | 14.2%), and self-employed (not incorporated) (20 | 11.8%) make up the most common classes of employment.
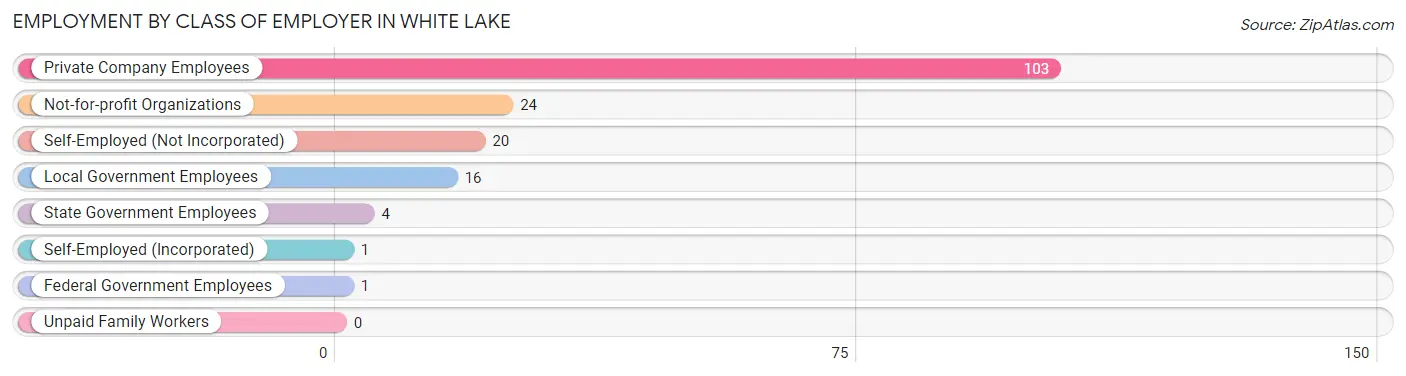
| Employer Class | # Employees | % Employees |
| Private Company Employees | 103 | 61.0% |
| Self-Employed (Incorporated) | 1 | 0.6% |
| Self-Employed (Not Incorporated) | 20 | 11.8% |
| Not-for-profit Organizations | 24 | 14.2% |
| Local Government Employees | 16 | 9.5% |
| State Government Employees | 4 | 2.4% |
| Federal Government Employees | 1 | 0.6% |
| Unpaid Family Workers | 0 | 0.0% |
| Total | 169 | 100.0% |
Employment Status by Age in White Lake
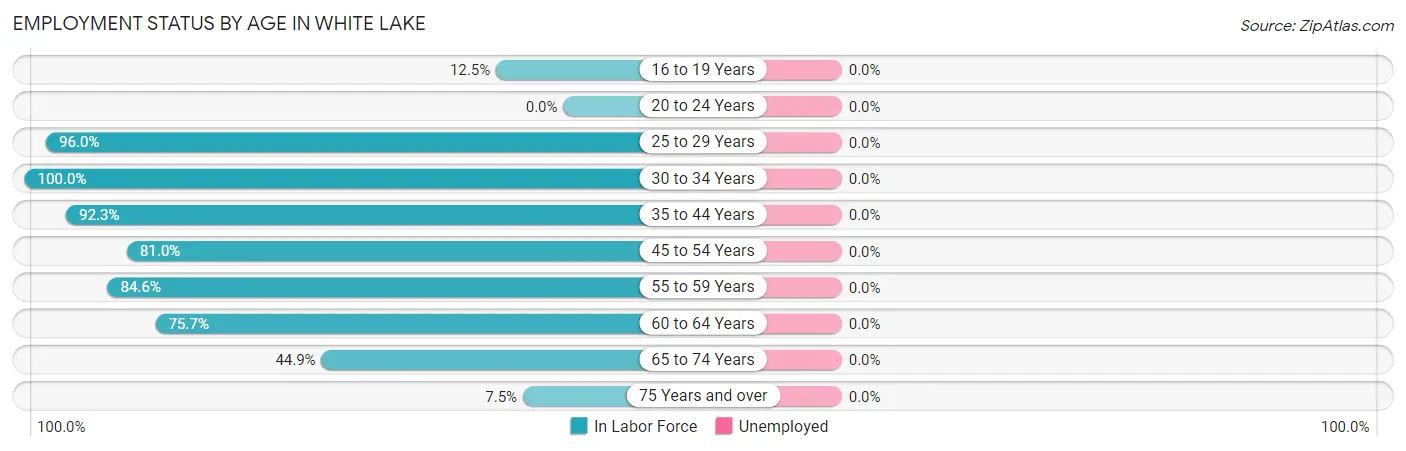
| Age Bracket | In Labor Force | Unemployed |
| 16 to 19 Years | 2 (12.5%) | 0 (0.0%) |
| 20 to 24 Years | 0 (0.0%) | 0 (0.0%) |
| 25 to 29 Years | 24 (96.0%) | 0 (0.0%) |
| 30 to 34 Years | 14 (100.0%) | 0 (0.0%) |
| 35 to 44 Years | 24 (92.3%) | 0 (0.0%) |
| 45 to 54 Years | 34 (81.0%) | 0 (0.0%) |
| 55 to 59 Years | 11 (84.6%) | 0 (0.0%) |
| 60 to 64 Years | 28 (75.7%) | 0 (0.0%) |
| 65 to 74 Years | 35 (44.9%) | 0 (0.0%) |
| 75 Years and over | 5 (7.5%) | 0 (0.0%) |
| Total | 177 (53.8%) | 0 (0.0%) |
Employment Status by Educational Attainment in White Lake
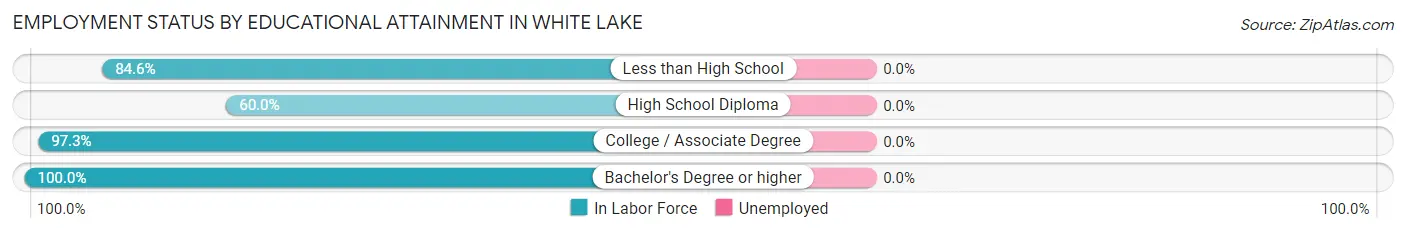
| Educational Attainment | In Labor Force | Unemployed |
| Less than High School | 11 (84.6%) | 0 (0.0%) |
| High School Diploma | 27 (60.0%) | 0 (0.0%) |
| College / Associate Degree | 73 (97.3%) | 0 (0.0%) |
| Bachelor's Degree or higher | 24 (100.0%) | 0 (0.0%) |
| Total | 135 (86.0%) | 0 (0.0%) |
Employment Occupations by Sex in White Lake
Management, Business, Science and Arts Occupations
The most common Management, Business, Science and Arts occupations in White Lake are Management (26 | 14.7%), Health Diagnosing & Treating (15 | 8.5%), Health Technologists (15 | 8.5%), Community & Social Service (7 | 4.0%), and Education Instruction & Library (4 | 2.3%).
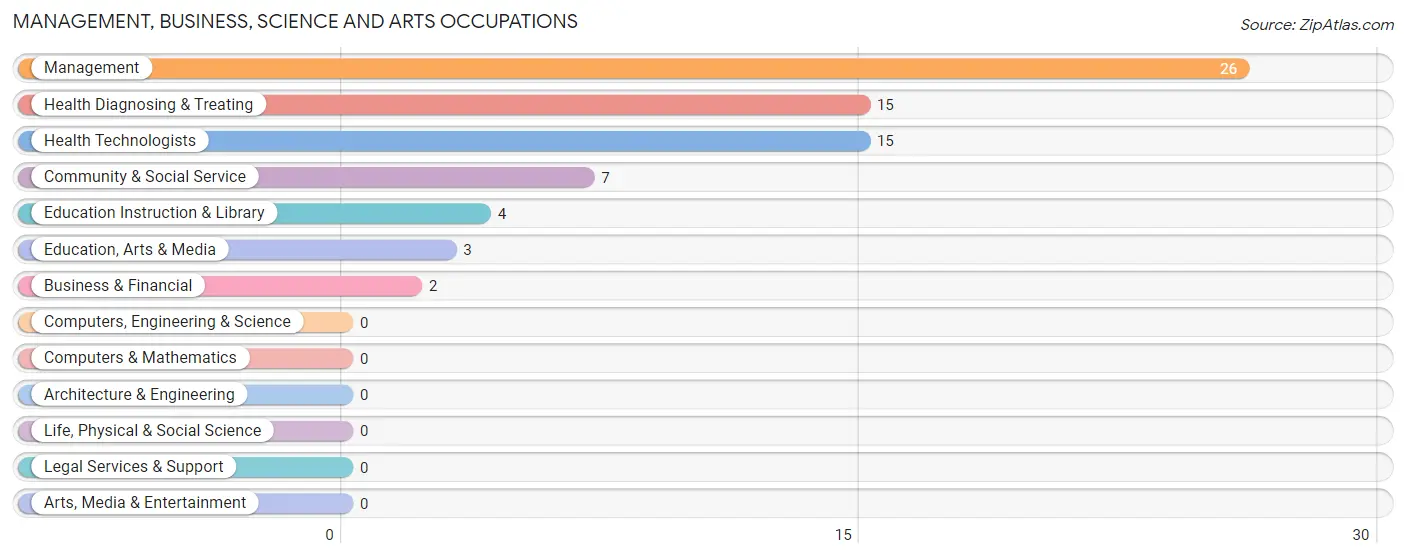
Management, Business, Science and Arts Occupations by Sex
Within the Management, Business, Science and Arts occupations in White Lake, the most male-oriented occupations are Management (80.8%), Education, Arts & Media (66.7%), and Community & Social Service (42.9%), while the most female-oriented occupations are Business & Financial (100.0%), Health Diagnosing & Treating (86.7%), and Health Technologists (86.7%).
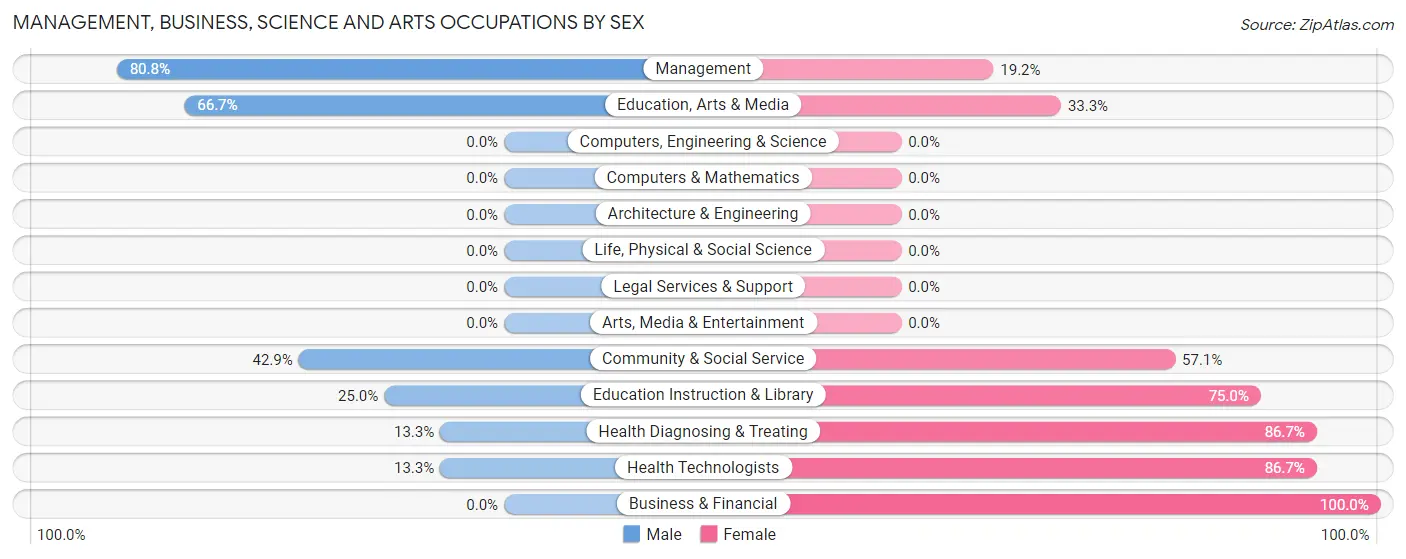
| Occupation | Male | Female |
| Management | 21 (80.8%) | 5 (19.2%) |
| Business & Financial | 0 (0.0%) | 2 (100.0%) |
| Computers, Engineering & Science | 0 (0.0%) | 0 (0.0%) |
| Computers & Mathematics | 0 (0.0%) | 0 (0.0%) |
| Architecture & Engineering | 0 (0.0%) | 0 (0.0%) |
| Life, Physical & Social Science | 0 (0.0%) | 0 (0.0%) |
| Community & Social Service | 3 (42.9%) | 4 (57.1%) |
| Education, Arts & Media | 2 (66.7%) | 1 (33.3%) |
| Legal Services & Support | 0 (0.0%) | 0 (0.0%) |
| Education Instruction & Library | 1 (25.0%) | 3 (75.0%) |
| Arts, Media & Entertainment | 0 (0.0%) | 0 (0.0%) |
| Health Diagnosing & Treating | 2 (13.3%) | 13 (86.7%) |
| Health Technologists | 2 (13.3%) | 13 (86.7%) |
| Total (Category) | 26 (52.0%) | 24 (48.0%) |
| Total (Overall) | 84 (47.5%) | 93 (52.5%) |
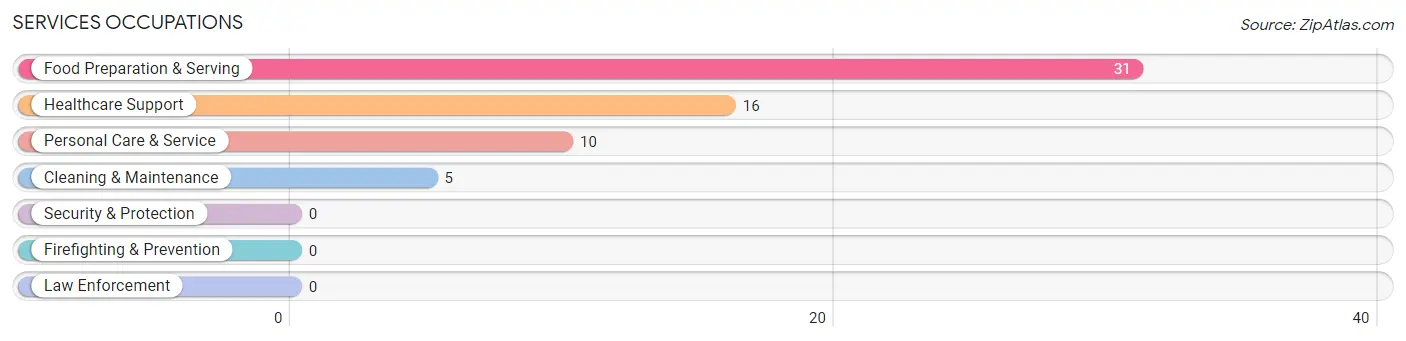
Services Occupations
The most common Services occupations in White Lake are Food Preparation & Serving (31 | 17.5%), Healthcare Support (16 | 9.0%), Personal Care & Service (10 | 5.7%), and Cleaning & Maintenance (5 | 2.8%).
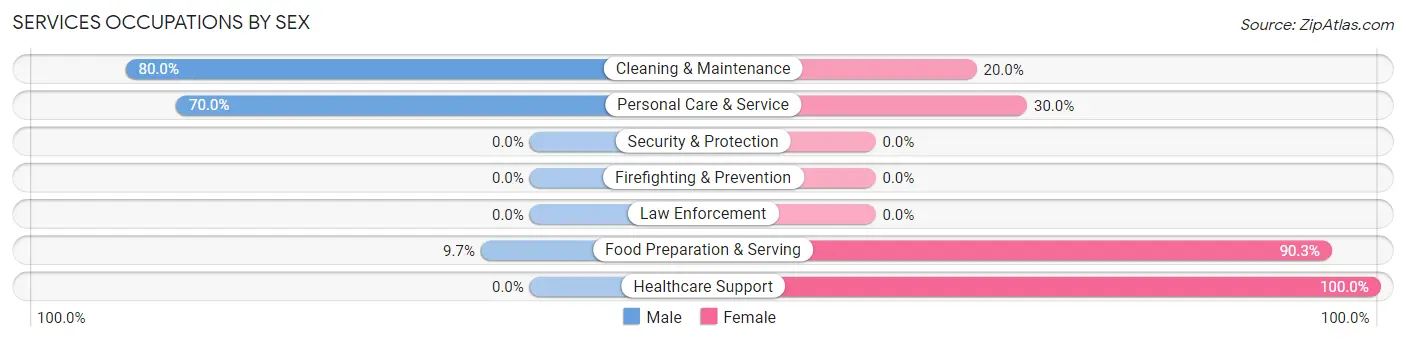
Services Occupations by Sex
Within the Services occupations in White Lake, the most male-oriented occupations are Cleaning & Maintenance (80.0%), Personal Care & Service (70.0%), and Food Preparation & Serving (9.7%), while the most female-oriented occupations are Healthcare Support (100.0%), Food Preparation & Serving (90.3%), and Personal Care & Service (30.0%).
| Occupation | Male | Female |
| Healthcare Support | 0 (0.0%) | 16 (100.0%) |
| Security & Protection | 0 (0.0%) | 0 (0.0%) |
| Firefighting & Prevention | 0 (0.0%) | 0 (0.0%) |
| Law Enforcement | 0 (0.0%) | 0 (0.0%) |
| Food Preparation & Serving | 3 (9.7%) | 28 (90.3%) |
| Cleaning & Maintenance | 4 (80.0%) | 1 (20.0%) |
| Personal Care & Service | 7 (70.0%) | 3 (30.0%) |
| Total (Category) | 14 (22.6%) | 48 (77.4%) |
| Total (Overall) | 84 (47.5%) | 93 (52.5%) |
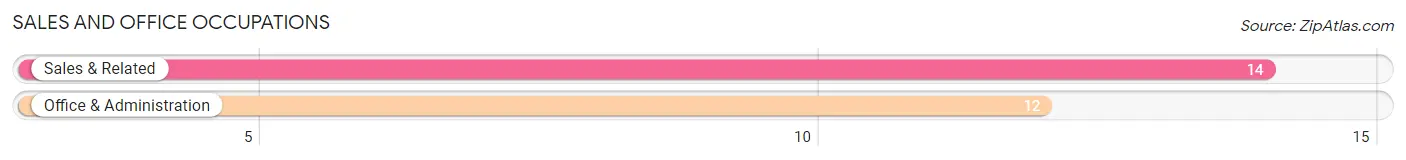
Sales and Office Occupations
The most common Sales and Office occupations in White Lake are Sales & Related (14 | 7.9%), and Office & Administration (12 | 6.8%).
Sales and Office Occupations by Sex
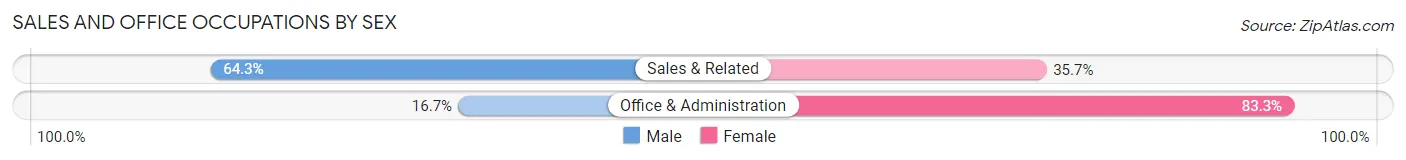
| Occupation | Male | Female |
| Sales & Related | 9 (64.3%) | 5 (35.7%) |
| Office & Administration | 2 (16.7%) | 10 (83.3%) |
| Total (Category) | 11 (42.3%) | 15 (57.7%) |
| Total (Overall) | 84 (47.5%) | 93 (52.5%) |
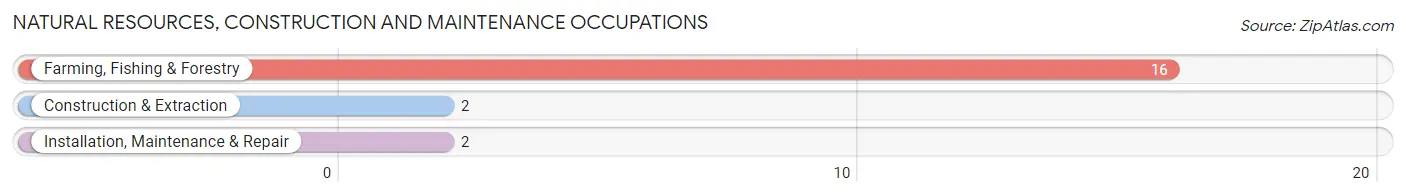
Natural Resources, Construction and Maintenance Occupations
The most common Natural Resources, Construction and Maintenance occupations in White Lake are Farming, Fishing & Forestry (16 | 9.0%), Construction & Extraction (2 | 1.1%), and Installation, Maintenance & Repair (2 | 1.1%).
Natural Resources, Construction and Maintenance Occupations by Sex
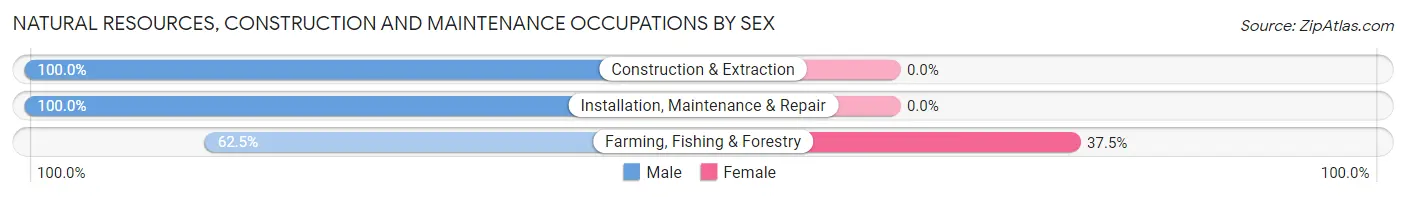
| Occupation | Male | Female |
| Farming, Fishing & Forestry | 10 (62.5%) | 6 (37.5%) |
| Construction & Extraction | 2 (100.0%) | 0 (0.0%) |
| Installation, Maintenance & Repair | 2 (100.0%) | 0 (0.0%) |
| Total (Category) | 14 (70.0%) | 6 (30.0%) |
| Total (Overall) | 84 (47.5%) | 93 (52.5%) |
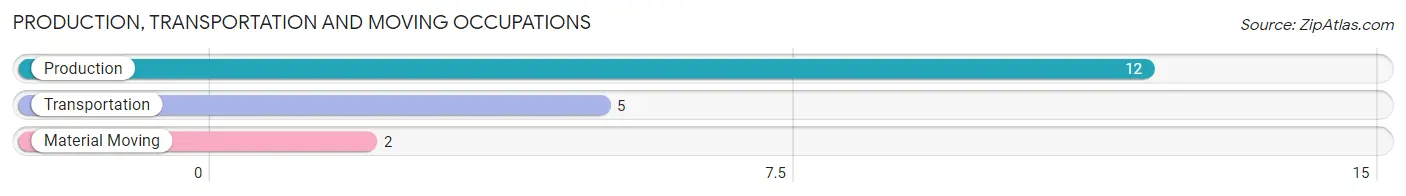
Production, Transportation and Moving Occupations
The most common Production, Transportation and Moving occupations in White Lake are Production (12 | 6.8%), Transportation (5 | 2.8%), and Material Moving (2 | 1.1%).
Production, Transportation and Moving Occupations by Sex
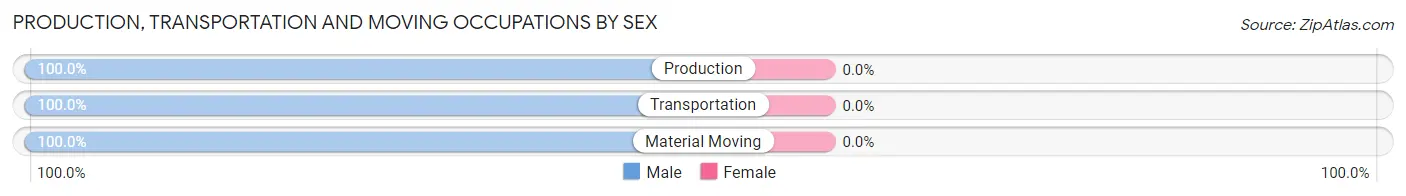
| Occupation | Male | Female |
| Production | 12 (100.0%) | 0 (0.0%) |
| Transportation | 5 (100.0%) | 0 (0.0%) |
| Material Moving | 2 (100.0%) | 0 (0.0%) |
| Total (Category) | 19 (100.0%) | 0 (0.0%) |
| Total (Overall) | 84 (47.5%) | 93 (52.5%) |
Employment Industries by Sex in White Lake
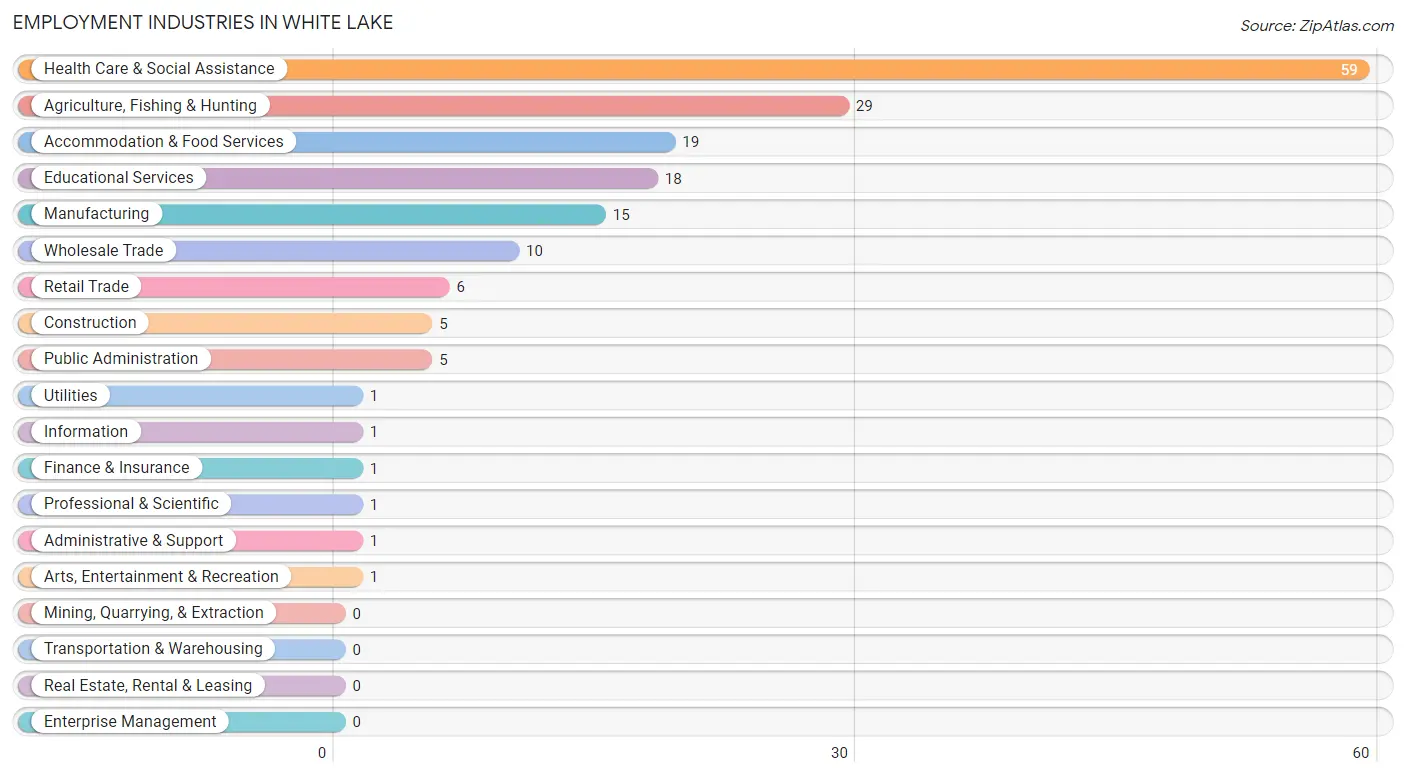
Employment Industries in White Lake
The major employment industries in White Lake include Health Care & Social Assistance (59 | 33.3%), Agriculture, Fishing & Hunting (29 | 16.4%), Accommodation & Food Services (19 | 10.7%), Educational Services (18 | 10.2%), and Manufacturing (15 | 8.5%).
Employment Industries by Sex in White Lake
The White Lake industries that see more men than women are Construction (100.0%), Utilities (100.0%), and Administrative & Support (100.0%), whereas the industries that tend to have a higher number of women are Information (100.0%), Finance & Insurance (100.0%), and Professional & Scientific (100.0%).
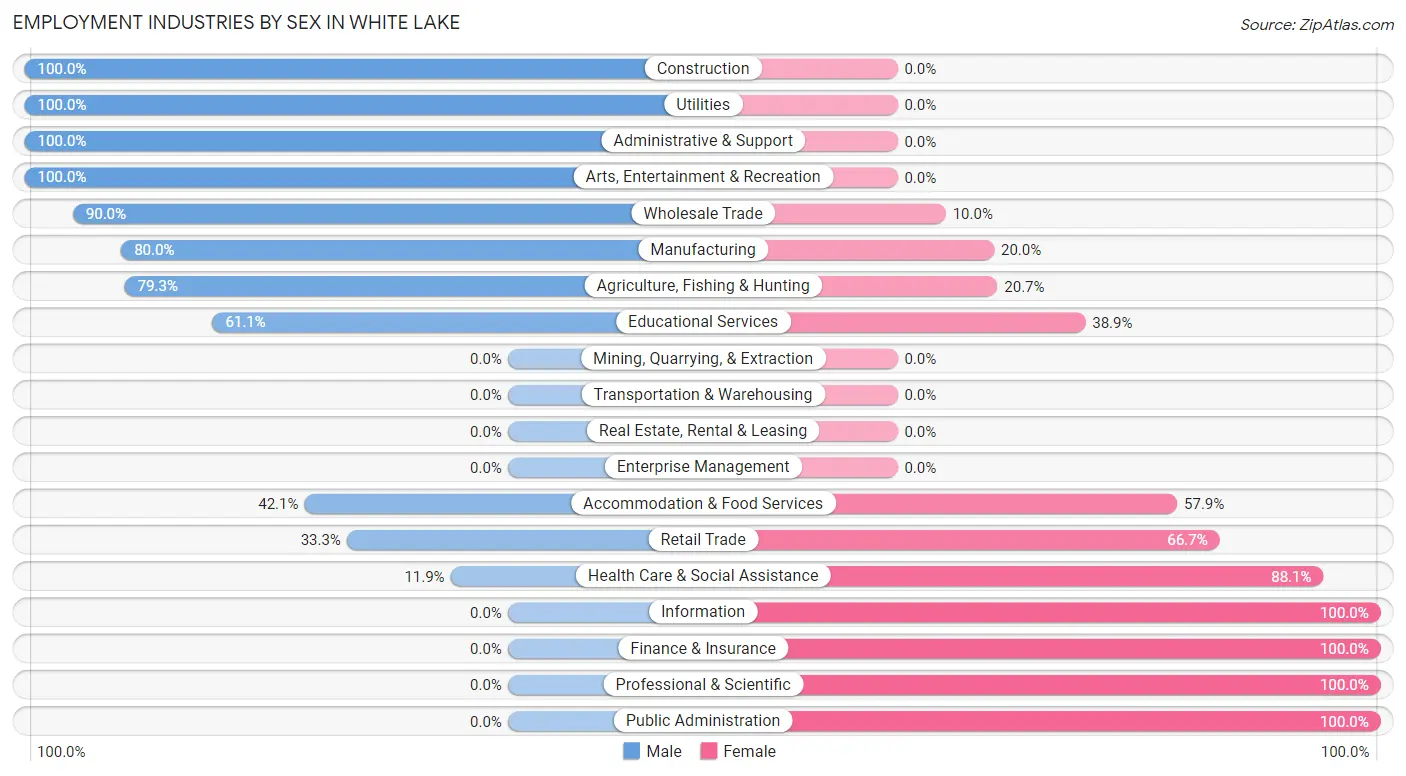
| Industry | Male | Female |
| Agriculture, Fishing & Hunting | 23 (79.3%) | 6 (20.7%) |
| Mining, Quarrying, & Extraction | 0 (0.0%) | 0 (0.0%) |
| Construction | 5 (100.0%) | 0 (0.0%) |
| Manufacturing | 12 (80.0%) | 3 (20.0%) |
| Wholesale Trade | 9 (90.0%) | 1 (10.0%) |
| Retail Trade | 2 (33.3%) | 4 (66.7%) |
| Transportation & Warehousing | 0 (0.0%) | 0 (0.0%) |
| Utilities | 1 (100.0%) | 0 (0.0%) |
| Information | 0 (0.0%) | 1 (100.0%) |
| Finance & Insurance | 0 (0.0%) | 1 (100.0%) |
| Real Estate, Rental & Leasing | 0 (0.0%) | 0 (0.0%) |
| Professional & Scientific | 0 (0.0%) | 1 (100.0%) |
| Enterprise Management | 0 (0.0%) | 0 (0.0%) |
| Administrative & Support | 1 (100.0%) | 0 (0.0%) |
| Educational Services | 11 (61.1%) | 7 (38.9%) |
| Health Care & Social Assistance | 7 (11.9%) | 52 (88.1%) |
| Arts, Entertainment & Recreation | 1 (100.0%) | 0 (0.0%) |
| Accommodation & Food Services | 8 (42.1%) | 11 (57.9%) |
| Public Administration | 0 (0.0%) | 5 (100.0%) |
| Total | 84 (47.5%) | 93 (52.5%) |
Education in White Lake
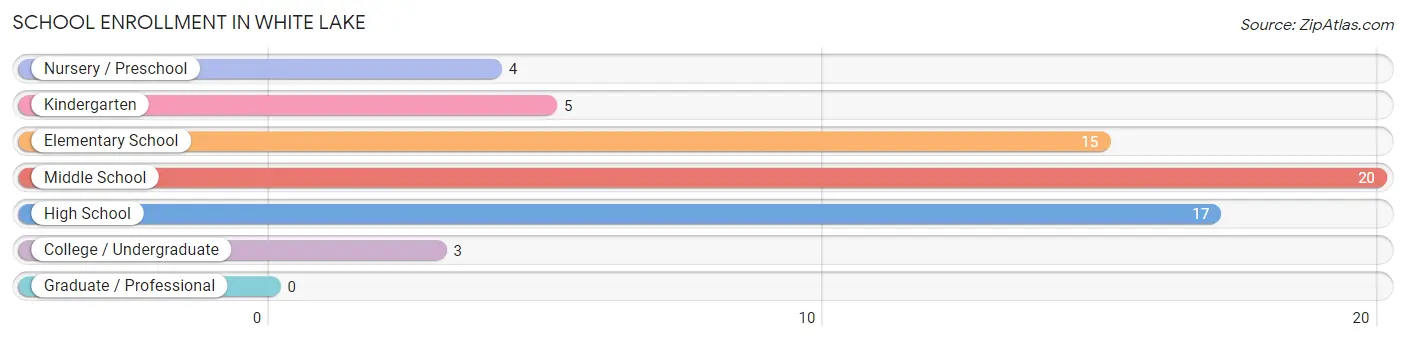
School Enrollment in White Lake
The most common levels of schooling among the 64 students in White Lake are middle school (20 | 31.2%), high school (17 | 26.6%), and elementary school (15 | 23.4%).
| School Level | # Students | % Students |
| Nursery / Preschool | 4 | 6.2% |
| Kindergarten | 5 | 7.8% |
| Elementary School | 15 | 23.4% |
| Middle School | 20 | 31.2% |
| High School | 17 | 26.6% |
| College / Undergraduate | 3 | 4.7% |
| Graduate / Professional | 0 | 0.0% |
| Total | 64 | 100.0% |
School Enrollment by Age by Funding Source in White Lake
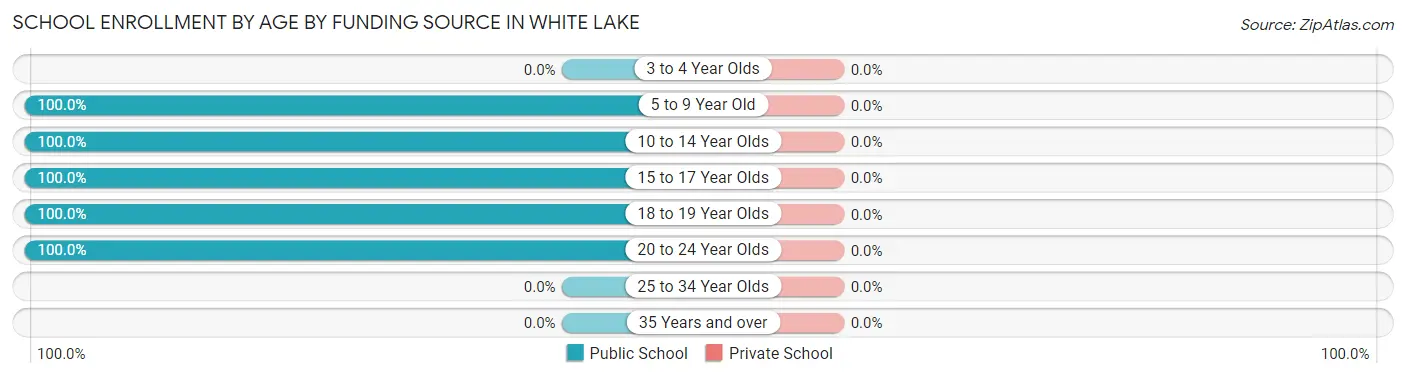
| Age Bracket | Public School | Private School |
| 3 to 4 Year Olds | 0 (0.0%) | 0 (0.0%) |
| 5 to 9 Year Old | 17 (100.0%) | 0 (0.0%) |
| 10 to 14 Year Olds | 27 (100.0%) | 0 (0.0%) |
| 15 to 17 Year Olds | 15 (100.0%) | 0 (0.0%) |
| 18 to 19 Year Olds | 3 (100.0%) | 0 (0.0%) |
| 20 to 24 Year Olds | 2 (100.0%) | 0 (0.0%) |
| 25 to 34 Year Olds | 0 (0.0%) | 0 (0.0%) |
| 35 Years and over | 0 (0.0%) | 0 (0.0%) |
| Total | 64 (100.0%) | 0 (0.0%) |
Educational Attainment by Field of Study in White Lake
Engineering (7 | 25.0%), science & technology (7 | 25.0%), education (3 | 10.7%), physical & health sciences (2 | 7.1%), and liberal arts & history (2 | 7.1%) are the most common fields of study among 28 individuals in White Lake who have obtained a bachelor's degree or higher.
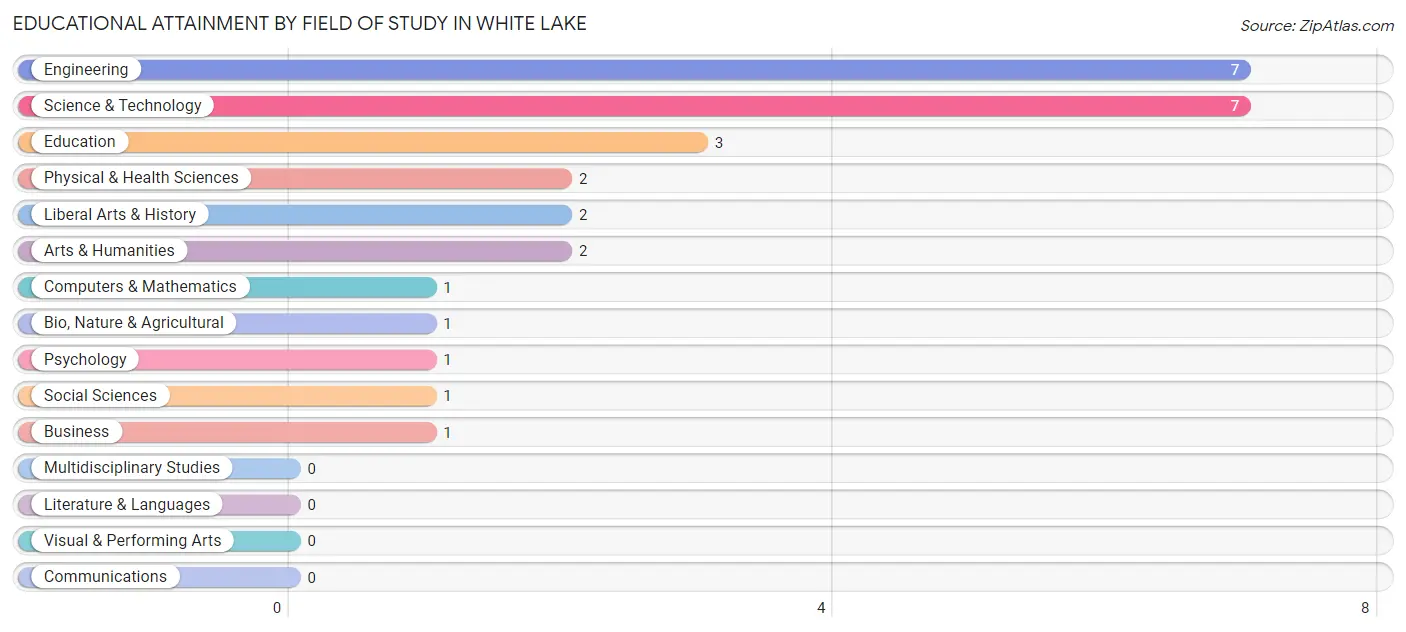
| Field of Study | # Graduates | % Graduates |
| Computers & Mathematics | 1 | 3.6% |
| Bio, Nature & Agricultural | 1 | 3.6% |
| Physical & Health Sciences | 2 | 7.1% |
| Psychology | 1 | 3.6% |
| Social Sciences | 1 | 3.6% |
| Engineering | 7 | 25.0% |
| Multidisciplinary Studies | 0 | 0.0% |
| Science & Technology | 7 | 25.0% |
| Business | 1 | 3.6% |
| Education | 3 | 10.7% |
| Literature & Languages | 0 | 0.0% |
| Liberal Arts & History | 2 | 7.1% |
| Visual & Performing Arts | 0 | 0.0% |
| Communications | 0 | 0.0% |
| Arts & Humanities | 2 | 7.1% |
| Total | 28 | 100.0% |
Transportation & Commute in White Lake
Vehicle Availability by Sex in White Lake
The most prevalent vehicle ownership categories in White Lake are males with 3 vehicles (35, accounting for 42.2%) and females with 3 vehicles (33, making up 40.7%).
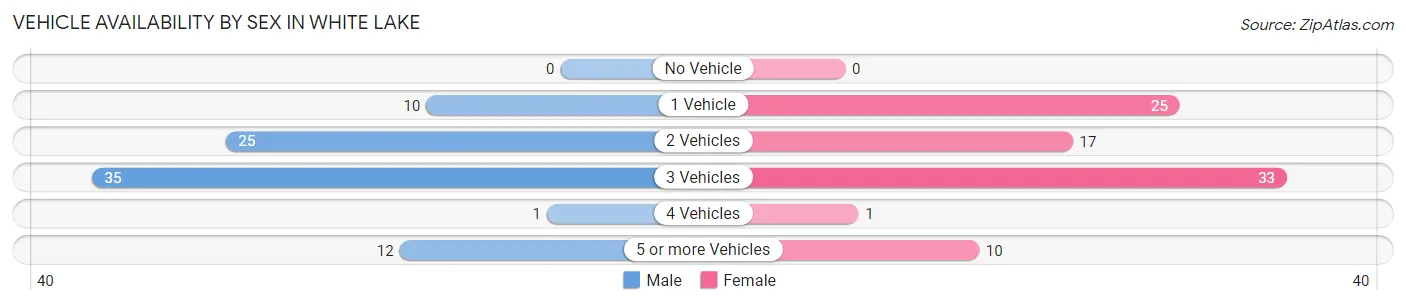
| Vehicles Available | Male | Female |
| No Vehicle | 0 (0.0%) | 0 (0.0%) |
| 1 Vehicle | 10 (12.0%) | 25 (29.1%) |
| 2 Vehicles | 25 (30.1%) | 17 (19.8%) |
| 3 Vehicles | 35 (42.2%) | 33 (38.4%) |
| 4 Vehicles | 1 (1.2%) | 1 (1.2%) |
| 5 or more Vehicles | 12 (14.5%) | 10 (11.6%) |
| Total | 83 (100.0%) | 86 (100.0%) |
Commute Time in White Lake
The most frequently occuring commute durations in White Lake are less than 5 minutes (45 commuters, 28.3%), 5 to 9 minutes (37 commuters, 23.3%), and 10 to 14 minutes (16 commuters, 10.1%).
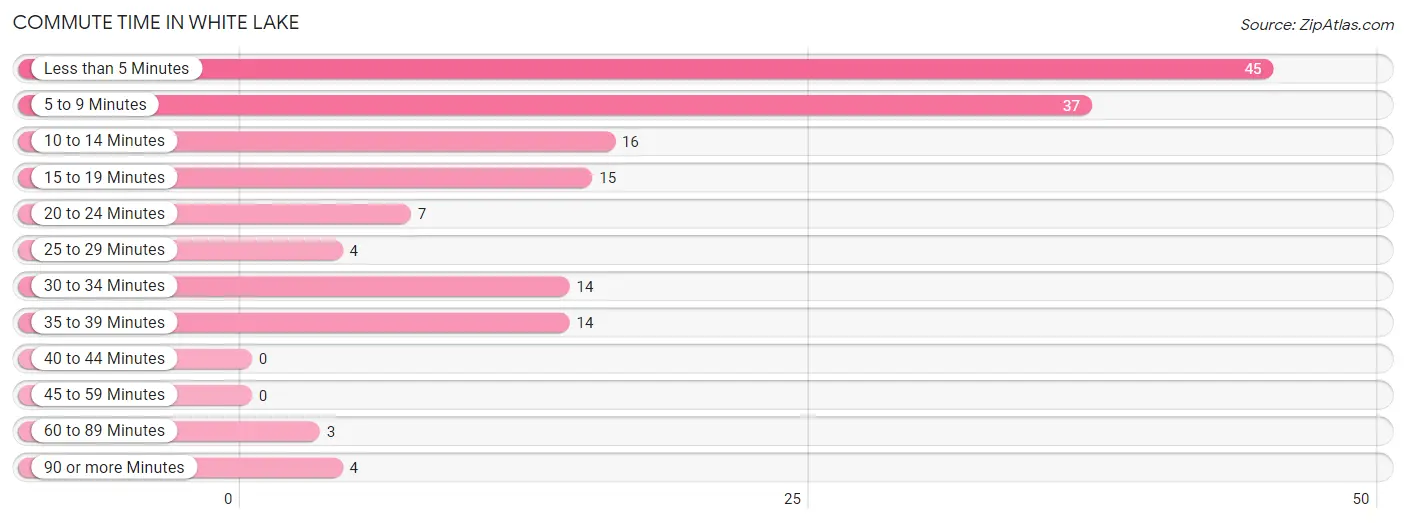
| Commute Time | # Commuters | % Commuters |
| Less than 5 Minutes | 45 | 28.3% |
| 5 to 9 Minutes | 37 | 23.3% |
| 10 to 14 Minutes | 16 | 10.1% |
| 15 to 19 Minutes | 15 | 9.4% |
| 20 to 24 Minutes | 7 | 4.4% |
| 25 to 29 Minutes | 4 | 2.5% |
| 30 to 34 Minutes | 14 | 8.8% |
| 35 to 39 Minutes | 14 | 8.8% |
| 40 to 44 Minutes | 0 | 0.0% |
| 45 to 59 Minutes | 0 | 0.0% |
| 60 to 89 Minutes | 3 | 1.9% |
| 90 or more Minutes | 4 | 2.5% |
Commute Time by Sex in White Lake
The most common commute times in White Lake are 5 to 9 minutes (17 commuters, 21.5%) for males and less than 5 minutes (33 commuters, 41.2%) for females.
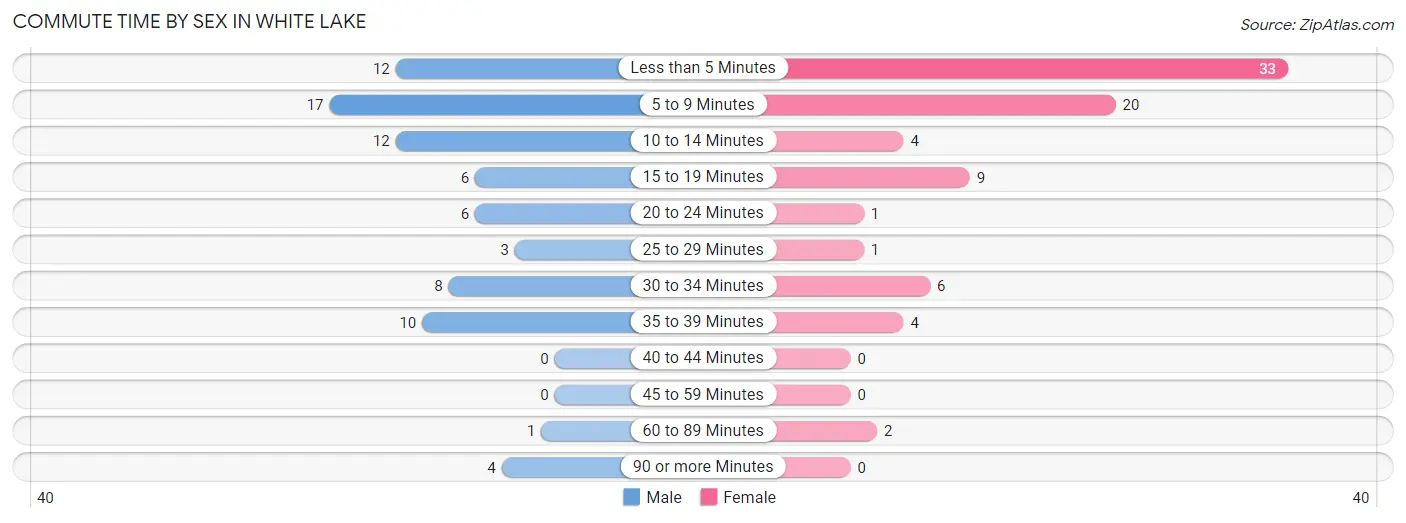
| Commute Time | Male | Female |
| Less than 5 Minutes | 12 (15.2%) | 33 (41.2%) |
| 5 to 9 Minutes | 17 (21.5%) | 20 (25.0%) |
| 10 to 14 Minutes | 12 (15.2%) | 4 (5.0%) |
| 15 to 19 Minutes | 6 (7.6%) | 9 (11.3%) |
| 20 to 24 Minutes | 6 (7.6%) | 1 (1.3%) |
| 25 to 29 Minutes | 3 (3.8%) | 1 (1.3%) |
| 30 to 34 Minutes | 8 (10.1%) | 6 (7.5%) |
| 35 to 39 Minutes | 10 (12.7%) | 4 (5.0%) |
| 40 to 44 Minutes | 0 (0.0%) | 0 (0.0%) |
| 45 to 59 Minutes | 0 (0.0%) | 0 (0.0%) |
| 60 to 89 Minutes | 1 (1.3%) | 2 (2.5%) |
| 90 or more Minutes | 4 (5.1%) | 0 (0.0%) |
Time of Departure to Work by Sex in White Lake
The most frequent times of departure to work in White Lake are 9:00 AM to 9:59 AM (20, 25.3%) for males and 6:00 AM to 6:29 AM (25, 31.2%) for females.
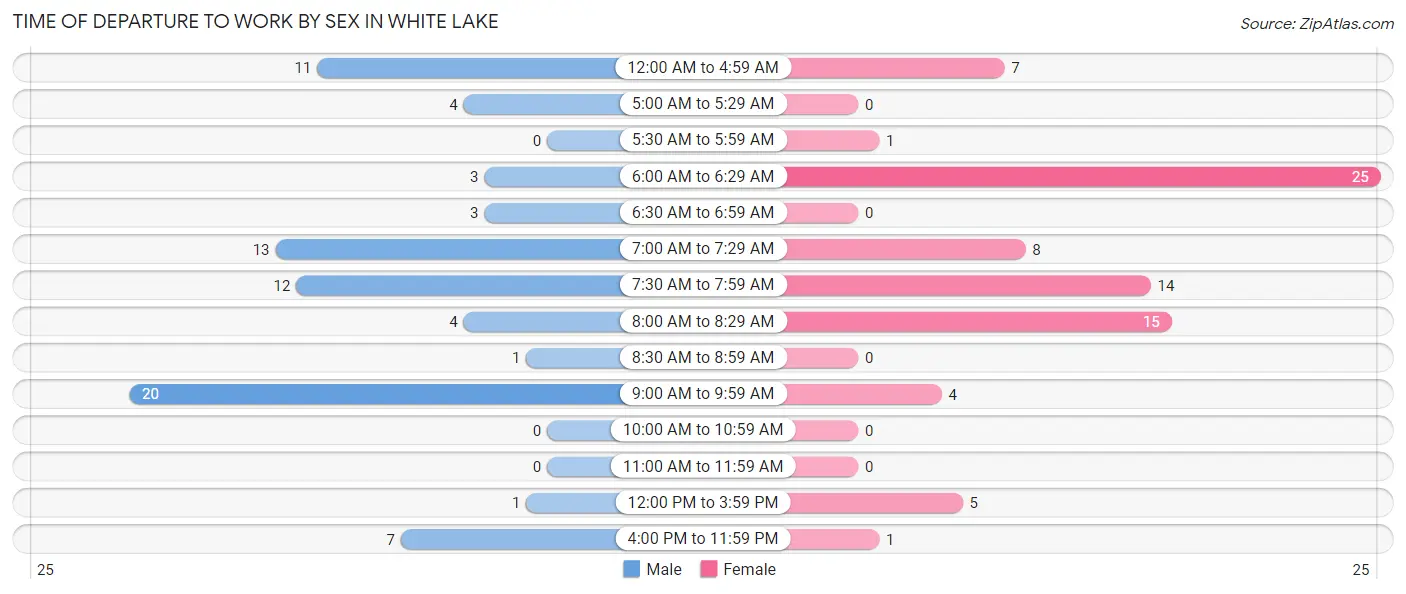
| Time of Departure | Male | Female |
| 12:00 AM to 4:59 AM | 11 (13.9%) | 7 (8.7%) |
| 5:00 AM to 5:29 AM | 4 (5.1%) | 0 (0.0%) |
| 5:30 AM to 5:59 AM | 0 (0.0%) | 1 (1.3%) |
| 6:00 AM to 6:29 AM | 3 (3.8%) | 25 (31.2%) |
| 6:30 AM to 6:59 AM | 3 (3.8%) | 0 (0.0%) |
| 7:00 AM to 7:29 AM | 13 (16.5%) | 8 (10.0%) |
| 7:30 AM to 7:59 AM | 12 (15.2%) | 14 (17.5%) |
| 8:00 AM to 8:29 AM | 4 (5.1%) | 15 (18.8%) |
| 8:30 AM to 8:59 AM | 1 (1.3%) | 0 (0.0%) |
| 9:00 AM to 9:59 AM | 20 (25.3%) | 4 (5.0%) |
| 10:00 AM to 10:59 AM | 0 (0.0%) | 0 (0.0%) |
| 11:00 AM to 11:59 AM | 0 (0.0%) | 0 (0.0%) |
| 12:00 PM to 3:59 PM | 1 (1.3%) | 5 (6.2%) |
| 4:00 PM to 11:59 PM | 7 (8.9%) | 1 (1.3%) |
| Total | 79 (100.0%) | 80 (100.0%) |
Housing Occupancy in White Lake
Occupancy by Ownership in White Lake
Of the total 160 dwellings in White Lake, owner-occupied units account for 126 (78.7%), while renter-occupied units make up 34 (21.2%).
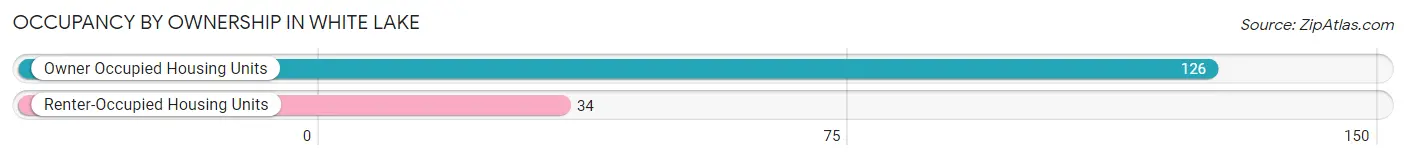
| Occupancy | # Housing Units | % Housing Units |
| Owner Occupied Housing Units | 126 | 78.7% |
| Renter-Occupied Housing Units | 34 | 21.2% |
| Total Occupied Housing Units | 160 | 100.0% |
Occupancy by Household Size in White Lake
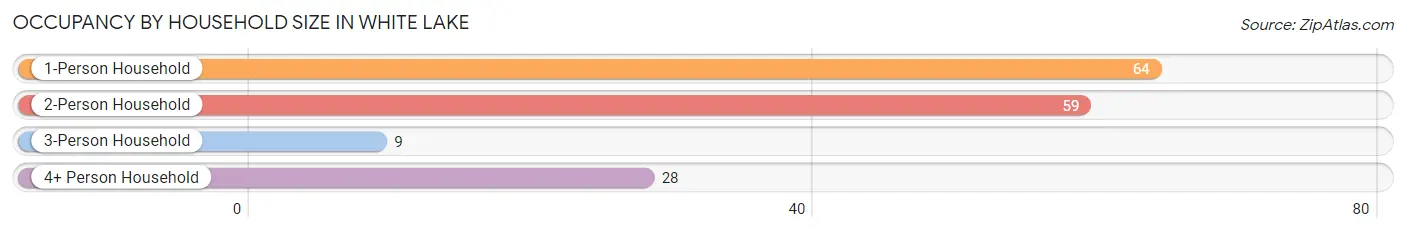
| Household Size | # Housing Units | % Housing Units |
| 1-Person Household | 64 | 40.0% |
| 2-Person Household | 59 | 36.9% |
| 3-Person Household | 9 | 5.6% |
| 4+ Person Household | 28 | 17.5% |
| Total Housing Units | 160 | 100.0% |
Occupancy by Ownership by Household Size in White Lake
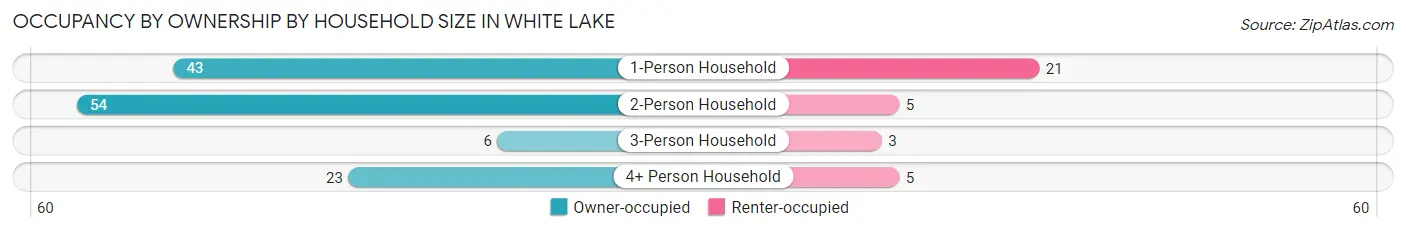
| Household Size | Owner-occupied | Renter-occupied |
| 1-Person Household | 43 (67.2%) | 21 (32.8%) |
| 2-Person Household | 54 (91.5%) | 5 (8.5%) |
| 3-Person Household | 6 (66.7%) | 3 (33.3%) |
| 4+ Person Household | 23 (82.1%) | 5 (17.9%) |
| Total Housing Units | 126 (78.7%) | 34 (21.2%) |
Occupancy by Educational Attainment in White Lake
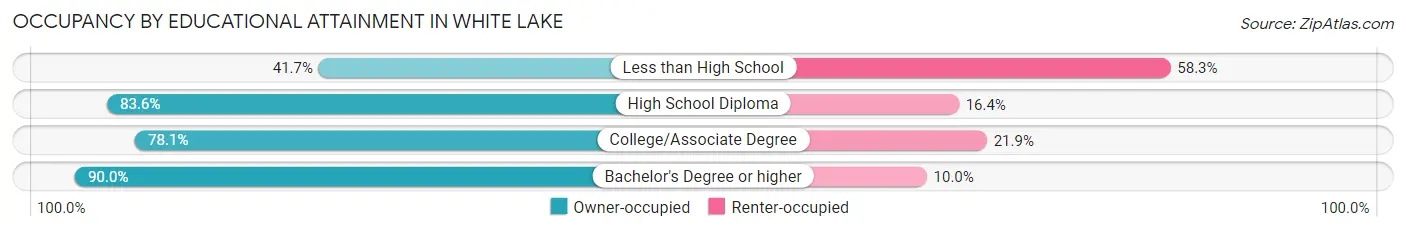
| Household Size | Owner-occupied | Renter-occupied |
| Less than High School | 5 (41.7%) | 7 (58.3%) |
| High School Diploma | 46 (83.6%) | 9 (16.4%) |
| College/Associate Degree | 57 (78.1%) | 16 (21.9%) |
| Bachelor's Degree or higher | 18 (90.0%) | 2 (10.0%) |
Occupancy by Age of Householder in White Lake
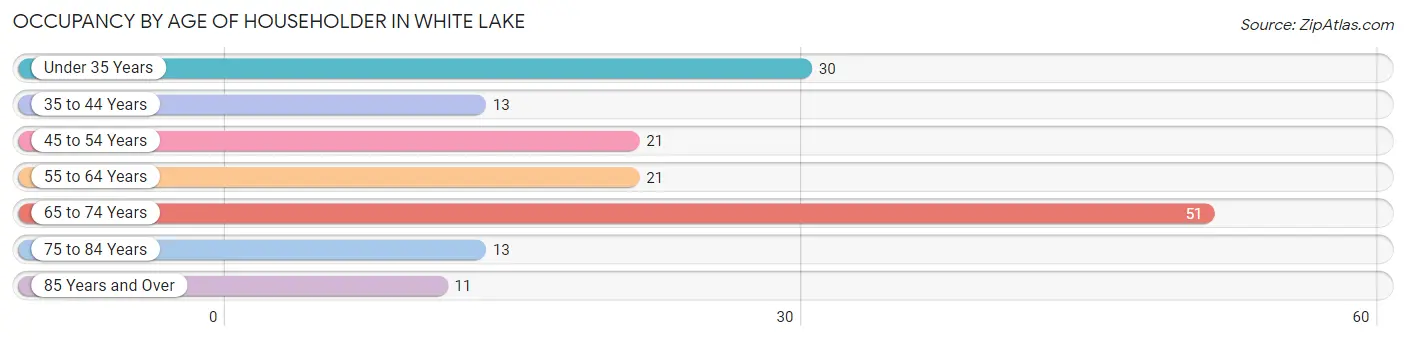
| Age Bracket | # Households | % Households |
| Under 35 Years | 30 | 18.8% |
| 35 to 44 Years | 13 | 8.1% |
| 45 to 54 Years | 21 | 13.1% |
| 55 to 64 Years | 21 | 13.1% |
| 65 to 74 Years | 51 | 31.9% |
| 75 to 84 Years | 13 | 8.1% |
| 85 Years and Over | 11 | 6.9% |
| Total | 160 | 100.0% |
Housing Finances in White Lake
Median Income by Occupancy in White Lake
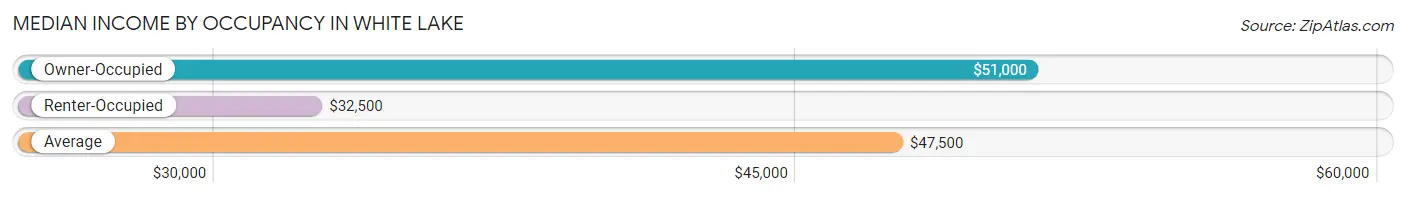
| Occupancy Type | # Households | Median Income |
| Owner-Occupied | 126 (78.7%) | $51,000 |
| Renter-Occupied | 34 (21.2%) | $32,500 |
| Average | 160 (100.0%) | $47,500 |
Occupancy by Householder Income Bracket in White Lake
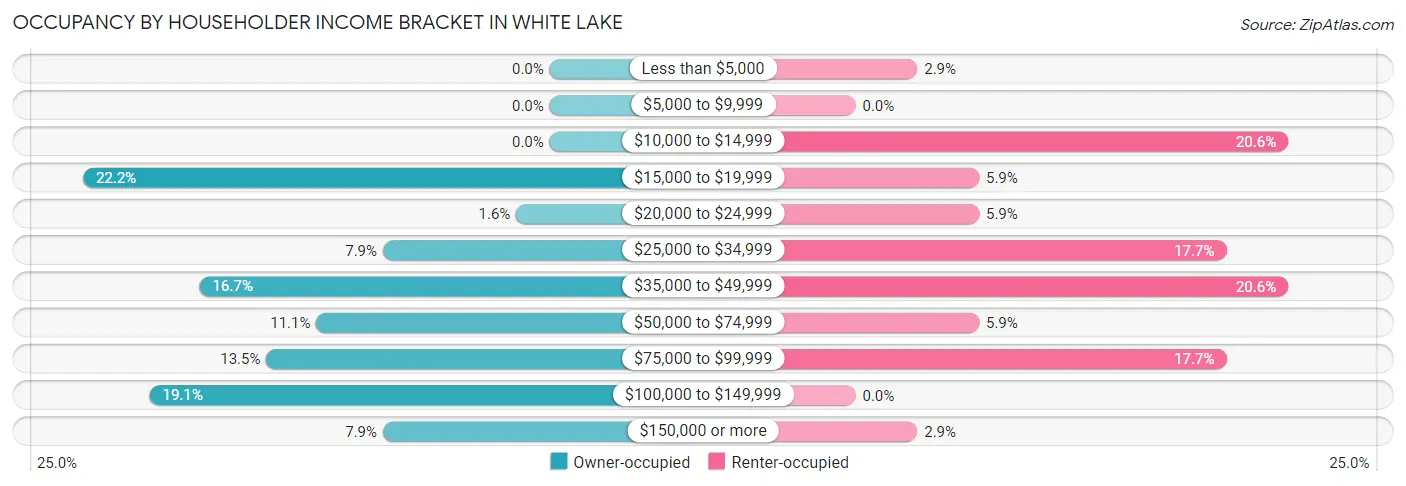
| Income Bracket | Owner-occupied | Renter-occupied |
| Less than $5,000 | 0 (0.0%) | 1 (2.9%) |
| $5,000 to $9,999 | 0 (0.0%) | 0 (0.0%) |
| $10,000 to $14,999 | 0 (0.0%) | 7 (20.6%) |
| $15,000 to $19,999 | 28 (22.2%) | 2 (5.9%) |
| $20,000 to $24,999 | 2 (1.6%) | 2 (5.9%) |
| $25,000 to $34,999 | 10 (7.9%) | 6 (17.6%) |
| $35,000 to $49,999 | 21 (16.7%) | 7 (20.6%) |
| $50,000 to $74,999 | 14 (11.1%) | 2 (5.9%) |
| $75,000 to $99,999 | 17 (13.5%) | 6 (17.6%) |
| $100,000 to $149,999 | 24 (19.1%) | 0 (0.0%) |
| $150,000 or more | 10 (7.9%) | 1 (2.9%) |
| Total | 126 (100.0%) | 34 (100.0%) |
Monthly Housing Cost Tiers in White Lake
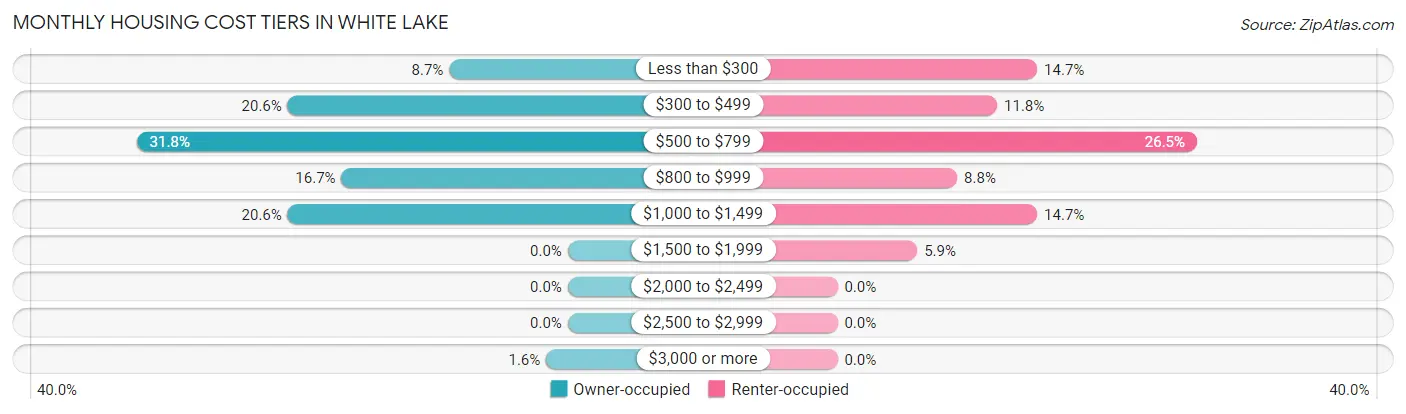
| Monthly Cost | Owner-occupied | Renter-occupied |
| Less than $300 | 11 (8.7%) | 5 (14.7%) |
| $300 to $499 | 26 (20.6%) | 4 (11.8%) |
| $500 to $799 | 40 (31.8%) | 9 (26.5%) |
| $800 to $999 | 21 (16.7%) | 3 (8.8%) |
| $1,000 to $1,499 | 26 (20.6%) | 5 (14.7%) |
| $1,500 to $1,999 | 0 (0.0%) | 2 (5.9%) |
| $2,000 to $2,499 | 0 (0.0%) | 0 (0.0%) |
| $2,500 to $2,999 | 0 (0.0%) | 0 (0.0%) |
| $3,000 or more | 2 (1.6%) | 0 (0.0%) |
| Total | 126 (100.0%) | 34 (100.0%) |
Physical Housing Characteristics in White Lake
Housing Structures in White Lake
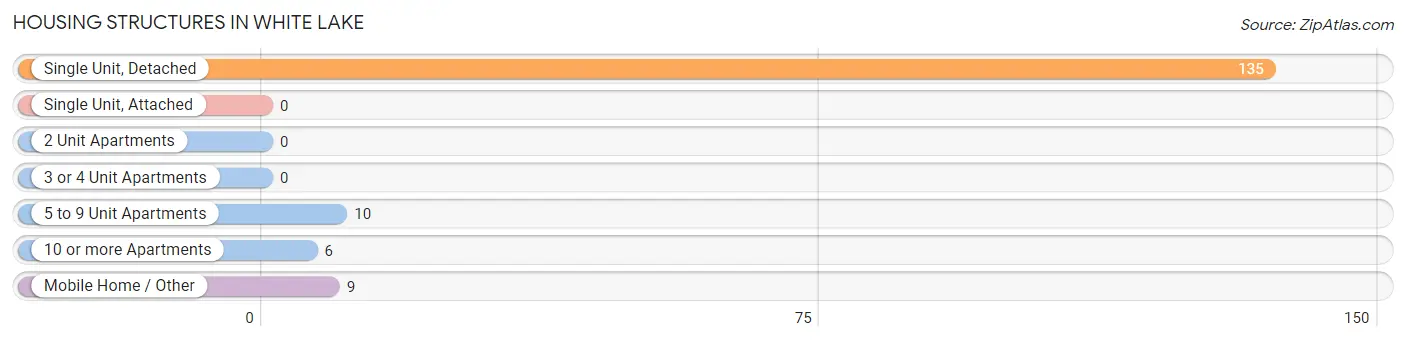
| Structure Type | # Housing Units | % Housing Units |
| Single Unit, Detached | 135 | 84.4% |
| Single Unit, Attached | 0 | 0.0% |
| 2 Unit Apartments | 0 | 0.0% |
| 3 or 4 Unit Apartments | 0 | 0.0% |
| 5 to 9 Unit Apartments | 10 | 6.2% |
| 10 or more Apartments | 6 | 3.7% |
| Mobile Home / Other | 9 | 5.6% |
| Total | 160 | 100.0% |
Housing Structures by Occupancy in White Lake
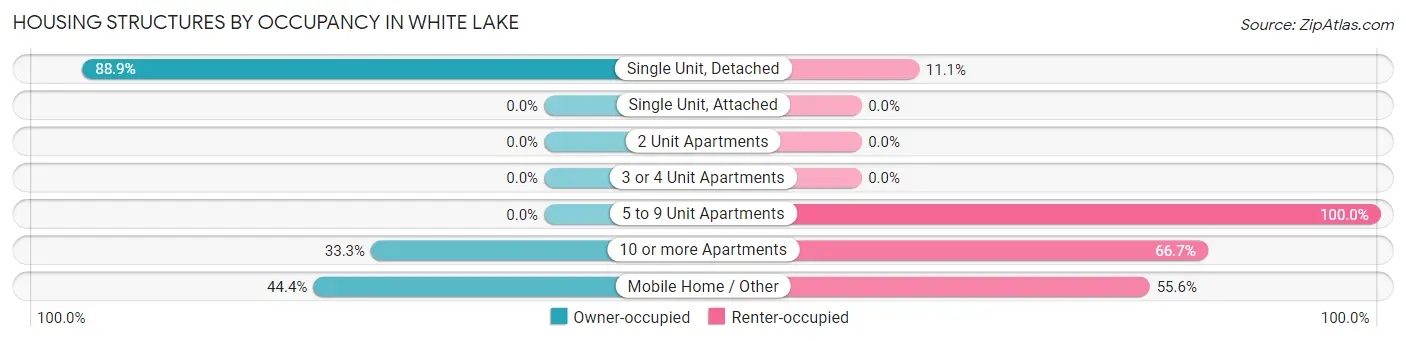
| Structure Type | Owner-occupied | Renter-occupied |
| Single Unit, Detached | 120 (88.9%) | 15 (11.1%) |
| Single Unit, Attached | 0 (0.0%) | 0 (0.0%) |
| 2 Unit Apartments | 0 (0.0%) | 0 (0.0%) |
| 3 or 4 Unit Apartments | 0 (0.0%) | 0 (0.0%) |
| 5 to 9 Unit Apartments | 0 (0.0%) | 10 (100.0%) |
| 10 or more Apartments | 2 (33.3%) | 4 (66.7%) |
| Mobile Home / Other | 4 (44.4%) | 5 (55.6%) |
| Total | 126 (78.7%) | 34 (21.2%) |
Housing Structures by Number of Rooms in White Lake
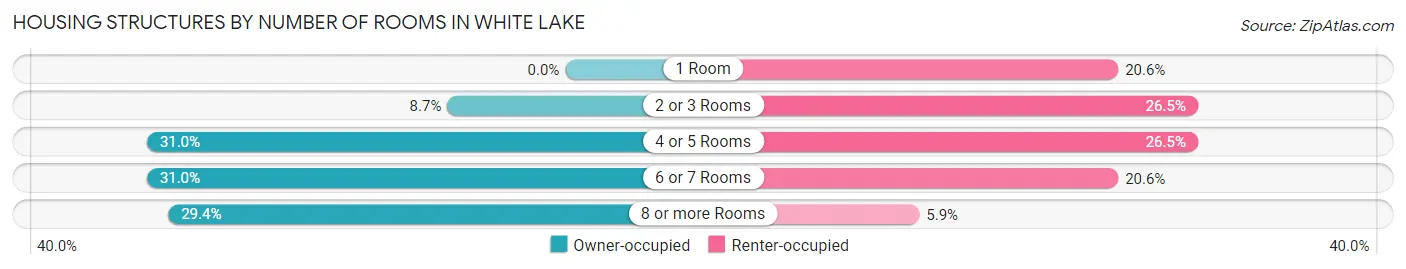
| Number of Rooms | Owner-occupied | Renter-occupied |
| 1 Room | 0 (0.0%) | 7 (20.6%) |
| 2 or 3 Rooms | 11 (8.7%) | 9 (26.5%) |
| 4 or 5 Rooms | 39 (30.9%) | 9 (26.5%) |
| 6 or 7 Rooms | 39 (30.9%) | 7 (20.6%) |
| 8 or more Rooms | 37 (29.4%) | 2 (5.9%) |
| Total | 126 (100.0%) | 34 (100.0%) |
Housing Structure by Heating Type in White Lake
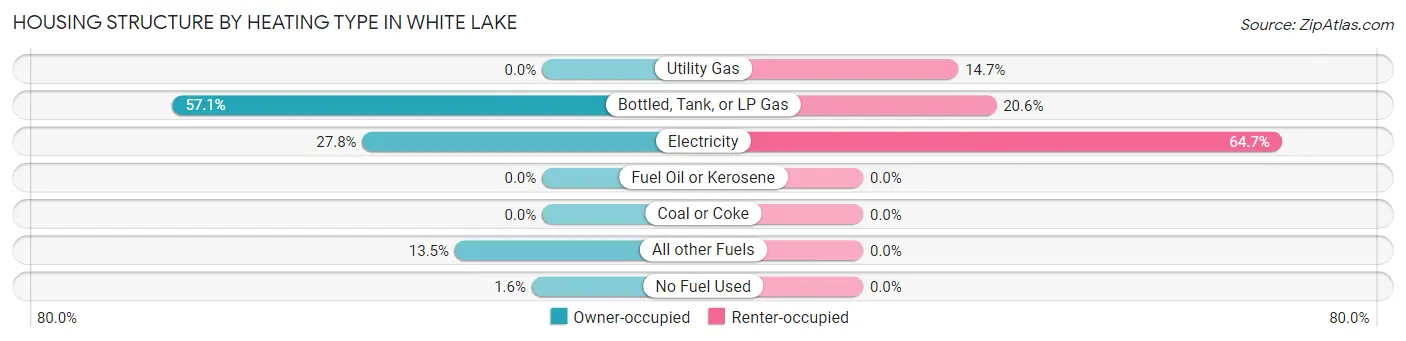
| Heating Type | Owner-occupied | Renter-occupied |
| Utility Gas | 0 (0.0%) | 5 (14.7%) |
| Bottled, Tank, or LP Gas | 72 (57.1%) | 7 (20.6%) |
| Electricity | 35 (27.8%) | 22 (64.7%) |
| Fuel Oil or Kerosene | 0 (0.0%) | 0 (0.0%) |
| Coal or Coke | 0 (0.0%) | 0 (0.0%) |
| All other Fuels | 17 (13.5%) | 0 (0.0%) |
| No Fuel Used | 2 (1.6%) | 0 (0.0%) |
| Total | 126 (100.0%) | 34 (100.0%) |
Household Vehicle Usage in White Lake
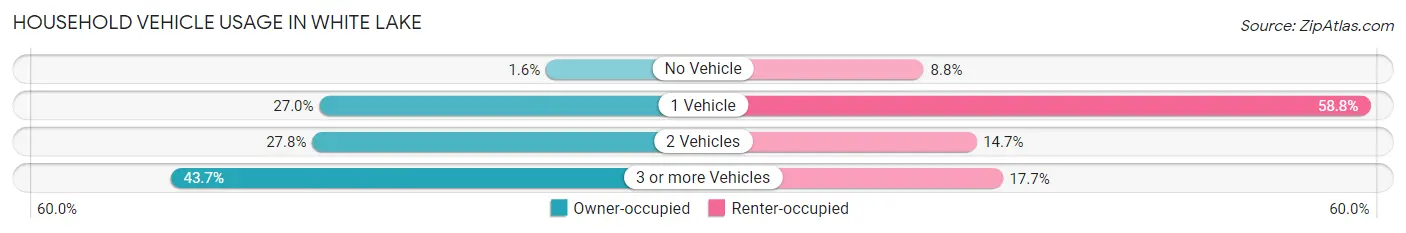
| Vehicles per Household | Owner-occupied | Renter-occupied |
| No Vehicle | 2 (1.6%) | 3 (8.8%) |
| 1 Vehicle | 34 (27.0%) | 20 (58.8%) |
| 2 Vehicles | 35 (27.8%) | 5 (14.7%) |
| 3 or more Vehicles | 55 (43.6%) | 6 (17.6%) |
| Total | 126 (100.0%) | 34 (100.0%) |
Real Estate & Mortgages in White Lake
Real Estate and Mortgage Overview in White Lake
| Characteristic | Without Mortgage | With Mortgage |
| Housing Units | 75 | 51 |
| Median Property Value | $53,400 | $82,100 |
| Median Household Income | $35,729 | $5 |
| Monthly Housing Costs | $502 | $2 |
| Real Estate Taxes | $1,257 | $1 |
Property Value by Mortgage Status in White Lake
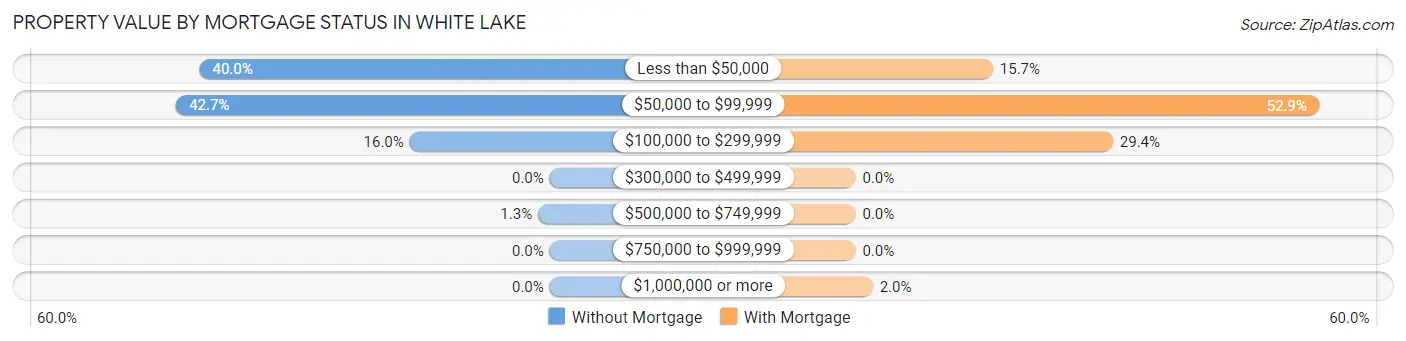
| Property Value | Without Mortgage | With Mortgage |
| Less than $50,000 | 30 (40.0%) | 8 (15.7%) |
| $50,000 to $99,999 | 32 (42.7%) | 27 (52.9%) |
| $100,000 to $299,999 | 12 (16.0%) | 15 (29.4%) |
| $300,000 to $499,999 | 0 (0.0%) | 0 (0.0%) |
| $500,000 to $749,999 | 1 (1.3%) | 0 (0.0%) |
| $750,000 to $999,999 | 0 (0.0%) | 0 (0.0%) |
| $1,000,000 or more | 0 (0.0%) | 1 (2.0%) |
| Total | 75 (100.0%) | 51 (100.0%) |
Household Income by Mortgage Status in White Lake
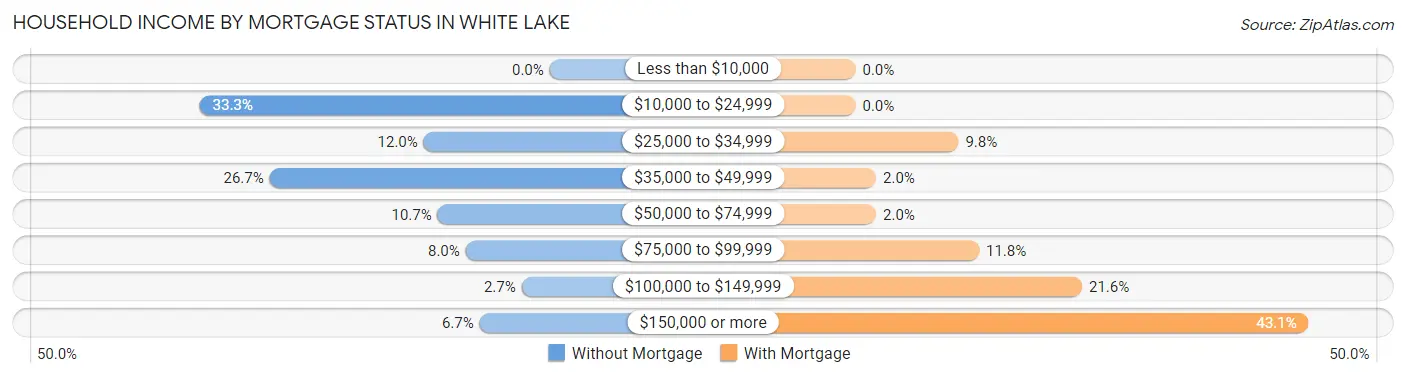
| Household Income | Without Mortgage | With Mortgage |
| Less than $10,000 | 0 (0.0%) | 0 (0.0%) |
| $10,000 to $24,999 | 25 (33.3%) | 0 (0.0%) |
| $25,000 to $34,999 | 9 (12.0%) | 5 (9.8%) |
| $35,000 to $49,999 | 20 (26.7%) | 1 (2.0%) |
| $50,000 to $74,999 | 8 (10.7%) | 1 (2.0%) |
| $75,000 to $99,999 | 6 (8.0%) | 6 (11.8%) |
| $100,000 to $149,999 | 2 (2.7%) | 11 (21.6%) |
| $150,000 or more | 5 (6.7%) | 22 (43.1%) |
| Total | 75 (100.0%) | 51 (100.0%) |
Property Value to Household Income Ratio in White Lake
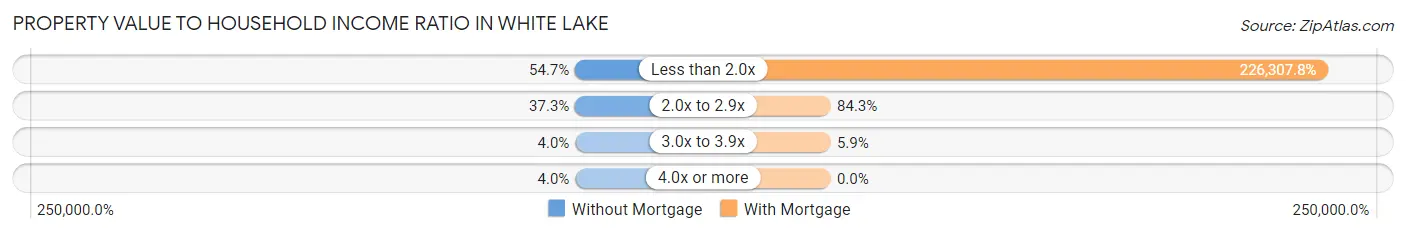
| Value-to-Income Ratio | Without Mortgage | With Mortgage |
| Less than 2.0x | 41 (54.7%) | 115,417 (226,307.8%) |
| 2.0x to 2.9x | 28 (37.3%) | 43 (84.3%) |
| 3.0x to 3.9x | 3 (4.0%) | 3 (5.9%) |
| 4.0x or more | 3 (4.0%) | 0 (0.0%) |
| Total | 75 (100.0%) | 51 (100.0%) |
Real Estate Taxes by Mortgage Status in White Lake
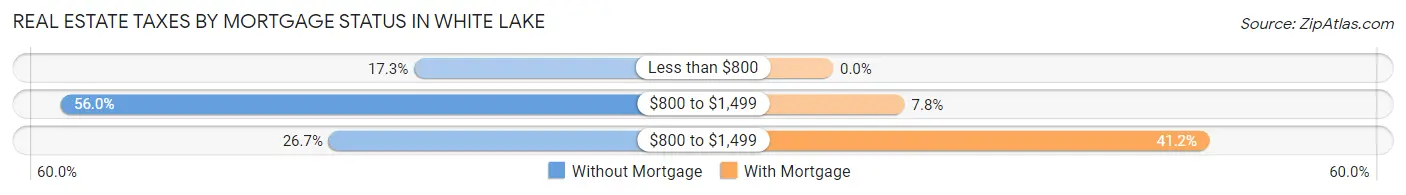
| Property Taxes | Without Mortgage | With Mortgage |
| Less than $800 | 13 (17.3%) | 0 (0.0%) |
| $800 to $1,499 | 42 (56.0%) | 4 (7.8%) |
| $800 to $1,499 | 20 (26.7%) | 21 (41.2%) |
| Total | 75 (100.0%) | 51 (100.0%) |
Health & Disability in White Lake
Health Insurance Coverage by Age in White Lake
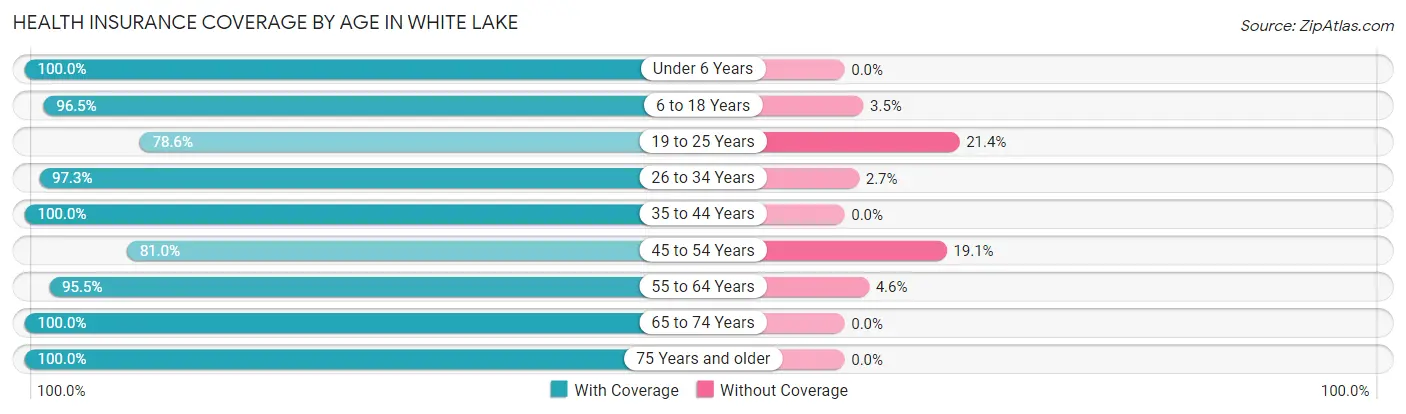
| Age Bracket | With Coverage | Without Coverage |
| Under 6 Years | 33 (100.0%) | 0 (0.0%) |
| 6 to 18 Years | 55 (96.5%) | 2 (3.5%) |
| 19 to 25 Years | 11 (78.6%) | 3 (21.4%) |
| 26 to 34 Years | 36 (97.3%) | 1 (2.7%) |
| 35 to 44 Years | 26 (100.0%) | 0 (0.0%) |
| 45 to 54 Years | 34 (80.9%) | 8 (19.1%) |
| 55 to 64 Years | 42 (95.5%) | 2 (4.5%) |
| 65 to 74 Years | 75 (100.0%) | 0 (0.0%) |
| 75 Years and older | 29 (100.0%) | 0 (0.0%) |
| Total | 341 (95.5%) | 16 (4.5%) |
Health Insurance Coverage by Citizenship Status in White Lake
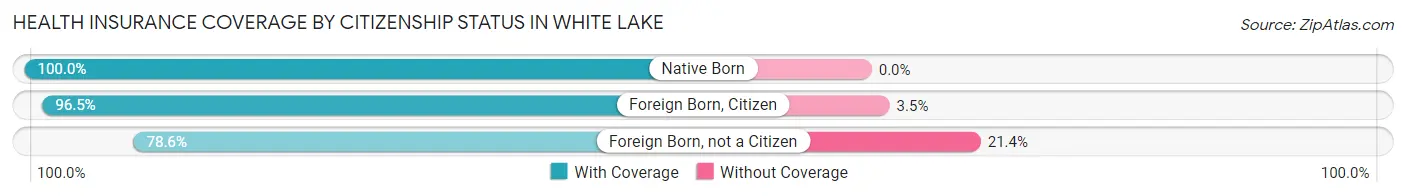
| Citizenship Status | With Coverage | Without Coverage |
| Native Born | 33 (100.0%) | 0 (0.0%) |
| Foreign Born, Citizen | 55 (96.5%) | 2 (3.5%) |
| Foreign Born, not a Citizen | 11 (78.6%) | 3 (21.4%) |
Health Insurance Coverage by Household Income in White Lake
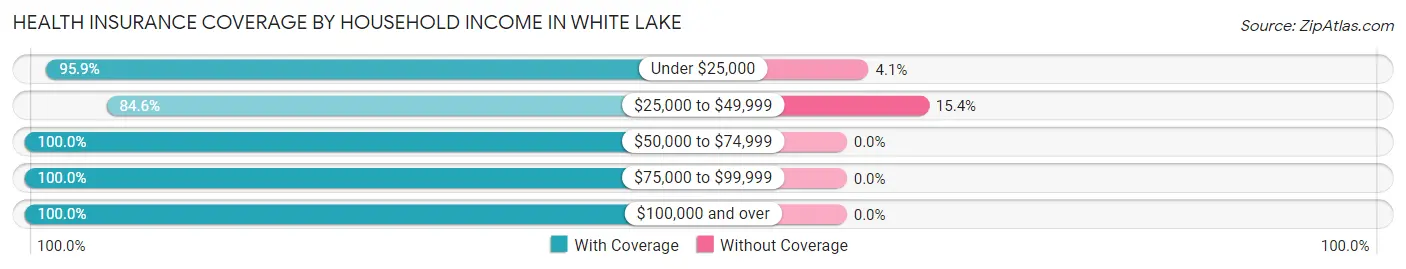
| Household Income | With Coverage | Without Coverage |
| Under $25,000 | 47 (95.9%) | 2 (4.1%) |
| $25,000 to $49,999 | 77 (84.6%) | 14 (15.4%) |
| $50,000 to $74,999 | 36 (100.0%) | 0 (0.0%) |
| $75,000 to $99,999 | 68 (100.0%) | 0 (0.0%) |
| $100,000 and over | 113 (100.0%) | 0 (0.0%) |
Public vs Private Health Insurance Coverage by Age in White Lake
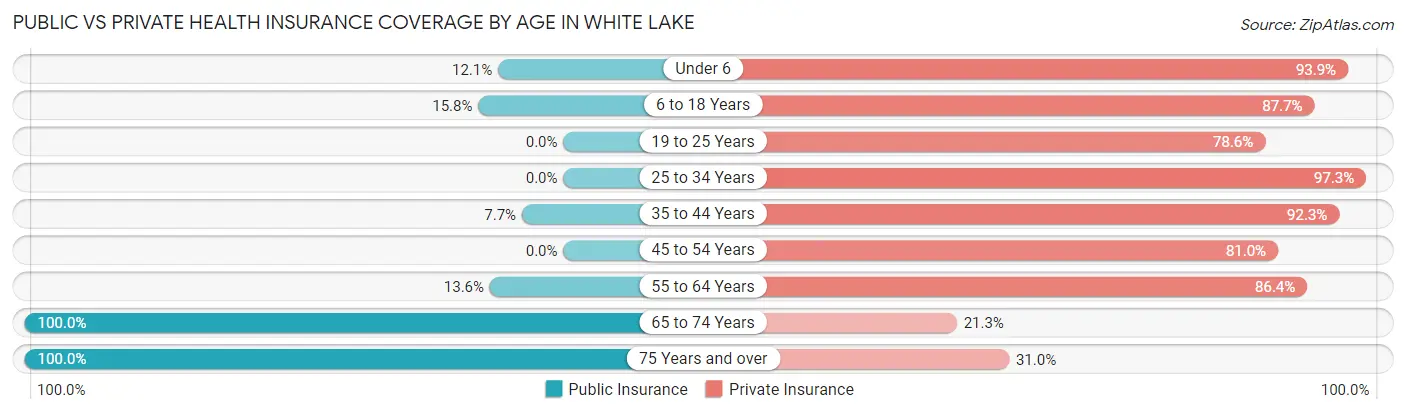
| Age Bracket | Public Insurance | Private Insurance |
| Under 6 | 4 (12.1%) | 31 (93.9%) |
| 6 to 18 Years | 9 (15.8%) | 50 (87.7%) |
| 19 to 25 Years | 0 (0.0%) | 11 (78.6%) |
| 25 to 34 Years | 0 (0.0%) | 36 (97.3%) |
| 35 to 44 Years | 2 (7.7%) | 24 (92.3%) |
| 45 to 54 Years | 0 (0.0%) | 34 (80.9%) |
| 55 to 64 Years | 6 (13.6%) | 38 (86.4%) |
| 65 to 74 Years | 75 (100.0%) | 16 (21.3%) |
| 75 Years and over | 29 (100.0%) | 9 (31.0%) |
| Total | 125 (35.0%) | 249 (69.8%) |
Disability Status by Sex by Age in White Lake
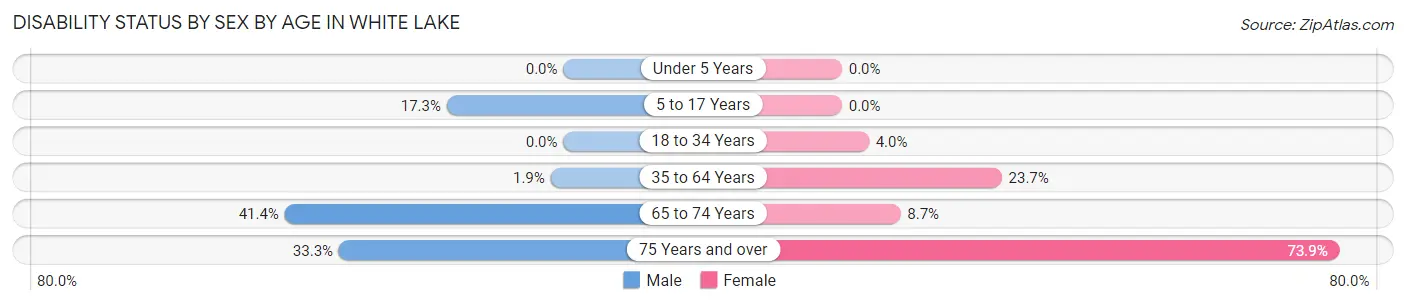
| Age Bracket | Male | Female |
| Under 5 Years | 0 (0.0%) | 0 (0.0%) |
| 5 to 17 Years | 9 (17.3%) | 0 (0.0%) |
| 18 to 34 Years | 0 (0.0%) | 1 (4.0%) |
| 35 to 64 Years | 1 (1.9%) | 14 (23.7%) |
| 65 to 74 Years | 12 (41.4%) | 4 (8.7%) |
| 75 Years and over | 2 (33.3%) | 17 (73.9%) |
Disability Class by Sex by Age in White Lake
Disability Class: Hearing Difficulty
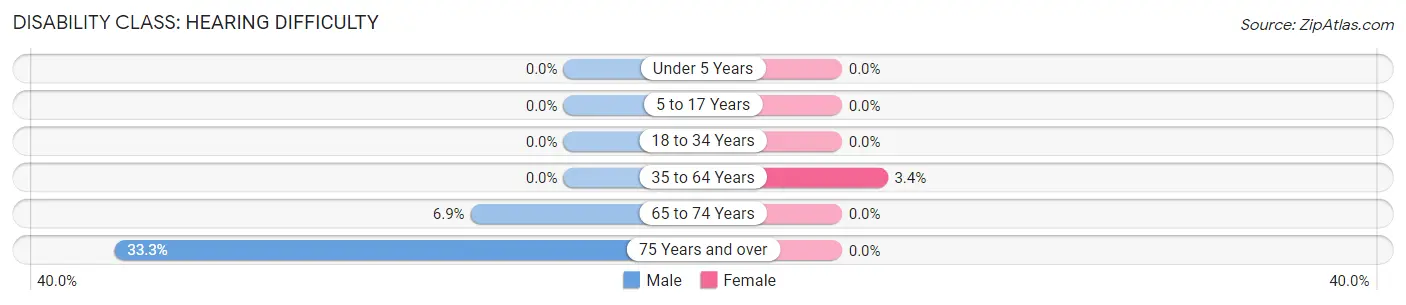
| Age Bracket | Male | Female |
| Under 5 Years | 0 (0.0%) | 0 (0.0%) |
| 5 to 17 Years | 0 (0.0%) | 0 (0.0%) |
| 18 to 34 Years | 0 (0.0%) | 0 (0.0%) |
| 35 to 64 Years | 0 (0.0%) | 2 (3.4%) |
| 65 to 74 Years | 2 (6.9%) | 0 (0.0%) |
| 75 Years and over | 2 (33.3%) | 0 (0.0%) |
Disability Class: Vision Difficulty
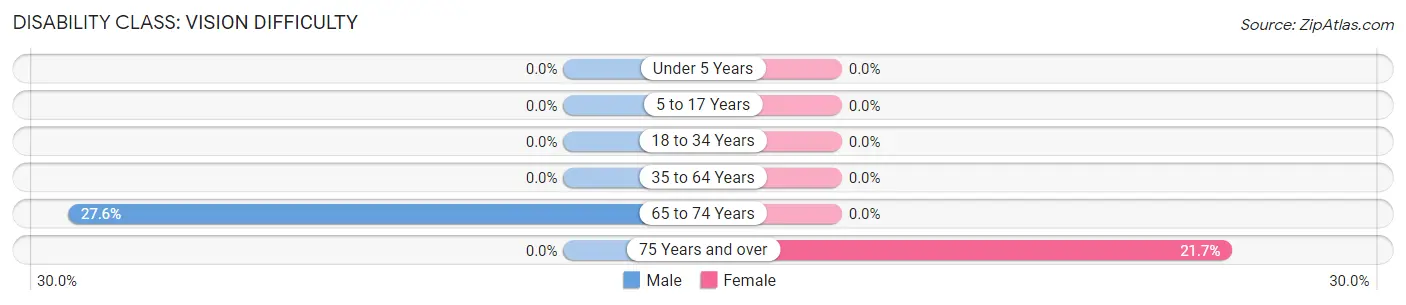
| Age Bracket | Male | Female |
| Under 5 Years | 0 (0.0%) | 0 (0.0%) |
| 5 to 17 Years | 0 (0.0%) | 0 (0.0%) |
| 18 to 34 Years | 0 (0.0%) | 0 (0.0%) |
| 35 to 64 Years | 0 (0.0%) | 0 (0.0%) |
| 65 to 74 Years | 8 (27.6%) | 0 (0.0%) |
| 75 Years and over | 0 (0.0%) | 5 (21.7%) |
Disability Class: Cognitive Difficulty
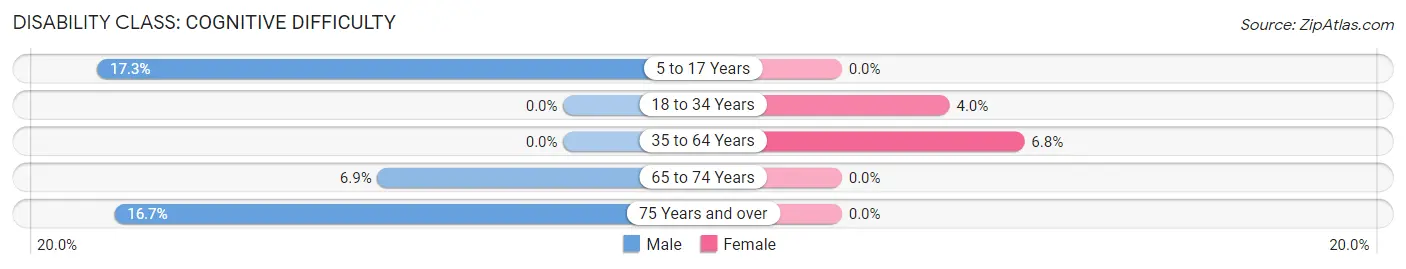
| Age Bracket | Male | Female |
| 5 to 17 Years | 9 (17.3%) | 0 (0.0%) |
| 18 to 34 Years | 0 (0.0%) | 1 (4.0%) |
| 35 to 64 Years | 0 (0.0%) | 4 (6.8%) |
| 65 to 74 Years | 2 (6.9%) | 0 (0.0%) |
| 75 Years and over | 1 (16.7%) | 0 (0.0%) |
Disability Class: Ambulatory Difficulty
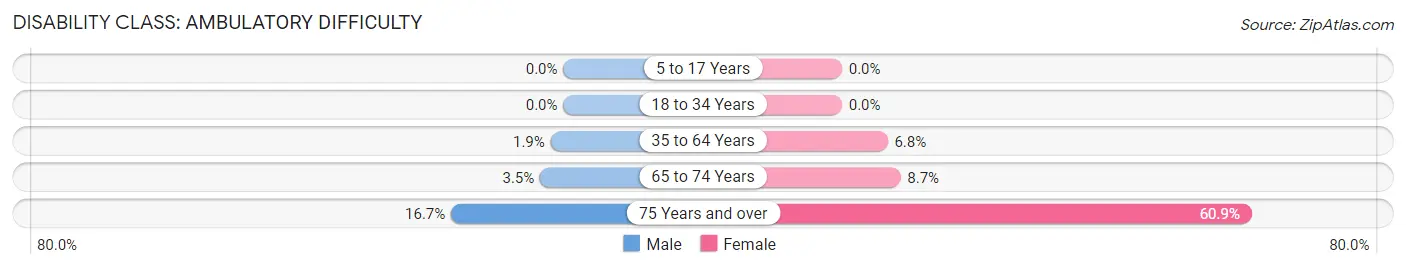
| Age Bracket | Male | Female |
| 5 to 17 Years | 0 (0.0%) | 0 (0.0%) |
| 18 to 34 Years | 0 (0.0%) | 0 (0.0%) |
| 35 to 64 Years | 1 (1.9%) | 4 (6.8%) |
| 65 to 74 Years | 1 (3.5%) | 4 (8.7%) |
| 75 Years and over | 1 (16.7%) | 14 (60.9%) |
Disability Class: Self-Care Difficulty
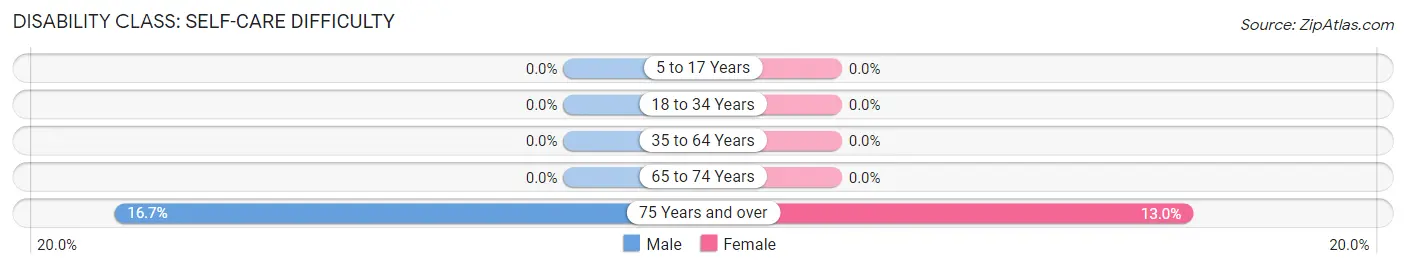
| Age Bracket | Male | Female |
| 5 to 17 Years | 0 (0.0%) | 0 (0.0%) |
| 18 to 34 Years | 0 (0.0%) | 0 (0.0%) |
| 35 to 64 Years | 0 (0.0%) | 0 (0.0%) |
| 65 to 74 Years | 0 (0.0%) | 0 (0.0%) |
| 75 Years and over | 1 (16.7%) | 3 (13.0%) |
Technology Access in White Lake
Computing Device Access in White Lake
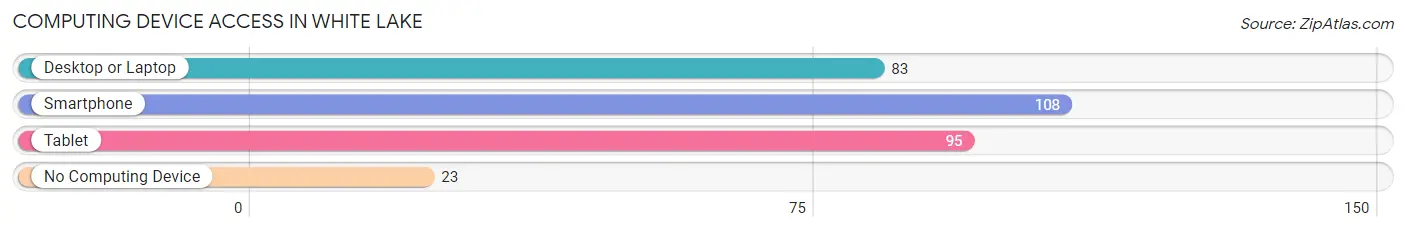
| Device Type | # Households | % Households |
| Desktop or Laptop | 83 | 51.9% |
| Smartphone | 108 | 67.5% |
| Tablet | 95 | 59.4% |
| No Computing Device | 23 | 14.4% |
| Total | 160 | 100.0% |
Internet Access in White Lake
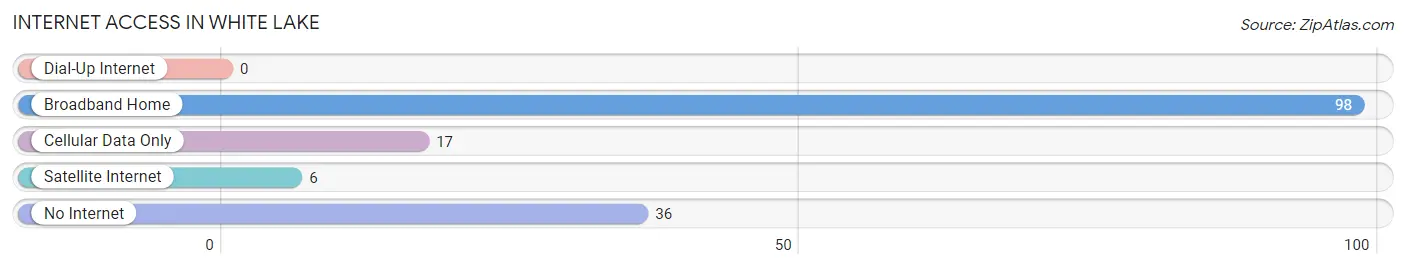
| Internet Type | # Households | % Households |
| Dial-Up Internet | 0 | 0.0% |
| Broadband Home | 98 | 61.3% |
| Cellular Data Only | 17 | 10.6% |
| Satellite Internet | 6 | 3.7% |
| No Internet | 36 | 22.5% |
| Total | 160 | 100.0% |
White Lake Summary
History
White Lake is a small town located in the southeastern corner of South Dakota, in the United States. It is situated in the heart of the Great Plains, and is surrounded by rolling hills and prairies. The town was founded in 1883 by a group of settlers from Wisconsin, who were looking for a place to settle and start a new life. The town was named after the nearby White Lake, which was a popular fishing spot for the settlers.
The town quickly grew and prospered, and by the early 1900s, it had become a bustling community with a variety of businesses, including a bank, a hotel, a general store, and a post office. The town also had a school, a church, and a newspaper.
In the early 1900s, the town was a major stop on the Chicago, Milwaukee, St. Paul and Pacific Railroad, which ran through the town. This allowed the town to become a major shipping hub for the surrounding area.
The town continued to grow and prosper until the Great Depression hit in the 1930s. The town was hit hard by the economic downturn, and many businesses closed their doors. The town was able to survive, however, and by the 1950s, it had recovered and was once again a thriving community.
Geography
White Lake is located in the southeastern corner of South Dakota, in the United States. It is situated in the heart of the Great Plains, and is surrounded by rolling hills and prairies. The town is located in the White Lake Township, which is part of the Lake County.
The town is located at an elevation of 1,845 feet (562 meters) above sea level. The town is located on the White River, which is a tributary of the Missouri River. The town is located about 25 miles (40 kilometers) south of the city of Sioux Falls, and about 50 miles (80 kilometers) north of the city of Sioux City, Iowa.
Economy
White Lake is a small town with a population of just over 500 people. The town’s economy is largely based on agriculture, with the majority of the population employed in farming and ranching. The town also has a few small businesses, including a grocery store, a hardware store, and a few restaurants.
The town is also home to a few manufacturing companies, including a furniture factory and a plastics factory. The town is also home to a few tourist attractions, including the White Lake State Park, which is a popular destination for camping, fishing, and hiking.
Demographics
As of the 2010 census, the population of White Lake was 517 people. The racial makeup of the town was 97.3% White, 0.4% African American, 0.4% Native American, 0.2% Asian, 0.2% from other races, and 1.5% from two or more races. Hispanic or Latino of any race were 0.8% of the population.
The median income for a household in the town was $37,500, and the median income for a family was $45,000. The per capita income for the town was $17,845. About 11.2% of families and 14.2% of the population were below the poverty line, including 18.2% of those under age 18 and 8.3% of those age 65 or over.
Common Questions
What is Per Capita Income in White Lake?
Per Capita income in White Lake is $28,901.
What is the Median Family Income in White Lake?
Median Family Income in White Lake is $79,167.
What is the Median Household income in White Lake?
Median Household Income in White Lake is $47,500.
What is Income or Wage Gap in White Lake?
Income or Wage Gap in White Lake is 55.1%.
Women in White Lake earn 44.9 cents for every dollar earned by a man.
What is Family Income Deficit in White Lake?
Family Income Deficit in White Lake is $11,817.
Families that are below poverty line in White Lake earn $11,817 less on average than the poverty threshold level.
What is Inequality or Gini Index in White Lake?
Inequality or Gini Index in White Lake is 0.43.
What is the Total Population of White Lake?
Total Population of White Lake is 404.
What is the Total Male Population of White Lake?
Total Male Population of White Lake is 203.
What is the Total Female Population of White Lake?
Total Female Population of White Lake is 201.
What is the Ratio of Males per 100 Females in White Lake?
There are 101.00 Males per 100 Females in White Lake.
What is the Ratio of Females per 100 Males in White Lake?
There are 99.01 Females per 100 Males in White Lake.
What is the Median Population Age in White Lake?
Median Population Age in White Lake is 52.2 Years.
What is the Average Family Size in White Lake
Average Family Size in White Lake is 3.0 People.
What is the Average Household Size in White Lake
Average Household Size in White Lake is 2.2 People.
How Large is the Labor Force in White Lake?
There are 177 People in the Labor Forcein in White Lake.
What is the Percentage of People in the Labor Force in White Lake?
53.8% of People are in the Labor Force in White Lake.